Embed Size (px)
Citation preview

For
per
sona
l use
onl
y

This page has been intentionally left blank
For
per
sona
l use
onl
y
Commonwealth Bank of Australia – Pillar 3 Report 1
Table of Contents
1 Introduction 2
2 Scope of Application 3
3 Capital 4
4 Leverage Ratio 7
5 Risk Weighted Assets 8
6 Credit Risk 10
6.1 Credit Risk Exposure – Excluding Equities and Securitisation 10
6.2 Past Due and Impaired Exposures, Provisions and Reserves 19
6.3 Portfolios Subject to Standardised and Supervisory Risk-Weights 24
6.4 Portfolios Subject to Internal Ratings Based Approaches 26
6.5 Credit Risk Mitigation 36
6.6 Counterparty Credit Risk 38
6.7 Securitisation 39
7 Equity Risk 49
8 Market Risk 50
8.1 Traded Market Risk 50
8.2 Non-Traded Market Risk 51
9 Operational Risk 51
10 Liquidity Risk 52
11 Appendices 53
11.1 Detailed Capital Disclosures Template (APS 330 Attachment A) 53
11.2 Detailed Leverage Disclosures Template (APS 330 Attachment E) 56
11.3 Regulatory Balance Sheet 57
11.4 Reconciliation between Detailed Capital Template and Regulatory Balance Sheet 58
11.5 Entities excluded from Level 2 Regulatory Consolidated Group 61
11.6 List of APRA APS 330 Tables 63
11.7 List of Supplemental Tables and Diagrams 65
11.8 Glossary 66
For further information contact:
Investor Relations
Melanie Kirk
Phone: 02 9118 7166
Email: [email protected]
For
per
sona
l use
onl
y
Introduction
2 Commonwealth Bank of Australia – Pillar 3 Report
1 Introduction
The Commonwealth Bank of Australia (the Group) is an
Authorised Deposit-taking Institution (ADI) regulated by the
Australian Prudential Regulation Authority (APRA) under the
authority of the Banking Act 1959.
This document is prepared in accordance with Board
approved policy and APRA’s prudential standard APS 330
“Public Disclosure”. It presents information on the Group’s
capital adequacy and Risk Weighted Asset (RWA)
calculations for credit risk including securitisation, market risk,
Interest Rate Risk in the Banking Book (IRRBB) and
operational risk.
This document also presents information on the Group’s
leverage and liquidity ratios in accordance with prescribed
methodology.
The Group is required to report its assessment of capital
adequacy on a Level 2 basis. Level 2 is defined as the
consolidated banking group excluding the insurance, funds
management businesses and entities through which
securitisation of Group assets are conducted.
The Group is predominantly accredited to use the Advanced
Internal Ratings Based approach (AIRB) for credit risk and
Advanced Measurement Approach (AMA) for operational risk.
The Group is also required to assess its traded market risk
and IRRBB requirement under Pillar 1 of the Basel capital
framework.
The external auditor has performed certain agreed upon
procedures over the Pillar 3 report, including verifying the
disclosures are consistent with information contained in the
Group’s Profit Announcement, returns provided to APRA and
source systems.
This document is available on the Group’s corporate website
www.commbank.com.au/about-us/investors/shareholders.
The Group in Review
The Group strengthened its capital position during the half
year, by undertaking a $5.1 billion institutional and retail
entitlement offer ahead of the APRA requirement to hold
additional capital with respect to Australian residential
mortgages effective from 1 July 2016. This capital raising
places the Group in a strong position both domestically and
on an internationally comparable basis. As at
31 December 2015, the Basel III Common Equity Tier 1
(CET1) ratio was 14.3% on an internationally comparable
basis. The Group’s Basel III CET1, Tier 1 and Total Capital
ratios as measured on an APRA basis as at
31 December 2015 were 10.2%, 12.2% and 14.1%
respectively.
The Group’s Leverage Ratio, which is defined as Tier 1
Capital as a percentage of total exposures was 5.0% at
31 December 2015 on an APRA basis and 5.6% on an
internationally comparable basis.
The Liquidity Coverage Ratio (LCR), which came into effect
on 1 January 2015, requires Australian ADIs to hold sufficient
liquid assets to meet 30 day net cash outflows projected
under an APRA-prescribed stress scenario. The Group
maintained an average LCR of 125.5% in the December 15
half.
The Group regularly benchmarks and aligns its policy
framework against existing prudential and regulatory
standards. Potential developments in Australian and
international standards, and global best practice are also
considered.
The Group continues to monitor and take actions to enhance
its strong risk culture. This includes a risk appetite framework
and a risk accountability (Three Lines of Defence) model. The
Group has a formal Risk Appetite Framework that creates
clear obligations and transparency over risk management and
strategy decisions. The Three Lines of Defence model
requires business management to operate responsibly by
taking well understood and managed risks that are
appropriately and adequately priced.
The strength and robustness of the Group’s risk management
framework has been reflected in the Group’s overall asset
quality and capital position. In particular, the Group remains in
a select group of banking institutions with an AA-/Aa2 credit
rating. To maintain this strength, the Group continues to
invest in its risk systems and management processes.
The Group’s capital forecasting process and capital plans are
in place to ensure a sufficient capital buffer above minimum
levels is maintained at all times. The Group manages its
capital by regularly and simultaneously considering regulatory
capital requirements, rating agency views on the capital
required to maintain the Group’s credit rating, the market
response to capital, stress testing and the Group’s bottom up
view of economic capital. These views then cascade into
considerations on what capital level is targeted.
The Group’s management of its capital adequacy is supported
by robust capital management processes applied in each
Business Unit. The results are integrated into the Group’s
consolidated regulatory and economic capital requirements, and
risk-adjusted performance and pricing processes.
31 Dec 15 30 Jun 15 31 Dec 14
Summary Group Capital Adequacy Ratios (Level 2) % % %
Common Equity Tier 1 10. 2 9. 1 9. 2
Tier 1 12. 2 11. 2 11. 6
Tier 2 1. 9 1. 5 1. 1
Total Capital (APRA) 14. 1 12. 7 12. 7
Common Equity Tier 1 (Internationally Comparable) (1) 14. 3 12. 7 n/a
(1) Analysis aligns with the 13 July 2015 APRA study titled “International capital comparison study”.
For
per
sona
l use
onl
y
Scope of Application
Commonwealth Bank of Australia – Pillar 3 Report 3
2 Scope of Application
This document has been prepared in accordance with Board
approved policy and reporting requirements set out in
APS 330.
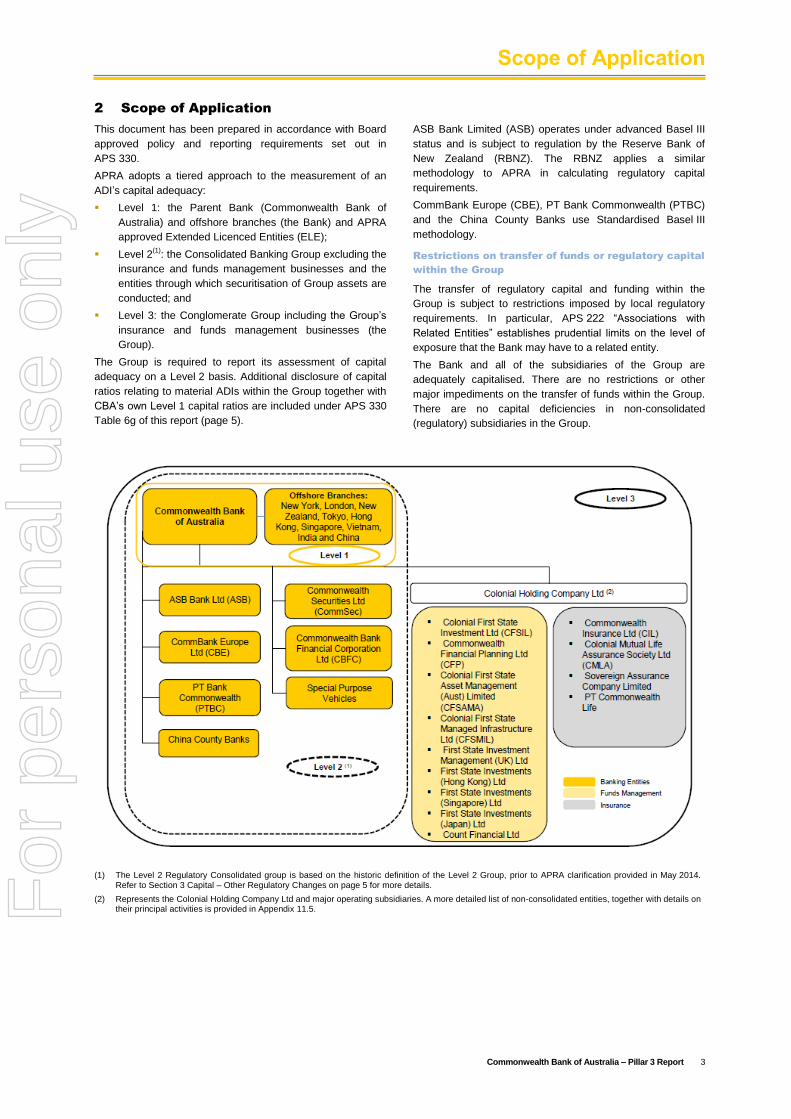
APRA adopts a tiered approach to the measurement of an
ADI’s capital adequacy:
Level 1: the Parent Bank (Commonwealth Bank of
Australia) and offshore branches (the Bank) and APRA
approved Extended Licenced Entities (ELE);
Level 2(1)
: the Consolidated Banking Group excluding the
insurance and funds management businesses and the
entities through which securitisation of Group assets are
conducted; and
Level 3: the Conglomerate Group including the Group’s
insurance and funds management businesses (the
Group).
The Group is required to report its assessment of capital
adequacy on a Level 2 basis. Additional disclosure of capital
ratios relating to material ADIs within the Group together with
CBA’s own Level 1 capital ratios are included under APS 330
Table 6g of this report (page 5).
ASB Bank Limited (ASB) operates under advanced Basel III
status and is subject to regulation by the Reserve Bank of
New Zealand (RBNZ). The RBNZ applies a similar
methodology to APRA in calculating regulatory capital
requirements.
CommBank Europe (CBE), PT Bank Commonwealth (PTBC)
and the China County Banks use Standardised Basel III
methodology.
Restrictions on transfer of funds or regulatory capital
within the Group
The transfer of regulatory capital and funding within the
Group is subject to restrictions imposed by local regulatory
requirements. In particular, APS 222 “Associations with
Related Entities” establishes prudential limits on the level of
exposure that the Bank may have to a related entity.
The Bank and all of the subsidiaries of the Group are
adequately capitalised. There are no restrictions or other
major impediments on the transfer of funds within the Group.
There are no capital deficiencies in non-consolidated
(regulatory) subsidiaries in the Group.
(1) The Level 2 Regulatory Consolidated group is based on the historic definition of the Level 2 Group, prior to APRA clarification provided in May 2014. Refer to Section 3 Capital – Other Regulatory Changes on page 5 for more details.
(2) Represents the Colonial Holding Company Ltd and major operating subsidiaries. A more detailed list of non-consolidated entities, together with details on their principal activities is provided in Appendix 11.5.
For
per
sona
l use
onl
y
Capital
4 Commonwealth Bank of Australia – Pillar 3 Report
3 Capital
Capital Adequacy
The Basel Committee on Banking Supervision (BCBS) has
implemented a set of capital, liquidity and funding reforms
known as “Basel III”. The objectives of the capital reforms are to
increase the quality, consistency and transparency of capital, to
enhance the risk coverage framework, and to reduce systemic
and pro-cyclical risk. The major reforms are being implemented
on a phased approach to 1 January 2019.
The Basel III capital reforms were implemented in Australia on
1 January 2013. APRA has adopted a more conservative
approach than the minimum standards published by the BCBS
and also adopted an accelerated timetable for implementation.
The APRA prudential standards require a minimum CET1 ratio
of 4.5% effective from 1 January 2013. An additional CET1
capital conservation buffer of 3.5%, inclusive of a Domestic
Systemically Important Bank (DSIB) requirement of 1%, effective
on 1 January 2016, bringing the CET1 requirement to at least
8%.
In December 2015, APRA announced that the countercyclical
capital buffer for Australian exposures, which is also effective
from 1 January 2016, has been set at 0%.
The Group has a range of instruments and methodologies
available to effectively manage capital. These include share
issues and buybacks, dividend and Dividend Reinvestment
Plan (DRP) policies, hybrid capital raising and dated and
undated subordinated debt issues. All major capital related
initiatives require approval by the Board.
The Group’s capital position is monitored on a continuous
basis and reported monthly to the Executive Committee of the
Group and the Risk Committee. Three year capital forecasts
are conducted on a quarterly basis and a detailed capital and
strategic plan is presented to the Board annually.
Capital Management
The Group’s Basel III CET1 ratio as measured on an APRA
basis was 10.2% at 31 December 2015, compared with 9.1%
at 30 June 2015.
The increase in capital ratios during the period primarily
reflects capital generated from earnings combined with the
issue of shares as part of the entitlement offer of $5.1 billion
completed in September 2015. This was partly offset by:
The impact of the June 2015 final dividend, which was
moderated by the issuance of shares in respect of the
Dividend Reinvestment Plan (DRP); and
Increases in RWA as outlined on pages 8 and 9.
The Group’s Basel III internationally comparable CET1 ratio
as at 31 December 2015 was 14.3%, compared with 12.7%
as at June 2015.
Details of the major differences in the Basel III APRA and the
Basel III internationally comparable CET1 ratios are provided
on page 6.
The Tier 1 and Total Capital ratios under Basel III (APRA) are
12.2% and 14.1% respectively at 31 December 2015.
Capital Initiatives
In order to actively manage the Group’s capital, the following
significant initiatives were undertaken during the half year:
Common Equity Tier 1 Capital
The aforementioned $5.1 billion that the Group raised
through an institutional and retail entitlements offer; and
The DRP in respect of the 2015 final dividend was
satisfied by the issuance of $657 million of ordinary
shares, representing a participation rate of 18.1%.
Additional Tier 1 and Tier 2 Capital
In December 2015, the Group issued USD1.25 billion
subordinated notes that are Basel III compliant Tier 2
capital.
Other Regulatory Changes
Financial Systems Inquiry
In December 2014, the Government released the final report
of the Financial System Inquiry (FSI). The key
recommendations from the report included:
Setting capital standards such that Australian ADI capital
ratios are unquestionably strong;
Raising the average Internal Ratings-Based (IRB)
mortgage risk weight for ADIs using IRB risk weight
models to increase mortgage competition between the
major banks and non-major banks;
Implementing a framework for minimum loss absorbing
and recapitalisation capacity in line with emerging
international practice, sufficient to facilitate the orderly
resolution of ADIs and minimise taxpayer support;
Introducing a leverage ratio, in line with the Basel
Committee, that acts as a backstop to the capital
position of ADIs; and
Developing a reporting template to improve the
transparency and comparability of capital ratios.
In July 2015, in connection with the FSI recommendations,
APRA released the following:
Information paper; “International capital comparison
study” (APRA study), which endorsed the FSI
recommendation that the capital of Australian ADIs
should be unquestionably strong. However, APRA did
not confirm the definition of “unquestionably strong”.
Nevertheless, the report confirmed that the major banks
are well-capitalised and compared the major banks’
capital ratios against a set of international peers; and
An announcement in relation to increases in the capital
requirements under the IRB approach for Australian
residential mortgages, which will increase the average
risk weighting for a mortgage portfolio to approximately
25%, effective from 1 July 2016. This change is aimed at
increasing mortgage competition between the major
banks and non-major banks.
As a result of this additional capital requirement, the Group
undertook a $5.1 billion institutional and retail entitlement
offer which was completed in September 2015.
In October 2015, the Government provided its formal
response to the FSI recommendations, confirming its support
for the resilience in the banking system, and has either
endorsed APRA’s approach, or delegated authority to it, on
each of these recommendations.
Basel Committee on Banking Supervision
The BCBS has issued a number of consultation documents,
associated with:
Design of a framework for the application of capital floors
based on standardised approaches;
Revisions to the standardised approach for credit risk;
Fundamental Review of the Trading Book;
Revisions to Operational Risk; and
Interest Rate Risk in the Banking Book.
For
per
sona
l use
onl
y
Capital
Commonwealth Bank of Australia – Pillar 3 Report 5
Other Regulatory Changes (continued)
Finalisation of the review of the Trading Book “Minimum
capital requirements for market risk” was completed in
January 2016 with an effective implementation date of
1 January 2019.
Finalisation with respect to the remaining proposals is
expected during 2016.
Composition of Level 2 ADI Groups
In May 2014, APRA provided more clarity on the definition of
the Level 2 Banking Group. Subsidiary intermediate holding
companies are considered part of the Level 2 Group,
regardless of the nature of any activity undertaken by their
operating subsidiaries. As a result, capital benefits arising
from the debt issued by the Colonial Group will be phased
out. APRA granted transition arrangements on these
changes, in line with the maturity profile of the debt.
Conglomerate Groups
APRA has proposed extending its prudential supervision
framework to Conglomerate Groups that have material
operations in more than one APRA regulated industry and/or
have one or more material unregulated entities. APRA
released revised conglomerate standards in August 2014.
However, a decision on the implementation date has yet to be
provided. APRA has confirmed that a minimum transition
period of 12 months will apply before the implementation
date.
31 Dec 15 30 Jun 15 31 Dec 14
Summary Group Capital Adequacy Ratios (Level 2) % % %
Common Equity Tier 1 10. 2 9. 1 9. 2
Tier 1 12. 2 11. 2 11. 6
Tier 2 1. 9 1. 5 1. 1
Total Capital 14. 1 12. 7 12. 7
Common Equity Tier 1 (Internationally Comparable) (1) 14. 3 12. 7 n/a
(1) Analysis aligns with the 13 July 2015 APRA study titled “International capital comparison study”.
APRA APRA APRA
31 Dec 15 30 Jun 15 31 Dec 14
$M $M $M
Ordinary Share Capital and Treasury Shares (1) 33,577 27,898 27,326
Reserves 2,373 2,252 2,548
Retained earnings 22,067 20,999 19,446
Non-controlling interests - - -
Common Equity Tier 1 Capital before regulatory adjustments 58,017 51,149 49,320
Common Equity Tier 1 regulatory adjustments (17,801) (17,751) (16,735)
Common Equity Tier 1 Capital 40,216 33,398 32,585
Additional Tier 1 Capital 7,756 7,749 8,413
Tier 1 Capital 47,972 41,147 40,998
Tier 2 Capital 7,333 5,661 3,903
Total Capital 55,305 46,808 44,901
(1) Inclusive of Treasury shares held by the Group's life insurance operations and employee share scheme trusts.
Further details on the composition of the Group’s capital is detailed in Appendix 11.1.
APS 330 Table 6g – Capital Ratios – Level 1 and Major Subsidiaries
31 Dec 15 30 Jun 15 31 Dec 14
Significant Group ADIs % % %
CBA Level 1 CET1 Capital ratio 10. 7 9. 6 9. 1
CBA Level 1 Tier 1 Capital ratio 12. 6 11. 5 11. 5
CBA Level 1 Total Capital ratio 14. 5 13. 1 12. 5
ASB CET1 Capital ratio 9. 3 8. 8 9. 9
ASB Tier 1 Capital ratio 11. 3 10. 8 11. 0
ASB Total Capital ratio 12. 2 11. 8 12. 0
For
per
sona
l use
onl
y
Capital
6 Commonwealth Bank of Australia – Pillar 3 Report
Regulatory Capital Framework Comparison
The APRA Basel III capital requirements are more
conservative than those of the BCBS, leading to lower
reported capital ratios.
In July 2015, APRA published a study on the calculation of
internationally comparable capital by Australian banks entitled
“International capital comparison study” (APRA study). As at
31 December 2015, the Group’s internationally comparable
CET1, Tier 1 and Total Capital ratios were 14.3%, 15.9% and
17.5% respectively. The basis of this analysis aligns with the
APRA study.
The following table provides details on the differences, as at
31 December 2015, between the APRA Basel III capital
requirements and the internationally comparable capital
ratios.
CET1 Tier 1
Total
Capital
Item Description of adjustment % % %
Basel III (APRA) 10. 2 12. 2 14. 1
Equity investments Appendix 1
Items 1, 2, 4
Balances below prescribed threshold are risk weighted, compared to
a 100% CET1 deduction under APRA’s requirements.
0. 9 0. 8 0. 8
Capitalised Expenses Appendix 1
Item 5
Balances are risk weighted, compared to a 100% CET1 deduction
under APRA's requirements.
0. 1 0. 1 0. 1
Deferred tax assets Appendix 1
Item 3
Balances below prescribed threshold are risk weighted, compared to
a 100% CET1 deduction under APRA’s requirements.
0. 2 0. 2 0. 2
IRRBB RWA 3.3.2 APRA requires capital to be held for Interest Rate Risk in the
Banking Book (IRRBB). The BCBS does not have any capital
requirement.
0. 5 0. 6 0. 7
Residential mortgages 3.3.1 Loss Given Default (LGD) of 15%, compared to the 20% LGD floor
under APRA’s requirements.
0. 7 0. 8 0. 9
Other retail standardised
exposures
3.3.6 Risk weighting of 75%, rather than 100% under APRA’s
requirements.
0. 1 0. 1 0. 1
Unsecured non-retail
exposures
3.3.3 LGD of 45%, compared to the 60% or higher LGD under APRA’s
requirements.
0. 6 0. 7 0. 8
Non-retail undrawn
commitments
3.3.4 Credit conversion factor of 75%, compared to 100% under APRA’s
requirements.
0. 4 0. 5 0. 5
Specialised lending 3.3.5 Use of IRB probabilities of default (PD) and LGDs for income
producing real estate and project finance exposures, reduced by
application of a scaling factor of 1.06. APRA applies higher risk
weights under a supervisory slotting approach, but does not require
the application of the scaling factor.
0. 5 0. 6 0. 7
Currency conversion 3.3.7 Increase in the A$ equivalent concessional threshold level for small
business retail and small/ medium enterprise corporate exposures.
0. 1 0. 1 0. 1
14. 3 16. 7 19. 0
Basel III non-compliant
instruments
Removal of Basel III non compliant Tier 1 and Tier 2 instruments
that are currently subject to transitional rules.- (0.8) (1.5)
Basel III (Internationally Comparable - aligns with APRA study) 14. 3 15. 9 17. 5
APRA Study
Reference
Subtotal (1)
(1) Represents ratios prior to adjustments made for non-compliant Basel III Tier 1 and Tier 2 Capital instruments. This value is used in determining Leverage Ratio (Internationally Comparable) as determined on page 7.
In July 2015, APRA announced increases in the capital
requirements under the IRB approach for Australian
residential mortgages, which will increase the average risk
weighting for a mortgage portfolio to 25%, effective from
1 July 2016. In the future, the calculation of internationally
comparable capital will require an adjustment for this
amount.
The above calculations do not include the impact of a
Basel I capital floor, which was introduced as a transitional
measure as part of the implementation of Basel II. The
Australian banks have now fully implemented Basel III and,
therefore, it is difficult to calculate the impact of such a
floor. APRA concluded in the APRA study that it is difficult
to make adjustments for the floor in internationally
comparable calculations at this time but the inclusion of a
floor could reduce internationally comparable ratios by a
material amount.
For
per
sona
l use
onl
y
Leverage Ratio
Commonwealth Bank of Australia – Pillar 3 Report 7
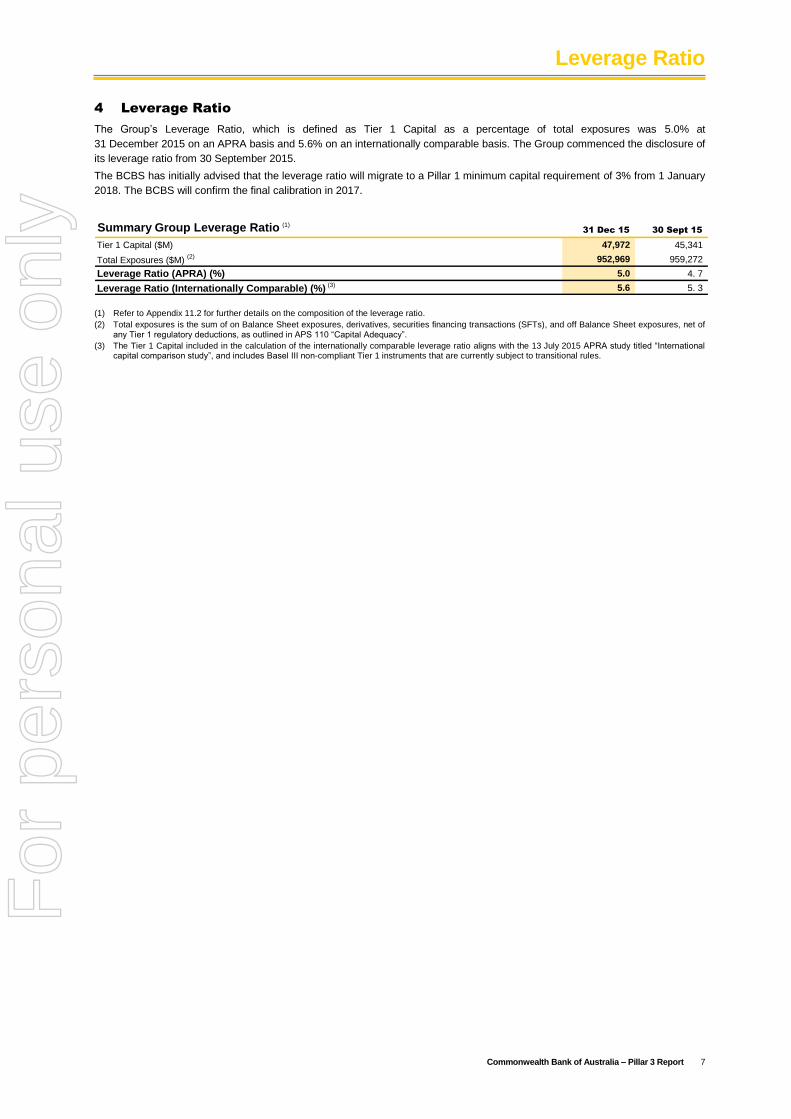
4 Leverage Ratio
The Group’s Leverage Ratio, which is defined as Tier 1 Capital as a percentage of total exposures was 5.0% at
31 December 2015 on an APRA basis and 5.6% on an internationally comparable basis. The Group commenced the disclosure of
its leverage ratio from 30 September 2015.
The BCBS has initially advised that the leverage ratio will migrate to a Pillar 1 minimum capital requirement of 3% from 1 January
2018. The BCBS will confirm the final calibration in 2017.
Summary Group Leverage Ratio (1)
31 Dec 15 30 Sept 15
Tier 1 Capital ($M) 47,972 45,341
Total Exposures ($M) (2) 952,969 959,272
Leverage Ratio (APRA) (%) 5.0 4. 7
Leverage Ratio (Internationally Comparable) (%) (3) 5.6 5. 3
(1) Refer to Appendix 11.2 for further details on the composition of the leverage ratio.
(2) Total exposures is the sum of on Balance Sheet exposures, derivatives, securities financing transactions (SFTs), and off Balance Sheet exposures, net of any Tier 1 regulatory deductions, as outlined in APS 110 “Capital Adequacy”.
(3) The Tier 1 Capital included in the calculation of the internationally comparable leverage ratio aligns with the 13 July 2015 APRA study titled “International capital comparison study”, and includes Basel III non-compliant Tier 1 instruments that are currently subject to transitional rules.
For
per
sona
l use
onl
y
Risk Weighted Assets
8 Commonwealth Bank of Australia – Pillar 3 Report
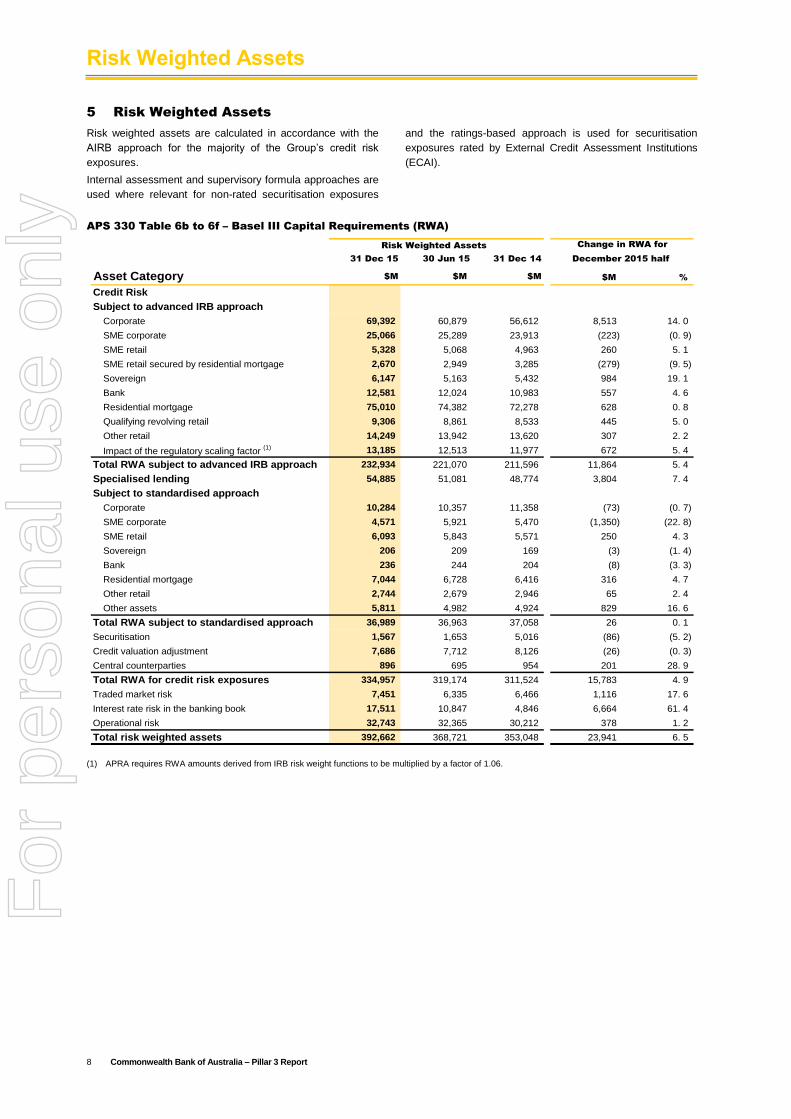
5 Risk Weighted Assets
Risk weighted assets are calculated in accordance with the
AIRB approach for the majority of the Group’s credit risk
exposures.
Internal assessment and supervisory formula approaches are
used where relevant for non-rated securitisation exposures
and the ratings-based approach is used for securitisation
exposures rated by External Credit Assessment Institutions
(ECAI).
APS 330 Table 6b to 6f – Basel III Capital Requirements (RWA)
31 Dec 15 30 Jun 15 31 Dec 14
Asset Category $M $M $M $M %
Credit Risk
Subject to advanced IRB approach
Corporate 69,392 60,879 56,612 8,513 14. 0
SME corporate 25,066 25,289 23,913 (223) (0. 9)
SME retail 5,328 5,068 4,963 260 5. 1
SME retail secured by residential mortgage 2,670 2,949 3,285 (279) (9. 5)
Sovereign 6,147 5,163 5,432 984 19. 1
Bank 12,581 12,024 10,983 557 4. 6
Residential mortgage 75,010 74,382 72,278 628 0. 8
Qualifying revolving retail 9,306 8,861 8,533 445 5. 0
Other retail 14,249 13,942 13,620 307 2. 2
Impact of the regulatory scaling factor (1) 13,185 12,513 11,977 672 5. 4
Total RWA subject to advanced IRB approach 232,934 221,070 211,596 11,864 5. 4
Specialised lending 54,885 51,081 48,774 3,804 7. 4
Subject to standardised approach
Corporate 10,284 10,357 11,358 (73) (0. 7)
SME corporate 4,571 5,921 5,470 (1,350) (22. 8)
SME retail 6,093 5,843 5,571 250 4. 3
Sovereign 206 209 169 (3) (1. 4)
Bank 236 244 204 (8) (3. 3)
Residential mortgage 7,044 6,728 6,416 316 4. 7
Other retail 2,744 2,679 2,946 65 2. 4
Other assets 5,811 4,982 4,924 829 16. 6
Total RWA subject to standardised approach 36,989 36,963 37,058 26 0. 1
Securitisation 1,567 1,653 5,016 (86) (5. 2)
Credit valuation adjustment 7,686 7,712 8,126 (26) (0. 3)
Central counterparties 896 695 954 201 28. 9
Total RWA for credit risk exposures 334,957 319,174 311,524 15,783 4. 9
Traded market risk 7,451 6,335 6,466 1,116 17. 6
Interest rate risk in the banking book 17,511 10,847 4,846 6,664 61. 4
Operational risk 32,743 32,365 30,212 378 1. 2
Total risk weighted assets 392,662 368,721 353,048 23,941 6. 5
December 2015 half
Change in RWA forRisk Weighted Assets
(1) APRA requires RWA amounts derived from IRB risk weight functions to be multiplied by a factor of 1.06.
For
per
sona
l use
onl
y
Risk Weighted Assets
Commonwealth Bank of Australia – Pillar 3 Report 9
Risk Weighted Assets
Total Group RWA increased by $23.9 billion or 6.5% on the
prior half to $392.7 billion.
Credit Risk Exposure and RWA
Credit risk RWA increased over the half by $15.8 billion or
4.9% to $335.0 billion, mostly due to:
Growth in most portfolios;
Refreshed parameters in models used to calculate credit
risk estimates; and
Depreciation of the Australian dollar.
RWA increases were partly offset by a reduction in Bank
exposures.
Traded Market Risk RWA
Traded market risk RWA increased by $1.1 billion or 17.6% to
$7.5 billion. This increase is mainly due to the impact of
higher level of market volatility on the capital charge under
the Internal Model Approach.
Interest Rate Risk in the Banking Book (IRRBB) RWA
IRRBB RWA increased by $6.7 billion or 61.4% driven by
increases arising from interest rate risk management activity
and the capital raising.
Operational Risk RWA
Operational Risk RWA remained stable at $32.7 billion. The
Group continues to monitor industry events and the current
regulatory environment to assess the impact on its
Operational Risk profile.
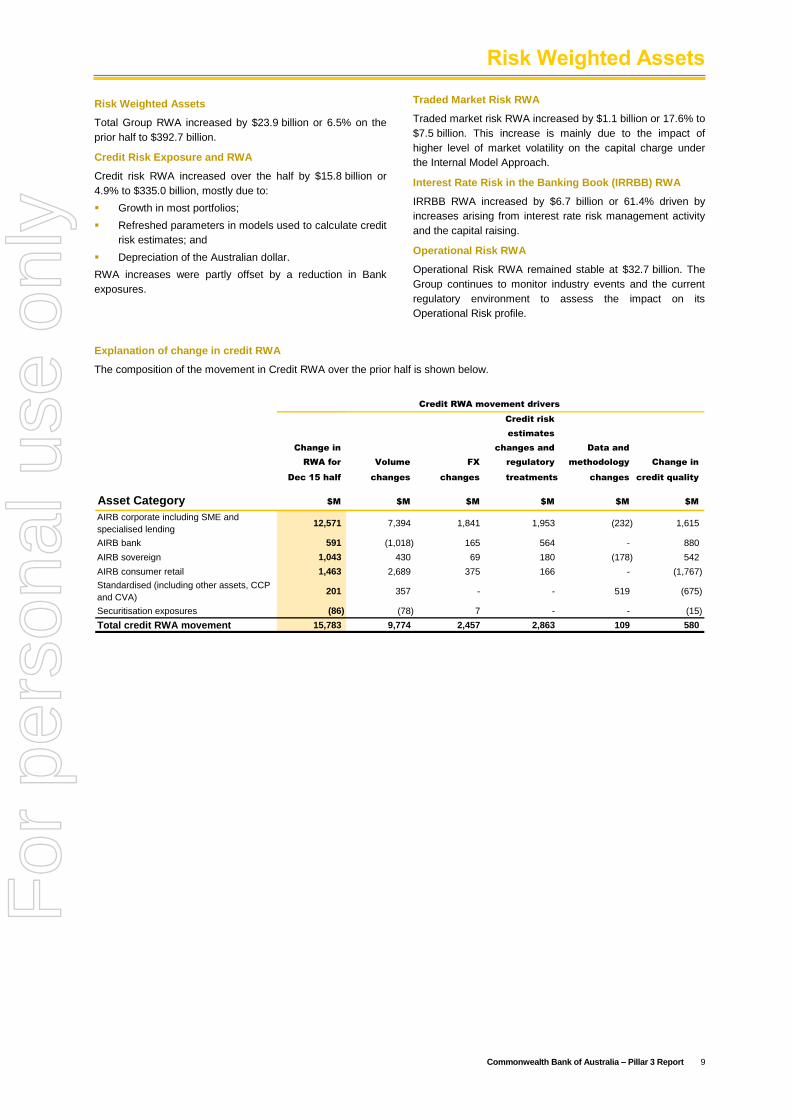
Explanation of change in credit RWA
The composition of the movement in Credit RWA over the prior half is shown below.
Credit risk
estimates
Change in changes and Data and
RWA for Volume FX regulatory methodology Change in
Dec 15 half changes changes treatments changes credit quality
Asset Category $M $M $M $M $M $M
AIRB corporate including SME and
specialised lending12,571 7,394 1,841 1,953 (232) 1,615
AIRB bank 591 (1,018) 165 564 - 880
AIRB sovereign 1,043 430 69 180 (178) 542
AIRB consumer retail 1,463 2,689 375 166 - (1,767)
Standardised (including other assets, CCP
and CVA)201 357 - - 519 (675)
Securitisation exposures (86) (78) 7 - - (15)
Total credit RWA movement 15,783 9,774 2,457 2,863 109 580
Credit RWA movement drivers
For
per
sona
l use
onl
y
Credit Risk
10 Commonwealth Bank of Australia – Pillar 3 Report
6 Credit Risk
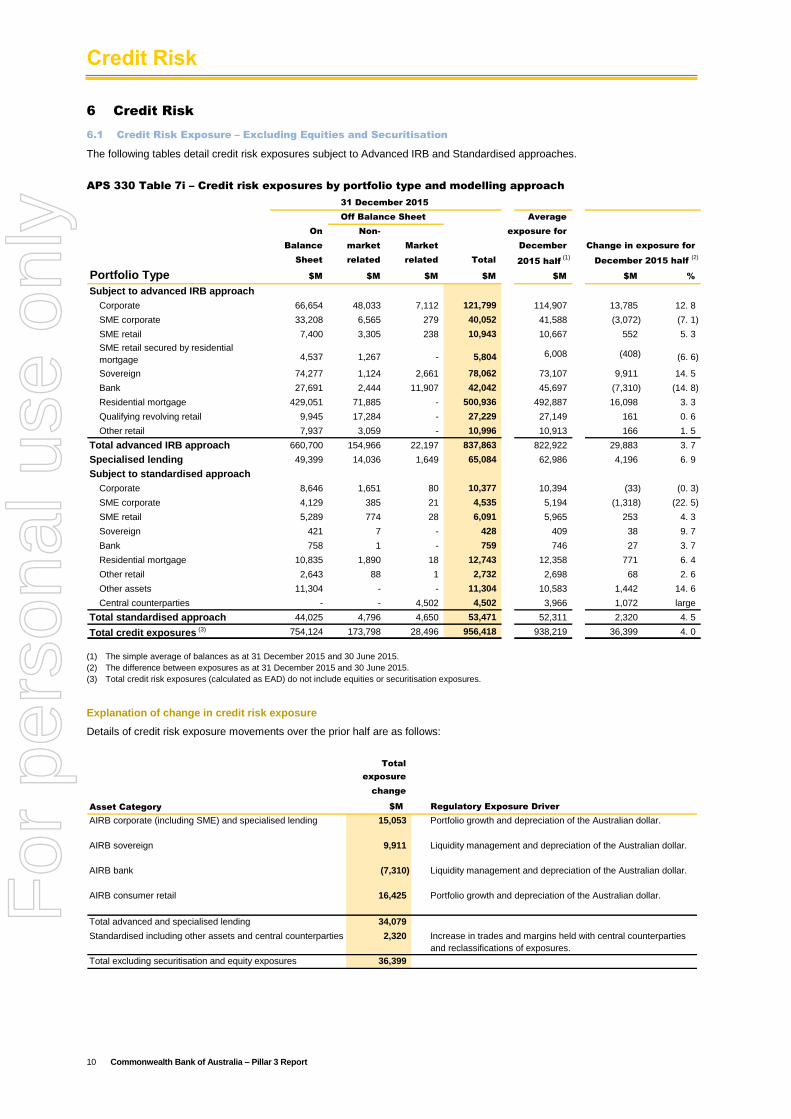
6.1 Credit Risk Exposure – Excluding Equities and Securitisation
The following tables detail credit risk exposures subject to Advanced IRB and Standardised approaches.
APS 330 Table 7i – Credit risk exposures by portfolio type and modelling approach
Average
On Non- exposure for
Balance market Market December Change in exposure for
Sheet related related Total 2015 half (1)
December 2015 half (2)
Portfolio Type $M $M $M $M $M $M %
Subject to advanced IRB approach
Corporate 66,654 48,033 7,112 121,799 114,907 13,785 12. 8
SME corporate 33,208 6,565 279 40,052 41,588 (3,072) (7. 1)
SME retail 7,400 3,305 238 10,943 10,667 552 5. 3
SME retail secured by residential
mortgage 4,537 1,267 - 5,804 6,008 (408) (6. 6)
Sovereign 74,277 1,124 2,661 78,062 73,107 9,911 14. 5
Bank 27,691 2,444 11,907 42,042 45,697 (7,310) (14. 8)
Residential mortgage 429,051 71,885 - 500,936 492,887 16,098 3. 3
Qualifying revolving retail 9,945 17,284 - 27,229 27,149 161 0. 6
Other retail 7,937 3,059 - 10,996 10,913 166 1. 5
Total advanced IRB approach 660,700 154,966 22,197 837,863 822,922 29,883 3. 7
Specialised lending 49,399 14,036 1,649 65,084 62,986 4,196 6. 9
Subject to standardised approach
Corporate 8,646 1,651 80 10,377 10,394 (33) (0. 3)
SME corporate 4,129 385 21 4,535 5,194 (1,318) (22. 5)
SME retail 5,289 774 28 6,091 5,965 253 4. 3
Sovereign 421 7 - 428 409 38 9. 7
Bank 758 1 - 759 746 27 3. 7
Residential mortgage 10,835 1,890 18 12,743 12,358 771 6. 4
Other retail 2,643 88 1 2,732 2,698 68 2. 6
Other assets 11,304 - - 11,304 10,583 1,442 14. 6
Central counterparties - - 4,502 4,502 3,966 1,072 large
Total standardised approach 44,025 4,796 4,650 53,471 52,311 2,320 4. 5
Total credit exposures (3) 754,124 173,798 28,496 956,418 938,219 36,399 4. 0
Off Balance Sheet
31 December 2015
(1) The simple average of balances as at 31 December 2015 and 30 June 2015.
(2) The difference between exposures as at 31 December 2015 and 30 June 2015.
(3) Total credit risk exposures (calculated as EAD) do not include equities or securitisation exposures.
Explanation of change in credit risk exposure
Details of credit risk exposure movements over the prior half are as follows:
Total
exposure
change
Asset Category $M Regulatory Exposure Driver
AIRB corporate (including SME) and specialised lending 15,053
AIRB sovereign 9,911
AIRB bank (7,310)
AIRB consumer retail 16,425
Total advanced and specialised lending 34,079
Standardised including other assets and central counterparties 2,320
Total excluding securitisation and equity exposures 36,399
Portfolio growth and depreciation of the Australian dollar.
Liquidity management and depreciation of the Australian dollar.
Liquidity management and depreciation of the Australian dollar.
Increase in trades and margins held with central counterparties
and reclassifications of exposures.
Portfolio growth and depreciation of the Australian dollar.
For
per
sona
l use
onl
y
Credit Risk
Commonwealth Bank of Australia – Pillar 3 Report 11
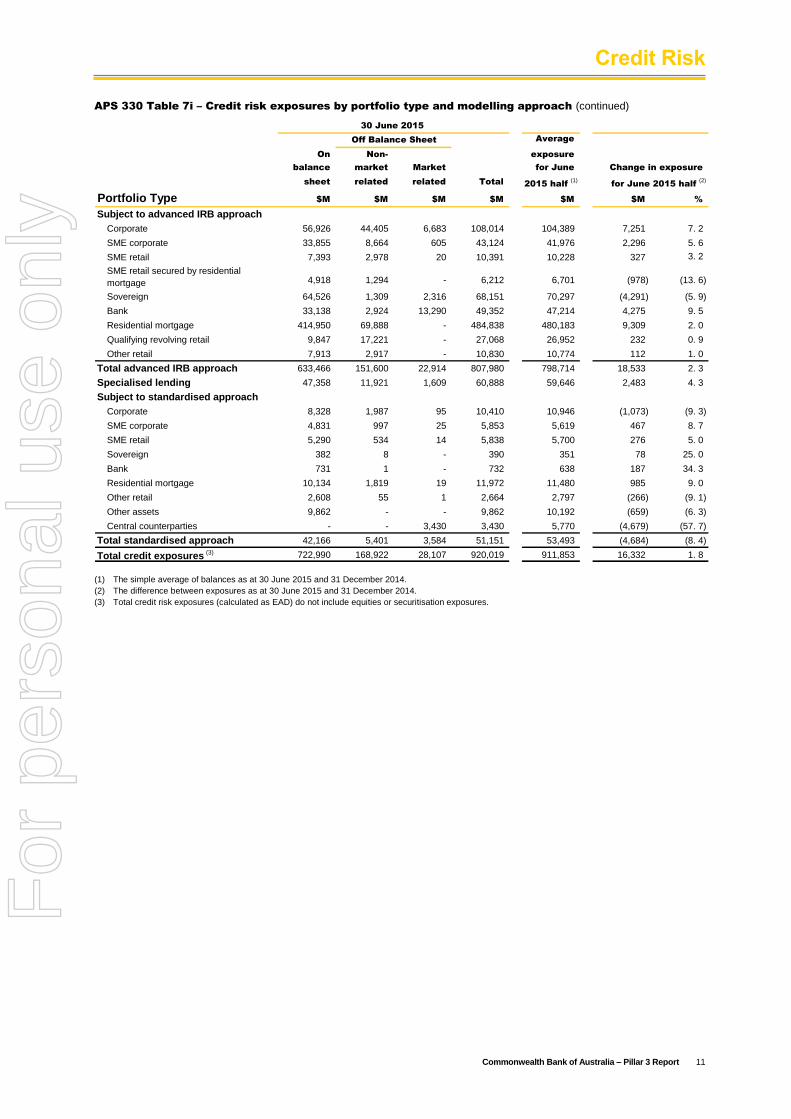
APS 330 Table 7i – Credit risk exposures by portfolio type and modelling approach (continued)
Average
On Non- exposure
balance market Market for June Change in exposure
sheet related related Total 2015 half (1)
for June 2015 half (2)
Portfolio Type $M $M $M $M $M $M %
Subject to advanced IRB approach
Corporate 56,926 44,405 6,683 108,014 104,389 7,251 7. 2
SME corporate 33,855 8,664 605 43,124 41,976 2,296 5. 6
SME retail 7,393 2,978 20 10,391 10,228 327 3. 2
SME retail secured by residential
mortgage 4,918 1,294 - 6,212 6,701 (978) (13. 6)
Sovereign 64,526 1,309 2,316 68,151 70,297 (4,291) (5. 9)
Bank 33,138 2,924 13,290 49,352 47,214 4,275 9. 5
Residential mortgage 414,950 69,888 - 484,838 480,183 9,309 2. 0
Qualifying revolving retail 9,847 17,221 - 27,068 26,952 232 0. 9
Other retail 7,913 2,917 - 10,830 10,774 112 1. 0
Total advanced IRB approach 633,466 151,600 22,914 807,980 798,714 18,533 2. 3
Specialised lending 47,358 11,921 1,609 60,888 59,646 2,483 4. 3
Subject to standardised approach
Corporate 8,328 1,987 95 10,410 10,946 (1,073) (9. 3)
SME corporate 4,831 997 25 5,853 5,619 467 8. 7
SME retail 5,290 534 14 5,838 5,700 276 5. 0
Sovereign 382 8 - 390 351 78 25. 0
Bank 731 1 - 732 638 187 34. 3
Residential mortgage 10,134 1,819 19 11,972 11,480 985 9. 0
Other retail 2,608 55 1 2,664 2,797 (266) (9. 1)
Other assets 9,862 - - 9,862 10,192 (659) (6. 3)
Central counterparties - - 3,430 3,430 5,770 (4,679) (57. 7)
Total standardised approach 42,166 5,401 3,584 51,151 53,493 (4,684) (8. 4)
Total credit exposures (3) 722,990 168,922 28,107 920,019 911,853 16,332 1. 8
Off Balance Sheet
30 June 2015
(1) The simple average of balances as at 30 June 2015 and 31 December 2014.
(2) The difference between exposures as at 30 June 2015 and 31 December 2014.
(3) Total credit risk exposures (calculated as EAD) do not include equities or securitisation exposures.
For
per
sona
l use
onl
y
Credit Risk
12 Commonwealth Bank of Australia – Pillar 3 Report
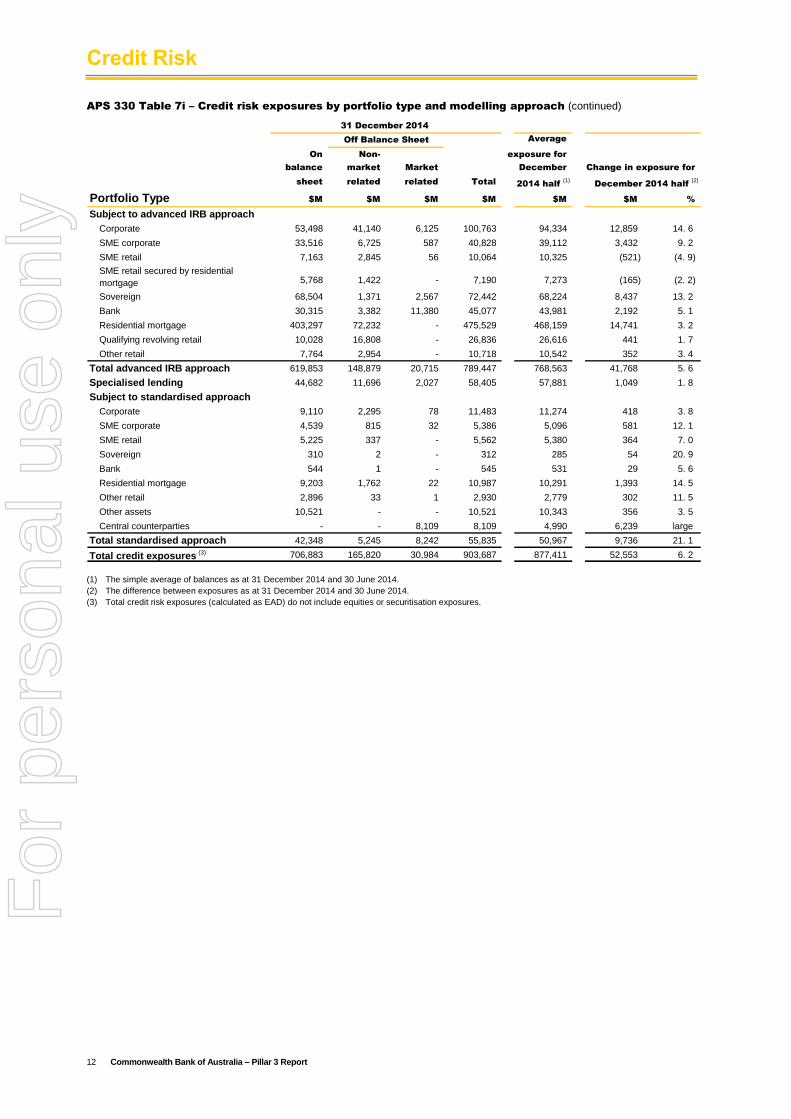
APS 330 Table 7i – Credit risk exposures by portfolio type and modelling approach (continued)
Average
On Non- exposure for
balance market Market December Change in exposure for
sheet related related Total 2014 half (1)
December 2014 half (2)
Portfolio Type $M $M $M $M $M $M %
Subject to advanced IRB approach
Corporate 53,498 41,140 6,125 100,763 94,334 12,859 14. 6
SME corporate 33,516 6,725 587 40,828 39,112 3,432 9. 2
SME retail 7,163 2,845 56 10,064 10,325 (521) (4. 9)
SME retail secured by residential
mortgage 5,768 1,422 - 7,190 7,273 (165) (2. 2)
Sovereign 68,504 1,371 2,567 72,442 68,224 8,437 13. 2
Bank 30,315 3,382 11,380 45,077 43,981 2,192 5. 1
Residential mortgage 403,297 72,232 - 475,529 468,159 14,741 3. 2
Qualifying revolving retail 10,028 16,808 - 26,836 26,616 441 1. 7
Other retail 7,764 2,954 - 10,718 10,542 352 3. 4
Total advanced IRB approach 619,853 148,879 20,715 789,447 768,563 41,768 5. 6
Specialised lending 44,682 11,696 2,027 58,405 57,881 1,049 1. 8
Subject to standardised approach
Corporate 9,110 2,295 78 11,483 11,274 418 3. 8
SME corporate 4,539 815 32 5,386 5,096 581 12. 1
SME retail 5,225 337 - 5,562 5,380 364 7. 0
Sovereign 310 2 - 312 285 54 20. 9
Bank 544 1 - 545 531 29 5. 6
Residential mortgage 9,203 1,762 22 10,987 10,291 1,393 14. 5
Other retail 2,896 33 1 2,930 2,779 302 11. 5
Other assets 10,521 - - 10,521 10,343 356 3. 5
Central counterparties - - 8,109 8,109 4,990 6,239 large
Total standardised approach 42,348 5,245 8,242 55,835 50,967 9,736 21. 1
Total credit exposures (3) 706,883 165,820 30,984 903,687 877,411 52,553 6. 2
Off Balance Sheet
31 December 2014
(1) The simple average of balances as at 31 December 2014 and 30 June 2014.
(2) The difference between exposures as at 31 December 2014 and 30 June 2014.
(3) Total credit risk exposures (calculated as EAD) do not include equities or securitisation exposures.
For
per
sona
l use
onl
y
Credit Risk
Commonwealth Bank of Australia – Pillar 3 Report 13
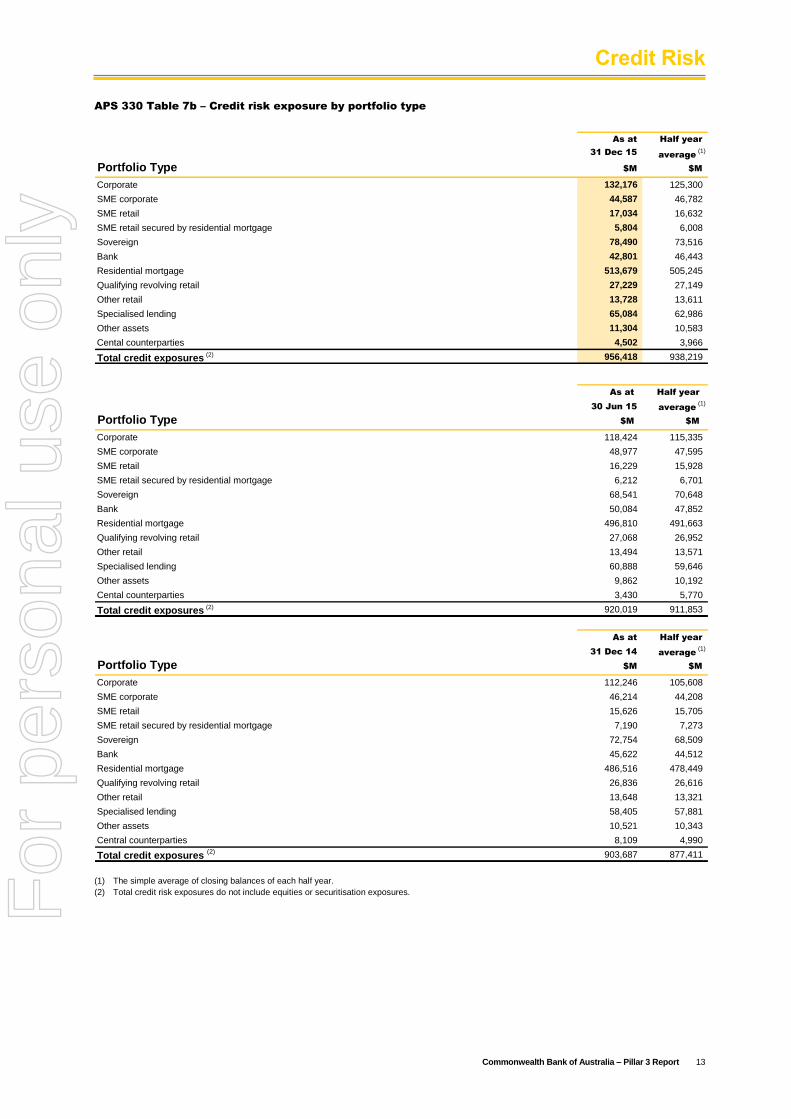
APS 330 Table 7b – Credit risk exposure by portfolio type
As at Half year
31 Dec 15average
(1)
Portfolio Type $M $M
Corporate 132,176 125,300
SME corporate 44,587 46,782
SME retail 17,034 16,632
SME retail secured by residential mortgage 5,804 6,008
Sovereign 78,490 73,516
Bank 42,801 46,443
Residential mortgage 513,679 505,245
Qualifying revolving retail 27,229 27,149
Other retail 13,728 13,611
Specialised lending 65,084 62,986
Other assets 11,304 10,583
Cental counterparties 4,502 3,966
Total credit exposures (2) 956,418 938,219
As at Half year
30 Jun 15 average (1)
Portfolio Type $M $M
Corporate 118,424 115,335
SME corporate 48,977 47,595
SME retail 16,229 15,928
SME retail secured by residential mortgage 6,212 6,701
Sovereign 68,541 70,648
Bank 50,084 47,852
Residential mortgage 496,810 491,663
Qualifying revolving retail 27,068 26,952
Other retail 13,494 13,571
Specialised lending 60,888 59,646
Other assets 9,862 10,192
Cental counterparties 3,430 5,770
Total credit exposures (2) 920,019 911,853
As at Half year
31 Dec 14 average (1)
Portfolio Type $M $M
Corporate 112,246 105,608
SME corporate 46,214 44,208
SME retail 15,626 15,705
SME retail secured by residential mortgage 7,190 7,273
Sovereign 72,754 68,509
Bank 45,622 44,512
Residential mortgage 486,516 478,449
Qualifying revolving retail 26,836 26,616
Other retail 13,648 13,321
Specialised lending 58,405 57,881
Other assets 10,521 10,343
Central counterparties 8,109 4,990
Total credit exposures (2) 903,687 877,411
(1) The simple average of closing balances of each half year.
(2) Total credit risk exposures do not include equities or securitisation exposures.
For
per
sona
l use
onl
y
Credit Risk
14 Commonwealth Bank of Australia – Pillar 3 Report
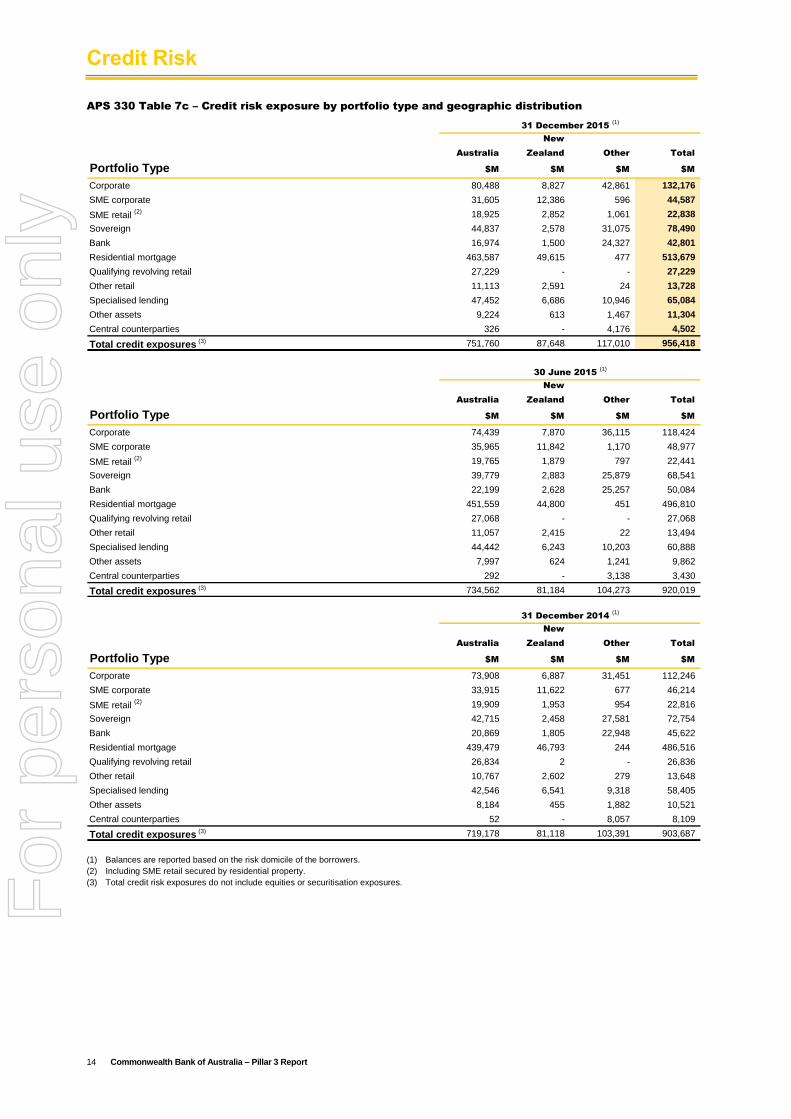
APS 330 Table 7c – Credit risk exposure by portfolio type and geographic distribution
New
Australia Zealand Other Total
Portfolio Type $M $M $M $M
Corporate 80,488 8,827 42,861 132,176
SME corporate 31,605 12,386 596 44,587
SME retail (2) 18,925 2,852 1,061 22,838
Sovereign 44,837 2,578 31,075 78,490
Bank 16,974 1,500 24,327 42,801
Residential mortgage 463,587 49,615 477 513,679
Qualifying revolving retail 27,229 - - 27,229
Other retail 11,113 2,591 24 13,728
Specialised lending 47,452 6,686 10,946 65,084
Other assets 9,224 613 1,467 11,304
Central counterparties 326 - 4,176 4,502
Total credit exposures (3) 751,760 87,648 117,010 956,418
31 December 2015 (1)
New
Australia Zealand Other Total
Portfolio Type $M $M $M $M
Corporate 74,439 7,870 36,115 118,424
SME corporate 35,965 11,842 1,170 48,977
SME retail (2) 19,765 1,879 797 22,441
Sovereign 39,779 2,883 25,879 68,541
Bank 22,199 2,628 25,257 50,084
Residential mortgage 451,559 44,800 451 496,810
Qualifying revolving retail 27,068 - - 27,068
Other retail 11,057 2,415 22 13,494
Specialised lending 44,442 6,243 10,203 60,888
Other assets 7,997 624 1,241 9,862
Central counterparties 292 - 3,138 3,430
Total credit exposures (3) 734,562 81,184 104,273 920,019
30 June 2015 (1)
New
Australia Zealand Other Total
Portfolio Type $M $M $M $M
Corporate 73,908 6,887 31,451 112,246
SME corporate 33,915 11,622 677 46,214
SME retail (2) 19,909 1,953 954 22,816
Sovereign 42,715 2,458 27,581 72,754
Bank 20,869 1,805 22,948 45,622
Residential mortgage 439,479 46,793 244 486,516
Qualifying revolving retail 26,834 2 - 26,836
Other retail 10,767 2,602 279 13,648
Specialised lending 42,546 6,541 9,318 58,405
Other assets 8,184 455 1,882 10,521
Central counterparties 52 - 8,057 8,109
Total credit exposures (3) 719,178 81,118 103,391 903,687
31 December 2014 (1)
(1) Balances are reported based on the risk domicile of the borrowers.
(2) Including SME retail secured by residential property.
(3) Total credit risk exposures do not include equities or securitisation exposures.
For
per
sona
l use
onl
y
Credit Risk
Commonwealth Bank of Australia – Pillar 3 Report 15
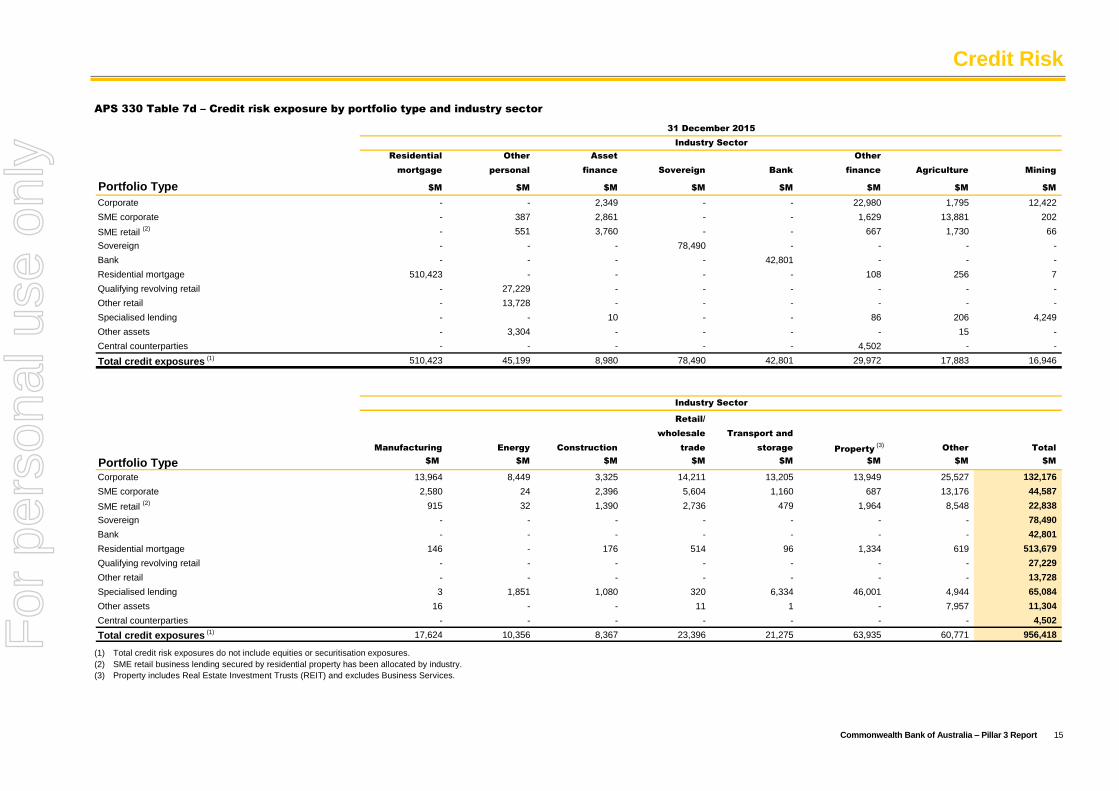
APS 330 Table 7d – Credit risk exposure by portfolio type and industry sector
Residential Other Asset Other
mortgage personal finance Sovereign Bank finance Agriculture Mining
Portfolio Type $M $M $M $M $M $M $M $M
Corporate - - 2,349 - - 22,980 1,795 12,422
SME corporate - 387 2,861 - - 1,629 13,881 202
SME retail (2) - 551 3,760 - - 667 1,730 66
Sovereign - - - 78,490 - - - -
Bank - - - - 42,801 - - -
Residential mortgage 510,423 - - - - 108 256 7
Qualifying revolving retail - 27,229 - - - - - -
Other retail - 13,728 - - - - - -
Specialised lending - - 10 - - 86 206 4,249
Other assets - 3,304 - - - - 15 -
Central counterparties - - - - - 4,502 - -
Total credit exposures (1) 510,423 45,199 8,980 78,490 42,801 29,972 17,883 16,946
Retail/
wholesale Transport and
Manufacturing Energy Construction trade storage Property (3)
Other Total
Portfolio Type $M $M $M $M $M $M $M $M
Corporate 13,964 8,449 3,325 14,211 13,205 13,949 25,527 132,176
SME corporate 2,580 24 2,396 5,604 1,160 687 13,176 44,587
SME retail (2) 915 32 1,390 2,736 479 1,964 8,548 22,838
Sovereign - - - - - - - 78,490
Bank - - - - - - - 42,801
Residential mortgage 146 - 176 514 96 1,334 619 513,679
Qualifying revolving retail - - - - - - - 27,229
Other retail - - - - - - - 13,728
Specialised lending 3 1,851 1,080 320 6,334 46,001 4,944 65,084
Other assets 16 - - 11 1 - 7,957 11,304
Central counterparties - - - - - - - 4,502
Total credit exposures (1) 17,624 10,356 8,367 23,396 21,275 63,935 60,771 956,418
Industry Sector
31 December 2015
Industry Sector
(1) Total credit risk exposures do not include equities or securitisation exposures.
(2) SME retail business lending secured by residential property has been allocated by industry.
(3) Property includes Real Estate Investment Trusts (REIT) and excludes Business Services.
For
per
sona
l use
onl
y
Credit Risk
16 Commonwealth Bank of Australia – Pillar 3 Report
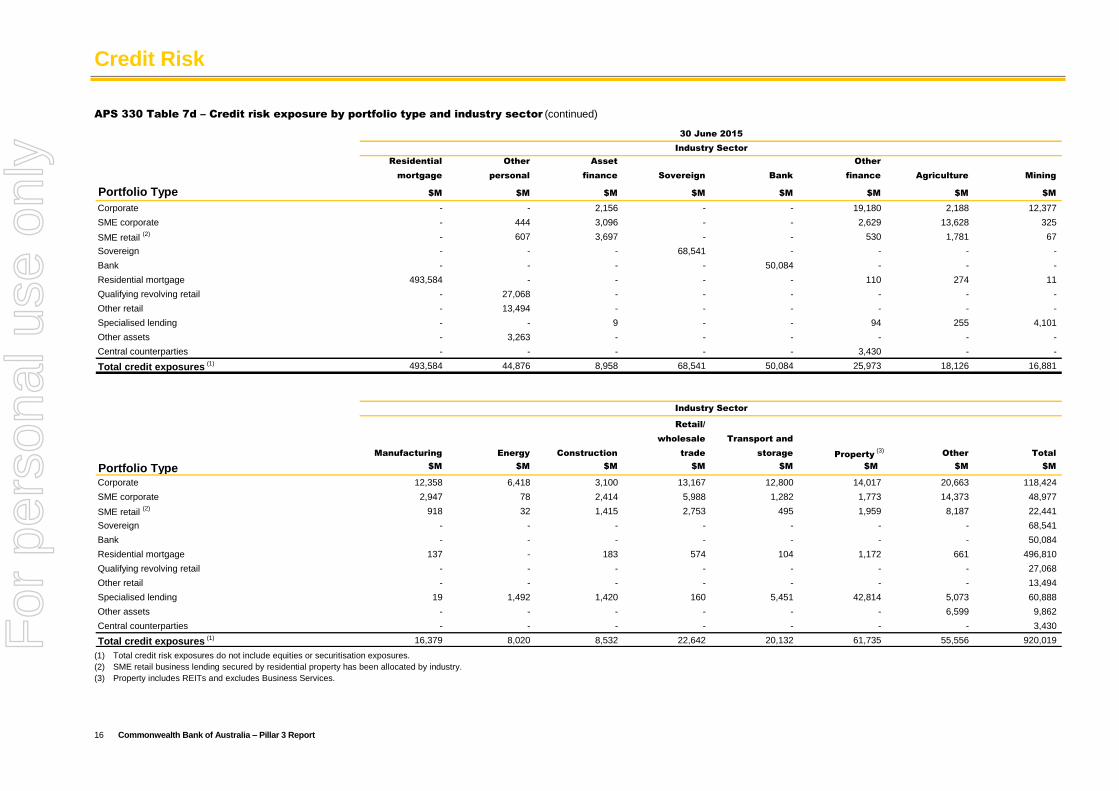
APS 330 Table 7d – Credit risk exposure by portfolio type and industry sector (continued)
Residential Other Asset Other
mortgage personal finance Sovereign Bank finance Agriculture Mining
Portfolio Type $M $M $M $M $M $M $M $M
Corporate - - 2,156 - - 19,180 2,188 12,377
SME corporate - 444 3,096 - - 2,629 13,628 325
SME retail (2) - 607 3,697 - - 530 1,781 67
Sovereign - - - 68,541 - - - -
Bank - - - - 50,084 - - -
Residential mortgage 493,584 - - - - 110 274 11
Qualifying revolving retail - 27,068 - - - - - -
Other retail - 13,494 - - - - - -
Specialised lending - - 9 - - 94 255 4,101
Other assets - 3,263 - - - - - -
Central counterparties - - - - - 3,430 - -
Total credit exposures (1) 493,584 44,876 8,958 68,541 50,084 25,973 18,126 16,881
Retail/
wholesale Transport and
Manufacturing Energy Construction trade storage Property (3)
Other Total
Portfolio Type $M $M $M $M $M $M $M $M
Corporate 12,358 6,418 3,100 13,167 12,800 14,017 20,663 118,424
SME corporate 2,947 78 2,414 5,988 1,282 1,773 14,373 48,977
SME retail (2) 918 32 1,415 2,753 495 1,959 8,187 22,441
Sovereign - - - - - - - 68,541
Bank - - - - - - - 50,084
Residential mortgage 137 - 183 574 104 1,172 661 496,810
Qualifying revolving retail - - - - - - - 27,068
Other retail - - - - - - - 13,494
Specialised lending 19 1,492 1,420 160 5,451 42,814 5,073 60,888
Other assets - - - - - - 6,599 9,862
Central counterparties - - - - - - - 3,430
Total credit exposures (1) 16,379 8,020 8,532 22,642 20,132 61,735 55,556 920,019
Industry Sector
30 June 2015
Industry Sector
(1) Total credit risk exposures do not include equities or securitisation exposures.
(2) SME retail business lending secured by residential property has been allocated by industry.
(3) Property includes REITs and excludes Business Services.
For
per
sona
l use
onl
y
Credit Risk
Commonwealth Bank of Australia – Pillar 3 Report 17
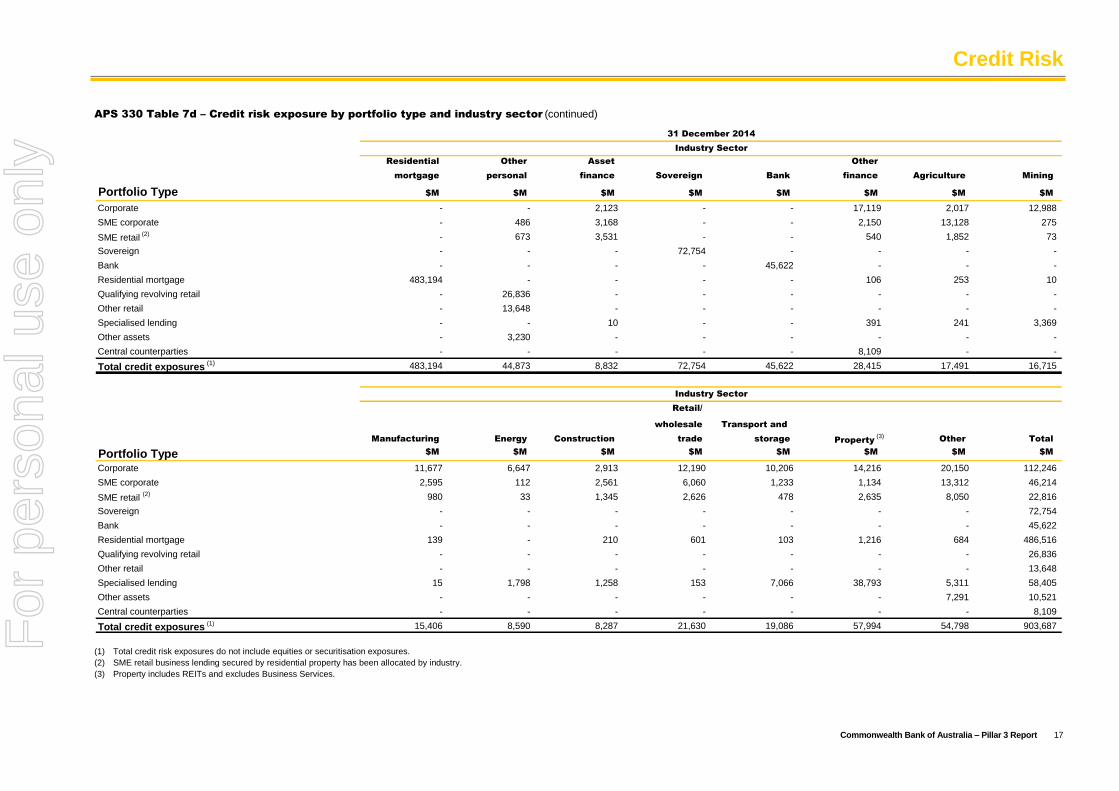
APS 330 Table 7d – Credit risk exposure by portfolio type and industry sector (continued)
Residential Other Asset Other
mortgage personal finance Sovereign Bank finance Agriculture Mining
Portfolio Type $M $M $M $M $M $M $M $M
Corporate - - 2,123 - - 17,119 2,017 12,988
SME corporate - 486 3,168 - - 2,150 13,128 275
SME retail (2) - 673 3,531 - - 540 1,852 73
Sovereign - - - 72,754 - - - -
Bank - - - - 45,622 - - -
Residential mortgage 483,194 - - - - 106 253 10
Qualifying revolving retail - 26,836 - - - - - -
Other retail - 13,648 - - - - - -
Specialised lending - - 10 - - 391 241 3,369
Other assets - 3,230 - - - - - -
Central counterparties - - - - - 8,109 - -
Total credit exposures (1) 483,194 44,873 8,832 72,754 45,622 28,415 17,491 16,715
Retail/
wholesale Transport and
Manufacturing Energy Construction trade storage Property (3)
Other Total
Portfolio Type $M $M $M $M $M $M $M $M
Corporate 11,677 6,647 2,913 12,190 10,206 14,216 20,150 112,246
SME corporate 2,595 112 2,561 6,060 1,233 1,134 13,312 46,214
SME retail (2) 980 33 1,345 2,626 478 2,635 8,050 22,816
Sovereign - - - - - - - 72,754
Bank - - - - - - - 45,622
Residential mortgage 139 - 210 601 103 1,216 684 486,516
Qualifying revolving retail - - - - - - - 26,836
Other retail - - - - - - - 13,648
Specialised lending 15 1,798 1,258 153 7,066 38,793 5,311 58,405
Other assets - - - - - - 7,291 10,521
Central counterparties - - - - - - - 8,109
Total credit exposures (1) 15,406 8,590 8,287 21,630 19,086 57,994 54,798 903,687
Industry Sector
31 December 2014
Industry Sector
(1) Total credit risk exposures do not include equities or securitisation exposures.
(2) SME retail business lending secured by residential property has been allocated by industry.
(3) Property includes REITs and excludes Business Services.
For
per
sona
l use
onl
y
Credit Risk
18 Commonwealth Bank of Australia – Pillar 3 Report
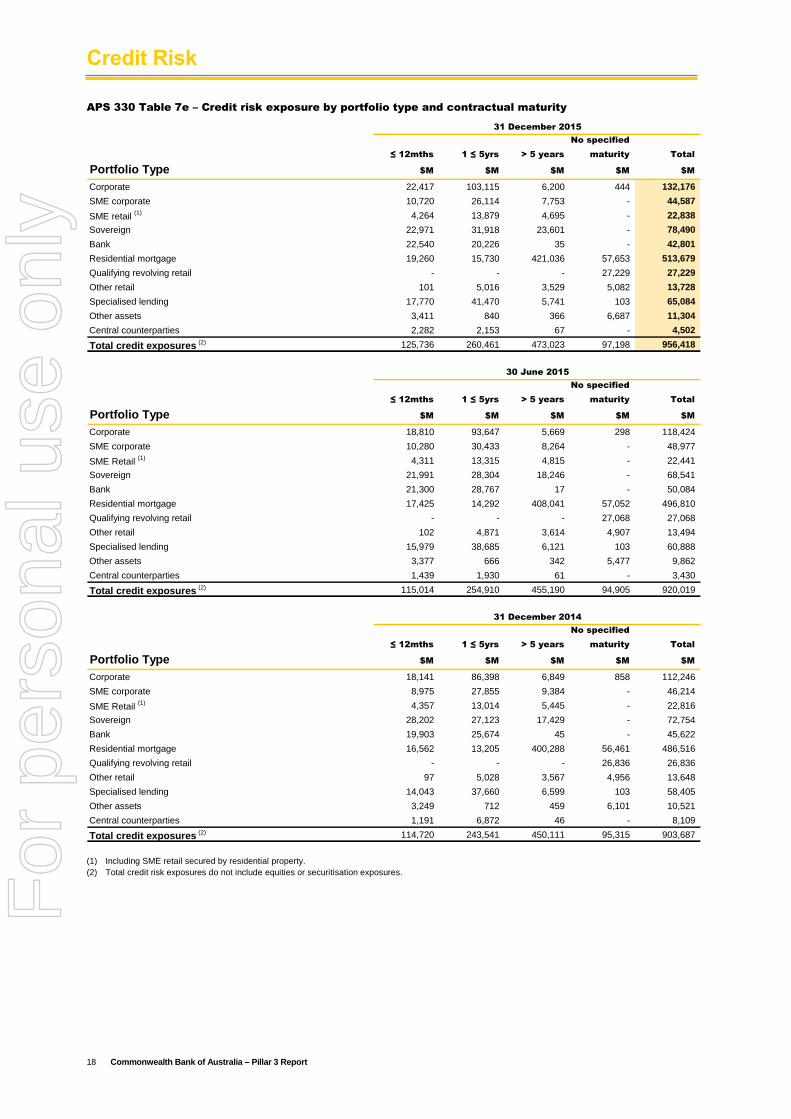
APS 330 Table 7e – Credit risk exposure by portfolio type and contractual maturity
No specified
≤ 12mths 1 ≤ 5yrs > 5 years maturity Total
Portfolio Type $M $M $M $M $M
Corporate 22,417 103,115 6,200 444 132,176
SME corporate 10,720 26,114 7,753 - 44,587
SME retail (1) 4,264 13,879 4,695 - 22,838
Sovereign 22,971 31,918 23,601 - 78,490
Bank 22,540 20,226 35 - 42,801
Residential mortgage 19,260 15,730 421,036 57,653 513,679
Qualifying revolving retail - - - 27,229 27,229
Other retail 101 5,016 3,529 5,082 13,728
Specialised lending 17,770 41,470 5,741 103 65,084
Other assets 3,411 840 366 6,687 11,304
Central counterparties 2,282 2,153 67 - 4,502
Total credit exposures (2) 125,736 260,461 473,023 97,198 956,418
31 December 2015
No specified
≤ 12mths 1 ≤ 5yrs > 5 years maturity Total
Portfolio Type $M $M $M $M $M
Corporate 18,810 93,647 5,669 298 118,424
SME corporate 10,280 30,433 8,264 - 48,977
SME Retail (1) 4,311 13,315 4,815 - 22,441
Sovereign 21,991 28,304 18,246 - 68,541
Bank 21,300 28,767 17 - 50,084
Residential mortgage 17,425 14,292 408,041 57,052 496,810
Qualifying revolving retail - - - 27,068 27,068
Other retail 102 4,871 3,614 4,907 13,494
Specialised lending 15,979 38,685 6,121 103 60,888
Other assets 3,377 666 342 5,477 9,862
Central counterparties 1,439 1,930 61 - 3,430
Total credit exposures (2) 115,014 254,910 455,190 94,905 920,019
30 June 2015
No specified
≤ 12mths 1 ≤ 5yrs > 5 years maturity Total
Portfolio Type $M $M $M $M $M
Corporate 18,141 86,398 6,849 858 112,246
SME corporate 8,975 27,855 9,384 - 46,214
SME Retail (1) 4,357 13,014 5,445 - 22,816
Sovereign 28,202 27,123 17,429 - 72,754
Bank 19,903 25,674 45 - 45,622
Residential mortgage 16,562 13,205 400,288 56,461 486,516
Qualifying revolving retail - - - 26,836 26,836
Other retail 97 5,028 3,567 4,956 13,648
Specialised lending 14,043 37,660 6,599 103 58,405
Other assets 3,249 712 459 6,101 10,521
Central counterparties 1,191 6,872 46 - 8,109
Total credit exposures (2) 114,720 243,541 450,111 95,315 903,687
31 December 2014
(1) Including SME retail secured by residential property.
(2) Total credit risk exposures do not include equities or securitisation exposures.
For
per
sona
l use
onl
y
Credit Risk
Commonwealth Bank of Australia – Pillar 3 Report 19
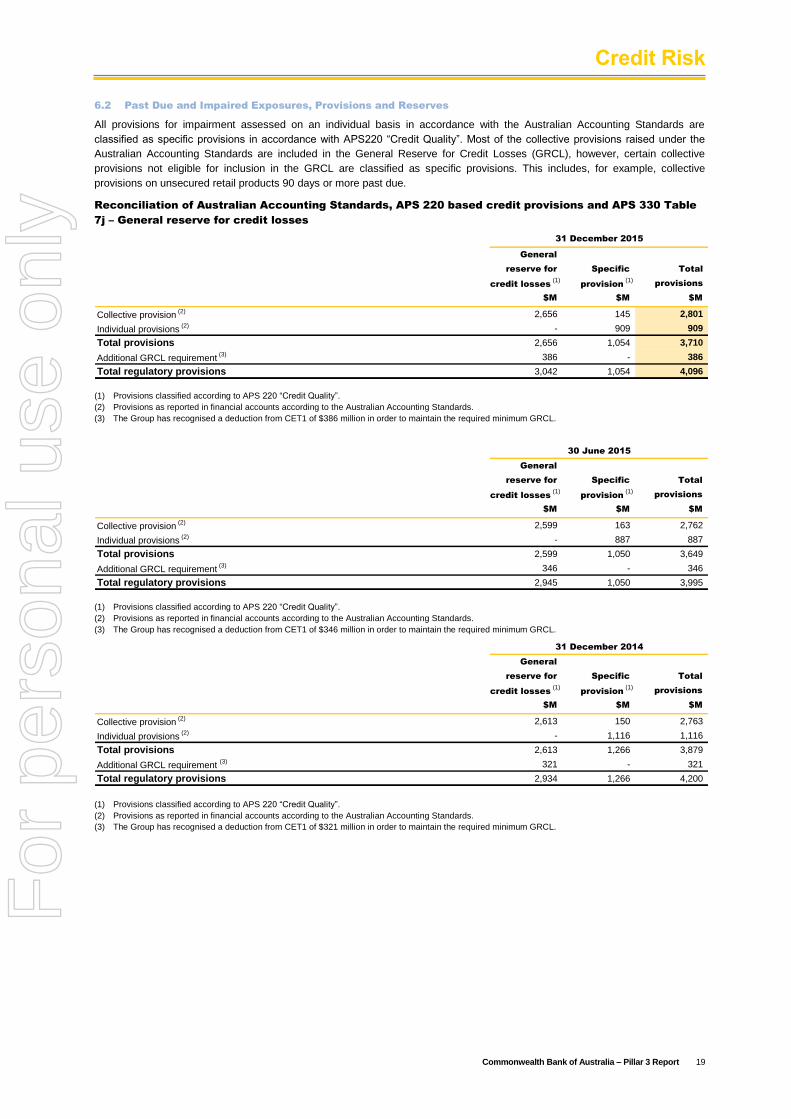
6.2 Past Due and Impaired Exposures, Provisions and Reserves
All provisions for impairment assessed on an individual basis in accordance with the Australian Accounting Standards are
classified as specific provisions in accordance with APS220 “Credit Quality”. Most of the collective provisions raised under the
Australian Accounting Standards are included in the General Reserve for Credit Losses (GRCL), however, certain collective
provisions not eligible for inclusion in the GRCL are classified as specific provisions. This includes, for example, collective
provisions on unsecured retail products 90 days or more past due.
Reconciliation of Australian Accounting Standards, APS 220 based credit provisions and APS 330 Table
7j – General reserve for credit losses
General
reserve for Specific Total
credit losses (1)
provision (1)
provisions
$M $M $M
Collective provision (2) 2,656 145 2,801
Individual provisions (2) - 909 909
Total provisions 2,656 1,054 3,710
Additional GRCL requirement (3) 386 - 386
Total regulatory provisions 3,042 1,054 4,096
31 December 2015
.
(1) Provisions classified according to APS 220 “Credit Quality”.
(2) Provisions as reported in financial accounts according to the Australian Accounting Standards.
(3) The Group has recognised a deduction from CET1 of $386 million in order to maintain the required minimum GRCL.
General
reserve for Specific Total
credit losses (1)
provision (1)
provisions
$M $M $M
Collective provision (2) 2,599 163 2,762
Individual provisions (2) - 887 887
Total provisions 2,599 1,050 3,649
Additional GRCL requirement (3) 346 - 346
Total regulatory provisions 2,945 1,050 3,995
30 June 2015
(1) Provisions classified according to APS 220 “Credit Quality”.
(2) Provisions as reported in financial accounts according to the Australian Accounting Standards.
(3) The Group has recognised a deduction from CET1 of $346 million in order to maintain the required minimum GRCL.
General
reserve for Specific Total
credit losses (1)
provision (1)
provisions
$M $M $M
Collective provision (2) 2,613 150 2,763
Individual provisions (2) - 1,116 1,116
Total provisions 2,613 1,266 3,879
Additional GRCL requirement (3) 321 - 321
Total regulatory provisions 2,934 1,266 4,200
31 December 2014
(1) Provisions classified according to APS 220 “Credit Quality”.
(2) Provisions as reported in financial accounts according to the Australian Accounting Standards.
(3) The Group has recognised a deduction from CET1 of $321 million in order to maintain the required minimum GRCL.
For
per
sona
l use
onl
y
Credit Risk
20 Commonwealth Bank of Australia – Pillar 3 Report
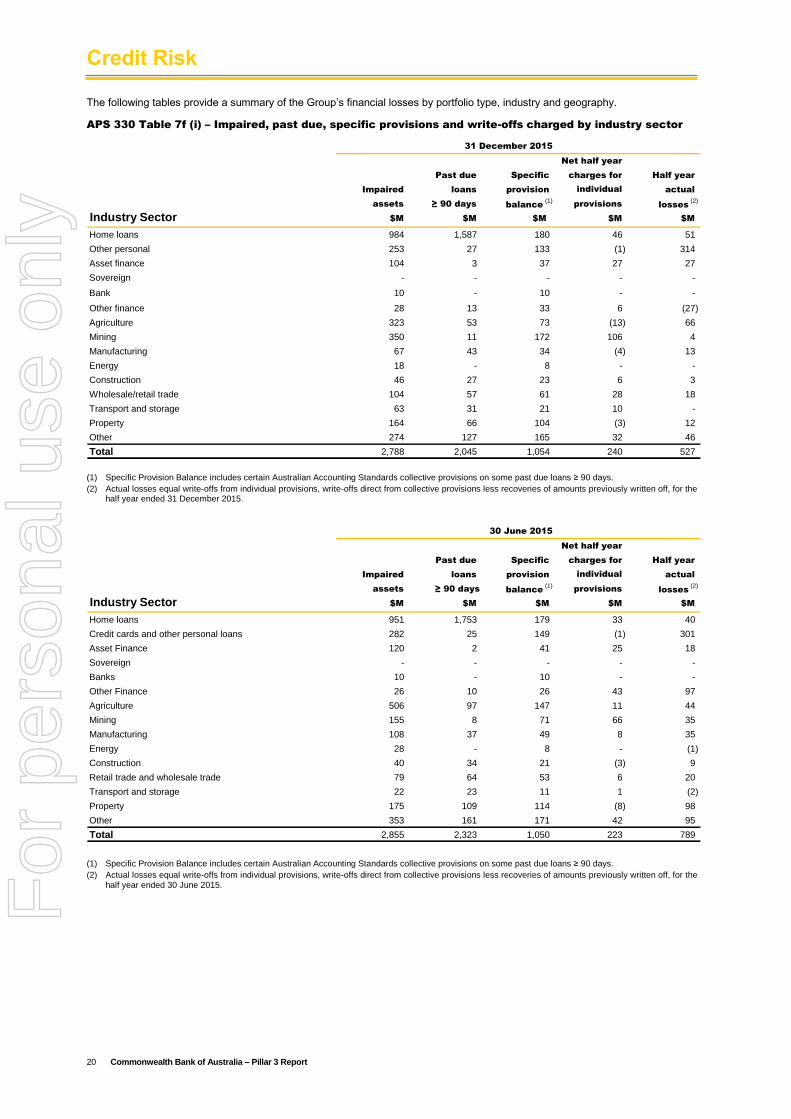
The following tables provide a summary of the Group’s financial losses by portfolio type, industry and geography.
APS 330 Table 7f (i) – Impaired, past due, specific provisions and write-offs charged by industry sector
31 December 2015 > 0 = Error in calculation
Net half year
Past due Specific charges for Half year
Impaired loans provision individual actual
assets ≥ 90 days balance (1)
provisions losses (2)
Industry Sector $M $M $M $M $M
Home loans 984 1,587 180 46 51
Other personal 253 27 133 (1) 314
Asset finance 104 3 37 27 27
Sovereign - - - - -
Bank 10 - 10 - -
Other finance 28 13 33 6 (27)
Agriculture 323 53 73 (13) 66
Mining 350 11 172 106 4
Manufacturing 67 43 34 (4) 13
Energy 18 - 8 - -
Construction 46 27 23 6 3
Wholesale/retail trade 104 57 61 28 18
Transport and storage 63 31 21 10 -
Property 164 66 104 (3) 12
Other 274 127 165 32 46
Total 2,788 2,045 1,054 240 527
.
(1) Specific Provision Balance includes certain Australian Accounting Standards collective provisions on some past due loans ≥ 90 days.
(2) Actual losses equal write-offs from individual provisions, write-offs direct from collective provisions less recoveries of amounts previously written off, for the half year ended 31 December 2015.
30 June 2015
Net half year
Past due Specific charges for Half year
Impaired loans provision individual actual
assets ≥ 90 days balance (1)
provisions losses (2)
Industry Sector $M $M $M $M $M
Home loans 951 1,753 179 33 40
Credit cards and other personal loans 282 25 149 (1) 301
Asset Finance 120 2 41 25 18
Sovereign - - - - -
Banks 10 - 10 - -
Other Finance 26 10 26 43 97
Agriculture 506 97 147 11 44
Mining 155 8 71 66 35
Manufacturing 108 37 49 8 35
Energy 28 - 8 - (1)
Construction 40 34 21 (3) 9
Retail trade and wholesale trade 79 64 53 6 20
Transport and storage 22 23 11 1 (2)
Property 175 109 114 (8) 98
Other 353 161 171 42 95
Total 2,855 2,323 1,050 223 789
(1) Specific Provision Balance includes certain Australian Accounting Standards collective provisions on some past due loans ≥ 90 days.
(2) Actual losses equal write-offs from individual provisions, write-offs direct from collective provisions less recoveries of amounts previously written off, for the half year ended 30 June 2015.
For
per
sona
l use
onl
y
Credit Risk
Commonwealth Bank of Australia – Pillar 3 Report 21
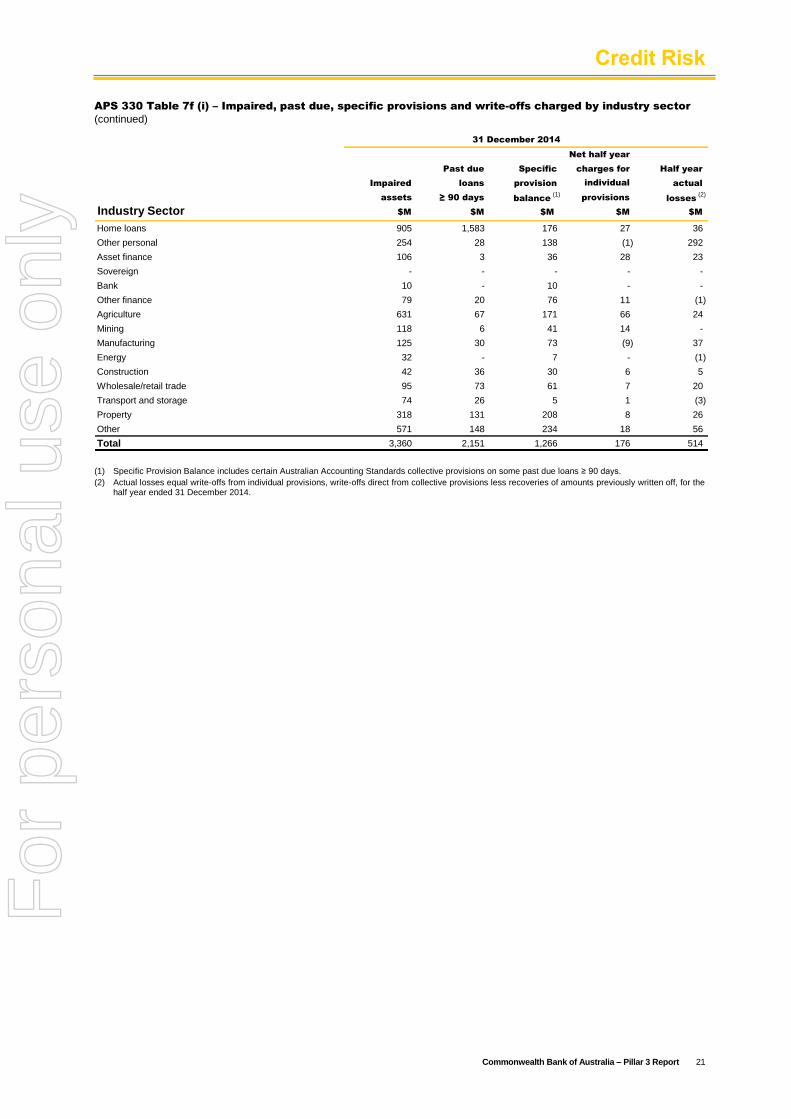
APS 330 Table 7f (i) – Impaired, past due, specific provisions and write-offs charged by industry sector
(continued)
31 December 2014
Net half year
Past due Specific charges for Half year
Impaired loans provision individual actual
assets ≥ 90 days balance (1)
provisions losses (2)
Industry Sector $M $M $M $M $M
Home loans 905 1,583 176 27 36
Other personal 254 28 138 (1) 292
Asset finance 106 3 36 28 23
Sovereign - - - - -
Bank 10 - 10 - -
Other finance 79 20 76 11 (1)
Agriculture 631 67 171 66 24
Mining 118 6 41 14 -
Manufacturing 125 30 73 (9) 37
Energy 32 - 7 - (1)
Construction 42 36 30 6 5
Wholesale/retail trade 95 73 61 7 20
Transport and storage 74 26 5 1 (3)
Property 318 131 208 8 26
Other 571 148 234 18 56
Total 3,360 2,151 1,266 176 514
.
(1) Specific Provision Balance includes certain Australian Accounting Standards collective provisions on some past due loans ≥ 90 days.
(2) Actual losses equal write-offs from individual provisions, write-offs direct from collective provisions less recoveries of amounts previously written off, for the half year ended 31 December 2014.
For
per
sona
l use
onl
y
Credit Risk
22 Commonwealth Bank of Australia – Pillar 3 Report
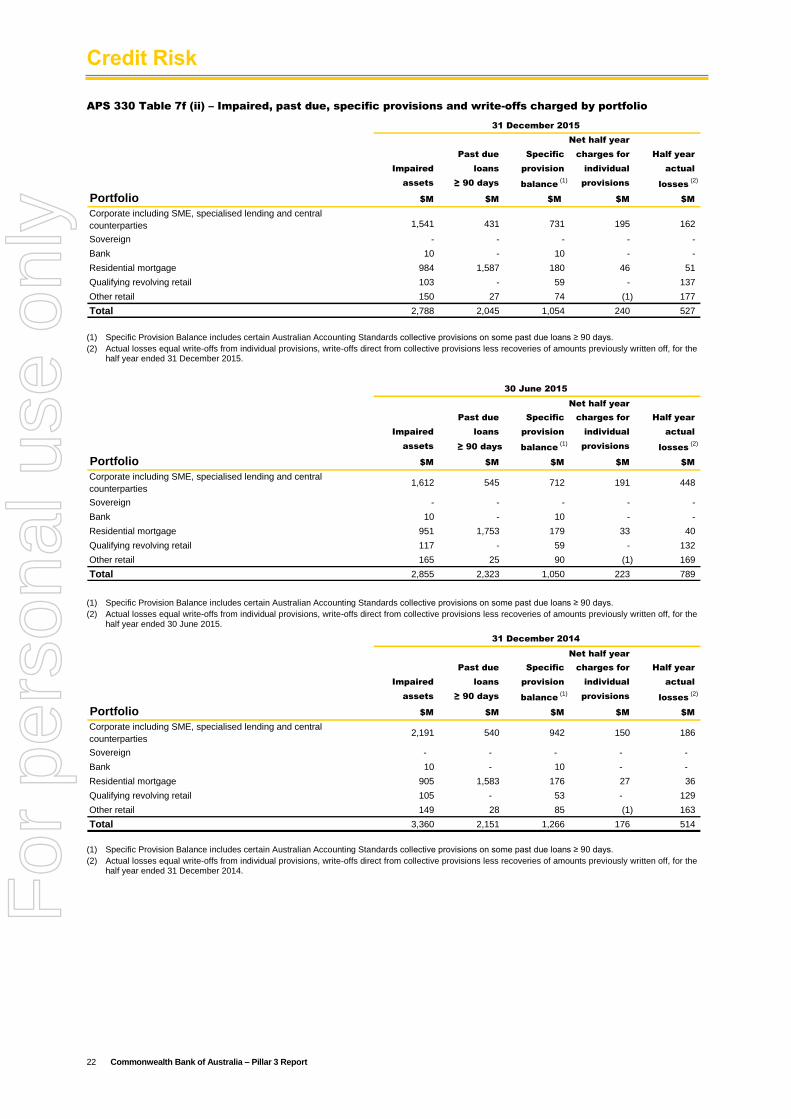
APS 330 Table 7f (ii) – Impaired, past due, specific provisions and write-offs charged by portfolio
Net half year
Past due Specific charges for Half year
Impaired loans provision individual actual
assets ≥ 90 days balance (1)
provisions losses (2)
Portfolio $M $M $M $M $M
Corporate including SME, specialised lending and central
counterparties 1,541 431 731 195 162
Sovereign - - - - -
Bank 10 - 10 - -
Residential mortgage 984 1,587 180 46 51
Qualifying revolving retail 103 - 59 - 137
Other retail 150 27 74 (1) 177
Total 2,788 2,045 1,054 240 527
31 December 2015
(1) Specific Provision Balance includes certain Australian Accounting Standards collective provisions on some past due loans ≥ 90 days.
(2) Actual losses equal write-offs from individual provisions, write-offs direct from collective provisions less recoveries of amounts previously written off, for the half year ended 31 December 2015.
Net half year
Past due Specific charges for Half year
Impaired loans provision individual actual
assets ≥ 90 days balance (1)
provisions losses (2)
Portfolio $M $M $M $M $M
Corporate including SME, specialised lending and central
counterparties1,612 545 712 191 448
Sovereign - - - - -
Bank 10 - 10 - -
Residential mortgage 951 1,753 179 33 40
Qualifying revolving retail 117 - 59 - 132
Other retail 165 25 90 (1) 169
Total 2,855 2,323 1,050 223 789
30 June 2015
(1) Specific Provision Balance includes certain Australian Accounting Standards collective provisions on some past due loans ≥ 90 days.
(2) Actual losses equal write-offs from individual provisions, write-offs direct from collective provisions less recoveries of amounts previously written off, for the half year ended 30 June 2015.
Net half year
Past due Specific charges for Half year
Impaired loans provision individual actual
assets ≥ 90 days balance (1)
provisions losses (2)
Portfolio $M $M $M $M $M
Corporate including SME, specialised lending and central
counterparties2,191 540 942 150 186
Sovereign - - - - -
Bank 10 - 10 - -
Residential mortgage 905 1,583 176 27 36
Qualifying revolving retail 105 - 53 - 129
Other retail 149 28 85 (1) 163
Total 3,360 2,151 1,266 176 514
31 December 2014
(1) Specific Provision Balance includes certain Australian Accounting Standards collective provisions on some past due loans ≥ 90 days.
(2) Actual losses equal write-offs from individual provisions, write-offs direct from collective provisions less recoveries of amounts previously written off, for the half year ended 31 December 2014.
For
per
sona
l use
onl
y
Credit Risk
Commonwealth Bank of Australia – Pillar 3 Report 23
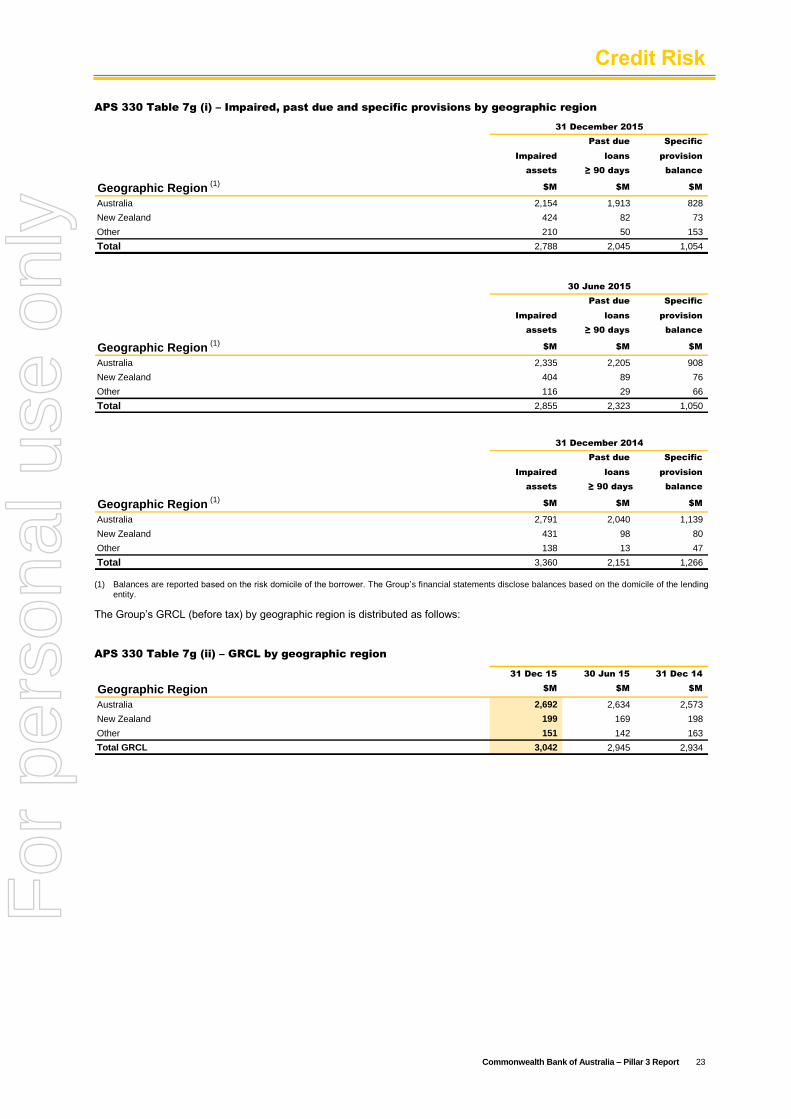
APS 330 Table 7g (i) – Impaired, past due and specific provisions by geographic region
Past due Specific
Impaired loans provision
assets ≥ 90 days balance
Geographic Region (1)
$M $M $M
Australia 2,154 1,913 828
New Zealand 424 82 73
Other 210 50 153
Total 2,788 2,045 1,054
31 December 2015
Past due Specific
Impaired loans provision
assets ≥ 90 days balance
Geographic Region (1)
$M $M $M
Australia 2,335 2,205 908
New Zealand 404 89 76
Other 116 29 66
Total 2,855 2,323 1,050
30 June 2015
Past due Specific
Impaired loans provision
assets ≥ 90 days balance
Geographic Region (1)
$M $M $M
Australia 2,791 2,040 1,139
New Zealand 431 98 80
Other 138 13 47
Total 3,360 2,151 1,266
31 December 2014
(1) Balances are reported based on the risk domicile of the borrower. The Group’s financial statements disclose balances based on the domicile of the lending entity.
The Group’s GRCL (before tax) by geographic region is distributed as follows:
APS 330 Table 7g (ii) – GRCL by geographic region
31 Dec 15 30 Jun 15 31 Dec 14
Geographic Region $M $M $M
Australia 2,692 2,634 2,573
New Zealand 199 169 198
Other 151 142 163
Total GRCL 3,042 2,945 2,934
For
per
sona
l use
onl
y
Credit Risk
24 Commonwealth Bank of Australia – Pillar 3 Report
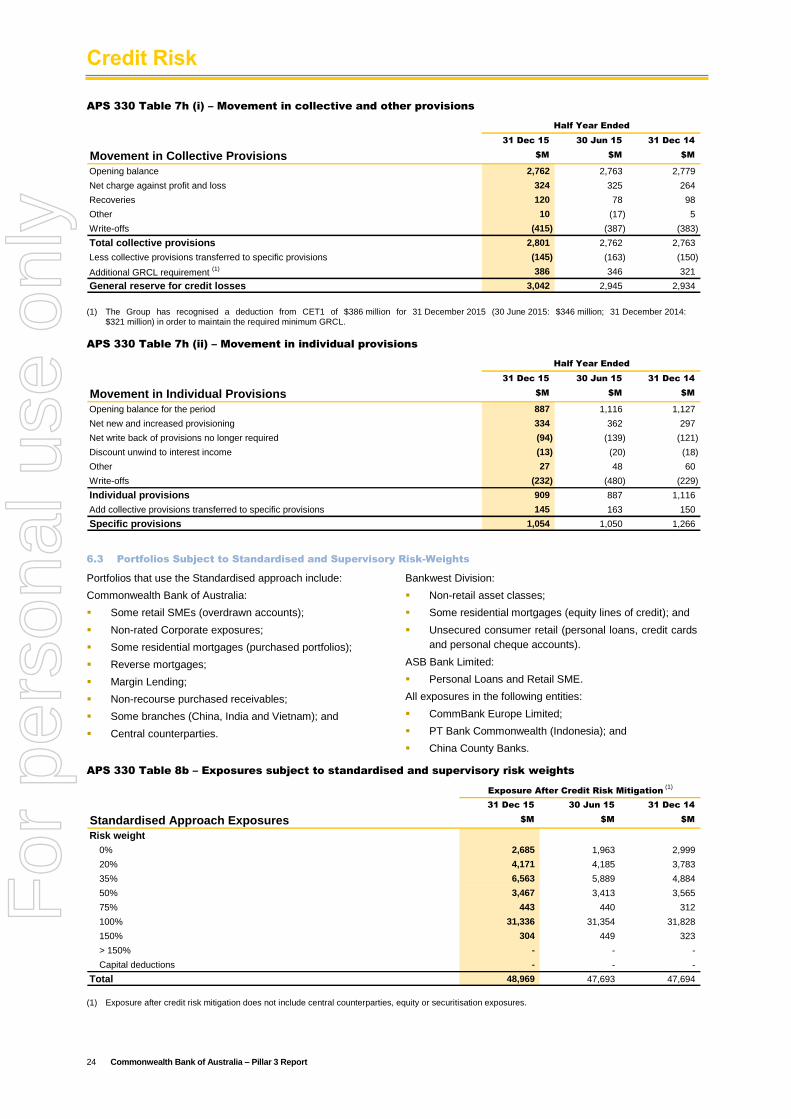
APS 330 Table 7h (i) – Movement in collective and other provisions
31 Dec 15 30 Jun 15 31 Dec 14
Movement in Collective Provisions $M $M $M
Opening balance 2,762 2,763 2,779
Net charge against profit and loss 324 325 264
Recoveries 120 78 98
Other 10 (17) 5
Write-offs (415) (387) (383)
Total collective provisions 2,801 2,762 2,763
Less collective provisions transferred to specific provisions (145) (163) (150)
Additional GRCL requirement (1) 386 346 321
General reserve for credit losses 3,042 2,945 2,934
Half Year Ended
(1) The Group has recognised a deduction from CET1 of $386 million for 31 December 2015 (30 June 2015: $346 million; 31 December 2014:
$321 million) in order to maintain the required minimum GRCL.
APS 330 Table 7h (ii) – Movement in individual provisions
31 Dec 15 30 Jun 15 31 Dec 14
Movement in Individual Provisions $M $M $M
Opening balance for the period 887 1,116 1,127
Net new and increased provisioning 334 362 297
Net write back of provisions no longer required (94) (139) (121)
Discount unwind to interest income (13) (20) (18)
Other 27 48 60
Write-offs (232) (480) (229)
Individual provisions 909 887 1,116
Add collective provisions transferred to specific provisions 145 163 150
Specific provisions 1,054 1,050 1,266
Half Year Ended
6.3 Portfolios Subject to Standardised and Supervisory Risk-Weights
Portfolios that use the Standardised approach include:
Commonwealth Bank of Australia:
Some retail SMEs (overdrawn accounts);
Non-rated Corporate exposures;
Some residential mortgages (purchased portfolios);
Reverse mortgages;
Margin Lending;
Non-recourse purchased receivables;
Some branches (China, India and Vietnam); and
Central counterparties.
Bankwest Division:
Non-retail asset classes;
Some residential mortgages (equity lines of credit); and
Unsecured consumer retail (personal loans, credit cards
and personal cheque accounts).
ASB Bank Limited:
Personal Loans and Retail SME.
All exposures in the following entities:
CommBank Europe Limited;
PT Bank Commonwealth (Indonesia); and
China County Banks.
APS 330 Table 8b – Exposures subject to standardised and supervisory risk weights
31 Dec 15 30 Jun 15 31 Dec 14
Standardised Approach Exposures $M $M $M
Risk weight
0% 2,685 1,963 2,999
20% 4,171 4,185 3,783
35% 6,563 5,889 4,884
50% 3,467 3,413 3,565
75% 443 440 312
100% 31,336 31,354 31,828
150% 304 449 323
> 150% - - -
Capital deductions - - -
Total 48,969 47,693 47,694
Exposure After Credit Risk Mitigation (1)
(1) Exposure after credit risk mitigation does not include central counterparties, equity or securitisation exposures.
For
per
sona
l use
onl
y
Credit Risk
Commonwealth Bank of Australia – Pillar 3 Report 25
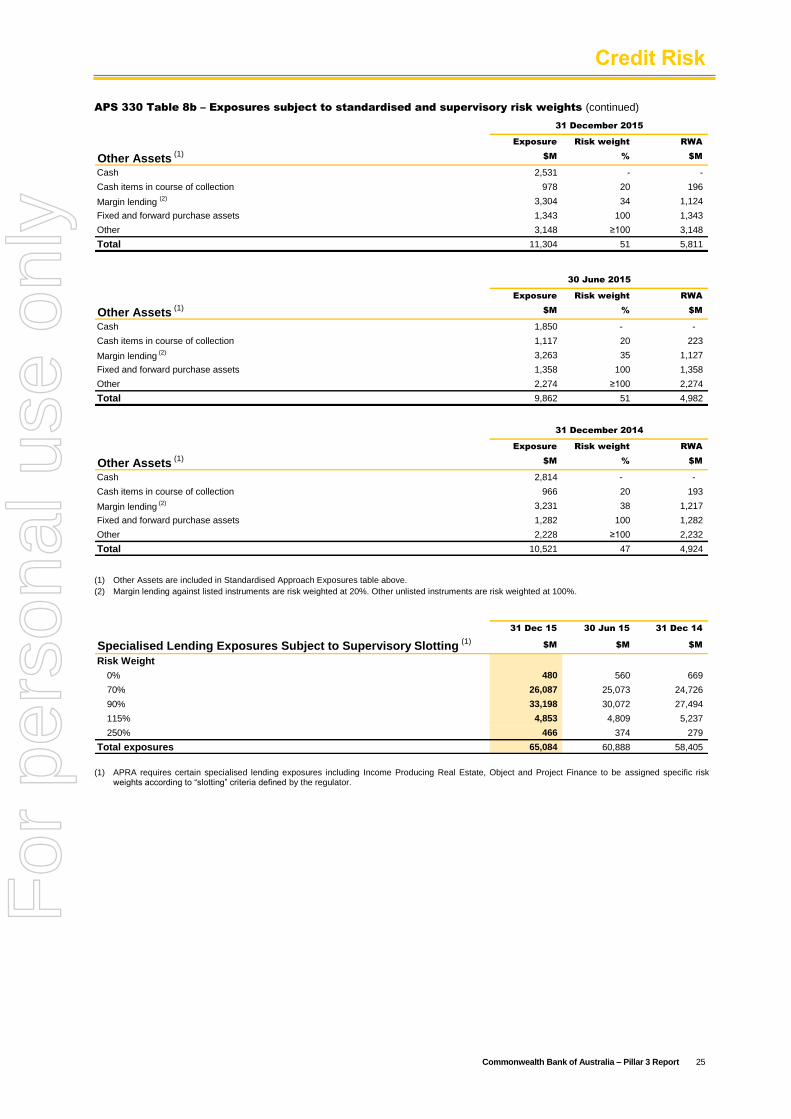
APS 330 Table 8b – Exposures subject to standardised and supervisory risk weights (continued)
Exposure Risk weight RWA
Other Assets (1)
$M % $M
Cash 2,531 - -
Cash items in course of collection 978 20 196
Margin lending (2) 3,304 34 1,124
Fixed and forward purchase assets 1,343 100 1,343
Other 3,148 ≥100 3,148
Total 11,304 51 5,811
31 December 2015
Exposure Risk weight RWA
Other Assets (1)
$M % $M
Cash 1,850 - -
Cash items in course of collection 1,117 20 223
Margin lending (2) 3,263 35 1,127
Fixed and forward purchase assets 1,358 100 1,358
Other 2,274 ≥100 2,274
Total 9,862 51 4,982
30 June 2015
Exposure Risk weight RWA
Other Assets (1)
$M % $M
Cash 2,814 - -
Cash items in course of collection 966 20 193
Margin lending (2) 3,231 38 1,217
Fixed and forward purchase assets 1,282 100 1,282
Other 2,228 ≥100 2,232
Total 10,521 47 4,924
31 December 2014
(1) Other Assets are included in Standardised Approach Exposures table above.
(2) Margin lending against listed instruments are risk weighted at 20%. Other unlisted instruments are risk weighted at 100%.
31 Dec 15 30 Jun 15 31 Dec 14
Specialised Lending Exposures Subject to Supervisory Slotting (1)
$M $M $M
Risk Weight
0% 480 560 669
70% 26,087 25,073 24,726
90% 33,198 30,072 27,494
115% 4,853 4,809 5,237
250% 466 374 279
Total exposures 65,084 60,888 58,405
(1) APRA requires certain specialised lending exposures including Income Producing Real Estate, Object and Project Finance to be assigned specific risk
weights according to “slotting” criteria defined by the regulator.
For
per
sona
l use
onl
y
Credit Risk
26 Commonwealth Bank of Australia – Pillar 3 Report
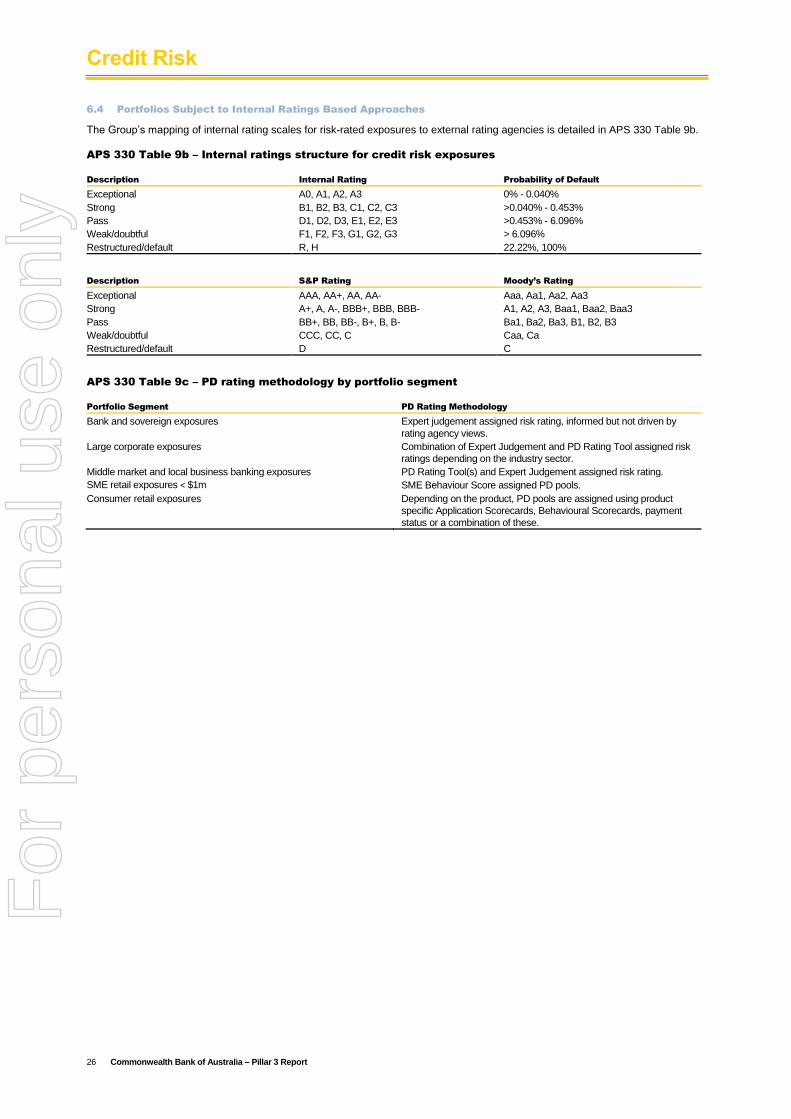
6.4 Portfolios Subject to Internal Ratings Based Approaches
The Group’s mapping of internal rating scales for risk-rated exposures to external rating agencies is detailed in APS 330 Table 9b.
APS 330 Table 9b – Internal ratings structure for credit risk exposures
Description Internal Rating Probability of Default
Exceptional A0, A1, A2, A3 0% - 0.040%
Strong B1, B2, B3, C1, C2, C3 >0.040% - 0.453%
Pass D1, D2, D3, E1, E2, E3 >0.453% - 6.096%
Weak/doubtful F1, F2, F3, G1, G2, G3 > 6.096%
Restructured/default R, H 22.22%, 100%
Description S&P Rating Moody’s Rating
Exceptional AAA, AA+, AA, AA- Aaa, Aa1, Aa2, Aa3
Strong A+, A, A-, BBB+, BBB, BBB- A1, A2, A3, Baa1, Baa2, Baa3
Pass BB+, BB, BB-, B+, B, B- Ba1, Ba2, Ba3, B1, B2, B3
Weak/doubtful CCC, CC, C Caa, Ca
Restructured/default D C
APS 330 Table 9c – PD rating methodology by portfolio segment
Portfolio Segment PD Rating Methodology
Bank and sovereign exposures Expert judgement assigned risk rating, informed but not driven by
rating agency views.
Large corporate exposures Combination of Expert Judgement and PD Rating Tool assigned risk
ratings depending on the industry sector.
Middle market and local business banking exposures PD Rating Tool(s) and Expert Judgement assigned risk rating.
SME retail exposures < $1m SME Behaviour Score assigned PD pools.
Consumer retail exposures Depending on the product, PD pools are assigned using product
specific Application Scorecards, Behavioural Scorecards, payment
status or a combination of these.
For
per
sona
l use
onl
y
Credit Risk
Commonwealth Bank of Australia – Pillar 3 Report 27
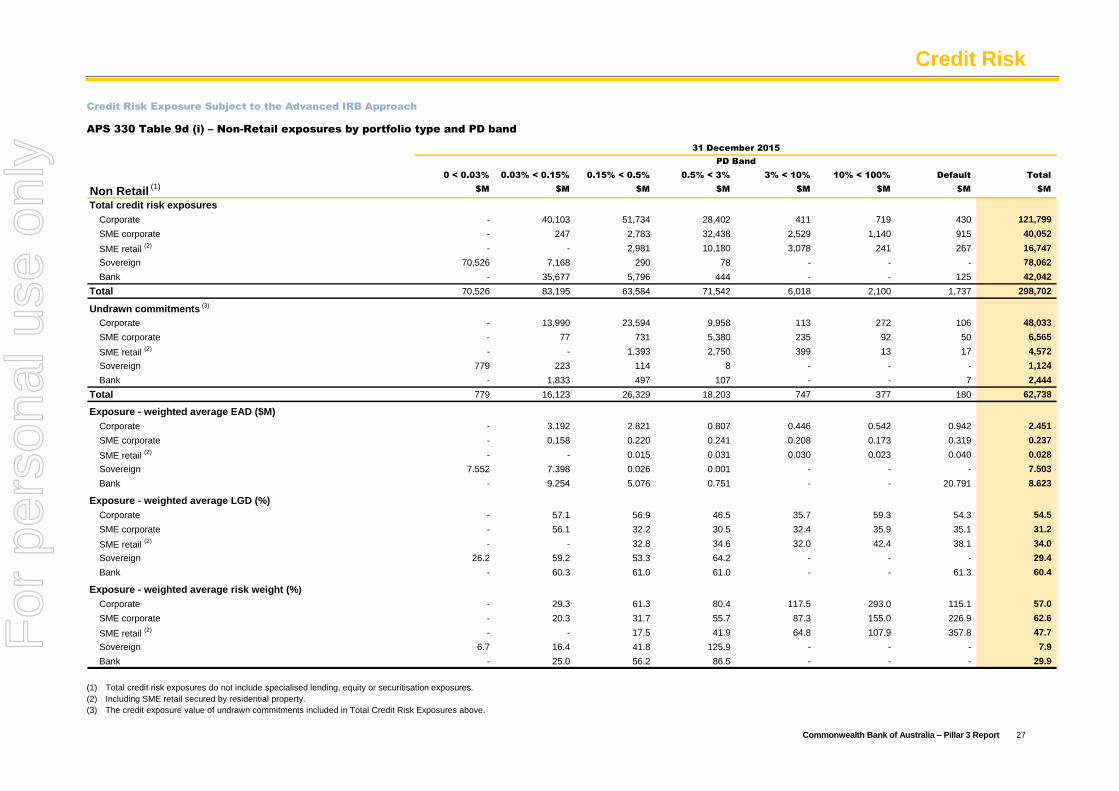
Credit Risk Exposure Subject to the Advanced IRB Approach
APS 330 Table 9d (i) – Non-Retail exposures by portfolio type and PD band
0 < 0.03% 0.03% < 0.15% 0.15% < 0.5% 0.5% < 3% 3% < 10% 10% < 100% Default Total
Non Retail (1)$M $M $M $M $M $M $M $M
Total credit risk exposures
Corporate - 40,103 51,734 28,402 411 719 430 121,799
SME corporate - 247 2,783 32,438 2,529 1,140 915 40,052
SME retail (2) - - 2,981 10,180 3,078 241 267 16,747
Sovereign 70,526 7,168 290 78 - - - 78,062
Bank - 35,677 5,796 444 - - 125 42,042
Total 70,526 83,195 63,584 71,542 6,018 2,100 1,737 298,702
Undrawn commitments (3)
Corporate - 13,990 23,594 9,958 113 272 106 48,033
SME corporate - 77 731 5,380 235 92 50 6,565
SME retail (2) - - 1,393 2,750 399 13 17 4,572
Sovereign 779 223 114 8 - - - 1,124
Bank - 1,833 497 107 - - 7 2,444
Total 779 16,123 26,329 18,203 747 377 180 62,738
Exposure - weighted average EAD ($M)
Corporate - 3.192 2.821 0.807 0.446 0.542 0.942 2.451
SME corporate - 0.158 0.220 0.241 0.208 0.173 0.319 0.237
SME retail (2) - - 0.015 0.031 0.030 0.023 0.040 0.028
Sovereign 7.552 7.398 0.026 0.001 - - - 7.503
Bank - 9.254 5.076 0.751 - - 20.791 8.623
Exposure - weighted average LGD (%)
Corporate - 57.1 56.9 46.5 35.7 59.3 54.3 54.5
SME corporate - 56.1 32.2 30.5 32.4 35.9 35.1 31.2
SME retail (2) - - 32.8 34.6 32.0 42.4 38.1 34.0
Sovereign 26.2 59.2 53.3 64.2 - - - 29.4
Bank - 60.3 61.0 61.0 - - 61.3 60.4
Exposure - weighted average risk weight (%)
Corporate - 29.3 61.3 80.4 117.5 293.0 115.1 57.0
SME corporate - 20.3 31.7 55.7 87.3 155.0 226.9 62.6
SME retail (2) - - 17.5 41.9 64.8 107.9 357.8 47.7
Sovereign 6.7 16.4 41.8 125.9 - - - 7.9
Bank - 25.0 56.2 86.5 - - - 29.9
31 December 2015
PD Band
(1) Total credit risk exposures do not include specialised lending, equity or securitisation exposures.
(2) Including SME retail secured by residential property.
(3) The credit exposure value of undrawn commitments included in Total Credit Risk Exposures above.
For
per
sona
l use
onl
y
Credit Risk
28 Commonwealth Bank of Australia – Pillar 3 Report
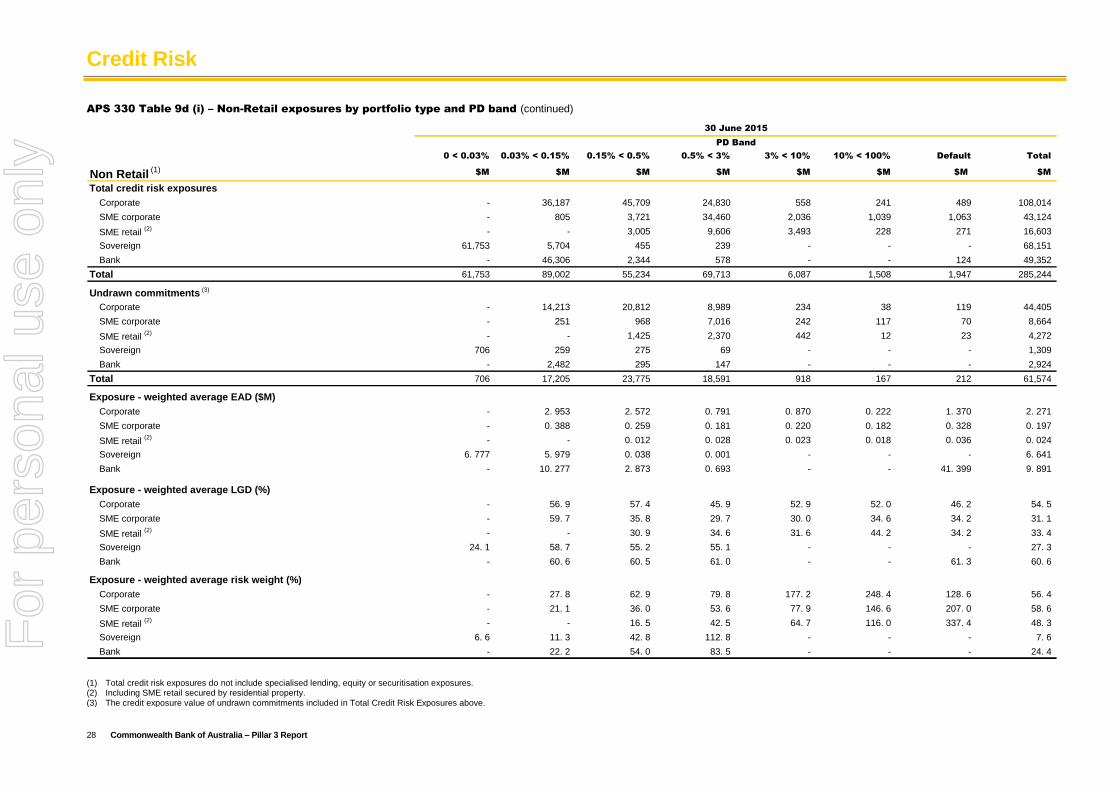
APS 330 Table 9d (i) – Non-Retail exposures by portfolio type and PD band (continued)
0 < 0.03% 0.03% < 0.15% 0.15% < 0.5% 0.5% < 3% 3% < 10% 10% < 100% Default Total
Non Retail (1)$M $M $M $M $M $M $M $M
Total credit risk exposures
Corporate - 36,187 45,709 24,830 558 241 489 108,014
SME corporate - 805 3,721 34,460 2,036 1,039 1,063 43,124
SME retail (2) - - 3,005 9,606 3,493 228 271 16,603
Sovereign 61,753 5,704 455 239 - - - 68,151
Bank - 46,306 2,344 578 - - 124 49,352
Total 61,753 89,002 55,234 69,713 6,087 1,508 1,947 285,244
Undrawn commitments (3)
Corporate - 14,213 20,812 8,989 234 38 119 44,405
SME corporate - 251 968 7,016 242 117 70 8,664
SME retail (2) - - 1,425 2,370 442 12 23 4,272
Sovereign 706 259 275 69 - - - 1,309
Bank - 2,482 295 147 - - - 2,924
Total 706 17,205 23,775 18,591 918 167 212 61,574
Exposure - weighted average EAD ($M)
Corporate - 2. 953 2. 572 0. 791 0. 870 0. 222 1. 370 2. 271
SME corporate - 0. 388 0. 259 0. 181 0. 220 0. 182 0. 328 0. 197
SME retail (2) - - 0. 012 0. 028 0. 023 0. 018 0. 036 0. 024
Sovereign 6. 777 5. 979 0. 038 0. 001 - - - 6. 641
Bank - 10. 277 2. 873 0. 693 - - 41. 399 9. 891
Exposure - weighted average LGD (%)
Corporate - 56. 9 57. 4 45. 9 52. 9 52. 0 46. 2 54. 5
SME corporate - 59. 7 35. 8 29. 7 30. 0 34. 6 34. 2 31. 1
SME retail (2) - - 30. 9 34. 6 31. 6 44. 2 34. 2 33. 4
Sovereign 24. 1 58. 7 55. 2 55. 1 - - - 27. 3
Bank - 60. 6 60. 5 61. 0 - - 61. 3 60. 6
Exposure - weighted average risk weight (%)
Corporate - 27. 8 62. 9 79. 8 177. 2 248. 4 128. 6 56. 4
SME corporate - 21. 1 36. 0 53. 6 77. 9 146. 6 207. 0 58. 6
SME retail (2) - - 16. 5 42. 5 64. 7 116. 0 337. 4 48. 3
Sovereign 6. 6 11. 3 42. 8 112. 8 - - - 7. 6
Bank - 22. 2 54. 0 83. 5 - - - 24. 4
30 June 2015
PD Band
(1) Total credit risk exposures do not include specialised lending, equity or securitisation exposures. (2) Including SME retail secured by residential property. (3) The credit exposure value of undrawn commitments included in Total Credit Risk Exposures above.
For
per
sona
l use
onl
y
Credit Risk
Commonwealth Bank of Australia – Pillar 3 Report 29
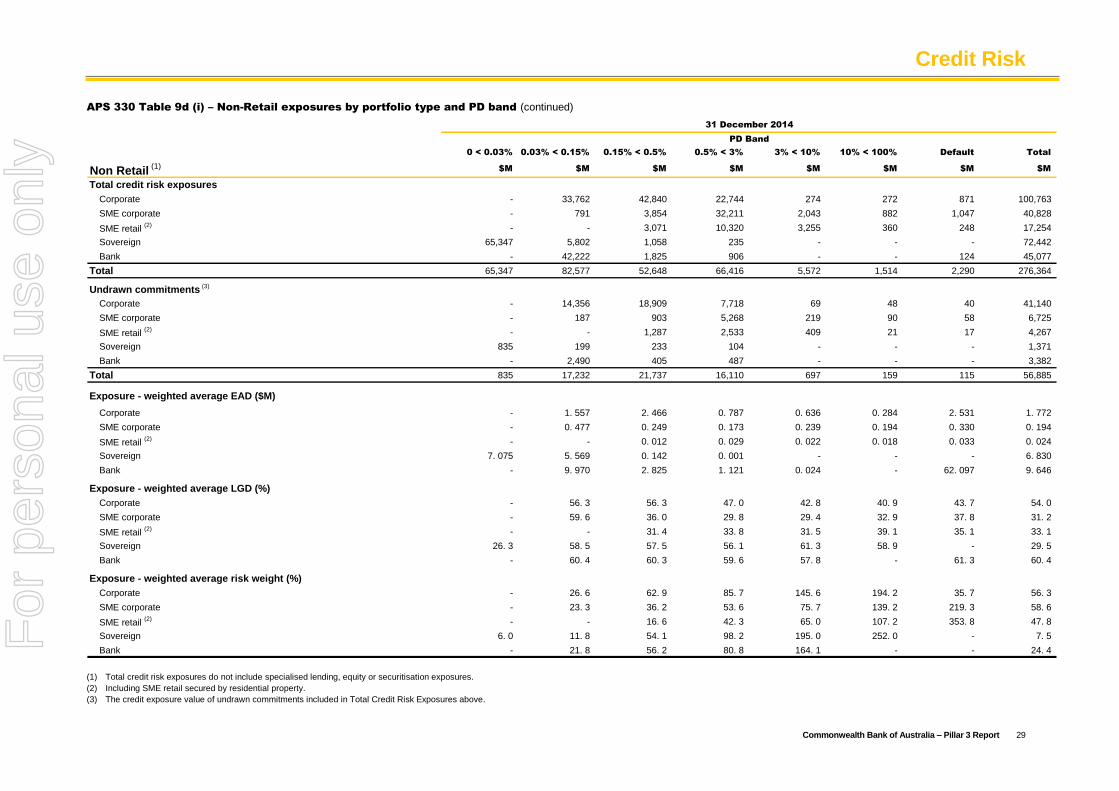
APS 330 Table 9d (i) – Non-Retail exposures by portfolio type and PD band (continued)
0 < 0.03% 0.03% < 0.15% 0.15% < 0.5% 0.5% < 3% 3% < 10% 10% < 100% Default Total
Non Retail (1)
$M $M $M $M $M $M $M $M
Total credit risk exposures
Corporate - 33,762 42,840 22,744 274 272 871 100,763
SME corporate - 791 3,854 32,211 2,043 882 1,047 40,828
SME retail (2) - - 3,071 10,320 3,255 360 248 17,254
Sovereign 65,347 5,802 1,058 235 - - - 72,442
Bank - 42,222 1,825 906 - - 124 45,077
Total 65,347 82,577 52,648 66,416 5,572 1,514 2,290 276,364
Undrawn commitments (3)
Corporate - 14,356 18,909 7,718 69 48 40 41,140
SME corporate - 187 903 5,268 219 90 58 6,725
SME retail (2) - - 1,287 2,533 409 21 17 4,267
Sovereign 835 199 233 104 - - - 1,371
Bank - 2,490 405 487 - - - 3,382
Total 835 17,232 21,737 16,110 697 159 115 56,885
Exposure - weighted average EAD ($M)
Corporate - 1. 557 2. 466 0. 787 0. 636 0. 284 2. 531 1. 772
SME corporate - 0. 477 0. 249 0. 173 0. 239 0. 194 0. 330 0. 194
SME retail (2) - - 0. 012 0. 029 0. 022 0. 018 0. 033 0. 024
Sovereign 7. 075 5. 569 0. 142 0. 001 - - - 6. 830
Bank - 9. 970 2. 825 1. 121 0. 024 - 62. 097 9. 646
Exposure - weighted average LGD (%)
Corporate - 56. 3 56. 3 47. 0 42. 8 40. 9 43. 7 54. 0
SME corporate - 59. 6 36. 0 29. 8 29. 4 32. 9 37. 8 31. 2
SME retail (2) - - 31. 4 33. 8 31. 5 39. 1 35. 1 33. 1
Sovereign 26. 3 58. 5 57. 5 56. 1 61. 3 58. 9 - 29. 5
Bank - 60. 4 60. 3 59. 6 57. 8 - 61. 3 60. 4
Exposure - weighted average risk weight (%)
Corporate - 26. 6 62. 9 85. 7 145. 6 194. 2 35. 7 56. 3
SME corporate - 23. 3 36. 2 53. 6 75. 7 139. 2 219. 3 58. 6
SME retail (2) - - 16. 6 42. 3 65. 0 107. 2 353. 8 47. 8
Sovereign 6. 0 11. 8 54. 1 98. 2 195. 0 252. 0 - 7. 5
Bank - 21. 8 56. 2 80. 8 164. 1 - - 24. 4
31 December 2014
PD Band
(1) Total credit risk exposures do not include specialised lending, equity or securitisation exposures.
(2) Including SME retail secured by residential property.
(3) The credit exposure value of undrawn commitments included in Total Credit Risk Exposures above.
For
per
sona
l use
onl
y
Credit Risk
30 Commonwealth Bank of Australia – Pillar 3 Report
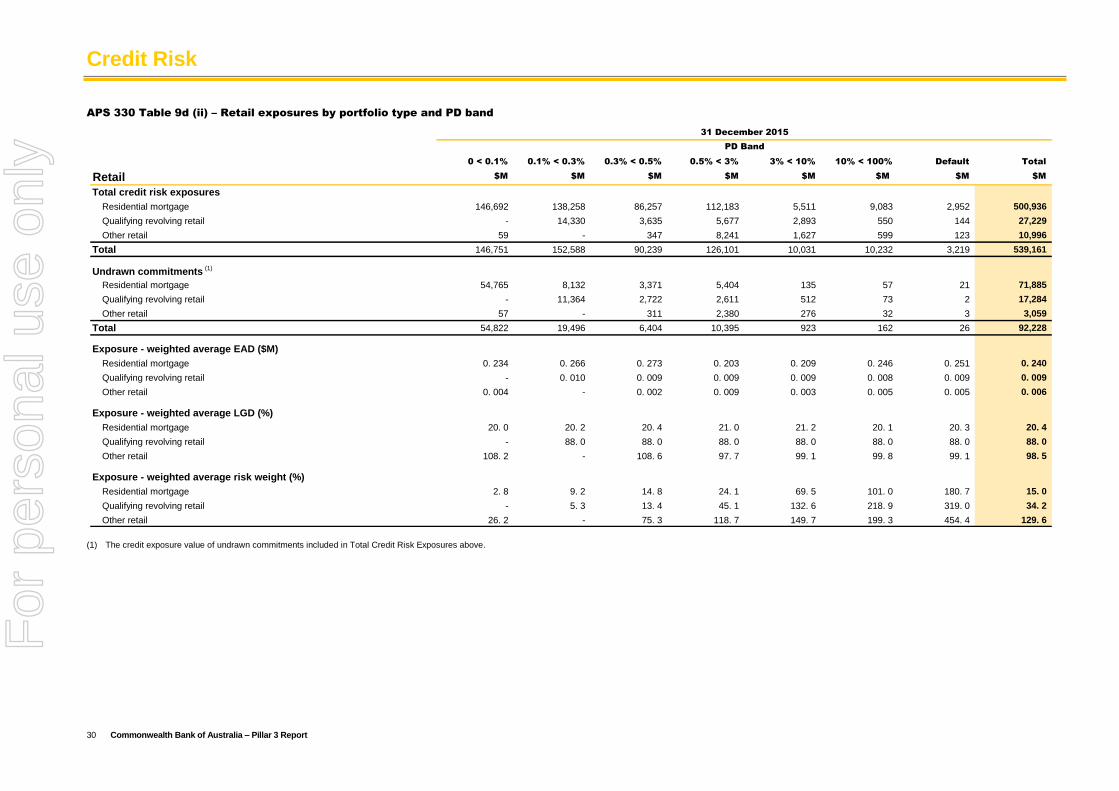
APS 330 Table 9d (ii) – Retail exposures by portfolio type and PD band
0 < 0.1% 0.1% < 0.3% 0.3% < 0.5% 0.5% < 3% 3% < 10% 10% < 100% Default Total
Retail $M $M $M $M $M $M $M $M
Total credit risk exposures
Residential mortgage 146,692 138,258 86,257 112,183 5,511 9,083 2,952 500,936
Qualifying revolving retail - 14,330 3,635 5,677 2,893 550 144 27,229
Other retail 59 - 347 8,241 1,627 599 123 10,996
Total 146,751 152,588 90,239 126,101 10,031 10,232 3,219 539,161
Undrawn commitments (1)
Residential mortgage 54,765 8,132 3,371 5,404 135 57 21 71,885
Qualifying revolving retail - 11,364 2,722 2,611 512 73 2 17,284
Other retail 57 - 311 2,380 276 32 3 3,059
Total 54,822 19,496 6,404 10,395 923 162 26 92,228
Exposure - weighted average EAD ($M)
Residential mortgage 0. 234 0. 266 0. 273 0. 203 0. 209 0. 246 0. 251 0. 240
Qualifying revolving retail - 0. 010 0. 009 0. 009 0. 009 0. 008 0. 009 0. 009
Other retail 0. 004 - 0. 002 0. 009 0. 003 0. 005 0. 005 0. 006
Exposure - weighted average LGD (%)
Residential mortgage 20. 0 20. 2 20. 4 21. 0 21. 2 20. 1 20. 3 20. 4
Qualifying revolving retail - 88. 0 88. 0 88. 0 88. 0 88. 0 88. 0 88. 0
Other retail 108. 2 - 108. 6 97. 7 99. 1 99. 8 99. 1 98. 5
Exposure - weighted average risk weight (%)
Residential mortgage 2. 8 9. 2 14. 8 24. 1 69. 5 101. 0 180. 7 15. 0
Qualifying revolving retail - 5. 3 13. 4 45. 1 132. 6 218. 9 319. 0 34. 2
Other retail 26. 2 - 75. 3 118. 7 149. 7 199. 3 454. 4 129. 6
31 December 2015
PD Band
(1) The credit exposure value of undrawn commitments included in Total Credit Risk Exposures above.
For
per
sona
l use
onl
y
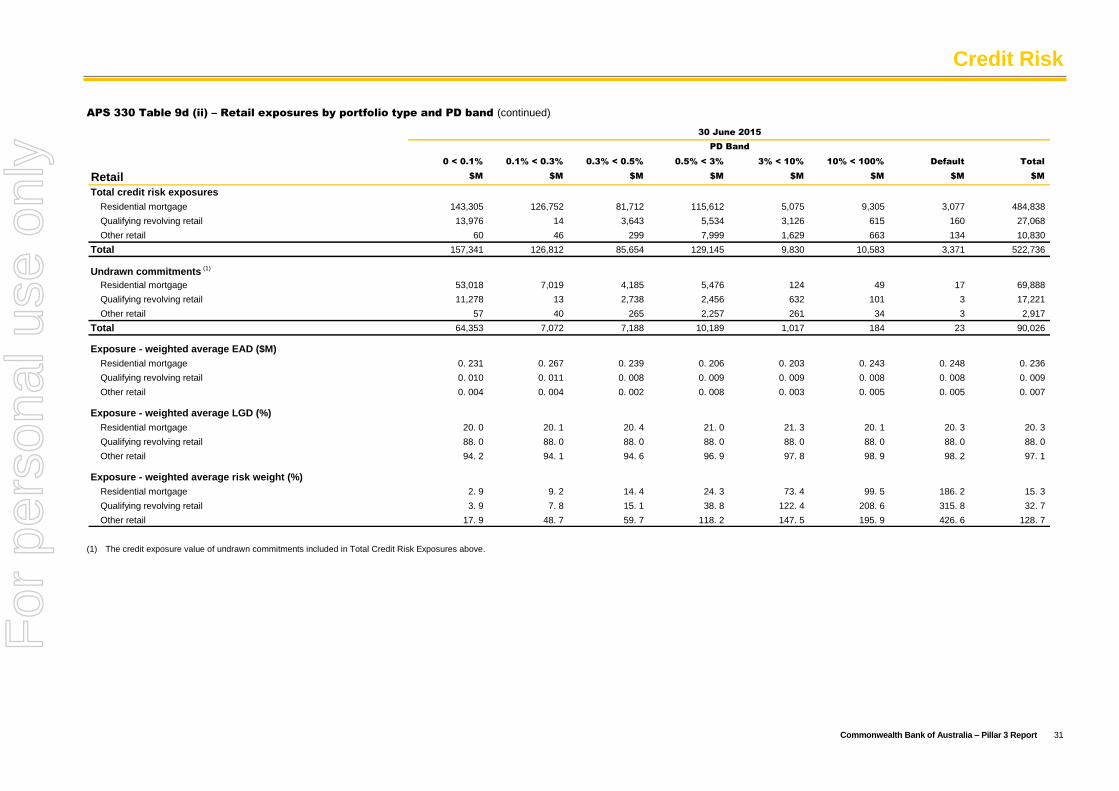
Credit Risk
Commonwealth Bank of Australia – Pillar 3 Report 31
APS 330 Table 9d (ii) – Retail exposures by portfolio type and PD band (continued)
0 < 0.1% 0.1% < 0.3% 0.3% < 0.5% 0.5% < 3% 3% < 10% 10% < 100% Default Total
Retail $M $M $M $M $M $M $M $M
Total credit risk exposures
Residential mortgage 143,305 126,752 81,712 115,612 5,075 9,305 3,077 484,838
Qualifying revolving retail 13,976 14 3,643 5,534 3,126 615 160 27,068
Other retail 60 46 299 7,999 1,629 663 134 10,830
Total 157,341 126,812 85,654 129,145 9,830 10,583 3,371 522,736
Undrawn commitments (1)
Residential mortgage 53,018 7,019 4,185 5,476 124 49 17 69,888
Qualifying revolving retail 11,278 13 2,738 2,456 632 101 3 17,221
Other retail 57 40 265 2,257 261 34 3 2,917
Total 64,353 7,072 7,188 10,189 1,017 184 23 90,026
Exposure - weighted average EAD ($M)
Residential mortgage 0. 231 0. 267 0. 239 0. 206 0. 203 0. 243 0. 248 0. 236
Qualifying revolving retail 0. 010 0. 011 0. 008 0. 009 0. 009 0. 008 0. 008 0. 009
Other retail 0. 004 0. 004 0. 002 0. 008 0. 003 0. 005 0. 005 0. 007
Exposure - weighted average LGD (%)
Residential mortgage 20. 0 20. 1 20. 4 21. 0 21. 3 20. 1 20. 3 20. 3
Qualifying revolving retail 88. 0 88. 0 88. 0 88. 0 88. 0 88. 0 88. 0 88. 0
Other retail 94. 2 94. 1 94. 6 96. 9 97. 8 98. 9 98. 2 97. 1
Exposure - weighted average risk weight (%)
Residential mortgage 2. 9 9. 2 14. 4 24. 3 73. 4 99. 5 186. 2 15. 3
Qualifying revolving retail 3. 9 7. 8 15. 1 38. 8 122. 4 208. 6 315. 8 32. 7
Other retail 17. 9 48. 7 59. 7 118. 2 147. 5 195. 9 426. 6 128. 7
30 June 2015
PD Band
(1) The credit exposure value of undrawn commitments included in Total Credit Risk Exposures above.
For
per
sona
l use
onl
y
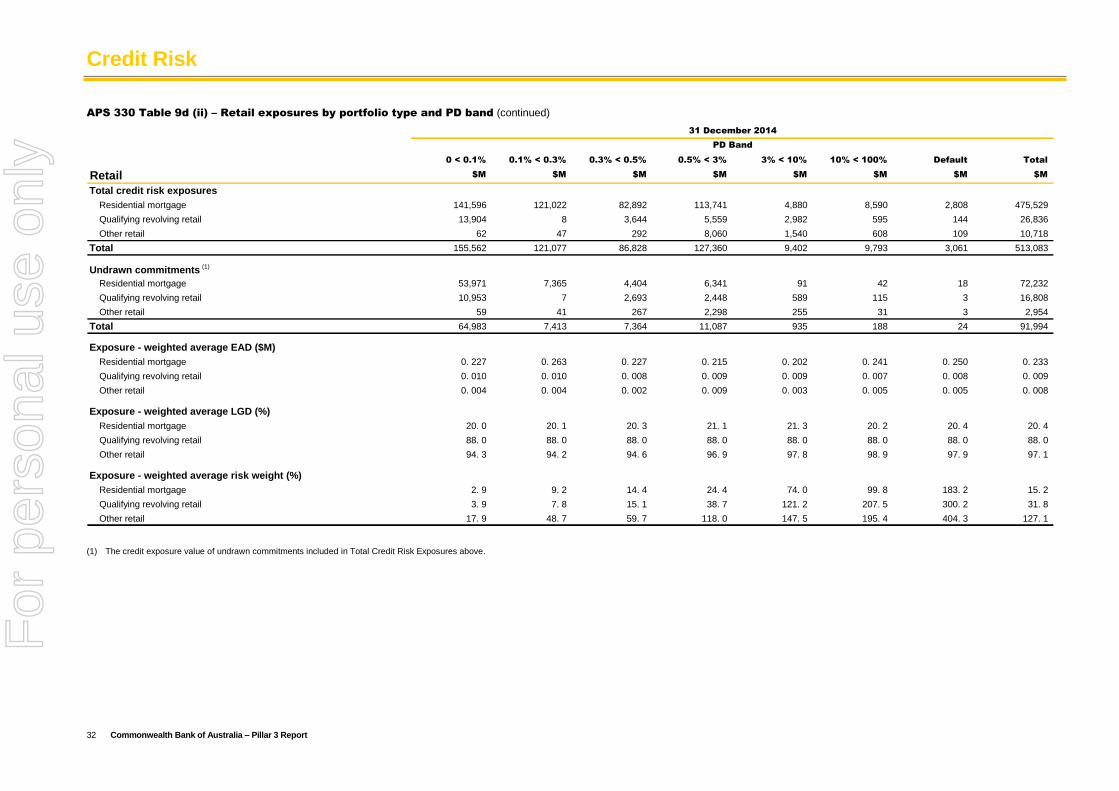
Credit Risk
32 Commonwealth Bank of Australia – Pillar 3 Report
APS 330 Table 9d (ii) – Retail exposures by portfolio type and PD band (continued)
0 < 0.1% 0.1% < 0.3% 0.3% < 0.5% 0.5% < 3% 3% < 10% 10% < 100% Default Total
Retail $M $M $M $M $M $M $M $M
Total credit risk exposures
Residential mortgage 141,596 121,022 82,892 113,741 4,880 8,590 2,808 475,529
Qualifying revolving retail 13,904 8 3,644 5,559 2,982 595 144 26,836
Other retail 62 47 292 8,060 1,540 608 109 10,718
Total 155,562 121,077 86,828 127,360 9,402 9,793 3,061 513,083
Undrawn commitments (1)
Residential mortgage 53,971 7,365 4,404 6,341 91 42 18 72,232
Qualifying revolving retail 10,953 7 2,693 2,448 589 115 3 16,808
Other retail 59 41 267 2,298 255 31 3 2,954
Total 64,983 7,413 7,364 11,087 935 188 24 91,994
Exposure - weighted average EAD ($M)
Residential mortgage 0. 227 0. 263 0. 227 0. 215 0. 202 0. 241 0. 250 0. 233
Qualifying revolving retail 0. 010 0. 010 0. 008 0. 009 0. 009 0. 007 0. 008 0. 009
Other retail 0. 004 0. 004 0. 002 0. 009 0. 003 0. 005 0. 005 0. 008
Exposure - weighted average LGD (%)
Residential mortgage 20. 0 20. 1 20. 3 21. 1 21. 3 20. 2 20. 4 20. 4
Qualifying revolving retail 88. 0 88. 0 88. 0 88. 0 88. 0 88. 0 88. 0 88. 0
Other retail 94. 3 94. 2 94. 6 96. 9 97. 8 98. 9 97. 9 97. 1
Exposure - weighted average risk weight (%)
Residential mortgage 2. 9 9. 2 14. 4 24. 4 74. 0 99. 8 183. 2 15. 2
Qualifying revolving retail 3. 9 7. 8 15. 1 38. 7 121. 2 207. 5 300. 2 31. 8
Other retail 17. 9 48. 7 59. 7 118. 0 147. 5 195. 4 404. 3 127. 1
31 December 2014
PD Band
(1) The credit exposure value of undrawn commitments included in Total Credit Risk Exposures above.
For
per
sona
l use
onl
y
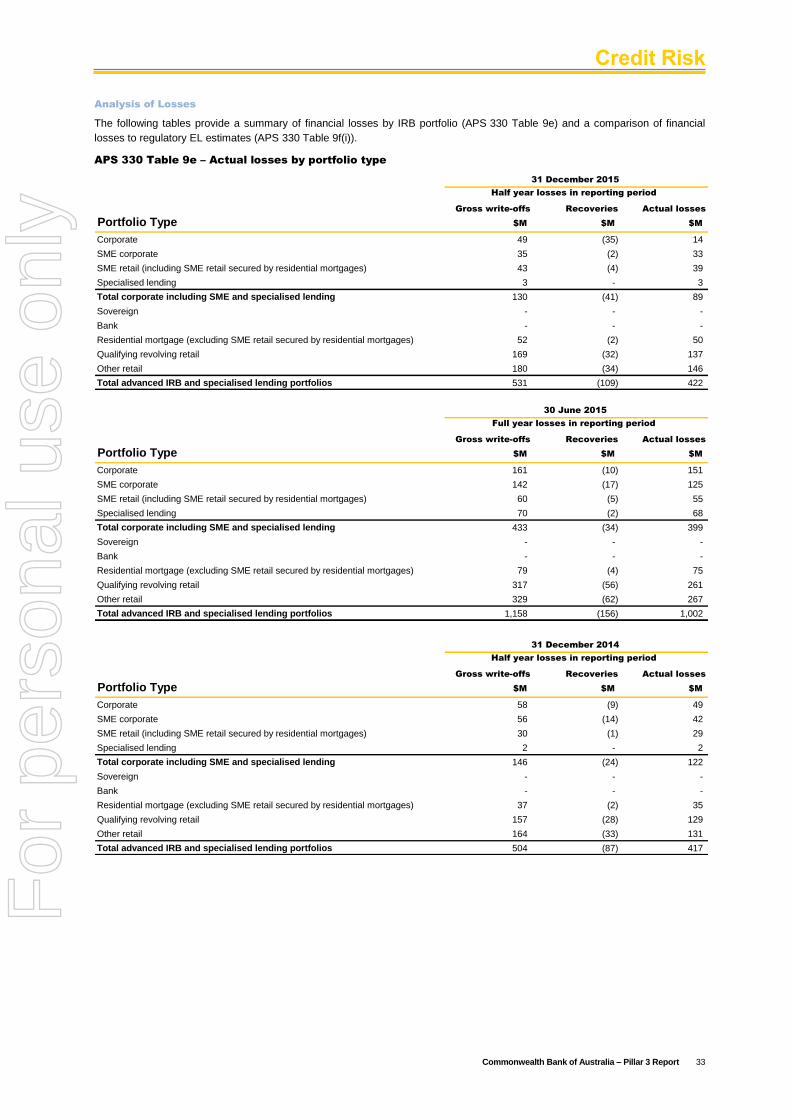
Credit Risk
Commonwealth Bank of Australia – Pillar 3 Report 33
Analysis of Losses
The following tables provide a summary of financial losses by IRB portfolio (APS 330 Table 9e) and a comparison of financial
losses to regulatory EL estimates (APS 330 Table 9f(i)).
APS 330 Table 9e – Actual losses by portfolio type
Gross write-offs Recoveries Actual losses
Portfolio Type $M $M $M
Corporate 49 (35) 14
SME corporate 35 (2) 33
SME retail (including SME retail secured by residential mortgages) 43 (4) 39
Specialised lending 3 - 3
Total corporate including SME and specialised lending 130 (41) 89
Sovereign - - -
Bank - - -
Residential mortgage (excluding SME retail secured by residential mortgages) 52 (2) 50
Qualifying revolving retail 169 (32) 137
Other retail 180 (34) 146
Total advanced IRB and specialised lending portfolios 531 (109) 422
31 December 2015
Half year losses in reporting period
Gross write-offs Recoveries Actual losses
Portfolio Type $M $M $M
Corporate 161 (10) 151
SME corporate 142 (17) 125
SME retail (including SME retail secured by residential mortgages) 60 (5) 55
Specialised lending 70 (2) 68
Total corporate including SME and specialised lending 433 (34) 399
Sovereign - - -
Bank - - -
Residential mortgage (excluding SME retail secured by residential mortgages) 79 (4) 75
Qualifying revolving retail 317 (56) 261
Other retail 329 (62) 267
Total advanced IRB and specialised lending portfolios 1,158 (156) 1,002
30 June 2015
Full year losses in reporting period
Gross write-offs Recoveries Actual losses
Portfolio Type $M $M $M
Corporate 58 (9) 49
SME corporate 56 (14) 42
SME retail (including SME retail secured by residential mortgages) 30 (1) 29
Specialised lending 2 - 2
Total corporate including SME and specialised lending 146 (24) 122
Sovereign - - -
Bank - - -
Residential mortgage (excluding SME retail secured by residential mortgages) 37 (2) 35
Qualifying revolving retail 157 (28) 129
Other retail 164 (33) 131
Total advanced IRB and specialised lending portfolios 504 (87) 417
31 December 2014
Half year losses in reporting period
For
per
sona
l use
onl
y
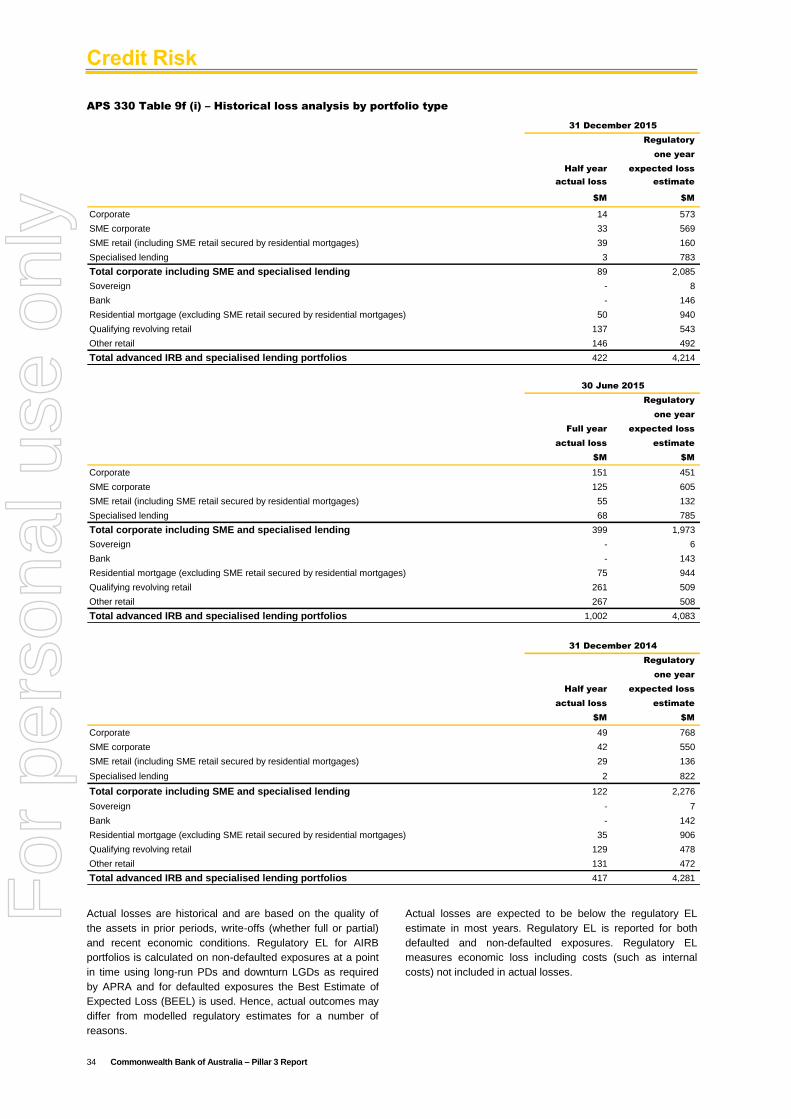
Credit Risk
34 Commonwealth Bank of Australia – Pillar 3 Report
APS 330 Table 9f (i) – Historical loss analysis by portfolio type
Regulatory
one year
Half year expected loss
actual loss estimate
$M $M
Corporate 14 573
SME corporate 33 569
SME retail (including SME retail secured by residential mortgages) 39 160
Specialised lending 3 783
Total corporate including SME and specialised lending 89 2,085
Sovereign - 8
Bank - 146
Residential mortgage (excluding SME retail secured by residential mortgages) 50 940
Qualifying revolving retail 137 543
Other retail 146 492
Total advanced IRB and specialised lending portfolios 422 4,214
31 December 2015
Regulatory
one year
Full year expected loss
actual loss estimate
$M $M
Corporate 151 451
SME corporate 125 605
SME retail (including SME retail secured by residential mortgages) 55 132
Specialised lending 68 785
Total corporate including SME and specialised lending 399 1,973
Sovereign - 6
Bank - 143
Residential mortgage (excluding SME retail secured by residential mortgages) 75 944
Qualifying revolving retail 261 509
Other retail 267 508
Total advanced IRB and specialised lending portfolios 1,002 4,083
30 June 2015
Regulatory
one year
Half year expected loss
actual loss estimate
$M $M
Corporate 49 768
SME corporate 42 550
SME retail (including SME retail secured by residential mortgages) 29 136
Specialised lending 2 822
Total corporate including SME and specialised lending 122 2,276
Sovereign - 7
Bank - 142
Residential mortgage (excluding SME retail secured by residential mortgages) 35 906
Qualifying revolving retail 129 478
Other retail 131 472
Total advanced IRB and specialised lending portfolios 417 4,281
31 December 2014
Actual losses are historical and are based on the quality of
the assets in prior periods, write-offs (whether full or partial)
and recent economic conditions. Regulatory EL for AIRB
portfolios is calculated on non-defaulted exposures at a point
in time using long-run PDs and downturn LGDs as required
by APRA and for defaulted exposures the Best Estimate of
Expected Loss (BEEL) is used. Hence, actual outcomes may
differ from modelled regulatory estimates for a number of
reasons.
Actual losses are expected to be below the regulatory EL
estimate in most years. Regulatory EL is reported for both
defaulted and non-defaulted exposures. Regulatory EL
measures economic loss including costs (such as internal
costs) not included in actual losses.
For
per
sona
l use
onl
y
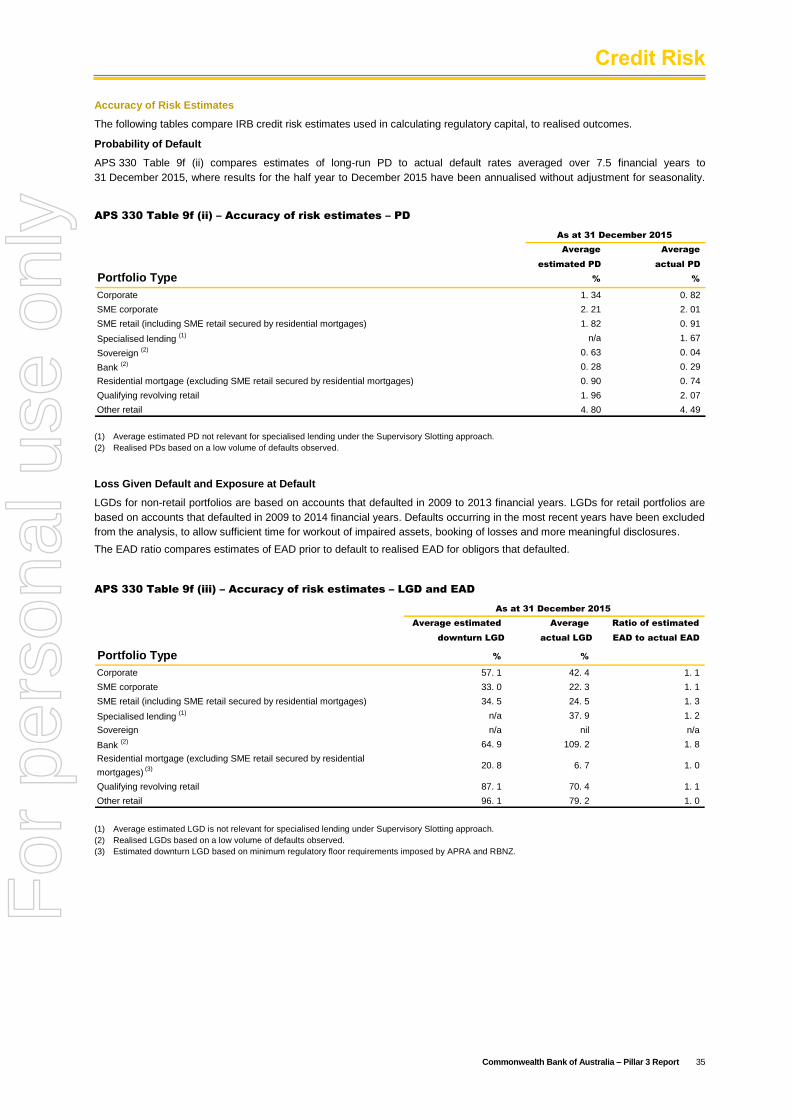
Credit Risk
Commonwealth Bank of Australia – Pillar 3 Report 35
Accuracy of Risk Estimates
The following tables compare IRB credit risk estimates used in calculating regulatory capital, to realised outcomes.
Probability of Default
APS 330 Table 9f (ii) compares estimates of long-run PD to actual default rates averaged over 7.5 financial years to
31 December 2015, where results for the half year to December 2015 have been annualised without adjustment for seasonality.
APS 330 Table 9f (ii) – Accuracy of risk estimates – PD
Average Average
estimated PD actual PD
Portfolio Type % %
Corporate 1. 34 0. 82
SME corporate 2. 21 2. 01
SME retail (including SME retail secured by residential mortgages) 1. 82 0. 91
Specialised lending (1) n/a 1. 67
Sovereign (2) 0. 63 0. 04
Bank (2) 0. 28 0. 29
Residential mortgage (excluding SME retail secured by residential mortgages) 0. 90 0. 74
Qualifying revolving retail 1. 96 2. 07
Other retail 4. 80 4. 49
As at 31 December 2015
(1) Average estimated PD not relevant for specialised lending under the Supervisory Slotting approach.
(2) Realised PDs based on a low volume of defaults observed.
Loss Given Default and Exposure at Default
LGDs for non-retail portfolios are based on accounts that defaulted in 2009 to 2013 financial years. LGDs for retail portfolios are
based on accounts that defaulted in 2009 to 2014 financial years. Defaults occurring in the most recent years have been excluded
from the analysis, to allow sufficient time for workout of impaired assets, booking of losses and more meaningful disclosures.
The EAD ratio compares estimates of EAD prior to default to realised EAD for obligors that defaulted.
APS 330 Table 9f (iii) – Accuracy of risk estimates – LGD and EAD
Average estimated Average Ratio of estimated
downturn LGD actual LGD EAD to actual EAD
Portfolio Type % %
Corporate 57. 1 42. 4 1. 1
SME corporate 33. 0 22. 3 1. 1
SME retail (including SME retail secured by residential mortgages) 34. 5 24. 5 1. 3
Specialised lending (1) n/a 37. 9 1. 2
Sovereign n/a nil n/a
Bank (2) 64. 9 109. 2 1. 8
Residential mortgage (excluding SME retail secured by residential
mortgages) (3) 20. 8 6. 7 1. 0
Qualifying revolving retail 87. 1 70. 4 1. 1
Other retail 96. 1 79. 2 1. 0
As at 31 December 2015
(1) Average estimated LGD is not relevant for specialised lending under Supervisory Slotting approach.
(2) Realised LGDs based on a low volume of defaults observed.
(3) Estimated downturn LGD based on minimum regulatory floor requirements imposed by APRA and RBNZ.
For
per
sona
l use
onl
y
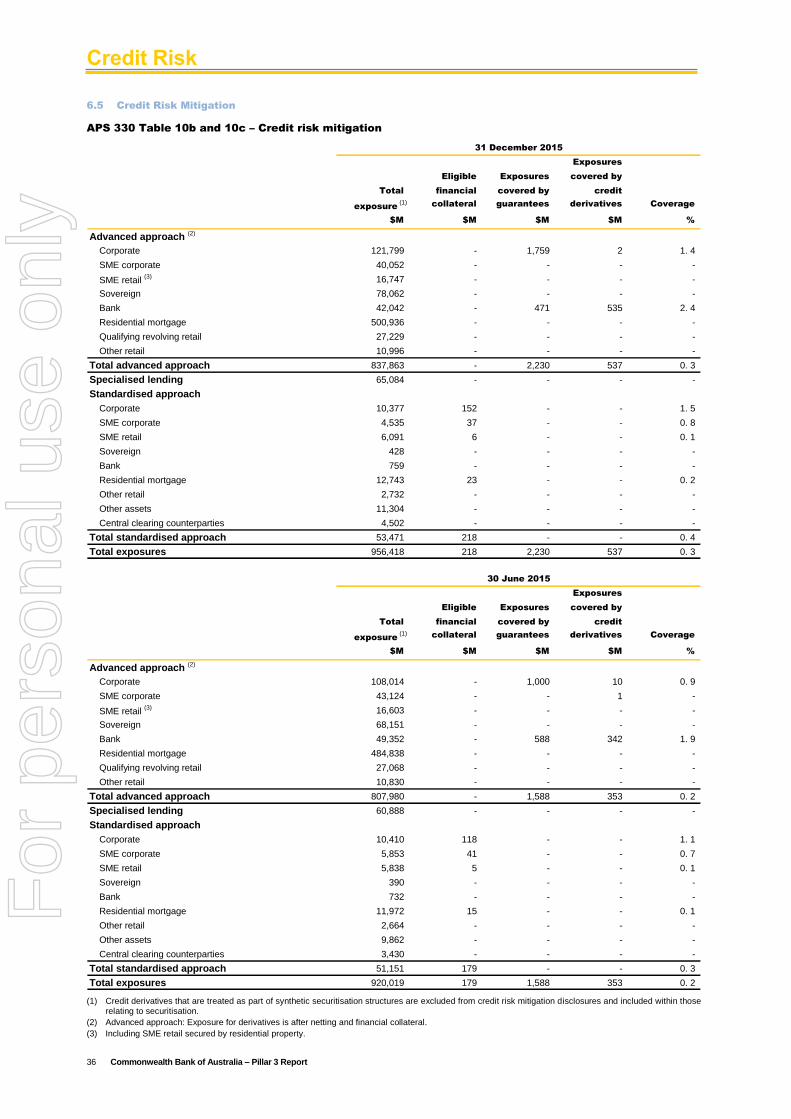
Credit Risk
36 Commonwealth Bank of Australia – Pillar 3 Report
6.5 Credit Risk Mitigation
APS 330 Table 10b and 10c – Credit risk mitigation
Exposures
Eligible Exposures covered by
Total financial covered by credit
exposure (1) collateral guarantees derivatives Coverage
$M $M $M $M %
Advanced approach (2)
Corporate 121,799 - 1,759 2 1. 4
SME corporate 40,052 - - - -
SME retail (3) 16,747 - - - -
Sovereign 78,062 - - - -
Bank 42,042 - 471 535 2. 4
Residential mortgage 500,936 - - - -
Qualifying revolving retail 27,229 - - - -
Other retail 10,996 - - - -
Total advanced approach 837,863 - 2,230 537 0. 3
Specialised lending 65,084 - - - -
Standardised approach
Corporate 10,377 152 - - 1. 5
SME corporate 4,535 37 - - 0. 8
SME retail 6,091 6 - - 0. 1
Sovereign 428 - - - -
Bank 759 - - - -
Residential mortgage 12,743 23 - - 0. 2
Other retail 2,732 - - - -
Other assets 11,304 - - - -
Central clearing counterparties 4,502 - - - -
Total standardised approach 53,471 218 - - 0. 4
Total exposures 956,418 218 2,230 537 0. 3
31 December 2015
Exposures
Eligible Exposures covered by
Total financial covered by credit
exposure (1) collateral guarantees derivatives Coverage
$M $M $M $M %
Advanced approach (2)
Corporate 108,014 - 1,000 10 0. 9
SME corporate 43,124 - - 1 -
SME retail (3) 16,603 - - - -
Sovereign 68,151 - - - -
Bank 49,352 - 588 342 1. 9
Residential mortgage 484,838 - - - -
Qualifying revolving retail 27,068 - - - -
Other retail 10,830 - - - -
Total advanced approach 807,980 - 1,588 353 0. 2
Specialised lending 60,888 - - - -
Standardised approach
Corporate 10,410 118 - - 1. 1
SME corporate 5,853 41 - - 0. 7
SME retail 5,838 5 - - 0. 1
Sovereign 390 - - - -
Bank 732 - - - -
Residential mortgage 11,972 15 - - 0. 1
Other retail 2,664 - - - -
Other assets 9,862 - - - -
Central clearing counterparties 3,430 - - - -
Total standardised approach 51,151 179 - - 0. 3
Total exposures 920,019 179 1,588 353 0. 2
30 June 2015
(1) Credit derivatives that are treated as part of synthetic securitisation structures are excluded from credit risk mitigation disclosures and included within those relating to securitisation.
(2) Advanced approach: Exposure for derivatives is after netting and financial collateral.
(3) Including SME retail secured by residential property.
For
per
sona
l use
onl
y
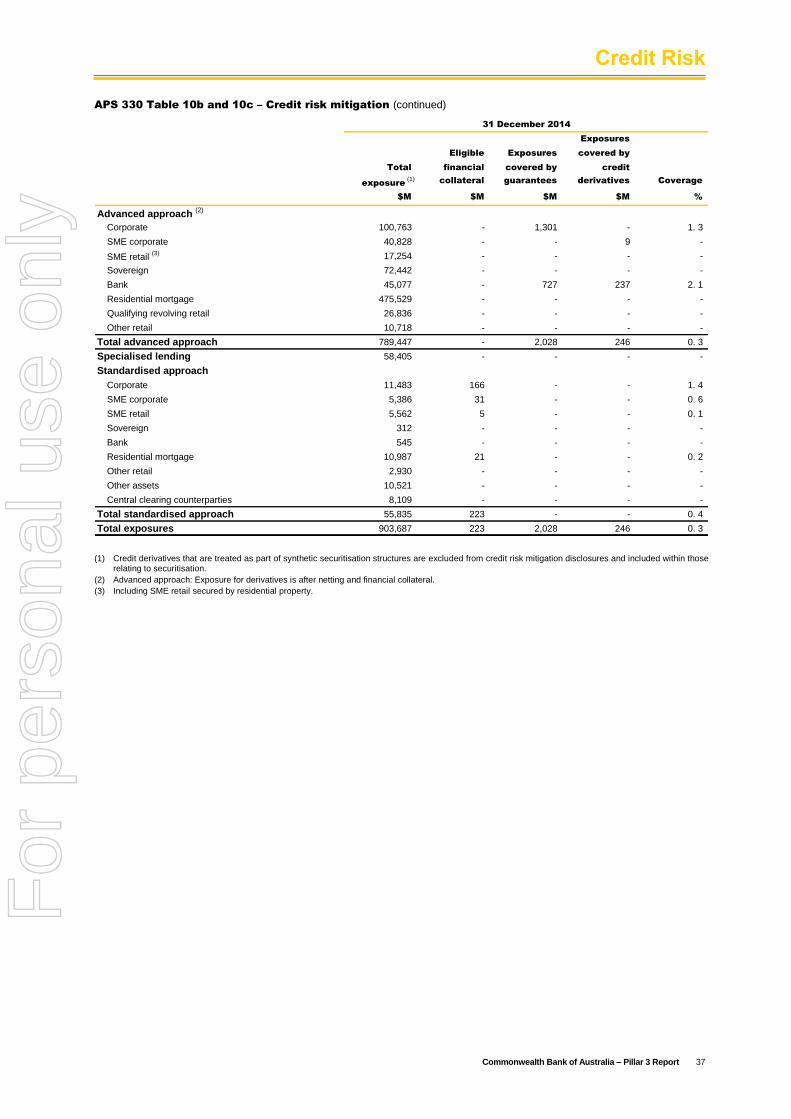
Credit Risk
Commonwealth Bank of Australia – Pillar 3 Report 37
APS 330 Table 10b and 10c – Credit risk mitigation (continued)
Exposures
Eligible Exposures covered by
Total financial covered by credit
exposure (1) collateral guarantees derivatives Coverage
$M $M $M $M %
Advanced approach (2)
Corporate 100,763 - 1,301 - 1. 3
SME corporate 40,828 - - 9 -
SME retail (3) 17,254 - - - -
Sovereign 72,442 - - - -
Bank 45,077 - 727 237 2. 1
Residential mortgage 475,529 - - - -
Qualifying revolving retail 26,836 - - - -
Other retail 10,718 - - - -
Total advanced approach 789,447 - 2,028 246 0. 3
Specialised lending 58,405 - - - -
Standardised approach
Corporate 11,483 166 - - 1. 4
SME corporate 5,386 31 - - 0. 6
SME retail 5,562 5 - - 0. 1
Sovereign 312 - - - -
Bank 545 - - - -
Residential mortgage 10,987 21 - - 0. 2
Other retail 2,930 - - - -
Other assets 10,521 - - - -
Central clearing counterparties 8,109 - - - -
Total standardised approach 55,835 223 - - 0. 4
Total exposures 903,687 223 2,028 246 0. 3
31 December 2014
(1) Credit derivatives that are treated as part of synthetic securitisation structures are excluded from credit risk mitigation disclosures and included within those relating to securitisation.
(2) Advanced approach: Exposure for derivatives is after netting and financial collateral.
(3) Including SME retail secured by residential property.
For
per
sona
l use
onl
y
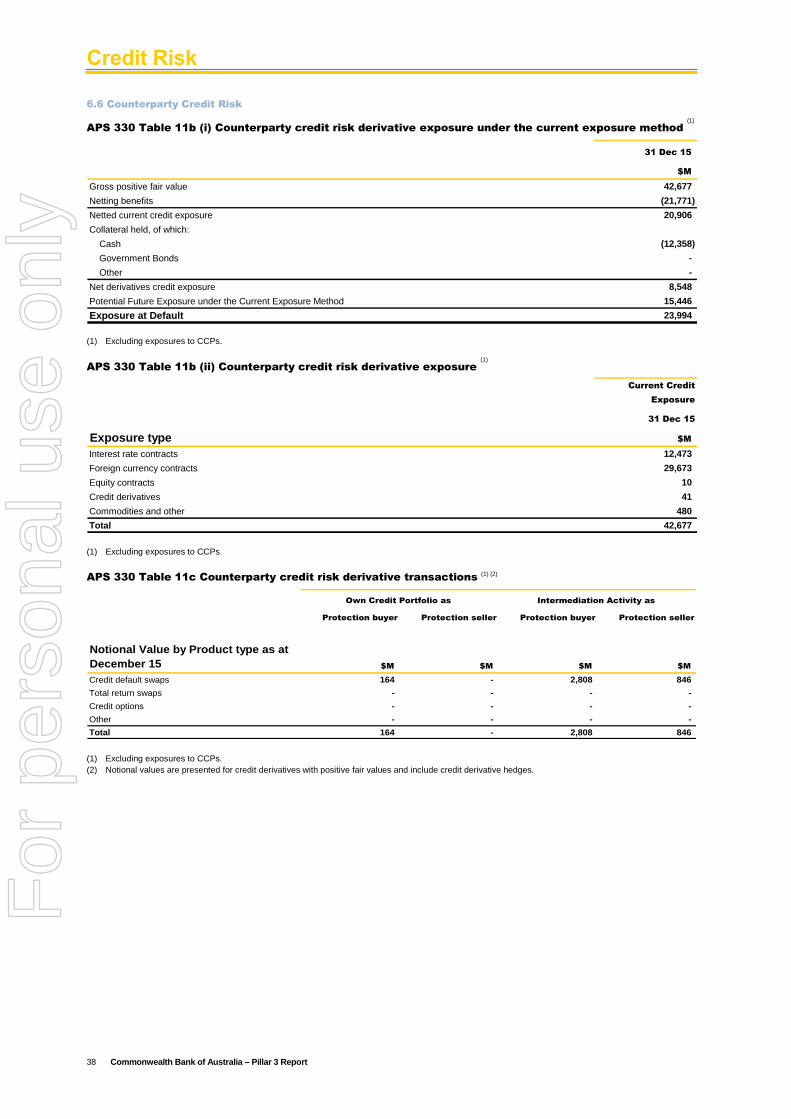
Credit Risk
38 Commonwealth Bank of Australia – Pillar 3 Report
6.6 Counterparty Credit Risk
APS 330 Table 11b (i) Counterparty credit risk derivative exposure under the current exposure method
(1)
31 Dec 15
$M
Gross positive fair value 42,677
Netting benefits (21,771)
Netted current credit exposure 20,906
Collateral held, of which:
Cash (12,358)
Government Bonds -
Other -
Net derivatives credit exposure 8,548
Potential Future Exposure under the Current Exposure Method 15,446
Exposure at Default 23,994
(1) Excluding exposures to CCPs.
APS 330 Table 11b (ii) Counterparty credit risk derivative exposure
(1)
Current Credit
Exposure
31 Dec 15
Exposure type $M
Interest rate contracts 12,473
Foreign currency contracts 29,673
Equity contracts 10
Credit derivatives 41
Commodities and other 480
Total 42,677
(1) Excluding exposures to CCPs.
APS 330 Table 11c Counterparty credit risk derivative transactions (1) (2)
Protection buyer Protection seller Protection buyer Protection seller
Notional Value by Product type as at
December 15 $M $M $M $M
Credit default swaps 164 - 2,808 846
Total return swaps - - - -
Credit options - - - -
Other - - - -
Total 164 - 2,808 846
Own Credit Portfolio as Intermediation Activity as
(1) Excluding exposures to CCPs.
(2) Notional values are presented for credit derivatives with positive fair values and include credit derivative hedges.
For
per
sona
l use
onl
y
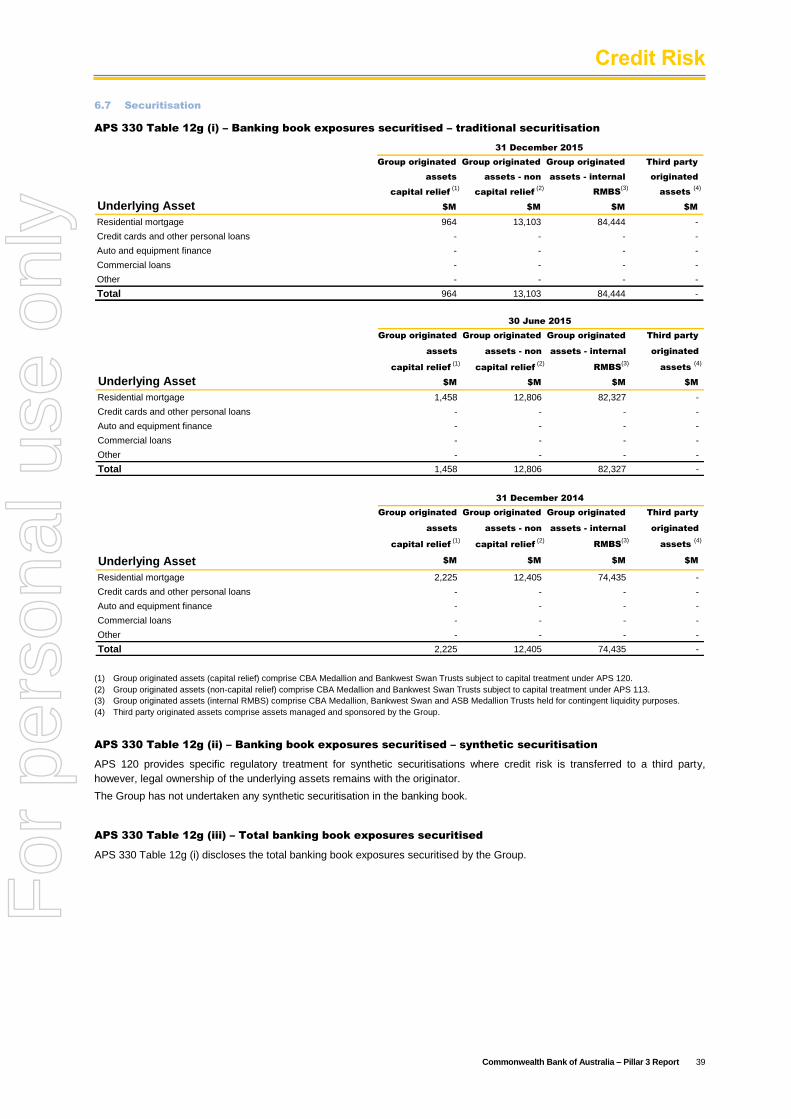
Credit Risk
Commonwealth Bank of Australia – Pillar 3 Report 39
6.7 Securitisation
APS 330 Table 12g (i) – Banking book exposures securitised – traditional securitisation
Group originated Group originated Group originated Third party
assets assets - non assets - internal originated
capital relief (1)
capital relief (2)
RMBS(3)
assets (4)
Underlying Asset $M $M $M $M
Residential mortgage 964 13,103 84,444 -
Credit cards and other personal loans - - - -
Auto and equipment finance - - - -
Commercial loans - - - -
Other - - - -
Total 964 13,103 84,444 -
31 December 2015
Group originated Group originated Group originated Third party
assets assets - non assets - internal originated
capital relief (1)
capital relief (2)
RMBS(3)
assets (4)
Underlying Asset $M $M $M $M
Residential mortgage 1,458 12,806 82,327 -
Credit cards and other personal loans - - - -
Auto and equipment finance - - - -
Commercial loans - - - -
Other - - - -
Total 1,458 12,806 82,327 -
30 June 2015
Group originated Group originated Group originated Third party
assets assets - non assets - internal originated
capital relief (1)
capital relief (2)
RMBS(3)
assets (4)
Underlying Asset $M $M $M $M
Residential mortgage 2,225 12,405 74,435 -
Credit cards and other personal loans - - - -
Auto and equipment finance - - - -
Commercial loans - - - -
Other - - - -
Total 2,225 12,405 74,435 -
31 December 2014
(1) Group originated assets (capital relief) comprise CBA Medallion and Bankwest Swan Trusts subject to capital treatment under APS 120.
(2) Group originated assets (non-capital relief) comprise CBA Medallion and Bankwest Swan Trusts subject to capital treatment under APS 113.
(3) Group originated assets (internal RMBS) comprise CBA Medallion, Bankwest Swan and ASB Medallion Trusts held for contingent liquidity purposes.
(4) Third party originated assets comprise assets managed and sponsored by the Group.
APS 330 Table 12g (ii) – Banking book exposures securitised – synthetic securitisation
APS 120 provides specific regulatory treatment for synthetic securitisations where credit risk is transferred to a third party,
however, legal ownership of the underlying assets remains with the originator.
The Group has not undertaken any synthetic securitisation in the banking book.
APS 330 Table 12g (iii) – Total banking book exposures securitised
APS 330 Table 12g (i) discloses the total banking book exposures securitised by the Group.
For
per
sona
l use
onl
y
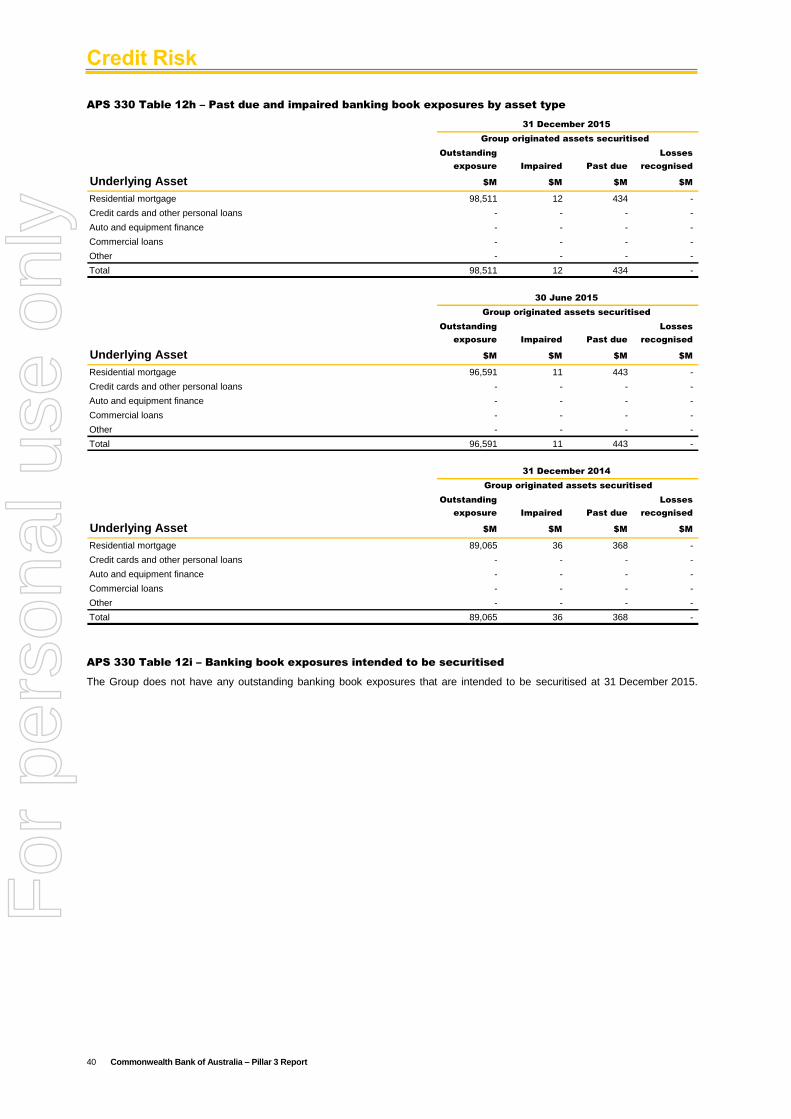
Credit Risk
40 Commonwealth Bank of Australia – Pillar 3 Report
APS 330 Table 12h – Past due and impaired banking book exposures by asset type
Outstanding Losses
exposure Impaired Past due recognised
Underlying Asset $M $M $M $M
Residential mortgage 98,511 12 434 -
Credit cards and other personal loans - - - -
Auto and equipment finance - - - -
Commercial loans - - - -
Other - - - -
Total 98,511 12 434 -
31 December 2015
Group originated assets securitised
Outstanding Losses
exposure Impaired Past due recognised
Underlying Asset $M $M $M $M
Residential mortgage 96,591 11 443 -
Credit cards and other personal loans - - - -
Auto and equipment finance - - - -
Commercial loans - - - -
Other - - - -
Total 96,591 11 443 -
30 June 2015
Group originated assets securitised
Outstanding Losses
exposure Impaired Past due recognised
Underlying Asset $M $M $M $M
Residential mortgage 89,065 36 368 -
Credit cards and other personal loans - - - -
Auto and equipment finance - - - -
Commercial loans - - - -
Other - - - -
Total 89,065 36 368 -
31 December 2014
Group originated assets securitised
APS 330 Table 12i – Banking book exposures intended to be securitised
The Group does not have any outstanding banking book exposures that are intended to be securitised at 31 December 2015.
For
per
sona
l use
onl
y
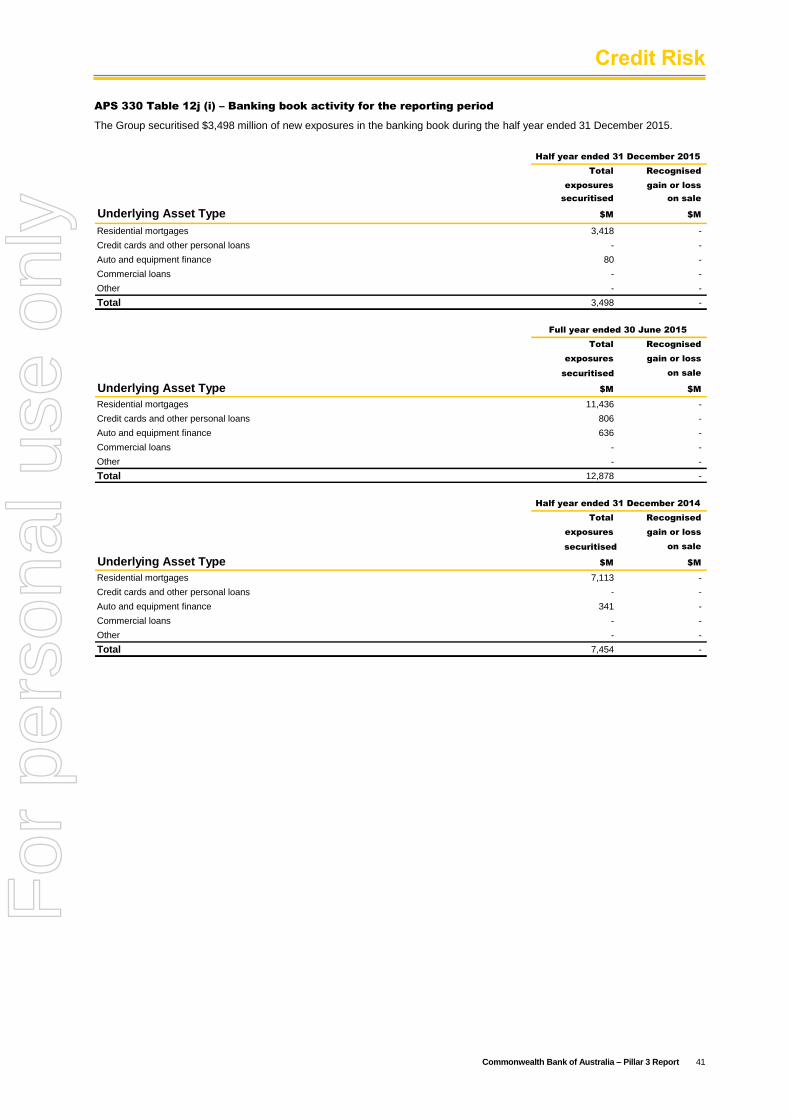
Credit Risk
Commonwealth Bank of Australia – Pillar 3 Report 41
APS 330 Table 12j (i) – Banking book activity for the reporting period
The Group securitised $3,498 million of new exposures in the banking book during the half year ended 31 December 2015.
Total Recognised
exposures gain or loss
securitised on sale
Underlying Asset Type $M $M
Residential mortgages 3,418 -
Credit cards and other personal loans - -
Auto and equipment finance 80 -
Commercial loans - -
Other - -
Total 3,498 -
Half year ended 31 December 2015
Total Recognised
exposures gain or loss
securitised on sale
Underlying Asset Type $M $M
Residential mortgages 11,436 -
Credit cards and other personal loans 806 -
Auto and equipment finance 636 -
Commercial loans - -
Other - -
Total 12,878 -
Full year ended 30 June 2015
Total Recognised
exposures gain or loss
securitised on sale
Underlying Asset Type $M $M
Residential mortgages 7,113 -
Credit cards and other personal loans - -
Auto and equipment finance 341 -
Commercial loans - -
Other - -
Total 7,454 -
Half year ended 31 December 2014
For
per
sona
l use
onl
y
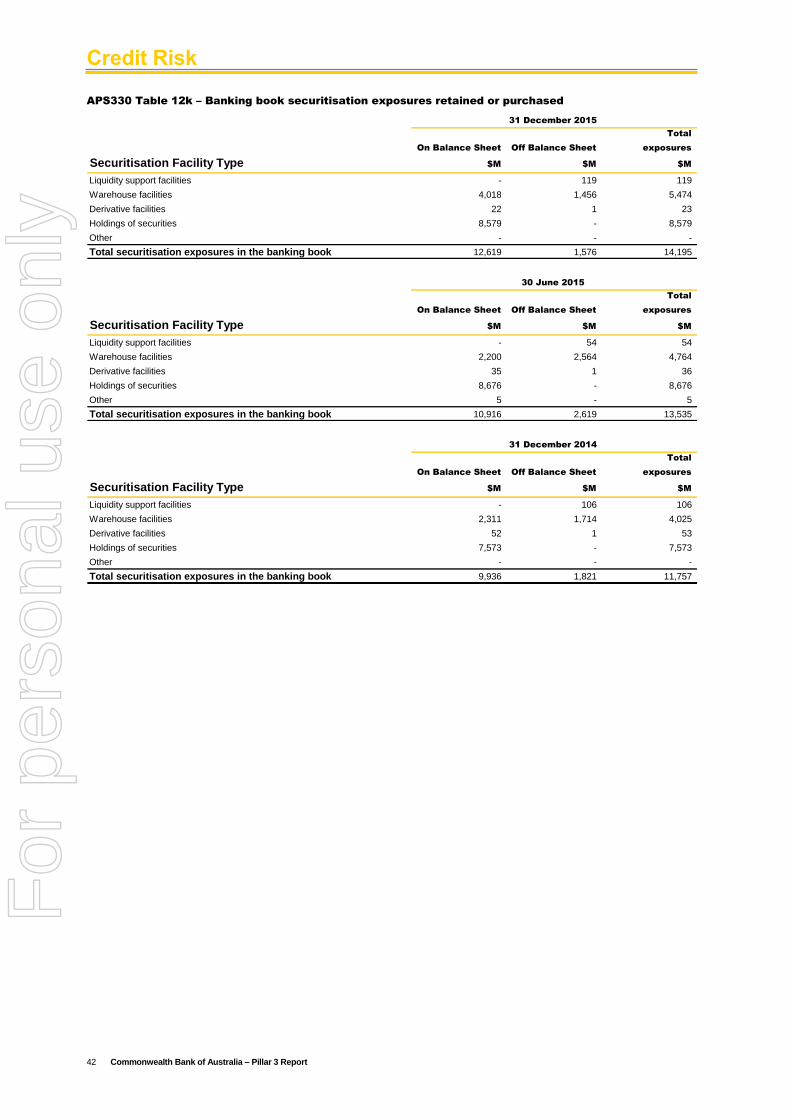
Credit Risk
42 Commonwealth Bank of Australia – Pillar 3 Report
APS330 Table 12k – Banking book securitisation exposures retained or purchased
Total
On Balance Sheet Off Balance Sheet exposures
Securitisation Facility Type $M $M $M
Liquidity support facilities - 119 119
Warehouse facilities 4,018 1,456 5,474
Derivative facilities 22 1 23
Holdings of securities 8,579 - 8,579
Other - - -
Total securitisation exposures in the banking book 12,619 1,576 14,195
31 December 2015
Total
On Balance Sheet Off Balance Sheet exposures
Securitisation Facility Type $M $M $M
Liquidity support facilities - 54 54
Warehouse facilities 2,200 2,564 4,764
Derivative facilities 35 1 36
Holdings of securities 8,676 - 8,676
Other 5 - 5
Total securitisation exposures in the banking book 10,916 2,619 13,535
30 June 2015
Total
On Balance Sheet Off Balance Sheet exposures
Securitisation Facility Type $M $M $M
Liquidity support facilities - 106 106
Warehouse facilities 2,311 1,714 4,025
Derivative facilities 52 1 53
Holdings of securities 7,573 - 7,573
Other - - -
Total securitisation exposures in the banking book 9,936 1,821 11,757
31 December 2014
For
per
sona
l use
onl
y
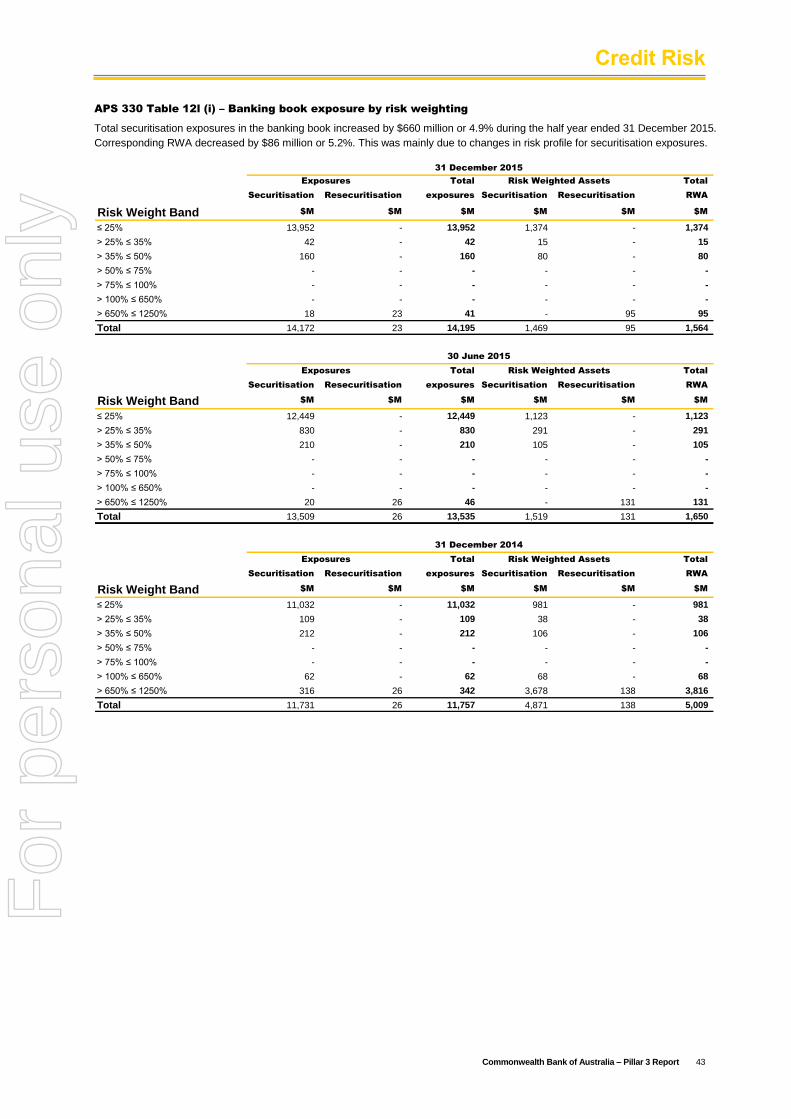
Credit Risk
Commonwealth Bank of Australia – Pillar 3 Report 43
APS 330 Table 12l (i) – Banking book exposure by risk weighting
Total securitisation exposures in the banking book increased by $660 million or 4.9% during the half year ended 31 December 2015.
Corresponding RWA decreased by $86 million or 5.2%. This was mainly due to changes in risk profile for securitisation exposures.
Total Total
Securitisation Resecuritisation exposures Securitisation Resecuritisation RWA
Risk Weight Band $M $M $M $M $M $M
≤ 25% 13,952 - 13,952 1,374 - 1,374
> 25% ≤ 35% 42 - 42 15 - 15
> 35% ≤ 50% 160 - 160 80 - 80
> 50% ≤ 75% - - - - - -
> 75% ≤ 100% - - - - - -
> 100% ≤ 650% - - - - - -
> 650% ≤ 1250% 18 23 41 - 95 95
Total 14,172 23 14,195 1,469 95 1,564
Risk Weighted Assets
31 December 2015
Exposures
Total Total
Securitisation Resecuritisation exposures Securitisation Resecuritisation RWA
Risk Weight Band $M $M $M $M $M $M
≤ 25% 12,449 - 12,449 1,123 - 1,123
> 25% ≤ 35% 830 - 830 291 - 291
> 35% ≤ 50% 210 - 210 105 - 105
> 50% ≤ 75% - - - - - -
> 75% ≤ 100% - - - - - -
> 100% ≤ 650% - - - - - -
> 650% ≤ 1250% 20 26 46 - 131 131
Total 13,509 26 13,535 1,519 131 1,650
Exposures Risk Weighted Assets
30 June 2015
Total Total
Securitisation Resecuritisation exposures Securitisation Resecuritisation RWA
Risk Weight Band $M $M $M $M $M $M
≤ 25% 11,032 - 11,032 981 - 981
> 25% ≤ 35% 109 - 109 38 - 38
> 35% ≤ 50% 212 - 212 106 - 106
> 50% ≤ 75% - - - - - -
> 75% ≤ 100% - - - - - -
> 100% ≤ 650% 62 - 62 68 - 68
> 650% ≤ 1250% 316 26 342 3,678 138 3,816
Total 11,731 26 11,757 4,871 138 5,009
Risk Weighted Assets
31 December 2014
Exposures
For
per
sona
l use
onl
y
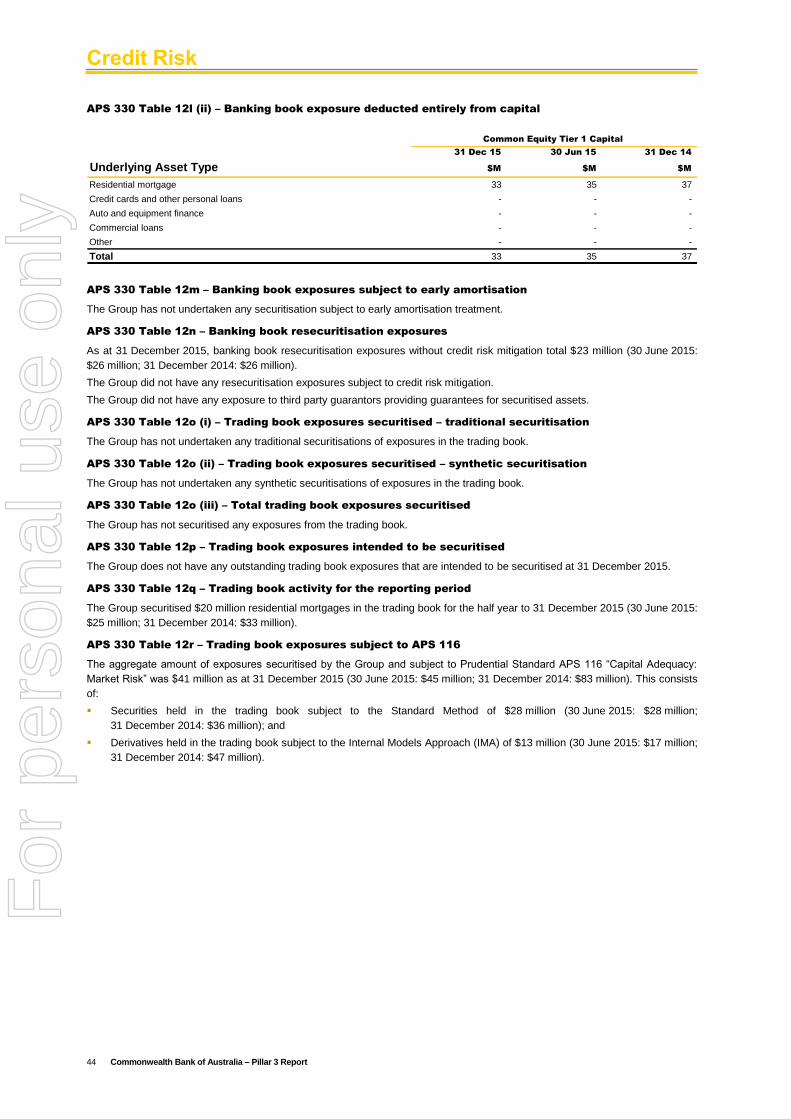
Credit Risk
44 Commonwealth Bank of Australia – Pillar 3 Report
APS 330 Table 12l (ii) – Banking book exposure deducted entirely from capital
31 Dec 15 30 Jun 15 31 Dec 14
Underlying Asset Type $M $M $M
Residential mortgage 33 35 37
Credit cards and other personal loans - - -
Auto and equipment finance - - -
Commercial loans - - -
Other - - -
Total 33 35 37
Common Equity Tier 1 Capital
APS 330 Table 12m – Banking book exposures subject to early amortisation
The Group has not undertaken any securitisation subject to early amortisation treatment.
APS 330 Table 12n – Banking book resecuritisation exposures
As at 31 December 2015, banking book resecuritisation exposures without credit risk mitigation total $23 million (30 June 2015:
$26 million; 31 December 2014: $26 million).
The Group did not have any resecuritisation exposures subject to credit risk mitigation.
The Group did not have any exposure to third party guarantors providing guarantees for securitised assets.
APS 330 Table 12o (i) – Trading book exposures securitised – traditional securitisation
The Group has not undertaken any traditional securitisations of exposures in the trading book.
APS 330 Table 12o (ii) – Trading book exposures securitised – synthetic securitisation
The Group has not undertaken any synthetic securitisations of exposures in the trading book.
APS 330 Table 12o (iii) – Total trading book exposures securitised
The Group has not securitised any exposures from the trading book.
APS 330 Table 12p – Trading book exposures intended to be securitised
The Group does not have any outstanding trading book exposures that are intended to be securitised at 31 December 2015.
APS 330 Table 12q – Trading book activity for the reporting period
The Group securitised $20 million residential mortgages in the trading book for the half year to 31 December 2015 (30 June 2015:
$25 million; 31 December 2014: $33 million).
APS 330 Table 12r – Trading book exposures subject to APS 116
The aggregate amount of exposures securitised by the Group and subject to Prudential Standard APS 116 “Capital Adequacy:
Market Risk” was $41 million as at 31 December 2015 (30 June 2015: $45 million; 31 December 2014: $83 million). This consists
of:
Securities held in the trading book subject to the Standard Method of $28 million (30 June 2015: $28 million;
31 December 2014: $36 million); and
Derivatives held in the trading book subject to the Internal Models Approach (IMA) of $13 million (30 June 2015: $17 million;
31 December 2014: $47 million).
For
per
sona
l use
onl
y
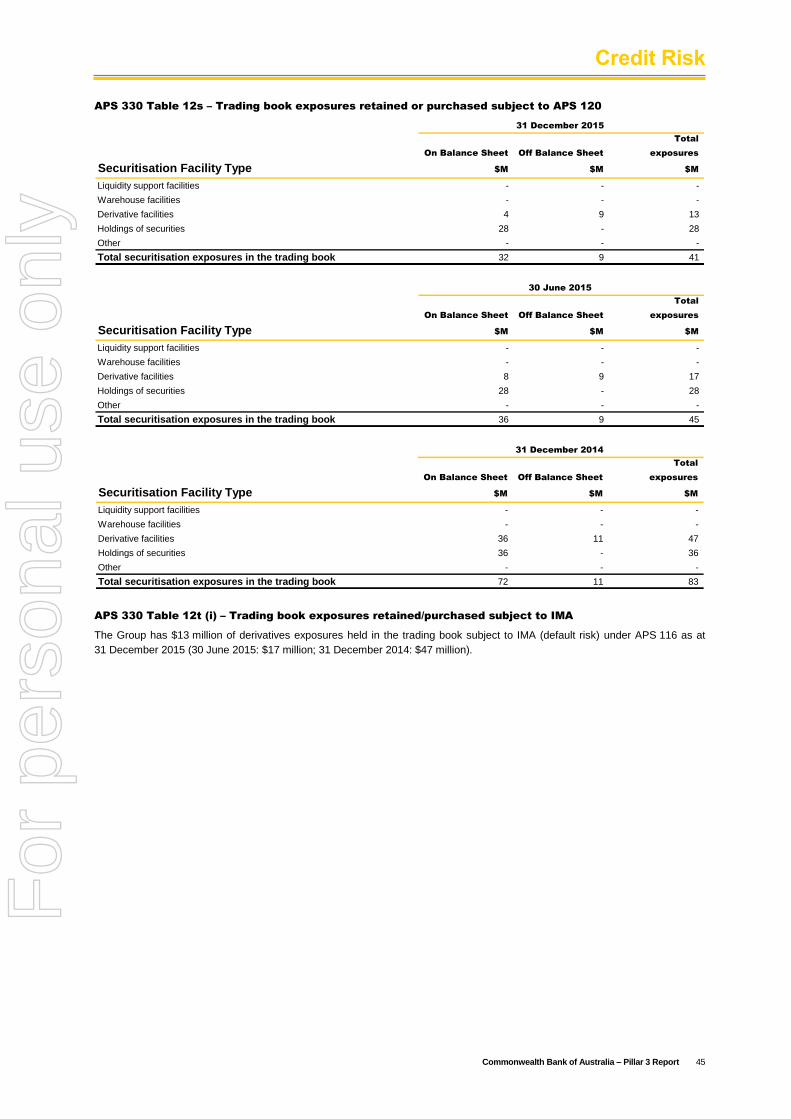
Credit Risk
Commonwealth Bank of Australia – Pillar 3 Report 45
APS 330 Table 12s – Trading book exposures retained or purchased subject to APS 120
Total
On Balance Sheet Off Balance Sheet exposures
Securitisation Facility Type $M $M $M
Liquidity support facilities - - -
Warehouse facilities - - -
Derivative facilities 4 9 13
Holdings of securities 28 - 28
Other - - -
Total securitisation exposures in the trading book 32 9 41
31 December 2015
Total
On Balance Sheet Off Balance Sheet exposures
Securitisation Facility Type $M $M $M
Liquidity support facilities - - -
Warehouse facilities - - -
Derivative facilities 8 9 17
Holdings of securities 28 - 28
Other - - -
Total securitisation exposures in the trading book 36 9 45
30 June 2015
Total
On Balance Sheet Off Balance Sheet exposures
Securitisation Facility Type $M $M $M
Liquidity support facilities - - -
Warehouse facilities - - -
Derivative facilities 36 11 47
Holdings of securities 36 - 36
Other - - -
Total securitisation exposures in the trading book 72 11 83
31 December 2014
APS 330 Table 12t (i) – Trading book exposures retained/purchased subject to IMA
The Group has $13 million of derivatives exposures held in the trading book subject to IMA (default risk) under APS 116 as at
31 December 2015 (30 June 2015: $17 million; 31 December 2014: $47 million).
For
per
sona
l use
onl
y
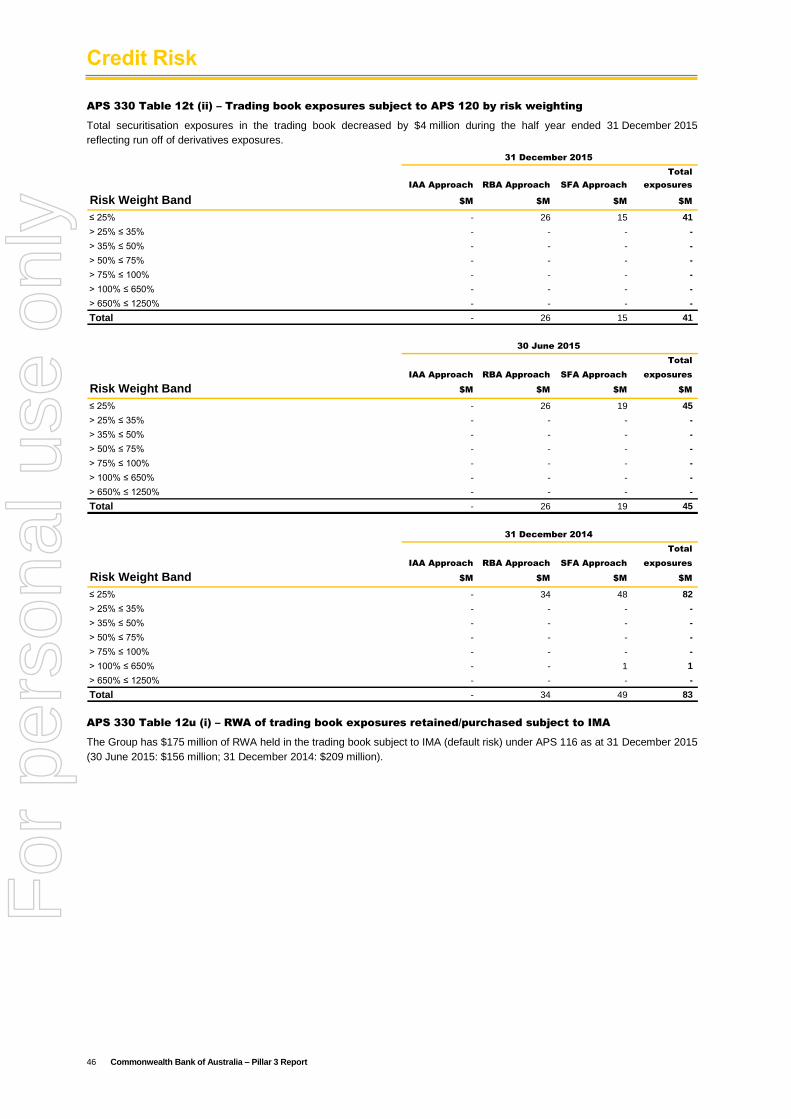
Credit Risk
46 Commonwealth Bank of Australia – Pillar 3 Report
APS 330 Table 12t (ii) – Trading book exposures subject to APS 120 by risk weighting
Total securitisation exposures in the trading book decreased by $4 million during the half year ended 31 December 2015
reflecting run off of derivatives exposures.
Total
IAA Approach RBA Approach SFA Approach exposures
Risk Weight Band $M $M $M $M
≤ 25% - 26 15 41
> 25% ≤ 35% - - - -
> 35% ≤ 50% - - - -
> 50% ≤ 75% - - - -
> 75% ≤ 100% - - - -
> 100% ≤ 650% - - - -
> 650% ≤ 1250% - - - -
Total - 26 15 41
31 December 2015
Total
IAA Approach RBA Approach SFA Approach exposures
Risk Weight Band $M $M $M $M
≤ 25% - 26 19 45
> 25% ≤ 35% - - - -
> 35% ≤ 50% - - - -
> 50% ≤ 75% - - - -
> 75% ≤ 100% - - - -
> 100% ≤ 650% - - - -
> 650% ≤ 1250% - - - -
Total - 26 19 45
30 June 2015
Total
IAA Approach RBA Approach SFA Approach exposures
Risk Weight Band $M $M $M $M
≤ 25% - 34 48 82
> 25% ≤ 35% - - - -
> 35% ≤ 50% - - - -
> 50% ≤ 75% - - - -
> 75% ≤ 100% - - - -
> 100% ≤ 650% - - 1 1
> 650% ≤ 1250% - - - -
Total - 34 49 83
31 December 2014
APS 330 Table 12u (i) – RWA of trading book exposures retained/purchased subject to IMA
The Group has $175 million of RWA held in the trading book subject to IMA (default risk) under APS 116 as at 31 December 2015
(30 June 2015: $156 million; 31 December 2014: $209 million).
For
per
sona
l use
onl
y
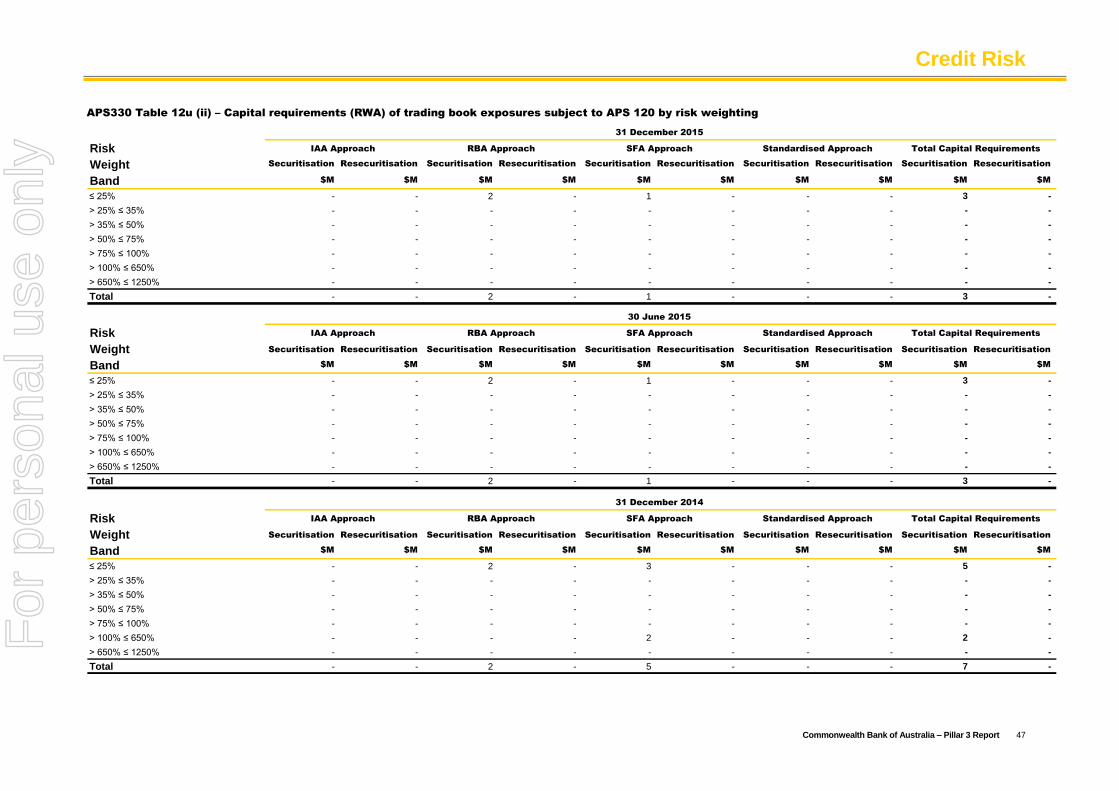
Credit Risk
Commonwealth Bank of Australia – Pillar 3 Report 47
APS330 Table 12u (ii) – Capital requirements (RWA) of trading book exposures subject to APS 120 by risk weighting
Risk
Weight Securitisation Resecuritisation Securitisation Resecuritisation Securitisation Resecuritisation Securitisation Resecuritisation Securitisation Resecuritisation
Band $M $M $M $M $M $M $M $M $M $M
≤ 25% - - 2 - 1 - - - 3 -
> 25% ≤ 35% - - - - - - - - - -
> 35% ≤ 50% - - - - - - - - - -
> 50% ≤ 75% - - - - - - - - - -
> 75% ≤ 100% - - - - - - - - - -
> 100% ≤ 650% - - - - - - - - - -
> 650% ≤ 1250% - - - - - - - - - -
Total - - 2 - 1 - - - 3 -
Risk
Weight Securitisation Resecuritisation Securitisation Resecuritisation Securitisation Resecuritisation Securitisation Resecuritisation Securitisation Resecuritisation
Band $M $M $M $M $M $M $M $M $M $M
≤ 25% - - 2 - 3 - - - 5 -
> 25% ≤ 35% - - - - - - - - - -
> 35% ≤ 50% - - - - - - - - - -
> 50% ≤ 75% - - - - - - - - - -
> 75% ≤ 100% - - - - - - - - - -
> 100% ≤ 650% - - - - 2 - - - 2 -
> 650% ≤ 1250% - - - - - - - - - -
Total - - 2 - 5 - - - 7 -
RBA Approach SFA Approach Standardised Approach Total Capital Requirements
31 December 2015
IAA Approach RBA Approach SFA Approach Standardised Approach Total Capital Requirements
31 December 2014
IAA Approach RBA Approach SFA Approach Standardised Approach Total Capital Requirements
30 June 2015
IAA Approach
For
per
sona
l use
onl
y
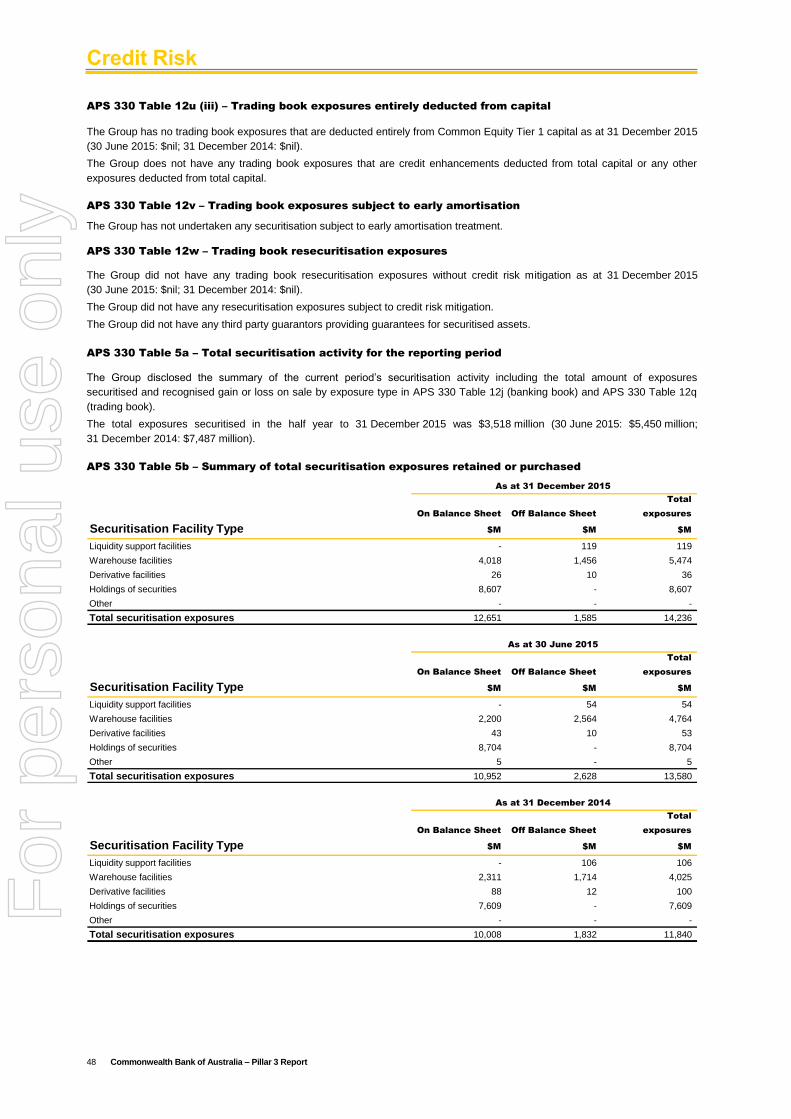
Credit Risk
48 Commonwealth Bank of Australia – Pillar 3 Report
APS 330 Table 12u (iii) – Trading book exposures entirely deducted from capital
The Group has no trading book exposures that are deducted entirely from Common Equity Tier 1 capital as at 31 December 2015
(30 June 2015: $nil; 31 December 2014: $nil).
The Group does not have any trading book exposures that are credit enhancements deducted from total capital or any other
exposures deducted from total capital.
APS 330 Table 12v – Trading book exposures subject to early amortisation
The Group has not undertaken any securitisation subject to early amortisation treatment.
APS 330 Table 12w – Trading book resecuritisation exposures
The Group did not have any trading book resecuritisation exposures without credit risk mitigation as at 31 December 2015
(30 June 2015: $nil; 31 December 2014: $nil).
The Group did not have any resecuritisation exposures subject to credit risk mitigation.
The Group did not have any third party guarantors providing guarantees for securitised assets.
APS 330 Table 5a – Total securitisation activity for the reporting period
The Group disclosed the summary of the current period’s securitisation activity including the total amount of exposures
securitised and recognised gain or loss on sale by exposure type in APS 330 Table 12j (banking book) and APS 330 Table 12q
(trading book).
The total exposures securitised in the half year to 31 December 2015 was $3,518 million (30 June 2015: $5,450 million;
31 December 2014: $7,487 million).
APS 330 Table 5b – Summary of total securitisation exposures retained or purchased
Total
On Balance Sheet Off Balance Sheet exposures
Securitisation Facility Type $M $M $M
Liquidity support facilities - 119 119
Warehouse facilities 4,018 1,456 5,474
Derivative facilities 26 10 36
Holdings of securities 8,607 - 8,607
Other - - -
Total securitisation exposures 12,651 1,585 14,236
As at 31 December 2015
Total
On Balance Sheet Off Balance Sheet exposures
Securitisation Facility Type $M $M $M
Liquidity support facilities - 54 54
Warehouse facilities 2,200 2,564 4,764
Derivative facilities 43 10 53
Holdings of securities 8,704 - 8,704
Other 5 - 5
Total securitisation exposures 10,952 2,628 13,580
As at 30 June 2015
Total
On Balance Sheet Off Balance Sheet exposures
Securitisation Facility Type $M $M $M
Liquidity support facilities - 106 106
Warehouse facilities 2,311 1,714 4,025
Derivative facilities 88 12 100
Holdings of securities 7,609 - 7,609
Other - - -
Total securitisation exposures 10,008 1,832 11,840
As at 31 December 2014
For
per
sona
l use
onl
y
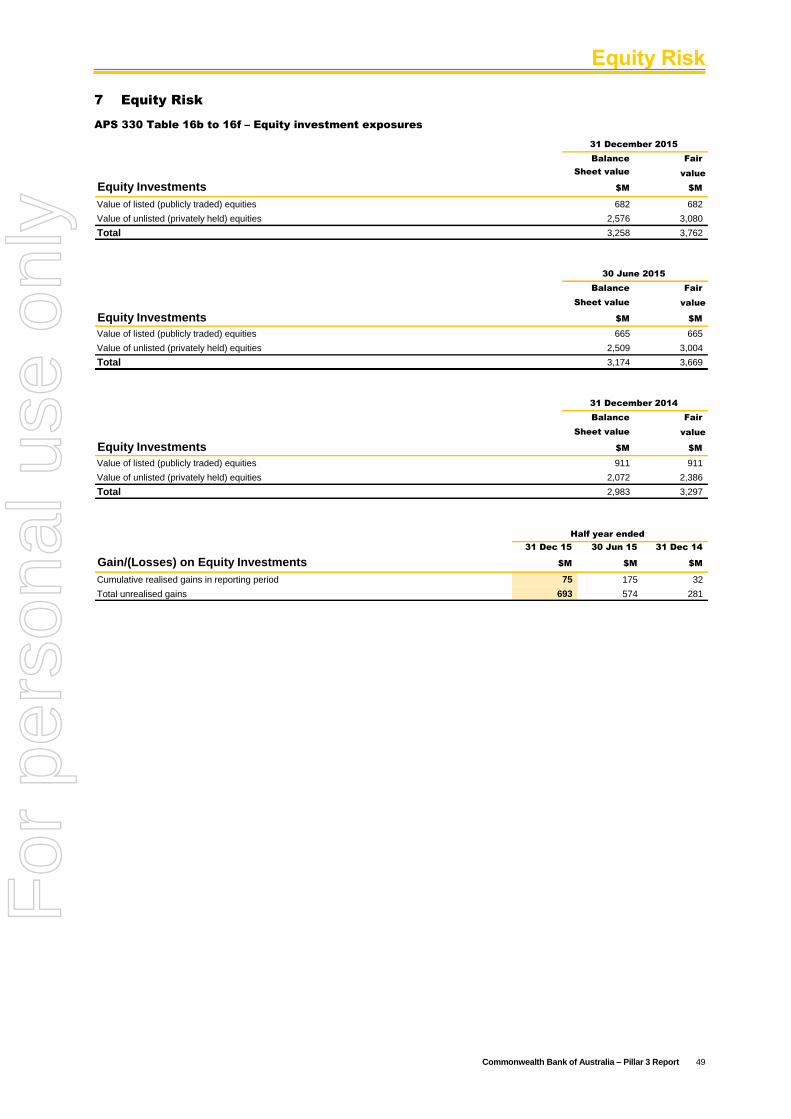
Equity Risk
Commonwealth Bank of Australia – Pillar 3 Report 49
7 Equity Risk
APS 330 Table 16b to 16f – Equity investment exposures
Balance Fair
Sheet value value
Equity Investments $M $M
Value of listed (publicly traded) equities 682 682
Value of unlisted (privately held) equities 2,576 3,080
Total 3,258 3,762
31 December 2015
Balance Fair
Sheet value value
Equity Investments $M $M
Value of listed (publicly traded) equities 665 665
Value of unlisted (privately held) equities 2,509 3,004
Total 3,174 3,669
30 June 2015
Balance Fair
Sheet value value
Equity Investments $M $M
Value of listed (publicly traded) equities 911 911
Value of unlisted (privately held) equities 2,072 2,386
Total 2,983 3,297
31 December 2014
31 Dec 15 30 Jun 15 31 Dec 14
Gain/(Losses) on Equity Investments $M $M $M
Cumulative realised gains in reporting period 75 175 32
Total unrealised gains 693 574 281
Half year ended
For
per
sona
l use
onl
y
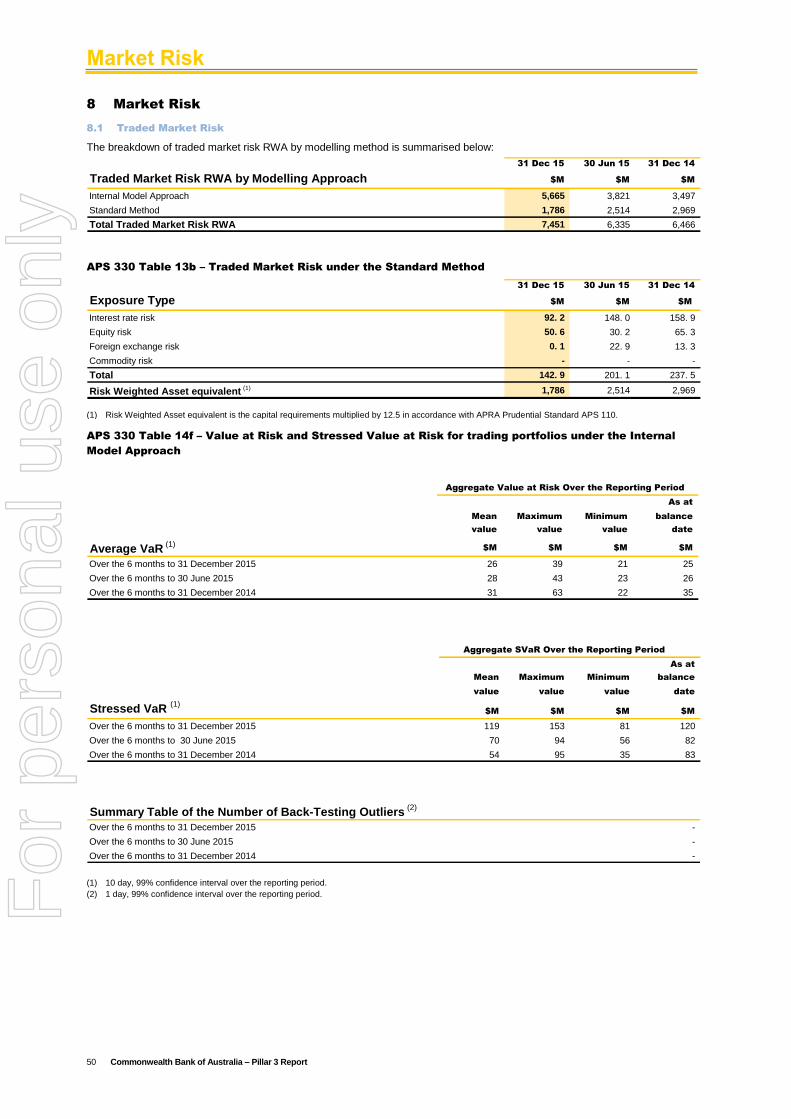
Market Risk
50 Commonwealth Bank of Australia – Pillar 3 Report
8 Market Risk
8.1 Traded Market Risk
The breakdown of traded market risk RWA by modelling method is summarised below:
31 Dec 15 30 Jun 15 31 Dec 14
Traded Market Risk RWA by Modelling Approach $M $M $M
Internal Model Approach 5,665 3,821 3,497
Standard Method 1,786 2,514 2,969
Total Traded Market Risk RWA 7,451 6,335 6,466
APS 330 Table 13b – Traded Market Risk under the Standard Method
31 Dec 15 30 Jun 15 31 Dec 14
Exposure Type $M $M $M
Interest rate risk 92. 2 148. 0 158. 9
Equity risk 50. 6 30. 2 65. 3
Foreign exchange risk 0. 1 22. 9 13. 3
Commodity risk - - -
Total 142. 9 201. 1 237. 5
Risk Weighted Asset equivalent (1) 1,786 2,514 2,969
(1) Risk Weighted Asset equivalent is the capital requirements multiplied by 12.5 in accordance with APRA Prudential Standard APS 110.
APS 330 Table 14f – Value at Risk and Stressed Value at Risk for trading portfolios under the Internal
Model Approach
As at
Mean Maximum Minimum balance
value value value date
Average VaR (1)
$M $M $M $M
Over the 6 months to 31 December 2015 26 39 21 25
Over the 6 months to 30 June 2015 28 43 23 26
Over the 6 months to 31 December 2014 31 63 22 35
Aggregate Value at Risk Over the Reporting Period
As at
Mean Maximum Minimum balance
value value value date
Stressed VaR (1)
$M $M $M $M
Over the 6 months to 31 December 2015 119 153 81 120
Over the 6 months to 30 June 2015 70 94 56 82
Over the 6 months to 31 December 2014 54 95 35 83
Aggregate SVaR Over the Reporting Period
Summary Table of the Number of Back-Testing Outliers (2)
Over the 6 months to 31 December 2015 -
Over the 6 months to 30 June 2015 -
Over the 6 months to 31 December 2014 -
(1) 10 day, 99% confidence interval over the reporting period.
(2) 1 day, 99% confidence interval over the reporting period.
For
per
sona
l use
onl
y
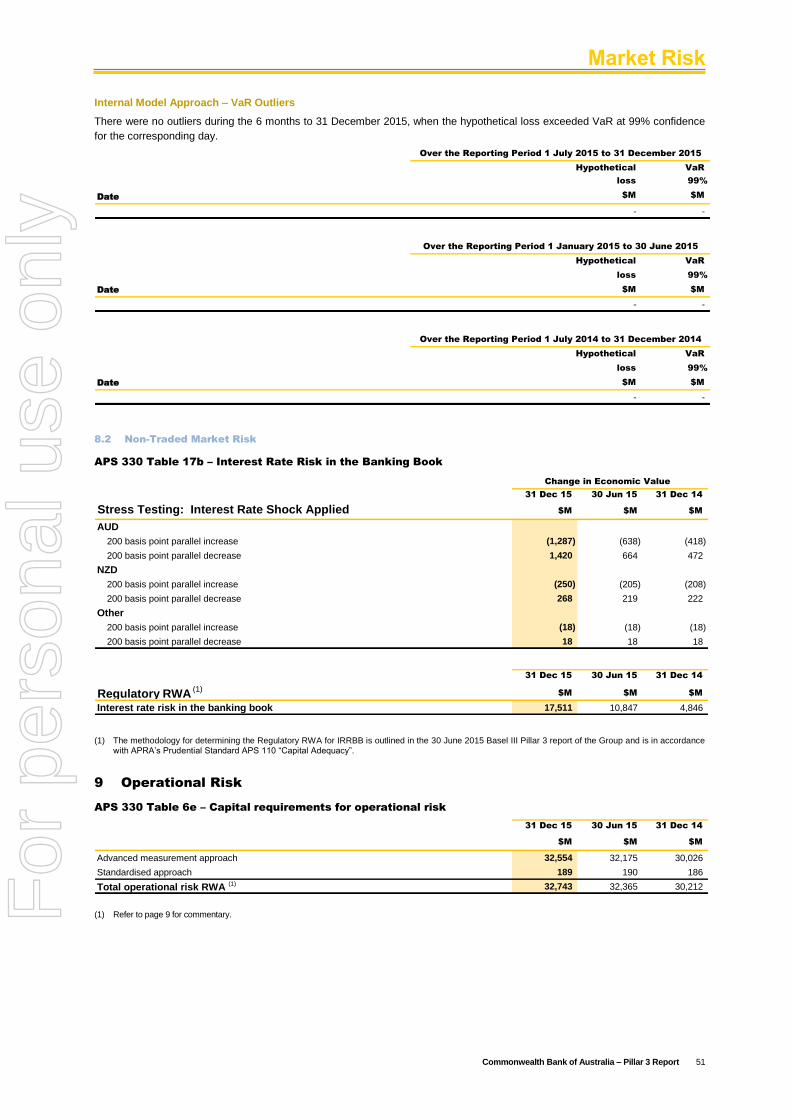
Market Risk
Commonwealth Bank of Australia – Pillar 3 Report 51
Internal Model Approach – VaR Outliers
There were no outliers during the 6 months to 31 December 2015, when the hypothetical loss exceeded VaR at 99% confidence
for the corresponding day.
Hypothetical VaR
loss 99%
Date $M $M
- -
Over the Reporting Period 1 July 2015 to 31 December 2015
Hypothetical VaR
loss 99%
Date $M $M
- -
Over the Reporting Period 1 January 2015 to 30 June 2015
Hypothetical VaR
loss 99%
Date $M $M
- -
Over the Reporting Period 1 July 2014 to 31 December 2014
8.2 Non-Traded Market Risk
APS 330 Table 17b – Interest Rate Risk in the Banking Book
31 Dec 15 30 Jun 15 31 Dec 14
Stress Testing: Interest Rate Shock Applied $M $M $M
AUD
200 basis point parallel increase (1,287) (638) (418)
200 basis point parallel decrease 1,420 664 472
NZD
200 basis point parallel increase (250) (205) (208)
200 basis point parallel decrease 268 219 222
Other
200 basis point parallel increase (18) (18) (18)
200 basis point parallel decrease 18 18 18
Change in Economic Value
31 Dec 15 30 Jun 15 31 Dec 14
Regulatory RWA (1)$M $M $M
Interest rate risk in the banking book 17,511 10,847 4,846
(1) The methodology for determining the Regulatory RWA for IRRBB is outlined in the 30 June 2015 Basel III Pillar 3 report of the Group and is in accordance with APRA’s Prudential Standard APS 110 “Capital Adequacy”.
9 Operational Risk
APS 330 Table 6e – Capital requirements for operational risk
31 Dec 15 30 Jun 15 31 Dec 14
$M $M $M
Advanced measurement approach 32,554 32,175 30,026
Standardised approach 189 190 186
Total operational risk RWA (1) 32,743 32,365 30,212
(1) Refer to page 9 for commentary.
For
per
sona
l use
onl
y
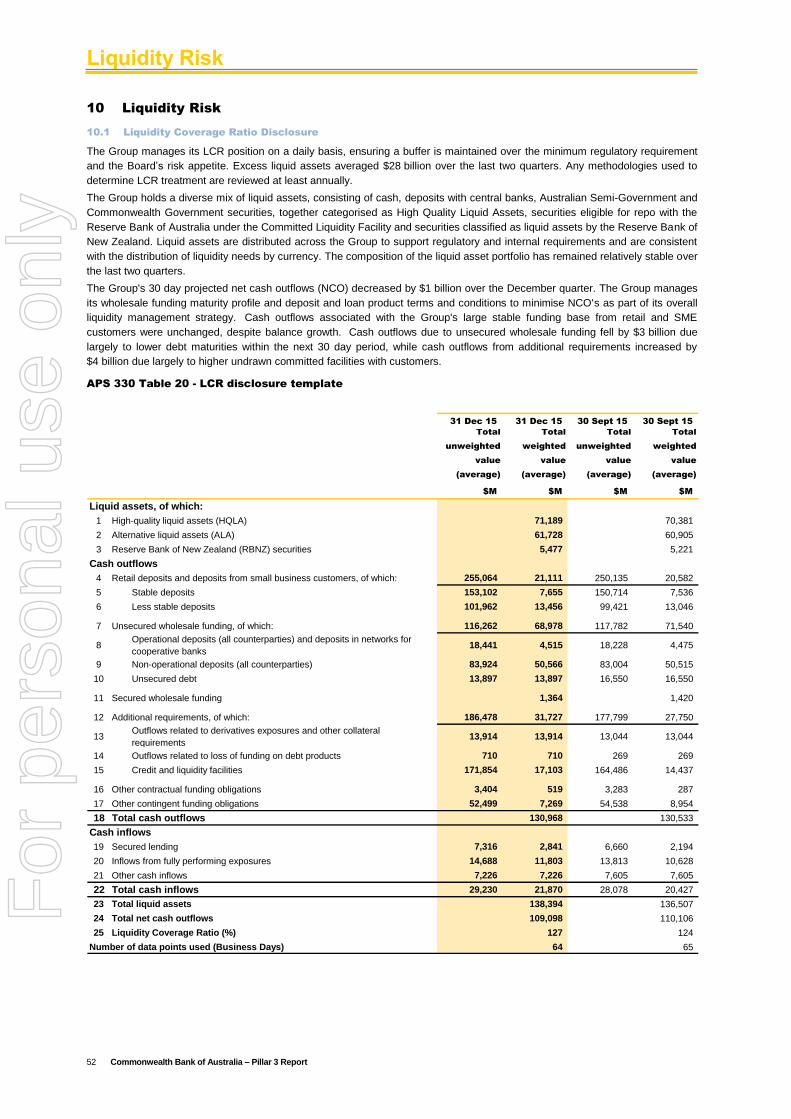
Liquidity Risk
52 Commonwealth Bank of Australia – Pillar 3 Report
10 Liquidity Risk
10.1 Liquidity Coverage Ratio Disclosure
The Group manages its LCR position on a daily basis, ensuring a buffer is maintained over the minimum regulatory requirement
and the Board’s risk appetite. Excess liquid assets averaged $28 billion over the last two quarters. Any methodologies used to
determine LCR treatment are reviewed at least annually.
The Group holds a diverse mix of liquid assets, consisting of cash, deposits with central banks, Australian Semi-Government and
Commonwealth Government securities, together categorised as High Quality Liquid Assets, securities eligible for repo with the
Reserve Bank of Australia under the Committed Liquidity Facility and securities classified as liquid assets by the Reserve Bank of
New Zealand. Liquid assets are distributed across the Group to support regulatory and internal requirements and are consistent
with the distribution of liquidity needs by currency. The composition of the liquid asset portfolio has remained relatively stable over
the last two quarters.
The Group's 30 day projected net cash outflows (NCO) decreased by $1 billion over the December quarter. The Group manages
its wholesale funding maturity profile and deposit and loan product terms and conditions to minimise NCO's as part of its overall
liquidity management strategy. Cash outflows associated with the Group's large stable funding base from retail and SME
customers were unchanged, despite balance growth. Cash outflows due to unsecured wholesale funding fell by $3 billion due
largely to lower debt maturities within the next 30 day period, while cash outflows from additional requirements increased by
$4 billion due largely to higher undrawn committed facilities with customers.
APS 330 Table 20 - LCR disclosure template
31 Dec 15 31 Dec 15 30 Sept 15 30 Sept 15
Total
unweighted
value
(average)
Total
weighted
value
(average)
Total
unweighted
value
(average)
Total
weighted
value
(average)
$M $M $M $M
Liquid assets, of which:
1 High-quality liquid assets (HQLA) 71,189 70,381
2 Alternative liquid assets (ALA) 61,728 60,905
3 Reserve Bank of New Zealand (RBNZ) securities 5,477 5,221
Cash outflows
4 Retail deposits and deposits from small business customers, of which: 255,064 21,111 250,135 20,582
5 Stable deposits 153,102 7,655 150,714 7,536
6 Less stable deposits 101,962 13,456 99,421 13,046
7 Unsecured wholesale funding, of which: 116,262 68,978 117,782 71,540
8Operational deposits (all counterparties) and deposits in networks for
cooperative banks18,441 4,515 18,228 4,475
9 Non-operational deposits (all counterparties) 83,924 50,566 83,004 50,515
10 Unsecured debt 13,897 13,897 16,550 16,550
11 Secured wholesale funding 1,364 1,420
12 Additional requirements, of which: 186,478 31,727 177,799 27,750
13Outflows related to derivatives exposures and other collateral
requirements13,914 13,914 13,044 13,044
14 Outflows related to loss of funding on debt products 710 710 269 269
15 Credit and liquidity facilities 171,854 17,103 164,486 14,437
16 Other contractual funding obligations 3,404 519 3,283 287
17 Other contingent funding obligations 52,499 7,269 54,538 8,954
18 Total cash outflows 130,968 130,533
Cash inflows
19 Secured lending 7,316 2,841 6,660 2,194
20 Inflows from fully performing exposures 14,688 11,803 13,813 10,628
21 Other cash inflows 7,226 7,226 7,605 7,605
22 Total cash inflows 29,230 21,870 28,078 20,427
23 Total liquid assets 138,394 136,507
24 Total net cash outflows 109,098 110,106
25 Liquidity Coverage Ratio (%) 127 124
Number of data points used (Business Days) 64 65
For
per
sona
l use
onl
y
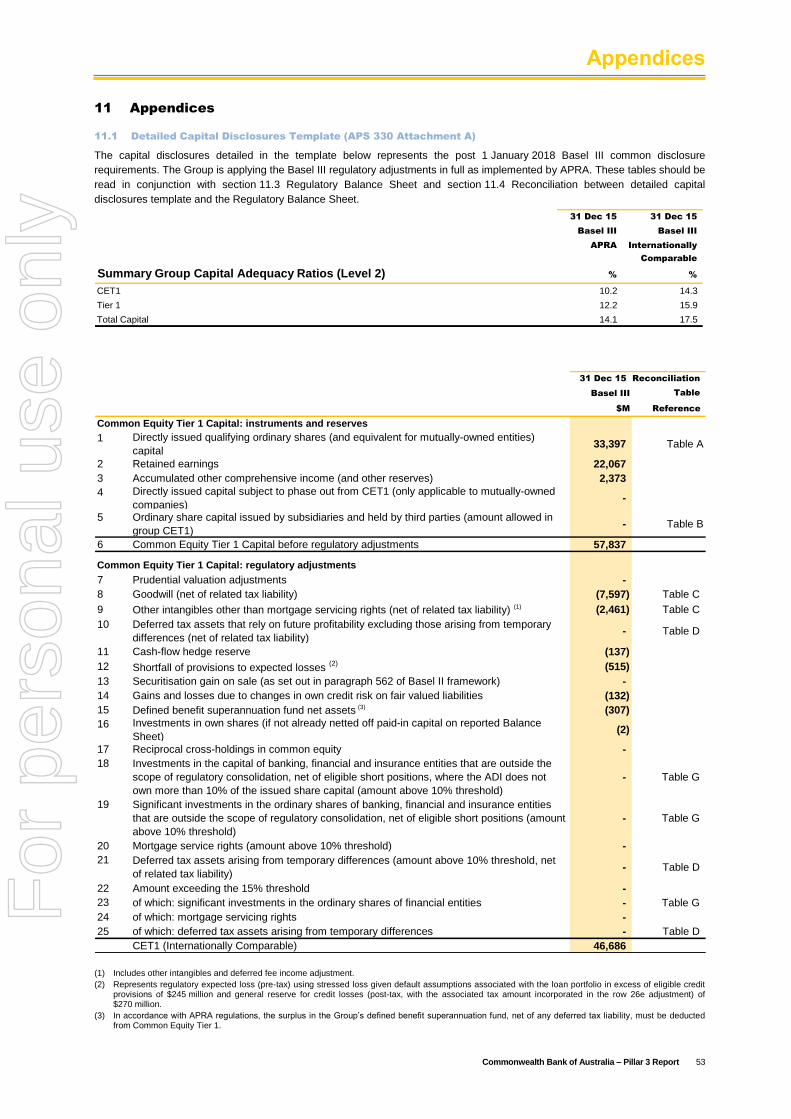
Appendices
Commonwealth Bank of Australia – Pillar 3 Report 53
11 Appendices
11.1 Detailed Capital Disclosures Template (APS 330 Attachment A)
The capital disclosures detailed in the template below represents the post 1 January 2018 Basel III common disclosure
requirements. The Group is applying the Basel III regulatory adjustments in full as implemented by APRA. These tables should be
read in conjunction with section 11.3 Regulatory Balance Sheet and section 11.4 Reconciliation between detailed capital
disclosures template and the Regulatory Balance Sheet.
31 Dec 15 31 Dec 15
Basel III Basel III
APRA Internationally
Comparable
Summary Group Capital Adequacy Ratios (Level 2) % %
CET1 10.2 14.3
Tier 1 12.2 15.9
Total Capital 14.1 17.5
31 Dec 15 Reconciliation
Basel III Table
$M Reference
Common Equity Tier 1 Capital: instruments and reserves
1 Directly issued qualifying ordinary shares (and equivalent for mutually-owned entities)
capital33,397 Table A
2 Retained earnings 22,067
3 Accumulated other comprehensive income (and other reserves) 2,373
4 Directly issued capital subject to phase out from CET1 (only applicable to mutually-owned
companies)-
5 Ordinary share capital issued by subsidiaries and held by third parties (amount allowed in
group CET1)- Table B
6 Common Equity Tier 1 Capital before regulatory adjustments 57,837
Common Equity Tier 1 Capital: regulatory adjustments
7 Prudential valuation adjustments -
8 Goodwill (net of related tax liability) (7,597) Table C
9 Other intangibles other than mortgage servicing rights (net of related tax liability) (1) (2,461) Table C
10 Deferred tax assets that rely on future profitability excluding those arising from temporary
differences (net of related tax liability)- Table D
11 Cash-flow hedge reserve (137)
12 Shortfall of provisions to expected losses (2) (515)
13 Securitisation gain on sale (as set out in paragraph 562 of Basel II framework) -
14 Gains and losses due to changes in own credit risk on fair valued liabilities (132)
15 Defined benefit superannuation fund net assets (3) (307)
16 Investments in own shares (if not already netted off paid-in capital on reported Balance
Sheet)(2)
17 Reciprocal cross-holdings in common equity -
18 Investments in the capital of banking, financial and insurance entities that are outside the
scope of regulatory consolidation, net of eligible short positions, where the ADI does not
own more than 10% of the issued share capital (amount above 10% threshold)
- Table G
19 Significant investments in the ordinary shares of banking, financial and insurance entities
that are outside the scope of regulatory consolidation, net of eligible short positions (amount
above 10% threshold)
- Table G
20 Mortgage service rights (amount above 10% threshold) -
21 Deferred tax assets arising from temporary differences (amount above 10% threshold, net
of related tax liability)- Table D
22 Amount exceeding the 15% threshold -
23 of which: significant investments in the ordinary shares of financial entities - Table G
24 of which: mortgage servicing rights -
25 of which: deferred tax assets arising from temporary differences - Table D
CET1 (Internationally Comparable) 46,686
(1) Includes other intangibles and deferred fee income adjustment.
(2) Represents regulatory expected loss (pre-tax) using stressed loss given default assumptions associated with the loan portfolio in excess of eligible credit provisions of $245 million and general reserve for credit losses (post-tax, with the associated tax amount incorporated in the row 26e adjustment) of $270 million.
(3) In accordance with APRA regulations, the surplus in the Group’s defined benefit superannuation fund, net of any deferred tax liability, must be deducted from Common Equity Tier 1.
For
per
sona
l use
onl
y
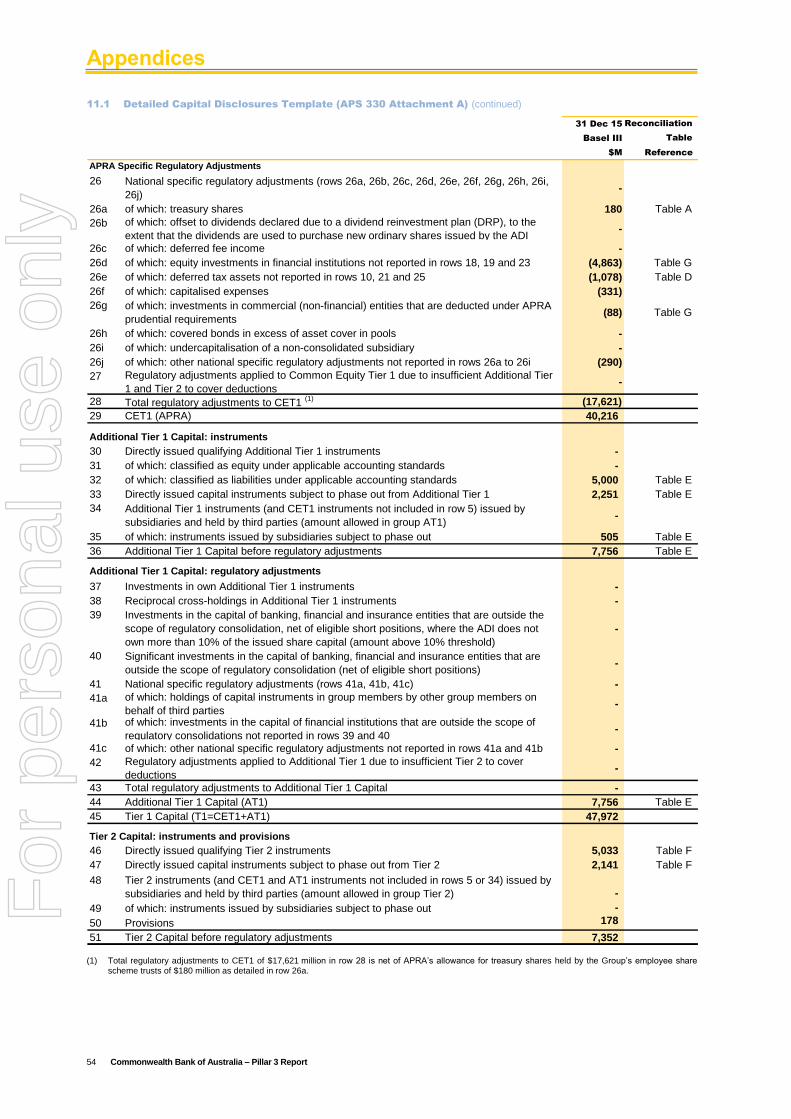
Appendices
54 Commonwealth Bank of Australia – Pillar 3 Report
11.1 Detailed Capital Disclosures Template (APS 330 Attachment A) (continued)
31 Dec 15 Reconciliation
Basel III Table
$M Reference
APRA Specific Regulatory Adjustments
26 National specific regulatory adjustments (rows 26a, 26b, 26c, 26d, 26e, 26f, 26g, 26h, 26i,
26j) -
26a of which: treasury shares 180 Table A
26b of which: offset to dividends declared due to a dividend reinvestment plan (DRP), to the
extent that the dividends are used to purchase new ordinary shares issued by the ADI -
26c of which: deferred fee income -
26d of which: equity investments in financial institutions not reported in rows 18, 19 and 23 (4,863) Table G
26e of which: deferred tax assets not reported in rows 10, 21 and 25 (1,078) Table D
26f of which: capitalised expenses (331)
26g of which: investments in commercial (non-financial) entities that are deducted under APRA
prudential requirements(88) Table G
26h of which: covered bonds in excess of asset cover in pools -
26i of which: undercapitalisation of a non-consolidated subsidiary -
26j of which: other national specific regulatory adjustments not reported in rows 26a to 26i (290)
27 Regulatory adjustments applied to Common Equity Tier 1 due to insufficient Additional Tier
1 and Tier 2 to cover deductions -
28 Total regulatory adjustments to CET1 (1) (17,621)
29 CET1 (APRA) 40,216
Additional Tier 1 Capital: instruments
30 Directly issued qualifying Additional Tier 1 instruments -
31 of which: classified as equity under applicable accounting standards -
32 of which: classified as liabilities under applicable accounting standards 5,000 Table E
33 Directly issued capital instruments subject to phase out from Additional Tier 1 2,251 Table E
34 Additional Tier 1 instruments (and CET1 instruments not included in row 5) issued by
subsidiaries and held by third parties (amount allowed in group AT1)-
35 of which: instruments issued by subsidiaries subject to phase out 505 Table E
36 Additional Tier 1 Capital before regulatory adjustments 7,756 Table E
Additional Tier 1 Capital: regulatory adjustments
37 Investments in own Additional Tier 1 instruments -
38 Reciprocal cross-holdings in Additional Tier 1 instruments -
39 Investments in the capital of banking, financial and insurance entities that are outside the
scope of regulatory consolidation, net of eligible short positions, where the ADI does not
own more than 10% of the issued share capital (amount above 10% threshold)
-
40 Significant investments in the capital of banking, financial and insurance entities that are
outside the scope of regulatory consolidation (net of eligible short positions)-
41 National specific regulatory adjustments (rows 41a, 41b, 41c) -
41a of which: holdings of capital instruments in group members by other group members on
behalf of third parties-
41b of which: investments in the capital of financial institutions that are outside the scope of
regulatory consolidations not reported in rows 39 and 40-
41c of which: other national specific regulatory adjustments not reported in rows 41a and 41b -
42 Regulatory adjustments applied to Additional Tier 1 due to insufficient Tier 2 to cover
deductions-
43 Total regulatory adjustments to Additional Tier 1 Capital -
44 Additional Tier 1 Capital (AT1) 7,756 Table E
45 Tier 1 Capital (T1=CET1+AT1) 47,972
Tier 2 Capital: instruments and provisions
46 Directly issued qualifying Tier 2 instruments 5,033 Table F
47 Directly issued capital instruments subject to phase out from Tier 2 2,141 Table F
48 Tier 2 instruments (and CET1 and AT1 instruments not included in rows 5 or 34) issued by
subsidiaries and held by third parties (amount allowed in group Tier 2) -
49 of which: instruments issued by subsidiaries subject to phase out -
50 Provisions 178
51 Tier 2 Capital before regulatory adjustments 7,352
(1) Total regulatory adjustments to CET1 of $17,621 million in row 28 is net of APRA’s allowance for treasury shares held by the Group’s employee share scheme trusts of $180 million as detailed in row 26a.
For
per
sona
l use
onl
y
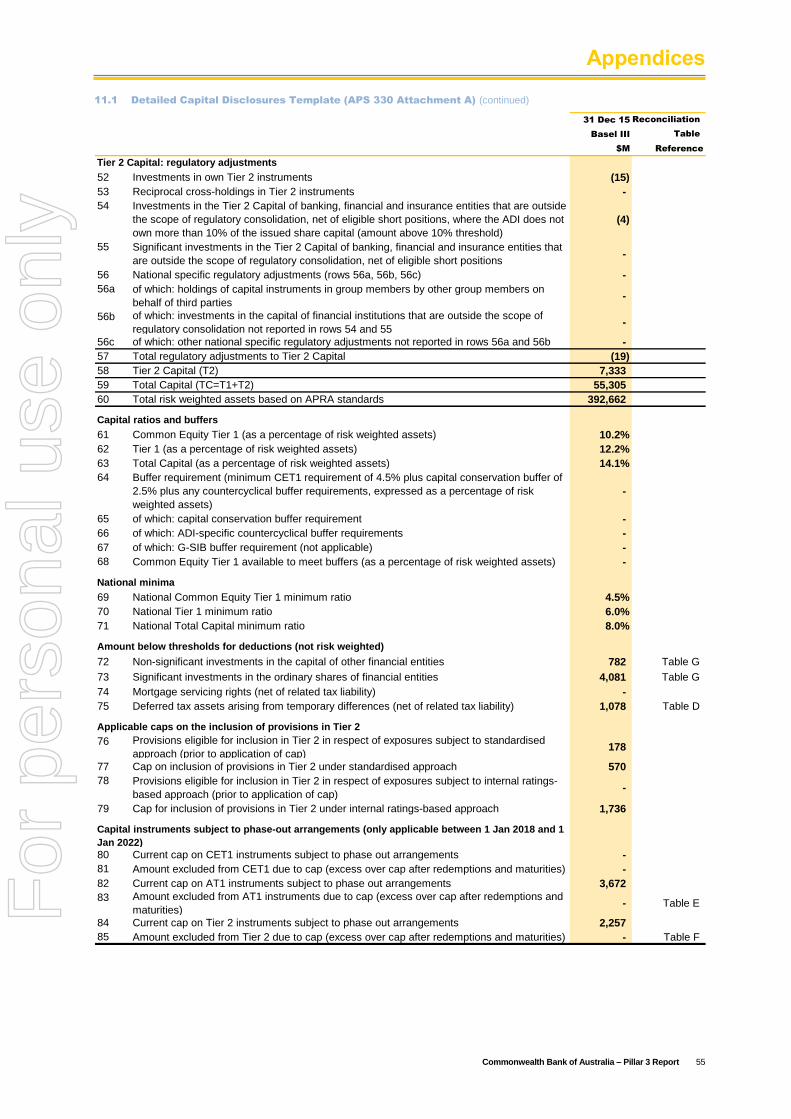
Appendices
Commonwealth Bank of Australia – Pillar 3 Report 55
11.1 Detailed Capital Disclosures Template (APS 330 Attachment A) (continued)
31 Dec 15 Reconciliation
Basel III Table
$M Reference
Tier 2 Capital: regulatory adjustments
52 Investments in own Tier 2 instruments (15)
53 Reciprocal cross-holdings in Tier 2 instruments -
54 Investments in the Tier 2 Capital of banking, financial and insurance entities that are outside
the scope of regulatory consolidation, net of eligible short positions, where the ADI does not
own more than 10% of the issued share capital (amount above 10% threshold)
(4)
55 Significant investments in the Tier 2 Capital of banking, financial and insurance entities that
are outside the scope of regulatory consolidation, net of eligible short positions-
56 National specific regulatory adjustments (rows 56a, 56b, 56c) -
56a of which: holdings of capital instruments in group members by other group members on
behalf of third parties-
56b of which: investments in the capital of financial institutions that are outside the scope of
regulatory consolidation not reported in rows 54 and 55-
56c of which: other national specific regulatory adjustments not reported in rows 56a and 56b -
57 Total regulatory adjustments to Tier 2 Capital (19)
58 Tier 2 Capital (T2) 7,333
59 Total Capital (TC=T1+T2) 55,305
60 Total risk weighted assets based on APRA standards 392,662
Capital ratios and buffers
61 Common Equity Tier 1 (as a percentage of risk weighted assets) 10.2%
62 Tier 1 (as a percentage of risk weighted assets) 12.2%
63 Total Capital (as a percentage of risk weighted assets) 14.1%
64 Buffer requirement (minimum CET1 requirement of 4.5% plus capital conservation buffer of
2.5% plus any countercyclical buffer requirements, expressed as a percentage of risk
weighted assets)
-
65 of which: capital conservation buffer requirement -
66 of which: ADI-specific countercyclical buffer requirements -
67 of which: G-SIB buffer requirement (not applicable) -
68 Common Equity Tier 1 available to meet buffers (as a percentage of risk weighted assets) -
National minima
69 National Common Equity Tier 1 minimum ratio 4.5%
70 National Tier 1 minimum ratio 6.0%
71 National Total Capital minimum ratio 8.0%
Amount below thresholds for deductions (not risk weighted)
72 Non-significant investments in the capital of other financial entities 782 Table G
73 Significant investments in the ordinary shares of financial entities 4,081 Table G
74 Mortgage servicing rights (net of related tax liability) -
75 Deferred tax assets arising from temporary differences (net of related tax liability) 1,078 Table D
Applicable caps on the inclusion of provisions in Tier 2
76 Provisions eligible for inclusion in Tier 2 in respect of exposures subject to standardised
approach (prior to application of cap)178
77 Cap on inclusion of provisions in Tier 2 under standardised approach 570
78 Provisions eligible for inclusion in Tier 2 in respect of exposures subject to internal ratings-
based approach (prior to application of cap)-
79 Cap for inclusion of provisions in Tier 2 under internal ratings-based approach 1,736
80 Current cap on CET1 instruments subject to phase out arrangements -
81 Amount excluded from CET1 due to cap (excess over cap after redemptions and maturities) -
82 Current cap on AT1 instruments subject to phase out arrangements 3,672
83 Amount excluded from AT1 instruments due to cap (excess over cap after redemptions and
maturities)- Table E
84 Current cap on Tier 2 instruments subject to phase out arrangements 2,257
85 Amount excluded from Tier 2 due to cap (excess over cap after redemptions and maturities) - Table F
Capital instruments subject to phase-out arrangements (only applicable between 1 Jan 2018 and 1
Jan 2022)
For
per
sona
l use
onl
y
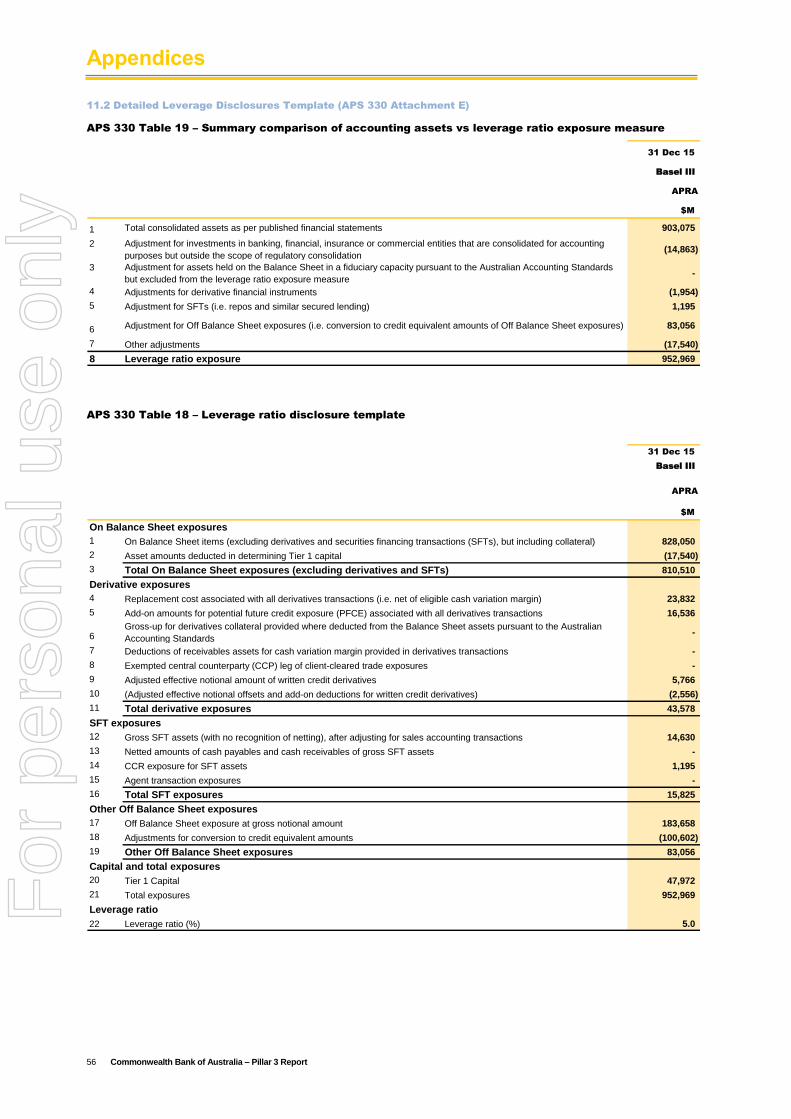
Appendices
56 Commonwealth Bank of Australia – Pillar 3 Report
11.2 Detailed Leverage Disclosures Template (APS 330 Attachment E)
APS 330 Table 19 – Summary comparison of accounting assets vs leverage ratio exposure measure
31 Dec 15
Basel III
APRA
$M
1 Total consolidated assets as per published financial statements 903,075
2 Adjustment for investments in banking, financial, insurance or commercial entities that are consolidated for accounting
purposes but outside the scope of regulatory consolidation(14,863)
3 Adjustment for assets held on the Balance Sheet in a fiduciary capacity pursuant to the Australian Accounting Standards
but excluded from the leverage ratio exposure measure-
4 Adjustments for derivative financial instruments (1,954)
5 Adjustment for SFTs (i.e. repos and similar secured lending) 1,195
6 Adjustment for Off Balance Sheet exposures (i.e. conversion to credit equivalent amounts of Off Balance Sheet exposures) 83,056
7 Other adjustments (17,540)
8 Leverage ratio exposure 952,969
APS 330 Table 18 – Leverage ratio disclosure template
31 Dec 15
Basel III
APRA
$M
On Balance Sheet exposures
1 On Balance Sheet items (excluding derivatives and securities financing transactions (SFTs), but including collateral) 828,050
2 Asset amounts deducted in determining Tier 1 capital (17,540)
3 Total On Balance Sheet exposures (excluding derivatives and SFTs) 810,510
Derivative exposures
4 Replacement cost associated with all derivatives transactions (i.e. net of eligible cash variation margin) 23,832
5 Add-on amounts for potential future credit exposure (PFCE) associated with all derivatives transactions 16,536
6Gross-up for derivatives collateral provided where deducted from the Balance Sheet assets pursuant to the Australian
Accounting Standards-
7 Deductions of receivables assets for cash variation margin provided in derivatives transactions -
8 Exempted central counterparty (CCP) leg of client-cleared trade exposures -
9 Adjusted effective notional amount of written credit derivatives 5,766
10 (Adjusted effective notional offsets and add-on deductions for written credit derivatives) (2,556)
11 Total derivative exposures 43,578
SFT exposures
12 Gross SFT assets (with no recognition of netting), after adjusting for sales accounting transactions 14,630
13 Netted amounts of cash payables and cash receivables of gross SFT assets -
14 CCR exposure for SFT assets 1,195
15 Agent transaction exposures -
16 Total SFT exposures 15,825
Other Off Balance Sheet exposures
17 Off Balance Sheet exposure at gross notional amount 183,658
18 Adjustments for conversion to credit equivalent amounts (100,602)
19 Other Off Balance Sheet exposures 83,056
Capital and total exposures
20 Tier 1 Capital 47,972
21 Total exposures 952,969
Leverage ratio
22 Leverage ratio (%) 5.0
For
per
sona
l use
onl
y
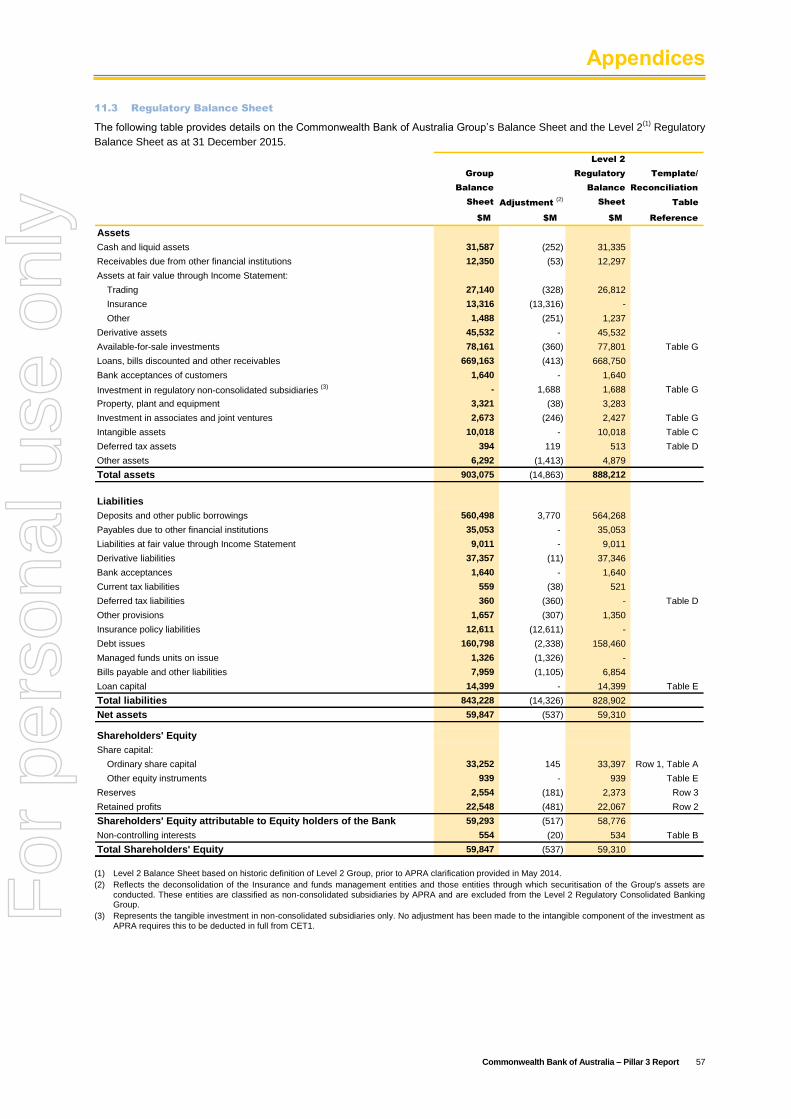
Appendices
Commonwealth Bank of Australia – Pillar 3 Report 57
11.3 Regulatory Balance Sheet
The following table provides details on the Commonwealth Bank of Australia Group’s Balance Sheet and the Level 2(1)
Regulatory
Balance Sheet as at 31 December 2015.
Level 2
Group Regulatory Template/
Balance Balance Reconciliation
Sheet Adjustment (2)
Sheet Table
$M $M $M Reference
Assets
Cash and liquid assets 31,587 (252) 31,335
Receivables due from other financial institutions 12,350 (53) 12,297
Assets at fair value through Income Statement:
Trading 27,140 (328) 26,812
Insurance 13,316 (13,316) -
Other 1,488 (251) 1,237
Derivative assets 45,532 - 45,532
Available-for-sale investments 78,161 (360) 77,801 Table G
Loans, bills discounted and other receivables 669,163 (413) 668,750
Bank acceptances of customers 1,640 - 1,640
Investment in regulatory non-consolidated subsidiaries (3) - 1,688 1,688 Table G
Property, plant and equipment 3,321 (38) 3,283
Investment in associates and joint ventures 2,673 (246) 2,427 Table G
Intangible assets 10,018 - 10,018 Table C
Deferred tax assets 394 119 513 Table D
Other assets 6,292 (1,413) 4,879
Total assets 903,075 (14,863) 888,212
Liabilities
Deposits and other public borrowings 560,498 3,770 564,268
Payables due to other financial institutions 35,053 - 35,053
Liabilities at fair value through Income Statement 9,011 - 9,011
Derivative liabilities 37,357 (11) 37,346
Bank acceptances 1,640 - 1,640
Current tax liabilities 559 (38) 521
Deferred tax liabilities 360 (360) - Table D
Other provisions 1,657 (307) 1,350
Insurance policy liabilities 12,611 (12,611) -
Debt issues 160,798 (2,338) 158,460
Managed funds units on issue 1,326 (1,326) -
Bills payable and other liabilities 7,959 (1,105) 6,854
Loan capital 14,399 - 14,399 Table E
Total liabilities 843,228 (14,326) 828,902
Net assets 59,847 (537) 59,310
Shareholders' Equity
Share capital:
Ordinary share capital 33,252 145 33,397 Row 1, Table A
Other equity instruments 939 - 939 Table E
Reserves 2,554 (181) 2,373 Row 3
Retained profits 22,548 (481) 22,067 Row 2
Shareholders' Equity attributable to Equity holders of the Bank 59,293 (517) 58,776
Non-controlling interests 554 (20) 534 Table B
Total Shareholders' Equity 59,847 (537) 59,310
(1) Level 2 Balance Sheet based on historic definition of Level 2 Group, prior to APRA clarification provided in May 2014.
(2) Reflects the deconsolidation of the Insurance and funds management entities and those entities through which securitisation of the Group's assets are conducted. These entities are classified as non-consolidated subsidiaries by APRA and are excluded from the Level 2 Regulatory Consolidated Banking Group.
(3) Represents the tangible investment in non-consolidated subsidiaries only. No adjustment has been made to the intangible component of the investment as APRA requires this to be deducted in full from CET1.
For
per
sona
l use
onl
y
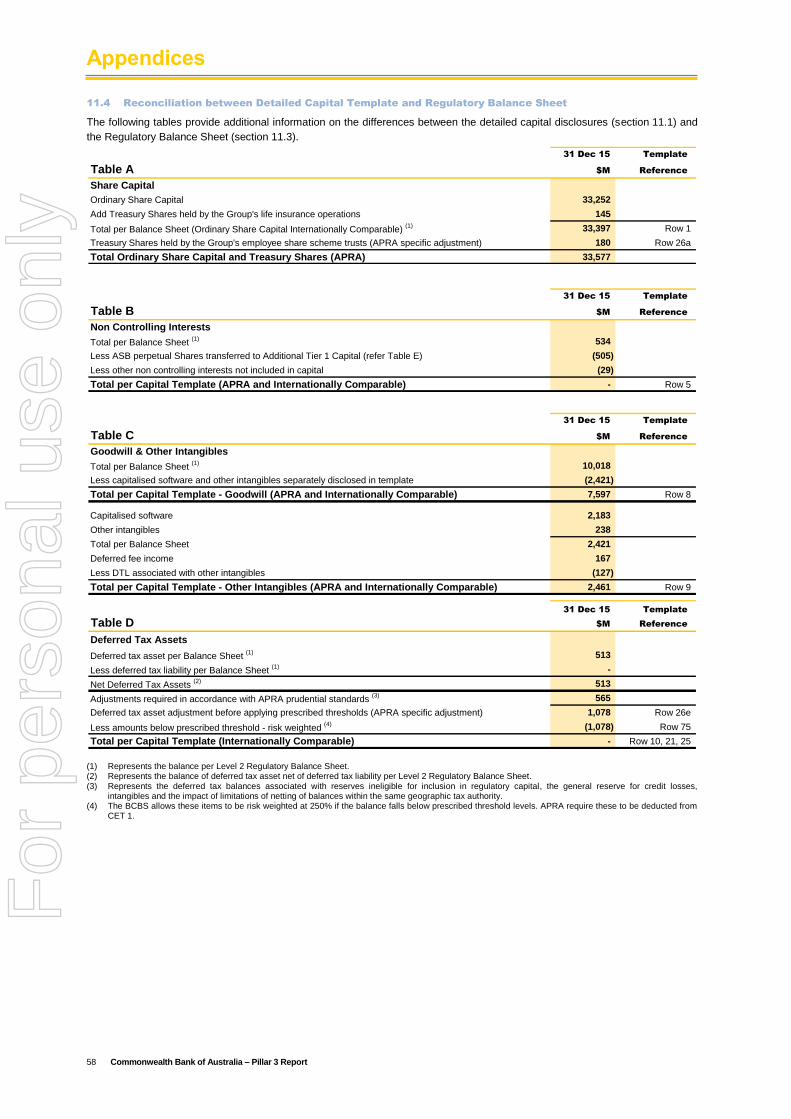
Appendices
58 Commonwealth Bank of Australia – Pillar 3 Report
11.4 Reconciliation between Detailed Capital Template and Regulatory Balance Sheet
The following tables provide additional information on the differences between the detailed capital disclosures (section 11.1) and
the Regulatory Balance Sheet (section 11.3).
31 Dec 15 Template
Table A $M Reference
Share Capital
Ordinary Share Capital 33,252
Add Treasury Shares held by the Group's life insurance operations 145
Total per Balance Sheet (Ordinary Share Capital Internationally Comparable) (1) 33,397 Row 1
Treasury Shares held by the Group's employee share scheme trusts (APRA specific adjustment) 180 Row 26a
Total Ordinary Share Capital and Treasury Shares (APRA) 33,577
31 Dec 15 Template
Table B $M Reference
Non Controlling Interests
Total per Balance Sheet (1) 534
Less ASB perpetual Shares transferred to Additional Tier 1 Capital (refer Table E) (505)
Less other non controlling interests not included in capital (29)
Total per Capital Template (APRA and Internationally Comparable) - Row 5
31 Dec 15 Template
Table C $M Reference
Goodwill & Other Intangibles
Total per Balance Sheet (1) 10,018
Less capitalised software and other intangibles separately disclosed in template (2,421)
Total per Capital Template - Goodwill (APRA and Internationally Comparable) 7,597 Row 8
Capitalised software 2,183
Other intangibles 238
Total per Balance Sheet 2,421
Deferred fee income 167
Less DTL associated with other intangibles (127)
Total per Capital Template - Other Intangibles (APRA and Internationally Comparable) 2,461 Row 9
31 Dec 15 Template
Table D $M Reference
Deferred Tax Assets
Deferred tax asset per Balance Sheet (1) 513
Less deferred tax liability per Balance Sheet (1) -
Net Deferred Tax Assets (2) 513
Adjustments required in accordance with APRA prudential standards (3) 565
Deferred tax asset adjustment before applying prescribed thresholds (APRA specific adjustment) 1,078 Row 26e
Less amounts below prescribed threshold - risk weighted (4) (1,078) Row 75
Total per Capital Template (Internationally Comparable) - Row 10, 21, 25
(1) Represents the balance per Level 2 Regulatory Balance Sheet. (2) Represents the balance of deferred tax asset net of deferred tax liability per Level 2 Regulatory Balance Sheet. (3) Represents the deferred tax balances associated with reserves ineligible for inclusion in regulatory capital, the general reserve for credit losses,
intangibles and the impact of limitations of netting of balances within the same geographic tax authority. (4) The BCBS allows these items to be risk weighted at 250% if the balance falls below prescribed threshold levels. APRA require these to be deducted from
CET 1.
For
per
sona
l use
onl
y
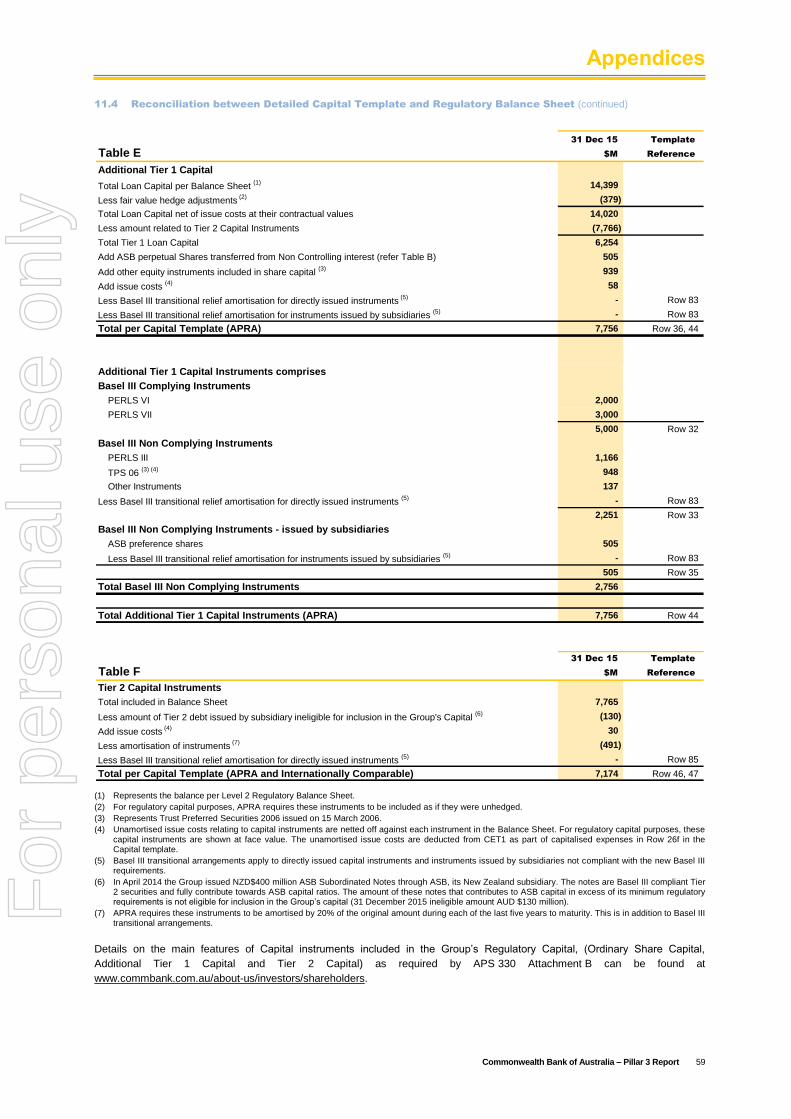
Appendices
Commonwealth Bank of Australia – Pillar 3 Report 59
11.4 Reconciliation between Detailed Capital Template and Regulatory Balance Sheet (continued)
31 Dec 15 Template
Table E $M Reference
Additional Tier 1 Capital
Total Loan Capital per Balance Sheet (1) 14,399
Less fair value hedge adjustments (2) (379)
Total Loan Capital net of issue costs at their contractual values 14,020
Less amount related to Tier 2 Capital Instruments (7,766)
Total Tier 1 Loan Capital 6,254
Add ASB perpetual Shares transferred from Non Controlling interest (refer Table B) 505
Add other equity instruments included in share capital (3) 939
Add issue costs (4) 58
Less Basel III transitional relief amortisation for directly issued instruments (5) - Row 83
Less Basel III transitional relief amortisation for instruments issued by subsidiaries (5) - Row 83
Total per Capital Template (APRA) 7,756 Row 36, 44
Additional Tier 1 Capital Instruments comprises
Basel III Complying Instruments
PERLS VI 2,000
PERLS VII 3,000
5,000 Row 32
Basel III Non Complying Instruments
PERLS III 1,166
TPS 06 (3) (4) 948
Other Instruments 137
Less Basel III transitional relief amortisation for directly issued instruments (5) - Row 83
2,251 Row 33
Basel III Non Complying Instruments - issued by subsidiaries
ASB preference shares 505
Less Basel III transitional relief amortisation for instruments issued by subsidiaries (5) - Row 83
505 Row 35
Total Basel III Non Complying Instruments 2,756
Total Additional Tier 1 Capital Instruments (APRA) 7,756 Row 44
31 Dec 15 Template
Table F $M Reference
Tier 2 Capital Instruments
Total included in Balance Sheet 7,765
Less amount of Tier 2 debt issued by subsidiary ineligible for inclusion in the Group's Capital (6) (130)
Add issue costs (4) 30
Less amortisation of instruments (7) (491)
Less Basel III transitional relief amortisation for directly issued instruments (5) - Row 85
Total per Capital Template (APRA and Internationally Comparable) 7,174 Row 46, 47
(1) Represents the balance per Level 2 Regulatory Balance Sheet.
(2) For regulatory capital purposes, APRA requires these instruments to be included as if they were unhedged.
(3) Represents Trust Preferred Securities 2006 issued on 15 March 2006.
(4) Unamortised issue costs relating to capital instruments are netted off against each instrument in the Balance Sheet. For regulatory capital purposes, these capital instruments are shown at face value. The unamortised issue costs are deducted from CET1 as part of capitalised expenses in Row 26f in the Capital template.
(5) Basel III transitional arrangements apply to directly issued capital instruments and instruments issued by subsidiaries not compliant with the new Basel III requirements.
(6) In April 2014 the Group issued NZD$400 million ASB Subordinated Notes through ASB, its New Zealand subsidiary. The notes are Basel III compliant Tier 2 securities and fully contribute towards ASB capital ratios. The amount of these notes that contributes to ASB capital in excess of its minimum regulatory requirements is not eligible for inclusion in the Group’s capital (31 December 2015 ineligible amount AUD $130 million).
(7) APRA requires these instruments to be amortised by 20% of the original amount during each of the last five years to maturity. This is in addition to Basel III transitional arrangements.
Details on the main features of Capital instruments included in the Group’s Regulatory Capital, (Ordinary Share Capital,
Additional Tier 1 Capital and Tier 2 Capital) as required by APS 330 Attachment B can be found at
www.commbank.com.au/about-us/investors/shareholders.
For
per
sona
l use
onl
y
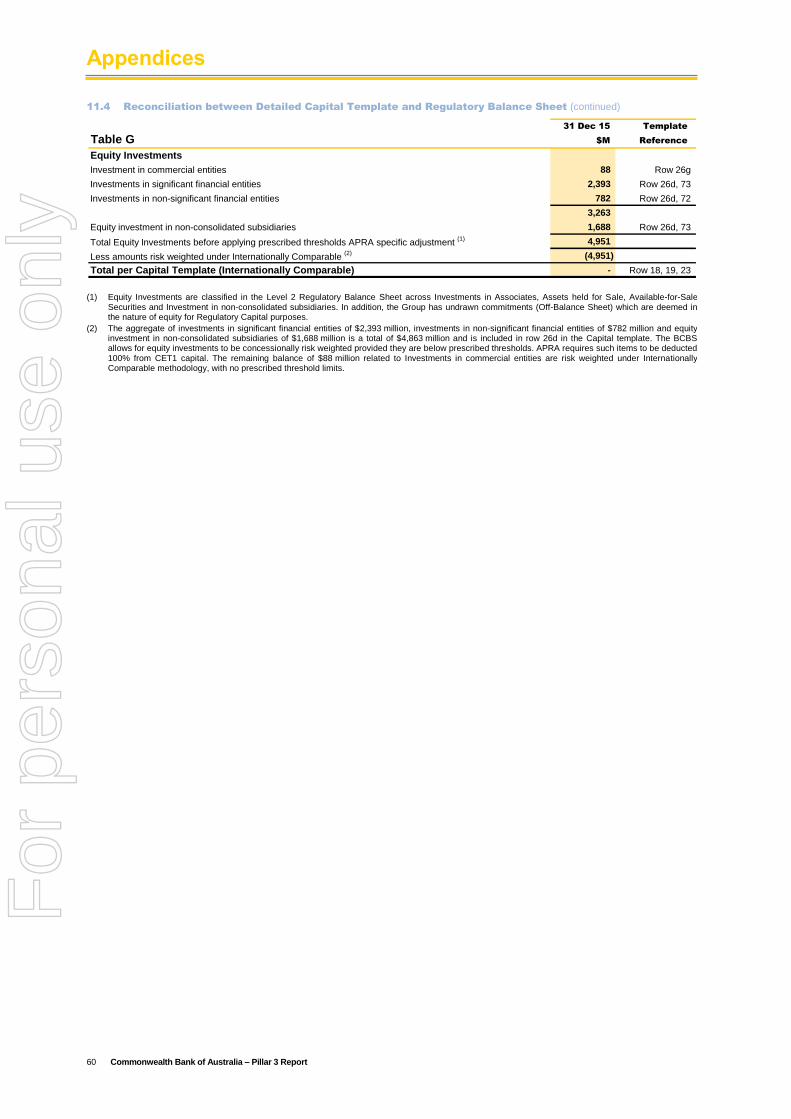
Appendices
60 Commonwealth Bank of Australia – Pillar 3 Report
11.4 Reconciliation between Detailed Capital Template and Regulatory Balance Sheet (continued)
31 Dec 15 Template
Table G $M Reference
Equity Investments
Investment in commercial entities 88 Row 26g
Investments in significant financial entities 2,393 Row 26d, 73
Investments in non-significant financial entities 782 Row 26d, 72
3,263
Equity investment in non-consolidated subsidiaries 1,688 Row 26d, 73
Total Equity Investments before applying prescribed thresholds APRA specific adjustment (1) 4,951
Less amounts risk weighted under Internationally Comparable (2) (4,951)
Total per Capital Template (Internationally Comparable) - Row 18, 19, 23
(1) Equity Investments are classified in the Level 2 Regulatory Balance Sheet across Investments in Associates, Assets held for Sale, Available-for-Sale Securities and Investment in non-consolidated subsidiaries. In addition, the Group has undrawn commitments (Off-Balance Sheet) which are deemed in the nature of equity for Regulatory Capital purposes.
(2) The aggregate of investments in significant financial entities of $2,393 million, investments in non-significant financial entities of $782 million and equity investment in non-consolidated subsidiaries of $1,688 million is a total of $4,863 million and is included in row 26d in the Capital template. The BCBS allows for equity investments to be concessionally risk weighted provided they are below prescribed thresholds. APRA requires such items to be deducted 100% from CET1 capital. The remaining balance of $88 million related to Investments in commercial entities are risk weighted under Internationally Comparable methodology, with no prescribed threshold limits.
For
per
sona
l use
onl
y
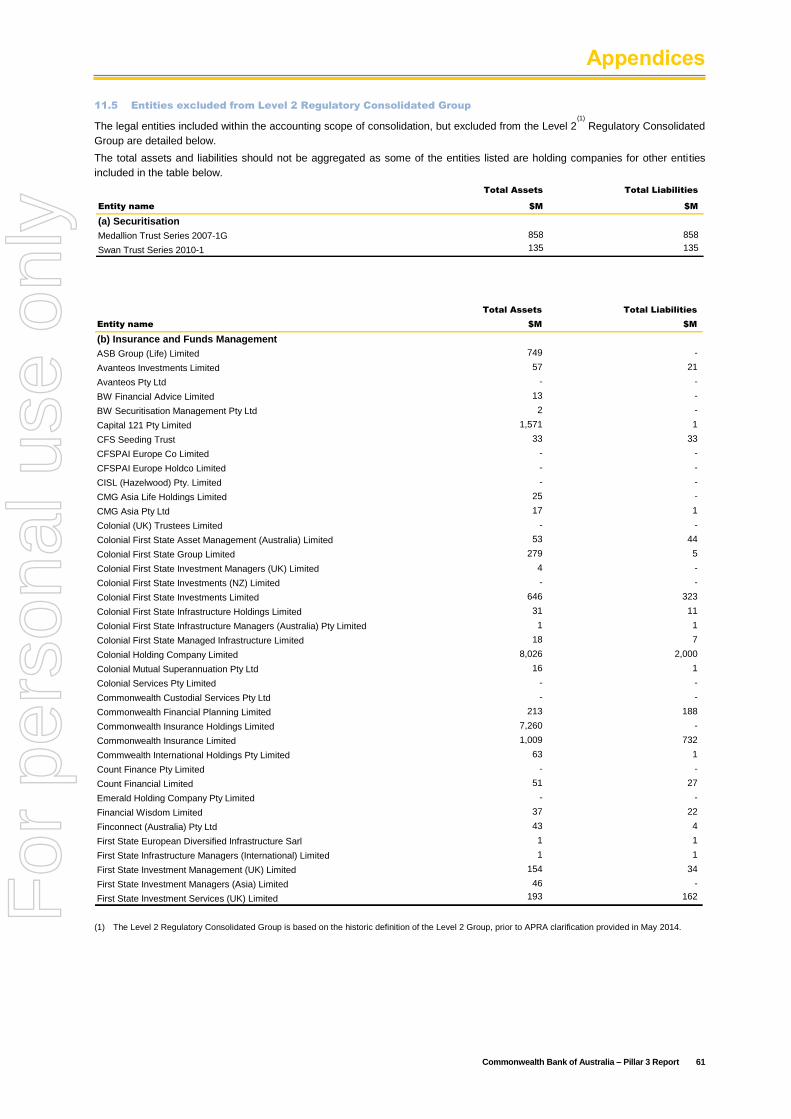
Appendices
Commonwealth Bank of Australia – Pillar 3 Report 61
11.5 Entities excluded from Level 2 Regulatory Consolidated Group
The legal entities included within the accounting scope of consolidation, but excluded from the Level 2(1)
Regulatory Consolidated
Group are detailed below.
The total assets and liabilities should not be aggregated as some of the entities listed are holding companies for other entities
included in the table below.
Total Assets Total Liabilities
Entity name $M $M
(a) Securitisation
Medallion Trust Series 2007-1G 858 858
Swan Trust Series 2010-1 135 135
Total Assets Total Liabilities
Entity name $M $M
(b) Insurance and Funds Management
ASB Group (Life) Limited 749 -
Avanteos Investments Limited 57 21
Avanteos Pty Ltd - -
BW Financial Advice Limited 13 -
BW Securitisation Management Pty Ltd 2 -
Capital 121 Pty Limited 1,571 1
CFS Seeding Trust 33 33
CFSPAI Europe Co Limited - -
CFSPAI Europe Holdco Limited - -
CISL (Hazelwood) Pty. Limited - -
CMG Asia Life Holdings Limited 25 -
CMG Asia Pty Ltd 17 1
Colonial (UK) Trustees Limited - -
Colonial First State Asset Management (Australia) Limited 53 44
Colonial First State Group Limited 279 5
Colonial First State Investment Managers (UK) Limited 4 -
Colonial First State Investments (NZ) Limited - -
Colonial First State Investments Limited 646 323
Colonial First State Infrastructure Holdings Limited 31 11
Colonial First State Infrastructure Managers (Australia) Pty Limited 1 1
Colonial First State Managed Infrastructure Limited 18 7
Colonial Holding Company Limited 8,026 2,000
Colonial Mutual Superannuation Pty Ltd 16 1
Colonial Services Pty Limited - -
Commonwealth Custodial Services Pty Ltd - -
Commonwealth Financial Planning Limited 213 188
Commonwealth Insurance Holdings Limited 7,260 -
Commonwealth Insurance Limited 1,009 732
Commwealth International Holdings Pty Limited 63 1
Count Finance Pty Limited - -
Count Financial Limited 51 27
Emerald Holding Company Pty Limited - -
Financial Wisdom Limited 37 22
Finconnect (Australia) Pty Ltd 43 4
First State European Diversified Infrastructure Sarl 1 1
First State Infrastructure Managers (International) Limited 1 1
First State Investment Management (UK) Limited 154 34
First State Investment Managers (Asia) Limited 46 -
First State Investment Services (UK) Limited 193 162
(1) The Level 2 Regulatory Consolidated Group is based on the historic definition of the Level 2 Group, prior to APRA clarification provided in May 2014.
For
per
sona
l use
onl
y
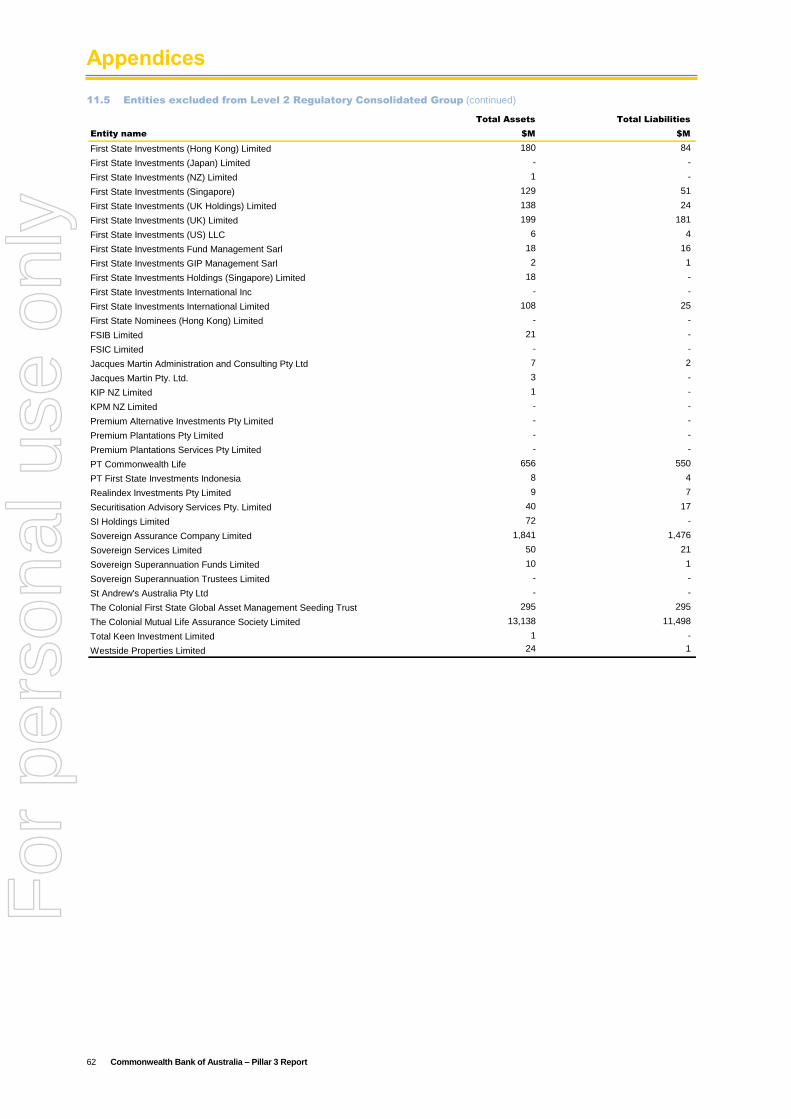
Appendices
62 Commonwealth Bank of Australia – Pillar 3 Report
11.5 Entities excluded from Level 2 Regulatory Consolidated Group (continued)
Total Assets Total Liabilities
Entity name $M $M
First State Investments (Hong Kong) Limited 180 84
First State Investments (Japan) Limited - -
First State Investments (NZ) Limited 1 -
First State Investments (Singapore) 129 51
First State Investments (UK Holdings) Limited 138 24
First State Investments (UK) Limited 199 181
First State Investments (US) LLC 6 4
First State Investments Fund Management Sarl 18 16
First State Investments GIP Management Sarl 2 1
First State Investments Holdings (Singapore) Limited 18 -
First State Investments International Inc - -
First State Investments International Limited 108 25
First State Nominees (Hong Kong) Limited - -
FSIB Limited 21 -
FSIC Limited - -
Jacques Martin Administration and Consulting Pty Ltd 7 2
Jacques Martin Pty. Ltd. 3 -
KIP NZ Limited 1 -
KPM NZ Limited - -
Premium Alternative Investments Pty Limited - -
Premium Plantations Pty Limited - -
Premium Plantations Services Pty Limited - -
PT Commonwealth Life 656 550
PT First State Investments Indonesia 8 4
Realindex Investments Pty Limited 9 7
Securitisation Advisory Services Pty. Limited 40 17
SI Holdings Limited 72 -
Sovereign Assurance Company Limited 1,841 1,476
Sovereign Services Limited 50 21
Sovereign Superannuation Funds Limited 10 1
Sovereign Superannuation Trustees Limited - -
St Andrew's Australia Pty Ltd - -
The Colonial First State Global Asset Management Seeding Trust 295 295
The Colonial Mutual Life Assurance Society Limited 13,138 11,498
Total Keen Investment Limited 1 -
Westside Properties Limited 24 1
For
per
sona
l use
onl
y
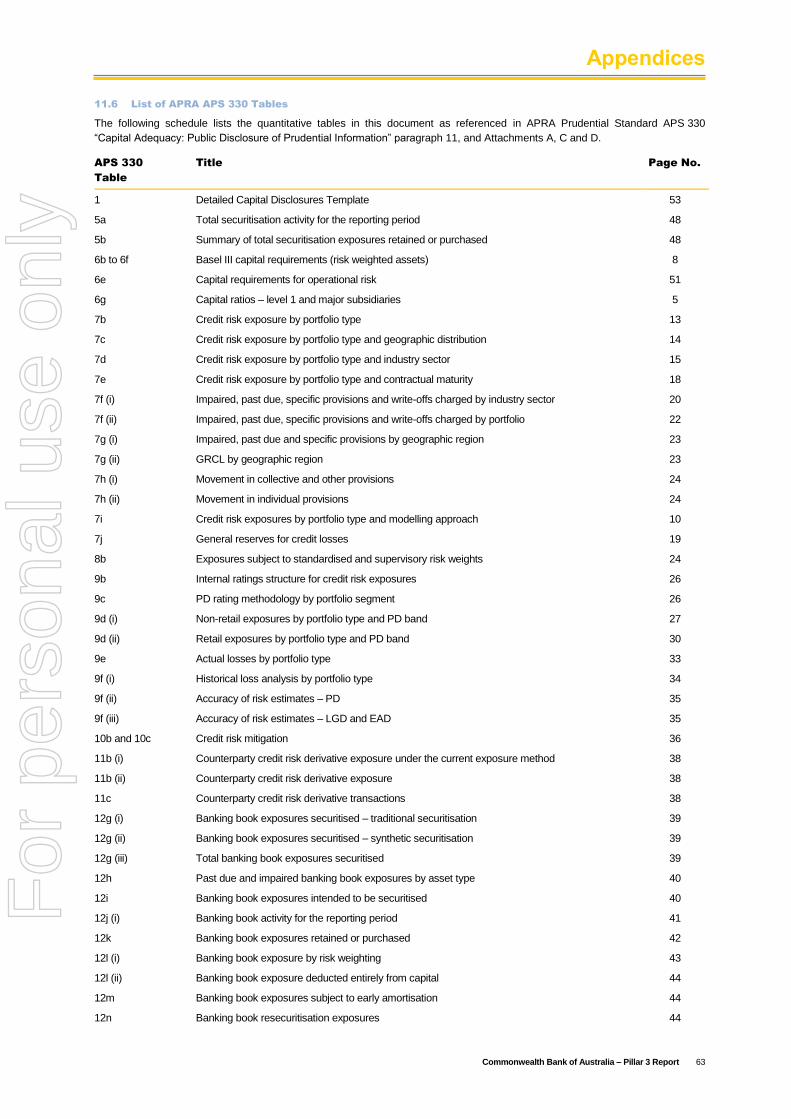
Appendices
Commonwealth Bank of Australia – Pillar 3 Report 63
11.6 List of APRA APS 330 Tables
The following schedule lists the quantitative tables in this document as referenced in APRA Prudential Standard APS 330
“Capital Adequacy: Public Disclosure of Prudential Information” paragraph 11, and Attachments A, C and D.
APS 330
Table
Title Page No.
1 Detailed Capital Disclosures Template 53
5a Total securitisation activity for the reporting period 48
5b Summary of total securitisation exposures retained or purchased 48
6b to 6f Basel III capital requirements (risk weighted assets) 8
6e Capital requirements for operational risk 51
6g Capital ratios – level 1 and major subsidiaries 5
7b Credit risk exposure by portfolio type 13
7c Credit risk exposure by portfolio type and geographic distribution 14
7d Credit risk exposure by portfolio type and industry sector 15
7e Credit risk exposure by portfolio type and contractual maturity 18
7f (i) Impaired, past due, specific provisions and write-offs charged by industry sector 20
7f (ii) Impaired, past due, specific provisions and write-offs charged by portfolio 22
7g (i) Impaired, past due and specific provisions by geographic region 23
7g (ii) GRCL by geographic region 23
7h (i) Movement in collective and other provisions 24
7h (ii) Movement in individual provisions 24
7i Credit risk exposures by portfolio type and modelling approach 10
7j General reserves for credit losses 19
8b Exposures subject to standardised and supervisory risk weights 24
9b Internal ratings structure for credit risk exposures 26
9c PD rating methodology by portfolio segment 26
9d (i) Non-retail exposures by portfolio type and PD band 27
9d (ii) Retail exposures by portfolio type and PD band 30
9e Actual losses by portfolio type 33
9f (i) Historical loss analysis by portfolio type 34
9f (ii) Accuracy of risk estimates – PD 35
9f (iii) Accuracy of risk estimates – LGD and EAD 35
10b and 10c Credit risk mitigation 36
11b (i) Counterparty credit risk derivative exposure under the current exposure method 38
11b (ii) Counterparty credit risk derivative exposure 38
11c Counterparty credit risk derivative transactions 38
12g (i) Banking book exposures securitised – traditional securitisation 39
12g (ii) Banking book exposures securitised – synthetic securitisation 39
12g (iii) Total banking book exposures securitised 39
12h Past due and impaired banking book exposures by asset type 40
12i Banking book exposures intended to be securitised 40
12j (i) Banking book activity for the reporting period 41
12k Banking book exposures retained or purchased 42
12l (i) Banking book exposure by risk weighting 43
12l (ii) Banking book exposure deducted entirely from capital 44
12m Banking book exposures subject to early amortisation 44
12n Banking book resecuritisation exposures 44
For
per
sona
l use
onl
y
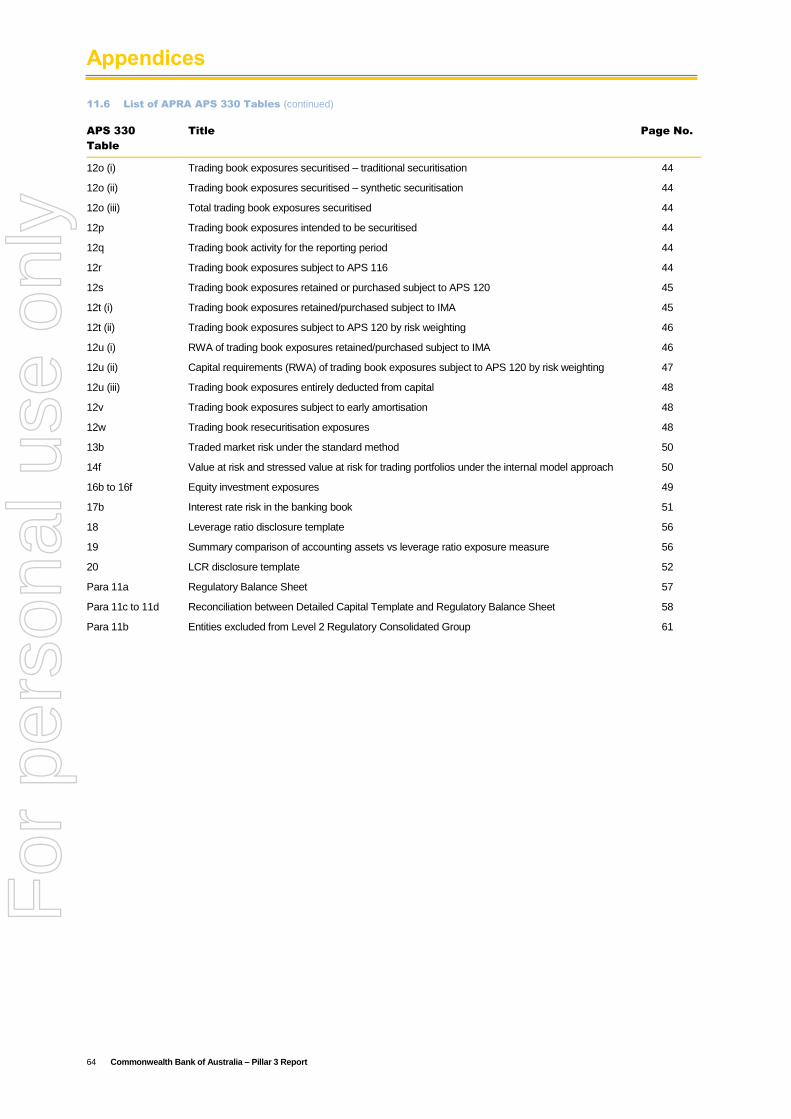
Appendices
64 Commonwealth Bank of Australia – Pillar 3 Report
11.6 List of APRA APS 330 Tables (continued)
APS 330
Table
Title Page No.
12o (i) Trading book exposures securitised – traditional securitisation 44
12o (ii) Trading book exposures securitised – synthetic securitisation 44
12o (iii) Total trading book exposures securitised 44
12p Trading book exposures intended to be securitised 44
12q Trading book activity for the reporting period 44
12r Trading book exposures subject to APS 116 44
12s Trading book exposures retained or purchased subject to APS 120 45
12t (i) Trading book exposures retained/purchased subject to IMA 45
12t (ii) Trading book exposures subject to APS 120 by risk weighting 46
12u (i) RWA of trading book exposures retained/purchased subject to IMA 46
12u (ii) Capital requirements (RWA) of trading book exposures subject to APS 120 by risk weighting 47
12u (iii) Trading book exposures entirely deducted from capital 48
12v Trading book exposures subject to early amortisation 48
12w Trading book resecuritisation exposures 48
13b Traded market risk under the standard method 50
14f Value at risk and stressed value at risk for trading portfolios under the internal model approach 50
16b to 16f Equity investment exposures 49
17b Interest rate risk in the banking book 51
18 Leverage ratio disclosure template 56
19 Summary comparison of accounting assets vs leverage ratio exposure measure 56
20 LCR disclosure template 52
Para 11a Regulatory Balance Sheet 57
Para 11c to 11d Reconciliation between Detailed Capital Template and Regulatory Balance Sheet 58
Para 11b Entities excluded from Level 2 Regulatory Consolidated Group 61
For
per
sona
l use
onl
y
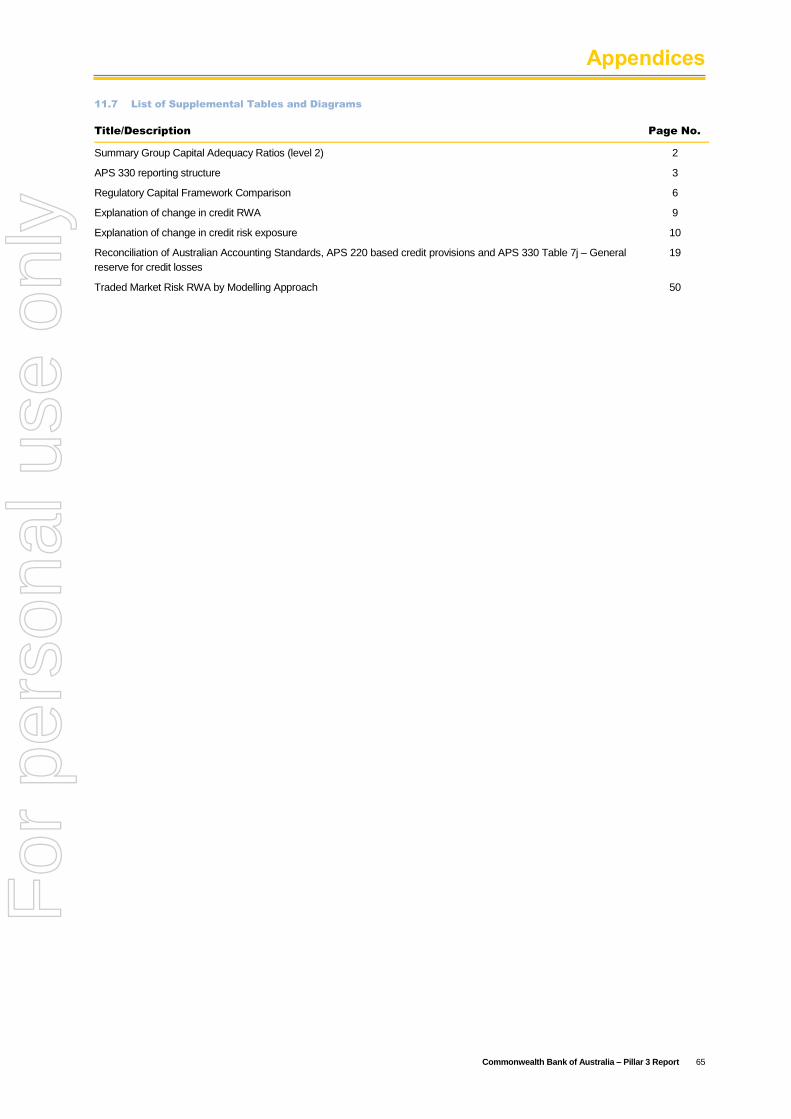
Appendices
Commonwealth Bank of Australia – Pillar 3 Report 65
11.7 List of Supplemental Tables and Diagrams
Title/Description Page No.
Summary Group Capital Adequacy Ratios (level 2) 2
APS 330 reporting structure 3
Regulatory Capital Framework Comparison 6
Explanation of change in credit RWA 9
Explanation of change in credit risk exposure 10
Reconciliation of Australian Accounting Standards, APS 220 based credit provisions and APS 330 Table 7j – General
reserve for credit losses
19
Traded Market Risk RWA by Modelling Approach 50
For
per
sona
l use
onl
y
Appendices
66 Commonwealth Bank of Australia – Pillar 3 Report
11.8 Glossary
Term Definition
Additional Tier 1 Capital Additional Tier 1 Capital is a Basel III defined concept and consists of high quality capital that essentially
includes providing a permanent and unrestricted commitment of funds, is freely available to absorb
losses, ranks behind the claims of depositors and other more senior creditors in the event of a wind-up,
and provides for fully discretionary capital distributions.
Australian Accounting
Standards
The Australian Accounting Standards as issued by the Australian Accounting Standards Board.
Authorised Deposit-taking
Institution (ADI)
Includes banks, building societies and credit unions which are authorised by APRA to take deposits from
customers.
Advanced Internal Ratings
Based (AIRB) Approach
Used to measure credit risk in accordance with the Group’s Basel III accreditation that allows the Group
to use internal estimates of PD, LGD and EAD for the purposes of calculating regulatory capital.
Advanced Measurement
Approach (AMA)
Used to measure operational risk in accordance with the Group’s Basel III accreditation that allows the
Group to use its own internal model for the purposes of calculating regulatory capital.
Australian Prudential
Regulation Authority (APRA)
The regulator of banks, insurance companies and superannuation funds, credit unions, building societies
and friendly societies in Australia.
ADI Prudential Standards
(APS)
APRA’s ADI Prudential Standards. For more information, refer to the APRA web site.
ASB ASB Bank Limited – a subsidiary of the Commonwealth Bank of Australia that is directly regulated by the
Reserve Bank of New Zealand.
Bank Basel asset class – includes claims on ADIs and overseas banks.
Basel II Refers to the Basel Committee on Banking Supervision’s Revised Framework for International
Convergence of Capital Measurement and Capital Standards issued in June 2006 and as subsequently
amended.
Basel III Refers to the Basel Committee on Banking Supervision’s framework for more resilient banks and
banking systems issued December 2010 (revised June 2011) and Capital requirements for bank
exposures to central counterparties (July 2012).
CBA Commonwealth Bank of Australia – the head entity of the Group.
Central counterparty (CCP) A clearing house that interposes itself between counterparties to contracts traded in one or more
financial markets, thereby ensuring the future performance of open contracts.
Committed Liquidity Facility
(CLF)
The Reserve Bank of Australia (RBA) provides the CLF to participating ADIs under the LCR, as a
shortfall in Commonwealth government and Semi-government securities exists in Australia. ADIs can
draw under the CLF in a liquidity crisis against qualifying securities pledged to the RBA. The amount of
the CLF for each ADI is set by APRA annually.
Common Equity Tier 1
(CET1) Capital
The highest quality of capital available to the Group reflecting the permanent and unrestricted
commitment of funds that are freely available to absorb losses. It comprises ordinary share capital,
retained earnings and reserves less prescribed deductions.
Collective Provision All loans and receivables that do not have an individually assessed provision are assessed collectively
for impairment. The collective provision is maintained to reduce the carrying value of the portfolio of
loans to their estimated recoverable amounts. These provisions are as reported in the Group’s Financial
Statements in accordance with the Australian Accounting Standards (AASB 139 “Financial Instruments:
Recognition and Measurement”).
Corporate Basel asset class – includes commercial credit risk where annual revenues exceed $50 million.
Credit Valuation Adjustment
(CVA) Risk
The risk of mark-to-market losses related to deterioration in the credit quality of a derivative
counterparty.
For
per
sona
l use
onl
y
Appendices
Commonwealth Bank of Australia – Pillar 3 Report 67
11.8 Glossary (continued)
Term Definition
Exposure at Default (EAD) The extent to which a bank may be exposed upon default of an obligor.
External Credit Assessment
Institution (ECAI)
For example Moody’s, Standard & Poor’s or Fitch.
Extended Licenced Entity
(ELE)
APRA may deem an entity of an ADI to be part of the ADI itself for the purposes of measuring the ADIs
exposures to related entities.
General Reserve for Credit
Losses (GRCL)
APS 220 requires the Group to establish a reserve that covers credit losses prudently estimated, but not
certain to arise, over the full life of all individual facilities making up the business of the ADI. Most of the
Group’s collective provisions are included in the General Reserve for Credit Losses. An excess of
required General Reserve for Credit Losses over the Group’s collective provisions is recognised as a
deduction from CET1.
Individual Provisions Provisions made against individual facilities in the credit-rated managed segment where there is
objective evidence of impairment and full recovery of principal and interest is considered doubtful. These
provisions are as reported in the Group’s Financial Statements in accordance with the Australian
Accounting Standards (AASB 139 “Financial Instruments: Recognition and Measurement”). Also known
as individually assessed provisions or IAP.
Interest Rate Risk in the
Banking Book (IRRBB)
The risk that the Bank’s profit derived from Net Interest Income (interest earned less interest paid), in
current and future periods, is adversely impacted from changes in interest rates. This is measured from
two perspectives; firstly by quantifying the change in the net present value of the Balance Sheet’s future
earnings potential and secondly, as the anticipated change to the Net Interest Income earned over 12
months. The APS117 IRRBB regulatory capital requirement is calculated using the net present value
approach.
Level 1 Represents the ADI and each entity of the ADI that has been approved as an extended licence entity by
APRA.
Level 2 The level at which the Group reports its capital adequacy to APRA being the consolidated banking group
comprising the ADI and all of its subsidiary entities other than the insurance and funds management
entities and entities through which securitisation of Group assets is conducted. This is the basis on
which this report has been produced.
Level 3 The conglomerate group including the Group’s insurance and wealth management business.
Leverage Ratio Tier 1 Capital divided by Total Exposures, with this ratio expressed as a percentage.
Liquidity Coverage Ratio
(LCR)
The LCR is a quantitative liquidity measure that is part of the Basel III reforms. It was implemented by
APRA in Australia on 1 January 2015. It requires Australian ADIs to hold sufficient liquid assets to meet
30 day net cash outflows projected under an APRA-prescribed stress scenario.
Loss Given Default (LGD) The fraction of EAD that is not expected to be recovered following default.
Net Cash Outflows Net cash outflows in the LCR are calculated by applying prescribed run-off factors on liabilities and
various Off Balance Sheet exposures that can generate a cash outflow in the next 30 days.
Other Assets Basel asset class – primarily includes Cash, Investments in Related Entities, Fixed Assets and Margin
Lending.
Other Retail Basel asset class – primarily includes retail credit exposures not otherwise classed as a residential
mortgage, SME retail or a qualifying revolving retail asset.
Probability of Default (PD) The likelihood that a debtor fails to meet an obligation or contractual commitment.
Qualifying Revolving Retail
(QRR)
Basel asset class – represents revolving exposures to individuals less than $0.1m, unsecured and
unconditionally cancellable by the Group. Only Australian retail credit cards qualify for this AIRB asset
class.
For
per
sona
l use
onl
y
Appendices
68 Commonwealth Bank of Australia – Pillar 3 Report
11.8 Glossary (continued)
Term Definition
Residential Mortgage Basel asset class – retail exposures secured by residential mortgage property.
RBA Reserve Bank of Australia.
RBNZ Reserve Bank of New Zealand.
Risk Weighted Assets (RWA) The value of the Group’s On and Off Balance Sheet assets are adjusted by risk weights calculated
according to various APRA prudential standards. For more information, refer to the APRA web site.
Scaling Factor In order to broadly maintain the aggregate level of capital in the global financial system post
implementation of Basel II, the Basel Committee on Banking Supervision applies a scaling factor to the
risk weighted asset amounts for credit risk under the IRB approach of 1.06.
Securitisation Basel asset class – Group-originated securitised exposures and the provision of facilities to customers in
relation to securitisation activities.
SME Corporate Basel asset class – Small and Medium Enterprise (SME) commercial credit risk where annual revenues
are less than $50 million and exposures are greater than $1 million.
SME Retail Basel asset class – Small and Medium Enterprise (SME) exposures up to $1 million that are not secured
by residential mortgage property.
SME Retail Secured by
Residential Mortgage
Small and Medium Enterprise (SME) exposures up to $1 million that are partly or fully secured by
residential mortgage property.
Sovereign Basel asset class – primarily includes claims on Australian and foreign governments, central banks
(including Reserve Bank of Australia), international banking agencies and regional development banks.
Specialised Lending Basel asset classes subject to the supervisory slotting approach and which include Income Producing
Real Estate (IPRE), object finance, project finance and commodity finance.
Specific Provisions APS 220 requires ADIs to report as specific provisions all provisions for impairment assessed by an ADI
on an individual basis in accordance with the Australian Accounting Standards and that portion of
provisions assessed on a collective basis which are deemed ineligible to be included in the General
Reserve for Credit Losses (which are primarily collective provisions on some defaulted assets).
Stress VAR
Stressed Value at Risk uses the same methodology as Value at Risk (VaR) except that the historical
data used is taken from a one year observation period of significant market volatility as seen during the
Global Financial Crisis.
Tier 1 Capital Comprises CET1 and Additional Tier 1 Capital.
Tier 2 Capital Capital items that fall short of the necessary conditions to qualify as Tier 1 Capital.
Total Exposures (as used in
the Leverage Ratio)
The sum of On Balance Sheet items, derivatives, securities financing transactions (SFTs), and Off
Balance Sheet items, net of any Tier 1 regulatory deductions that are already included in these items, as
outlined in APS 110 “Capital Adequacy” (APS 110) Attachment D.
For
per
sona
l use
onl
y