Embed Size (px)
Citation preview

Corporate Presentation
Fortescue Metals Group LtdOctober 2012
For
per
sona
l use
onl
y

Important NoticeThe purpose of this presentation is to provide general information about Fortescue Metals Group Ltd ("Fortescue"). It is not recommended that any person makes any investment decision in relation to Fortescue based on this presentation.
This presentation contains certain statements which may constitute "forward-looking statements". Such statements are only predictions and are subject to inherent risks and uncertainties which could cause actual values, results, performance or achievements to differ materially from those expressed, implied or projected in any forward-looking statements.
No representation or warranty, express or implied, is made by Fortescue that the material contained in this presentation will beachieved or prove to be correct. Except for statutory liability which cannot be excluded, each of Fortescue, its officers, employees and advisers expressly disclaims any responsibility for the accuracy or completeness of the material contained in this presentation and excludes all liability whatsoever (including in negligence) for any loss or damage which may be suffered by any person as a consequence of any information in this presentation or any error or omission therefrom. Fortescue accepts no responsibility to update any person regarding any inaccuracy, omission or change in information in this presentation or any other information madeavailable to a person nor any obligation to furnish the person with any further information.
Additional InformationThis presentation should be read in conjunction with the Annual Financial Report as at 30 June 2012, the half year financial statements together with any announcements made by Fortescue in accordance with its continuous disclosure obligations arisingunder the Corporations Act 2001.
All amounts within this presentation are stated in United States Dollars consistent with the Functional Currency of the Fortescue Metals Group Limited.
Tables contained within this presentation may contain immaterial rounding differences.
Disclaimer
2
For
per
sona
l use
onl
y

The Fortescue storyWorld’s 4th biggest seaborne exporter
Strong culturedelivers record results
57.5mtrecord shipped in FY2012
Top 25 ASX listed company
mtpacurrentrun rate
12bt resource
Target run rate
155mtpa
3
For
per
sona
l use
onl
y

See our operations in the PilbaraCorporate DVD
4
For
per
sona
l use
onl
y

A differentiated modelDelivering results
CultureFortescue’s unique culture is the key
RelationshipsDirect relationships with sub contractors and local suppliers
ChinaLeveraging China’s growth and manufacturing capability
SpeedSpeed of delivery – time is money
Planning Planning for scale today and efficiency into the future
5
For
per
sona
l use
onl
y

6
2012 in review
For
per
sona
l use
onl
y

7
Operations, 30%+ growth across all areasContinuing growth trajectory over FY13
Mining Processed Port
Ore Mined (wmt) Ore Processed (wmt) Total Ore Shipped (wmt)
0.0
10.0
20.0
30.0
40.0
50.0
60.0
70.0
FY09 FY10 FY11 FY120.0
10.0
20.0
30.0
40.0
50.0
60.0
FY09 FY10 FY11 FY120.0
10.0
20.0
30.0
40.0
50.0
60.0
FY09 FY10 FY11 FY12
46% 33% 41%
Mill
ion
tonn
es
Mill
ion
tonn
es
Mill
ion
tonn
es
For
per
sona
l use
onl
y

Financial highlightsRecord FY12 performance
Fortescue tonnes shipped up 38% yoy
Revenues up 23% yoy
C1 average
EBITDA up 14% yoy
NPAT up 53%
fully franked dividend
55.8mt $6.7bn $48/wmt$3bn$1.6bnA$0.08
8
For
per
sona
l use
onl
y

9
EBITDA analysis
9
• Volume benefits offset by lower index prices• Higher costs from Christmas Creek ramp up, strip ratio and strong AUD
EBITDA Variance (US$m)
For
per
sona
l use
onl
y
10
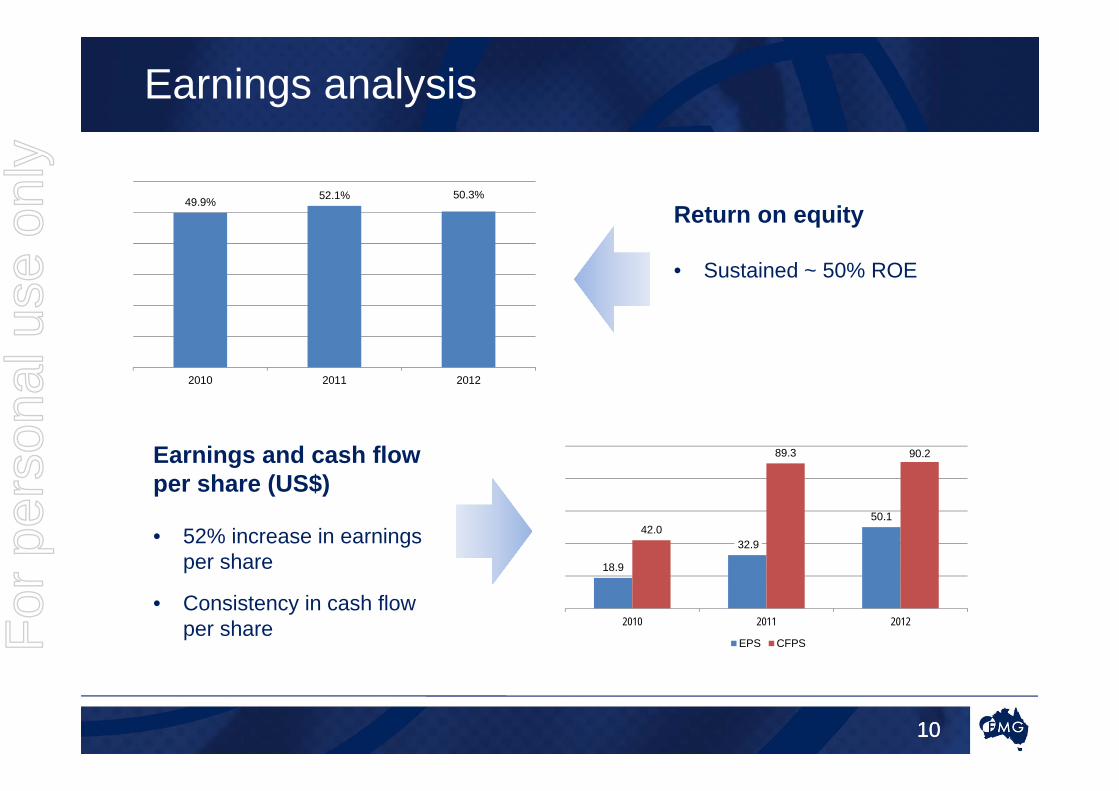
Earnings analysis
10
Return on equity
• Sustained ~ 50% ROE
Earnings and cash flow per share (US$)
• 52% increase in earnings per share
• Consistency in cash flow per share
18.9
32.9
50.142.0
89.3 90.2
2010 2011 2012
EPS CFPS
49.9% 52.1% 50.3%
2010 2011 2012
For
per
sona
l use
onl
y

11
Expansion facilities structured for flexibility
• Diversification of funding sources and maturity profiles• Early call options provide repayment flexibility
$750$600
$2,040
$600
$154
$1,000$900
$99 $100
$1,500
$1,000
$750
$866
$490
0
500
1000
1500
2000
2500
US$
m
CY2012 CY2013 CY2014 CY2015 CY2016 CY2017 CY2018 CY2019 CY2020 CY2021 CY2022
* Note the Master Finance Lease and Export Credit facilities amortises straight line to maturity
CAPEX Term Loan Revolving Credit Facility Senior Unsecured Note Unsecured Loan Note Preference Shares Master Lease Facility* Export Credit Facility*
For
per
sona
l use
onl
y
12
Market
For
per
sona
l use
onl
y

13
Iron Ore Price (62% Fe CFR – Platts IODEX China)
$80.00
$100.00
$120.00
$140.00
$160.00
$180.00
$200.00
Jul-1
0
Aug
-10
Sep
-10
Oct
-10
Nov
-10
Dec
-10
Jan-
11
Feb-
11
Mar
-11
Apr
-11
May
-11
Jun-
11
Jul-1
1
Aug
-11
Sep
-11
Oct
-11
Nov
-11
Dec
-11
Jan-
12
Feb-
12
Mar
-12
Apr
-12
May
-12
Jun-
12
Jul-1
2
Aug
-12
Sep
-12
History shows price volatilityStrong rebounds follow price drops
For
per
sona
l use
onl
y
14
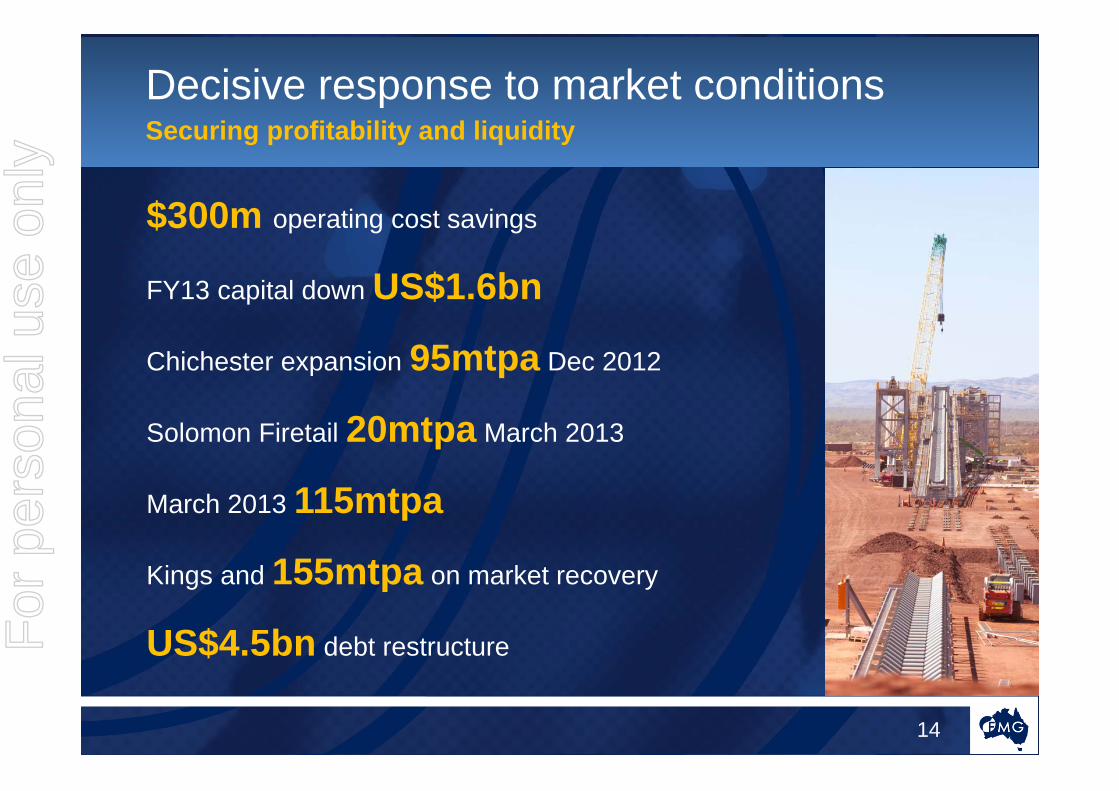
Decisive response to market conditionsSecuring profitability and liquidity
$300m operating cost savings
FY13 capital down US$1.6bn
Chichester expansion 95mtpa Dec 2012
Solomon Firetail 20mtpa March 2013
March 2013 115mtpa
Kings and 155mtpa on market recovery
US$4.5bn debt restructureFor
per
sona
l use
onl
y

15
Fortescue cost per tonne 155mtpa $55*
Chinese cost curve to support pricesWith Fortescue products at lower end of cost curve
Source: Metalytics prepared March 2012
Cumulative mt (wet, as delivered)
US$
/dry
tonn
e C
FR e
quiv
alen
t
200
150
100
50
0
0 100 200 300 400 500 600 700 800 900 1,000
Domestic Chinese Ore
Australia
Brazil
India
South Africa
Other
Firetail cost per tonne $40*
* Estimated C1 costs at full production
For
per
sona
l use
onl
y

16
C1 costDecreasing cost profile
* Estimated C1 costs at full production^ C1 costs estimated from Metalytics industry US$/dry tonne CFR equivalent analysis
0
5
10
15
20
25
30
35
40
45
50
Fortescue Firetail* RIO^ BHP^ Vale^
$/wmt
Industry leaders^
For
per
sona
l use
onl
y
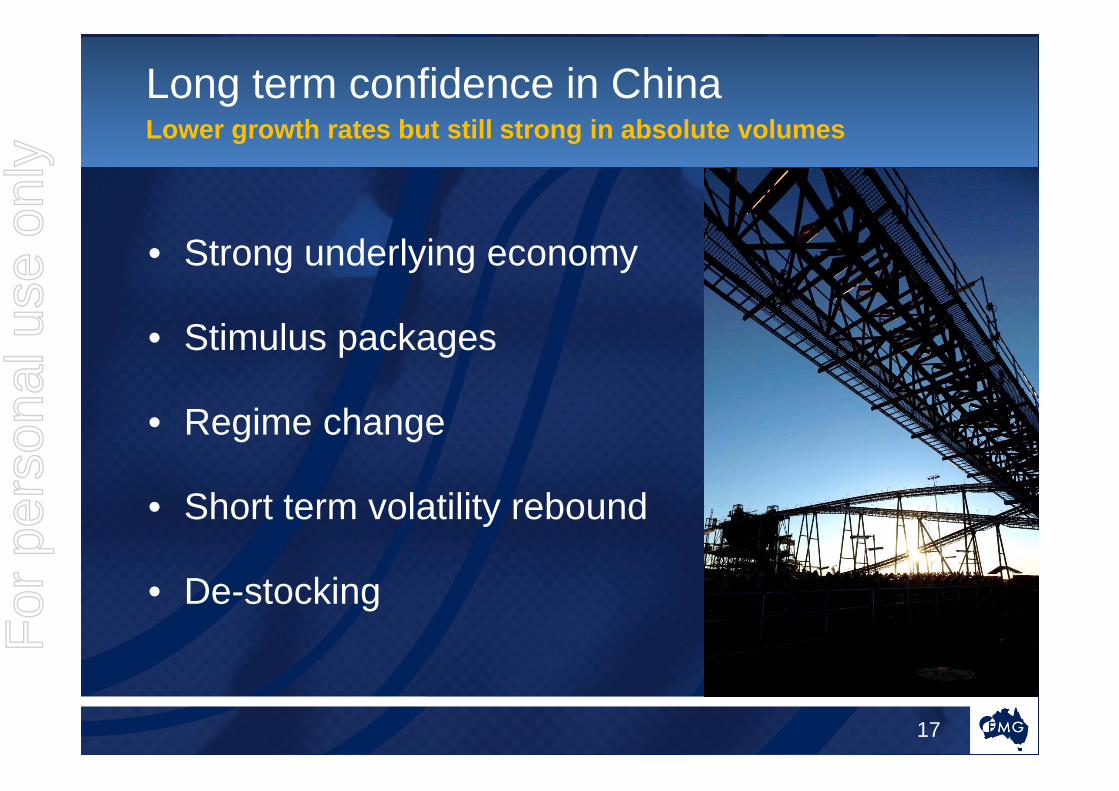
Long term confidence in ChinaLower growth rates but still strong in absolute volumes
• Strong underlying economy
• Stimulus packages
• Regime change
• Short term volatility rebound
• De-stocking
17
For
per
sona
l use
onl
y

18
Additional approvals
7 port and channel projects
13 highway projects
10 urban waste plant projects
Stimulus package announcedApproves US$157 billion infrastructure projects
urban railway projectsUS$133 billion
25Near term steel
consumption growth
infrastructure and urbanisation
For
per
sona
l use
onl
y

19
Expansion and Development
For
per
sona
l use
onl
y

2020
The quarterly milestone calendarForging ahead
Christmas Creek 2nd OPF
Train unloadersSolomon Firetail
115mtpa run rate
DEC QTR
SEP QTR
MAR QTR
JUN QTR
FY2013
For
per
sona
l use
onl
y

Financial strength will follow expansionCashflow will be harnessed for financial de-risking
Strong operations:• Expanded product range
• Low Solomon Strip Ratio < 2 : 1
• Target Solomon C1 cost of US$25 - 30/wmt*
• C1 cost in lowest 1/3rd of global cost curve
• Economies of scale + productivity gains hold wages inflation
Strong balance sheet:• Gearing reduction to follow production ramp up
• Preferred gearing range 30 – 40% by FYE14
• Balance sheet flexibility
* Assumes parity exchange rate.
21
For
per
sona
l use
onl
y
22
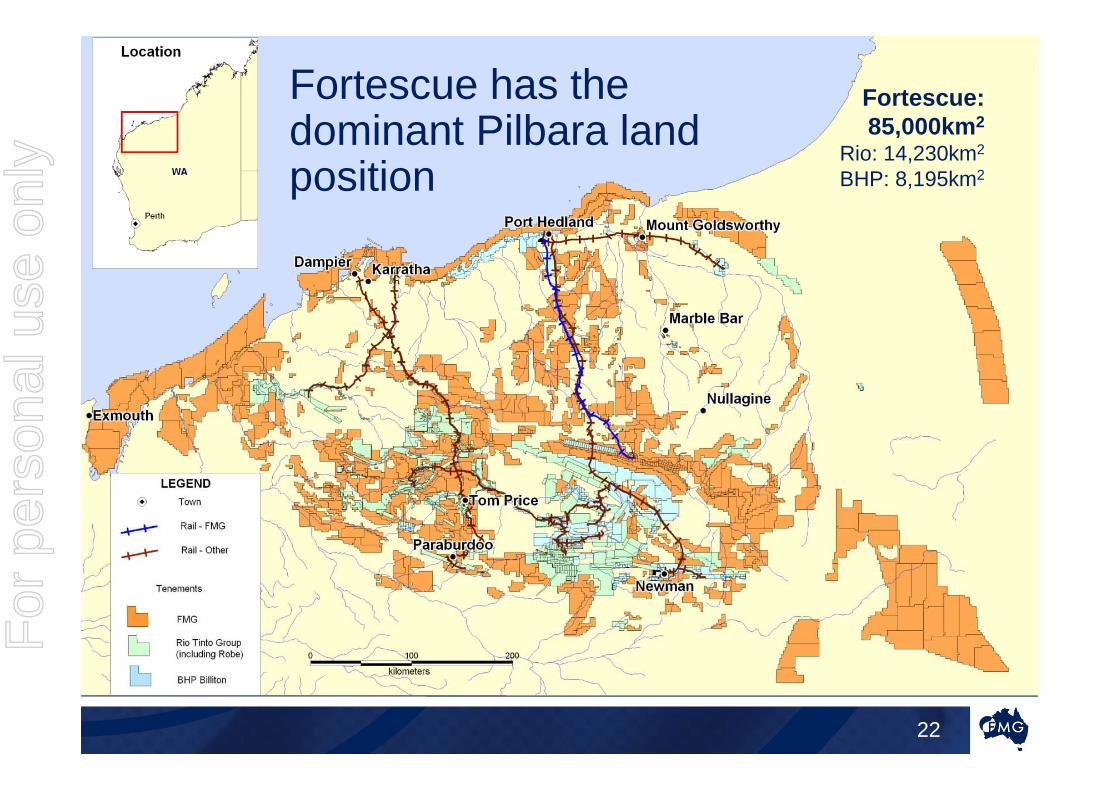
Fortescue has the dominant Pilbara land position
Fortescue: 85,000km2
Rio: 14,230km2
BHP: 8,195km2
For
per
sona
l use
onl
y

23
Fortescue
23
Flexible design for future growthFifth berth approved
* 120mtpa allocated priority capacity
For
per
sona
l use
onl
y

2424
2,266 2,227 2,143 2,550 2,550
695 695 695 695 6951,715 2,224 2,860
3,070 3,070
624 6241,032
2,013
1,2301,230
2,465
3,236
0
2,000
4,000
6,000
8,000
10,000
12,000
14,000
2008 2009 2010 2011 2012
Min
eral
Res
ourc
es (M
t)
Fiscal Year Chichester Hub Chichester Other Solomon Hub Western Hub Nyidinghu Magnetite
1.5btAnnualised growth of
per annum
Resource portfolio sets expansion platformTo leverage existing assets for low cost growth
• Supports low cost Brownfield opportunities at both the Chichester and Solomon Hubs
For
per
sona
l use
onl
y

Deleverage following expansion
Expansion to 155mtpa
Strong FY2012 results
Building one of the world’s great resourcecompanies
Unique culture drives performance
Flexible growth pipeline
25
For
per
sona
l use
onl
y

26
Low cost brownfield expansion opportunities
Potential 10mtpa Chichester expansion
Low capital intensity ~US$20/t at the mine
OPF mods, debottlenecking, stockyard upgrades
Solomon brownfield opportunities to be investigated post Kings completion
For
per
sona
l use
onl
y

2727
Further low Phos opportunities in the East Chichester
• Existing resource and large exploration potential – Mt Lewin and Tongololo• Low Phos ore to support blending options
20 km
MappedMapped mineralisation
Resource outline
Proposed drilling
For
per
sona
l use
onl
y

Proudly supporting:
Sign up to alerts online:
www.fmgl.com.au
For
per
sona
l use
onl
y