Embed Size (px)
Citation preview

For
per
sona
l use
onl
y

Contents
1 Chairman and Managing Director’s Review
6 Providing customers with global reach
8 Corporate Social Responsibility
10 Board of Directors
Toll Group structure and Senior Management
13 Directors’ Report
39 Corporate Governance Statement
49 Income Statements
50 Statements of Recognised Income and Expenses
51 Balance Sheets
52 Statements of Cash Flows
53 Notes to the Financial Statements
130 Directors’ Declaration
131 Independent Audit Report
133 Shareholder Information
134 Ten Year Summary
For
per
sona
l use
onl
y

TOLL – ANNUAL REPORT 2008 1
It’s been another big year for the Toll Group. In the last 12 months,
we have restructured the company into three major operating divisions,
reduced our exposure to Virgin Blue Australia (VBA) through a special
in specie dividend, sold our New Zealand rail and ferry operations back
to the New Zealand government and achieved another year of strong
underlying organic revenue and earnings growth for continuing business
operations across the Group. As we look forward to the coming year we
are very excited by what we see ahead: our core Australian business is
extremely sound, our Asian businesses are growing, our powerful organic
growth engine remains strong, and new business wins across the Group
are solid and consistent. But before we discuss this in more detail, let’s
briefl y recap the past year.
Following our decision to distribute our stake in Virgin Blue
Australia on a 1 for 1 basis to shareholders by way of a special
in specie dividend, we booked a one-off non-cash charge to the
current year’s profi t of approximately $1.2 billion.
When offset by adjustments including the $225 million gain from
the sale of the New Zealand rail and ferry operations, and the
year’s underlying net profi t fi gure of $258 million, the net effect
is an after tax reported loss of $694.7 million for the 2007-08
fi nancial year.
However, when we focus on the company’s annual earnings for
the continuing business operations of the Group, the strength
of Toll’s performance is clear — across the Group all our key
measures are up, core operations are strong and vibrant, and
the story we have to tell is a good one.
Our 2007-08 revenue grew from $4.86 billion to $5.60 billion,
an increase of 15 percent; EBITDA grew from $471 million to
$570 million, a rise of 21 percent; EBIT grew from $365 million
to $429 million, an increase of 18 percent; and our normalised
net profi t after tax for continuing operations increased 24 percent
to $258 million.
Shareholder returns from continuing operations were
likewise strong: on a like-for-like basis our EPS (fully diluted)
was 42.7 cents per share compared to 35.5 cents per share
for the previous year, and the fi nal full-year dividend was
25 cents per share.
Of course, a feature of Toll’s powerful and unique business
model is the consistent generation of strong cash fl ow, and
this last year was no exception. In 2007-08, our net cash from
DEAR FELLOW INVESTOR,
CHAIRMAN AND MANAGING DIRECTOR’S REVIEWF
or p
erso
nal u
se o
nly

2
continuing operations was $496 million. Compellingly, our ‘unique
integrated logistics model’ has allowed us to generate signifi cant
cash fl ow over the past fi ve years — an undeniable barometer
of Toll’s fi nancial strength.
This impressive cash fl ow profi le has again enabled us to grow
the business through strategic acquisitions and focused capital
expenditure. In the last 12 months, we have spent $796 million
acquiring new businesses that broaden the scale and capabilities
of our evolving and unique global supply chain model, taking our
acquisition tally to over 63 in the last 22 years.
Capital expenditure topped $380 million for the year with the
key areas of focus being new facilities, technology and fl eet
upgrades.
Equally important is the strength of our balance sheet, and
we are pleased to tell you it’s in great shape: total assets exceed
$4.8 billion, net debt is a very manageable $650 million and total
equity is $2.1 billion. We have a gearing ratio of only 24 percent
and interest cover is very strong at around 12 times.
Add it all up, and the company is fi nancially strong,
underpinned by consistent organic growth and in a very powerful
position to take advantage of any new strategic opportunities.
As we have said before in previous annual reports, achieving
such results over one, two or even fi ve years as many great
companies have done, is not really that unique. What’s gratifying
is to achieve consistent underlying performance over long
periods and through different economic cycles. It’s precisely this
point of consistent underlying performance over long periods
through differing economic cycles that is an important part of
any discussion today, and as Toll enters this new fi nancial year
with momentum, some are asking whether the fl uctuating global
economic factors are going to affect us going forward?
This is a legitimate question: certainly future economic conditions
are not easy to predict, and there are many factors that will
always be beyond our control, but Toll is a company with a clear
strategic vision, a powerful and time-tested business model,
driven by an enthusiastic group of energised people, and
if you don’t read any further in this annual report, know this,
Toll is in great shape and excited by the opportunities ahead.
To help you better understand the sources of our confi dence
let’s look at the key points in a little more detail.
First, we’ve greatly simplifi ed the structure of the business
following the in specie VBA dividend and sale of the New
Zealand rail and ferry assets, and established three operating
divisions — Australia and New Zealand Integrated Transport
and Logistics, Toll Asia Contract Logistics and Toll Global
Forwarding. Second, we’re exceptionally strong fi nancially,
with powerful cash fl ows, solid growth in underlying EBIT
margins and a balance sheet the envy of many. Third, we’re
very well positioned in the key trade markets of the Asian
region, where trade has never been stronger. Fourth, we’re
generating revenue from a diversifi ed range of strong industry
sectors across our extensive geographic markets. Fifth, we’re
insulated against rising fuel costs and have most contracts
structured around effective fuel recovery surcharges, proven
and tested to minimise increasing costs to Toll. And sixth,
we’re underpinned by strong, consistent organic growth,
a cornerstone of Toll’s year-on-year revenue story.
Put it all together, and we’re talking powerful competitive
advantages in uncertain economic times, and the foundations
of our confi dence about what lies ahead for Toll and our three
new operating divisions.
1. Australia and New Zealand Integrated Transport
and Logistics is the largest of the three divisions, contributing
over 80 percent of the Group’s revenue and EBIT, and on a
comparable basis for continuing operations, trading results
for 2007-08 were excellent.
0
1
2
3
4
5
65.6
05 06 07 08
0
100
200
300
400
500
429
05 06 07 08
0
100
200
300
400
500
600 570
05 06 07 08
REVENUE*Billion dollars
EBIT*Million dollars
EBITDA*Million dollars
CHAIRMAN AND MANAGING DIRECTOR’S REVIEWF
or p
erso
nal u
se o
nly

TOLL – ANNUAL REPORT 2008 3
Revenue from Australian operations grew 9.2 percent to
$4.42 billion, EBIT grew 18 percent from $294 million to
$347 million, and EBIT margins maintained the powerful
upward trends of prior years, increasing from 7.21 percent
to 7.84 percent.
These are fi rst-class results, and signifi cantly organic growth
again played a starring role. There is no doubt, organic growth
is one of Toll’s most powerful growth engines, confi rming year-
on-year just how much more business our customers continue
to bring us.
Highlights for the year were many, including the fi nalisation
of the long-term domestic freight operations agreement with
Virgin Blue, the winning of signifi cant new contracts in retail,
mining and automotive, the establishment of Toll Dnata, our
aviation logistics joint venture with Emirates, the transferral
of the Jetcare maintenance facilities to Virgin Blue and the
continuation of the integration and rationalisation of the
ex-Patrick warehousing and logistics activities.
We also acquired a number of smaller businesses including
Victorian Express, Westrans, Extra Transport, Golden Riverland
Express, SkyNet Worldwide Express and the Western Australian-
based, Courier Australia to expand and grow our capabilities.
Across the Tasman, New Zealand continued to perform well.
Revenue was NZ$255 million, up from NZ$234 million, with
EBIT substantially increasing from NZ$7.3 million to the
NZ$9.4 million for the year. These are very good results in
what can only be considered a fl at economy and we are keen
to grow our presence in New Zealand.
Following the sale of the rail and ferry operations, the focus
in New Zealand is fi rmly on contract logistics and road and rail
forwarding, leveraging our scale and volume to generate the
lowest possible linehaul cost to strengthen our position in the
higher-value spaces of supply chain management. That’s why
we continue to build our services, and the recent acquisition
of United Carriers, one of Northland’s largest freight companies
with annual sales of NZ$40 million, is an example of our
ongoing commitment. Expect to see more acquisition activity
from Toll in New Zealand’s freight forwarding sector, as we
reaffi rm our commitment to this important market.
A major strength of Toll’s business model in our core Australian
and New Zealand markets, especially in uncertain economic
times, is the level of diversifi cation of our customer base and
the industry sectors in which we operate. This is an important
point, for there is the mistaken belief that we are signifi cantly
exposed to a slowdown in discretionary spend, and while there
is a general softening in the economy, we believe, Toll is well
insulated to minimise any effects.
We compete in a number of key dynamic market sectors, the
majority of which are pretty resilient. For example, 80 percent of
our Australian retail and Fast Moving Consumer Goods (FMCG)
business is non-discretionary, defence and government spending
remains strong, the mining and resources sector is booming,
automotive is still performing, and the steel and industrial sector
is powering ahead, exporting to Asia and beyond. The exception
to the rule is the manufacturing sector, where the obvious
slowdown in the local market is countered in many cases, by
moves to offshore production. Of course, with our signifi cant and
ever expanding presence in the Asian region we don’t greatly
suffer, as we benefi t from this growing two-way trade as well.
Add to that the fact that our top 20 sector customers represent
less than 30 percent of the Group’s total revenue, and Toll’s
business model is best regarded as highly sustainable in both
good times and bad.
But we have another core strength, one that is increasingly
playing a pivotal role in differentiating Toll’s unique competitive
advantages, and that’s our diverse and integrated multi-modal
operational profi le. Providing more fl exibility and greater
diversity in end-to-end supply chain solutions, customers can,
for example, now trade-off service for price, shifting from road
0
1
2
3
4
5
6
7
8 7.65
05 06 07 08
EBIT MARGIN*Percent
* Continuing operations for years 2007, 2008Adjusted to refl ect continuing operations post restructure following sale of New Zealand rail and ferry operations and demerger of Virgin Blue Australia.
TOTAL ORDINARY DIVIDENDSMillion dollars
0
50
100
150
200
161.6
05 06 07 08
For
per
sona
l use
onl
y

4
to rail, air express to road express or rail to sea. Not only do
our customers have more choice, but this collective multi-modal
approach presents Toll with huge cross-selling opportunities,
driving greater sector revenues and improved EBIT margins
throughout the Group.
In summary, our core Australian market is extremely strong and
stable. We see no reason for increased concern in the coming
year, and in fact, we look forward to the opportunities ahead.
Now, let’s turn our attention to our expanding Asian businesses.
We have moved quickly in the last few months to consolidate
and unify our growing and powerful collection of Asian logistics
assets under the Toll brand, an essential move for a company
that today does business in over 45 countries and enjoys an
increasingly broad-based geographic distribution of revenue.
2. Toll Asia Contract Logistics, the second of our three
divisions, is of course, the amalgamation of our 2006
acquisition of SembCorp Logistics, and our October 2007
takeover of Sembawang Kimtrans, the Singapore-based
integrated logistics and marine transportation specialist.
With a new management structure and the appointment
of Wayne Hunt, a long-standing and senior Toll executive,
as CEO, Toll Asia performed very well in 2007-08. Revenues
were S$777 million compared to S$563 million for the year
previous; EBIT increased 12 percent, from S$73 million to
S$82 million. On a like-for-like basis, and excluding the impact
of the Sembawang Kimtrans acquisition, underlying revenue
grew 12.5 percent, driven in part by excellent growth in
offshore marine and mining logistics operations, government
defence logistics, and major contract wins or renewals for
customers like Yamaha, Hawley and Hazel, Pfi zer, St Medical,
Samsung, Proctor & Gamble, Coca-Cola Amatil, Johnson &
Johnson, Michelin and Nestlé. This strong growth in underlying
revenue is an important point, for it is a clear indication of
Toll’s increasing momentum in Asia.
We’re also investing in key assets. Take SOPS (Singapore
Offshore Petroleum Services), our offshore oil and gas logistics
division, for example. Strategically headquartered at the
sprawling 52 hectare Loyang Offshore Supply Base — and
home to nearly 200 established oil and gas services-related
companies and the region’s integrated offshore logistics
hub — SOPS is at the very heart of this one-stop resource
centre for oilfi eld services, equipment and supplies. That’s why
we’re investing signifi cant capital as part of a redevelopment
strategy and securing 40-year leases to ensure our long-term
foundations, for its potential is as much global as it is regional.
Which brings us to the third division in the Group.
3. Toll Global Forwarding has been formed as a direct response
to customers’ growing global logistics needs. It is important to
understand that customers of all kinds are increasingly making
their decisions at a regional or global level. This is being driven
by the very international nature of trade today, and in particular,
the meteoric rise of Asia as the ‘world’s factory’.
That’s why our most recent acquisitions — the Hong Kong-
based BALtrans in March 2008, and the Australian-based Gluck
in June 2008 — are strategically so very important to Toll.
With a network spanning 65 major cities across Asia, US,
Europe, Africa and the Middle East, BALtrans is one of
Asia’s largest global forwarders, adding extensive worldwide
capabilities and annual revenues of approximately $700 million
to Toll’s operations. And Gluck, whose strong, long-term
relationship with BALtrans, strategically strengthens our
Australian-Asian based freight forwarding capabilities.
We have appointed Hugh Cushing, previously Toll’s Director of
International Development, as CEO of Toll Global Forwarding, to
ensure the swift and accurate alignment of BALtrans operations
with Toll’s unique business model.
CHAIRMAN AND MANAGING DIRECTOR’S REVIEWF
or p
erso
nal u
se o
nly

TOLL – ANNUAL REPORT 2008 5
Importantly, the formation of Toll Global Forwarding means we
now have a consolidated offering across the Group, true end-to-
end international supply chain capabilities, all underpinned by
one point of contact across all operational components.
The strength and breadth of Toll’s international service
capabilities is a huge competitive advantage, and one that
fi rmly catapults Toll’s unique integrated business model into
global prominence. From this base, we can leverage not
only our scale and network capacities to drive superior cost
structures, but also our cross-group capabilities to maximise
cross-group sales and revenues.
And we’re pleased to say we’re already seeing results:
revenues and earnings are growing steadily, we’ve won
important new global freight forwarding contracts including
GMC, Shandong SEM Machinery Co., Ltd. (a Caterpillar
subsidiary), Danks, Supercheap, Spotlight and the Apparel
Group; and we’re expanding capabilities for customers like
Proctor & Gamble, Colgate, Ford and Holden.
Year-after-year, our results consistently confi rm we have the
right business model, that we are in the right businesses in the
right segments of the industry, and that we compete in one of
the most dynamic industries there is, for global trade is perhaps
the world’s most powerful economic engine.
On pages 6 to 7 of this report, you’ll see demand for logistics
in our region is supported by powerful trends — trends that are
constantly working in our favour.
Importantly, this one fact remains constant: customers continue
to outsource more and more of their logistics. We’ve said on
many occasions, our greatest opportunities for growth are right
in front of us: if we execute our business model successfully,
we earn more of our customers’ business.
This is illustrated in the strong and consistent organic growth
we experience year-in-and-year-out; in the mushrooming
internationalism of Australian business where customers are
increasingly expanding their two-way trade between Australia
and Asia; and in the growing sophistication of our intra- and
inter-Asian trade.
We believe our differentiating capabilities — our vision
of a single source for global supply chain management, our
strategy, our values, our focus on being the best at what we
do, our famous can-do attitude, and our belief in people as
a competitive advantage — are powerful drivers of strong
and profi table growth in both good times and bad.
As a result, we know that Toll has excellent opportunities in
2008 and beyond. In an environment that presents signifi cant
challenges for some, we possess signifi cant strengths: a
powerful balance sheet, signifi cant cash reserves and available
undrawn facilities, little net debt, low gearing and strong
interest cover. Our acquisition capacity is strong, and thanks to a
well-executed business model, we’re far less subject to volatility
in uncertain economic conditions. We’re in excellent shape —
and remain very optimistic about the future of our company.
In closing, we want to sincerely thank the 25,000+ Toll
people for their outstanding accomplishments and strong
results. Another great year by a truly great team! We thank
our customers for entrusting us with more of their business.
And we thank you, our owners, for your confi dence in Toll
as we begin yet another exciting year.
Ray Horsburgh AM
Chairman
Paul Little
Managing Director
For
per
sona
l use
onl
y

6
Toll’s global integration
Ten to fi fteen years ago the typical supply chain
was domestic, but today many businesses are either
directly sourcing overseas, or their suppliers are.
And more and more companies are selling their
goods in international markets.
Consequently, customers have come to realise that
if they’re going to respond rapidly and effectively
to today’s marketplace, they need to do more
to re-engineer their supply chains, and not just
domestically, but globally.
That’s why Toll’s three main areas of focus, include:
• the strong and powerful Australia and
New Zealand integrated domestic transport
and logistics business;
• Toll Asia Contract Logistics, the Asian logistics
business headquartered in Singapore; and,
• the recently created Toll Global Forwarding
business focused on international freight
forwarding and supply chain services,
headquartered in Hong Kong.
These powerful and strategically located logistics
capabilities combined with the advantages of
our formidable technical capabilities is enabling
customers to comprehensively optimise effi ciencies
in their global logistics and supply chains,
synchronising multiple partners in multiple countries
in multiple time zones. Which adds up to strong
growth for Toll.
PROVIDING CUSTOMERS
WITH GLOBAL REACH
WHERE WE DO BUSINESS IN 2008 – BY REGION
Today, Toll does business from over 700 sites in over 45 countries and enjoys an
increasingly broad-based geographic distribution of revenue. Of course, our focus is the
Asian region, the fastest growing and most dynamic logistics marketplace there is.
Why operating in high growth areas is good for Toll
Because it’s where trade happens. Countries like China, India and Vietnam are growth
markets; people are becoming consumers; they’re joining the middle class. Hundreds of
millions of people are opening their fi rst bank accounts, getting their fi rst cell phones,
using their fi rst credit cards. Tens of millions are buying their fi rst televisions, their fi rst
refrigerators and their fi rst automobiles. Now consider what has to happen to deliver all
of those people cell phones, televisions and cars. Every item has to travel through a
complex integrated logistics network involving supply chain management optimised for
both time and cost. That’s why Toll operates in high growth areas — because we’re
at the crucial intersection of supply and demand.
AUSTRALIA AND NEW ZEALAND
Revenue: AUD$4.64 billion
• Express/Courier
• Domestic Freight Forwarding
• Specialist Logistics
• Coastal Shipping
• Distribution, Warehousing and
Logistics Management
• Defence Logistics
• AutoLogistics
• Road, Rail & Air Freight Forwarding
TOLL GROUP
AMERICAS EUROPE
WHO WE ARE IN 2008
We are an Asian region focused integrated logistics group with extensive global reach.
With over 25,000 people we operate in over 45 countries and have revenues in excess
of $5.6 billion. We are headquartered in Australia.
Moscow
IstanbulRome
MilanZurich
Madrid
MontrealToronto
BostonNew York
Chicago
St Louis
Memphis
Atlanta
Miami
Lima
Co-owned branch
Agency branch Santiago
Sao Paulo
Buenos Aires
Dallas
Los Angeles
San Francisco
Vancouver ParisBrusselsLondon
Basildon
OsloStockholm
AlvestaRotterdam
Hamburg
DusseldorfHannover
Amsterdam
FrankfurtMunich
Goteborg
Manchester
Southampton
Stuttgart
Barcelona
Tel Aviv
Kuwait
Manama
Doha
Dubai
Muscat
Karachi
New Delhi
Mumbai
Colombo
Durban
Port Elizabeth
Cape Town
Johannesburg
Cairo
ASIA CONTRACT LOGISTICS
Revenue: AUD$602 million
• Oil and Gas Logistics
• Supply Chain Management
• Distribution of Bulk Materials
• Defence Logistics
• Project Logistics
• Specialist Logistics
• Marine Logistics
For
per
sona
l use
onl
y

TOLL – ANNUAL REPORT 2008 7
OUR REVENUE MIX IN 2008
A major strength of the business, particularly in relation to challenging economic environments is the level
of diversifi cation across industry segments and also across the customer base. The fact that the company
is not heavily reliant on specifi c discretionary consumer spending is positive in both diffi cult and strong
economic periods. And when you combine the profi le of our customers with our variable cost structure
relating to sub-contractor fl eet, Toll’s business model is sustainable no matter what the economic conditions.
*Excludes Virgin BlueDefence and
Government 15%
Mining and
Resources 13%
Automotive 9%
Retail and
FMCG 50%
Manufacturing 8%
Steel and Industrial 5%
REVENUE
CONTRIBUTION
BY
INDUSTRY
Strong market alignment between Australia, New Zealand and Asia
INDUSTRY AUSTRALIA NZ ASIA
Retail and FMCG (50%) Customers include: Coca-Cola Amatil, Foster’s Group, Palmolive, Unilever, Wesfarmers, Woolworths
4 4 4
Defence and Government (15%)Customers include: Australian Defence Force, Australian Taxation Offi ce, NT Government, QLD Purchasing
4 4 4
Mining and Resources (13%)Customers include: Rio Tinto, Xstrata, Zinifex 4 4
Automotive (9%)Customers include: Bridgestone, Ford Motor Co, General Motors, Holden, Mercedes Benz, Toyota Motor Co
4 4
Manufacturing (8%)Customers include: Amcor, Fletcher Building Group, Qenos, Viridian Glass 4 4 4
Steel and Industrial (5%)Customers include: BlueScope Steel, OneSteel, Orica 4 4
2008 GDP growth rates
China 9.3%
India 7.9%
Vietnam 7.3%
Cambodia 7.2%
Indonesia 6.1%
Thailand 5.3%
Malaysia 5.0%
Singapore 4.0%
Australia 3.2%
ASIA
Committed to optimising outcomes
MANAGING A COMPLEX ARRAY OF LOGISTICS SERVICES
Toll’s integrated logistics offering is developed from an array of complex service offerings, utilising all
modes of transport, a specialised range of integrated logistics services, an extensive range of freight
profi les, and covers all major territories and regions.
MODE
• Road
• Rail
• Sea
• Air
SERVICE
• Network transport
• Contract logistics
• 4PL
• Freight-Forwarding
FREIGHT PROFILE
• Satchels
• Packages
• Pallets
• FTLs
• Bulk
TERRITORY
• Australia
• New Zealand
• Japan
• China
• India
• Singapore
• Other
+ + +
Moscow
Dubai
Muscat
Karachi
New Delhi
Dhaka
MumbaiChennai
Colombo
Perth
AdelaideMelbourne
Hobart
CanberraSydney
Brisbane
Wellington
Auckland
Jakarta
Singapore
Kuala LumpurIpoh
Penang
BangkokBurma
Macau
ShenzhenGuangzhou
Chengdu
Hong Kong
XiamenFuzhou
Shanghai/Ningbo
Tokyo
SeoulBeijing
Tianjin
Dalian
Quingdao
Surabaya Darwin
Manila
Ho Chi Minh City
Taipei/Taichung/Kaohsiung/Hsinchu
TOLL GLOBAL FORWARDING
Revenue: AUD$358 million (four months trading)
• Air Freight
• Ocean Freight
• Consolidation and Deconsolidation
• Supplier Management
• Order Management
• Customs Brokerage
• Visibility and Information Management
For
per
sona
l use
onl
y
8
CORPORATE SOCIAL RESPONSIBILITY
Of course, Toll exists to deliver solid fi nancial results, and healthy returns to
our investors. But it’s not all we do, or all we are. In a world too frequently
beset by intolerance, fear, hunger and illiteracy, some of us are in a position
to help. We count ourselves among the fortunate — not only able to help,
but having the responsibility and the desire to help.
COMMUNITY
We are pleased to tell you that once again the company’s largest
ongoing community commitment is our support of First Step, a small
but successful non-profi t organisation assisting people who have a
dependency on drugs, particularly heroin.
For the eighth consecutive year we have provided not only fi nancial
assistance but time and expertise to help First Step do what they
do best, design and deliver treatment and management programs
for drug addiction and recovery. According to individual needs,
treatments may vary and include counselling, buprenorphine/
methadone maintenance programs, rapid detoxifi cation, naltrexone
tablets and slow release naltrexone implants.
Our connection with First Step has lead directly to the development
of the Second Step program.
Second Step
Begun in 2001, Second Step was designed to offer employment
opportunities to people who, as a result of previous drug or
incarceration issues, fi nd diffi culty in obtaining or retaining suitable
employment. The program provides a period of supported employment
and aims to help people to: replace their previous life style with a
safer and more constructive one; re-establish themselves within the
working world; develop strategies for coping with diffi culties in daily
life; establish a life style and work habit that will help them avoid
resuming previous self destructive behaviours; and move on to the
next stage of their life with skills, experience and a solid reference
for future employment.
We are very proud of our ongoing involvement and indeed in March
of this year, our participation in the Second Step program was
recognised when featured on a popular Australian television show the
7:30 Report. The response to the program aired was overwhelming,
and thousands of enquiries have been received at head offi ce. The
great thing was the high number of Australian corporations who
contacted us for further information.
There is no doubt First Step and Second Step are growing in
importance and infl uence and it is now our goal to develop the
programs to encourage the involvement of other corporations who
are as keen to support people coping with what would otherwise
be an overwhelming problem.
…At 4am on a cold winter’s day 18 months
ago, recovering drug addict Second Stepper
set off on an arduous ride into a new life.
She’d recently been released from jail
with no money, no possessions and no one
to turn to, except welfare agencies that
gave her clothes, a bike, and a place in
a supported employment program run by
Toll Holdings. Every day for the next three
months, she spent three hours travelling
each way by bike and train, from a boarding
house in Melbourne’s northern suburbs to a
job hauling boxes at a warehouse in the west.
Every day I used to think “What the hell am
I doing? This sucks, I hate it, I don’t wanna
do this” but I kept going, every day. They
offered me something nobody ever would.
They believed that I could do it. They trusted
me, so, and I promised them I would do it.
So I had to.
…It gives people like me hope. Hope that
someone will believe in them. That they are
willing to change. You can get out. And live
a normal life.
“
”7:30 Report – Australian Broadcasting Corporation
For
per
sona
l use
onl
y

TOLL – ANNUAL REPORT 2008 9
“Convoy for Kids
Operating across the Asian region, Convoy for Kids assists in the
welfare of sick and disabled children and for the tenth year we are
happy to be part of the programs conducted by this great organisation.
Surf Life Saving
Like most Australians we have an affi nity with beach culture,
and in particular the very important role surf life saving plays in
ensuring our beaches are safer for all beach goers. That’s why our
long-standing association with Sorrento Surf Life Saving Club is
now in its seventh year.
ENVIRONMENT
Toll is now into its third year of an enhanced focus on environmental
climate change. Since 2006, we have met the requirements of key
government environmental programs, that will lead Australia into
the Carbon Pollution Reduction Scheme.
In Australia, the focus at Toll has been to progressively improve
reporting and management processes. At the hub of this approach
is our Toll web-based management system, GEMS (Greenhouse
Emission Management System). Simply, GEMS converts all energy
sources to specifi c program units measuring the progress and
impact of Toll’s generated greenhouse gases.
Our focus on improving operational effi ciency has identifi ed
many aspects that impact fuel use throughout our fl eet. Vehicle
specifi cations will be further refi ned to ensure that the best
fl eet investments are implemented to maximise fuel savings and
return on investment. In addition, Toll will continue exploring the
use of alternative fuels and technologies based on research and
development results from its own and international trials.
Toll’s ongoing commitment to designing energy effi cient depots,
warehouses and distribution centres includes trials on improving
lighting systems, building design and potential implementation
of alternate energy sources such as solar power. In addition, Toll
recognises the need to maximise the use of rain water and seeks
to where possible capture multiple facility rain water to supply
truck cleaning facilities and toilet fl ushing systems.
Furthermore, Toll prefers to reduce emissions in place of acquiring
carbon credits through trading. We will seek additional emission
reduction opportunities to ensure the greatest savings are made
to meet our strategic goals and support our customers.
One of the common themes I see wherever I go,
is that governments either can’t or choose not to
support these sorts of programs as aggressively
as I think they should, and so business needs
to step up to the plate.
Paul Little – Managing Director
At Toll, we know that being a company in the community in which we
work means stepping up to real problems we face as people. And as a big
corporation we are in a position to help. Around the Asian region we actively
support a range of worthy initiatives, of which we are justly proud, including:
Foodbank Australia
For the fourth consecutive year we have continued our long-standing support
of Foodbank Australia. By providing transport services for the collection and
distribution of donated grocery and beverage products to more than 1,500
state-based accredited welfare agencies — The Salvation Army, Mission
Australia, St Vincent’s, The Smith Family and school Breakfast Clubs around
Australia — we help Foodbank feed more than 20,000 Australians daily.
Toll was proud to receive the 2008 Foodbank Partnership Award – for being
a pivotal partner in helping Foodbank achieve its vision of ‘an Australia
without hunger’.
Cancer Support
Supporting cancer research makes a difference, and Toll has a long history
of supporting cancer research groups across the country including Australia’s
Biggest Morning Tea, Shave for a Cure and Swinging for NZ Cancer Society
(Golf Day).
TLC for Kids
Toll is proud to support TLC for Kids Distraction Box Program which provides
urgent attention and immediate distractions to sick children and young
people, as well as support for families via an additional program, RAPID
TLC. Since the organisation was established ten years ago TLC for Kids
has helped over 13,500 people.
”
For
per
sona
l use
onl
y

10
BOARD OF DIRECTORS
Ray Horsburgh AMHon D Univ, FAICD, B.Chem Eng
Chairman from 14 September 2007Independent Non Executive Director
Director since 24 November 2004.
Extensive management experience in the glass and steel industries, mergers and acquisitions, managing businesses overseas especially in the SE Asian countries and building businesses in mainland China. Former Managing Director of Smorgon Steel Group Limited from 1998 to 30 June 2007. Non Executive Director of CSR Limited, National Can Industries Limited and Traffic Technologies Limited.
Age 65.
Special Responsibilities: Chairman of Board of Directors and the Nomination and Corporate Governance Committee. Member of the Remuneration and Succession Planning and Audit and Financial Risk Committees.
Paul LittleFAICD, FCIT
Managing Director
Managing Director since 1 May 1986.
Extensive experience and management in the logistics industry. Director of Virgin Blue Holdings Limited from May 2006 to August 2008. Age 60.
Special Responsibilities: Member of the Nomination and Corporate Governance Committee.
Harry BoonLLB (Hons), B Com (Melb)
Independent Non Executive Director
Director since 1 November 2006.
Extensive experience in global marketing and sales, large scale manufacturing operations, and product development. Chairman of Tatts Group Limited and Gale Pacific Limited and Non Executive Director of Hastie Group Limited, and former Director PaperLinX Limited and Funtastic Limited. Former Chief Executive Officer and Managing Director of Ansell Limited. Age 60.
Special Responsibilities: Chairman of the Remuneration and Succession Planning Committee. Member of the Nomination and Corporate Governance
Committee.
Mark SmithFAMI, CPM, FAIM, MAICD
Independent Non Executive Director
Director since 1 July 2007.
Extensive experience in senior roles including marketing with Unilever and Uncle Toby’s. Managing Director of Cadbury Schweppes Australia and New Zealand from 2003 to 2007. Former Managing Director of Confectionery ANZ and prior to that, three years as Director of Marketing for Cadbury Trebor Basset in the UK and senior positions in Cadbury Schweppes’ North American and Australian operations. Age 53.
Special Responsibilities: Chairman of the Audit and Financial Risk Committee. Member of the Nomination and Corporate Governance Committee.
TOLL GROUP STRUCTURE
Managing Director/CEO
Paul Little
Global Forwarding
Hugh Cushing
Acting CFO
Mal Grimmond
Strategy M&A
Stephen Stanley
Company Secretary
Bernard McInerney
Asia Contract Logistics
Wayne Hunt
Australia
John Ludeke
New Zealand
David Jackson
For
per
sona
l use
onl
y

TOLL – ANNUAL REPORT 2008 11
Barry CusackBE (Hons), M. Eng. Sci, FTSE, FAusIMM, FAIM, MAICD
Independent Non Executive Director
Director from 1 October 2007.
In an executive career of 40 years in the minerals industry with the Rio Tinto Group, held positions of Managing Director of Dampier Salt, Hlsmelt Corporation, Hamersley Iron Operations and Rio Tinto Australia and was Chairman of Rio Tinto Asia and Rio Tinto Shipping.
Chairman of 0Z Minerals Limited and a Non Executive Director of MacMahon Holdings Limited. Past President of the Minerals Council of Australia, 2001 to 2003.Age 66.
Special Responsibilities: Member of the Nomination and Corporate Governance and Remuneration and Succession Planning Committees.
Frank Ford M. Tax(Melb), B Bus (Acc), FCA
Independent Non Executive Director
Director since 14 January 2008.
Former Managing Director Deloitte
Victoria after a long and successful
career as a professional advisor
spanning some 35 years. During that
period, Mr Ford was also a member
of the Deloitte Global Board, Deloitte
Global Governance Committee and also
the Deloitte National Management
Committee.
Director of Citigroup Pty Limited and
Tarrawarra Museum of Art Limited.
Age 62.
Special Responsibilities: Member
of Audit and Financial Risk and the
Nomination and Corporate Governance
Committees.
Bernard McInerneyAICS, CPA, AICD, B Bus (Acc)
Company Secretary
Company Secretary since 1994. Also held the position of General Manager Finance and Administration from 1994 until late 1997. Extensive experience in business acquisitions and accounting and financial management within the logistics industry over the last 24 years. Director of Virgin Blue Holdings Limited from September 2006 to August 2008. Age 50.
Special Responsibilities: Member of the Risk Management Committee.
Neil Chatfield FCPA, FAICD
Chief Financial Officer to September 2008
Director from 1998 to 18 September 2008.
Over 30 years experience in the resources and transport sectors. Extensive experience in financial management, capital markets, mergers and acquisitions and risk management. Non Executive Director of Seek Limited since 2005 and Non Executive Director of Whitehaven Coal since 2007. Chairman of Virgin Blue Holdings Limited since June 2007 and Director of Virgin Blue Holdings Limited since May 2006. Age 54.
SENIOR MANAGEMENT
John LudekeGroup Director – Toll Australia and New Zealand
Joined Toll 1996. Current position since May 2007.
Previously, Group Director Toll Australia Group since June 2006 and Group Director Long Distance/ Networks Divisions since 1997.
Extensive experience over 26 years in a number of senior management positions within the transport and logistics industry.
Age 59.
Chairman of Toll NZ Limited from January 2007 to June 2008.
Director of Virgin Blue Holdings Limited from June 2007 to August 2008.
Stephen StanleyDirector, Strategy, Mergers and Acquisitions
Joined Toll 1999. Current position since 1999. Extensive experience in the transport industry and management. Responsible for strategy, portfolio review, marketing growth initiatives involving acquisitions, joint ventures and major business developments. Age 50.
Wayne HuntPresident/CEO – Toll Asia
Joined Toll 1990. Current position since August 2007. Previously held positions as Group General Manager Intermodal at Pacific National and Divisional GM Toll AutoLogistics, General Manager Group Development, National Sales & Marketing Manager Toll Express and NSW Marketing Manager.
Twenty-four years experience in the logistics industry. Age 56.
Member of the Chartered Institute of Logistics and Transport Australia.
Hugh CushingCEO – Toll Global Forwarding
Joined Toll in 1997 with the acquisition of the TNT Australia businesses. In current position since 1 July 2008. Previously Director Business Development and was responsible for the Toll Solutions technology development team.
Thirty-two years experience in operational, commercial and general management positions. Age 51.
David JacksonChief Executive Officer – Toll NZ Limited
Joined Toll 1996. Current position since October 2003. Previously, General Manager of Toll SPD.
Thirty years experience in various management roles in the transport and logistics industry. Age 51.
Director of Toll NZ Limited from October 2003 to August 2008.
Trustee of Chris Cairns Foundation.
Director of WNC 2007 Limited.
Malcolm GrimmondActing Chief Financial OfficerDirector, Business Solutions and Chief Information Officer
Joined Toll 1997. Acting CFO since September 2008. Current position, CIO since 2006. Previously CFO Pacific National and Divisional Financial Controller Toll Logistics.
Thirteen years experience in financial, commercial and management positions in the transport and logistics industry.Age 45.
After 11 years with Toll, Neil has decided to pursue private interests and concentrate on his Non Executive Director roles. Neil leaves Toll in March 2009. We thank him for his valued contribution and wish him well.
For
per
sona
l use
onl
y

12
F INANCIAL STATEMENTS AND
DIRECTORS’ REPORT
FOR THE YEAR ENDED 30 JUNE 2008
For
per
sona
l use
onl
y

TOLL – ANNUAL REPORT 2008 13
The directors present their report together with the fi nancial report of
Toll Holdings Limited (‘the Company’) and the consolidated fi nancial
report of the consolidated entity, being the Company and its controlled
entities (‘the Group’), for the year ended 30 June 2008 and the
auditors’ report thereon.
Directors
The following persons held offi ce as directors of the Company during
or since the end of the fi nancial year:
Ray Horsburgh AM (Chairman) Director since 2004
John Moule AM Director since 1995
(Retired 14 September 2007)
Paul Little (Managing Director) Director since 1986
Neil Chatfi eld Director since 1998
Harry Boon Director since 2006
Mark Smith Appointed 1 July 2007
Barry Cusack Appointed 1 October 2007
Frank Ford Appointed 14 January 2008
Principal Activities
The principal activities of the Group during the year consisted of:
• Less than full load express and economy freight forwarding
service using all modes of transport;
• Full load road and rail freight forwarding service including rail
linehaul operation;
• Temperature controlled transport service for full load and less
than full load clients;
• Warehousing and distribution of bulk dry and refrigerated goods;
• Wharf cartage, container handling and storage;
• Contract distribution services;
• Time sensitive parcel freight distribution services;
• Specialised international forwarding services;
• Removals and relocation brokerage service;
• Vehicle transport and distribution;
• Bulk liquid transportation;
• Shipping linehaul operations for freight and passengers;
• Rail passenger operations; and
• Air passenger operations.
Consolidated Result
The consolidated profi t from ordinary activities for the year
attributable to the members of the Company was:
2008$M
2007$M
Net profi t/(loss) attributable to members of the Company (694.7) 1,278.7
Earnings per share
Basic earnings per share (107.41¢) 202.52¢
Diluted earnings per share (107.41¢) 197.39¢
Continuing operations
Basic earnings per share 38.72¢ 4.36¢
Diluted earnings per share 38.70¢ 4.33¢
Review of Operations
Toll Holdings, the Asian region’s leading integrated transport and
logistics provider, has reported after tax earnings for the year to
30 June 2008 of $258 million in relation to continuing businesses.
This result excludes discontinuing businesses ($945m loss) and net
one-off items ($7m), refl ecting a total loss of $952 million relating
mainly to the non-cash restructure of the Virgin Blue investment
and gain on sale of the New Zealand rail and ferry operations.
Revenue from continuing businesses was $5.6 billion for the year
with EBIT, pre-acquisition accounting amortisation of $429 million.
This compares to $4.9 billion and $365 million respectively on a
like for like basis in the previous year.
Divisional Performance
Following the in specie Virgin Blue special dividend and sale of the
New Zealand rail and ferry operations, the Company has established
three major operating divisions, namely Australia and New Zealand
Integrated Transport and Logistics, Toll Asia Contract Logistics and
Toll Global Forwarding.
Comparative results have been restated for consistency into the three
divisions and all references to divisional EBIT are pre-amortisation of
charges arising from acquisition accounting and one-off items.
Toll Australia and New Zealand
Trading results across the Australian division continued to
demonstrate strong revenue and earnings growth. EBIT margin
expansion also continued, as improved effi ciencies and cost control
were achieved.
Revenue for Australia for the year was $4.42 billion, which after
eliminating the impact of acquisitions and incremental fuel
surcharges, represented an underlying organic increase of 7.5%
over the previous year of $4.05 billion.
EBIT for Australia grew over 18% to $347 million compared to
$294 million previously. This resulted in the EBIT margin increasing
from 7.21% to 7.84% maintaining the margin expansion evident
over the past few years.
DIRECTORS’ REPORT
F O R T H E Y E A R E N D E D 3 0 J U N E 2 0 0 8
For
per
sona
l use
onl
y

14
Review of Operations (continued)
There were numerous other highlights in the Australian division over
the year, these included:
• completion of a long term domestic freight operations agreement
with Virgin Blue;
• acquisitions of the Victorian Express, Couriers Australia and
SkyNet businesses;
• signifi cant new contract wins in the retail, mining and automotive
sectors;
• establishment of a Joint Venture with Dnata;
• transfer of Jetcare maintenance facilities to Virgin Blue; and
• continued integration and rationalisation of Patrick warehousing
and logistics activities.
Trading conditions generally remained strong throughout the year. In
particular, the resource, food, beverage and retail sectors experienced
solid volumes. Defence logistics also recorded strong activity.
The Company continued to invest heavily in technology, infrastructure
and new fl eet, providing increased cost effi ciency and capacity to
facilitate future growth.
The express and time sensitive operations of the Company grew
strongly throughout the year, supported by investment in a new
national air linehaul network and targeted acquisitions. These express
operations represent approximately 35% of divisional revenue and
are pivotal in servicing increased volumes arising from Asian direct
sourcing activities of Australian customers.
Toll IPEC, the Company’s road parcel express business, performed
strongly during the year, benefi ting from integrating services with
group warehousing and distribution operations and utilising its
comprehensive network to grow market share.
Toll Priority, our air express operator, also performed well and
completed the acquisition of SkyNet, an international air express
operator. Whilst the cost of additional investment in the air linehaul
network impacted results, it is expected that potential integration with
the developing international Asian air network will drive additional
profi table growth for Toll Priority.
The Toll Dnata aviation logistics joint venture with Emirates,
established early in the year, continued to secure additional growth
including the acquisition of the Skystar and Aerocare businesses.
Toll Express and Toll SPD, the Company’s road and rail forwarding
operation, traded well with increased volumes and achieved
effi ciencies through technology and fl eet investments.
NQX had a strong result from increased activity in the resource sector,
as well as enhanced national trade emanating from Queensland.
Our Queensland rail forwarder, QRX, had a diffi cult year with major
fl ooding and derailments disrupting services.
In the automotive sector, domestic manufactured vehicles continued
to experience fl at conditions as the high Australian dollar favoured
imports. Notwithstanding these conditions, Toll Automotive performed
well, growing market share and supporting customers with Asian
based sourcing arrangements.
PDL Toll, the Group’s defence logistics operator, traded strongly and
extended its capability in both aviation and marine services. PDL Toll
is currently furthering its defence and United Nations footprint into
developing countries.
Looking at economic conditions and the likely impact on operations
within Australia, no major deterioration is evident, notwithstanding
a number of challenging factors including increased interest rates,
high fuel prices and currency volatility.
Following the sale of the rail and ferry operations back to the
NZ Crown, Toll New Zealand now consists of contract logistics and
road and rail forwarding operations under the Tranzlink brand. The
sale, which was effective 30 June 2008, will enable the Company
to focus on accelerating growth in forwarding and logistics within
New Zealand.
New Zealand revenue for the year was NZ$255 million compared
to NZ$234 million previously whilst EBIT was NZ$9.4 million against
NZ$7.3 million previously.
Results for the year benefi ted from increased rail linehaul and
warehousing effi ciencies. Investment in technology and new facilities
is expected to assist growth in the next 12 months.
Effective 30 June 2008, the Company acquired the United Carriers
business. This business further expands our road and rail forwarding
base in New Zealand, particularly into Northland where the Company
previously had a limited presence.
Whilst the New Zealand economy remains subdued, we are
increasing our focus on acquisition opportunities, to add further
scale and capability to existing operations.
Toll Asia
The Group’s presence in Asia within the contract and marine
logistics sectors continued to grow strongly throughout the year.
The integration of Sembawang Kimtrans is now complete and has
proceeded very well.
Total revenue for Toll Asia for the year was S$777 million compared
to S$563 million in the prior year. On a like for like basis and excluding
the impact of the Sembawang Kimtrans acquisition, underlying
revenue grew 12.5% continuing the successful growth rates in
new business established over the past 18 months.
EBIT for the year (including share of associates) was S$82 million,
a 12% increase over the S$73 million recorded in the prior year.
Underlying revenue and EBIT growth accelerated in the second half
of the fi nancial year.
Highlights for Toll Asia during the course of the year included:
• full takeover of the Sembawang Kimtrans operations;
• strong growth in offshore supply operations;
• strong contract retention rates; and
• management restructure and appointment of Toll CEO.
Revenue grew strongly across most of the business, in particular the
offshore marine and mining logistics operations which benefi ted from
high levels of activity in the energy sector.
DIRECTORS’ REPORT C O N T I N U E D
F O R T H E Y E A R E N D E D 3 0 J U N E 2 0 0 8
For
per
sona
l use
onl
y
TOLL – ANNUAL REPORT 2008 15
Solid revenue growth was experienced in Malaysia, Thailand, Vietnam
and China, with higher revenue from existing customers and new
contracts providing the increase.
The Government defence logistics operations continued to perform
well and traded up on plan. As expected, additional opportunities to
leverage the defence logistics capability in Singapore to other group
operations has created further growth in this important sector.
During the year the contribution from associates reduced from
S$13.9 million to S$3 million, partially due to the acquisition of
previous associates Sembawang Kimtrans and Thailand and disposal
of associates in the prior year. Equity accounted results from 38%
owned Footwork Express reduced signifi cantly due to continued
depressed economic conditions in Japan, high levels of competition
and a one-off income tax charge.
The Group is currently reviewing its investment in Footwork Express
in order to maximise value and determine the optimum way for the
Company to leverage the comprehensive Japanese network within
Footwork Express.
The growth now being experienced in our Toll Asia businesses is
expected to be further enhanced by the integration of services with
Toll Global Forwarding, creating tailored solutions for customers
seeking cross border supply chain solutions.
Toll Global Forwarding (TGF)
The TGF division has been developed to consolidate capabilities
across the Group in order to offer customers end-to-end international
supply chain solutions.
The global footprint for TGF has been established with the successful
takeover of BALtrans, a Hong Kong based listed company, effective
1 March 2008.
The strategic rationale for the BALtrans transaction and the
establishment of TGF was to develop a service offering, which
when combined with in-country transport capabilities, would deliver
effi ciencies to customers’ international supply chains.
TGF has not only enhanced the Group’s global air and ocean freight
forwarding capabilities, but provided a global network including
operations in Europe, North America and the Middle East as well
as Asia Pacifi c.
In June 2008 the Group acquired a 100% interest in Gluck, an
Australian based international forwarder with a close long term
relationship with BALtrans in Asia. The acquisition of Gluck enables
all the Australian forwarding operations to be consolidated, thereby
providing scale and additional capability.
In the year to 30 June 2008, TGF recorded revenues of $358 million
compared to the prior year, which related only to the Australian
operations of $145 million. EBIT for the year was $10.9 million
against $4.9 million in the previous period.
During the period since the acquisition of BALtrans in March 2008, the
business has seen strong improvement in both revenue and earnings
compared to the corresponding period in the previous year. This was
refl ective of a more stable leadership team and increased focus on
business development.
TGF has a detailed integration plan to ensure that all international
forwarding operations across the Group are co-ordinated under one
infrastructure, and to ensure that the assets, both in Australia and
Asia, are leveraged to provide a wholly integrated service to customers.
A number of management changes have been made in order to
align the BALtrans operations with the Toll business model, and the
Group’s Director of International Development, Mr Hugh Cushing has
been appointed CEO of the TGF business. A number of other positive
management changes have also been affected.
To date the integration of TGF is proceeding very well and a number
of new customer contracts have been secured with a very promising
pipeline of prospective opportunities.
Discontinuing Operations
Effective 30 June 2008, Virgin Blue became a discontinued operation
as a consequence of the decision to distribute Virgin Blue shares to
shareholders via a special in specie dividend.
Revenue for the year for Virgin Blue was $2.35 billion compared
to $2.17 billion, while profi t after tax was $97.7 million compared
to $215.8 million. Earnings were impacted by high fuel costs, a
competitive market place and investment in new operations.
Also effective 30 June 2008 was the New Zealand rail and ferry
sale to the Crown, and these operations became characterised as
discontinued. Revenue for the year in relation to these operations
was NZ$555 million compared to NZ$543 million previously. EBIT
for the year was NZ$56 million compared to NZ$52 million in the
previous period.
Finance
Net debt at 30 June 2008 was $1.27 billion, including Reset
Preference Shares of $250 million. Following the settlement of the
New Zealand rail and ferry sale after balance date, net debt fell to
approximately $650 million. Based on net debt of $650 million, gearing
(measured on a net debt to equity plus net debt basis) was 24%.
Interest cover remained very strong at over 12 times.
Cashfl ow from continuing operations was $496 million, which
refl ected the ongoing strength of the core activities of the Group.
Throughout the year the Group continued to invest heavily in growth.
Investment in acquisitions amounted to $796 million, whilst net
capital expenditure was $380 million. The acquisition investments
which included BALtrans and Sembawang Kimtrans also included
a number of smaller strategic acquisitions designed to broaden
the Group’s capability and scale. The availability of value adding
acquisitions is particularly strong as smaller industry players in both
Australia and Asia come under increasing pressure, both fi nancially
and in their ability to meet service demands.
For
per
sona
l use
onl
y
16
Review of Operations (continued)
Earnings per share (fully diluted) from continuing operations for the
year was 42.7 cents per share, pre acquisition amortisation charges
and one-off items, compared to 35.5 cents per share in the prior
period.
The Company has declared a fi nal dividend of 11.5 cents per ordinary
share, bringing the full year dividend to 25 cents per share. The
dividend, on continuing operations represents a 20% increase over
the previous year, on a constant payout ratio basis.
Industry Conditions
Over the past year, the industry has continued to consolidate both on
a domestic and global scale. However, there is a consistent theme
of enhanced focus on international supply chain management.
Notwithstanding slowing economic conditions in some regions,
trade-fl ows both by air and sea remained robust with Asia being
central to global logistics.
In Australia, as more and more companies look to direct international
sourcing in order to remain competitive, opportunities to work with
these groups is increasing. Toll has assembled a strong capability in
terms of technology and operational expertise and this is expected
to drive growth over the long term.
Industry conditions for contract logistics businesses throughout the
world have remained challenging and companies with limited supply
chain focus are likely to come under increasing pressure. In contrast,
companies with the ability to provide highly integrated solutions are
increasingly better positioned to gain market share, higher margins
and to benefi t from increased outsourcing.
High fuel prices have remained a challenge for the industry, with
most industry players adopting fuel surcharging mechanisms. At Toll,
we have a rigorous system of surcharging to ensure that the volatility
of fuel costs is appropriately managed and communicated to our
customer base. In addition, fuel conservation programs are in place
around the Group to promote reduced fuel usage where possible.
In the next twelve months, we expect industry rationalisation to
continue with many larger and smaller players under pressure due
to excess gearing, unsustainable business models and poor execution.
As industry valuation multiples also reduce, it is likely that a range of
acquisition opportunities will present themselves to the Company.
Environment
Toll is now into its third year of an enhanced focus on environmental
climate change.
Since 2006 we have met the requirements of key government
environmental programs that will lead Australia into the Carbon
Pollution Reduction Scheme.
In Australia the focus at Toll has been to progressively improve
reporting and management processes. At the hub of this approach
is our previously reported Toll web based management system,
GEMS (Greenhouse Emission Management System). Simply, GEMS
converts all energy sources to specifi c program units measuring the
progress and impact of Toll’s generated greenhouse gases.
Our focus on improving operational effi ciency has identifi ed
many aspects that impact fuel use throughout our fl eet. Vehicle
specifi cations will be further refi ned to ensure that the best fl eet
investments are implemented to maximise fuel savings and return
on investment.
In addition, Toll will continue exploring the use of alternative fuels
and technologies based on research and development results from
its own and international trials.
Toll’s ongoing commitment to designing energy effi cient depots,
warehouses and distribution centres includes trials on improving
lighting systems, building design and potential implementation
of alternate energy sources such as solar power. In addition, Toll
recognises the need to maximise the use of rain water and seeks
to where possible capture multiple facility rain water to supply
truck cleaning facilities and toilet fl ushing systems.
Finally, Toll prefers to reduce emissions in place of acquiring carbon
credits through trading. We will seek additional emission reduction
opportunities to ensure the greatest savings are made to meet our
strategic goals and support our customers.
Economic Conditions
Generally economic conditions remained solid in the regions in which
the Company participates. In Australia, there has been no noticeable
slowdown and, although much current economic data is pointing to
a slowdown in consumption, the Company does not expect a serious
deterioration in conditions.
In New Zealand conditions remain fl at. Most Asian countries in which
the Group operates continue to demonstrate solid growth.
Whilst considerable volatility exists in global energy prices and on global
debt and equity markets, fundamentals in the logistics sector remain
favourable as global trade and the trend to outsourcing continues.
DIRECTORS’ REPORT C O N T I N U E D
F O R T H E Y E A R E N D E D 3 0 J U N E 2 0 0 8
For
per
sona
l use
onl
y
TOLL – ANNUAL REPORT 2008 17
Outlook
The in specie dividend of Virgin Blue shares to shareholders, and strengthening of our balance sheet, have positioned the Company to manage
any signifi cant downturn in economic conditions should it arise. At the same time, the strength of our ongoing cashfl ows and debt capacity
will enable the Company to pursue growth opportunities, both in Australia and in support of our Global Forwarding and Asian contract logistics
businesses.
Results to date for the June 2009 fi nancial year have remained solid and are tracking well ahead of last year. Based on current trading conditions
the outlook for the full year is for strong earnings and cashfl ow generation to continue across the business.
Dividends
Dividends paid or declared by the Company to members since the beginning of the previous fi nancial year were:
Cents per
share Total ($M)
Franked/Unfranked
Payment Date
Dividends provided or paid by the Company during the year:
Ordinary Shares
2008
2007 Final Dividend 11.0 70.7 Franked 3/10/2007
2007 Special Dividend 5.0 32.1 Franked 3/10/2007
2008 Interim Dividend 13.5 87.1 Franked 4/04/2008
2008 Special (in specie) Dividend (see below) 304.6 Unfranked 22/08/2008
2007
2006 Final Dividend 17.0 106.2 Franked 29/09/2006
2007 Interim Dividend 16.0 101.2 Franked 23/03/2007
2007 1st Special Restructure Dividend 17.0 109.2 Franked(i) 15/06/2007
2007 2nd Special Restructure Dividend 140.0 899.7 Unfranked(ii) 15/06/2007
Dividends paid or declared by the Company after year end:
Final Dividend 11.5 74.5 Franked 24/10/2008
On 22 August 2008 the Company distributed a special (in specie) dividend of Virgin Blue Holdings Ltd shares on the basis of one Virgin Blue
ordinary share for each ordinary Toll Holdings Limited share held, with the record date being 23 July 2008. The special dividend is a demerger
dividend for income tax purpose and not subject to dividend franking.
(i) Applied to partly satisfy the issue of Asciano units
(ii) Applied to partly satisfy the issue of Asciano shares
Signifi cant Changes in the State of Affairs
Signifi cant changes in the state of affairs of the Group during the fi nancial year were:
(a) Movement in assets and liabilities due to:
(i) in specie distribution of Virgin Blue shares to Toll Holdings Limited shareholders, resulting in the disposal of Virgin Blue at 30 June 2008
(ii) acquisition of Sembawang Kimtrans and BALtrans during the year
(iii) sale of New Zealand Rail and Ferry operations to the New Zealand Crown effective 30 June 2008.
Financial Reporting
The Managing Director and the Chief Financial Offi cer have declared in writing to the Board that the Group’s fi nancial reports are founded on
a sound system of risk management and internal compliance and control which implements the policies adopted by the Board.
Monthly actual results are reported against budgets approved by the directors and revised forecasts, if required, are prepared.
For
per
sona
l use
onl
y

18
Environmental Regulation
The operations of the Group in Australia are subject to various environmental regulations under both Commonwealth and State legislation.
In making this report, the directors note that the Group’s operations frequently involve the use or development of land, the transport of goods and
people, the storage, transport and disposal of waste and the use of transportation equipment. Some of these activities require a licence, consent
or approval from Commonwealth or State regulatory bodies. This regulation of the Group’s activities is typically of a general nature, applying to
all persons carrying out such activities, and does not in the directors’ view comprise particular and signifi cant environmental regulation.
Based upon enquiries within the Group, the directors are not aware of any breaches of particular and signifi cant environmental regulation
affecting the Group’s operations.
The directors believe the environmental performance of the Group is sound and that the Group has appropriate systems in place for the
management of its ongoing corporate environmental responsibilities.
Events Subsequent to Balance Date
Dividends
A fi nal dividend of 11.5 cents per share has been declared by the directors.
On 22 August 2008 the Company distributed a special (in specie) dividend of Virgin Blue Holdings Ltd shares on the basis of one Virgin Blue
ordinary share for each ordinary Toll Holdings Limited share held , with the record date being 23 July 2008. The special dividend is a demerger
dividend for income tax purpose and not subject to dividend franking.
Likely Developments and Expected Results of Operations
The Group will continue to pursue its policy of increasing the profi tability and market share of its businesses during the next fi nancial year.
Information as to likely developments in the operations of the Group and the expected results of those operations in future fi nancial years has
not been included in this report because, the directors believe on reasonable grounds, that to include such information would be likely to result
in unreasonable prejudice to the Group.
DIRECTORS’ REPORT C O N T I N U E D
F O R T H E Y E A R E N D E D 3 0 J U N E 2 0 0 8
For
per
sona
l use
onl
y

TOLL – ANNUAL REPORT 2008 19
Information on Directors
Director Experience & Qualifi cations Age Special Responsibilities*
R Horsburgh AMHon D Univ, FAICD,BChem EngIndependent Non Executive Director
Extensive management experience in the glass and steel industries, in mergers and acquisitions, managing businesses overseas especially in the SE Asian countries and building businesses in mainland China. Director since 2004. Appointed Chairman from 14 September 2007.Former Managing Director of Smorgon Steel Group Limited from 1998 to June 2007. Non Executive Director of CSR Limited , National Can Industries Limited and Traffi c Technologies Limited since 2006.
65 Chairman of Board of Directors Chairman of the Nomination and Corporate Governance Committee and Member of the Remuneration and Succession Planning Committee and Audit and Financial Risk Committee. Chairman of the Audit and Financial Risk Committee up to February 2008.
P A LittleFAICD, FCITManaging Director
Extensive experience and management in the logistics industry. Managing Director for 20 years. Director since 1986. Director of Virgin Blue Holdings Limited from May 2006 to August 2008.
60 Member of the Remuneration and Succession Planning and Nomination and Corporate Governance Committees.
N Chatfi eldFCPA, FAICDChief Financial Offi cer
Over 30 years experience in the resources and transport sectors. Extensive experience in fi nancial management, capital markets, mergers and acquisitions and risk management. Director since 1998. Non Executive Director of Seek Limited since 2005 and of Whitehaven Coal Limited since 2007. Chairman of Virgin Blue Holdings Limited since June 2007 and Director of Virgin Blue Holdings Limited since May 2006.
54 Member of the Risk Committee.
H BoonLLB(Hons), BCom(Melb)Independent Non Executive Director
Extensive experience in global marketing and sales, large scale manufacturing operations, and product development. Director since 1 November 2006. Currently Chairman of Tatts Group Limited and Gale Pacifi c Limited and Non Executive Director of Hastie Group Limited since 2005, PaperlinX Limited since May 2008 and of Funtastic Limited from 2004 to 2007. Former Chief Executive Offi cer and Managing Director of Ansell Limited.
60 Chairman of the Remuneration and Succession Planning Committee from March 2008. Member of Nomination and Corporate Governance Committee. Member of the Audit and Financial Risk Committee up to February 2008.
M SmithFAMI, CPM, FAIM, MAICD Independent Non Executive Director
Extensive experience in senior roles including marketing with Unilever and Uncle Toby’s. Director since 1 July 2007. Managing Director of Cadbury Schweppes Australia and New Zealand from 2003 to 2007. Former Managing Director of Confectionery ANZ and prior to that, three years as Director of Marketing for Cadbury Trebor Basset in the UK and senior positions in Cadbury Schweppes’ North American and Australian operations.
53 Chairman of Audit and Financial Risk Committee from March 2008. Member of Nomination and Corporate Governance Committee and a Member of the Remuneration and Succession Planning Committee up to February 2008.
B CusackBE(Hons),M.Eng.Sci., FTSE, FAusIMMFAIM, MAICD,Independent Non Executive Director
Extensive experience in management and resource industries. Director since October 2007. He joined Rio Tinto Australia (formerly CRA) in 1966 and retired as Managing Director of Rio Tinto Australia in 2001. Non Executive Director of MacMahon Holdings Limited since 2002, Chairman of Oz Minerals Limited and was President of the Minerals Council of Australia from 2001 to 2003 (member since 1996).
66 Member of the Remuneration and Succession Planning and Nomination and Corporate Governance Committees.
F FordM.Tax (Melb), B.Bus(Acc), FCA Independent Non Executive Director
Extensive experience in fi nancial and risk management. Director since January 2008. Former Managing Director of Deloitte Victoria as a professional advisor for 35 years. A past member of the Deloitte Global Board, Deloitte Global Governance and Deloitte National Management Committees. Director of Citigroup Pty Limited and Tarrawarra Museum of Art Limited.
62 Member of the Audit and Financial Risk and Nomination and Corporate Governance Committees.
* Refer to Meetings of Directors as detailed on the following page.
For
per
sona
l use
onl
y

20
Information on Directors (continued)
Company Secretary
Mr Bernard B McInerney (AICS, CPA, AICD) has held the position of company secretary since 1994. Mr McInerney has been involved in fi nance
and administration positions in the transport and logistics industry for the last 23 years. Director of Virgin Blue Holdings Limited from September
2006 to August 2008. Age 50.
Directors’ Interests
The relevant interest of each director in the shares, options or Reset Preference Shares issued by the Company, as notifi ed by the directors to the
Australian Stock Exchange in accordance with S205G(1) of the Corporations Act 2001, at 31 August 2008 is as follows:
Ordinary Shares Reset Preference
Shares Options Over
Ordinary Shares
Paul Little 37,191,800 1,500 –
Neil Chatfi eld 380,484 1,000 –
Ray Horsburgh 23,221 – –
Harry Boon 17,100 – –
Mark Smith 17,500 – –
Barry Cusack 37,387 – –
Meetings of Directors
The following table sets out the number of meetings of the Company’s directors (including meetings of committees of directors) held during the
year ended 30 June 2008 and the number of meetings attended by each director who held offi ce during the fi nancial year.
Directors’ Meetings
Audit and Financial Risk Committee
Meetings
Remuneration and Succession Planning Committee Meetings
Nomination and Corporate
Governance Committee Meetings
No. of Meetings No. of Meetings No. of Meetings No. of Meetings
Director Attended Held Attended Held Attended Held Attended Held
Paul Little 26 26 4* 4 6 6 5 5
John Moule (retired 14/09/07) 4 7 1 1 3 3 2 2
Neil Chatfi eld 26 26 4* 4 – – 5 5
Ray Horsburgh 25 26 4 4 6 6 5 5
Harry Boon 23 26 3^ 3 6 6 5 5
Mark Smith (appointed 01/07/07) 26 26 4 4 5^ 5 5 5
Barry Cusack (appointed 01/10/07) 17 17 2^ 2 3 3 3 3
Frank Ford (appointed 14/01/08) 9 10 2 2 1^ 1 2 2
* May attend meetings as an invitee.
Ceased being a member of the Committee effective 29 February 2008.
In addition, as required, matters were dealt with by circular resolution and ratifi ed at the next Board Meeting.
DIRECTORS’ REPORT C O N T I N U E D
F O R T H E Y E A R E N D E D 3 0 J U N E 2 0 0 8
For
per
sona
l use
onl
y

TOLL – ANNUAL REPORT 2008 21
Share Options
During or since the end of the fi nancial year, the Company has granted options over unissued ordinary shares as follows:
Senior Executive Option Plan and Executive Share Option Scheme
As at the 31 August 2008, unissued ordinary shares of the Company under option are:
Grant Date Total Options
Granted Unexpired
Options No of
Executives Exercise
Price $ Expiry Date
4 Oct 2006 670,000 340,000 8 10.29 25 Jul 2011
11 Jan 2008 3,831,176 3,686,176 329 10.55 10 Jan 2013
25 Jun 2008 1,350,000 1,350,000 111 6.32 24 Jan 2013
Each option is convertible into one ordinary share once certain performance criteria are met. Performance criteria are tested over 3 periods.
For the October 2006 options, the measurement dates are 30 June 2009, 30 June 2010 and 30 June 2011. For the January 2008 options, the
measurement dates are 30 June 2010, 30 June 2011 and 30 June 2012. For the June 2008 options, the measurement dates are 31 December
2010, 31 December 2011 and 31 December 2012. Options which do not vest in the initial periods are retested at the two subsequent dates.
Options which do not vest in the third and fi nal performance period will lapse. The proportion of options that vest at the end of a relevant
performance period depends on the fully diluted pre-amortisation for continuing operations post restructure, excluding Virgin Blue EPS compound
growth performance. All options will vest if the Group’s cumulative compound EPS growth is greater than 15%. If EPS growth is 10%, 50% of the
options will vest, between 10% and 15%, a pro-rata straight-line allocation is vested. If EPS growth is below 10%, no options will vest.
No shares were issued during the fi nancial year on the exercise of options granted under either the Senior Executive Option Plan or the Executive
Share Option Scheme (2007: 9,211,000 shares). No ordinary shares have been issued since the end of the fi nancial year from the exercise of
options granted under the scheme (2007: nil shares).
Remuneration Report – audited
This report summarises the director and executive remuneration policies and practices, including detailed remuneration outcomes for the
2008 fi nancial year, of the Group. It has been prepared in accordance with the remuneration reporting requirements under section 300A of the
Corporations Act 2001, and details the remuneration arrangements for Key Management Personnel (KMP) according to Accounting Standard
AASB 124 Related Party Disclosures.
The Group’s remuneration strategy is pivotal to achieving its objective of being a market leader in the industry in which it operates where
it competes for a limited number of highly skilled proven executives.
In light of the Group’s desire to be consistent with market best practice, the Board undertook in the previous fi nancial year a comprehensive
review of its executive remuneration framework. In doing this, the Board sought to ensure that the critical components of the Group’s
remuneration structure that have been instrumental in its success were refi ned and built on, namely:
• actively supporting the execution of business strategy including the successful identifi cation, completion and integration of acquisitions;
• rewarding executives for superior company performance;
• attracting and retaining appropriately qualifi ed and experienced directors and executives;
• aligning remuneration outcomes with shareholder wealth creation; and
• considering corporate governance expectations.
The review sought input from a range of internal and external sources on how the Group’s practices could achieve these goals. On the external
front, extensive input was received from external remuneration advisors PricewaterhouseCoopers. The internal component of the review
included extensive work on defi ning the type of remuneration system that would best support business strategy. This has included consideration
of the appropriate metrics to be applied for the short-term and long-term incentive programs, and the mix of reward between fi xed and at-risk
components of remuneration and the role of equity as a reward component.
Toll has throughout the last fi nancial year commenced the process of ensuring a consistent application of the remuneration structure to business
unit general managers.
For
per
sona
l use
onl
y
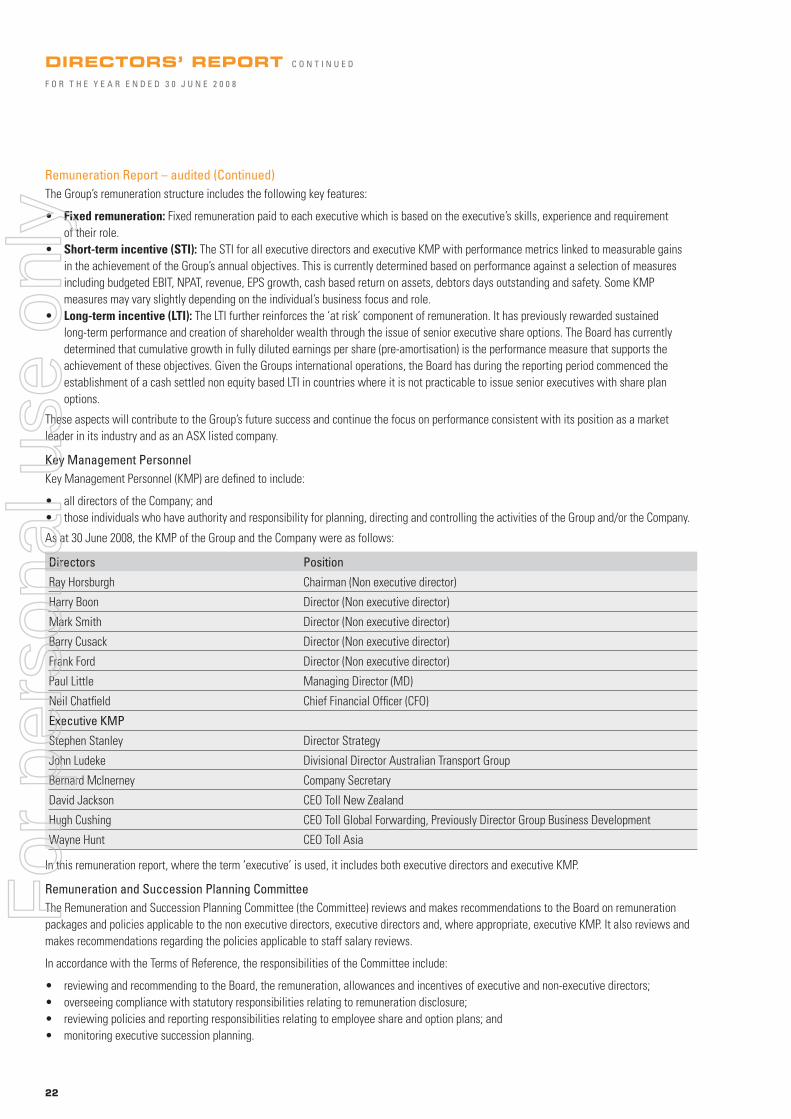
22
Remuneration Report – audited (Continued)
The Group’s remuneration structure includes the following key features:
• Fixed remuneration: Fixed remuneration paid to each executive which is based on the executive’s skills, experience and requirement
of their role.
• Short-term incentive (STI): The STI for all executive directors and executive KMP with performance metrics linked to measurable gains
in the achievement of the Group’s annual objectives. This is currently determined based on performance against a selection of measures
including budgeted EBIT, NPAT, revenue, EPS growth, cash based return on assets, debtors days outstanding and safety. Some KMP
measures may vary slightly depending on the individual’s business focus and role.
• Long-term incentive (LTI): The LTI further reinforces the ‘at risk’ component of remuneration. It has previously rewarded sustained
long-term performance and creation of shareholder wealth through the issue of senior executive share options. The Board has currently
determined that cumulative growth in fully diluted earnings per share (pre-amortisation) is the performance measure that supports the
achievement of these objectives. Given the Groups international operations, the Board has during the reporting period commenced the
establishment of a cash settled non equity based LTI in countries where it is not practicable to issue senior executives with share plan
options.
These aspects will contribute to the Group’s future success and continue the focus on performance consistent with its position as a market
leader in its industry and as an ASX listed company.
Key Management Personnel
Key Management Personnel (KMP) are defi ned to include:
• all directors of the Company; and
• those individuals who have authority and responsibility for planning, directing and controlling the activities of the Group and/or the Company.
As at 30 June 2008, the KMP of the Group and the Company were as follows:
Directors Position
Ray Horsburgh Chairman (Non executive director)
Harry Boon Director (Non executive director)
Mark Smith Director (Non executive director)
Barry Cusack Director (Non executive director)
Frank Ford Director (Non executive director)
Paul Little Managing Director (MD)
Neil Chatfi eld Chief Financial Offi cer (CFO)
Executive KMP
Stephen Stanley Director Strategy
John Ludeke Divisional Director Australian Transport Group
Bernard McInerney Company Secretary
David Jackson CEO Toll New Zealand
Hugh Cushing CEO Toll Global Forwarding, Previously Director Group Business Development
Wayne Hunt CEO Toll Asia
In this remuneration report, where the term ‘executive’ is used, it includes both executive directors and executive KMP.
Remuneration and Succession Planning Committee
The Remuneration and Succession Planning Committee (the Committee) reviews and makes recommendations to the Board on remuneration
packages and policies applicable to the non executive directors, executive directors and, where appropriate, executive KMP. It also reviews and
makes recommendations regarding the policies applicable to staff salary reviews.
In accordance with the Terms of Reference, the responsibilities of the Committee include:
• reviewing and recommending to the Board, the remuneration, allowances and incentives of executive and non-executive directors;
• overseeing compliance with statutory responsibilities relating to remuneration disclosure;
• reviewing policies and reporting responsibilities relating to employee share and option plans; and
• monitoring executive succession planning.
DIRECTORS’ REPORT C O N T I N U E D
F O R T H E Y E A R E N D E D 3 0 J U N E 2 0 0 8
For
per
sona
l use
onl
y

TOLL – ANNUAL REPORT 2008 23
The Committee consists of the three non-executive directors. The Company Secretary acts as Secretary of the Committee. The MD, executives
and professional advisors retained by the Committee may attend meetings by invitation. Any recommendation made by the Committee
concerning an individual director or executive’s remuneration is made without that director or executive being present.
For executive directors and executive KMP, remuneration programs are balanced with a mix of fi xed and variable rewards. To ensure that the
reward program elements are strategically integrated and effectively delivered the Committee holds meetings at least twice a year and as
required. Meetings are to be held once per each half year with at least one meeting to be held prior to the end of the fi nancial year to review
the senior executive salary review process. During the 2008 fi nancial year, six Committee meetings were held.
Remuneration structure
As noted above, the remuneration structure comprises three core elements which together form the annual total target remuneration for
an executive:
• fi xed remuneration;
• short-term incentive (STI); and
• long-term incentive (LTI).
The structure of both short and long-term incentives is performance based and aligned with the business strategy of the Group. As an executive’s
seniority level increases, the proportion of performance related remuneration (STI and LTI) increases as a proportion of the executive’s total
target remuneration.
The remuneration levels of KMP are determined by reference to the market for superior performing executives. Although reward levels must be
appropriately competitive, they must also be fi nancially responsible. The Group has, in most instances, historically positioned its remuneration
levels between the median and the upper quartile of its comparator group. Current year reviews sought to reposition the mix between fi xed and
variable remuneration with a greater emphasis towards at-risk remuneration.
Fixed remuneration
An executive’s fi xed remuneration includes:
• cash salary;
• benefi ts the executive has elected to receive in lieu of salary (inclusive of any fringe benefi ts tax); and
• superannuation.
The level of fi xed remuneration paid to each executive is based on the executive’s skills and experience, the requirements for their role and their
relevant labour market in terms of the particular industry and geographical location. In setting fi xed remuneration, the executive’s total potential
remuneration is taken into consideration to ensure an appropriate balance between fi xed and variable remuneration.
Fixed remuneration is reviewed annually to ensure that it remains market competitive for each executive and refl ects any changes in an
executive’s role. The executive’s performance as evaluated against objectives under the Group’s performance management system infl uences
recommendations relating to fi xed remuneration.
Recommendations concerning executive KMP fi xed remuneration levels are made by the Managing Director and are subsequently considered
by the Committee, or in the case of KMP’s who are subject to service contracts, the Board.
Short-term incentives
STI’s may be awarded to executives based on their annual performance as evaluated under the Group’s performance management system. In
addition, the Committee or Board may recommend the establishment of specifi c incentive programs linked to the achievement of key corporate
objectives, milestones or events. STIs are paid in cash or as superannuation contributions.
The STI for all executive directors and executive KMP considers performance metrics linked to measurable gains in the achievement of the
Group’s corporate objectives. Typically, the performance objectives comprise elements relating to individual performance, the performance of
the relevant business unit or division and the performance of the Group. Accordingly, the specifi c STI objectives vary from executive to executive
both in terms of their nature and the weighting of these objectives in accordance with the Group’s priorities. Group metrics relate to the
corporate objectives, strategic plans and fi nancial budgets approved by the Board.
For
per
sona
l use
onl
y

24
Remuneration Report – audited (Continued)
The Committee and the executive directors ensure all relevant STI measures are aligned with the organisation’s strategic objectives going
forward. Currently, the criteria relate to achievement of a mixture of budgeted EBIT, NPAT, revenue, EPS growth, cash based returns on assets,
debtors days outstanding and safety measures. For the 2008 fi nancial year, the performance measures for executive KMP are summarised in
the table below.
Measures EPS Debtors days outstanding Safety Other
Paul Little • •
Neil Chatfi eld • • • •
KMP Based upon Board approved corporate objectives, plans and budgets
The Board approves the executive directors’ specifi c performance objectives established with reference to the Board approved corporate
objectives, plans and budgets. The Managing Director approves the performance objectives for other executive KMP which are also based on
the Board approved corporate objectives, plans and budgets. Upon completion of the annual performance period, performance evaluations are
then conducted. Proposed incentive payments are then derived from this process having regard to the established performance objectives and
assessment criteria.
Long-term incentives
The LTI is the second variable component of remuneration. The intention of the LTI is to support the business strategy by aligning executive
remuneration with overall Group performance.
The LTI is equity-based and currently provided through the shareholder approved Senior Executive Option Plan in the form of performance
options. In the case of executive directors, any allocations of options are also subject to shareholder approval. Options are a right to acquire
a fully paid ordinary share in the Company for a specifi ed exercise price when performance hurdles are achieved during performance periods.
Historically, grants of options have been made every second year, but as a result of the review conducted last year a decision was made to
provide for an annual issue of options to executives. Annual grants will provide executives with a rolling three year focus (due to the three year
performance period), a greater retention effect due to the rolling amount at risk, and will provide the Board an annual opportunity to set new
three year targets and reconsider the choice of instruments, hurdles, targets and vesting, to ensure the LTI continues to satisfy shareholder
expectations while at the same time acting as an appropriate incentive for executives.
DIRECTORS’ REPORT C O N T I N U E D
F O R T H E Y E A R E N D E D 3 0 J U N E 2 0 0 8
For
per
sona
l use
onl
y
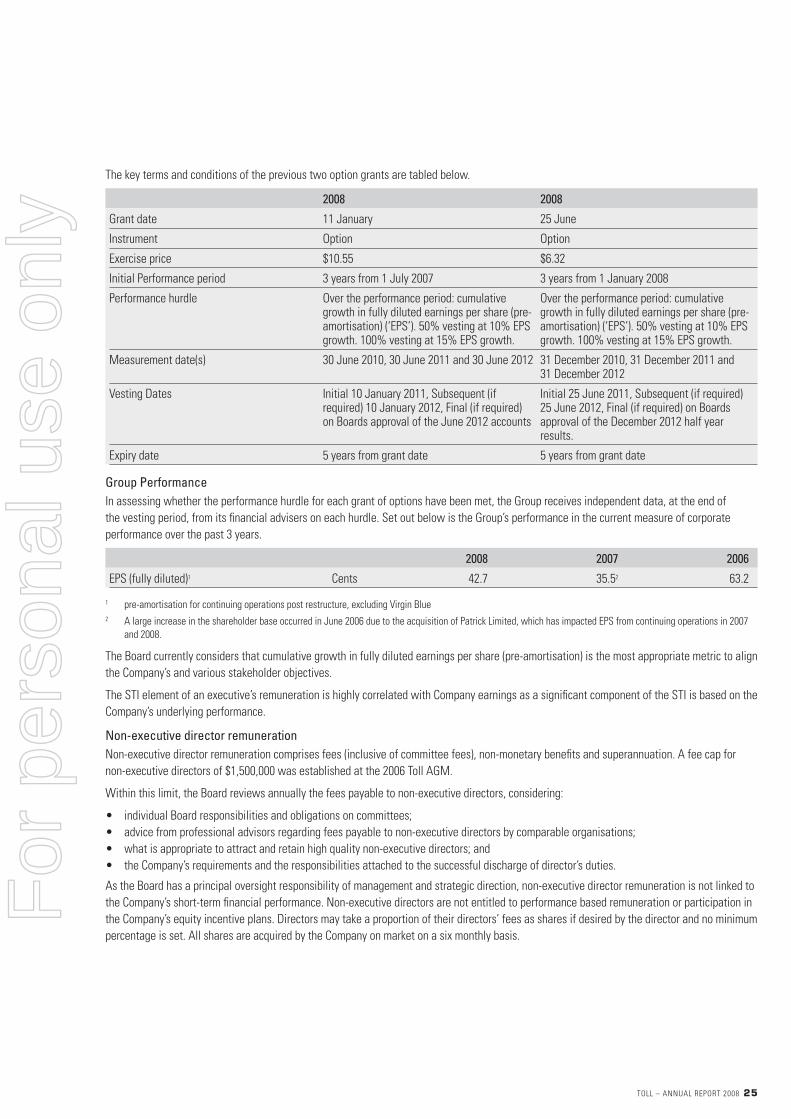
TOLL – ANNUAL REPORT 2008 25
The key terms and conditions of the previous two option grants are tabled below.
2008 2008
Grant date 11 January 25 June
Instrument Option Option
Exercise price $10.55 $6.32
Initial Performance period 3 years from 1 July 2007 3 years from 1 January 2008
Performance hurdle Over the performance period: cumulative growth in fully diluted earnings per share (pre-amortisation) (‘EPS’). 50% vesting at 10% EPS growth. 100% vesting at 15% EPS growth.
Over the performance period: cumulative growth in fully diluted earnings per share (pre-amortisation) (‘EPS’). 50% vesting at 10% EPS growth. 100% vesting at 15% EPS growth.
Measurement date(s) 30 June 2010, 30 June 2011 and 30 June 2012 31 December 2010, 31 December 2011 and 31 December 2012
Vesting Dates Initial 10 January 2011, Subsequent (if required) 10 January 2012, Final (if required) on Boards approval of the June 2012 accounts
Initial 25 June 2011, Subsequent (if required) 25 June 2012, Final (if required) on Boards approval of the December 2012 half year results.
Expiry date 5 years from grant date 5 years from grant date
Group Performance
In assessing whether the performance hurdle for each grant of options have been met, the Group receives independent data, at the end of
the vesting period, from its fi nancial advisers on each hurdle. Set out below is the Group’s performance in the current measure of corporate
performance over the past 3 years.
2008 2007 2006
EPS (fully diluted)1 Cents 42.7 35.52 63.2
1 pre-amortisation for continuing operations post restructure, excluding Virgin Blue
2 A large increase in the shareholder base occurred in June 2006 due to the acquisition of Patrick Limited, which has impacted EPS from continuing operations in 2007
and 2008.
The Board currently considers that cumulative growth in fully diluted earnings per share (pre-amortisation) is the most appropriate metric to align
the Company’s and various stakeholder objectives.
The STI element of an executive’s remuneration is highly correlated with Company earnings as a signifi cant component of the STI is based on the
Company’s underlying performance.
Non-executive director remuneration
Non-executive director remuneration comprises fees (inclusive of committee fees), non-monetary benefi ts and superannuation. A fee cap for
non-executive directors of $1,500,000 was established at the 2006 Toll AGM.
Within this limit, the Board reviews annually the fees payable to non-executive directors, considering:
• individual Board responsibilities and obligations on committees;
• advice from professional advisors regarding fees payable to non-executive directors by comparable organisations;
• what is appropriate to attract and retain high quality non-executive directors; and
• the Company’s requirements and the responsibilities attached to the successful discharge of director’s duties.
As the Board has a principal oversight responsibility of management and strategic direction, non-executive director remuneration is not linked to
the Company’s short-term fi nancial performance. Non-executive directors are not entitled to performance based remuneration or participation in
the Company’s equity incentive plans. Directors may take a proportion of their directors’ fees as shares if desired by the director and no minimum
percentage is set. All shares are acquired by the Company on market on a six monthly basis.
For
per
sona
l use
onl
y

26
Remuneration Report – audited (Continued)
During the reporting period, non executive director fees (inclusive of superannuation) were based on the following fee schedule effective
1 July 2007:
Board
Audit and Financial Risk
Committee(1)
Remuneration and Succession
Planning Committee(1)
Chairman $400,000 $25,000 $15,000
Members $140,000 $10,000 $10,000
(1) The chairman of the Board does not receive any additional payments for his role as chairmen or member of any sub committee.
Nomination and Governance Committee fees are incorporated in non executive director base Board remuneration.
Service Contracts
As reported last year, the Board considered it of critical importance to secure the services of certain key management personnel post the Group’s
restructure on 15 June 2007.
During the current reporting period, no additional Executive Service Deeds were entered into with KMP’s. Going forward it is the current
intention of the Board that for new executive service deeds, notice periods and associated payments will be based on Fixed remuneration.
As previously reported the following executives entered into three year Executive Service Deeds in April 2007.
Paul Little Managing Director
Neil Chatfi eld Chief Financial Offi cer
John Ludeke Divisional Director, Toll Australia Group and New Zealand
Stephen Stanley Director Strategy
Bernard McInerney Company Secretary
In all instances, the Executive Service Deeds provide for minimum notice periods by both the executive and the Company, with the Company
maintaining the discretion to, if appropriate, payout the required notice period.
Mr Little’s deed requires the Company to give 12 months written notice to terminate his services. Mr Little however is locked in for a period
of two years, and is after that time, able to give 6 months written notice.
Notice of termination requirements for all other executives noted above are 18 months by the Company and 6 months by the executive.
Remuneration is based on Total Employment Remuneration (TER) comprising Fixed Remuneration, Short Term Incentives and Long Term
Incentives and is reviewed annually by the Board with the assistance of remuneration consultants.
Remuneration for Short Term Incentives is based on performance hurdles as determined by the Board, taking into account Company and
individual targets.
Long Term Incentive remuneration values are converted into annual allocations of options or performance rights in accordance with the
Company’s Senior Executive Option and Rights Plan. Historically this has taken the form of fi ve year term options with vesting based on
appropriate performance hurdles with initial testing three years from grant date.
The basis and circumstances for Termination Payments embodied within the Executive Service Deeds entered into in April 2007 received
shareholder approval at an extraordinary general meeting held on 28 May 2007.
DIRECTORS’ REPORT C O N T I N U E D
F O R T H E Y E A R E N D E D 3 0 J U N E 2 0 0 8
For
per
sona
l use
onl
y

TOLL – ANNUAL REPORT 2008 27
In summary, they are as follows:
Mr Little
• Where Mr Little works out his full notice period, he will be paid a further six months remuneration. In the event that the Company
requests Mr Little not work out his notice period, the balance of the required notice period will be paid out based on his Total Employment
Remuneration.
• Where the Company gives Mr Little notice or the executive resigns and has agreed a planned retirement transition plan with the Company,
any outstanding options or rights will, subject to regulatory compliance, remain alive and remain subject to performance hurdles and
exercise requirements.
• Any Short Term Incentive (STI) component of notice termination payments will be based on historical performance achievement over a three
year period.
The above termination payments for Mr Little will not apply in the event that the Company terminates his services due to an event of summary
dismissal which would have the effect of being termination without notice or payment in lieu.
Termination payments and terms for the other executives are as per Mr Little’s conditions, with the exception that, as noted previously, relevant
notice periods are an additional six months and no additional six month payment is required should the executive work out the required notice
period.
The Executive Service Deeds also incorporate appropriate confi dentiality and non-compete clauses to protect the interests of the Company
and the requirement for the Company to obtain salary continuance insurance in the event of an executive’s illness or involuntary incapacity for
periods exceeding six months.
In determining the required notice periods and termination payments embodied in the Executive Service Deeds, the Board had regard to advice
from external remuneration consultants, the executive’s service period and contribution to the Company’s growth, shareholder and governance
guidelines, as well as future objectives of the Company. Having considered all of these factors, and the need to secure executive services post
the restructure, the Board considered the terms of the Executive Service Deeds to be both reasonable and appropriate in the circumstances.
For
per
sona
l use
onl
y

28
Remuneration Report – audited (Continued)
Remuneration of Key Management Personnel
Name Period
Primary Post Employment
Salary & Fees
$’000 Bonus
$’000
Deferred Compensation
$’000
Non Monetary Benefi ts
$’000
Super- annuation
$’000
Termination Benefi ts
$’000
Directors
Non Executive
Ray Horsburgh 2008 2007
239 29
– –
– –
46 30
70 105
– –
Harry Boon 20082007
–5
––
––
143–
25105
––
Mark SmithAppointed 01/07/07
20082007
39–
––
––
123–
13–
––
Barry CusackAppointed 01/10/07
20082007
51–
––
––
60–
10–
––
Frank FordAppointed 14/01/08
20082007
65–
––
––
––
6–
––
Alistair LucasRetired 26/10/06
2007
18
–
–
–
35
–
John MouleRetired 14/09/07
20082007
67175
––
––
–70
16105
274*–
Executive
Paul Little
20082007
2,0791,874
1,2752,000
–8,857
2121
100105
––
Neil Chatfi eld 20082007
975836
5853,700
–5,197
3131
69108
––
Mark RowsthornResigned 15/06/07
2007
1,459
–
8,857
20
105
8,272
Total 2008 3,515 1,860 – 424 309 274
Total 2007 4,396 5,700 22,911 172 668 8,272
* Payment of entitlement accrued under a retirement benefi ts program which was frozen as at 30 June 2003. No current directors have any accrued entitlement
to be paid.
DIRECTORS’ REPORT C O N T I N U E D
F O R T H E Y E A R E N D E D 3 0 J U N E 2 0 0 8
For
per
sona
l use
onl
y

TOLL – ANNUAL REPORT 2008 29
Equity Compensation Total
Bonus vested during year
Bonus forfeited during year
Performance related
remuneration Fixed
remuneration
Value of options as % of remuneration
Value of Options$’000 $’000 % % % % %
– –
355 164
– –
– –
– –
100 100
– –
––
168110
––
––
––
100100
––
––
175–
––
––
––
100–
––
––
121–
––
––
––
100–
––
––
71–
––
––
––
100–
––
–
53
–
–
–
100
–
––
357350
––
––
––
100100
––
1,870572
5,34513,429
59100
41–
58.885.1
41.214.9
35.04.3
900382
2,56010,254
67100
33–
58.090.5
42.09.5
35.23.7
572
19,285
–
–
48.9
51.1
3.0
2,770 9,152
1,526 43,645
For
per
sona
l use
onl
y
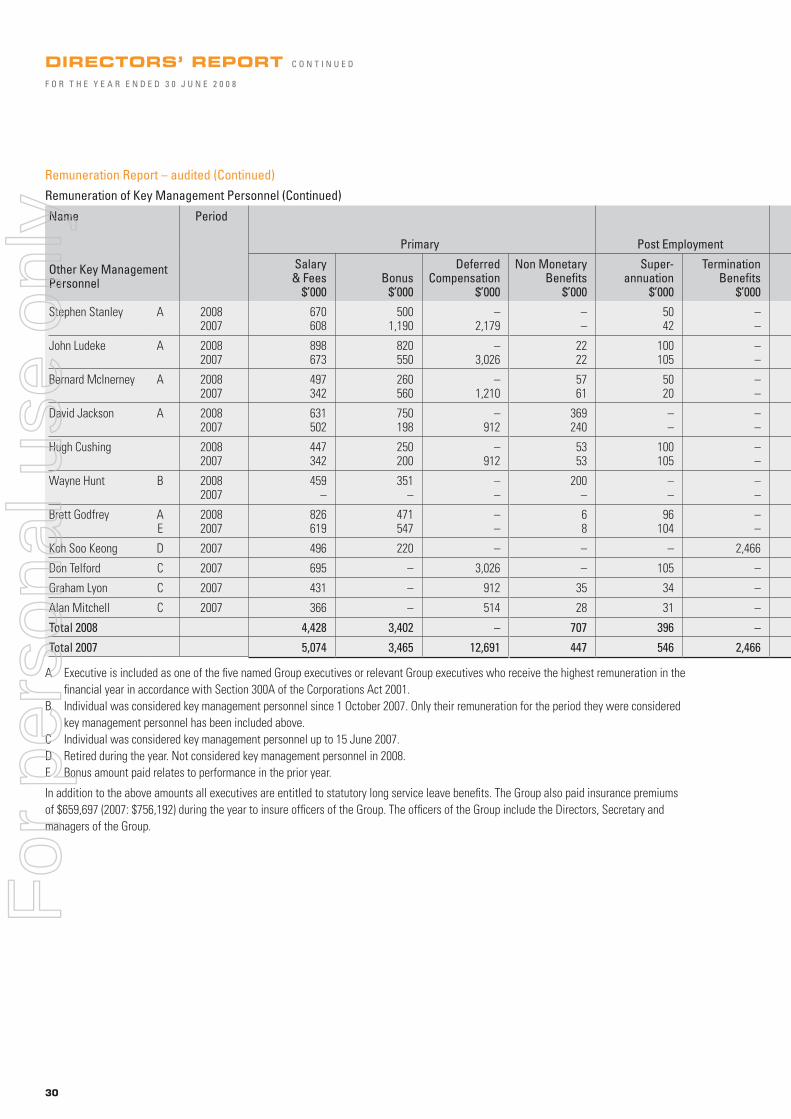
30
Remuneration Report – audited (Continued)
Remuneration of Key Management Personnel (Continued)
Name
Other Key Management Personnel
Period
Primary Post Employment
Salary & Fees
$’000 Bonus
$’000
Deferred Compensation
$’000
Non Monetary Benefi ts
$’000
Super-annuation
$’000
Termination Benefi ts
$’000
Stephen Stanley
A
20082007
670608
5001,190
–2,179
––
5042
––
John Ludeke
A
20082007
898673
820550
–3,026
2222
100105
––
Bernard McInerney
A
20082007
497342
260560
–1,210
5761
5020
––
David Jackson
A
20082007
631502
750198
–912
369240
––
––
Hugh Cushing
20082007
447342
250200
–912
5353
100105
––
Wayne Hunt
B
20082007
459–
351 –
– –
200 –
– –
––
Brett Godfrey
AE
20082007
826619
471547
––
68
96104
––
Koh Soo Keong D 2007 496 220 – – – 2,466
Don Telford C 2007 695 – 3,026 – 105 –
Graham Lyon C 2007 431 – 912 35 34 –
Alan Mitchell C 2007 366 – 514 28 31 –
Total 2008 4,428 3,402 – 707 396 –
Total 2007 5,074 3,465 12,691 447 546 2,466
A Executive is included as one of the fi ve named Group executives or relevant Group executives who receive the highest remuneration in the
fi nancial year in accordance with Section 300A of the Corporations Act 2001.
B Individual was considered key management personnel since 1 October 2007. Only their remuneration for the period they were considered
key management personnel has been included above.
C Individual was considered key management personnel up to 15 June 2007.
D Retired during the year. Not considered key management personnel in 2008.
E Bonus amount paid relates to performance in the prior year.
In addition to the above amounts all executives are entitled to statutory long service leave benefi ts. The Group also paid insurance premiums
of $659,697 (2007: $756,192) during the year to insure offi cers of the Group. The offi cers of the Group include the Directors, Secretary and
managers of the Group.
DIRECTORS’ REPORT C O N T I N U E D
F O R T H E Y E A R E N D E D 3 0 J U N E 2 0 0 8
For
per
sona
l use
onl
y
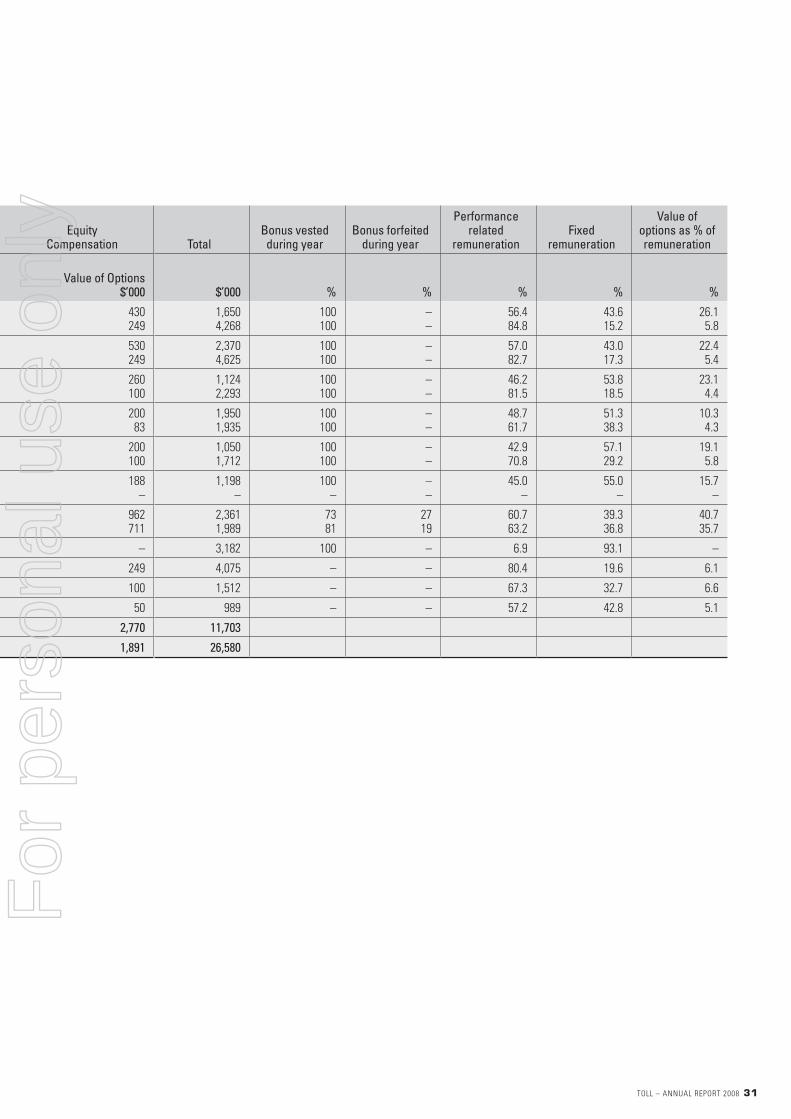
TOLL – ANNUAL REPORT 2008 31
Equity Compensation Total
Bonus vested during year
Bonus forfeited during year
Performance related
remuneration Fixed
remuneration
Value of options as % of remuneration
Value of Options $’000 $’000 % % % % %
430249
1,6504,268
100100
––
56.484.8
43.615.2
26.15.8
530249
2,3704,625
100100
––
57.082.7
43.017.3
22.45.4
260100
1,1242,293
100100
––
46.281.5
53.818.5
23.14.4
20083
1,9501,935
100100
––
48.761.7
51.338.3
10.34.3
200100
1,0501,712
100100
––
42.970.8
57.129.2
19.15.8
188 –
1,198 –
100 –
– –
45.0 –
55.0–
15.7–
962711
2,3611,989
7381
2719
60.763.2
39.336.8
40.735.7
– 3,182 100 – 6.9 93.1 –
249 4,075 – – 80.4 19.6 6.1
100 1,512 – – 67.3 32.7 6.6
50 989 – – 57.2 42.8 5.1
2,770 11,703
1,891 26,580
For
per
sona
l use
onl
y

32
Remuneration Report – audited (Continued)
Equity Instruments
Value of options granted, exercised and forfeited during the year are:
All options refer to options over ordinary shares of the Company, which are exercisable on a one-for-one basis under the Executive Share Option
Plan. The assessed fair value at grant date of options granted to directors and specifi ed executives is allocated equally over the period of three
years from grant date to vesting date, and the amount is included in the remuneration tables above. Fair values at grant date are independently
determined using the Binomial method.
During the reporting period, nil options were vested and nil shares were issued on the exercise of options previously granted as remuneration
(2007: 5,160,000). Non executive directors are not entitled to options.
2008 Date Granted*
Balance 1 July
‘000
Granted in Year
‘000
Directors – Executive
Paul Little 11/01/08 – 739
Neil Chatfi eld 11/01/08 – 356
Total – 1,095
Other Key Management Personnel
John Ludeke 11/01/08 – 209
Stephen Stanley 11/01/08 – 170
Hugh Cushing 11/01/08 – 79
Bernard McInerney 11/01/08 – 103
David Jackson 11/01/08 – 79
Wayne Hunt 25/06/08 – 120
Brett Godfrey – – –
Total – 760
* Value of exercised options during the year is calculated as the market price of shares of the Company on the ASX as at close of trading on the date the options were
exercised after deducting the price paid to exercise the option.
DIRECTORS’ REPORT C O N T I N U E D
F O R T H E Y E A R E N D E D 3 0 J U N E 2 0 0 8
For
per
sona
l use
onl
y

TOLL – ANNUAL REPORT 2008 33
Exercised/sold in Year
‘000
Balance 30 June
‘000 Option Value
$
Amount paid per share
$
Total Amount paid
$’000
Total Option Value*
$’000
– 739 2.53 – – –
– 356 2.53 – – –
– 1,095 – –
– 209 2.53 – – –
– 170 2.53 – – –
– 79 2.53 – – –
– 103 2.53 – – –
– 79 2.53 – – –
– 120 1.57 – – –
– – – – – –
– 760 – –
For
per
sona
l use
onl
y

34
Remuneration Report – audited (Continued)
Equity Instruments (continued)
Value of options granted, exercised and forfeited during the previous year are:
2007 Date Granted
Balance 1 July
‘000
Exercised/sold in Year
‘000
Directors – Executive
Paul Little 31/10/02 800 800
Paul Little 02/11/04 500 500
Mark Rowsthorn 31/10/02 800 800
Mark Rowsthorn 02/11/04 500 500
Neil Chatfi eld 28/10/04 350 350
Total 2,950 2,950
Other Key Management Personnel
John Ludeke 09/09/04 300 300
Don Telford 09/09/04 300 300
Terry Mallon 09/09/04 300 300
Stephen Stanley 25/01/02 400 400
Stephen Stanley 09/09/04 300 300
Hugh Cushing 09/09/04 120 120
Graham Lyon 09/09/04 120 120
Bernard McInerney 09/09/04 120 120
Alan Mitchell 09/09/04 60 60
David Jackson 29/05/00 10 10
David Jackson 25/01/02 80 80
David Jackson 09/09/04 100 100
Koh Soo Keong** – – –
Brett Godfrey – – –
Total 2,210 2,210
* Value of exercised options during the year is calculated as the market price of shares of the Company on the ASX as at close of trading on the date the options were
exercised after deducting the price paid to exercise the option
** Koh Soo Keong was granted 250,000 options on 4 October 2006 which were forfeited on his resignation in April 2007.
DIRECTORS’ REPORT C O N T I N U E D
F O R T H E Y E A R E N D E D 3 0 J U N E 2 0 0 8
For
per
sona
l use
onl
y

TOLL – ANNUAL REPORT 2008 35
Balance 30 June
‘000 Option Value
$
Amount paid per share
$
Total Amount paid
$’000
Total Option Value*
$’000
– 2.56 7.32 5,855 11,984
– 2.56 12.87 6,434 520
– 2.56 7.32 5,855 5,272
– 2.56 12.87 6,434 520
– 2.75 10.95 3,833 1,036
– 28,411 19,332
– 2.09 10.95 3,285 3,801
– 2.09 10.95 3,285 1,038
– 2.09 10.95 3,285 3,801
– 1.71 6.75 2,700 5,520
– 2.09 10.95 3,285 915
– 2.09 10.95 1,314 366
– 2.09 10.95 1,314 1,520
– 2.09 10.95 1,314 366
– 2.09 10.95 657 760
– 1.71 1.99 20 127
– 1.71 6.75 540 635
– 2.09 10.95 1,095 1,267
– – – – –
– – – – –
– 22,094 20,116
For
per
sona
l use
onl
y
36
Insurance of offi cers
During the fi nancial year, the Group paid premiums of $659,697 (2007: $756,192) to insure offi cers of the Company and related bodies corporate.
The offi cers of the Group covered by the insurance policy include the directors, Paul Little, Mark Smith, John Moule, Neil Chatfi eld, Ray
Horsburgh, Harry Boon, Barry Cusack, Frank Ford and the secretary, Bernard McInerney. Other offi cers covered by the policy are directors or
secretaries of controlled entities who are not also directors or secretaries of the Group, past directors of companies within the Group and
managers of the Group.
The liabilities insured, subject to specifi c exclusions, include costs and expenses that may be incurred in defending civil or criminal proceedings
that may be brought against the offi cers in their capacity as offi cers of the Company or a related body corporate.
Indemnifi cation of offi cers
The Company has agreed to indemnify the directors of the Company and the secretary, and its controlled entities, against all liabilities to another
person (other than the Company or a related body corporate) that may arise from their position as directors or secretary of the Company and its
controlled entities, except where the liability arises out of conduct involving a lack of good faith. The agreement stipulates that the Company will
meet the full amount of any such liabilities, including costs and expenses.
Rounding off
The Company is of the kind referred to in ASIC Class Order 98/100 dated 10 July 1998 (updated by CO 05/641 effective 28 July 2005 and
CO 06/51 effective 31 January 2006) and in accordance with that Class Order, amounts in the fi nancial report, and directors’ report have
been rounded off to the nearest decimal of a million dollars, unless otherwise stated.
Non audit services
During the year KPMG, the Company’s auditor has performed certain other services in addition to its statutory duties.
The board has considered the non audit services provided during the year by the auditor and, in accordance with a resolution of the Audit and
Financial Risk Committee, is satisfi ed that the provision of those non-audit services during the year by the auditor is compatible with, and did
not compromise, the auditor independence requirements of the Corporations Act 2001 for the following reasons:
• all non-audit services were subject to the corporate governance procedures adopted by the Group and have been reviewed by the audit
committee to ensure they do not impact the integrity and objectivity of the auditor; and
• the non-audit services provided do not undermine the general principles relating to auditor independence as set out in Professional
Statement F1 Professional Independence, as they did not involve reviewing or auditing the auditor’s own work, acting in a management
or decision making capacity for the Group, acting as an advocate for the Group or jointly sharing risks and rewards.
DIRECTORS’ REPORT C O N T I N U E D
F O R T H E Y E A R E N D E D 3 0 J U N E 2 0 0 8
For
per
sona
l use
onl
y

TOLL – ANNUAL REPORT 2008 37
Auditor’s Remuneration
Details of the amounts paid to the auditor of the Company, KPMG, and its related practices for audit and non-audit services provided during the
year are set out below. In addition, amounts paid to other auditors for statutory audit and other services are also disclosed.
Consolidated
2008 $’000
2007 $’000
Audit services:
Auditors of the Company – audit and review of fi nancial reports
KPMG Australia 1,646 1,964
Overseas KPMG fi rms 998 469
Other auditors
Audit and review of fi nancial reports (non-KPMG fi rms) – 84
2,644 2,517
Other services:
Taxation services
KPMG Australia 2,950 4,883
Overseas KPMG fi rms 191 129
Non KPMG fi rms – –
Other assurance services
KPMG Australia 175 132
Overseas KPMG fi rms 7 3
Other services
KPMG Australia 276 77
Related practices of KPMG – due diligence services 277 4,638
Related practices of KPMG – Other 38 100
Non KPMG fi rms – –
3,914 9,962
For
per
sona
l use
onl
y

38
Lead Auditor’s Independence Declaration under Section 307C of the Corporations Act 2001
The lead auditors independence declaration is set out on the following page and forms part of the directors’ report for the year ended
30 June 2008.
Auditor
KPMG continues in offi ce in accordance with Section 327 of the Corporations Act 2001.
This report is made in accordance with a resolution of the directors.
R Horsburgh P A Little
Director Director
Dated at Melbourne this 8th day of September 2008.
Lead Auditor’s Independence Declaration under Section 307C of the Corporations Act 2001
To: the directors of Toll Holdings Limited
I declare that, to the best of my knowledge and belief, in relation to the audit for the fi nancial year ended 30 June 2008, there have been:
(i) no contraventions of the auditor independence requirements as set out in the Corporations Act 2001 in relation to the audit; and
(ii) no contraventions of any applicable code of professional conduct in relation to the audit.
KPMG
Paul Shannon
Partner
Melbourne
8 September 2008
DIRECTORS’ REPORT C O N T I N U E D
F O R T H E Y E A R E N D E D 3 0 J U N E 2 0 0 8
For
per
sona
l use
onl
y
TOLL – ANNUAL REPORT 2008 39
This report outlines the Group’s annual statement on its corporate
governance framework. In August 2007, the ASX Corporate
Governance Council issued a revised version of the ASX Corporate
Governance Principles and Recommendations which will be
effective in respect of the Group’s 2009 reporting period. Except
where indicated, the Group’s corporate governance framework
is in accordance with the revised ASX Corporate Governance
Council’s Corporate Governance Principles and Recommendations
(ASX Guidelines). During the year these policies and practices
have been enhanced to address new requirements and
expectations where necessary, and refl ect developments within
the Group.
Information on all the charters/terms of reference, and documents
and policies referred to in this report are contained on the Group’s
website at http://www.toll.com.au/about_corporategovern.html.
1. Board of Directors
The Board is chaired by an independent Non–Executive Director.
The roles of the Chairman and the Managing Director are
separate, and the Managing Director and Chief Financial Offi cer
are the only Executive Directors on the Board.
1.1 Board Charter
The Board operates under a formal Charter which details its
functions and responsibilities.
In summary:
a) The Board seeks to ensure that it adds value by guiding,
assisting and supporting management to achieve the
Company’s goals. This includes creating and maintaining a
company which generates sustainable growth and profi tability
for the benefi t of all stakeholders. The Board is committed to
abiding by all relevant laws and regulations and to provide
employees with a safe and rewarding working environment.
It will have consideration in its deliberations for the broader
community, external and internal stakeholders and the
Company’s responsibilities as a corporate citizen of good
standing.
b) The Board is responsible for the overall operation and
stewardship of the Group and, in particular, is responsible
for strategy, risk management, reporting and disclosure,
management performance, corporate governance, Board
committees and delegation of authority to management.
The Board has delegated the day to day management of the
Group’s business to management.
c) The Board’s role includes evaluating the performance of
the Managing Director, approving criteria for assessing,
monitoring and evaluating the performance of senior
executives, as well as undertaking an annual performance
review of the Board’s own effectiveness.
d) In addition to its regular meetings, the Board’s annual
program includes reviews of Company activities and
strategies, and Directors participate in visitation of operations
around the Group. Opportunities are provided both at and
outside Board meetings for Directors to meet with senior
executives and personnel. The Board plans to continue these
important interactions.
e) Non-Executive Directors are, amongst other matters, advised
of the Board’s Charter in formal letters of appointment to the
Board.
1.2 Review of Board and Board Committee Performance
On an annual basis, the Chairman discusses Board and Committee
effectiveness with the Board as a whole and with each Director
individually, using as a resource assessments of the competencies
of the Board and its Committees contributed to by each Board
member at the time. These discussions form the basis for further
Board consideration of continuous improvement.
The performance of the Board, Committees and Directors
was evaluated during the reporting period with each Director
completing a detailed questionnaire which was summarised,
evaluated and reported to the Board by the Chairman.
1.3 Board Composition
Members of the Board bring considerable and wide-ranging
competencies to Board considerations. These include skills,
experience and expertise in international business, global
manufacturing and sales, product development, major resource
industries, railways management, fi nance and accounting,
mergers and acquisitions, general management plus extensive
experience in transport logistics management and development.
The Board’s policy and procedures for the nomination, selection
and appointment of Directors can be found on the Group’s website
at http://www.toll.com.au/about_corporategovern.html.
The names and further information regarding the skills,
experience, qualifi cations and relevant expertise of the Directors
and secretary are set out in the Directors’ Report.
Details of the Directors, their tenure and attendance at Board and
Committee meetings can be found in the Directors’ Report.
The Board’s intention is that it should, at all times, be composed
of a majority of independent Non-Executive Directors, which
includes the Chairman. The Board met this criterion during the
full year under review. Independent Non-Executive Director
representation was further strengthened on 1 October 2007 and
14 January 2008 with the appointment to the Board of Barry
Cusack and Frank Ford respectively.
The Board considers that, fundamentally, the independence of
Directors is based on their capacity to put the best interests of
the Company and its shareholders ahead of all other interests,
so that Directors are capable of exercising objective independent
judgement. Capacity to act independently and the skill sets and
experience of individual Directors to complement the skills and
experience of the Board overall are critical criteria in candidate
selection. The capacity for individual Directors to add value to the
Board is very important.
CORPORATE GOVERNANCE STATEMENT
F O R T H E Y E A R E N D E D 3 0 J U N E 2 0 0 8
For
per
sona
l use
onl
y
40
1. Board of Directors (continued)
When evaluating candidates, the Board has regard to the
potential for confl icts of interest, whether actual or perceived, and
the extent or materiality of these in the ongoing assessment of
Director independence. In this respect, the Board has regard to the
defi nition of ‘Independent Directors’ in the ASX Guidelines. The
Board does not believe that the existence of one or more of the
‘Relationships affecting independent status’ in the ASX Guidelines
will necessarily result in the relevant Director not being classifi ed
as ‘independent’, particularly given the Board’s criteria outlined
above, and the additional safeguards the Company will seek to
implement in order to ensure independence. An overall review
of these considerations is conducted by the Board annually,
and more often if considered necessary, to determine whether
individual Directors are ‘independent’.
Additional policies, such as Directors not being present during
discussions or decision making in matters in which they have or
could be seen to potentially have a material confl ict of interest,
as well as Directors being excluded from taking part in the
appointment of third party service providers where the Director
has an interest, provide further separation and safeguards for the
maintenance of independence.
The Board has considered the implementation of a set of pre-
determined materiality thresholds in relation to assessing
Director independence, but has determined not to establish fi xed
thresholds, believing that, if taken in isolation and out of context,
these can be misleading and inconclusive. Accordingly, the Board
assesses each Director’s independence on an individual basis.
The Board has considered the circumstances of each Director and
determined that all its Non-Executive Directors were independent
during the reporting period.
In accordance with the Corporations Act 2001 and the Company’s
Constitution, Directors must keep the Board advised, on an
ongoing basis, of any interest that could potentially confl ict with
those of the Company, and any development which may impact
the Director’s perceived or actual independence. Procedures are in
place for Directors to disclose potential confl icts of interest.
In order to assist Directors in fulfi lling their responsibilities, each
Director has the right, with the Chairman’s prior approval, to
seek independent professional advice at the Group’s expense. In
addition, the Board, and each committee, at the expense of the
Group, may obtain whatever professional advice it requires to
assist in its work.
1.4 Tenure and Retirement
Directors appointed to casual vacancies during any reporting
period are required to stand for election at the next general
meeting of members.
Directors, excluding the Managing Director, are required to retire
and, if available and eligible, are able to stand for re-election at
least once every three years.
2. Board Committees
To assist in the execution of its responsibilities, the Board has
established a number of Board Committees, comprising the:
a) Nomination and Corporate Governance Committee;
b) Audit and Financial Risk Committee; and
c) Remuneration and Succession Planning Committee.
These Committees:
a) each have their own written terms of reference, which are
reviewed and updated as appropriate;
b) report to the Board on matters attended to by them at the fi rst
Board meeting following each Committee meeting;
c) as noted above, are authorised to seek any information they
require from any offi cer or employee of the Company, and may
take such independent professional advice as they consider
appropriate;
d) have no executive powers regarding their fi ndings and
recommendations; and
e) must have a Chairman and a majority of members as
independent Non Executive Directors.
The Board may, at any time, determine to address matters
identifi ed within a Committee’s terms of reference at the full
Board level.
Details of members and their attendance at committee meetings
during the year are set out in the Directors’ Report.
2.1 Nomination and Corporate Governance Committee
The Nomination and Corporate Governance Committee is
required to have no less than three Directors (including the
Managing Director), the majority of which must be independent
Non-Executive Directors. The Chairman of the Nomination and
Corporate Governance Committee must also be an independent
Non-Executive Director. The Committee meets as necessary, and
has met on fi ve occasions during the reporting period.
Membership of the Nomination and Corporate Governance
Committee throughout the reporting period comprised all
independent Non-Executive Directors and the Managing Director,
and the Chairman of the Committee, Ray Horsburgh, who was at
all times an independent Non-Executive Director.
The purpose of the Nomination and Corporate Governance
Committee is to assist the Board by:
(a) reviewing the size and composition of the Board and making
recommendations to the Board with regard to any appropriate
changes;
(b) providing advice to the Board with respect to the necessary
and desirable competencies of Directors;
(c) establishing a criteria for membership selection and ensuring
the criteria is used in making recommendations to the Board
for the appointment and removal of Directors;
CORPORATE GOVERNANCE STATEMENT C O N T I N U E D
F O R T H E Y E A R E N D E D 3 0 J U N E 2 0 0 8
For
per
sona
l use
onl
y

TOLL – ANNUAL REPORT 2008 41
(d) in a timely manner, making recommendations to the Board
whether or not Directors, whose term of offi ce is expiring,
should be proposed for re-election at the Company’s next
AGM;
(e) developing a policy and procedures for the selection and
appointment of Directors;
(f) identifying individuals who may be qualifi ed to become
Directors, having regard to such factors as the Committee
considers appropriate, including independence, judgement,
skill, diversity, experience with business and other
organisations of a comparable size, the interaction of the
candidate’s experience with the experience of other Board
members, and the extent to which the candidate would be a
desirable addition to the Board and any Board Committees;
(g) ensuring that an effective orientation program for new
Directors is in place, and reviewing as necessary its
effectiveness;
(h) identifying Directors qualifi ed to fi ll vacancies on Board
Committees and making recommendations to the Board
in relation thereto, having regard to such factors as the
Committee considers appropriate, including the Terms of
Reference of the particular Board Committee, the Director’s
experience, the interaction of the Director’s experience
with the experience of other Committee members, and
the Principles of Good Governance and Best Practice
Recommendations of the ASX Corporate Governance Council;
(i) establishing and reviewing Board succession plans on a
regular basis to maintain an appropriate balance of skills,
experience and expertise on the Board and providing advice
to the Board on those matters;
(j) developing and implementing a plan for identifying, assessing
and enhancing Director competencies;
(k) establishing procedures for use by the Committee to evaluate
the performance of the Board and each Director, including an
assessment of whether each Director has devoted appropriate
time to their duties;
(l) considering and making recommendations to the Board on the
Board’s operations;
(m) reviewing the Company’s approach to Corporate Governance,
having regard to the ASX Corporate Governance Principles,
and establishing procedures to promote compliance, where
considered necessary;
(n) periodically reviewing the Corporate Code of Practice, as well
as procedures to promote compliance;
(o) reviewing policies and advising the Board on sensitive issues
or practices where necessary; and
(p) periodically reviewing the Company’s Continuous Disclosure
Policy.
2.2 Remuneration and Succession Planning Committee
The Remuneration and Succession Planning Committee is required
to have no less than three Non-Executive Directors, the majority
of which must be independent. The Chairman of the Remuneration
and Succession Planning Committee must be an independent
Non-Executive Director. The Committee formally meets twice
a year and more frequently where necessary.
Membership of the Remuneration and Succession Planning
Committee throughout the reporting period has varied, however,
it now comprises three independent Non-Executive Directors
including the Chairman of the Committee, Harry Boon, who
was at all times an independent Non-Executive Director.
The Remuneration and Succession Planning Committee reviews
and makes recommendations to the Board on remuneration
packages and policies applicable to the Managing Director,
Non-Executive Directors and, where appropriate, senior executives.
The Committee may also review and make recommendations
regarding the policies applicable to staff salary reviews generally.
One of the requirements of the Committee is to ensure remuneration
levels are competitively set in order to attract and retain
appropriately qualifi ed and experienced Directors and
senior executives.
The duties of the Remuneration and Succession Planning
Committee are as follows:
a) review, determine and make recommendations to the
Board on the Managing Director’s (Chief Executive Offi cer)
remuneration, and where considered appropriate, contracted
executives remuneration, allowances and incentives;
b) review and make recommendations to the Board on
Non-Executive Directors fees;
c) review and if considered appropriate, make recommendations
to the Managing Director on remuneration, allowances and
incentives of other uncontracted Executive Directors of the
Board;
d) review and ratify other Senior Executive (at least all fi rst
level reports to Managing Director (Chief Executive Offi cer))
remuneration, allowances and incentives;
e) oversee compliance with statutory responsibilities relating
to remuneration disclosure;
f) review policies and reporting responsibilities relating to
employee share, rights, phantom units and option plans;
g) review senior executive, Director and Non-Executive Director
retirement and termination payments (if any);
h) review adequacy of professional indemnity and Directors
and Offi cers liability insurance policy; and
i) establish and monitor executive succession planning.
For
per
sona
l use
onl
y

42
2. Board Committees (continued)
The Group’s Remuneration Policy is performance driven and is
designed to support the needs and direction of the business.
The level of remuneration of Non-Executive Directors, executive
Directors and other senior executives is determined by reference
to the market via survey data and input from external professional
remuneration consultants. Remuneration programs are designed
to be appropriately competitive whilst being fi nancially
responsible.
Executive Directors and Senior Executives
For Executive Directors and other senior executives, remuneration
programs are balanced with a mix of fi xed and variable rewards.
The structure of both short and long term variable incentives is
performance based.
Short-term incentives typically require the achievement of goals
relating to annual Business Unit/Division/Group performance, or
achieving strategic objectives.
Long-term incentives through the shareholder-approved Senior
Executive Option and Rights Plan focus on linking executive
reward with overall Group performance. Details of the current
performance hurdles to be met are set out in the Remuneration
Report.
Non Executive Directors
Non Executive Director remuneration comprises Board and
Committee fees (inclusive of superannuation or an allowance for
superannuation). In accordance with the NED Share Plan, Non
Executive Directors are able to sacrifi ce Director fees to acquire
shares during relevant trading windows (subject to the Company’s
Securities Trading Policy).
Unlike executives, Non Executive Directors do not receive any
performance related remuneration and are not entitled to any
retirement benefi ts. Further information and the components of
remuneration for Directors and senior executives, together with
the Remuneration Report, are set out in the Directors’ Report.
2.3 Audit and Financial Risk Committee
The Audit and Financial Risk Committee is required to have
no less than three members who must all be Non-Executive
Directors, with the majority being independent Non Executive
Directors. The Chairman of the Audit and Financial Risk
Committee must be an independent Non Executive Director. The
Committee meets at least three times a year and more frequently
where necessary.
During the reporting period, chairmanship of this committee
passed from Ray Horsburgh to Mark Smith, and all members were
independent Non Executive Directors.
The Audit and Financial Risk Committee considers any matters
relating to the fi nancial affairs of the Group and the external audit.
In addition, the Committee examines any other matters referred to
it by the Board.
The duties of the Audit and Financial Risk Committee are as
follows:
a) monitor any matters outstanding with auditors, Australian
Taxation Offi ce, Australian Securities and Investments
Commission, Australian Securities Exchange and fi nancial
institutions and compliance with the Corporations Act 2001
and ASX Listing Rules;
b) monitor corporate risk assessment and internal controls;
c) review and monitor compliance with the Company’s Auditor
Independence Policy;
d) liaise with external auditors;
e) review the annual audit plan with the auditors;
f) review information derived from the audit;
g) review interim fi nancial information;
h) review accounting policies;
i) review effectiveness of internal audit and cross divisional
reviews;
j) monitor risks relating to business continuity, disaster recovery,
reputation, currency exposure and interest rate exposure;
k) review compliance with relevant government regulations;
l) assess the performance of fi nancial management;
m) review adequacy of insurance coverage;
n) recommend to the Board the selection and appointment,
rotation, re-appointment or replacement of the external
auditors;
o) review performance and compensation of the external
auditors; and
p) supervise special investigations as directed by the Board.
Meetings are held at least three times a year or as otherwise
required, including:
a) at the fi nal planning stage of the external audit;
b) before the issue of the half yearly profi t announcement; and
c) before the issue of the fi nal profi t announcement and approval
of the annual report and accounts.
In carrying out its duties, the Audit and Financial Risk Committee
reviews a number of certifi cates and reports from management
on various aspects of the Company. This is necessary for
the maintenance of a high standard of audit and fi nancial
risk management, and is of particular importance when the
Committee is considering the profi t announcement and whether
to recommend the annual report and accounts to the Board.
Declarations are made by the relevant managers on various
aspects of risk and fi nances, including:
a) a statement in writing to the Board signed by the Managing
Director and Chief Financial Offi cer certifying that the
Company’s fi nancial reports present a true and fair view, in
all material respects, of the Company’s fi nancial condition
and operational results and are in accordance with relevant
accounting standards. For further detail on this certifi cate,
please see the below section titled ‘Risk Management’;
CORPORATE GOVERNANCE STATEMENT C O N T I N U E D
F O R T H E Y E A R E N D E D 3 0 J U N E 2 0 0 8
For
per
sona
l use
onl
y

TOLL – ANNUAL REPORT 2008 43
b) statements on the operation of and compliance with a sound
system of risk management and internal compliance and
control of exposure to material risks, supported by appropriate
sign offs from divisional and business unit management; and
c) the risk management and governance-management
declaration. This declaration includes the formal evaluation
of risk management, compliance and internal control for
material business risks across all business units, divisions
and Group functions, and complements the existing fi nancial
statements certifi cation and further builds transparency and
accountability.
3. Ethical and Responsible Decision Making
All Directors, managers and employees are expected to act
with integrity and objectivity, striving at all times to enhance
the reputation and performance of the Group. Accordingly, the
Group has established policies in order to maintain confi dence
in the Group’s integrity, encourage compliance with both legal
obligations and stakeholder expectations, and to ensure all
employees are responsible and accountable to report unethical
practices and are protected from recrimination where such reports
are made.
The Company has also developed a Toll Disclosure Hotline policy
to enable all employees the opportunity to anonymously report
unethical or inappropriate behaviour via an independent third
party. This Hotline is currently being implemented.
The Group’s Code of Practice, which has been in place for several
years and is issued to all employees, was supplemented in 2004
with the Code of Conduct for Directors and Senior Executives. This
Code was based on a code prepared by the Australian Institute of
Company Directors.
Notwithstanding the above policy, employees are encouraged to
report unacceptable behaviour to their nominated supervisors.
4. Securities Trading Policy
The Group has in place a detailed securities trading policy.
In summary:
a) all Directors, executives and employees are prohibited
from trading in the Company’s securities, related fi nancial
products and derivatives whenever they have price sensitive
information which is not generally available; and
b) where paragraph a) above does not apply, trading for
Directors and senior executives is restricted to the six-week
period commencing on:
(i) the second full trading day following the release of the
half year results;
(ii) the second full trading day following the release of the
full year results;
(iii) the release of a disclosure document (e.g. a prospectus)
by the Group;
(iv) the second full trading day following the Annual General
Meeting; and
(v) any other Board sanctioned occasions where price
sensitive information has been released by the Company.
In respect of purchases under the NED Share Plan for
Non-Executive Directors, these may only be made during the
six-week period commencing on the second full trading day
following the release of half year and full year results.
5. Approach to Risk Management
Good risk management underpins a successful business and is
an integral part of the management processes and culture of the
Group. The Group embraces the active management of risk by all
its employees, supported by clear accountability and performance
evaluation, to achieve strategic and business objectives. Whilst
the acceptance of risk is necessary to achieving corporate goals,
success is derived from the Group’s ability to identify key risks in a
timely manner and implement appropriate strategies to maximise
business opportunities, manage uncertainties and minimise
potential hazards. By continually evaluating the risk and reward
balance, and building risk management into daily activities, the
Group’s risk management framework addresses the interests of
all stakeholders – including shareholders, customers, suppliers,
regulators, employees and members of the public.
The Managing Director is responsible for implementation of the
risk management policy and internal compliance and control
system. In practice, Divisional Directors are responsible for
risk management within their respective divisions. To promote
accountability, Divisional Directors delegate day-to-day
responsibility for risk management, compliance and control to
Business Unit General Managers. This responsibility includes
adopting the Group standard approach to designing and
implementing a sound system of risk management and internal
control that identifi es, assesses, monitors, and manages key risks
that impact achievement of business objectives. Specialist risk
and occupational health and safety (OH&S) managers support
business units in establishing and monitoring risk management
processes and awareness within their specialist areas.
The Board, through the Audit and Financial Risk Committee,
oversees the establishment, implementation and ongoing review
of the Group’s risk management and internal compliance and
control system. The internal control system covers strategic,
fi nancial, operational and compliance risks. The Audit and
Financial Risk Committee also approves the annual program and
scope of Business Assurance and Internal Audit (BA&IA) reviews.
The Nomination and Corporate Governance Committee reviews
corporate governance practice and relevant Company policies
where required.
For
per
sona
l use
onl
y

44
5. Approach to Risk Management (continued)
The Board has received and considered the annual certifi cation
from the Managing Director and Chief Financial Offi cer which
states that:
a) in their opinion, the Company’s fi nancial records have been
properly maintained and the fi nancial reports for the year
ended 30 June 2008 present a true and fair view, in all
material respects, of the fi nancial position and operational
results of the Company and Group and are in accordance with
relevant accounting standards in all material respects; and
b) to the best of their knowledge and belief:
(i) the statements in (a) above regarding the integrity of
the fi nancial reports are founded on a sound system of
risk management and internal compliance and control in
relation to fi nancial reporting risks which implements the
fi nancial and governance policies adopted by the Board;
(ii) the Group’s risk management and internal compliance and
control systems, relating to fi nancial reporting risks for
the year ended 30 June 2008, were operating effectively
in all material respects, based on the risk management
and compliance model adopted by the Group;
(iii) there is a sound system of risk management and internal
compliance and control which implements those policies
adopted by the Board in relation to other material
business risks, and the system is operating effi ciently
in all material respects;
(iv) nothing has come to their attention since 30 June 2008
that would indicate any material change to the
statements made in (i), (ii) and (iii) above; and
(v) majority-owned entities and material joint ventures
are included for the purposes of this statement.
This certifi cation provides a reasonable level of assurance,
however does not imply a guarantee against adverse events or
more volatile outcomes arising in the future. The certifi cations:
a) are supported by a framework of detailed risk management
and governance declarations which are signed off by the
relevant business unit General Managers, Divisional Directors
and selected Corporate/Group executives;
b) continue to evolve in line with changing business structure,
risk and compliance requirements; and
c) are thoroughly reviewed and further cross-referenced to the
results of other audit and assurance processes (internal and
external), management enquiries, business performance
reporting and specifi c verifi cation as appropriate.
The certifi cation relating to fi nancial reporting and other material
business risks and controls covers the period up to signing the
annual fi nancial report.
Integrated risk management programs aimed at ensuring risks
are identifi ed, assessed and appropriately managed, and include
regular reports to the Board on the status of business risks.
The Audit and Financial Risk Committee also receives reports
on fi nancial risks in accordance with its charter, and is further
responsible for reviewing the effectiveness of the Group’s risk
management and internal control system.
As a transport and logistics provider, the Group is focused on
managing key business risks that may arise from such matters
as OH&S (including vehicle and driver safety, and fatigue
management), environment and property management, the Fuel
Tax Credit system, business continuity, managing customer service
and supplier expectations, contractual obligations, transport
industry consolidation, fi nancial and capital management, risk
fi nancing and insurance, fl uctuations in fuel prices and the
development and use of information systems and technology. The
Group’s approach to managing many of the existing operational
and fi nancial risks is outlined in ‘Internal Compliance and Control’
section of this report below.
The full text of the Group’s comprehensive Risk Management
Policy and Internal Compliance and Control System is set out
in the Risk Management Policy Statement in the Corporate
Governance section of the Group’s website (www.tollgroup.com –
About Toll – Corporate Governance).
5.1 Management of business risks, including the
obligations from undertakings provided to the ACCC
Some of the more signifi cant emerging business risk areas that
must be effectively managed include the Group’s presence and
growth in the Asian region, its expansion into global freight
forwarding via the BALtrans acquisition, and satisfactory
compliance with the ACCC undertakings arising from the
demerger of the Asciano Group on 15 June 2007. (A dedicated
project team is responsible for implementing a compliance
framework to ensure the Group’s obligations in relation to the
ACCC undertakings are satisfi ed).
As the market is aware, Toll Holdings has given undertakings
to the ACCC on the acquisition of Patrick Corporation. These
undertakings were varied to enable the restructure of the Toll
Group and the demerger of Asciano Limited (a separate listed
entity). The undertakings to the ACCC include obligations
designed to ensure that the Toll Group and the Asciano Group are,
from the restructure date of 15 June 2007 until 31 March 2011,
independent and separate from one another, operate at arm’s
length and are not anti-competitive. Toll’s compliance with these
undertakings is audited half yearly by an external audit fi rm.
The undertakings comprise both Director and governance
related obligations (such as investment restrictions and Director
independence) and corporate obligations (including specifi c
obligations when doing business with Asciano, restrictions on
employing Asciano personnel, and specifi c prohibited business
arrangements such as shared services and joint ventures). To
ensure Toll is fully compliant with its undertakings, a compliance
program has been implemented that addresses both Director and
Corporate obligations. A ‘Toll Compliance Manager’ and ‘Audit
Manager’ have been appointed to oversee the development and
implementation of compliance processes, as well as the ongoing
CORPORATE GOVERNANCE STATEMENT C O N T I N U E D
F O R T H E Y E A R E N D E D 3 0 J U N E 2 0 0 8
For
per
sona
l use
onl
y

TOLL – ANNUAL REPORT 2008 45
monitoring of adherence to the undertakings. Some specifi c
initiatives undertaken include:
a) communication and awareness briefi ngs to Toll Directors
and Management on the undertakings, their requirements
and compliance processes – including signed management
declarations of understanding;
b) appointment of ‘Toll Contract Managers’ to coordinate and
review Toll’s business and contract arrangements with
specifi c Asciano entities (such as Pacifi c National and Patrick
Ports);
c) implementation of revised business procedures surrounding
drafting and approval of contracts with Asciano, engaging
new employees and contractors etc; and
d) internal reporting processes for monitoring compliance.
5.2 Management of Risks to Safety
Recognising the importance of safety to the risk profi le of the
Group, the following provides more detail on the Group’s approach
to safety.
The highest priority is placed on the health and safety of all
employees, sub-contractors and the general public through a
commitment to improving OH&S performance, which is a key
part of both the overall risk management program and the
management remuneration incentive scheme. Specifi c health
and safety risks arise from operating large vehicle fl eets and
transport assets, manual handling, hazardous goods cartage,
conduct of drivers, and ensuring vehicles, rolling stock and vessels
are maintained in a satisfactory condition. An extensive safety
and compliance system which is supported by training operates,
and is subject to regular internal and external evaluations.
Comprehensive vehicle maintenance programs exist for company
fl eets and transport assets. Emergency response strategies have
been implemented across the Group to respond to any unforseen
incidents.
This approach to workplace safety has resulted in a signifi cant
reduction in the rate of work related injuries.
Stringent OH&S auditing is also conducted by NSW, Victoria and
Queensland State Governments for Toll to obtain & maintain
Workers Compensation Self Insurance licences.
5.3 Risk Management throughout the Group
Through General Managers, Financial Controllers and business
unit risk or OH&S managers, Group Risk Management assists
divisions to implement appropriate risk processes and practices.
In doing so it promotes the active day-to-day management of risk
and ongoing performance improvement. Signifi cant risk matters
are also reported on a monthly basis to the Board.
Group Risk Management consists of the Group Risk Management
Committee, with the assistance of the Business Assurance &
Internal Audit (BA&IA).
Overall, the Group Risk Management function is responsible for:
a) providing technical advice;
b) developing risk management policies and procedures; and
c) co-ordinating risk reporting to the Group Risk Management
Committee and the Board on matters such as OH&S, security,
environment, dangerous goods/hazards, crisis management,
business interruption, contracts, risk fi nancing and insurance.
All material price sensitive changes to the Group’s business
risk profi le are disclosed to stakeholders in accordance with the
Group’s Continuous Disclosure policy.
The Group’s business risk profi le is also subject to a formal review
as part of the annual strategic and business planning cycle.
The Group Risk Management Committee is made up of
management and deals with the management of risk at an
operational level. The Group Risk Management Committee
(a management committee) has the following characteristics:
(i) chaired by the Director, Toll Australia and NZ Group;
(ii) activities include:
– formulating Group policies and strategies for
selected key risks;
– monitoring the risk performance role;
– providing a forum to discuss and manage any major
Group risk issues; and
– identifying the key business risks which could prevent
the Group from achieving its objectives and ensuring that
appropriate controls are in place to manage these risks.
The BA&IA reports to the Audit and Financial Risk Committee, and:
a) is responsible for independently evaluating the effectiveness
and effi ciency of selected risk management and internal
compliance and control systems;
b) co-ordinates its program with other Group ‘assurance’
activities covering OH&S, hazardous goods, balance sheet
integrity and internal compliance programs;
c) assists in evaluating and monitoring the effectiveness of
the Group and Divisional business risk analysis program;
d) liaises and consults with the Group Risk Management
function on selected risk and compliance matters; and
e) is a member of the Group Risk Management Committee.
5.4 Internal Compliance and Control
The strength of the Group’s risk management and internal control
framework is founded on a combination of ‘formal’ policies,
procedures, reporting and analysis, as well as ‘informal’ controls
such as management competence, judgement, ethics and values
and specifi c accountability, all of which are actively promoted by
senior management.
The Board is responsible for the internal compliance and control
framework, whilst recognising that no cost effective internal
control system will preclude all errors and irregularities. Selected
internal compliance and control mechanisms employed to support
the business include:
For
per
sona
l use
onl
y

46
5. Approach to Risk Management (continued)
Business and strategic planning, budgeting and reporting
a) A comprehensive business and strategic planning and
budgeting process includes evaluation of strategies,
objectives and risks which underpin business strategic plans
and an annual budget approved by the Board.
b) Monthly actual performance is reported against budget and
revised forecasts for the year are prepared as required.
c) Strategy and business plan performance are monitored
by division and business unit, supported by regular senior
management forums, Group Risk Management Committee
meetings and reporting to the Board and Board committees.
Quality and integrity of employees
d) The Group’s quality management system, supported by
training, development, succession planning and appraisal,
requires the involvement and commitment of management,
employees and subcontractors to ensure continuous
improvement and management of risk.
e) Currently there are clearly defi ned accountabilities,
performance measures and reinforcement of values and
ethics by senior management.
Corporate policies
Approved corporate policies address matters such as Code of
Practice, Toll Disclosure Hotline, OH&S, Equal Opportunity, Driver
Health, Compliance, Environment, Drugs and Alcohol, Corporate
Governance, Management Performance Review and Development,
Continuous Disclosure, Securities Trading Policy, Treasury, Trade
Practices and Privacy.
Business systems, procedures and controls
Comprehensive fi nancial, business process, project management
and IT system controls and procedures exist for each of the Group,
division and business unit levels.
Investment appraisal
a) The Group has documented guidelines for capital expenditure,
investment appraisals and due diligence for acquisitions.
b) These include annual budgets, appraisal against fi nancial
hurdle targets, expenditure review procedures and
appropriate levels of authority.
c) Post investment reviews are performed to assess the
effectiveness of funds invested in capital assets and business
acquisitions.
d) Comprehensive and proven business integration strategies
are used to derive maximum value from acquisitions.
Group assurance and monitoring activities
These include Internal Audit, specialist audits of OH&S,
environment, and dangerous goods, balance sheet reviews,
and Group compliance programs.
6. Communicating with Shareholders
The Group is committed to keeping shareholders fully informed
regarding developments and important information affecting
the Group. It endeavours to do so using plain language, with
transparency and openness.
The Group uses a range of channels to achieve these objectives
and continues to seek additional and more effective ways to
enhance communications with its shareholders. It aims to provide
a level playing fi eld for the provision of information to
all shareholders. Information is communicated to shareholders
as follows:
a) all matters requiring disclosure or reporting under the
ASX Listing Rules are communicated to the ASX Online
Announcements Offi ce for immediate dissemination to
the market in accordance with the Company’s Continuous
Disclosure Policy.
b) the Annual Report is distributed to shareholders who
have requested it in printed format. It is also available
electronically to all shareholders who have registered their
email address with the Share Registry, or available via the
Group’s website.
c) the Annual General Meeting is the main opportunity for
shareholders to hear the Managing Director and Chairman
provide updates on Company performance, ask questions
of the Board, and to express views and vote on the various
matters of business on the agenda. Shareholders may also
ask questions of the Company’s auditors at the meeting
regarding the conduct of the audit, preparation and content
of the auditor’s report, accounting policies adopted by
management and auditor independence. The auditor will
also be given reasonable opportunity to answer appropriate
written questions from shareholders. Shareholders unable
to attend in person may appoint a proxy to attend and vote
on their behalf, or they may view the meeting via web
cast. In addition, where appropriate, additional meetings of
shareholders are held to consider relevant proposals which
need to be dealt with outside the time frame of the Annual
General Meeting.
d) the Group’s internet website at www.tollgroup.com is
regularly updated and provides the following information
under the ‘Shareholder’ information section:
(i) Information regarding the latest Annual General Meeting,
Proxy voting results, Notice of the Annual General
Meeting;
(ii) Annual Reports for at least the past 10 years and
presentations made to the market regarding annual
results;
(iii) Corporate announcements;
(iv) Recent signifi cant developments;
(v) ‘Toll Today’ quarterly newsletters;
(vi) Diary for events of interest to shareholders; and
CORPORATE GOVERNANCE STATEMENT C O N T I N U E D
F O R T H E Y E A R E N D E D 3 0 J U N E 2 0 0 8
For
per
sona
l use
onl
y

TOLL – ANNUAL REPORT 2008 47
(vii) The live share price of the Company’s ordinary shares
trading on the ASX (with an approximate delay of
20 minutes).
7. Relating to our Stakeholders
The Group recognises that its actions and behaviour as a
large public company affect many stakeholders. Shareholders,
employees, customers, suppliers, unions, governments and
members of the public may all be affected by the Group’s
corporate presence to some extent. The Group believes in
openness and transparency within its operations and its
relationships with stakeholders. To assist this process, the Group
has developed a number of codes of conduct or policies which
set out what various groups of people may expect when they
interact with the Group, and where appropriate, what the Group
expects of them. Details or summaries of which are available on
the Group’s internet website at www.tollgroup.com under the
Company Policies section, and embrace the following:
a) Occupational Health and Safety
b) Environment
c) Compliance
d) Drugs and Alcohol
e) Rehabilitation
f) Driver Health
g) Dangerous Goods
h) Privacy
In addition, information on the following matters is accessible
under the About Toll – Corporate Governance section of the
Group’s internet website at www.tollgroup.com:
a) Board Charter
b) Terms of reference of Board committees
c) Procedure for the selection and appointment of new Directors
d) Securities trading policy
e) Code of conduct for Directors and senior executives
f) Auditor independence policy
g) Continuous disclosure policy
h) Communications with shareholders
i) Risk management policy statement
j) Performance evaluation process for Board and key executives
k) Codes of conduct with stakeholders
8. Our Community
Throughout the year the Group continued to be the major
supporter of the First Step program, responding to the challenges
of treating and managing drug addiction and recovery.
The Second Step employment program has also continued to
develop and now provides employment opportunities and support
for people who are making the transition from incarceration or
recovering from drug addiction. This program continues to be
highly successful, maintaining a high rate of success and having
enabled over 140 people to achieve full time service.
Our leading role in this initiative also encourages other corporates
to be involved in supporting people dealing with what would
otherwise be an insurmountable problem.
In addition, the Group continued its lead role assisting Foodbank
Australia receive food donations from food and grocery companies,
and managed the distribution to over 1,500 accredited welfare
agencies around Australia. The program helps to feed over 20,000
Australians daily. Other Group community initiatives include:
• Surf Life Saving
The Group continues to value its association with the Sorrento
Surf Life Saving Club, a relationship which now spans over
six consecutive years. Across Australia, Group employees
are involved in supporting the surf movement generally. The
Group is grateful for surf life saving clubs around Australia,
which help to ensure our beaches are safe for all beach goers.
• TLC for Kids
The Group is a proud supporter of the TLC for Kids Distraction
Box Program. TLC for Kids was established in 1998 to provide
immediate distractions and urgent attention to sick children
and young people, and provide support to families via a
program known as RAPID TLC. Over 13,500 people have
directly benefi ted from the services TLC for Kids provides.
• Convoy for Kids
The Group is a proud supporter of Convoy for Kids which
assists the welfare of sick or disabled children across the
Asian region.
• Cancer Support
Across the Asian region, Group businesses continue to
proudly support various Cancer Research groups through
various initiatives such as Australia’s Biggest Morning Tea,
Shave for a Cure and Swinging for NZ Cancer Society Golf Day.
These are just some of the Group’s community initiatives of which
we are proud. Additionally, individual businesses within the Toll
Group provide support to local community organisations.
The Group features its involvement with some of the initiatives
in our quarterly magazine Toll Today which can be accessed on
our website at www.tollgroup.com under Toll Group Newsletter.
9. Greenhouse challenge and energy effi ciency opportunities
Toll is now into its third year of an enhanced focus on environment
climate change issues.
Since 2006, Toll has met the requirements of the key government
environmental programs that will lead Australia into the Carbon
Pollution Reduction Scheme which recognises the global need to
reduce greenhouse gases.
For
per
sona
l use
onl
y

48
9. Greenhouse challenge and energy effi ciency opportunities (continued)
In Australia, Toll has progressively improved reporting and
management processes. At the hub of this is our previously
reported Toll web based management system, GEMS (Greenhouse
Emission Management System). Simply, GEMS converts all energy
sources to specifi c program units measuring the progress and
impact of Toll’s generated greenhouse gases.
Our focus on improving operational effi ciency has identifi ed
many aspects that impact fuel use throughout our fl eet. Vehicle
specifi cations will be further refi ned to ensure that the best fl eet
investments are implemented to maximise fuel savings and return
on investment.
In addition, Toll will continue exploring the use of alternative
fuels and technologies based on research and development
(R&D) results from its own and international trials. As such the
Group’s commitment to the environment includes potential R&D
projects having a signifi cant impact on emission abatement and
consideration of agreements and or partnerships with suppliers
and customers to improve emission abatement whilst developing
a holistic awareness of the transport industry’s environmental
impact.
Toll’s ongoing commitment to designing energy effi cient depots,
warehouses and distribution centres includes trials on improving
lighting systems, building design and potential implementation
of alternate energy sources such as solar power. In addition, Toll
recognises the need to maximise the use of rain water and seeks
to where possible capture multiple facility rain water to supply
truck cleaning facilities and toilet fl ushing systems.
The Group’s primary focus is on reducing operational emissions
by improving effi ciency in the use of fuel, electricity, waste and
water areas and extends into offsetting emissions programs
where greenhouse gas emissions cannot be reasonably reduced,
establishing the Group as a more effi cient and environmentally
friendly operator.
Finally, Toll prefers to reduce emissions in place of acquiring
carbon credits through trading. We will seek additional emission
reduction opportunities to ensure the greatest savings are made
to meet our strategic goals and support our customers.
CORPORATE GOVERNANCE STATEMENT C O N T I N U E D
F O R T H E Y E A R E N D E D 3 0 J U N E 2 0 0 8
For
per
sona
l use
onl
y

TOLL – ANNUAL REPORT 2008 49
INCOME STATEMENTS
F O R T H E Y E A R E N D E D 3 0 J U N E 2 0 0 8
Consolidated The Company
Note 2008
$M
2007Restated*
$M 2008
$M 2007
$M
Revenue 5 5,604.5 4,857.4 1.9 0.2
Other income 6 27.0 20.1 566.3 506.7
Direct transport and logistics costs (2,795.9) (2,312.6) – –
Repairs and maintenance costs (115.4) (105.8) – –
Employee benefi ts expense (1,375.7) (1,301.6) (25.6) (15.2)
Fuel, oil and electricity costs (250.4) (134.2) – –
Occupancy and property costs (263.8) (203.2) (5.7) (6.0)
Depreciation and amortisation 7 (167.7) (135.7) (8.1) (6.2)
Other operating costs (276.0) (367.0) (34.4) (43.1)
Results from operating activities 386.6 317.4 494.4 436.4
Share of profi t of associates and joint ventures 34 5.2 15.5 – –
Profi t before net fi nancing costs and income tax expense 391.8 332.9 494.4 436.4
Financial income 35.9 27.0 26.0 67.0
Financial expenses 7 (69.0) (332.2) (20.9) (18.7)
Net fi nancing costs (33.1) (305.2) 5.1 48.3
Profi t before income tax expense 358.7 27.7 499.5 484.7
Income tax (expense)/benefi t 8 (104.4) 6.7 15.8 11.0
Profi t from continuing operations 254.3 34.4 515.3 495.7
Discontinued operations
Profi t /(loss) of discontinued operations (net of income tax) 10 (945.1) 1,251.2 (30.3) 766.6
Profi t for the year (690.8) 1,285.6 485.0 1,262.3
Attributable to:
Equity holders of the parent (694.7) 1,278.7 485.0 1,262.3
Minority interests 3.9 6.9 – –
Profi t for the year (690.8) 1,285.6 485.0 1,262.3
Earnings per share:
Basic earnings per share 11 (107.41¢) 202.52¢
Diluted earnings per share 11 (107.41¢) 197.39¢
Continuing operations
Basic earnings per share 11 38.72¢ 4.36¢
Diluted earnings per share 11 38.70¢ 4.33¢
* See discontinued operation – note 10 (b)
The income statements are to be read in conjunction with the notes to the fi nancial statements set out on pages 53 to 129.For
per
sona
l use
onl
y

50
Consolidated The Company
Note 2008
$M 2007
$M 2008
$M 2007
$M
Retained earnings
Recognised directly in retained earnings:
Actuarial gains/(losses) in defi ned benefi t superannuation plans 25 – (1.2) – –
Transfer of asset revaluation reserve and hedging reserve upon demerger of discontinued operations – 188.4 – –
Foreign currency translation reserve
Foreign exchange translation differences, net of gain/(loss) on hedges of net investments in foreign subsidiaries (100.2) 10.0 – –
Hedging reserve
Effective portion of changes in fair value of cash fl ow hedges 137.2 (65.4) – –
Transfer to retained earnings upon demerger of discontinued operations – (7.4) – –
Asset revaluation reserve
Transfer to retained earnings upon demerger of discontinued operations – (181.0) – –
Available-for-sale reserve
Net change in fair value of available-for-sale fi nancial assets – – – –
Net income/(expense) recognised directly in equity 37.0 (56.6) – –
Profi t after tax for the year (690.8) 1,285.6 485.0 1,262.3
Total recognised income and expense for the year (653.8) 1,229.0 485.0 1,262.3
Attributable to:
Equity holders of the parent 28 (701.4) 1,165.8 485.0 1,262.3
Minority interests 28 47.6 63.2 – –
Total recognised income and expense for the year (653.8) 1,229.0 485.0 1,262.3
The statements of recognised income and expense are to be read in conjunction with the notes to the fi nancial statements set out on pages 53 to 129.
STATEMENTS OF RECOGNISED INCOME AND EXPENSES
F O R T H E Y E A R E N D E D 3 0 J U N E 2 0 0 8
For
per
sona
l use
onl
y

TOLL – ANNUAL REPORT 2008 51
BALANCE SHEETS
A S A T 3 0 J U N E 2 0 0 8
Consolidated The Company
Note 2008
$M 2007
$M 2008
$M 2007
$M
Current assets
Cash and cash equivalents 13 354.0 1,743.6 0.5 4.4
Receivables 14 1,462.2 696.0 2,239.5 14.1
Inventories 15 37.1 41.0 – –
Investments 18 – 0.7 – –
Assets classifi ed as held for sale 9 14.8 0.3 – –
Prepayments 45.8 49.2 4.5 2.3
Current tax receivable 4.4 10.2 – 19.8
Other fi nancial assets 16 56.1 35.5 11.2 2.0
Total current assets 1,974.4 2,576.5 2,255.7 42.6
Non current assets
Receivables 14 22.1 36.3 5.6 4.9
Investments accounted for using the equity method 17 226.9 274.3 – –
Investments 18 69.6 27.7 700.1 8,447.2
Investment property 19 – 1.6 – –
Property, plant & equipment 20 1,197.4 2,819.2 36.8 54.3
Intangible assets 21 1,262.1 1,849.8 10.3 0.2
Deferred tax assets 8 73.2 1.5 18.4 –
Prepayments 12.8 4.4 – –
Other fi nancial assets 16 1.9 24.8 – –
Total non current assets 2,866.0 5,039.6 771.2 8,506.6
Total assets 4,840.4 7,616.1 3,026.9 8,549.2
Current liabilities
Payables 22 667.4 1,114.3 27.5 5,546.4
Interest bearing liabilities 23 514.8 514.1 249.6 –
Current tax liabilities 96.8 – 65.1 –
Provisions 25 236.2 299.6 45.1 92.8
Other fi nancial liabilities 26 13.5 124.8 2.0 2.0
Total current liabilities 1,528.7 2,052.8 389.3 5,641.2
Non current liabilities
Interest bearing liabilities 23 1,106.7 1,742.8 – 248.8
Deferred tax liabilities 8 18.2 51.9 – 10.0
Provisions 25 69.2 127.4 25.0 23.7
Other fi nancial liabilities 26 14.5 19.9 – –
Total non current liabilities 1,208.6 1,942.0 25.0 282.5
Total liabilities 2,737.3 3,994.8 414.3 5,923.7
Net assets 2,103.1 3,621.3 2,612.6 2,625.5
Equity
Issued capital 27 2,554.5 2,492.8 2,554.5 2,492.8
Treasury shares 28 (7.2) (8.2) (7.2) (8.2)
Reserves 28 (113.3) (54.4) 2.2 68.3
Retained earnings 28 (373.2) 816.0 63.1 72.6
Total equity attributable to equity holders of the parent 2,060.8 3,246.2 2,612.6 2,625.5
Minority interests 28 42.3 375.1 – –
Total equity 2,103.1 3,621.3 2,612.6 2,625.5
The balance sheets are to be read in conjunction with the notes to the fi nancial statements set out on pages 53 to 129.
For
per
sona
l use
onl
y
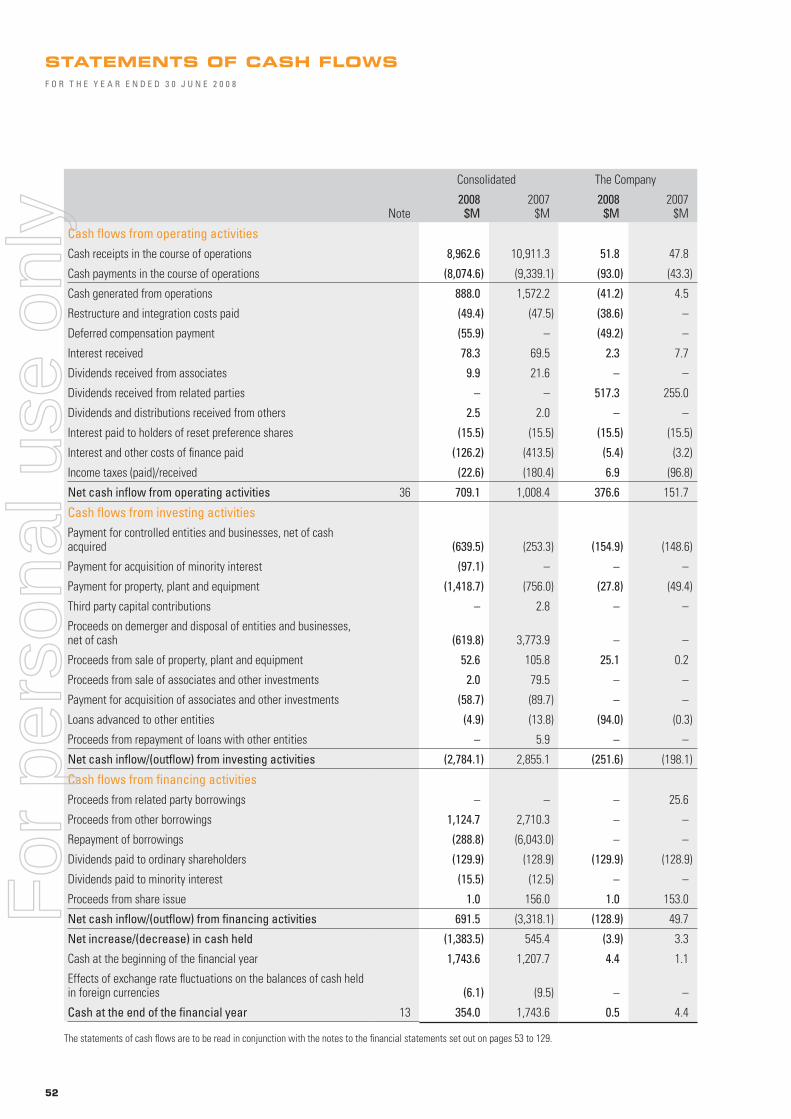
52
Consolidated The Company
Note 2008
$M 2007
$M 2008
$M 2007
$M
Cash fl ows from operating activities
Cash receipts in the course of operations 8,962.6 10,911.3 51.8 47.8
Cash payments in the course of operations (8,074.6) (9,339.1) (93.0) (43.3)
Cash generated from operations 888.0 1,572.2 (41.2) 4.5
Restructure and integration costs paid (49.4) (47.5) (38.6) –
Deferred compensation payment (55.9) – (49.2) –
Interest received 78.3 69.5 2.3 7.7
Dividends received from associates 9.9 21.6 – –
Dividends received from related parties – – 517.3 255.0
Dividends and distributions received from others 2.5 2.0 – –
Interest paid to holders of reset preference shares (15.5) (15.5) (15.5) (15.5)
Interest and other costs of fi nance paid (126.2) (413.5) (5.4) (3.2)
Income taxes (paid)/received (22.6) (180.4) 6.9 (96.8)
Net cash infl ow from operating activities 36 709.1 1,008.4 376.6 151.7
Cash fl ows from investing activities
Payment for controlled entities and businesses, net of cash acquired (639.5) (253.3) (154.9) (148.6)
Payment for acquisition of minority interest (97.1) – – –
Payment for property, plant and equipment (1,418.7) (756.0) (27.8) (49.4)
Third party capital contributions – 2.8 – –
Proceeds on demerger and disposal of entities and businesses, net of cash (619.8) 3,773.9 – –
Proceeds from sale of property, plant and equipment 52.6 105.8 25.1 0.2
Proceeds from sale of associates and other investments 2.0 79.5 – –
Payment for acquisition of associates and other investments (58.7) (89.7) – –
Loans advanced to other entities (4.9) (13.8) (94.0) (0.3)
Proceeds from repayment of loans with other entities – 5.9 – –
Net cash infl ow/(outfl ow) from investing activities (2,784.1) 2,855.1 (251.6) (198.1)
Cash fl ows from fi nancing activities
Proceeds from related party borrowings – – – 25.6
Proceeds from other borrowings 1,124.7 2,710.3 – –
Repayment of borrowings (288.8) (6,043.0) – –
Dividends paid to ordinary shareholders (129.9) (128.9) (129.9) (128.9)
Dividends paid to minority interest (15.5) (12.5) – –
Proceeds from share issue 1.0 156.0 1.0 153.0
Net cash infl ow/(outfl ow) from fi nancing activities 691.5 (3,318.1) (128.9) 49.7
Net increase/(decrease) in cash held (1,383.5) 545.4 (3.9) 3.3
Cash at the beginning of the fi nancial year 1,743.6 1,207.7 4.4 1.1
Effects of exchange rate fl uctuations on the balances of cash held in foreign currencies (6.1) (9.5) – –
Cash at the end of the fi nancial year 13 354.0 1,743.6 0.5 4.4
The statements of cash fl ows are to be read in conjunction with the notes to the fi nancial statements set out on pages 53 to 129.
STATEMENTS OF CASH FLOWS
F O R T H E Y E A R E N D E D 3 0 J U N E 2 0 0 8
For
per
sona
l use
onl
y
TOLL – ANNUAL REPORT 2008 53
1. Reporting entity
Toll Holdings Limited (the ‘Company’) is domiciled in Australia.
The principal accounting policies which have been adopted in
the preparation of this fi nancial report are set out below. These
policies have been consistently applied to all the years presented,
unless otherwise stated. The fi nancial report includes separate
fi nancial statements for the Company as an individual entity
and the consolidated entity consisting of the Company and its
subsidiaries (together referred to as the ‘Group’), and the Group’s
interest in associates and jointly controlled entities.
Certain comparative amounts have been reclassifi ed to conform
with the current year’s presentation. In addition, the comparative
income statement has been re-presented as if an operation
discontinued during the current period had been discontinued
from the start of the comparative period (see note 10).
2. Basis of preparation
(a) Statement of compliance
The fi nancial report is a general purpose fi nancial report which
has been prepared in accordance with Australian Accounting
Standards (AASBs) (including Australian Interpretations) adopted
by the Australian Accounting Standards Board (AASB) and the
Corporations Act 2001. The fi nancial reports of the Group and
the Company also comply with International Financial Reporting
Standards (IFRSs) and interpretations adopted by the International
Accounting Standards Board.
Early adoption of standards
The Group has elected to early adopt the following accounting
standards and amendments:
• AASB 7-6 Amendments to Australian Accounting Standards
arising from AASB 123 (revised) Borrowing Costs [AASB 1,
AASB 101, AASB 107, AASB 111, AASB 116 & AASB 138 and
Interpretations 1& 12]. The revision of AASB 123 necessitates
consequential amendments to the pronouncements listed
above. The amendments principally removed references to
expensing borrowing costs on qualifying assets, as AASB 123
was revised to require such borrowing costs to be capitalised.
• AASB 123 (revised): Borrowing Costs. AASB 123 was
revised to require borrowing costs on qualifying assets to be
capitalised.
The Company had used and continued to use the alternative
treatment of borrowing costs since AASB 123 was initially
adopted on 1 July 2005. The alternative treatment required
that borrowing costs that are directly attributable to the
acquisition, construction or production of a qualifying asset shall
be capitalised as part of the cost of that asset. The use of the
alternative treatment has the effect of adopting the revised
AASB 123, and consequently AASB 7-6.
(b) Basis of measurement
The consolidated fi nancial statements have been prepared on the
historical cost basis except for the following:
• Derivative fi nancial instruments are measured at fair value.
• Financial instruments at fair value through profi t or loss are
measured at fair value.
• Available for sale fi nancial assets are measured at fair value.
• Investment properties are measured at fair value.
• Assets classifi ed as held for sale are measured at the lower
of carrying value and fair value less costs to sell.
(c) Functional and presentation currency
These consolidated fi nancial statements are presented in
Australian dollars, which is the Company’s functional currency and
the functional currency of the majority of the Group. The Company
is of the kind referred to in ASIC Class Order 98/100 dated 10
July 1998 (updated by CO 05/641 effective 28 July 2005 and CO
06/51 effective 31 January 2006) and in accordance with that
Class Order, amounts in the fi nancial report, and directors’ report
have been rounded off to the nearest decimal of a million dollars,
unless otherwise stated.
3. Signifi cant Accounting Policies
The accounting policies set out below have been applied
consistently to all periods presented in these consolidated
fi nancial statements, and have been applied consistently by
Group entities.
(a) Basis of consolidation
(i) Subsidiaries
Subsidiaries are entities controlled by the Group. Control exists
when the Group has the power to govern the fi nancial and
operating policies of an entity so as to obtain benefi ts from its
activities. In assessing control, potential voting rights that are
currently exercisable are taken into account.
The fi nancial statements of subsidiaries are included in the
consolidated fi nancial statements from the date that control
commences until the date that control ceases. The accounting
policies of subsidiaries have been changed when necessary to
align them with the policies adopted by the Group.
Investments in subsidiaries are carried at their cost of acquisition
in the Company’s fi nancial statements.
(ii) Associates
Associates are those entities in which the Group has signifi cant
infl uence, but not control, over the fi nancial and operating
policies. The consolidated fi nancial statements includes the
Group’s share of the total recognised gains and losses of
associates on an equity accounted basis, from the date that
signifi cant infl uence commences until the date that signifi cant
infl uence ceases. When the Group’s share of losses exceeds its
interest in an associate, its carrying amount is reduced to nil and
NOTES TO THE FINANCIAL STATEMENTS
F O R T H E Y E A R E N D E D 3 0 J U N E 2 0 0 8
For
per
sona
l use
onl
y

54
3. Signifi cant Accounting Policies (continued)
recognition of further losses is discontinued except to the extent
that the Group has incurred legal or constructive obligations or
made payments on behalf of an associate.
In the Company’s fi nancial statements, investments in associates
are carried at their cost of acquisition.
(iii) Joint ventures
Interests in joint ventures are accounted for in the consolidated
fi nancial statements using the equity method and are carried
at cost in the Company’s fi nancial statements. Under the equity
method, the share of the profi ts or losses are recognised in the
income statement, and the share of movements in reserves is
recognised in reserves in the balance sheet.
(iv) Transactions eliminated on consolidation
Intra-group balances and any unrealised income and expenses
arising from intra-group transactions, are eliminated in preparing
the consolidated fi nancial statements.
Unrealised gains arising from transactions with associates
and jointly controlled entities are eliminated to the extent of
the Group’s interest in the entity with adjustments made to the
‘Investment in associates’ and ‘Share of associates’ net profi t’
accounts.
Unrealised losses are eliminated in the same way as unrealised
gains, but only to the extent that there is no evidence of
impairment. Gains and losses are recognised as the contributed
assets are consumed or sold by the associates and jointly
controlled entities or, if not consumed or sold by the associate
or jointly controlled entity, when the Group’s interest in such
entities is disposed of.
(b) Foreign currency
(i) Foreign currency transactions
Transactions in foreign currencies are translated at the foreign
exchange rates at the dates of the transactions. Monetary assets
and liabilities denominated in foreign currencies at the reporting
date are translated to the functional currency at the foreign
exchange rate at that date. The foreign currency gain or loss
on monetary items is the difference between amortised cost in
the functional currency at the beginning of the period, adjusted
for effective interest and payments during the period, and the
amortised cost in foreign currency translated at the exchange
rate at the end of the period. Non-monetary assets and liabilities
denominated in foreign currencies that are measured at fair value
are retranslated to the functional currency at the exchange rate
at the date that the fair value was determined. Foreign currency
differences arising on retranslation are recognised in profi t or loss,
except for differences arising on the retranslation of available-for-
sale equity instruments, a fi nancial liability designated as a hedge
of the net investment in a foreign operation, or qualifying cash
fl ow hedges, which are recognised directly in equity.
(ii) Foreign operations
The assets and liabilities of foreign operations, including goodwill
and fair value adjustments arising on acquisition, are translated to
Australian dollars at foreign exchange rates at the reporting date.
The income and expenses of foreign operations are translated
to Australian dollars at exchange rates at the dates of the
transactions. Foreign currency differences are recognised directly
in equity in the foreign currency translation reserve (FCTR) and
released into the income statement upon disposal of the foreign
entity.
Foreign exchange gains and losses arising from a monetary item
receivable from or payable to a foreign operation, the settlement
of which is neither planned nor likely in the foreseeable future,
are considered to form part of a net investment in a foreign
operation and are recognised directly in equity in the FCTR.
(iii) Hedge of net investment in foreign operation
Foreign currency differences arising on the retranslation of a
fi nancial liability designated as a hedge of a net investment in a
foreign operation are recognised directly in equity, in the FCTR, to
the extent that the hedge is effective. To the extent that the hedge
is ineffective, such differences are recognised in profi t or loss.
When the hedged part of a net investment is disposed of, the
associated cumulative amount in equity is transferred to profi t
or loss as an adjustment to the profi t or loss on disposal.
(c) Financial instruments
(i) Derivative fi nancial instruments
The Group holds derivative fi nancial instruments to hedge its
foreign currency, aviation fuel and interest rate risk exposures.
Embedded derivatives are separated from the host contract and
accounted for separately if the economic characteristics and
risks of the host contract and the embedded derivative are not
closely related, a separate instrument with the same terms as the
embedded derivative would meet the defi nition of a derivative,
and the combined instrument is not measured at fair value
through profi t or loss.
Derivatives are recognised initially at fair value and attributable
transaction costs are recognised in profi t or loss when incurred.
Subsequent to initial recognition, derivatives are measured at fair
value, and changes therein are accounted for as described below.
Fair value hedges
Changes in the fair value of derivatives that are designated
and qualifi ed as fair value hedges are recorded in profi t or loss,
together with any changes in the fair value of the hedged asset or
liability that are attributable to the hedged risk. The gain or loss
relating to the effective portion of interest rate swaps hedging
fi xed rate borrowings is recognised in the income statement as
fi nance income or fi nance expense together with the gain or loss
relating to the ineffective portion and changes in the fair value of
the hedge fi xed rate borrowings attributable to interest rate risk.
NOTES TO THE FINANCIAL STATEMENTS C O N T I N U E D
F O R T H E Y E A R E N D E D 3 0 J U N E 2 0 0 8
For
per
sona
l use
onl
y

TOLL – ANNUAL REPORT 2008 55
If the hedge no longer meets the criteria for hedge accounting, the
adjustment to the carrying amount of a hedge item for which the
effective interest method is used is amortised to profi t or loss over
the period to maturity using a recalculated effective interest rate.
Cash fl ow hedges
Changes in the fair value of the derivative hedging instrument
designated as a cash fl ow hedge are recognised directly in equity
to the extent that the hedge is effective. To the extent that the
hedge is ineffective, changes in fair value are recognised in profi t
or loss.
If the hedging instrument no longer meets the criteria for
hedge accounting, expires or is sold, terminated or exercised,
then hedge accounting is discontinued prospectively. The
cumulative gain or loss previously recognised in equity remains
there until the forecast transaction occurs. When the hedged
item is a non-fi nancial asset, the amount recognised in equity
is transferred to the carrying amount of the asset when it is
recognised. In other cases the amount recognised in equity is
transferred to profi t or loss in the same period that the hedged
item affects profi t or loss.
Derivatives that do not qualify for hedge accounting
Certain derivative instruments do not qualify for hedge
accounting. Changes in the fair value of any derivative instrument
that does not qualify for hedge accounting are recognised
immediately in profi t or loss.
Share capital
Ordinary shares are classifi ed as equity. Incremental costs directly
attributable to the issue of ordinary shares and share options are
recognised as a deduction from equity, net of any tax effects.
Reset preference shares
Reset preference shares are classifi ed as a liability and
distributions to holders are treated as a fi nancial expense
in the income statement.
Repurchase of share capital (treasury shares)
When the share capital recognised as equity is repurchased,
the amount of the consideration paid, which includes directly
attributable costs, is recognised as a deduction from equity, net
of any tax effects. Repurchased shares are classifi ed as treasury
shares and are presented as a deduction from equity. When
treasury shares are sold or reissued subsequently, the amount
received is recognised as an increase in equity, and the resulting
surplus or defi cit on the transaction is transferred to/from
retained earnings.
(ii) Non-derivative fi nancial instruments
Non-derivative fi nancial instruments comprise, investments
in equity and debt securities, trade and other receivables, cash
and cash equivalents, loans and borrowings, and trade and
other payables.
Non-derivative fi nancial instruments are recognised initially at
fair value plus, for instruments not at fair value through profi t
or loss, any directly attributable costs. Subsequent to initial
recognition non-derivative fi nancial instruments are measured
as described below.
A fi nancial instrument is recognised if the Group becomes a party
to the contractual provisions of the instrument. Financial assets
are derecognised if the Group’s contractual rights to the cash
fl ows from the fi nancial assets expire or if the Group transfers
the fi nancial asset to another party without retaining control or
substantially all risks and rewards of the asset. Financial liabilities
are derecognised if the Group’s obligations specifi ed in the
contract expire or are discharged or cancelled.
Cash and cash equivalents comprise cash balances and call
deposits. Bank overdrafts that are repayable on demand and form
an integral part of the Group’s cash management are included as
a component of cash and cash equivalents for the purpose of the
statement of cash fl ows.
Accounting for fi nance income and expense is discussed in
note 3(p)(iv).
Held-to-maturity investments
If the Group has the positive intent and ability to hold debt
securities to maturity, then they are classifi ed as held-to-maturity.
Held-to-maturity investments are measured at amortised cost
using the effective interest method, less any impairment losses.
Available-for-sale fi nancial assets
The Group’s investments in equity securities and certain debt
securities are classifi ed as available-for-sale fi nancial assets.
Subsequent to initial recognition, they are measured at fair value
and changes therein, other than impairment losses (see note 3(j)
(i)), and foreign exchange gains and losses on available-for-sale
monetary items are recognised directly in a separate component
of equity. When an investment is derecognised, the cumulative
gain or loss in equity is transferred to profi t or loss.
Financial assets at fair value through profi t or loss
An instrument is classifi ed as at fair value through profi t or
loss if it is held for trading or is designated as such upon initial
recognition. Financial instruments are designated at fair value
through profi t or loss if the Group manages such investments
and makes purchase and sale decisions based on their fair value
in accordance with the Group’s documented risk management
or investment strategy. Upon initial recognition, attributable
transaction costs are recognised in profi t or loss when incurred.
Financial instruments at fair value through profi t or loss are
measured at fair value, and changes therein are recognised
in profi t or loss.
Other
Other non-derivative fi nancial instruments are measured at
amortised cost using the effective interest method, less any
impairment losses.
For
per
sona
l use
onl
y

56
3. Signifi cant Accounting Policies (continued)
(d) Fair value estimation
The fair value of fi nancial assets and liabilities must be estimated
for recognition and measurement or for disclosure purposes.
The fair value of fi nancial instruments traded in active markets
(such as publicly traded derivatives and trading securities) is
determined using valuation techniques. The Group uses a variety
of methods and makes assumptions that are based on market
conditions existing at each reporting date. Quoted market prices
or dealer quotes for similar instruments are used for long term
debt instruments held. Other techniques, such as estimated
discounted cash fl ows, are used to determine the fair value for
remaining fi nancial instruments. The fair value of interest rate
swaps is calculated as the present value of the estimated future
cash fl ows. The fair value of forward exchange contracts is
determined using forward exchange market rates at the
reporting date.
The nominal value less estimated credit adjustments of
receivables and payables are assumed to approximate their
fair values. The fair value of fi nancial liabilities for disclosure
purposes is estimated by discounting the future contractual
cash fl ows at the current market interest rate that is available
to the Group for similar instruments.
(e) Property, plant and equipment
Recognition and measurement
Items of property, plant and equipment are measured at cost less
accumulated depreciation and accumulated impairment losses.
Cost includes expenditure that is directly attributable to the
acquisition of the asset. The cost of self-constructed asset
includes the cost of materials and direct labour, any other costs
directly attributable to bringing the asset to a working condition
for its intended use, and the costs of dismantling and removing
the items and restoring the site on which they are located. Cost
also may include transfers from equity of any gain or loss on
qualifying cash fl ow hedges of foreign currency purchases of
property, plant and equipment. Purchased software that is integral
to the functionality of the related equipment is capitalised as part
of that equipment. Borrowing costs related to the acquisition or
construction of qualifying assets are capitalised.
When parts of an item of property, plant and equipment have
different useful lives, they are accounted for as separate items
(major components) of property, plant and equipment.
Gains and losses on disposal of an item of property, plant
and equipment are determined by comparing the proceeds
from disposal with the carrying amount of property, plant and
equipment and are recognised net within ‘other income’ in the
income statement. When revalued assets are sold, the amounts
included in the revaluation reserve are transferred to retained
earnings.
Subsequent costs
The cost of replacing part of an item of property, plant and
equipment is recognised in the carrying amount of the item if it is
probable that the future economic benefi ts embodied within the
part will fl ow to the Group and its cost can be measured reliably.
The carrying amount of the replaced part is derecognised. The
costs of the day-to-day servicing of property, plant and equipment
are recognised in profi t or loss as incurred.
Depreciation
Depreciation is recognised in profi t or loss on a straight-line
basis over the estimated useful lives of each part of an item of
property, plant and equipment. Leased assets are depreciated
over the shorter of the lease term and their useful lives unless it
is reasonably certain that the Group will obtain ownership by the
end of the lease term. Land is not depreciated.
The estimated useful lives for the current and comparative periods
are as follows:
• Buildings 2.5% – 10.0%
• Leasehold improvements 2.5% – 15.0%
• Plant and equipment:
Aircraft and aeronautic related assets:
– Modifi cations to leased aircrafts 20.0% – 40.0%
– Rotables and maintenance parts 7.25%
– Airframe, engines and landing gear 10.0% – 25.0%
– Major cyclical maintenance 10.0% – 80.0%
Base and jetty improvements Over remaining lease
term up to 6 years
Vessels 4.0% – 10.0%
Track infrastructure 2.2% – 16.5%
Rolling stock 3.3% – 20.0%
Other plant and equipment 8.5% – 40.0%
• Leased plant and equipment 8.5% – 33.0%
Depreciation methods and useful lives, as well as residual values,
are reviewed at each reporting date.
NOTES TO THE FINANCIAL STATEMENTS C O N T I N U E D
F O R T H E Y E A R E N D E D 3 0 J U N E 2 0 0 8
For
per
sona
l use
onl
y

TOLL – ANNUAL REPORT 2008 57
Repairs and maintenance – owned aircraft
Routine maintenance costs including annual airframe checks
are written off to profi t or loss as incurred. Major cyclical
maintenance on owned aircraft is capitalised to the carrying
value of the aircraft as incurred and amortised over the period to
the next scheduled major maintenance. Any remaining carrying
amount of the cost of the previous inspection is derecognised.
Repairs and maintenance – operating leased aircraft
Routine maintenance costs including annual airframe checks are
written off to profi t or loss as incurred. Provision is made for the
estimated future costs of major cyclical maintenance of leased
airframes, engines, landing gear and auxiliary power units by
making charges to profi t or loss, calculated by reference to the
rectifi cation cost and the number of hours or cycles operated
during the period. The Group is presently obligated to these
aircraft rectifi cation requirements pursuant to the operating lease
agreements. The costs of major cyclical maintenance are written
off against the provision when incurred.
(f) Leased assets
Leases, the terms of which the Group assumes substantially
all the risks and rewards of ownership are classifi ed as fi nance
leases. Upon initial recognition the leased asset is measured at an
amount equal to the lower of its fair value and the present value
of the minimum lease payments. Subsequent to initial recognition,
the asset is accounted for in accordance with the accounting
policy applicable to that asset.
Other leases are operating leases and, except for investment
property, the leased assets are not recognised on the Group’s
balance sheet. Investment property held under an operating lease
is recognised on the Group’s balance sheet at its fair value.
(g) Intangible assets
(i) Goodwill
Business combinations
All business combinations are accounted for by applying the
purchase method. Goodwill represents the difference between
the cost of the acquisition and the fair value of the net identifi able
assets acquired.
Goodwill is stated at cost less any accumulated impairment
losses. Goodwill is allocated to cash-generating units and is
tested annually for impairment. In respect of associates, the
carrying amount of goodwill is included in the carrying amount
of the investment in associate.
Negative goodwill arising on an acquisition is recognised directly
in profi t or loss.
Goodwill arising on the acquisition of a minority interest in a
subsidiary represents the excess of the cost of the additional
investment over the carrying amount of the net assets acquired
at the date of exchange.
(ii) Other intangible assets
Other intangible assets that are acquired by Group, which
have fi nite useful lives, are measured at cost less accumulated
amortisation and impairment losses.
(iii) Research and development
Expenditure on research activities, undertaken with the
prospect of gaining new scientifi c or technical knowledge and
understanding, is recognised in profi t or loss when incurred.
Expenditure on development activities, whereby research fi ndings
are applied to a plan or design for the production of new or
substantially improved products and processes, is capitalised if
the product or process is technically and commercially feasible
and the Group has suffi cient resources to complete development.
The expenditure capitalised includes the cost of materials,
direct labour and overhead costs that are directly attributable to
preparing the asset for its intended use. Borrowing costs related
to the development of qualifying assets are capitalised. Other
development expenditure is recognised in profi t or loss
as incurred.
Capitalised development expenditure is stated at cost less
accumulated amortisation and impairment losses.
(iv) Subsequent expenditure
Subsequent expenditure is capitalised only when it increases
the future economic benefi ts embodied in the specifi c asset to
which it relates. All other expenditure, including expenditure on
internally generated goodwill and brands, is recognised in profi t
or loss as incurred.
(v) Amortisation
Amortisation is recognised in profi t or loss on a straight-line basis
over the estimated useful lives of the intangible assets, other than
goodwill, from the date that they are available for use.
The estimated useful lives for the current and comparative periods
are as follows:
• Software & technology 3 – 5 years
• Customer contracts & relationships 1 – 10 years
• Right of Way 66 years
• Other intangibles 5 years
(h) Inventories
Inventories are measured at the lower of cost and net realisable
value. The cost of inventories is based on the fi rst-in-fi rst-out
principle, and includes all costs of purchase, production or
conversion costs and other costs incurred in bringing them to
their present location and condition. The cost of inventory may
also include transfers from equity of any gain or loss on qualifying
cash fl ow hedges of foreign currency purchases of inventory.
Net realisable value is the estimated selling price in the ordinary
course of business, less the estimated costs of completion and
selling expenses.
For
per
sona
l use
onl
y

58
3. Signifi cant Accounting Policies (continued)
(i) Investment property
Investment property is property held either to earn rental income
or for capital appreciation or for both, but not for sale in the
ordinary course of business, used in the production or supply
of goods or services or for administrative purposes. Investment
property is measured at fair value with any change therein
recognised in profi t or loss.
When the use of a property changes such that it is reclassifi ed
as property, plant and equipment, its fair value at the date of
reclassifi cation becomes its cost for subsequent accounting.
(j) Impairment
(i) Financial assets
A fi nancial asset is assessed at each reporting date to determine
whether there is any objective evidence that it is impaired. A
fi nancial asset is considered to be impaired if objective evidence
indicates that one or more events have had a negative effect on
the estimated future cash fl ows of that asset.
An impairment loss in respect of a fi nancial asset measured at
amortised cost is calculated as the difference between its carrying
amount, and the present value of the estimated future cash fl ows
discounted at the original effective interest rate. An impairment
loss in respect of an available-for-sale fi nancial asset is calculated
by reference to its fair value.
Individually signifi cant fi nancial assets are tested for impairment
on a individual basis. The remaining fi nancial assets are assessed
collectively in groups that share similar credit risk characteristics.
All impairment losses are recognised in profi t or loss. Any
cumulative loss in respect of an available-for-sale fi nancial asset
recognised previously in equity is transferred to profi t or loss.
An impairment loss is reversed if the reversal can be related
objectively to an event occurring after the impairment loss was
recognised. For fi nancial assets measured at amortised cost and
available-for-sale fi nancial assets that are debt securities, the
reversal is recognised in profi t or loss. For available-for-sale
fi nancial assets that are equity securities, the reversal is
recognised directly in equity.
(ii) Non-fi nancial assets
The carrying amounts of the Group’s non-fi nancial assets, other
than investment property, inventories and deferred tax assets,
are reviewed at each reporting date to determine whether there
is any indication of impairment. If any such indication exists
then the asset’s recoverable amount is estimated. For goodwill
and intangible assets that have indefi nite lives or that are not
yet available for use, recoverable amount is estimated at each
reporting date.
The recoverable amount of an asset or cash-generating unit is
the greater of its value in use and its fair value less costs to sell.
In assessing value in use, the estimated future cash fl ows are
discounted to their present value using a pre-tax discount rate
that refl ects current market assessments of the time value of
money and the risks specifi c to the asset.
An impairment loss is recognised if the carrying amount of an
asset or its cash-generating unit exceeds its recoverable amount.
Impairment losses are recognised in profi t or loss. Impairment
losses recognised in respect of cash-generating units are
allocated fi rst to reduce the carrying amount of any goodwill
allocated to the units and then to reduce the carrying amount of
the other assets in the unit (group of units) on a pro rata basis.
An impairment loss in respect of goodwill is not reversed. In
respect of other assets, impairment losses recognised in prior
periods are assessed at each reporting date for any indications
that the loss has decreased or no longer exists. An impairment
loss is reversed if there has been a change in the estimates used
to determine the recoverable amount. An impairment loss is
reversed only to the extent that the asset’s carrying amount does
not exceed the carrying amount that would have been determined,
net of depreciation or amortisation, if no impairment loss had
been recognised.
(k) Non-current assets held for sale
Non-current assets (or disposal groups comprising assets and
liabilities) that are expected to be recovered primarily through
sale rather than through continuing use are classifi ed as held for
sale. Immediately before classifi cation as held for sale, the assets
(or components of a disposal group) are remeasured in accordance
with the Group’s accounting policies. Thereafter generally the
assets (or disposal group) are measured at the lower of their
carrying amount and fair value less cost to sell. Any impairment
loss on a disposal group fi rst is allocated to goodwill, and then
to remaining assets and liabilities on pro rata basis, except that
no loss is allocated to inventories, fi nancial assets, deferred
tax assets, employee benefi t assets and investment property,
which continue to be measured in accordance with the Group’s
accounting policies. Impairment losses on initial classifi cation as
held for sale and subsequent gains or losses on re-measurement
are recognised in profi t or loss. Gains are not recognised in excess
of any cumulative impairment loss.
(l) Provisions
A provision is recognised if, as a result of a past event, the
Group has a present legal or constructive obligation that can be
estimated reliably, and it is probable that an outfl ow of economic
benefi ts will be required to settle the obligation. Provisions are
determined by discounting the expected future cash fl ows at a
pre-tax rate that refl ects current market assessments of the time
value of money and the risks specifi c to the liability.
(m) Employee benefi ts
(i) Defi ned contribution plans
A defi ned contribution plan is a post-employment benefi t plan
under which an entity pays fi xed contributions into a separate
entity and will have no legal or constructive obligation to
pay further amounts. Obligations for contributions to defi ned
NOTES TO THE FINANCIAL STATEMENTS C O N T I N U E D
F O R T H E Y E A R E N D E D 3 0 J U N E 2 0 0 8
For
per
sona
l use
onl
y
TOLL – ANNUAL REPORT 2008 59
contribution plans are recognised as a personnel expense in profi t
or loss when they are due. Prepaid contributions are recognised
as an asset to the extent that a cash refund or a reduction in
future payments is available.
(ii) Defi ned benefi t plans
A defi ned benefi t plan is a post-employment benefi t plan other
than a defi ned contribution plan. The Group’s net obligation in
respect of defi ned benefi t plans is calculated separately for each
plan by estimating the amount of future benefi t that employees
have earned in return for their service in the current and prior
periods; that benefi t is discounted to determine its present value.
Any unrecognised past service costs and the fair value of any plan
assets are deducted.
The discount rate is the yield at reporting date on government
bonds that have maturity dates approximating the terms of the
Group’s obligations. The calculation is performed annually by a
qualifi ed actuary using the projected unit credit method. When
the calculation results in a benefi t to the Group, the recognised
asset is limited to the net total of any unrecognised past service
costs and the present value of any future refunds from the plan
or reductions in future contributions to the plan.
When the benefi ts of a fund are improved, the portion of the
increased benefi t relating to past service by employees is
recognised in profi t or loss on a straight-line basis over the
average period until the benefi ts become vested. To the extent
that the benefi ts vest immediately, the expense is recognised
immediately in profi t or loss. Actuarial gains and losses are
recognised directly in equity.
(iii) Long-term service benefi ts
The Group’s net obligation in respect of long-term employee
benefi ts, other than defi ned benefi t plans is the amount of future
benefi t that employees have earned in return for their service in
the current and prior periods plus related on costs; that benefi t is
discounted to determine its present value, and the fair value of
any related assets is deducted. The discount rate is the yield at
the reporting date on government bonds that have maturity dates
approximating the terms of the Group’s obligations.
(iv) Share-based payment transactions
The fair value of options at grant date is recognised as an
employee expense with a corresponding increase in equity, over
the period that the employees become unconditionally entitled
to the options. The amount recognised as an expense is adjusted
to refl ect the actual number of share options that vest, except for
those that fail to vest due to market conditions not being met.
The fair value of the options granted is measured using either
the Binomial, Monte Carlo or Black Scholes method, taking into
account the terms and conditions upon which the options were
granted.
The fair value of the amount payable to employees in respect of
share appreciation rights, which are settled in cash, is recognised
as an expense, with a corresponding increase in liabilities, over
the period that the employees become unconditionally entitled to
payment. The liability is re-measured at each reporting date and
at settlement date.
(v) Wages, salaries, annual leave, sick leave and
non-monetary benefi ts
Liabilities for employee benefi ts for wages, salaries, annual leave
and sick leave that are expected to be settled within 12 months
of the reporting date represent present obligations resulting from
employees’ services provided to reporting date, and are calculated
at undiscounted amounts based on remuneration wage and salary
rates that the Group expects to pay as at reporting date including
related on-costs, such as, workers compensation insurance and
payroll tax. Non-accumulating non-monetary benefi ts, such as
medical care, housing, cars and free or subsidised goods and
services, are expensed based on the net marginal cost to the
Group as the benefi ts are taken by the employees.
A liability is recognised for the amount expected to be paid under
short-term cash bonus or profi t-sharing plans if the Group has a
present legal or constructive obligation to pay this amount as a
result of past service provided by the employee and the obligation
can be estimated reliably.
(vi) Termination benefi ts
Termination benefi ts are recognised as an expense when the
Group is demonstrably committed, without realistic possibility
of withdrawal, to a formal detailed plan to either terminate
employment before the normal retirement date, or to provide
termination benefi ts as a result of an offer made to encourage
voluntary redundancy. Termination benefi ts for voluntary
redundancies are recognised as an expense if the Group has made
an offer encouraging voluntary redundancy, it is probable that the
offer will be accepted, and the number of acceptances can be
estimated reliably.
(vii) Treasury shares
In 1999, the Company introduced an Employee Share Ownership
Plan (ESOP). This plan allows non-recourse, interest free loans to
be provided to all employees as the Board may from time to time
make offers to employees to acquire shares under the plan. If
and when an issue is made to employees, it will be treated as an
in-substance grant of options and expensed in the period because
of the limited recourse nature of the loans. Since there is no
vesting period, there is no recurring expense for this item.
The shares are acquired in the name of the employee and each
employee authorises and appoints the Secretary of the Company
to act on their behalf. Any dividends paid on the shares of the
Company are used to repay the loan. If the employee leaves the
employment of the Group, the loan balance must be paid in full
or the shares will be sold and the proceeds applied to settle the
loan balance.
Shares in the Company held under ESOP are classifi ed and
disclosed as Treasury Shares and deducted from equity.
For
per
sona
l use
onl
y
60
3. Signifi cant Accounting Policies (continued)
(n) Revenue
Revenue is measured at the fair value of the consideration
received or receivable. Amounts disclosed as revenue are net
of returns, trade allowances, duties and taxes paid. Revenue is
recognised from major categories as follows:
• Revenue from services provided is recognised following the
provision of the service and/or in accordance with agreed
contractual terms in the period in which the service is
provided;
• Scheduled revenue from airline passenger ticket sales is
recognised when carriage (uplift) is performed. Scheduled
airline passenger revenue received in advance, together with
any commission thereon, is carried forward in the balance
sheet as unearned passenger revenue. Revenue earned from
the provision of other airline related services, and government
mandated charges is recognised in profi t or loss as it is
earned;
• Charter hire of vessels is recognised when the service is
provided;
• Revenue from sale of products is recognised at the time of
delivery;
• Revenue from warehousing services is recognised over the
period of the contract;
• Other income from the disposal of property, plant and
equipment is recognised when control of the property has
passed to the buyer;
• Interest revenue is recognised using the effective interest
method;
• Income from dividends and distributions are recognised when
they are declared;
• Rental revenue is recognised on a straight line basis over the
term of the lease; and
• Internal recharges are recognised as they are incurred and
charged.
No revenue is recognised if there are signifi cant uncertainties
regarding recovery of the consideration due, the costs incurred
or to be incurred cannot be measured reliably, there is a risk of
return of goods or there is a continuing management involvement
with the goods.
(o) Government grants
Grants from the government are recognised at their fair value
where there is a reasonable assurance that the grant will be
received and that the Group will comply with all attached
conditions. These grants are recognised as other income in the
income statement.
Government grants relating to costs are deferred and recognised
in profi t or loss over the period necessary to match them with the
costs that they are intended to compensate.
Government grants relating to the purchase of property, plant
and equipment are included in non current liabilities as deferred
income and are credited to profi t or loss on straight line basis over
the expected lives of the related assets.
(p) Expenses
(i) Operating lease payments
Payments made under operating leases are recognised in the
profi t or loss on a straight-line basis over the term of the lease.
Lease incentives received are recognised in profi t or loss as an
integral part of the total lease expense and spread over the
lease term.
(ii) Finance lease payments
Minimum lease payments are apportioned between the fi nance
charge and the reduction of the outstanding liability. The fi nance
expense is allocated to each period during the lease term so as
to produce a constant periodic rate of interest on the remaining
balance of the liability.
(iii) Borrowing costs
Borrowing costs are expensed as incurred unless they relate
to qualifying assets. Qualifying assets are assets which take
more than 12 months to get ready for their intended use or sale.
In these circumstances, borrowing costs are capitalised to the
cost of the assets. Where funds are borrowed specifi cally for
the acquisition, construction or production of a qualifying asset,
the amount of borrowing costs capitalised are those incurred in
relation to those borrowings, net of any interest earned on those
borrowings. Where funds are borrowed for the acquisition of a
qualifying asset, borrowing costs are capitalised using a weighted
average capitalisation rate.
(iv) Finance income and expenses
Finance income comprises interest income on funds invested,
gains on the disposal of available-for-sale fi nancial assets, changes
in the fair value of fi nancial assets at fair value through profi t or
loss, and gains on hedging instruments that are recognised in
profi t or loss. Interest income is recognised as it accrues, using
the effective interest method.
Finance expenses comprise interest expense on borrowings,
unwinding of the discount on provisions, dividends on reset
preference shares classifi ed as liabilities, changes in the fair value
of fi nancial assets at fair value through profi t or loss, impairment
losses recognised on fi nancial assets, and losses on hedging
instruments that are recognised in profi t or loss using the
effective interest method.
(q) Income tax
Income tax expense comprises current and deferred tax. Income
tax expense is recognised in profi t or loss except to the extent
that it relates to items recognised directly in equity, in which case
it is recognised in equity.
NOTES TO THE FINANCIAL STATEMENTS C O N T I N U E D
F O R T H E Y E A R E N D E D 3 0 J U N E 2 0 0 8
For
per
sona
l use
onl
y

TOLL – ANNUAL REPORT 2008 61
Current tax is the expected tax payable on the taxable income for
the year, using tax rates enacted or substantively enacted at the
reporting date, and any adjustment to tax payable in respect of
previous years.
Deferred tax is recognised using the balance sheet method,
providing for temporary differences between the carrying
amounts of assets and liabilities for fi nancial reporting purposes
and the amounts used for taxation purposes. Deferred tax is
not recognised for the following temporary differences: the
initial recognition of goodwill, the initial recognition of assets or
liabilities in a transaction that is not a business combination and
that affects neither accounting nor taxable profi t, and differences
relating to investments in subsidiaries and jointly controlled
entities to the extent that it is probable that they will not reverse
in the foreseeable future. Deferred tax is measured at the tax
rates that are expected to be applied to the temporary differences
when they reverse, based on the laws that have been enacted or
substantially enacted by the reporting date. Deferred tax assets
and liabilities are offset if there is a legally enforceable right of
offset, and they relate to income taxes levied by the same tax
authority on the same taxable entity, or on different tax entities,
but they intend to settle current tax liabilities and assets on
a net basis or their tax assets and liabilities will be realised
simultaneously.
A deferred tax asset is recognised only to the extent that it is
probable that future taxable profi ts will be available against
which the temporary difference can be utilised. Deferred tax
assets are reviewed at each reporting date and are reduced to the
extent that it is no longer probable that the related tax benefi t will
be realised.
Additional income taxes that arise from the distribution of
dividends are recognised at the same time as the liability to pay
the related dividend is recognised.
Tax consolidation
The Company and its wholly-owned Australian resident entities
have formed a tax consolidated group and are therefore taxed as
a single entity from that date. The head entity within the
tax-consolidated group is Toll Holdings Limited.
Current tax expense/income, deferred tax liabilities and deferred
tax assets arising from temporary differences of the members
of the tax consolidated group are recognised in their separate
fi nancial statements using the ‘stand-alone taxpayer’ approach.
Under this approach, each entity in the tax-consolidated group
measures its current and deferred taxes as if it continued to be a
separate taxable entity in its own right. This also means that each
entity recognises tax in relation to its intra-group transactions.
Each entity also assesses the recovery of its unused tax losses
and tax credits only in the period in which they arise, and before
assumption by the head entity, applied in its own circumstances,
without regard to the circumstances of the tax-consolidated group.
Any current tax liabilities (or assets) and deferred tax assets
arising from unused tax losses of the subsidiaries are assumed by
the head entity in the tax-consolidated group and are recognised
as amounts payable/(receivable) to/(from) other entities in the
tax-consolidated group in conjunction with any tax funding
arrangement amounts (refer below). Any difference between
these amounts is recognised by the Company as an equity
contribution or distribution.
The Company recognises deferred tax assets arising from unused
tax losses of the tax consolidated group to the extent that it is
probable that future taxable profi ts of the tax consolidated group
will be available against which the asset can be utilised.
Any subsequent period adjustments to deferred tax assets arising
from unused tax losses as a result of revised assessments of the
probability of recoverability is recognised by the head entity only.
Nature of tax funding arrangements and
tax sharing agreements
The head entity, in conjunction with other members of the tax
consolidated group, has entered into a tax funding arrangement
which sets out the funding obligations of members of the tax
consolidated group in respect of tax amounts. Each entity
accounts for its inter-entity assets and liabilities that arise for
it under the arrangement. These amounts are treated as arising
through equity contributions or distributions, in the same way as
the head entity’s assumption of subsidiaries’ current tax amounts
and tax losses/credits, and therefore alter the net amount
recognised as tax-consolidation contributions by or distributions
to equity participants. However, there will be no net contribution
or distribution where the amounts arising for the period under
the tax funding arrangement equate to the amounts initially
recognised by a subsidiary for its current taxes and any tax losses/
credits assumed by the head entity.
Contributions to fund the current tax liabilities are payable as per
the tax funding arrangement and refl ect the timing of the head
entity’s obligation to make payments for tax liabilities to the
relevant tax authorities.
The head entity in conjunction with other members of the
tax-consolidated group, has also entered into a tax sharing
agreement. The tax sharing agreement provides for the
determination of the allocation of income tax liabilities between
the entities should the head entity default on its tax payment
obligations. No amounts have been recognised in the fi nancial
statements in respect of this agreement as payment of any
amounts under the tax sharing agreement is considered remote.For
per
sona
l use
onl
y

62
3. Signifi cant Accounting Policies (continued)
(r) Goods and Services Tax
Revenues, expenses and assets are recognised net of the amount
of Goods and Services Tax (GST), except where the amount of
GST incurred is not recoverable from the relevant tax authority. In
these circumstances the GST is recognised as part of the cost of
acquisition of the asset or as part of an item of expense.
Receivables and payables are stated with the amount of GST
included. The net amount of GST recoverable from, or payable to,
the tax authority is included as a current asset or liability in the
balance sheet.
Cash fl ows are included in the statement of cash fl ows on a gross
basis. The GST components of cash fl ows arising from investing
and fi nancing activities, which are recoverable from, or payable
to, the tax authority are classifi ed as operating cash fl ows.
(s) Segment reporting
A segment is a distinguishable component of the Group that
is engaged either in providing related products or services
(business segment), or in providing products or services within a
particular economic environment (geographical segment), which is
subject to risks and returns that are different from those of other
segments. Segment information is presented in respect of the
Group’s business and geographical segments. The Group’s primary
format for segment reporting is based on business segments
as determined based on the Group’s management and internal
reporting structure.
Inter-segment pricing is determined on an arm’s length basis.
Segment results, assets and liabilities include items directly
attributable to a segment as well as those that can be allocated
on a reasonable basis.
Segment capital expenditure is the total cost incurred during the
period to acquire property, plant and equipment, and intangible
assets other than goodwill.
(t) Earnings per share
The Group presents basic and diluted earnings per share (EPS)
data for its ordinary shares. Basic EPS is calculated by dividing the
profi t or loss attributable to ordinary shareholders of the Company
by the weighted average number of ordinary shares outstanding
during the period. Diluted EPS is determined by adjusting the
profi t or loss attributable to ordinary shareholders and the
weighted average number of ordinary shares outstanding for the
effects of all dilutive potential ordinary shares, which comprise
convertible notes and share options granted to employees.
(u) Discontinued operations
A discontinued operation is a component of the Group’s business
that represents a separate major line of business or geographical
area of operations that has been disposed of or is held for sale,
or is a subsidiary acquired exclusively with a view to resale.
Classifi cation as a discontinued operation occurs upon disposal or
when the operation meets the criteria to be classifi ed as held for
sale, if earlier. When an operation is classifi ed as a discontinued
operation, the comparative income statement is restated as if the
operation had been discontinued from the start of the comparative
period.
(v) Loyalty program accounting
The Group receives revenue from the sale to third parties of rights
to have Velocity Reward points allocated to members of the
Velocity program. This revenue is deferred and recognised in profi t
or loss when the points are redeemed. Members of the Velocity
Program also accumulate points by travelling on qualifying Group
airline services. The obligation to provide awards to members
is accounted for by deferring a portion of the fl ight ticket sales
revenue. This revenue is recognised in profi t or loss when the
points are redeemed.
(w) Use of estimates and judgements
The preparation of fi nancial statements requires management
to make judgements, estimates and assumptions that affect the
application of accounting policies and the reported amounts of
assets, liabilities, income and expenses. Actual results may differ
from these estimates. Estimates and underlying assumptions are
reviewed on an ongoing basis. Revisions to accounting estimates
are recognised in the period in which the estimate is revised and
in any future periods affected. In particular, information about
signifi cant areas of estimation uncertainty and critical judgements
in applying accounting policies that have the most signifi cant
effect on the amount recognised in the fi nancial statements are
described below:
Impairment of goodwill and intangibles with indefi nite
useful lives
The Group assesses whether goodwill and intangibles with
indefi nite useful lives are impaired at least annually in accordance
with the accounting policy in note 3(j). These calculations involve
an estimation of the recoverable amount of the cash-generating
units to which the goodwill and intangibles with indefi nite useful
lives are allocated.
Defi ned benefi t superannuation fund obligations
Various actuarial assumptions are utilised in the determination
of the Group’s defi ned benefi t superannuation fund obligations.
These assumptions are discussed in note 25(b).
Workers compensation self-insurance provisions
Independent actuarial valuations are used to estimate the
provision required for workers compensation where the Group
is self insured.
Maintenance provisions
As described in note 3(e), the Group provides for the estimated
future costs of major cyclical maintenance of leased airframes,
engines, landing gear and auxiliary power units, calculated by
reference to the rectifi cation of costs and the number of hours or
cycles operated during the period. These calculations require the
use of assumptions regarding the timing of maintenance and the
NOTES TO THE FINANCIAL STATEMENTS C O N T I N U E D
F O R T H E Y E A R E N D E D 3 0 J U N E 2 0 0 8
For
per
sona
l use
onl
y

TOLL – ANNUAL REPORT 2008 63
cost of repairs. The timing of future payments is estimated with
reference to historical data, industry standards and manufacturers
specifi cations.
Financial Instruments
The Group enters into fi nancial arrangements to manage
exposures to interest rates, foreign currency and fuel price risk.
Financial instruments are recognised as fi nancial assets and
fi nancial liabilities of the entity. The fair value of these fi nancial
assets and fi nancial liabilities must be estimated for recognition
and measurement disclosure purposes. These calculations require
valuation techniques using various methods and assumptions.
Residual Values
The estimate of the useful life and depreciable amount of aircraft
requires the use of assumptions regarding the residual value of
the aircraft at the estimated time of disposal. Residual value is
estimated based on market estimates of future aircraft values and
current expectations of the aircraft operations. As the market for
aircraft is based on US dollars, residual value estimates are also
affected by expectations of future movements in the US dollar
against the Australian dollar.
Acquisition accounting
The Group’s fair values of the assets and liabilities at acquisition
are provisional and subject to review during the period up to
twelve months from acquisition date. The provisional fair values
are updated to refl ect new information that provides better
evidence of fair values at acquisition date.
(x) New standards and interpretations not yet adopted
The following standards, amendments to standards and
interpretations have been identifi ed as those which may impact
the entity in the period of initial application. They are available
for early adoption at 30 June 2008, but have not been applied in
preparing this fi nancial report:
• AASB 3 (revised) Business Combinations. This Standard
changes the application of acquisition accounting for
business combinations and the accounting for non-controlling
(minority) interests. Key changes include: the immediate
expensing of all transaction costs; measurement of
contingent consideration at acquisition date with subsequent
changes through the income statement; measurement of
non-controlling (minority) interests at full fair value or the
proportionate share of the fair value of the underlying net
assets; guidance on issues such as reacquired rights and
vendor indemnities; and the inclusion of combinations by
contract alone and those involving mutuals. The revised
Standard becomes mandatory for the Group’s 30 June 2010
fi nancial statements. The Group has not yet determined
the potential effect of the revised Standard on the Group’s
fi nancial report.
• AASB 8 Operating Segments introduces the ‘management
approach’ to segment reporting. AASB 8, which becomes
mandatory for the Group’s 30 June 2010 fi nancial statements,
will require the disclosure of segment information based on
the internal reports regularly reviewed by the Group’s Chief
Operating Decision Maker in order to assess each segment’s
performance and to allocate resources to them. Currently the
Group presents segment information in respect of its business
and geographical segments (see note 4). The Group does
not anticipate any signifi cant changes in implementing
this standard.
• AASB 101 (revised) Presentation of Financial Statements. This
Standard introduces a statement of comprehensive income.
Other revisions include impacts on the presentation of items
in the statement of changes in equity, new presentation
requirements for restatements or reclassifi cations of items
in the fi nancial statements, changes in the presentation
requirements for dividends and changes to the titles
of the fi nancial statements. It is applicable for annual
reporting periods beginning on or after 1 January 2009. The
amendments are expected to only affect the presentation
of the Company’s fi nancial report and will not have a direct
impact on the measurement and recognition of amounts under
the current AASB 101. Retrospective action will be required.
Application date for the Company is 30 June 2009.
• AASB 127 (revised) Consolidated and Separate Financial
Statements. This Standard changes the accounting for
investments in subsidiaries. Key changes include: the
re-measurement to fair value of any previous/retained
investment when control is obtained/lost, with any resulting
gain or loss being recognised in profi t or loss; and the
treatment of increases in ownership interest after control
is obtained as transactions with equity holders in their
capacity as equity holders. The revised Standard will become
mandatory for the Group’s 30 June 2010 fi nancial statements.
The Group has not determined the potential effect of the
revised standard on the Group’s fi nancial report.
• AASB 2008-1 Amendments to Australian Accounting
Standard-Share-based Payment: Vesting Conditions and
Cancellations changes the measurement of share-based
payments that contain non-vesting conditions. AASB 2008-1
becomes mandatory for the Group’s 30 June 2010 fi nancial
statements. The Group has not yet determined the potential
effect of the amending standard on the Group’s fi nancial report.For
per
sona
l use
onl
y

64
4. Segment Information
The Group comprises the following main business segments, based on the Group’s management reporting system.
Business Segment – 2008
Toll Australia
/NZ $M
Toll Asia
$M
Toll Global Forwarding
$M Discontinued
$M Elimination
$M Consolidated
$M
Less Discontinued
Operations $M
Consolidated (Continuing Operations)
$M
Revenue
Operating segment revenue 4,641.7 605.2 357.6 2,783.9 – 8,388.4 (2,783.9) 5,604.5
Intersegment revenue – – – 23.3 (23.3) – – –
Total Segment Revenue 4,641.7 605.2 357.6 2,807.2 (23.3) 8,388.4 (2,783.9) 5,604.5
Segment result
Segment result 351.6 61.1 10.9 204.2 – 627.8 (204.2) 423.6
Share of profi t of associates and joint ventures 2.9 2.3 – – – 5.2 – 5.2
Total Segment Result 354.5 63.4 10.9 204.2 – 633.0 (204.2) 428.8
Depreciation and amortisation arising from acquisition accounting (7.0) (18.1) (1.5) – – (26.6) – (26.6)
Write-down of investment in listed company (10.4) – – – – (10.4) – (10.4)
Net fi nance costs (61.2) 28.1 (33.1)
Loss on disposal of discontinued operations (1,080.5) 1,080.5 –
Share of minority interest on discontinued operations (36.3) 36.3 –
Profi t/(loss) before income tax expense (582.0) 940.7 358.7
Income tax expense (108.8) 4.4 (104.4)
Profi t /(loss) after income tax for the period (690.8) 945.1 254.3
Depreciation and amortisation 125.3 38.6 3.8 172.3 – 340.0 (172.3) 167.7
NOTES TO THE FINANCIAL STATEMENTS C O N T I N U E D
F O R T H E Y E A R E N D E D 3 0 J U N E 2 0 0 8
For
per
sona
l use
onl
y

TOLL – ANNUAL REPORT 2008 65
4. Segment Information (continued)
Business Segment – 2007
Toll Australia
/NZ $M
Toll Asia $M
Toll Global Forwarding
$M Discontinued
$M Elimination
$M Consolidated
$M
Less Discontinued
Operations $M
Consolidated (Continuing Operations)
$M
Revenue
Operating segment revenue 4,251.2 461.2 145.0 5,093.3 – 9,950.7 (5,093.3) 4,857.4
Intersegment revenue – – – 255.2 (255.2) – – –
Total Segment Revenue 4,251.2 461.2 145.0 5,348.5 (255.2) 9,950.7 (5,093.3) 4,857.4
Segment result
Segment result 296.0 48.6 4.9 774.0 – 1,123.5 (774.0) 349.5
Share of profi t of associates and joint ventures 4.0 11.5 – 11.6 – 27.1 (11.6) 15.5
Total Segment Result 300.0 60.1 4.9 785.6 – 1,150.6 (785.6) 365.0
Depreciation and amortisation arising from acquisition accounting (7.7) (16.6) – (97.6) – (121.9) 97.6 (24.3)
Non recurring restructure and transaction costs (10.4) – – – – (10.4) 2.6 (7.8)
Net fi nance costs (335.8) 30.6 (305.2)
Gain on sale of discontinued operations 828.0 (828.0) –
Share of minority interest on discontinued operations (80.2) 80.2 –
Profi t before income tax expense 1,430.3 (1,402.6) 27.7
Income tax expense (144.7) 151.4 6.7
Profi t for the period 1,285.6 (1,251.2) 34.4
Depreciation and amortisation 107.4 28.0 0.3 397.7 – 533.4 (397.7) 135.7 F
or p
erso
nal u
se o
nly

66
4. Segment Information (continued)
Business Segment – 2008
Toll Australia
/NZ $M
Toll Asia
$M
Toll Global Forwarding
$M Discontinued
$M Unallocated
$M Consolidated
$M
Less: Discontinued
Operations $M
Consolidated (Continuing Operations)
$M
Assets
Segment assets 3,007.3 1,116.6 284.6 – – 4,408.5 – 4,408.5
Equity accounted investments 55.8 170.0 1.1 – – 226.9 – 226.9
Unallocated cash deposits – – – – 205.0 205.0 – 205.0
Consolidated Total Assets 3,063.1 1,286.6 285.7 – 205.0 4,840.4 – 4,840.4
Liabilities
Segment liabilities 837.7 470.0 168.2 – – 1,475.9 – 1,475.9
Unallocated corporate liabilities (principally corporate debt) – – – – 1,261.4 1,261.4 – 1,261.4
Consolidated Total Liabilities 837.7 470.0 168.2 – 1,261.4 2,737.3 – 2,737.3
Acquisition of Non Current Assets 290.2 45.1 2.8 1,083.0 – 1,421.1 (1,083.0) 338.1
Business Segment – 2007
Toll Australia
/NZ $M
Toll Asia $M
Toll Global Forwarding
$M Discontinued
$M Unallocated
$M Consolidated
$M
Less: Discontinued
Operations $M
Consolidated (Continuing Operations)
$M
Assets
Segment assets 1,671.5 894.9 51.0 4,059.4 – 6,676.8 (4,059.4) 2,617.4
Equity accounted investments 56.5 214.0 – 3.8 – 274.3 (3.8) 270.5
Unallocated cash deposits – – – – 665.0 665.0 – 665.0
Consolidated Total Assets 1,728.0 1,108.9 51.0 4,063.2 665.0 7,616.1 (4,063.2) 3,552.9
Liabilities
Segment liabilities 616.3 412.6 34.1 1,785.6 – 2,848.6 (1,785.6) 1,063.0
Unallocated corporate liabilities (principally corporate debt) – – – – 1,146.2 1,146.2 – 1,146.2
Consolidated Total Liabilities 616.3 412.6 34.1 1,785.6 1,146.2 3,994.8 (1,785.6) 2,209.2
Acquisition of Non Current Assets 166.3 7.5 – 582.2 – 756.0 (582.2) 173.8
NOTES TO THE FINANCIAL STATEMENTS C O N T I N U E D
F O R T H E Y E A R E N D E D 3 0 J U N E 2 0 0 8
For
per
sona
l use
onl
y
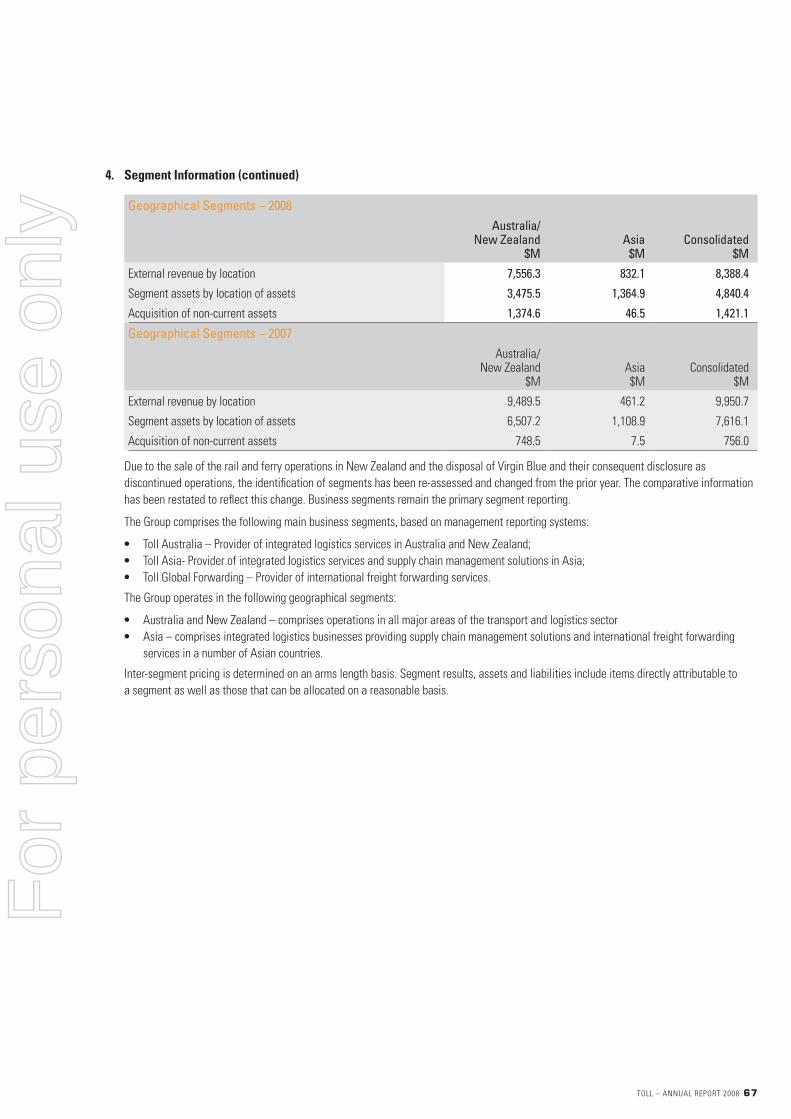
TOLL – ANNUAL REPORT 2008 67
4. Segment Information (continued)
Geographical Segments – 2008
Australia/ New Zealand
$M Asia
$M Consolidated
$M
External revenue by location 7,556.3 832.1 8,388.4
Segment assets by location of assets 3,475.5 1,364.9 4,840.4
Acquisition of non-current assets 1,374.6 46.5 1,421.1
Geographical Segments – 2007
Australia/New Zealand
$M Asia $M
Consolidated $M
External revenue by location 9,489.5 461.2 9,950.7
Segment assets by location of assets 6,507.2 1,108.9 7,616.1
Acquisition of non-current assets 748.5 7.5 756.0
Due to the sale of the rail and ferry operations in New Zealand and the disposal of Virgin Blue and their consequent disclosure as
discontinued operations, the identifi cation of segments has been re-assessed and changed from the prior year. The comparative information
has been restated to refl ect this change. Business segments remain the primary segment reporting.
The Group comprises the following main business segments, based on management reporting systems:
• Toll Australia – Provider of integrated logistics services in Australia and New Zealand;
• Toll Asia- Provider of integrated logistics services and supply chain management solutions in Asia;
• Toll Global Forwarding – Provider of international freight forwarding services.
The Group operates in the following geographical segments:
• Australia and New Zealand – comprises operations in all major areas of the transport and logistics sector
• Asia – comprises integrated logistics businesses providing supply chain management solutions and international freight forwarding
services in a number of Asian countries.
Inter-segment pricing is determined on an arms length basis. Segment results, assets and liabilities include items directly attributable to
a segment as well as those that can be allocated on a reasonable basis.
For
per
sona
l use
onl
y

68
5. Revenue
Consolidated The Company
2008
$M 2007
$M 2008
$M 2007
$M
Operating Revenue
Transport and logistics services rendered 5,593.7 4,848.6 1.1 0.1
Other Revenue
Rental revenue 10.8 8.8 0.8 0.1
5,604.5 4,857.4 1.9 0.2
6. Other Income
Consolidated The Company
2008
$M 2007
$M 2008
$M 2007
$M
Dividend Income
– Related parties – – 517.3 467.0
– Other parties 2.5 0.1 – –
Distribution from trust – – 2.8 2.9
Internal recharges – – 46.2 36.8
Government grants 1.4 2.0 – –
Net gain on disposal of investments and businesses 1.7 10.0 – –
Net gain on disposal of property, plant and equipment 19.9 8.0 – –
Other 1.5 – – –
27.0 20.1 566.3 506.7
NOTES TO THE FINANCIAL STATEMENTS C O N T I N U E D
F O R T H E Y E A R E N D E D 3 0 J U N E 2 0 0 8
For
per
sona
l use
onl
y
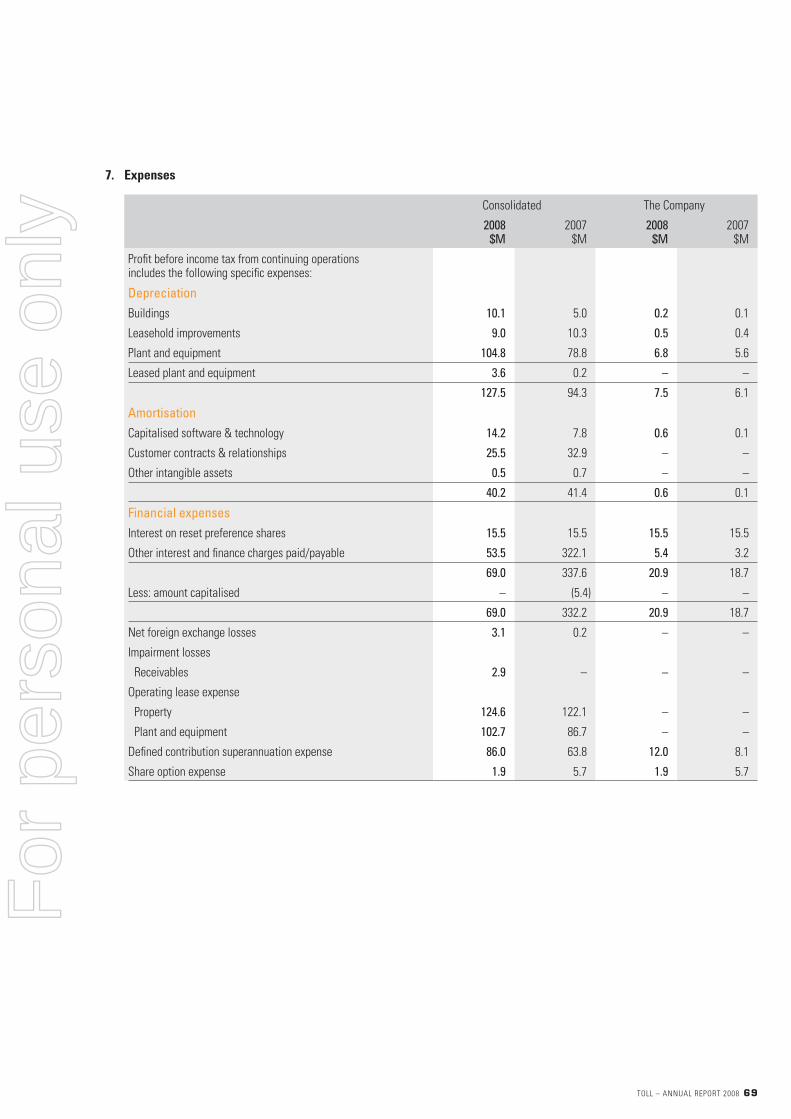
TOLL – ANNUAL REPORT 2008 69
7. Expenses
Consolidated The Company
2008
$M 2007
$M 2008
$M 2007
$M
Profi t before income tax from continuing operations includes the following specifi c expenses:
Depreciation
Buildings 10.1 5.0 0.2 0.1
Leasehold improvements 9.0 10.3 0.5 0.4
Plant and equipment 104.8 78.8 6.8 5.6
Leased plant and equipment 3.6 0.2 – –
127.5 94.3 7.5 6.1
Amortisation
Capitalised software & technology 14.2 7.8 0.6 0.1
Customer contracts & relationships 25.5 32.9 – –
Other intangible assets 0.5 0.7 – –
40.2 41.4 0.6 0.1
Financial expenses
Interest on reset preference shares 15.5 15.5 15.5 15.5
Other interest and fi nance charges paid/payable 53.5 322.1 5.4 3.2
69.0 337.6 20.9 18.7
Less: amount capitalised – (5.4) – –
69.0 332.2 20.9 18.7
Net foreign exchange losses 3.1 0.2 – –
Impairment losses
Receivables 2.9 – – –
Operating lease expense
Property 124.6 122.1 – –
Plant and equipment 102.7 86.7 – –
Defi ned contribution superannuation expense 86.0 63.8 12.0 8.1
Share option expense 1.9 5.7 1.9 5.7
For
per
sona
l use
onl
y

70
8 Income Tax Expense
Recognised in the income statement
Consolidated The Company
2008
$M 2007
$M 2008
$M 2007
$M
Current tax expense
Current year 108.5 144.2 (22.1) (43.6)
Adjustments for prior years (6.6) 3.5 (4.0) –
101.9 147.7 (26.1) (43.6)
Deferred tax expense
Origination and reversal of temporary differences 6.9 (3.0) 2.0 (1.0)
Total income tax expense/(benefi t) 108.8 144.7 (24.1) (44.6)
Income tax expense/(benefi t) from continuing operations 104.4 (6.7) (15.8) (11.0)
Income tax expense/(benefi t) from discontinued operations 4.4 151.4 (8.3) (33.6)
Total income tax expense/(benefi t) 108.8 144.7 (24.1) (44.6)
Numerical reconciliation between tax expense
and pre-tax net profi t
Profi t from continuing operations before income tax expense 358.7 27.7 499.5 484.7
Profi t/(loss) from discontinued operations before income tax expense (940.7) 1,482.8 (38.6) 733.0
Total profi t before tax (582.0) 1,510.5 460.9 1,217.7
Income tax expense/(benefi t) using the domestic corporation tax rate of 30% (2007 – 30%) (174.6) 453.2 138.3 365.3
Increase in tax expense due to:
Non deductible expenditure 25.8 25.0 4.0 7.5
Tax losses not recognised 2.0 1.0 – –
Decrease in tax expense/(benefi t) due to:
Non-assessable profi t upon demerger/loss on disposal 308.1 (291.1) – (253.3)
Non-assessable inter-company dividend – – (155.2) (157.9)
Other non assessable items (21.6) (17.1) (7.2) (6.2)
Tax exempt income (12.2) (17.4) – –
Utilisation of tax losses not previously recognised (17.2) – – –
Effect of tax rate in foreign jurisdictions 6.4 (0.8) – –
Tax rate change – (6.0) – –
Share of associates net profi t (1.3) (5.6) – –
115.4 141.2 (20.1) (44.6)
Under/(over) provision in prior years (6.6) 3.5 (4.0) –
Income tax expense/(benefi t) 108.8 144.7 (24.1) (44.6)
Deferred tax recognised directly in equity
Relating to:
– changes in fair value of cash fl ow hedges – (30.0) – –
– hedge of net investment in foreign subsidiary 11.6 13.4 – –
11.6 (16.6) – –
NOTES TO THE FINANCIAL STATEMENTS C O N T I N U E D
F O R T H E Y E A R E N D E D 3 0 J U N E 2 0 0 8
For
per
sona
l use
onl
y
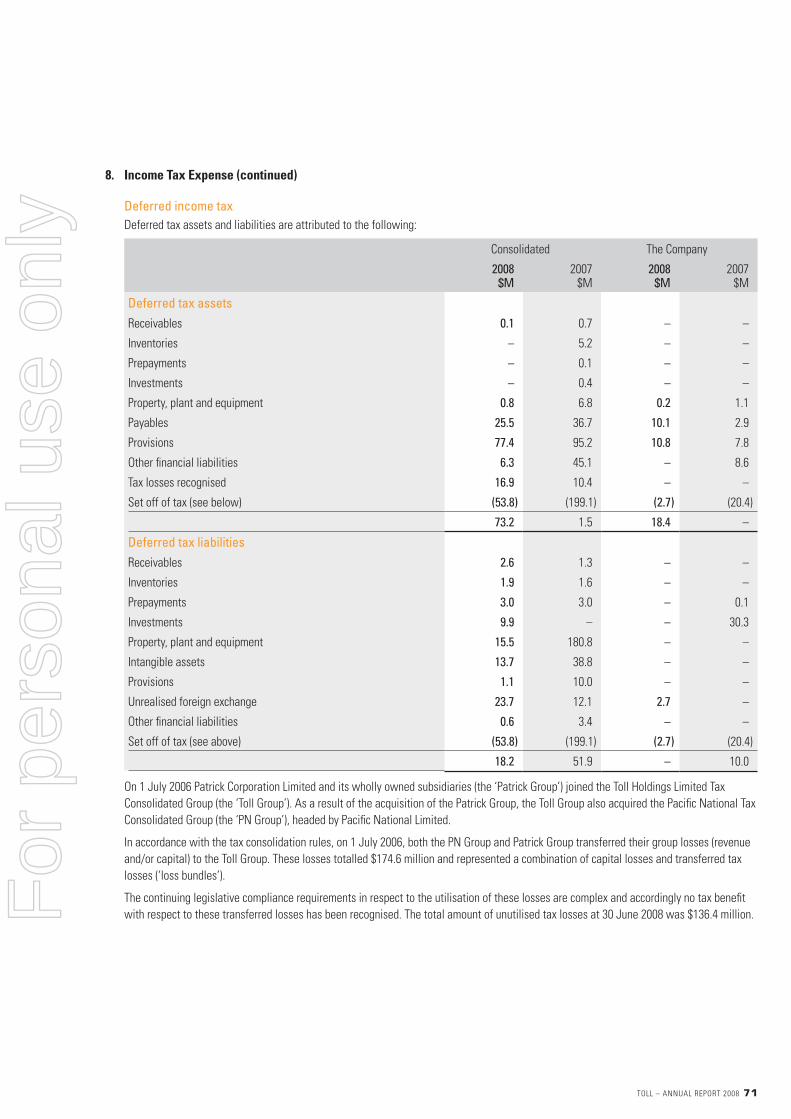
TOLL – ANNUAL REPORT 2008 71
8. Income Tax Expense (continued)
Deferred income tax
Deferred tax assets and liabilities are attributed to the following:
Consolidated The Company
2008
$M 2007
$M 2008
$M 2007
$M
Deferred tax assets
Receivables 0.1 0.7 – –
Inventories – 5.2 – –
Prepayments – 0.1 – –
Investments – 0.4 – –
Property, plant and equipment 0.8 6.8 0.2 1.1
Payables 25.5 36.7 10.1 2.9
Provisions 77.4 95.2 10.8 7.8
Other fi nancial liabilities 6.3 45.1 – 8.6
Tax losses recognised 16.9 10.4 – –
Set off of tax (see below) (53.8) (199.1) (2.7) (20.4)
73.2 1.5 18.4 –
Deferred tax liabilities
Receivables 2.6 1.3 – –
Inventories 1.9 1.6 – –
Prepayments 3.0 3.0 – 0.1
Investments 9.9 – – 30.3
Property, plant and equipment 15.5 180.8 – –
Intangible assets 13.7 38.8 – –
Provisions 1.1 10.0 – –
Unrealised foreign exchange 23.7 12.1 2.7 –
Other fi nancial liabilities 0.6 3.4 – –
Set off of tax (see above) (53.8) (199.1) (2.7) (20.4)
18.2 51.9 – 10.0
On 1 July 2006 Patrick Corporation Limited and its wholly owned subsidiaries (the ‘Patrick Group’) joined the Toll Holdings Limited Tax
Consolidated Group (the ‘Toll Group’). As a result of the acquisition of the Patrick Group, the Toll Group also acquired the Pacifi c National Tax
Consolidated Group (the ‘PN Group’), headed by Pacifi c National Limited.
In accordance with the tax consolidation rules, on 1 July 2006, both the PN Group and Patrick Group transferred their group losses (revenue
and/or capital) to the Toll Group. These losses totalled $174.6 million and represented a combination of capital losses and transferred tax
losses (‘loss bundles’).
The continuing legislative compliance requirements in respect to the utilisation of these losses are complex and accordingly no tax benefi t
with respect to these transferred losses has been recognised. The total amount of unutilised tax losses at 30 June 2008 was $136.4 million.For
per
sona
l use
onl
y
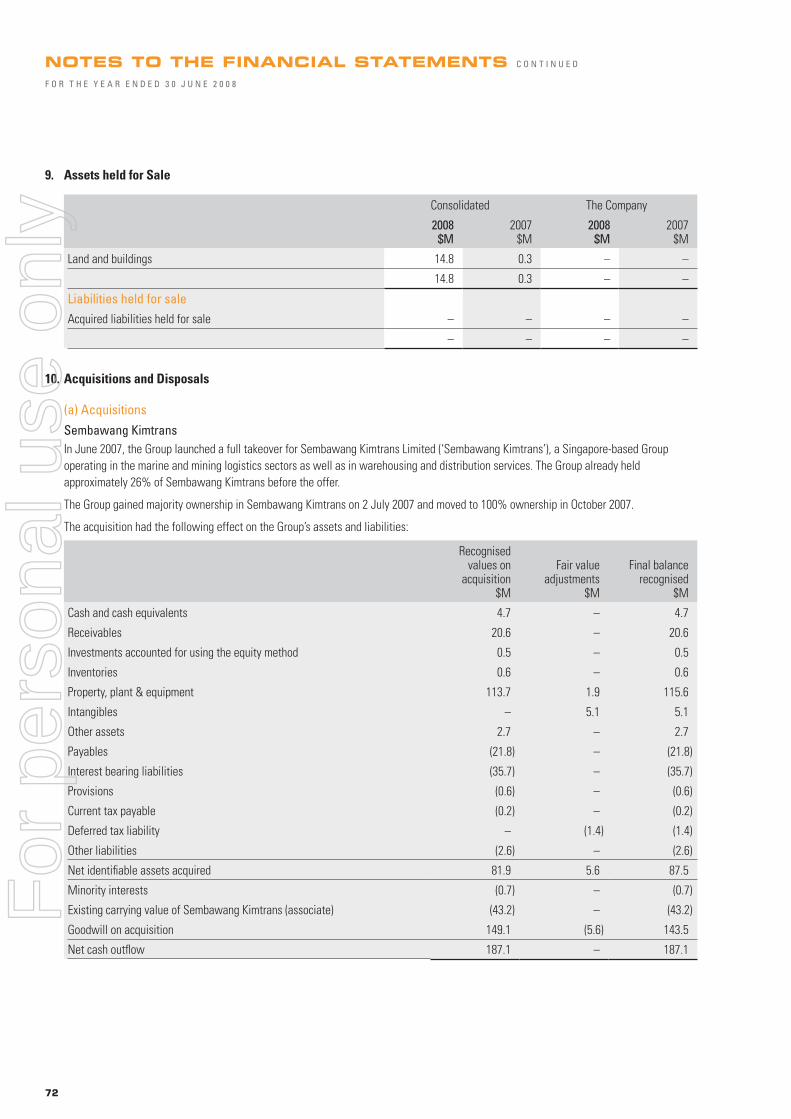
72
9. Assets held for Sale
Consolidated The Company
2008
$M 2007
$M 2008
$M 2007
$M
Land and buildings 14.8 0.3 – –
14.8 0.3 – –
Liabilities held for sale
Acquired liabilities held for sale – – – –
– – – –
10. Acquisitions and Disposals
(a) Acquisitions
Sembawang Kimtrans
In June 2007, the Group launched a full takeover for Sembawang Kimtrans Limited (‘Sembawang Kimtrans’), a Singapore-based Group
operating in the marine and mining logistics sectors as well as in warehousing and distribution services. The Group already held
approximately 26% of Sembawang Kimtrans before the offer.
The Group gained majority ownership in Sembawang Kimtrans on 2 July 2007 and moved to 100% ownership in October 2007.
The acquisition had the following effect on the Group’s assets and liabilities:
Recognised values on
acquisition $M
Fair value adjustments
$M
Final balance recognised
$M
Cash and cash equivalents 4.7 – 4.7
Receivables 20.6 – 20.6
Investments accounted for using the equity method 0.5 – 0.5
Inventories 0.6 – 0.6
Property, plant & equipment 113.7 1.9 115.6
Intangibles – 5.1 5.1
Other assets 2.7 – 2.7
Payables (21.8) – (21.8)
Interest bearing liabilities (35.7) – (35.7)
Provisions (0.6) – (0.6)
Current tax payable (0.2) – (0.2)
Deferred tax liability – (1.4) (1.4)
Other liabilities (2.6) – (2.6)
Net identifi able assets acquired 81.9 5.6 87.5
Minority interests (0.7) – (0.7)
Existing carrying value of Sembawang Kimtrans (associate) (43.2) – (43.2)
Goodwill on acquisition 149.1 (5.6) 143.5
Net cash outfl ow 187.1 – 187.1
NOTES TO THE FINANCIAL STATEMENTS C O N T I N U E D
F O R T H E Y E A R E N D E D 3 0 J U N E 2 0 0 8
For
per
sona
l use
onl
y

TOLL – ANNUAL REPORT 2008 73
10. Acquisitions and Disposals (continued)
BALtrans
Recognised values on
acquisition $M
Cash and cash equivalents 43.0
Receivables 129.7
Property, plant & equipment 15.5
Intangible assets 48.7
Other assets 15.6
Payables (98.2)
Interest bearing liabilities (36.5)
Provisions (6.3)
Current tax payable (4.1)
Other liabilities (13.0)
Net identifi able assets acquired 94.4
Goodwill on acquisition 258.6
Net cash outfl ow 353.0
The Group is currently in the process of assessing the fair values of the assets and liabilities acquired. As a result, the fair values provided
above are provisional and will be subject to fi nalisation during the period up to twelve months from acquisition date.
Toll NZ
In September 2007, the Group moved to 100% ownership of Toll NZ Limited after it acquired the remaining 15.8% of shares that it did
not own. Toll NZ Limited has subsequently been de-listed from the New Zealand Stock Exchange.
The total cost to acquire the minority interests in Toll NZ Limited was $85.8m and resulted in goodwill of $35.2m recognised on the
balance sheet.
For
per
sona
l use
onl
y

74
10. Acquisitions and Disposals (continued)
(b) Discontinued Operations
2008:
Effective 30 June 2008, the rail and ferry operations in New Zealand were sold to the New Zealand Crown for NZ$690m equity value.
Also, effective 30 June 2008, the directors authorised the payment of a special (in specie distribution) dividend of Virgin Blue shares to Toll
shareholders. As a result, Virgin Blue became a discontinued operation of the Toll Group on that date.
2007:
Pursuant to Undertakings given to the ACCC on 11 March 2006 in connection with regulatory clearance of the consolidated entity’s
acquisition of Patrick Corporation Limited, the consolidated entity divested the Patrick Tasmania Shipping and Forwarding businesses on
31 March 2007. The consolidated entity also demerged the Group’s ports businesses; and the rail operations of Pacifi c National to Asciano
effective 15 June 2007. Further information about the Undertakings to the ACCC is set out in note 38.
The comparative income statement has been re-presented to show the discontinued operations separately from continuing operations.
Profi t and loss attributable to discontinued operations were as follows:
Consolidated
2008
$M 2007
$M
Results of discontinued operations
Revenue 2,783.9 5,093.3
Other income 18.0 22.8
Expenses (2,625.8) (4,472.9)
Share of profi t of associates and joint ventures – 11.6
Results from operating activities 176.1 654.8
Income tax expense (53.9) (191.4)
Results from operating activities, net of income tax 122.2 463.4
(Loss)/Gain on disposal of discontinued operations and demerger (net of transaction costs)* (1,080.5) 828.0
Share of minority interest on discontinued operations (36.3) (80.2)
Income tax benefi t associated with disposal 49.5 40.0
Profi t for the period (945.1) 1,251.2
Basic earnings (loss) per share (146.13¢) 198.16¢
Diluted earnings (loss) per share (146.13¢) 193.20¢
Cash fl ows from discontinued operations
Net cash from operating activities 369.2 944.2
Net cash from investing activities (1,034.2) 3,283.1
Net cash from fi nancing activities 533.0 9.7
Net cash from/(used in) discontinued operations (132.0) 4,237.0
* Includes additional costs associated with demerger of Asciano
NOTES TO THE FINANCIAL STATEMENTS C O N T I N U E D
F O R T H E Y E A R E N D E D 3 0 J U N E 2 0 0 8
For
per
sona
l use
onl
y

TOLL – ANNUAL REPORT 2008 75
10. Acquisitions and Disposals (continued)
(b) Discontinued Operations (continued)
Consolidated
2008
$M 2007
$M
Effect of disposal on the fi nancial position of the Group
Cash 647.5 –
Receivables 179.8 412.2
Inventories 11.3 50.0
Prepayments 91.5 106.1
Assets classifi ed as held for sale – 51.6
Investments accounted for using the equity method 0.8 22.0
Investments – 5.1
Property, plant & equipment 2,789.6 2,291.7
Intangible assets 1,155.1 4,843.1
Other fi nancial assets 112.5 36.4
Payables (786.9) (220.4)
Liabilities classifi ed as held for sale – (10.1)
Deferred income (17.8) –
Provisions (122.3) (275.9)
Interest bearing liabilities (1,585.1) (703.0)
Deferred tax liabilities (170.1) (72.9)
Other fi nancial liabilities (2.6) (0.3)
Net identifi able assets and liabilities 2,303.3 6,535.6
Minority interest in assets disposed (343.9) –
1,959.4 6,635.6
Consideration received/receivable:
– satisfi ed in cash 546.6 3,769.6
– satisfi ed through the issue of Asciano Shares and Asciano Units – 3,707.8
Total consideration 546.6 7,477.4
(Loss)/Gain on demerger of discontinued operations (net of transaction costs) in the Company is $nil million (2007; $766.6 million).
For
per
sona
l use
onl
y

76
11. Earnings Per Share
Basic earnings per share
The calculation of basic earnings per share at 30 June 2008 was based on the profi t/(loss) attributable to ordinary shareholders of
$(694.7) million (2007: $1,278.7 million) and a weighted average number of ordinary shares outstanding of 646.8 million (2007:
631.4 million), calculated as follows:
Consolidated
2008
$M 2007
$M
Profi t attributable to ordinary shareholders
Profi t from continuing operations 254.3 34.4
Profi t from continuing operations – attributable to minority interests (3.9) (6.9)
Profi t from continuing operations – attributable to ordinary shareholders 250.4 27.5
Profi t/(loss) from discontinued operations (945.1) 1,251.2
Profi t/(loss) attributable to ordinary shareholders (694.7) 1,278.7
Consolidated
Million shares
Million shares
Weighted average number of ordinary shares
Issued ordinary shares at 1 July 642.5 624.3
Effect of shares issued 4.3 7.1
Weighted average number of ordinary shares at 30 June 646.8 631.4
Diluted earnings per share
The calculation of diluted earnings per share at 30 June 2008 was based on the profi t/(loss) attributable to ordinary shareholders of
$(679.2) million (2007: $1,294.2 million) and a weighted average number of ordinary shares outstanding after adjustment for the effects
of all dilutive potential ordinary shares of 647.0 million (2007: 655.7 million), calculated as follows:
Consolidated
2008
$M 2007
$M
Profi t attributable to ordinary shareholders (diluted)
Profi t/(loss) attributable to ordinary shareholders (basic) (694.7) 1,278.7
Interest savings on Reset Preference Shares 15.5 15.5
Profi t attributable to ordinary shareholders (diluted) (679.2) 1,294.2
Consolidated
Million shares
Million shares
Weighted average number of ordinary shares (diluted)
Weighted average number of ordinary shares (basic) 646.8 631.4
Effect of share options on issue 0.2 3.4
Weighted average number of ordinary shares (diluted) 647.0 634.8
Effect of Reset Preference Shares 35.4 20.9
Weighted average number of ordinary shares (diluted) 682.4 655.7
The Reset Preference Shares are potentially dilutive. They were not included in the calculation of diluted EPS in 2008 because they were
anti-dilutive for that period, however they were treated as dilutive in 2007 (2008: 35.38 million potential ordinary shares (2007: 20.85 million)).
The change in potential ordinary shares is due to the adjustment in value from the Asciano demerger.
NOTES TO THE FINANCIAL STATEMENTS C O N T I N U E D
F O R T H E Y E A R E N D E D 3 0 J U N E 2 0 0 8
For
per
sona
l use
onl
y
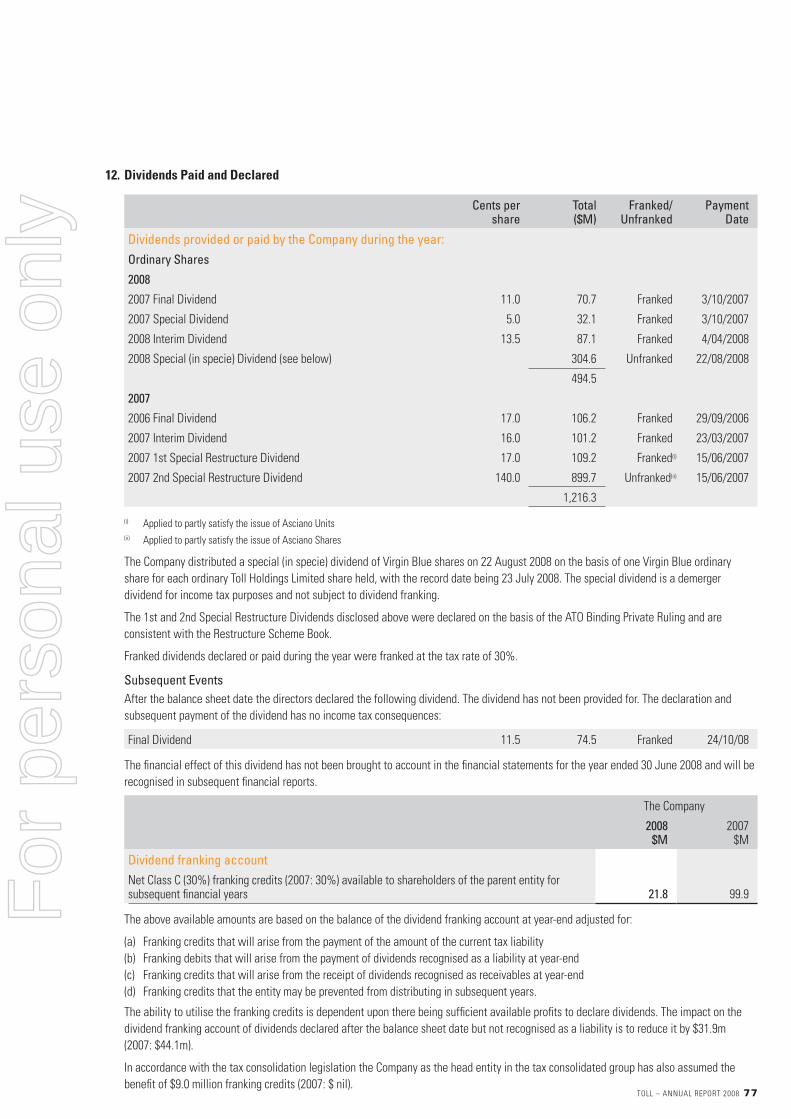
TOLL – ANNUAL REPORT 2008 77
12. Dividends Paid and Declared
Cents per
share Total ($M)
Franked/Unfranked
Payment Date
Dividends provided or paid by the Company during the year:
Ordinary Shares
2008
2007 Final Dividend 11.0 70.7 Franked 3/10/2007
2007 Special Dividend 5.0 32.1 Franked 3/10/2007
2008 Interim Dividend 13.5 87.1 Franked 4/04/2008
2008 Special (in specie) Dividend (see below) 304.6 Unfranked 22/08/2008
494.5
2007
2006 Final Dividend 17.0 106.2 Franked 29/09/2006
2007 Interim Dividend 16.0 101.2 Franked 23/03/2007
2007 1st Special Restructure Dividend 17.0 109.2 Franked(i) 15/06/2007
2007 2nd Special Restructure Dividend 140.0 899.7 Unfranked(ii) 15/06/2007
1,216.3
(i) Applied to partly satisfy the issue of Asciano Units
(ii) Applied to partly satisfy the issue of Asciano Shares
The Company distributed a special (in specie) dividend of Virgin Blue shares on 22 August 2008 on the basis of one Virgin Blue ordinary
share for each ordinary Toll Holdings Limited share held, with the record date being 23 July 2008. The special dividend is a demerger
dividend for income tax purposes and not subject to dividend franking.
The 1st and 2nd Special Restructure Dividends disclosed above were declared on the basis of the ATO Binding Private Ruling and are
consistent with the Restructure Scheme Book.
Franked dividends declared or paid during the year were franked at the tax rate of 30%.
Subsequent Events
After the balance sheet date the directors declared the following dividend. The dividend has not been provided for. The declaration and
subsequent payment of the dividend has no income tax consequences:
Final Dividend 11.5 74.5 Franked 24/10/08
The fi nancial effect of this dividend has not been brought to account in the fi nancial statements for the year ended 30 June 2008 and will be
recognised in subsequent fi nancial reports.
The Company
2008
$M 2007
$M
Dividend franking account
Net Class C (30%) franking credits (2007: 30%) available to shareholders of the parent entity for subsequent fi nancial years 21.8 99.9
The above available amounts are based on the balance of the dividend franking account at year-end adjusted for:
(a) Franking credits that will arise from the payment of the amount of the current tax liability
(b) Franking debits that will arise from the payment of dividends recognised as a liability at year-end
(c) Franking credits that will arise from the receipt of dividends recognised as receivables at year-end
(d) Franking credits that the entity may be prevented from distributing in subsequent years.
The ability to utilise the franking credits is dependent upon there being suffi cient available profi ts to declare dividends. The impact on the
dividend franking account of dividends declared after the balance sheet date but not recognised as a liability is to reduce it by $31.9m
(2007: $44.1m).
In accordance with the tax consolidation legislation the Company as the head entity in the tax consolidated group has also assumed the
benefi t of $9.0 million franking credits (2007: $ nil).
For
per
sona
l use
onl
y

78
12. Dividends Paid and Declared (continued)
Dividends actually paid, satisfi ed by the issue of shares under the dividend reinvestment plan or satisfi ed by the reduction in employee
loans under the employee share ownership plan during the years ended 30 June 2008 and 30 June 2007 were as follows:
The Company
2008
$M 2007
$M
Total dividends paid in cash 129.5 128.9
Satisfi ed by issue of shares in Toll Holdings 60.0 78.0
Satisfi ed by issue of shares and units in Asciano – 1,008.9
Satisfi ed by issue of Virgin Blue shares 304.6 –
Satisfi ed by reduction in employee share plan loans 0.4 0.5
494.5 1,216.3
13. Cash and Cash Equivalents
Consolidated The Company
2008
$M 2007
$M 2008
$M 2007
$M
Cash at bank and on hand 60.9 582.1 0.5 4.4
Deposits at call 293.1 1,161.5 – –
354.0 1,743.6 0.5 4.4
The amount of restricted cash and cash equivalents not available for use by the consolidated entity – 167.6 – –
14. Receivables
Consolidated The Company
2008
$M 2007
$M 2008
$M 2007
$M
Current
Trade Receivables 735.2 577.9 5.3 3.0
Allowance for impairment losses (23.2) (22.6) (2.8) (0.1)
712.0 555.3 2.5 2.9
Loans to controlled entities – – 2,236.7 11.2
Other receivables 750.2 140.7 0.3 –
1,462.2 696.0 2,239.5 14.1
Non Current
Loans to associates 6.2 6.4 5.6 4.9
Other receivables 11.5 29.9 – –
Other loans 4.4 – – –
22.1 36.3 5.6 4.9
1,484.3 732.3 2,245.1 19.0
In July 2008, approximately $620 million of current other receivables for the Group were received in settlement of asset sales for the
Toll New Zealand rail and ferry operations from the New Zealand Government.
NOTES TO THE FINANCIAL STATEMENTS C O N T I N U E D
F O R T H E Y E A R E N D E D 3 0 J U N E 2 0 0 8
For
per
sona
l use
onl
y

TOLL – ANNUAL REPORT 2008 79
15. Inventories
Consolidated The Company
2008
$M 2007
$M 2008
$M 2007
$M
Stores and materials 15.0 23.1 – –
Finished goods at net realisable value 22.1 17.9 – –
37.1 41.0 – –
16. Other Financial Assets
Consolidated The Company
2008
$M 2007
$M 2008
$M 2007
$M
Current
Derivative fi nancial instruments 56.1 35.5 11.2 2.0
56.1 35.5 11.2 2.0
Non Current
Derivative fi nancial instruments 1.7 – – –
Other cash deposits 0.2 24.8 – –
1.9 24.8 – –
58.0 60.3 11.2 2.0
17. Investments Accounted for using the Equity Method
Consolidated The Company
2008
$M 2007
$M 2008
$M 2007
$M
Non Current
Associates and joint ventures 226.9 274.3 – –
226.9 274.3 – –
For
per
sona
l use
onl
y

80
18. Investments
Consolidated The Company
2008
$M 2007
$M 2008
$M 2007
$M
Current
Listed shares – at market value – – – –
Unlisted shares – at market value – 0.7 – –
– 0.7 – –
Non Current
Shares in controlled entities – at cost – – 676.6 8,430.9
Shares in associate entities – – 23.5 16.3
Listed shares – at market value 67.8 25.3 – –
Unlisted shares – at cost 1.8 2.4 – –
69.6 27.7 700.1 8,447.2
69.6 28.4 700.1 8,447.2
Unlisted shares in other entities carried at cost are not measured at fair value because their fair value cannot be reliably measured. There
is no identifi able active market in which the fair value of these investments can be reliably determined.
An impairment charge was also incurred in relation to the Group’s investment in Brambles Limited. This investment was written down to its
share price on the Australian Stock Exchange at 30 June 2008 of $8.73 per share. This resulted in an impairment of $20.2 million before tax.
Sensitivity analysis – equity price risk
All of the Group’s listed equity investments are listed on the Australian Securities Exchange. For such investments classifi ed as fair value
through profi t and loss, the impact of a 10 percent increase or decrease in the share price at the reporting date would have been an increase
or decrease of $6.3 million before tax (2007: $2.5 million).
19. Investment Property
Consolidated The Company
2008
$M 2007
$M 2008
$M 2007
$M
Fair value of investment property at start of year 1.6 1.3 – –
Change in fair value – 0.3 – –
Disposal of investment property (1.6) – – –
Fair value of investment property at end of year – 1.6 – –
The investment property was included in the sale of the Toll New Zealand rail and ferry operations to the New Zealand Crown effective
30 June 2008.
The fair value of the Group’s investment property at 30 June 2007 was based on a valuation report dated 13 April 2007 by Hadley and Lyall
Limited, a registered independent valuer having an appropriate recognised professional qualifi cation and experience in the location and
category of the property being valued. Fair value was determined having regard to recent market transactions for similar properties in the
same location as the Group’s investment property.
There were no restrictions on the Group’s ability to realise the investment property or the remittance of income and proceeds on disposal.
NOTES TO THE FINANCIAL STATEMENTS C O N T I N U E D
F O R T H E Y E A R E N D E D 3 0 J U N E 2 0 0 8
For
per
sona
l use
onl
y

TOLL – ANNUAL REPORT 2008 81
20. Property, Plant and Equipment
Consolidated
FreeholdLand
$M Buildings
$M
LeaseholdImprovements
$M
Plant and Equipment
$M
Leased Plant and
Equipment $M
Capital Work in
Progress $M
Total $M
Carrying Amount
Balance at 1 July 2007 184.2 285.8 61.1 2,196.4 37.9 53.8 2,819.2
Adjustments to provisional accounting – – – – – – –
Acquisitions through business combinations 70.1 12.9 2.2 143.7 – 21.7 250.6
Other acquisitions 65.6 9.0 11.1 1,151.5 2.2 151.5 1,390.9
Transfer from capital work in progress – 6.1 4.9 41.8 – (52.8) –
Disposals (6.3) (24.7) (2.3) (40.3) (0.2) (5.2) (79.0)
Demerger and disposals of entities and businesses (33.3) (62.5) – (2,547.1) (30.2) (116.5) (2,789.6)
Depreciation – (10.1) (9.0) (276.2) (3.7) – (299.0)
Effect of movements in foreign exchange (0.2) (7.6) (0.4) (79.1) (5.8) (2.8) (95.9)
Balance as at 30 June 2008 280.1 208.9 67.6 590.7 0.2 49.7 1,197.4
Cost 280.1 250.3 175.1 1,173.6 2.8 49.7 1,931.6
Accumulated depreciation – (41.4) (107.5) (582.9) (2.4) – (734.2)
Balance as at 30 June 2008 280.1 208.9 67.6 590.7 0.4 49.7 1,197.4
Carrying Amount
Balance at 1 July 2006 395.4 347.2 469.9 3,376.2 20.4 334.8 4,943.9
Adjustments to provisional accounting – (6.1) (73.4) (36.4) (7.5) (12.5) (135.9)
Acquisitions through business combinations – – 0.7 8.3 1.6 – 10.6
Other acquisitions 30.6 21.1 6.4 460.8 33.3 176.9 729.1
Capitalised borrowing costs – – – – – 5.4 5.4
Transfer from capital work in progress 0.8 3.7 19.9 232.0 – (256.4) –
Transfer from non-current assets held for sale 1.3 12.8 – 18.4 – 0.2 32.7
Disposals (3.8) (15.4) (1.6) (74.2) (0.1) – (95.1)
Demerger and disposals of entities and businesses (240.1) (67.5) (330.9) (1,460.3) (8.4) (197.1) (2,304.3)
Depreciation – (12.5) (28.7) (359.3) (1.1) – (401.6)
Effect of movements in foreign exchange – 2.5 (1.2) 30.9 (0.3) 2.5 34.4
Balance as at 30 June 2007 184.2 285.8 61.1 2,196.4 37.9 53.8 2,819.2
Cost 184.2 324.2 152.6 3,115.9 38.7 53.8 3,869.4
Accumulated depreciation – (38.4) (91.5) (919.5) (0.8) – (1,050.2)
Balance as at 30 June 2007 184.2 285.8 61.1 2,196.4 37.9 53.8 2,819.2
For
per
sona
l use
onl
y

82
20. Property, Plant and Equipment (continued)
The Company
FreeholdLand
$M Buildings
$M
Plant and Equipment
$M
LeaseholdImprovements
$M
Capital Work in
Progress $M
Total $M
Carrying Amount
Balance at 1 July 2007 0.5 7.7 32.3 1.0 12.8 54.3
Acquisitions – – 19.4 – 9.1 28.5
Transfer from capital work in progress – – – 2.3 (2.3) –
Transfer to related parties – – – – (12.7) (12.7)
Disposals – – (25.0) (0.8) – (25.8)
Depreciation – (0.2) (6.8) (0.5) – (7.5)
Balance as at 30 June 2008 0.5 7.5 19.9 2.0 6.9 36.8
Cost 0.5 8.3 46.7 5.5 6.9 67.9
Accumulated depreciation – (0.8) (26.8) (3.5) – (31.1)
Balance as at 30 June 2008 0.5 7.5 19.9 2.0 6.9 36.8
Carrying Amount
Balance at 1 July 2006 0.5 3.0 10.5 2.7 13.5 30.2
Acquisitions – 7.2 23.6 – 18.5 49.3
Transfer from capital work in progress – – 4.0 – (4.0) –
Transfer to related parties – (2.4) – (1.3) (15.2) (18.9)
Disposals – – (0.2) – – (0.2)
Depreciation – (0.1) (5.6) (0.4) – (6.1)
Balance as at 30 June 2007 0.5 7.7 32.3 1.0 12.8 54.3
Cost 0.5 8.3 55.7 4.0 12.8 81.3
Accumulated depreciation – (0.6) (23.4) (3.0) – (27.0)
Balance as at 30 June 2007 0.5 7.7 32.3 1.0 12.8 54.3
Refer note 23 for non current assets pledged as security.
NOTES TO THE FINANCIAL STATEMENTS C O N T I N U E D
F O R T H E Y E A R E N D E D 3 0 J U N E 2 0 0 8
For
per
sona
l use
onl
y

TOLL – ANNUAL REPORT 2008 83
21. Intangible Assets
Consolidated
Goodwill $M
Capitalised Software & Technology
$M
Right of Way
$M
Customer Contracts &
Relationships $M
Other Intangibles
$M Total
$M
Carrying Amount
Balance at 1 July 2007 1,655.5 39.6 51.3 92.3 11.1 1,849.8
Adjustments to provisional accounting – – – 5.5 (5.1) 0.4
Acquisitions through business combinations 562.8 1.4 – 31.4 3.9 599.5
Other acquisitions – 29.7 – – 0.5 30.2
Disposal of entities and businesses (1,104.6) (5.6) (44.5) – (0.4) (1,155.1)
Amortisation – (14.1) (0.8) (25.5) (0.6) (41.0)
Effect of movements in foreign exchange (15.1) (0.1) (6.0) (0.5) – (21.7)
Balance as at 30 June 2008 1,098.6 50.9 – 103.2 9.4 1,262.1
Cost 1,098.6 95.3 – 169.4 10.6 1,373.9
Accumulated amortisation – (44.4) – (66.2) (1.2) (111.8)
Balance as at 30 June 2008 1,098.6 50.9 – 103.2 9.4 1,262.1
Carrying Amount
Balance at 1 July 2006 5,659.1 283.1 48.2 599.6 37.1 6,627.1
Adjustments to provisional accounting 199.4 (33.7) – – – 165.7
Acquisitions through business combinations 26.8 – – – – 26.8
Other acquisitions – 26.6 – – 0.3 26.9
Demerger and disposals of entities and businesses (4,224.9) (191.1) – (402.9) (24.2) (4,843.1)
Amortisation – (33.8) (0.8) (96.3) (0.9) (131.8)
Transfer (to)/from assets classifi ed as held for sale 40.0 – – – – 40.0
Impairment – (10.5) – – – (10.5)
Effect of movements in foreign exchange (44.9) (1.0) 3.9 (8.1) (1.2) (51.3)
Balance as at 30 June 2007 1,655.5 39.6 51.3 92.3 11.1 1,849.8
Cost 1,655.5 83.2 53.7 131.1 12.8 1,936.3
Accumulated amortisation – (43.6) (2.4) (38.8) (1.7) (86.5)
Balance as at 30 June 2007 1,655.5 39.6 51.3 92.3 11.1 1,849.8
For
per
sona
l use
onl
y

84
21. Intangible Assets (continued)
The Company
Capitalised Software & Technology
$M Total
$M
Carrying Amount
Balance at 1 July 2007 0.2 0.2
Other acquisitions 5.2 5.2
Amortisation (0.6) (0.6)
Disposal (0.3) (0.3)
Transfer from other Toll group entity 5.8 5.8
Balance at 30 June 2008 10.3 10.3
Cost 11.0 11.0
Accumulated amortisation (0.7) (0.7)
Balance at 30 June 2008 10.3 10.3
Carrying Amount
Balance at 1 July 2006 0.2 0.2
Acquisitions through business combinations – –
Other acquisitions 0.1 0.1
Revaluation of assets (after gaining control of associate) – –
Amortisation (0.1) (0.1)
Impairment – –
Effects of movement in foreign exchange – –
Balance at 30 June 2007 0.2 0.2
Cost 0.3 0.3
Accumulated amortisation (0.1) (0.1)
Balance at 30 June 2007 0.2 0.2
NOTES TO THE FINANCIAL STATEMENTS C O N T I N U E D
F O R T H E Y E A R E N D E D 3 0 J U N E 2 0 0 8
For
per
sona
l use
onl
y

TOLL – ANNUAL REPORT 2008 85
21. Intangible Assets (continued)
(a) Impairment tests for goodwill
Goodwill is allocated to the Group’s cash generating units (CGU’s) identifi ed according to business segment and country of operation.
A segment level summary of the goodwill allocation is presented below:
2008
$M 2007
$M
Toll Asia 600.1 466.5
Toll Australia 207.9 118.0
Toll Global Forwarding 290.6 –
Virgin Blue – 1,071.0
1,098.6 1,655.5
The recoverable amount of a CGU is determined based on value-in-use calculations. These calculations use cash fl ow projections based
on fi nancial budgets approved by management covering a fi ve year period.
On 30 June 2008, the Group disposed of Virgin Blue and the associated goodwill.
On 15 June 2007, the Group demerged the Patrick and Pacifi c National businesses into Asciano which resulted in the corresponding
goodwill being disposed.
(b) Key assumptions used for impairment testing
The following key assumptions were used for impairment testing:
Growth Rate Discount Rate
2008
% 2007
% 2008
% 2007
%
Toll Asia 10.00 10.00 6.24 6.29
Toll Australia 8.00 7.20 10.53 10.29
Toll Global Forwarding 9.00 – 6.70 –
Virgin Blue – 11.70 – 10.29
These assumptions have been used for each CGU within the business segments. The weighted average growth rates are consistent with
internal budgets. The discount rates are pre-tax and refl ect specifi c risks relating to the relevant segments within Australia.
(c) Impairment charge
During the year, an impairment charge was incurred on the Group’s investment in Virgin Blue. The value of this investment was written down
to its share price on the Australian Stock Exchange at 30 June 2008 of 47 cents per share. This resulted in an impairment of $1,279.5 million.
For
per
sona
l use
onl
y
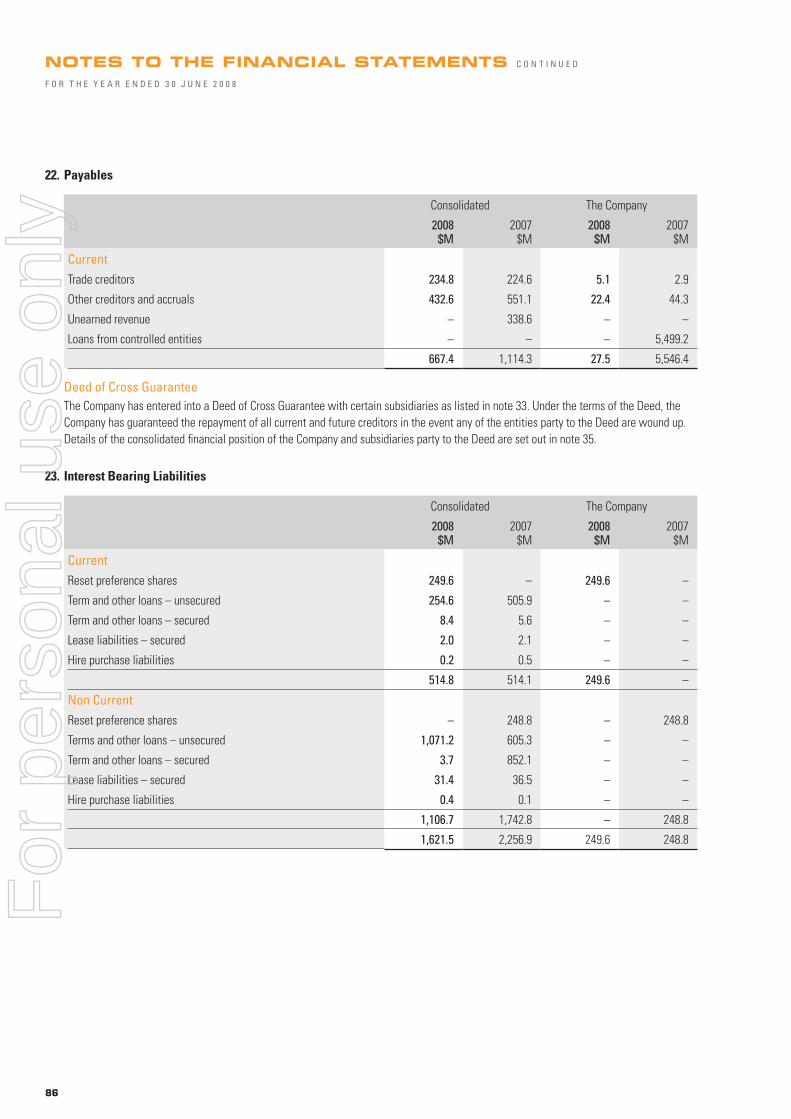
86
22. Payables
Consolidated The Company
2008
$M 2007
$M 2008
$M 2007
$M
Current
Trade creditors 234.8 224.6 5.1 2.9
Other creditors and accruals 432.6 551.1 22.4 44.3
Unearned revenue – 338.6 – –
Loans from controlled entities – – – 5,499.2
667.4 1,114.3 27.5 5,546.4
Deed of Cross Guarantee
The Company has entered into a Deed of Cross Guarantee with certain subsidiaries as listed in note 33. Under the terms of the Deed, the
Company has guaranteed the repayment of all current and future creditors in the event any of the entities party to the Deed are wound up.
Details of the consolidated fi nancial position of the Company and subsidiaries party to the Deed are set out in note 35.
23. Interest Bearing Liabilities
Consolidated The Company
2008
$M 2007
$M 2008
$M 2007
$M
Current
Reset preference shares 249.6 – 249.6 –
Term and other loans – unsecured 254.6 505.9 – –
Term and other loans – secured 8.4 5.6 – –
Lease liabilities – secured 2.0 2.1 – –
Hire purchase liabilities 0.2 0.5 – –
514.8 514.1 249.6 –
Non Current
Reset preference shares – 248.8 – 248.8
Terms and other loans – unsecured 1,071.2 605.3 – –
Term and other loans – secured 3.7 852.1 – –
Lease liabilities – secured 31.4 36.5 – –
Hire purchase liabilities 0.4 0.1 – –
1,106.7 1,742.8 – 248.8
1,621.5 2,256.9 249.6 248.8
NOTES TO THE FINANCIAL STATEMENTS C O N T I N U E D
F O R T H E Y E A R E N D E D 3 0 J U N E 2 0 0 8
For
per
sona
l use
onl
y

TOLL – ANNUAL REPORT 2008 87
23. Interest Bearing Liabilities (continued)
Terms and debt repayment schedule
Terms and conditions of outstanding loans were as follows:
Consolidated
2008 $M
2007 $M
Currency
Weighted average
rate Year of
maturity Face value
Carrying amount
Face value
Carrying amount
Secured bank facility AUD 6.69% 2008 – – 854.8 847.9
Secured bank facility ZAR 16.00% 2009 8.3 8.3 – –
Secured bank facility SGD 3.96% 2012 3.7 3.7 4.2 4.2
Secured bank facility IND 11.13% 2008 – – 5.6 5.6
Unsecured bank facility NZD 8.94% 2009-2010 178.2 178.2 202.5 202.5
Unsecured bank facility SGD 1.83% 2009 104.1 104.1 176.3 176.3
Unsecured bank facility RMB 6.39% 2008 – – 4.7 4.7
Unsecured bank facility HKD 2.77% 2010 165.8 165.8 – –
Unsecured bank facility AUD 7.86% 2009-2011 173.7 173.7 15.0 13.9
Unsecured bank facility TWD 3.64% 2009 1.4 1.4 0.3 0.3
Unsecured bank facility THB 4.27% 2010 12.6 12.6 18.8 18.8
Unsecured bank facility CAD 4.05% 2009 2.0 2.0 – –
Unsecured bank facility CNY 9.36% 2009 1.1 1.1 – –
Unsecured syndicated bank facility SGD 1.84% 2010 687.0 687.0 694.4 694.4
Reset preference shares-see note 24 AUD 6.20% 2008 250.0 249.6 250.0 248.8
Finance lease and HP liabilities Various 8.61% 2008-2016 34.0 34.0 39.2 39.2
Loan from MI Shareholders SGD – – – – 0.3 0.3
Total interest-bearing liabilities 1,621.9 1,621.5 2,266.1 2,256.9
The Company
2008 $M
2007 $M
Currency
Weighted average
rate Year of
maturity Face value
Carrying amount
Face value
Carrying amount
Reset preference shares AUD 6.20% 2008 250.0 249.6 250.0 248.8
250.0 249.6 250.0 248.8
(a) Secured Bank Facilities
Toll Asia and Toll Global Forwarding loans
Included in interest bearing liabilities are current and non current term loans totalling $12 million which have been secured by the assets
of the Toll Asia group and Toll Global Forwarding group. At year end, the carrying amounts of assets pledged as security are $17 million.
Other
All other fi nancing is subject to negative pledge arrangements.
For
per
sona
l use
onl
y
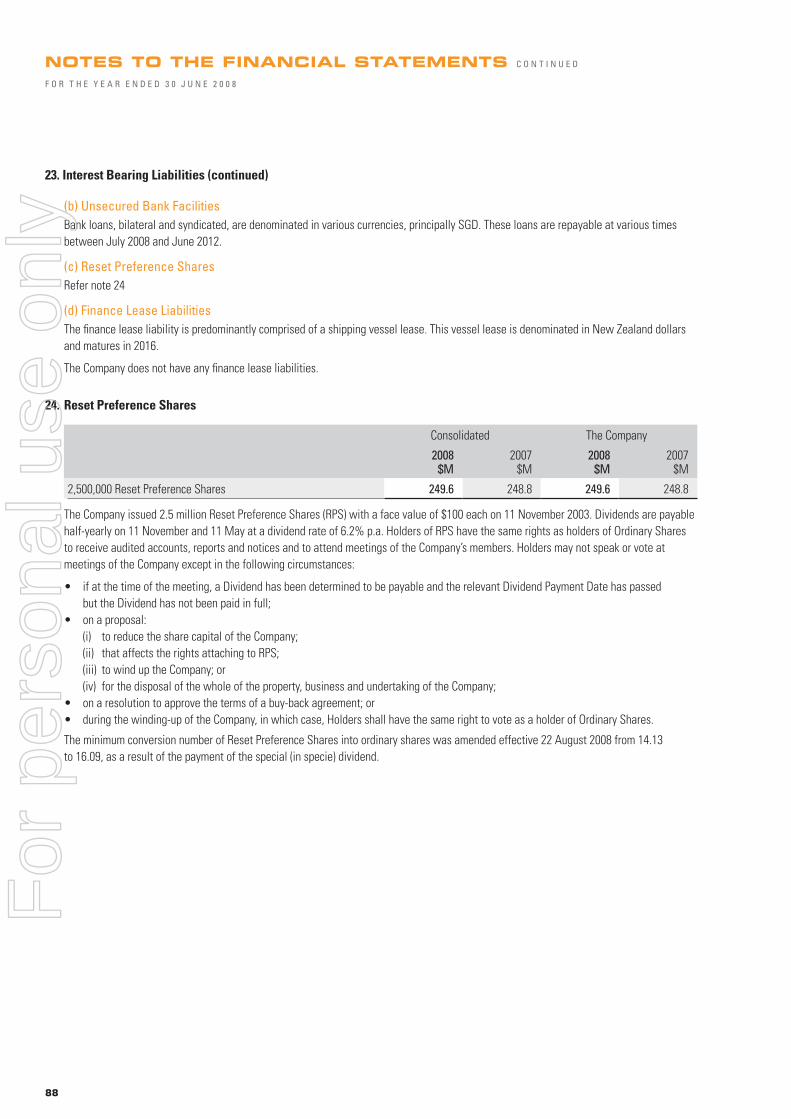
88
23. Interest Bearing Liabilities (continued)
(b) Unsecured Bank Facilities
Bank loans, bilateral and syndicated, are denominated in various currencies, principally SGD. These loans are repayable at various times
between July 2008 and June 2012.
(c) Reset Preference Shares
Refer note 24
(d) Finance Lease Liabilities
The fi nance lease liability is predominantly comprised of a shipping vessel lease. This vessel lease is denominated in New Zealand dollars
and matures in 2016.
The Company does not have any fi nance lease liabilities.
24. Reset Preference Shares
Consolidated The Company
2008
$M 2007
$M 2008
$M 2007
$M
2,500,000 Reset Preference Shares 249.6 248.8 249.6 248.8
The Company issued 2.5 million Reset Preference Shares (RPS) with a face value of $100 each on 11 November 2003. Dividends are payable
half-yearly on 11 November and 11 May at a dividend rate of 6.2% p.a. Holders of RPS have the same rights as holders of Ordinary Shares
to receive audited accounts, reports and notices and to attend meetings of the Company’s members. Holders may not speak or vote at
meetings of the Company except in the following circumstances:
• if at the time of the meeting, a Dividend has been determined to be payable and the relevant Dividend Payment Date has passed
but the Dividend has not been paid in full;
• on a proposal:
(i) to reduce the share capital of the Company;
(ii) that affects the rights attaching to RPS;
(iii) to wind up the Company; or
(iv) for the disposal of the whole of the property, business and undertaking of the Company;
• on a resolution to approve the terms of a buy-back agreement; or
• during the winding-up of the Company, in which case, Holders shall have the same right to vote as a holder of Ordinary Shares.
The minimum conversion number of Reset Preference Shares into ordinary shares was amended effective 22 August 2008 from 14.13
to 16.09, as a result of the payment of the special (in specie) dividend.
NOTES TO THE FINANCIAL STATEMENTS C O N T I N U E D
F O R T H E Y E A R E N D E D 3 0 J U N E 2 0 0 8
For
per
sona
l use
onl
y
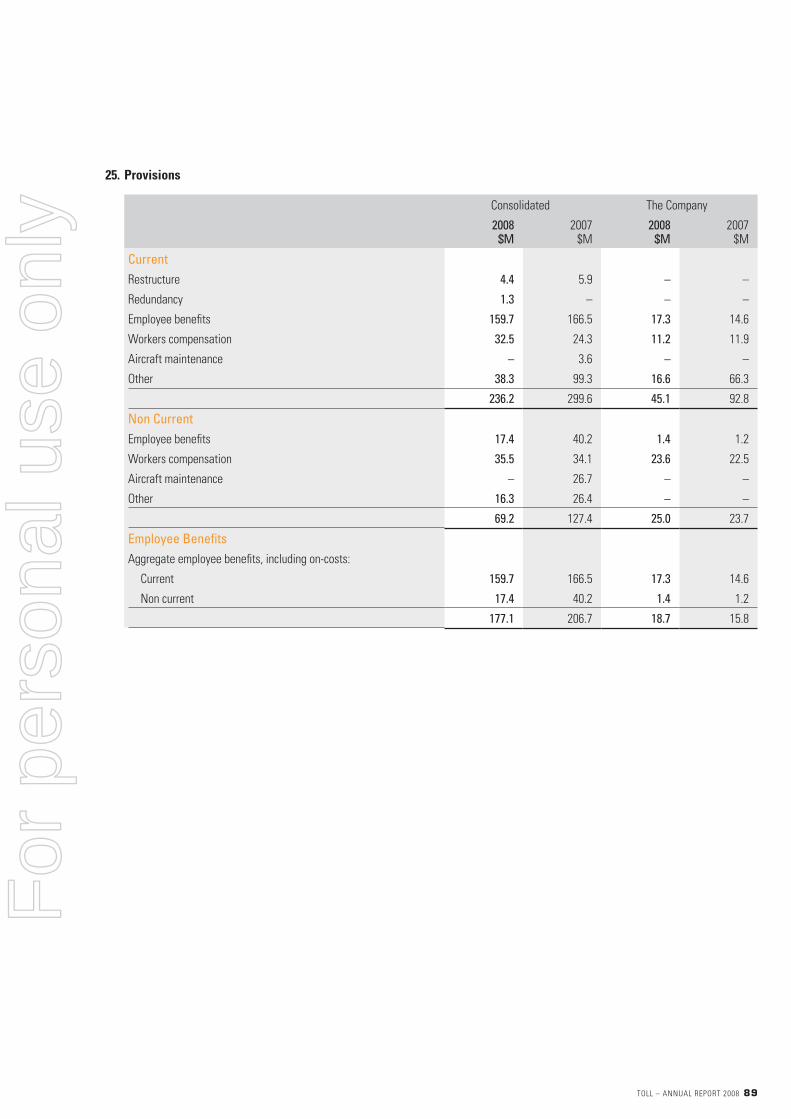
TOLL – ANNUAL REPORT 2008 89
25. Provisions
Consolidated The Company
2008
$M 2007
$M 2008
$M 2007
$M
Current
Restructure 4.4 5.9 – –
Redundancy 1.3 – – –
Employee benefi ts 159.7 166.5 17.3 14.6
Workers compensation 32.5 24.3 11.2 11.9
Aircraft maintenance – 3.6 – –
Other 38.3 99.3 16.6 66.3
236.2 299.6 45.1 92.8
Non Current
Employee benefi ts 17.4 40.2 1.4 1.2
Workers compensation 35.5 34.1 23.6 22.5
Aircraft maintenance – 26.7 – –
Other 16.3 26.4 – –
69.2 127.4 25.0 23.7
Employee Benefi ts
Aggregate employee benefi ts, including on-costs:
Current 159.7 166.5 17.3 14.6
Non current 17.4 40.2 1.4 1.2
177.1 206.7 18.7 15.8
For
per
sona
l use
onl
y

90
25. Provisions (continued)
(a) Reconciliation of provisions
Restructure
$M Redundancy
$M
Worker’s Compensation
$M
Aircraft Maintenance
$M Other
$M Total
$M
Consolidated
Balance at beginning of the year 5.9 – 58.4 30.3 125.7 220.3
Provisions made during the year 4.8 1.3 27.4 11.8 36.9 82.2
Provisions used during the year (6.3) – (18.0) (2.5) (84.7) (111.5)
Provisions reversed during the year – (0.1) – – (12.7) (12.8)
Acquisition of entities and businesses – 0.1 0.2 – 1.4 1.7
Disposal of entities and businesses – – – (39.6) (11.9) (51.5)
Movement from foreign currency fl uctuations – – – – (0.1) (0.1)
Balance at the end of the year 4.4 1.3 68.0 – 54.6 128.3
Current 4.4 1.3 32.5 – 38.3 76.5
Non current – – 35.5 – 16.3 51.8
The Company
Balance at beginning of the year – – 34.4 – 66.3 100.7
Provisions made during the year – – 18.2 – 10.1 28.3
Provisions used during the year – – (17.8) – (59.8) (77.6)
Balance at the end of the year – – 34.8 – 16.6 51.4
Current – – 11.2 – 16.6 27.8
Non current – – 23.6 – – 23.6
(i) Restructure
A provision for restructuring is recognised when the Group has approved a detailed and formal restructuring plan, and the restructuring
either has commenced or has been announced publicly. A provision has been made for the estimated costs of restructuring the Group as
a result of the acquisitions made in prior years. The Group expects to incur the liability over the next 12 months.
(ii) Redundancy
Provision was made for the costs for employee redundancy due to restructuring of the Group.
(iii) Worker’s compensation
The Group self insures for risks associated with worker’s compensation in certain states of Australia. Outstanding claims are recognised
when an incident occurs that may give rise to a claim and are measured at the cost that the Group expects to incur in settling the claims,
discounted using a government bond rate with a maturity date approximating the term of the obligation. Such assessments are based upon
an independent actuarial assessment.
(iv) Aircraft maintenance
Provision is made for the estimated future costs of major cyclical maintenance of airframes, engines, landing gear and auxiliary power units
of operating leased aircraft.
(v) Other
This relates mainly to provision for insurance claims, rolling stock lease return payment provisions and provision for bonus and incentives.
The Group expects to incur the majority of the liability within the next 12 months.
NOTES TO THE FINANCIAL STATEMENTS C O N T I N U E D
F O R T H E Y E A R E N D E D 3 0 J U N E 2 0 0 8
For
per
sona
l use
onl
y

TOLL – ANNUAL REPORT 2008 91
25. Provisions (continued)
(b) Liability for defi ned benefi t superannuation plan obligation
Employees of the Company and entities in the Group are covered by defi ned contribution superannuation plans.
A discontinued subsidiary in the Group made contributions to three defi ned benefi t superannuation funds that provided defi ned benefi t
amounts for its employees upon retirement. This subsidiary was disposed by the Group effective 15 June 2007.
26. Other Financial Liabilities
Consolidated The Company
2008
$M 2007
$M 2008
$M 2007
$M
Current
Derivative fi nancial instruments 13.1 118.1 2.0 2.0
Other 0.4 6.7 – –
13.5 124.8 2.0 2.0
Non Current
Derivative fi nancial instruments 11.7 2.7 – –
Other 2.8 17.2 – –
14.5 19.9 – –
28.0 144.7 2.0 2.0
For
per
sona
l use
onl
y

92
27. Contributed equity
Consolidated The Company
2008
$M 2007
$M 2008
$M 2007
$M
Issued and Paid Up Capital
648,143,027 ordinary shares fully paid (2007 – 642,512,000) 2,554.5 2,492.8 2,554.5 2,492.8
(a) Effective 1 July 1998, the Company Law Review Act abolished the concept of par value shares and the concept of authorised capital.
Accordingly, the Company does not have authorised capital or par value in respect of its issued shares.
(b) The Company has an established Dividend Reinvestment Plan for the purpose of providing shareholders the opportunity to apply
dividends paid or declared by the Company in subscribing for shares rather than receiving those dividends in cash. Shares are issued
under the plan currently at a 2.5% (2007: 2.5%) discount to the weighted average market price over the fi ve business days immediately
after the transfer books close date for the purposes of the dividend payment.
(c) Movements in issued and paid up ordinary share capital of the Company during the year were as follows:
Date Details Number of
Shares
Issue Price
$
Contributed Equity
$M
01/07/07 Opening Balance 642,512,000 2,492.8
Dividend Reinvestment Plan 2,250,942 13.5242 30.4
Dividend Reinvestment Plan 3,260,962 9.0637 29.5
Shares Issued (net of issue costs) 119,123 14.9529 1.8
30/06/08 Closing Balance 648,143,027 2,554.5
Holders of ordinary shares are entitled to receive dividends as declared from time to time and are entitled to one vote per share at
shareholder meetings and are also entitled to proceeds on winding up of the Company in proportion to the number of shares held.
(d) Senior Executive Option Plan and Executive Share Option Scheme
As at 30 June 2008 unissued ordinary shares of the Company under option are:
Grant Date
Expiry Date
Exercise Price ($)
Balance 01/07/07
‘000
Options Granted
‘000
Options Lapsed
‘000
Options Exercised
‘000
Balance 30/06/08
‘000
Vested Balance
‘000
Proceeds Received
($M)
Shares Issued
‘000
Market Value
Aggregate ($M)
Weighted Avg Share
Price on Exercise
$
04/10/06 25/07/11 10.29 370 – (30) – 340 – – – – –
11/01/08 10/01/13 10.55 – 3,831 (145) – 3,686 – – – – –
25/06/08 24/06/13 6.32 – 1,350 – – 1,350 – – – – –
370 5,181 (175) – 5,376 – – – –
The Company has an Executive Share Option Scheme and Senior Executive Option Plan which have been approved by the members at
previous Annual General Meetings.
Each option is convertible into one ordinary share once certain performance criteria are met. Performance criteria are tested over three
periods. For the October 2006 options the measurement dates are 30 June 2009, 30 June 2010 and 30 June 2011. For the January 2008
options, the measurement dates are 30 June 2010, 30 June 2011 and 30 June 2012. For the June 2008 options, the measurement dates
are 31 December 2010, 31 December 2011 and 31 December 2012. Options which do not vest in the initial period are retested at the two
subsequent dates. Options which do not vest in the third and fi nal performance period will lapse. The proportion of options that vest at the
end of a relevant performance period depends on the fully diluted pre-amortisation for continuing operations post restructure, excluding
Virgin Blue EPS compound growth performance. All options will vest if the Group’s cumulative compound EPS growth is greater than 15%.
If EPS growth is 10%, 50% of the options will vest, between 10% and 15%, a pro-rata straight-line allocation is vested. If EPS growth is
below 10%, no options will vest.
Nil ordinary shares were issued during the fi nancial year on the exercise of options granted under the executive share option scheme
(2007: 9,211,000 shares).
NOTES TO THE FINANCIAL STATEMENTS C O N T I N U E D
F O R T H E Y E A R E N D E D 3 0 J U N E 2 0 0 8
For
per
sona
l use
onl
y

TOLL – ANNUAL REPORT 2008 93
28. Capital and Reserves
Reconciliation of movement in capital and reserves
Contributed Equity
$M
Treasury Shares
$M
Retained Earnings
$M
Foreign Currency
Translation Reserve
$M
Asset Revaluation
Reserve $M
Available-for-sale Reserve
$M
Share-Based
Payment Reserve
$M
Hedging Reserve
$M Total
$M
Minority Interests
$M
Total Equity
$M
Consolidated
Balance at 1 July 2007 2,492.8 (8.2) 816.0 (23.0) – – 0.2 (31.6) 3,246.2 375.1 3,621.3
Total recognised income and expense for the year – – (694.7) (98.1) – – – 91.4 (701.4) 47.6 (653.8)
Dividend re-investment plan 59.9 0.2 – – – – – – 60.1 – 60.1
Exercise of share options – – – – – – – – – – –
Shares issued 1.8 – – – – – – – 1.8 – 1.8
Share option expense – – – – – – 1.9 – 1.9 4.9 6.8
Capital return – – – – – – – – – – –
Repayments of treasury shares – 0.8 – – – – – – 0.8 – 0.8
Dividends to shareholders – – (494.5) – – – – – (494.5) – (494.5)
Interest in dividends paid – – – – – – – – – (18.1) (18.1)
Disposal of discontinued operations – – – (7.2) – – – (46.9) (54.1) (315.3) (369.4)
Acquired minority interest – – – – – – – – – (51.9) (51.9)
Balance at 30 June 2008 2,554.5 (7.2) (373.2) (128.3) – – 2.1 12.9 2,060.8 42.3 2,103.1
Balance at 1 July 2006 4,943.6 (9.6) 566.4 (32.0) 181.0 – 12.5 16.3 5,678.2 341.0 6,019.2
Total recognised income and expense for the year – – 1,385.7 9.0 (181.0) – – (47.9) 1,165.8 63.2 1,229.0
Reallocate minority interest to discontinued operations – – 80.2 – – – – – 80.2 – 80.2
Dividend re-investment plan 78.0 0.4 – – – – – – 78.4 – 78.4
Exercise of share options 109.9 – – – – – (18.0) – 91.9 3.0 94.9
Shares issued 60.2 – – – – – – – 60.2 – 60.2
Share option expense – – – – – – 5.7 – 5.7 3.0 8.7
Capital return (2,698.9) – – – – – – – (2,698.9) – (2,698.9)
Repayments of treasury shares – 1.0 – – – – – – 1.0 – 1.0
Dividends to shareholders – – (1,216.3) – – – – – (1,216.3) – (1,216.3)
Interest in dividends paid – – – – – – – – – (12.5) (12.5)
Disposal of discontinued operations – – – – – – – – – (19.6) (19.6)
Acquired minority interest – – – – – – – – – (3.0) (3.0)
Balance at 30 June 2007 2,492.8 (8.2) 816.0 (23.0) – – 0.2 (31.6) 3,246.2 375.1 3,621.3
For
per
sona
l use
onl
y

94
28. Capital and Reserves (continued)
Reconciliation of movement in capital and reserves (continued)
Contributed Equity
$M
Treasury Shares
$M
Retained Earnings
$M
Foreign Currency
Translation Reserve
$M
Available-for-sale Reserve
$M
Share-Based
Payment Reserve
$M
Hedging Reserve
$M Total
$M
Minority Interests
$M
Total Equity
$M
The Company
Balance at 1 July 2007 2,492.8 (8.2) 72.6 – 68.1 0.2 – 2,625.5 – 2,625.5
Total recognised income and expense for the year – – 485.0 – – – – 485.0 – 485.0
Dividend re-investment plan 59.9 0.2 – – – – – 60.1 – 60.1
Reversal of available-for-sale reserve – – – – (68.1) – – (68.1) – (68.1)
Share option expense – – – – – 1.9 – 1.9 – 1.9
Shares issued 1.8 – – – – – – 1.8 – 1.8
Repayments of treasury shares – 0.8 – – – – – 0.8 – 0.8
Dividends to shareholders – – (494.5) – – – – (494.5) – (494.5)
Balance at 30 June 2008 2,554.5 (7.2) 63.1 – – 2.1 – 2,612.6 – 2,612.6
Balance at 1 July 2006 4,943.6 (9.6) 26.6 – 68.1 12.5 – 5,041.2 – 5,041.2
Total recognised income and expense for the year – – 1,262.3 – – – – 1,262.3 – 1,262.3
Dividend re-investment plan 78.0 0.4 – – – – – 78.4 – 78.4
Exercise of share options 109.9 – – – – (18.0) – 91.9 – 91.9
Share option expense – – – – – 5.7 – 5.7 – 5.7
Shares issued 60.2 – – – – – – 60.2 – 60.2
Repayments of treasury shares – 1.0 – – – – – 1.0 – 1.0
Dividends to shareholders – – (1,216.3) – – – – (1,216.3) – (1,216.3)
Capital return (2,698.9) – – – – – – (2,698.9) – (2,698.9)
Balance at 30 June 2007 2,492.8 (8.2) 72.6 – 68.1 0.2 – 2,625.5 – 2,625.5
NOTES TO THE FINANCIAL STATEMENTS C O N T I N U E D
F O R T H E Y E A R E N D E D 3 0 J U N E 2 0 0 8
For
per
sona
l use
onl
y
TOLL – ANNUAL REPORT 2008 95
29. Financial Instruments
Financial Risk Management
Overview
The Company and the Group have exposure to the following risks from their use of fi nancial instruments:
• credit risk
• liquidity risk
• market risk.
This note presents information about the Company’s and the Group’s exposure to each of the above risks, their objectives, policies and
processes for measuring and managing risk, and the management of capital. Further quantitative disclosures are included throughout this
fi nancial report.
The Board of Directors has overall responsibility for the establishment and oversight of the risk management framework. The Board has
established the Risk Management Committee, which is responsible for developing and monitoring risk management policies. The committee
reports regularly to the Board of Directors on its activities.
The Board, through the Audit and Financial Risk Committee, oversees the establishment, implementation and ongoing review of the Group’s
risk management and internal compliance and control system. The internal control system covers fi nancial risks.
The Audit and Financial Risk Committee considers any matters relating to the fi nancial affairs of the Group that it determines to be
necessary. In addition, the Committee examines any other matters referred to it by the Board.
The duties of the Audit and Financial Risk Committee include, amongst others, duties relating specifi cally to fi nancial risk management
including monitoring corporate risk assessment and internal controls; monitoring risks relating to credit, liquidity, currency, interest rate,
and other market exposure.
Group policy is not to enter, issue or hold derivative fi nancial instruments for speculative trading purposes.
Credit risk
Credit risk represents the risk of fi nancial loss that would be recognised if counterparties failed to perform as contracted, and arises
principally on the Group’s receivables from customers, investment securities, cash held with fi nancial institutions, and derivatives held
with various counterparties. For the Company it arises principally from receivables due from subsidiaries.
At reporting date there were no signifi cant concentrations of credit risk.
Trade and other receivables
The Group and the Company minimise concentrations of credit risk by undertaking transactions with a large number of customers and
counterparties. The Group and the Company are not materially exposed to any individual customer, which is consistent with their diverse
customer base.
The Company’s and Group’s exposure to credit risk is infl uenced mainly by the individual characteristics of each customer. The exposure to
credit risk is further diversifi ed through the demographics of the Group’s customer base, including the default risk of the industry and country
in which customers operate.
The Company and the Group have established an allowance for impairment that represents their estimate of incurred losses in respect
of trade and other receivables and investments.
Investments
The Group limits its exposure to credit risk by only investing in liquid securities and only with counterparties that have a credit rating of at
least A1 from Standard & Poor’s, however, the current Group Treasury policy allows investments with counterparties rated A2 (short term)
or A- (long term). Given these high credit ratings, management does not expect any counterparty to fail to meet its obligations.
Guarantees
Group policy is to provide fi nancial guarantees to wholly-owned subsidiaries, where required. In exceptional circumstances the Group may
provide fi nancial guarantees to other Group entities.
Cash and Cash Deposits
The Group deposits all its cash and cash deposits, with fi nancial institutions that have a credit rating of at least A1 from Standard & Poor’s,
however, the current Group Treasury policy allows investments with counterparties rated A2 (short term) or A- (long term). Management has
established policies which limit the exposure of the Group to any individual counterparty.
For
per
sona
l use
onl
y

96
29. Financial Instruments (continued)
Derivative Transactions
The Group undertakes derivative transactions in fuel, foreign exchange and interest rates with fi nancial institutions that have a credit rating
of at least A1 from Standard & Poor’s however, the current Group Treasury policy allows investments with counterparties rated A2 (short
term) or A- (long term). Management has established policies which limit the exposure of the Group to any individual counterparty.
Liquidity risk
Liquidity risk is the risk that the Group will not be able to meet its fi nancial obligations as they fall due. Prudent liquidity risk management
implies maintaining suffi cient cash and marketable securities, the availability of funding as required and the ability to close-out market
positions if necessary. Due to the dynamic nature of the underlying businesses, Group Treasury aims at maintaining fl exibility in funding by
keeping adequate liquidity available.
Market risk
Market risk is the risk that changes in market prices, such as foreign exchange rates, interest rates and equity prices will affect the Group’s
income or the value of its holdings of fi nancial instruments. The objective of market risk management is to manage and control market risk
exposures within acceptable parameters, while optimising the return.
The Group enters into derivatives, and also incurs fi nancial liabilities, in order to manage market risks. All such transactions are carried out
within the guidelines set out in the Treasury policy which has been approved by the Audit and Financial Risk Committee. Generally the Group
seeks to apply hedge accounting in order to manage volatility in profi t or loss.
At 30 June 2008, the Toll Group held various types of derivative fi nancial instruments that were designated as cash fl ow hedges of future
transactions. These were:
• Hedging of certain foreign currency revenue receipts and operational payments and future debt repayments in foreign currency via
exchange derivative contracts (forwards, swaps or options); and
• Hedging of future interest payments by interest rate derivative contracts (forwards, swaps or options).
Any gains/losses on contracts entered to hedge anticipated specifi c sales and purchase of goods and services, together with the cost of
contracts are recognised in the fi nancial statements at the time the underlying transaction occurs.
At 30 June 2008, the Toll Group held various types of derivative fi nancial instruments that were designated as cash fl ow hedges of future
transactions. These were:
1 year
$M 1 to 2 years
$M 2 to 5 years
$M > 5 years
$M Total
$M
Consolidated – 2008
Contracts to hedge future currency payments 327.0 (11.3) (10.4) – 305.3
Contracts to hedge future fuel payments – – – – –
Contracts to hedge future interest payments (61.9) 460.1 369.1 62.9 830.2
265.1 448.8 358.7 62.9 1,135.5
Consolidated – 2007
Contracts to hedge future currency payments 1,116.4 293.4 20.3 0.3 1,430.4
Contracts to hedge future fuel payments 139.3 – – – 139.3
Contracts to hedge future interest payments 502.7 (9.0) 498.9 335.2 1,327.8
1,758.4 284.4 519.2 335.5 2,897.5
NOTES TO THE FINANCIAL STATEMENTS C O N T I N U E D
F O R T H E Y E A R E N D E D 3 0 J U N E 2 0 0 8
For
per
sona
l use
onl
y

TOLL – ANNUAL REPORT 2008 97
29. Financial Instruments (continued)
Foreign Currency risk
The Group is exposed to foreign currency risk on sales, purchases and borrowings that are denominated in a currency other than the entity’s
respective functional currency of Australian dollars. The currencies giving rise to this risk are primarily Singapore dollar, Hong Kong dollar,
United States dollar and New Zealand dollar.
The Group uses forward exchange contracts to hedge its currency risk. When necessary, forward exchange contracts are rolled over
at maturity.
The Group classifi es its forward exchange contracts hedging forecast transactions as cash fl ow hedges. The cash fl ows are expected
to occur at various dates between 12 months and 48 months from the reporting date. For the year ended 30 June 2008, other fi nancial
assets and liabilities of the Group include derivative fi nancial instruments used to hedge foreign currency with a fair value of $7.3 million
(2007: $108.7 million).
Interest on borrowings is denominated in currencies that match the cash fl ows generated by the underlying operations of the Group,
primarily Australian dollar, Singapore dollar, New Zealand dollar and Hong Kong dollar. This provides an economic hedge and no derivatives
are entered into.
The Group’s New Zealand dollar denominated commercial borrowings are designated as a hedge of the Group’s investment in its
New Zealand subsidiaries. The carrying amount of the commercial bills at 30 June 2008 was $178.0 million (2007: $202.5 million).
The Group’s Singapore dollar denominated commercial borrowings are designated as a hedge of the Group’s investment in its
Asian subsidiaries. The carrying amount of the commercial bills at 30 June 2008 was $495.0 million (2007: $620.0 million).
The Group’s Hong Kong dollar denominated commercial borrowings are designated as a hedge of the Group’s investment in its
Asian subsidiaries. The carrying amount of the commercial bills at 30 June 2008 was $165.8 million (2007: $nil million).
Interest rate risk
The Group is exposed to interest rate risk related to its commercial borrowings.
The Group enters into interest rate derivatives to manage cash fl ow and fair value interest rate risks associated with movements in interest
rates on borrowings.
All of the Group’s term and other loans attract fl oating interest rates. The Group adopts a policy of ensuring that between
50 and 100 percent of its exposure to changes in interest rates on borrowings is on a fi xed rate basis. The Group uses fl oating-to-fi xed
interest rate swaps to achieve an appropriate mix of fi xed and fl oating rate exposure. The Company has fl oating interest rate exposure
via fl oating-to-fi xed interest rate swaps associated with reset preference shares (see below)
In terms of principal outstanding at 30 June 2008, fl oating-to-fi xed interest rate swaps currently in place cover approximately 83% (2007: 80%)
of the Group’s term and other loans. The fi xed interest rates range between 2.00% and 6.36% (2007: 3.00% and 6.36%) and the variable
rates between 1.08% and 8.00% (2007: 2.61% and 6.56%). The contracts require settlement of net interest receivable or payable every
90 or 182 days.
The Company and the Group have issued reset preference shares which pay a fi xed interest rate of 6.20%. Fixed-to-fl oating interest rates
swaps are used by both the Company and the Group to manage this exposure. The swaps have a notional principal amount of $250 million
and mature in November 2008. The contracts require settlement of net interest payable or receivable every 6 months.
Other market price risk
Commodity Price Risk
Price risk arises on the Group’s exposure to jet fuel prices and on the Group’s exposure to diesel prices. Wherever possible, Toll seeks
to have fuel surcharge mechanisms in place within customer contracts to mitigate the effects of rising diesel prices on the Group.
Toll Group uses options and swaps on aviation fuel and crude oil to hedge the exposure to movements in the price of aviation fuel. Hedging
is conducted in accordance with Toll Group Policy. Up to 80 per cent of estimated fuel costs out to 6 months may be hedged, up to 60 per
cent in the subsequent 6 months, up to 50 per cent between 1-2 years and up to 30 per cent in 2-3 years with any hedging outside these
parameters requiring the approval by the Board.
For the year ended 30 June 2008, other fi nancial assets and liabilities of the Group includes derivative fi nancial instruments used to hedge
aviation fuel with a fair value of $nil million (2007: $11.7 million).
The Group does not enter into commodity contracts other than to meet the Group’s expected usage and sale requirements.
For
per
sona
l use
onl
y
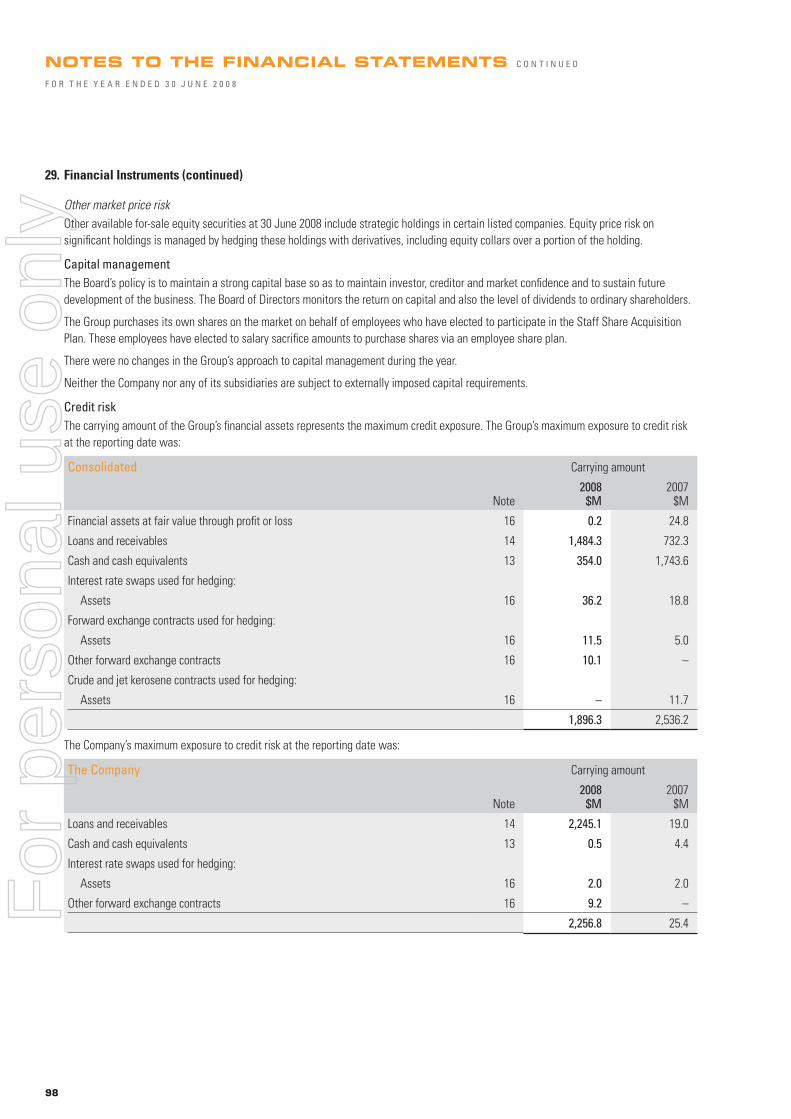
98
29. Financial Instruments (continued)
Other market price risk
Other available for-sale equity securities at 30 June 2008 include strategic holdings in certain listed companies. Equity price risk on
signifi cant holdings is managed by hedging these holdings with derivatives, including equity collars over a portion of the holding.
Capital management
The Board’s policy is to maintain a strong capital base so as to maintain investor, creditor and market confi dence and to sustain future
development of the business. The Board of Directors monitors the return on capital and also the level of dividends to ordinary shareholders.
The Group purchases its own shares on the market on behalf of employees who have elected to participate in the Staff Share Acquisition
Plan. These employees have elected to salary sacrifi ce amounts to purchase shares via an employee share plan.
There were no changes in the Group’s approach to capital management during the year.
Neither the Company nor any of its subsidiaries are subject to externally imposed capital requirements.
Credit risk
The carrying amount of the Group’s fi nancial assets represents the maximum credit exposure. The Group’s maximum exposure to credit risk
at the reporting date was:
Consolidated Carrying amount
Note 2008
$M 2007
$M
Financial assets at fair value through profi t or loss 16 0.2 24.8
Loans and receivables 14 1,484.3 732.3
Cash and cash equivalents 13 354.0 1,743.6
Interest rate swaps used for hedging:
Assets 16 36.2 18.8
Forward exchange contracts used for hedging:
Assets 16 11.5 5.0
Other forward exchange contracts 16 10.1 –
Crude and jet kerosene contracts used for hedging:
Assets 16 – 11.7
1,896.3 2,536.2
The Company’s maximum exposure to credit risk at the reporting date was:
The Company Carrying amount
Note 2008
$M 2007
$M
Loans and receivables 14 2,245.1 19.0
Cash and cash equivalents 13 0.5 4.4
Interest rate swaps used for hedging:
Assets 16 2.0 2.0
Other forward exchange contracts 16 9.2 –
2,256.8 25.4
NOTES TO THE FINANCIAL STATEMENTS C O N T I N U E D
F O R T H E Y E A R E N D E D 3 0 J U N E 2 0 0 8
For
per
sona
l use
onl
y

TOLL – ANNUAL REPORT 2008 99
29. Financial Instruments (continued)
The Group’s maximum exposure to credit risk for trade receivables at the reporting date by geographic region was:
Consolidated Carrying amount
2008 $M
2007 $M
Australia 573.2 492.6
Asia 146.1 115.7
New Zealand 683.8 113.3
Other regions 81.2 10.7
1,484.3 732.3
The Company’s maximum exposure to credit risk for trade receivables at the reporting date by geographic region was:
The Company Carrying amount
2008 $M
2007 $M
Australia 5.3 2.1
Asia – 0.2
New Zealand – 0.7
Other regions – –
5.3 3.0
The Group has no signifi cant concentration of credit risk with any one customer due to its diverse customer base.
Impairment losses
The aging of the Group’s trade receivables at the reporting date was:
Consolidated
Gross 2008
$M
Impairment 2008
$M
Gross2007
$M
Impairment 2007
$M
Not past due 446.0 (3.3) 332.1 (2.5)
Past due 0-30 days 207.8 (2.5) 168.5 (3.5)
Past due 31-120 days 58.0 (8.6) 51.0 (5.1)
Past due 121 days to one year 23.4 (8.8) 26.3 (11.5)
735.2 (23.2) 577.9 (22.6)
Of the Company’s receivables balance $2.8million are past due and fully provided for (2007: $0.1m).
The movement in the allowance for impairment in respect of trade receivables during the year was as follows:
Consolidated
2008
$M 2007
$M
Balance at 1 July 22.6 25.4
Impairment loss recognised 20.2 9.7
Impairment loss reversed (17.3) (2.5)
Impairment loss utilised (2.3) (10.0)
Balance at 30 June 23.2 22.6
The impairment loss at 30 June 2008 relates to collective impairment raised on past due receivables in accordance with Toll Group policy, which refl ect historical default rates on similar receivables balances. There were no individually signifi cant impaired receivables from particular customers.
There is no collateral held on the Group’s receivables balances held with customers.
During the year ended 30 June 2008, there were no renegotiations of trade receivables of the Group (2007: nil).
For
per
sona
l use
onl
y
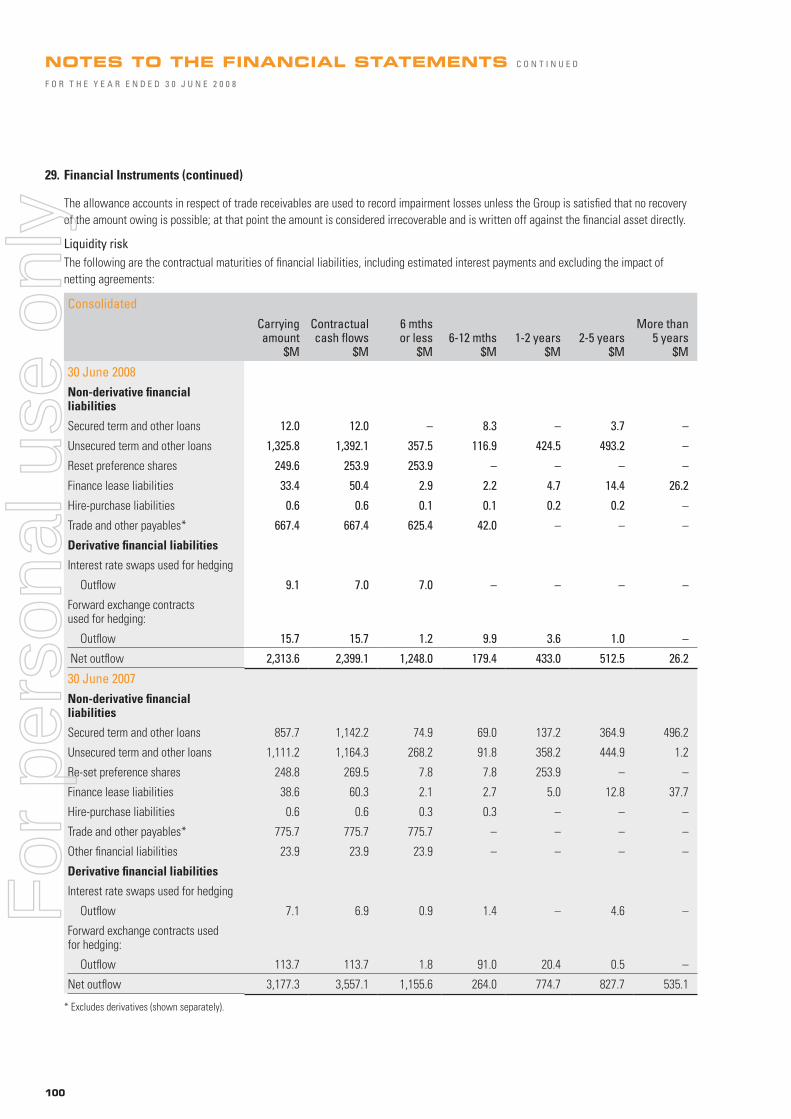
100
29. Financial Instruments (continued)
The allowance accounts in respect of trade receivables are used to record impairment losses unless the Group is satisfi ed that no recovery
of the amount owing is possible; at that point the amount is considered irrecoverable and is written off against the fi nancial asset directly.
Liquidity risk
The following are the contractual maturities of fi nancial liabilities, including estimated interest payments and excluding the impact of
netting agreements:
Consolidated
Carrying amount
$M
Contractual cash fl ows
$M
6 mths or less
$M 6-12 mths
$M 1-2 years
$M 2-5 years
$M
More than 5 years
$M
30 June 2008
Non-derivative fi nancial liabilities
Secured term and other loans 12.0 12.0 – 8.3 – 3.7 –
Unsecured term and other loans 1,325.8 1,392.1 357.5 116.9 424.5 493.2 –
Reset preference shares 249.6 253.9 253.9 – – – –
Finance lease liabilities 33.4 50.4 2.9 2.2 4.7 14.4 26.2
Hire-purchase liabilities 0.6 0.6 0.1 0.1 0.2 0.2 –
Trade and other payables* 667.4 667.4 625.4 42.0 – – –
Derivative fi nancial liabilities
Interest rate swaps used for hedging
Outfl ow 9.1 7.0 7.0 – – – –
Forward exchange contracts used for hedging:
Outfl ow 15.7 15.7 1.2 9.9 3.6 1.0 –
Net outfl ow 2,313.6 2,399.1 1,248.0 179.4 433.0 512.5 26.2
30 June 2007
Non-derivative fi nancial liabilities
Secured term and other loans 857.7 1,142.2 74.9 69.0 137.2 364.9 496.2
Unsecured term and other loans 1,111.2 1,164.3 268.2 91.8 358.2 444.9 1.2
Re-set preference shares 248.8 269.5 7.8 7.8 253.9 – –
Finance lease liabilities 38.6 60.3 2.1 2.7 5.0 12.8 37.7
Hire-purchase liabilities 0.6 0.6 0.3 0.3 – – –
Trade and other payables* 775.7 775.7 775.7 – – – –
Other fi nancial liabilities 23.9 23.9 23.9 – – – –
Derivative fi nancial liabilities
Interest rate swaps used for hedging
Outfl ow 7.1 6.9 0.9 1.4 – 4.6 –
Forward exchange contracts used for hedging:
Outfl ow 113.7 113.7 1.8 91.0 20.4 0.5 –
Net outfl ow 3,177.3 3,557.1 1,155.6 264.0 774.7 827.7 535.1
* Excludes derivatives (shown separately).
NOTES TO THE FINANCIAL STATEMENTS C O N T I N U E D
F O R T H E Y E A R E N D E D 3 0 J U N E 2 0 0 8
For
per
sona
l use
onl
y

TOLL – ANNUAL REPORT 2008 101
29. Financial Instruments (continued)
The Company
Carrying amount
$M
Contractual cash fl ows
$M
6 mths or less $M
6-12 mths $M
1-2 years $M
2-5 years $M
More than 5 years
$M
30 June 2008
Non-derivative fi nancial liabilities
Reset preference shares 249.6 253.9 253.9 – – – –
Trade and other payables 27.5 27.5 27.5 – – – –
Derivative fi nancial liabilities
Interest rate swaps used for hedging:
Outfl ow 2.0 2.0 2.0 – – – –
Net outfl ow 279.1 283.4 283.4 – – – –
30 June 2007
Non-derivative fi nancial liabilities
Reset preference shares 248.8 269.5 7.8 7.8 253.9 – –
Trade and other payables 5,546.4 5,546.4 47.2 5,499.2 – – –
Derivative fi nancial liabilities
Interest rate swaps used for hedging:
Outfl ow 2.0 1.7 0.8 0.9 – – –
Net outfl ow 5,797.2 5,817.6 55.8 5,507.9 253.9 – –
For
per
sona
l use
onl
y

102
29. Financial Instruments (continued)
Currency risk
Exposure to currency risk
The Group’s exposure to foreign currency risk at balance date was as follows, based on notional amounts:
USD
$M NZD
$M SGD
$M OTHER
$M USD $M
NZD $M
SGD $M
OTHER $M
30 June 2008 30 June 2007
Cash at bank 19.6 – 1.9 31.2 180.9 19.9 – 25.8
Trade receivables 26.8 3.5 3.1 115.0 5.1 3.1 – 56.1
Financial assets at fair value through profi t or loss 0.2 – – – 24.8 – – –
Term and other loans – (178.2) (496.0) (192.7) – (202.5) (618.9) (31.7)
Trade payables (12.0) (0.3) (0.6) (82.3) (13.2) (13.1) – (61.6)
Gross balance sheet exposure 34.6 (175.0) (491.6) (128.8) 197.6 (192.6) (618.9) (11.4)
Forward exchange contracts – – – – (105.0) – – –
– – – – (105.0) – – –
Net exposure 34.6 (175.0) (491.6) (128.8) 92.6 (192.6) (618.9) (11.4)
The Company has no exposure to foreign currency risk (2007: nil)
Sensitivity analysis
A 10 percent strengthening/weakening of the Australian dollar against the following currencies at 30 June would have increased
(decreased) equity and profi t or loss by the amounts shown below. This analysis assumes that all other variables, in particular interest rates,
remain constant. The analysis is performed on the same basis for 2007.
Effect 10% Strengthening of AUD 10% Weakening of AUD
Equity$M
Profi t or loss $M
Equity $M
Profi t or loss $M
30 June 2008
USD – (3.3) – 3.3
NZD 16.1 (0.3) (16.1) 0.3
SGD 45.1 (0.7) (45.1) 0.7
OTHER 18.0 (6.4) (18.0) 6.4
30 June 2007
USD 104.1 (17.8) (126.4) 17.8
NZD 18.4 (0.9) (18.4) 0.9
SGD 56.3 – (56.3) –
OTHER 3.0 (2.0) (3.0) 2.0
NOTES TO THE FINANCIAL STATEMENTS C O N T I N U E D
F O R T H E Y E A R E N D E D 3 0 J U N E 2 0 0 8
For
per
sona
l use
onl
y
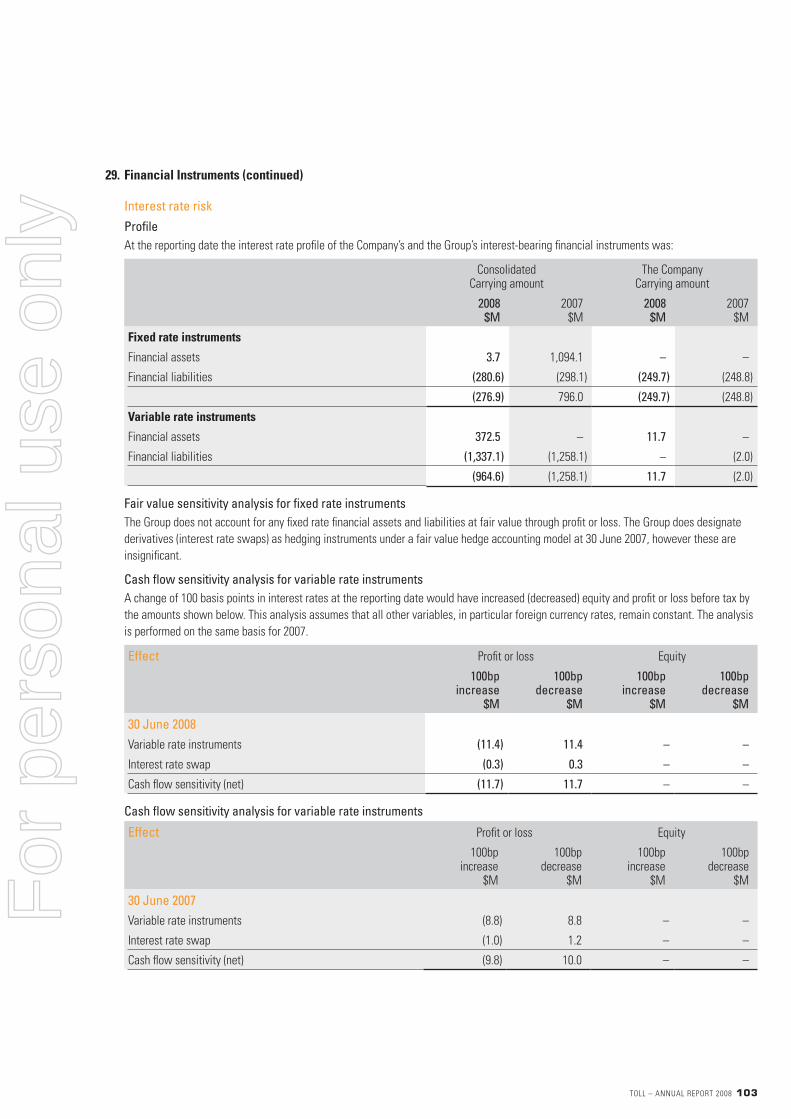
TOLL – ANNUAL REPORT 2008 103
29. Financial Instruments (continued)
Interest rate risk
Profi le
At the reporting date the interest rate profi le of the Company’s and the Group’s interest-bearing fi nancial instruments was:
Consolidated
Carrying amount The Company
Carrying amount
2008
$M 2007
$M 2008
$M 2007
$M
Fixed rate instruments
Financial assets 3.7 1,094.1 – –
Financial liabilities (280.6) (298.1) (249.7) (248.8)
(276.9) 796.0 (249.7) (248.8)
Variable rate instruments
Financial assets 372.5 – 11.7 –
Financial liabilities (1,337.1) (1,258.1) – (2.0)
(964.6) (1,258.1) 11.7 (2.0)
Fair value sensitivity analysis for fi xed rate instruments
The Group does not account for any fi xed rate fi nancial assets and liabilities at fair value through profi t or loss. The Group does designate
derivatives (interest rate swaps) as hedging instruments under a fair value hedge accounting model at 30 June 2007, however these are
insignifi cant.
Cash fl ow sensitivity analysis for variable rate instruments
A change of 100 basis points in interest rates at the reporting date would have increased (decreased) equity and profi t or loss before tax by
the amounts shown below. This analysis assumes that all other variables, in particular foreign currency rates, remain constant. The analysis
is performed on the same basis for 2007.
Effect Profi t or loss Equity
100bp increase
$M
100bp decrease
$M
100bp increase
$M
100bp decrease
$M
30 June 2008
Variable rate instruments (11.4) 11.4 – –
Interest rate swap (0.3) 0.3 – –
Cash fl ow sensitivity (net) (11.7) 11.7 – –
Cash fl ow sensitivity analysis for variable rate instruments
Effect Profi t or loss Equity
100bp increase
$M
100bp decrease
$M
100bp increase
$M
100bp decrease
$M
30 June 2007
Variable rate instruments (8.8) 8.8 – –
Interest rate swap (1.0) 1.2 – –
Cash fl ow sensitivity (net) (9.8) 10.0 – –
For
per
sona
l use
onl
y

104
29. Financial Instruments (Continued)
Fair values
The fair values of fi nancial assets and liabilities, together with the carrying amounts shown in the balance sheet, are as follows:
Consolidated 30 June 2008 30 June 2007
Carrying amount Fair Value Carrying amount Fair Value
$M $M $M $M
Investments 69.6 69.6 28.4 28.4
Financial assets at fair value through profi t or loss 0.2 0.2 24.8 24.8
Loans and receivables 1,484.3 1,484.3 732.3 732.3
Cash and cash equivalents 354.0 354.0 1,743.6 1,743.6
Interest rate swaps used for hedging:
Assets 36.2 36.2 18.8 18.8
Liabilities (13.1) (13.1) (7.1) (7.1)
Forward exchange contracts used for hedging:
Assets 11.5 11.5 5.0 5.0
Liabilities (11.7) (11.7) (113.7) (113.7)
Crude and jet kerosene contracts used for hedging – – 11.7 11.7
Other forward exchange contracts 10.1 10.1 – –
Secured term and other loans (12.1) (12.0) (857.7) (857.7)
Unsecured term and other loans (1,325.8) (1,325.8) (1,111.2) (1,111.2)
Reset preference shares (249.6) (249.6) (248.8) (248.8)
Finance lease liabilities (33.4) (33.4) (38.6) (38.6)
Hire purchase liabilities (0.6) (0.6) (0.6) (0.6)
Other fi nancial liabilities (3.3) (3.3) (23.9) (23.9)
Trade and other payables* (667.4) (667.4) (775.7) (775.7)
(351.1) (351.0) (612.7) (612.7)
* Excludes derivatives (shown separately).
NOTES TO THE FINANCIAL STATEMENTS C O N T I N U E D
F O R T H E Y E A R E N D E D 3 0 J U N E 2 0 0 8
For
per
sona
l use
onl
y

TOLL – ANNUAL REPORT 2008 105
29. Financial Instruments (continued)
The Company 30 June 2008 30 June 2007
Carrying amount Fair Value Carrying amount Fair Value
$M $M $M $M
Loans and receivables 2,245.1 2,245.1 19.0 19.0
Cash and cash equivalents 0.5 0.5 4.4 4.4
Interest rate swaps used for hedging:
Assets 2.0 2.0 2.0 2.0
Liabilities (2.0) (2.0) (2.0) (2.0)
Other Forward exchange contracts:
Assets 9.2 9.2 – –
Reset preference shares (249.6) (249.6) (248.8) (248.8)
Trade and other payables (27.5) (27.5) (5,546.4) (5,546.4)
1,977.7 1,977.7 (5,771.8) (5,771.8)
The basis for determining fair values is disclosed in note 3.
Interest rates used for determining fair value
The interest rates used to discount estimated cash fl ows, where applicable, are based on the 90 day swap curve at the reporting date, and
were as follows:
2008
$M 2007
$M
Derivatives 1.00%-7.96% 2.41%-8.40%
Loans and borrowings 1.00%-7.96% 2.41%-8.40%
Leases 1.00%-7.96% 2.41%-8.40%
Fuel price risk
Price risk arose on the Group’s exposure to jet fuel prices through its subsidiary, Virgin Blue at 30 June 2007. Virgin Blue was deconsolidated
on 30 June 2008. Wherever possible, Toll seeks to have fuel surcharge mechanisms in place within customer contracts to mitigate the
effects of rising diesel prices on the Group.
During the previous and the current year, the Group’s fuel price management strategy aimed to provide the subsidiary with protection
against sudden and signifi cant increases in oil prices while ensuring that the subsidiary was not competitively disadvantaged in a serious
way in the event of a substantial fall in the price of fuel.
Risk management
Group Treasury was responsible for managing this exposure by using swap contracts and option contracts. These contracts were designated
at Group level as hedges of price risk on specifi c volumes of future jet fuel consumption. The Group’s risk management policy is to hedge,
subject to limits determined by the Board, anticipated jet fuel consumption for subsequent fi nancial periods. Realised gains or losses on
these contracts arise due to differences between actual fuel prices on settlement and the forward rates of the derivative contracts.
During the year, the net gain arising from fuel hedging activities for the Group was $93.2 million (2007: loss of $11.5 million) as a result of
actual fuel prices moving higher than the average hedged price. Of this net amount, $74.1 million (gain) represents the effective portion of
the hedges and $19.1 million (gain) represents the ineffective portion of the hedges. Both amounts are part of the discontinued operations
amount in the Group’s Income Statement.
The Company did not enter into any fuel price derivatives in the current or prior period.
For
per
sona
l use
onl
y

106
29. Financial Instruments (continued)
Fuel price risk
Sensitivity analysis
The following table summarises the sensitivity of the Group’s fi nancial assets and liabilities to a reasonably possible change in fuel prices at
30 June 2007. A USD 30 per bbl increase/decrease in the price of fuel would have increased/(decreased) equity and profi t and loss before
tax by the amounts shown below. This analysis assumes that all other variables remain constant.
There was no sensitivity to fuel price risk of the Group’s fi nancial assets and liabilities at 30 June 2008.
USD 30/bbl increase USD 30/bbl decrease
Carrying Amount
$M Profi t
$M Equity
$M Profi t
$M Equity
$M
2007
Financial Assets
– Derivative Asset 11.7 3.2 51.0 (0.6) (22.0)
11.7 3.2 51.0 (0.6) (22.0)
The Company was not exposed to fuel price risk at 30 June 2007 and 30 June 2008.
30. Contingencies
Details of contingent liabilities and contingent assets where the probability of future payments/receipts is not considered remote are set out
below, as well as details of contingent liabilities and contingent assets, which although considered remote, the directors consider should be
disclosed.
From time to time the Group is subject to claims and litigation during the normal course of business. The directors have given consideration
to such matters, which are or may be subject to litigation at year-end, and subject to specifi c provisions raised are of the opinion that no
material liability exists.
Contingent liabilities
The Company has issued bank guarantees in favour of certain controlled entities in respect of various banking and commercial
arrangements. Under the terms of the fi nancial guarantee contracts, the Company or the Group will make payments to reimburse the lenders
upon failure of the guaranteed entity to make payments when due.
Terms and face values of the liabilities guaranteed were as follows:
Consolidated The Company
2008
$M 2007
$M 2008
$M 2007
$M
Bank and other guarantees 4.8 4.8 4.8 4.8
NOTES TO THE FINANCIAL STATEMENTS C O N T I N U E D
F O R T H E Y E A R E N D E D 3 0 J U N E 2 0 0 8
For
per
sona
l use
onl
y

TOLL – ANNUAL REPORT 2008 107
31. Commitments for Expenditure
Consolidated The Company
2008
$M 2007
$M 2008
$M 2007
$M
(a) Capital Expenditure Commitments
Total capital expenditure contracted at balance date but not provided for in the fi nancial statements, payable:
Not later than one year 13.1 969.5 12.0 –
Later than one year but not later than fi ve years 6.1 1,889.8 6.0 –
Later than fi ve years – 267.6 – –
19.2 3,126.9 18.0 –
Comprising:
Aircraft and aeronautic-related equipment – 2,874.6 – –
Other property, plant and equipment 19.2 252.3 18.0 –
19.2 3,126.9 18.0 –
(b) Non-Cancellable Operating Lease Commitments
Future non-cancellable operating lease rentals of property, plant and equipment, not provided for in the fi nancial statements, payable:
Not later than one year 168.9 315.9 3.3 –
Later than one year but not later than fi ve years 450.6 716.2 8.7 –
Later than fi ve years 162.0 148.6 – –
781.5 1,180.7 12.0 –
Comprising:
Property 581.1 573.5 – –
Aircraft and aeronautic-related equipment 41.5 491.0 – –
Other plant and equipment 158.9 116.2 12.0 –
781.5 1,180.7 12.0 –
(c) Finance Lease & Hire Purchase Commitments
Finance lease rentals and hire purchase payable are as follows:
Not later than one year 5.3 4.9 – –
Later than one year but not later than fi ve years 16.1 18.4 – –
Later than fi ve years 30.2 38.7 – –
Future lease rentals/repayments 51.6 62.0 – –
Less: Future fi nance charges (17.6) (22.8) – –
Total fi nance lease and hire purchase commitments in fi nancial statements 34.0 39.2 – –
Finance lease commitment
Current (note 23) 2.0 2.1 – –
Non current (note 23) 31.4 36.5 – –
Total lease liability 33.4 38.6 – –
Hire purchase liability
Current (note 23) 0.2 0.5 – –
Non current (note 23) 0.4 0.1 – –
Total hire purchase liability 0.6 0.6 – –
34.0 39.2 – –
For
per
sona
l use
onl
y

108
32. Related Parties
Apart from the details disclosed in this note, no director or key management personnel has entered into a material contract with
the Company or the Group since the end of the previous fi nancial year and there are no material contracts involving directors’ or key
management personnel interests existing at year-end.
Directors
The names of each person holding the position of Director of the Company at any time during the fi nancial year are as follows:
Name Position
Paul Little Executive Director Managing Director
Neil Chatfi eld Executive Director Chief Financial Offi cer
John Moule (retired 14/09/07) Non-executive Director Chairman to 14/9/07
Ray Horsburgh Non-executive Director Chairman from 14/9/07
Harry Boon Non-executive Director
Mark Smith (appointed 01/07/07) Non-executive Director
Barry Cusack (appointed 01/10/07) Non-executive Director
Frank Ford (appointed 14/01/08) Non-executive Director
Other key management personnel
The following persons had authority and responsibility for planning, directing and controlling the activities of the Group, directly or indirectly,
during the fi nancial year:
Name Position
John Ludeke Divisional Director Australian Transport
Stephen Stanley Director Strategy/Mergers and Acquisitions
Hugh Cushing CEO Toll Global Forwarding
David Jackson Chief Executive Offi cer Toll New Zealand
Bernard McInerney Company Secretary
Brett Godfrey Chief Executive Offi cer Virgin Blue
Wayne Hunt* President and Chief Executive Offi cer Toll Asia
All of these persons with the exception of those noted above were also key management persons for the years ended 30 June 2007 and
30 June 2008.
* KMP since 1 October 2007
Remuneration, Retirement Benefi ts and Service Arrangements of KMP
Consolidated The Company
2008 $’000
2007 $’000
2008 $’000
2007 $’000
Primary benefi ts 13,970 54,850 10,276 51,116
Post-employment benefi ts 1,348 11,960 883 9,382
Equity compensation 5,540 3,416 4,190 2,622
20,858 70,225 15,349 63,120
The Company has taken advantage of the relief provided by ASIC Class Order 06/05 and has transferred the detailed remuneration
disclosures to the directors report. The relevant information can be found in the Remuneration Report.
NOTES TO THE FINANCIAL STATEMENTS C O N T I N U E D
F O R T H E Y E A R E N D E D 3 0 J U N E 2 0 0 8
For
per
sona
l use
onl
y

TOLL – ANNUAL REPORT 2008 109
32. Related Parties (continued)
Equity instrument disclosures relating to key management personnel
(i) Options provided as remuneration and shares issued on exercise of such options
Details of options provided as remuneration and shares issued on the exercise of such options, together with the terms and conditions of the
options can be found in the Remuneration Report.
(ii) Option holdings
The numbers of options over ordinary shares in the Company held during the fi nancial year by each director and other key management
personnel of the Group are:
Balance 1 July
‘000
Granted during the
year ‘000
Sold during the year
‘000
Forfeited during the
year ‘000
Exercised during the
year ‘000
Balance at 30 June
‘000
2008
Directors
Paul Little – 739 – – – 739
Neil Chatfi eld – 356 – – – 356
Other Key Management Personnel
John Ludeke – 209 – – – 209
Stephen Stanley – 170 – – – 170
Hugh Cushing – 79 – – – 79
Bernard McInerney – 103 – – – 103
David Jackson – 79 – – – 79
Brett Godfrey – – – – – –
2007
Directors
Paul Little 1,300 – (1,300) – – –
Mark Rowsthorn** 1,300 – (1,300) – – –
Neil Chatfi eld 350 – (350) – – –
Other Key Management Personnel
John Ludeke 300 – (300) – – –
Don Telford* 300 – – – (300) –
Stephen Stanley 700 – (300) – (400) –
Hugh Cushing 120 – (120) – – –
Graham Lyon* 120 – (120) – – –
Bernard McInerney 120 – (120) – – –
Alan Mitchell* 60 – (60) – – –
David Jackson 190 – (190) – – –
Brett Godfrey – – – – – –
Koh Soo Keong*** – 250 – (250) – –
* Transferred to Asciano 15 June 2007
** Resigned 15 June 2007
*** Resigned 30 April 2007
For
per
sona
l use
onl
y

110
32. Related Parties (continued)
Equity instrument disclosures relating to key management personnel (continued)
(iii) Share holdings
The numbers of shares in the Company held during the fi nancial year by each director and other key management personnel of the Group,
including their personally related parties are set out below:
Balance1 July
‘000
Purchased during the
year ‘000
Exercise of options
‘000
Dividend Reinvestment
‘000
Sold during the
year ‘000
Other changes
‘000
Balance 30 June
‘000
2008
Directors
Paul Little 36,931 261 – – – – 37,192
John Moule 727 – – – – (727) –
Neil Chatfi eld 375 5 – – – – 380
Ray Horsburgh 11 12 – – – – 23
Harry Boon – 17 – – – – 17
Mark Smith – 18 – – – – 18
Barry Cusack – 37 – – – – 37
Frank Ford – – – – – – –
Other Key Management Personnel
John Ludeke 328 – – – – – 328
Stephen Stanley 460 40 – 12 – – 512
Hugh Cushing 78 – – – – – 78
David Jackson 2 – – – – – 2
Bernard McInerney 360 – – – – – 360
Wayne Hunt – – – – – – –
Brett Godfrey – – – – – – –
2007
Directors
Paul Little 36,931 – – – – – 36,931
Mark Rowsthorn** 30,194 – – – – (30,194) –
John Moule 736 6 – 2 (17) – 727
Neil Chatfi eld 430 – – – (55) – 375
Alastair Lucas*** 237 5 – – – (242) –
Ray Horsburgh 5 6 – – – – 11
Other Key Management Personnel
John Ludeke 608 – – – (280) – 328
Don Telford* 402 – 300 – (49) (653) –
Stephen Stanley 100 – 400 – (40) – 460
Hugh Cushing 92 – – – (14) – 78
Graham Lyon* 900 – – – (100) (800) –
David Jackson 2 – – – – – 2
Bernard McInerney 360 – – – – – 360
Alan Mitchell* 3 1 – – – (4) –
Koh Soo Keong^ – – – – – – –
Brett Godfrey – – – – – – –
* Transferred to Asciano 15 June 2007
** Resigned 15 June 2007
*** Retired 26 Oct 2006
Resigned 30 April 2007
NOTES TO THE FINANCIAL STATEMENTS C O N T I N U E D
F O R T H E Y E A R E N D E D 3 0 J U N E 2 0 0 8
For
per
sona
l use
onl
y

TOLL – ANNUAL REPORT 2008 111
32. Related Parties (continued)
Equity instrument disclosures relating to key management personnel (continued)
(iv) Reset Preference shares
Balance 1 July 2006
Purchased during the
year
Sold during the
year Other
changes
Balance 30 June
2007
Purchased during the
year
Sold during the
year
Balance 30 June
2008
Paul Little 1,500 – – – 1,500 – – 1,500
Mark Rowsthorn** 1,500 – – (1,500) – – – –
Neil Chatfi eld 1,000 – – – 1,000 – – 1,000
Don Telford* – – – – – – – –
Bernard McInerney 360 – – – 360 – – 360
* Transferred to Asciano 15 June 2007
** Resigned 15 June 2007
No director or other key management personnel other than those identifi ed above held reset preference shares in the Company during the
current year or the prior year.
Other Transactions of Directors and Director Related Entities and key management personnel with the Company or its
Controlled Entities
(i) Shares and movements in Virgin Blue Holdings Ltd
Balance 30 June
2007 ‘000
Purchased during the
year ‘000
Sold during the year
‘000
Other changes
‘000
Balance 30 June
2008 ‘000
Brett Godfrey 28,147 345 – – 28,492
Neil Chatfi eld 20 35 – – 55
Bernard McInerney 15 – – – 15
(ii) The Group hired aircraft from Little Aviation Pty Ltd. during the year for transport. Paul Little is a director of Little Aviation Pty Ltd.
An amount of $12,452 was paid to Little Aviation. These charges were equivalent to normal commercial business class airline tickets.
In all matters outlined above, the terms and conditions of the transactions were no more favourable than those available, or which might
reasonably be expected to be available, on similar transactions to non-director related entities on an arms length basis.
Wholly Owned Group
The wholly owned Group consists of the Company and its wholly owned controlled entities as set out in note 33.
Transactions between the Company and related parties in the wholly owned Group during the years 30 June 2007 and 30 June 2008
consisted of:
(a) loans advanced by the Company;
(b) loans repaid to the Company;
(c) the payment of interest on the above loans;
(d) the payment of dividends to the Company; and
(e) the payment of head offi ce overheads to the Company.
The above transactions were made on normal commercial terms and conditions and at market rates, except that there are no fi xed terms
for the repayment of principal on loans advanced by or to the Company.For
per
sona
l use
onl
y

112
32. Related Parties (continued)
Wholly Owned Group (continued)
Aggregate amounts included in the determination of profi t from ordinary activities before income tax expense that resulted from transactions
with related parties in the wholly owned Group were as follows:
The Company
2008
$M 2007
$M
Interest revenue 26.0 67.0
Dividend revenue 517.0 467.0
Internal recharge 46.2 36.8
Distribution from Trust 2.8 2.9
Outstanding balances with related parties in the wholly owned Group at balance date were as follows:
Current receivables 2,236.7 16.1
Current payables – 5,499.2
Ownership Interests in Related Parties
Interests held in related parties are set out in notes 33 and 34.
Transactions with Related Parties
The Group has entered into contracts in relation to the supply of transport and logistics services with certain related parties. The terms
and conditions of those transactions were no more favourable than those available, or which might reasonably be expected to be available,
on similar transactions to unrelated entities on an arms length basis.
Consolidated The Company
2008
$M 2007
$M 2008
$M 2007
$M
Purchases of goods and services
– Associates
Purchase of rail linehaul services – – – –
– Other related parties
‘Virgin’ and ‘Virgin Blue’ brand name royalty 7.1 6.9 – –
Revenue from services provided:
– Associates
Revenue for airline services 11.7 11.8 – –
Revenue for sales, rental and marketing fee – 0.7 – –
Outstanding balances with Related Parties
The following balances are outstanding at the reporting date
in relation to transactions with related parties:
Receivables
– Associates 5.6 5.4 – –
Payables
– Other related parties 9.0 8.7 – –
NOTES TO THE FINANCIAL STATEMENTS C O N T I N U E D
F O R T H E Y E A R E N D E D 3 0 J U N E 2 0 0 8
For
per
sona
l use
onl
y

TOLL – ANNUAL REPORT 2008 113
33. Particulars in Relation to Controlled Entities
Name of Entity Note Date relief granted (a) Country of Incorporation Ownership Interest
2008
% 2007
%
The Company
Toll Holdings Limited
Controlled Entities of Toll Holdings Limited
246 Miller Pty Ltd Australia 100 –
Adderstone Finance Pty Ltd (g) Australia 100 100
ARC Strang Pty Ltd (a) 27 June 2008 Australia 100 100
Artmill Distributors Pty Ltd (f) Australia – 100
Australis Terminal Co Pty Ltd (f) Australia – 100
Autotrans Express (Aust) Pty Ltd (a) 29 Oct 2001 Australia 100 100
Avellaneda Pty Ltd (g) Australia 100 100
BALtrans (Australia) Pty Ltd Australia 75 –
BALtrans (China) Ltd Hong Kong 100 –
BALtrans Clover Cargo Holdings (Proprietary) Limited South Africa 62 –
BALtrans Clover Cargo Investments (Proprietary) Limited South Africa 62 –
BALtrans Clover Cargo (Proprietary) Limited South Africa 62 –
BALtrans Exhibition & Removal Ltd Hong Kong 60 –
BALtrans Forwarding Sdn Bhd Malaysia 100 –
BALtrans Global Logistics Ltd British Virgin Islands 100 –
BALtrans Holdings Limited Bermuda 100 –
BALtrans International (BVI) Ltd British Virgin Islands 100 –
BALtrans International Cargo Ltd Peoples Republic of China 100 –
BALtrans International Moving Ltd Hong Kong 70 –
BALtrans International Special Freight Ltd Peoples Republic of China 60 –
BALtrans International (USA) Inc USA 100 –
BALtrans Logistics (Canada) Ltd Canada 70 –
BALtrans Logistics (China) Ltd Peoples Republic of China 100 –
BALtrans Logistics Company Ltd Peoples Republic of China 100 –
BALtrans Logistics (France) SAS France 100 –
BALtrans Logistics (Germany) GMBH Germany 100 –
BALtrans Logistics (Hong Kong) Ltd Hong Kong 100 –
BALtrans Logistics Inc USA 100 –
BALtrans Logistics (India) Private Ltd India 100 –
BALtrans Logistics International Cooperatief U. A. Netherlands 100 –
BALtrans Logistics (Lanka) Pvt Ltd Sri Lanka 84 –
BALtrans Logistics Ltd Hong Kong 100 –
BALtrans Logistics (Malaysia) Sdn Bhd Malaysia 100
BALtrans Logistics (Netherlands) B.V. Netherlands 100 –
BALtrans Logistics Pte Ltd Singapore 100 –
For
per
sona
l use
onl
y
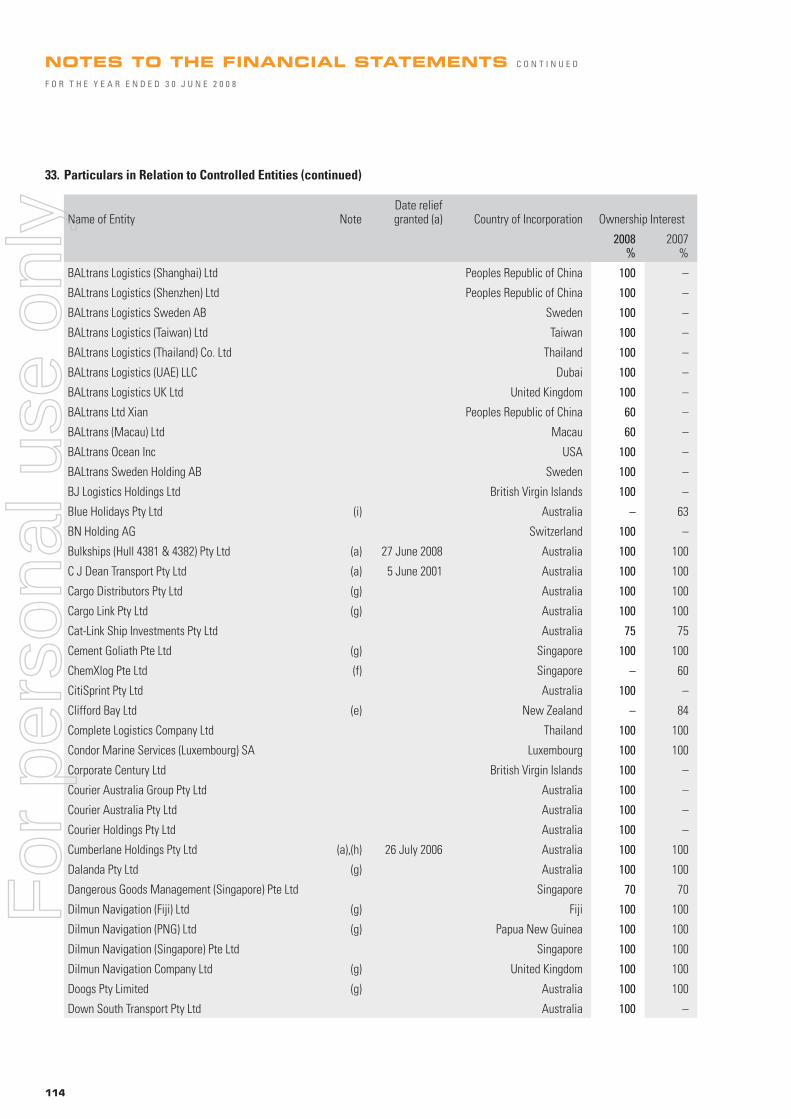
114
33. Particulars in Relation to Controlled Entities (continued)
Name of Entity Note Date relief granted (a) Country of Incorporation Ownership Interest
2008
% 2007
%
BALtrans Logistics (Shanghai) Ltd Peoples Republic of China 100 –
BALtrans Logistics (Shenzhen) Ltd Peoples Republic of China 100 –
BALtrans Logistics Sweden AB Sweden 100 –
BALtrans Logistics (Taiwan) Ltd Taiwan 100 –
BALtrans Logistics (Thailand) Co. Ltd Thailand 100 –
BALtrans Logistics (UAE) LLC Dubai 100 –
BALtrans Logistics UK Ltd United Kingdom 100 –
BALtrans Ltd Xian Peoples Republic of China 60 –
BALtrans (Macau) Ltd Macau 60 –
BALtrans Ocean Inc USA 100 –
BALtrans Sweden Holding AB Sweden 100 –
BJ Logistics Holdings Ltd British Virgin Islands 100 –
Blue Holidays Pty Ltd (i) Australia – 63
BN Holding AG Switzerland 100 –
Bulkships (Hull 4381 & 4382) Pty Ltd (a) 27 June 2008 Australia 100 100
C J Dean Transport Pty Ltd (a) 5 June 2001 Australia 100 100
Cargo Distributors Pty Ltd (g) Australia 100 100
Cargo Link Pty Ltd (g) Australia 100 100
Cat-Link Ship Investments Pty Ltd Australia 75 75
Cement Goliath Pte Ltd (g) Singapore 100 100
ChemXlog Pte Ltd (f) Singapore – 60
CitiSprint Pty Ltd Australia 100 –
Clifford Bay Ltd (e) New Zealand – 84
Complete Logistics Company Ltd Thailand 100 100
Condor Marine Services (Luxembourg) SA Luxembourg 100 100
Corporate Century Ltd British Virgin Islands 100 –
Courier Australia Group Pty Ltd Australia 100 –
Courier Australia Pty Ltd Australia 100 –
Courier Holdings Pty Ltd Australia 100 –
Cumberlane Holdings Pty Ltd (a),(h) 26 July 2006 Australia 100 100
Dalanda Pty Ltd (g) Australia 100 100
Dangerous Goods Management (Singapore) Pte Ltd Singapore 70 70
Dilmun Navigation (Fiji) Ltd (g) Fiji 100 100
Dilmun Navigation (PNG) Ltd (g) Papua New Guinea 100 100
Dilmun Navigation (Singapore) Pte Ltd Singapore 100 100
Dilmun Navigation Company Ltd (g) United Kingdom 100 100
Doogs Pty Limited (g) Australia 100 100
Down South Transport Pty Ltd Australia 100 –
NOTES TO THE FINANCIAL STATEMENTS C O N T I N U E D
F O R T H E Y E A R E N D E D 3 0 J U N E 2 0 0 8
For
per
sona
l use
onl
y

TOLL – ANNUAL REPORT 2008 115
33. Particulars in Relation to Controlled Entities (continued)
Name of Entity Note Date relief granted (a) Country of Incorporation Ownership Interest
2008
% 2007
%
Dynamic Container Line Ltd British Virgin Islands 100 –
Dynamic Logistics (Hong Kong) Ltd Hong Kong 100 –
Exhibitstrans Logistics Ltd Hong Kong 60 –
Express Blue Air Freight Pty Ltd (d) Australia – –
Federated Stevedores Darwin Pty Ltd (f) Australia – 100
Fire Engineering Pty Ltd (f) Australia – 100
FMS Facility Management Services Pty Ltd Australia 100 –
Fracht Forwarding & Travels (Private) Ltd India 100 100
Freight Solutions International LLC USA 100 –
Fremantle Link Services Pty Ltd (f) Australia – 100
Freshmark Pty Ltd (f) Australia – 100
Fuel Handling Systems Ltd (formerly BALtrans (UK) Holdings Ltd ) United Kingdom 100 –
Gluck Pty Ltd Australia 100 –
Greens Distribution Pty Ltd (g) Australia 100 100
Guangdong Supreme International Forwarding Agency Company Ltd Peoples Republic of China 100 –
Guangzhou – Toll Warehousing Services Co. Ltd People’s Republic of China 100 100
Helicorp Pty Ltd Australia 100 100
Helijet Services Pty Ltd Australia 100 –
Holyman (Luxembourg) SA Luxembourg 100 100
Holyman (NZ) Pty Ltd (a),(h) 26 July 2006 Australia 100 100
Holyman (South East Asia) Pte Ltd (g) Singapore 100 100
Holyman (UK) Ltd United Kingdom 100 100
Holyman (USA) Inc USA 100 100
Holyman Catalina Agencies LLC USA 80 80
Holyman Ferries Pte Ltd (g) Singapore 100 100
Holyman Operations Pty Ltd Australia 100 100
Holyman Ports Pty Ltd (g) Australia 100 100
Holyman Pty Ltd (a),(h) 26 July 2006 Australia 100 100
Holyman Refrigeration Pty Ltd (g) Australia 100 100
Holyman Shipping Services Pty Ltd (a) Australia 100 100
Holyman Superannuation Pty Ltd Australia 100 100
Holyman Transport Pty Ltd (a) 27 June 2008 Australia 100 100
International Corporate Relocations Pty Ltd (g) Australia 100 100
Intravest Pty Ltd (a) 27 June 2008 Australia 100 100
Inverlael Pty Ltd (a) 27 June 2008 Australia 100 100
J.D.Lyons & Co. Ltd (f) New Zealand – 100
For
per
sona
l use
onl
y
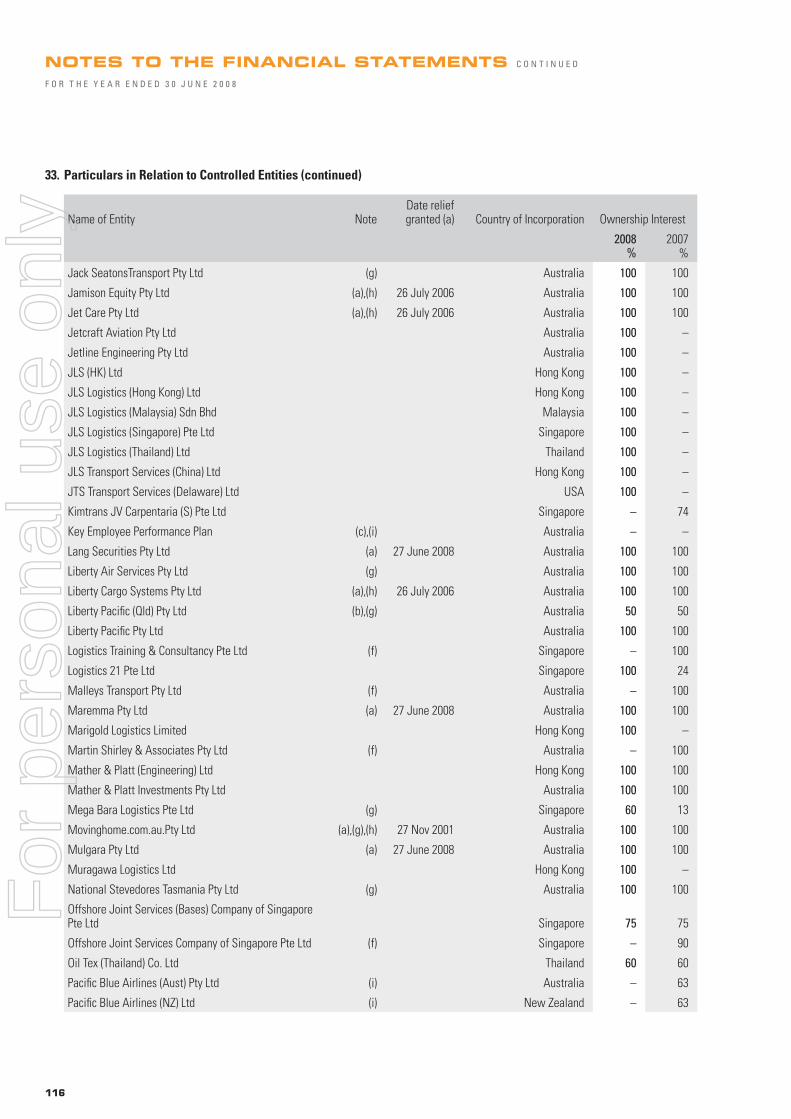
116
33. Particulars in Relation to Controlled Entities (continued)
Name of Entity Note Date relief granted (a) Country of Incorporation Ownership Interest
2008
% 2007
%
Jack SeatonsTransport Pty Ltd (g) Australia 100 100
Jamison Equity Pty Ltd (a),(h) 26 July 2006 Australia 100 100
Jet Care Pty Ltd (a),(h) 26 July 2006 Australia 100 100
Jetcraft Aviation Pty Ltd Australia 100 –
Jetline Engineering Pty Ltd Australia 100 –
JLS (HK) Ltd Hong Kong 100 –
JLS Logistics (Hong Kong) Ltd Hong Kong 100 –
JLS Logistics (Malaysia) Sdn Bhd Malaysia 100 –
JLS Logistics (Singapore) Pte Ltd Singapore 100 –
JLS Logistics (Thailand) Ltd Thailand 100 –
JLS Transport Services (China) Ltd Hong Kong 100 –
JTS Transport Services (Delaware) Ltd USA 100 –
Kimtrans JV Carpentaria (S) Pte Ltd Singapore – 74
Key Employee Performance Plan (c),(i) Australia – –
Lang Securities Pty Ltd (a) 27 June 2008 Australia 100 100
Liberty Air Services Pty Ltd (g) Australia 100 100
Liberty Cargo Systems Pty Ltd (a),(h) 26 July 2006 Australia 100 100
Liberty Pacifi c (Qld) Pty Ltd (b),(g) Australia 50 50
Liberty Pacifi c Pty Ltd Australia 100 100
Logistics Training & Consultancy Pte Ltd (f) Singapore – 100
Logistics 21 Pte Ltd Singapore 100 24
Malleys Transport Pty Ltd (f) Australia – 100
Maremma Pty Ltd (a) 27 June 2008 Australia 100 100
Marigold Logistics Limited Hong Kong 100 –
Martin Shirley & Associates Pty Ltd (f) Australia – 100
Mather & Platt (Engineering) Ltd Hong Kong 100 100
Mather & Platt Investments Pty Ltd Australia 100 100
Mega Bara Logistics Pte Ltd (g) Singapore 60 13
Movinghome.com.au.Pty Ltd (a),(g),(h) 27 Nov 2001 Australia 100 100
Mulgara Pty Ltd (a) 27 June 2008 Australia 100 100
Muragawa Logistics Ltd Hong Kong 100 –
National Stevedores Tasmania Pty Ltd (g) Australia 100 100
Offshore Joint Services (Bases) Company of Singapore Pte Ltd Singapore 75 75
Offshore Joint Services Company of Singapore Pte Ltd (f) Singapore – 90
Oil Tex (Thailand) Co. Ltd Thailand 60 60
Pacifi c Blue Airlines (Aust) Pty Ltd (i) Australia – 63
Pacifi c Blue Airlines (NZ) Ltd (i) New Zealand – 63
NOTES TO THE FINANCIAL STATEMENTS C O N T I N U E D
F O R T H E Y E A R E N D E D 3 0 J U N E 2 0 0 8
For
per
sona
l use
onl
y

TOLL – ANNUAL REPORT 2008 117
33. Particulars in Relation to Controlled Entities (continued)
Name of Entity Note Date relief granted (a) Country of Incorporation Ownership Interest
2008
% 2007
%
Pacifi c Blue Holdings Pty Ltd (i) Australia – 63
Pack-Tainers Rail Services Pty Ltd (f) Australia – 100
Palm Valley Pipeline Company Pty Ltd (f) Australia – 100
Patrick Bulk Transport Pty Ltd (g) Australia 100 100
PRK Corporation Pty Ltd (formerly Patrick Corporation Ltd) (a) 26 July 2006 Australia 100 100
Patrick Chartering Pty Ltd Australia 100 100
Patrick International Freight (NZ) Ltd New Zealand 100 100
Patrick Logistics (NZ) Ltd New Zealand 100 100
Patrick Logistics Superannuation Pty Ltd Australia 100 100
Patrick Packing Services Pty Ltd Australia 100 100
Patrick Shipping Pty Ltd (a),(h) 26 July 2006 Australia 100 100
Patrick Stevedores No.1 Pty Ltd (g) Australia 100 100
Patrick Stevedores No.2 Pty Ltd (g) Australia 100 100
Patrick Stevedores No.3 Pty Ltd (g) Australia 100 100
Plexis Services Inc USA 100 100
PT Bahana Perintis Indonesia Indonesia 100 24
PT BALtransindo Indonesia 90 –
PT BALtrans Logistics Indonesia Indonesia 100 –
PT Interglobal Jasa Karya Indonesia Indonesia 100 24
PT Sin Kepri Logistik Indonesia 95 –
PT SK Logistik Indonesia Indonesia 100 24
PT SK Pelarayan Indonesia Indonesia 51 24
PT Toll Indonesia Indonesia 51 51
Quexton Pty Ltd (a) 27 June 2008 Australia 100 100
Red Jet Foundation Charitable Trust (c),(i) Australia – –
Red Jet Foundation Pty Ltd (i) Australia – 63
R&H Nominees Pty Ltd (g) 28 April 2004 Australia 100 100
R&H Transport Services Pty Ltd (a),(h) 28 April 2004 Australia 100 100
Refrigerated Roadways Pty Ltd (a),(h) 15 June 1998 Australia 100 100
Resarta Pty Ltd (a) 27 June 2008 Australia 100 100
Scarabus Pty Ltd (a) 26 July 2006 Australia 100 100
Seatons Container Freight Station Pty Ltd Australia 100 100
Sembawang Kimtrans Marine Pte Ltd Singapore 100 24
Sembawang Kimtrans Shipping Pte Ltd Singapore 100 24
SembCorp Logistics (Shanghai) Co. Ltd People’s Republic of China 100 100
SembLog Asia Pacifi c Pte Ltd (f) Singapore – 100
Serenade Pty Ltd (a) 26 July 2006 Australia 100 100
Shenzhen ST-Anda Logistics Co. Ltd People’s Republic of China 51 51
For
per
sona
l use
onl
y

118
33. Particulars in Relation to Controlled Entities (continued)
Name of Entity Note Date relief granted (a) Country of Incorporation Ownership Interest
2008
% 2007
%
Singapore Offshore Petroleum Services Pte Ltd Singapore 100 100
Singapore Technologies Logistics Pte Ltd Singapore 100 100
SML Investments Pte Ltd (g) Singapore 100 100
SOPS (Bangladesh) Private Ltd (g) Bangladesh 100 100
SOPS (Cambodia) Co. Ltd Cambodia 100 –
SOPS Investments Pte Limited Singapore 100 100
SOPS (Iran) Private Limited Bermuda – 78
SOPS Orient Caspian Pte Ltd Bermuda 65 65
ST Airport Services Pte Ltd Singapore 67 67
STARS (TL) Lda Timor Leste 67 –
ST Logistics Pte Ltd Singapore 100 100
ST Logistics (UK) Ltd United Kingdom 100 100
ST Logistics (USA) Inc USA 100 100
ST Medical Services Pte Ltd Singapore 100 100
Stream Solutions (Holdings) Pty Ltd (a) 27 June 2008 Australia 100 62
Stream Solutions Pty Ltd (formerly Stream Solutions Limited) (a) 27 June 2008 Australia 100 62
Supreme Freight Consolidators (Ocean) Ltd Hong Kong 100 –
Supreme Logistics (Hong Kong) Ltd Hong Kong 100 –
Supreme Logistics Ltd Hong Kong 100 –
The Loyalty Trust (c),(i) Australia – –
Toll Aircraft Maintenance Pty Ltd (formerly Patrick Aircraft Maintenance Pty Ltd) (a),(h) 26 July 2006 Australia 100 100
Toll (Asia) Pte Ltd Singapore 100 100
Toll (BVI) Limited British Virgin Islands 100 –
Toll (Cambodia) Co. Limited Cambodia 100 100
Toll Carriers Limited New Zealand 100 –
Toll (Corporate Services) Pty Ltd Australia 100 100
Toll (Cowra) Pty Ltd (a),(h) 5 June 2001 Australia 100 100
Toll Dnata Airport Services Pty Ltd (formerly Toll Air Services Pty Ltd) (a) 26 July 2006 Australia – 100
Toll (FGCT) Pty Ltd (a),(g),(h) 5 June 2001 Australia 100 100
Toll (FHL) Pty Ltd (a) 5 June 2001 Australia 100 100
Toll Funding (Singapore) Pte Ltd (formerly SOPS Pte Ltd) Singapore 100 100
Toll (Thailand) Ltd Thailand 100 100
Toll (TL) Lda Timor Leste 100 –
Toll (TR) Finance Ltd (e) New Zealand – 84
Toll (Vietnam) Limited Vietnam 100 100
Toll Energy Logistics Pty Ltd (a) 15 June 1998 Australia 100 100
Toll Equipment (FFM) Pty Ltd (a) 27 June 2008 Australia 100 100
Toll Express (Asia) Pte Ltd Singapore 100 100
NOTES TO THE FINANCIAL STATEMENTS C O N T I N U E D
F O R T H E Y E A R E N D E D 3 0 J U N E 2 0 0 8
For
per
sona
l use
onl
y

TOLL – ANNUAL REPORT 2008 119
33. Particulars in Relation to Controlled Entities (continued)
Name of Entity Note Date relief granted (a) Country of Incorporation Ownership Interest
2008
% 2007
%
Toll Finance (NZ) Limited New Zealand 100 100
Toll Finance Pty Ltd (a) 4 June 2004 Australia 100 100
Toll Fleet Equipment (Malaysia) Sdn Bhd Malaysia 57 57
Toll Global Forwarding Pty Ltd (formerly Toll International Pty Ltd) (a) 26 July 2006 Australia 100 100
Toll Group (NZ) Ltd New Zealand 100 100
Toll Holdings (Thailand) Ltd Thailand 100 100
Toll Holdings Property Trust Australia 100 100
Toll (HK) Ltd Hong Kong 100 100
Toll (India) Logistics Pvt Ltd India 100 100
Toll Integrated Logistics (Malaysia) Sdn Bhd Malaysia 100 100
Toll International Investments Pty Limited Australia 100 –
Toll IPEC Pty Ltd (a) 26 Oct 1999 Australia 100 100
Toll Kukbo Co Ltd South Korea 51 51
Toll (New Zealand) Limited (formerly Toll Limited) New Zealand 100 100
Toll Logistics (Asia) Ltd (formerly Sembawang Kimtrans Ltd) Singapore 100 24
Toll Logistics Asia (M) Sdn Bhd (formerly Sembawang Kimtrans Logistics Sdn Bhd) Malaysia 100 24
Toll Logistics (NZ) Ltd New Zealand 100 100
Toll Logistics Australia Pty Ltd (a),(h) 15 June 1998 Australia 100 100
Toll Logistics (Thailand) Ltd Thailand 100 46
Toll – Macro Asia Philippines Inc Philippines 51 51
Toll Networks (NZ) Ltd New Zealand 100 100
Toll North Pty Ltd (a) 15 June 1998 Australia 100 100
Toll NZ Consolidated Ltd (e) New Zealand – 84
Toll NZ Limited (e) New Zealand – 84
Toll Personnel Pty Ltd (a) 26 July 2006 Australia 100 100
Toll Ports NZ Limited New Zealand 100 100
Toll (PRK) Finance Pty Ltd (formerly Patrick Finance Pty Ltd) 26 July 2006 Australia 100 100
Toll (PRK) Tasmania Pty Ltd (formerly Patrick Tasmania Pty Ltd) Australia 100 100
Toll Property Fund Holdings Pty Ltd (a) 27 June 2008 Australia 100 100
Toll Projects Pty Ltd (f) Australia – 100
Toll Properties Pty Ltd (a) 21 Dec 1994 Australia 100 100
Toll Pty Ltd (a) 5 June 2001 Australia 100 100
Toll (Qingdao) Warehousing Services Co. Ltd People’s Republic of China 100 100
Toll Rail Investments Pty Ltd (formerly Patrick Rail Investments Pty Ltd) (g) Australia 100 100
Toll RE Limited Australia 100 –
Toll Relocations Pty Ltd (a),(g),(h) 12 June 2001 Australia 100 100
Toll (SCL) Ltd Singapore 100 100
Toll (Singapore) Pte Ltd Singapore 100 100
For
per
sona
l use
onl
y

120
33. Particulars in Relation to Controlled Entities (continued)
Name of Entity Note Date relief granted (a) Country of Incorporation Ownership Interest
2008
% 2007
%
Toll Services (Thailand) Ltd Thailand – 100
Toll-SGN Vietnam Co. Ltd Vietnam 60 60
Toll Shipping (IOM) Ltd Isle of Man 100 100
Toll Shipping Seagoing Offi cers Superannuation Pty Ltd (a) 27 June 2008 Australia 100 100
Toll Support Services Pty Ltd (formerly Spare 1 Pty Ltd) (a) 27 June 2008 Australia 100 100
Toll (Taiwan) Ltd Taiwan 100 100
Toll Technologies Investments Pty Ltd (a) 12 June 2001 Australia 100 100
Toll Technologies Pty Ltd (a),(h) 5 June 2000 Australia 100 100
Toll Transport Pty Ltd (a) 11 June 1993 Australia 100 100
Toll (USA) Inc USA 100 100
Toll Warehouse (Thailand) Limited (formerly Toll Warehouse (Logistics) Ltd) Thailand 100 100
Toll Zenecon Pte Ltd Singapore 51 51
Tranz Link Ltd (e) New Zealand – 84
Tranz Metro Ltd (e) New Zealand – 84
Tranz National Ltd (e) New Zealand – 84
Tranz Rail Holdings Pty Ltd (e) Australia – 84
Tranz Rail Pty Ltd (e) Australia – 84
Union Corporate Services Pty Ltd (a),(h) 26 July 2006 Australia 100 100
United Distribution Services (Far East) Ltd Hong Kong 100 –
VB Investco Pty Ltd (i) Australia – 63
VB Ventures Pty Ltd (i) Australia – 63
VBNC1 Pty Ltd (i) Australia – 63
VBNC2 Pty Ltd (i) Australia – 63
VBNC3 Pty Ltd (i) Australia – 63
VBNC4 Pty Ltd (i) Australia – 63
VBNC5 Pty Ltd (i) Australia – 63
VBNC6 Pty Ltd (i) Australia – 63
VBNC8 Pty Ltd (i) Australia – 63
Victorian Express Pty Ltd (a) 27 June 2008 Australia 100 –
Velocity Rewards Pty Ltd (i) Australia – 63
Villawood Unit Trust Australia 100 –
Virgin Australia Holdings Pty Ltd (i) Australia – 63
Virgin Blue Airlines Pty Ltd (i) Australia – 63
Virgin Blue International Airlines Pty Ltd (i) Australia – 63
Virgin Blue International (Holdings) Pty Ltd (i) Australia – 63
Virgin Blue Holdings Ltd (i) Australia – 63
NOTES TO THE FINANCIAL STATEMENTS C O N T I N U E D
F O R T H E Y E A R E N D E D 3 0 J U N E 2 0 0 8
For
per
sona
l use
onl
y
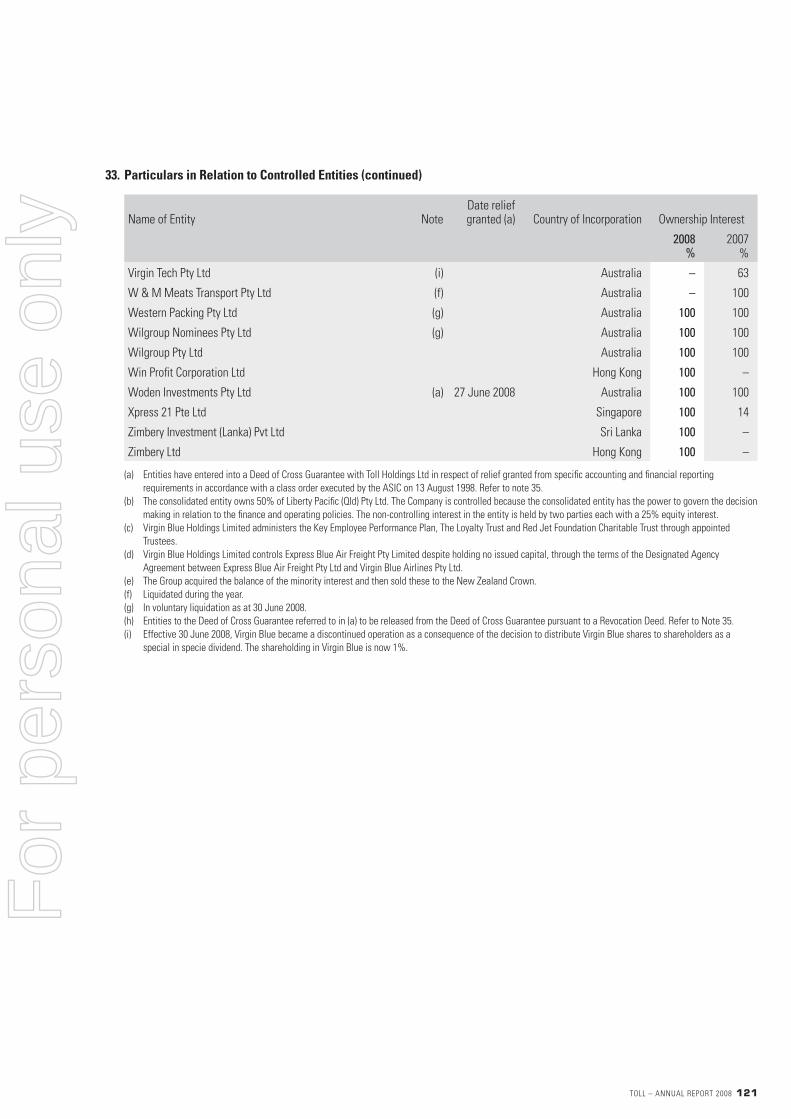
TOLL – ANNUAL REPORT 2008 121
33. Particulars in Relation to Controlled Entities (continued)
Name of Entity Note Date relief granted (a) Country of Incorporation Ownership Interest
2008
% 2007
%
Virgin Tech Pty Ltd (i) Australia – 63
W & M Meats Transport Pty Ltd (f) Australia – 100
Western Packing Pty Ltd (g) Australia 100 100
Wilgroup Nominees Pty Ltd (g) Australia 100 100
Wilgroup Pty Ltd Australia 100 100
Win Profi t Corporation Ltd Hong Kong 100 –
Woden Investments Pty Ltd (a) 27 June 2008 Australia 100 100
Xpress 21 Pte Ltd Singapore 100 14
Zimbery Investment (Lanka) Pvt Ltd Sri Lanka 100 –
Zimbery Ltd Hong Kong 100 –
(a) Entities have entered into a Deed of Cross Guarantee with Toll Holdings Ltd in respect of relief granted from specifi c accounting and fi nancial reporting
requirements in accordance with a class order executed by the ASIC on 13 August 1998. Refer to note 35.
(b) The consolidated entity owns 50% of Liberty Pacifi c (Qld) Pty Ltd. The Company is controlled because the consolidated entity has the power to govern the decision
making in relation to the fi nance and operating policies. The non-controlling interest in the entity is held by two parties each with a 25% equity interest.
(c) Virgin Blue Holdings Limited administers the Key Employee Performance Plan, The Loyalty Trust and Red Jet Foundation Charitable Trust through appointed
Trustees.
(d) Virgin Blue Holdings Limited controls Express Blue Air Freight Pty Limited despite holding no issued capital, through the terms of the Designated Agency
Agreement between Express Blue Air Freight Pty Ltd and Virgin Blue Airlines Pty Ltd.
(e) The Group acquired the balance of the minority interest and then sold these to the New Zealand Crown.
(f) Liquidated during the year.
(g) In voluntary liquidation as at 30 June 2008.
(h) Entities to the Deed of Cross Guarantee referred to in (a) to be released from the Deed of Cross Guarantee pursuant to a Revocation Deed. Refer to Note 35.
(i) Effective 30 June 2008, Virgin Blue became a discontinued operation as a consequence of the decision to distribute Virgin Blue shares to shareholders as a
special in specie dividend. The shareholding in Virgin Blue is now 1%.
For
per
sona
l use
onl
y
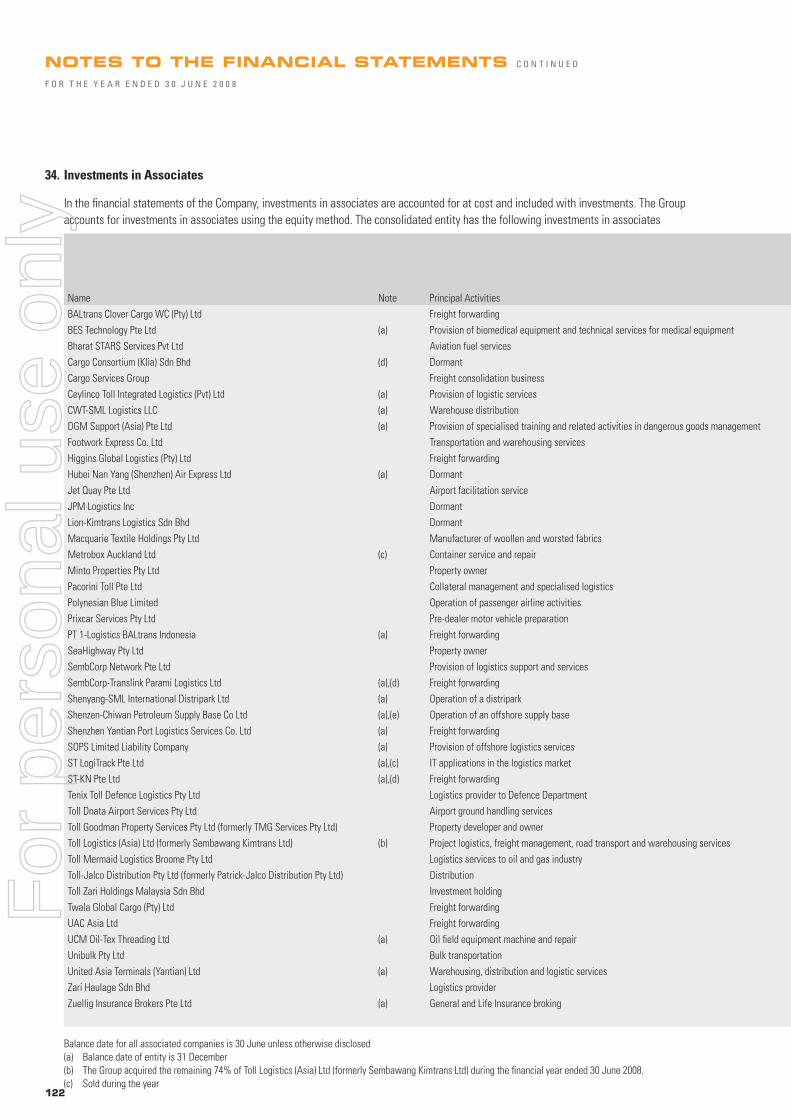
122
34. Investments in Associates
In the fi nancial statements of the Company, investments in associates are accounted for at cost and included with investments. The Group
accounts for investments in associates using the equity method. The consolidated entity has the following investments in associates
Name Note Principal Activities
BALtrans Clover Cargo WC (Pty) Ltd Freight forwarding
BES Technology Pte Ltd (a) Provision of biomedical equipment and technical services for medical equipment
Bharat STARS Services Pvt Ltd Aviation fuel services
Cargo Consortium (Klia) Sdn Bhd (d) Dormant
Cargo Services Group Freight consolidation business
Ceylinco Toll Integrated Logistics (Pvt) Ltd (a) Provision of logistic services
CWT-SML Logistics LLC (a) Warehouse distribution
DGM Support (Asia) Pte Ltd (a) Provision of specialised training and related activities in dangerous goods management
Footwork Express Co. Ltd Transportation and warehousing services
Higgins Global Logistics (Pty) Ltd Freight forwarding
Hubei Nan Yang (Shenzhen) Air Express Ltd (a) Dormant
Jet Quay Pte Ltd Airport facilitation service
JPM Logistics Inc Dormant
Lion-Kimtrans Logistics Sdn Bhd Dormant
Macquarie Textile Holdings Pty Ltd Manufacturer of woollen and worsted fabrics
Metrobox Auckland Ltd (c) Container service and repair
Minto Properties Pty Ltd Property owner
Pacorini Toll Pte Ltd Collateral management and specialised logistics
Polynesian Blue Limited Operation of passenger airline activities
Prixcar Services Pty Ltd Pre-dealer motor vehicle preparation
PT 1-Logistics BALtrans Indonesia (a) Freight forwarding
SeaHighway Pty Ltd Property owner
SembCorp Network Pte Ltd Provision of logistics support and services
SembCorp-Translink Parami Logistics Ltd (a),(d) Freight forwarding
Shenyang-SML International Distripark Ltd (a) Operation of a distripark
Shenzen-Chiwan Petroleum Supply Base Co Ltd (a),(e) Operation of an offshore supply base
Shenzhen Yantian Port Logistics Services Co. Ltd (a) Freight forwarding
SOPS Limited Liability Company (a) Provision of offshore logistics services
ST LogiTrack Pte Ltd (a),(c) IT applications in the logistics market
ST-KN Pte Ltd (a),(d) Freight forwarding
Tenix Toll Defence Logistics Pty Ltd Logistics provider to Defence Department
Toll Dnata Airport Services Pty Ltd Airport ground handling services
Toll Goodman Property Services Pty Ltd (formerly TMG Services Pty Ltd) Property developer and owner
Toll Logistics (Asia) Ltd (formerly Sembawang Kimtrans Ltd) (b) Project logistics, freight management, road transport and warehousing services
Toll Mermaid Logistics Broome Pty Ltd Logistics services to oil and gas industry
Toll-Jalco Distribution Pty Ltd (formerly Patrick-Jalco Distribution Pty Ltd) Distribution
Toll Zari Holdings Malaysia Sdn Bhd Investment holding
Twala Global Cargo (Pty) Ltd Freight forwarding
UAC Asia Ltd Freight forwarding
UCM Oil-Tex Threading Ltd (a) Oil fi eld equipment machine and repair
Unibulk Pty Ltd Bulk transportation
United Asia Terminals (Yantian) Ltd (a) Warehousing, distribution and logistic services
Zari Haulage Sdn Bhd Logistics provider
Zuellig Insurance Brokers Pte Ltd (a) General and Life Insurance broking
Balance date for all associated companies is 30 June unless otherwise disclosed
(a) Balance date of entity is 31 December
(b) The Group acquired the remaining 74% of Toll Logistics (Asia) Ltd (formerly Sembawang Kimtrans Ltd) during the fi nancial year ended 30 June 2008.
(c) Sold during the year
NOTES TO THE FINANCIAL STATEMENTS C O N T I N U E D
F O R T H E Y E A R E N D E D 3 0 J U N E 2 0 0 8
For
per
sona
l use
onl
y

TOLL – ANNUAL REPORT 2008 123
(d) In voluntary liquidation
(e) The Group has signifi cant infl uence over Shenzen-Chiwan Petroleum Supply Base Company Ltd through a 22% ownership interest held by one of the Group’s
non-100% owned subsidiaries.
Ordinary Share Ownership Interest Investment Carrying Value
Consolidated The Company
2008 %
2007 %
2008 $M
2007 $M
2008 $M
2007 $M
37 – – – – –
35 35 – – – –
34 – 1.0 – – –
34 – – – – –
22 22 32.9 30.3 – –
50 50 0.1 – – –
30 30 2.4 2.3 – –
14 14 – – – –
38 38 67.9 74.1 – –
41 – – – – –
50 – – – – –
29 7 – – – –
28 – – – – –
25 6 – – – –
34 34 2.9 3.0 – –
– 42 – 1.0 – –
50 50 13.1 12.2 – –
50 50 3.4 3.2 – –
– 31 – 2.8 – –
50 50 21.3 22.2 – –
30 – – – – –
50 50 – 2.6 – –
50 50 0.2 0.2 – –
30 30 – – – –
49 49 3.2 3.3 – –
17 17 58.3 55.9 – –
30 – – – – –
32 32 – 0.5 – –
– 38 – – – –
49 49 – – – –
50 50 8.8 11.5 16.3 16.3
50 100 6.0 – 6.8 –
50 50 0.9 3.0 – –
– 26 – 43.0 – –
50 50 1.6 0.9 0.4 –
50 50 1.3 1.1 – –
30 30 – – – –
23 – – – – –
50 – – – – –
29 29 0.7 0.8 – –
50 50 – – – –
40 – – – – –
45 45 – – – –
49 49 0.9 0.4 – –
226.9 274.3 23.5 16.3
For
per
sona
l use
onl
y

124
34. Investments in Associates (continued)
Results of associates
Consolidated
2008
$M 2007
$M
Share of associates’ net profi t accounted for using the equity method:
– from continuing operations 5.2 15.5
– from discontinued operations – 11.6
5.2 27.1
Fair value of listed investments in associates
Sembawang Kimtrans Ltd –* 62.2
Shenzen-Chiwan Petroleum Supply Base Co Limited 51.3 110.3
* As at 2 July 2007, the Group gained control of Sembawang Kimtrans Ltd. The legal entity was
consolidated into the Group’s results from that date.
Summarised fi nancial information of equity accounted associates, not adjusted for the percentage ownership held by the Group
Total assets 941.1 1,140.0
Total liabilities 590.5 663.4
Total revenue 1,780.8 1,434.0
Total profi t 17.2 81.7
NOTES TO THE FINANCIAL STATEMENTS C O N T I N U E D
F O R T H E Y E A R E N D E D 3 0 J U N E 2 0 0 8
For
per
sona
l use
onl
y
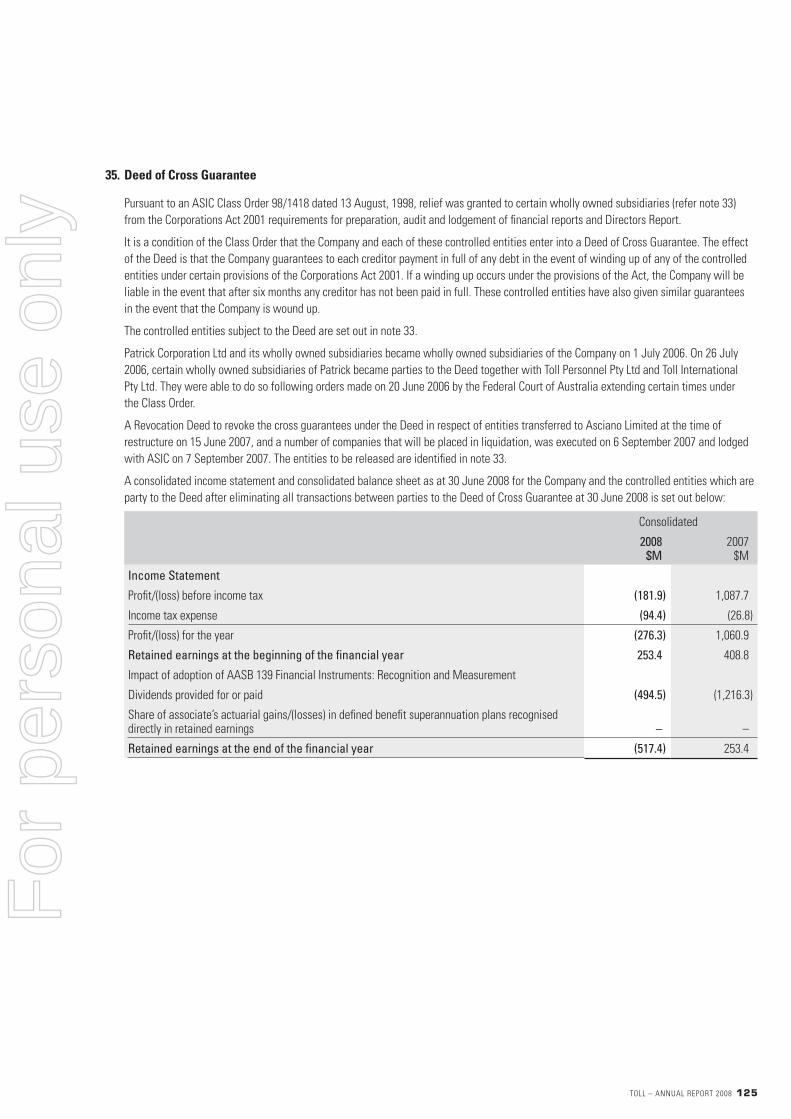
TOLL – ANNUAL REPORT 2008 125
35. Deed of Cross Guarantee
Pursuant to an ASIC Class Order 98/1418 dated 13 August, 1998, relief was granted to certain wholly owned subsidiaries (refer note 33)
from the Corporations Act 2001 requirements for preparation, audit and lodgement of fi nancial reports and Directors Report.
It is a condition of the Class Order that the Company and each of these controlled entities enter into a Deed of Cross Guarantee. The effect
of the Deed is that the Company guarantees to each creditor payment in full of any debt in the event of winding up of any of the controlled
entities under certain provisions of the Corporations Act 2001. If a winding up occurs under the provisions of the Act, the Company will be
liable in the event that after six months any creditor has not been paid in full. These controlled entities have also given similar guarantees
in the event that the Company is wound up.
The controlled entities subject to the Deed are set out in note 33.
Patrick Corporation Ltd and its wholly owned subsidiaries became wholly owned subsidiaries of the Company on 1 July 2006. On 26 July
2006, certain wholly owned subsidiaries of Patrick became parties to the Deed together with Toll Personnel Pty Ltd and Toll International
Pty Ltd. They were able to do so following orders made on 20 June 2006 by the Federal Court of Australia extending certain times under
the Class Order.
A Revocation Deed to revoke the cross guarantees under the Deed in respect of entities transferred to Asciano Limited at the time of
restructure on 15 June 2007, and a number of companies that will be placed in liquidation, was executed on 6 September 2007 and lodged
with ASIC on 7 September 2007. The entities to be released are identifi ed in note 33.
A consolidated income statement and consolidated balance sheet as at 30 June 2008 for the Company and the controlled entities which are
party to the Deed after eliminating all transactions between parties to the Deed of Cross Guarantee at 30 June 2008 is set out below:
Consolidated
2008
$M 2007
$M
Income Statement
Profi t/(loss) before income tax (181.9) 1,087.7
Income tax expense (94.4) (26.8)
Profi t/(loss) for the year (276.3) 1,060.9
Retained earnings at the beginning of the fi nancial year 253.4 408.8
Impact of adoption of AASB 139 Financial Instruments: Recognition and Measurement
Dividends provided for or paid (494.5) (1,216.3)
Share of associate’s actuarial gains/(losses) in defi ned benefi t superannuation plans recognised directly in retained earnings – –
Retained earnings at the end of the fi nancial year (517.4) 253.4
For
per
sona
l use
onl
y
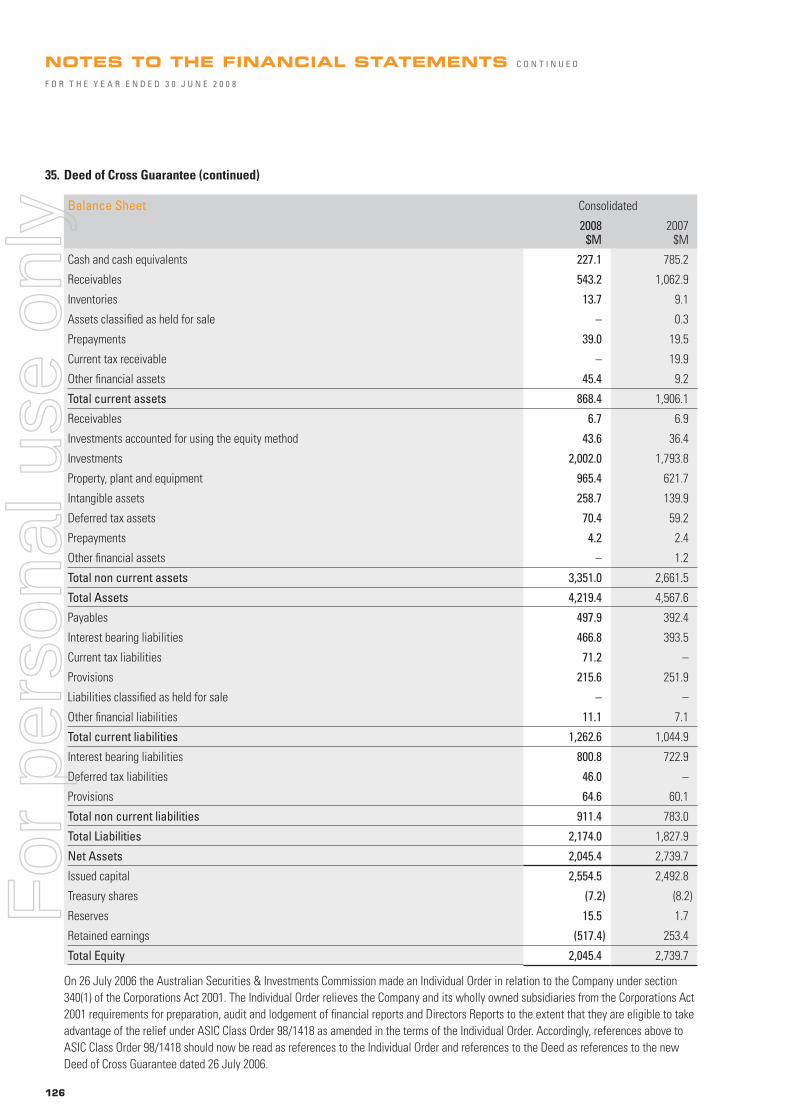
126
35. Deed of Cross Guarantee (continued)
Balance Sheet Consolidated
2008
$M 2007
$M
Cash and cash equivalents 227.1 785.2
Receivables 543.2 1,062.9
Inventories 13.7 9.1
Assets classifi ed as held for sale – 0.3
Prepayments 39.0 19.5
Current tax receivable – 19.9
Other fi nancial assets 45.4 9.2
Total current assets 868.4 1,906.1
Receivables 6.7 6.9
Investments accounted for using the equity method 43.6 36.4
Investments 2,002.0 1,793.8
Property, plant and equipment 965.4 621.7
Intangible assets 258.7 139.9
Deferred tax assets 70.4 59.2
Prepayments 4.2 2.4
Other fi nancial assets – 1.2
Total non current assets 3,351.0 2,661.5
Total Assets 4,219.4 4,567.6
Payables 497.9 392.4
Interest bearing liabilities 466.8 393.5
Current tax liabilities 71.2 –
Provisions 215.6 251.9
Liabilities classifi ed as held for sale – –
Other fi nancial liabilities 11.1 7.1
Total current liabilities 1,262.6 1,044.9
Interest bearing liabilities 800.8 722.9
Deferred tax liabilities 46.0 –
Provisions 64.6 60.1
Total non current liabilities 911.4 783.0
Total Liabilities 2,174.0 1,827.9
Net Assets 2,045.4 2,739.7
Issued capital 2,554.5 2,492.8
Treasury shares (7.2) (8.2)
Reserves 15.5 1.7
Retained earnings (517.4) 253.4
Total Equity 2,045.4 2,739.7
On 26 July 2006 the Australian Securities & Investments Commission made an Individual Order in relation to the Company under section
340(1) of the Corporations Act 2001. The Individual Order relieves the Company and its wholly owned subsidiaries from the Corporations Act
2001 requirements for preparation, audit and lodgement of fi nancial reports and Directors Reports to the extent that they are eligible to take
advantage of the relief under ASIC Class Order 98/1418 as amended in the terms of the Individual Order. Accordingly, references above to
ASIC Class Order 98/1418 should now be read as references to the Individual Order and references to the Deed as references to the new
Deed of Cross Guarantee dated 26 July 2006.
NOTES TO THE FINANCIAL STATEMENTS C O N T I N U E D
F O R T H E Y E A R E N D E D 3 0 J U N E 2 0 0 8
For
per
sona
l use
onl
y

TOLL – ANNUAL REPORT 2008 127
36. Notes to the Statement of Cash Flows
Consolidated The Company
2008
$M 2007
$M 2008
$M 2007
$M
Reconciliation of profi t from ordinary activities after income tax to net cash provided by operating activities
Profi t for the year after income tax (690.8) 1,365.8 485.0 1,262.3
Share of associates’ net profi t (8.6) (27.1) – –
Dividends received from associates 9.9 21.6 – –
(Profi t)/loss on sale of property, plant & equipment (23.6) (7.7) – –
(Profi t)/loss on sale of investments and businesses 1,015.0 (970.0) – (845.0)
Capitalised borrowing costs – (5.4) – –
Effective interest on debt establishment costs 2.9 11.0 1.0 1.0
Change in fair value of investment property – (0.3) – –
Add/(Less) non-cash items:
Depreciation and Amortisation 349.7 533.4 8.1 6.2
Share option expense 2.1 8.7 2.0 5.7
Amortisation of deferred gain (21.9) (5.8) – –
Impairment of receivables 3.1 – – –
Impairment of software (0.4) 10.5 – –
Impairment of investments 19.9 – – –
Revaluation of investment – – (9.2) –
Net cash infl ow from operating activities before changes in assets and liabilities 657.3 934.7 486.9 430.2
Changes in assets and liabilities adjusted for effects of purchase and disposal of controlled entities during the fi nancial year:
(Increase)/decrease in receivables (195.2) (36.9) 2.1 6.5
(Increase)/decrease in inventories (3.6) (2.8) – –
(Increase)/decrease in prepayments (91.8) 14.7 (2.2) 0.7
(Increase)/decrease in other assets 14.5 – – –
Increase/(decrease) in payables 241.0 83.9 (20.1) 37.5
Increase/(decrease) in provisions (11.1) 81.7 (46.0) 67.4
(Increase)/decrease in loans to controlled entities – – (100.7) (327.1)
Increase/(decrease) in derivative fi nancial liabilities (39.2) (31.5) – –
Increase/(decrease) in current tax liabilities 77.1 (39.0) 85.0 (40.6)
Increase/(decrease) in deferred tax liabilities 60.1 3.6 (28.4) (22.9)
Net cash infl ow from operating activities 709.1 1,008.4 376.6 151.7For
per
sona
l use
onl
y

128
37. Events Subsequent to Balance Date
Dividends
A fi nal dividend of 11.5 cents per share has been declared by the directors which is payable on 24 October 2008.
The Company distributed a special (in specie) dividend of Virgin Blue Holdings Ltd shares on 22 August 2008, on the basis of one Virgin Blue
share for each ordinary Toll Holdings Ltd share held, with the record date being 23 July 2008. The special dividend is a demerger dividend
for income tax purposes and not subject to dividend franking.
38. Undertakings to ACCC
Toll provided Undertakings (‘the Undertakings’) to the ACCC on 11 March 2006 in connection with regulatory clearance of the Group’s
acquisition of Patrick. Those Undertakings provided for the divestment of 50% of its economic interest in Pacifi c National, Patrick’s Bass
Strait shipping business, Patrick’s Tasmanian freight forwarding business, Toll’s vehicle distribution business and Toll’s interest in PrixCar
Services Pty Ltd.
The Undertakings also included obligations for Pacifi c National to make available a total of up to 3 train sets and associated support
services to operators which intended to operate linehaul services on the east west corridor (referred to as the ‘Starters Kit’), as well
as the implementation of a ports and rail non-discrimination regime.
In order to facilitate the Group restructure and in recognition that Pacifi c National and the Group’s port’s businesses would be transferred
to Asciano following the Group’s restructure, the ACCC on 18 April 2007 accepted a Variation (‘the Variation’) to the Undertakings.
The Variation provided that once the restructure was implemented, Toll would be relieved of its obligations to divest the Toll vehicle
distribution business and Toll’s interest in PrixCar. Asciano would also be relieved of its obligation to divest the 50% interest in Pacifi c
National transferred to it on restructure.
In addition, the Variation provided that Toll’s obligations to make available the Starters Kit rail assets and to implement the port and
rail non-discrimination regimes would, following the restructure, be taken over by Asciano under separate undertakings to the ACCC.
For the period prior to the restructure (which occurred on 15 June 2007), Toll continued to have obligations to implement the port and
rail non-discrimination regimes. This included the provision of audit reports to the ACCC in respect of compliance with these regimes.
The Variation includes a range of measures designed to ensure that Toll and Asciano are independent and separate of one another, and
include a prohibition against cross shareholdings/interests, no sharing of profi ts/revenues as between the two entities and the separate
listing of the entities on ASX.
The Variation also imposes a number of restrictions in respect of relevant directors on Toll and Asciano intended to ensure governance
independence. These measures include prohibitions on common directors, no sharing or secondment of managers as between the two
entities, no cross shareholdings in the other entity and restrictions on the employment of managers previously employed by the other entity.
The relevant Toll and Asciano directors were also required to divest their interest in Asciano and Toll respectively following the restructure.
The relevant directors of Toll and Asciano were required to give undertakings to the ACCC to resign all positions including their employment,
if no longer independent of the other entity. The existing directors of Toll and Asciano have given such undertakings.
This is a summary only of the material terms of the Undertakings and the Variation. The undertakings given by Toll and Asciano as well
as the relevant Toll and Asciano directors apply until 31 March 2011.
Full details of the undertakings are available on the ACCC website.
NOTES TO THE FINANCIAL STATEMENTS C O N T I N U E D
F O R T H E Y E A R E N D E D 3 0 J U N E 2 0 0 8
For
per
sona
l use
onl
y
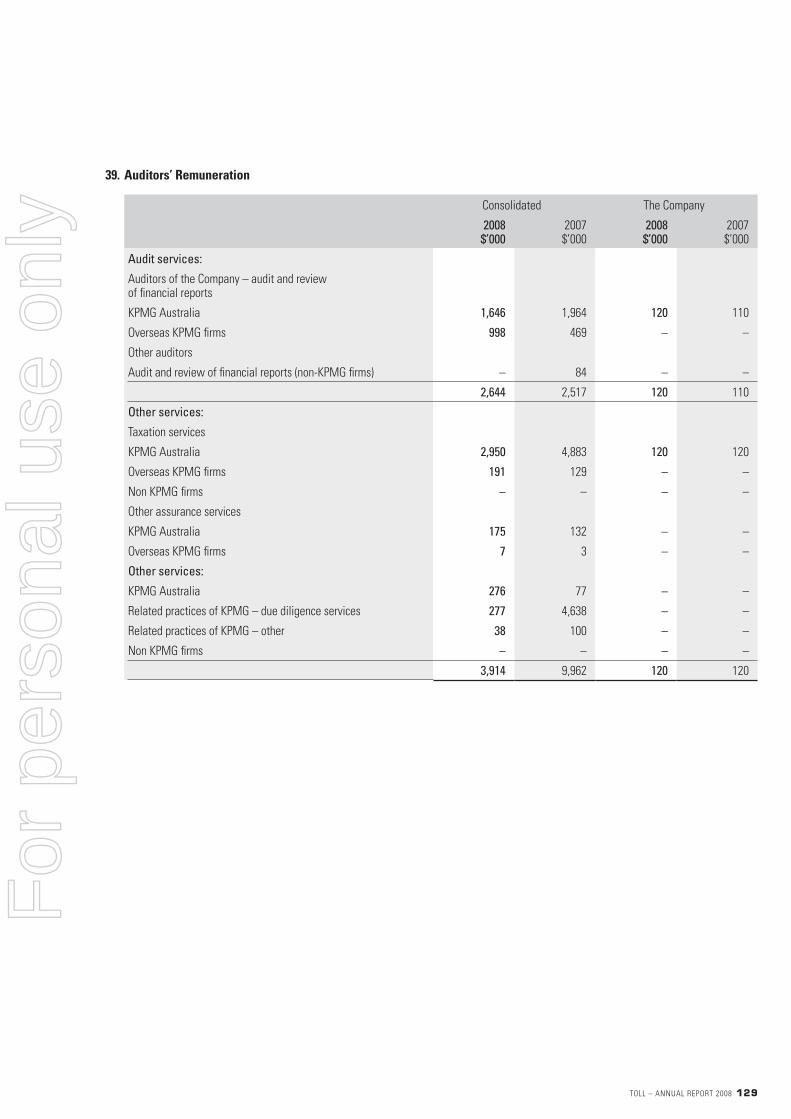
TOLL – ANNUAL REPORT 2008 129
39. Auditors’ Remuneration
Consolidated The Company
2008 $’000
2007 $’000
2008 $’000
2007 $’000
Audit services:
Auditors of the Company – audit and review of fi nancial reports
KPMG Australia 1,646 1,964 120 110
Overseas KPMG fi rms 998 469 – –
Other auditors
Audit and review of fi nancial reports (non-KPMG fi rms) – 84 – –
2,644 2,517 120 110
Other services:
Taxation services
KPMG Australia 2,950 4,883 120 120
Overseas KPMG fi rms 191 129 – –
Non KPMG fi rms – – – –
Other assurance services
KPMG Australia 175 132 – –
Overseas KPMG fi rms 7 3 – –
Other services:
KPMG Australia 276 77 – –
Related practices of KPMG – due diligence services 277 4,638 – –
Related practices of KPMG – other 38 100 – –
Non KPMG fi rms – – – –
3,914 9,962 120 120
For
per
sona
l use
onl
y

130
1. In the opinion of the directors of the Company:
(a) the fi nancial statements and notes set out on pages 49 to 129, including the remuneration disclosures that are contained in the
Remuneration Report on pages 21 to 35 of the Directors Report, are in accordance with the Corporations Act 2001 including:
(i) giving a true and fair view of the fi nancial position of the Company and the Group as at 30 June 2008 and of their performance,
as represented by the results of their operations and their cash fl ows, for the fi nancial year ended on that date; and
(ii) complying with Australian Accounting Standards and the Corporations Regulations 2001; and
(b) the remuneration disclosures that are contained in the Remuneration Report in the Directors’ Report comply with Australian
Accounting Standard AASB 124 Related Party Disclosures
(c) there are reasonable grounds to believe that the Company will be able to pay its debts as and when they become due and payable,
(d) the fi nancial report also complies with International Financial Reporting Standards as disclosed in note 2.
2. There are reasonable grounds to believe that the Company and the controlled entities identifi ed in Note 33 will be able to meet any
obligations or liabilities to which they are or may become subject to by virtue of the Deed of Cross Guarantee between the Company and
those controlled entities pursuant to ASIC Class Order 98/1418.
3. The directors have been given the declarations required by Section 295A of the Corporations Act 2001 from the chief executive offi cer
and chief fi nancial offi cer for the fi nancial year ended 30 June 2008.
Signed in accordance with a resolution of the Directors:
R Horsburgh P A Little
Director Director
Dated at Melbourne this 8th day of September 2008.
DIRECTORS’ DECLARATION
F O R T H E Y E A R E N D E D 3 0 J U N E 2 0 0 8
For
per
sona
l use
onl
y

TOLL – ANNUAL REPORT 2008 131
INDEPENDENT AUDIT REPORT
T O T H E M E M B E R S O F T O L L H O L D I N G S L I M I T E D
Report on the fi nancial report
We have audited the accompanying fi nancial report of Toll Holdings Limited (the Company), which comprises the balance sheets as at
30 June 2008, and the income statements, statements of recognised income and expense and cash fl ow statements for the year ended
on that date, a description of signifi cant accounting policies and other explanatory notes 1 to 39 and the directors’ declaration set out on
pages 49 to 130 of the Group comprising the Company and the entities it controlled at the year’s end or from time to time during the
fi nancial year.
Directors’ responsibility for the fi nancial report
The directors of the Company are responsible for the preparation and fair presentation of the fi nancial report in accordance with Australian
Accounting Standards (including the Australian Accounting Interpretations) and the Corporations Act 2001. This responsibility includes
establishing and maintaining internal control relevant to the preparation and fair presentation of the fi nancial report that is free from
material misstatement, whether due to fraud or error; selecting and applying appropriate accounting policies; and making accounting
estimates that are reasonable in the circumstances. In note 2, the directors also state, in accordance with Australian Accounting Standard
AASB 101 Presentation of Financial Statements, that the fi nancial report, comprising the fi nancial statements and notes, complies with
International Financial Reporting Standards.
Auditor’s responsibility
Our responsibility is to express an opinion on the fi nancial report based on our audit. We conducted our audit in accordance with Australian
Auditing Standards. These Auditing Standards require that we comply with relevant ethical requirements relating to audit engagements and
plan and perform the audit to obtain reasonable assurance whether the fi nancial report is free from material misstatement.
An audit involves performing procedures to obtain audit evidence about the amounts and disclosures in the fi nancial report. The procedures
selected depend on the auditor’s judgement, including the assessment of the risks of material misstatement of the fi nancial report,
whether due to fraud or error. In making those risk assessments, the auditor considers internal control relevant to the entity’s preparation
and fair presentation of the fi nancial report in order to design audit procedures that are appropriate in the circumstances, but not for the
purpose of expressing an opinion on the effectiveness of the entity’s internal control. An audit also includes evaluating the appropriateness
of accounting policies used and the reasonableness of accounting estimates made by the directors, as well as evaluating the overall
presentation of the fi nancial report.
We performed the procedures to assess whether in all material respects the fi nancial report presents fairly, in accordance with the
Corporations Act 2001 and Australian Accounting Standards (including the Australian Accounting Interpretations), a view which is consistent
with our understanding of the Company’s and the Group’s fi nancial position and of their performance.
We believe that the audit evidence we have obtained is suffi cient and appropriate to provide a basis for our audit opinion.
Independence
In conducting our audit, we have complied with the independence requirements of the Corporations Act 2001.
Auditor’s opinion
In our opinion:
(a) the fi nancial report of Toll Holdings Limited is in accordance with the Corporations Act 2001, including:
(i) giving a true and fair view of the Company’s and the Group’s fi nancial position as at 30 June 2008 and of their performance for the
year ended on that date; and
(ii) complying with Australian Accounting Standards (including the Australian Accounting Interpretations) and the Corporations
Regulations 2001.
(b) the fi nancial report of the Group also complies with International Financial Reporting Standards as disclosed in note 2.
For
per
sona
l use
onl
y

132
Report on the remuneration report
We have audited the Remuneration Report included in pages 21 to 35 of the directors’ report for the year ended 30 June 2008. The directors
of the Company are responsible for the preparation and presentation of the remuneration report in accordance with Section 300A of the
Corporations Act 2001. Our responsibility is to express an opinion on the remuneration report, based on our audit conducted in accordance
with auditing standards.
Auditor’s opinion
In our opinion, the remuneration report of Toll Holdings Limited for the year ended 30 June 2008, complies with Section 300A of the
Corporations Act 2001.
KPMG
Paul Shannon
Partner
Melbourne
8 September 2008
INDEPENDENT AUDIT REPORT C O N T I N U E D
T O T H E M E M B E R S O F T O L L H O L D I N G S L I M I T E D
For
per
sona
l use
onl
y

TOLL – ANNUAL REPORT 2008 133
SHAREHOLDER INFORMATION
Additional information required by the Australian Stock Exchange Listing Rules not elsewhere disclosed in this report. The shareholder
information set out below was applicable as at 26 August 2008.
A. Distribution of shareholders
Analysis of numbers of shareholders by size of share holdings for ordinary securities.
Number Units %
1 – 1,000 44,619 22,453,534 3.46
1,001 – 5,000 40,617 90,269,622 13.93
5,001 – 10,000 5,158 36,884,419 5.69
10,001 – 100,000 2,760 59,077,785 9.12
100,001 – and over 178 439,457,667 67.80
93,332 648,143,027 100.00
There were 3,169 holders with less than a marketable parcel of ordinary shares.
Each ordinary share is entitled to one vote per share.
B. Twenty largest shareholders
The names of the twenty largest shareholders are listed below:
Name Number of Ordinary
Shares Held Percentage of
Issued Shares %
1 National Nominees Limited 74,526,350 11.50
2 HSBC Custody Nominees (Australia) Limited 71,778,380 11.07
3 JP Morgan Nominees Australia Limited 66,982,462 10.33
4 Paul Alexander Little 36,026,444 5.56
5 Citicorp Nominees Pty Limited 26,459,394 4.08
6 Ecapital Nominees Pty Limited Settlement Account 21,308,918 3.29
7 PGA (Investments) Pty Ltd 15,367,200 2.37
8 Cogent Nominees Pty Limited 12,908,152 1.99
9 ANZ Nominees Limited Cash Income Account 11,361,698 1.75
10 Australian Foundation Investment Company Limited 8,000,000 1.23
11 Queensland Investment Corporation 6,444,103 0.99
12 UBS Wealth Management Australia Nominees Pty Ltd 4,907,841 0.76
13 HSBC Custody Nominees (Australia) Limited 4,702,998 0.73
14 UBS Nominees Pty Ltd 4,291,065 0.66
15 AMP Life Limited 3,613,719 0.56
16 Citicorp Nominees Pty Limited (CFSIL Commonwealth Aust Shs 19 A/C) 2,680,107 0.41
17 Camrock (Australia) Pty Limited 2,659,520 0.41
18 Australian Reward Investment Alliance 2,563,472 0.40
19 RBC Dexia Investor Services Australia Nominees Pty Limited 2,442,087 0.38
20 Argo Investments Limited 2,154,281 0.33
Total 381,178,191 58.80
C. Substantial shareholders
The following are substantial shareholders of the Company.
Name Number of Ordinary
Shares Held Percentage of
Issued Shares %
(a) Commonwealth Bank Group 44,334,476 6.87
(b) Paul Alexander Little and related bodies corporate 37,191,800 5.74
For
per
sona
l use
onl
y

134
TEN YEAR SUMMARY
June 1999 June 2000 June 2001
Operating Results ($M)Group Sales 1,296 1,360 1,603 Profi t before Depreciation, Amortisation and Interest (EBITDA) 63 72 101 Depreciation and Amortisation 22 21 30 EBIT 41 51 71 Share of Associates profi t 0 0 0 Net Interest 3 3 5 Profi t before Tax 38 48 66 Income Tax Expense 8 7 16 Operating Profi t after Tax 31 41 49 Profi t from Discontinued Operations (net of income tax)Outside Equity Interests 0 0 0 Profi t Attributable to Members 30 40 49 CPS Dividend/RPS 3 0 0 Ordinary Dividends 12 17 20 Ordinary Payout Ratio (%) (from continuing operations) 44.44 42.50 40.82 Overall Dividend Payout Ratio (%) 50.00 42.50 40.82
Financial Position ($M)Cash 23 27 47 Other Current Assets 144 190 244 Other Non-Current Assets 170 182 349 Future Income Tax Benefi ts 9 5 13 Intangible Assets (Goodwill & Other) 0 0 46 Total Assets 346 404 699 Other Liabilities 170 200 313 Borrowings 50 45 188 Total Liabilities 220 245 501 Net Assets 126 159 198 Outside Equity Interests 0 0 1 Reserves and Retained Profi ts 36 60 89 Paid Up Capital 90 99 108 Total Shareholders Equity 126 159 198
Per Ordinary Share ($) (from continuing operations)Basic Earnings per ordinary share before abnormal itemsBased on weighted average number of shares issued during the year 0.1429 0.1674 0.2000 Based on number of shares issued at the end of the period 0.1102 0.1653 0.1992 Diluted Earnings per share 0.129 0.166 0.1945 Dividend Paid or Declared per share 0.06 0.07 0.08Franking (%) Interim 35 20 60
Final 50 50 70Net Tangible Asset Backing 0.534 0.657 0.618
Analytical Information (from continuing operations)EBITDA to Sales (%) 4.86 5.29 6.30 EBIT to Sales (%) 3.16 3.75 4.43 Group Profi t after Tax to Sales (%) 2.31 2.94 3.06 EBIT to Total Assets (%) 11.85 12.62 10.16 Return on Shareholders Equity (%) 23.81 25.16 24.87 Current Assets to Current Liabilities (X) 0.00 1.17 1.03 EBIT Interest cover (X) 13.67 17.00 14.20 Effective Tax Rate (%) 21.05 14.58 24.24
GearingNet borrowings to Net borrowings + Equity (%) 17.65 10.17 41.59 Net borrowings to Equity (%) 21.43 11.32 71.21
OtherOrdinary SharesWeighted average number of shares on issue during the year 182 239 245 Shares on issue at year end 236 242 246 Preference SharesCumulative Shares on issue at year end 0 0 0
Non Cumulative Shares on issue at year end 0 0 0 Number of ordinary shareholders at year end 4,889 6,992 7,913Number of employees at year end Est 5,635 5,874 8,984
* Adjusted to refl ect continuing operations only following the sale of NZ rail & ferry operations and the demerger of Virgin Blue Australia
For
per
sona
l use
onl
y

TOLL – ANNUAL REPORT 2008 135
June 2002 June 2003 June 2004 June 2005 June 2006 June 2007 June 2008*
2,038 2,570 3,272 3,778 4,894 4,857 5,605 154 202 305 360 545 455 554 53 77 114 126 190 136 168
101 125 191 234 355 320 387 9 31 45 49 34 16 5
12 19 23 28 88 305 33 98 137 213 255 301 30 359 23 30 39 56 58 (7) 104 75 107 174 199 243 37 254
1,249 (945)1 1 5 5 12 7 4
74 106 169 194 231 1,279 (695)0 0 8 16 16 16 16
27 44 66 88 152 204 162 36.49 41.51 39.05 45.36 65.80 555.86 63.55 36.49 41.51 43.79 53.61 65.80 555.86 63.55
48 89 102 152 1,208 1,743 354 293 351 492 487 1,457 833 1,620 727 863 1,454 1,601 5,375 3,188 1,531
14 27 24 19 3 2 73 68 107 102 185 6,627 1,850 1,262
1,150 1,437 2,174 2,444 14,670 7,616 4,840 371 455 661 710 2,293 1,738 1,115 376 351 419 462 6,358 2,257 1,622 747 806 1,080 1,172 8,651 3,995 2,736 403 631 1,094 1,272 6,019 3,621 2,104
2 3 37 39 341 375 42 136 220 335 424 734 753 (493)265 408 722 809 4,944 2,493 2,555 403 631 1,094 1,272 6,019 3,621 2,104
0.2782 0.3581 0.5079 0.5477 0.5939 0.0472 0.3872 0.2691 0.3430 0.5016 0.5394 0.3446 0.0463 0.3863 0.2645 0.3463 0.5010 0.5455 0.6330 1.9739 0.3870
0.10 0.14 0.205 0.265 0.310 0.320 0.250100 100 100 100 100 100 100100 100 100 100 100 100 100
1.218 1.696 3.090 3.294 (0.974) 2.754 1.350
7.56 7.86 9.32 9.53 11.14 9.38 9.89 4.96 4.86 5.84 6.19 7.25 6.58 6.90 3.63 4.12 5.17 5.13 4.72 0.61 4.47 8.78 8.70 8.79 9.57 2.42 4.20 7.99
18.45 16.88 15.45 15.25 3.84 0.82 11.90 1.00 1.05 1.08 0.79 0.42 1.26 1.57 8.42 6.58 8.30 8.36 4.03 1.05 11.68
25.84 28.30 23.21 27.18 21.72 (46.21) 29.53
44.87 29.34 22.47 19.60 46.11 12.43 37.60 81.39 41.52 28.98 24.37 85.56 14.19 60.25
266 296 317 325 362 631 647 275 309 321 330 624 643 648
0 0 2.5 2.5 2.5 2.5 2.5
0 0 0 0 0 0 0 9,473 16,877 25,355 35,881 68,148 84,820 93,3269,764 12,466 17,375 17,545 28,000 27,000 25,000
For
per
sona
l use
onl
y

136
COMPANY DIRECTORY
Directors
Chairman
Ray Horsburgh AM
Managing Director
Paul Little
Executive Directors
Neil Chatfi eld
Non-Executive Directors
Harry Boon
Mark Smith
Barry Cusack
Frank Ford
Secretary
Bernard McInerney
Toll Holdings Limited
Principal Registered Offi ce in Australia
Level 7, 380 St Kilda Road
Melbourne Vic 3004
Telephone: +61 3 9694 2888
Facsimile: +61 3 9694 2880
Website: www.tollgroup.com
Share Register
Computershare Investor Services
Yarra Falls
452 Johnston Street
Abbotsford Vic 3067
Telephone:
– Australia 1300 850 505
– Overseas +61 3 9415 4000
Facsimile: +61 3 9473 2500
Website: www.computershare.com
Stock Exchange Listing
Toll Holdings Limited shares are listed
on the Australian Stock Exchange
The home exchange is in Melbourne
Auditors
KPMG
147 Collins Street
Melbourne Vic 3000
Lead Bankers
National Australia Bank
271 Collins Street
Melbourne Vic 3000
Solicitors
Minter Ellison
Level 23, South Rialto Tower
525 Collins Street
Melbourne Vic 3000
For
per
sona
l use
onl
y

Design by theballgroup.com.au – TOL0143 09/08 Text of this annual report printed on Envi Silk (pages 1-12) and Envi 50/50 (pages 13-136) – Carbon Neutral Paper.
Toll Holdings Limited uses
Greenhouse Friendly™
ENVI Carbon Neutral Paper
ENVI is an Australian Government
certified Greenhouse Friendly™ Product.
For
per
sona
l use
onl
y

T O L L H O L D I N G S L I M I T E D ABN 25 006 592 089
We set the standard for
excellence of integrated logistics
and distribution through total
commitment to quality people
and services, with superior
fi nancial results.
For
per
sona
l use
onl
y