Embed Size (px)
Citation preview

Macquarie Group
Limited
30 July 2020
2020 Annual
General Meeting
For
per
sona
l use
onl
y

2
The material in this presentation has been prepared by Macquarie Group Limited ABN 94 122 169 279 (MGL) and is general background information about Macquarie’s (MGL and its
subsidiaries) activities current as at the date of this presentation. This information is given in summary form and does not purport to be complete. The material contained in this presentation
may include information derived from publicly available sources that have not been independently verified. Information in this presentation should not be considered as advice or a
recommendation to investors or potential investors in relation to holding, purchasing or selling securities or other financial products or instruments and does not take into account your
particular investment objectives, financial situation or needs. Before acting on any information you should consider the appropriateness of the information having regard to these matters,
any relevant offer document and in particular, you should seek independent financial advice. No representation or warranty is made as to the accuracy, completeness or reliability of the
information. All securities and financial product or instrument transactions involve risks, which include (among others) the risk of adverse or unanticipated market, financial or political
developments and, in international transactions, currency risk.
This presentation may contain forward looking statements – that is, statements related to future, not past, events or other matters – including, without limitation, statements regarding our
intent, belief or current expectations with respect to Macquarie’s businesses and operations, market conditions, results of operation and financial condition, capital adequacy, provisions for
impairments and risk management practices. Readers are cautioned not to place undue reliance on these forward looking statements. Macquarie does not undertake any obligation to
publicly release the result of any revisions to these forward looking statements or to otherwise update any forward looking statements, whether as a result of new information, future events
or otherwise, after the date of this presentation. Actual results may vary in a materially positive or negative manner. Forward looking statements and hypothetical examples are subject to
uncertainty and contingencies outside Macquarie’s control. Past performance is not a reliable indication of future performance.
Unless otherwise specified all information is for the year ended 31 March 2020.
Certain financial information in this presentation is prepared on a different basis to the Financial Report within the Macquarie Group Financial Report (“the Financial Report”) for the year
ended 31 March 2020, which is prepared in accordance with Australian Accounting Standards. Where financial information presented within this presentation does not comply with Australian
Accounting Standards, a reconciliation to the statutory information is provided.
This presentation provides further detail in relation to key elements of Macquarie’s financial performance and financial position. It also provides an analysis of the funding profile of Macquarie
because maintaining the structural integrity of Macquarie’s balance sheet requires active management of both asset and liability portfolios. Active management of the funded balance sheet
enables the Group to strengthen its liquidity and funding position.
Any additional financial information in this presentation which is not included in the Financial Report was not subject to independent audit or review by PricewaterhouseCoopers. Numbers
are subject to rounding and may not fully reconcile.
Disclaimer
For
per
sona
l use
onl
y

AgendaChair’s Update Overview of FY20 1Q21 Update
FY21 Outlook Formal Business Glossary
For
per
sona
l use
onl
y

Chair's Update
Peter Warne
For
per
sona
l use
onl
y

5
Chair's Update Overview of FY20 1Q21 Update FY21 Outlook GlossaryFormal BusinessMacquarie I Annual General Meeting I macquarie.com
Introduction
While Macquarie has felt the
effects of this pandemic, the
group remains well placed
because of its diversity of
business mix, geography,
strong capitalisation and well
funded balance sheet, and
a conservative approach
to risk management
While we are focused on addressing immediate needs, we are equally committed to our ongoing responsibilities to all stakeholders:
Protecting the health and welfare of our people
Helping Australian consumers and small businesses deal with sudden change
Supporting the move to remote working and learning
Bolstering resilience in essential community services
Facilitating access to global capital
Addressing community need through philanthropyFor
per
sona
l use
onl
y

6
Chair's Update Overview of FY20 1Q21 Update FY21 Outlook GlossaryFormal BusinessMacquarie I Annual General Meeting I macquarie.com
Macquarie’s response to COVID-19
1. As at 31 Mar 20. 2. BFS, by loan balance as at 30 Jun 20. 3. Dealogic Macquarie Group completed ASX raisings, 1 Apr 20 to 30 Jun 20. Deal values reflect the full transaction value and not an attributed value.
• Gradual, voluntary return to office commenced in certain locations where safe
to do so and in limited numbers to allow for social distancing
• Globally consistent and coordinated move to working remotely, supported by
ongoing commitment to flexible working
• Over 98%1 of staff worked remotely with no notable interruption to client service
• Existing systems have been resilient to large-scale remote working, reflecting
long-term investment in technology
• Candidate engagement, selection, onboarding and training of new hires
(including graduates and interns) has continued without interruption through
virtual communications
• Flexible leave options available to staff to ensure remote working can be
balanced with family and carer responsibilities
• Enhanced wellbeing, communications and training programs to support staff
• Personal Banking and vehicle lease clients have access to a comprehensive
support package, which includes payment pause options without penalty or
impact to credit score
• Business Banking clients able to defer loan repayments for all loans up to
$A10m
• Commenced a holistic communication approach, including a 3 month check-in,
with clients over the term of their payment pause to provide support at this time
• Enhanced approaches to support vulnerable customers
• CGM’s Specialised and Asset Finance (SAF) division provided access to
lending relief for 30k+ SME clients to support business cash flows
– Continued support to all clients from March to June, with asset funding of
$A440m+
• Macquarie Capital supporting clients in raising more than $A11.1b of equity3
• Providing expertise, advice and capital solutions to assist clients and partners
in navigating COVID-19 and related market disruption
Employees Clients
Staff working remotely
>98%Clients accessing assistance2
~13%
For
per
sona
l use
onl
y

7
Chair's Update Overview of FY20 1Q21 Update FY21 Outlook GlossaryFormal BusinessMacquarie I Annual General Meeting I macquarie.com
Macquarie’s response to COVID-19
• Working with MIRA and Macquarie Capital portfolio companies to ensure
robustness of business continuity planning, financial resilience & employee
wellbeing, including projects under construction
• Maximising remote working while maintaining essential community services
and connecting best practice across assets, industries and regions
• Capacity upgrades to MIRA-managed digital infrastructure assets have left
them able to handle significant activity increases resulting from widespread
remote working
• Examples of portfolio company initiatives: AGS Airport’s carparks repurposed
as COVID-19 testing centres in the UK; Spain’s healthcare workers receiving
Personal Protective Equipment from CLH and free parking from Empark; Penn
Foster training nurses in COVID-19 testing, and Dovel Technologies using
analytics to review antiviral clinical trials
• $A20m allocation to Macquarie Group Foundation to help combat COVID-19
and provide relief for its impacts
• To date, the Foundation has allocated $A7.3m to 24 non-profits focused on
direct relief efforts providing critical food, medical support, humanitarian relief
kits and information to a range of vulnerable groups affected by COVID-19
around the world; and a further $A2m has been directed to public health and
clinical research
• The Foundation continues to match staff giving and fundraising to maintain
support for the non-profit community. Additionally, a $A1m fund was created to
assist staff-supported non-profits impacted by COVID-19
• BFS engaging and hiring workers furloughed by other employers to meet
increased short-term customer service demand
• CGM, SAF sourcing computer equipment for North American educators
• Macquarie portfolio companies: Achieve3000 offering 2m low income students
in the US free access to its education platform; INEA providing free internet to
teachers in Poland
Portfolio Companies Community
Daily users of essential services
~100mCOVID-19 donation
$A20m
For
per
sona
l use
onl
y

8
Chair's Update Overview of FY20 1Q21 Update FY21 Outlook GlossaryFormal BusinessMacquarie I Annual General Meeting I macquarie.com
EPS
Operating income
DPS
Financial performance
Profit
6,000
10,000
14,000
FY16 FY17 FY18 FY19 FY20
$Am FY20
$A12,325m
▼3%
ON FY19
4.00
7.00
10.00
FY16 FY17 FY18 FY19 FY20
FY20
$A7.91
▼10%
ON FY19
$A
1,000
2,000
3,000
FY16 FY17 FY18 FY19 FY20
$Am FY20
$A2,731m
▼8%
ON FY19
0.00
3.00
6.00
FY16 FY17 FY18 FY19 FY20
$A FY20
$A4.30
▼25%
ON FY19For
per
sona
l use
onl
y

9
Chair's Update Overview of FY20 1Q21 Update FY21 Outlook GlossaryFormal BusinessMacquarie I Annual General Meeting I macquarie.com
FY20 funded balance sheet initiatives
1. Issuances cover a range of tenors, currencies, product types and are AUD equivalent based on FX rates at the time of issuance and include undrawn facilities. 2. Excludes securitisations. 3. Includes equity. 4. Total customer deposits as per the funded balance sheet ($A67.1b) differs from total deposits as per the statutory balance sheet ($A67.3b). The funded balance sheet reclassifies certain balances to other funded balance sheet categories.
Despite the challenges presented in the final months of our 2020 financial year, our diversity of business mix and geography, strong
capitalisation and well-funded balance sheet, and a conservative approach to risk management has allowed us to be resilient.
• $A1.7b of equity capital raised in 1H20 through $A1.0b institutional placement and $A0.7b share purchase plan
• $A26.0b1 of term funding raised during FY20 with $A7.7b with weighted average life 4.9 years2 in Q4 FY20 including:
Increased proportion of term funding and deposits
• Growth in term liabilities3 as a proportion of balance sheet – 47% at Mar 20 (compared to 45% at Mar 19)
• Customer deposits4 continue to grow – up 20% in FY20, representing 42% of sources at Mar 20 (compared to 40% at Mar 19)
• Short term wholesale issued paper and other short-term debt at 11% of sources at Mar 20 (compared to 15% at Mar 19)
Strong liquidity with Cash, liquids and self-securitised assets comprising 39% of Assets
• Bank Group LCR at 173% and NSFR at 118% at Mar 20
JANUARY
$A2.6b• $US1.25b 5yr MBL USD Public • €0.5b 7yr MGL EUR Public
FEBRUARY
$A4.4b• $A1.8b 5yr MBL AUD Public
• $A1.0b SMART ABS
• $A0.9b PUMA RMBS
• €0.4b 2yr MBL EUR Public
MARCH
$A0.7b• $US0.3b 5yr MGL Samurai
Loan Facility• $Ae0.2b Islamic Finance /
Structured Note
For
per
sona
l use
onl
y

10
Chair's Update Overview of FY20 1Q21 Update FY21 Outlook GlossaryFormal BusinessMacquarie I Annual General Meeting I macquarie.com
FY20 dividend
1. At $A110.47 per share. The DRP pricing period was from 25 May 20 to 5 Jun 20. 2. Subject to any prevailing guidance from APRA.
FY20 ORDINARY DIVIDEND
$A4.30 $A5.75
IN FY19
FROM
(45% franked)
(40% franked)
2H20 ORDINARY DIVIDEND
$A1.80 $A3.60
IN 2H19
FROM
(45% franked)
(40% franked)
2H20 RECORD DATE
DRP shares for
the 2H20 dividend
were issued1
19 May 202H20 PAYMENT DATE
3 Jul 20
FY20 ANNUAL PAYOUT RATIO
Dividend policy
remains 60-80%
annual payout
ratio256%
For
per
sona
l use
onl
y

11
Chair's Update Overview of FY20 1Q21 Update FY21 Outlook GlossaryFormal BusinessMacquarie I Annual General Meeting I macquarie.com
Risk culture and conduct
• Macquarie’s long-established risk culture and our management of conduct risk is well embedded
across all parts of the organisation. Key aspects include:
– Primary responsibility resides at the individual and business unit level
– Strong independent oversight by the Risk Management Group
– Independent and objective risk-based assurance by Internal Audit
• Macquarie’s long track record of unbroken profitability is supported by our risk culture which is
underpinned by our principles of Opportunity, Accountability and Integrity
• The Board is provided with detailed metrics to support its key oversight role in ensuring that the
Macquarie culture is aligned with our risk appetite
• Macquarie’s remuneration framework and consequence management process is designed to
promote accountability, encourage and reward appropriate behaviours and discourage inappropriate
behaviours
– In FY20, there were 164 matters involving conduct/policy breaches which resulted in formal
consequences. Of these, 32 matters resulted in termination of employment and 132 resulted in a
formal warning. In 19 of the 132 matters where a formal warning was issued, the individual
subsequently left Macquarie. These matters were considered to be isolated issues with no
evidence of broader systemic conduct issues
• Senior leader communications have increased through the COVID-19 period, regularly and clearly
reminding staff of ongoing expectations which continue to apply despite the different ways in which
we are working
For
per
sona
l use
onl
y

12
Chair's Update Overview of FY20 1Q21 Update FY21 Outlook GlossaryFormal BusinessMacquarie I Annual General Meeting I macquarie.com
Risk culture and conduct in practiceOperating and Support Groups, Risk Management Group (RMG), Integrity Office and Human Resources work together to maintain our strong risk culture and conduct
The Integrity Office
• Established in 1998 as an internally independent function to allow staff to speak up safely
about misconduct, illegal or unethical behaviour or breaches of the Code of Conduct
• Reports directly to CEO and meets regularly with the Chairman
• Runs the Whistleblower Program and conducts or coordinates investigations into concerns
that are raised. The global Whistleblower Policy is reviewed annually. Significant legislative
changes in Australia were incorporated and the policy was published externally for the first
time
• Integrity Office appointments were made across a number of regions to enhance the reach of
the office
• Continued to work closely with Behavioural Risk, Compliance and Human Resources on
initiatives relating to conduct and culture
• Mandatory training was provided online to all staff globally on the Code of Conduct and the
Whistleblower policy. Additional training was provided to senior staff re identifying and
dealing with whistleblower matters
• The Integrity Office delivered face to face presentations to 5,517 staff across 22 offices on
related matters such as the avenues, support and protections available to those who speak
up, psychological safety and What We Stand For. A new speak up program was developed
for Executive Assistants and an Ethical Leadership Program was created for nominated
people managers
Recent risk culture and
conduct specific initiatives
Expanding the risk culture review capability to include
country-wide reviews and thematic advisory projects e.g. WHS,
cultural due diligence in acquisitions, and a Macquarie COVID-19
risk culture survey
Continued roll out of the Executive Director Leadership Program to
our Senior Leaders; content includes emphasis on the importance
of creating inclusive working environments and their positive impact
on risk culture
Introduced a new Standard and enhanced our monitoring to support
the identification and evaluation of instances where conduct is the
root cause of incidents
Global training program rolled out delivering face to face training to
over 3,200 supervisors across 20+ offices to strengthen their
capability in understanding the role they play in managing conduct
risk and providing effective supervision
For
per
sona
l use
onl
y

13
Chair's Update Overview of FY20 1Q21 Update FY21 Outlook GlossaryFormal BusinessMacquarie I Annual General Meeting I macquarie.com
Environmental, Social and Governance (ESG)
1. GCA: Global Commission on Adaptation; CFLI: Climate Finance Leadership Initiative. 2. TCFD: Taskforce on Climate-related Financial Disclosures; UN PRI: United Nations Principles for Responsible Investment.
Macquarie’s ESG commitment reflects our responsibility to clients, shareholders, communities, our people and the environment in which we operate
• Investing in social infrastructure
• Actively managing social risks including
human rights and modern slavery risk
• Providing a diverse, inclusive workplace
• Seeking to operate harm-free
environments through the maintenance of
high WHS standards and performance
across all our activities
• Engaging Macquarie and its staff in the
wider community
• Strong corporate governance
• Ethical conduct by staff
• Customer advocacy
• Whistleblowing framework
• Anti bribery and anti corruption
• Anti money laundering
• Managing conflicts of interest
• Cyber security and data privacy
• Dealing with 3rd parties and suppliers
• Reporting transparently
• Investing in sustainability solutions and
supporting the global energy transition
• Actively managing environmental risks
including climate change risks
• Engaging in climate leadership initiatives
such as GCA and CFLI1
• Supporting TCFD, UN PRI and other
external ESG standards2
• Promoting sustainable workplaces
• Commitment to the RE100 initiative
Environment Social Governance
For
per
sona
l use
onl
y

14
Chair's Update Overview of FY20 1Q21 Update FY21 Outlook GlossaryFormal BusinessMacquarie I Annual General Meeting I macquarie.com
14
FY20 Key ESG Milestones
More information is also available at macquarie.com/ESG. 1. MW of renewable energy assets in operation or under management reflect 100% generating capacity of each asset, not the proportion owned/managed by Macquarie. 2. Equity investments are reported on a funded balance sheet basis and therefore exclude equity hedge positions and non-controlling interests. Macquarie’s carrying value of its interest in East Anglia ONE Limited is $A2.8b, which has been partially funded with asset-specific borrowings of $A2.3b at 31 Mar 20. Total funded equity investments amount to $A7.4b as at 31 Mar 20 ($A5.9b at 31 Mar 19). 3. Total funded loan assets include loan assets held at amortised cost adjusted to exclude certain items such as assets that are funded by third parties with no recourse to Macquarie. In addition, loan assets at amortised cost per the statutory balance sheet are adjusted to include fundable assets not classified as loans on a statutory basis (e.g. assets subject to operating leases). Total funded loan assets amount to $A86.5b as at 31 Mar 20 ($A82.3b as at 31 Mar 19). 4. Content includes conduct and conduct risk, psychological safety (aimed at staff and supervisors) and ethical decision-making. Macquarie also requires staff to undertake mandatory online Code of Conduct training. 5. Contribution comprises Macquarie Group Foundation matching support for staff donations and fundraising; Foundation donations to commemorate staff attaining 10-year and 25-year anniversaries at Macquarie; Foundation grants to non-profit organisations to recognise 12 months of board service by a Macquarie employee; and Macquarie and Foundation grants to community organisations (including Year 1 donations for the 50th Anniversary Award).
Environmentaland social risk management
Environmental and social financing
Climate change
Sustainability in direct operations
Customer and client experience
Peopleand workplace
Business conduct and ethics
Macquarie Group Foundation
391transactions
assessed under our Environmental and Social Risk (ESR)
Policy in FY20
$A9.0binvested or arranged in renewable energy and
energy efficiency projects in FY20
12,800 MWof renewable energy
assets in operation or under management1
$A20.4brenewable energy
assets under
management
13.6%of total funded equity
investments exposed to renewable energy2
1.3%of total funded loan
assets are exposed to conventional energy3
100%renewable electricity
by 2025
FY20 emissions per capita reduced by
45% from FY10 baseline
(18% reduction from FY19)
Partnerships Gold Award 2019 for
Financial Advisor of the Year
Mozo Experts Choice Awards 2020 for Excellent banking app, Internet banking
and Exceptional everyday account
Canstar Outstanding Value Transaction
Account (2018 and 2019)
3,000classroom events and
350,000online courses and
knowledge tests delivered to our staff
in FY20
Women represent
41%of Macquarie’s workforce and
36%of Board Directors
at 31 Mar 2020
Tailored training, workshops and
leadership-led sessions provided to over
8,700staff4
Code of Conduct
Appropriate
Workplace Behaviour
Privacy
Financial Crime
Business Resilience
Risk in a Remote
Working Environment
Anti-Bribery and
Corruption
$A51mdonated by
Macquarie staff and the
Foundation in FY20
($A410m since
inception in 19855)
1,600non-profit organisations
supported in FY20
46,000hours volunteered
in FY20For
per
sona
l use
onl
y

15
Chair's Update Overview of FY20 1Q21 Update FY21 Outlook GlossaryFormal BusinessMacquarie I Annual General Meeting I macquarie.com
15
Progress on driving solutions on all sources of emissions
Examples of activity from FY20.
Global LNGcapability
Commercial EVinfrastructure
solutions
Invested in the largest residential community solar manager in the US
Acquired Savion – a solar and energy storage developer
Investing in the construction of green affordable housing in Kenya
Financing clean energy projects across South Africa
Financing Spanishsolar plants
Funding energy efficient assets -Australia
Working with the UN Green Climate Fund and the Government to deliver a new green bank in Mongolia
Supporting the development of a
nationwide network of solar farms in India
Developing an onshore wind farm in Sweden
Financing Dutch biomass plants
Constructing UK biogas facility, creating energy from agricultural waste
Developing and constructing a UK energy-from-waste facility
Investing in machine learning and AI to grow presence in sustainable commodities
Physical LNG cargo traded out of London office
Agri fund targeting on farm emissions reduction
Financing commercialrooftop solar in Australia
Reducing agricultural emissions
Investing in waste management
Providing term loan to upgrade Sweden's largest refiner
Solar PV projects in Japan
Offshore wind project off the coast of Taiwan
Investing in Germanoffshore wind farm
Developing two onshore wind farms in Norway
1 GW solar backed by PPAs
Onshore wind portfolio in Mexico
Carbon neutral gas offsets
North America Emissions Trading
Commercial rooftop and ground mounted solar PV systems in the UK
Investing in two offshore wind farms in the UK
Funding operational onshore wind farms in Poland
Funding deployment of smart gas and electricity meters
Synthetic securitisation of £1.1b portfolio of green loans
European Emissions Trading Scheme
Issuing a $US300m Samurai loan facility, including a $US150m green tranche
Integrating a solar and energy storage facility in South Korea
Solar development in South Korea
Offshore wind development in South Korea
Installing five commercial and industrial energy storage systems in South Korean factories
Installing Korea's first floating LiDAR wind resource
For
per
sona
l use
onl
y

16
Chair's Update Overview of FY20 1Q21 Update FY21 Outlook GlossaryFormal BusinessMacquarie I Annual General Meeting I macquarie.com
Diversity & InclusionThe diversity of our people is one of our greatest strengths. An inclusive workplace enables us to embrace diversity to deliver more innovative and sustainable solutions for our clients, shareholders, communities and our people
68 nationalitiesRepresentation of staff at Macquarie
72+ languagesSpoken by Macquarie staff
50/50Gender representation on Intern and Graduate programs
36% female representationon Board of Directors
27% female representationon Executive Committee
95%Macquarie’s global return-to-work rate for staff who have taken parental leave
Diversity & Inclusion awards and partnerships
For
per
sona
l use
onl
y

17
Chair's Update Overview of FY20 1Q21 Update FY21 Outlook GlossaryFormal BusinessMacquarie I Annual General Meeting I macquarie.com
Macquarie in the community
As a company is a member of the society in which it operates, it follows that one of its important duties is to work in a multitude of ways for the betterment of society. In the long run this is consistent with a company’s duty to its shareholders.”
David ClarkeMacquarie Group Chairman 1984–2011
“
$A410m
$A51m
1,600+non-profits supported
46,000+hours volunteered
Macquarie Group Foundation
contributed since 1985
More than
record contribution in FY20
COVID-19
donation fund for organisations providing
relief efforts
Macquarie
Group Collection
Supporting emerging
artists since 1986
Macquarie Sports
Sporting opportunities
for children in regional
and remote communities
since 1999
For
per
sona
l use
onl
y

18
Chair's Update Overview of FY20 1Q21 Update FY21 Outlook GlossaryFormal BusinessMacquarie I Annual General Meeting I macquarie.com
Last Mile Health
Social Finance
Monash University’s
World Mosquito
Program
The Ocean Cleanup
Murdoch Children’s
Research Institute
World Scabies Program 18
For
per
sona
l use
onl
y

19
Chair's Update Overview of FY20 1Q21 Update FY21 Outlook GlossaryFormal BusinessMacquarie I Annual General Meeting I macquarie.com
Supporting COVID-19 relief efforts$A20m allocated to the Foundation to support non-profits working to combat COVID-19 and provide relief to affected communities
To date, the Foundation has allocated $A7.3m
to non-profits focused on direct relief efforts
providing critical food, medical support,
humanitarian relief kits and information to a
range of vulnerable groups affected by
COVID-19 around the world. $A2m has also
been directed to research:
• $A1m to the Burnet Institute for its
large-scale study on isolation/quarantine
and physical distancing, to assist in
restoring economic and recreational activity
• $A1m to the Doherty Institute for its
international Australasian COVID-19 Trial
(ASCOT), which aims to identify the best
treatments for COVID-19 that will reduce
mortality or the need for mechanical
ventilation in hospitalised, but not yet
critically ill patients
For
per
sona
l use
onl
y

20
Chair's Update Overview of FY20 1Q21 Update FY21 Outlook GlossaryFormal BusinessMacquarie I Annual General Meeting I macquarie.com
20
Macquarie’s purpose statement
At Macquarie, our purpose represents what we do and why we exist. Our purpose is:
Empowering people
to innovate and invest
for a better future
What we do – and the way we do it – matters.
Three long-held principles guide how we do business:
Opportunity | Accountability | Integrity
For
per
sona
l use
onl
y
Overview of FY20
Managing Director and Chief
Executive Officer
Shemara Wikramanayake
For
per
sona
l use
onl
y

22
Chair's Update Overview of FY20 1Q21 Update FY21 Outlook GlossaryFormal BusinessMacquarie I Annual General Meeting I macquarie.com
0.0
0.5
1.0
1.5
2.0
2.5
3.0
MQG All Ordinaries Index
100
1,000
10,000
51 years of unbroken profitability
Historical figures converted at FY20 average FX rate for comparative purposes. Macquarie TSR calculations assume continuous listing, and is indexed to 100 on 29 Jul 96, being when MBL shares were first quoted on ASX. The All Ordinaries Accumulation Index (All Ords Index) comprises the 500 largest ASX listed companies by market capitalisation. The TSR chart is displayed on a base-10 logarithmic scale, which displays relative percentage movements over an extended historical timeframe as similar in size, without visually skewing the performance in more recent years. 1. FY70 – FY72 were profitable years. 2. At 31 Mar 20. 3. Ranking refers to TSR against the respective index constituents that have been continuously listed since Macquarie’s inclusion. Source: Bloomberg. Data to 31 Mar 20.
Performance(ASX: MQG)
Total
shareholder return (TSR)2
Earnings
per share CAGR
Dividends
per share CAGR ASX 203
Diversified
Financials3
MSCI World
Capital
Markets3
MSCI
World
Banks3
Since listing 5,019% 11% 11% 3rd 1st 1st 1st
5 year 50% 10% 5% 9th 4th 15th 5th
$A2,731mFY20 profit
TSR %
$Ab
For
per
sona
l use
onl
y

23
Chair's Update Overview of FY20 1Q21 Update FY21 Outlook GlossaryFormal BusinessMacquarie I Annual General Meeting I macquarie.com
FY20 result: $A2,731m down 8% on FY19
2H20
$Am
1H20
$Am
2H20 v
1H20
FY20
$Am
FY19
$Am
FY20 v
FY19
Net operating income (excl. Credit and Other impairment
charges)6,906 6,459 7% 13,365 13,306 -
Net credit impairment charges (661) (144) 359% (805) (320) 152%
Other impairment (charges)/reversals (240) 5 * (235) (232) 1%
Total operating expenses (4,391) (4,480) 2% (8,871) (8,887) -
Operating profit before income tax 1,614 1,840 12% 3,454 3,867 11%
Income tax expense (352) (376) 6% (728) (879) 17%
Effective tax rate1 (%) 21.6 20.5 21.0 22.8
Loss/(profit) attributable to non-controlling interests 12 (7) 5 (6)
Profit attributable to MGL shareholders 1,274 1,457 13% 2,731 2,982 8%
Annualised return on equity (%) 12.7 16.4 23% 14.5 18.0 19%
Basic earnings per share $A3.62 $A4.30 16% $A7.91 $A8.83 10%
Dividend per ordinary share $A1.80 $A2.50 28% $A4.30 $A5.75 25%
1. Calculation of the effective tax rate is after adjusting for the impact of non-controlling interests.
For
per
sona
l use
onl
y

24
Chair's Update Overview of FY20 1Q21 Update FY21 Outlook GlossaryFormal BusinessMacquarie I Annual General Meeting I macquarie.com
Net operating income movement
KEY DRIVERS
• MAM: Increased base fees, performance fees, investment-related & other income, partially offset by lower net operating lease income
• BFS: Growth in average volumes for BFS deposits, loan portfolio, and funds on platform offset by margin compression on deposits and the impact of realigning the wealth advice business to focus on the high net worth segment
• CGM: Strong global client contribution across all products and sectors and higher revenue from Specialised and Asset Finance and Commodities’ lending and financing activities, partially offset by a reduction in inventory management and trading revenues
• Macquarie Capital: DCM fee revenue down, partially offset by higher M&A fee revenue. Investment-related income down on strong asset realisations in FY19
• Corporate: Includes accounting volatility from changes in fair value on economic hedges and higher funding usage by Operating Groups driving increased interest income
• Credit impairment charges: Increased significantly primarily due to a deterioration in current and expected macroeconomic conditions as a result of COVID-19
12,754
12,325
(485)
(3)
531
104
260
10,000
10,500
11,000
11,500
12,000
12,500
13,000
13,500
14,000
FY19Net operating
income
MAM BFS CGM MacCap Corporate CreditImpairment
Charges
OtherImpairment
Charges
FY20Net operating
income
0
(836)
$Am
For
per
sona
l use
onl
y

25
Chair's Update Overview of FY20 1Q21 Update FY21 Outlook GlossaryFormal BusinessMacquarie I Annual General Meeting I macquarie.com
MARKETS-FACING
ACTIVITIES
ANNUITY-STYLE
ACTIVITIES
FY20 net profit contribution from Operating Groups$A5,448m down 11% on FY19
Macquarie Asset Management (MAM)
▲on FY19
Increased base fees, performance fees, investment-related & other income,
partially offset by lower net operating lease income, higher operating expenses
and higher credit and other impairment charges
Macquarie Capital (MacCap)
▼on FY19
DCM fee revenue down, partially offset by higher M&A fee revenue. Investment-
related income down given strong asset realisations in FY19. Higher operating
expenses, funding costs and increased credit and other impairment charges
1. Note certain assets of the Credit Markets business, certain activities of the Cash Equities business and the Commodity Markets and Finance business, and some other less financially significant activities are undertaken from within the Non-Banking Group.
Non-B
ankin
g G
roup
Non-B
ankin
g G
roup
Banking and Financial Services (BFS)
▲on FY19
Growth in average volumes for BFS deposits, loan portfolio, funds on platform and the impact of realigning the wealth advice business to focus on the high net worth segment, offset by margin compression on deposits and higher credit provisions
Commodities and Global Markets1 (CGM)
▲ on FY19
Higher revenue from Specialised and Asset Finance and Commodities’
lending and financing activities
Commodities and Global Markets1 (CGM)
▼ on FY19
Reduction in inventory management and trading revenues and an increase in
credit provisions mostly offset by strong global client contributions across all
products and sectors demonstrating benefits of portfolio diversity
$A3,439m ▲13%
ON FY19 $A2,009m ▼35%
ON FY19
Bankin
g G
roup
Bankin
g G
roup
For
per
sona
l use
onl
y

26
Chair's Update Overview of FY20 1Q21 Update FY21 Outlook GlossaryFormal BusinessMacquarie I Annual General Meeting I macquarie.com
Diversification by regionInternational income 67% of total income1
Total staff2 15,849, International staff 58% of total
Americas EMEA Asia Australia3
1. Net operating income excluding earnings on capital and other corporate items. 2. Includes staff employed in certain operationally segregated subsidiaries throughout the presentation. 3. Includes New Zealand. 4. Includes people employed through MIRA-managed fund assets and investments
where Macquarie Capital holds a significant influence. 5. AUM at 31 Mar 20 has been restated to reflect an immaterial misstatement in total MAM AUM reported on 8 May 20.
25%of total
income
29%of total
income
13%of total
income
33%of total
income
2,756 $A3,018mAssets under management5
$A293.0bEmploying 27,000+ people4
CANADA USA
Calgary Austin Nashville
Montreal Boise New York
Toronto Boston Orlando
Vancouver Chicago Philadelphia
Dallas San Diego
LATIN AMERICA Houston San Francisco
Mexico City Jacksonville San Jose
Sao Paulo Los Angeles Seattle
Santiago Minneapolis Walnut Creek
6,670 $A3,892mAssets under management5
$A116.4bEmploying 7,000+ people4
AUSTRALIA NEW ZEALAND
Adelaide Melbourne Auckland
Brisbane Newcastle
Canberra Parramatta
Gold Coast Perth
Manly Sydney
4,014 $A1,573mAssets under management5
$A67.3bEmploying 50,000+ people4
ASIA
Bangkok Manila
Beijing Mumbai
Gurugram Seoul
Hong Kong Shanghai
Hsin-Chu Singapore
Jakarta Taipei
Kuala Lumpur Tokyo
2,409 $A3,470mAssets under management5
$A122.2bEmploying 57,000+ people4
EUROPE MIDDLE-EAST
Amsterdam Luxembourg Dubai
Braintree Madrid
Coventry Munich SOUTH AFRICA
Dublin Paris Cape Town
Dusseldorf Reading Johannesburg
Edinburgh Solihull
Frankfurt Vienna
Geneva Watford
Limerick Zurich
London
TOTAL INCOME1 TOTAL INCOME1 TOTAL INCOME1 TOTAL INCOME1
For
per
sona
l use
onl
y

27
Chair's Update Overview of FY20 1Q21 Update FY21 Outlook GlossaryFormal BusinessMacquarie I Annual General Meeting I macquarie.com
Business mixAnnuity-style activities represent approximately 63% of the Group’s performance1
Net Profit Contribution2
Comparative figures have been restated to conform to changes in current year financial presentation and group restructures, where necessary. 1. Based on FY20 net profit contribution from Operating Groups, annuity-style businesses represent 54% of the Group’s performance. 2. Net profit
contribution is management accounting profit before unallocated corporate costs, profit share and income tax.
0
500
1,000
1,500
2,000
2,500
3,000
3,500
4,000
4,500
5,000
5,500
6,000
6,500
FY16 FY17 FY18 FY19 FY20
Annuity-style businesses: ◼ Macquarie Asset Management ◼ Banking and Financial Services
Markets-facing businesses:◼ Commodities and Global Markets ◼ Macquarie Capital
$Am
For
per
sona
l use
onl
y

28
Chair's Update Overview of FY20 1Q21 Update FY21 Outlook GlossaryFormal BusinessMacquarie I Annual General Meeting I macquarie.com
Macquarie Asset Management
Note: References relate to the full year ended 31 Mar 20. Net profit contribution is management accounting profit before unallocated corporate costs, profit share and income tax. Pie chart is based on FY20 net profit contribution from operating groups.1. Excludes real estate assets. 2. AUM at 31 Mar 20 has been restated to reflect an immaterial misstatement in total MAM AUM reported on 8 May 20. 3. IPE Real Assets (Jul/Aug 20). 4. Infrastructure Investor 50 2019 (Nov 19). 5. IJ Global Awards Jul 20. 6. Winner of the 2020 Investment Manager of the Year in Australia at the Financial Standard Investment Leadership Awards. 7. Money magazine’s Best of the Best 2020 Awards in Australia. 8. Macquarie held a 50% interest at 31 Mar 20. 9. As at 31 Mar 20, gross of fees.
MIRA
$A149.3bEquity under management
$A21.3b Invested across 62 new
investments
17% on FY19
$A16.7b Equity proceeds from asset
divestments
Sale of Macquarie AirFinance to
a joint venture and entered into
an agreement to provide ongoing
management support services8
$A25.1bEquity to deploy
$A20.1b Equity raised
MIM
$A382.6bAssets under management
6% on FY19
69%of assets under management
outperforming respective
benchmarks on a three-year
basis9
Completed the Foresters assets
acquisition, adding ~$US11b in
First Investors Funds and
~$US1b in assets transitioned
to the recently launched
Delaware Funds by Macquarie
Premier Advisor Platform
Actively manages funds for investors
across multiple asset classes
FY20 Net profit contribution
$A2,177m16%
on FY19
150+ infrastructure
and real assets1
1,890+people
22markets
$A597.7bassets under management2
~40%
Net profit
contribution
FY20 awards
#1 Infrastructure Investment Manager globally3
Investment Manager of the Year 20206
Best Investment Manager 20207
European Ports Deal of the Year (Gdansk Port) &European Utility Deal of the Year (Elenia)5
World’s largest infrastructure manager (No.1 Position)4
For
per
sona
l use
onl
y

29
Chair's Update Overview of FY20 1Q21 Update FY21 Outlook GlossaryFormal BusinessMacquarie I Annual General Meeting I macquarie.com
Banking and Financial Services
Note: References relate to the full year ended 31 Mar 20. Net profit contribution is management accounting profit before unallocated corporate costs, profit share and income tax. Pie chart is based on FY20 net profit contribution from operating groups.1. Funds on platform includes Macquarie Wrap and Vision. 2. BFS deposits exclude corporate/wholesale deposits. 3. Includes general plant & equipment.
$A52.1bHome loan portfolio
35% on Mar 19
$A9.0bBusiness banking loan portfolio
10% on Mar 19
$A79.1b Funds on platform1
8% on Mar 19
$A63.9bTotal BFS deposits2
20% on Mar 19
$A32.7bCMA deposits
20% on Mar 19
$A13.7bAustralian vehicle
finance portfolio3
10% on Mar 19
Rebuilt our tech stack and are the first to offer lending and retail deposits on one core banking system
30+ years bringing innovation and competition to Australian consumers
FY20 awards
Macquarie’s retail banking and financial
services business
FY20 Net profit contribution
$A770m2%
on FY19
~14%
Net profit
contribution
1.6mAustralian clients
2,660people
Personal Banking
Business Banking
Wealth Management Leasing
More thanFor
per
sona
l use
onl
y

30
Chair's Update Overview of FY20 1Q21 Update FY21 Outlook GlossaryFormal BusinessMacquarie I Annual General Meeting I macquarie.com
Commodities and Global Markets
Note: References relate to the full year ended 31 Mar 20, and do not account for the transfer of Cash Equities from Commodities and Global Markets to Macquarie Capital on 1 Jun 20. Net profit contribution is management accounting profit before unallocated corporate costs, profit share and income tax. Pie chart is based on FY20 net profit contribution from operating groups. 1. Platts Q4 CY19. 2. 2020 Energy Risk Awards. 3. Private Debt Investor Awards. 4. SGX General Clearing Member rankings.
Strong contribution from client activity across all
divisions reflecting the strength of the platform and
benefits of portfolio diversity; offset by reduced
inventory management and trading against a strong
prior year as well as an increase in credit provisions
FY20 awards
2020Oil and productsHouse of the Year2
2020Environmental Products, Bank of the Year2
2020Derivatives House of the Year2
NO. 12019 Fund Financier of the Year (Americas)3
SGXTop 5 Commodities and Top 3 Electricity General Clearing Member4
Specialised and Asset FinanceStable portfolio of $A8.5b with
strong growth in lease income from
Technology, Media and Telecoms
Commodity Markets
FuturesClient activity up, with increased
commission in ANZ and the
Americas partially offset by
impairments on a small number of
counterparties
Financial MarketsIncreased revenue contribution
across all regions driven by
expansion of expertise in new
markets as well as favourable
equity markets and associated
client activity
Strong results across the
commodities platform from increased
client hedging activity particularly in
Global Oil, EMEA Gas and Power,
Agriculture, Metals and Mining;
partially offset by reduced inventory
management and trading
Provides clients with access to markets,
financing, financial hedging, research and
market analysis and physical execution
FY20 Net profit contribution
$A1,746mFlaton FY19
~32%
Net profit
contribution
No. 2Physical gas marketer in North America1
2,630+people
200+ products
24markets
For
per
sona
l use
onl
y

31
Chair's Update Overview of FY20 1Q21 Update FY21 Outlook GlossaryFormal BusinessMacquarie I Annual General Meeting I macquarie.com
Macquarie Capital
Note: References relate to the full year ended 31 Mar 20, and do not account for the transfer of Cash Equities from Commodities and Global Markets to Macquarie Capital on 1 Jun 20. Net profit contribution is management accounting profit before unallocated corporate costs, profit share and income tax. Pie chart is based on FY20 net profit contribution from operating groups. 1. Dealogic and IJGlobal for Macquarie Group completed M&A, investments, ECM and DCM transactions converted as at the relevant report date. Deal values reflect the full transaction value and not an attributed value. 2. The Asset Triple A Infrastructure Awards 2019. 3. Infrastructure Partnerships Australia (IPA) 2019 National Infrastructure Awards. 4. Inspiratia (CY19 by deal count and transaction volume). 5. PFI Awards 2019. 6. Dealogic (CY19 announced and completed by deal count).
Advisory and Capital Solutions
Infrastructure and Energy Group
Maintained a leading
market position in ANZ M&A6,
with established niches in
other regions and businesses
Notable deals included:
• Advisor to the supervisory
board of thyssenkrupp AG on
the €17.2b (~$A29b) sale of
its Elevator Technology
business to a consortium led
by Advent, Cinven and RAG
• Sole Financial Advisor to
DuluxGroup on its acquisition
by Nippon Paint Holdings Co
for an enterprise value of
$A4.2b
Continued focus on green
energy with over 250 projects
under development or
construction, with a
development pipeline of
>25GW at 31 Mar 20
Notable deals included:
• Macquarie helped deliver
Taiwan's first commercial
scale offshore windfarm,
Formosa 1. Macquarie is a
developer and equity investor
in Formosa 2 which is
currently under construction.
Together these projects will
generate 504MW of clean
electricity
FY20 awards
NO. 1Global Infrastructure
Financial Advisor4
Asia-Pacific Transport
Deal of the yearCross River Rail5
NO. 1Global Renewables
Financial Advisor4
Renewable Energy
Deal of the yearFormosa 1 Offshore Wind Farm2
Advisory Excellence AwardSydney Metro Martin Place Integrated Station Development3
Advises and invests alongside clients and
partners to realise opportunity; develops and
invests in infrastructure and energy projects
FY20 Net profit contribution
$A755m57%
on FY19
1,540+people
19markets
$A4.2bCapital invested
~14%
Net profit
contribution
$A319bcompleted deals in FY201
For
per
sona
l use
onl
y
32
Chair's Update Overview of FY20 1Q21 Update FY21 Outlook GlossaryFormal BusinessMacquarie I Annual General Meeting I macquarie.com
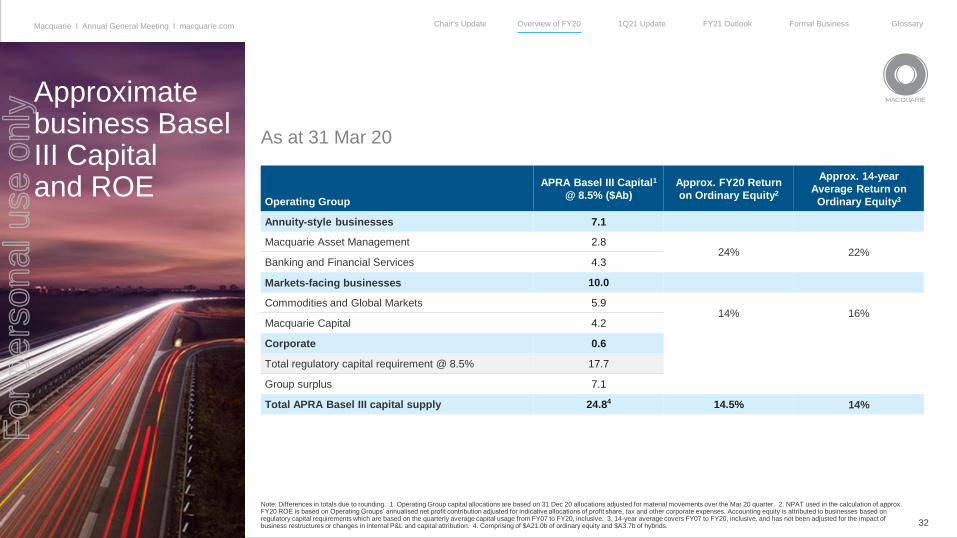
Approximate business Basel III Capital and ROE
As at 31 Mar 20
Note: Differences in totals due to rounding. 1. Operating Group capital allocations are based on 31 Dec 20 allocations adjusted for material movements over the Mar 20 quarter. 2. NPAT used in the calculation of approx. FY20 ROE is based on Operating Groups’ annualised net profit contribution adjusted for indicative allocations of profit share, tax and other corporate expenses. Accounting equity is attributed to businesses based on regulatory capital requirements which are based on the quarterly average capital usage from FY07 to FY20, inclusive. 3. 14-year average covers FY07 to FY20, inclusive, and has not been adjusted for the impact of business restructures or changes in internal P&L and capital attribution. 4. Comprising of $A21.0b of ordinary equity and $A3.7b of hybrids.
Operating Group
APRA Basel III Capital1
@ 8.5% ($Ab)
Approx. FY20 Return
on Ordinary Equity2
Approx. 14-year
Average Return on
Ordinary Equity3
Annuity-style businesses 7.1
Macquarie Asset Management 2.824% 22%
Banking and Financial Services 4.3
Markets-facing businesses 10.0
Commodities and Global Markets 5.914% 16%
Macquarie Capital 4.2
Corporate 0.6
Total regulatory capital requirement @ 8.5% 17.7
Group surplus 7.1
Total APRA Basel III capital supply 24.84 14.5% 14%
For
per
sona
l use
onl
y

33
Chair's Update Overview of FY20 1Q21 Update FY21 Outlook GlossaryFormal BusinessMacquarie I Annual General Meeting I macquarie.com
Business backed by strong funding and capital
The funded balance sheet is a representation of Macquarie’s net funding requirements, and therefore differs from the statutory balance sheet by excluding certain items such as non-recourse self-funded assets and certain accounting gross-ups. 1. ‘Other debt maturing in the next 12 months’ includes Structured notes, Secured funding, Bonds, Other loans, Subordinated debt and Net trade creditors. 2. ‘Debt maturing beyond 12 months’ includes Subordinated debt. 3. Non-controlling interests are netted down in ‘Equity and hybrids’ and ‘Equity investments and PPE’ and ‘Loan assets (incl. op lease) > 1 year’. 4. Hybrid instruments include Macquarie Additional Capital Securities, Macquarie Capital Notes 2, 3 & 4, Macquarie Bank Capital Notes (BCN) (BCN were redeemed in Mar 20) and Macquarie Income Securities (MIS) (MIS were redeemed in Apr 20). 5. ‘Cash, liquids and self-securitised assets’ includes self-securitisation of repo eligible Australian assets originated by Macquarie, a portion of which Macquarie can utilise as collateral in the Reserve Bank of Australia’s Committed Liquidity Facility. 6. ‘Loan Assets (incl. op lease) > 1 year’ includes Debt investment securities. 7. ‘Equity investments and PPE’ includes Macquarie’s co-investments in Macquarie-managed funds and equity investments. 8. Calculated at 8.5% RWA including the capital conservation buffer (CCB), per APRA ADI Prudential Standard 110. Based on materiality, the 8.5% used to calculate the Group capital surplus does not include the countercyclical capital buffer (CCyB) of ~3bps. The individual CCyB varies by jurisdiction and the Bank Group’s CCyB is calculated as a weighted average based on exposures in different jurisdictions. 9. MBL upgraded to A+ on 11 Dec 19.
0
30
60
90
120
150
180
Funding sources Funded assets
Equity and hybrids ³ ⁴ 16%
Debt maturing beyond
12 months ² 31%
Customer deposits 42%
Other debt maturing in the
next 12 months ¹ 8%
Equity investments and PPE 3 7
Loan assets (incl. op lease)
> 1 year 3 6 32%
Loan assets (incl. op lease)
< 1 year 8%
Trading assets 14%
Cash, liquids and
self-securitised assets 5 39%
ST wholesale issued paper 3%
$Ab
MGL funded balance sheet 31 Mar 20
APRA Basel III capital position8
31 Mar 20
Credit ratings31 Mar 20
Group capital surplus
$A7.1bCET1 ratio
12.2%28 years9 23 years 28 years
‘A’ RATED
Current ratings
‘A+’ ‘A2’ ‘A’For
per
sona
l use
onl
y

1Q21 Update
Managing Director and Chief
Executive Officer
Shemara Wikramanayake
For
per
sona
l use
onl
y
35
Chair's Update Overview of FY20 1Q21 Update FY21 Outlook GlossaryFormal BusinessMacquarie I Annual General Meeting I macquarie.com
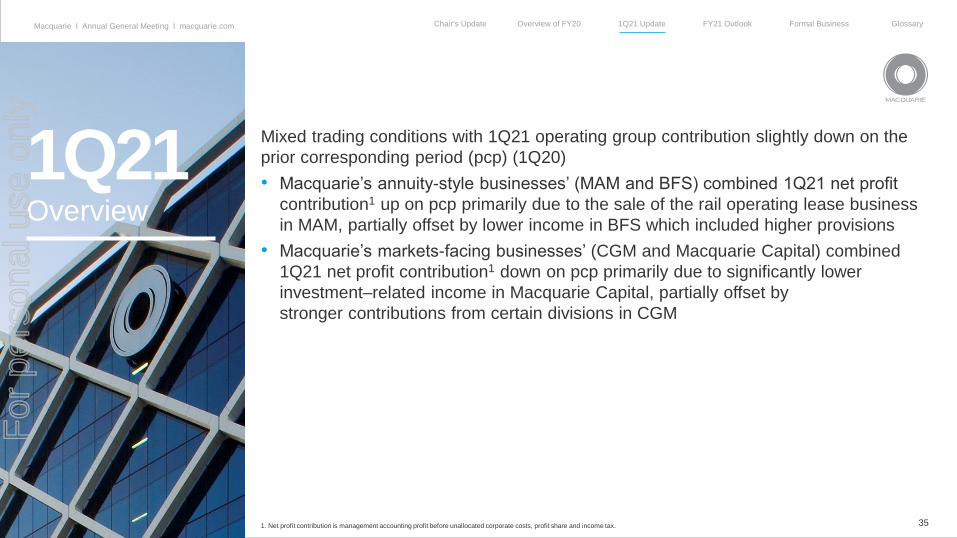
Mixed trading conditions with 1Q21 operating group contribution slightly down on the
prior corresponding period (pcp) (1Q20)
• Macquarie’s annuity-style businesses’ (MAM and BFS) combined 1Q21 net profit
contribution1 up on pcp primarily due to the sale of the rail operating lease business
in MAM, partially offset by lower income in BFS which included higher provisions
• Macquarie’s markets-facing businesses’ (CGM and Macquarie Capital) combined
1Q21 net profit contribution1 down on pcp primarily due to significantly lower
investment–related income in Macquarie Capital, partially offset by
stronger contributions from certain divisions in CGM
1. Net profit contribution is management accounting profit before unallocated corporate costs, profit share and income tax.
1Q21Overview
For
per
sona
l use
onl
y
36
Chair's Update Overview of FY20 1Q21 Update FY21 Outlook GlossaryFormal BusinessMacquarie I Annual General Meeting I macquarie.com
1. Based on FY20 net profit contribution from operating groups as reported on 8 May 20. Net profit contribution is management accounting profit before unallocated corporate costs, profit share and income tax. 2. MIRA’s total EUM includes market capitalisation at measurement date for listed funds, the sum of original committed capital less capital subsequently returned for unlisted funds and mandates as well as invested capital for managed businesses. 3. As at 30 Jun 20, gross of fees. 4. BFS deposits exclude corporate/wholesale deposits. 5. Funds on platform includes Macquarie Wrap and Vision. 6. BFS, by % of loan balance as at 30 Jun 20.
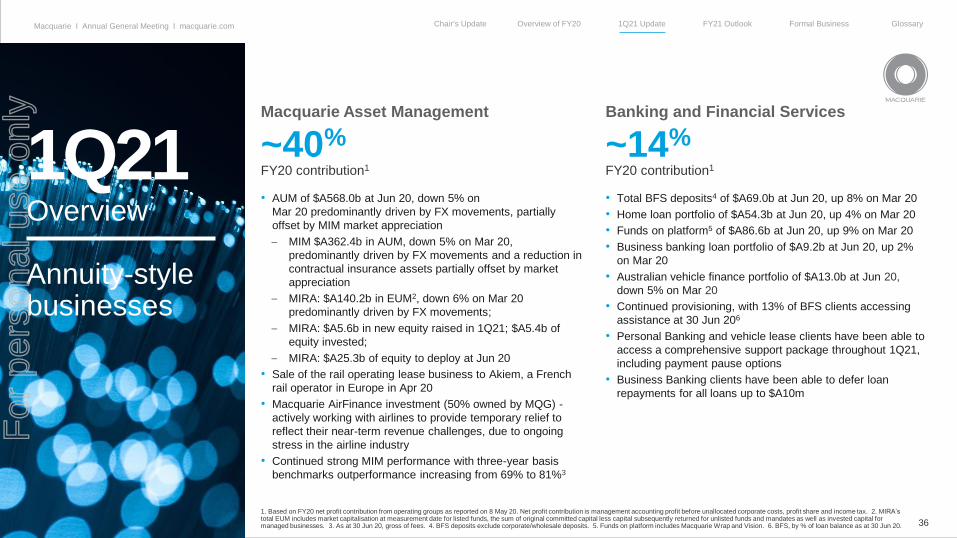
1Q21Overview
Annuity-style businesses
Macquarie Asset Management Banking and Financial Services
~40% ~14%
FY20 contribution1
• AUM of $A568.0b at Jun 20, down 5% on
Mar 20 predominantly driven by FX movements, partially
offset by MIM market appreciation
– MIM $A362.4b in AUM, down 5% on Mar 20,
predominantly driven by FX movements and a reduction in
contractual insurance assets partially offset by market
appreciation
– MIRA: $A140.2b in EUM2, down 6% on Mar 20
predominantly driven by FX movements;
– MIRA: $A5.6b in new equity raised in 1Q21; $A5.4b of
equity invested;
– MIRA: $A25.3b of equity to deploy at Jun 20
• Sale of the rail operating lease business to Akiem, a French
rail operator in Europe in Apr 20
• Macquarie AirFinance investment (50% owned by MQG) -
actively working with airlines to provide temporary relief to
reflect their near-term revenue challenges, due to ongoing
stress in the airline industry
• Continued strong MIM performance with three-year basis
benchmarks outperformance increasing from 69% to 81%3
• Total BFS deposits4 of $A69.0b at Jun 20, up 8% on Mar 20
• Home loan portfolio of $A54.3b at Jun 20, up 4% on Mar 20
• Funds on platform5 of $A86.6b at Jun 20, up 9% on Mar 20
• Business banking loan portfolio of $A9.2b at Jun 20, up 2%
on Mar 20
• Australian vehicle finance portfolio of $A13.0b at Jun 20,
down 5% on Mar 20
• Continued provisioning, with 13% of BFS clients accessing
assistance at 30 Jun 206
• Personal Banking and vehicle lease clients have been able to
access a comprehensive support package throughout 1Q21,
including payment pause options
• Business Banking clients have been able to defer loan
repayments for all loans up to $A10m
FY20 contribution1
For
per
sona
l use
onl
y

37
Chair's Update Overview of FY20 1Q21 Update FY21 Outlook GlossaryFormal BusinessMacquarie I Annual General Meeting I macquarie.com
1. Based on FY20 net profit contribution from operating groups. Net profit contribution is management accounting profit before unallocated corporate costs, profit share and income tax. 2. Platts Q1 CY20. 3. Dealogic and IJGlobal for Macquarie Group completed M&A, investments, ECM and DCM transactions converted as at the relevant report date. Deal values reflect the full transaction value and not an attributed value. 4. Cash Equities transferred from Commodities and Global Markets to Macquarie Capital on 1 Jun 20. 5. 1 Apr to 30 Jun 20 (Dealogic, by value). 6. Dealogic Macquarie Group completed ASX raisings, 1 Apr 20 to 30 Jun 20. Deal values reflect the full transaction value and not an attributed value. 7. Dealogic all exchange raisings completed, 1 Apr 20 to 30 Jun 20. 8. Dealogic completed ASX raisings, 1 Apr 20 to 30 Jun 20. 9. Global Finance 2020, 2019 and 2018. 10. Environmental Finance Sustainable Investment Awards 2020.
1Q21Overview
Markets-facing businesses
Commodities and Global Markets Macquarie Capital
~32% ~14%
FY20 contribution1
• Increased activity as clients sought to rebalance their portfolios to manage risk in a volatile environment. Notwithstanding the strong start, trading conditions more subdued towards the end of the quarter
• Strong contribution from client hedging and trading opportunities across the commodities platform
• Continued client activity in foreign exchange across all regions
• Renewed Commodity Markets and Finance borrowing base facility
• Continued funding education technology infrastructure in Australia and healthcare assets, including robotics, in UK
• Product and client sector diversity continues to be an area of strength
• Maintained ranking as No. 2 physical gas marketer in North America2
• 95 transactions valued at $A77.7b completed globally3, transaction volume up on pcp, with transaction value down on pcp
• Fee revenue down on pcp due to lower fee revenue from M&A and DCM, largely offset by increased ECM activity and strong performance of Equities platform4
• Investment-related income down significantly predominantly due to lower revenue from asset realisations
• No 1 in ANZ for ECM5, supporting clients in raising more than $A11.1b of equity6. Since 1 Apr, the ASX has been the most active exchange in the world7, with more than $A23.4b equity raised8
• Exclusive financial adviser to TPG Telecom Limited on the $A21.3b merger of equals with Vodafone Hutchison Australia, and the demerger of Tuas Limited, TPG’s Singapore mobile business
• ACS Principal Finance committed over $A500m in 1Q21 through focused investing in credit markets and bespoke financing solutions
• Green Investment Group finalised development activities for its first onshore wind project in Norway, the 47 MW Tysvaer Wind Farm, and reached financial close on a portfolio of three onshore wind farms in the Nordics totalling 170 MW capacity. GIG has now supported over 1 GW of onshore wind capacity in the Nordics with Power Purchase Agreements
• World’s Best Investment Bank in Infrastructure for the 3rd consecutive year9
• ESG data initiative of the year: GIG and BNEF’s Carbon Score10
FY20 contribution1
For
per
sona
l use
onl
y

38
Chair's Update Overview of FY20 1Q21 Update FY21 Outlook GlossaryFormal BusinessMacquarie I Annual General Meeting I macquarie.com
Term liabilities exceed term assets
These charts represent Macquarie’s funded balance sheets at the respective dates noted above.1. ‘Other debt maturing in the next 12 months’ includes Structured notes, Secured funding, Bonds, Other loans, Subordinated debt and Net trade creditors. 2. ‘Debt maturing beyond 12 months’ includes Subordinated debt. 3. Non-controlling interests are netted down in ‘Equity and hybrids’ and ‘Equity investments and PPE’ and ‘Loan assets (incl. op lease) > 1 year’. 4. ‘Cash, liquids and self-securitised assets’ includes self-securitisation of repo eligible Australian assets originated by Macquarie, a portion of which Macquarie can utilise as collateral in the Reserve Bank of Australia’s Committed Liquidity Facility. 5. ‘Loan Assets (incl. op lease) > 1 year’ includes Debt investment securities. 6. ‘Equity investments and PPE’ includes Macquarie’s co-investments in Macquarie-managed funds and equity investments.
Funded balance sheet remains strong
30 Jun 2031 Mar 2031 Mar 19
$Ab $Ab $Ab
0
30
60
90
120
150
180
Funding sources Funded assets
Debt maturing beyond
12 months 2 31%
Customer deposits 42%
Other debt maturing in the
next 12 months 1 8%
ST wholesale issued paper 3%
Equity investments and PPE 3,6 7%
Loan assets (incl. op lease)
> 1 year 3,5 32%
Loan assets (incl. op lease)
< 1 year 8%
Trading assets 14%
Cash, liquids and
self-securitised assets 4 39%
0
30
60
90
120
150
180
Funding sources Funded assets
Equity and hybrids 3 16%
Debt maturing beyond
12 months 2 29%
Customer deposits 40%
Other debt maturing in the
next 12 months 1 10%
ST wholesale issued paper 5%
Equity investments and PPE 3,6 6%
Loan assets (incl. op lease)
> 1 year 3,5 35%
Loan assets (incl. op lease)
< 1 year 10%
Trading assets 15%
Cash, liquids and
self-securitised assets 4 34%
Equity and hybrids 3 16%
0
30
60
90
120
150
180
Funding sources Funded assets
Equity and hybrids 3 16%
Debt maturing beyond
12 months 2 28%
Customer deposits 46%
Other debt maturing in the
next 12 months 1 8%
ST wholesale issued paper 2%
Equity investments and PPE 3,6 6%
Loan assets (incl. op lease)
> 1 year 3,5 32%
Loan assets (incl. op lease)
< 1 year 8%
Trading assets 16%
Cash, liquids and
self-securitised assets 4 38%
For
per
sona
l use
onl
y

39
Chair's Update Overview of FY20 1Q21 Update FY21 Outlook GlossaryFormal BusinessMacquarie I Annual General Meeting I macquarie.com
9.2
7.18.1
10.3
(2.1)
(0.6)
(1.1)
0.60.5
1.6
2.2
0.0
2.0
4.0
6.0
8.0
10.0
HarmonisedBasel III
at Mar-20²
APRA Basel III'super equivalence'
APRA Basel IIIat Mar-20
Dividends Ordinary equityissuance (MEREP)
Net hybridissuance³
Business capitalrequirements
Other movements⁴ APRA Basel IIIat Jun-20⁵
APRA Basel III'super
equivalence'⁶
HarmonisedBasel IIIat Jun-20
Basel III capital position • APRA Basel III Group capital at Jun 20 of $A24.2b; Group capital surplus of $A8.1b1
• APRA Basel III CET1 ratio: 13.2%; Harmonised Basel III CET1 ratio: 16.3%
• Other movements include a reduction in the Foreign Currency Translation reserve, which substantially offsets the FX component of the movement in business
capital requirements
1. Calculated at 8.5% RWA including the capital conservation buffer (CCB), per APRA ADI Prudential Standard 110. Based on materiality, the 8.5% used to calculate the Group capital surplus does not include the countercyclical capital buffer (CCyB) of ~1bps. The individual CCyB varies by
jurisdiction and the Bank Group’s CCyB is calculated as a weighted average based on exposures in different jurisdictions. 2. Basel III applies only to the Bank Group and not the Non-Bank Group. ‘Harmonised’ Basel III estimates are calculated in accordance with the BCBS Basel III framework.
3. Bank Capital Notes 2 issuance net of Macquarie Income Securities redemption. 4. Includes current quarter P&L, movements in foreign currency translation and share-based payment reserves and other movements. 5. Pro forma APRA Basel III surplus of $A8.3b, including shares issued on 3 Jul 20
to satisfy the dividend reinvestment plan. 6. APRA Basel III ‘super-equivalence’ includes the impact of changes in capital requirements in areas where APRA differs from the BCBS Basel III framework. Differences include the treatment of mortgages $A1.0b; capitalised expenses $A0.4b; equity
investments $A0.3b; investment into deconsolidated subsidiaries $A0.1b; DTAs and other impacts $A0.4b.
Group regulatory surplus: Basel III (Jun 20)$Ab
Based on 8.5% (minimum Tier 1
ratio + CCB)
When combined with the $A0.2b DRP issuance in Jul-20, total
issuances more than offset the FY20 dividend
For
per
sona
l use
onl
y

40
Chair's Update Overview of FY20 1Q21 Update FY21 Outlook GlossaryFormal BusinessMacquarie I Annual General Meeting I macquarie.com
Business capital requirements1
1Q21 key drivers
MAM
• Mainly sell-down of European rail business
BFS
• Growth in home loan book and business banking downgrades3, partially offset by run-off in vehicles portfolio
CGM
• Reduced derivative and loan exposures, partially offset by downgrades3
Macquarie Capital
• Asset realisations and successful syndication of DCM underwriting positions, largely offset by downgrades3
1. Regulatory capital requirements are calculated at 8.5% RWA. 2. The foreign currency translation reserve (FCTR) forms part of capital supply and substantially offsets FX movements in capital requirements. 3. Counterparties downgraded per Macquarie's internal ratings framework.
$A2.0b increaseover FY20
$A1.4b decreaseover 1Q21
Substantially offset by FCTR2
Substantially offset by FCTR2
$A15.7b
$A17.7b
$A16.1b
(1.5)
(0.1)
(0.5) (0.0)
(1.2)
0.3
0.9
0.8
1.4
0.1
12.0
13.0
14.0
15.0
16.0
17.0
18.0
Mar-19 MAM BFS CGM MacCap FX Mar-20 MAM BFS CGM MacCap FX Jun-20
$Ab
For
per
sona
l use
onl
y

41
Chair's Update Overview of FY20 1Q21 Update FY21 Outlook GlossaryFormal BusinessMacquarie I Annual General Meeting I macquarie.com
Capital management update
Dividend Reinvestment Plan (DRP)
• The Board determined that a 1.5% discount would apply to shares allocated under the DRP for the 2H20 dividend
• On 3 Jul 20, ordinary shares were issued and allocated at $A110.47 per share1 to shareholders participating in the
DRP. Shareholders participating in the DRP held approx. 33.9% of Macquarie's ordinary shares
Macquarie Group Employee Retained Equity Plan (MEREP)
• On 9 Jun 20, a total of 5,024,608 Macquarie ordinary shares were issued pursuant to the Macquarie Group
Employee Retained Equity Plan (MEREP). The shares were issued and allocated at $A112.151 per share
Additional Tier 1 Capital
• MBL repaid $A400m of Macquarie Income Securities (MIS) on 15 Apr 20
– MIS were issued in 1999 and receive transitional treatment under APRA’s prudential standards that results in
reducing capital recognition. The repayment reduced Tier 1 capital by $A93m
• On 2 Jun 20, MBL issued 6,410,270 Macquarie Bank Capital Notes 2 (BCN2) at an issue price of $A100 each,
raising $A641m
• The BCN2 offer included the Securityholder Offer which received applications exceeding $A420m. This strong
demand necessitated the scaling of the applications to approximately 33% which is in line with the average scaling
applied to applications received under the Broker Firm Offer. The total allocation for the Securityholder Offer was
$A141m
Loss Absorbing Capital - Tier 2 Capital
• On 28 May 20, Macquarie Bank Limited issued $A750m of 10 year subordinated notes with a 5-year non-call period
• On 3 Jun 20, Macquarie Bank Limited issued $US750m of 10 year subordinated notes
1. The DRP price was determined in accordance with the DRP Rules, being the arithmetic average of the daily volume-weighted average price of all Macquarie Group shares sold through a normal trade on the ASX automated trading system of the 10 business days from 25 May 20 to 5 Jun 20 inclusive, less a discount of 1.5%. The price at which the shares to satisfy the MEREP requirements were issued was calculated in the same manner and over the same pricing period as the DRP shares, excluding the 1.5% discount.
For
per
sona
l use
onl
y

42
Chair's Update Overview of FY20 1Q21 Update FY21 Outlook GlossaryFormal BusinessMacquarie I Annual General Meeting I macquarie.com
13.2%
16.3%
0.0%
3.5%
7.0%
10.5%
14.0%
17.5%
CET1 ratio
118%
85.0%
90.0%
95.0%
100.0%
105.0%
110.0%
115.0%
120.0%
125.0%
NSFR
189%
40.0%
70.0%
100.0%
130.0%
160.0%
190.0%
LCR ²
6.0%
6.6%
0.0%
1.5%
3.0%
4.5%
6.0%
7.5%
Leverage ratio
Strong regulatory ratios
Bank Group (Jun 20)
1. ‘Harmonised’ Basel III estimates are calculated in accordance with the BCBS Basel III. 2. Average LCR for Jun 20 quarter is based on an average of daily observations. 3. Includes the capital conservation buffer in the minimum CET1 ratio requirement. APRA has released a draft update to
'Prudential Standard APS 110 Capital Adequacy' proposing a minimum requirement for the leverage ratio of 3.5% effective Jan 23.
Bank Group (Harmonised ¹) Bank Group (APRA) Basel III minimum ³
For
per
sona
l use
onl
y

43
Chair's Update Overview of FY20 1Q21 Update FY21 Outlook GlossaryFormal BusinessMacquarie I Annual General Meeting I macquarie.com
Regulatory update
Australia
• On 30 Mar 20, APRA announced the deferral of its scheduled implementation of the Basel III reforms in Australia by one year to allow ADIs to focus
on maintaining operations and providing credit to the Australian economy1
• The status of the relevant regulatory changes is shown in the table below, noting that APRA announced (on 23 Mar 20) that it does not plan to recommence
consultation on any non-essential matters to finalise revisions to the prudential framework before 30 Sep 202
1. ‘APRA announces deferral of capital reform implementation’; 30 Mar 20. 2. ‘APRA adapts 2020 agenda to prioritise COVID-19 response’; 23 Mar 20. 3. ‘APRA announces new commencement dates for prudential and reporting standards’; 16 Apr 20. 4. ‘APRA updates regulatory approach to loans subject to repayment deferral’; 8 Jul 20. 5. ‘APRA updates guidance on capital management for banks and insurers’; 29 Jul 20.
Regulatory Change Status Original compliance date Revised compliance date
APS 110 (Leverage ratio) Draft standard released 21 Nov 19 2022 2023
APS 111 (Capital treatment of subsidiaries) Draft standard released 15 Oct 19 2021 No update
APS 112 (Standardised credit risk) Draft standard released 12 Jun 19 2022 2023
APS 113 (IRB credit risk) Draft mortgages standard released 12 Jun 19 2022 2023
APS 115 (Operational risk) Standard finalised 11 Dec 19 2021 2023
APS 116 (FRTB) Waiting for draft standard to be released 2023 2024
APS 117 (IRRBB) Draft standard released 4 Sep 19 2022 2023
APS 222 (Associations with related entities)3 Standard finalised 20 Aug 19 2021 2022
Transparency, comparability and flexibility Waiting for draft standard to be released 2022 2023
• On 8 Jul 20, APRA extended the temporary capital treatment for bank loan repayment deferrals from six months to ten months, or until 31 Mar 21, whichever comes first.
Under the temporary capital treatment, repayment deferral periods are not treated as periods of arrears for capital adequacy purposes4
• On 29 Jul 20, APRA updated its guidance provided in April 2020 on capital management. The updated guidance indicated that for the remainder of 2020, banks should seek
to retain at least half of their earnings when making decisions on capital distributions (and utilise initiatives to at least partially offset the impact of capital distributions where
possible), conduct regular stress testing to inform decision-making and demonstrate ongoing lending capacity; and make use of capital buffers to absorb the impacts of
stress, and continue to lend to support households and businesses5
• As previously noted, APRA is in discussions with Macquarie on resolution planning and intragroup funding. These discussions are progressing and Macquarie will continue
working on these initiatives in consultation with APRA
• Based on the current information available, it is Macquarie’s expectation that it will have sufficient capital to accommodate likely additional regulatory Tier 1 capital
requirements as a result of the above changes, noting that some of them are at an early stage of review and hence the final impact is uncertain
Germany
• Macquarie continues to respond to requests for information about its historical activities as part of the ongoing, industry-wide investigation in Germany relating to
dividend trading
• In total, the German authorities have designated as suspects approximately 100 current and former Macquarie staff, most of whom are no longer at Macquarie
• The total amount at issue is not material and MGL has provided for the matter
For
per
sona
l use
onl
y

FY21 Outlook
Managing Director and Chief
Executive Officer
Shemara Wikramanayake
For
per
sona
l use
onl
y

45
Chair's Update Overview of FY20 1Q21 Update FY21 Outlook GlossaryFormal BusinessMacquarie I Annual General Meeting I macquarie.com
Factors impacting short-term outlook
Annuity-style businesses
Non-B
ankin
g G
roup Macquarie Asset Management (MAM)
• Base fees expected to be broadly in line
• Net Other Operating Income1 expected to be significantly down, due to expected delays in timing of asset sales
• Increased support for some airline clients of Macquarie AirFinance
Bankin
g G
roup Banking and Financial Services (BFS)
• Higher deposit and loan portfolio volumes
• Platform volumes subject to market movements
• Competitive dynamics to drive margin pressure
• Ongoing provisioning given a continued focus on supporting clients through COVID-19
1. Net Other Operating Income includes all operating income excluding base fees. 2. Note certain assets of the Credit Markets business and certain activities of the Commodity Markets and Finance business, and some other less financially significant activities are undertaken from within the Non-
Banking Group.
Markets-facing businesses
Non-B
ankin
g G
roup Macquarie Capital (MacCap)
• Transaction activity continues, with challenging markets expected to reduce the number of successful transactions and increase the time to completion. Strong ECM activity in Australia through 1Q21 not expected to continue
• Investment-related income expected to be significantly down on FY20 driven by lower asset realisations considering market conditions, but positioned to benefit from market recovery
Bankin
g G
roup Commodities and Global Markets2 (CGM)
• Strong client activity not expected to continue in 2Q21, albeit volatility may continue to create opportunities
• Consistent contribution from Specialised and Asset Finance linked to stable balance sheet and annuity flows
• Product and client sector diversity expected to provide some support through uncertain economic conditions in 1H21
Corporate
• Compensation ratio expected to be within the range of historical levels • The FY21 effective tax rate is expected to be within the range of recent outcomes
For
per
sona
l use
onl
y

46
Chair's Update Overview of FY20 1Q21 Update FY21 Outlook GlossaryFormal BusinessMacquarie I Annual General Meeting I macquarie.com
Short-term outlook
Market conditions are likely to remain challenging, especially given the significant and
unprecedented uncertainty caused by the worldwide impact of COVID-19 and the uncertain
speed of the global economic recovery
The extent to which these conditions will adversely impact our overall FY21 profitability is
uncertain, making short-term forecasting extremely difficult. Accordingly we are currently
unable to provide meaningful earnings guidance for the year ahead
The range of factors that will influence our short-term outlook include:
• The duration and severity of the COVID-19 pandemic
• The uncertain speed of the global economic recovery
• Global levels of government support for economies
• The completion rate of transactions and period-end reviews
• Geographic composition of income
• The impact of foreign exchange
• Potential regulatory changes and tax uncertainties
• Market conditions and the impact of geopolitical events
We continue to maintain a cautious stance, with a conservative approach to capital, funding
and liquidity that positions us well to respond to the current environment
For
per
sona
l use
onl
y

47
Chair's Update Overview of FY20 1Q21 Update FY21 Outlook GlossaryFormal BusinessMacquarie I Annual General Meeting I macquarie.com
Medium-term outlook
Macquarie remains well-positioned to deliver superior performance in the medium term
Deep expertise in major markets
Build on our strength in business and geographic diversity and continue to adapt our
portfolio mix to changing market conditions
• Annuity-style income is primarily provided by two Operating Groups’ businesses
which are delivering superior returns following years of investment and acquisitions
– Macquarie Asset Management and Banking and Financial Services
• Two markets-facing businesses well positioned to benefit from improvements in
market conditions with strong platforms and franchise positions
– Commodities and Global Markets and Macquarie Capital
Ongoing program to identify cost saving initiatives and efficiency
Strong and conservative balance sheet
• Well-matched funding profile with minimal reliance on short-term wholesale funding
• Surplus funding and capital available to support growth
Proven risk management framework and culture
For
per
sona
l use
onl
y

48
Chair's Update Overview of FY20 1Q21 Update FY21 Outlook GlossaryFormal BusinessMacquarie I Annual General Meeting I macquarie.com
Medium term
Annuity-style businesses
Non-B
ankin
g G
roup Macquarie Asset Management (MAM)
• Leading specialist global asset manager, well-positioned to respond to current market conditions. Strongly placed to grow assets under management through its diversified product offering, track record and experienced local investment teams
Bankin
g G
roup Banking and Financial Services (BFS)
• Growth opportunities through intermediary and direct retail client distribution, platforms and client service
• Opportunities to increase financial services engagement with existing business banking clients and extend into adjacent segments
• Modernising technology to improve client experience and support growth
1. Note certain assets of the Credit Markets business and certain activities of the Commodity Markets and Finance business and some other less financially significant activities are undertaken from within the Non-Banking Group.
Markets-facing businesses
Non-B
ankin
g G
roup Macquarie Capital (MacCap)
• Positioned to benefit from recovery in M&A and capital markets activity
• Continues to tailor the business offering to current opportunities and market conditions including providing flexible capital solutions across sectors and regions
• Opportunities for project development and balance sheet investment by the group and in support of partners and clients subject to market conditions
Bankin
g G
roup Commodities and Global Markets1 (CGM)
• Opportunities to grow commodities business, both organically and through acquisition
• Development of institutional and corporate coverage for specialised credit, rates and foreign exchange products
• Tailored financing solutions globally across a variety of industries and asset classes
• Continued investment in asset finance portfolio
• Growing client base across all regions
For
per
sona
l use
onl
y
Formal Business
Peter Warne
For
per
sona
l use
onl
y

Macquarie Group
Limited
30 July 2020
2020 Annual
General Meeting
For
per
sona
l use
onl
y

Glossary
For
per
sona
l use
onl
y

52
Chair's Update Overview of FY20 1Q21 Update FY21 Outlook GlossaryFormal BusinessMacquarie I Annual General Meeting I macquarie.com
Glossary$A / AUD Australian Dollar CET1 Common Equity Tier 1
$US / USD United States Dollar CFM Commodities and Financial Markets
£ / GBP Pound Sterling CGM Commodities and Global Markets
€ Euro CLF Committed Liquidity Facility
1H20 Half-Year ended 30 September 2019 CMA Cash Management Account
1Q21 First Quarter ended 30 June 2020 CRM Customer Relationship Management
2H19 Half-Year ended 31 March 2019 CY19 Calendar Year ending 31 December 2019
2H20 Half-Year ended 31 March 2020 DCM Debt Capital Markets
ABN Australian Business Number DPS Dividends Per Share
ADI Authorised Deposit-Taking Institution DRP Dividend Reinvestment Plan
AGS Aberdeen Glasgow Southampton DTA Deferred Tax Asset
ALX Atlas Arteria ECAM Economic Capital Adequacy Model
AML Anti-Money Laundering ECM Equity Capital Markets
ANZ Australia and New Zealand EMEA Europe, the Middle East and Africa
Approx. Approximately EPS Earnings Per Share
APRA Australian Prudential Regulation Authority EUM Equity Under Management
ASX Australian Stock Exchange FX Foreign Exchange
AUM Assets under Management FY16 Full Year ended 31 March 2016
BCBS Basel Committee on Banking Supervision FY17 Full Year ended 31 March 2017
BFS Banking and Financial Services FY18 Full Year ended 31 March 2018
CAF Corporate and Asset Finance FY19 Full Year ended 31 March 2019
Capex Capital Expenditure FY20 Full Year ended 31 March 2020
CCB Capital Conservation Buffer FY21 Full Year ended 31 March 2021
For
per
sona
l use
onl
y

53
Chair's Update Overview of FY20 1Q21 Update FY21 Outlook GlossaryFormal BusinessMacquarie I Annual General Meeting I macquarie.com
GlossaryGIFII Macquarie Global Infrastructure Fund 2 MQA Macquarie Atlas Roads
GIG Green Investment Group MREI Macquarie Real Estate Investments
GLL GLL Real Estate Partners MSIS Macquarie Specialised Investment Solutions
IPO Initial Public Offering MW Mega Watt
IRB Internal Ratings-Based NGLs Natural gas liquids
IFRS International Financial Reporting Standards No. Number
IT Information Technology NPAT Net Profit After Tax
KMGF Korea Macquarie Growth Fund NPC Net Profit Contribution
LBO Leveraged Buyout NSFR Net Stable Funding Ratio
LCR Liquidity Coverage Ratio OTC Over-The-Counter
LNG Liquefied Natural Gas P&L Profit and Loss Statement
M&A Mergers and Acquisitions PPE Property, Plant and Equipment
MacCap Macquarie Capital PPP Public Private Partnership
MAM Macquarie Asset Management RBA Reserve Bank of Australia
MBL Macquarie Bank Limited RHS Right Hand Side
MD&A Management Discussion & Analysis ROE Return on Equity
MEIF Macquarie European Infrastructure Fund 1 RWA Risk Weighted Assets
MEIF3 Macquarie European Infrastructure Fund 3 SBI State Bank of India
MEREP Macquarie Group Employee Retained Equity Plan SME Small and Medium Enterprise
MGL / MQG Macquarie Group Limited SMSF Self Managed Super Fund
MIC Macquarie Infrastructure Corporation SAF Specialised and Asset Finance
MIDIS Macquarie Infrastructure Debt Investment Solutions UK United Kingdom
MiFID Markets in Financial Instruments Directive US United States of America
MIM Macquarie Investment Management VaR Value at Risk
MIP Macquarie Infrastructure Partners Fund 1 WHS Work Health and Safety
MIRA Macquarie Infrastructure and Real Assets YoY Year on Year
For
per
sona
l use
onl
y