Embed Size (px)
Citation preview

APPENDIX 4E – PRELIMINARY FINAL REPORT Financial year ended 30 June 2018
1
August 22, 2018 ASX: WSA
Reporting Period The reporting period is the financial year ended 30 June 2018. The previous corresponding period is 30 June 2017. Results for announcement to the market
% Change Amount A$’000
Revenue from ordinary activities Up 16% to 248,268
Net profit from ordinary activities after tax attributable to members of Western Areas Ltd Down 39% to 11,837
Net profit after tax attributable to members of Western Areas Ltd Down 39% to 11,837
Dividends A fully franked dividend of 2.0 cents per ordinary share has been declared for the year ended 30 June 2018.
Amount per security Unfranked amount per security
Franked amount per security
% CFI
Financial year ended 30 June 2018
Final dividend 2.0 cents Nil 2.0 cents 0%
Interim dividend Nil Nil Nil 0%
Financial year ended 30 June 2017
Final dividend 2.0 cents Nil 2.0 cents 0%
Interim dividend Nil Nil Nil 0%
Ex‐Dividend date for FY18 Final Dividend 13 September 2018
Record Date for FY18 Final Dividend 14 September 2018
Payment Date for FY18 Final Dividend 5 October 2018 Dividend Reinvestment Plan The Company does not operate a dividend reinvestment plan.
Net Tangible Asset Backing
Current year Previous year
The net tangible assets per security 183.4 cents 170.7 cents Investments in Controlled Entities Wholly Owned and Controlled Subsidiaries of Western Areas Ltd:
BioHeap Ltd Western Platinum NL Australian Nickel Investments Pty Ltd Western Areas Nickel Pty Ltd Western Areas Employee Share Trust
For
per
sona
l use
onl
y

APPENDIX 4E – PRELIMINARY FINAL REPORT Financial year ended 30 June 2018
2
Investments in Associates & Joint Ventures Associates of Western Areas Ltd did not contribute to the result of the consolidated group for the financial year ended 30 June 2018. Associates of Western Areas Ltd:
Grid Metals Corp (formerly Mustang Minerals Corp) 12.1% (Canadian Entity) Audit Review & Accounting Standards This report is based on Consolidated Financial Statements that have been subject to a full Audit by the Company’s Auditor. All entities incorporated into the Consolidated Group’s result were prepared under AIFRS. Other Information The income statement, statement of financial position, statement of cash flows and associated notes are contained in the financial statements in the attached Financial Report for the year ended 30 June 2018. Other detailed commentary on the variation between the results for the year ended 30 June 2018 and the comparative period is provided in the Directors Report of the Financial Report.
Except for the matters noted above, all the disclosure requirements pursuant to ASX Listing Rule 4.3A are contained within Western Areas Limited 30 June 2018 Consolidated Financial Statements which accompany this Preliminary Final Report. Date: 22 August 2018
Daniel Lougher Managing Director
For
per
sona
l use
onl
y

FINFO30
NANCOR TH
JUNE
IAL RE YEA
E 2018
REPORAR EN8
RT NDED
For
per
sona
l use
onl
y

Western Areas Ltd & Controlled Entities ABN 68 091 049 357
Page 2 of 77
CONTENTS
DIRECTORS REPORT ................................................................................................................................. 3
AUDITOR’S INDEPENDENCE DECLARATION ........................................................................................... 24
CONSOLIDATED STATEMENT OF PROFIT OR LOSS AND OTHER COMPREHENSIVE INCOME ................ 25
CONSOLIDATED STATEMENT OF FINANCIAL POSITION ......................................................................... 26
CONSOLIDATED STATEMENT OF CHANGES IN EQUITY .......................................................................... 27
CONSOLIDATED STATEMENT OF CASH FLOWS ...................................................................................... 28
NOTES TO THE FINANCIAL STATEMENTS ............................................................................................... 29
DIRECTORS DECLARATION ..................................................................................................................... 72
INDEPENDANT AUDITOR’S OPINION ..................................................................................................... 73
For
per
sona
l use
onl
y

Western Areas Ltd & Controlled Entities ABN 68 091 049 357
Page 3 of 77
DIRECTORS REPORT
The Directors of Western Areas Limited present the financial report of the Company for the financial year ended 30 June 2018. Unless noted, all amounts in this report refer to Australian dollars. In order to comply with the provisions of the Corporations Act 2001, the Directors’ report follows:
Information about the Directors
The following persons were directors of Western Areas Ltd for the entire financial year and up to the date of this report unless otherwise stated.
Ian Macliver BCom, FCA, SF Fin, FAICD
Non‐Executive
Independent Chairman
Director Appointed
October 2011
Mr Macliver is a highly experienced listed company director and Chartered Accountant with significant experience as a senior executive and director of both resource and industrial companies, with particular responsibility for company strategy development, capital raising and all other forms corporate development initiatives. Mr Macliver is Executive Chairman of Grange Consulting Group Pty Limited which provides specialist corporate advisory services to both listed and unlisted companies.
Committee responsibilities:
• Member of the Audit & Risk, Remuneration, Nomination and Treasury Committee
Other current listed company directorships:
• Otto Energy Ltd (since January 2004)
o Member of Audit & Risk Committee
o Member of Remuneration Committee
o Member of Nomination Committee
Former listed company directorships in last three years:
• Rent.com.au Ltd (ceased June 2015)
o Chairman of the Board
Daniel Lougher BSc. (Mining Geology) Msc. Eng, MAusIMM
Managing Director
& CEO
Director Appointed
May 2008
Mr Lougher is a qualified Mining Geologist and Mining Engineer with over 35 years experience in all facets of mining project exploration, feasibility, development and operational activities in Australia and overseas. Mr Lougher’s experience covers a diverse range of commodities including gold, platinum and copper.
Committee responsibilities:
• Member of the Nomination Committee
Other current listed company directorships:
• N/A
Former listed company directorships in last three years:
• Bluejay Mining Plc (formally FinnAust Mining Plc) (ceased March 2016)
o Chairman of the Board
• Mustang Minerals Corp (ceased October 2015)
Other relevant experience:
• Extensive training in Mine, Planning and Geotechnical Engineering (Chamber of Mines, South Africa
• WA Mines Manager Certificate
For
per
sona
l use
onl
y

Western Areas Ltd & Controlled Entities ABN 68 091 049 357
Page 4 of 77
David Southam BCom, CPA, MAICD
Executive
Director
Director Appointed
November 2010
Mr Southam is a Certified Practicing Accountant with over 25 years experience in accounting, banking and finance across the resources and industrial sectors. Mr Southam has been responsible for completing significant capital management initiatives and commodity offtake contracts with large domestic and international companies.
Committee responsibilities:
• N/A
Other current listed company directorships:
• Kidman Resources Ltd (Nominee Director on behalf of Western Areas Limited) (since July 2017)
o Chairman of Audit & Risk Committee
o Member of Remuneration & Nomination Committee
• Ramelius Resources Limited (Non‐Executive Director) (since 1 July 2018)
o Chairman of Audit & Risk Committee
o Member of Remuneration & Nomination Committee
Former listed company directorships in last three years:
• Troy Resources Ltd (ceased December 2016)
o Member of Audit and Nomination & Remuneration Committee
• Sundance Resources Ltd (ceased January 2016)
o Member of Audit Committee
Other relevant experience:
• Member of the Curtin University Audit & Risk Committee
Richard Yeates BSc (Geology),
MAusIMM, GAICD
Non‐Executive
Independent Director
Director Appointed
October 2009
Mr Yeates is an experienced international mining executive with 36 years industry experience, variously in the fields of mineral exploration, project management, feasibility studies, project finance audits, project development and transactions. He was a founding director, major shareholder and principal consultant of Resource Service Group (RSG), subsequently RSG Global and Coffey Mining, growing a boutique Goldfields consulting entity into an international enterprise over a 20 year period, culminating in the business sale to Coffey International Limited (now Intech) in 2006. Mr Yeates experience covers a wide range of commodities (including tin, tungsten, gold, copper, lead zinc, nickel, coal and mineral sands), in 39 countries on five continents.
Committee responsibilities:
• Chairman of the Nomination Committee
• Member of the Remuneration Committee
Other current listed company directorships:
• Middle Island Resources Ltd (since March 2010)
o Managing Director and CEO
o Member of Remuneration Committee
o Member of Nomination Committee
Former listed company directorships in last three years:
• Independent Non‐Executive Director, Atherton Resources Ltd (formerly Mungana Goldmines Limited) (ceased December 2015)
o Member of Audit & Risk Committee
o Member of Remuneration Committee
o Member of Nomination Committee
Other relevant experience:
• Director, Austmine (ceased October 2009)
• Director, Australia‐Africa Mining Industry Group (AAMIG, now AAMEG) (ceased November 2016)
• Member, Swick Mining Services Limited R&D Advisory Board (current)
For
per
sona
l use
onl
y
Western Areas Ltd & Controlled Entities ABN 68 091 049 357
Page 5 of 77
Craig Readhead B.Juris, LL.B, FAICD
Non‐Executive
Independent Director
Director Appointed
June 2014
Mr Readhead is a lawyer with over 30 years legal and corporate advisory experience with specialisation in the resources sector, including the implementation of large scale mining projects both in Australia and overseas. Mr Readhead had a distinguished legal career specialising in mining and corporate law.
Committee responsibilities:
• Chairman of the Audit, Risk and Treasury Committee
Other current listed company directorships:
• Beadell Resources Ltd (since April 2010)
o Member of the Remuneration, Nomination & Diversity and Audit & Risk Committee
o Formerly Chairman of the Board (ceased July 2018)
• Eastern Goldfields Ltd (since March 2013)
• Redbank Copper Ltd (since April 2013)
Former listed company directorships in last three years:
• General Mining Corporation Ltd (ceased October 2015)
Other relevant experience:
• Formerly President of the Australian Mining and Petroleum Law Association
• Previously a member of the WA Council of the Australian Institute of Company Directors
Tim Netscher BSc (Eng) (Chemical),
BCom, MBA, FIChE, CEng, MAICD
Non‐Executive
Independent Director
Director Appointed
August 2014
Mr Netscher is an experienced international mining executive with extensive operational, project development, transactional and sustainability experience gained in senior executive and board roles over many years. His key executive positions during the past 25 years included Managing Director and CEO of Gindalbie Metals Ltd, Senior Vice President Asia Pacific Region of Newmont Inc., Managing Director of Vale Coal Australia, President of P T Inco and Executive Director of Refining & New Business at Impala Platinum Ltd. Mr Netscher’s experience covers a wide range of resources including nickel, coal, iron ore, uranium and gold in Africa, Asia and Australia.
Committee responsibilities:
• Chairman of the Remuneration Committee
• Member of the Audit, Risk and Treasury Committee
Other current listed company directorships:
• Gold Road Resources Limited (since September 2014) o Chairman o Member of Audit & Risk Committee o Member of Remuneration & Nomination Committee
• St Barbara Limited (since February 2014) o Chairman of the Health, Safety, Environment and Community Committee o Member of the Audit and Risk Committee o Member of the Remuneration and Nomination Committee
Former listed company directorships in last three years:
• Chairman, Toro Energy Limited (ceased September 2016) o Member of Audit & Risk Committee o Member of Remuneration Committee
• Chairman, Deep Yellow Limited (ceased December 2015) o Member of Audit & Risk Committee o Member of Remuneration Committee
Other relevant experience: • Director, Queensland Resources Council • Director, Minerals Council of Australia • Director, Chamber of Minerals and Energy of Western Australia
For
per
sona
l use
onl
y

Western Areas Ltd & Controlled Entities ABN 68 091 049 357
Page 6 of 77
Natalia Streltsova MSc, PhD (Chem Eng), GAICD, MSME, MCIM
Non‐Executive
Independent Director
Director Appointed
January 2017
Dr Streltsova is a Chemical Engineer with over 25 years' experience in the minerals industry. She has a strong background in mineral processing and metallurgy with specific expertise in nickel, gold and base metals. Dr Streltsova has held various leadership and technical roles with major mining houses including Vale SA, BHP Billiton and WMC Resources Limited. She has broad international experience, both in technical and in business development capacities, covering projects in Australia, Africa, South America and in the countries of the Former Soviet Union.
Committee responsibilities:
• Member of the Nomination Committee
Other current listed company directorships:
• Neometals Ltd (since April 2016)
o Chairman of the Risk Committee
o Member of the Audit, Nominations and Remuneration Committees
• Parkway Minerals NL (since June 2015)
o Chairman of the Nomination Committee
o Member of the Audit & Risk and Remuneration Committees
Other relevant experience: • Director, CRC Parker Centre Limited
Company Secretary
Mr Belladonna is a Certified Practicing Accountant and has been employed at Western Areas Limited since 2005, originally as Financial Controller and then as the Company Secretary and Chief Financial Officer. In his time at the Company he has been intimately involved in the accounting, debt financing, corporate governance, risk management, capital raising and financial initiatives at the Company. Mr Belladonna has over 15 years experience in the resources industry including listed gold and base metal companies in a range of management positions.
Interests in Shares and Options of the Company
Full details of the Directors’ shareholdings in Western Areas are included in the Remuneration Report section of this Directors’ report.
Remuneration of Key Management Personnel
Information about the remuneration of directors and senior management is set out in the Remuneration Report of this Directors’ Report on page 13.
Performance Rights Granted to Key Management Personnel
Performance Rights granted to directors and senior management during the financial year ended 30 June 2018 is set out in the Remuneration Report of this Directors’ Report on page 17.
Indemnification of Officers and Directors
During the financial year, the parent entity paid a premium under a contract insuring all Directors and Officers of the Company against liability incurred in that capacity. Disclosure of the nature of liabilities insured and the premium is subject to a confidentiality clause under the contract of insurance.
The Company has not otherwise, during or since the end of the financial year, except to the extent permitted by law, indemnified or agreed to indemnify an officer or auditor of the Company against a liability incurred as such an officer or auditor.
For
per
sona
l use
onl
y

Western Areas Ltd & Controlled Entities ABN 68 091 049 357
Page 7 of 77
Directors’ Benefits
No Directors of the Consolidated Entity have, since the end of the previous financial year, received or become entitled to receive a benefit (other than a benefit included in the total amount of emoluments received or due and receivable by Directors shown on page 21 of the Directors’ Report) by reason of a contract made by the parent entity or a related body corporate with the director or with any entity in which the director has a substantial financial interest, with the exception of benefits that may be deemed to have arisen in relation to the transactions entered into in the ordinary course of business as disclosed in Note 28 to the accounts.
Directors’ Meetings
The following table sets out the number of meetings of the parent entity’s Directors and meetings of the sub‐committees of the Board held during the year ended 30 June 2018 and the number of meetings attended by each Director.
Meetings of CommitteesDirectors Meetings
Audit & Risk Mgmt
Remuneration Nomination Treasury
Meetings held : 11 3 2 1 1
Meetings attended :
I Macliver 11 3 2 1 1
D Lougher 11 ‐ ‐ 1 ‐
D Southam 11 ‐ ‐ ‐ ‐
R Yeates 11 ‐ 2 1 ‐
C Readhead 11 3 ‐ ‐ 1
T Netscher 11 3 2 ‐ 1
N Streltsova 10 ‐ ‐ 1 ‐
Proceedings on behalf of the Company
No person has applied for leave of the Court to bring proceedings on behalf of the Company or intervene in any proceedings to which the Company is a party for the purpose of taking responsibility on behalf of the Company for all or any part of those proceedings.
The Company was not a party to any such proceedings during the year.
Dividends Paid or Recommended
In respect of the financial year ended 30 June 2018, the Board of Directors declared a final fully franked dividend of 2 cents to the holders of fully paid ordinary shares on 22 August 2018.
In relation to the 30 June 2017 financial year the Board declared a final 2 cent fully franked dividend on 22 August 2017 and paid to shareholders on 6 October 2017.
Subsequent Events
The Board of Directors, on 22 August 2018, declared a final fully franked dividend of 2 cents to the holders of fully paid ordinary shares.
Other than matters detailed above, there have been no subsequent events after 30 June 2018 which have a material effect on the financial statements for the year ended 30 June 2018.
Principal Activities
The principal activities of the Consolidated Entity during the year consisted of mining, processing and sale of nickel sulphide concentrate, the continued assessment of development feasibility of the high grade nickel mines and the exploration for nickel sulphides and other base metals.
For
per
sona
l use
onl
y

Western Areas Ltd & Controlled Entities ABN 68 091 049 357
Page 8 of 77
Review of Operations
Operational metrics
The Company continues to strongly operate in line with plan and achieved its published guidance metrics which were updated during the year. Detailed quarterly operating reports are provided throughout the year outlining quarterly and year to date production, cost, sales and operating metrics, some of which are shown below.
Financial Year ‐ Physical Summary
FY18 FY17
Tonnes Mined Tns 607,120 591,778
Nickel Grade (average) % 4.0% 4.4%
Tonnes Milled Tns 616,598 617,808
Milled Grade (average) % 4.0% 4.2%
Recovery % 87% 89%
Nickel in Concentrate Tns 21,060 23,005
Nickel Sales in Concentrate Tns 20,549 22,639
Total ore mined was materially in line with the prior year, whilst head grade delivered materially matched the estimated Ore Reserve grades. The Spotted Quoll mine produced 346,455 tonnes of ore at a grade of 4.2% nickel, with Flying Fox producing 260,665 ore tonnes at an average grade 3.9%.
The nickel concentrator treated a total of 616,598 tonnes of ore during FY18, continuing to operate well above its 550,000 tonne per annum name plate capacity. As planned, year on year milled grade and nickel production were slightly lower as a result of the mines producing at Ore Reserve grades and completion of the remaining ore‐sorter material (sourced from low grade Flying Fox stockpiles) in the first half of the financial year. The overall result of the ore sorter campaign was very positive increasing ore stockpile volumes and allowing flexibility in selecting the optimum mill feed blends.
Significant asset construction activity to enhance the operational capacity at Forrestania was completed during the year. The main items included the Mill Recovery Enhancement Project (MREP), that utilises the Company’s 100% owned Bioheap™ technology, and the return airway shaft at the Spotted Quoll underground mine, including the mechanical fitout. The Spotted Quoll return airway is the final significant infrastructure capital item required to support the life of the Spotted Quoll mining, outside of regular sustaining underground mine development.
For
per
sona
l use
onl
y

Western Areas Ltd & Controlled Entities ABN 68 091 049 357
Page 9 of 77
Financial Metrics Income Statement
Full Financial Year – Earnings Results Summary
FY18 FY17 Change
$m $m $m
Revenue 248.3 213.9 34.4
EBITDA1 84.0 84.9 (0.9)
EBIT 18.5 18.6 (0.1)
Profit Before Tax 17.2 17.4 (0.2)
Net Profit After Tax 11.8 19.3 (7.5)
The A$34.4m increase in Revenue was due to the higher average nickel price for the year at A$7.53/lb (FY17 A$6.11/lb), which was partially offset by a reduction in sales volumes.
Earnings before Interest, Tax, Depreciation and Amortisation (EBITDA) and Profit Before Tax were consistent with the prior year. Underlying this result was a significant increase in earnings from ordinary business activities, that was offset by two non‐recurring material transactions in the prior year being:
1) The sale of the Company’s investment in Bluejay Mining Plc (A$25.6m); and 2) Recognition of the share based consideration received from Kidman Resources Ltd (A$7.5m).
When excluding these one off prior year items, year on year underlying EBITDA increased by $32.1m and underlying Net Profit after Tax increased by $23.4m.
Net Profit After Tax was $7.5m lower than the prior year due to the increased earnings from ordinary mining activities that resulted in an increased taxation expense (A$7.3m) as underlying business earnings are subject to normal corporate income tax.
Statement of Cash Flows
Full Financial Year – Cashflow Summary
FY18 FY17 Change
$m $m $m
Revenue 237.2 226.8 10.4
Payments to suppliers (154.0) (157.7) 3.7
Other ___(6.2) __(2.9) (3.3)
Net Operating Cashflow 77.0 66.2 10.8
Sale of investments 0.0 32.6 (32.6)
Capital Purchases ___(59.8) __(34.0) (25.8)
Net Investing Cashflow (59.8) (1.4) (58.4)
Net Financing Cashflow (5.8) (0.2) (5.6)
Net Cashflow 11.3 64.6 (53.3)
Cash At Bank 151.6 140.3 11.3
1 EBITDA is a not defined by International Financial Reporting Standards. As such it is a Non‐IFRS performance measure.
For
per
sona
l use
onl
y

Western Areas Ltd & Controlled Entities ABN 68 091 049 357
Page 10 of 77
Net cash flow of A$11.3m resulted in A$151.6m cash at bank at year end. The free cashflow result was generated as a result of an increase in nickel sales receipts resulting from a higher average nickel price for the year and the continued focus on absolute cost management and control. The absolute free cashflow result is an excellent achievement in the context of the significant year on year increase in capital and development expenditure at the current production assets located at Forrestania and investment into the Company’s organic growth projects.
Net operating cashflow increased by A$10.8m primarily due to the higher average nickel price and lower payments to suppliers during the year.
The significant year on year change in Investing Cashflow, primarily relates to investments in production assets at Forrestania, such as the Mill Recovery Enhancement Project and completion of the Spotted Quoll Return Airway Shaft. The year on year variance is also materially affected by the absences of the non‐recurring sale of the investment in Bluejay Mining Plc (A$32.6m) that occurred in the prior year.
The year on year change in net financing cashflow was due to the reintroduction of a final dividend related to the FY17 financial results which was paid in the first half of FY18.
Statement of Financial Position
Full Financial Year ‐ Balance Sheet Summary
FY18 FY17 Change
$m $m $m
Current Assets 208.7 181.2 27.5
Total Assets 571.9 518.9 53.0
Current Liabilities 47.8 29.8 18.0
Total Liabilities 83.1 59.6 23.5
Net Equity 488.8 459.3 29.5
Current assets increased primarily due to the cash at bank increasing by A$11.3m and the ore stockpile inventory value increasing by A$13.5m. The increase in inventory value related to both mined ore stockpiles and finished concentrate awaiting shipment at year end.
The increase in non‐current assets primarily relates to the favourable revaluation of the Company’s shareholding in Kidman Resources Ltd, which increased in value by A$21.8m during FY18. Furthermore, non‐current asset investment increased with construction of capital assets at the Forrestania Nickel Operation and the Odysseus early works program at Cosmos. Amortisation charges against mine properties of A$47.1m was partly offset by new development expenditure of A$34.0m. Exploration and evaluation expenditure of A$10.6m was capitalised during the year as the Company continued to invest in exploration at Cosmos, Forrestania and Western Gawler. Total assets as at the reporting date were A$571.9m, representing an increase of A$53.0m as compared to the prior year.
Total liabilities of A$83.1m represented an increase of A$23.5m from the prior year as a result of a general increase in operating and capital works across the group, which results in higher average payable balances, and an increased deferred tax liability related to a reduction in offsetting deferred tax assets.
Total equity attributable to the shareholders increased by A$29.5m to A$488.8m, mainly due to a significant increase in the revaluation reserve related to the Company’s investment in Kidman Resources Limited and NPAT of A$11.8m partly offset by the dividend paid during the year related to the FY17 earnings result.
For
per
sona
l use
onl
y

Western Areas Ltd & Controlled Entities ABN 68 091 049 357
Page 11 of 77
Material Business Risks
Western Areas is faced with economic and non‐economic risks associated with achieving its business strategy and goals. An existing risk management framework formally deals with risk to ensure that the control environment is appropriate having consideration for the level of risk exposure. The senior management team regularly report to the Board on key material risks and the quality of their controls to ensure they exist within the Board’s risk appetite.
Strategic Long Term Economic Risks (2 – 5 years) • Exploration Risk
Organic growth is a key strategic pillar, and we therefore accept the inherent risks associated with mineral exploration. Our exploration program is focussed on highly prospective tenements within the regions of Forrestania, the Cosmos Nickel Complex and the West Gawler region. It is believed that these regions will provide us with the best opportunity to grow our near mine Resources, and establish new mining areas for the Company. The Company cannot control the risk of there being no economic resources within the ground we are exploring, however we apply advance exploration techniques and geological knowledge to provide the best and most cost‐effective way to confirm the existence of economic resources.
• Metal & Currency Markets The Company has no influence over the movement in the nickel price, or foreign exchange rates. Western Areas does at time hedge a portion of expected nickel sales and foreign exchange exposures in line with the board approved treasury management policy. Though the Company does not hedge 100% of the exposure, and believe it is not prudent to do so, a high level of operating and commercial discipline is practiced, which has in the past resulted in the generation of free cash flows for the business. Western Areas remains one of the lowest cost nickel producers and is debt free, which provides a significant buffer against the adverse effects of a deterioration in nickel market fundamentals.
• Inorganic Growth & Investment Western Areas’ strategy includes investment in business development activities (joint ventures, mergers, acquisitions, innovation) to enhance our current project portfolio. Business development opportunities remain tightly contested, however we are debt free and continue to generate positive cash flow from the Forrestania Nickel Operation. Western Areas is in a competitive position to pursue business development opportunities that can provide the best possible value for our shareholders.
Operating Risks • Business Interruption A significant disruption to Forrestania Nickel Operations could have a significant adverse effect
on Western Areas’ operating revenue. The Forrestania Nickel Operations consist of the Spotted Quoll and Flying Fox mines, the Cosmic Boy concentrator and associated infrastructure. There are some single line exposures in our production chain, including the primary supply of electricity from a third‐party provider. A significant failure event at one of the single line exposures has the potential to significantly reduce nickel production and consequent revenue from nickel sales. In recent times, bushfires have exposed our operations to some delays and downtime particularly in relation to infrastructure connected to our operations (power lines and roads). Forrestania Nickel Operations has well established risk and business continuity management practices that prevent and respond to known business interruption risks.
Within our corporate environment we have made significant strides to enhance the protection of the Company’s information technology systems and data.
For
per
sona
l use
onl
y

Western Areas Ltd & Controlled Entities ABN 68 091 049 357
Page 12 of 77
• Counter Parties Western Areas relies on a number of contractor entities to support exploration, mining, logistics and maintenance activities. The financial failure of one of our key contractors (e.g. a mining contractor) could result in interruptions to production plans, and affect our operating costs. Western Areas practices a high level of due diligence prior to awarding a contract, and actively manage our supply chain partners. The Company believes in building relationships with our supply chain partners to generate long term value.
• New Technology/Markets There is inherent risk of developing new production lines and the Company has been working with offtake partners to establish appetite for offtake for an enhanced value in use high grade concentrate product that can be utilised within the growing electric vehicle (EV) battery market. The Mill Recovery Enhancement Project is new technology that is facilitating the entry into new markets, while realising greater recoveries from nickel tonnes mined by monetising what would once be sent to waste.
Sustainability Risks • Safety & Health
The safety and well‐being of people undertaking activities on behalf of the Company remains an absolute priority. There are a number of inherent hazards associated with exploration, mining and mineral processing that require ongoing management and assurance to ensure our safety performance is in line with the high standards we expect. Western Areas continues to demonstrate excellence in safety performance, and continues to work with its contractors and partners to make Western Areas a safe place.
Western Areas’ values the contribution of our people and have put in place the required systems and support to motivate, empower, and reward our people.
• People The attraction and retention of skilled personnel is an emerging risk attributed to the increase in mining and project activity within West Australia and abroad, along with a loss of capacity within the West Australian job market due to the recent downturn and an aging workforce. With the growing optimism within the natural resource industry, the demand for good quality people will continue to be challenging.
Western Areas focuses on recognising and rewarding performance to incentivise individuals, and maintaining a positive, supportive and open communication to foster a culture of learning and development. The Western Areas employment offering is an attractive proposition for the skills, experience and expertise the Company requires.
• Compliance The Company has a number of statutory and regulatory obligations to fulfil including corporate,
financial, health and safety, environmental, land management, tenure, and human resources. Western Areas readily accepts that fulfilling compliance obligations is a necessary part of maintaining its license to operate. The governance framework and compliance management practices are built into roles and responsibilities, planning processes and day to day activities. Compliance is an accepted part of Western Areas culture.
• Stakeholders Western Areas is committed to being a proactive member in the communities where it operates, recognising the needs of all stakeholder groups and engaging with them to seek positive outcomes. This includes working closely with relevant government departments, traditional owners, pastoralists, businesses, and community members to ensure there is ongoing support for the Company’s activities.
For
per
sona
l use
onl
y

Western Areas Ltd & Controlled Entities ABN 68 091 049 357
Page 13 of 77
REMUNERATION REPORT (AUDITED)
This report outlines the remuneration arrangements in place for Key Management Personnel (KMP) which includes Non‐Executive Directors and Executives of Western Areas Ltd. The remuneration structures of Western Areas have been extremely well supported by its shareholders based on the Annual General Meeting (AGM) voting results, and the Company has been mindful to monitor market standards and conditions closely. Given the level of support and acceptance, there have been no material changes in remuneration practices or incentive programmes during the 2018 financial year (FY18).
Key points/changes for FY18
• The Remuneration Report resolution at the 2017 AGM was incredibly well supported with 99% of votes cast supporting the resolution;
• Continuation of the highly successful $1,000 tax exempt share plan offering to all staff (excluding KMP), aligning all staff to shareholder outcomes and encouraging employees to act like owners of the business;
• Following an improvement in market conditions, corporate performance, increasing competition for talent and positive commodity price outlook, a staged reversal of the 10% base salary reduction for the Executive Directors’ and Key Management Personnel was implemented during the FY18 ‐ The initial base salary reduction was implemented in March 2016; and
• A partial reversal of the 10% reduction in Non‐executive Directors’ remuneration was agreed with effect from 1 January 2018. The Non‐executive Directors salaries still remain reduced by 5%, which was first implemented in March 2016.
The report is comprised of the following key sections:
• Section A: Who this report covers • Section B: Remuneration governance and philosophy • Section C: Use of remuneration consultants • Section D: Executive remuneration framework • Section E: Link between performance and remuneration outcomes • Section F: Non‐executive director remuneration • Section G: Service contracts • Section H: Details of remuneration
SECTION A: WHO THIS REPORT COVERS
The following people acted as directors of the Company during the financial year:
Mr I Macliver Independent Non‐Executive Chairman Mr D Lougher Managing Director Mr D Southam Executive Director Mr R Yeates Independent Non‐Executive Director Mr C Readhead Independent Non‐Executive Director Mr T Netscher Independent Non‐Executive Director Mrs N Streltsova Independent Non‐Executive Director
Other ‘KMP’s of the Company during the financial year were:
Mr J Belladonna Chief Financial Officer & Company Secretary Mr W Jones General Manager Operations
For
per
sona
l use
onl
y

Western Areas Ltd & Controlled Entities ABN 68 091 049 357
Page 14 of 77
SECTION B: REMUNERATION GOVERNANCE AND PHILOSOPHY
The Remuneration Committee is responsible for assisting the Board in fulfilling its responsibilities relating to the remuneration of Directors, the Managing Director and KMP, remuneration practices, strategies and disclosures generally to ensure that the Company’s remuneration policy:
• Reflects the competitive global market in which we operate; • Retains staff throughout commodity price cycles, which is crucial to ensure achievement of
corporate goals and objectives; • Rewards individuals based on performance across a range of disciplines that apply to
delivering results and executing strategies for the Company; • Links executive remuneration to the creation of shareholder value; and • Remuneration arrangements are equitable, fair and facilitate the deployment of senior
management across the Company.
Remuneration levels and other terms of employment are reviewed at least annually by the Remuneration Committee, having regard to performance against goals set each year, qualifications and experience, relevant market conditions and independent remuneration benchmarking reports. SECTION C: USE OF REMUNERATION CONSULTANTS
Western Areas engaged PwC as Remuneration Consultants during FY18 to provide assistance with documentation management and ongoing market trend monitoring and development in relation to the Long Term Incentive (“LTI”) plans. No ‘remuneration recommendations’ as defined in the Corporation Act 2001 were made or supplied by PwC. SECTION D: EXECUTIVE REMUNERATION FRAMEWORK
The Company’s Executive reward structure provides a combination of fixed and variable pay, and is comprised of: • Fixed remuneration, inclusive of base pay, superannuation, allowances, and salary‐sacrifice
component; • Short term incentives; and • Long term incentives. Remuneration element
Description Performance metrics
Potential opportunity
Changes for FY19
Fixed remuneration
Inclusive of base pay, superannuation, allowances and salary‐sacrifice component
Nil Positioned at median against market
Reviewed, in line with market positioning
STI Cash bonus on achievement of individual and Company key performance indicators (‘KPIs’)
KPIs used span across key focus areas of the business (operations, corporate, resource replenishment and exploration)
40% ‐ 55% of base salary
N/A
LTI Performance Rights Relative TSR over a 3 year period measured against a custom peer group consisting of 24 companies.
50% to 100% of base salary
N/A
For
per
sona
l use
onl
y

Western Areas Ltd & Controlled Entities ABN 68 091 049 357
Page 15 of 77
Remuneration mixes
The relative proportion of target FY18 total remuneration packages split between fixed and variable remuneration is shown below:
The target remuneration mix of higher level KMP has been designed with emphasis on LTI exposure. This further aligns Executives with shareholders and a focus on long term value generation.
In the event of serious misconduct or a material misstatement in the Company's financial statements, the Remuneration Committee can cancel or defer performance based remuneration that has not yet been vested or paid. There is currently no formal claw back of performance based remuneration paid in prior financial years. It is noted that senior Executives have a balanced blend of physical, financial, mineral resource and exploration targets included in their key performance indicators, which limits the potential reward payable based on achieving financial targets alone to trigger STI payments.
Fixed remuneration
The fixed remuneration component is reviewed annually by the Remuneration Committee. Base salary for each Executive is benchmarked against market data for comparable roles in the market.
Following a near two year 10% reduction in KMP base salaries, the discount was reversed in a staged manner during the financial year. The discount was first implemented in March 2016. In assessing the removal of the discount, the Remuneration Committee considered the overall Company performance, earnings and cashflow outcomes, reinstatement of a final dividend, the increasingly competitive employee market and the positive commodity price outlook.
Short term incentive (‘STI’)
It is the Company’s policy to cap STI payments at a targeted STI level. The percentage is applied against the relevant Executive’s base salary only and excludes all allowances and superannuation. It is noted that all STI targets for FY18 were based off the 5% reduced base salary level.
The full list of KPIs set for Executives in FY18 is below. For each Executive, KPIs relevant to their area of influence are selected from the list below and assigned each year.
42% 46% 46% 55%
21% 23% 23%20%
37% 31% 31% 25%
0%
20%
40%
60%
80%
100%
Mr D Lougher Mr D Southam Mr J Belladonna Mr W Jones
Fixed Remuneration Target STI Target LTI
For
per
sona
l use
onl
y

Western Areas Ltd & Controlled Entities ABN 68 091 049 357
Page 16 of 77
Overview KPI Why KPI was set
Operations
Forrestania safety performance Based on Lost Time Injury performance in each quarter.
Motivate and reward the continued focus on safety standards and procedures.
Forrestania environmental incidents Based on a minimum reported environmental incidences by quarter.
Motivate and reward the continued focus on best practice environmental management.
Forrestania unit cash cost
Focused on average unit cash costs for Flying Fox (FF) and Spotted Quoll (SQ) mines per pound of nickel produced. Performance better than budget is required.
Motivate and reward the stringent management of production costs outcomes that exceed the Board set business plan.
Forrestania nickel in ore production Must exceed the budgeted nickel metal in ore production target from FF and SQ mines.
Motivate and reward nickel production outcomes that exceed Board set business plans.
Forrestania mill recoveries Achieve a set threshold recovery above budget levels for the combined ore feed from FF and SQ mines.
Motivate and reward nickel production outcomes that exceed Board set business plans.
Forrestania nickel in concentrate sales
Sale of nickel metal in concentrate to exceed a set tonnage target.
Motivate and reward nickel sales outcomes that exceed Board set business plans.
Corporate
Earnings Achieve EBIT target above budget. Motivate and reward financial outcomes that exceed Board set business plans.
Cashflow Achieve pre‐funding cashflow target above budget.
Motivate and reward financial outcomes that exceed Board set business plans.
Construction of the Mill Recovery Enhancement Project (MREP)
Achieving on time and on budget construction of the MREP project. Achieving design product specification.
Motivate and reward construction and commissioning outcomes related to a new key asset construction.
Business development
Based on business development activities and project pipeline development that provides opportunities to add value or protect value in the Company and for the shareholders.
Motivate and reward business development initiatives that provide market intelligence, preservation of capital and enhance corporate growth opportunities identification.
Mineral Resources and Exploration
Nickel resource Establishing replacement nickel reserves or mining inventory tonnages.
Motivate and reward mine life extension outcomes at Board set levels.
Project evaluation and developments
Based on Board set outcomes associated with the evaluation and development activities for new projects.
Motivate and reward timely delivery of key growth initiatives and activities.
New nickel resources Establishing new published nickel resources exceeding a targeted nickel tonnage levels.
Motivate and reward economic nickel discovery.
New nickel discovery Discovery of a new Nickel deposit. Motivate and reward economic nickel discovery.
For
per
sona
l use
onl
y

Western Areas Ltd & Controlled Entities ABN 68 091 049 357
Page 17 of 77
Long Term Incentive (‘LTI’)
Under the shareholder approved LTI plan Executives receive a grant of Performance Rights each year with each grant measured against a 3 year TSR period. No vesting occurs until the end of the third year to ensure Executives are focused on the long‐term shareholder value generation.
The number of Performance Rights to be granted is determined by dividing the LTI dollar value of the award by the fair value of a Performance Right as calculated by an independent valuation expert at 1 July of each respective year.
The quantum of LTI grants made during FY18 was as follows:
Name LTI quantum (% of base salary) (i)
Number of Performance
Rights issued (ii)
Fair Value at allocation date (ii) Exercise date Expiry date
Mr D Lougher 100% 420,280 $1.66 Upon receipt of a vesting notice issued in FY21
30/6/2023
Mr D Southam 75% 236,480 $1.66 As above 30/6/2023
Mr J Belladonna 75% 159,320 $1.66 As above 30/6/2023
Mr W Jones 50% 114,570 $1.66 As above 30/6/2023 (i) % of base salary was calculated on the base salary applicable 1 July 2017 including the 5% base salary discount. (ii) $1.66 was the fair value of the performance rights as calculated on 1 July 2017. For accounting purposes the fair value, as required
under AASB 2, is measured on the date of the Annual General Meeting where the Performance Rights are approved. For FY18 this was $2.47/right as at 22 November 2017.
Performance conditions
Western Areas TSR performance for the FY18 grant will be assessed against a customised peer group comprising the following 24 companies:
Altona Mining Ltd Hillgrove Resources Ltd Northern Star Resources Ltd Rex Minerals Ltd
Alumina Ltd Independence Group NL OM Holdings Ltd Sandfire Resources Ltd
Avanco Resources Ltd Medusa Mining Ltd Oz Minerals Ltd Syrah Resources Ltd
Beadell Resources Ltd Metals X Ltd Panoramic Resources Ltd Talisman Resources Ltd
Bouganville Copper Ltd Mincor Resources NL Pilbara Minerals Ltd Gindalbi Metals Ltd
Cudeco Ltd Mt Gibson Iron Ltd Poseidon Nickel Ltd Zimplats Holdings Ltd
No Performance Rights will vest unless the percentile ranking of the Company’s TSR for the relevant performance year, as compared to the TSR’s for the peer group companies, is at or above the 50th percentile and the participant remains employed with the Company as at 30 June 2020.
The following table sets out the vesting outcome based on the Company’s relative TSR performance:
Relative TSR performance Performance Vesting Outcomes
Less than 50th percentile 0% vesting
At the 50th percentile 50% vesting
Between 50th and 75th percentile Pro‐rata / progressive vesting from 50% ‐ 100%
At or above 75th percentile 100% vesting
Performance period and vesting
No Performance Rights will vest unless they meet a relative TSR measure for the period 1 July 2017 to 30 June 2020 as measured against the peer group and satisfaction of the service based vesting condition which requires the participant remains employed as at 30 June 2020. Upon satisfaction of the performance and service condition, the Performance Rights will vest upon receipt of a vesting notice during the 2021 financial year.
For
per
sona
l use
onl
y

Western Areas Ltd & Controlled Entities ABN 68 091 049 357
Page 18 of 77
Share trading policy
The trading of shares issued to participants under any of the Company’s employee equity plans is subject to, and conditional upon, compliance with the Company’s employee share trading policy contained in the Corporate Code of Conduct. Executives are prohibited from entering into any hedging arrangements over unvested performance rights received via the LTI plan. The Company would consider a breach of this policy as gross misconduct which may lead to disciplinary action and potentially dismissal.
SECTION E: LINK BETWEEN PERFORMANCE AND REMUNERATION OUTCOMES
The remuneration framework detailed above has been tailored with the objective of attracting and retaining the highest calibre staff who contribute to the success of the Company, while maintaining alignment between Company performance and individual rewards. The remuneration policies seek a balance between the interests of stakeholders and competitive market remuneration levels.
Company Performance
The Company continued a consistent high level to performance during FY18 achieving its production and cost guidance, as provided and updated for the market during the year. This consistent performance and a strengthening nickel price enabled free cashflow and net profits to be generated. Capital assets have been constructed on time and on budget and importantly new and innovative growth projects have been advanced. These outcomes have occurred while maintaining a class leading performance in safety and environmentally management.
The table below shows the KPIs of the Company over the last 5 years.
Year Ended 30 June 2018 2017 2016 2015 2014
Lost time injury frequency rate 0.9 1.1 0 0 1.9
Nickel tonnes Sold (tns) 20,549 22,639 24,793 26,036 25,756
Nickel Price – US$ 5.84/lb $4.58/lb $4.14/lb $6.58/lb $7.46/lb
Reported Cash Cost US$/lb (*) $2.03/lb $1.80/lb $1.64/lb $1.94/lb $2.28/lb
Net Profit / (Loss) after Tax (‘000) 11,837 19,299 (29,783) 35,013 25,460
EPS 4.34 7.09 (12.3) 15.1 12.2
Dividend Cents/share 2.0 2.0 ‐ 7.0 5.0
Market capitalisation ($) 971M 575M 582M 753M 1,073M
Closing share price ($) $3.56 $2.11 $2.15 $3.23 $4.62
TSR – 3 year peer ranking (% percentile) 57th 60th 74th 84th 93rd (*) Cash cost of production before smelting & refining, concentrate haulage and royalties.
Short term incentive
Based on the achievements of the Company in FY18, the Remuneration Committee determined that Executives achieved between 76% and 87% of their target STI opportunity. It is noted that no KMP achieved 100% of their target STI award.
For
per
sona
l use
onl
y

Western Areas Ltd & Controlled Entities ABN 68 091 049 357
Page 19 of 77
Performance achieved during the year against the above KPIs has resulted in Executives earning the STI payments below.
Name Target STI quantum (% of base salary)
Target FY18 STI quantum ($)
STI quantum earned ($)
STI quantum not earned ($)
Executive Directors
Mr D Lougher 55% 383,000 290,000 93,000
Mr D Southam 55% 288,000 253,000 35,000
Executives
Mr J Belladonna 55% 194,000 170,000 24,000
Mr W Jones 40% 152,000 118,000 34,000
STI payments have historically fluctuated in line with Company performance. The table below demonstrates the variability in awards received over time.
Year Ended 30 June 2018 2017 2016 2015 2014 2013
Average KMP STI Payout % 82% 83% 56% 90% 87% 29%
Long Term Incentive
The performance rights that vested and were converted into shares during FY18 were originally issued in FY15. The relative TSR performance of the grant was assessed at the completion of the 3 year performance period ending on 30 June 2018. As a result of the assessment, Western Areas was positioned at the 57th percentile against the peer group which resulted in 64% vesting of the grant.
SECTION F: NON‐EXECUTIVE DIRECTOR REMUNERATION
Non‐Executive Director (NED) fees limits
NED fees are determined within an aggregated fee limit of $1,000,000, which was approved by shareholders at the 2012 AGM. This aggregated fee limit is reviewed from time to time and the apportionment amongst Directors is reviewed annually. The following fees (including statutory superannuation) were applicable for the year:
Fees Fin. Year Board Chair Board Member
Actual 2018 $178,391 $154,606
Non‐Executive Directors fee structure
NED remuneration consists of a base Directors fee for their role as Board members, and is inclusive of compensation for any role on nominated Board sub‐committees. That is, no separate committee fees are payable. NEDs do not receive any performance‐based pay.
It is an objective of the Company to encourage Directors to own shares in Western Areas. However share based payments in the form of options or equity in the Company are not offered to NEDs as encouraged by Corporate Governance guidelines.
There is no scheme to provide retirement benefits to NEDs, other than statutory superannuation.
For
per
sona
l use
onl
y

Western Areas Ltd & Controlled Entities ABN 68 091 049 357
Page 20 of 77
SECTION G: SERVICE CONTRACTS Executives
A summary of the key contractual provisions for each of the current executives as at 30 June 2018 is set out below:
Name & job title Base salary
Super‐annuation
Contract duration Notice period Termination provision
D Lougher, Managing Director* $734,400 11% No fixed
term 3 months 12 months termination payment and accrued leave entitlements
D Southam, Executive Director* $550,914 11% No fixed
term 3 months 12 months termination payment and accrued leave entitlements
J Belladonna, Chief Financial Officer / Company Secretary*
$371,200 11% No fixed term 3 months 6 months termination payment
and accrued leave entitlements
W Jones, General Manager Operations
$400,400 11% No fixed term 1 month 6 months termination payment
and accrued leave entitlements
*In the event that there is a takeover of, or merger with, the Company, the Company must pay the Executive a change of control bonus within 10 days of that takeover or merger occurring. The amount of the takeover bonus will be calculated as follows: (a) The positive difference (expressed as a percentage of the 20 day VWAP) between the bid price for the Company’s shares as a
result of a takeover or merger bid, and the volume weighted share price of the Company’s share price for the 20 days immediately preceding the takeover or merger bid; and
(b) Multiplied by 3, as a percentage of the Executive’s base annual salary at the time that such a bid is completed.
(This contractual position is a legacy item that has not been applicable to any new executive appointment in over 7 years.)
All other senior management contracts are as per the Company’s standards terms and conditions and there are no contractual entitlements to cash bonuses, options or performance rights.
Non‐Executive Directors
Non‐Executive Directors receive a letter of appointment before commencing duties on the Board. The letter outlines compensation arrangements relevant to the Director. Non‐Executive appointments have no end date, retirement, redundancy or minimum notice periods included in their contracts.
For
per
sona
l use
onl
y

Western Areas Ltd & Controlled Entities ABN 68 091 049 357
Page 21 of 77
SECTION H: DETAILS OF REMUNERATION
Short Term Employee Benefits Post
Employment
Long Term Employee Benefits
(accounting valuation)
TOTAL Base Salary
STI Payments / Bonuses
Allowances& Other
Non Monetary
Super‐annuation
Long Service Leave
Share Based
Payments LTI
Non‐executive Directors
I Macliver 160,713 ‐ ‐ ‐ 17,678 ‐ ‐ 178,391
FY2017 156,369 ‐ ‐ ‐ 17,201 ‐ ‐ 173,570
C Readhead 139,284 ‐ ‐ ‐ 15,322 ‐ ‐ 154,606
FY2017 135,520 ‐ ‐ ‐ 14,907 ‐ ‐ 150,427
T Netscher 154,606 ‐ ‐ ‐ ‐ ‐ ‐ 154,606
FY2017 150,427 ‐ ‐ ‐ ‐ ‐ ‐ 150,427
R Yeates 139,284 ‐ ‐ ‐ 15,322 ‐ ‐ 154,606
FY2017 135,520 ‐ ‐ ‐ 14,907 ‐ ‐ 150,427
N Streltsova 139,284 ‐ ‐ ‐ 15,322 ‐ ‐ 154,606
FY2017 67,760 ‐ ‐ ‐ 7,454 ‐ ‐ 75,214
Total Non‐Executive Remuneration FY2018 796,815
Total Non‐Executive Remuneration FY2017 700,065
Executive Directors
D Lougher 716,040 290,000 57,764 48,748 25,000 18,346 890,042 2,045,940
FY2017 660,961 275,700 50,681 49,488 32,083 16,512 864,519 1,949,944
D Southam 537,142 253,000 38,086 50,663 25,000 13,763 500,750 1,418,404
FY2017 495,823 229,500 31,040 55,178 30,000 12,386 486,388 1,340,315
Executive Officers
J Belladonna 361,920 170,000 18,807 41,624 25,000 9,271 337,400 964,022
FY2017 334,081 157,500 13,249 45,334 27,500 8,346 327,725 913,735
W Jones 390,390 118,000 19,843 37,091 25,000 10,002 225,669 825,995
FY2017 360,361 125,500 9,456 36,300 32,083 9,002 235,668 808,370
Total Executive Remuneration FY2018 5,254,361
Total Executive Remuneration FY2017 5,012,364(i) Includes all paid and/or accrued bonuses for the applicable year. (ii) Includes over‐cap super. (iii) LTI refers to the value of Performance Rights that were expensed during the FY18. No Options were granted or remain outstanding at
the end of the financial year.
Related Party Transactions
There were no related party transactions with KMP during FY18.
For
per
sona
l use
onl
y

Western Areas Ltd & Controlled Entities ABN 68 091 049 357
Page 22 of 77
Shareholding by Key Management Personnel
The number of shares held by KMP (and their related parties) in the Group during the financial year is as follows:
Balance at 1 July
2017 Granted as
Remuneration
On Vesting of Performance
Rights
Other Changes During the Year
Balance at 30 June 2018
I Macliver 36,448 ‐ ‐ ‐ 36,448
D Lougher 462,430 ‐ 143,598 (193,598) 412,430
D Southam 131,932 ‐ 80,791 (147,800) 64,923
R Yeates 10,000 ‐ ‐ ‐ 10,000
T Netscher 12,000 ‐ ‐ ‐ 12,000
C Readhead 20,000 ‐ ‐ ‐ 20,000
J Belladonna 242,630 ‐ 54,436 (127,066) 170,000
W Jones 170,950 ‐ 39,145 (40,890) 169,205
TOTAL 1,086,390 ‐ 317,970 (509,354) 895,006
Options held by Key Management Personnel
There were no options held by key management at any time during FY18.
Performance Rights held by Key Management Personnel
Details of Performance Rights held by KMP and granted but not yet vested under the LTI plan at 30 June 2018 are outlined below:
Balance at 1 July 2017
Number granted as
Remuneration
Number vested
Number expired / Lapsed
Balance at 30 June 2018
Portion vested (%)
Portion unvested (%)
D Lougher 880,430 420,280 (143,598) (61,542) 1,095,570 0% 100%
D Southam 495,335 236,460 (80,791) (34,624) 616,380 0% 100%
J Belladonna 333,755 159,320 (54,436) (23,329) 415,310 0% 100%
W Jones 240,002 114,570 (39,145) (16,777) 298,650 0% 100%
TOTAL 1,949,522 930,630 (317,970) (136,272) 2,425,910 0% 100%
All Performance Rights issued during FY18 were allotted in accordance with the shareholder approved Western Areas LTI plan. The rights were granted on 30 November 2017 and have a zero exercise price.
End of audited Remuneration Report.
For
per
sona
l use
onl
y

Western Areas Ltd & Controlled Entities ABN 68 091 049 357
Page 23 of 77
Significant Changes in the State of Affairs
No significant changes in the consolidated group’s state of affairs occurred during the financial year.
Future Developments
Disclosure of information regarding likely developments in the operations of the consolidated entity in future financial years and the expected results of those operations is likely to result in unreasonable prejudice to the consolidated entity. Accordingly, this information has not been disclosed in this report.
Environmental Regulation and Performance
The Consolidated Entity has conducted exploration and development activities on mineral tenements. The right to conduct these activities is granted subject to State and Federal environmental legislation and regulations, tenement conditions and Mining Proposal commitments. The Consolidated Entity aims to ensure that a high standard of environmental management is achieved and, as a minimum, to comply with all relevant legislation and regulations, tenement conditions and Mining Proposal commitments. The Company has achieved a high level of compliance with all environmental conditions set for its projects and actively strives for continual improvement.
Auditor's Independence Declaration
The Auditor's Independence Declaration to the Directors of Western Areas Ltd on page 24 forms part of the Directors’ Report for the year ended 30 June 2018.
Non – Audit Services
The entity’s auditor, Crowe Horwath, provided non‐audit services, related to renewable energy lodgements, amounting to $4,500 during FY18 (FY17: $4,500). The Board has the following procedures in place before any non‐audit services are obtained from the auditors:
• all non audit services are reviewed and approved by the Board and the Audit & Risk Management Committee prior to commencement to ensure they do not adversely affect the integrity and objectivity of the auditor; and
• the nature of the services provided does not compromise the general principles relating to auditor independence as set out in APES 110: Code of Ethics for Professional Accountants set by the Accounting Professional and Ethical Standards Board.
Rounding of Amounts
The Company is of a kind referred to in Corporations Instrument 2016/191, issued by the Australian Securities and Investments Commission, relating to 'rounding‐off'. Amounts in this report have been rounded off in accordance with that Corporations Instrument to the nearest thousand dollars, or in certain cases, the nearest dollar..
Signed in accordance with a resolution of the Board of Directors.
D Lougher Managing Director
Perth, 22 August 2018
For
per
sona
l use
onl
y

Western Areas Ltd & Controlled Entities ABN 68 091 049 357
Page 24 of 77
AUDITOR’S INDEPENDENCE DECLARATION
For
per
sona
l use
onl
y

Western Areas Ltd & Controlled Entities ABN 68 091 049 357
Page 25 of 77
CONSOLIDATED STATEMENT OF PROFIT OR LOSS AND OTHER COMPREHENSIVE INCOME
Year ended 30 June 2018
Notes
Consolidated Entity
2018 $’000
2017 $’000
Sales 248,268 213,920
Operating Costs (146,408) (146,493)
Depreciation and Amortisation 4 (64,872) (65,717)
Other income 2 3,494 4,486
Profit on Sale of tenements & investments 2 ‐ 33,063
Finance costs 4 (1,934) (1,854)
Employee benefit expense (11,342) (9,185)
Foreign exchange gain / (loss) 1,143 (436)
Write off of non‐current assets ‐ (48)
Share based payments 29 (3,598) (3,060)
Administration expenses (4,286) (6,254)
Care and maintenance expense (1,750) (1,310)
Share of loss of associates accounted for using the equity method
‐ (694)
Realised derivative (loss) / gain (1,552) 932
Profit before income tax 17,163 17,350
Income tax (expense) / benefit 7 (5,326) 1,949
Profit for the year 11,837 19,299
Other comprehensive income, net of tax Items that may be reclassified to profit or loss
Changes in fair value of hedging instruments (2,012) 249 Changes in financial assets at fair value through other comprehensive income
9 21,911 2,646
Total comprehensive income for the year 31,736 22,194
Basic earnings per share (cents per share) 18 4.34 7.09
Diluted earnings per share (cents per share) 18 4.27 7.01
The accompanying notes form part of these financial statements.
For
per
sona
l use
onl
y

Western Areas Ltd & Controlled Entities ABN 68 091 049 357
Page 26 of 77
CONSOLIDATED STATEMENT OF FINANCIAL POSITION As At 30 June 2018
Notes
Consolidated Entity
2018 $’000
2017 $’000
Current Assets
Cash and cash equivalents 19(b) 151,643 140,294
Trade and other receivables 5 22,209 19,182
Inventories 6 34,805 21,280
Derivative financial instruments 16 ‐ 420
Total Current Assets 208,657 181,176
Non Current Assets
Property, plant and equipment 8 89,003 82,884
Intangible assets 506 506
Exploration & evaluation expenditure 10 97,784 87,157
Mine properties 11 142,673 155,813
Financial assets at fair value through other comprehensive income
9 33,307 11,396
Total Non Current Assets 363,273 337,756
Total Assets 571,930 518,932
Current Liabilities
Trade and other payables 13 41,396 26,345
Borrowings 14 267 170
Provisions 15 4,514 3,323
Derivative financial instruments 16 1,592 ‐
Total Current Liabilities 47,769 29,838
Non Current Liabilities
Borrowings 14 445 304
Provisions 15 24,408 23,544
Deferred tax liabilities 12 10,496 5,902
Total Non Current Liabilities 35,349 29,750
Total Liabilities 83,118 59,588
Net Assets 488,812 459,344
Equity
Contributed equity 17 442,963 442,963
Other reserves 30 44,533 21,447
Retained earnings 1,316 (5,066)
Total Equity 488,812 459,344
The accompany notes form part of these financial statements.
For
per
sona
l use
onl
y

Western Areas Ltd & Controlled Entities
Page 27 of 77
CONSOLIDATED STATEMENT OF CHANGES IN EQUITY Year Ended 30 June 2018
Issued Capital
Capital Raising Costs
Share Based
Payment Reserve
Hedge Reserve
Investment Reserve
Retained Earnings
Total Equity
$’000 $’000 $’000 $’000 $’000 $’000 $’000
TOTAL EQUITY AT 1 JULY 2016 459,184 (16,221) 24,528 171 (9,296) (24,365) 434,001
COMPREHENSIVE INCOME
Profit for the year 19,299 19,299
Other comprehensive loss for the year 249 2,646 2,895
TOTAL COMPREHENSIVE PROFIT FOR THE YEAR
249 2,646 19,299 22,194
TRANSACTIONS WITH OWNERS IN THEIR CAPACITY AS OWNER, AND OTHER TRANSFERS
Share based payments expense 3,060 3,060
Deferred tax asset on performance rights 89 89
TOTAL EQUITY AT 30 JUNE 2017 459,184 (16,221) 27,677 420 (6,650) (5,066) 459,344
COMPREHENSIVE INCOME
Profit for the year 11,837 11,837
Other comprehensive profit for the year (2,012) 21,911 19,899
TOTAL COMPREHENSIVE (LOSS)/PROFIT FOR THE YEAR
(2,012) 21,911 11,837 31,736
TRANSACTIONS WITH OWNERS IN THEIR CAPACITY AS OWNER, AND OTHER TRANSFERS
Share based payments expense 3,598 3,598
Deferred tax liability on performance rights (411) (411)
Dividends paid (5,455) (5,455)
TOTAL EQUITY AT 30 JUNE 2018 459,184 (16,221) 30,864 (1,592) 15,261 1,316 488,812
The accompanying notes form part of these financial statements.
For
per
sona
l use
onl
y

Western Areas Ltd & Controlled Entities ABN 68 091 049 357
Page 28 of 77
CONSOLIDATED STATEMENT OF CASH FLOWS
Year Ended 30 June 2018
Notes
Consolidated Entity
2018 $’000
2017 $’000
Cash flows from operating activities
Receipts from customers 237,242 226,844Payments to suppliers and employees (154,007) (157,743)Interest received 2,480 1,702Royalties paid (9,194) (9,818)Other receipts 880 593Interest paid (25) (14)Realisation on settlement of derivatives (410) 496Income tax refund ‐ 4,130Net cash inflow from operating activities 19(a) 76,966 66,190 Cash flows from investing activities Payments for property, plant and equipment (22,544) (6,280)Proceeds from sale of property, plant & equipment 4 ‐Proceeds from sale of investments ‐ 32,583Mine development expenditure (26,268) (15,703)Exploration & evaluation expenditure (10,972) (11,983)Net cash outflow from investing activities (59,780) (1,383) Cash flows from financing activities Finance lease payments (282) (219)Borrowing costs (100) ‐Dividends paid to company’s shareholders (5,455) ‐Net cash outflow from financing activities (5,837) (219)Net increase in cash and cash equivalents held 11,349 64,588Cash and cash equivalents as at the beginning of the financial year
140,294 75,706
Cash and cash equivalents at end of financial year 19(b) 151,643 140,294
The accompanying notes form part of these financial statements.
For
per
sona
l use
onl
y

Western Areas Ltd & Controlled Entities ABN 68 091 049 357
Page 29 of 77
NOTES TO THE FINANCIAL STATEMENTS
For The Year Ended 30 June 2018
Note 1: Statement of Significant Accounting Policies
These consolidated financial statements and notes represent those of Western Areas Ltd and Controlled Entities (the “consolidated group” or “group”).
The separate financial statements of the parent entity, Western Areas Ltd, have not been presented within this financial report as permitted by amendments made to Corporation Act 2001 effective as at 28 June 2010.
The group is a for profit entity for financial reporting purposes under Australian Accounting Standards.
The Financial Report was approved by the Board of Directors on 22 August 2018.
Basis of Preparation
These general purpose financial statements have been prepared in accordance with Australian Accounting Standards, Australian Accounting Interpretations, other authoritative pronouncements of the Australian Accounting Standards Board (AASB) and the Corporations Act 2001.
Australian Accounting Standards set out accounting policies that the AASB has concluded would result in a financial report containing relevant and reliable information about transactions, events and conditions. Compliance with Australian Accounting Standards ensures that the financial statements and notes also comply with International Financial Reporting Standards. Material accounting policies adopted in the preparation of this financial report are presented below and have been consistently applied unless stated otherwise.
Except for cash flow information, the financial statements have been prepared on an accruals basis and are based on historical costs, modified, where applicable, by the measurement at fair value of selected non‐current assets, financial assets and financial liabilities.
Adoption of new and revised Accounting Standards
The consolidated entity has adopted all of the new, revised or amending Accounting Standards and Interpretations issued by the Australian Accounting Standards Board (‘AASB’) that are mandatory for the current reporting period.
The adoption of these Accounting Standards and Interpretations did not have any significant impact on the financial performance or position of the consolidated entity.
(a) Principles of Consolidation
The Group financial statements consolidate those of the Western Areas Limited (‘company’ or ‘parent’) and all of its subsidiaries as of 30 June 2018. The parent controls a subsidiary if it is exposed, or has rights, to variable returns from its involvement with the subsidiary and has the ability to affect those returns through its power over the subsidiary. All subsidiaries have a reporting date of 30 June.
All transactions and balances between Group companies are eliminated on consolidation, including unrealised gains and losses on transactions between Group companies. Where unrealised losses on intra‐group asset sales are reversed on consolidation, the underlying asset is also tested for impairment from a group perspective. Amounts reported in the financial statements of subsidiaries have been adjusted where necessary to ensure consistency with the accounting policies adopted by the Group.
For
per
sona
l use
onl
y

Western Areas Ltd & Controlled Entities ABN 68 091 049 357
Page 30 of 77
Note 1: Statement of Significant Accounting Policies
(a) Principles of Consolidation (continued...)
Profit or loss and other comprehensive income of subsidiaries acquired or disposed of during the year are recognised from the effective date of acquisition, or up to the effective date of disposal, as applicable.
Non‐controlling interests, presented as part of equity, represent the portion of a subsidiary’s profit or loss and net assets that is not held by the Group. The Group attributes total comprehensive income or loss of subsidiaries between the owners of the parent and the non‐controlling interests based on their respective ownership interests.
(b) Investments in Associates and Joint Arrangements
Associates are those entities over which the Group is able to exert significant influence but which are not subsidiaries.
A joint venture is an arrangement that the Group controls jointly with one or more other investors, and over which the Group has rights to a share of the arrangement’s net assets rather than direct rights to underlying assets and obligations for underlying liabilities. A joint arrangement in which the Group has direct rights to underlying assets and obligations for underlying liabilities is classified as a joint operation.
Investments in associates and joint ventures are accounted for using the equity method. Interests in joint operations are accounted for by recognising the Group’s assets (including its share of any assets held jointly), its liabilities (including its share of any liabilities incurred jointly), its revenue from the sale of its share of the output arising from the joint operation, its share of the revenue from the sale of the output by the joint operation and its expenses (including its share of any expenses incurred jointly).
Any goodwill or fair value adjustment attributable to the Group’s share in the associate or joint venture is not recognised separately and is included in the amount recognised as the investment.
The carrying amount of the investment in associates and joint ventures is increased or decreased to recognise the Group’s share of the profit or loss and other comprehensive income of the associate and joint venture, adjusted where necessary to ensure consistency with the accounting policies of the Group.
Unrealised gains and losses on transactions between the Group and its associates and joint ventures are eliminated to the extent of the Group’s interest in those entities. Where unrealised losses are eliminated, the underlying asset is also tested for impairment. (c) Segment reporting
Operating segments are reported in a manner consistent with the internal reporting provided to the chief operating decision maker. The chief operating decision maker, who is responsible for allocating resources and assessing performance of the operating segments, has been identified as the board of directors.
For
per
sona
l use
onl
y

Western Areas Ltd & Controlled Entities ABN 68 091 049 357
Page 31 of 77
Note 1: Statement of Significant Accounting Policies
(d) Foreign Currency Transactions and Balances
The financial statements are presented in Australian dollars, which is Western Areas Limited's functional and presentation currency.
Foreign currency transactions
Foreign currency transactions are translated into Australian dollars using the exchange rates prevailing at the dates of the transactions. Foreign exchange gains and losses resulting from the settlement of such transactions and from the translation at financial year‐end exchange rates of monetary assets and liabilities denominated in foreign currencies are recognised in profit or loss.
Foreign operations
The assets and liabilities of foreign operations are translated into Australian dollars using the exchange rates at the reporting date. The revenues and expenses of foreign operations are translated into Australian dollars using the average exchange rates, which approximate the rates at the dates of the transactions, for the period. All resulting foreign exchange differences are recognised in other comprehensive income through the foreign currency equity reserve.
The foreign currency reserve is recognised in profit or loss when the foreign operation or net investment is disposed of.
(e) Revenue recognition
Revenue is recognised when it is probable that the economic benefit will flow to the consolidated entity and the revenue can be reliably measured. Revenue is measured at the fair value of the consideration received or receivable. All revenue is stated net of the amount of goods and services tax (GST).
Sale of Goods
Revenue from the sale of nickel is recognised when the performance obligation of delivering the products to the buyer has been satisfied, currently being the point at which the product is delivered on site to the buyer or passes the ships’ rail or as otherwise agreed between Western Areas and the buyer. Revenue is recognised at estimated sales value. The estimated sales value is determined by reference to the estimated metal content, metal recovery, payability, the metal price and exchange rate. Revenue is provisionally priced at the date revenue is recognised. An adjustment is made to reflect the final sales value when the actual metal content and metal recovery has been determined. The final metal content and metal recovery is generally known between 30 and 90 days after delivery to the customer.
Interest
Interest revenue is recognised on a proportional basis taking into account the interest rates applicable to the financial assets.
Other revenue
Other revenue is recognised when it is received or when the right to receive payment is established.
(f) Finance Costs
Finance costs attributable to qualifying assets are capitalised as part of the asset. All other finance costs are expensed in the period in which they are incurred.
For
per
sona
l use
onl
y
Western Areas Ltd & Controlled Entities ABN 68 091 049 357
Page 32 of 77
Note 1: Statement of Significant Accounting Policies
(g) Inventories
Inventories are measured at the lower of cost and net realisable value. Costs, including an appropriate portion of fixed and variable overhead expenses, are assigned to inventories on hand by the method most appropriate to each class of inventory with the majority being valued on an average cost basis. Net realisable value represents the estimated selling price less all estimated costs of completion and costs to be incurred in marketing, selling and distribution.
The cost of mining stocks includes direct materials, direct labour, transportation costs and variable and fixed overhead costs relating to mining activities.
The cost of consumables and spare parts includes cost of materials and transportation costs.
(h) Property, Plant and Equipment
Each class of property, plant and equipment is carried at cost less, where applicable, any accumulated depreciation and impairment losses.
Property
Land and buildings are carried at cost, less accumulated depreciation for buildings.
Plant and Equipment
Plant and equipment are measured on the cost basis and therefore carried at cost less accumulated depreciation and any accumulated impairment. In the event the carrying amount of plant and equipment is greater than the estimated recoverable amount, the carrying amount is written down immediately to the estimated recoverable amount and impairment losses are recognised either in profit or loss or as a revaluation decrease if the impairment losses relate to a revalued asset. A formal assessment of recoverable amount is made when impairment indicators are present (refer to Note 1(p) for details of impairment).
The carrying amount of plant and equipment is reviewed annually by directors to ensure it is not in excess of the recoverable amount from these assets. The recoverable amount is assessed on the basis of the expected net cash flows that will be received from the asset’s employment and subsequent disposal. The expected net cash flows have been discounted to their present values in determining recoverable amounts.
The cost of fixed assets constructed within the consolidated group includes the cost of materials, direct labour, borrowing costs and an appropriate proportion of fixed and variable overheads. Subsequent costs are included in the asset’s carrying amount or recognised as a separate asset, as appropriate, only when it is probable that future economic benefits associated with the item will flow to the Group and the cost of the item can be measured reliably. All other repairs and maintenance are recognised as expenses in profit or loss during the financial period in which they are incurred.
Depreciation
Depreciation of an asset (including amounts classified as Works in Progress) begins when it is available for use, that is, when it is in the location and condition necessary for it to be capable of operating in the manner intended by Management. The depreciable amount of all property, plant and equipment is depreciated on a straight line basis over their useful lives or the estimated life of mine, whichever is shorter. Land is not depreciated. The depreciation rates used for each major type of depreciable assets are:
For
per
sona
l use
onl
y

Western Areas Ltd & Controlled Entities ABN 68 091 049 357
Page 33 of 77
Note 1: Statement of Significant Accounting Policies
(h) Property, Plant and Equipment (continued...)
Class of Fixed Asset Depreciation Rate
Property 2% ‐ 20%
Plant and equipment 2% ‐ 33% or units of production over life of mine
Motor vehicles 20%
Furniture and fittings 6% ‐ 27%
The assets’ residual values and useful lives are reviewed, and adjusted if appropriate, at the end of each reporting period.
An asset’s carrying amount is written down immediately to its recoverable amount if the carrying amount is greater than its estimated recoverable amount.
Gains and losses on disposals are determined by comparing proceeds with the carrying amount. These gains and losses are recognised in profit or loss in the period in which they arise.
(i) Exploration and Evaluation Expenditure
Exploration and evaluation expenditures incurred are capitalised in respect of each identifiable area of interest. These costs are only capitalised for areas of interest where rights of tenure are current, to the extent that they are expected to be recovered through the successful development of the area of interest or where activities in the area have not yet reached a stage that permits reasonable assessment of the existence of economically recoverable reserves and active and significant operation in relation to the area of interest are continuing.
Accumulated costs in relation to an abandoned area are written off in full against profit or loss in the year in which the decision to abandon the area is made.
When production commences, the accumulated costs for the relevant area of interest are transferred to mine properties and are amortised at the rate of depletion of the economically recoverable reserves.
A regular review is undertaken of each area of interest to determine the appropriateness of continuing to carry forward costs in relation to that area of interest. In accordance with AASB 6, where circumstances suggest that the carrying amount of an asset exceed its recoverable amount, an impairment loss will be recognised.
(j) Mine Properties
Development expenditure incurred by or on behalf of the consolidated entity is accumulated separately for each area of interest in which economically recoverable resources have been identified. Such expenditure comprises costs directly attributable to the construction of a mine, the related infrastructure and expenditure transferred from the capitalised exploration and evaluation expenditure phase.
Amortisation is charged using the units‐of production method, with separate calculations being made for each area of interest. The units‐of‐production basis results in a amortisation charge proportional to the depletion of proved and probable reserves.
Mine properties are tested for impairment in accordance with the policy in Note 1 (p).
For
per
sona
l use
onl
y

Western Areas Ltd & Controlled Entities ABN 68 091 049 357
Page 34 of 77
Note 1: Statement of Significant Accounting Policies
(j) Mine Properties (continued…)
Costs of site restoration are provided for over the life of the facility from when exploration commences and are included in the costs from that stage. Site restoration costs include obligations relating to dismantling and removing mining plant, reclamation, waste dump rehabilitation and other costs associated with restoration and rehabilitation of the site. Such costs have been determined using estimates for current costs and current legal requirements and technology.
Any changes in the estimates for the costs are accounted for on a prospective basis. In determining the costs of site restoration, there is uncertainty regarding the nature and extent of the restoration due to community expectations and future legislation. Accordingly the costs have been determined on the basis that the restoration will be completed within one year of abandoning the site.
(k) Income Tax
The income tax expense or benefit for the period is the tax payable on that period's taxable income based on the applicable income tax rate for each jurisdiction, adjusted by changes in deferred tax assets and liabilities attributable to temporary differences, unused tax losses and the adjustment recognised for prior periods, where applicable.
Deferred tax assets and liabilities are recognised for temporary differences at the tax rates expected to apply when the assets are recovered or liabilities are settled, based on those tax rates that are enacted or substantively enacted, except for:
• When the deferred income tax asset or liability arises from the initial recognition of goodwill or an asset or liability in a transaction that is not a business combination and that, at the time of the transaction, affects neither the accounting nor taxable profits; or
• When the taxable temporary difference is associated with interests in subsidiaries, associates or joint ventures, and the timing of the reversal can be controlled and it is probable that the temporary difference will not reverse in the foreseeable future.
Deferred tax assets are recognised for deductible temporary differences and unused tax losses only if it is probable that future taxable amounts will be available to utilise those temporary differences and losses.
The carrying amount of recognised and unrecognised deferred tax assets are reviewed each reporting date. Deferred tax assets recognised are reduced to the extent that it is no longer probable that future taxable profits will be available for the carrying amount to be recovered. Previously unrecognised deferred tax assets are recognised to the extent that it is probable that there are future taxable profits available to recover the asset.
Deferred tax assets and liabilities are offset only where there is a legally enforceable right to offset current tax assets against current tax liabilities and deferred tax assets against deferred tax liabilities; and they relate to the same taxable authority on either the same taxable entity or different taxable entity's which intend to settle simultaneously.
Western Areas Limited (the 'head entity') and its wholly‐owned Australian subsidiaries have formed an income tax consolidated group under the tax consolidation regime. The head entity and each subsidiary in the tax consolidated group continue to account for their own current and deferred tax amounts. The tax consolidated group has applied the 'separate taxpayer within group' approach in determining the appropriate amount of taxes to allocate to members of the tax consolidated group.
For
per
sona
l use
onl
y

Western Areas Ltd & Controlled Entities ABN 68 091 049 357
Page 35 of 77
Note 1: Statement of Significant Accounting Policies
(k) Income Tax (continued…)
In addition to its own current and deferred tax amounts, the head entity also recognises the current tax liabilities (or assets) and the deferred tax assets arising from unused tax losses and unused tax credits assumed from each subsidiary in the tax consolidated group.
Assets or liabilities arising under tax funding agreements with the tax consolidated entities are recognised as amounts receivable from or payable to other entities in the tax consolidated group. The tax funding arrangement ensures that the intercompany charge equals the current tax liability or benefit of each tax consolidated group member, resulting in neither a contribution by the head entity to the subsidiaries nor a distribution by the subsidiaries to the head entity.
(l) Goods and Services Tax (GST)
Revenues, expenses and assets are recognised net of the amount of GST, except where the amount of GST incurred is not recoverable from the Australian Tax Office. In these circumstances the GST is recognised as part of the cost of acquisition of the asset or as part of an item of the expense. Receivables and payables in the statement of financial position are shown inclusive of GST.
Cash flows are presented in the cash flow statement on a gross basis, except for the GST component of investing and financing activities, which are disclosed as operating cash flows.
(m) Employee Benefits
Short‐term employee benefits
Liabilities for wages and salaries, including non‐monetary benefits, annual leave and long service leave expected to be settled within 12 months of the reporting date are measured at the amounts expected to be paid when the liabilities are settled.
Other long‐term employee benefits obligations
The liabilities for long service leave and annual leave that are not expected to be settled wholly within 12 months after the end of the period in which the employees render the related service are recognised as non‐current liabilities and are therefore measured at the present value of expected future payments to be made in respect of services provided by employees up to the end of the reporting period. Consideration is given to expected future wage and salary levels, experience of employee departures and periods of service. Expected future payments are discounted using market yields at the end of the reporting period of government bonds with terms and currencies that match, as closely as possible, the estimated future cash outflows.
The obligations are presented as current liabilities in the balance sheet if the entity does not have an unconditional right to defer settlement for at least twelve months after the reporting period, regardless of when the actual settlement is expected to occur.
Defined contribution superannuation expense
Contributions to defined contribution superannuation plans are expensed in the period in which they are incurred.
For
per
sona
l use
onl
y

Western Areas Ltd & Controlled Entities ABN 68 091 049 357
Page 36 of 77
Note 1: Statement of Significant Accounting Policies
(m) Employee Benefits (continued…)
Share‐based payments
The consolidated entity has provided benefits to its Key Management Personnel in the form of share‐based payments, whereby services were rendered partly or wholly in exchange for shares or rights over shares. The Remuneration Committee approved the grant of performance rights as incentives to attract Executives and to maintain their long term commitment to the Company. These benefits are awarded at the discretion of the Board, or following approval by shareholders (equity‐settled transactions).
The costs of these equity‐settled transactions are measured by reference to the fair value of the equity instruments at the date on which they are granted. The fair value of performance rights granted is determined using the Black Scholes Option Pricing Model (“BSM”) that includes a Monte Carlo Simulation Model to value the Rights, further details of which are disclosed in Note 29.
The costs of these equity‐settled transactions is recognised, together with a corresponding increase in equity, over the period in which the performance and/or service conditions are fulfilled (the vesting period), ending on the date on which the relevant employees become fully entitled to the equity instrument (vesting date).
At each subsequent reporting date until vesting, the cumulative charge to the income statement is the product of (i) the fair value at grant date of the award; (ii) the current best estimate of the number of equity instruments that will vest, taking into account such factors as the likelihood of employee turnover during the vesting period and the likelihood of non‐market performance conditions being met and (iii) the expired portion of the vesting period. The charge to the income statement for the period is the cumulative amount as calculated above less the amounts already charged in previous periods. There is a corresponding credit to equity.
Until an equity instrument has vested, any amounts recorded will be adjusted if more or fewer equity instruments vest than were originally anticipated to do so. Any equity instrument subject to a market condition is considered to vest irrespective of whether or not that market condition is fulfilled, provided that all other conditions are satisfied.
If the terms of an equity‐settled award are modified, as a minimum, an expense is recognised as if the terms had not been modified. An additional expense is recognised for any modification that increases the total fair value of the share based payment arrangement, or is otherwise beneficial to the recipient of the award, as measured at the date of modification.
If an equity‐settled transaction is cancelled (other than a grant cancelled by forfeiture when the vesting conditions are not satisfied), it is treated as if it had vested on the date of cancellation, and any expense not yet recognised for the award is recognised immediately. However, if a new equity instrument is substituted for the cancelled award and designated as a replacement award on the date that it is granted, the cancelled and new equity instrument are treated as if they were a modification of the original award, as described in the preceding paragraph.
For
per
sona
l use
onl
y

Western Areas Ltd & Controlled Entities ABN 68 091 049 357
Page 37 of 77
Note 1: Statement of Significant Accounting Policies
(n) Leases
The determination of whether an arrangement is or contains a lease is based on the substance of the arrangement and requires an assessment of whether the fulfilment of the arrangement is dependent on the use of a specific asset or assets and the arrangement conveys a right to use the asset.
A distinction is made between finance leases, which effectively transfer from the lessor to the lessee substantially all the risks and benefits incidental to the ownership of leased assets, and operating leases, under which the lessor effectively retains substantially all such risks and benefits.
Finance leases are capitalised. A lease asset and liability are established at the fair value of the leased assets, or if lower, the present value of minimum lease payments. Lease payments are allocated between the principal component of the lease liability and the finance costs, so as to achieve a constant rate of interest on the remaining balance of the liability.
Leased assets acquired under a finance lease are depreciated over the asset's useful life or over the shorter of the asset's useful life and the lease term if there is no reasonable certainty that the consolidated entity will obtain ownership at the end of the lease term.
Operating lease payments, net of any incentives received from the lessor, are charged to profit or loss on a straight‐line basis over the term of the lease.
(o) Financial Instruments
Initial recognition and measurement
Financial assets and financial liabilities are recognised when the entity becomes a party to the contractual provisions to the instrument. For financial assets, this is equivalent to the date that the company commits itself to either the purchase or sale of the asset (i.e. trade date accounting is adopted).
Financial instruments are initially measured at fair value plus transaction costs, except where the instrument is classified ‘at fair value through profit or loss’, in which case transaction costs are expensed to the income statement immediately.
Classification and Subsequent Measurement
Financial instruments are subsequently measured at either of fair value or amortised cost using the effective interest rate method. Fair value represents the amount for which an asset could be exchanged or a liability settled, between knowledgeable, willing parties. Where available, quoted prices in an active market are used to determine fair value. In other circumstances, valuation techniques are adopted.
A financial asset is subsequently measured at amortised cost, using effective interest method and net of any impairment loss, if:
• The asset is held within the business model whose objective is to hold assets in order to collect contractual cash flows; and
• The contractual terms of the financial asset give rise, on specified dates, to cash flows that are solely payments of principal and interest.
For
per
sona
l use
onl
y

Western Areas Ltd & Controlled Entities ABN 68 091 049 357
Page 38 of 77
Note 1: Statement of Significant Accounting Policies
(o) Financial Instruments (continued…)
Amortised cost is calculated as:
a) the amount at which the financial asset or financial liability is measured at initial recognition;
b) less principal repayments;
c) plus or minus the cumulative amortisation of the difference, if any, between the amount initially recognised and the maturity amount calculated using the effective interest method; and
d) less any reduction for impairment.
The effective interest method is used to allocate interest income or interest expense over the relevant period and is equivalent to the rate that exactly discounts estimated future cash payments or receipts (including fees, transaction costs and other premiums or discounts) through the expected life (or when this cannot be reliably predicted, the contractual term) of the financial instrument to the net carrying amount of the financial asset or financial liability. Revisions to expected future net cash flows will necessitate an adjustment to the carrying value with a consequential recognition of an income or expense in profit or loss.
Financial assets at fair value through profit and loss
As from 1 July 2013 the group classifies its financial assets in the following measurement categories:
• those to be measured subsequently at fair value, or
• those to be measured at amortised cost.
The classification depends on the entity’s business model for managing the financial assets and the contractual terms of the cash flows. The group is required to reclassify all affected debt investments when and only when its business model for managing those assets changes.
At initial recognition, the group measures a financial asset at its fair value plus, in the case of a financial asset not at fair value through profit or loss, transaction costs that are directly attributable to the acquisition of the financial asset. Transaction costs of financial assets carried at fair value through profit or loss are expensed in profit or loss.
A gain or loss on a debt investment that is subsequently measured at fair value and is not part of a hedging relationship is recognised in profit or loss and presented net in the income statement within other income or other expenses in the period in which it arises. A gain or loss on a debt investment that is subsequently measured at amortised cost and is not part of a hedging relationship is recognised in profit or loss when the financial asset is derecognised or impaired and through the amortisation process using the effective interest rate method.
The group subsequently measures all equity investments at fair value. Where the group’s management has made an irrevocable election to present fair value gains and losses on equity investments in other comprehensive income, there is no subsequent reclassification of fair value gains and losses to profit or loss. Dividends from such investments continue to be recognised in profit or loss as other revenue when the group’s right to receive payments is established and as long as they represent a return on investment.
Financial liabilities
Non‐derivative financial liabilities (excluding financial guarantees) are subsequently measured at amortised cost.
For
per
sona
l use
onl
y

Western Areas Ltd & Controlled Entities ABN 68 091 049 357
Page 39 of 77
Note 1: Statement of Significant Accounting Policies
(o) Financial Instruments (continued…)
De‐recognition
Financial assets are de‐recognised where the contractual rights to receipt of cash flows expires or the asset is transferred to another party whereby the entity no longer has any significant continuing involvement in the risks and benefits associated with the asset. Financial liabilities are de‐recognised where the related obligations are discharged, cancelled or expired. The difference between the carrying value of the financial liability extinguished or transferred to another party and the fair value of consideration paid, including the transfer of non‐cash assets or liabilities assumed, is recognised in profit or loss.
Derivative financial instruments
Derivative financial instruments are used by the consolidated entity to hedge exposures to commodity prices and foreign currency exchange rates.
The Group documents at the inception of a transaction the relationship between hedging instruments and hedged items, as well as its risk management objective and strategy for undertaking various hedge transactions. The Group also documents its assessment, both at hedge inception and on an ongoing basis, of whether the derivatives that are used in hedging transactions have been and will continue to be highly effective in offsetting changes in fair values or cash flows of hedged items.
Derivatives are initially recognised at fair value on the date the contract is entered into and are subsequently remeasured to their fair value. The method of recognising the resulting gain or loss depends on whether the derivative is designated as a hedging instrument, and if so, the nature of the item being hedged. Hedging derivatives are either Fair Value Hedges or Cashflow Hedges.
Fair Value Hedges
Changes in the fair value of derivatives classified as fair value hedges are recognised in the Income Statement, together with any changes in the fair value of the hedge asset or liability that are attributable to the hedged risk.
Cash Flow Hedge
Cash flow hedges are used to cover the consolidated entity’s exposure to variability in cash flows that is attributable to particular risk associated with a recognised asset or liability or a firm commitment which could affect profit or loss. The effective portion of the gain or loss on the hedging instrument is recognised directly in equity, whilst the ineffective portion is recognised in profit or loss. Amounts taken to equity are transferred out of equity and included in the measurement of the hedged transaction when the forecast transaction occurs.
Cash flow hedges are tested for effectiveness on a regular basis both retrospectively and prospectively to ensure that each hedge is highly effective and continues to be designated as a cash flow hedge. If the forecast transaction is no longer expected to occur, amounts recognised in equity are transferred to profit or loss.
If the hedging instrument is sold, terminated, expires, exercised without replacement or rollover, or if the hedge becomes ineffective and is no longer a designated hedge, amounts previously recognised in equity remain in equity until the forecast transaction occurs.
For
per
sona
l use
onl
y

Western Areas Ltd & Controlled Entities ABN 68 091 049 357
Page 40 of 77
Note 1: Statement of Significant Accounting Policies
(o) Financial Instruments (continued…)
All Other Derivatives
Changes in the fair value of derivatives that do not qualify for hedge accounting are recognised in the Income Statement.
(p) Impairment of Assets
At the end of each reporting period, the Group assesses whether there is any indication that an asset may be impaired. The assessment will include the consideration of external and internal sources of information including dividends received from subsidiaries, associates or jointly controlled entities deemed to be out of pre‐acquisition profits. If such an indication exists, an impairment test is carried out on the asset by comparing the recoverable amount of the asset, being the higher of the asset’s fair value less costs to sell and value in use, to the asset’s carrying value. Any excess of the asset’s carrying value over its recoverable amount is expensed to the income statement.
Where it is not possible to estimate the recoverable amount of an individual asset, the Group estimates the recoverable amount of the cash‐generating unit to which the asset belongs.
Reversal of impairment losses
An impairment loss recognised in prior periods for an asset/CGU is reversed if there has been a change in the estimates used to determine the asset’s/CGU’s recoverable amount since the last impairment loss was recognised. When an impairment loss subsequently reverses, the carrying amount of the asset/CGU is increased to the revised estimate of its recoverable amount, but so that the increased carrying amount does not exceed the carrying amount that would have been determined had no impairment loss been recognised for the asset/CGU in prior years.
(q) Rounding Amounts
The company is of a kind referred to in Corporations Instrument 2016/191, issued by the Australian Securities and Investments Commission, relating to 'rounding‐off'. Amounts in this report have been rounded off in accordance with that Corporations Instrument to the nearest thousand dollars, or in certain cases, the nearest dollar.
(r) Cash and Cash Equivalents
Cash and cash equivalents comprise cash‐on‐hand, cash in banks and investments in money market instruments, net of outstanding bank overdrafts.
(s) Provisions
Provisions are recognised where the group has a legal or constructive obligation, as a result of past events, for which it is probable that an outflow of economic benefits will result and that outflow is able to be reliably measured.
(t) Intangibles
Expenditure during the research phase of a project is recognised as an expense when incurred. Patents and trademarks are capitalised only when technical feasibility studies identify that the project will deliver future economic benefits and these benefits can be measured reliably.
Patents and trademarks have a finite life and are amortised on a systematic basis matched to the future economic benefits over the useful life of the project.
For
per
sona
l use
onl
y

Western Areas Ltd & Controlled Entities ABN 68 091 049 357
Page 41 of 77
Note 1: Statement of Significant Accounting Policies
(u) Critical Accounting Estimates and Balances
The preparation of the financial statements requires management to make judgements, estimates and assumptions that affect the reported amounts in the financial statements. Management continually evaluates its judgements and estimates in relation to assets, liabilities, contingent liabilities, revenue and expenses. Management bases its judgements, estimates and assumptions on historical experience and on other various factors, including expectations of future events, management believes to be reasonable under the circumstances. The resulting accounting judgements and estimates will seldom equal the related actual results. The judgements, estimates and assumptions that have a significant risk of causing a material adjustment to the carrying amounts of assets and liabilities (refer to the respective notes) within the next financial year are discussed below.
Share‐based payment transactions
The consolidated entity measures the cost of equity‐settled transactions with employees by reference to the fair value of the equity instruments at the date at which they are granted. The fair value is determined by using the Monti Carlo model taking into account the terms and conditions upon which the instruments were granted. The accounting estimates and assumptions relating to equity‐settled share‐based payments would have no impact on the carrying amounts of assets and liabilities within the next annual reporting period but may impact profit or loss and equity.
Provision for impairment of inventories
The provision for impairment of inventories assessment requires a degree of estimation and judgement. Costs incurred in or benefits of the productive process are accumulated as stockpiles, nickel and other metals in process, ore on run of mine ore pads and product inventory. Net realisable value tests are performed at least annually and represent the estimated future sales price of the product based on prevailing metal prices, less estimated costs to complete production and bring the product to sale.
Stockpiles are measured by estimating the number of tonnes added and removed from the stockpile, the number of contained metal tonnes based on assay data, and the estimated recovery percentage based on the expected processing method.
Although the quantity of recoverable metal is reconciled by comparing the grades of the ore to the quantities of metals actually recovered (metallurgical balancing), the nature of the process inherently limits the ability to precisely monitor recoverability levels. As a result the metallurgical balancing process is constantly monitored and the engineering estimates are refined based on actual results over time.
Fair value measurement hierarchy
The consolidated entity is required to classify all assets and liabilities, measured at fair value, using a three level hierarchy, based on the lowest level of input that is significant to the entire fair value measurement, being: Level 1: Quoted prices (unadjusted) in active markets for identical assets or liabilities that the entity can access at the measurement date; Level 2: Inputs other than quoted prices included within Level 1 that are observable for the asset or liability, either directly or indirectly; and Level 3: Unobservable inputs for the asset or liability. Considerable judgement is required to determine what is significant to fair value and therefore which category the asset or liability is placed in can be subjective.
For
per
sona
l use
onl
y

Western Areas Ltd & Controlled Entities ABN 68 091 049 357
Page 42 of 77
Note 1: Statement of Significant Accounting Policies
(u) Critical Accounting Estimates and Balances (Continued...)
Fair value measurement hierarchy (continued…)
The fair value of assets and liabilities classified as level 3 is determined by the use of valuation models. These include discounted cash flow analysis or the use of observable inputs that require significant adjustments based on unobservable inputs.
Estimation of useful lives of assets
The consolidated entity determines the estimated useful lives and related depreciation and amortisation charges for its property, plant and equipment and finite life intangible assets. The useful lives could change significantly as a result of technical innovations or some other event. The depreciation and amortisation charge will increase where the useful lives are less than previously estimated lives, or technically obsolete or non‐strategic assets that have been abandoned or sold will be written off or written down.
Impairment of non‐financial assets other than goodwill and other indefinite life intangible assets
The consolidated entity assesses impairment of non‐financial assets other than goodwill and other indefinite life intangible assets at each reporting date by evaluating conditions specific to the consolidated entity and to the particular asset that may lead to impairment. If an impairment trigger exists, the recoverable amount of the asset is determined. This involves fair value less costs of disposal or value‐in‐use calculations, which incorporate a number of key estimates and assumptions.
It is reasonably possible that the underlying metal price assumption may change which may then impact the estimated life of mine determinant and may then require a material adjustment to the carrying value of mining plant and equipment, mining infrastructure and mining development assets. Furthermore, the expected future cash flows used to determine the value‐in‐use of these assets are inherently uncertain and could materially change over time. They are significantly affected by a number of factors including reserves and production estimates, together with economic factors such as metal spot prices, discount rates, estimates of costs to produce reserves and future capital expenditure. At 30 June 2018, there were no impairment charge to Exploration, Evaluation and Development.
Income tax
The consolidated entity is subject to income taxes in the jurisdictions in which it operates. Significant judgement is required in determining the provision for income tax. There are many transactions and calculations undertaken during the ordinary course of business for which the ultimate tax determination is uncertain.
Provision for restoration and rehabilitation
Provision is made for the costs of Restoration and rehabilitation when the related environmental disturbance takes place as outlined in Note 15. The provision recognised represents management’s best estimate of the costs that will be incurred, but significant judgement is required as many of these costs will not crystallise until the end of the life of the mine. Estimates are reviewed annually and are based on current regulatory requirements and the estimated useful life of the mine.
For
per
sona
l use
onl
y

Western Areas Ltd & Controlled Entities ABN 68 091 049 357
Page 43 of 77
Note 1: Statement of Significant Accounting Policies
(u) Critical Accounting Estimates and Balances (Continued...)
Engineering and feasibility studies are undertaken periodically; however significant changes in the estimates of contamination, restoration standards and techniques will result in changes to provisions from period to period.
Recovery of deferred tax assets
Deferred tax assets are recognised for deductible temporary differences only if the consolidated entity considers it is probable that future taxable amounts will be available to utilise those temporary differences and losses.
Employee benefits provision
As discussed in Note (m), the liability for employee benefits expected to be settled more than 12 months from the reporting date are recognised and measured at the present value of the estimated future cash flows to be made in respect of all employees at the reporting date. In determining the present value of the liability, estimates of attrition rates and pay increases through promotion and inflation have been taken into account.
(v) Contributed equity
Ordinary shares are classified as equity. Incremental costs directly attributable to the issue of new shares or options are shown in equity as a deduction, net of tax, from the proceeds. Incremental costs directly attributable to the issue of new shares or options for the acquisition of a business are not included in the cost of the acquisition as part of the purchase consideration.
If the entity reacquires its own equity instruments, for example as the result of a share buy‐back, those instruments are deducted from equity and the associated shares are cancelled. No gain or loss is recognised in the profit and loss and the consideration paid including any directly attributable incremental costs (net of income taxes) is recognised directly in equity.
(w) Comparative figures
Where necessary, comparative figures have been restated to conform with changes in presentation for the current year.
(x) Trade and other payables
Trade and other payables represent the liabilities for goods and services received by the entity that remain unpaid at the end of the reporting period. The balance is recognised as a current liability with the amounts normally paid within 30 days of recognition of the liability.
(y) Trade and other receivables
Trade receivables are recognised initially at fair value and subsequently measured at amortised cost using the effective interest method, less provision for impairment. Trade receivables are generally due for settlement within 30 days. They are presented as current assets unless collection is not expected for more than 12 months after the reporting date.
The Group applies the simplified approach to providing for expected credit losses as prescribed by AASB 9.
For
per
sona
l use
onl
y

Western Areas Ltd & Controlled Entities ABN 68 091 049 357
Page 44 of 77
Note 1: Statement of Significant Accounting Policies
(z) Earnings per share
Basic earnings per share Basic earnings per share are calculated by dividing:
• The profit attributable to equity holders of the company, excluding any costs of servicing equity other than ordinary shares; by the,
• Weighted average number of ordinary shares outstanding during the financial year, adjusted for bonus elements in ordinary shares issued during the year (Note 18).
Diluted earnings per share Diluted earnings per share adjust the figures used in the determination of basic earnings per share to take into account: • The after income tax effect of interest and other financing costs associated with dilutive
potential ordinary shares, and • The weighted average number of additional ordinary shares that would have been
outstanding assuming the conversion of all dilutive potential ordinary shares.
(aa) New Accounting Standards and Interpretations not yet mandatory or early adopted
AASB 15 Revenue from Contracts with Customers
This standard is applicable to annual reporting periods beginning on or after 1 January 2018. The standard provides a single standard for revenue recognition.
The core principle of the standard is that an entity will recognise revenue to depict the transfer of promised goods or services to customers in an amount that reflects the consideration to which the entity expects to be entitled in exchange for those goods or services.
The standard will require: contracts (either written, verbal or implied) to be identified, together with the separate performance obligations within the contract; determine the transaction price, adjusted for the time value of money excluding credit risk; allocation of the transaction price to the separate performance obligations on a basis of relative stand‐alone selling price of each distinct good or service, or estimation approach if no distinct observable prices exist; and recognition of revenue when each performance obligation is satisfied.
Credit risk will be presented separately as an expense rather than adjusted to revenue. For goods, the performance obligation would be satisfied when the customer obtains control of the goods. For services, the performance obligation is satisfied when the service has been provided, typically for promises to transfer services to customers. For performance obligations satisfied over time, an entity would select an appropriate measure of progress to determine how much revenue should be recognised as the performance obligation is satisfied.
Contracts with customers will be presented in an entity's statement of financial position as a contract liability, a contract asset, or a receivable, depending on the relationship between the entity's performance and the customer's payment. Sufficient quantitative and qualitative disclosure is required to enable users to understand the contracts with customers; the significant judgments made in applying the guidance to those contracts; and any assets recognised from the costs to obtain or fulfil a contract with a customer.
The Group has reviewed all its sales contracts to identify potential changes in: timing of revenue recognition, measurement of the amount of revenue and note disclosure between the current standard, AASB 118 Revenue, and AASB 15.
For
per
sona
l use
onl
y

Western Areas Ltd & Controlled Entities ABN 68 091 049 357
Page 45 of 77
Note 1: Statement of Significant Accounting Policies
(aa) New Accounting Standards and Interpretations not yet mandatory or early adopted (continued...)
AASB 15 Revenue from Contracts with Customers (continued…) Currently revenue for domestic sales is recognised when the concentrates are delivered to the customers’ premises, which is the point when the customer takes over the risk and rewards of ownership transfer. The Consolidated Entity’s assessment indicates that under AASB 15, revenue will continued to be recognised on the same basis when the customer obtains control of the concentrates as this is when the consolidated entity has satisfied its performance obligations under the contract. Revenue for export sales is currently recognised when shipments of concentrates are loaded on to the vessel as the risk and reward of ownership is transferred to the customer at that point.
The Consolidated Entity’s assessment under AASB 15 indicates that the export contracts are made up of two performance obligations. The first obligation to deliver the concentrates to the port of shipment and the second obligation is to organise shipping of the concentrate, which will be satisfied when concentrates are delivered to the destination port. Under AASB 118, the Group recognises such shipping and other freight revenue and accrues the associated costs in full on loading whereas under AASB 15, freight and, where applicable, insurance, are required to be accounted for as separate performance obligations with revenue recognised over time as the service is rendered. The Group has determined that AASB 15 will have no material impact on the way the Group accounts for its revenue. AASB 16 Leases
This standard is applicable to annual reporting periods beginning on or after 1 January 2019. The standard replaces AASB 117 'Leases' and for lessees will eliminate the classifications of operating leases and finance leases. Subject to exceptions, a 'right‐of‐use' asset will be capitalised in the statement of financial position, measured as the present value of the unavoidable future lease payments to be made over the lease term. The exceptions relate to short‐term leases of 12 months or less and leases of low‐value assets (such as personal computers and small office furniture) where an accounting policy choice exists whereby either a 'right‐of‐use' asset is recognised or lease payments are expensed to profit or loss as incurred. A liability corresponding to the capitalised lease will also be recognised, adjusted for lease prepayments, lease incentives received, initial direct costs incurred and an estimate of any future restoration, removal or dismantling costs. Straight‐line operating lease expense recognition will be replaced with a depreciation charge for the leased asset (included in operating costs) and an interest expense on the recognised lease liability (included in finance costs). The Group has yet to commence an assessment of the impact of AASB 16. Management intend to commence the development of an implementation plan prior to 30 June 2019. It is expected that the plan is likely to involve the establishment of an implementation team whose responsibility will be to firstly gain a clear understanding of the requirements of the new Standards, and thereafter assess the potential impact on the Group (in the form of accounting and disclosure, taxation, systems and processes and internal controls) of this new Standard. This assessment will then establish the areas that require change for the purposes of full implementation. As part of finalising the plan, Management will determine the appropriate adoption date and transition method, as well as ensuring appropriate communication with relevant stakeholders.
For
per
sona
l use
onl
y

Western Areas Ltd & Controlled Entities ABN 68 091 049 357
Page 46 of 77
Note 2: Other income & Profit on Sale of Tenements & Investments
Consolidated Entity2018 $’000
2017 $’000
‐ Interest income 2,611 1,872
‐ Other income 879 829
‐ Profit on sale of PP&E 4 ‐
‐ Partial Exemption Certificate credits ‐ 1,785
Total other income 3,494 4,486
Profit on sale of Bluejay Plc shares ‐ 12,417
Profit on discontinuance of equity accounting ‐ 13,178
Profit on sale of tenements to Kidman Resources Ltd ‐ 7,468
Total profit on sale of tenements & investments ‐ 33,063
Note 3: Dividends
Dividends proposed
A fully franked final dividend of 2 cents per share is proposed for the year ended 30 June 2018 (2017: 2 cents per ordinary share)
5,470 5,446
Dividends paid 5,456 5,446
A final dividend of 2 cents per share was paid for the year ended 30 June 2017 (2016: Nil).
5,445 ‐
No interim dividend for 2018 (2017: Nil) ‐ ‐
5,445 ‐
Note 4: Profit before income tax
Profit before income tax includes the following specific expenses:
‐ Depreciation of property, plant and equipment 17,764 17,711
‐ Amortisation of mine development asset 47,108 48,006
‐ Rental expenditure relating to operating leases 1,019 1,186
‐ Employee benefits expense
Defined contribution superannuation expense 2,117 2,107
‐ Finance costs:
Provisions: unwinding of discount 1,297 1,227
Interest expense – finance leases 24 14
Borrowing costs amortised 613 613
Total borrowing costs 1,934 1,854
For
per
sona
l use
onl
y

Western Areas Ltd & Controlled Entities ABN 68 091 049 357
Page 47 of 77
Note 5: Trade and Other Receivables
Consolidated Entity2018 $’000
2017 $’000
Trade debtors 19,855 8,851
Other receivables 929 2,088
GST refund due 1,128 1,050
Prepayments 297 7,193
22,209 19,182
There are no balances within trade debtors and other receivables that contain amounts that are past due but not impaired. It is expected the balances will be received when due as there is no recent history of default or expectation that they will default.
Note 6: Inventories
Ore stockpiles 26,765 16,177
Nickel concentrate stockpiles 3,634 1,281
Consumables and spare parts 4,406 3,822
34,805 21,280
Note 7: Income Tax
The components of the tax expense comprise:
‐ Current tax ‐ ‐
‐ Deferred tax 4,594 (211)
‐ R&D Tax offset (246) (510)
‐ Adjustment of current tax for prior periods 978 (1,228)
Income tax expense / (benefit) 5,326 (1,949)
The prima facie tax on the profit from ordinary activities before income tax at the statutory income tax rate compared to the income tax expense at the groups’ effective income tax rate is reconciled as follows:
Prima facie tax on profit before income tax at 30% (2017: 30%) 5,149 5,205
Adjusted for the tax effect of:
‐ Exploration write‐off ‐ 14
‐ Share based payment expense 1,079 918
‐ Sale of foreign investment ‐ (7,679)
‐ Foreign branch losses (Bluejay mining Plc) ‐ 208
‐ Other temporary differences 821 (333)
‐ Income tax benefit on share based payments (1,723) (282)
Tax Expense / (Benefit) 5,326 (1,949)
For
per
sona
l use
onl
y

Western Areas Ltd & Controlled Entities ABN 68 091 049 357
Page 48 of 77
Note 8: Property, Plant and Equipment
Consolidated Entity
2018 $’000
2017 $’000
Property – at cost 48,049 48,049
Accumulated depreciation (33,294) (28,638)
14,755 19,411
Plant & equipment – at cost 145,693 144,245
Work in Progress – at cost 31,520 9,571
Accumulated depreciation (103,933) (91,052)
73,280 62,764
Plant & equipment under lease 2,428 1,942
Accumulated depreciation (1,460) (1,233)
968 709
Total property, plant & equipment – at cost 227,690 203,807
Accumulated Depreciation (138,687) (120,923)
Total 89,003 82,884
Assets Pledged as Security The property, plant and equipment are assets over which a mortgage has been granted as security over project loans. The terms of the mortgage preclude the assets from being sold or being used as security for further mortgages without the permission of the existing mortgagor. Assets under lease are pledged as security for the associated lease liabilities (Note 14(b)).
Movement in carrying amounts:
Movement in the carrying amounts for each class of property, plant and equipment between the beginning and the end of the current year: Property
Written down value at the beginning of the year 19,411 23,135
‐ Additions ‐ 872
‐ Depreciation expense (4,656) (4,596)
Written down value at the end of the year 14,755 19,411
Plant & Equipment
Written down value at the beginning of the year 62,764 72,683
‐ Additions 23,397 3,010
‐ Depreciation expense (12,881) (12,929)
Written down value at the end of the year 73,280 62,764
Plant & Equipment under Lease
Written down value at the beginning of the year 709 547
‐ Additions 486 348
‐ Depreciation expense (227) (186)
Written down value at the end of the year 968 709
For
per
sona
l use
onl
y

Western Areas Ltd & Controlled Entities ABN 68 091 049 357
Page 49 of 77
Note 9: Financial Assets
Consolidated Entity
2018 $’000
2017 $’000
Opening Balance 11,396 1,281
‐ Disposal of investment in associate ‐ (280)
‐ Fair value of consideration received for Tenement sale ‐ 5,222
‐ Proceeds on farm in joint venture at initial fair value ‐ 2,527
‐ Changes in fair value through other comprehensive income 21,911 2,646
33,307 11,396
In accordance with the terms of AASB 9, the Company made an irrevocable election to recognise movements in the fair value of its shares in Kidman Resources Ltd and Grid Metals Inc at each reporting period through Other Comprehensive Income. As at 30 June 2018, the investment in Kidman was fair valued at $32.42 million (2017:$10.63 million).
Note 10: Exploration & Evaluation Expenditure Exploration & Evaluation Expenditure consists of:
‐ At cost 70,679 60,052
‐ Cosmos Nickel Complex 27,105 27,105
Total Exploration and Evaluation Expenditure 97,784 87,157
Movement in carrying amount:
Movement in the carrying amounts for exploration and evaluation expenditure between the beginning and the end of the current period:
Written down value at the beginning of the year 87,157 80,360
‐ Expenditure incurred during the year 10,627 7,126
‐ Tenements sold at written down value ‐ (281)
‐ Write‐off ‐ (48)
Written down value at the end of the year 97,784 87,157
Carry Forward Exploration & Evaluation Expenditure
The recovery of the costs of exploration and evaluation expenditure carried forward is dependent upon the discovery of commercially viable mineral and other natural resource deposits and their subsequent development and exploitation or alternatively their sale.
For
per
sona
l use
onl
y

Western Areas Ltd & Controlled Entities ABN 68 091 049 357
Page 50 of 77
Note 11: Mine Properties
Consolidated Entity
2018 $’000
2017 $’000
Capitalised development expenditure consists of:
‐ Mine development 166,796 154,872
‐ Acquisition of mining assets 59,796 59,796
‐ Exploration expenditure transfer 76,000 76,000
‐ Deferred mining expenditure 371,825 349,781
‐ Capitalised restoration costs 11,645 11,645
‐ Capitalised interest 11,175 11,175
‐ Accumulated amortisation (554,564) (507,456)
Total Mine Development 142,673 155,813
Movement in carrying amount:
Movement in the carrying amounts for mine development expenditure between the beginning and the end of the current period:
Development Expenditure
Written down value at the beginning of the year 155,813 183,579
‐ Additions 33,968 20,240
‐ Amortisation charge for the year (47,108) (48,006)
Written down value at the end of the year 142,673 155,813
Note 12: Deferred Tax Liabilities
The balance comprises temporary differences attributable to:
(a) Liabilities
‐ Exploration & evaluation expenditure (21,151) (17,707)
‐ Mine development (6,780) (9,997)
‐ Other (213) (274)
(28,144) (27,978)
(b) Assets
‐ Property, plant and equipment 5,061 5,002
‐ Provisions 5,006 5,838
‐ Tax losses 3,879 9,752
‐ Employee share trust 1,178 192
‐ Other 2,524 1,292
17,648 22,076
Net deferred tax liabilities (10,496) (5,902)
For
per
sona
l use
onl
y

Western Areas Ltd & Controlled Entities ABN 68 091 049 357
Page 51 of 77
Note 12: Deferred Tax Liabilities
Consolidated Entity
2018 $’000
2017 $’000
(c) Reconciliation (i) Gross movement The overall movement in the deferred tax account is as follows:
Opening balance (5,902) (6,113)(Credit) / Debit to income statement (4,594) 211Closing balance (10,496) (5,902)
(ii) Deferred tax liability The movement in the deferred tax liabilities for each temporary difference during the year is as follows:
Exploration & development expenditure Opening balance (17,707) (50,782)(Debit) / Credit to income statement (3,444) 33,075Closing balance (21,151) (17,707)
Mine development Opening balance (9,997) 27,673Credit / (Debit) to income statement 3,217 (37,670)Closing balance (6,780) (9,997)
Other Opening balance (274) (286)Credit to income statement 61 12Closing balance (213) (274)
(iii) Deferred tax assets The movement in the deferred tax assets for each temporary difference during the year is as follows:
Provisions Opening balance 5,838 5,583(Debit) / Credit to income statement (832) 255Closing balance 5,006 5,838
Property, plant and equipment Opening balance 5,002 (1,938)Credit to income statement 59 6,940Closing balance 5,061 5,002
Tax losses Opening balance 9,752 11,378Debit to income statement (5,873) (1,626)Closing balance 3,879 9,752
Employee share trust Opening balance 192 965Credit / (Debit) to income statement 986 (773)Closing balance 1,178 192
Other Opening balance 1,292 1,294Credit / (Debit) to income statement 1,232 (2)Closing balance 2,524 1,292
For
per
sona
l use
onl
y

Western Areas Ltd & Controlled Entities ABN 68 091 049 357
Page 52 of 77
Note 13: Trade & Other Payables
Consolidated Entity
2018 $’000
2017 $’000
Trade payables 17,792 8,255
Accrued expenses 23,604 18,090
41,396 26,345
Note 14: Borrowings
Current
Lease liabilities 267 170
267 170
Non Current
Lease liabilities 445 304
445 304
(a) Corporate loan facility
The Corporate Loan facility can be made available for broad company purposes as agreed between the Australia and New Zealand Banking Group Ltd (ANZ) and Western Areas Ltd. In December 2017 the ANZ corporate loan facility (facility) was renegotiated by the Company. The new facility is a secured, two year, A$25m revolving cash facility. The initial term of the facility is 12 months, which is extendable for a further 12 months (24 months in total).
The carrying value of assets secured under the corporate loan facility is as follows:
Mine properties 11 142,673 155,813
Property, plant & equipment 8 88,035 82,175
230,708 237,988
(b) Lease liabilities
The lease liabilities are secured over the assets under the lease. The finance leases have an average term of 3 years and an average implicit discount rate of 5.05%. Refer to Note 8 for the carrying value of the assets under lease.
For
per
sona
l use
onl
y

Western Areas Ltd & Controlled Entities ABN 68 091 049 357
Page 53 of 77
Note 15: Provisions
Consolidated Entity
2018 $’000
2017 $’000
Current
Employee Entitlements 4,514 3,323
Non Current
Rehabilitation and restoration cost
Opening balance 22,917 22,649
Unwinding of discount 1,297 1,227
Rehabilitation expenditure incurred during the period (123) (959)
Closing balance 24,091 22,917
Employee entitlements 317 627
24,408 23,544
(a) Employee entitlements relate to the balance of annual leave and long service leave accrued by the consolidated entity’s employees. Recognition and measurement criteria have been disclosed in Note 1.
(b) Rehabilitation and restoration costs relate to an estimate of restoration costs that will result from the development of the Forrestania Nickel Project and Cosmos Nickel Project. Based on the current known mine life, restoration activities are not expected to commence within the next 8 years, following full exhaustion of mine life rehabilitation activities will be undertaken.
Note 16: Derivative financial instruments
Current Assets
Foreign exchange / nickel options – current assets ‐ 420
Foreign exchange / nickel options – current liabilities 1,592 ‐
Collar options are used to hedge cash flow risk associated with future transactions. Gains and losses arising from changes in the fair value of derivatives are initially recognised directly in the statement of comprehensive income. At the date of settlement, amounts included in the hedge reserve are transferred from equity and included in the income statement.
For
per
sona
l use
onl
y

Western Areas Ltd & Controlled Entities ABN 68 091 049 357
Page 54 of 77
Note 17: Issued Capital
Consolidated Entity
2018 $’000
2017 $’000
272,792,647 fully paid ordinary shares (2017: 272,276,625) 442,963 442,963
Movements in issued capital
Number of Shares
$’000
2018
Balance at beginning of the financial year 272,276,625 442,963
‐ Performance rights vested issued as shares 482,422 ‐
‐ Tax exempt share plan shares 33,600 ‐
Balance at end of the financial year 272,792,647 442,963
2017
Balance at beginning of the financial year 270,924,958 442,963
‐ Performance rights vested issued as shares 1,307,740 ‐
‐ Tax exempt share plan shares 43,927 ‐
Balance at end of the financial year 272,276,625 442,963
Capital management
The Board’s policy is to maintain a strong capital base so as to maintain investor, creditor, and market confidence and to sustain future development of the business. There were no changes to the consolidated entity’s approach to capital management during the year. Neither the Company nor any of its subsidiaries are subject to externally imposed capital requirements.
The Board effectively manages the Group’s capital by assessing the Group’s financial risks and adjusting its capital structure in response to changes in these risks and in the market. These responses include the management of debt levels, distributions to shareholders and share issues.
Performance rights
Information relating to performance rights issued, exercised and lapsed during the year and the performance rights outstanding at the end of the year are detailed in Note 29 Share Based Payments.
Terms and conditions of ordinary shares
Ordinary shares have the right to receive dividends as declared and, in the event of winding up the Company, to participate in the proceeds from the sale of all surplus assets in proportion to the number of and amounts paid upon shares held.
Ordinary shares entitle their holder to one vote, either in person or by proxy, at a meeting of the Company.
Tax Exempt Share Plan
During February 2018, the Company issued $1,000 worth of shares to eligible employees under the newly introduced Western Areas Ltd Tax Exempt Share Plan, eligible employees were those that satisfied the minimum service condition and were not included in the existing performance rights plan.
For
per
sona
l use
onl
y

Western Areas Ltd & Controlled Entities ABN 68 091 049 357
Page 55 of 77
Note 18: Earnings Per Share
Consolidated Entity
2018 $’000
2017 $’000
2018 $’000
2017 $’000
Earnings used to calculate basic / diluted earnings per share 11,837 19,299
2018
Number 2017
Number
Weighted average number of ordinary shares outstanding during the year used in calculating basic earnings per share
272,746,202 272,081,823
Weighted average number of ordinary shares outstanding during the year used in calculating dilutive earnings per share
277,113,672 275,329,044
Note 19: Cash Flow Information
a) Reconciliation of the net profit after tax to net cash provided by operating activities
Profit after income tax 11,837 19,299
Depreciation expense 17,764 17,711
Amortisation expense 47,721 48,619
Impairment / write‐off expenses ‐ 48
Profit on discontinue of equity accounting and sale of Bluejay shares ‐ (25,595)
Profit on sale of tenements ‐ (7,468)
Other 1,533 (1,125)
Share based payment expense 3,598 3,060
Rehabilitation provision interest unwound 1,297 1,227
Rehabilitation expense (123) (959)
Provision for employee entitlements 881 586
Change in Assets and Liabilities
Increase in trade and other payables 10,003 2,262
Increase in inventories (13,524) (6,520)
(Increase) / Decrease in trade and other receivables (9,216) 17,164
Decrease in interest receivable (131) (170)
Increase / (Decrease) in tax liabilities 5,326 (1,949)
Net cash provided by operating activities 76,966 66,190
b) Reconciliation of Cash and Cash Equivalents
Cash and cash equivalents comprises :
Cash on hand and at bank 151,643 140,294
For
per
sona
l use
onl
y

Western Areas Ltd & Controlled Entities ABN 68 091 049 357
Page 56 of 77
Note 19: Cash Flow Information (Continued…)
c) Financing Facilities Available As at the reporting date the Consolidated Entity had the following financing facilities in place: Total Facility Utilised at Balance Date Available Facilities (*)
$’000 $’000 $’000
Banking Facilities:‐
ANZ Banking Group
‐ Cash advance facility* 25,000 ‐ 25,000
‐ Asset Finance 1,000 679 321
Performance Guarantees:‐
ANZ Banking Group
‐ Security bond facility 1,000 472 528
27,000 1,151 25,849
* The Corporate Loan facility can be made available for broad company purposes as agreed between the Australia and New Zealand Banking Group Ltd (ANZ) and Western Areas Ltd (refer Note 13a).
d) Non Cash Financing Activities
During the year, the consolidated entity acquired plant & equipment by means of a finance lease to the value of $486k (2017: $348k).
Note 20: Commitments
The Directors are not aware of any commitments as at the date of these financial statements other than those listed below.
Consolidated Entity
2018 $’000
2017 $’000
a) Operating Lease Commitments Non‐cancellable operating leases contracted for but not capitalised in the accounts. ‐ no later than 1 year 645 680
‐ later than 1 year and not later than 5 years 1,436 2,081
Lease expenditure contracted for at year end 2,081 2,761
The operating leases are for miscellaneous office equipment and office premises in West Perth. The West Perth office lease expires August 2021.
b) Finance Lease Commitments ‐ no later than 1 year 267 170
‐ later than 1 year and not later than 5 years 445 304
Total Minimum Lease Payments 712 474
‐ future finance charges 53 35
Total Lease Liability 765 509
‐ current 297 197
‐ non current 468 312
765 509
For
per
sona
l use
onl
y

Western Areas Ltd & Controlled Entities ABN 68 091 049 357
Page 57 of 77
Note 20: Commitments (Continued…) b) Finance Lease Commitments (Continued…) The finance lease commitments relate primarily to motor vehicles, but also include some office equipment. Motor vehicles are finance leased under 3 year contracts at normal commercial rates, balloon payments are generally required at the expiry of the finance lease, at which point the Company takes ownership of the vehicle.
c) Capital Expenditure Commitments
Consolidated Entity
2018 $’000
2017 $’000
‐ no later than 1 year 25,784 11,963
‐ later than 1 year and not later than 5 years ‐ ‐
Total minimum commitments 25,784 11,963
On 10 April 2018, the Company announced the commencement of an early works program for the Odysseus Project at Cosmos. A total of $32m has been approved by the Board and will comprise three major work groups staged over an eighteen‐month period. For full details please refer to the ASX Announcement dated 10 April 2018.
d) Exploration Expenditure Commitments
‐ no later than 1 year 6,255 5,143
‐ later than 1 year and not later than 5 years 25,020 20,572
Total Minimum Payments 31,275 25,715
Under the terms and conditions of the Company’s title to its various tenements, it has an obligation to meet tenement rents and minimum levels of exploration expenditure as gazetted by the Department of Mines and Petroleum. Some of this cost may be met by joint venture partners.
Note 21: Auditor Remuneration
During the year the following fees were paid or payable for services provided by the auditor of the Company:
‐ Audit and review of financial statements 92 94
‐ Audit of Jobs and Competitiveness Program Assistance Application
5 5
97 99
Note 22: Material Contracts
The Company has two main customers. A summary of the key terms of the off‐take agreements entered into with these customers are detailed below. Credit risk associated with these customers is detailed in Note 27.
A 3 year Offtake Contract with BHP Nickel West (BHPNW) effective 1 February 2017 to deliver up 10,000 tonnes of nickel contained in concentrate per annum with a 30,000 tonne aggregate limit.
A 3 year Offtake Contract with Tsingshan Group (Tsingshan), through its associated entity Golden Harbour Pte Ltd, effective 1 February 2017 to deliver up 10,000 tonnes of nickel contained in concentrate per annum.
For
per
sona
l use
onl
y

Western Areas Ltd & Controlled Entities ABN 68 091 049 357
Page 58 of 77
Note 23: Contingent Liabilities The Directors are not aware of any contingent liabilities as at the date of these financial statements.
Note 24: Subsequent Events On 22 August 2018, the Board of Directors declared a fully franked dividend of 2 cents per share to the holders of fully paid ordinary shares.
Other than the matter detailed above, there have been no subsequent events after 30 June 2018 which had a material effect on the financial statements for the year ended 30 June 2018.
Note 25: Statement of Operations by Segments
Identification of reportable segment
The group identifies its operating segments based on the internal reports that are reviewed and used by the board of directors (chief operating decision makers) in assessing performance and determining the allocation of resources.
Basis of accounting for purposes of reporting by operating segments
Accounting policies adopted
Unless stated otherwise, all amounts reported to the Board of Directors as the chief decision maker is in accordance with accounting policies that are consistent to those adopted in the annual financial statements of the Group.
Note 26: Key Management Personnel Key Management Personnel
Key management personnel of the Consolidated Entity (as defined by AASB 124: Related Party transactions) include the following:
I Macliver Chairman (Non‐Executive) R Yeates Director (Non‐Executive) C Readhead Director (Non‐Executive) T Netscher Director (Non‐Executive) N Streltsova Director (Non‐Executive) D Lougher Managing Director D Southam Executive Director J Belladonna Chief Financial Officer / Company Secretary W Jones General Manager Operations
Refer to the remuneration report contained in the Directors’ report for details of the remuneration paid or payable to each member of the group’s key management personnel for the year ended 30 June 2018.
The total of remuneration paid to key management personnel of the Consolidated Entity during the year is detailed below:
Consolidated Entity
2018 $’000
2017 $’000
Short term employee benefits 3,882 3,576
Share based payments 1,954 1,914
Post‐employment benefits 215 222
6,051 5,712
For
per
sona
l use
onl
y

Western Areas Ltd & Controlled Entities ABN 68 091 049 357
Page 59 of 77
Note 27: Financial Risk Management
Financial Risk Management Policies
The Treasury Committee consisting of senior management meets on a regular basis to analyse and discuss amongst other issues, monitoring and managing financial risk exposures of the consolidated entity. The Treasury Committee monitors the consolidated entity financial risk management policies and exposures and approves financial transactions within the scope of its authority. It also reviews the effectiveness of internal controls relating to commodity price risk, counter party credit risk, currency risk, financing risk and interest rate risk.
The Treasury Committee’s overall risk management strategy seeks to assist the consolidated entity in meeting its financial targets, while minimising potential adverse effects on financial performance. Its functions include the review of the use of hedging derivative instruments, credit risk policies and future cash flow requirements.
Specific Financial Risk Exposures and Management
The main risks the Group is exposed to through its financial instruments are credit risk, liquidity risk and market risk consisting of interest rate risk, foreign currency risk and commodity and equity price risk.
a) Credit Risk
Credit risk refers to the risk that a counterparty will default on its contractual obligations resulting in financial loss to the consolidated entity. The consolidated entity has adopted a policy of only dealing with creditworthy counterparties as a means of mitigating the risk of financial loss from defaults.
The carrying amount of financial assets exposed to credit risk is detailed below:
Consolidated Entity
2018 $’000
2017 $’000
Cash and cash equivalents 151,643 140,294
Trade and other receivables 22,209 19,182
Financial assets at fair value through other comprehensive income 33,307 11,396
Derivative financial instruments ‐ 420
Cash and cash equivalents and derivative financial instruments
The credit risk on liquid funds and derivative financial instruments is limited because the counterparties are banks with high credit‐ratings.
Trade and other receivables
The consolidated entity does not have significant credit risk exposure to trade receivables as the consolidated entity’s customers are considered to be of high credit quality. There were no balances within trade and other receivables that are past due. It is expected these balances will be received when due. Export sales are conducted under an irrevocable letter of credit prior to product being loaded at the port of Esperance.
Financial assets at fair value through other comprehensive income
Credit risk on financial assets at fair value through other comprehensive income is minimised by undertaking transactions with recognised counterparties on recognised exchanges.
For
per
sona
l use
onl
y

Western Areas Ltd & Controlled Entities ABN 68 091 049 357
Page 60 of 77
Note 27: Financial Risk Management (Continued…)
b) Liquidity Risk
Liquidity risk arises from the possibility that the Group might encounter difficulty in settling its debts or otherwise meeting its obligations related to financial liabilities. The Group manages this risk through the following mechanisms which include:
• preparing forward looking cash flow analysis in relation to its operational, investing and financing activities
• using derivatives that are only traded in highly liquid markets
• monitoring undrawn credit facilities, to the extent that they exist
• obtaining funding from a variety of sources
• maintaining a reputable credit profile
• managing credit risk related to financial assets
• investing surplus cash only with major financial institutions
• comparing the maturity profile of financial liabilities with the realisation profile of financial assets
The tables below reflect an undiscounted contractual maturity analysis for financial assets and liabilities. Cash flows realised from financial assets reflect management’s expectation as to the timing of realisation. Actual timing may therefore differ from that disclosed. The timing of cash flows presented in the table to settle financial liabilities reflects the earliest contractual settlement dates and does not reflect management’s expectations that banking facilities will be rolled forward.
Financial liability and financial asset maturity analysis
The Consolidated Entity’s contractual maturity analysis of financial assets and financial liabilities is shown below:
For
per
sona
l use
onl
y

Western Areas Ltd & Controlled Entities ABN 68 091 049 357
Page 61 of 77
Note 27: Financial Risk Management (Continued…) b) Liquidity Risk (Continued…)
2018 Consolidated Entity
1 year or less$’000
Over 1 to 5 years $’000
More than 5 Years $’000
Total
contractual cash flows $’000
Financial Assets – Non Derivative
Cash and Cash Equivalents 151,643 ‐ ‐ 151,643
Trade and Other Receivables 22,209 ‐ ‐ 22,209
Financial assets at fair value through other comprehensive income
‐ ‐ 33,307 33,307
173,852 ‐ 33,307 207,159
Financial Liabilities – Non Derivative
Trade and Other Payables 41,396 ‐ ‐ 41,396
Lease Liabilities 267 445 ‐ 712
Financial Liabilities –Derivative
Derivative Collar Options (net settled) 1,592 ‐ ‐ 1,592
43,255 445 ‐ 43,700
Net Financial Assets/(Liabilities) 130,597 (445) 33,307 163,459
2017 Consolidated Entity
1 year or less$’000
Over 1 to 5 years $’000
More than 5 Years $’000
Total
contractual cash flows $’000
Financial Assets – Non Derivative
Cash and Cash Equivalents 140,294 ‐ ‐ 140,294
Trade and Other Receivables 19,182 ‐ ‐ 19,182
Financial assets at fair value through other comprehensive income
‐ ‐ 11,396 11,396
Financial Assets –Derivative
Derivative Collar Options (net settled) 420 ‐ ‐ 420
159,896 ‐ 11,396 171,292
Financial Liabilities – Non Derivative
Trade and Other Payables 26,345 ‐ ‐ 26,345
Lease Liabilities 170 304 ‐ 474
26,515 304 ‐ 26,819
Net Financial Assets/(Liabilities) 133,381 (304) 11,396 144,473
For
per
sona
l use
onl
y

Western Areas Ltd & Controlled Entities ABN 68 091 049 357
Page 62 of 77
Note 27: Financial Risk Management (Continued…)
c) Market Risk
Market risk is the risk that the fair value or future cash flows of a financial instrument will fluctuate because of changes in market prices. Market risk comprises three types of risk: interest rate risk, price risk and currency risk.
i) Interest Rate Risk
Exposure to interest rate risk arises on financial assets and financial liabilities recognised at reporting date whereby a future change in interest rates will affect future cash flows or the fair value of fixed rate financial instruments. Interest rate risk is managed using a mix of fixed and floating rate debt.
At the reporting date, the interest rate risk profile of the consolidated entity’s interest bearing financial instruments was as follows:
2018 Consolidated Entity
Floating Interest Rate $’000
Fixed Interest maturing in: Non‐
Interest Bearing $’000
Total $’000
Weighted Average Interest Rate
1 year or less $’000
Over 1 to 5 years $’000
More than 5 Years $’000
Financial Assets
Cash and Cash Equivalents 151,643 ‐ ‐ ‐ ‐ 151,643 2.62%
Trade and Other Receivables
‐ ‐ ‐ ‐ 22,209 22,209
Financial assets at fair value through other comprehensive income
‐ ‐ ‐ ‐ 33,307 33,307
151,643 ‐ ‐ ‐ 55,516 207,159
Financial Liabilities
Trade and Other Payables ‐ ‐ ‐ ‐ 41,396 41,396
Lease liability ‐ 267 445 ‐ ‐ 712 5.05%
‐ 267 445 ‐ 41,396 42,108
Net Financial Assets / (Liabilities)
151,643 (267) (445) ‐ 14,120 165,051
For
per
sona
l use
onl
y

Western Areas Ltd & Controlled Entities ABN 68 091 049 357
Page 63 of 77
Note 27: Financial Risk Management (Continued…)
c) Market Risk (Continued...)
i) Interest Rate Risk (Continued...)
2017 Consolidated Entity
Floating Interest Rate $’000
Fixed Interest maturing in: Non‐
Interest Bearing $’000
Total $’000
Weighted Average Interest Rate
1 year or less $’000
Over 1 to 5 years $’000
More than 5 Years $’000
Financial Assets
Cash and Cash Equivalents 140,294 ‐ ‐ ‐ ‐ 140,294 2.48%
Trade and Other Receivables
‐ ‐ ‐ ‐ 19,182 19,182
Financial assets at fair value through other comprehensive income
‐ ‐ ‐ ‐ 11,396 11,396
140,294 ‐ ‐ ‐ 30,578 170,872
Financial Liabilities
Trade and Other Payables 26,345 26,345
Lease liability ‐ 170 304 ‐ ‐ 474 4.88%
‐ 170 304 ‐ 26,345 26,819
Net Financial Assets / (Liabilities)
140,294 (170) (304) ‐ 4,233 144,053
Interest rate sensitivities have not been included in the financial report as the changes in profit before tax due to changes in interest rate is not material to the results of the Consolidated Entity.
ii) Price Risk
a) Equity Price Risk
The consolidated entity is exposed to equity securities price risk. This arises from investments held by the Group and classified on the statement of financial position as financial assets at fair value through other comprehensive income.
A majority of the consolidated entity’s equity investments are publicly traded and are quoted either on the ASX or the TSXV.
The table below summarises the impact of increases/decreases of these two indexes on the Consolidated Entity's comprehensive income. The analysis is based on the assumption that the equity indexes had increased by 10% / decreased by 10% (2017 – increased by 10% / decreased by 10%) and foreign exchange rate increased by 5% / decrease by 5% (2017 increased by 5% / decrease by 5%) with all other variables held constant and all the Consolidated Entity’s equity instruments moved according to the historical correlation with the index. The percentages are the sensitivity rates used when reporting equity price risk internally to key management personnel and represents management’s assessment of the possible change in equity prices.
For
per
sona
l use
onl
y

Western Areas Ltd & Controlled Entities ABN 68 091 049 357
Page 64 of 77
Note 27: Financial Risk Management (Continued…)
ii) Price Risk (Continued...)
a) Equity Price Risk (Continued...)
Consolidated Entity
30 June 2018 $’000
30 June 2017 $’000
Financial assets at fair value through other comprehensive income Index
ASX 3,242 532
TSXV 142 121
Comprehensive income would increase/decrease as a result of gains/losses on equity securities classified as financial assets at fair value through other comprehensive income. A decrease in the share price and exchange rate would result in a further decrease in fair value compared to cost.
b) Commodity Price Risk
The Consolidated Entity is exposed to commodity price risk. Commodity price risk arises from the sale of nickel. The entity manages its commodity price risk exposure arising from future commodity sales through sensitivity analysis, cash flow management and forecasting and where appropriate utilise derivative financial instruments to reduce price risk.
The following table details the Consolidated Entity’s sensitivity to a US$500 / tonne increase and decrease in the nickel price. US$500 is the sensitivity rate used when reporting commodity price risk internally to key management personnel and represents management’s assessment of the possible change in commodity price. The table below assumes all other variables remaining constant.
Sensitivity analysis
Profit Equity
$‘000 $‘000
Year Ended 30 June 2018
+‐ $500 / tonne nickel +/‐147 +/‐147
Year Ended 30 June 2017
+‐ $500 / tonne nickel +/‐120 +/‐120
Nickel Collar Options
The consolidated entity enters into financial transactions in the normal course of business and in line with Board guidelines for the purpose of hedging and managing its expected exposure to nickel prices. The hedges are treated as cashflow hedges in accordance with AASB 9 “Financial Instruments: Recognition and Measurement”. The following table summarises the nickel collar options open at 30 June 2018.
Exchange Rate
2018 $000
2017 $
Consolidated Group Collar Options Collar Options
Nickel Tonnes 3,600 ‐ US Price ($/tonne) Cap 15,587 ‐ USD Value ($’000) 56,113 ‐ US Price ($/tonne) Floor 13,167 ‐ USD Value ($’000) 47,401 ‐
For
per
sona
l use
onl
y

Western Areas Ltd & Controlled Entities ABN 68 091 049 357
Page 65 of 77
Note 27: Financial Risk Management (Continued…)
c) Market Risk (Continued…)
iii) Currency Risk
Currency risk arises when future commercial transactions and recognised financial assets and liabilities are denominated in a currency that is not the entity’s functional currency. The Consolidated Entity manages its foreign currency risk exposure through sensitivity analysis, cash flow management, forecasting and where appropriate, utilises derivative financial instruments. The carrying amount of the Consolidated Entity’s foreign currency denominated monetary assets and monetary liabilities at the reporting date is as follows:
30 June 2018 30 June 2017
Financial liabilities Financial assets Financial liabilities Financial assets
US$ ‘000 ‐ 9,655 ‐ 15,494
The following table details the consolidated entity’s sensitivity to a 5% increase and decrease in the Australian Dollar against the relevant foreign currencies. 5% is the sensitivity rate used when reporting foreign currency risk internally to key management personnel and represents management’s assessment of the possible change in foreign exchange rates. The sensitivity analysis includes only outstanding foreign currency denominated monetary items and adjusts their translation at the period end for a 5% change in foreign currency rates.
Sensitivity analysis
Profit Equity
$‘000 $‘000
Year Ended 30 June 2018
+ 5% in $A/$US 850 850
‐ 5% in $A/$US (886) (886)
Year Ended 30 June 2017
+ 5% in $A/$US 1,061 1,061
‐ 5% in $A/$US (960) (960)
Foreign exchange collar options
The consolidated entity had open foreign exchange collar options at 30 June 2018 relating to highly probable forecast transactions and recognised financial assets and financial liabilities. These contracts commit the Group to buy and sell specified amounts of foreign currencies in the future at specified exchange rates. The hedges are treated as cash flow hedges in accordance with AASB 9 “Financial Instruments: Recognition and Measurement”.
The following table summarises the notional amounts of the consolidated entity’s commitments in relation to foreign exchange collar options. The notional amounts do not represent amounts exchanged by the transaction counter parties and are therefore not a measure of the exposure of the consolidated entity through the use of these contracts.
Notional Amounts Exchange Rate
2018 $000
2017 $000
2018 $
2017 $
Consolidated Group
Buy AUD / Sell USD Put Call Put Call Settlement less than 6 months 30,000 15,000 0.737‐0.788 0.725‐0.755 6 months to 1 year ‐ ‐ ‐ ‐
For
per
sona
l use
onl
y
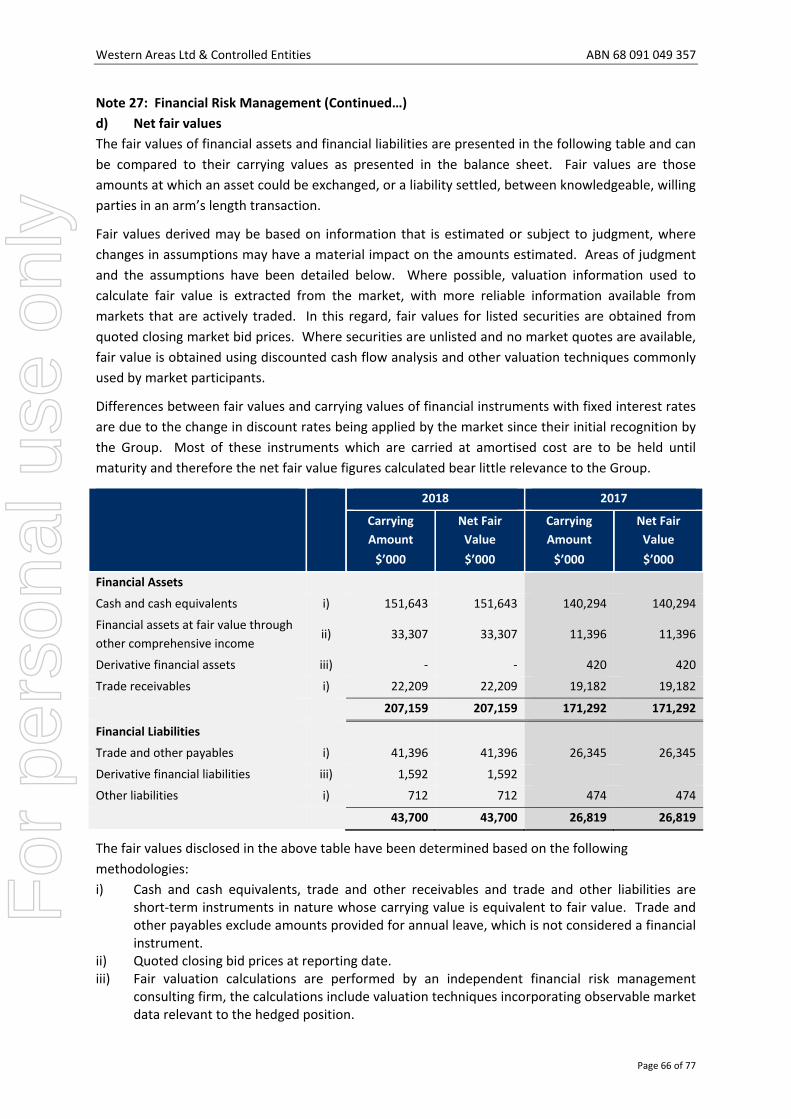
Western Areas Ltd & Controlled Entities ABN 68 091 049 357
Page 66 of 77
Note 27: Financial Risk Management (Continued…) d) Net fair values The fair values of financial assets and financial liabilities are presented in the following table and can be compared to their carrying values as presented in the balance sheet. Fair values are those amounts at which an asset could be exchanged, or a liability settled, between knowledgeable, willing parties in an arm’s length transaction.
Fair values derived may be based on information that is estimated or subject to judgment, where changes in assumptions may have a material impact on the amounts estimated. Areas of judgment and the assumptions have been detailed below. Where possible, valuation information used to calculate fair value is extracted from the market, with more reliable information available from markets that are actively traded. In this regard, fair values for listed securities are obtained from quoted closing market bid prices. Where securities are unlisted and no market quotes are available, fair value is obtained using discounted cash flow analysis and other valuation techniques commonly used by market participants.
Differences between fair values and carrying values of financial instruments with fixed interest rates are due to the change in discount rates being applied by the market since their initial recognition by the Group. Most of these instruments which are carried at amortised cost are to be held until maturity and therefore the net fair value figures calculated bear little relevance to the Group.
2018 2017
Carrying Amount $’000
Net Fair Value $’000
Carrying Amount $’000
Net Fair Value $’000
Financial Assets
Cash and cash equivalents i) 151,643 151,643 140,294 140,294
Financial assets at fair value through other comprehensive income
ii) 33,307 33,307 11,396 11,396
Derivative financial assets iii) ‐ ‐ 420 420
Trade receivables i) 22,209 22,209 19,182 19,182
207,159 207,159 171,292 171,292
Financial Liabilities
Trade and other payables i) 41,396 41,396 26,345 26,345
Derivative financial liabilities iii) 1,592 1,592
Other liabilities i) 712 712 474 474
43,700 43,700 26,819 26,819
The fair values disclosed in the above table have been determined based on the following methodologies: i) Cash and cash equivalents, trade and other receivables and trade and other liabilities are
short‐term instruments in nature whose carrying value is equivalent to fair value. Trade and other payables exclude amounts provided for annual leave, which is not considered a financial instrument.
ii) Quoted closing bid prices at reporting date. iii) Fair valuation calculations are performed by an independent financial risk management
consulting firm, the calculations include valuation techniques incorporating observable market data relevant to the hedged position.
For
per
sona
l use
onl
y

Western Areas Ltd & Controlled Entities ABN 68 091 049 357
Page 67 of 77
Note 27: Financial Risk Management (Continued…)
Financial Instruments Measured at Fair Value The financial instruments recognised at fair value in the statement of financial position have been analysed and classified using a fair value hierarchy reflecting the significance of the inputs used in making the measurements. The fair value hierarchy consists of the following levels:
‐ quoted prices in active markets for identical assets or liabilities (Level 1);
‐ inputs other than quoted prices included within Level 1 that are observable for the asset or liability, either directly (as prices) or indirectly (derived from prices) (Level 2); and
‐ inputs for the asset or liability that are not based on observable market data (unobservable inputs) (Level 3).
Level 1 $000
Level 2 $000
Level 3 $000
Total $000
2018
Financial assets:
Financial assets at fair value through other comprehensive income
33,307 ‐ ‐ 33,307
Financial liabilities
Derivative financial instruments ‐ (1,592) ‐ (1,592)
33,307 (1,592) ‐ 31,715
2017
Financial assets:
Financial assets at fair value through other comprehensive income
11,396 ‐ ‐ 11,396
Derivative financial instruments ‐ 420 ‐ 420
11,396 420 ‐ 11,816
Note 28: Related Party Transactions
There were no other related party transactions during the financial year other than those included in the key management compensation as disclosed in the Remuneration Report contained in the Directors’ Report.
Note 29: Share Based Payments
(a) Expenses arising from share based transactions
Consolidated Entity
2018 $’000
2017 $’000
Equity settled share options and performance rights granted during:
Year ended 30 June 2018 1,121 ‐
Year ended 30 June 2017 1,449 1,248
Year ended 30 June 2016 1,028 974
Year ended 30 June 2015 ‐ 838
Total expense recognised as employee costs 3,598 3,060
For
per
sona
l use
onl
y

Western Areas Ltd & Controlled Entities ABN 68 091 049 357
Page 68 of 77
Note 29: Share Based Payments (Continued...)
(b) Performance rights
Under the Performance Rights plan, executives and senior management are granted a right to be issued a share in the future subject to the performance based vesting conditions being met. The Company’s share price performance is measured via a relative total shareholder return (‘TSR’). The Company’s TSR is measured against a customised peer group of companies.
For grants made under the LTI plan during FY16, vesting will occur subject to the meeting of a 3 year service condition to 30 June 2018 and the performance condition tested against the relative TSR measure for the period 1 July 2015 to 30 June 2018.
For grants made under the LTI plan during FY17, vesting will occur subject to the meeting of a 3 year service condition to 30 June 2019 and the performance condition tested against the relative TSR measure for the period 1 July 2016 to 30 June 2019.
For grants made under the LTI plan during FY18, vesting will occur subject to the meeting of a 3 year service condition to 30 June 2020 and the performance condition tested against the relative TSR measure for the period 1 July 2017 to 30 June 2020.
The following table sets out the vesting outcome based on the Company’s relative TSR performance:
Relative TSR performance Performance Vesting Outcomes
Less than 50th percentile 0% vesting
At the 50th percentile 50% vesting
Between 50th and 75th percentile Pro‐rata / progressive vesting from 50% ‐ 100%
At or above 75th percentile 100% vesting
No Performance Rights will vest unless the percentile ranking of the Company’s TSR for the relevant performance year, as compared to the TSRs for the peer group companies, is at or above the 50th percentile.
The valuation inputs used in determining the fair value of performance rights issued during the year is detailed below:
2018 2017
Underlying share price $3.08 $2.98
Exercise price of rights Nil Nil
Risk free rate 1.86% 1.85%
Volatility factor 50% 48.4%
Dividend yield 1.18% 1.65%
Effective life 3.0 Years 3.0 years
Entitled number of employees 23 19
For
per
sona
l use
onl
y

Western Areas Ltd & Controlled Entities ABN 68 091 049 357
Page 69 of 77
Note 29: Share Based Payments (Continued...)
(b) Performance rights (Continued...)
Performance Rights held by Key Management Personnel at 30 June 2018
Balance at 1 July 2017
Granted as Remuneration
Exercise of Performance
Rights
Lapsed / Cancelled /
Other
Balance at 30 June 2018
Performance Rights Vested
D Lougher 880,430 420,280 (143,598) (61,542) 1,095,570 ‐D Southam 495,335 236,460 (80,791) (34,624) 616,380 ‐J Belladonna 333,755 159,320 (54,436) (23,329) 415,310 ‐W Jones 240,002 114,570 (39,145) (16,777) 298,650 ‐TOTAL 1,949,522 930,630 (317,970) (136,272) 2,425,910 ‐
Performance Rights held by Key Management Personnel at 30 June 2017
Balance at 1 July 2016
Granted as Remuneration
Exercise of Performance
Rights
Lapsed / Cancelled /
Other
Balance at 30 June 2017
Performance Rights Vested
D Lougher 970,640 375,540 (456,435) (9,315) 880,430 ‐D Southam 546,093 211,280 (256,797) (5,241) 495,335 ‐J Belladonna 355,779 142,360 (161,096) (3,288) 333,755 ‐W Jones 269,481 102,370 (129,212) (2,637) 240,002 ‐TOTAL 2,141,993 831,550 (1,003,540) (20,481) 1,949,522 ‐
(c) Share Option Plans
There were no options outstanding as at 30 June 2018.
Note 30: Reserves
(i) Share Based Payment reserve
The share based payment reserve records the items recognised as expenses on valuation of employee share options and performance rights.
(ii) Hedge reserve
The hedge reserve records revaluations of items designated as hedges.
(iii) Investment Revaluation reserve
The investment revaluation reserve records revaluations of financial assets at fair value through other comprehensive income.
For
per
sona
l use
onl
y

Western Areas Ltd & Controlled Entities ABN 68 091 049 357
Page 70 of 77
Note 31: Interests in Subsidiaries
The consolidated financial statements incorporate the assets, liabilities and results of the following wholly‐owned subsidiaries in accordance with the accounting policy described in Note 1:
Name Country of Incorporation Percentage of equity held
2018 2017
Western Platinum NL Australia 100% 100%
Australian Nickel Investments Pty Ltd Australia 100% 100%
Bioheap Ltd Australia 100% 100%
Western Areas Nickel Pty Ltd Australia 100% 100%
Western Areas Employee Share Trust Australia 100% 100%
All the entities above are members of the tax consolidated group of which Western Areas Ltd is the head entity. Western Areas Ltd is the parent entity and is incorporated and domiciled in Australia.
Note 32: Parent Information
The following information has been extracted from the books of the parent and has been prepared in accordance with the accounting standards.
Statement of Financial Position
Parent Entity
2018 $’000
2017 $’000
Assets
Current Assets 206,834 178,618
Non Current Assets 379,589 354,334
Total Assets 586,423 532,952
Liabilities
Current Liabilities 41,791 28,415
Non Current Liabilities 27,920 21,305
Total Liabilities 69,711 49,720
Net Assets 516,712 483,232
Equity
Issued capital 442,963 442,963
Reserves 44,533 21,445
Retained Earnings 29,216 18,824
Total Equity 516,712 483,232
Statement of Comprehensive Income
Profit for the year 15,847 23,009
Total comprehensive income for the year 35,746 25,904
Guarantees
Western Areas Ltd has not entered into any guarantees, in the current or previous financial year, in relation to the debts of its subsidiaries.
For
per
sona
l use
onl
y

Western Areas Ltd & Controlled Entities ABN 68 091 049 357
Page 71 of 77
Note 32: Parent Information (Continued...)
Contingent Liabilities
The Directors are not aware of any contingent liabilities as at the date of these financial statements.
Contractual Commitments
Refer to Note 20, all commitments were entered into by Western Areas Ltd or its fully owned subsidiary Australian Nickel Investments Pty Ltd.
Note 33: Additional Company Information
Western Areas Ltd is a Public Company, incorporated and domiciled in Australia.
Registered office and Principal place of business:
Level 2 2 Kings Park Road West Perth WA 6005 Tel: +61 8 9334 7777 Fax: +61 8 9486 7866 Web: www.westernareas.com.au Email: [email protected]
For
per
sona
l use
onl
y

Western Areas Ltd & Controlled Entities ABN 68 091 049 357
Page 72 of 77
DIRECTORS DECLARATION
1. In the opinion of the Directors of Western Areas Ltd:
(a) the Consolidated Entity’s financial statements and notes set out on pages 25 to 71 are in accordance with the Corporations Act 2001, including:
(i) giving a true and fair view of the Consolidated Entity’s financial position as at 30 June 2018 and of its performance, for the financial year ended on that date; and
(ii) complying with Australian Accounting Standards and the Corporations Regulations 2001;
(b) the financial report also complies with International Financial Reporting Standards as set out in Note 1;
(c) the remuneration disclosures that are contained in the remuneration report in the Directors’ report comply with Australian Accounting Standard AASB 124 Related Party Disclosures, the Corporations Act 2001 and the Corporations Regulations 2001;
(d) there are reasonable grounds to believe that the Consolidated Entity will be able to pay its debts as and when they become due and payable.
2. the Directors have been given the declarations required by Section 295A of the Corporations Act 2001 from the Chief Executive Officer, Managing Director, Executive Director and Chief Financial Officer for the financial year ended 30 June 2018.
Signed in accordance with a resolution of the Board of Directors.
D Lougher Managing Director
Dated – 22 August 2018
For
per
sona
l use
onl
y

Western Areas Ltd & Controlled Entities ABN 68 091 049 357
Page 73 of 77
INDEPENDANT AUDITOR’S OPINION
For
per
sona
l use
onl
y
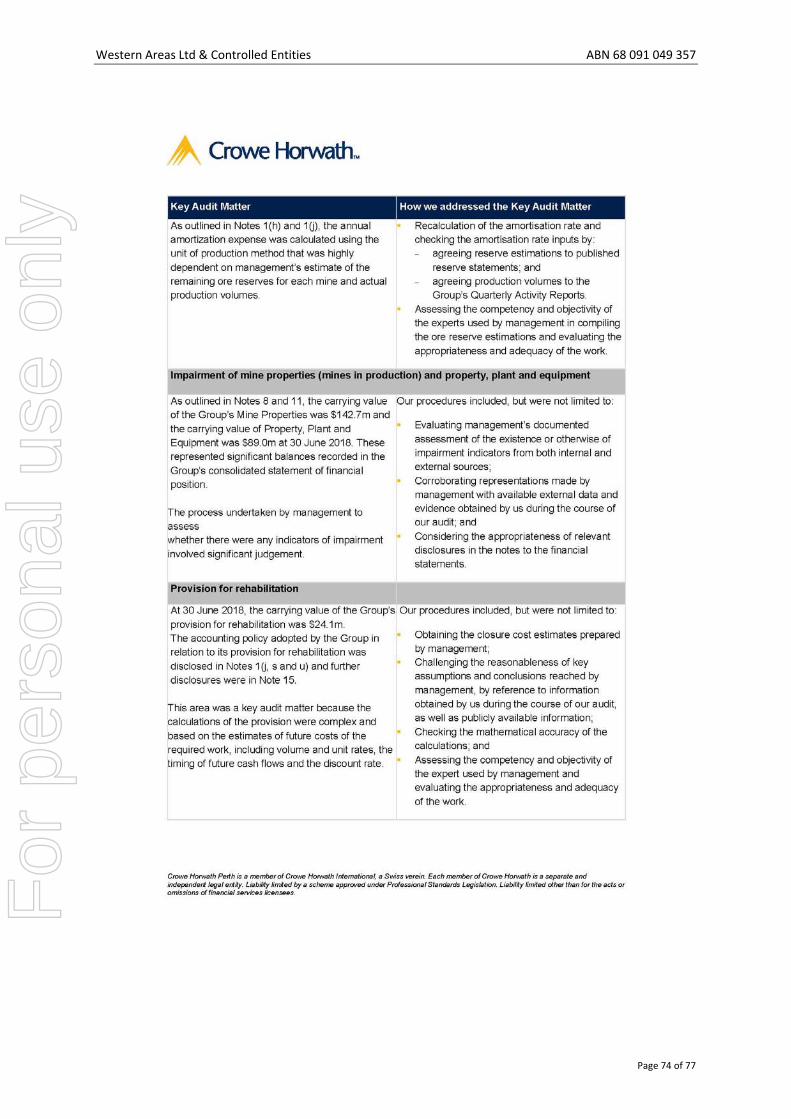
Western Areas Ltd & Controlled Entities ABN 68 091 049 357
Page 74 of 77
For
per
sona
l use
onl
y

Western Areas Ltd & Controlled Entities ABN 68 091 049 357
Page 75 of 77
For
per
sona
l use
onl
y

Western Areas Ltd & Controlled Entities ABN 68 091 049 357
Page 76 of 77
For
per
sona
l use
onl
y

Western Areas Ltd & Controlled Entities ABN 68 091 049 357
Page 77 of 77
For
per
sona
l use
onl
y