Embed Size (px)
Citation preview
Daconient of
The World Bank
FOR OMCIAL USE ONLY
Report Me. 4932-GE
STAFF APPRAISAL REPORT
GHANA
POWER SYSTEM REHABILITATION PROJECT
August 26, 1985
Western Arica Projects DepartmentEnergy Division
II& documt ha a aldud asugutm ad my be wed by re_ipet only in The peufru.mce oftbir o l doom. lb cmmtb y ino odmermwie be dbdhsed widhou WVod DBnk auihrize.bL l
Pub
lic D
iscl
osur
e A
utho
rized
Pub
lic D
iscl
osur
e A
utho
rized
Pub
lic D
iscl
osur
e A
utho
rized
Pub
lic D
iscl
osur
e A
utho
rized
Pub
lic D
iscl
osur
e A
utho
rized
Pub
lic D
iscl
osur
e A
utho
rized
Pub
lic D
iscl
osur
e A
utho
rized
Pub
lic D
iscl
osur
e A
utho
rized
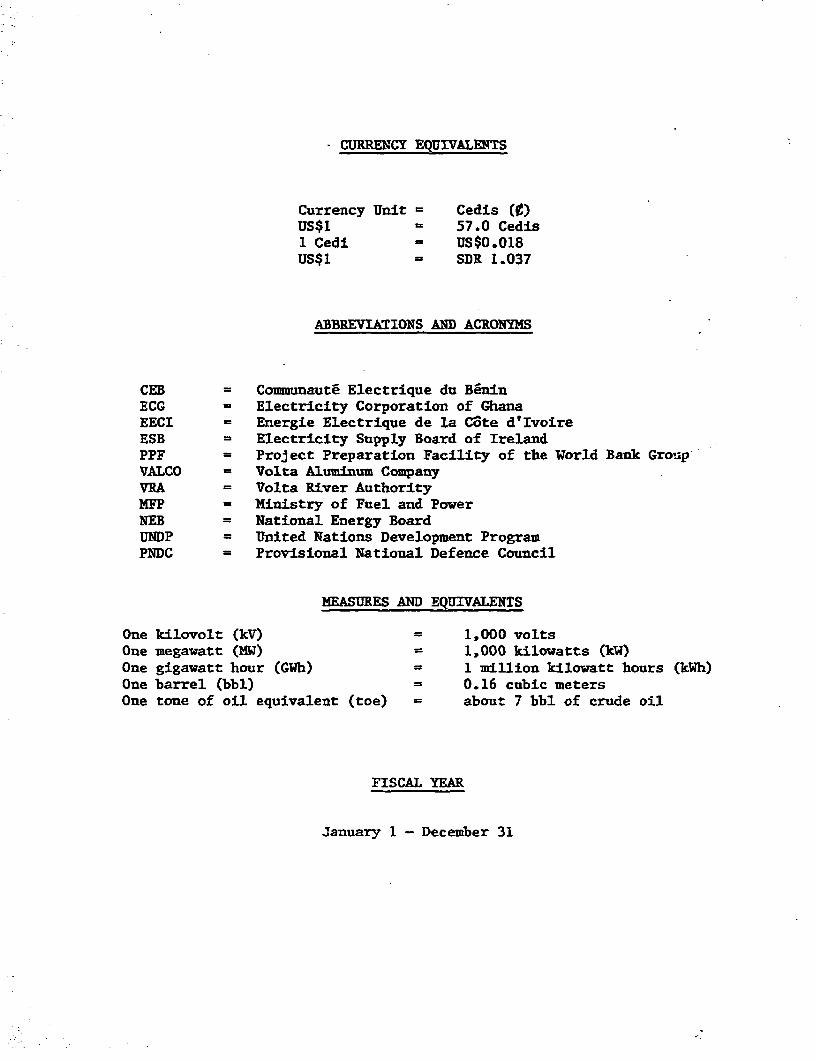
- CURRENCY EQUIVALENTS
Currency Unit Cedis (¢)US$1 57.0 Cedis1 Cedi = US$0.018US$1 - SDR 1.037
ABBREVIATIONS AND ACRONYNS
CEB = Communaute Electrique du BeninECG = Electricity Corporation of GhanaEECI = Energie Electrique de la Cote d'IvoireESB = Electricity Supply Board of IrelandPPF = Project Preparation Facility of the World Bank Group-VALCO = Volta Aluminum CompanyVRA = Volta River AuthorityMFP = Ministry of Fuel and PowerNEB = National Energy BoardUNDP = United Nations Development ProgramPNDC = Provisional National Defence Council
MEASURES AND EQUIVALENTS
One kilovolt (kV) = 1,000 voltsOne megawatt (MW) = 1,000 kilowatts (kW)One gigawatt hour (GWh) = 1 million kilowatt hours (kWh)One barrel (bbl) = 0.16 cubic metersOne tone of oil equivalent (toe) = about 7 bbl of crude oil
FISCAL YEAR
January 1 - December 31
FOR OFFICUIL USE ONLY
GHANA
STAFF APPRAISAL REPORT
POWER SYSTEM REHABILITATION PROJECT
TABLE OF CONTENTS
Page No.
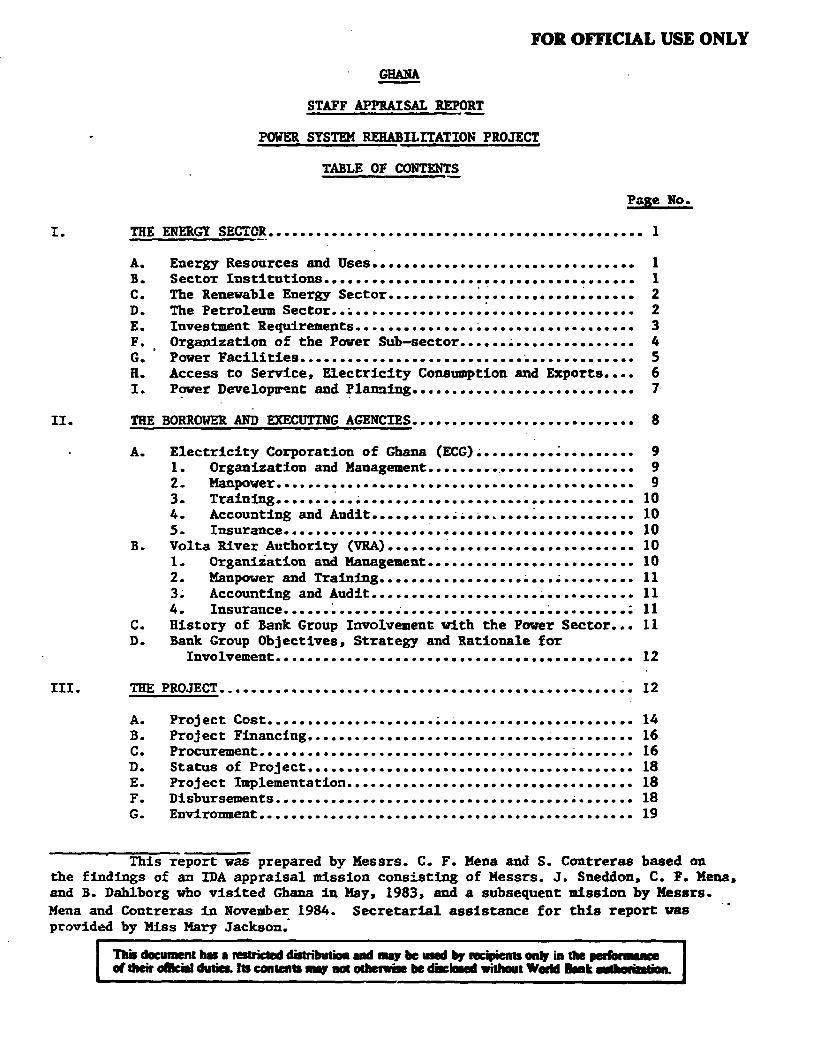
I. THE ENERGY SECTOR.......... 1
A. Energy Resources and Uses................. ...... ........ . 1B. Sector Institutions....................................... 1C. The Renewable Energy Sector.. 2............. 2D. The Petroleum Sector... ....................................* *. ; 2E. Investment Requirements ........ . ......... ............... .. 3F. Organization of the Pover Sub-sector ............ 4Go Power Facilities .... o ...... ....... . 5H. Access to Service, Electricity Consumption and Exports.... 6I. Power Developmrent and Planning .................... o..... 7
II. THE BORROWER AND EXECUTING AGENCIES .................. ........ o. 8
A. Electricity Corporation of Ghana (ECG) ............... o. 91. Organization and Managee...... 92. Manpower...... 93. Training.r. .... . . .. . . o. .. 10
4. Accounting and Audit .... 105. Insurance.............. 10
B. Volta River Authority (RA) . .10
1. Organization and Management. 102. Manpower and Traininga.. . .n..- 113. Accounting and Audit. . 114. Insurance ... ; 11
C. History of Bank Group Involvement with the Power Sector... 11D. Bank Group Objectives, Strategy and Rationale for
Invovmet...... ...... m .... 6400 t00 12
III. THE PROJECT ..... 12
A. Project Cost .......................... ...... 14B. Project Financing ......... . 16C. Procurement .................................... ....... 16D. Status of Project ............................................... . .. 18E. Project Implementation .................... . 18F. Disbursements ........................................... 18G. Environment ....................................... 19
This report was prepared by Messrs. C. F. Mena and S. Contreras based onthe findings of an IDA appraisal mission consisting of Messrs. J. Sneddon, C. F. Mena,and B. Dahlborg who visited Ghana in May, 1983, and a subsequent mission by Messrs.Mena and Contreras in November 1984. Secretarial assistance for this report vasprovided by Miss Mary Jackson.
Thi document ha a rusutcedidstibution and may be mnd by recipien only in tm perform"eor their oIlci.l ftduti Its countents amy sou ouduwbei be dhsckod withot World kink authiorinm.
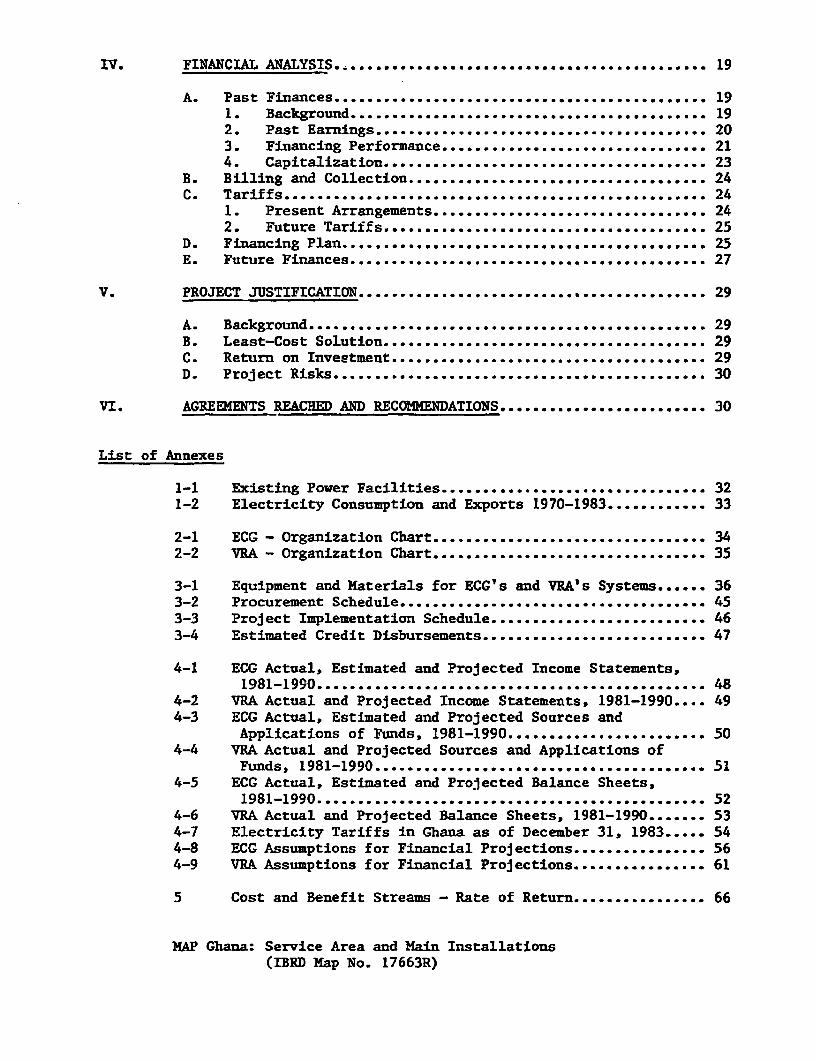
IV. FINANCIAL ANALYSIS............................... 19
A. Past Finances .. .................................... . 191. Background .................... * ... 19
2. Past Earnings > ......... 20
3. Financing Performance. . .. ......... .. 21
4. Capitalization .... . . ... ......... 23
B. Billing and Collectionl l e c t i on.. ...... ....... 24
C. Tariffss... .... ... . ......... 24
1. Present Arrangementsrangemens.. .......... 24
2. Future Tariffs ....................s........ 25D. Financing Plan .................................................... 25E. Future Finances ......... 27
V. PROJECT JUSTIFICATION ....... * .............. . 29
A. Background ............................................. . . . 29
B. Least-Cost Solution .............. ......... 29C. Return on Inveetment . . . . .................................. 29
D. Project Risks..... ...................................... 30
VI. AGREEMENTS REACHED AND RECONMENDATIONS .......................... 30
List of Annexes
l-1 Existing Power Facilities .......... . 321-2 Electricity Consumption and Exports 1970-1983 ........... 33
2-1 ECG - Organization Chart .............................. o.. 342-2 VRA - Organization Chart ............ o .................... 35
3-1 Equipment and Materials for ECG's and VRA's Systems ...... 363-2 Procurement Schedule . . .. .. .. 453-3 Project Implementation Schedule ......................... . 463-4 Estimated Credit Disbursements . . . . 47
4-1 ECG Actual, Estimated and Projected Income Statements,1981-1990 ....................................... o ....... 48
4-2 VRA Actual and Projected Income Statements, 1981-1990 .... 494-3 ECG Actual, Estimated and Projected Sources and
Applications of Funds, 1981-1990 .................... 504-4 VRA Actual and Projected Sources and Applications of
Funds, 1981-1990 ...... .... .000.... .............................. 51
4-5 ECG Actual, Estimated and Projected Balance Sheets,1981-1990 ............................ o.................. 52
4-6 VRA Actual and Projected Balance Sheets, 1981-1990 ... 534-7 Electricity Tariffs in Ghana as of December 31, 1983 ... 544-8 ECG Assumptions for Financial Projections . . 564-9 VRA Assumptions for Financial Projections. . 61
5 Cost and Benefit Streams - Rate of Return .66
MAP Ghana: Service Area and Main Installations(IBRD Map No. 17663R)
(iM
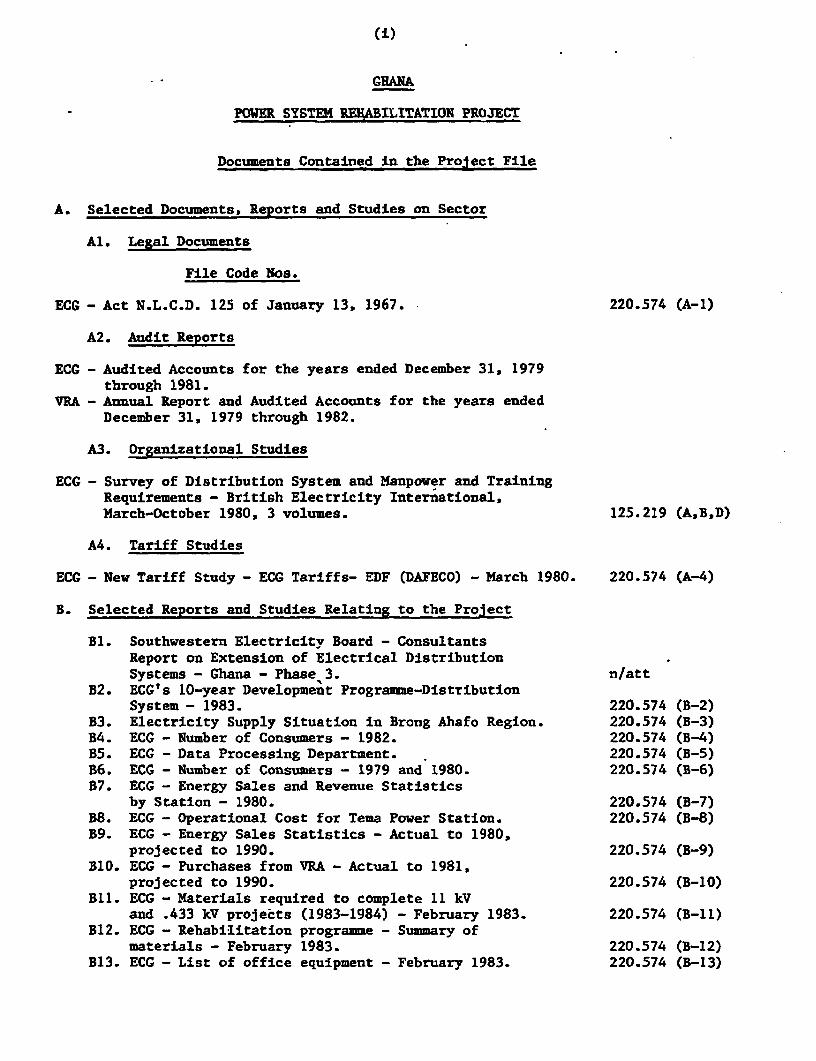
GHANA
POWER SYSTEM RE9ABILITATION PROJECT
Documents Contained in the Project File
A. Selected Documents, Reports and Studies on Sector
Al. Legal Documents
File Code Nos.
ECG - Act N.L.C.D. 125 of January 13, 1967. 220.574 (A-1)
A2. Audit Reports
ECG - Audited Accounts for the years ended December 31, 1979through 1981.
VRA - Annual Report and Audited Accounts for the years endedDecember 31, 1979 through 1982.
A3. Organizational Studies
ECG - Survey of Distribution System and Manpower and TrainingRequirements - British Electricity International,March-October 1980. 3 volumes. 125.219 (A,B,D)
A4. Tariff Studies
ECG - New Tariff Study - ECG Tariffs- EDF (DAFECO) - March 1980. 220.574 (A-4)
B. Selected Reports and Studies Relating to the Project
E1. Southwestern Electricity Board - ConsultantsReport on Extension of Electrical DistributionSystems - Ghana - Phase 3. n/att
B2. ECG's 10-year Development Programme-DistributionSystem - 1983. 220.574 (B-2)
B3. Electricity Supply Situation in Brong Ahafo Region. 220.574 (B-3)B4. ECG - Number of Consumers - 1982. 220.574 (B-4)B5. ECG - Data Processing Department. 220.574 (B-5)B6. ECG - Number of Consumers - 1979 and 1980. 220.574 (B-6)B7. ECG - Energy Sales and Revenue Statistics
by Station - 1980. 220.574 (B-7)B8. ECG - Operational Cost for Tema Power Station. 220.574 (B-8)B9. ECG - Energy Sales Statistics - Actual to 1980,
projected to 1990. 220.574 (B-9)B10. ECG - Purchases from VRA - Actual to 1981,
projected to 1990. 220.574 (B-10)B11. ECG - Materials required to complete 11 kV
and .433 kV projects (1983-1984) - February 1983. 220.574 (B-11)B12. ECG - Rehabilitation programme - Summary of
materials - February 1983. 220.574 (B-12)B13. ECG - List of office equipment - February 1983. 220.574 (B-13)
(ii)
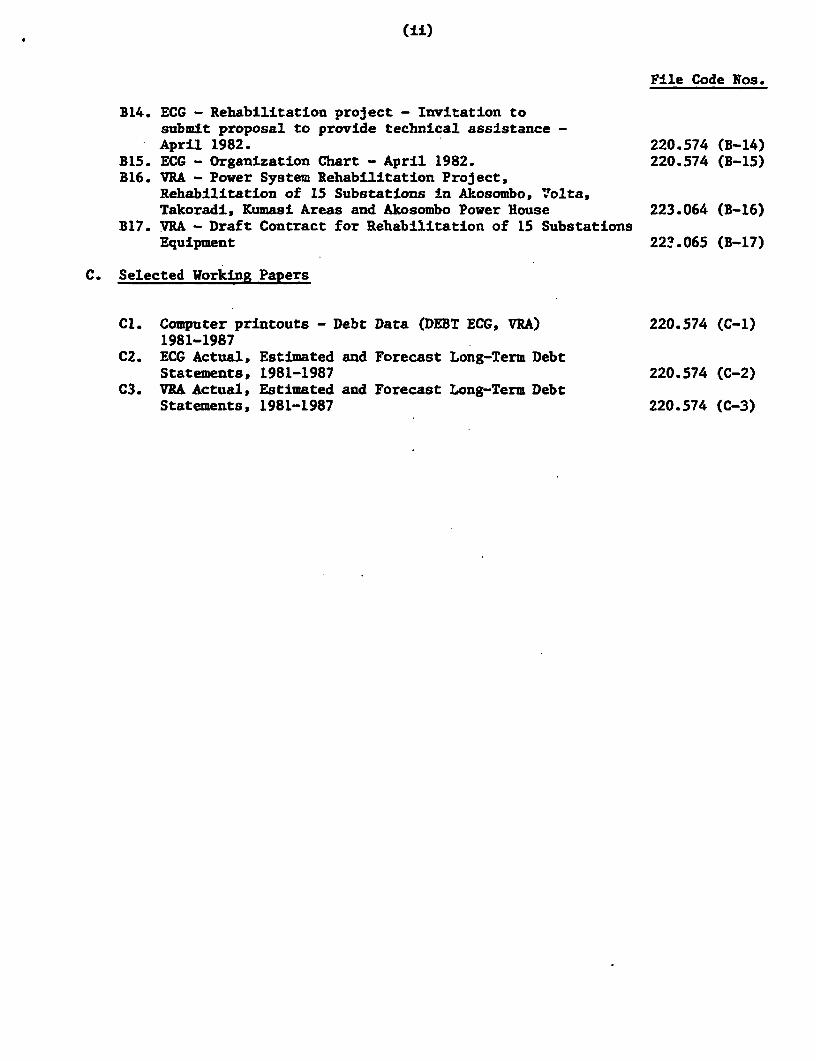
File Code Nos.
B14. ECG - Rehabilitation project - Invitation tosubmit proposal to provide technical assistance -April 1982. 220.574 (B-14)
B15. ECG - Organization Chart - April 1982. 220.574 (B-15)B16. VRA - Power System Rehabilitation Project,
Rehabilitation of 15 Substations in Akosombo, Volta,Takoradi, Kumasi Areas and Akosombo Power House 223.064 (B-16)
B17. VRA - Draft Contract for Rehabilitation of 15 SubstationsEquipment 22!.065 (B-17)
C. Selected Working Papers
Cl. Computer printouts - Debt Data (DEBT ECG, VRA) 220.574 (C-1)1981-1987
C2. ECG Actual, Estimated and Forecast Long-Term DebtStatements, 1981-1987 220.574 (C-2)
C3. VRA Actual, Estimated and Forecast Long-Term DebtStatements, 1981-1987 220.574 (C-3)
(iii)
GHANA
P0IER SYSTEM REHABILITATION PROJECT
Credit and Project Su_ arv
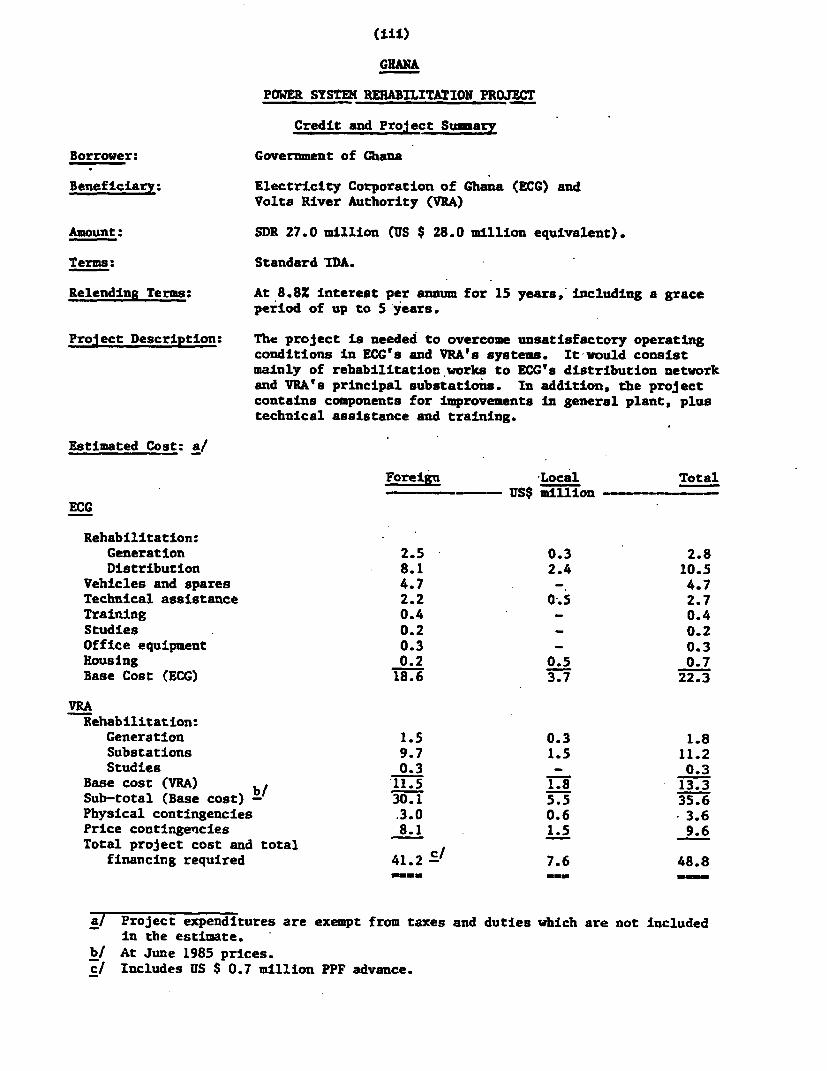
Borrower: Government of Ghana
Beneficiary: Electricity Corporation of Ghana (ECG) andVolta River Authority (VRA)
Amount: SDR 27.0 million (US $ 28.0 million equivalent).
Terms: Standard'IDA.
Relending Terms: At 8.8X interest per annum for 15 years,'including a graceperiod of up to 5 years.
Project Description: The project is needed to overcome unsatisfactory operatingconditions in ECG's and VRA's systems. It-would consistmainly of rehabilitation works to ECG's distribution networkand VRA's principal substations. In addition, the projectcontains components for improvements in general plant, plustechnical assistance and training.
Estimated Cost: a/
Foreign Local Total-- c-= - WUS$ million -
ECG
Rehabilitation:Generation 2.5 0.3 2.8Distribution 8.1 2.4 10.5
Vehicles and spares 4.7 4.7Technical assistance 2.2 0.5 2.7Training 0.4 - 0.4Studies 0.2 0.2Office equipment 0.3 _ 0.3Housing 0.2 0.5 0.7Base Cost (ECG) 18.6 3.7 22.3
VRARehabilitation:
Generation 1.5 0.3 1.8Substations 9.7 1.5 11.2Studies 0.3 - 0.3
Base cost (VRA) b/ '11.5 1.8 13.3Sub-total (Base cost) - 30.1 5.5 35.6Physical contingencies .3.0 0.6 3.6Price contingencies 8.1 1.5 9.6Total project cost and total
financing required 41.2 c, 7.6 48.8
a/ Project expenditures are exempt from taxes and duties which are not includedin the estimate.
b/ At June 1985 prices.c/ Includes US $ 0.7 million PPF advance.
(iv)
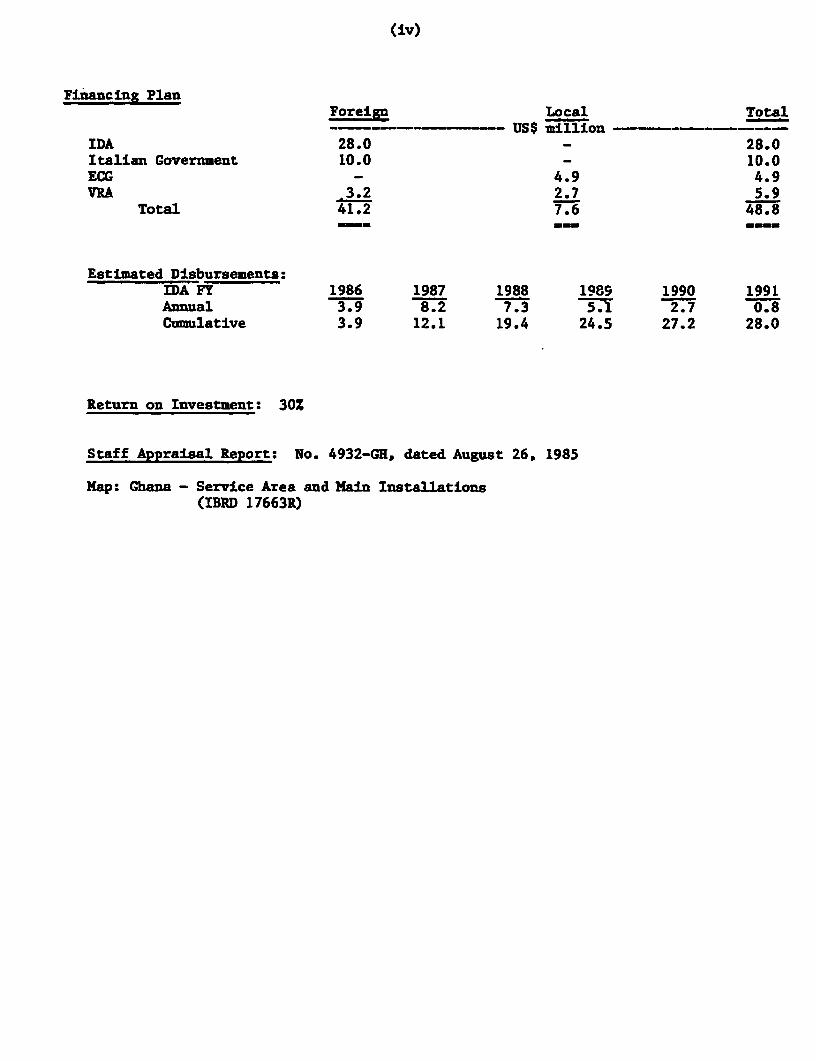
Financing PlanForeign Local Total- - - - US$ million
IDA 28.0 28.0Italian Government 10.0 - 10.0ECG - 4.9 4.9VRA 3.2 2.7 5.9
Total 41.2 7.6 48.8=m _.
Estimated Disbursements:IDA FY 1986 1987 1988 1989 1990 1991Annual 3.9 8.2 7.3 2.7 0.8Cumulative 3.9 12.1 19.4 24.5 27.2 28.0
Return on Investment: 30Z
Staff Appraisal Report: No. 4932-GH, dated August 26, 1985
Map: Ghana - Service Area and Main Installations(IBRD 17663R)
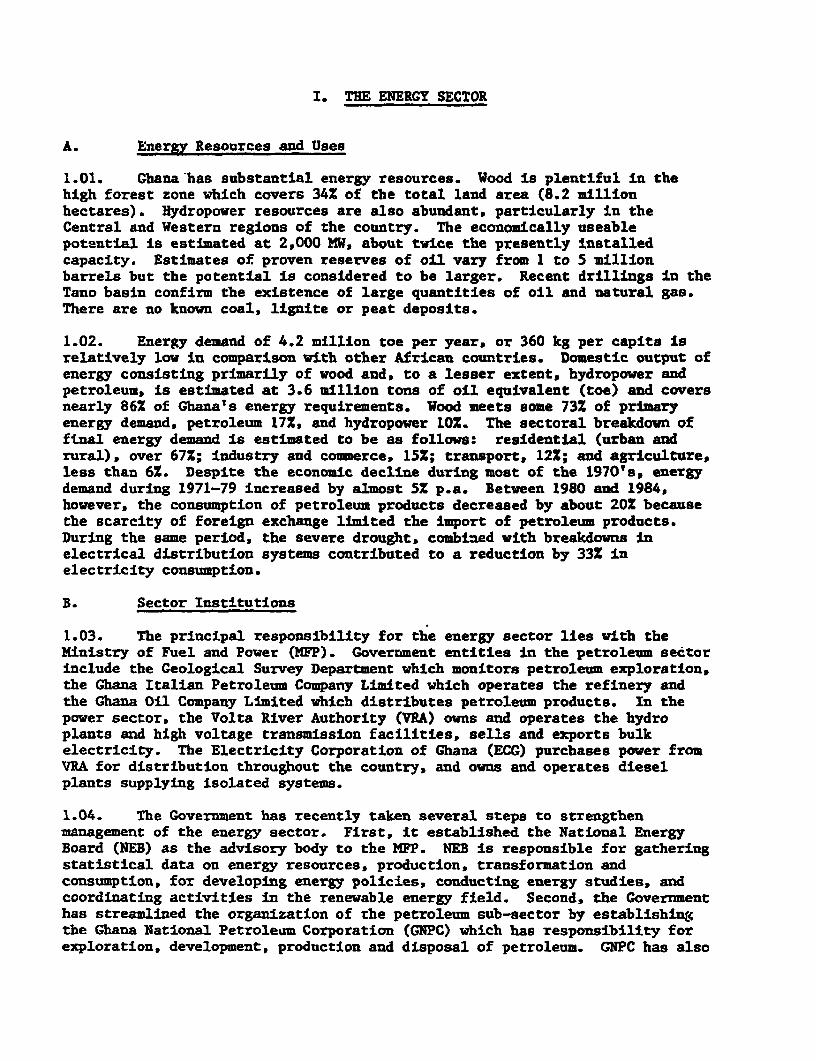
I. THE ENERGY SECTOR
A. Energy Resources and Uses
1.01. Ghana has substantial energy resources. Wood is plentiful in thehigh forest zone which covers 34% of the total lantd area (8.2 millionhectares). Hydropower resources are also abundant, particularly in theCentral and Western regions of the country. The economically useablepotential is estimated at 2,000 MW, about twice the presently installedcapacity. Estimates of proven reserves of oil vary from 1 to 5 millionbarrels but the potential is considered to be larger. Recent drillings in theTano basin confirm the existence of large quantities of oil and natural gas.There are no known coal, lignite or peat deposits.
1.02. Energy demand of 4.2 million toe per year, or 360 kg per capita isrelatively low in comparison with other African countries. Domestic output ofenergy consisting primarily of wood and, to a lesser extent, hydropower andpetroleum, Is estimated at 3.6 million tons of oil equivalent (toe) and coversnearly 86% of Ghana's energy requirements. Wood meets some 73% of primaryenergy demand, petroleum 17X, and hydropower 10%. The sectoral breakdown offinal energy demand is estimated to be as follows: residential (urban andrural), over 67Z; industry and commerce, 15%; transport, 12Z; and agriculture,less than 6%. Despite the economic decline during most of the 1970's, energydemand during 1971-79 increased by almost 5% p.a. Between 1980 and 1984,however, the consumption of petroleum products decreased by about 20% becausethe scarcity of foreign exchange limited the import of petroleum products.During the same period, the severe drought, combined with breakdowns inelectrical distribution systems contributed to a reduction by 33% inelectricity consumption.
B. Sector Institutions
1.03. The principal responsibility for the energy sector lies with theMinistry of Fuel and Power (MFP). Government entities in the petroleum sectorinclude the Geological Survey Department which monitors petroleum exploration,the Ghana Italian Petroleum Company Limited which operates the refinery andthe Ghana Oil Company Limited which distributes petroleum products. In thepower sector, the Volta River Authority (VRA) owns and operates the hydroplants and high voltage transmission facilities, sells and exports bulkelectricity. The Electricity Corporation of Ghana (ECG) purchases power fromVRA for distribution throughout the country, and owns and operates dieselplants supplying isolated systems.
1.04. The Government has recently taken several steps to strengthenmanagement of the energy sector. First, it established the National EnergyBoard (NEB) as the advisory body to the MPP. NEB is responsible for gatheringstatistical data on energy resources, production, transformation andconsumption, for developing energy policies, conducting energy studies, andcoordinating activities in the renewable energy field. Second, the Governmenthas streamlined the organization of the petroleum sub-sector by establishingthe Ghana National Petroleum Corporation (GNPC) which has responsibility forexploration, development, production and disposal of petroleum. GNPC has also
taken on the responsibility for crude and petroleum product procurement, afunction previously performed by the Petroleum Department in the MFP. Andfinally, in the power sub-sector, the Government has hired the ElectricitySupply Board of Ireland (ESB) to examine the organization of the sector andprovide technical assistance to ECG and VRA.
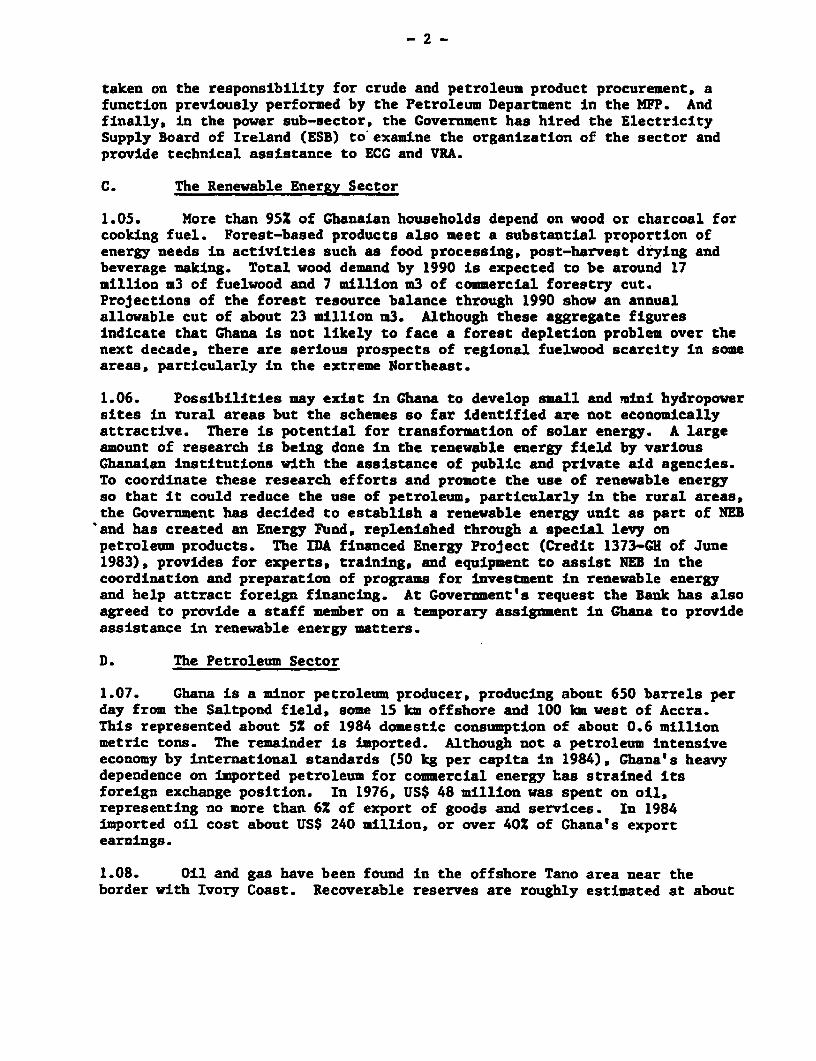
C. The Renewable Energy Sector
1.05. More than 95% of Ghanaian households depend on wood or charcoal forcooking fuel. Forest-based products also meet a substantial proportion ofenergy needs in activities such as food processing, post-harvest drying andbeverage making. Total wood demand by 1990 is expected to be around 17million m3 of fuelwood and 7 million m3 of commercial foreetry cut.Projections of the forest resource balance through 1990 show an annualallowable cut of about 23 million =3. Although these aggregate figuresindicate that Ghana is not likely to face a forest depletion problem over thenext decade, there are serious prospects of regional fuelwood scarcity in someareas, particularly in the extreme Northeast.
1.06. Possibilities may exist in Ghana to develop small and mini hydropowersites in rural areas but the schemes so far identified are not economicallyattractive. There is potential for transformation of solar energy. A largeamount of research is being done in the renewable energy field by variousGhanaian institutions with the assistance of public and private aid agencies.To coordinate these research efforts and promote the use of renewable energyso that it could reduce the use of petroleum, particularly in the rural areas,the Government has decided to establish a renewable energy unit as part of NEB'and has created an Energy Fund, replenished through a special levy onpetroleum products. The IDA financed Energy Project (Credit 1373-GB of June1983), provides for experts, training, and equipment to assist NEE in thecoordination and preparation of programs for investment in renewable energyand help attract foreign financing. At Government's request the Bank has alsoagreed to provide a staff member on a temporary assignment in Ghana to provideassistance in renewable energy matters.
D. The Petroleum Sector
1.07. Ghana is a minor petroleum producer, producing about 650 barrels perday from the Saltpond field, some 15 km offshore and 100 km west of Accra.This represented about 52 of 1984 domestic consumption of about 0.6 millionmetric tons. The remainder is imported. Although not a petroleum intensiveeconomy by international standards (50 kg per capita in 1984), Ghana's heavydependence on imported petroleum for commercial energy has strained itsforeign exchange position. In 1976, US$ 48 million was spent on oil,representing no more than 6% of export of goods and services. In 1984imported oil cost about US$ 240 million, or over 40Z of Ghana's exportearnings.
1.08. Oil and gas have been found in the offshore Tano area near theborder with Ivory Coast. Recoverable reserves are roughly estimated at about
- 3 -
50 million barrels of oil and one TCF 1/ of gas. On the basis of a gas marketstudy financed under Credit 1373-GH of June 1983 the most promising market forthe gas appears to be power generation. However, the economic merits andfinancial costs of exploiting the gas reserves remain to be established. As afirst step, the Government has hired consultants to prepare reliable estimatesof the gas reserves of the Saltpond field where 10 million cubic feet of gasper day are flared, as well as of the other discoveries. Should gas reservesprove to be sufficient and economically exploitable, a gas thermal generatingplant may be justifiable.
1.09. Under the Energy Project (Credit 1373-GH) the Government is activelypromoting petroleum exploration. Offshore areas have been made available tothe petroleum industry and several proposals for exploration/production havealready been received from international oil companies.
1.10. Petroleum product consumption in Ghana diminished by 20% from 1980 to1984 to about 600,000 tons. Diesel accounts for the largest consumption share(35%), followed by gasoline (34%). The largest consuming sector is transport(75% of total consumption). The remainder covers the residential sector, 16%,and the combined industrial and agricultural sectors, 9%. Petroleum productprices have been raised substantially following the exchange rate adjustmentsin 1983 and 1984. The Energy Project includes the financing of a study todevise a sound pricing policy and a mechanism for revising prices in thepetroleum field. A plan of action based on the study is expected to beavailable by December 31, 1985.
E. Investment Requirements
1.11. Government and the Bank are carrying out a review of publicinvestments which will be completed by September 1985. Investments in energyprojects during the period 1985-1990 will be conceutrated in power andpetroleum. Government proposals for investments in power would be mainly forrehabilitation of existing facilities, for extension of the high voltage gridand for small additions in thermal generating capacity to complement operationof the hydro plants, as follows:
1/ TCF - Trillion cubic feet.
- 4 -
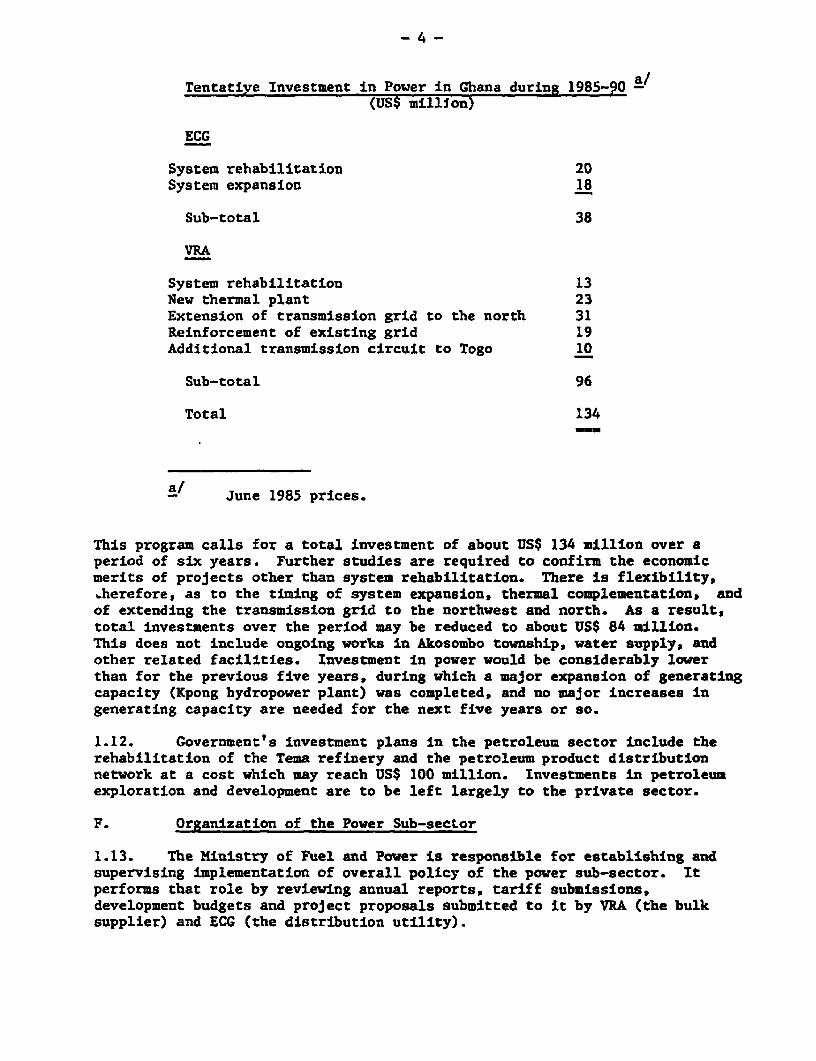
Tentative Investment in Power in Ghana during 1985-90(US$ million)
ECG
System rehabilitation 20System expansion 18
Sub-total 38
VRA
System rehabilitation 13New thermal plant 23Extension of transmission grid to the north 31Reinforcement of existing grid 19Additional transmission circuit to Togo 10
Sub-total 96
Total 134-mm
June 1985 prices.
This program calls for a total investment of about US$ 134 million over aperiod of six years. Further studies are required to confirm the economicmerits of projects other than system rehabilitation. There is flexibility,.herefore, as to the timing of system expansion. thermal complementation, andof extending the transmission grid to the northwest and north. As a result,total investments over the period may be reduced to about US$ 84 million.This does not include ongoing works in Akosombo township, water supply, andother related facilities. Investment in power would be considerably lowerthan for the previous five years, during which a major expansion of generatingcapacity (Kpong hydropower plant) was completed, and no major increases ingenerating capacity are needed for the next five years or so.
1.12. Government's investment plans in the petroleum sector include therehabilitation of the Tema refinery and the petroleum product distributionnetwork at a cost which may reach US$ 100 million. Investments in petroleumexploration and development are to be left largely to the private sector.
F. Organization of the Power Sub-sector
1.13. The Ministry of Fuel and Power is responsible for establishing andsupervising implementation of overall policy of the power sub-sector. Itperforms that role by reviewing annual reports, tariff submissions,development budgets and project proposals submitted to it by VRA (the bulksupplier) and ECG (the distribution utility).
- 5 -
1.14. Since its foundation in 1961 VRA has operated as a quasi enclavewithin Ghana, has been well managed and has fully met its responsibilitieswithin the sector. VRA has therefore enjoyed the confidence of Government andhas its views and proposals accepted. ECG, on the other hand, with operationswhich are much more complex than those of VRA, has suffered from ;neffectivemanagement, has not met its sector responsibilities in recent years, and doesnot have full confidence of Government or the consumers. The contrast betweenthe highly efficient, albeit simpler, management and operations of VRA and thepoor, although more complex, management and operations of ECG have promptedGovernment and IDA to consider ways to achieve a more effective sectororganization. A study of the merits of a merger of VRA and ECG as well asother institutional arrangements in the sector is being carried out byElectricity Supply Board of Ireland (ESB) and financed by a PPF advanceapproved by the Bank on August 15, 1983.
1.15. The study is being carried out in three stages. The first stage tobe cc-Ir?leted by August 1985 consists of a diagnosis of the sector withrecommendations on future sector organization, and in particular an analysisof the merits of merging ECG and VRA. This stage also includes a work plan,staffing plan and schedule for execution of the second step. Government andIDA will review ESB's work and agree on a schedule to carry out the necessarymeasures by December 1985. In the second stage, expected to require 6 months,ESB will review existing legislation governing the sub-sector, and inparticular legislation govern-ing the management and operations of theutilities. ESB will review the utilities' organizations, objectives,functions, financial practices, maintenance programs, and training provisions.The study will also define the roles of the responsible Ministry, theboard(s), the chief executives, the department heads and their deputiesincluding as appropriate job descriptions, delegation of responsibility andreporting requirements. Government and IDA will review ESB's recommendationsbefore December 1986 and agree on a schedule to carry out the necessarymeasures. For the third stage, ESB will prepare a detailed institutionalrehabilitation plan and assist in its implementation which should lead tobuilding strong, efficient and autonomous organization(s) capable of meetingthe country's electric power requirements economically. During negotiationsGovernment agreed to carry out necessary sector organization measures on aschedule satisfactory to the Association and to initiate them no later thanDecember 31, 1985.
G. Power Facilities
1.16. The total installed generating capacity in Ghana is about 1,130 MW ofwhich 1,072 MW (95%) is hydroelectric. The remainder comprises diesel unitsinstalled in 28 stations varying in size from 51 kW to 30 MW which aregenerally in poor condition. Hydro capacity is installed in two stationsowned by VRA on the Volta River - the Akosombo plant (912 MW), commissioned inthe mid-1960's, and the Kpong plant (160 MW), commissioned in 1982. Bothhydro plants are in good condition and well maintained. Because of age, theAkosombo plant efficiency has fallen, but it could be restored and probablyimproved. VRA would study this further, under the proposed project. Ghana'sinstalled capacity is described in greater detail in Annex 1-1.
- 6 -
1.17. The VRA 161 kV transmission system totals over 1,200 km. Eightcircuits of 67 km connect the Akosombo and Kpong plants to the VALCO smelterat Tema and other industrial loads. A 650 km transmission loop supplies ECGareas and mines in Southern Ghana. A 161 kV interconnection with CommunauteElectrique du Benin (CEB) connects Akosombo to Lome (Togo). In 1983, theIvory Coast was also interconnected through a 225 kV transmission line (seeMap). Under the proposed project these substations will be repaired andupgraded.
1.18. ECG's distribution facilities comprise 33 kV and 11 kV lines andunderground cables with 33/11/0.4 kV substations feeding power from VRA'stransmission system or ECG's diesel plants. ECG distributes power in the maincities - Accra, Tema, Kumasi, and Sekondi-Takoradi - and in other urbancenters located within the interconnected grid which covers the southern partof Ghana. About 95% of ECG's electricity requirement is purchased from VRA.ECG also operates a number of isolated stations on behalf of the Governmentwhich subsidizes the operation of these facilities. The quality of service isgenerally poor as the system has been inadequately maintained and consumershave been allowed to install service connections of varying materials andconstruction standards. Distribution losses average at least 15%. In view ofthe configuration of the system and the voltages involved, losses could bereduced to about 10%. In recent years service within the interconnected gridhas deteriorated due largely to poor maintenance and inadequate reinforcementof the distribution system. The isolated diesel plant systems serving smalltowns have even more serious problems. Many operate less than half the daybecause of inadequate supply of diesel fuel, in part due to poor roadconditions and the poor state of the contractor's tanker fleet.
R. Access to Service, Electricity Consumption and Exports
1.19. Ghana, with a population of about 12.5 million had about 230,000electricity consumers in 1983, indicating that no more than 10% of thepopulation 2/ had access to electricity. The cities of Accra, Tema, Takoradi,Kumasi, and Cape Coast accounted for 162,000 (70%) of the total number ofconsumers, with the remainder spread over other urban areas. Excluding salesto VALCO and CEB, per capita electricity consumption reached a high of 110 kWhin 1981 (this compares with 217 kWh in Ivory Coast, 124 kWh in Senegal).Sector sales grew steadily at an annual rate of 6.3Z between 1970 and 1977(from 2,763 GWh to 4,226 GWh), but slowed down to an annual pace of 5.0% overthe period 1977-1981 (from 4,226 GWh to 5,181 GWh), as economic activitydeclined. Between 1981 and 1983, however, sales dropped by 33.4Z becausehydro generation decreased from 5,650 GWh in 1981 to 2,650 GWh in 1983 asconsequence of the drought which started in 1981. In June 1983 VALCO wasforced to shut down its aluminum smelter which only resumed operations on areduced scale in April 1985. In 1984, VRA had to restrict supply to Ghana'sdomestic market to 1,000 GWh and to CEB to about 300 GWh. During the secondhalf of 1984 it began exports to Ivory Coast at an annual rate of 300 GWh.
2/ Based on average size household of 5 persons.

- 7 -
Details on Ghana's consumption pattern and rates of growth over 1970-1983 aregiven in Annex 1-2.
I. Power Development and Planning
1.20. Ghana's power sector is at a crossroads. The recent drought haddepleted the Volta lake (Akosombo reservoir), with the result that normaloperation of the reservoir is not certain before, say 1988. With domesticelectricity sales expected to grow between 2% to 5% p.a., new generatingcapacity would be needed primarily as reserve and to increase flexibility inreservoir management. According to an expansion plan prepared by AcresInternational Ltd. (Canada) all new capacity to the year 2000 would bethermal, as none of the hydro options is economic. The attractiveness ofthermal generation has been enhanced by recent offshore discoveries of gas.In all expansion schemes prepared by the consultants, rehabilitation of theTema diesel plant (10 x 3 MW) defers by about two years investments in newthermal capacity. The Tema plant would serve as standby and complement thehydro capacity. Rehabilitation.of Tema would cost about US$ 2.5 million andis included in the proposed project. f
1.21. In July 1984, Government and VALCO renegotiated the 1962 contract.The most significant change to the contract is the provision for reviews everyfive years and an increase in the price for power paid by VALCO, whichoriginally had been set at 2.625 US mills per kWh. The new rate is atapproximately the world average price for power supplied to smelters (aboutUS 20 mills/kWh). Also under the amended contract, VRA's supplies to VALCOare determined by a formula which guarantees that the domestic market getspriority over VALCO. The maximum energy assigned to VALCO is now 2,760 GWh(enough for only four out of five potlines). If VALCO requires more energy torun its fifth potline, it has the right of first refusal over any additionalenergy that may be available after VRA has met its other obligations but at aprice to be negotiated at that time. The new contract gives VRA considerableflexibility to supply customers other than VALCO, particularly the exportmarkets to Energie Electrique de la C^ote d'Ivoire (EECI) and CEB, and toincrease significantly its revenues. Since VRA no longer needs to guarantee afixed amount of power to VALCO, it can manage its reservoir in such a way asto maximize sales and reduce the likelihood of spilling water in wet years.
1.22. Other important changes to the agreement between Ghana and VALCOinclude an increase in the fee VALCO earns from its foreign shareholders onprocessing alui-na into aluminium and an increase in the tax rate on VALCO'sincome. Government now also has the right to nominate two directors to theVALCO board and the option to buy 20% of VALCO's equity during the next fiveyears. The effect on Government's revenues from the change in contract issignificant. For the maximum contracted amount (2,760 GWh/year) VRA'srevenues from sales to VALCO would be about US$ 39 million, at an aluminiumprice of USJ55/pound, as against US$ 15.5 million under the previousagreement. Similarly, tax revenues will increase significantly.
1.23. VRA has pioneered electrical supply across national boundaries inwestern Africa. It has supplied power to CEB starting in 1972 and to theIvory Coast since 1984. The interconnection has worked well and VRA, CEB, andBECI support a West Africa Power System Interconnection (WAPSI) within the
- 8 -
Union des Producteurs, Transporteurs et Distributeurs d'Energie Electriqued'Afrique (UPDEA). WAPSI, in a first stage, would aim at linking the powersystems of Benin, Ghana, Ivory Coast, Nigeria, and Togo. The presentlyinterconnected facilities would then be linked to the 330 kV Nigerian grid viaa 330 kV transmission line from the Ikeja West substation near Lagos to theVolta substation in Ghana. A Danish/Swedish joint venture was retained toprepare an interconnection feasibility study, which was financed with aScandinavian grant, and was completed in July 1984. The African DevelopmentBank (AfDB) was the executing agency and CEB supervised the study, with theBank providing advice. The feasibility study concluded that a West Africainterconnection (including Nigeria) was economic. The study assumed that gaswould be available to supply the 1,320 MW Egbin thermal plant near Lagos.However, the pipeline project to supply that plant is now stalled and thissituation casts doubts on the timing of interconnection with Nigeria.
1.24. The nature of the power systems and resource base in the regionsuggests that many benefits would be reaped from a Nigeria to Ivory Coastinterconnection. Ghana and Ivory Coast have largely hydro generation, whileNigeria is planning for large scale development of gas-fired thermalgeneration. Future interchanges might consist of firming up VRA hydrocapacity with NEPA thermal capacity and seasonal excess hydro energy transfersto effect fuel savings at NEPA in exchange for NEPA thermal energy support toVRA in dry periods. Another possibility is optimization of capacity use bytaking advantage of peak load diversity. Because utilities wish to retainindependence, and resolution of administration complexities takes time, anyinterconnection benefits are likely to be realized only in successive stagesof cooperation. The CEB - VRA - EECI portion of the interconnection hasbecome more attractive with the discovery of gas in Ghana and Ivory Coast,which could fuel gas-fired thermal plants to provide the requiredcomplementation for hydro, and with the increased flexibility provided by thenew VALCO/VRA agreement. As a consequence, reinforcement of VRA's existinggrid and additional transmission circuit to Togo and increased capacity oftransmission to Ivory Coast will likely proceed within the next two to threeyears. Given the uncertainty of future conditions on the Nigerian powersystem and, therefore, the economic attractiveness of the Nigerian portion ofthe West Africa interconnection, VRA has planned a back-up alternative tothermal support from Nigeria. The Acres study determined that a small amountof thermal capacity, 50 to 100 MT, would increase substantially the amount ofenergy VRA could sell while reducing the probability of spilled water byproviding a standby source to meet energy deficits in dry years. VRA shouldprepare such a thermal project for execution in case full interconnection doesnot proceed. The project would therefore include site investigations,engineering and bidding document preparation for a VRA thermal plant tocomplement existing hydro. The type, oil versus gas versus coal and sizewould be finalized in the continuing Acres study.
II. THE BORROWER AND EXECUTING AGENCIES
The borrower of the IDA and cofinanced funds would be the Governmentof Ghana and the beneficiaries would be ECG and VRA.
- 9 -
A. Electricity Corporation of Ghana (ECG)
2.01. ECG was established in 1967 to succeed the Electricity Division ofthe Ministry of Works and Housing and is responsible for the distribution ofelectricity throughout Ghana and for the country's diesel power plants and theoperations of Government's rural electrification works. Over the last fiveyears, ECG could not discharge its responsibilities satisfactorily due toineffective management and lack of foreign exchange to purchase spare partsand equipment. The quality of its service is poor with interrupted andintermittent supply and ECG has been unable to provide either for newconnections or for system reinforcement to maintain voltage levels.
1. Organization and Management
2.02. ECG is organized along typical utility lines. Its organization cLiartis shown in Annex 2-1. ECG has had organization and management problems forseveral years, such as poor administrative links with provincial centers, lackof effective administrative procedures, and a weak managerial team. In May1982 EeG's Board was replaced by a committee comprising the Managing Director,the Financial Controller or Chief accountant, the Chief Engineer of ECG, amiddle management representative, a trade -anion representative, and tworepresentatives of ECG's Workers Defense Committee. This committee provedineffective because it was concerned primarily with political matters andinterfered in the day to day operations of the utility. The committee wasdissolved in December 1984 and the old system reinstated. As part of itssecond stage work (para. 1.15) ESB will examine the composition andresponsibilities of ECG and its new board. Any necessary action will beincluded in ESB's third stage work.
2. Manpower
2.03. At year-end 1979, ECG had close to 6,200 employees (or 37 customersper employee, compared to 90 in Ivory Coast and 80 in Senegal) when it frozehirings. By the end of 1984 the number of employees had declined to 4,800.The pace of employee resignations has accelerated over the last year to about45 per month, as an increasing number of people are cashing in on theiraccrued benefits. Although an appropriate overall staff level will be reachedin the near future, ECG will still be overstaffed at the lower levels and willnot have qualified and trained personnel in sufficient numbers at all levels.ECG has had problems in recruiting and retaining suitably qualified staff,partly because of image problems and partly because employees are notadequately compensated. As a result, ECG has vacancies in about 50% of themanagement and professional cadres and many incumbents appear unsuitable forthe positions they hold. ESB will examine in detail ECG's manpower problemslncluding compensation and make recommendations and would assist ECG infinding suitable managerial staff from within ECG and Ghana and from overseasif necessary (para. 1.14). IDA and the Government will discuss theirrecommendations and agree by December 1986, on a plan to implement themeasures that should be taken in this area. In the meantime, and given theseriousness of the probleu, housi.ng would be financed under the project andassigned to senior staff to complement their remuneration.
- 10 -
3. Training
2.04. ECG is building its own training center at Tema for its technical,commercial and administrative training needs. Due to a shortage of importedmaterials, however, the workshop building is not yet completed. The centeralso lacks equipment, materials, and technical instructors. Staff trainingabroad has been curtailed due to cuts in bilateral aid and foreign exchangeproblems. Consequently, there is a backlog of training needs for managers,engineers and accountants who need exposure to utility operations overseas.In addition, ECG must develop the ability to continuousiv assess its manpowerneeds and plan all its training activities. The technical assistance programunder the proposed project would review all matters relating to training.Completion of the training center, including acquisition of remainingequipment would be financed under the proposed credit. ESB would review theutilities' training provisions and prepare a training program by December1986.
4. Accounting and Audit
2.05. Like other parts of ECG, its accounting department lacks qualifiedstaff. Financial management is almost non-existent and its accounting systemneeds redesign. Information is both sparse and unreliable. ECG keepsseparate accounts for the operation of rural electrification networks onGovernment's behalf. At end-1982, rural net fixed assets represented about 5Xof ECG's own assets. ECG's accounts are audited by Coopers and Lybrand. Forsome years now the auditors have heavily qualified their certificates for ECGdue to the unreliability of its accounting. As part of its assignment, ESBwould assist ECG overcome its accounting and financial management problems.
5. Insurance
2.06. ECG insures for protection against losses of goods-in-transit, fire,third party claims on vehicles and other property and workmen's compensationalong accepted public utility practices.
B. Volta River Authority (VRA)
2.07. VRA is a modern, well operated public utility with a high degree ofautonomy, and is responsible for hydropower generation and power exports toTogo-Benin and Ivory Coast, bulk power supplies to ECG, the Volta AluminumCompany's (VALCO) smelter at Tema, to gold and diamond mines, and the Akosombotextiles and township. VRA was established in 1961 to construct and operatethe Akosombo hydro-plant on the Volta River, which was the first hydroelectricproject in Ghana and was partly financed by the Bank (Loan 310-GH of February1962). In addition to Akosombo, VRA owns the Kpong hydroplant downstream ofAkosombo and the 161 kV grid in Ghana with extensions to Togo and the IvoryCoast.
1. Organization and Management
2.08. VRA's charter, the 1961 Volta River Development Act, charges VRA notonly to operate its hydroelectric plants according to sound public utilitypractices, but also to develop the Volta Lake which involves lake research and
- 11 -
transport. VRA is governed by a Board which is appointed by the Head ofState, who is Chairman ex-officio. The Board is composed of a Chairman andseven other members, including VRA's Chief Executive and representatives ofECG and VALCO. Its organization chart is shown in Annex 2-2.
2. Manpower and Training
2.09. As of December 1984, VRA had about 2,500 employees of which about 95%are engaged in electricity services and 5% in other activities. VRA has beenable to build up and retain good staff because of its financial and managerialindependence, relatively good working conditions and in spite of itsrelatively low salaries. As a result, the morale of VRA's staff is muchhigher than that of ECG's staff. VRA has recently installed its own trainingcenter at Akuse (Kpong) which is functioning well. VRA is receiving financialassistance (about US$ 3 million) on concessional terms from CIDA (Canada) tofinance equipment and expatriate instructors for its training center. TheAkuse center does not yet have all intended training specializations (notably,mechanical maintenance training), but VRA plans to provide these opportunely.
3. Accounting and Audit
2.10. VRA's accounting system is good. Financial forecasting is done on amicro-computer and production of accounting, budgeting and forecasting data istimely. VRA maintains separate accounts for activities unrelated toelectricity services. The accounting and finance departments have qualifiedstaff but appear understaffed. VRA's accounts are also audited by Coopers andLybrand. The accounts of VRA have always been certified without qualificationby the auditors.
4. Insurance
2.11. VRA insures against most common risks associated with hydrogeneration and transmission, fire, third party claims on vehicles and otherproperty and workmen's compensation along accepted public utility practices.
C. History of Bank Group Involvement with the Power Sector
2.12. Three projects financed by three IDE credits and one IBRD Loan havebeen made to assist the expansion of ECG's distribution system: a credit ofUS$ 10 million in 1968, US$ 2 million in 1971 and US$ 9 million in 1977together with a loan of US$ 9 million. The first two projects were completedsatisfactorily. The Third Power Project was completed in 1982 after athree-year delay, due in part to Ghana's economic situation and in part toECG's poor project administration. Although the project was successful inproviding new facilities, it was not successful in improving the management orthe operations of ECG. A Project Performance Audit Report (PPAR) of June 6,1985, presents in detail the effects of the project and the main lesson to belearned from it which is that in economies where growth prospects areuncertain, more emphasis should be placed on ensuring full utilization ofcapacity of existing facilities, rather than investing in extensicns of suchsystems.
- 12 -
2.13. Three loans have been made to VRA: the first for US$ 47 million toassist in financing the Volta River Hydroelectric Project (Akosombo) in 1961;the second for US$ 6 million for the Volta Expansion Project in 1968; and thethird for US$ 39 million to help finance the Kpong Hydro-Project in 1977. Thefirst two projects were completed satisfactorily. The Kpong projectexperienced cost overruns of about 140% in local costs and 14% in foreign costand two years delay, and was completed 1982. The cost overruns were due toGhana's poor economic condition which caused shortages and delays in obtaininglocally purchased equipment and materials and by the very high inflation thatprevailed at that time. The PPAR of June 6, 1985, points out, among others,that for hydro projects in the Sahel, extensive drought periods must beconsidered in structuring the hydrological design and operation criteria.
D. Bank Group Objectives, Strategy and Rationale for Involvement
2.14. The principal objective of the Bank in the power sector in Ghana isto improve the reliability, reduce the cost of electric power supplies andsupport economic grid extensions within Ghana, while at the same time reducingthe demands imposed by the sector on Government resources and maintaining thesector's export capability. The Bank's past lending has helped Ghana achievesome of these objectives, and by assisting VRA, has helped build one of thebetter managed utilities in West Africa. The Bank has not, however, succeededin introducing institutional and organizational reforms in ECG which wouldhave helped improve reliability and reduce costs. During the preparation ofthis project, IDA and the Government have agreed on a two front approach totackle the sector's problems. First, ESB's work and follow-up actions willprovide the basis for the reorganization and institutional rehabilitation ofthe sector. Second, the physical rehabilitation of the sector's facilitieswill improve service and consolidate finances. These actions would preparethe sector for future development and enhance its capacity to fulfill itsstrategic role in the economic growth both in Ghana and in its neighbors.
III. THE PROJECT
3.01. The project proposed for IDA financing is an important component ofthe 1986-90 investment program and will concentrate on the rehabilitation ofECG's and VRA's systems. It includes priority facilities that would permitthe sector to provide reliable service by 1990. Implementation of the projectis expected to begin by January 1, 1986, and be completed by December 31,1990.
- 13 -
3.02. Project Descrlption. The project comprises the following:
A. ECG
(a) Generationrehabilitation of the Tema diesel plant (10 x 3 MW). 3/
(b) Distribution 4/(i) improvements and installation of transformers at 33/0.4 kV,
33/11 kV, and 11/0.4 kV.
(ii) installation of low voltage distribution boards.
(c) General Plantprovision of about 100 new motor vehicles and spare parts for about120 existing ones, about 10 houses for ECG's senior staff, andmiscellaneous office equipment;
(d) Institutionaltechnical assistance and trainin- to be provided by an operatingutility. Government and ECG have retained the Electricity SupplyBoard of Ireland (ESB) who will perform the following:
(i) a diagnosis of the sector with recommendations on future sectororganization, and in particular on analysis of the merits ofmerging ECG and VRA and also include preparation of a workplan, staffing plan and schedule for execution of the followingwork stage;
(ii) review existing legislation governing the sub-sector, and inparticular legislation governing the management and operationof the utilities;
(iii) prepare a detailed institutional rehabilitation plan and assistin its implementation. ESB's services would entail about 168man-months; and
(iv) technical assistance through operational support, also to beprovided by ESB.
(e) Trainingtraining overseas of 6 mid-level professionals has been included,plus 6 scholarships.
3/ To be executed by VRA.
4/ For details see Annex 3-1.
- 14 -
B. VRA
(a) Generationanticorrosive painting of all exposed metal parts of the Akosombohydro plant;
(b) general improvements and renovation of miscellaneous electricalapparatus in the following substations: 5/
- Akosombo Area - Kpong, Tafo and Akwatia;- Volta Area - Winneba, Achimota, and Smelter;- Takoradi Area - Cape Coast, Takoradi, Tarkwa, and Prestea; and- Kumasi Area - Obuasi, Dunkwa, Kumasi, Konongo, and Nkawkaw; and
C. Studies
- Improvement in efficiency of the Akosombo hydro plant.
- Distribution expansion plans.
- Market surveys and economic analyses of the high voltage lineextensions to the northwest and northern parts of Ghana.
- Detailed and updated economic analyses of the proposedgeneration expansion plan and detailed engineering studies forthe next power plant.
- Tariff study (discussed in para. 4.12).
A. Project Cost
Project costs are summarized below:
5/ For details see Annex 3-1.
- 15 -
-mnory Project Costs
Foreign Totalas % of as % of
_~~~~~~~~~~~~~~oa Ikcal Toaltal_ceBOO FCMVIW Tool Toa Fr4p local Total Total Base cost- Cedi mink - !aLfLt -
Re*ibflitatlixnG8 125.0 15.0 140.0 2.5 0.3 2.8 89.3 7.9
Distrlbutim 405.0 120.0 525.0 8.1 2.4 10.5 77.1 29.5Vehicles and spares 235.0 - 235.0 4.7 - 4.7 100.0 13.2Technical assistance 110.0 25.0 135.0 2.2 0.5 2.7 81.5 7.6Training 20.0 - 20.0 0.4 - 0.4 100.0 1.1Studies 10.0 - 10.0 0.2 - 0.2 100.0 0.6Office eqipment 15.0 - 15.0 0.3 - 0.3 - 0.8Hbusing 10.0 25.0 35.0 0.2 0.5 0.7 28.6 1.9Base cost (BOG) 930.0 185.0 1,115.0 18.6 3.7 22.3 83.4 62.6
RAEdbfltticx:
Geeaticu 75.0 15.0 90.0 1.5 0.3 1.8 83.3 5.1Substations 485.0 75.0 560.0 9.7 1.5 11.2 86.6 31.4Studies 15.0 - 15.0 0.3 - 0.3 100.0 0.9
Base cost 3) 575.0 90.0 665.0 11.5 1.8 13.3 86.5 37.4Sub-total (Base cost) 1,505.0 275.0 1,780.0 30.1 5.5 35.6 84.6 100.0Phyical contignes 150.0 30.0 180.0 3.0 0.6 3.6 83.3 10.1Price cltfrgmEie 897.3 167.7 1065.0 8.1 1.5 9.6 84.4 27.0Total project cost andtotal finaxn requried 2,552.3 472.7 3,025.0 41.2 7.6 48.8 84.4 137.1
a/ Re litt of the Ta diesl plait wi be crried out by WA.
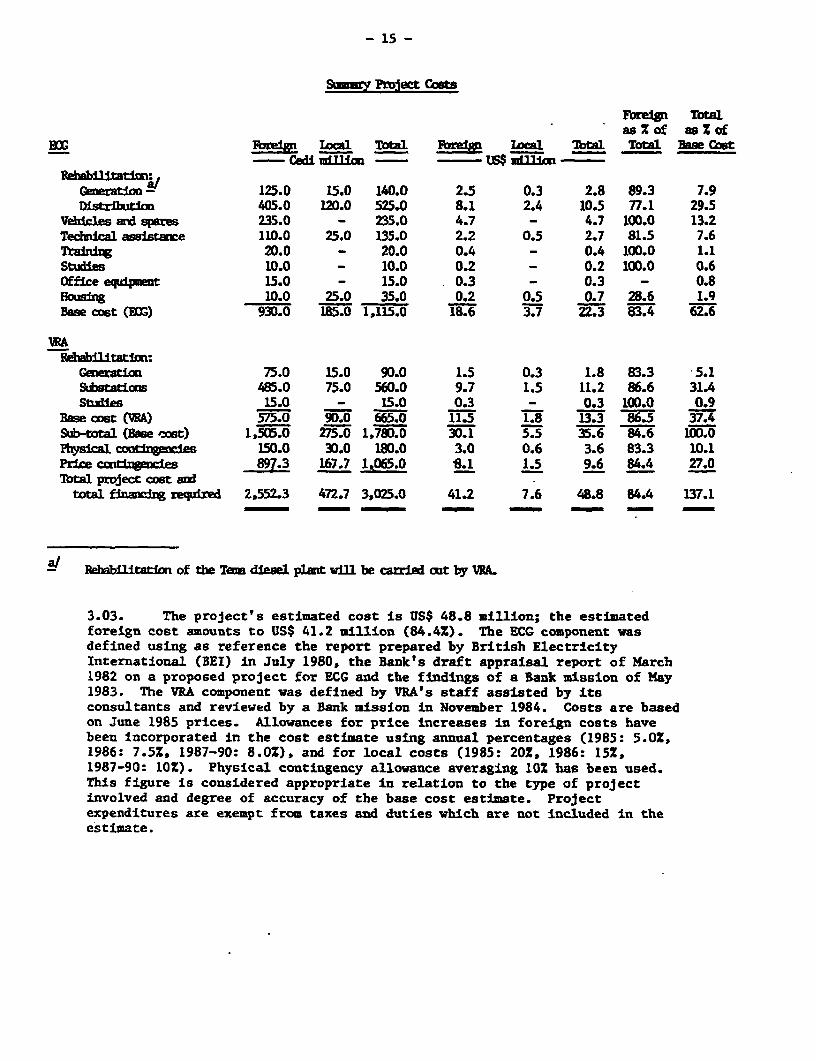
3.03. The project's estimated cost is US$ 48.8 million; the estimatedforeign cost amounts to US$ 41.2 million (84.4%). The ECG component wasdefined using as reference the report prepared by British ElectricityInternational (BEI) in July 1980, the Bank's draft appraisal report of March1982 on a proposed project for ECG and the findings of a Bank mission of May1983. The VRA component was defined by VRA's staff assisted by itsconsultants and reviewed by a Bank mission in November 1984. Costs are basedon June 1985 prices. Allowances for price increases in foreign costs havebeen Incorporated in the cost estimate using annual percentages (1985: 5.0%,1986: 7.5%. 1987-90: 8.0%), and for local costs (1985: 202. 1986: 15Z,1987-90: 10%). Physical contiugency allowance averaging 10% has been used.This figure is considered appropriate in relation to the type of projectinvolved and degree of accuracy of the base cost estimate. Projectexpenditures are exempt from taxes and duties which are not included in theestimate.
- 16 -
B. Project Financing
3.04. The proposed IDA credit would finance the foreign cost of ECG'srehabilitation equipment and materials, anticorrosive treatment of Akosombo,the foreign cost of the technical assistance, and training overseas of ECG'sstaff, and studies that will be needed both by ECG and VRA. The co-lender isexpected to finance most of the foreign exchange cost of VRA's rehabilitationprogram. The financing plan, as currently defined, would be as follows:
Project Financing and Assumed Terms to ECG and VRA
IDA Credit 28.0 15 years including up to 5 years grace at lnZItalian Government 10.0 SameECG 4.9 Internally generated fundsVRA 5.9 Same
48.8
The Government would relend the proceeds of the Credit to ECG and to VRA at8.8% for 15 years, including a grace period of up to 5 years. ECG and VRAwould bear the foreign exchange risk. Cofinancing is expected from theItalian Government (a memorandum of understanding between them and VRA is tobe signed soon). IDA has obtained assurances from Government to cover allfunding shortfalls, should they occur, to complete the project on schedule.
C. Procurement
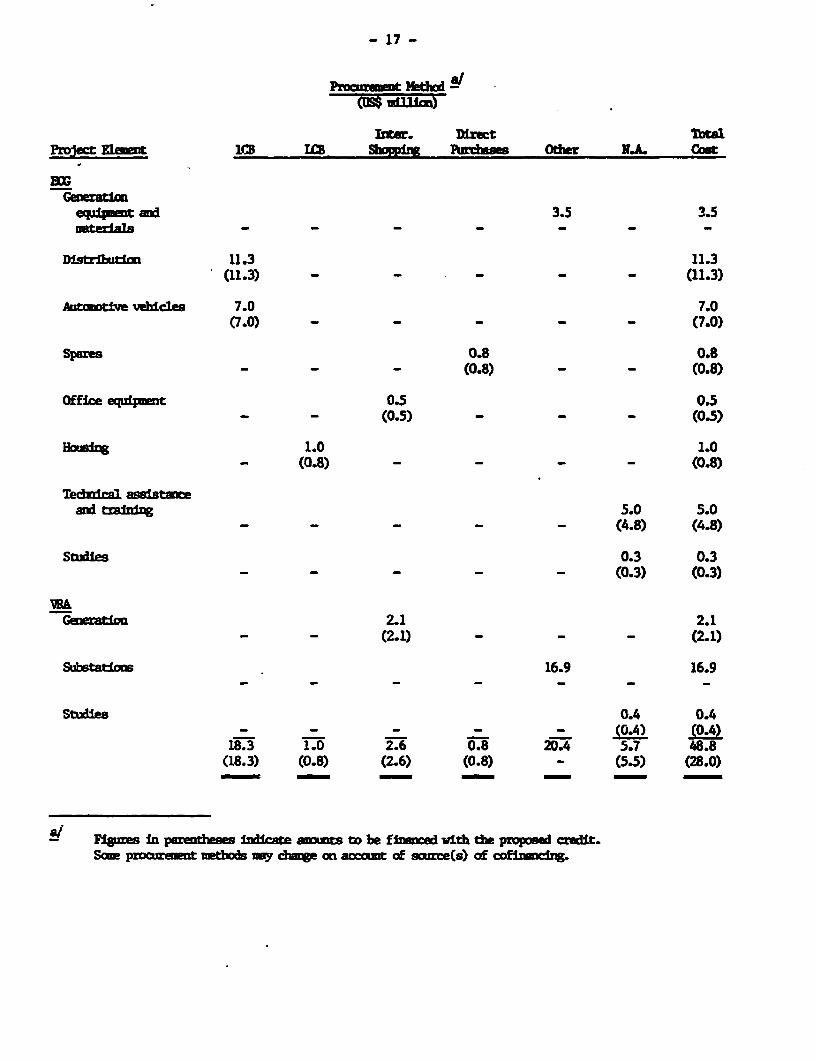
3.,05. ECG's distribution equipment and materials, and motor vehicles,would be procured through international competitive bidding (ICB) inaccordance with IDA guidelines. Office equipment would be procured throughinternational shopping and motor vehicle spare parts for ECG's existing fleetthrough direct purchases from the original manufacturers. Housing for ECGwould be procured through LCB and under guidelines acceptable to the Bank.Anticorrosive treatment of Akosombo will be contracted through internationalshopping. The Tema plant rehabilitation and VRA's substation equipment andmaterials would be purchased under the procurement requirements of thecofinancing sources. A summary of the procurement methods expected to be usedis given below and a time schedule for the various steps of procurement isshown in Annex 3-2.
- 17 -
Proart Nt(t1$ ui
Inter. Dirct TbtelProject E.ent 11:1 IQ pSxt Pewdis Other NJL Coat
equ1pt an 3.5 3.5aterial - - -_
Disriti 11.3 11.3(11.3) - - _ _ _ (11.3)
AhvtiVe vebidls 7.0 7.0(7.0) - - - - - (7.0)
Spares 0.8 0.8- - - (0.8) - - (0.8)
Office enur[mt 0.5 0.5= - (0.5) - - - (0.5)
Houizg 1.0 1.0- (0.8) - - - - (0.8)
Tedmica1 a8stuieand traini 5.0 5.0
- - - - - (4.8) (4.8)
Stlial 0.3 0.3_ _ - - - (0.3) (0.3)
INAGoierat1on 2.1 2.1
- - (2.1) _ _ _ (2.1)
Substati= 16.9 16.9
Sties 0.4 0.4- - - - - (0.4) (0.4)
18.3 1.0 2.6 0.8 20.4 5.7 48.8(18.3) (0.8) (2.6) (0.8) - (5.5) (28.0)
a/ F1gLires in pid s diae mts to be fined ith the propsed credit.Scm pcuremnt tbods uuy dhwge on accmt of swume(s) of cofizdrg.
- 18 -
D. Status of ProJect
3.06. ESB, who will provide technical assistance in the sector, began itswork in May 1985 through a PPF advance approved by the Bank in August 1983.Preparation of bidding documents has begun.
E. Project ImplementatioT
3.07. The executing agencies would be ECG and VRA. ESB, which has beencontracted by Government for the sector organization, will also assist ECG toprepare technical specifications and tender documents for the rehabilitationof its system. VRA, assisted by its own consultants (Acres of Canada), willcarry out its part of the project. The project implementation scheduleappears as Annex 3-3.
F. Disbursements
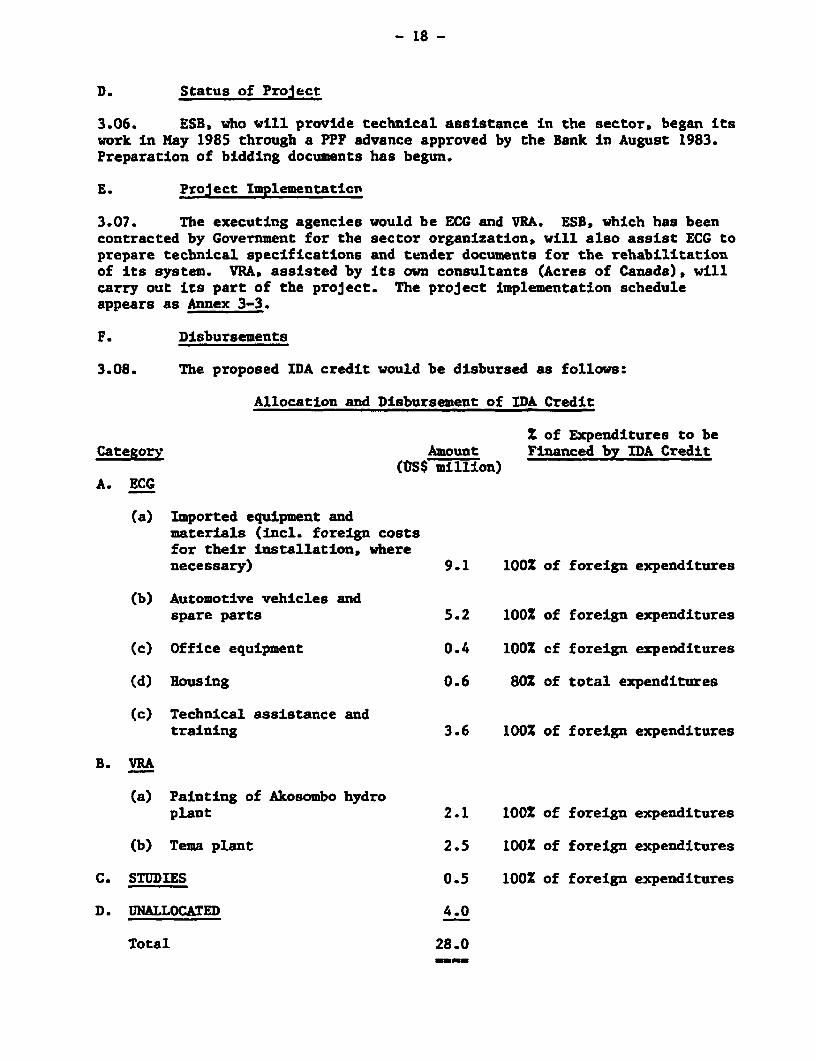
3.08. The proposed IDA credit would be disbursed as follows:
Allocation and Disbursement of IDA Credit
Z of Expenditures to beCategorab Amount Financed by IDA Credit
(tS$ million)A. ECG
(a) Imported equipment andmaterials (incl. foreign costsfor their installation, wherenecessary) 9.1 100% of foreign expenditures
(b) Automotive vehicles andspare parts 5.2 1002 of foreign expenditures
(c) Office equipment 0.4 100X cf foreign expenditures
(d) Housing 0.6 80% of total expenditures
(c) Technical assistance andtraining 3.6 100Z of foreign expenditures
B. VRA
(a) Painting of Akosombo hydroplant 2.1 100% of foreign expenditures
(b) Tema plant 2.5 100% of foreign expenditures
C. STUDIES 0.5 10O2 of foreign expenditures
D. UNALLOCATED 4.0
Total 28.0
- 19 -
3.09. The estimated schedule of disbursements is based on the SectoralDisbursements Profile in West Africa and is shown in Annex 3-4. Arrangementsto establish a-Special Account, to be maintained in foreign currency in acommercial bank, were agreed during negotiations. Withdrawals will be madeagainst full documentation, with the exception of contracts of less thanUS$ 10,000 equivalent and training overseas; reimbursement for expenditureswill be made on the basis of statements of expenditures (SOEs) for -whichsupporting documentation will be retained by the implementing agenciesconcerned. Amoxnis withdrawn on the basis of SOEs will be subject to specialauditing arrangements, including a separate opinion covering the use of thesefunds.
G. Environment
3.10. The project is not expected to produce any adverse environmentaleffects.
IV. FINANCIAL ANALYSIS
A. Past Finances
1. Backround
4.01. ECG's charter mandates it to operate commercially and to setelectricity charges at levels sufficient to cover annual operating costs, debtservicing requirements, fund a reasonable proportion of its expansion programand contribute to reserves. According to its charter, VRA has to operatecommercially and make profits. The actual financial performance of Ghana'spower sector in recent years must be seen in context with the deterioration ofthe economy, the drought that has affected Ghana since 1981 and the economicmeasures (Economic Recovery Program) undertaken since April 1983.
4.02. The deterioration of the economy has adversely affected thefinancial position of the sector as high inflation produced cost increaseswhich were not offset by timely and adequate rate Increases; industrial demandfor electricity declined and the sector lacked needed foreign exchange.Simultaneously, the drought has reduced hydroelectric generation, furtherrestricting sector revenues, particularly foreign exchange earniugs. As partof the Economic Recovery Program, Government devalued the Cedi by 11 times inOctober 1983, and by a further 60% in several stages in 1984. The Cedidevaluations resulted in additional cost increases and made critical thesector's financial position. To remedy this situation Government increasedelectricity rates by about 500% in 1984, and authorized further increases ofabout 20% for 1985, and about 15% for 1986. These measures, which were takenin the most adverse circumstances, are expected to put the sector on e soundfinancial footing.
4.03. The consequences of the economic measures are still rippling throughthe economy and make the analysis of data and their projection difficult. Inaddition, ECG's information is scant, inaccurate and tardy.

- 20 -
2. Past Earnings
4.04. Detailed Income Statements for ECG are shown in Annex 4-1.and forVRA in Annex 4-2; the table below summarizes their earnings over the period1981-1984:
Gand VRA - Past Frnrs 1961-M14(in mffIi-i O
BOG - ~~~~~VRAEst. Est.
FIscal Year 1981 1982 1983 1984 1981 1982 1983 1984
Sales (GWh) 1,004 890 866 687 5,181 4,799 2,436 1,63D
Average reva3m (t/Ib) .245 .314 .357 2.235 .035 .037 .099 .780
Totalreverms 248 284 315 1,542 194 189 264 1,372
Total expenes 22D 231 442 1,160 112 162 554 1.485
Net inxcme 28 53 (127) 382 82 27 (290) (113)
Ope Elrig ratio 82 76 128 70 52 64 207 65
Revalued rate b bs 2-76 329 1,229 2.332 1,416 1.650 5,987 11,295
Rate of returX C/
-nralued ratebase - 15.9 20.7 (7.1) 22.1 6.5 2.1 (6.8) (1.0)
Average revalued met fi Ldassets in operation 263 314 1,171 2.221 1.656 2,150 8,820 19,032
Rate of return o average revahednet fixed assets in operatim 16.7 21.7 (7.5) 23.3 6.0 3.5 (2.6) 2.6
Incbzles interest dhages and non-perating annde losses.
or FbOG, rate base is the sun of average revaled net fixed assets in peration plus 5% on it aswoking capital allcumce. Revalued assets are uissim estimtes, dbich may be uiderstated(para. 4.08). For VRA, rate base is average capital (equity, retaied earnings and revaluation reserve).
-/ F¢or EG, the rate of retumn is dbtaied by dividing net qprating inore by the rate base. For VEA, therate of return is obtaied by dividing net inccoe by the rate base.
Credit 689-GE and Loan 1381-GE earnings covenant requires ECG to earn a rateof return equivalent to 6.2% of its rate base (average revalued net fixedassets in operation plus 5% working capital allowance). Following two years
- 21 -
(1981 and 1982) of excellent earnings provided by substantial rate increases(183Z for 1981-1982), ECG did not cover its costs in 1983. In 1983, theGovernment granted ECG rate increases which yielded a 14% increase in itsrevenue while the utility's total costs (including interest charges) increasedby about 92%, mostly as a result of the devaluatic-: of the currency. The 500%rate increase granted to ECG in 1984 is expected to have produced again a veryhigh return; more than 20%.
4.05. Loan 1380-GH requires VRA to earn a rate of return equivalent to7.3% of average owner's equity (net income over average equity). VRA'searnings in 1981 were close to those required by Loan 1380-GH but deterioratedsteadily as a result of the drought until they bottomed out in 1983. In1981-1982 the Government authorized VRA rate increases of about 68% to itsdomestic consumers and VRA was able to increase the price on its exports toCEB by about 48%, while the utility's operating costs increased by about 47%.In 1983, the 15% rate increases granted VRA on its domestic sales andincreases in the Cedi equivalent of its exports - resulting from the Cedidevaluation - were much lower than the 240% increase in its total costs. The1984 hefty rate increases approved by the Government are expected to haveresulted still in a negative return figure on average capital but with a clearimproving trend.
3. Financing Performance
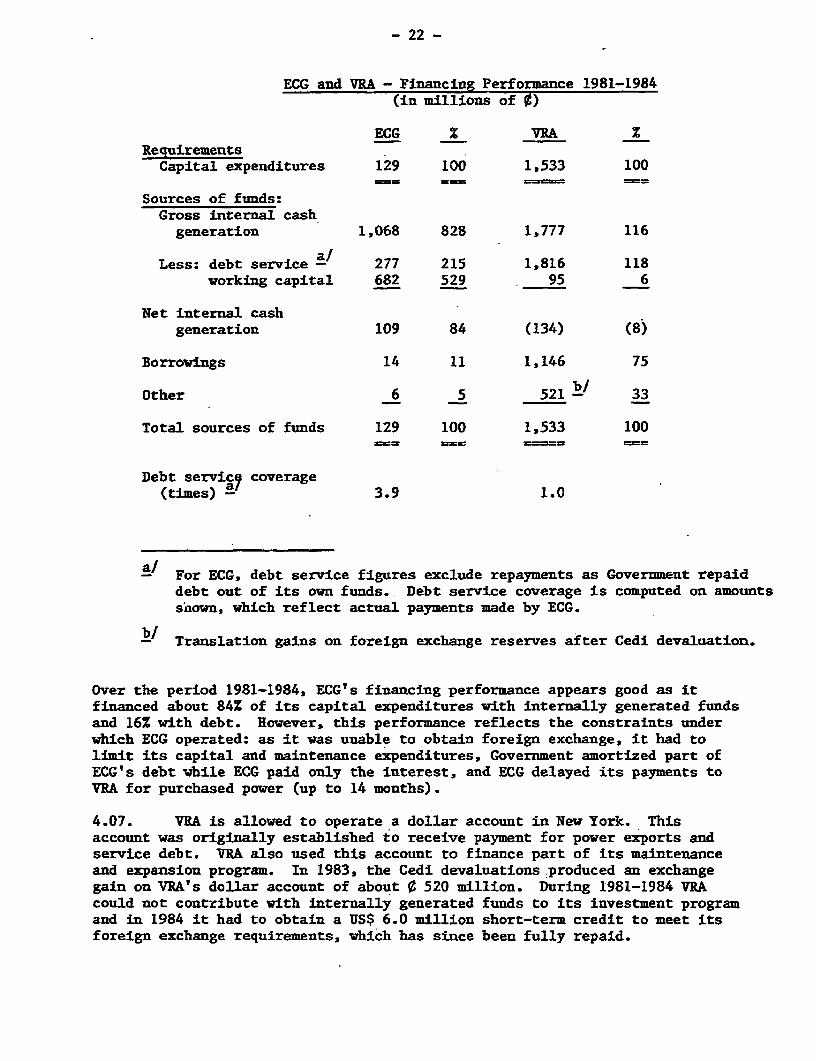
4.06. Detailed Sources and Applications of Funds Statements for ECG (since1981) are shown in Annex 4-3 and for VRA in Annex 4-4 and summarized asfollows:
- 22 -
ECG and VRA - Financing Performance 1981-1984(in millions of 0)
ECG % VRA ZRequirementsCapital expenditures 129 100 1,533 100
Sources of funds:Gross internal cash
generation 1,068 828 1,777 116
Less: debt service a/ 277 215 1,816 118working capital 682 529 95 6
Net internal cashgeneration 109 84 (134) (8)
Borrowings 14 11 1,146 75
Other 6 5 5 2 1 k' 33
Total sources of funds 129 100 1.533 100
Debt servic 7 coverage(times) - 3.9 1.0
-/ For ECG, debt service figures exclude repayments as Government repaiddebt out of its own funds. Debt service coverage is computed on amountssLnown, which reflect actual payments made by ECG.
b/ Translation gains on foreign exchange reserves after Cedi devaluation.
Over the period 1981-1984, ECG's financing performance appears goad as itfinanced about 84Z of its capital expenditures with internally generated fundsand 16Z with debt. However, this performance reflects the constraints underwhich ECG operated: as it was unable to obtain foreign exchange, it had tolimit its capital and maintenance expenditures, Government amortized part ofECG's debt while ECG paid only the interest, and ECG delayed its payments toVRA for purchased power (up to 14 months).
4.07. VRA is allowed to operate a dollar account in New York. Thisaccount was originally established to receive payment for power exports andservice debt. VRA also used this account to finance part of its maintenanceand expansion program. In 1983, the Cedi devaluations produced an exchangegain on VRA's dollar account of about ¢ 520 million. During 1981-1984 VRAcould not contribute with internally generated funds to its investment programand in 1984 it had to obtain a US$ 6.0 million short-term credit to meet itsforeign exchange requirements, which has since been fully repaid.
- 23 -
4. Capitalization
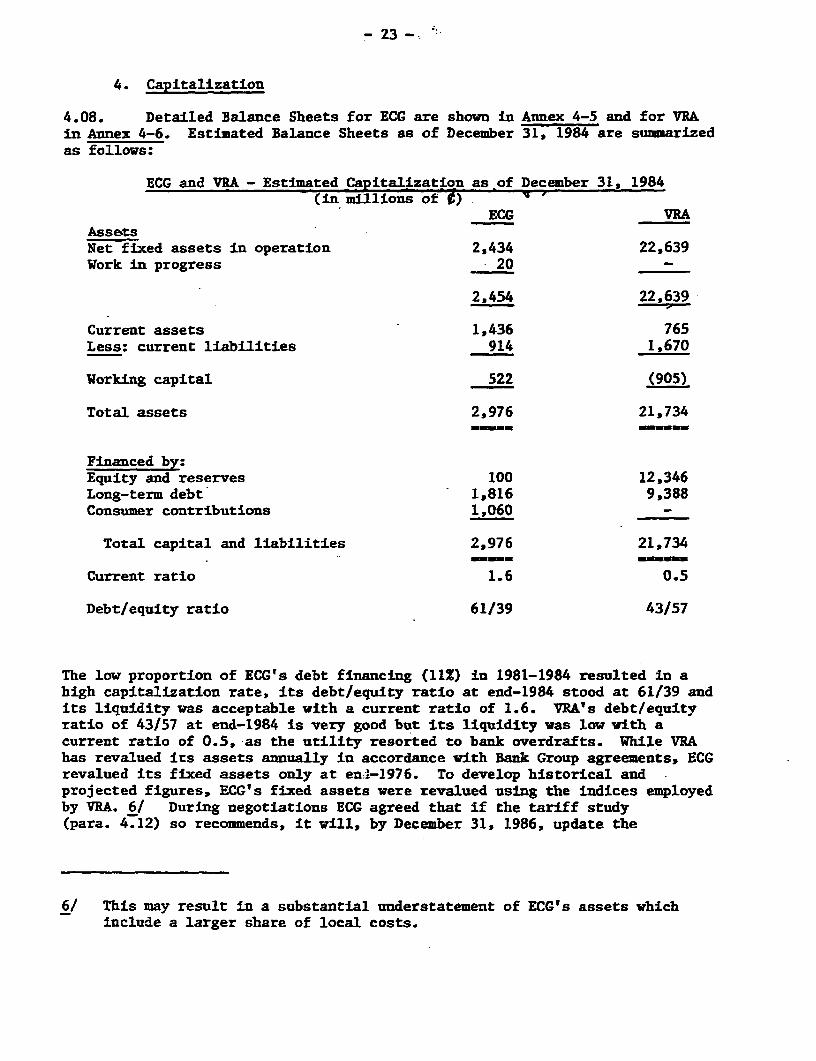
4.08. Detailed Balance Sheets for ECG are shown in Annex 4-5 and for VRAin Annex 4-6. Estimated Balance Sheets as of December 31, 1984 are summarizedas follows:
ECG and VRA - Estimated Capitalization as of December 31, 1984(in millions of 0 )
ECG VRAAssetsNet fixed assets in operation 2,434 22,639Work in progress - 20 -
2,454 22,639
Current assets 1,436 765Less: current liabilities 914 1,670
Working capital 522 (905)
Total assets 2,976 21,734
Financed by:Equity and reserves 100 12,346Long-term debt 1,816 9,388Consumer contributions 1,060 -
Total capital and liabilities 2,976 21,734
Current ratio 1.6 0.5
Debt/equity ratio 61/39 43/57
The low proportion of ECG's debt financing (11%) in 1981-1984 resulted in ahigh capitalization rate, its debt/equity ratio at end-1984 stood at 61/39 andits liquidity was acceptable with a current ratio of 1.6. VRA's debt/equityratio of 43/57 at end-1984 is very good but its liquidity was low with acurrent ratio of 0.5, as the utility resorted to bank overdrafts. While VRAhas revalued irs assets annually in accordance with Bank Group agreements, ECGrevalued its fixed assets only at en'-1976. To develop historical andprojected figures, ECG's fixed assets were revalued using the indices employedby VRA. 6/ During negotiations ECG agreed that if the tariff study(para. 4.12) so recommends, it will, by December 31, 1986, update the
6/ This may result in a substantial understatement of ECG's assets whichinclude a larger share of local costs.
- 24 -
revaluation of its assets to 1985 and will continue to revalue them every yearthereafter. VRA will continue to revalue its assets every year.
B. Billing and CollectionB. ~~~~~~~~~~~~~P
4.09. ECG has serious billing and collection problems. Receivables haverisen from almost 6 months billing in 1978 to 11 months by 1983. ESB, underproject financing, is assisting in improving ECG's billing and collection toreduce receivables to no more than 3 months billing by end-1987. On the otherhand, VRA's main collection problem has been ECG's overdues (para. 4.06). Itis expected that VRA would be able to reduce its receivables to 2 monthsbilling by end-1986 as ECG's finances improve and ECG pays its overdues. Amajor reason for ECG's overdues to VRA (over C 450 million) is ECG'sreceivableb from Government and parastatals (Government overdues stand atabout e 200 million and the Water and Sewerage Corporation's at about C 250million). Government is now paying its overdues under a plan agreed with ECG.To ensure that this plan is carried out in a timely manner, it was agreedduring negotiations that ECC will improve its collections so that byDecember 31, 1986, it will have no more than 120 days of billing outstandingand by December 31, 1987, and thereafter, no more than 90 days of billing.During negotiations it was also agreed that interlocking overdues amongGovernment, ECG and VRA will be settled not later than December 31, 1986.
C. Tariffs
1. Present Arrangements
4.10. Both ECG and VRA request rate increases to the MFP. After theproposal has been reviewed by X4EB, MEP makes a final decision on behalf ofGovernment. ECG's tariffs comprise demand and energy charges 7/ forcommercial and industrial customers. Its average selling price by end-1984was 9/kWh 2.235 or USi/kWh 4.47. 8/ Despite the recent rate increasesGhana's average revenue per kWh at the retail level is low compared to mostother West African countries (in USI/kWh: Benin: 14; Togo: 12; Ivory Coast:10; Senegal: 11; Burkina: 19), which reflects primarily Ghana's cheap hydrogeneration. VRA's tariffs are also two-part, comprising demand and energycharges. VRA's power sales to VALCO are now billed at over USJ 1 per kWh(para. 1.21). The price of VRA sales to CEB is USJ 4 per kWh from April 1,1985 to March 31, 1988, when it is scheduled to be renegotiated. The pricecurrently charged Ivory Coast is USi 4 per kWh but a long-term contract hasnot yet been agreed. VRA's total estimated average revenue for 1984 was
7/ Energy charge is that portion of the billed charge for electric servicewhich is based upon the elec.ric energy (kilowatt-hours) supplied; demandcharge is the portion of the billed charge which is based on billingdemand (power, which is measured in kilowatts).
8/ Cedis 50.0 = US$ 1.00.
- 25 -
9 0.78/kWh or USi/kWh 1.56 and its average cost ¢ 0.54/kWh or USi 1.1. 9/Annex 4-7 shows ECG's and VRA's domestic rate schedule.
4.11. ECG used to bear all diesel generation costs of the provincialstations, which it passed to consumers through a standard rate schedule. Toensure equity in sharing generation costs among all consumers, ECG hasrecently been authorized to charge all generation costs to VRA, who passesthem on to all domestic consumers at the bulk level, including ECG. However,the procedure for computing these charges is not yet finalized. Furthermore,to ensure that additional costs will be passed on to consumers on time, bothECG and VRA should incorporate fuel and bulk power cost adjustment clauses intheir tariff schedules and power supply contracts. During negotiations,Government, ECG and VRA agreed to confirm a procedure for computing andinvoicing ECG's generation costs to VRA for recovery in the charges to allbulk power consumers and agreed that ECG and VRA would incorporate fuel andbulk power cost adjustment clauses in their tariff schedules and power supplycontracts under procedures to be agreed with IDA.
2. Future Tariffs
4.12. Now that the Acres generation planning has been completed, sectortariffs should be examined. During negotiations, ECG and VRA agreed that theywill hire consultants, to be financed by the proposed credit, to carry out astudy of the sector tariffs and to discuss with IDA the findings of such a.study. This study will, among others, recommend an appropriate financial goalfor the sector. On the basis of such study. Government and IDA will agree onthe criteria and schedule for adjusting electricity rates. The study will setelectricity prices after consideration of the long-run marginal cost (LRMC,currently estimated at between USi 5 and 6 per kWh at the generation level),and a level sufficient to cover costs, service debt and make an adequatecontribution to expansion program. The revised agreement between VALCO andVRA provides flexibility to supply domestic markets for the foreseeable futurewith low cost power from Akosombo. Tariffs based on LRMC may tlus providelarge surpluses. The study will also make recommendations on the allocationof surpluses between retention at the utilities or payment of dividends. Thefinal results of the study should be available for discussion with IDA bymid-1986.
D. Financing Plan
4.13. The financial projections take into account the rate increasesalready allowed by Government (para. 4.02), and rates were assumed to remainunchanged at their 1986 level until 1990. VRA prices on its exports ofelectricity were kept constant throughout 1985-1990. VRA sales to VALCO wereconservatively valued at the minimum selling price of USJ 1 per kWh. ECG andVRA tentative investment plans are shown in para. 1.11. ECG's and VRA's
91 This cost is an inflated estimate due to the reduced sales that resultedfrom the drought.
- 26 -
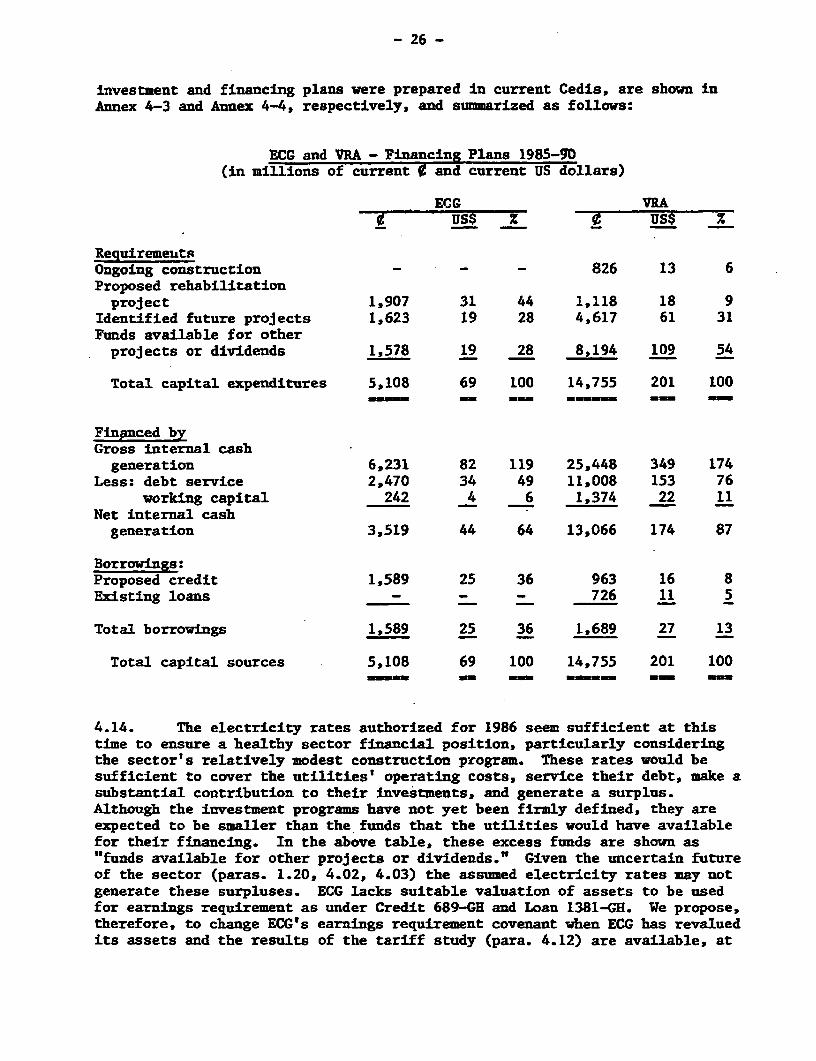
investment and financing plans were prepared in current Cedis, are shown inAnnex 4-3 and Annex 4-4, respectively, and summarized as follows:
ECG and VRA - Financing Plans 1985-90(in millions of current ¢ and current US dollars)
ECG VRAUS$ % ¢ USS z
RequiremeutsOngoing construction - - - 826 13 6Proposed rehabilitationproject 1,907 31 44 1,118 18 9
Identified future projects 1,623 19 28 4,617 61 31Funds available for otherprojects or dividends 1,578 19 28 8,194 109 54
Total capital expenditures 5,108 69 100 14,755 201 100
Financed byGross internal cashgeneration 6,231 82 119 25,448 349 174
Less: debt service 2,470 34 49 11,008 153 76working capital 242 4 6 1,374 22 11
Net internal cashgeneration 3,519 44 64 13,066 174 87
Borrowings:Proposed credit 1,589 25 36 963 16 8Existing loans - - - 726 11 5
Total borrowings 1,589 25 36 1,689 27 13
Total capital sources 5,108 69 100 14,755 201 100
4.14. The electricity rates authorized for 1986 seem sufficient at thistime to ensure a healthy sector financial position, particularly consideringthe sector's relatively modest construction program. These rates would besufficient to cover the utilities' operating costs, service their debt, make asubstantial contribution to their investments, and generate a surplus.Although the investment programs have not yet been firmly defined, they areexpected to be smaller than the funds that the utilities would have availablefor their financing. In the above table, these excess funds are shown as"funds available for other projects or dividends." Given the uncertain futureof the sector (paras. 1.20, 4.02, 4.03) the assumed electricity rates may notgenerate these surpluses. ECG lacks suitable valuation of assets to be usedfor earnings requirement as under Credit 689-GH and Loan 1381-GH. We propose,therefore, to change ECG's earnings requirement covenant when ECG has revaluedits assets and the results of the tariff study (para. 4.12) are available, at
- 27 -
which time the covenant would.be reviewed. Likewise, we propose to changeVRA's earnings requirement until the results of the tariff study areavailable. Although VRA's earningF requirement (para. 4.05) has worked wellin the past, it may not-be effective over the'next years if rains do notreturn to normal. Consequently, during negotiations, Government, ECG, and VRAagreed that:
(a) pending the results of the tariff study, ECG's and VRA'sdomestic rates would be reviewed annually and adjusted asnecessary to ensure that they would be the higher of either therates approved to be in effect by January 1, 1986 or sufficientto produce revenues to cover operating expenses, debt service,and working capital and produce a contribution to investment ofnot less than 25Z; and
(b) after completion of the tariff study, but not later thanJune 30, 1986, Government, the power entities, and IDA willagree on a financial objective and review the provision onearnings requirements.
4.15. Under the above conditions, in 1985-1990 ECG and VRA would not needborrowings other than the proposed Credit and cofinanced loan, and VRA woulddrawdown the remaining funds on existing loans (mostly contractors' andsuppliers' credits) to finance its ongoing construction program.
E. Future Finances
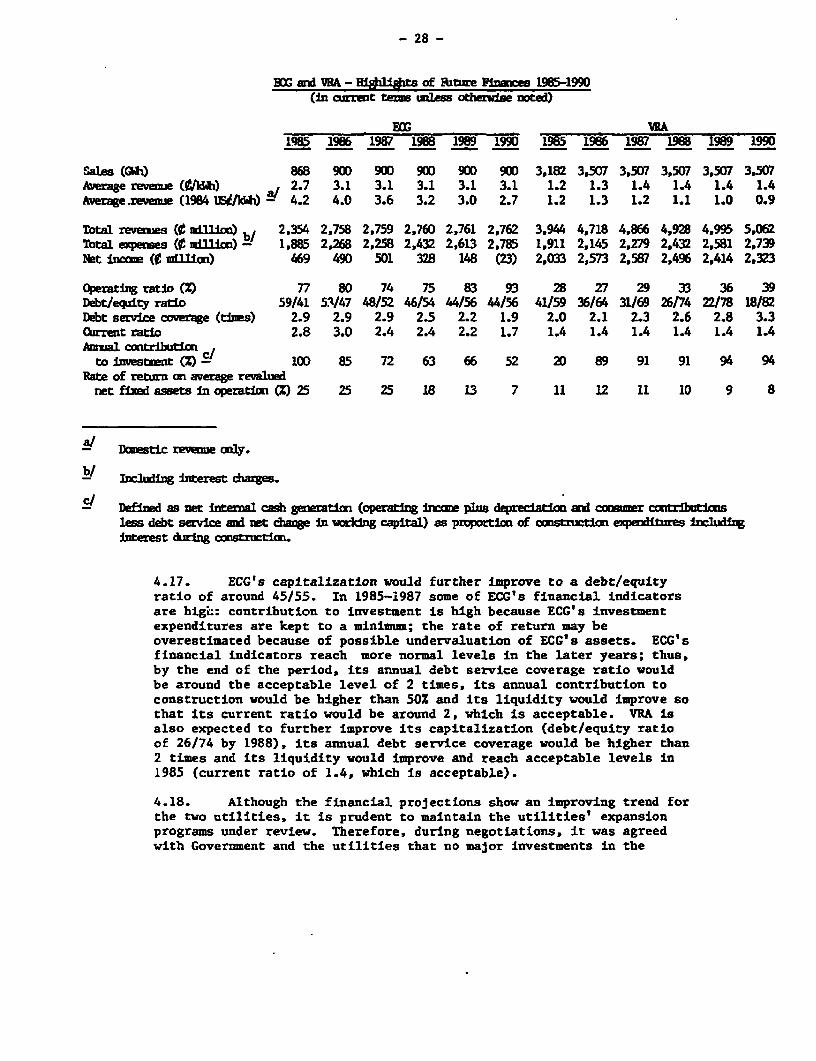
4.16. Under the above assumptions, the finances of ECG and VIA areimproving, as highlighted in the following table:
- 28 -
BOG axd WA - HiliAt:s of Fautre Pines 1985-1990(in CUrrent terni unless otherWIe noted)
BCG_ WA1_qa 1986 1987 1988 1989 1990 1985 1986 1987 1968 1989 1990
Sales (CWh) 868 900 900 900 900 900 3,182 3,507 3.507 3.507 3.507 3.507Average revenue (KWMh) 2.7 3.1 3.1 3.1 3.1 3.1 1.2 1.3 1.4 1.4 1.4 1.4Average.revenue (1984 UEU/kWh) - 4.2 4.0 3.6 3.2 3.0 2.7 1.2 1.3 1.2 1.1 1.0 0.9
Total revenues (i ndULni) b/ 2.354 2.758 2,759 2.760 2,761 2,762 3.944 4,718 4.866 4,928 4.995 5.062Total xipenses (O udUlm) - 1,885 2.268 2,258 2.432 2,613 2,785 1.911 2,145 2,279 2,432 2.581 2.739Net Inn ( mUllion) 469 490 501 328 148 (23) 2,033 2,573 2,587 2,496 2,414 2,323
Operating ratio (Z) 77 80 74 75 83 93 28 27 29 33 36 39Debt/equity ratio 59/41 53/47 48/52 46/54 44/56 44/56 41/59 36/64 31/69 26/74 22W78 18/82Debt service coverage (tims) 2.9 2.9 2.9 2.5 2.2 1.9 2.0 2.1 2.3 2.6 2.8 3.3ChrrTnt ratio 2.8 3.0 2.4 2.4 2.2 1.7 1.4 1.4 1.4 1.4 1.4 1.4Annul contribution c
to investment (Z) 10D 85 72 63 66 52 20 89 91 91 94 94Rate of return on average revalued
net fixBd assets in operatio (Z) 25 25 25 18 13 7 11 12 11 10 9 8
y Dazstic revenue aly.
b T1.04 interest dge.
Deffmd as net internal cash generation (operatng iTcoue plus depreciatmo and cQamr ctntrhtimzsless debt serie and net change in working capital) as proportimo of constctixm epesnditures includinginterest durig coritrutia.
4.17. ECG's capitalization would further improve to a debt/equityratio of around 45/55. In 1985-1987 some of ECG's financial indicatorsare higm:: contribution to investment is high because ECG's investmentexpenditures are kept to a minimum; the rate of return may beoverestimated because of possible undervaluation of ECG's assets. ECG'sfinancial indicators reach more normal levels in the later years; thus,by the end of the period, its annual debt service coverage ratio wouldbe around the acceptable level of 2 times, its annual contribution toconstruction would be higher than 50% and its liquidity would improve sothat its current ratio would be around 2, which is acceptable. VRA isalso expected to further improve its capitalization (debt/equity ratioof 26/74 by 1988), its annual debt service coverage would be higher than2 times and its liquidity would improve and reach acceptable levels in1985 (current ratio of 1.4, which is acceptable).
4.18. Although the financial projections show an improving trend forthe two utilities, it is prudent to maintain the utilities' expansionprograms under review. Therefore, during negotiations, it was agreedwith Government and the utilities that no major investments in the
- 29 -
sector (defined as those totalling US$ 25 million for the sector duringthe project period) would be carried out unless they are technically,economically and financially sound and satisfactory to IDA. Under lowrainfall conditions, VRA's foreign exchange deficit may continue andreach US$ 8-9 million by end-1986. If this shortage materialized, VRAexpects to cover it with short-term loans. During negotiations, ECG andVRA agreed that they would not incur long-term borrowings (andshort-term borrowings could not exceed 10% of cash operating expenses)without IDA's concurrence if forecast net revenues covered their maximumfuture debt service requirement (including the debt proposed to beincurred) less than 1.5 times.
V. PROJECT JUSTIFICATION
A. Background
5.01. Reliable public service electricity supply is vital to Ghana'seconomic recovery because of the increased dependence of mining andsmelting and other export-oriented industries in the public system andthe needs of agriculture and wood processing for reliable and economicelectricity. While the project would not involve system expansion itwould provide reliability in the infrastructure necessary for suchservice.
5.02. The purpose of the project is to restore reliable electricservice by overcoming the most serious operating problems existing inthe coastal grid and various isolated systems owing to inadequatemaintenance since the late 70's. These operating problems encompasssystem overloads with concomitant energy losses and voltage reductions,curtailment of service because of frequent outages of old thermalgenerating equipment (particularly in isolated systems) and frequentbreakdown of transportation equipment, which not only involve highmaintenance costs but also totally disrupts ECG's maintenance andoperation schedules. Since most of Ghana's industry relies onpublic-service electricity supply, the value of reliable supply to thenation's economy is very high. The justification of the project is toprovide the electrical facilities with the elements of reliabilitynecessary to render effective support to economic recovery of thecountry.
B. Least-Cost Solution
5.03. For all of the rehabilitation equipment no reasonablealternative exists. Some substation superstructures will be redesignedto improve their performance and some electrical apparatus will bereplaced with modern and more reliable units.
C. Return on Investment
5.04. The return on investment was estimated as the discount rate
- 30 -
that equates the present values of the benefits and costs associatedwith the 1985-1990 ECG and VRA rehabilitation project. Benefits weremeasured by the forecast revenues from the sales of electricity at theaverage retail level, using the tariff in effect in December 1983(Annex 5). The return for the project is about 30X which comparesfavorably with the opportunity cost of capital for Ghana, estimated tobe between 12X and 15%.
D. Project Risks
5.05. The execution of the project does not have major associatedrisks. The financial health of the sector, however, depends heavily onVRA's ability to supply VALCO and utilities of neighboring countriesand, this in turn, on a replenished Volta Lake. The recent drought hasseverely curtailed VALCO's supplies and under normal rainfall the lakecould recover its normal operating level within the next four years orso, but this event cannot be assured.
VI. AGREEMENTS REACHED AND RECOMNENDATION
6.01. During negotiations the following agreements were reached:
(a) Government agreed to carry out necessary sectororganization measures on a satisfactory schedule andinitiate them by December 31, 1985 (para 1.15);
(b) ECG will update the revaluation of its assets andthereafter will revalue them annually, if the tariffstudy so warrants it, and VRA will continue to revalueits assets annually (para. 4.08);
(c) Government, ECG, and VRA will settle their arrears byDecember 31, 1986, and will thereafter maintain paymentscurrent, and ECG should put into effect measures toimprove its collections (para. 4.09);
(d) procedures for charging all sector generation costs toVRA and which are included in the bulk rates should beagreed upon and ECG and VRA should incorporate fuel andbulk power cost adjustment surcharges (para. 4.11);
(e) ECG and VRA will carry out a tariff study and Governmentagreed that it will, on the basis of such study,implement new electricity rates and a schedule to adjustthem (para. 4.12);
(f) Government will allow ECG and VRA appropriate rateincreases (para. 4.14);
- 31 -
(g) Government wlll not carry out new investments exceedingUS$ 25 million on the aggregate until the completion ofthe proposed project (para. 4.18); and
(h) ECG and VRA will not incur debt without IDA's agreementif their net revenues covered their maximum debtrequirement less than 1.5 times, nor will they incurshort-term debt if it exceeds 10% of cash operatingexpenses (para. 4.18).
6.02. The proposed project is suitable for an IDA Credit of US$ 28million equivalent.
WAPEGAugust 1985
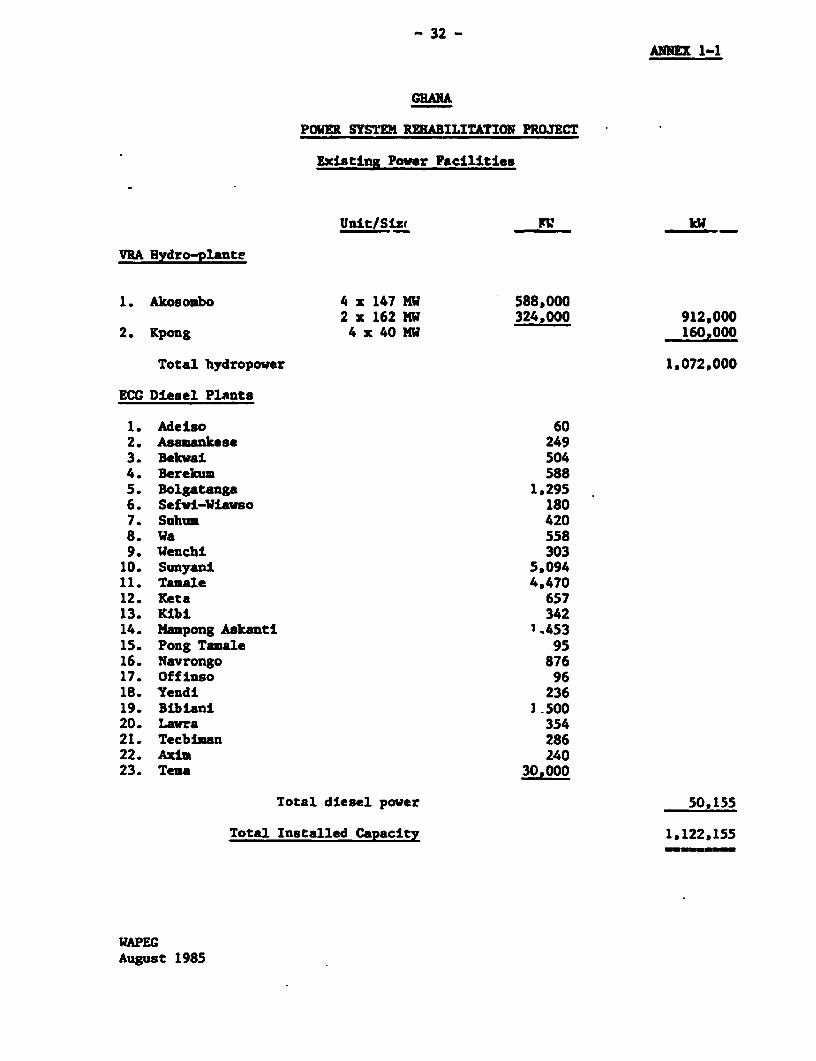
- 32 -ANE 1-1
GHANA
POWER SYSTEM REBABILITATION PROJECT
Existing Pover Facilities
Unit/Siz( ___ kW
VRA Hydro-plante
1. Akosombo 4 x 147 MW 588,0002 x 162 MW 324,000 912,000
2. Kpong 4 x 40 MW 160,000
Total hydropower 1,072,000
ECG Diesel Plants
1. Adelso 602. Asamankese 2493. Bekwai 5044. Berekum 5885. Bolgatanga 1,2956. Sefvi-Wiawso 1807. Suhum 4208. Wa 5589. Wenchi 30310. Sunyani 5,09411. Tamale 4,47012. Keta 65713. Kibi 34214. Maupong Askanti 1,45315. Pong Tamale 9516. Navrongo 87617. Offluso 9618. Tendi 23619. Bibiani 1 50020. Lavra 35421. Tecblman 28622. Axlz 24023. Tema 30.000
Total diesel power 50,155
Total Installed Capacity 1,122,155
WAPEGAugust 1985
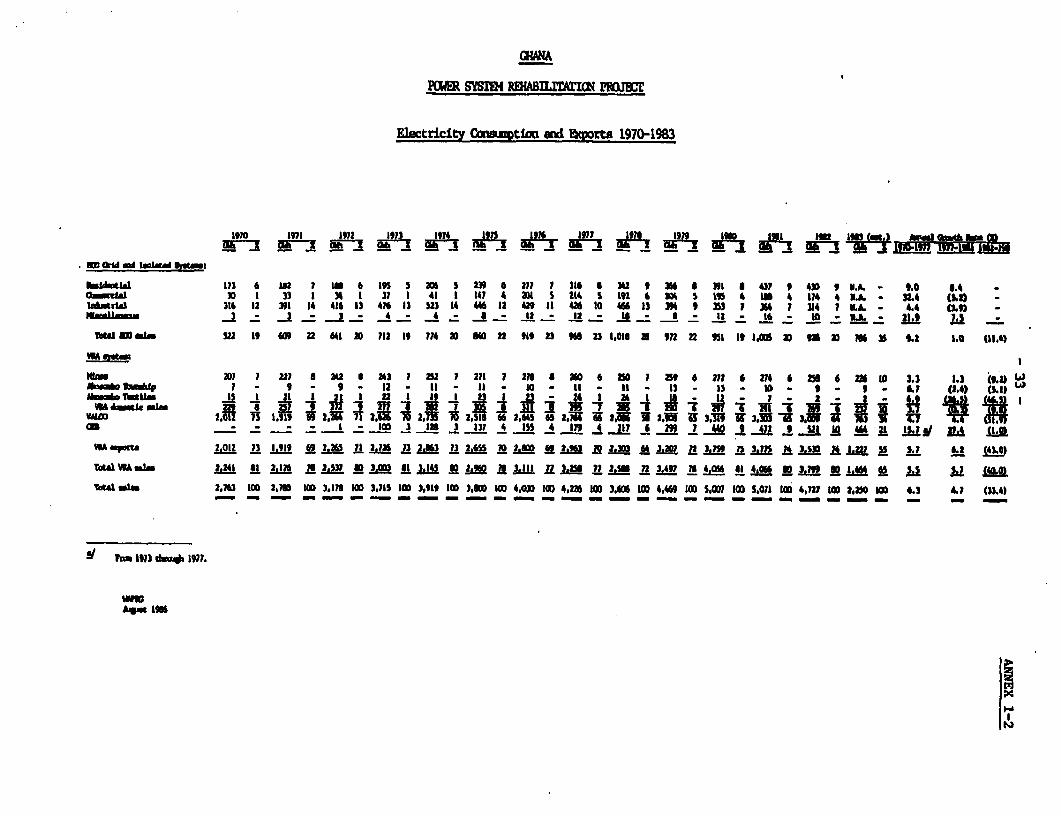
ElactricitY OQSulvtimi WAPorts 1970-1983
£910 aln 1992 .fI 19491 91 97 o ua a m m
mm mua led" ttma
NMIAWAIA 113 6 982 10116 I"55 3% 523962W11 3168 342 9 346 6 Ml 431 943 9 N.A.- 9.0 6 cw!ih1 30 £ 33 9 2491 3)19 491 1474 301521451 92~ 6 SX 195 4 1*4A74 4 .A. - AA. (3.2) 1i*rta 316912 XI914 41113 47193 2 1444691242911 426910 '469391 3 A 9 3 1 X,6 314 7NILL- 4.4 (S.") WMLiiniu 3m 3 3- - u2 _ L s-- I- 12 M A- t0 - UAL 29.9 -
T"U1inaim 522 to9Gap 2264133D7121to71433640 n22 is a394629,o01a912 22 9319It .IM 339 30 106626 9.1 1.0 OhA)
mmzu 201 1 l 22 A2 2S243 1 5 7 271 7 27 66 0 6 390 1594 622 6 214 6 W66 ZS o 3.3 9.3 it.2)aanombaftmd41 - 9 - 9 - 92 - 99 - II - 10 - It - 1 - is - 93 - 0 9 - 9 - L.I (2,4) (L.I)
VALW 2.11 71f I 19 12,N 7T12.11 2,7Z 15 U2.S9 K O 652.m N ' IM a12 13.1W ' 13A U13W UI - -Lao 3 l8 I all 4 1 4 119 4 217 6 M 1 4W 9 429 5210 A IL jj 5.2 flil (9.01
WA ~a" 2.092 73 9.119 62.265 113.716 flM3 73 2.6551260%123 ~~f31913.1 1.3 lW ~ 31 62 (30
TcIalWA iIm 2.241 II Z~j3j if2.131 al NM 913.945 32.= 40713i.911a R 72 n 2.497 164COX64.04j6F ms.9m 1 1.40 0 j j.
TuW uim 2M1U 100 26M3 1M 3.913 10 3.115 I0) 3,919 900 3MW 1 4#030 900 4,22 I0 3,M0 10 4,469 100 5,01 10 501i 10 4,121 10 2.30 9No 6.3 4.1 (33.45
WmWAs m
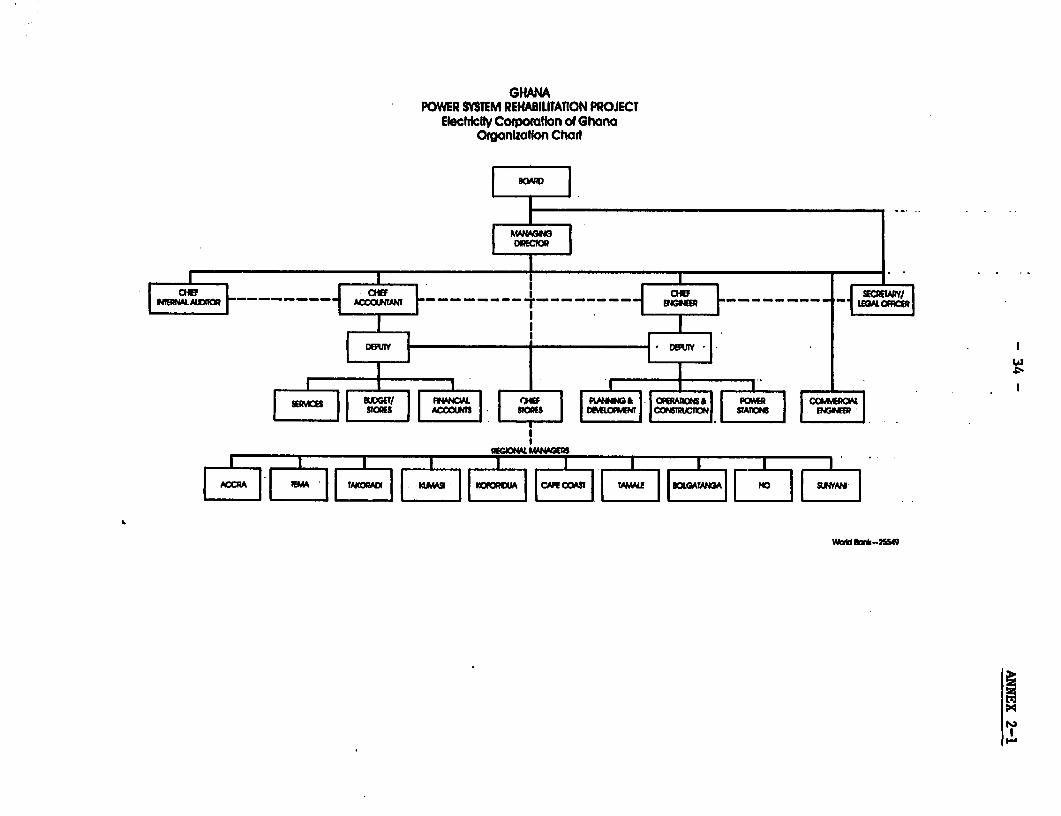
GHANAPOWER SYSTEM REHABILITATION PROJECT
ElectilV Corporotaon of GhanaOgnIzation Chait
ow~~~~~~~~~~~~~~~
Iuw / R Ir014i O11RA
w4mm"~~~~~~~~~~~~~~~~Admm-61
' 1'''
I esl :tha I~~~~~~~~I NC[£glA F -- t-------- T------ -- +_____ ___ h
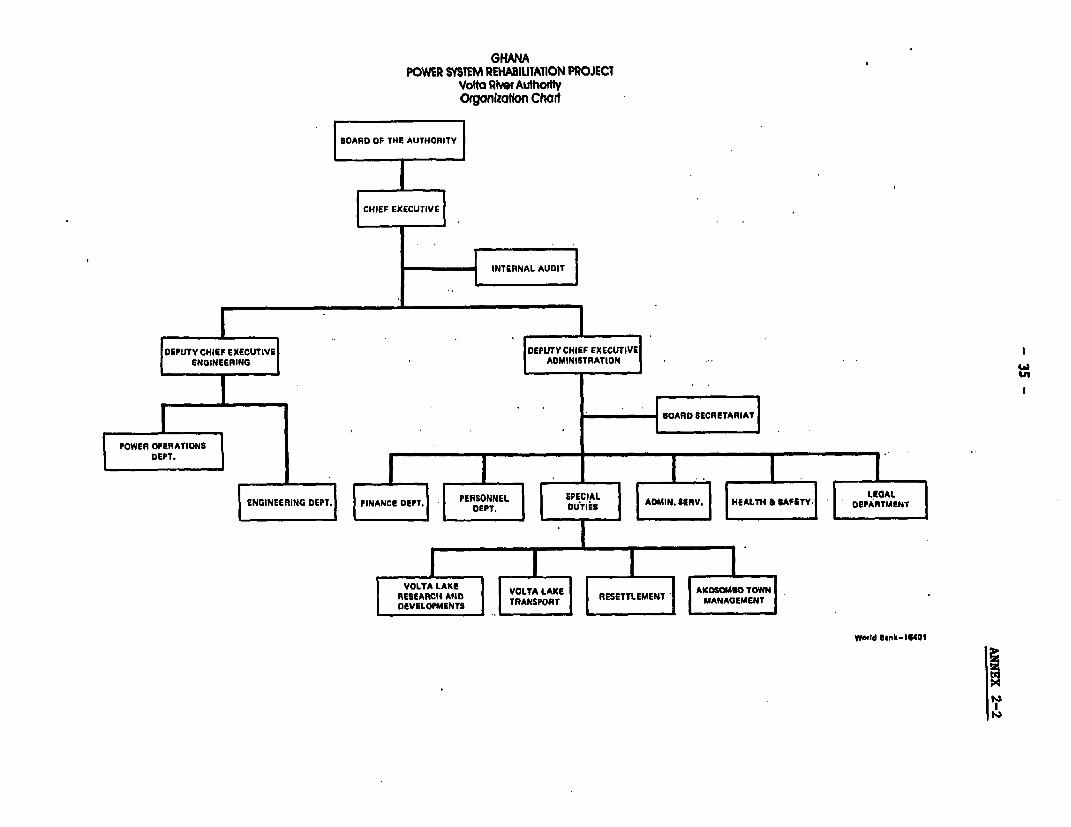
GHANAPOWER SYS1EM REHABIUTAIION PROJECT
Volta Rhe AuthtOrganlzatfo Choad
BOARD OF THE AUTHORITY
CHIEF EXECUTIVE
DEPUTY CHIEF EXECUTIVE DEPUTY CHIEF EXECUTIVEENGINEERING , ADMINISTRATION . U
RESEARCH AN VOLTA LAKE RESETTLOMRN SAAECRETARA
POWER OPERATIONS
l DEPT. | | f f i k i f f i f f iW i
Warld Sank-1l401
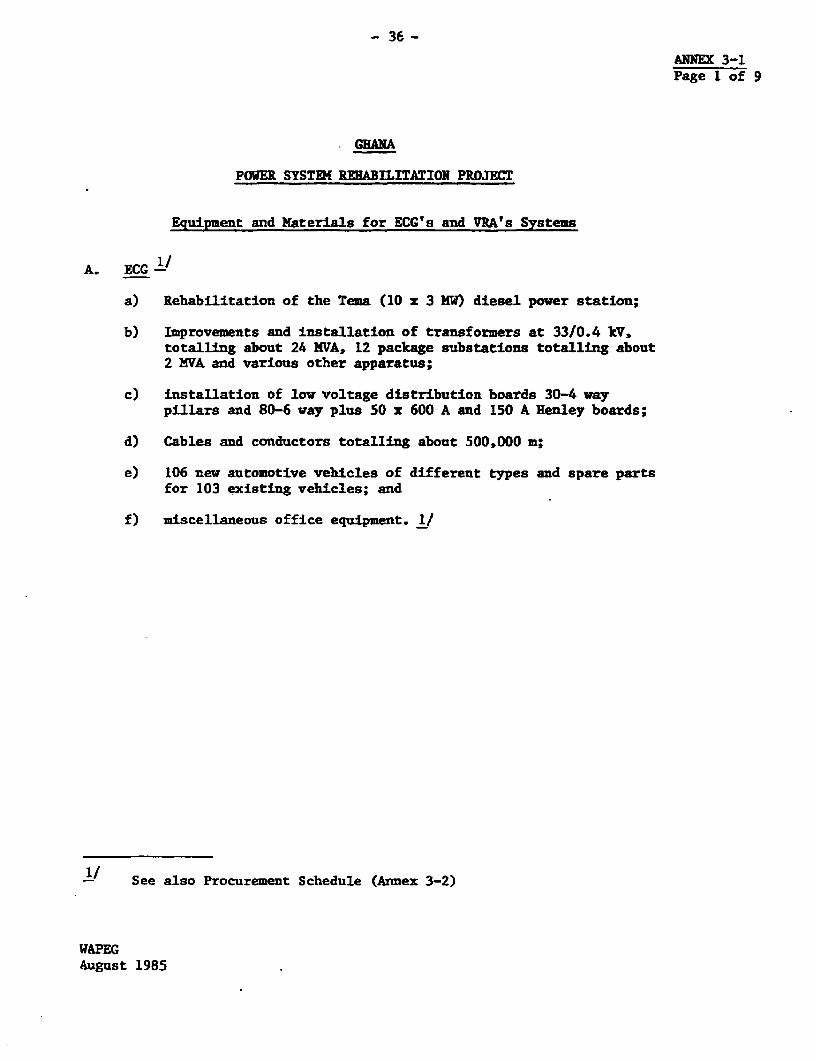
- 36 -
ANNEX 3-1Page 1 of 9
GHANA
POWER SYSTEM REHABILITATION PROJECT
Equipment and Materials for ECG's and VRA's Systems
A. ECG 1/
a) Rehabilitation of the Tema (10 x 3 MW) diesel power station;
b) Improvements and installation of transformers at 33/0.4 kV.totalling about 24 MVA, 12 package substations totalling about2 MVA and various other apparatus;
c) installation of lov voltage distribution boards 30-4 waypillars and 80-6 way plus 50 x 600 A and 150 A Henley boards;
d) Cables and conductors totalling about 500,000 m;
e) 106 new automotive vehicles of different types and spare partsfor 103 existing vehicles; and
f) miscellaneous office equipment. 1/
See also Procurement Schedule (Annex 3-2)
WAPEGAugust 1985
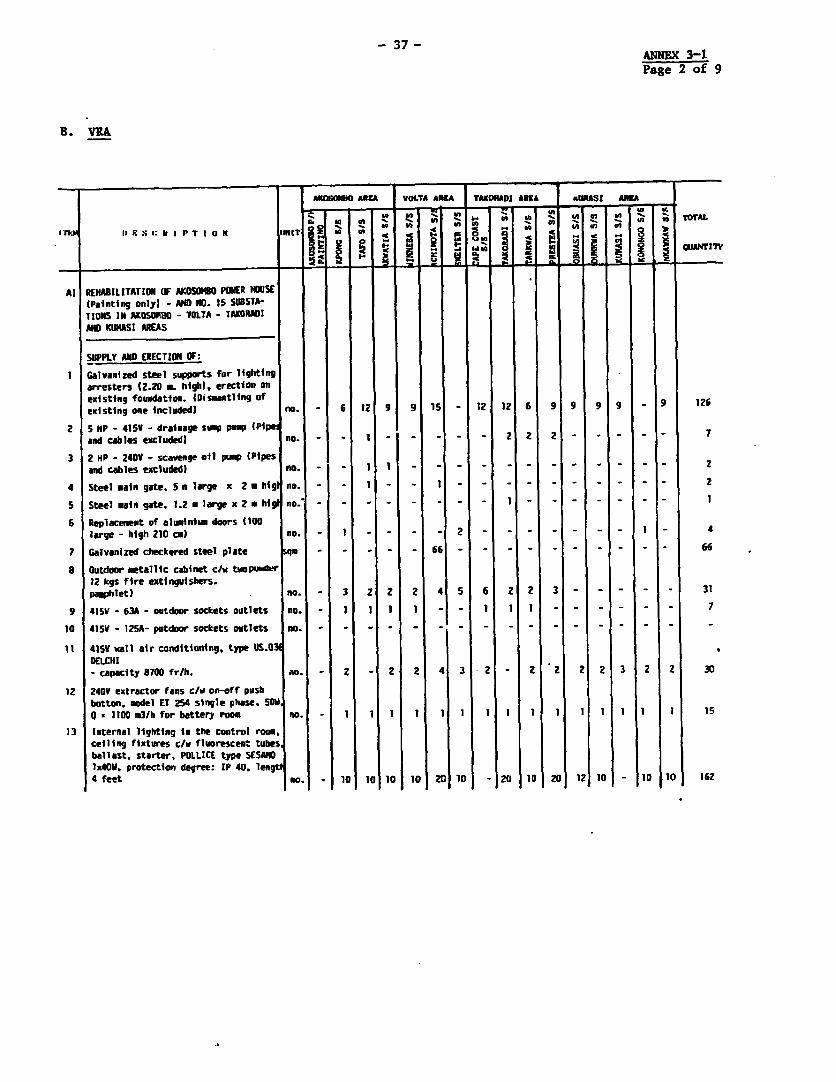
- 37 -ANNEX 3-1Page 2 of 9
B. V_A
AOSoinO AREA VOLTA ARA TAXORADI AREA aURAS! aRA
IP 1nting onlyJ on AND H0. 15SWSU-S a-. aX! tU 5TOTALTIOH III J- a 1 - toIm IaRSa~~:ah,IP TIo0N tINtT3N doI a -e
awe. (al g Q UANTITV
Al REHABILITATION OF AKOSIIC POWER HOUSE(Painting only) - AND NO. I5SU1STAk11IM IN AMOSONO - VOLTA - 7AK0RAOIAND KUNASI AREAS
SUWPLY MID ERECTION OF:
1 Galvanized steel supports for lightingarresters (2.20 a. high). erection onexisting foundation. (Dismntling ofexisting one included) no. - 6 12 9 9 15 - 12 12 6 9 9 9 9 _ 9 126
2 S HP - 415V - drainage sup punP I(P1eand cables excludedl no. - - - -2 2 2
3 2 HP - 240V - scavenge oil pu) (Pipesnd cables excluded) no. 21 1--2
4 Steel main gate. S m large x 2 u hig no. ------ 2S Steel main gate. 1.2 m large x 2 * h1 no.' _ - _-_16 Replacement of aluminium doors (100
large - hh 210 cm) no. - 11- - 47 Galvanized checkered steel plate qm - -- 66 - __668 Outdoor metallic cabinet c/w twopuser
12 kgs fire extinguishers.pag,hlet) no. - 3 2 2 2 4 5 6 2 2 3 31
9 415V - 63A - outdoor sockets oltlets no. I l-710 *15V - 125A- putdoor sockets outlets no. - _ _ _ _ - -- -
11 415V mail air conditioning, type US.031DELCHI- capacity 8700 fr/h. o. - 2 -2 2 4 32 - 2 2 223 2 2 30
12 240V extractor fans c/s on-off pushbotton. model ET 254 single phase. 5OWO * 11003/h for battery roo. no. 1 I 1 1 1 1 I 1 1 1 1 1 1 1 1 15
13 Internal lighting in the control roo.ceiling fixtures c/v fluorescent tubesballast. starter, POLLICE type SESANDx4OW. protection degree: IP 40. lengt
4 feet . 10 10 10 10 20 10 - 20 10 20 12 10 - 10 10 162
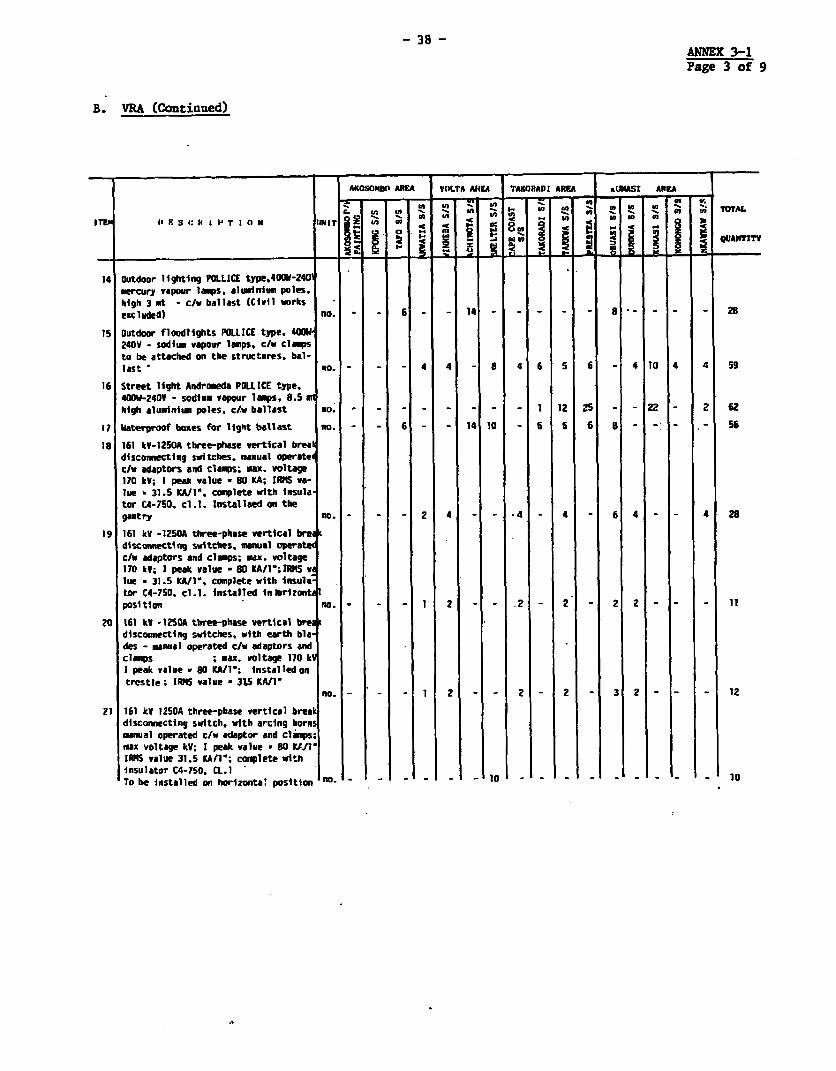
- 38 -ANNEX 3-1Page 3 of 9
B. VRA (Continued)
A_KOSOMNI ARIA VOLTA AREA TAKORADI AREA KUMASI AREA
h1gh 3 vt - -b2JOV - so iu- Mpi TOT. LC. 02 (5 ' -. &- * ~ - U (5 -to ae attached on the su r *bal-- a TOTng
IC, t ' w 8s S 6 SUANTI4M
14 Outdoor lighting PAdo CE typeO4001E-240werCury vapour lamps. al 8u ni5u POles,
high 3 at - c/w ballast (Civil works 25excluded) no.- 6 14 28
15 Outdoor floodlightS POLLICE type. 400W.240V - sodiu, vapour lamps, Clw ClasPSto be attached on the structures, bal-lastcn no. -4 4 -8 46 59
16 street light Andromeda POLICE type.401W-240V - sodium vapour lAIps. 8.5high alle nim poles. c/*w ballast no.1n1 2 - -2l
17 waterproof boxes for lightaballast no. 6 -h- 14 10 - 6 6 6 8 - 56IS 161 kV-1250A three-phase vertical brea
disconnecting switches. manual operatec/h adaptors and claps; max. voltage170 kV; I peak value * 80 KA; IRM vS-lue - 31.5 W11'. complete with insulator C4-750, cl.l. lnstallted on thegantry no. - -2 4 - _4 - 4 6 6 4 4 28
19 161 kY -1250A three-phase verti1cal bredisconnecting switches, manual oFerc/ adaptors and clps; max! volta170 kV; I peak value * 80 KAI'R;lle vlue * 31.5 KA/1'. complete with insultor C41-750. cl.l. installed inmDrizontposition - no. 1 2 _ - 2 - 2 - 2 2--_ - 12
20 161 kv -1250A three-phase vertical breadisconnecting switches. with earth bla-des - manua operated c/w adaptors andclamps ; max. voltage 170 kVI peak value - 80 *11" installed ontrestle IRKS value - 3155 KAl1"
no. - - . 1 2 - - 2 - 2 - 3 2 - - - 12
21 161 kVY 1250A three-phase vertical breakdisconnecting switch, with arcing hornsmanual operated c/w adaptor and clamws;max voltage kV; I peak value - 80 UJJI'IRKS value 31.5 KAW1; comiplete wit-hinsulator C4-750. M.1 -lTo be installed on horizontal position o -n- 10
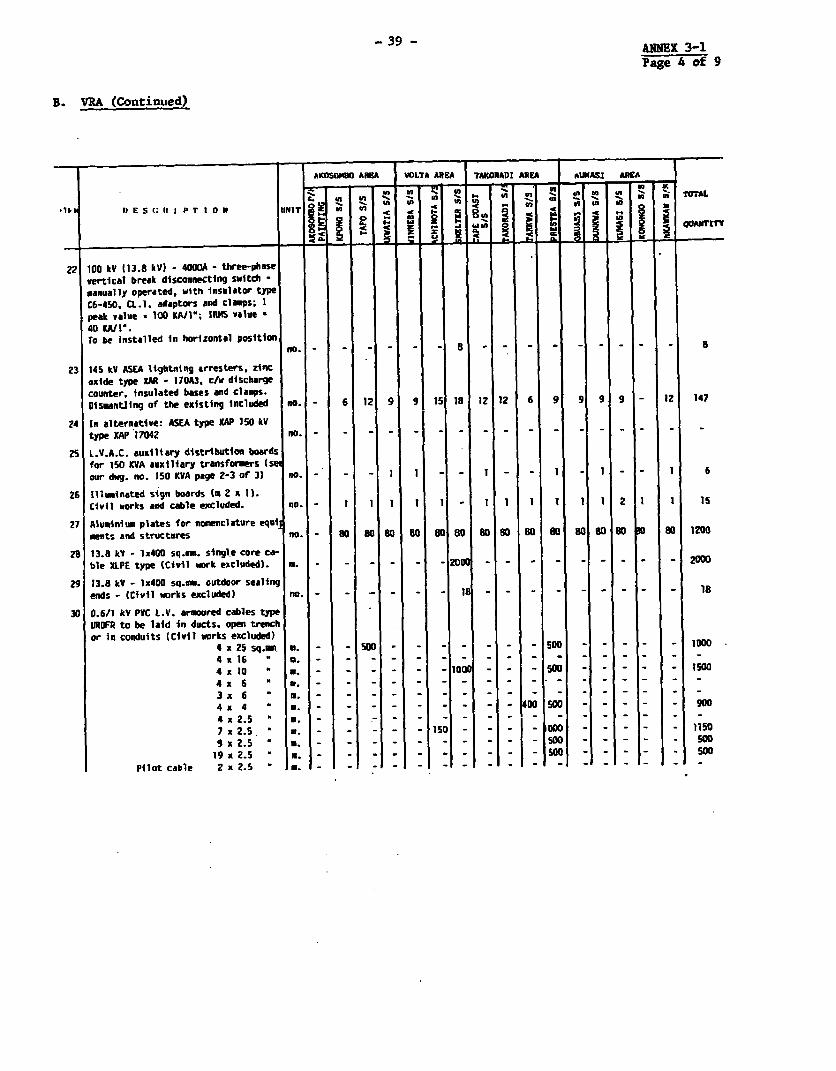
- 3 ANNEX 3-1
Page 4 of 9
B. VRA (Continued)
AKOSO AREA VOLTA AEIA TACORADI AREA WIASI AStA
22~~~~~~~ ~~ ~ 10 V-38x1-400- he-hs
Uxanuall op r go 2 in IAC6-450 CL 1. aptr and I a TOT
II1 ESUIIIPTION0 IINITM U(9' C UC W3 -C U'
CA i p 0 Le 9 in OW~~~~QUNTITY
peak walue aA 100 -AI -vau -
22 100 kV (13.8 k) - 4000A - three-phaSevertical break disconnecti0g Switch -manually operated, with InSulator typeC6-450. CL.I. adaptors and clamps; peak value * 100 KA/l; IRMS value40 KA/1'.To be installed in horizontal position
23 145 kV ASEA ltghtning arresters, zincoxide type EAR - 170A3. clw diSchargecountter, insulated bases and clamps.gismuntling of the existing included no. - 6 12 9 9 15 18 12 12 6 9 g 9 9 9 12 147
24 In alternative: ASEA type XAP 150 kVtype XAP 17042 no… - _ _ _ _ _ _
25 L.V.A.C. auxiliary distribution boardsfor 1SO KVA auxiliary transformers (Sour dwg. no. ISO KVA page 2-3 of3 no. - - - 1 I _ 1 _ 1 _ 1 6
26 Illuminated sign boards Cm 2 x I1Civil works and cable exCluded. no. - I 1 I 1 I _ 1 1 1 1 1 2 1 1 1S
27 Aluinium plates for nomenclature equi.nts and structures no.- 0 80 80 o 80 80 80 80 80 80 80 80s80 010 a 1200
28 13.8 kV - lx400 sq.m. single core ca-ble XLPE type (Civil work excluded). m _ 200 _ - -…- 2000
29 13.8 kV - lx400 sq.=. outdoor sealingends - (Civil works excluded) no. - - s _ _ _ 1 18
30 0.6/1 kV PVC L.V. armoured cables typeUROFR to be laid in ducts. open trenchor in conduits (Civil works excluded)
4x25 sq.m. O. - SO-5o0 - - - - 10004 x16 - U -
4 x10 M. -… _ 500 - - - -_ 15004 x6 M . -
3 x 6 _ _. _
4x4 _. --- SW - - - - 90O4 x2.5 B . - -
7 x 2.5 * _. -I__SO - - - - 11509 x2.5 E. 500 - - - - Soo19 x2.5 S W. _ _ _
Pilot cable 2x25 * _5 _
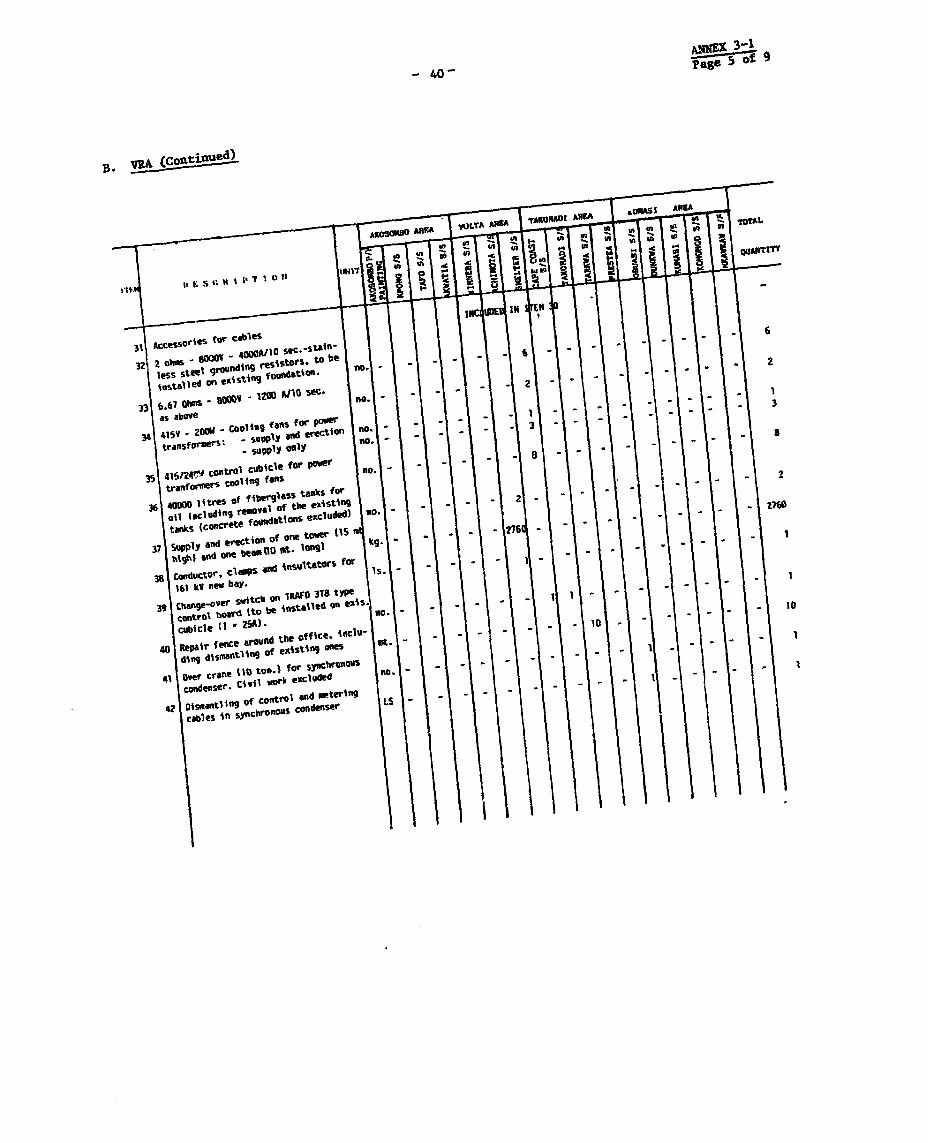
^IIEX 3140-
pae S of 9
~*VIA (Coftinue8)
j owcableS
B.~~~~~~~~~~~o
Ace; O' e'1;s t l S 4 ii
3 6.67 1
-
| r 1 "uRi 4000 10 SeC t o b e
£15~ - ZOM - resisgtan ors poin l s st eel S rOunfs - upl Y an to.C no installe l-- I--'-"t'"l- -\l- 1-- '- 319 15V 20Msu- IU'py on relY i n 0
35 4150?24'V control bCict for power no. |36 40000 w iite o j gl5Ss tanks for36 401 ingU 1Of l off the xisting |- - 26 -tanks (Concrete fO1NIbti00S 7:ldn) no
37 SAapply and ereC ti" Ot o nle t "o n (1 5 -3 I cYe - s -V " been(W lot. l M 276 -38 C0 ld C ' so ~d m min lt ators for
161 kV new bay. 1 TS'!
39 Champ _ C(er 5w ltCh On IRAFOl 3 i8 typControl bearl ttD be inStalldg lS
4 Rear fene around the ftfice. iicIU -din an'1 8 tlitI9 of existing ones Ut-
di d i S w ork n o . - - -l41 OWt crafle (10 excludied
.ling Of Conttol and unteer"9 L S - -
42 Disgafiti jog o Condenser
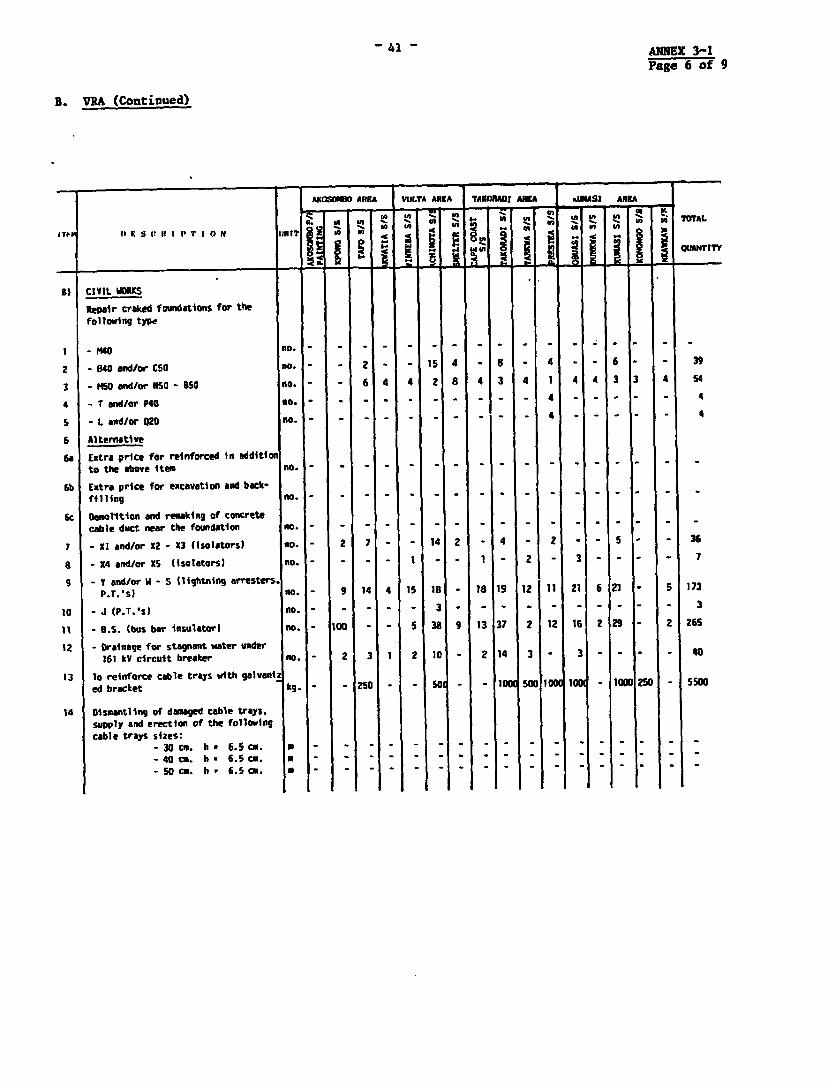
-41 - FANNEX 3-1Page 6 of 9
B. VRA (Continued)
A_COSOWO AREA VoLTA ARA TAORADI AMA IMASI AREA
I - -
B) CIVIL WORKS
Repair craked foundations for thefollowing type
1 - M40 no. _
2 - B40 and/or C50 no. _ _ 2 -- 15 4 - S - 4 - -6 - 39
3 - M50 andlor USO - B50 no. _ _ 6 4 4 2 8 4 3 4 1 4 4 3 3 4 54
4 - T and/or P40 no.- _ . _ ._ _ _ 4 - - - - 4
5 - L and/or Q20 no- - _ - - - -
6 Alternative
6a Extra price for reinforced in additionto the above item no. -- _
6b Extra price for excavation and back-filling no. -- _
6c Demolition and remaking of concretecable duct near the foundation no. -_ _
7 - XI and/or X2 - X3 (isolators) no. - 2 7 _ _ 14 2 _ 4 - 2 - - 5 _ - 36
8 - X4 nd/or S (isolators) no.- - - - - 1 - 2 - 3 - - 7
9 - Y and/or IW - 5 (lightning arresters.P.T.s) no. 9 14 4 15 18 - 18 19 12 11 21 6 21 5 173
10 - J (P.T.'s) no. _ _ _ _ 3 - - - - - - _ - 3
11 - .S. (bus bar insulator) no. - 100 - - 5 3B 9 13 37 2 12 16 2 29 2 2 265
12 - Drainage for stagnant water under161 kV circuit breeker no.- 2 3 1 2 10- 2 14 3 - 3 - - - 40
13 to reinforce cable trays with galvanized bracket kg.- - 250 _ S0- - lO SW IO 1 lO -1000 250 5500
14 Dismantling of damaged cable trays.supply and erection of the followingcable trays sizes:
30 cm. ha 6.5 C. a --40 cm. h 6.5 cm. 0 _ _So cm. h i 6.5 cm. U
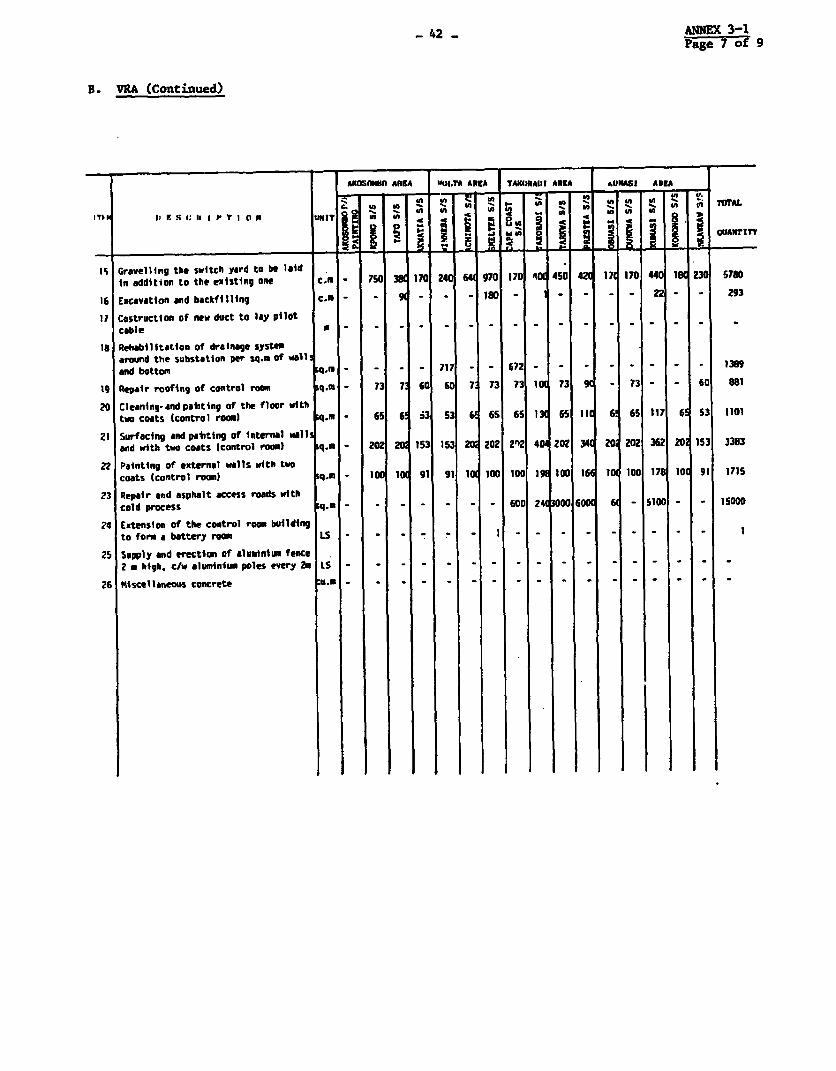
_42 ANNEX 3-1Page 7 o 9
B. VRA (Continued)
AI0OSOWUf ARUA "4I.TA ARCA TIAUIRHAI AREA aUNASI Alg
S. m~ ~ -- -- 3 U OTAIT i 11 V S 1: It I p T I a n mIrSI |A in"|SI0| i|0|i IS Grovelling the switch yard to be laid
in oddition to the existing one C.M - 750 38 170 24t 64 970 170 40 450 4 17 170 440 1 230 5780
16 Excavation and backfilling cOn - - St -- -- _ _ _ _22 _ Z 293
17 Costruction of new duct to lay pilotcable _- _
18 Rehabilitation of drainage systemaround the substation per sq.M of wall and bottom q. - _ _ 717 - - 672- - - - - - 1389
19 Repar roofing of control room q.u - 73 7 60 60 7 73 73 1 73 - 73 - 60 881
20 Cleaning-and paflting of the floor withtwo coats (control rooml q.m C5 6 6 j3 53 6 65 65 I 65 li 6 65 117 6 53 1101
21 Surfacing and pabiting of internal walland with two coats (control room) q.M - 202 20 153 153 20 202 2n |4 202 34 2 202 362 20 153 3383
22 Painting of external walls with twocoats (control room) q.m - 100 1( 91 91 1O 100 100 1 10W I 1 100 178 10 91 1715
23 Repair and asphalt access roads withcold process qq. _ - 600 24 3000 60 6 _ 51 - 15000
24 Extension of the control room buildingto form battery room LS - - 1
25 Supply and erection of alumnunm fence2 n high. c/w aluminium poles every 20 LS -
26 N4iscellaneous concrete -
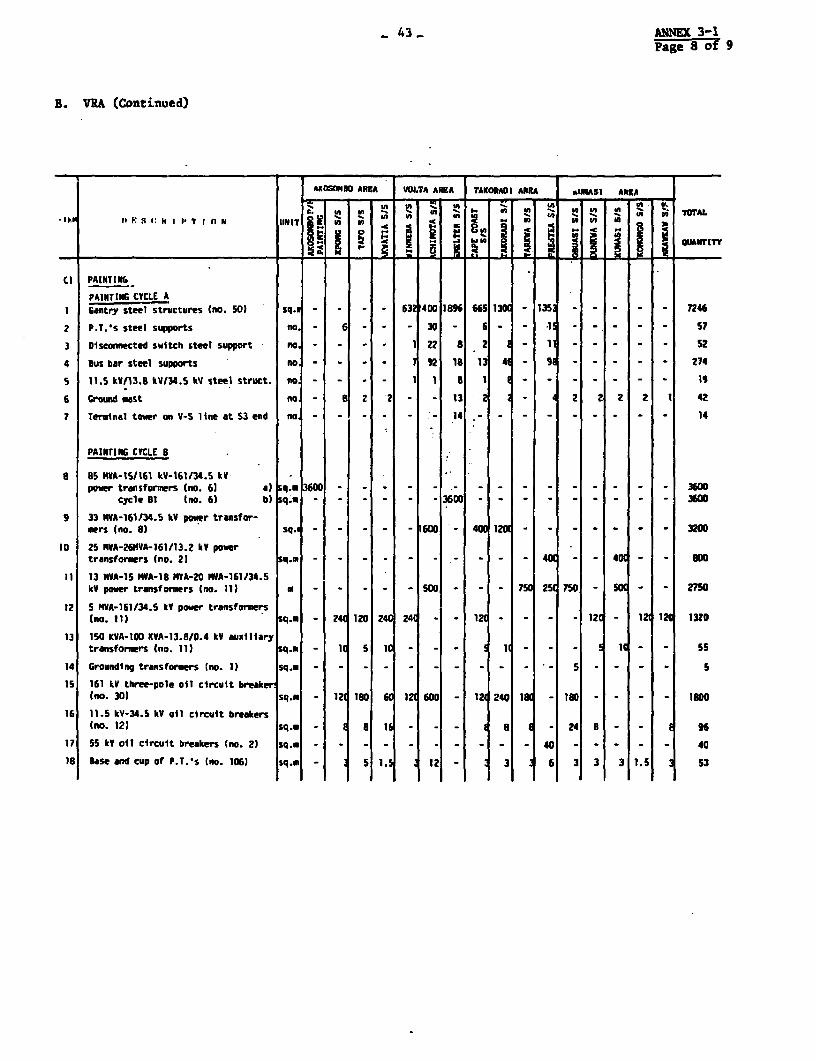
- 43 ANNEX 3-1Page 8 of 9
B. VRA (Continued)
A_ _ _ 30 AREA VOLTA AREA TAKORADI AREA | UMA51 ARA
-z Utt V.Sl to to en IU 0 inU~n i9b . ?A in- ,, % - TOA
CI PAINTING
PAINTING CYCLE AI Gentry steel structures (no. 501 sq. - _ _ 63J 40 1896 665 130 135 7246
2 P.T.'s steel supports no. 6 - - - 30 - 6 - -1 . _ S7
3 D1scomected switch steel support no - - _ . 1 22 8 2 1 _52
4 Bus bar steel supports no _ . 218 13 9- _ _ _ 274
5 11.5 kV/13.8 kV134.5 kV steel struct. no - - . 1 1 I I _ 19
6 Ground aast no 8 2 2 - 13 2 2 2 2 2 1 42
7 Terminal towr on V-S line at S3 end no _ - 14 - 14
PAINTING CYCLE B
8 85 WVA-15/161 kV-161/34.5 kY-power transformers (no. 61 a) q.- 6W 03600
cycle el (no. 6) b) sq.a - - - 36W 3600
9 33 MIA-161/34.5 kV powr transfor-mers (no. 81 sq.- - _ _ 1600 - 4 1201 -3200
10 25 NVA-26M1VA-161/13.2 kV powertransformers (no. 21 sq. - _ _ _ _ _ 4 - - 4W - - MD
11 13 NVA-15 MVA-18 pVA-20 NVA-161134.5kV power transformers (no. 11) 7 _ _ _ _ _ 50 25_ 750 -75D - - 2750
12 5 1VA-161134.5 kV power transfers(no. 111 sq.m - 2U 120 240 24C - - 12 _ _ _ 12 1 1 1320
13 150 KVA-100 KVA-13.8/0.4 kV auxiliarytransformers (no. 11) sq. 1 5 IC _ _ - - _ _ _ 1C - - 55
14 Grounding transformers (no. 1) sq.. - _ _ __… … … …
15 161 kV three-pole oil circuit breaker(no. 301 sq.. - 12 180 60 12 600- 12 240 18 - 180 - Ia 80
16 11.5 kV-34.5 kV oil circuit breakerslno. 12) sq. - I 8 16 E 8 E - 24 8 _ _ 96
17 55 kY oil circuit breakers (no. 2) sq.. _ _ _ _ _ 40 -- 40
18 Base and cup of P.T.'s (no. 106) sq.m - 5 1.5 12 _ 3 1 6 3 3 3 1.5 53
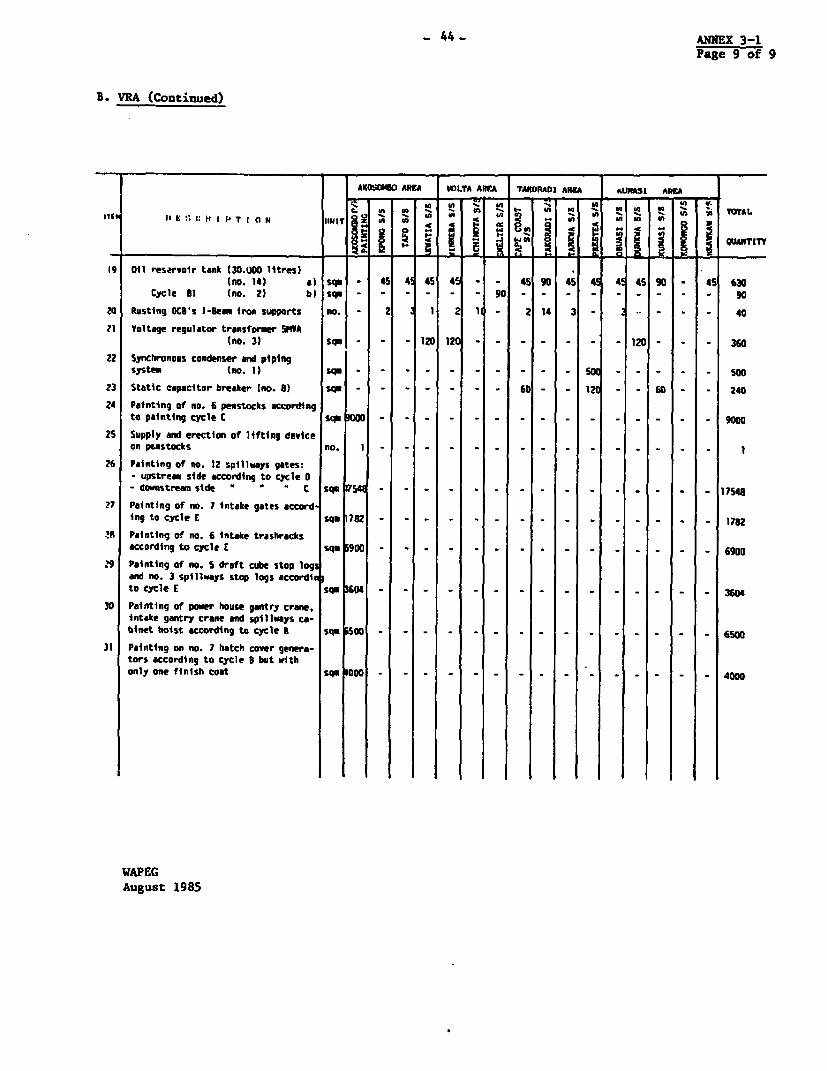
- 44- ANNEX 3-1
Page 9 of 9
B. VRA (Continued)
AKOStWU ARrA VOLTA AREA TAKORADI AREA aUNASI AREA
- - - - -- -, - u OAinin 44 0U
_ 11 E '; t1: It I P T I N U INIT l n-nnYnCsTT
19 Oil reservoir tank 130 W0OO1ltres)(no. 14 a) sqo . U t 45 45 . 4. 90 4a 45 4 45 90 45 630
Cycle Bl (no. 2 _ _ -9 _ _ _ _ _ _ go
ZO Rusting OC8Us I-Bekm iron supports no. 2 1 1 2 14 3 - 40
71 Voltage regulator transformer SIIVA(no. 31 sqn -_ 120 120 - - - 120 360
22 Synchronous condenser and pipingsystem (no. 1) sqn _ _ _ _ 5 _ _ SOO
23 Static capacitor breaker (no. 8) sq. - -50 - 12 - 60 240
24 Painting of no. 6 penstocks accordingto painting cycle C sq. MM - _ _ _ _ 90W
25 Supply and erection of lifting deviceon pe.nstocks no. 1 - _ - -1
26 Painting of no. 12 spillwsays gates:
- upstream side according to cycle 0- downstream side a * C sq. 1754- - _ 17548
27 Painting of no. 7 intake gates accord-ing to cycle E sq. 782 - _ _ _ _ _ _ _ 178
.R Painting of no. 6 intake trashracksaccording to cycle squ 900 -. _ . . 6900
29 Painting of no. 5 drift cube stop logand no. 3 spllwtays stop logs accord1nto cycle E sq. W _ _ _ _ 3604
30 Painting of power house gantry crane.intake gantry crane and spillways ca-binet hoist according to cycle 8 q iSOO - _ _ _ 6500
31 Painting on no. 7 hatch cover genera-tors according to cycle U but withonly one finish cost sq. -000 400w
WAPEGAugust 1985
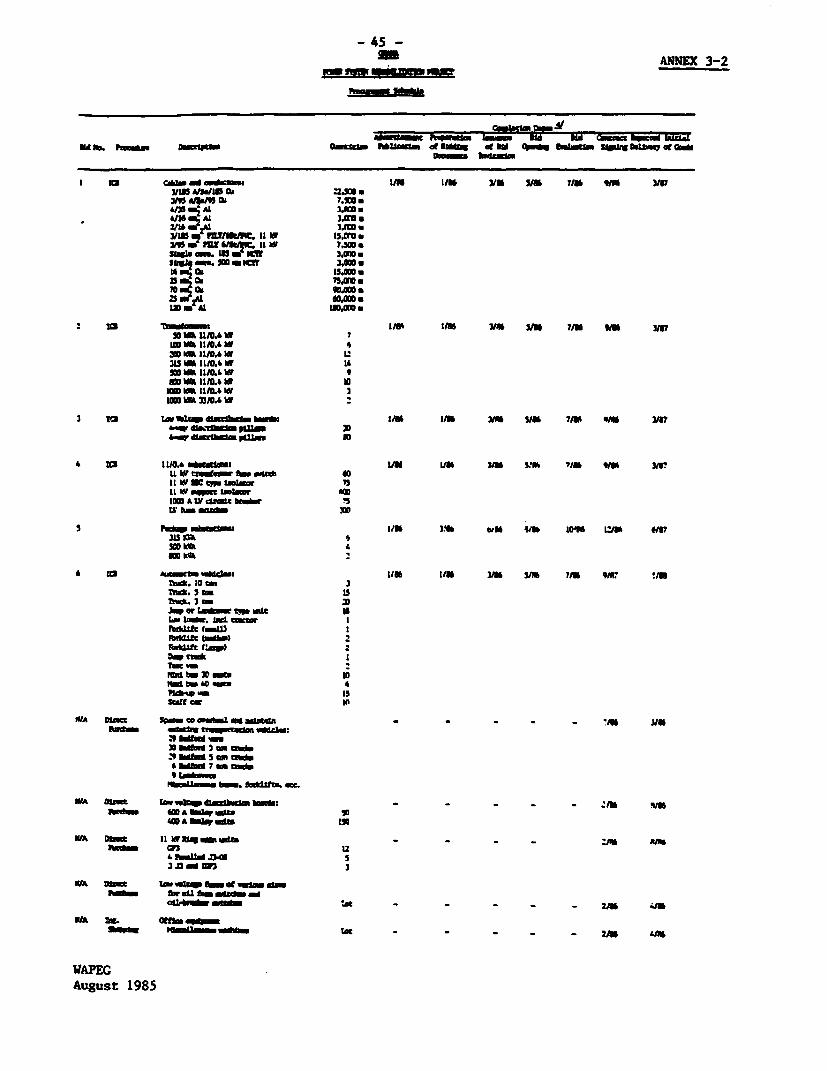
- 45 -gm ANNEX 3-2-- er
I 3 ml ad OWC.u tin I 3/111 us3 7IlS W/3 3131150 ALIaI DA ZZ.W U
* &/~~~~1i564Al 3.020.2/Il n- ~AL .m a3115 my 31T, I~ 1 13.112311 - 151 1136'F* u W 7.30,aSligia c. IU - PM 3.020
amsJ, SW ,. mm - . _
35 OA MM~~~~35 *
. .~~~~mYl0 OA1 "AM a.0
41 _ 4 GDAM a
MM AL aU3D
iusi. 1/. AI/S 3/I Yu 7/U Wm low30 Wa L S.tmto Wu LIMA 1 1 -30 A LIMA W SI
am ' WUa~ Mfm
* haL _L w *3,X
1*- ;al~ 3Ja UO-
M 1' "D IiZ
L lam W14 30
30 Aagl '__m 111 1/I /1 3/ V6 7/1 V117~l
tI p M el"m tlwa 7.l I
uft 1mle^W 4
byLLf kV1uwcInm)A
M a LV cUadc bdwr s10? WA m1110 13
afw IltO.w US M S :
WSM l 7- Yam la e
Tho.~~~~~~~ 5e m1 39
rI Wkf _1 W I
AwkUft m 2 W -b :5
Had b_ ID m oD
N/A Urn Si to2 Embo ad iintulm
hmZU mA
.O bdVA 7 s
aIl. 5 -S :5 - 2IS '
radm so a I lay Ud i
3/A~~~~ ~ ._. Uflm
WAPEG ~ ~ 4 AWAWu"t
Aug.t 19 t8
al -bd madve t: 2A
WA ~ ~ * at Oum44o
August~~~~E 198
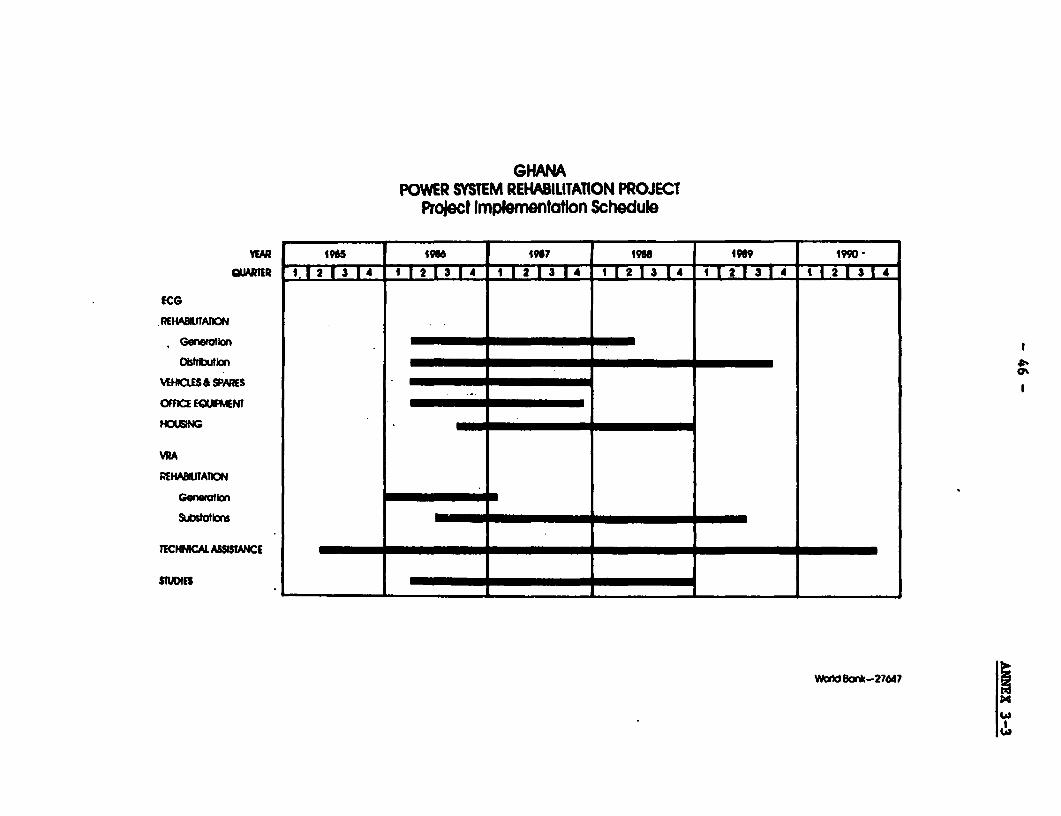
GHANAPOWER SYSTEM REHAILUTATION PROJECT
Project ImplementatIon Schedule
WmD 4905 4966 4196749899 1990l
QMR1R .1 2 3 1 3 41 1 2 3 1 4 1 2 13 14 2 3 14 i 2 13 14
ICG
REHASIITAtION
Genrofkon-
DOstrWlan-
WHICILES & SPRE S
OFFIE EQUIFf,NT
WRA
REHABITJATION
TECHNiCA ASSISANCE
STUDIES-
WouldB rit-276d7
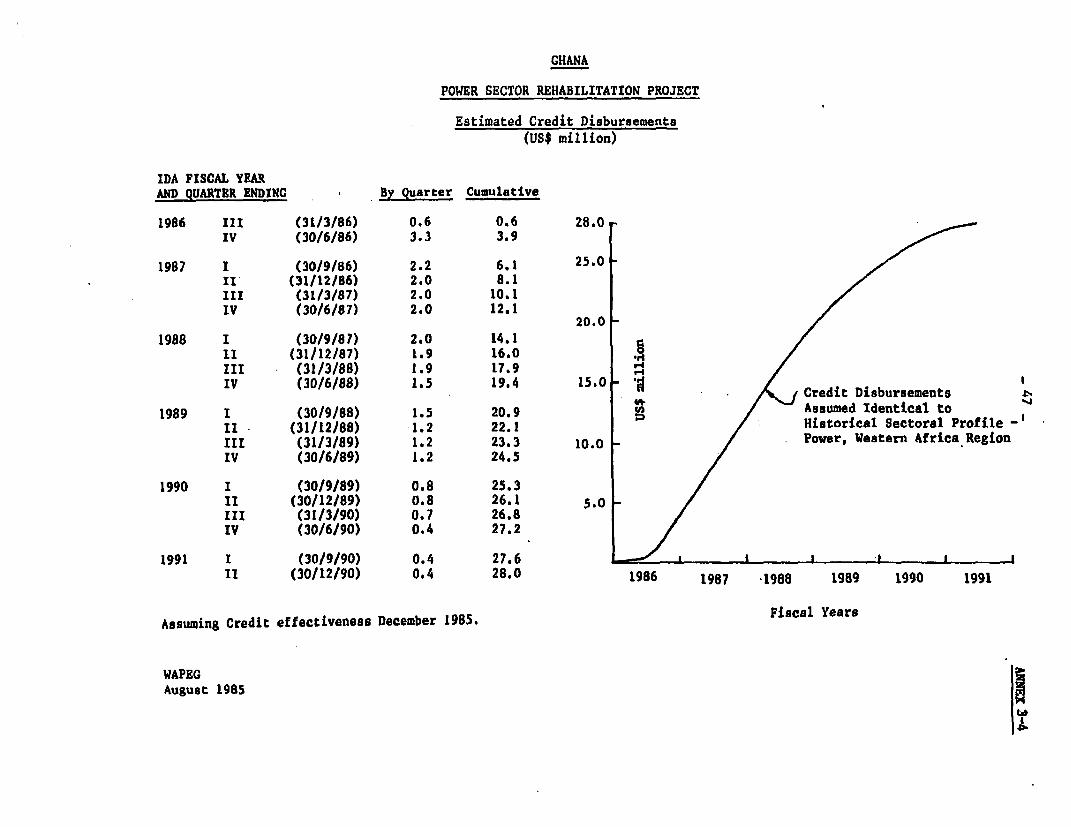
GHANA
POWER SECTOR REHABILITATION PROJECT
Estimated Credit Disbursements
(UIS$ million)
IDA FISCAL YfRAIlAND QUARTER ENDING ByQurer Cumulative
1986 III (31/3/86) 0.6 0.6 28.0 IV (30/6/86) 3.3 3.9
1987 I (30/9/86) 2.2 6,1 25.0-II (31/12/86) 2.0 8.1III (31/3/87) 2.0 10.1IV (30/6/87) 2.0 12.1
20.0-1988 I (30/9/87) 2.0 14.1
'Li (31/12/87) 1.9 16.0III (31/3/88) 1.9 17.9IV (30/6/88) 1.5 19.4 15.0 - rdtDsbreet
1989 1 ~(30/9188) 1.5 20.9 Assumed Identical toii (31/12/88) .1.2 22.1 Historical Sectoral Profile -'III (3113/89) 1.2 23.3 10.0 Power, Western Africa RegionIV (30/6/89) 1.2 24.5
1990 I (30/9/89) 0.8 25.3II (30/12/89) 0.8 26.1 5.0 III (31/3/90) 0.7 26.8IV (30/6/90) 0.4 27.2
1991 I (30/9/90) 0.4 27.6I11 (30/12/90) 0. 28.0 1986 1987 -1988 1989 1990 1991
Assuming Credit effectiveness December 1985. Fiscal Years
WAPEGAugust 1985
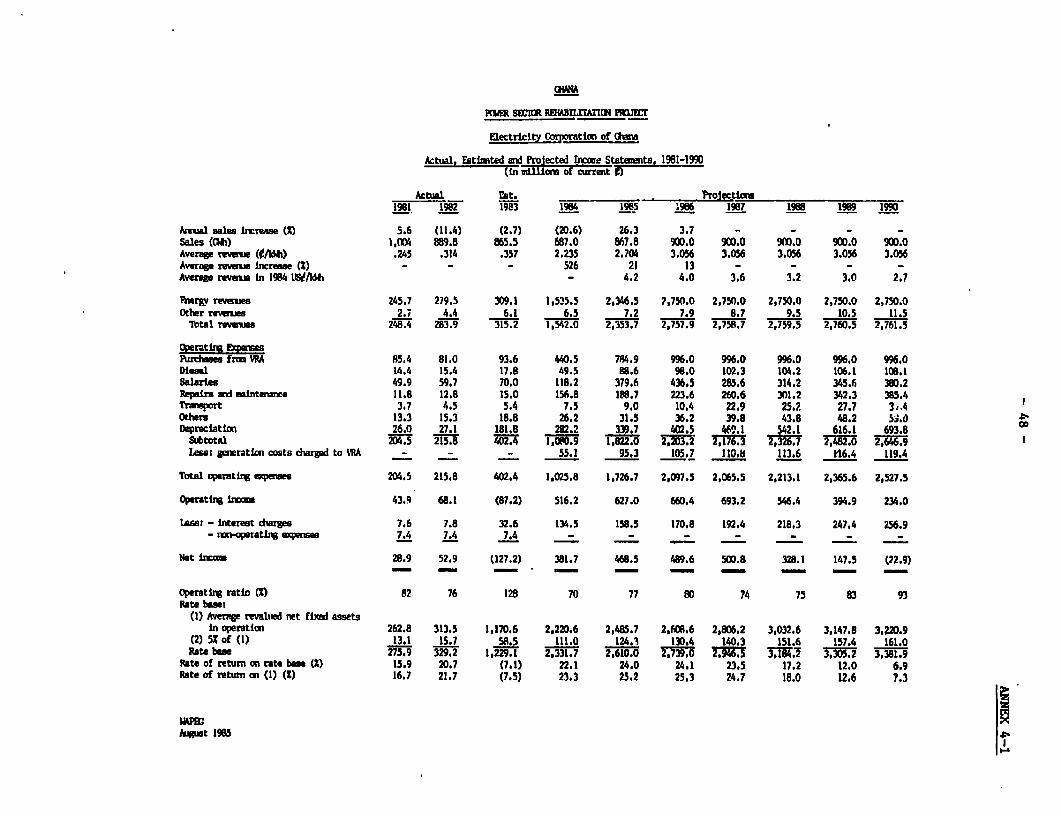
GWIA
WOMF SWIRi REHIABymmAna Pn=E
Eectricity t i of aCmi
Aktual, Estimted ard ProJected iaa Stat-rta, 1981-1990(in dlliU of citrent O
Atual rat. ProAectix__1981 1982 1983 1984 1985 1986 1987 19K s 1989 1990
Amal males 1rcue (X) 5.6 (11.4) (2,7) (20.6) 26.3 3.7 - - - -Sales (Mii) 1I0m 889.8 865.5 687.0 867.8 900.0 900.0 90M.0 900.0 900.0Averep remw (elli) .245 .314 .357 2.235 2.704 3.056 3.056 3.056 3.056 3.056Average reveme Increase (X) - - - 526 21 13 - - - -Average revme In 1984 LW/ASh - 4.2 4.0 3.6 3.2 3.0 2.7
Fmr&v reves 245.7 279.5 309.1 1,525.5 2,346.5 2,750.0 2,750.0 2,750.0 2,750.0 2,750.0Other reva, 2.7 4.4 6.1 6.5 7.2 7.9 8.7 9.5 10.5 11.5
Total reues 248.4 283.9 315,2 1,542.0 2,353.7 2,757.9 2,758.7 2,759.5 2,760.5 2,761.5
Pudin:ht frit WVA 85.4 81.0 93.6 440.5 784.9 996.0 996.0 996.0 996.0 996.0Diesel 14.4 15.4 17.8 49.5 98.6 98.0 102.3 104.2 106.1 108.1Salaries 49.9 59.7 70.0 118.2 379.6 436.5 285.6 314.2 345.6 380.2Repars an intenance 11.8 12.8 15.0 156.8 188.7 223.6 260.6 301.2 342.3 385.4Trawport 3.7 4.5 5.4 7.5 9.0 10.4 22.9 25.2 27.7 3:.4Othes 13.3 15.3 18.8 26.2 31.5 36.2 39.8 43.8 48.2 5,.0ODeprec1atinz 26.0 27.1 181.8 282.2 339.7 402.5 46n. 542.1 616.1 693.8
Subtotal 204.5 215.8 402.4 T 09 1,822.0 2,203.2 2,176.3 2,326.7 2,482.0 2,646.9Less: geraticn costs dwarged to VR4A _ _ 55.1 95.3 105.7 110.8 113.6 16.4 119.4
Total operathing uqws 204.5 215.8 402.4 1,025.8 1,726.7 2,097.5 2,065.5 2,213.1 2,365.6 2,527.5
Operating ib 43.9 68.1 (87.2) 516.2 627.0 660.4 693.2 546.4 394.9 234.0
Ltss: - interest dure 7.6 7.8 32.6 134.5 158.5 170.8 192.4 218.3 247.4 256.9- zai-operating 4exees 7.4 7.4 7.4 - _ _ _
Net iZE 28.9 52.9 (127.2) 381.7 468.5 489.6 500.8 328.1 147.5 (22.9)
Operating ratio t) 82 76 128 70 77 80 74 75 83 93Rate bese
(I) Average revalwud net fixed assetsin operation 262.8 313.5 1,170.6 2,220.6 2,485.7 2,608.6 2,806.2 3,032.6 3,147.8 3,220.9
(2) 5Z of (1) 13.1 15.7 5R.5 111.0 124.7 130.4 140.3 151.6 157.4 161.0Rate base 25.9 329.2 1,229.1 2,331.7 2,610.0 2,739.0 2,9465 3,164.2 T381.9
Rate of return on rate bose () 15.9 20.7 (7.1) 22.1 24.0 24.1 23.5 17.2 12.0 6.9Rate of return an (1) (Z) 16.7 21.7 (7.5) 23.3 25.2 25.3 24.7 18.0 12.6 7.3
gemt 1985
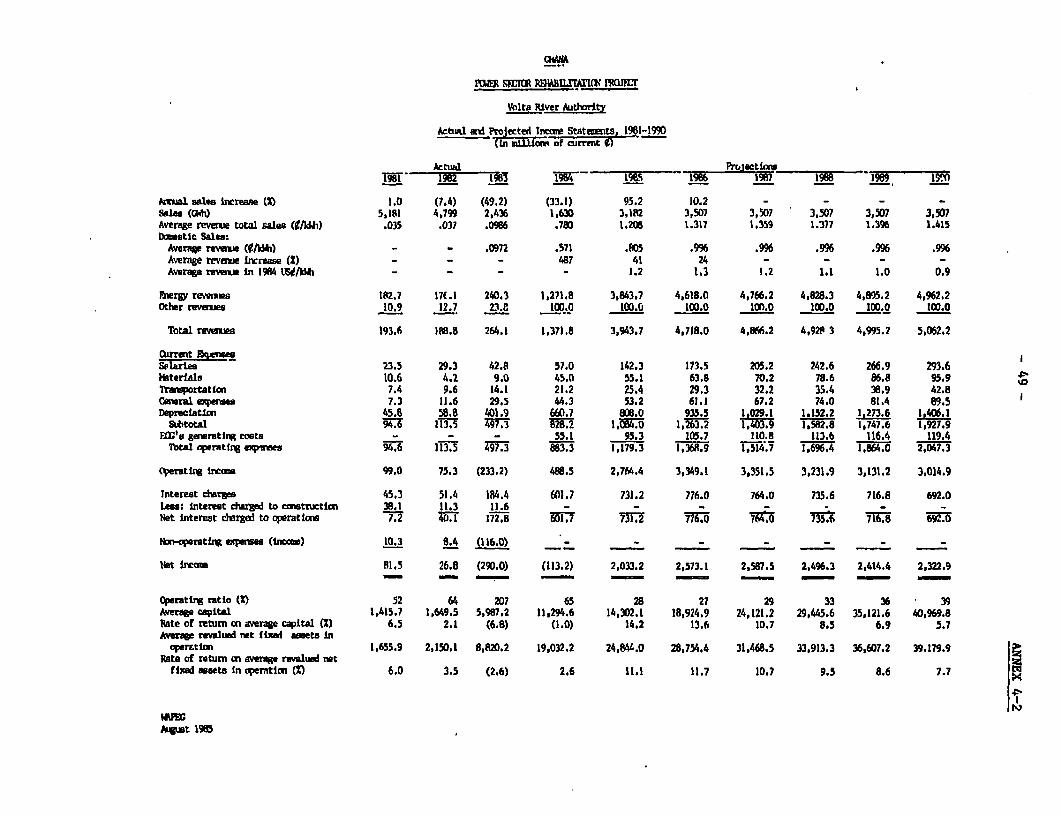
QVM
Volta River Authority
Mtual and Prtecte11ncmeStatwmitss2i-1990
1982 1 198l2 N 1986% \ 97 198__ 19B9 I
hguiuisale irtease (1) 1.0 (7.4) (49.2) (33.1) 05.2 10.2 -- - -
Sales (Qih) 5,181 4,799 2,436 1,630 3,182 3,507 3,507 3,507 3,507 3,507Average reve,e total saleas (0/kWM) .035 .037 .09B6 .780 1.208 1.317 1.359 1.377 1.396 1.415Dwastic Sales:
Averae reveu (0/IdI) - - .0972 .571 .fS .996 .996 .996 .996 .996Averge revenue increase (2) - - - 487 41 24 - - - -
Average rew.u in 1984 UEIAdIh - - - - 1.2 1.3 1.2 1,1 1.0 0.9
l5ur rewemus 182.7 17(.1 240.3 1,271.8 3,843.7 4,618.0 4,766.2 4,828.3 4,895.2 4,962.2Other revmes 10.9 12.7 23.8 100.0 100.0 100.0 10.0 100.0 100.0 100.0
Total revemes 193.6 388.8 264.1 1,371.8 3,943.7 4,718.0 4,866.2 4,923 3 4,995.2 5,062.2
Seiaxies 23.5 29.3 42.8 57.0 142.3 173.5 205.2 242.6 266.9 293.6Haterfals 10.6 4.2 9.0 45.0 55.1 63.8 70.2 78.6 86.8 95.9Twnsportation 7.4 9.6 14.1 21.2 25.4 29.3 32.2 35.4 38.9 42.8cGueruluqd o 7.3 11.6 29.5 44.3 53.2 61.1 67.2 74.0 81.4 89.5Depreciatiw 45.8 58.8 401.9 660.7 808.0 935.5 1 029.1 1,152.2 1,273.6 1,406.1adbeotal 94.6 113.5 497.3 828.2 . 1,263.2 1,1. 1,582.8 1,747.6 1,927.9
FM's genemtinR costs - - - 55.1 95.3 105.7 110.8 113.6 116.4 119.4Total operating expsi s 6 113.5 497..3 833 1,179.3 1,36. 9 1,514.7 1,696.4 1,864.0 2,047.3
('perattxW 1rca 99.0 75.3 (233.2) 488.5 2,764.4 3,349.1 3,351.5 3,231.9 3,131.2 3,014.9
Tntereat chrges 45.3 51.4 184.4 601.7 731.2 776.0 764.0 735.6 716.8 692.0least interest dargad to cmsttuction 38.1 11.3 11.6 - - - - - - -Net interest dcergd to operatlons 7.2 40.1 172.8 601.7 731.2 776.0 m0 735.6 716.B MO
Nn-oprateti eapes" (Iza) 10.3 8.4 (116.0) -_ - -
Nst krcate 81.5 26.8 (290.0) (113.2) 2,033.2 2,573.1 2,587.5 2,496.3 2,414.4 2,322.9
0peratir ratio (2) 52 64 207 65 28 27 29 33 36 39Average capital 1,415.7 1,649.5 5,987.2 11,294.6 14,302.1 18,924.9 24,121.2 29,445.6 35,121.6 40,969.8Rate of retun on average capital (M) 6.5 2.1 (6.8) (1.0) 14.2 13.6 10.7 8.5 6.9 5.7Avereg realueo net fixal amets In
apem.timo 1,655.9 2,150.1 8,820.2 19,032.2 24,844.0 28,754.4 31,468.5 33,913.3 36,607.2 39.179.9Rate of retuman avermge revalued netfil asaeta In operation (Z) 6.0 3.5 (2.6) 2.6 11.1 11.7 10.7 9.5 8.6 7.7
Iast 19805
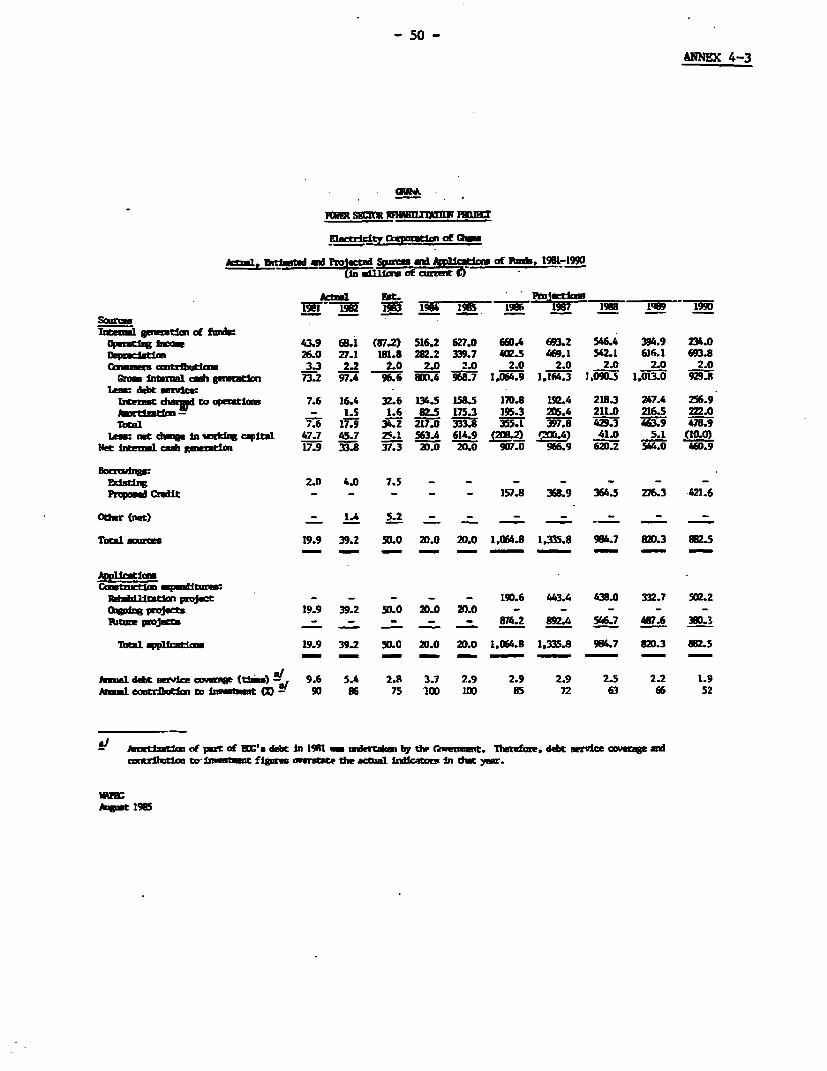
- 50 -
ANNEX 4-3
qmmrdlxs1dvm of am
A , aE Iaid Pro9 . a of ubu, 1961-1990
_ 19#15 s 1988 lqlB ~~~~~~~~~~~1990Iztenul garrton of funs
0p.aren boom 43.9 6A I (87.2) 516.2 627.0 650.4 693.2 546.4 394.9 234.01meAut1m~ 26.0 27.1 1I6.8 212.2 339.7 402.5 469.1 542.1 616.1 693.8
Cminumrs cmttdhild 3.3 2.2 2.0 2.0 2.0 2.0 2.0 2.0 2.0 2.0Grow mlntaxl di pratlm 73.2 97.4 96.6 800.4 968.7 1,064.9 1.1f4.3 1,090.5 1,013.0 929.5
Us: debt d -e-II1 dia 1d to apeztiaw 7.6 16.4 32.6 134.5 158.5 170.8 1924 218.3 247.4 256.9)ItNtatim - - 1.5 1.6 82.5 175.3 195.3 205.4 211.0 216.5 mD.11al 7.6 17.9 34.2 217.0 333.8 355.1 397.6 429.3 W69 478.9
Les: Met dI. In mzdzv capital 47.7 45.7 25.1. 563.4 614.9 (2082) r0.4 41.0 5.1 (10.0)Net Iter.ul acu gunrum 17.9 33.8 37.3 D7.0 20.0 907.0 966.9 6Z0.2 544.0 460.9
Zdm:UV 2.0 4.0 7.5 - - - - - - -Pid Ciit - - - - - 157.8 368.9 364.5 276.3 421.6
Odur (,Mt) - 1.4 5.2 _- - -
Totl sms 19.9 39.2 50.0 20.0 20.0 1,064.8 1,335.8 964.7 820.3 I 2.5
R niJtdm Project - - - 190.6 443.4 93.0 332.7 502.gRMA pROJect. 19.9 39.2 50.0 2D.0 20.0 - - - - -
Tuu projects - _ - - 874.2 892.4 546.7 457.6 300.3
Total qiplatiam 19.9 39.2 50.0 20.0 20.0 1,064.8 1,335.8 964.7 82D.3 862.5-- - -- - - - - -
Ammldebt ervkecwaae (t2s) IR/ 9.6 5.4 2.8 3.7 2.9 2.9 2.9 2.5 2.2 1.9Aul uucontrluti -to I ( 90 96 75 100 100 85 72 63 66 52
Amvrdz.tai of pet of M's debt In 1911 - wdertaim W thp rweumit. flrfore debt service cw.e u adcmrxbtlm to _nvinbt figurl overstute the ac_al Iinicatore in dut yaw.
hAut 1965
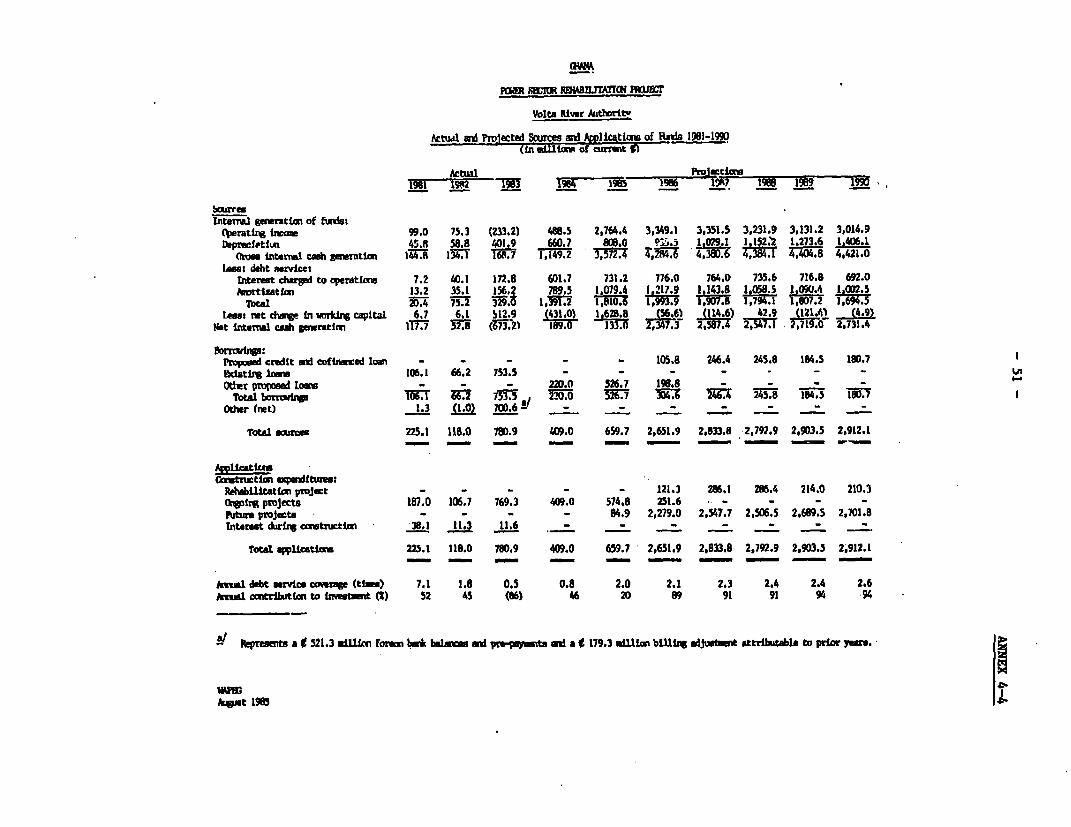
FR NE1 PEIWD.XLTAYG izc
Volta Rivr Auth3ritu
Actki md oected Smrces aFd Awklit1ons of RnIs 1981-1990(in Utc of am-t I)
Internal garsttiut of fiuFhtOperatizS iamm 99.0 75.3 (233.2) 488.5 2,764.4 3,349.1 3,351.5 3,231.9 3,131.2 3,014.9Deprecltiut 45.R 58.8 401.9 660.7 808.0 3.5I. 1,079.1 1152.12 1 273.6 1,406.1
Otw interil cvh gmratim iR l;T 1R7 1,149.2 3,572.4 ,;Z 4,38D.6 4,384.1 4,421.0leaw: debt aervice:
Inter_t dcward to operaticu 7.2 40.1 172.8 601.7 731.2 776.0 764.0 735.6 716.8 692.0IOLrtizatlm 13.2 35.1 156.2 789.5 1,079.4 1 217 9 1 143.8 I 068.5 1,090.4 1,O02.5
Theal =I 75.2 329. i.~t 1, 81. 96. 1 907.8 1 7.1 1,807.2 1,694.5lesst uet du%V in werkrg capital 6.7 6.1 S12.9 (431.0) 1 628.8 (6) (114.6) 42.9 (121.4) (4.9)
Not internal cash paraticm l1i7.7 2.8 (673.2) 189.0 13.i 2,347.3 287.4 2,547.1 ,7.0 2,731.4
Proposd credit ad cofinrced loan - - - 105.8 246.4 245.8 184.5 180.7 12datltz loom 106.1 66.2 753.5 - - - - - - - VI
Othte ptnsed lom - - - 220.0 526.7 198.8 - - - -Total bhorlnp 1. 773 1 5.7 530.6 246.4 184.5 10
Other (ret) 1.3 (1.0) 7ao.6!* __ _ - _
Total o 225.1 118.0 780.9 409.0 659.7 2,651.9 2,833.8 2,792.9 2,903.5 2,912.1
cpptr itcbmtmt- - -- - n - w-
Rehalitatim project - - - - - 121.3 26.1 286.4 214.0 210.3Qo3hs pojmets 187.0 106.7 769.3 409.0 574.8 251.6Putur* project - - - - 4.9 2,279.0 2,547.7 2,506.5 2,689.5 2,701.8interest dtrwil autnrstlm 38.1 11.3 11.6 -
Total appicattm 225.1 118.0 780.9 409.0 659.7 2,651.9 2,833.8 2,792.9 2,903.5 2,912.1
Ania dsbt asrwice "rqe (t1) 7.1 1.9 0.5 0.8 2.0 2.1 2.3 2.4 2.4 2.6Amal ccmtributti to Im t () 52 45 (86) 46 20 89 91 91 94 94
i kpresenta a t 521.3 ilUlm foremn bl* bzalmre ad pV-peymts ad a* 179.3 niUlmi btUih adjus t attrdbAbln to prior yes.
heat 1986 a
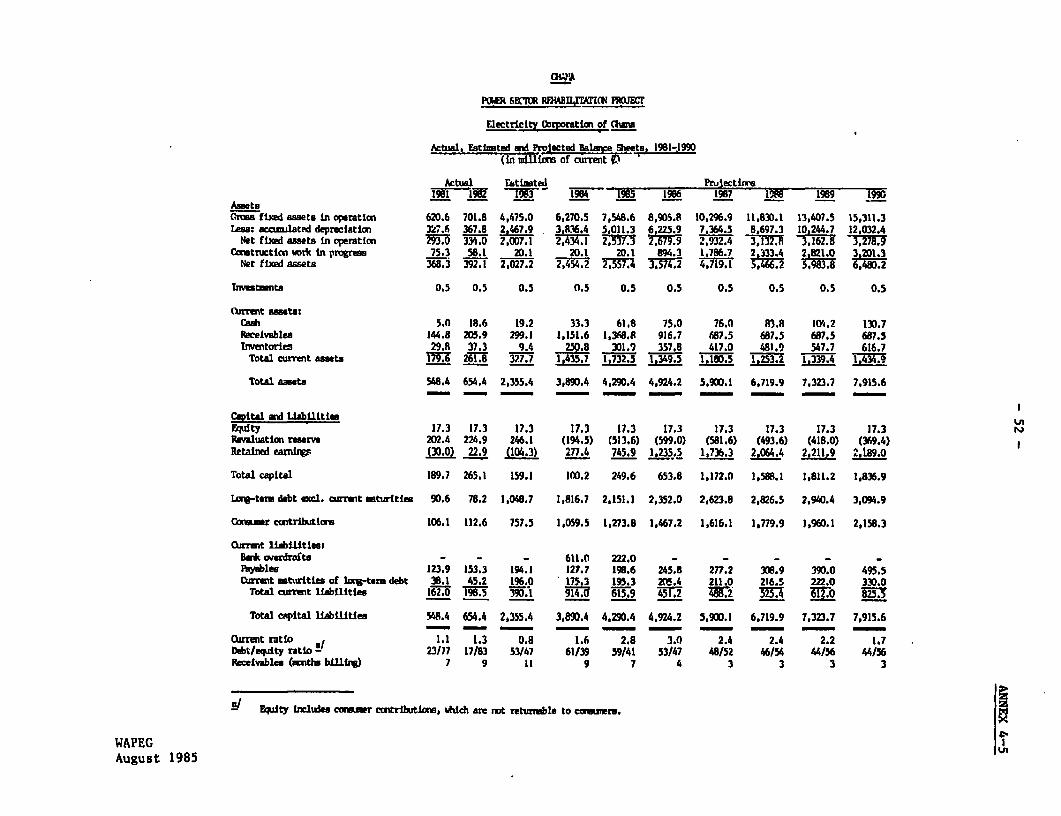
KWIR SEX RRUUJMAIN 0,F
Electricity Corporation of imia
Attul, EstiDated gd Pa o1ectealmle 9ets, 1981-1990(in sdlUiam of current f1
kbtal D,timted Pru ectink1981 192 13 1984- 1985 196 1987 198 1989 10
AssetsGrwuss fixed assets in operation 620.6 701.8 4,475.0 6,270.5 7,548.6 8,905.8 10,296.9 11,830.1 13,407.5 15,311.3Law: accnated depreciatiao 327.6 367.8 2,467.9 3,836.4 5 011.3 6 225.9 7,364.5 8,697.3 10 244.7 12,032.4
Net fixed assets in operatim on. 2,007.1 2,434.1 2,37 2.479. 3,932.162.8 3,278.9Csutncticon wi in prores 75.3 58.1 20.1 20.1 20.1 894.3 1,786.7 2,333.4 2,821.0 3,M1.3
Net fixsd assets 368.3 392.1 2,027.2 2,454.2 2,557.4 3,574.2 4.719.1 5,466.2 5,983.8 6,480.2
Txbtienta 0.5 0.5 0.5 0.5 0.5 0.5 0.5 0.5 0.5 0.5
Ot( t assets:Cash 5.0 18.6 19.2 33.3 61.8 75.0 76.0 83.8 104.2 130.7Receivables 144.8 205.9 299.1 1,151.6 1,360.8 916.7 687.5 687.5 607.5 687.5Inentorles 29.8 37.3 9.4 250.8 301.9 357,8 417.0 481.9 547.7 616.7
Total rrnt assets 179.6 261.8 7327.7 135.7 ,349.5 1,180.5 ;1,253.2 1,339.4 1,434.9
Total assets 548.4 654.4 2,355.4 3,890.4 4,290.4 4,924.2 5,900.1 6,719.9 7,323.7 7,915.6
Capital dM LiabilitiesFiidty 17.3 17.3 17.3 17.3 11.3 17.3 17.3 17.3 17.3 17.3RPaluatim reserve 202.4 224.9 246.1 (194.5) (513.6) (599.0) (581.6) (493.6) (418.0) (369.4)Retained eamniW (30.0) 22.9 (10.3) 277.4 745.9 1,3 5,5 1,736.3 2064.4 2L2119 2,189.0
Total capital 189.7 265.1 159.1 I0M.2 249.6 653.8 1,172.0 1,588.1 1,811.2 1,836.9
lIg-tera debt ex:l. cwramt setwitis 90.6 78.2 1,048.7 1,816.7 2,151.1 2,352.0 2,623.8 2,826.5 2,940.4 3,094.9
Caommr ccntributicg 106.1 112.6 757.5 1,059.5 1,273.8 1,467.2 1,616.1 1,779.9 1,960.1 2,158.3
O.trt liabilities:B*overdrafts - - - 611.0 222.0 - - - - -Pyables 123.9 153.3 194.1 127.7 198.6 245.8 277.2 309.9 390.0 495.5Current stuwities of lxg-term debt 38.1 45.2 196.0 175.3 195.3 25.4 211.0 216.5 222.0 330.0
Total carreit liAWtfaes 162.0i 39 15.9 45[.2 488.2 525.4 61.0 2B M
Total efpital liabilities 548.4 654.4 2,355.4 3,890.4 4,290.4 4,924.2 5,900.1 6,719.9 7,323.7 7,915.6
.rrmt ratto I 1.1 1.3 0.8 1.6 2.8 3.0 2.4 2.4 2.2 1.7Debt/eqlity ratto - 23/77 17/83 53/47 61/39 59/41 53/47 48/52 46/54 44/56 44/56Recelwables (Kmths bilflin) 7 9 11 9 7 4 3 3 3 3
tl ir Iclukes cansmer camtrliutrsw, hidi are mt retunuble to caszero.
WAPEGAugust 1985
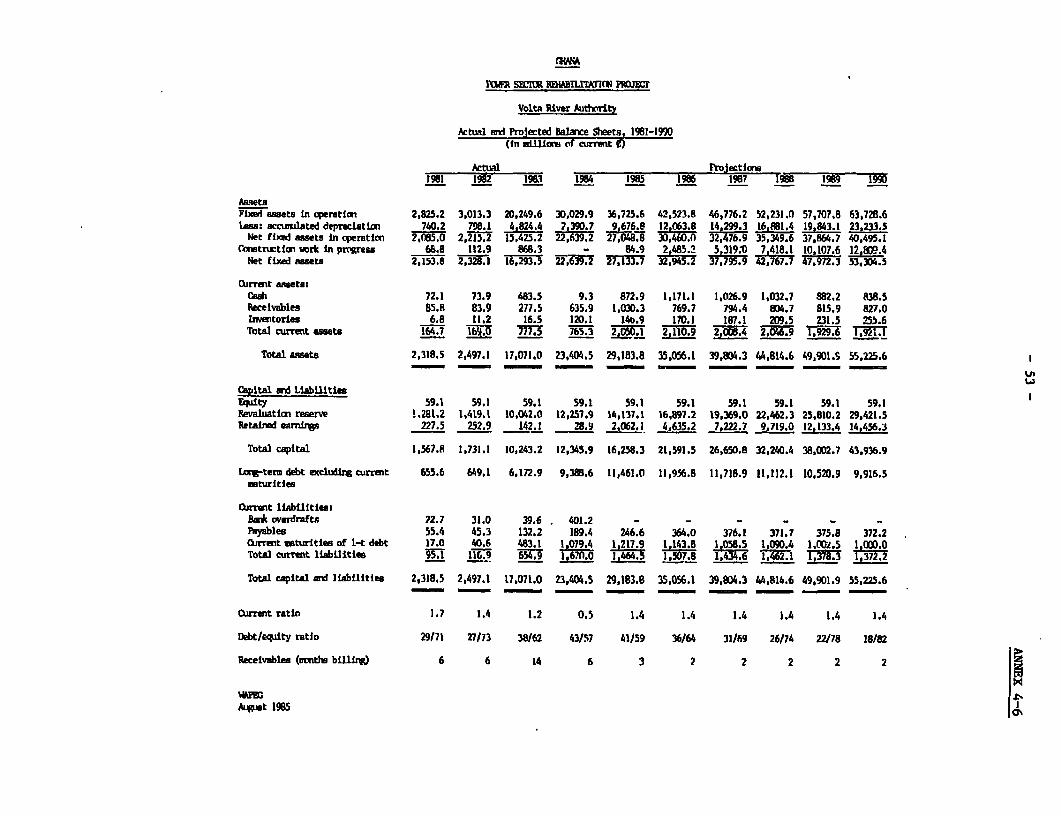
7uw SEMUR RlEMtMUN ht EWr
Volta River A2thtrity
ktual md Projected alaxe Sheets, 1981-1990(fn LUltaem of wrnt O)
19B1 1962 1981 1984 1985 1986 1987 2 1989 1990
AssetsFcaiasets In oeratson 2,825.2 3,013.3 20,249.6 30,029.9 36,725.6 42,523.8 46,776.2 52,231.0 57,707.8 63,728.6lAss: accsulated depreciatlen 740.2 798.1 4,824.4 7,39D 7 9 676 5 12 063 8 14,299.3 16,881.4 19,843.1 23,233.5
Net fxed assets in peratim 2,05.0 2,2 ;. 1425.2 22,h39.2 2 8 32,476.9 35,349.6 37,864.7 40,495.1Cautrurtin woerk in pgress 68.8 112.9 868.3 - 84.9 2,485.? 5 319.1 7,418.1 10,107.6 12,909.4
Net fixd assets 2,153.8 29328.1 16,293.5 22,639.2 27,133.7 32,945.2 37,7. 42,767.7 479.3 53,30D.5
O.rrent asetstCah 72.1 73.9 483.5 9.3 872.9 1,171.1 1,026.9 1,032.7 882.2 838.5Receivables 85.8 83.9 277.5 635.9 1,030.3 769.7 794.4 804.7 815.9 827.0Iwtories 6.8 11.2 16.5 120.1 140.9 110.1 187.1 209,5 231.5 255.6
Total crrait assets 164.7 i 3 777.5 765.3 2, 2,110.9 2,8.4 2,046.9 1,929.6 1,92I.1
Total aRsets 2,318.5 2,497.1 17,071.0 23,404.5 29.183.8 35,056.1 39,804.3 44,814.6 49,901.S 55,225.6
Cspital ad Liab iltiesEdty 59.1 59.1 59.1 59.1 59.1 59.1 59.1 59.1 59.1 59.1Revaluation reserve 1.281.2 1,419.1 10,042.0 12,257.9 14,137.1 16,897.2 19,369.0 22,462.3 25,810.2 29,421.5Retafi eamnis 227.5 252.9 142.1 28.9 2LO62 1 4,635.2 7,222.7 9,719.0 12,133.4 14,456.3
Total capital 1,567.8 1,731.1 10,243.2 12,345.9 16,258.3 21,591.5 26,650.8 32,240.4 38,C02.7 43,936.9
LaV-temr debt excluiig current 655.6 649.1 6,172.9 9,385.6 11,461.0 11,956.8 11,715.9 11,112.1 10,52D.9 9,916.5Ituritife
OQlrlt liabilitles:Ban cverdrafts 22.7 31.0 39.6 401.2 - - - - - -Payables 55.4 45.3 132.2 189.4 246.6 364.0 376.1 371.7 375.8 372.2Crent uturities of 1-t debt 17.0 40.6 483.1 1 079 4 1 217 9 1,143.8 1,058.5 1 090.4 1.02.5 1,O0O.0Total currat liabilities ;3 II 64 1, 1,507.8 g 1,46 .1 1,378.3 1,3722
Total capital mid liabilities 2,318.5 2,497.1 17,071.0 23,404.5 29,183.8 35,056.1 39,904.3 44,814.6 49,901.9 55,225.6
irmnt ratio 1.7 1.4 1.2 0.5 1.4 1.4 1.4 1.4 1.4 1.4
Debt/eqiity ratio 29/71 271/73 38/62 43/57 41/59 36/64 31/69 26/74 22/78 18/82
Receivables (uithw bilirog) 6 6 14 6 3 2 2 2 2 2
A&at 1985
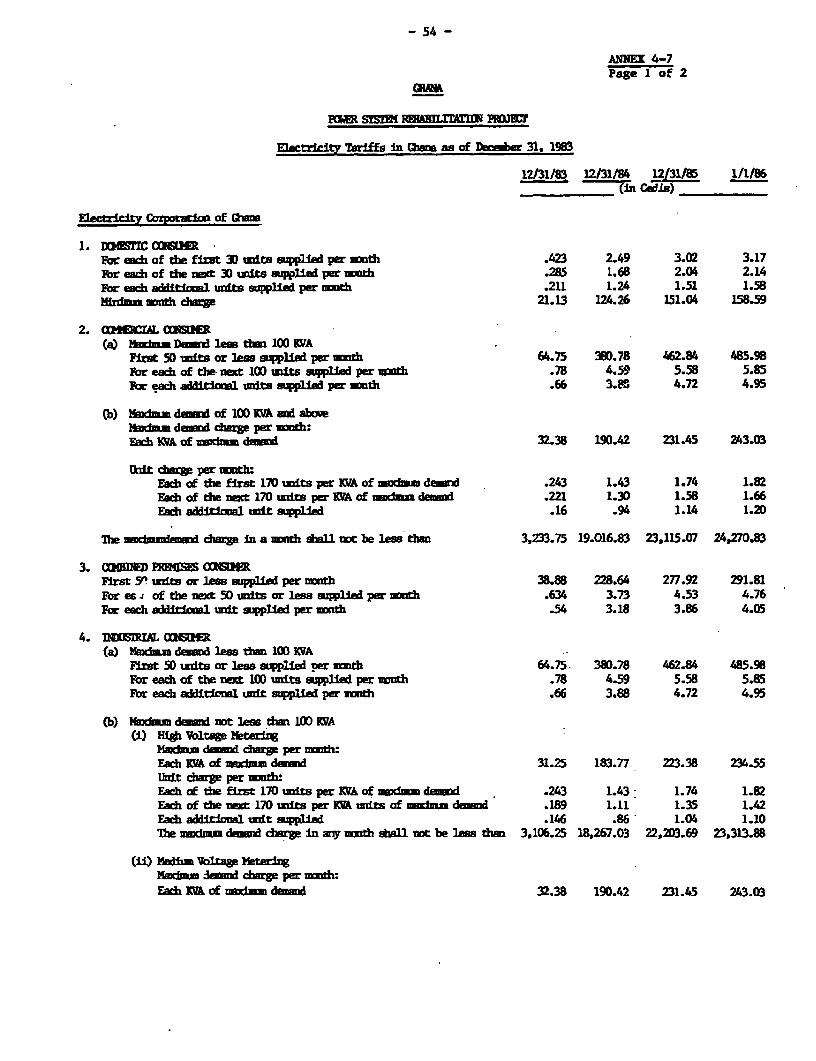
- 54 -
ANNEX 4-7Page 1 of 2
PM= S!( FRHA3LIrAT[ W
Elwtricity Tariffs In Quna as of December 31, 1983
12131/83 12131/PA 12131/85 1/1/86________ (in COedLT)___
lectricity Cporatim of Gha
1. DGM cflCFor eac of the first 30 units suplied per auidt .423 2.49 3.02 3.17Pbr each of the next 30 umits supped per math .285 1.68 2.04 2.14Fwr each addii l -it supplied per mmth .211 1.24 1.51 1.58
i:m wsothcharge 21.13 124.26 151.04 158.59
2. CMIAL OASR(a) Ma Dam d less thl i 100 IVA
First 50 units or less stpplied per mmith 64.75 380.78 462.84 485.98For each of te, 100 Uil:6 supplied per mt .78 4.59 5.58 5.85For each additicW uim supplied per mxdt .66 3.8g 4.72 4.95
(b) Madn dled of 100 TWA and aboveM1d-. dema charBe per mmth:Fach IWA of umdmm de 32.38 190.42 231.45 243.03
Urdt d=W per mmtb:Each of the first 170 mmits per KVA of nsdma demnd .243 1.43 1.74 1.82Each of the t 170 uni per RVA of midas darnd .221 1.30 1.58 1.66Eah addiinal unit supplied .16 .94 1.14 1.20
The ard de In a m sball n be less than 3,233.75 19.016.83 23,115.07 24,270.83
3. CIMIDED ElM CONEIFirst 5! ilts or los asuaied per umth 38.88 228.64 277.92 291.81For es j of the next 50 its or less supplied per h .634 3.73 4.53 4.76For each additioml unit supplied per umitd .54 3.18 3.86 4.05
4. DIXEUJRI CAL (a) NMdm4 dod less thm 100 VA
First 50 units or ls ss pled per mmdn 64.75. 380.78 462.84 485.98For eadc of the nex 100 wmits aWUlid per .78 4.59 5.58 5.85For each additioral unit supplied per mmth .66 3.88 4.72 4.95
(b) Ykidnu dwand rnot less dhai 100 KVA(i) Hih Vbltage ie
Madum de chr- per mI:Each KVA of iind dellnd 31.25 183.77 223.38 234.55Unit Dre per :mthEach of tie first 170 its per TKA of midmum deamd .243 1.43 1.74 1.82Fach of tie 170 is per Kl its of mmdmm de .189 1.11 1.35 1.42Each addilial wilt upplied .146 .86 1.04 1.10The mundnma dumad charg in ary uwth sball not be less thn 3,106.25 18,267.03 22,203.69 23,313.88
(ii) Hadiln Voltap 1kteiriNadmm amzxd charge per mId:Eachi IA of undus demsd 32.38 190.42 231.45 243.03
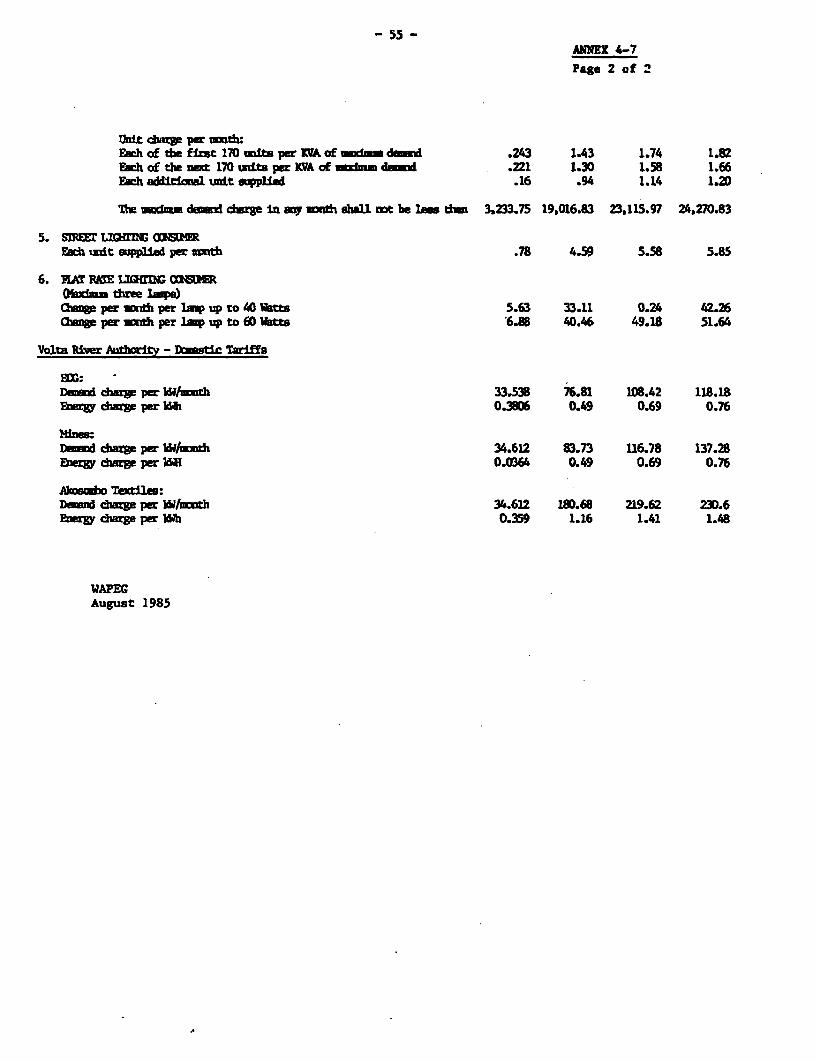
- 55 -
ANNEX 4-7Page 2 of 2
Unit ducrnm per :thEAch of the first 170 its per I of uidmm dind .243 1.43 1.74 1.82Each of the ro 170 udts per KVA of tidum d.mnd .221 1.30 1.58 1.66EA.h aMitia8u uit ppUied .16 .94 1.14 1.20
The umdim daLi durae in my h shall not be les dm 3,233.75 19,016.83 23,115.97 24,270.83
5. ST1r LIGHrn1 0Eacih wit suppl per mith .78 4.59 5.58 5.85
6. NAT RATE LIGHMG OX6MOQisndm thee laws)ahDg per =nth per lap up to 40 Wetts 5.63 33.11 0.24 42.26ainoe per wnth per 1ip up to 60 Watts 6.88 40.46 49.18 51.64
Volts liver ahority - Dwstic Mwiffs
E:Dd darge per kSWl/umth 33.538 76.81 108.42 118.18ERY dre per b 0.3806 0.49 0.69 0.76
Mes:Dem dure per 1/rh 34.612 83.73 116.78 137.28Ezurw ce per kd{ 0.0364 0.49 0.69 0.76
Alwodio Textilo:Dum a d e per likW/ut 34.612 ISD.68 219.62 23D.6Ery di. per N& 0.359 1.16 1.41 1.48
WAPEGAugust 1985
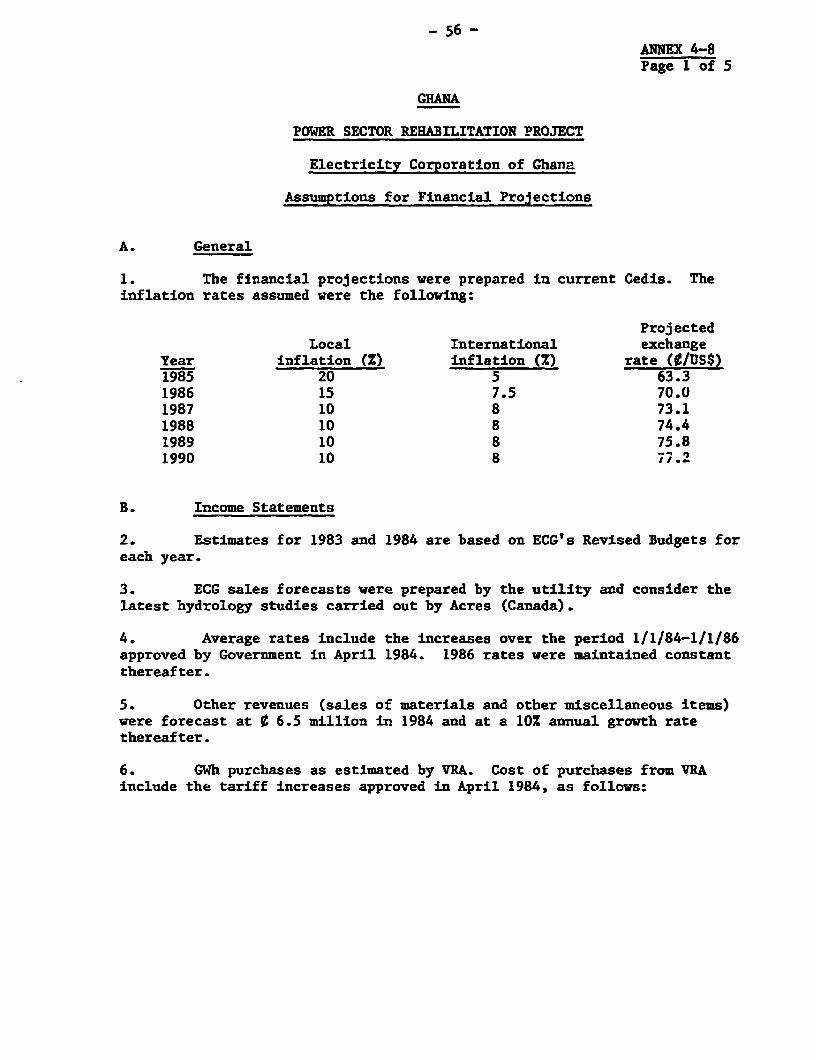
- 56 -ANNEX 4-8Page 1 of 5
GHANA
POWER SECTOR REHABILITATION PROJECT
Electricity Corporation of Ghana
Assumptions for Financial Projections
A. General
1. The financial projections were prepared in current Cedis. Theinflation rates assumed were the following:
ProjectedLocal International exchange
Year inflation (Z) inflation (%) rate (¢IUS$)1985 20 5 63.31986 15 7.5 70.01987 10 8 73.11988 10 8 74.41989 10 8 75.81990 10 8 77.2
B. Income Statements
2. Estimates for 1983 and 1984 are based on ECG's Revised Budgets foreach year.
3. ECG sales forecasts were prepared by the utility and consider thelatest hydrology studies carried out by Acres (Canada).
4. Average rates include the increases over the period 1/1/84-1/1/86approved by Government in April 1984. 1986 rates were maintained constantthereafter.
5. Other revenues (sales of materials and other miscellaneous items)were forecast at ¢ 6.5 million in 1984 and at a 10% annual growth ratethereafter.
6. GWh purchases as estimated by VRA. Cost of purchases from VRAinclude the tariff increases approved in April 1984, as follows:
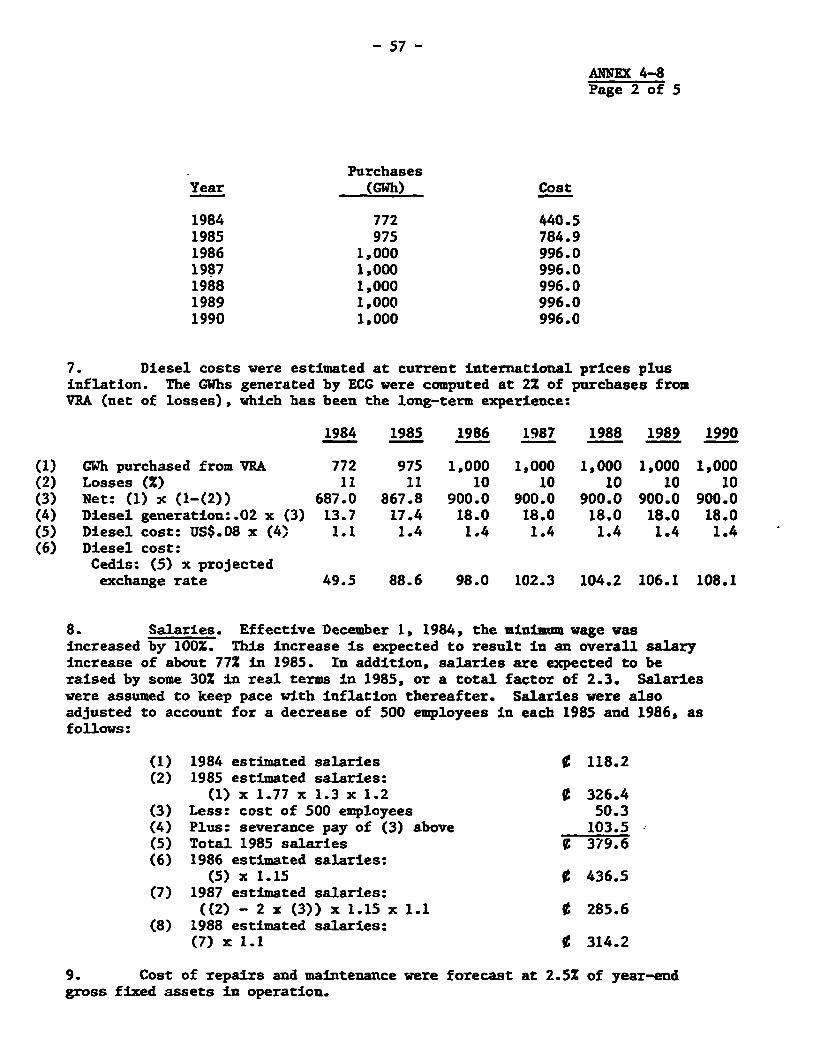
- 57 -
ANNEX 4-8Page 2 of 5
PurchasesYear (GWh) Cost
1984 772 440.51985 975 784.91986 1,000 996.01987 1,000 996.01988 1,000 996.01989 1,000 996.01990 1,000 996.0
7. Diesel costs were estimated at current international prices plusinflation. The GWhs generated by ECG were computed at 2% of purchases fromVRA (net of losses), which has been the long-term experience:
1984 1985 1986 1987 1988 1989 1990
(1) GWh purchased from VRA 772 975 1,000 1,000 1,000 1,000 1,000(2) Losses (%) 11 11 10 10 10 10 10(3) Net: (1) x (1-(2)) 687.0 867.8 900.0 900.0 900.0 900.0 900.0(4) Diesel generation:.02 x (3) 13.7 17.4 18.0 18.0 18.0 18.0 18.0(5) Diesel cost: US$.08 x (4) 1.1 1.4 1.4 1.4 1.4 1.4 1.4(6) Diesel cost:
Cedis: (5) x projectedexchange rate 49.5 88.6 98.0 102.3 104.2 106.1 108.1
8. Salaries. Effective December 1, 1984, the minimum wage wasincreased by 100%. This increase is expected to result in an overall salaryincrease of about 77Z in 1985. In addition, salaries are expected to beraised by some 30% in real terms in 1985, or a total factor of 2.3. Salarieswere assumed to keep pace with inflation thereafter. Salaries were alsoadjusted to account for a decrease of 500 employees in each 1985 and 1986, asfollows:
(1) 1984 estimated salaries ¢ 118.2(2) 1985 estimated salaries:
(1) x 1.77 x 1.3 x 1.2 0 326.4(3) Less: cost of 500 employees 50.3(4) Plus: severance pay of (3) above 103.5(5) Total 1985 salaries 9 379.6(6) 1986 estimated salaries:
(5) x 1.15 ¢ 436.5(7) 1987 estimated salaries:
((2) - 2 x (3)) x 1.15 x 1.1 ¢ 285.6(8) 1988 estimated salaries:
(7) x 1.1 0 314.2
9. Cost of repairs and maintenance were forecast at 2.5% of year-endgross fixed assets in operation.
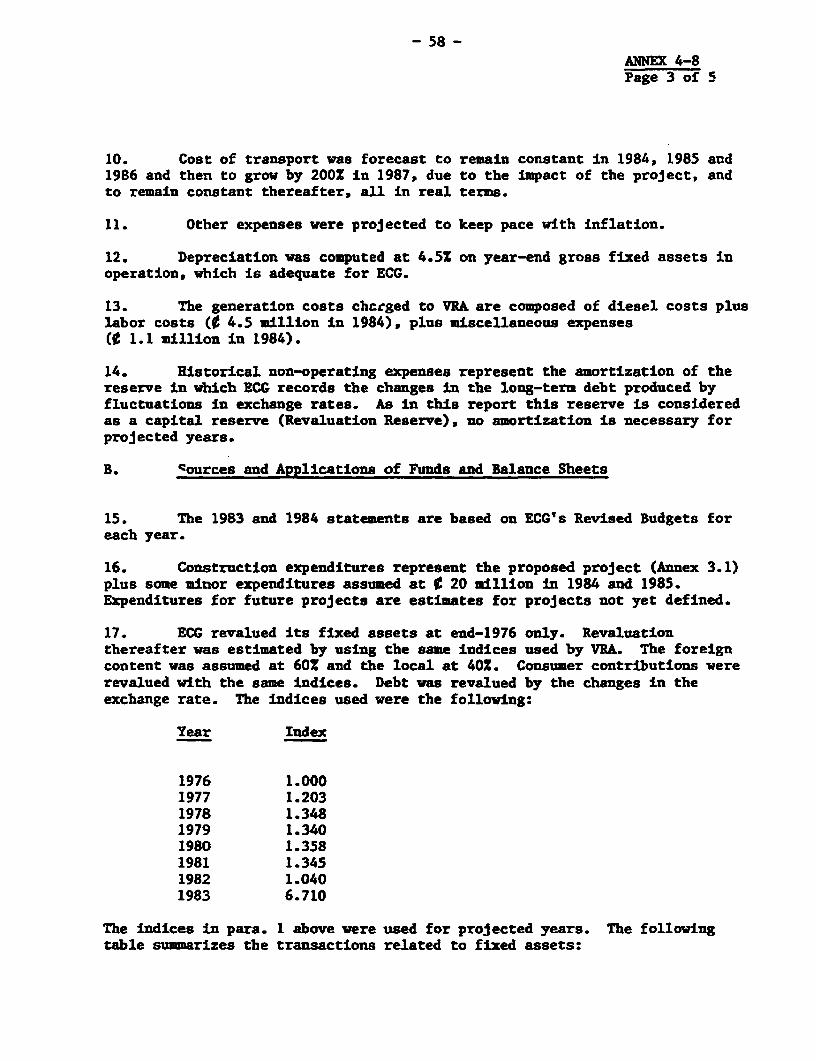
- 58 -ANNEX 4-8Page 3 of 5
10. Cost of transport was forecast to remain constant in 1984, 1985 and1986 and then to grow by 200% in 1987, due to the impact of the project, andto remain constant thereafter, all in real terms.
11. Other expenses were projected to keep pace with inflation.
12. Depreciation was computed at 4.5Z on year-end gross fixed assets inoperation, which is adequate for ECG.
13. The generation costs chcrged to VRA are composed of diesel costs pluslabor costs (C 4.5 million in 1984), plus miscellaneous expenses(¢ 1.1 million in 1984).
14. Historical non-operating expenses represent the amortization of thereserve in which ECG records the changes in the long-term debt produced byfluctuations in exchange rates. As in this report this reserve is consideredas a capital reserve (Revaluation Reserve), no amortization is necessary forprojected years.
B. o and Applications of Funds and Balance Sheets
15. The 1983 and 1984 statements are based on ECG's Revised Budgets foreach year.
16. Construction expenditures represent the proposed project (Annex 3.1)plus some minor expenditures assumed at t 20 million in 1984 and 1985.Expenditures for future projects are estimates for projects not yet defined.
17. ECG revalued its fixed assets at end-1976 only. Revaluationthereafter was estimated by using the same indices used by VRA. The foreigncontent was assumed at 60% and the local at 402. Consumer contributions wererevalued with the same indices. Debt was revalued by the changes in theexchange rate. The indices used were the following:
Year Index
1976 1.0001977 1.2031978 1.3481979 1.3401980 1.3581981 1.3451982 1.0401983 6.710
The indices in para. 1 above were used for projected years. The followingtable summarizes the transactions related to fixed assets:
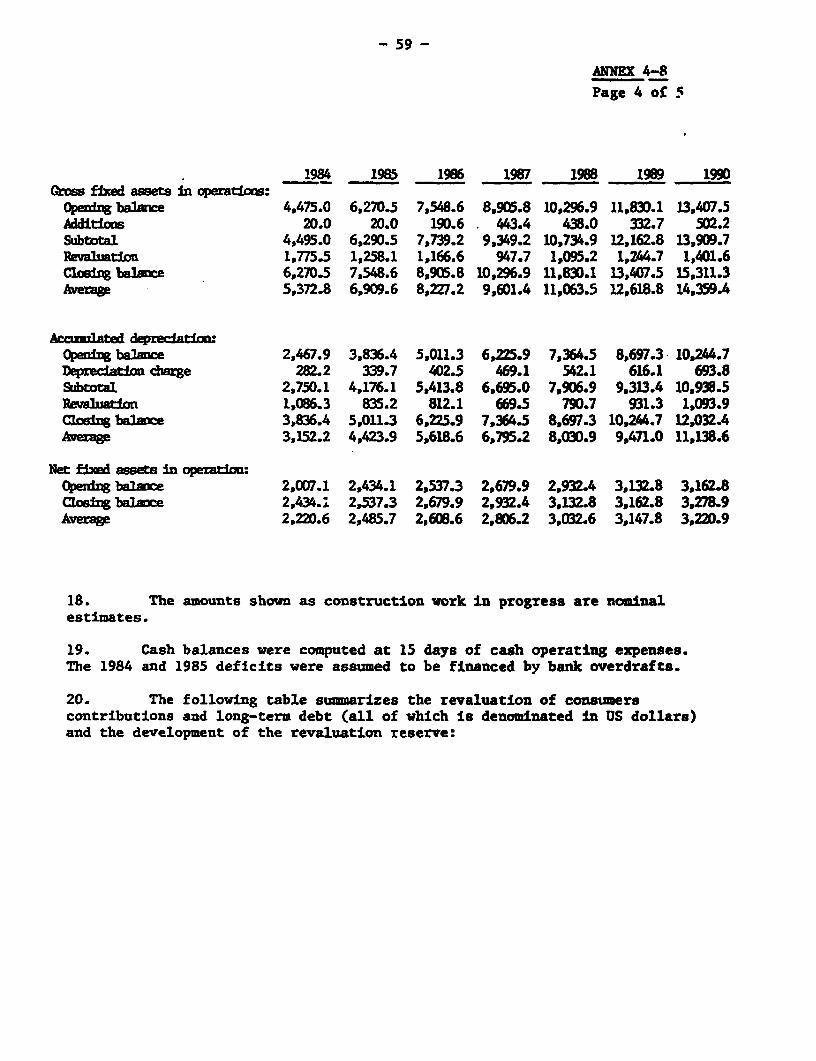
- 59 -
ANNEX 4-8Page 4 of 5
1984 1985 1986 1987 1988 1989 1990Gross fixed assets in operaticns:
penbing balance 4,475.0 6,270.5 7,548.6 8,905.8 10,296.9 11,830.1 13,407.5Additinos 20.0 20.0 190.6 443.4 438.0 332.7 502.2Subtotal 4,495.0 6,290.5 7,739.2 9,349.2 10,734.9 12,162.8 13,909.7RevabiatIon 1,775.5 1,258.1 1,166.6 947.7 1,095.2 1,244.7 1,401.6Closing balmee 6,270.5 7,548.6 8,905.8 10,296.9 11,830.1 13,407.5 15,311.3Anerage 5,372.8 6,909.6 8,227.2 9,601.4 11,063.5 12,618.8 14,359.4
AccuAlata deprecIatidOpueafdgt 2,467.9 3,836.4 5,011.3 6,225.9 7,364.5 8,697.3 10,244.7DepredSation charge 282.2 339.7 402.5 469.1 542.1 616.1 693.8Subtotal 2,750.1 4,176.1 5,413.8 6,695.0 7,906.9 9,313.4 10,938.5Revsalaton 1,086.3 835.2 812.1 669.5 790.7 931.3 1,093.9Closing Wbaance 3,836.4 5,011.3 6,225.9 7,364.5 8,697.3 10,244.7 12,032.4Average 3,152.2 4,423.9 5,618.6 6,795.2 8,030.9 9,471.0 11,138.6
Net fixed assetrs in operatimon:Opeidrg balance 2,007.1 2,434.1 2,537.3 2,679.9 2,932.4 3,132.8 3,162.8Closing balanae 2,434.1 2,537.3 2,679.9 2,932.4 3,132.8 3,162.8 3,278.9Arav e 2,220.6 2,485.7 2,606.6 2,806.2 3,032.6 3,147.8 3,220.9
18. The amounts shown as construction work in progress are nominalestimates.
19. Cash balances were computed at 15 days of cash operating expenses.The 1984 and 1985 deficits were assumed to be financed by bank overdrafts.
20. The following table summarizes the revaluation of consumerscontributions and long-term debt (all of which is denominated in US dollars)and the development of the revaluation reserve:
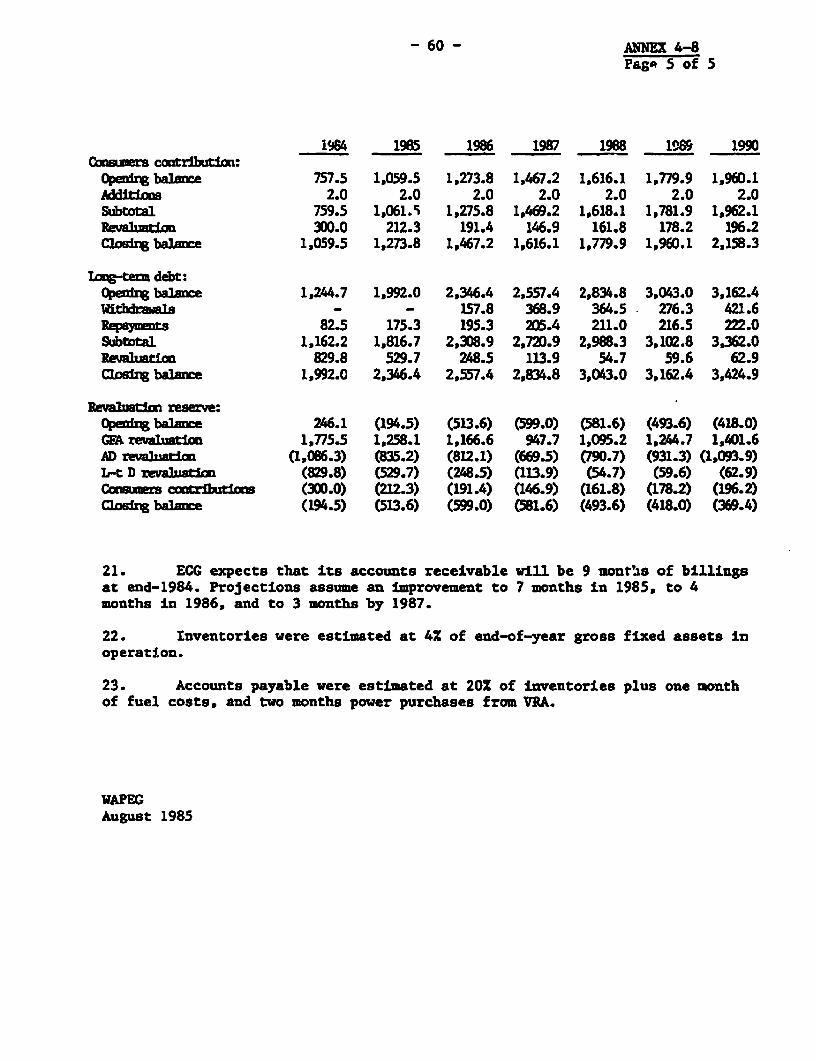
- 60 - AlNNE 4-8Page 5 of 5
i964 1985 1986 1987 1988 1989 1990Con ccHtrhtio:
Openfing balsnce 757.5 1,059.5 1,273.8 1,467.2 1,616.1 1,779.9 1,960.1Additions 2.0 2.0 2.0 2.0 2.0 2.0 2.0Subtotal 759.5 1,061.% 1,275.8 1,469.2 1,618.1 1,781.9 1,962.1Pevabxtlion 300.0 212.3 191.4 146.9 161.8 178.2 196.2Closirg balance 1,059.5 1,273.8 1,467.2 1,616.1 1,779.9 1,960.1 2,158.3
Iong-term debt:Operirg balane 1,244.7 1,992.0 2,346.4 2,557.4 2,834.8 3,043.0 3,162.4Withdrainls - - 157.8 368.9 364.5 276.3 421.6;xrpnoits 82.5 175.3 195.3 205.4 211.0 216.5 222.0
Subtotal 1,162.2 1,816.7 2,308.9 2,720.9 2,988.3 3,102.8 3,362.0Revahuatimc 829.8 529.7 248.5 113.9 54.7 59.6 62.9Closing balance 1,992.0 2,346.4 2,557.4 2,834.8 3,043.0 3,162.4 3,424.9
awrnbt rese:Opening bal2 246.1 (194.5) (513.6) (599.0) (581.6) (493.6) (418.0)*A revaluation 1,775.5 1,258.1 1,166.6 947.7 1,095.2 1,244.7 1,401.6AD revaluation (1,086.3) (835.2) (812.1) (669.5) (790.7) (931.3) (1,093.9)I-t D rvauatio (829.8) (529.7) (248.5) (113.9) (54.7) (59.6) (62.9)cinsumrs contrlutlgxs (300.0) (212.3) (191.4) (146.9) (161.8) (178.2) (196.2)C2os1% balamee (194.5) (513.6) (599.0) (581.6) (493.6) (418.0) (369.4)
21. ECG expects that its accounts receivable will be 9 mont'as of billingsat end-1984. Projections assume an improvement to 7 months in 1985, to 4months in 1986, and to 3 months by 1987.
22. Inventories were estimated at 42 of end-of-year gross fixed assets inoperation.
23. Accounts payable were estimated at 201 of inventories plus one monthof fuel costs, and two months power purchases from VRA.
WAPEGAugust 1985
- 61 -
ANNEX 4-9Page 1 of 5
GHANA
POWER SECTOR REHABILITATION PROJECT
Volta River Authority
Assumptions for Financial Projections
A. General
1. The financial projections were prepared in current Cedis. Theinflation rates assumed and the projected exchange rates were thefollowing:
ProjectedLocal International exchange
Year inflation (Z) inflation (Z) rate (MIUS$)1985 20 5 63.31986 15 7.5 70.01987 10 8 73.11988 10 8 74.41989 10 8 75.81990 10 8 77.2
B. Income Statements
2. Estimates for 1984 are based orn VRA's estimates at end-1984.Projections for 1985 are based on VRk's budget.
3. VRA sales forecasts were prepared by the utility and considerthe latest hydrology studies carried out by Acres (Canada). Averagerates include the increases over the period 1 1/84 - 1/1/86 approved byGovernment in April 1984 and the latest reviqions to the supply contractwith VALCO and CEB. Domestic rates were maintained constant thereafter.The following table details sales, average and total revenues percustomer:
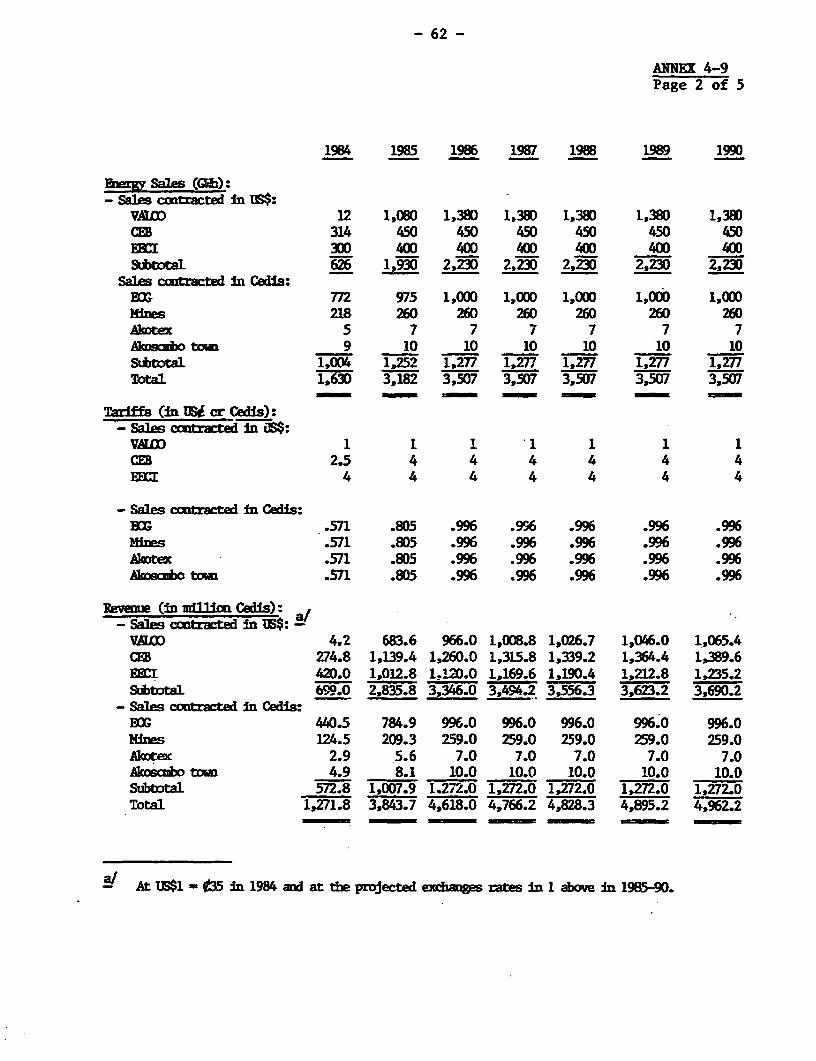
- 62 -
ANNEX 4-9Page 2 of 5
1984 1985 1986 1987 1988 1989 1990
-rgy Sales (GPh):- Sal cmtrarted iu Ia$:
VATIX) 12 1,080 1,380 1,380 1,380 1,380 1,380CEB 314 450 450 450 450 450 450EEKI 300 400 400 400 400 400 400Subtotal 626 ,930 2,230 2,230 2,230 2,230 2,230
SO cmtractsd in Cedls:BoG 772 975 1,000 1,000 1,000 1,000 1,000Ithies 218 260 260 260 260 260 260Alotex 5 7 7 7 7 7 7Almscubo tou 9 10 10 10 10 10 10Subtotal 1,O4 1,252 1,277 1,277 1,277 1,277 1,277Total 1,630 3,182 3,507 3,507 3,507 3,507 3,507
Tariffs (in _US or Cedis):- Sal ntrt in S:
VAUX 1 1 1 1 1 1 1CEB 2.5 4 4 4 4 4 4EEI 4 4 4 4 4 4 4
- Sales coitracted in Cedis:BOG3 .571 .805 .996 .996 .996 .996 .996mi .571 .805 .996 .996 .996 .996 .996Alwtex .571 .805 .996 .996 .996 .996 .996Alwsicimb tomi .571 .805 .996 .996 .996 .996 .996
Rseveue (iu uillo<n Cedis): a/ . .- Sale ctracted in U$:
VALO)D 4.2 683.6 966.0 1,008.8 1,026.7 1,046.0 1,065.4CEB 274.8 1,139.4 1,260.0 1,315.8 1,339.2 1,364.4 1,389.6EBCI 420.0 1,012.8 1.12D.0 1,169.6 1,190.4 1,212.8 1,235.2
SbtotaiL 699.0 2,835.8 3,346.0 3,494.2 3,556.3 3,623.2 3,690.2- Sals cxtrwted in Cedis:
Ex 440.5 784.9 996.0 996.0 996.0 996.0 996.0Mines 124.5 209.3 259.0 259.0 259.0 259.0 259.0Almtex 2.9 5.6 7.0 7.0 7.0 7.0 7.0Akoszibo tbon 4.9 8.1 10.0 10.0 10.0 10.0 10.0Subtotal 572.8 1,007.9 1.272.0 1,272.0 1,272.0 1,272.0 1,272.0Total 1,271.8 3,843.7 4,618.0 4,766.2 4,828.3 4,895.2 4,962.2
At US$1 - 035 in 1984 and at the projected ezbivrges rates in 1 above in 1985-90.
- 63 -
ANNEX 4-9Page 3 of 5
4. The major component of other revenues is interest onshort-term foreign exchange investments.
5. Salaries. Effective December 1, 1984, the minimum wage wasincreased by 100Z. This increase is expected to result in an overallsalary increase of about 60% in 1985. In addition, salaries areexpected to be raised by some 30% in real terms in 1985, or a totalfactor of 2.1. Salaries were raised by 6% in 1986 and by 7.5% in 1987and 1988 in real terms to allow for expansion and promotions.
6. Materials were estimated at 0.15% of end-of-year gross fixedassets in operation.
7. Transportation costs are expected to remain constant in realterms as VRA will not increase its vehicle fleet.
8. General expenses are expected to remain constant in realterms.
9. Depreciation was computed at 2.2% of year-end gross fixedassets in operation.
10. For an explanation of ECG"s generation costs see Annex 4.8,para. 13.
11. For an explanation of historical non-operating expenses seeAnnex 4.8, para. 14.
B. Sources and Applications of Funds and Balance Sheets
12. The 1984-statements are based on VRA's estimates at end-1984.Projections for 1985 are based on VRA's budget.
13. VRA's transactions related to fixed assets are as follows:

- 64 -
ANNEX 4-9Page 4 of 5
1984 1985 1986 1987 1988 1989 1990Gross fixed assets in operation:
opening balance 20,249.6 30,029.9 36,725.6 42,523.8 46,776.2 52,231.0 57,707.8additims 1277.3 574.8 251.6 - 693.8 214.0 210.3subtotal 21,526.9 30,604.7 36,977.2 42,523.8 47,470.0 52,445.0 57,918.1revaluatimn 8,503.0 6,120.9 5,546.6 4,252.4 4,761.0 5,262.8 5,810.5closing bavimce 30,029.9 36,725.6 42,523.8 46,776.2 52,231.0 57,707.8 63,728.6average 25,139.8 33,377.8 39,624.7 44,650.0 49,503.6 54,969.4 60,718.2
Acmuated depre pationopenig balance 4,824.4 7,390.7 9,676.8 12,063.8 14,299.3 16,881.4 19,843.1dbepkredtio chargbe 660.7 808.0 935.5 1,029.1 1,152.2 1,273.6 1,406.1subtotal 5,485.1 8,198.7 10,612.3 13,092.9 15,451.5 18,155.0 21,249.2revaluatiCo 1.905.6 1,478.1 1,451.5 1,206.4 1,429.9 1,688.1 1,984.3closing balance 7,390.7 9,676.8 12,063.8 14,299.3 16,881.4 19,843.1 23,233.5average 6,107.6 8,533.7 10,870.3 13,181.6 15,590.4 18,362.3 21,538.3
Net fixed assets in operation:opentig balance 15,425.2 22,639.2 27,048.8 30,460.0 32,476.9 35,349.6 37,864.7c]zelg balance 22,639.2 27,048.8 30,460.0 32,476.9 35,349.6 37,864.7 40,495.1average 19,032.2 24,844.0 28,754.4 31,468.5 33,913.3 36,607.2 39,179.9
14. The following summarizes the revaluation of long-term debt andthe development of the revaluation reserve:
Iong-term debt:openig balance 6,656.0 10,468.0 12,678.9 13,100.6 12,777.4 12,202.5 11,523.4withdrn~ls 22D.0 526.7 304.6 246.4 245.8 184.5 180.7repaynmuts 789.5 1,079.4 1,217.9 1,143.8 1,058.5 1,090.4 1,002.5subtotal 6,086.5 9,915.3 11,765.6 12,203.2 11,964.7 11,296.6 10,701.6revalution 4,381.5 2,763.6 1,335.0 574.2 237.8 226.8 214.9closing bale 10,468.o 12,678.9 13,100.6 12,777.4 12,202.5 11.523.4 10,916.5
Revaluation reserve:opening balnce 10,042.0 12,257.9 14.137.1 16,897.2 19,369.0 22,462.3 25,810.2GFA revaluatio 8,503.0 6,120.9 5,546.6 4,252.4 4,761.0 5,262.8 5,810.5AD revalution (1,905.6) (1,478.1) (1,451.5) (1,206.4) (1,429.9) (1,688.1) (1,984.3)L-t D revaluation (4,381.5) (2,763.6) (1,335.0) (574.2) (237.8) (226.8) (214.9)closing balae 12,257.9 14,137.1 16,897.2 19,369.0 22,462.3 25,810.2 29,421.5
15. Cash balances were computed at 15 days of cash operatingexpenses in 1984 and to obtain a 1.4 liquidity ratio starting 1985.
16. VRA's experience with accounts receivable has been an averageof six months billings mostly from ECG. Forecasts assume improvementsto three months in 1985 and to two months in 1986, and to remainconstant thereafter.
17. Inventories vere estimated at 0.4% of year-end gross fixedassets in operation.
- 65 -
ANNEX 4-9Page 5 of 5
18. Accounts payable were estimated at 3 months of interestpayable plus 8.33% of cash operating expenses plus 5% of capitalexpenditures.
19. VRA shows cash surpluses starting 1985. The surpluses wereallocated to cash balances, payables and future (undetermined)investments so as to conform with the constraints in 15 and 18 above.
WAPEGAugust 1985
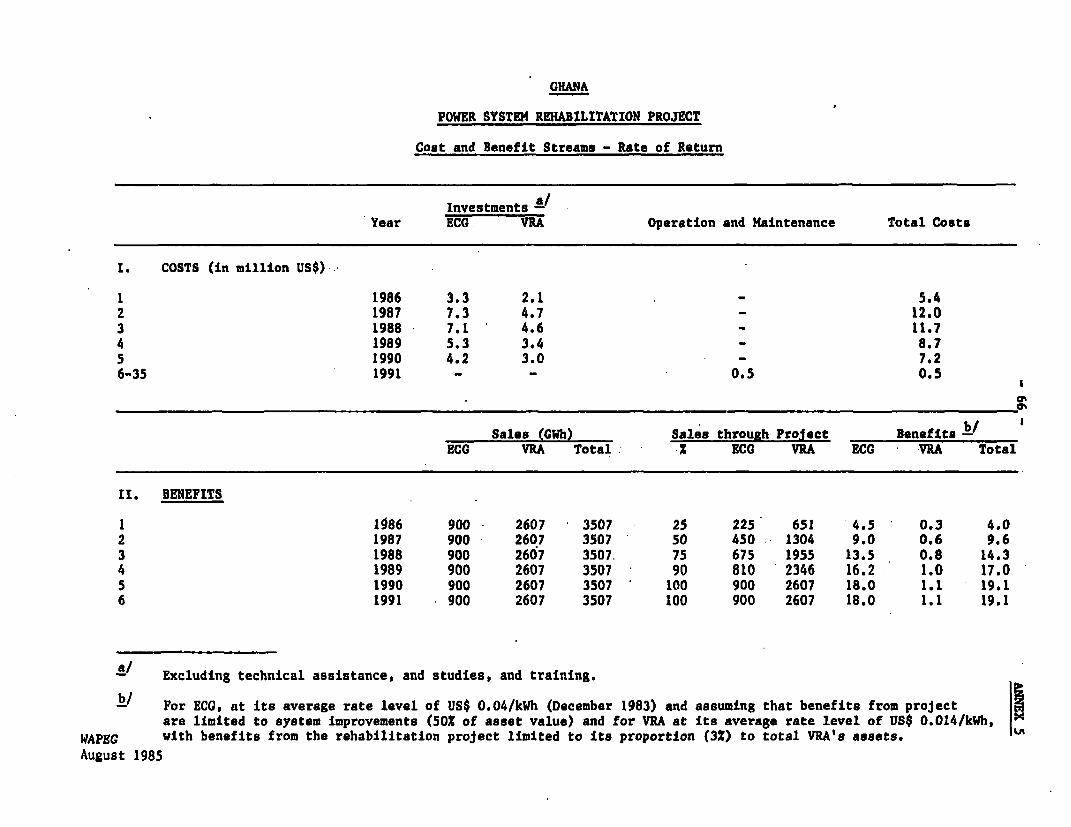
GHANA
POWER SYSTEM REHABILITATION PROJECT
Cost and Benefit Streams - Rate of Return
Investments -/Year ECG VRA Operstion and Maintenance Total Costs
I. COSTS (in million US$)
1 1986 3.3 2.1 - 5.42 1987 7.3 4.7 - 12.03 1988 7.1 4.6 - 11.74 1989 5.3 3.4 - 8.75 1990 4.2 3.0 - 7.26-35 1991 - - 0.5 0.5
a%
Sales (GWh) Sales through Project Benefits /ECG VRA Total EZ CG VRA ECG VRA Total
It. BENEFITS
1 1086 900 2607 3507 25 225 651 4.5 0.3 4.02 1987 900 2607 3507 50 450 1304 9.0 0.6 9.63 1988 900 2607 3507. 75 675 1955 13.5 0.8 14.34 1989 900 2607 3507 90 810 2346 16.2 1.0 17.05 1990 900 2607 3507 100 900 2607 18.0 1.1 19.16 1991 900 2607 3507 100 900 2607 18.0 1.1 19.1
A/ Excluding technical assistance, and studies, and training.
For ECG, at its average rate level of US$ 0.04/kWh (December 1983) and assuming that benefits from projectare limited to system improvements (502 of asset value) and for VRA at its average rate level of US$ 0.014/kWh,
WAPEG with benefits from the rehabilitation project limited to its proportion (3Z) to total VRA's assets. UAugust 1985
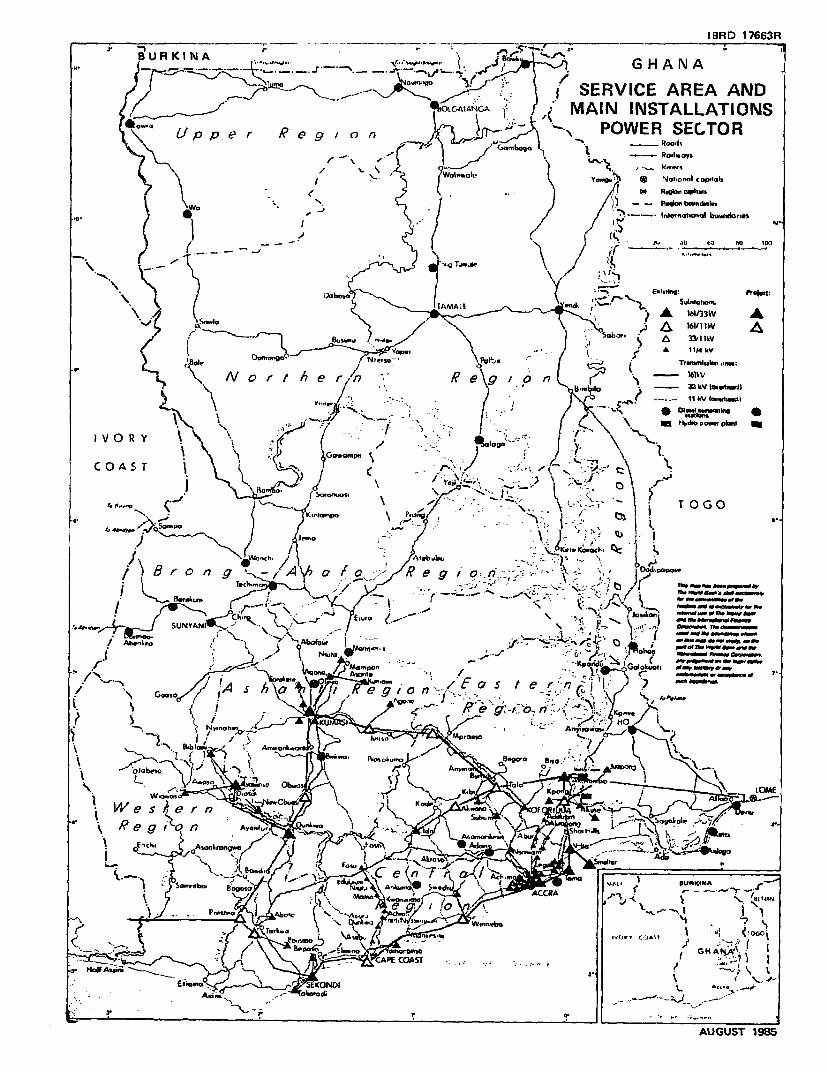
IBRD 17663R
i U R K I N A 54x~~~~Znr 1. G H A N A
gJ f4t -- f4_ > g ~SERVICE AREA AND{tt ~~~f76QtGAIAGA 1 (' AIN INSTALLATIONS
\- U p p g 0 n > - POWER SECTOR
/ / >.---* In~~lariollon. bob.af *e
WC4 r- }J° : h D
| \ j~~~~~~~~~~~~~~~~~~~~~~~~~~~~~~~~niw( ; l~ b ou Fndows*
( ~~~~ 80wno g "~~~~~~~~~~-,j_ / o- st 3t w
£ )Hote omr,mglo~ ~<P \0 i Tr_msBba nP
r ? \< N ~~~~~~D or 7ern-Regont ¢v__ttVuZhd
. \ \5 ,. 2>Gobrornpe \ ) , \ 114 k
/Vcr h e 6 t-l n_ Ketl6t"k-J ~ ~~~~~~~~~ ~ ~~~~~~~~~ ~ ~~~~~~~~~~~~~~~~~~~ \WenX J,; Atbuu l*-: 1
j } B r o r g v -/Adlh a f o, XR e g i 0 ,,.;,.>. "j.t- , l+PaWe1 V 4lwh"d
t t ; ' s t ->RotiLon' ~~~~~~~~~V__4.U*, 6 z;2 SUI>IYANIv-' +- \> '- Sf IUfO i-"- \ ''S j, \ N .r! =_~~~~~~~~~~~~~~~~~~~~~~~~~~~~~~~~~~~~~~~~~~~~~~~~~~~~~~~~~~~~~~~~~~~~~~~~~~~~~~~~~t
I V> 0@ RMno Ypgf<;lkols ri/ > G osoX 50 n -- / f= / S /e r-n ; -
C1 _0 A l!yob> T *An
\ . o Ezbonz_o ; An_lonSw4nab / ~~~~~~viN; Z } \
aX~~~~~~~~~~~~~~~~~~~~~~~~~~~~~~~~~C
.~~~~~~~~~~~~~~~~~~~~~~~~~~~~~~~~~~~A EsowsD .em,v
~~~~~~~~~~~~~~~~~~~~~~~~~~~~~~~~~~~~~jlAror r.,,.._.v;
SUNYAN<11~~~~~~~~~~~~~~~UUS 18