Embed Size (px)
Citation preview

Appendix for Oil Price Shocks and Industrial Production:
Is the Relationship Linear?∗
Ana María Herrera† Latika Gupta Lagalo‡ Tatsuma Wada§
March 1, 2011
Abstract
This paper tests the three leading specifications of asymmetric and possibly nonlinear feedback from
the real price of oil to U.S. industrial production and its sectoral components. We show that the evidence
of such feedback is sensitive to the estimation period. Support for a nonlinear model is strongest for
samples starting before 1973. Instead, using post-1973 data only, the evidence against symmetry becomes
considerably weaker. For example, at the aggregate level, there is no evidence against the hypothesis
of symmetric responses to oil price innovations of typical magnitude, consistent with results by Kilian
and Vigfusson (2009) for U.S. real GDP. There is strong evidence of asymmetries at the disaggregate
level, however, especially for industries that are energy intensive in production (such as chemicals) or
that produce goods that are energy-intensive in use (such as transportation equipment). Our analysis
suggests that these asymmetries may be obscured in the aggregate data and highlights the importance
of developing multi-sector models of the transmission of oil price shocks.
Key Words : Asymmetry; oil price; net increase; shocks; industrial production; transmission.
JEL Classification: C32, E37, Q43.
∗We thank two referees, Colin Cameron, Oscar Jordà, Hiroyuki Kasahara, Lutz Kilian, Vadim Marmer, Elena Pesavento,
Zhongjun Qu, Shinichi Sakata, Mark Watson, and seminar participants at Boston University, University of British Columbia,
University of California-Davis, and the Federal Reserve Bank of Dallas for helpful comments and suggestions.†Department of Economics, Wayne State University, 2095 Faculty Administration Building, 656 W. Kirby, Detroit, MI
48202; e-mail: [email protected].‡Department of Economics, Wayne State University, 2136 Faculty Administration Building, 656 W. Kirby, Detroit, MI
48202; e-mail: [email protected].§Department of Economics, Wayne State University, 2103 Faculty Administration Building, 656 W. Kirby, Detroit, MI
48202; e-mail: [email protected]

1 Impulse response function based test
We compute the impulse response function based test in the following manner:
(i) We estimate the two equations in (5) by and keep the estimated coefficients, the standard
deviations, and the residuals from the two equations. Let us denote these by b1, b2, b1, b2, b1,and b2,respectively.
(ii) Given a history −1 − −1 − ≡ ∈ Ω, we generate two paths of
such that
1 = 1 [1 ] +
2 = 1 [1 ] + 1
where 1 is drawn from the empirical distribution of 1 (i.e., resampled from the residual b1 in (5a) and
equals two standard deviations, 2b1.(iii) The updated information sets, together with the censored variables, are given by I1 = 1 1
1#
1# and I2 = 1 2
2#
2# Given these two histories, two paths for are generated
as:
1 = 2I1 + 2
2 = 2I2 + 2
where 2 is drawn from the empirical distribution of 2. (Notice that the same value is used as 2 to
generate 1 and 2 ).
(iv) We generate new information sets Ω+11 = 1 1 −1 −+1 1 −1 −+1 and
Ω+12 = 1 2 −1 −+1 2 −1 −+1; the two paths for +1 are given by
1+1 = 1Ω+11 + 1+1
2+1 = 1Ω+12 + 1+12

We repeat this step and (iii) alternatively + 1 times.
(v) After repetitions of steps (ii)-(iv) we generate the conditional as
¡ Ω
¢=1
X=1
1 −1
X=1
2 for = 0 1
where ( Ω)
→ [+|Ω]− [+|Ω] as →∞ In our computation we set = 10001
(vi) The unconditional is generated by repeating (ii) to (v) for all possible Ω, = 1 : and then
taking the mean over all the histories:
( ) =1
X=1
¡ Ω
¢
(vii) The variance-covariance matrix for [ ( ) (−)] is computed as follows. First, given the
estimated parameters b1, b2, b1, b2, the residuals, and an arbitrary chosen history Ω, the system in (5)
is used to generate pseudo-series of the same length of our data. Second, for each of the newly generated
pseudo-series, ( ), we repeat steps (i) through (vi) to get the unconditional . Finally, for
unconditional , both for and − , the variance covariance matrix is computed. The matrix has a size
of 2 ( + 1)× 2 ( + 1).
(viii) Finally the test statistic of symmetry of positive and negative (and censored in the case of the net
oil price increase) is computed as
=³b´0 ³bΞ0´−1 ³b´ ∼ 2+1
1 = 100 is used when we compute the data mining robust critical values by simulation.
3

where
b2(+1)×1
=
⎡⎢⎢⎢⎢⎢⎢⎢⎢⎢⎢⎢⎢⎢⎢⎢⎢⎢⎢⎣
(0 )
...
( )
(0−)...
(−)
⎤⎥⎥⎥⎥⎥⎥⎥⎥⎥⎥⎥⎥⎥⎥⎥⎥⎥⎥⎦
; (+1)×2(+1)
=
⎡⎢⎢⎢⎢⎢⎢⎣1 0 1 0
.... . .
....... . .
...
0 1 0 1
⎤⎥⎥⎥⎥⎥⎥⎦ ;
Ξ2(+1)×2(+1)
=
∙³b − ´³b −
´0¸
and symmetry means that
( ) = − (−) for = 0 1 2
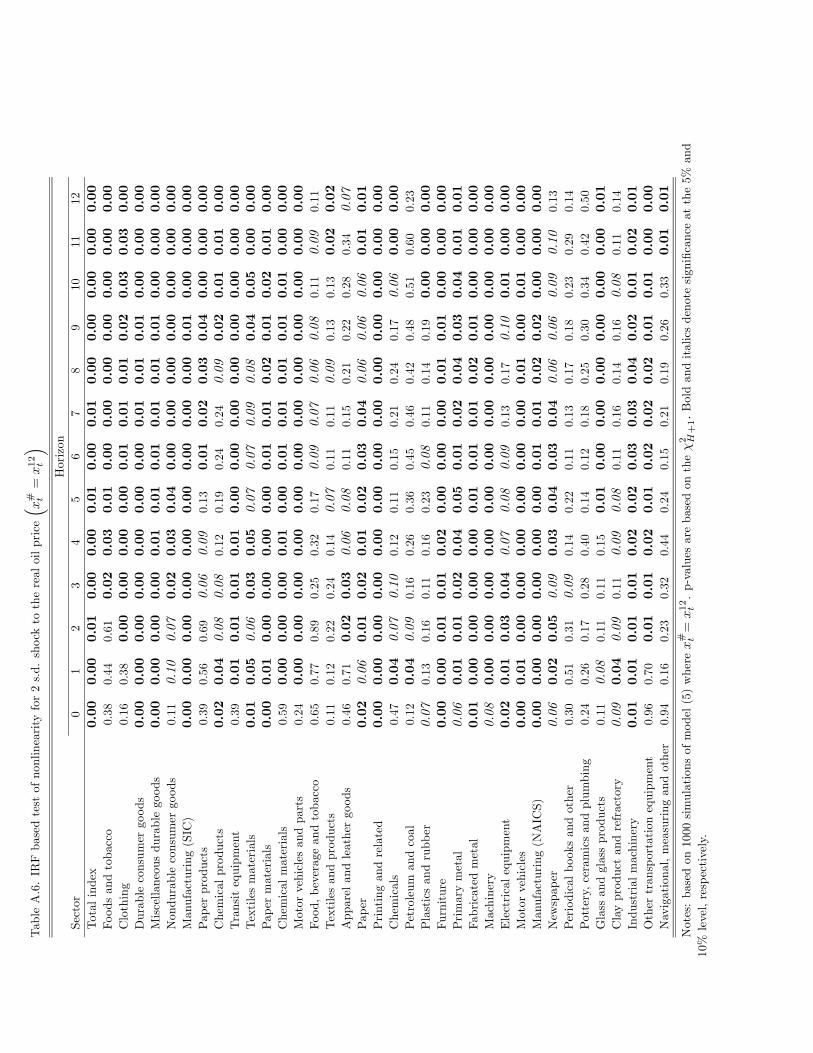
2 Additional Test Results
This section contains the results for the IRF based test for horizons = 0 1 ...,12. Tables A.2-A.7 and
A.8-A.15 contain the IRF based test results for the full sample for a real oil price shock and a nominal
oil price shock, respectively. Tables A.16-A.21 and A.22-A.29 contain the IRF based test results for the
1973:1-2009:9 subsample for a real oil price shock and a nominal oil price shock, respectively. Figures A.1a
to A.1e and A.2a to A.2e contain IRF Plots to a typical one-standard deviation and a large two-standard
deviation innovation to the real oil price, respectively.
4

Table A.1. Industry code and sample period
Sector Industry code Sample period
Total Industrial Production B50001 1947:1-2009:9
Foods and tobacco B51211 1947:1-2009:9
Clothing B51212 1947:1-2009:9
Durable consumer goods B51100 1947:1-2009:9
Miscellaneous durable goods B51123 1947:1-2009:9
Non durable consumer goods B51200 1947:1-2009:9
Manufacturing (SIC) B00004 1947:1-2009:9
Paper products B51214 1954:1-2009:9
Chemical products B51213 1954:1-2009:9
Transit equipment B52110 1954:1-2009:9
Textiles materials B53210 1967:1-2009:9
Paper materials B53220 1967:1-2009:9
Chemical materials B53230 1967:1-2009:9
Motor vehicles and parts G3361T3 1967:1-2009:9
Food, beverage and tobacco G311A2 1972:1-2009:9
Textiles and products G313A4 1972:1-2009:9
Apparel and leather goods G315A6 1972:1-2009:9
Paper G322 1972:1-2009:9
Printing and related G323 1972:1-2009:9
Chemicals G325 1972:1-2009:9
Petroleum and coal G324 1972:1-2009:9
Plastics and rubber G326 1972:1-2009:9
Furniture G337 1972:1-2009:9
Primary metal G331 1972:1-2009:9
Fabricated metal G332 1972:1-2009:9
Machinery G333 1972:1-2009:9
Electrical equipment G335 1972:1-2009:9
Motor vehicles G3361 1972:1-2009:9
Manufacturing (NAICS) GMF 1972:1-2009:9
Newspaper G51111 1986:1-2009:9
Periodical books and other G51112T9 1986:1-2009:9
Pottery, ceramics, and plumbing G32711 1986:1-2009:9
Glass and glass products G3272 1986:1-2009:9
Clay products and refractory G3271 1986:1-2009:9
Industrial machinery G3332 1986:1-2009:9
Other transportation equipment N3369 1986:1-2009:9
Navigational, measuring and other G3345 1986:1-2009:9
5

TableA.2IRFbasedtestofsymmetryto1s.d.shocktotherealoilprice(# =1 ) Horizon
Sector
01
23
45
67
89
10
11
12
Totalindex
0.10
0.06
0.11
0.08
0.11
0.11
0.04
0.06
0.02
0.01
0.02
0.03
0.04
Foodsandtobacco
0.29
0.14
0.23
0.34
0.20
0.03
0.04
0.06
0.07
0.07
0.11
0.13
0.16
Clothing
0.02
0.04
0.01
0.01
0.03
0.04
0.07
0.09
0.13
0.17
0.23
0.22
0.27
Durableconsumergoods
0.03
0.04
0.08
0.04
0.07
0.10
0.08
0.06
0.06
0.07
0.11
0.13
0.16
Miscellaneousdurablegoods
0.00
0.01
0.01
0.01
0.02
0.04
0.07
0.07
0.11
0.11
0.15
0.14
0.18
Nondurableconsumergoods
0.20
0.27
0.29
0.18
0.27
0.12
0.11
0.16
0.21
0.20
0.24
0.28
0.35
Manufacturing(SIC)
0.05
0.01
0.03
0.04
0.04
0.04
0.03
0.04
0.02
0.02
0.03
0.05
0.07
Paperproducts
0.21
0.30
0.06
0.01
0.02
0.03
0.05
0.01
0.02
0.03
0.06
0.07
0.10
Chemicalproducts
0.85
0.22
0.35
0.17
0.17
0.20
0.16
0.23
0.28
0.10
0.06
0.07
0.09
Transitequipment
0.42
0.04
0.01
0.01
0.01
0.03
0.03
0.03
0.03
0.03
0.05
0.06
0.08
Textilesmaterials
0.08
0.01
0.02
0.03
0.04
0.01
0.02
0.03
0.04
0.06
0.06
0.09
0.13
Papermaterials
0.08
0.03
0.06
0.11
0.11
0.16
0.21
0.25
0.33
0.41
0.38
0.30
0.23
Chemicalmaterials
0.71
0.00
0.01
0.01
0.02
0.01
0.02
0.02
0.04
0.04
0.06
0.05
0.07
Motorvehiclesandparts
0.68
0.01
0.03
0.00
0.00
0.00
0.00
0.00
0.01
0.00
0.01
0.00
0.00
Food,beverageandtobacco
0.47
0.16
0.28
0.33
0.33
0.14
0.14
0.21
0.28
0.35
0.41
0.50
0.57
Textilesandproducts
0.11
0.09
0.18
0.27
0.39
0.34
0.42
0.49
0.59
0.66
0.74
0.62
0.68
Apparelandleathergoods
0.03
0.08
0.13
0.23
0.31
0.23
0.32
0.25
0.31
0.40
0.49
0.56
0.62
Paper
0.11
0.02
0.04
0.08
0.11
0.14
0.16
0.22
0.30
0.33
0.40
0.44
0.48
Printingandrelated
0.01
0.03
0.04
0.08
0.11
0.12
0.11
0.15
0.19
0.24
0.31
0.23
0.29
Chemicals
0.69
0.00
0.00
0.00
0.00
0.00
0.00
0.00
0.01
0.01
0.01
0.01
0.02
Petroleumandcoal
0.26
0.17
0.27
0.41
0.55
0.66
0.75
0.83
0.88
0.92
0.94
0.94
0.96
Plasticsandrubber
0.03
0.07
0.12
0.14
0.23
0.32
0.39
0.47
0.51
0.60
0.55
0.22
0.09
Furniture
0.01
0.04
0.06
0.12
0.18
0.27
0.17
0.14
0.20
0.25
0.32
0.39
0.45
Primarymetal
0.32
0.19
0.30
0.40
0.47
0.54
0.61
0.70
0.70
0.78
0.84
0.87
0.83
Fabricatedmetal
0.09
0.04
0.08
0.08
0.13
0.21
0.29
0.38
0.47
0.56
0.65
0.61
0.68
Machinery
0.09
0.03
0.06
0.11
0.07
0.12
0.17
0.24
0.25
0.31
0.40
0.48
0.56
Electricalequipment
0.07
0.17
0.31
0.31
0.44
0.52
0.43
0.40
0.48
0.57
0.65
0.17
0.12
Motorvehicles
0.46
0.01
0.03
0.02
0.04
0.07
0.08
0.11
0.15
0.18
0.19
0.22
0.27
Manufacturing(NAICS)
0.06
0.00
0.01
0.02
0.03
0.03
0.02
0.04
0.06
0.06
0.09
0.09
0.12
Newspaper
0.96
0.27
0.35
0.36
0.26
0.34
0.17
0.21
0.26
0.34
0.40
0.48
0.55
Periodicalbooksandother
0.36
0.17
0.21
0.06
0.11
0.17
0.25
0.34
0.40
0.49
0.55
0.63
0.68
Pottery,ceramicsandplumbing
0.30
0.06
0.07
0.04
0.07
0.10
0.12
0.17
0.21
0.19
0.25
0.32
0.39
Glassandglassproducts
0.16
0.28
0.29
0.29
0.28
0.25
0.25
0.24
0.32
0.39
0.47
0.54
0.62
Clayproductandrefractory
0.76
0.32
0.20
0.18
0.25
0.31
0.42
0.52
0.60
0.67
0.75
0.82
0.85
Industrialmachinery
0.26
0.16
0.30
0.45
0.22
0.31
0.42
0.52
0.55
0.64
0.65
0.71
0.78
Othertransportationequipment
0.26
0.28
0.45
0.59
0.68
0.62
0.54
0.64
0.69
0.71
0.77
0.83
0.85
Navigational,measuringandother
0.11
0.27
0.43
0.13
0.18
0.14
0.20
0.26
0.20
0.26
0.34
0.41
0.48
Notes:basedon1000simulationsofmodel(5)where# =1 .p-valuesarebasedonthe2 +1Boldanditalicsdenotesignificanceatthe5%and
10%level,respectively.

TableA.3.IRFbasedtestofnonlinearityfor1s.d.shocktotherealoilprice
³ # =12
´Horizon
Sector
01
23
45
67
89
10
11
12
Totalindex
0.00
0.00
0.01
0.01
0.02
0.02
0.02
0.03
0.00
0.00
0.00
0.00
0.00
Foodsandtobacco
0.34
0.33
0.47
0.01
0.01
0.00
0.00
0.00
0.00
0.00
0.00
0.00
0.00
Clothing
0.16
0.36
0.00
0.01
0.01
0.01
0.02
0.04
0.04
0.06
0.07
0.09
0.01
Durableconsumergoods
0.00
0.00
0.00
0.00
0.00
0.00
0.00
0.01
0.00
0.00
0.00
0.00
0.00
Miscellaneousdurablegoods
0.00
0.00
0.00
0.01
0.01
0.02
0.03
0.05
0.06
0.08
0.01
0.00
0.01
Nondurableconsumergoods
0.11
0.07
0.04
0.02
0.02
0.03
0.01
0.02
0.00
0.00
0.00
0.00
0.00
Manufacturing(SIC)
0.00
0.00
0.00
0.01
0.01
0.01
0.01
0.02
0.01
0.02
0.01
0.00
0.01
Paperproducts
0.39
0.63
0.79
0.08
0.14
0.20
0.09
0.13
0.18
0.24
0.12
0.16
0.17
Chemicalproducts
0.02
0.03
0.05
0.02
0.04
0.07
0.11
0.12
0.07
0.08
0.06
0.08
0.10
Transitequipment
0.28
0.00
0.01
0.02
0.03
0.01
0.01
0.01
0.00
0.00
0.00
0.00
0.00
Textilesmaterials
0.04
0.11
0.19
0.21
0.31
0.38
0.47
0.55
0.62
0.53
0.61
0.43
0.44
Papermaterials
0.01
0.04
0.02
0.03
0.06
0.09
0.13
0.20
0.26
0.30
0.37
0.42
0.48
Chemicalmaterials
0.60
0.03
0.06
0.11
0.17
0.19
0.27
0.26
0.33
0.39
0.47
0.26
0.32
Motorvehiclesandparts
0.27
0.04
0.06
0.11
0.14
0.16
0.23
0.14
0.16
0.18
0.24
0.31
0.37
Food,beverageandtobacco
0.70
0.82
0.93
0.59
0.73
0.58
0.58
0.65
0.65
0.73
0.79
0.85
0.89
Textilesandproducts
0.18
0.28
0.46
0.58
0.60
0.41
0.52
0.60
0.66
0.73
0.79
0.74
0.78
Apparelandleathergoods
0.55
0.80
0.11
0.16
0.24
0.33
0.43
0.53
0.63
0.67
0.74
0.81
0.69
Paper
0.10
0.24
0.13
0.21
0.27
0.38
0.50
0.59
0.68
0.70
0.73
0.76
0.83
Printingandrelated
0.02
0.06
0.12
0.20
0.28
0.23
0.32
0.40
0.47
0.53
0.62
0.69
0.76
Chemicals
0.54
0.20
0.26
0.37
0.48
0.50
0.57
0.66
0.74
0.73
0.69
0.68
0.75
Petroleumandcoal
0.18
0.14
0.27
0.42
0.56
0.66
0.75
0.79
0.80
0.86
0.88
0.92
0.88
Plasticsandrubber
0.20
0.37
0.49
0.58
0.64
0.76
0.74
0.82
0.84
0.89
0.51
0.59
0.67
Furniture
0.02
0.06
0.12
0.17
0.26
0.26
0.35
0.40
0.49
0.52
0.55
0.60
0.65
Primarymetal
0.11
0.04
0.09
0.17
0.26
0.35
0.34
0.44
0.53
0.52
0.61
0.66
0.73
Fabricatedmetal
0.06
0.04
0.08
0.15
0.23
0.33
0.43
0.53
0.59
0.56
0.52
0.60
0.68
Machinery
0.16
0.06
0.09
0.16
0.25
0.31
0.39
0.37
0.39
0.42
0.50
0.59
0.64
Electricalequipment
0.08
0.15
0.29
0.34
0.46
0.57
0.62
0.72
0.79
0.75
0.56
0.49
0.57
Motorvehicles
0.04
0.04
0.09
0.16
0.24
0.32
0.39
0.42
0.52
0.61
0.69
0.76
0.73
Manufacturing(NAICS)
0.07
0.08
0.11
0.20
0.30
0.40
0.51
0.62
0.70
0.77
0.75
0.81
0.87
Newspaper
0.14
0.21
0.29
0.42
0.41
0.53
0.50
0.61
0.69
0.75
0.82
0.84
0.89
Periodicalbooksandother
0.41
0.69
0.68
0.66
0.74
0.84
0.80
0.87
0.91
0.94
0.96
0.98
0.98
Pottery,ceramicsandplumbing
0.37
0.59
0.59
0.74
0.84
0.72
0.70
0.76
0.83
0.88
0.88
0.92
0.95
Glassandglassproducts
0.24
0.38
0.57
0.69
0.81
0.71
0.79
0.64
0.73
0.79
0.72
0.79
0.85
Clayproductandrefractory
0.17
0.27
0.45
0.51
0.52
0.51
0.62
0.71
0.77
0.84
0.83
0.87
0.91
Industrialmachinery
0.04
0.12
0.22
0.35
0.49
0.46
0.58
0.63
0.72
0.69
0.61
0.60
0.67
Othertransportationequipment
0.96
0.77
0.18
0.23
0.29
0.39
0.50
0.59
0.69
0.67
0.72
0.79
0.84
Navigational,measuringandother
0.91
0.35
0.52
0.67
0.78
0.69
0.76
0.81
0.86
0.90
0.93
0.84
0.82
Notes:basedon1000simulationsofmodel(5)where# =12.p-valuesarebasedonthe2 +1Boldanditalicsdenotesignificanceatthe5%and
10%level,respectively.

TableA.4.IRFbasedtestofnonlinearityfor1s.d.shocktotherealoilprice
³ # =36
´Horizon
Sector
01
23
45
67
89
10
11
12
Totalindex
0.55
0.14
0.01
0.01
0.02
0.04
0.06
0.08
0.12
0.13
0.10
0.01
0.00
Foodsandtobacco
0.51
0.77
0.36
0.22
0.07
0.11
0.11
0.02
0.01
0.02
0.03
0.01
0.01
Clothing
0.66
0.79
0.86
0.85
0.92
0.96
0.96
0.98
0.81
0.87
0.91
0.94
0.75
Durableconsumergoods
0.44
0.09
0.01
0.02
0.03
0.05
0.06
0.08
0.09
0.06
0.08
0.02
0.01
Miscellaneousdurablegoods
0.32
0.08
0.01
0.02
0.04
0.06
0.09
0.12
0.17
0.21
0.14
0.03
0.03
Nondurableconsumergoods
0.93
0.35
0.05
0.02
0.04
0.07
0.11
0.11
0.15
0.19
0.25
0.13
0.06
Manufacturing(SIC)
0.47
0.09
0.00
0.01
0.02
0.03
0.05
0.07
0.11
0.15
0.15
0.02
0.00
Paperproducts
0.95
0.87
0.55
0.56
0.55
0.66
0.70
0.37
0.45
0.54
0.62
0.06
0.09
Chemicalproducts
0.60
0.26
0.36
0.08
0.03
0.06
0.09
0.13
0.19
0.25
0.26
0.16
0.20
Transitequipment
0.60
0.73
0.01
0.03
0.06
0.06
0.03
0.04
0.02
0.01
0.00
0.00
0.00
Textilesmaterials
0.05
0.11
0.21
0.21
0.29
0.34
0.42
0.50
0.59
0.43
0.51
0.49
0.53
Papermaterials
0.15
0.34
0.21
0.33
0.28
0.39
0.50
0.58
0.68
0.75
0.82
0.67
0.66
Chemicalmaterials
0.92
0.15
0.28
0.29
0.40
0.25
0.35
0.45
0.52
0.60
0.66
0.51
0.49
Motorvehiclesandparts
0.64
0.05
0.08
0.15
0.22
0.21
0.29
0.33
0.41
0.51
0.59
0.59
0.66
Food,beverageandtobacco
0.37
0.07
0.14
0.24
0.30
0.24
0.12
0.15
0.19
0.25
0.33
0.38
0.41
Textilesandproducts
0.88
0.11
0.20
0.31
0.39
0.39
0.49
0.59
0.68
0.75
0.80
0.83
0.88
Apparelandleathergoods
0.91
0.44
0.55
0.31
0.33
0.43
0.53
0.33
0.42
0.44
0.50
0.56
0.44
Paper
0.17
0.26
0.17
0.16
0.24
0.32
0.40
0.47
0.55
0.64
0.71
0.75
0.78
Printingandrelated
0.11
0.22
0.32
0.45
0.54
0.54
0.64
0.69
0.66
0.73
0.80
0.78
0.83
Chemicals
0.32
0.03
0.02
0.02
0.03
0.06
0.08
0.12
0.17
0.15
0.20
0.26
0.31
Petroleumandcoal
0.03
0.07
0.15
0.02
0.03
0.04
0.06
0.09
0.12
0.16
0.21
0.28
0.35
Plasticsandrubber
0.70
0.26
0.33
0.43
0.55
0.63
0.26
0.25
0.26
0.30
0.38
0.43
0.30
Furniture
0.07
0.18
0.31
0.44
0.55
0.26
0.35
0.32
0.33
0.38
0.42
0.46
0.54
Primarymetal
0.07
0.18
0.31
0.44
0.55
0.26
0.35
0.32
0.33
0.38
0.42
0.46
0.54
Fabricatedmetal
0.11
0.05
0.05
0.09
0.15
0.23
0.33
0.43
0.53
0.61
0.50
0.53
0.57
Machinery
0.11
0.06
0.08
0.15
0.23
0.19
0.22
0.25
0.26
0.32
0.36
0.42
0.47
Electricalequipment
0.25
0.35
0.56
0.65
0.78
0.87
0.78
0.84
0.87
0.91
0.74
0.80
0.81
Motorvehicles
0.99
0.04
0.07
0.12
0.20
0.25
0.33
0.42
0.51
0.54
0.61
0.67
0.75
Manufacturing(NAICS)
0.60
0.07
0.11
0.18
0.27
0.36
0.33
0.42
0.51
0.61
0.66
0.74
0.62
Newspaper
0.12
0.13
0.18
0.14
0.21
0.24
0.34
0.43
0.53
0.62
0.71
0.78
0.80
Periodicalbooksandother
0.62
0.16
0.30
0.45
0.53
0.65
0.45
0.48
0.54
0.61
0.70
0.75
0.81
Pottery,ceramicsandplumbing
0.65
0.72
0.88
0.96
0.98
0.90
0.83
0.89
0.92
0.95
0.97
0.98
0.99
Glassandglassproducts
0.46
0.75
0.89
0.92
0.93
0.96
0.93
0.95
0.97
0.90
0.93
0.96
0.98
Clayproductandrefractory
0.61
0.36
0.55
0.67
0.75
0.81
0.80
0.86
0.91
0.93
0.93
0.95
0.96
Industrialmachinery
0.12
0.30
0.48
0.63
0.63
0.56
0.51
0.62
0.71
0.77
0.68
0.71
0.70
Othertransportationequipment
0.41
0.58
0.39
0.47
0.47
0.60
0.68
0.72
0.81
0.86
0.89
0.91
0.94
Navigational,measuringandother
0.72
0.25
0.18
0.25
0.21
0.29
0.35
0.40
0.49
0.46
0.52
0.60
0.63
Notes:basedon1000simulationsofmodel(5)where# =36.p-valuesarebasedonthe2 +1Boldanditalicsdenotesignificanceatthe5%and
10%level,respectively.

TableA.5.IRFbasedtestofsymmetryfor2s.d.shocktotherealoilprice
³ # =1
´Horizon
Sector
01
23
45
67
89
10
11
12
Totalindex
0.15
0.10
0.20
0.11
0.17
0.14
0.06
0.07
0.01
0.01
0.01
0.01
0.01
Foodsandtobacco
0.34
0.21
0.35
0.47
0.35
0.04
0.06
0.06
0.07
0.05
0.07
0.09
0.10
Clothing
0.02
0.05
0.00
0.01
0.02
0.03
0.04
0.04
0.06
0.09
0.11
0.10
0.13
Durableconsumergoods
0.04
0.04
0.08
0.03
0.06
0.09
0.06
0.02
0.03
0.03
0.04
0.05
0.06
Miscellaneousdurablegoods
0.01
0.02
0.02
0.02
0.05
0.07
0.11
0.11
0.14
0.14
0.19
0.16
0.20
Nondurableconsumergoods
0.24
0.35
0.42
0.26
0.37
0.17
0.15
0.22
0.29
0.24
0.26
0.27
0.34
Manufacturing(SIC)
0.07
0.02
0.05
0.04
0.06
0.05
0.04
0.04
0.01
0.01
0.02
0.03
0.04
Paperproducts
0.27
0.38
0.06
0.00
0.01
0.02
0.03
0.00
0.00
0.01
0.01
0.01
0.01
Chemicalproducts
0.86
0.26
0.43
0.23
0.25
0.28
0.20
0.28
0.34
0.11
0.04
0.03
0.04
Transitequipment
0.47
0.08
0.02
0.00
0.01
0.02
0.01
0.01
0.00
0.00
0.00
0.00
0.00
Textilesmaterials
0.10
0.01
0.03
0.03
0.03
0.00
0.01
0.01
0.02
0.02
0.02
0.03
0.05
Papermaterials
0.09
0.02
0.04
0.09
0.07
0.11
0.12
0.13
0.19
0.25
0.22
0.12
0.03
Chemicalmaterials
0.72
0.00
0.00
0.00
0.00
0.00
0.00
0.00
0.01
0.01
0.01
0.00
0.00
Motorvehiclesandparts
0.71
0.00
0.01
0.00
0.00
0.00
0.00
0.00
0.00
0.00
0.00
0.00
0.00
Food,beverageandtobacco
0.49
0.17
0.28
0.34
0.35
0.09
0.07
0.08
0.11
0.15
0.17
0.23
0.29
Textilesandproducts
0.12
0.09
0.16
0.21
0.32
0.22
0.27
0.33
0.42
0.49
0.58
0.29
0.35
Apparelandleathergoods
0.02
0.06
0.06
0.12
0.16
0.05
0.08
0.02
0.02
0.03
0.06
0.08
0.10
Paper
0.11
0.01
0.02
0.05
0.06
0.08
0.08
0.11
0.15
0.15
0.16
0.12
0.11
Printingandrelated
0.00
0.01
0.01
0.01
0.01
0.01
0.01
0.01
0.02
0.02
0.04
0.02
0.02
Chemicals
0.72
0.00
0.00
0.00
0.00
0.00
0.00
0.00
0.00
0.00
0.00
0.00
0.00
Petroleumandcoal
0.30
0.19
0.31
0.46
0.60
0.69
0.77
0.84
0.88
0.92
0.94
0.94
0.96
Plasticsandrubber
0.03
0.07
0.09
0.10
0.16
0.24
0.26
0.32
0.37
0.46
0.32
0.01
0.00
Furniture
0.01
0.02
0.04
0.08
0.12
0.19
0.04
0.03
0.06
0.07
0.11
0.12
0.08
Primarymetal
0.36
0.20
0.28
0.34
0.41
0.45
0.51
0.61
0.55
0.64
0.70
0.74
0.69
Fabricatedmetal
0.11
0.04
0.06
0.04
0.08
0.12
0.18
0.24
0.31
0.40
0.48
0.33
0.40
Machinery
0.09
0.02
0.04
0.06
0.01
0.03
0.05
0.07
0.07
0.11
0.15
0.19
0.25
Electricalequipment
0.08
0.18
0.32
0.28
0.40
0.47
0.32
0.30
0.37
0.44
0.53
0.01
0.01
Motorvehicles
0.46
0.01
0.01
0.00
0.01
0.01
0.01
0.01
0.02
0.01
0.01
0.01
0.01
Manufacturing(NAICS)
0.05
0.00
0.00
0.01
0.01
0.00
0.00
0.00
0.00
0.00
0.01
0.01
0.01
Newspaper
0.96
0.24
0.26
0.21
0.09
0.13
0.00
0.00
0.00
0.00
0.00
0.00
0.00
Periodicalbooksandother
0.32
0.09
0.12
0.00
0.00
0.00
0.00
0.01
0.01
0.02
0.01
0.02
0.03
Pottery,ceramicsandplumbing
0.28
0.03
0.01
0.00
0.00
0.00
0.00
0.00
0.00
0.00
0.00
0.00
0.00
Glassandglassproducts
0.12
0.19
0.11
0.03
0.00
0.00
0.00
0.00
0.00
0.00
0.00
0.00
0.00
Clayproductandrefractory
0.75
0.24
0.06
0.02
0.03
0.04
0.07
0.11
0.12
0.17
0.22
0.27
0.27
Industrialmachinery
0.25
0.10
0.20
0.32
0.02
0.02
0.03
0.05
0.03
0.04
0.02
0.03
0.04
Othertransportationequipment
0.22
0.17
0.29
0.33
0.44
0.22
0.16
0.22
0.25
0.24
0.18
0.23
0.25
Navigational,measuringandother
0.10
0.25
0.40
0.06
0.07
0.03
0.04
0.06
0.02
0.02
0.03
0.04
0.04
Notes:basedon1000simulationsofmodel(5)where# =1 .p-valuesarebasedonthe2 +1.Boldanditalicsdenotesignificanceatthe5%and
10%level,respectively.
TableA.6.IRFbasedtestofnonlinearityfor2s.d.shocktotherealoilprice
³ # =12
´Horizon
Sector
01
23
45
67
89
10
11
12
Totalindex
0.00
0.00
0.01
0.00
0.00
0.01
0.00
0.01
0.00
0.00
0.00
0.00
0.00
Foodsandtobacco
0.38
0.44
0.61
0.02
0.03
0.01
0.00
0.00
0.00
0.00
0.00
0.00
0.00
Clothing
0.16
0.38
0.00
0.00
0.00
0.00
0.01
0.01
0.01
0.02
0.03
0.03
0.00
Durableconsumergoods
0.00
0.00
0.00
0.00
0.00
0.00
0.00
0.01
0.01
0.01
0.00
0.00
0.00
Miscellaneousdurablegoods
0.00
0.00
0.00
0.00
0.01
0.01
0.01
0.01
0.01
0.01
0.00
0.00
0.00
Nondurableconsumergoods
0.11
0.10
0.07
0.02
0.03
0.04
0.00
0.00
0.00
0.00
0.00
0.00
0.00
Manufacturing(SIC)
0.00
0.00
0.00
0.00
0.00
0.00
0.00
0.00
0.00
0.01
0.00
0.00
0.00
Paperproducts
0.39
0.56
0.69
0.06
0.09
0.13
0.01
0.02
0.03
0.04
0.00
0.00
0.00
Chemicalproducts
0.02
0.04
0.08
0.08
0.12
0.19
0.24
0.24
0.09
0.02
0.01
0.01
0.00
Transitequipment
0.39
0.01
0.01
0.01
0.01
0.00
0.00
0.00
0.00
0.00
0.00
0.00
0.00
Textilesmaterials
0.01
0.05
0.06
0.03
0.05
0.07
0.07
0.09
0.08
0.04
0.05
0.00
0.00
Papermaterials
0.00
0.01
0.00
0.00
0.00
0.00
0.01
0.01
0.02
0.01
0.02
0.01
0.00
Chemicalmaterials
0.59
0.00
0.00
0.00
0.01
0.00
0.01
0.01
0.01
0.01
0.01
0.00
0.00
Motorvehiclesandparts
0.24
0.00
0.00
0.00
0.00
0.00
0.00
0.00
0.00
0.00
0.00
0.00
0.00
Food,beverageandtobacco
0.65
0.77
0.89
0.25
0.32
0.17
0.09
0.07
0.06
0.08
0.11
0.09
0.11
Textilesandproducts
0.11
0.12
0.22
0.24
0.14
0.07
0.11
0.11
0.09
0.13
0.13
0.02
0.02
Apparelandleathergoods
0.46
0.71
0.02
0.03
0.06
0.08
0.11
0.15
0.21
0.22
0.28
0.34
0.07
Paper
0.02
0.06
0.01
0.02
0.01
0.02
0.03
0.04
0.06
0.06
0.06
0.01
0.01
Printingandrelated
0.00
0.00
0.00
0.00
0.00
0.00
0.00
0.00
0.00
0.00
0.00
0.00
0.00
Chemicals
0.47
0.04
0.07
0.10
0.12
0.11
0.15
0.21
0.24
0.17
0.06
0.00
0.00
Petroleumandcoal
0.12
0.04
0.09
0.16
0.26
0.36
0.45
0.46
0.42
0.48
0.51
0.60
0.23
Plasticsandrubber
0.07
0.13
0.16
0.11
0.16
0.23
0.08
0.11
0.14
0.19
0.00
0.00
0.00
Furniture
0.00
0.00
0.01
0.01
0.02
0.00
0.00
0.00
0.01
0.01
0.00
0.00
0.00
Primarymetal
0.06
0.01
0.01
0.02
0.04
0.05
0.01
0.02
0.04
0.03
0.04
0.01
0.01
Fabricatedmetal
0.01
0.00
0.00
0.00
0.00
0.01
0.01
0.01
0.02
0.01
0.00
0.00
0.00
Machinery
0.08
0.00
0.00
0.00
0.00
0.00
0.00
0.00
0.00
0.00
0.00
0.00
0.00
Electricalequipment
0.02
0.01
0.03
0.04
0.07
0.08
0.09
0.13
0.17
0.10
0.01
0.00
0.00
Motorvehicles
0.00
0.01
0.00
0.00
0.00
0.00
0.00
0.00
0.01
0.00
0.01
0.00
0.00
Manufacturing(NAICS)
0.00
0.00
0.00
0.00
0.00
0.00
0.01
0.01
0.02
0.02
0.00
0.00
0.00
Newspaper
0.06
0.02
0.05
0.09
0.03
0.04
0.03
0.04
0.06
0.06
0.09
0.10
0.13
Periodicalbooksandother
0.30
0.51
0.31
0.09
0.14
0.22
0.11
0.13
0.17
0.18
0.23
0.29
0.14
Pottery,ceramicsandplumbing
0.24
0.26
0.17
0.28
0.40
0.14
0.12
0.18
0.25
0.30
0.34
0.42
0.50
Glassandglassproducts
0.11
0.08
0.11
0.11
0.15
0.01
0.00
0.00
0.00
0.00
0.00
0.00
0.01
Clayproductandrefractory
0.09
0.04
0.09
0.11
0.09
0.08
0.11
0.16
0.14
0.16
0.08
0.11
0.14
Industrialmachinery
0.01
0.01
0.01
0.01
0.02
0.02
0.03
0.03
0.04
0.02
0.01
0.02
0.01
Othertransportationequipment
0.96
0.70
0.01
0.01
0.02
0.01
0.02
0.02
0.02
0.01
0.01
0.00
0.00
Navigational,measuringandother
0.94
0.16
0.23
0.32
0.44
0.24
0.15
0.21
0.19
0.26
0.33
0.01
0.01
Notes:basedon1000simulationsofmodel(5)where# =12.p-valuesarebasedonthe2 +1Boldanditalicsdenotesignificanceatthe5%and
10%level,respectively.

TableA.7.IRFbasedtestofnonlinearityfor2s.d.shocktotherealoilprice(# =36)
Horizon
Sector
01
23
45
67
89
10
11
12
Totalindex
0.20
0.01
0.01
0.02
0.04
0.06
0.04
0.06
0.06
0.09
0.00
0.00
0.00
Foodsandtobacco
0.17
0.03
0.07
0.00
0.01
0.00
0.00
0.00
0.00
0.00
0.00
0.00
0.00
Clothing
0.35
0.64
0.35
0.50
0.64
0.76
0.72
0.56
0.60
0.65
0.73
0.77
0.38
Durableconsumergoods
0.12
0.01
0.01
0.02
0.03
0.03
0.06
0.08
0.11
0.13
0.07
0.00
0.00
Miscellaneousdurablegoods
0.03
0.00
0.01
0.02
0.03
0.04
0.07
0.08
0.08
0.09
0.01
0.00
0.00
Nondurableconsumergoods
0.86
0.03
0.03
0.01
0.01
0.01
0.00
0.01
0.01
0.02
0.00
0.00
0.00
Manufacturing(SIC)
0.11
0.00
0.01
0.02
0.03
0.06
0.04
0.06
0.07
0.11
0.00
0.00
0.00
Paperproducts
0.79
0.41
0.51
0.44
0.50
0.53
0.13
0.13
0.19
0.23
0.01
0.01
0.01
Chemicalproducts
0.08
0.06
0.11
0.03
0.05
0.07
0.08
0.09
0.13
0.09
0.05
0.07
0.04
Transitequipment
0.07
0.01
0.03
0.06
0.07
0.01
0.03
0.03
0.02
0.01
0.01
0.00
0.00
Textilesmaterials
0.04
0.13
0.20
0.14
0.17
0.23
0.21
0.26
0.30
0.13
0.18
0.07
0.03
Papermaterials
0.15
0.28
0.13
0.21
0.22
0.30
0.38
0.41
0.51
0.57
0.53
0.17
0.14
Chemicalmaterials
0.91
0.10
0.15
0.03
0.05
0.04
0.05
0.07
0.10
0.12
0.11
0.00
0.00
Motorvehiclesandparts
0.66
0.01
0.02
0.04
0.07
0.02
0.03
0.05
0.06
0.08
0.11
0.12
0.12
Food,beverageandtobacco
0.38
0.06
0.13
0.19
0.21
0.17
0.06
0.05
0.07
0.11
0.14
0.16
0.21
Textilesandproducts
0.89
0.07
0.14
0.20
0.26
0.24
0.33
0.42
0.49
0.56
0.61
0.54
0.47
Apparelandleathergoods
0.96
0.46
0.55
0.33
0.30
0.31
0.39
0.30
0.39
0.37
0.45
0.53
0.45
Paper
0.16
0.33
0.20
0.27
0.35
0.47
0.41
0.39
0.40
0.40
0.47
0.46
0.53
Printingandrelated
0.07
0.11
0.09
0.11
0.09
0.15
0.20
0.28
0.23
0.31
0.38
0.44
0.46
Chemicals
0.35
0.01
0.02
0.01
0.02
0.03
0.04
0.06
0.06
0.08
0.09
0.09
0.12
Petroleumandcoal
0.02
0.08
0.16
0.02
0.04
0.07
0.11
0.16
0.18
0.23
0.27
0.23
0.20
Plasticsandrubber
0.71
0.27
0.29
0.27
0.38
0.44
0.02
0.03
0.05
0.07
0.05
0.07
0.10
Furniture
0.06
0.16
0.29
0.39
0.49
0.10
0.13
0.19
0.25
0.31
0.18
0.22
0.17
Primarymetal
0.03
0.10
0.18
0.14
0.22
0.23
0.15
0.21
0.21
0.18
0.24
0.23
0.27
Fabricatedmetal
0.10
0.01
0.02
0.06
0.08
0.09
0.13
0.18
0.25
0.33
0.18
0.20
0.21
Machinery
0.07
0.01
0.02
0.02
0.03
0.04
0.06
0.06
0.07
0.09
0.08
0.10
0.11
Electricalequipment
0.23
0.29
0.46
0.52
0.64
0.71
0.44
0.55
0.64
0.71
0.42
0.38
0.45
Motorvehicles
0.99
0.02
0.02
0.04
0.07
0.05
0.06
0.07
0.10
0.12
0.17
0.18
0.17
Manufacturing(NAICS)
0.59
0.01
0.03
0.03
0.06
0.09
0.03
0.06
0.08
0.12
0.14
0.10
0.13
Newspaper
0.11
0.01
0.03
0.05
0.02
0.03
0.04
0.06
0.09
0.11
0.14
0.19
0.24
Periodicalbooksandother
0.61
0.07
0.09
0.16
0.25
0.34
0.21
0.28
0.35
0.44
0.52
0.54
0.60
Pottery,ceramicsandplumbing
0.60
0.76
0.90
0.97
0.98
0.76
0.83
0.89
0.93
0.95
0.96
0.98
0.99
Glassandglassproducts
0.41
0.63
0.77
0.79
0.74
0.74
0.43
0.53
0.57
0.59
0.65
0.67
0.72
Clayproductandrefractory
0.59
0.19
0.30
0.39
0.51
0.63
0.69
0.67
0.67
0.69
0.75
0.81
0.85
Industrialmachinery
0.10
0.14
0.17
0.26
0.28
0.35
0.39
0.44
0.46
0.55
0.35
0.35
0.36
Othertransportationequipment
0.38
0.62
0.16
0.28
0.30
0.28
0.38
0.48
0.56
0.64
0.70
0.75
0.81
Navigational,measuringandother
0.71
0.19
0.27
0.42
0.28
0.22
0.11
0.16
0.21
0.19
0.16
0.21
0.26
Notes:basedon1000simulationsofmodel(5)where# =36.p-valuesarebasedonthe2 +1Boldanditalicsdenotesignificanceatthe5%and
10%level,respectively.

TableA.8.IRFbasedtestofsymmetryto1s.d.shocktothenominaloilprice(# =1 )
Horizon
Sector
01
23
45
67
89
10
11
12
Totalindex
0.13
0.05
0.11
0.08
0.11
0.09
0.04
0.06
0.01
0.01
0.02
0.03
0.04
Foodsandtobacco
0.30
0.15
0.25
0.37
0.24
0.05
0.06
0.07
0.11
0.10
0.13
0.17
0.20
Clothing
0.02
0.05
0.01
0.01
0.03
0.04
0.07
0.09
0.13
0.17
0.23
0.18
0.21
Durableconsumergoods
0.04
0.04
0.07
0.03
0.06
0.11
0.09
0.07
0.08
0.10
0.13
0.17
0.21
Miscellaneousdurablegoods
0.00
0.01
0.01
0.02
0.03
0.06
0.09
0.10
0.14
0.14
0.20
0.18
0.23
Nondurableconsumergoods
0.19
0.25
0.26
0.19
0.29
0.16
0.11
0.16
0.21
0.18
0.22
0.25
0.32
Manufacturing(SIC)
0.07
0.01
0.03
0.04
0.03
0.03
0.03
0.04
0.02
0.02
0.03
0.04
0.07
Paperproducts
0.27
0.38
0.05
0.01
0.02
0.03
0.06
0.01
0.02
0.04
0.06
0.08
0.11
Chemicalproducts
0.79
0.22
0.35
0.21
0.22
0.24
0.21
0.29
0.33
0.11
0.07
0.08
0.11
Transitequipment
0.46
0.07
0.03
0.01
0.02
0.04
0.06
0.05
0.04
0.04
0.06
0.08
0.10
Textilesmaterials
0.09
0.01
0.03
0.04
0.05
0.01
0.03
0.04
0.05
0.07
0.08
0.11
0.15
Papermaterials
0.14
0.03
0.06
0.12
0.12
0.18
0.24
0.31
0.39
0.47
0.40
0.30
0.23
Chemicalmaterials
0.77
0.00
0.00
0.01
0.01
0.02
0.03
0.03
0.04
0.04
0.06
0.06
0.08
Motorvehiclesandparts
0.66
0.01
0.03
0.00
0.00
0.00
0.00
0.00
0.01
0.00
0.01
0.00
0.00
Food,beverageandtobacco
0.47
0.17
0.29
0.33
0.32
0.16
0.16
0.23
0.31
0.37
0.44
0.53
0.61
Textilesandproducts
0.11
0.08
0.17
0.25
0.38
0.36
0.43
0.48
0.57
0.64
0.73
0.61
0.67
Apparelandleathergoods
0.04
0.11
0.16
0.27
0.37
0.27
0.37
0.29
0.36
0.45
0.54
0.62
0.68
Paper
0.17
0.02
0.04
0.08
0.11
0.15
0.18
0.25
0.34
0.36
0.43
0.46
0.49
Printingandrelated
0.01
0.03
0.05
0.08
0.12
0.14
0.13
0.17
0.21
0.25
0.32
0.26
0.33
Chemicals
0.74
0.00
0.00
0.00
0.00
0.00
0.00
0.01
0.01
0.01
0.01
0.02
0.02
Petroleumandcoal
0.21
0.15
0.24
0.37
0.51
0.62
0.72
0.81
0.86
0.90
0.92
0.93
0.94
Plasticsandrubber
0.04
0.07
0.12
0.17
0.26
0.36
0.44
0.53
0.56
0.63
0.57
0.25
0.14
Furniture
0.01
0.03
0.06
0.12
0.19
0.28
0.22
0.20
0.27
0.32
0.40
0.46
0.53
Primarymetal
0.39
0.16
0.27
0.37
0.42
0.50
0.58
0.67
0.65
0.74
0.81
0.84
0.84
Fabricatedmetal
0.08
0.03
0.07
0.08
0.13
0.21
0.29
0.38
0.47
0.57
0.65
0.62
0.69
Machinery
0.12
0.03
0.07
0.12
0.08
0.13
0.19
0.26
0.28
0.36
0.45
0.53
0.62
Electricalequipment
0.07
0.17
0.31
0.35
0.47
0.55
0.49
0.47
0.57
0.65
0.73
0.23
0.17
Motorvehicles
0.44
0.01
0.03
0.02
0.03
0.06
0.07
0.11
0.15
0.19
0.22
0.26
0.31
Manufacturing(NAICS)
0.06
0.00
0.01
0.02
0.03
0.03
0.03
0.04
0.07
0.07
0.09
0.10
0.13
Newspaper
0.95
0.28
0.36
0.35
0.25
0.34
0.17
0.21
0.27
0.35
0.39
0.47
0.54
Periodicalbooksandother
0.41
0.19
0.23
0.06
0.11
0.18
0.26
0.35
0.42
0.51
0.56
0.65
0.69
Pottery,ceramicsandplumbing
0.29
0.05
0.06
0.03
0.06
0.09
0.11
0.16
0.20
0.18
0.23
0.30
0.37
Glassandglassproducts
0.17
0.29
0.30
0.29
0.28
0.24
0.24
0.24
0.32
0.40
0.47
0.54
0.62
Clayproductandrefractory
0.67
0.28
0.19
0.16
0.22
0.28
0.38
0.49
0.57
0.63
0.71
0.78
0.83
Industrialmachinery
0.32
0.16
0.31
0.46
0.23
0.32
0.42
0.53
0.55
0.65
0.64
0.71
0.77
Othertransportationequipment
0.29
0.32
0.47
0.61
0.71
0.65
0.58
0.69
0.73
0.75
0.81
0.86
0.87
Navigational,measuringandother
0.11
0.26
0.41
0.12
0.17
0.16
0.23
0.30
0.23
0.29
0.37
0.44
0.52
Notes:basedon1000simulationsofmodel(5)where# =1 .p-valuesarebasedonthe2 +1Boldanditalicsdenotesignificanceatthe5%and
10%level,respectively.

TableA.9.IRFbasedtestofnonlinearityfor1s.d.shocktothenominaloilprice
³ # =12
´Horizon
Sector
01
23
45
67
89
10
11
12
Totalindex
0.00
0.00
0.00
0.00
0.00
0.00
0.00
0.00
0.00
0.00
0.00
0.00
0.00
Foodsandtobacco
0.19
0.23
0.40
0.00
0.00
0.00
0.00
0.00
0.00
0.00
0.00
0.00
0.00
Clothing
0.18
0.36
0.00
0.00
0.00
0.00
0.00
0.00
0.00
0.00
0.00
0.00
0.00
Durableconsumergoods
0.00
0.00
0.00
0.00
0.00
0.00
0.00
0.00
0.00
0.00
0.00
0.00
0.00
Miscellaneousdurablegoods
0.00
0.00
0.00
0.00
0.00
0.00
0.00
0.00
0.00
0.00
0.00
0.00
0.00
Nondurableconsumergoods
0.05
0.05
0.03
0.00
0.00
0.00
0.00
0.00
0.00
0.00
0.00
0.00
0.00
Manufacturing(SIC)
0.00
0.00
0.00
0.00
0.00
0.00
0.00
0.00
0.00
0.00
0.00
0.00
0.00
Paperproducts
0.58
0.11
0.20
0.00
0.00
0.00
0.00
0.00
0.00
0.00
0.00
0.00
0.00
Chemicalproducts
0.00
0.01
0.03
0.01
0.02
0.04
0.07
0.11
0.13
0.08
0.03
0.04
0.06
Transitequipment
0.33
0.00
0.00
0.00
0.00
0.00
0.00
0.00
0.00
0.00
0.00
0.00
0.00
Textilesmaterials
0.00
0.01
0.02
0.01
0.01
0.01
0.01
0.01
0.01
0.02
0.02
0.01
0.02
Papermaterials
0.00
0.01
0.00
0.00
0.00
0.00
0.00
0.01
0.01
0.01
0.01
0.01
0.01
Chemicalmaterials
0.15
0.01
0.00
0.00
0.01
0.01
0.01
0.01
0.02
0.02
0.03
0.02
0.02
Motorvehiclesandparts
0.06
0.01
0.02
0.05
0.04
0.03
0.05
0.02
0.02
0.02
0.03
0.05
0.04
Food,beverageandtobacco
0.61
0.60
0.75
0.53
0.67
0.30
0.24
0.27
0.15
0.20
0.26
0.33
0.40
Textilesandproducts
0.09
0.23
0.40
0.51
0.50
0.16
0.22
0.28
0.36
0.45
0.51
0.47
0.55
Apparelandleathergoods
0.51
0.76
0.05
0.07
0.08
0.12
0.18
0.21
0.28
0.35
0.42
0.51
0.41
Paper
0.04
0.10
0.02
0.03
0.06
0.09
0.14
0.16
0.22
0.23
0.26
0.32
0.38
Printingandrelated
0.01
0.02
0.05
0.09
0.13
0.08
0.13
0.19
0.26
0.33
0.41
0.46
0.55
Chemicals
0.38
0.09
0.10
0.14
0.21
0.24
0.29
0.36
0.44
0.30
0.35
0.38
0.43
Petroleumandcoal
0.25
0.12
0.22
0.33
0.47
0.55
0.65
0.69
0.71
0.77
0.80
0.85
0.69
Plasticsandrubber
0.06
0.15
0.28
0.43
0.50
0.63
0.57
0.68
0.69
0.77
0.26
0.32
0.32
Furniture
0.01
0.03
0.06
0.09
0.15
0.11
0.17
0.21
0.28
0.33
0.38
0.42
0.50
Primarymetal
0.19
0.02
0.06
0.11
0.17
0.25
0.21
0.27
0.36
0.36
0.43
0.45
0.53
Fabricatedmetal
0.02
0.01
0.02
0.05
0.08
0.13
0.20
0.26
0.33
0.36
0.35
0.41
0.49
Machinery
0.09
0.01
0.01
0.02
0.04
0.05
0.07
0.07
0.07
0.07
0.09
0.13
0.18
Electricalequipment
0.04
0.11
0.18
0.16
0.25
0.34
0.42
0.49
0.56
0.46
0.22
0.20
0.22
Motorvehicles
0.01
0.02
0.06
0.09
0.14
0.18
0.24
0.27
0.33
0.42
0.51
0.58
0.60
Manufacturing(NAICS)
0.02
0.03
0.03
0.06
0.10
0.14
0.21
0.29
0.35
0.44
0.43
0.52
0.57
Newspaper
0.18
0.23
0.36
0.49
0.47
0.59
0.60
0.71
0.72
0.79
0.85
0.87
0.91
Periodicalbooksandother
0.37
0.66
0.71
0.62
0.73
0.83
0.79
0.87
0.92
0.94
0.96
0.98
0.97
Pottery,ceramicsandplumbing
0.28
0.48
0.50
0.66
0.77
0.70
0.67
0.74
0.82
0.86
0.83
0.88
0.92
Glassandglassproducts
0.22
0.34
0.52
0.64
0.77
0.69
0.77
0.59
0.68
0.73
0.69
0.77
0.82
Clayproductandrefractory
0.11
0.20
0.36
0.44
0.48
0.46
0.54
0.63
0.64
0.73
0.70
0.76
0.82
Industrialmachinery
0.04
0.12
0.22
0.34
0.48
0.47
0.58
0.61
0.71
0.66
0.55
0.56
0.64
Othertransportationequipment
0.91
0.82
0.14
0.19
0.25
0.35
0.46
0.52
0.62
0.61
0.67
0.74
0.79
Navigational,measuringandother
0.97
0.42
0.58
0.69
0.77
0.66
0.75
0.83
0.87
0.92
0.94
0.82
0.78
Notes:basedon1000simulationsofmodel(5)where# =12.p-valuesarebasedonthe2 +1Boldanditalicsdenotesignificanceatthe5%and
10%level,respectively.

TableA.10.IRFbasedtestofnonlinearityfor1s.d.shocktothenominaloilprice
³ # =36
´Horizon
Sector
01
23
45
67
89
10
11
12
Totalindex
0.00
0.00
0.00
0.00
0.00
0.00
0.00
0.00
0.00
0.00
0.00
0.00
0.00
Foodsandtobacco
0.00
0.00
0.00
0.00
0.00
0.00
0.00
0.00
0.00
0.00
0.00
0.00
0.00
Clothing
0.83
0.84
0.00
0.00
0.00
0.00
0.00
0.00
0.00
0.00
0.00
0.00
0.00
Durableconsumergoods
0.00
0.00
0.00
0.00
0.00
0.00
0.00
0.00
0.00
0.00
0.00
0.00
0.00
Miscellaneousdurablegoods
0.00
0.00
0.00
0.00
0.00
0.00
0.00
0.00
0.00
0.00
0.00
0.00
0.00
Nondurableconsumergoods
0.01
0.00
0.00
0.00
0.00
0.00
0.00
0.00
0.00
0.00
0.00
0.00
0.00
Manufacturing(SIC)
0.00
0.00
0.00
0.00
0.00
0.00
0.00
0.00
0.00
0.00
0.00
0.00
0.00
Paperproducts
0.41
0.52
0.20
0.06
0.11
0.02
0.01
0.02
0.01
0.01
0.00
0.00
0.00
Chemicalproducts
0.02
0.00
0.01
0.00
0.00
0.00
0.00
0.00
0.00
0.00
0.00
0.00
0.00
Transitequipment
0.26
0.00
0.00
0.00
0.00
0.00
0.00
0.00
0.00
0.00
0.00
0.00
0.00
Textilesmaterials
0.02
0.06
0.13
0.08
0.03
0.06
0.06
0.04
0.06
0.04
0.06
0.02
0.02
Papermaterials
0.06
0.06
0.05
0.07
0.12
0.18
0.25
0.29
0.37
0.43
0.47
0.27
0.31
Chemicalmaterials
0.76
0.02
0.01
0.02
0.04
0.01
0.01
0.01
0.02
0.03
0.06
0.05
0.01
Motorvehiclesandparts
0.06
0.03
0.07
0.11
0.19
0.11
0.16
0.06
0.06
0.03
0.04
0.06
0.08
Food,beverageandtobacco
0.02
0.01
0.02
0.03
0.03
0.04
0.03
0.04
0.06
0.08
0.10
0.13
0.16
Textilesandproducts
0.52
0.07
0.12
0.15
0.22
0.20
0.22
0.26
0.32
0.22
0.24
0.29
0.36
Apparelandleathergoods
0.60
0.48
0.35
0.26
0.21
0.28
0.36
0.27
0.35
0.42
0.50
0.59
0.57
Paper
0.12
0.06
0.12
0.11
0.18
0.27
0.20
0.22
0.29
0.33
0.38
0.44
0.49
Printingandrelated
0.11
0.24
0.41
0.34
0.48
0.58
0.65
0.73
0.80
0.84
0.89
0.75
0.80
Chemicals
0.57
0.02
0.01
0.00
0.01
0.01
0.02
0.02
0.03
0.04
0.06
0.08
0.10
Petroleumandcoal
0.01
0.03
0.07
0.03
0.06
0.09
0.13
0.19
0.23
0.26
0.34
0.40
0.48
Plasticsandrubber
0.50
0.45
0.52
0.58
0.72
0.82
0.14
0.06
0.10
0.13
0.18
0.19
0.14
Furniture
0.18
0.41
0.60
0.70
0.82
0.37
0.47
0.45
0.38
0.48
0.36
0.43
0.48
Primarymetal
0.47
0.41
0.36
0.26
0.37
0.48
0.43
0.49
0.53
0.61
0.67
0.63
0.68
Fabricatedmetal
0.10
0.03
0.02
0.03
0.04
0.07
0.11
0.17
0.23
0.31
0.12
0.12
0.16
Machinery
0.21
0.04
0.04
0.08
0.14
0.10
0.14
0.19
0.17
0.24
0.30
0.36
0.43
Electricalequipment
0.64
0.36
0.54
0.66
0.73
0.84
0.65
0.62
0.68
0.76
0.62
0.69
0.66
Motorvehicles
0.06
0.11
0.19
0.31
0.43
0.52
0.62
0.69
0.77
0.74
0.80
0.81
0.83
Manufacturing(NAICS)
0.38
0.05
0.04
0.04
0.07
0.08
0.08
0.10
0.14
0.20
0.23
0.28
0.16
Newspaper
0.21
0.14
0.24
0.27
0.33
0.45
0.56
0.66
0.75
0.81
0.86
0.90
0.89
Periodicalbooksandother
0.77
0.19
0.28
0.42
0.53
0.66
0.42
0.49
0.50
0.59
0.67
0.74
0.80
Pottery,ceramicsandplumbing
0.50
0.43
0.62
0.78
0.88
0.85
0.81
0.88
0.91
0.95
0.97
0.98
0.99
Glassandglassproducts
0.32
0.58
0.77
0.84
0.90
0.95
0.92
0.93
0.95
0.89
0.91
0.94
0.96
Clayproductandrefractory
0.88
0.22
0.37
0.53
0.68
0.78
0.76
0.84
0.89
0.92
0.91
0.94
0.94
Industrialmachinery
0.29
0.46
0.64
0.75
0.80
0.82
0.81
0.88
0.91
0.91
0.75
0.81
0.79
Othertransportationequipment
0.33
0.54
0.33
0.41
0.52
0.61
0.71
0.80
0.86
0.91
0.94
0.96
0.98
Navigational,measuringandother
0.84
0.36
0.34
0.43
0.45
0.55
0.55
0.63
0.72
0.71
0.78
0.84
0.85
Notes:basedon1000simulationsofmodel(5)where# =36.p-valuesarebasedonthe2 +1Boldanditalicsdenotesignificanceatthe5%and
10%level,respectively.

TableA.11.IRFbasedtestofnonlinearityfor1s.d.shocktothenominaloilprice
1
12
36
Sector
01
612
01
612
01
612
Totalindex
0.13
0.05
0.04
0.04**
0.00**
0.00**
0.00**
0.00**
0.00**
0.00**
0.00**
0.00**
Foodsandtobacco
0.30
0.15
0.06
0.20
0.19
0.23
0.00**
0.00**
0.00**
0.00**
0.00**
0.00**
Clothing
0.02
0.05
0.07
0.21
0.18
0.36
0.00**
0.00**
0.83
0.84
0.00**
0.00**
Durableconsumergoods
0.04
0.04
0.09
0.21
0.00**
0.00**
0.00**
0.00**
0.00**
0.00**
0.00**
0.00**
Miscellaneousdurablegoods
0.00**
0.01
0.09
0.23
0.00**
0.00**
0.00**
0.00**
0.00**
0.00**
0.00**
0.00**
Nondurableconsumergoods
0.19
0.25
0.11
0.32
0.05
0.05
0.00**
0.00**
0.01*
0.00**
0.00**
0.00**
Manufacturing(SIC)
0.07
0.01
0.03
0.07**
0.00**
0.00**
0.00**
0.00**
0.00**
0.00**
0.00**
0.00**
Paperproducts
0.27
0.38
0.06
0.11*
0.58
0.11
0.00**
0.00**
0.41
0.52
0.01**
0.00**
Chemicalproducts
0.79
0.22
0.21
0.11*
0.00*
0.01*
0.07**
0.06**
0.02
0.00**
0.00**
0.00**
Transitequipment
0.46
0.07
0.06
0.10**
0.33
0.00**
0.00**
0.00**
0.26
0.00**
0.00**
0.00**
Textilesmaterials
0.09
0.01
0.03**
0.15*
0.00**
0.01*
0.01**
0.02**
0.02
0.06
0.06*
0.02**
Papermaterials
0.14
0.03
0.24
0.23
0.00**
0.01**
0.00**
0.01**
0.06
0.06
0.25
0.31
Chemicalmaterials
0.77
0.00**
0.03**
0.08**
0.15
0.01**
0.01**
0.02**
0.76
0.02*
0.01**
0.01**
Motorvehiclesandparts
0.66
0.01
0.00**
0.00**
0.06
0.01**
0.05**
0.04**
0.06
0.03
0.16
0.08**
Food,beverageandtobacco
0.47
0.17
0.16
0.61
0.61
0.60
0.24
0.40
0.02
0.01**
0.03**
0.16*
Textilesandproducts
0.11
0.08
0.43
0.67
0.09
0.23
0.22
0.55
0.52
0.07
0.22
0.36
Apparelandleathergoods
0.04
0.11
0.37
0.68
0.51
0.76
0.18
0.41
0.60
0.48
0.36
0.57
Paper
0.17
0.02
0.18
0.49
0.04
0.10
0.14
0.38
0.12
0.06
0.20
0.49
Printingandrelated
0.01
0.03
0.13
0.33
0.01*
0.02
0.13
0.55
0.11
0.24
0.65
0.80
Chemicals
0.74
0.00**
0.00**
0.02**
0.38
0.09
0.29
0.43
0.57
0.02**
0.02**
0.10**
Petroleumandcoal
0.21
0.15
0.72
0.94
0.25
0.12
0.65
0.69
0.01*
0.03
0.13
0.48
Plasticsandrubber
0.04
0.07
0.44
0.14*
0.06
0.15
0.57
0.32
0.50
0.45
0.14
0.14*
Furniture
0.01
0.03
0.22
0.53
0.01*
0.03
0.17
0.50
0.18
0.41
0.47
0.48
Primarymetal
0.39
0.16
0.58
0.84
0.19
0.02
0.21
0.53
0.47
0.41
0.43
0.68
Fabricatedmetal
0.08
0.03
0.29
0.69
0.02
0.01*
0.20
0.49
0.10
0.03
0.11
0.16*
Machinery
0.12
0.03
0.19
0.62
0.09
0.01*
0.07*
0.18**
0.21
0.04
0.14
0.43
Electricalequipment
0.07
0.17
0.49
0.17
0.04
0.11
0.42
0.22*
0.64
0.36
0.65
0.66
Motorvehicles
0.44
0.01
0.07
0.31
0.01
0.02
0.24
0.60
0.06
0.11
0.62
0.83
Manufacturing(NAICS)
0.06
0.00
0.03*
0.13*
0.02
0.03
0.21
0.57
0.38
0.05
0.08
0.16*
Newspaper
0.95
0.28
0.17
0.54
0.18
0.23
0.60
0.91
0.21
0.14
0.56
0.89
Periodicalbooksandother
0.41
0.19
0.26
0.69
0.37
0.66
0.79
0.97
0.77
0.19
0.42
0.80
Pottery,ceramicsandplumbing
0.29
0.05
0.11
0.37
0.28
0.48
0.67
0.92
0.50
0.43
0.81
0.99
Glassandglassproducts
0.17
0.29
0.24
0.62
0.22
0.34
0.77
0.82
0.32
0.58
0.92
0.96
Clayproductandrefractory
0.67
0.28
0.38
0.83
0.11
0.20
0.54
0.82
0.88
0.22
0.76
0.94
Industrialmachinery
0.32
0.16
0.42
0.77
0.04
0.12
0.58
0.64
0.29
0.46
0.81
0.79
Othertransportationequipment
0.29
0.32
0.58
0.87
0.91
0.82
0.46
0.79
0.33
0.54
0.71
0.98
Navigationalinst.
0.11
0.26
0.23
0.52
0.97
0.42
0.75
0.78
0.84
0.36
0.55
0.85
Notes:basedon1000simulationsofmodel(5).p-valuesarebasedonthe2 +1.Boldanditalicsdenotesignificanceatthe5%and10%level,
respectively.**and*denotesignificanceafteraccountingfordataminingata5%and10%level,respectively.

TableA.12.IRFbasedtestofsymmetryfor2s.d.shocktothenominaloilprice
³ # =1
´Horizon
Sector
01
23
45
67
89
10
11
12
Totalindex
0.19
0.08
0.17
0.11
0.16
0.12
0.06
0.07
0.01
0.01
0.01
0.01
0.01
Foodsandtobacco
0.35
0.22
0.36
0.51
0.39
0.06
0.06
0.07
0.10
0.06
0.09
0.11
0.12
Clothing
0.02
0.05
0.00
0.01
0.02
0.02
0.04
0.03
0.06
0.08
0.09
0.07
0.09
Durableconsumergoods
0.04
0.03
0.07
0.03
0.05
0.08
0.06
0.03
0.03
0.03
0.05
0.06
0.08
Miscellaneousdurablegoods
0.01
0.03
0.02
0.03
0.06
0.09
0.14
0.14
0.18
0.19
0.23
0.18
0.23
Nondurableconsumergoods
0.24
0.33
0.39
0.28
0.40
0.21
0.16
0.22
0.29
0.21
0.23
0.24
0.30
Manufacturing(SIC)
0.11
0.02
0.04
0.04
0.05
0.04
0.04
0.04
0.01
0.01
0.02
0.02
0.04
Paperproducts
0.34
0.47
0.06
0.00
0.01
0.02
0.03
0.00
0.00
0.01
0.01
0.01
0.01
Chemicalproducts
0.81
0.26
0.42
0.28
0.30
0.32
0.26
0.35
0.40
0.13
0.04
0.05
0.07
Transitequipment
0.51
0.11
0.03
0.01
0.01
0.03
0.02
0.01
0.00
0.00
0.01
0.01
0.00
Textilesmaterials
0.11
0.01
0.03
0.04
0.04
0.01
0.01
0.02
0.02
0.02
0.03
0.04
0.06
Papermaterials
0.15
0.02
0.04
0.09
0.07
0.12
0.15
0.18
0.25
0.30
0.24
0.11
0.02
Chemicalmaterials
0.77
0.00
0.00
0.00
0.00
0.00
0.00
0.00
0.00
0.00
0.00
0.00
0.00
Motorvehiclesandparts
0.68
0.00
0.01
0.00
0.00
0.00
0.00
0.00
0.00
0.00
0.00
0.00
0.00
Food,beverageandtobacco
0.49
0.18
0.27
0.33
0.33
0.11
0.08
0.08
0.12
0.14
0.17
0.23
0.29
Textilesandproducts
0.11
0.08
0.14
0.19
0.30
0.22
0.27
0.31
0.39
0.46
0.55
0.25
0.31
Apparelandleathergoods
0.02
0.06
0.07
0.14
0.19
0.05
0.08
0.02
0.02
0.03
0.06
0.07
0.09
Paper
0.17
0.01
0.02
0.04
0.06
0.08
0.08
0.11
0.16
0.16
0.16
0.11
0.09
Printingandrelated
0.00
0.01
0.01
0.01
0.01
0.01
0.01
0.01
0.02
0.02
0.04
0.02
0.02
Chemicals
0.76
0.00
0.00
0.00
0.00
0.00
0.00
0.00
0.00
0.00
0.00
0.00
0.00
Petroleumandcoal
0.23
0.17
0.25
0.39
0.54
0.64
0.73
0.81
0.85
0.90
0.92
0.92
0.94
Plasticsandrubber
0.03
0.06
0.08
0.10
0.16
0.24
0.26
0.33
0.35
0.42
0.28
0.00
0.00
Furniture
0.01
0.02
0.03
0.07
0.11
0.16
0.06
0.05
0.08
0.10
0.14
0.15
0.11
Primarymetal
0.43
0.15
0.24
0.28
0.33
0.37
0.43
0.53
0.43
0.53
0.60
0.64
0.64
Fabricatedmetal
0.09
0.02
0.04
0.03
0.06
0.11
0.15
0.21
0.28
0.37
0.45
0.30
0.34
Machinery
0.12
0.02
0.04
0.08
0.02
0.03
0.06
0.08
0.08
0.12
0.17
0.21
0.27
Electricalequipment
0.07
0.16
0.30
0.30
0.42
0.50
0.38
0.38
0.46
0.54
0.63
0.01
0.01
Motorvehicles
0.43
0.00
0.01
0.00
0.00
0.01
0.00
0.01
0.01
0.01
0.01
0.01
0.01
Manufacturing(NAICS)
0.05
0.00
0.00
0.00
0.01
0.00
0.00
0.00
0.00
0.00
0.01
0.00
0.01
Newspaper
0.95
0.25
0.27
0.19
0.08
0.12
0.00
0.00
0.00
0.00
0.00
0.00
0.00
Periodicalbooksandother
0.37
0.12
0.15
0.00
0.00
0.00
0.00
0.01
0.01
0.02
0.01
0.02
0.03
Pottery,ceramicsandplumbing
0.27
0.02
0.01
0.00
0.00
0.00
0.00
0.00
0.00
0.00
0.00
0.00
0.00
Glassandglassproducts
0.13
0.20
0.11
0.03
0.00
0.00
0.00
0.00
0.00
0.00
0.00
0.00
0.00
Clayproductandrefractory
0.65
0.19
0.06
0.01
0.02
0.02
0.04
0.07
0.08
0.12
0.16
0.20
0.22
Industrialmachinery
0.31
0.11
0.20
0.33
0.02
0.02
0.03
0.05
0.03
0.04
0.02
0.02
0.03
Othertransportationequipment
0.25
0.22
0.31
0.35
0.48
0.25
0.19
0.27
0.28
0.29
0.24
0.29
0.29
Navigational,measuringandother
0.09
0.23
0.37
0.04
0.06
0.04
0.05
0.07
0.02
0.02
0.04
0.04
0.05
Notes:basedon1000simulationsofmodel(5)where# =1 .p-valuesarebasedonthe2 +1.Boldanditalicsdenotesignificanceatthe5%and
10%level,respectively.

TableA.13.IRFbasedtestofnonlinearityfor2s.d.shocktothenominaloilprice
³ # =12
´Horizon
Sector
01
23
45
67
89
10
11
12
Totalindex
0.01
0.00
0.01
0.00
0.00
0.00
0.00
0.01
0.00
0.00
0.00
0.00
0.00
Foodsandtobacco
0.39
0.48
0.67
0.01
0.02
0.01
0.00
0.00
0.00
0.00
0.00
0.00
0.00
Clothing
0.34
0.58
0.00
0.00
0.00
0.00
0.00
0.00
0.00
0.00
0.00
0.00
0.00
Durableconsumergoods
0.00
0.00
0.01
0.01
0.02
0.02
0.03
0.06
0.08
0.09
0.01
0.00
0.00
Miscellaneousdurablegoods
0.00
0.00
0.00
0.00
0.00
0.00
0.00
0.00
0.00
0.00
0.00
0.00
0.00
Nondurableconsumergoods
0.16
0.17
0.14
0.02
0.02
0.04
0.00
0.00
0.00
0.00
0.00
0.00
0.00
Manufacturing(SIC)
0.01
0.00
0.00
0.00
0.00
0.00
0.00
0.00
0.00
0.01
0.00
0.00
0.00
Paperproducts
0.70
0.38
0.56
0.01
0.02
0.01
0.01
0.01
0.02
0.02
0.00
0.00
0.00
Chemicalproducts
0.03
0.08
0.16
0.16
0.23
0.33
0.44
0.54
0.62
0.48
0.18
0.13
0.07
Transitequipment
0.56
0.04
0.03
0.01
0.02
0.00
0.00
0.01
0.00
0.00
0.00
0.00
0.00
Textilesmaterials
0.01
0.02
0.05
0.02
0.02
0.02
0.02
0.03
0.01
0.01
0.01
0.00
0.00
Papermaterials
0.00
0.01
0.00
0.00
0.00
0.01
0.01
0.02
0.02
0.01
0.01
0.00
0.00
Chemicalmaterials
0.23
0.00
0.00
0.00
0.00
0.00
0.00
0.00
0.00
0.00
0.00
0.00
0.00
Motorvehiclesandparts
0.11
0.00
0.00
0.00
0.00
0.00
0.00
0.00
0.00
0.00
0.00
0.00
0.00
Food,beverageandtobacco
0.61
0.59
0.78
0.33
0.41
0.18
0.08
0.05
0.02
0.03
0.04
0.06
0.08
Textilesandproducts
0.07
0.17
0.31
0.34
0.22
0.06
0.08
0.09
0.09
0.12
0.12
0.03
0.03
Apparelandleathergoods
0.47
0.72
0.02
0.03
0.03
0.06
0.08
0.09
0.13
0.15
0.21
0.25
0.06
Paper
0.01
0.04
0.00
0.01
0.01
0.02
0.04
0.04
0.06
0.06
0.06
0.01
0.01
Printingandrelated
0.00
0.00
0.00
0.00
0.00
0.00
0.00
0.00
0.00
0.00
0.00
0.00
0.00
Chemicals
0.35
0.02
0.02
0.04
0.06
0.04
0.07
0.10
0.13
0.03
0.02
0.00
0.00
Petroleumandcoal
0.21
0.07
0.14
0.24
0.35
0.44
0.53
0.52
0.52
0.55
0.60
0.68
0.22
Plasticsandrubber
0.01
0.02
0.04
0.07
0.11
0.15
0.06
0.09
0.11
0.16
0.00
0.00
0.00
Furniture
0.00
0.00
0.01
0.01
0.01
0.00
0.00
0.00
0.00
0.01
0.00
0.00
0.00
Primarymetal
0.18
0.01
0.01
0.02
0.04
0.06
0.02
0.03
0.04
0.05
0.07
0.02
0.02
Fabricatedmetal
0.00
0.00
0.00
0.00
0.00
0.00
0.00
0.01
0.02
0.02
0.00
0.00
0.00
Machinery
0.08
0.00
0.00
0.00
0.00
0.00
0.00
0.00
0.00
0.00
0.00
0.00
0.00
Electricalequipment
0.02
0.03
0.07
0.07
0.13
0.17
0.20
0.27
0.36
0.22
0.01
0.00
0.00
Motorvehicles
0.00
0.00
0.00
0.00
0.00
0.00
0.00
0.00
0.00
0.00
0.00
0.00
0.00
Manufacturing(NAICS)
0.00
0.00
0.00
0.00
0.00
0.00
0.00
0.00
0.01
0.01
0.00
0.00
0.00
Newspaper
0.11
0.04
0.09
0.13
0.05
0.07
0.07
0.07
0.07
0.06
0.08
0.11
0.13
Periodicalbooksandother
0.26
0.50
0.42
0.08
0.14
0.21
0.11
0.14
0.20
0.21
0.26
0.32
0.14
Pottery,ceramicsandplumbing
0.16
0.17
0.11
0.19
0.26
0.11
0.09
0.13
0.19
0.21
0.22
0.28
0.35
Glassandglassproducts
0.11
0.06
0.08
0.07
0.11
0.01
0.00
0.00
0.00
0.00
0.00
0.01
0.01
Clayproductandrefractory
0.06
0.03
0.06
0.08
0.10
0.09
0.11
0.15
0.12
0.12
0.06
0.07
0.11
Industrialmachinery
0.01
0.01
0.01
0.01
0.01
0.01
0.02
0.02
0.02
0.01
0.01
0.01
0.01
Othertransportationequipment
0.90
0.73
0.00
0.01
0.01
0.00
0.01
0.01
0.01
0.00
0.00
0.00
0.00
Navigational,measuringandother
0.93
0.26
0.39
0.44
0.56
0.35
0.29
0.38
0.36
0.44
0.53
0.01
0.01
Notes:basedon1000simulationsofmodel(5)where# =12.p-valuesarebasedonthe2 +1.Boldanditalicsdenotesignificanceatthe5%and
10%level,respectively.

TableA.14.IRFbasedtestofnonlinearityfor2s.d.shocktothenominaloilprice
³ # =36
´Horizon
Sector
01
23
45
67
89
10
11
12
Totalindex
0.03
0.00
0.01
0.00
0.00
0.01
0.00
0.00
0.00
0.01
0.00
0.00
0.00
Foodsandtobacco
0.00
0.00
0.00
0.00
0.00
0.00
0.00
0.00
0.00
0.00
0.00
0.00
0.00
Clothing
0.87
0.93
0.03
0.06
0.06
0.11
0.15
0.14
0.14
0.19
0.22
0.24
0.06
Durableconsumergoods
0.00
0.00
0.00
0.01
0.02
0.04
0.06
0.06
0.06
0.04
0.00
0.00
0.00
Miscellaneousdurablegoods
0.00
0.00
0.00
0.00
0.00
0.00
0.00
0.00
0.00
0.00
0.00
0.00
0.00
Nondurableconsumergoods
0.12
0.00
0.00
0.00
0.00
0.00
0.00
0.00
0.00
0.00
0.00
0.00
0.00
Manufacturing(SIC)
0.02
0.00
0.00
0.00
0.00
0.01
0.00
0.01
0.01
0.01
0.00
0.00
0.00
Paperproducts
0.60
0.76
0.59
0.29
0.42
0.13
0.09
0.11
0.12
0.15
0.00
0.00
0.00
Chemicalproducts
0.07
0.02
0.06
0.01
0.01
0.01
0.01
0.02
0.04
0.04
0.03
0.04
0.04
Transitequipment
0.47
0.02
0.01
0.02
0.03
0.01
0.01
0.02
0.00
0.00
0.00
0.00
0.00
Textilesmaterials
0.07
0.18
0.32
0.20
0.17
0.20
0.24
0.28
0.31
0.21
0.27
0.11
0.08
Papermaterials
0.15
0.24
0.12
0.19
0.29
0.40
0.52
0.51
0.61
0.64
0.72
0.24
0.16
Chemicalmaterials
0.80
0.02
0.03
0.04
0.08
0.05
0.06
0.09
0.13
0.18
0.19
0.01
0.01
Motorvehiclesandparts
0.15
0.02
0.05
0.10
0.16
0.08
0.09
0.12
0.14
0.09
0.12
0.16
0.16
Food,beverageandtobacco
0.04
0.02
0.03
0.06
0.05
0.07
0.03
0.01
0.02
0.03
0.05
0.06
0.08
Textilesandproducts
0.57
0.09
0.18
0.24
0.25
0.25
0.34
0.43
0.46
0.31
0.34
0.38
0.36
Apparelandleathergoods
0.64
0.50
0.38
0.42
0.26
0.25
0.27
0.15
0.21
0.17
0.22
0.26
0.25
Paper
0.11
0.17
0.15
0.23
0.32
0.41
0.40
0.35
0.29
0.29
0.36
0.39
0.47
Printingandrelated
0.08
0.14
0.21
0.10
0.11
0.17
0.23
0.32
0.38
0.45
0.53
0.50
0.52
Chemicals
0.63
0.00
0.01
0.01
0.02
0.04
0.04
0.06
0.07
0.11
0.12
0.09
0.11
Petroleumandcoal
0.02
0.06
0.11
0.04
0.06
0.10
0.15
0.21
0.22
0.29
0.36
0.29
0.28
Plasticsandrubber
0.54
0.41
0.38
0.33
0.40
0.53
0.01
0.01
0.02
0.03
0.03
0.04
0.06
Furniture
0.15
0.33
0.52
0.58
0.72
0.13
0.13
0.18
0.25
0.27
0.18
0.21
0.20
Primarymetal
0.48
0.32
0.45
0.48
0.43
0.35
0.20
0.28
0.34
0.30
0.35
0.42
0.44
Fabricatedmetal
0.14
0.00
0.01
0.03
0.06
0.06
0.08
0.12
0.17
0.23
0.12
0.14
0.14
Machinery
0.21
0.01
0.02
0.02
0.02
0.04
0.07
0.06
0.10
0.11
0.14
0.19
0.21
Electricalequipment
0.68
0.32
0.51
0.65
0.65
0.67
0.30
0.40
0.44
0.51
0.38
0.28
0.35
Motorvehicles
0.09
0.06
0.04
0.06
0.10
0.11
0.04
0.05
0.07
0.09
0.12
0.08
0.09
Manufacturing(NAICS)
0.41
0.01
0.03
0.03
0.05
0.08
0.04
0.06
0.09
0.11
0.14
0.06
0.08
Newspaper
0.16
0.02
0.05
0.08
0.02
0.02
0.03
0.05
0.06
0.07
0.11
0.14
0.19
Periodicalbooksandother
0.76
0.09
0.06
0.11
0.18
0.26
0.09
0.13
0.17
0.23
0.29
0.31
0.35
Pottery,ceramicsandplumbing
0.45
0.47
0.67
0.81
0.90
0.76
0.82
0.89
0.93
0.95
0.96
0.98
0.99
Glassandglassproducts
0.25
0.34
0.48
0.53
0.59
0.68
0.47
0.57
0.56
0.54
0.63
0.70
0.75
Clayproductandrefractory
0.84
0.13
0.24
0.37
0.51
0.64
0.66
0.72
0.65
0.65
0.71
0.78
0.80
Industrialmachinery
0.26
0.24
0.27
0.33
0.41
0.53
0.55
0.62
0.65
0.71
0.44
0.40
0.38
Othertransportationequipment
0.25
0.49
0.06
0.09
0.15
0.14
0.21
0.28
0.36
0.44
0.52
0.56
0.64
Navigational,measuringandother
0.82
0.19
0.28
0.42
0.38
0.34
0.14
0.20
0.20
0.23
0.15
0.20
0.26
Notes:basedon1000simulationsofmodel(5)where# =36.p-valuesarebasedonthe2 +1Boldanditalicsdenotesignificanceatthe5%and
10%level,respectively.

TableA.15.IRFbasedtestofnonlinearityfor2s.d.shocktothenominaloilprice
1
12
36
Sector
01
67
12
01
612
01
612
Totalindex
0.19
0.08
0.06
0.07
0.01
0.01
0.00
0.00
0.00
0.03
0.00
0.00
0.00**
Foodsandtobacco
0.35
0.22
0.06
0.07
0.12
0.39
0.48
0.00
0.00
0.00
0.00**
0.00**
0.00**
Clothing
0.02
0.05
0.04
0.03
0.09
0.34
0.58
0.00
0.00
0.87
0.93
0.15
0.06
Durableconsumergoods
0.04
0.03
0.06
0.03
0.08
0.00
0.00
0.03
0.00
0.00
0.00
0.06
0.00**
Miscellaneousdurablegoods
0.01
0.03
0.14
0.14
0.23
0.00
0.00
0.00
0.00
0.00
0.00
0.00
0.00**
Nondurableconsumergoods
0.24
0.33
0.16
0.22
0.30
0.16
0.17
0.00
0.00
0.12
0.00**
0.00**
0.00**
Manufacturing(SIC)
0.11
0.02
0.04
0.04
0.04
0.01
0.00
0.00
0.00
0.02
0.00
0.00
0.00**
Paperproducts
0.34
0.47
0.03
0.00
0.01
0.70
0.38
0.01
0.00
0.60
0.76
0.09
0.00
Chemicalproducts
0.81
0.26
0.26
0.35
0.07
0.03
0.08
0.44
0.07
0.07
0.02
0.01
0.04
Transitequipment
0.51
0.11
0.02
0.01
0.00
0.56
0.04
0.00
0.00
0.47
0.02
0.01
0.00**
Textilesmaterials
0.11
0.01
0.01
0.02
0.06
0.01
0.02
0.02
0.00
0.07
0.18
0.24
0.08
Papermaterials
0.15
0.02
0.15
0.18
0.02
0.00
0.01
0.01
0.00
0.15
0.24
0.52
0.16
Chemicalmaterials
0.77
0.00
0.00
0.00
0.00
0.23
0.00
0.00
0.00
0.80
0.02
0.06
0.01
Motorvehiclesandparts
0.68
0.00
0.00
0.00
0.00
0.11
0.00
0.00
0.00
0.15
0.02
0.09
0.16
Food,beverageandtobacco
0.49
0.18
0.08
0.08
0.29
0.61
0.59
0.08
0.08
0.04
0.02
0.03
0.08
Textilesandproducts
0.11
0.08
0.27
0.31
0.31
0.07
0.17
0.08
0.03
0.57
0.09
0.34
0.36
Apparelandleathergoods
0.02
0.06
0.08
0.02
0.09
0.47
0.72
0.08
0.06
0.64
0.50
0.27
0.25
Paper
0.17
0.01
0.08
0.11
0.09
0.01
0.04
0.04
0.01
0.11
0.17
0.40
0.47
Printingandrelated
0.00
0.01
0.01
0.01
0.02
0.00
0.00
0.00
0.00
0.08
0.14
0.23
0.52
Chemicals
0.76
0.00
0.00
0.00
0.00
0.35
0.02
0.07
0.00
0.63
0.00
0.04
0.10
Petroleumandcoal
0.23
0.17
0.73
0.81
0.94
0.21
0.07
0.53
0.22
0.02
0.06
0.15
0.28
Plasticsandrubber
0.03
0.06
0.26
0.33
0.00
0.01
0.02
0.06
0.00
0.54
0.41
0.01
0.06
Furniture
0.01
0.02
0.06
0.05
0.11
0.00
0.00
0.00
0.00
0.15
0.33
0.13
0.20
Primarymetal
0.43
0.15
0.43
0.53
0.64
0.18
0.01
0.02
0.02
0.48
0.32
0.20
0.44
Fabricatedmetal
0.09
0.02
0.15
0.21
0.34
0.00
0.00
0.00
0.00
0.14
0.00
0.08
0.14
Machinery
0.12
0.02
0.06
0.08
0.27
0.08
0.00
0.00
0.00
0.21
0.01
0.07
0.21
Electricalequipment
0.07
0.16
0.38
0.38
0.01
0.02
0.03
0.20
0.00
0.68
0.32
0.30
0.35
Motorvehicles
0.43
0.00
0.00
0.01
0.01
0.00
0.00
0.00
0.00
0.09
0.06
0.04
0.09
Manufacturing(NAICS)
0.05
0.00
0.00
0.00
0.01
0.00
0.00
0.00
0.00
0.41
0.01
0.04
0.08
Newspaper
0.95
0.25
0.00
0.00
0.00
0.11
0.04
0.07
0.13
0.16
0.02
0.03
0.19
Periodicalbooksandother
0.37
0.12
0.00
0.01
0.03
0.26
0.50
0.11
0.14
0.76
0.09
0.09
0.35
Pottery,ceramicsandplumbing
0.27
0.02
0.00
0.00
0.00
0.16
0.17
0.09
0.35
0.45
0.47
0.82
0.99
Glassandglassproducts
0.13
0.20
0.00
0.00
0.00
0.11
0.06
0.00
0.01
0.25
0.34
0.47
0.75
Clayproductandrefractory
0.65
0.19
0.04
0.07
0.22
0.06
0.03
0.10
0.10
0.84
0.13
0.66
0.80
Industrialmachinery
0.31
0.10
0.03
0.05
0.03
0.01
0.01
0.02
0.01
0.26
0.24
0.55
0.38
Othertransportationequipment
0.25
0.22
0.19
0.27
0.29
0.90
0.73
0.01
0.00
0.25
0.49
0.21
0.64
Navigational,measuringandother
0.09
0.23
0.05
0.07
0.05
0.93
0.26
0.29
0.01
0.82
0.19
0.14
0.26
Notes:basedon1000simulationsofmodel(5).p-valuesarebasedonthe2 +1.Boldanditalicsdenotesignificanceatthe5%and10%level,
respectively.**and*denotesignificanceafteraccountingfordataminingata5%and10%level,respectively.

TableA.16.IRFbasedtestofsymmetryfor1s.d.shocktotherealoilprice(# =1 )-1973-2009subsample
Horizon
Sector
01
23
45
67
89
10
11
12
Totalindex
0.14
0.06
0.13
0.11
0.17
0.16
0.07
0.11
0.11
0.10
0.13
0.15
0.18
Foodsandtobacco
0.29
0.13
0.25
0.35
0.31
0.25
0.31
0.24
0.30
0.34
0.41
0.49
0.57
Clothing
0.09
0.20
0.21
0.33
0.42
0.37
0.47
0.47
0.47
0.54
0.55
0.63
0.71
Durableconsumergoods
0.11
0.08
0.16
0.09
0.14
0.22
0.13
0.16
0.20
0.12
0.16
0.21
0.27
Miscellaneousdurablegoods
0.02
0.07
0.11
0.18
0.28
0.39
0.51
0.59
0.69
0.77
0.83
0.75
0.81
Nondurableconsumergoods
0.13
0.29
0.48
0.65
0.67
0.53
0.53
0.63
0.72
0.72
0.71
0.70
0.75
Manufacturing(SIC)
0.09
0.03
0.06
0.08
0.13
0.18
0.11
0.17
0.18
0.22
0.28
0.35
0.42
Paperproducts
0.15
0.33
0.07
0.01
0.02
0.03
0.06
0.07
0.10
0.14
0.18
0.24
0.29
Chemicalproducts
0.68
0.17
0.12
0.07
0.07
0.11
0.14
0.17
0.24
0.26
0.23
0.29
0.28
Transitequipment
0.50
0.12
0.06
0.08
0.14
0.20
0.14
0.18
0.18
0.24
0.27
0.32
0.38
Textilesmaterials
0.14
0.06
0.12
0.14
0.17
0.13
0.19
0.24
0.32
0.40
0.38
0.46
0.46
Papermaterials
0.07
0.02
0.06
0.10
0.11
0.18
0.22
0.19
0.26
0.33
0.30
0.24
0.29
Chemicalmaterials
0.65
0.01
0.02
0.03
0.06
0.06
0.08
0.12
0.18
0.24
0.30
0.27
0.22
Motorvehiclesandparts
0.71
0.02
0.04
0.02
0.04
0.06
0.07
0.10
0.13
0.11
0.13
0.15
0.20
Food,beverageandtobacco
0.25
0.13
0.24
0.31
0.28
0.20
0.24
0.19
0.23
0.30
0.37
0.46
0.54
Textilesandproducts
0.18
0.07
0.13
0.17
0.26
0.33
0.42
0.48
0.57
0.64
0.72
0.69
0.76
Apparelandleathergoods
0.10
0.25
0.31
0.42
0.52
0.47
0.59
0.61
0.62
0.67
0.69
0.76
0.82
Paper
0.05
0.02
0.06
0.10
0.11
0.17
0.18
0.23
0.29
0.33
0.34
0.30
0.37
Printingandrelated
0.07
0.08
0.14
0.18
0.28
0.28
0.37
0.47
0.57
0.64
0.71
0.76
0.80
Chemicals
0.79
0.00
0.00
0.01
0.01
0.01
0.03
0.03
0.06
0.08
0.11
0.11
0.11
Petroleumandcoal
0.27
0.12
0.23
0.26
0.38
0.50
0.61
0.70
0.78
0.85
0.90
0.92
0.95
Plasticsandrubber
0.07
0.18
0.25
0.29
0.42
0.54
0.64
0.74
0.79
0.84
0.74
0.57
0.63
Furniture
0.03
0.09
0.17
0.28
0.35
0.42
0.38
0.41
0.48
0.58
0.65
0.63
0.55
Primarymetal
0.52
0.20
0.19
0.26
0.38
0.48
0.54
0.63
0.52
0.61
0.68
0.75
0.81
Fabricatedmetal
0.16
0.19
0.26
0.34
0.47
0.60
0.67
0.76
0.81
0.85
0.90
0.88
0.92
Machinery
0.10
0.06
0.14
0.23
0.12
0.17
0.25
0.31
0.37
0.45
0.52
0.54
0.61
Electricalequipment
0.13
0.28
0.46
0.50
0.64
0.74
0.75
0.75
0.82
0.85
0.90
0.36
0.32
Motorvehicles
0.88
0.03
0.06
0.07
0.12
0.18
0.15
0.18
0.22
0.19
0.24
0.28
0.32
Manufacturing(NAICS)
0.10
0.03
0.06
0.09
0.15
0.20
0.12
0.17
0.18
0.23
0.30
0.36
0.43
Notes:basedon1000simulationsofmodel(5)where# =1 .p-valuesarebasedonthe2 +1Boldanditalicsdenotesignificanceatthe5%and
10%level,respectively.

TableA.17.IRFbasedtestofnonlinearityfor1s.d.shocktotherealoilprice
³ # =12
´ -1973-2009subsample
Horizon
Sector
01
23
45
67
89
10
11
12
Totalindex
0.12
0.09
0.18
0.29
0.37
0.47
0.50
0.56
0.56
0.65
0.74
0.70
0.74
Foodsandtobacco
0.42
0.62
0.81
0.87
0.77
0.80
0.77
0.84
0.83
0.88
0.92
0.94
0.96
Clothing
0.86
0.50
0.11
0.19
0.29
0.37
0.47
0.42
0.52
0.58
0.66
0.72
0.71
Durableconsumergoods
0.22
0.30
0.49
0.66
0.73
0.83
0.84
0.88
0.93
0.93
0.96
0.91
0.94
Miscellaneousdurablegoods
0.07
0.12
0.14
0.24
0.32
0.40
0.44
0.54
0.63
0.62
0.65
0.72
0.78
Nondurableconsumergoods
0.31
0.59
0.45
0.46
0.56
0.67
0.65
0.67
0.70
0.78
0.84
0.88
0.92
Manufacturing(SIC)
0.14
0.06
0.10
0.16
0.22
0.32
0.39
0.39
0.48
0.56
0.64
0.67
0.74
Paperproducts
0.42
0.49
0.69
0.31
0.44
0.57
0.42
0.47
0.55
0.51
0.50
0.58
0.66
Chemicalproducts
0.22
0.44
0.57
0.44
0.58
0.70
0.76
0.83
0.89
0.89
0.93
0.96
0.97
Transitequipment
0.23
0.13
0.23
0.34
0.42
0.33
0.43
0.47
0.35
0.39
0.46
0.44
0.48
Textilesmaterials
0.07
0.16
0.29
0.35
0.46
0.44
0.34
0.37
0.41
0.48
0.57
0.65
0.70
Papermaterials
0.04
0.11
0.15
0.14
0.23
0.34
0.44
0.55
0.64
0.70
0.77
0.81
0.86
Chemicalmaterials
0.46
0.12
0.18
0.17
0.27
0.31
0.40
0.41
0.50
0.60
0.68
0.63
0.69
Motorvehiclesandparts
0.27
0.12
0.16
0.27
0.32
0.41
0.52
0.48
0.54
0.51
0.58
0.67
0.73
Food,beverageandtobacco
0.32
0.48
0.69
0.77
0.70
0.63
0.63
0.72
0.70
0.76
0.83
0.86
0.90
Textilesandproducts
0.93
0.78
0.17
0.28
0.40
0.50
0.60
0.55
0.64
0.65
0.73
0.80
0.74
Apparelandleathergoods
0.03
0.10
0.12
0.15
0.23
0.33
0.44
0.54
0.63
0.72
0.77
0.82
0.87
Paper
0.04
0.11
0.20
0.22
0.32
0.35
0.44
0.49
0.55
0.61
0.70
0.75
0.81
Printingandrelated
0.17
0.10
0.18
0.29
0.42
0.39
0.46
0.48
0.49
0.58
0.66
0.71
0.74
Chemicals
0.06
0.09
0.17
0.12
0.20
0.29
0.36
0.43
0.53
0.60
0.64
0.68
0.75
Petroleumandcoal
0.27
0.38
0.49
0.61
0.75
0.83
0.73
0.77
0.82
0.87
0.83
0.88
0.92
Plasticsandrubber
0.03
0.11
0.20
0.26
0.38
0.33
0.44
0.43
0.51
0.54
0.62
0.69
0.75
Furniture
0.03
0.11
0.20
0.26
0.38
0.33
0.44
0.43
0.51
0.54
0.62
0.69
0.75
Primarymetal
0.05
0.05
0.08
0.14
0.22
0.31
0.40
0.48
0.55
0.58
0.55
0.60
0.63
Fabricatedmetal
0.19
0.03
0.06
0.11
0.16
0.21
0.29
0.37
0.43
0.47
0.56
0.63
0.71
Machinery
0.07
0.15
0.28
0.40
0.52
0.64
0.70
0.77
0.84
0.74
0.81
0.82
0.87
Electricalequipment
0.07
0.15
0.28
0.40
0.52
0.64
0.70
0.77
0.84
0.74
0.81
0.82
0.87
Motorvehicles
0.17
0.09
0.16
0.25
0.34
0.43
0.54
0.60
0.69
0.67
0.70
0.77
0.81
Manufacturing(NAICS)
0.16
0.06
0.09
0.16
0.22
0.31
0.39
0.40
0.49
0.56
0.65
0.67
0.74
Notes:basedon1000simulationsofmodel(5)where# =12.p-valuesarebasedonthe2 +1Boldanditalicsdenotesignificanceatthe5%and
10%level,respectively.

TableA.18.IRFbasedtestofnonlinearityfor1s.d.shocktotherealoilprice
³ # =36
´ -1973-2009subsample
Horizon
Sector
01
23
45
67
89
10
11
12
Totalindex
0.88
0.18
0.26
0.39
0.50
0.63
0.65
0.71
0.75
0.81
0.86
0.79
0.80
Foodsandtobacco
0.28
0.11
0.22
0.35
0.42
0.16
0.06
0.09
0.12
0.16
0.22
0.27
0.33
Clothing
0.80
0.25
0.17
0.14
0.21
0.25
0.34
0.31
0.39
0.48
0.54
0.62
0.67
Durableconsumergoods
0.99
0.08
0.17
0.25
0.24
0.15
0.22
0.26
0.34
0.43
0.52
0.60
0.66
Miscellaneousdurablegoods
0.15
0.13
0.05
0.08
0.12
0.18
0.26
0.34
0.43
0.52
0.61
0.68
0.63
Nondurableconsumergoods
0.41
0.26
0.44
0.60
0.66
0.77
0.76
0.82
0.88
0.90
0.93
0.96
0.97
Manufacturing(SIC)
0.53
0.06
0.05
0.08
0.13
0.16
0.21
0.15
0.20
0.26
0.28
0.32
0.26
Paperproducts
0.69
0.37
0.55
0.72
0.61
0.73
0.21
0.24
0.31
0.29
0.35
0.43
0.47
Chemicalproducts
0.19
0.28
0.06
0.11
0.16
0.24
0.29
0.33
0.42
0.51
0.56
0.64
0.62
Transitequipment
0.02
0.00
0.00
0.01
0.02
0.02
0.01
0.01
0.01
0.02
0.03
0.00
0.00
Textilesmaterials
0.20
0.29
0.40
0.44
0.19
0.28
0.20
0.25
0.33
0.40
0.45
0.41
0.48
Papermaterials
0.31
0.31
0.23
0.26
0.30
0.36
0.30
0.38
0.48
0.57
0.66
0.74
0.72
Chemicalmaterials
0.79
0.20
0.16
0.07
0.12
0.17
0.08
0.13
0.18
0.20
0.26
0.26
0.26
Motorvehiclesandparts
0.34
0.02
0.05
0.07
0.12
0.07
0.11
0.15
0.20
0.25
0.32
0.38
0.39
Food,beverageandtobacco
0.35
0.12
0.24
0.37
0.43
0.07
0.03
0.05
0.07
0.10
0.14
0.18
0.24
Textilesandproducts
0.81
0.19
0.29
0.32
0.43
0.35
0.46
0.57
0.63
0.68
0.76
0.77
0.82
Apparelandleathergoods
0.89
0.50
0.52
0.38
0.48
0.57
0.68
0.52
0.59
0.68
0.76
0.82
0.84
Paper
0.27
0.24
0.12
0.15
0.16
0.22
0.19
0.24
0.29
0.37
0.45
0.54
0.59
Printingandrelated
0.10
0.21
0.38
0.47
0.45
0.34
0.44
0.45
0.54
0.64
0.71
0.71
0.66
Chemicals
0.35
0.07
0.01
0.02
0.03
0.06
0.08
0.12
0.15
0.15
0.21
0.19
0.22
Petroleumandcoal
0.05
0.06
0.09
0.01
0.01
0.01
0.01
0.02
0.03
0.04
0.07
0.07
0.10
Plasticsandrubber
0.96
0.31
0.50
0.62
0.72
0.81
0.20
0.17
0.14
0.02
0.03
0.05
0.07
Furniture
0.11
0.16
0.28
0.42
0.56
0.19
0.26
0.25
0.28
0.36
0.39
0.46
0.54
Primarymetal
0.06
0.15
0.14
0.08
0.13
0.20
0.21
0.21
0.16
0.19
0.09
0.11
0.13
Fabricatedmetal
0.18
0.11
0.02
0.05
0.06
0.10
0.15
0.19
0.27
0.35
0.24
0.27
0.33
Machinery
0.08
0.14
0.08
0.07
0.11
0.06
0.09
0.13
0.13
0.18
0.12
0.13
0.11
Electricalequipment
0.20
0.39
0.59
0.66
0.78
0.87
0.68
0.67
0.72
0.76
0.40
0.47
0.37
Motorvehicles
0.94
0.08
0.15
0.17
0.24
0.09
0.13
0.17
0.21
0.26
0.33
0.39
0.46
Manufacturing(NAICS)
0.57
0.06
0.05
0.08
0.13
0.16
0.20
0.16
0.21
0.27
0.28
0.32
0.26
Notes:basedon1000simulationsofmodel(5)where# =36.p-valuesarebasedonthe2 +1Boldanditalicsdenotesignificanceatthe5%and
10%level,respectively.

TableA.19.IRFbasedtestofsymmetryfor2s.d.shocktotherealoilprice
³ # =1
´ -1973-2009subsample
Horizon
Sector
01
23
45
67
89
10
11
12
Totalindex
0.01
0.01
0.02
0.03
0.05
0.03
0.02
0.02
0.00
0.00
0.00
0.00
0.00
Foodsandtobacco
0.26
0.51
0.72
0.85
0.79
0.65
0.57
0.62
0.59
0.60
0.51
0.58
0.66
Clothing
0.06
0.14
0.09
0.15
0.18
0.05
0.08
0.03
0.03
0.04
0.04
0.06
0.08
Durableconsumergoods
0.09
0.03
0.07
0.01
0.02
0.03
0.00
0.00
0.00
0.00
0.00
0.00
0.00
Miscellaneousdurablegoods
0.01
0.04
0.04
0.08
0.14
0.21
0.27
0.32
0.40
0.50
0.56
0.39
0.46
Nondurableconsumergoods
0.11
0.24
0.41
0.57
0.57
0.41
0.35
0.46
0.53
0.51
0.54
0.50
0.53
Manufacturing(SIC)
0.06
0.00
0.01
0.01
0.02
0.02
0.00
0.01
0.00
0.01
0.01
0.01
0.02
Paperproducts
0.16
0.34
0.06
0.00
0.00
0.00
0.00
0.00
0.00
0.00
0.01
0.01
0.01
Chemicalproducts
0.70
0.12
0.11
0.01
0.01
0.02
0.01
0.02
0.03
0.01
0.00
0.00
0.00
Transitequipment
0.54
0.10
0.02
0.03
0.06
0.09
0.01
0.01
0.00
0.01
0.01
0.01
0.01
Textilesmaterials
0.14
0.04
0.08
0.08
0.09
0.02
0.03
0.03
0.06
0.07
0.04
0.06
0.05
Papermaterials
0.07
0.01
0.03
0.06
0.08
0.12
0.16
0.11
0.16
0.20
0.17
0.09
0.08
Chemicalmaterials
0.66
0.00
0.01
0.01
0.02
0.01
0.01
0.01
0.01
0.02
0.02
0.00
0.00
Motorvehiclesandparts
0.72
0.00
0.01
0.00
0.00
0.00
0.00
0.00
0.00
0.00
0.00
0.00
0.00
Food,beverageandtobacco
0.28
0.10
0.18
0.24
0.17
0.06
0.07
0.03
0.04
0.04
0.06
0.08
0.11
Textilesandproducts
0.18
0.04
0.06
0.06
0.10
0.13
0.19
0.21
0.28
0.34
0.42
0.34
0.41
Apparelandleathergoods
0.06
0.18
0.16
0.23
0.28
0.11
0.17
0.10
0.11
0.13
0.14
0.18
0.23
Paper
0.04
0.01
0.01
0.03
0.03
0.06
0.07
0.10
0.13
0.13
0.10
0.04
0.06
Printingandrelated
0.04
0.03
0.04
0.04
0.07
0.07
0.11
0.15
0.21
0.25
0.31
0.25
0.26
Chemicals
0.80
0.00
0.00
0.00
0.00
0.00
0.00
0.00
0.00
0.00
0.00
0.00
0.00
Petroleumandcoal
0.29
0.11
0.20
0.24
0.36
0.48
0.59
0.66
0.75
0.82
0.87
0.89
0.92
Plasticsandrubber
0.07
0.19
0.20
0.18
0.28
0.38
0.49
0.60
0.62
0.68
0.38
0.06
0.07
Furniture
0.02
0.06
0.11
0.19
0.22
0.29
0.09
0.12
0.15
0.20
0.25
0.22
0.11
Primarymetal
0.54
0.19
0.18
0.26
0.37
0.48
0.52
0.60
0.37
0.46
0.52
0.58
0.64
Fabricatedmetal
0.16
0.14
0.18
0.23
0.33
0.45
0.54
0.62
0.68
0.73
0.79
0.74
0.80
Machinery
0.08
0.04
0.08
0.14
0.03
0.06
0.09
0.11
0.09
0.12
0.15
0.14
0.17
Electricalequipment
0.13
0.25
0.41
0.40
0.54
0.64
0.56
0.50
0.57
0.59
0.68
0.04
0.04
Motorvehicles
0.89
0.01
0.02
0.00
0.01
0.02
0.01
0.01
0.01
0.00
0.00
0.00
0.00
Manufacturing(NAICS)
0.07
0.00
0.01
0.01
0.02
0.02
0.00
0.01
0.01
0.01
0.01
0.01
0.02
Notes:basedon1000simulationsofmodel(5)where# =1 .p-valuesarebasedonthe2 +1Boldanditalicsdenotesignificanceatthe5%and
10%level,respectively.

TableA.20.IRFbasedtestofnonlinearityfor2s.d.shocktotherealoilprice
³ # =12
´ -1973-2009subsample
Horizon
Sector
01
23
45
67
89
10
11
12
Totalindex
0.24
0.06
0.11
0.16
0.15
0.24
0.23
0.31
0.31
0.40
0.39
0.04
0.03
Foodsandtobacco
0.64
0.89
0.94
0.98
0.40
0.48
0.29
0.38
0.31
0.40
0.46
0.51
0.54
Clothing
0.84
0.37
0.01
0.03
0.06
0.08
0.11
0.06
0.09
0.09
0.09
0.06
0.03
Durableconsumergoods
0.07
0.00
0.01
0.02
0.03
0.06
0.03
0.04
0.07
0.09
0.12
0.07
0.07
Miscellaneousdurablegoods
0.01
0.00
0.01
0.01
0.02
0.03
0.01
0.01
0.02
0.02
0.01
0.00
0.00
Nondurableconsumergoods
0.22
0.44
0.15
0.09
0.08
0.13
0.02
0.02
0.02
0.03
0.03
0.02
0.02
Manufacturing(SIC)
0.04
0.00
0.00
0.00
0.00
0.01
0.01
0.01
0.01
0.02
0.02
0.00
0.00
Paperproducts
0.31
0.34
0.54
0.08
0.11
0.17
0.01
0.02
0.03
0.02
0.01
0.01
0.01
Chemicalproducts
0.11
0.23
0.35
0.21
0.31
0.42
0.43
0.42
0.48
0.33
0.35
0.39
0.38
Transitequipment
0.18
0.03
0.06
0.11
0.11
0.02
0.02
0.03
0.01
0.00
0.00
0.00
0.00
Textilesmaterials
0.01
0.04
0.08
0.05
0.09
0.05
0.01
0.01
0.01
0.01
0.02
0.02
0.00
Papermaterials
0.01
0.02
0.01
0.01
0.01
0.02
0.03
0.04
0.06
0.04
0.07
0.07
0.01
Chemicalmaterials
0.38
0.01
0.02
0.02
0.03
0.03
0.05
0.05
0.06
0.09
0.10
0.01
0.01
Motorvehiclesandparts
0.23
0.03
0.01
0.01
0.01
0.01
0.01
0.01
0.02
0.03
0.04
0.05
0.07
Food,beverageandtobacco
0.22
0.32
0.51
0.55
0.21
0.14
0.03
0.03
0.02
0.03
0.04
0.07
0.09
Textilesandproducts
0.06
0.12
0.23
0.30
0.06
0.02
0.01
0.02
0.03
0.04
0.06
0.01
0.00
Apparelandleathergoods
0.94
0.70
0.04
0.07
0.12
0.17
0.21
0.13
0.19
0.14
0.16
0.16
0.06
Paper
0.00
0.00
0.00
0.00
0.00
0.01
0.01
0.01
0.02
0.02
0.03
0.02
0.01
Printingandrelated
0.01
0.00
0.00
0.00
0.00
0.00
0.00
0.01
0.01
0.01
0.02
0.03
0.01
Chemicals
0.11
0.01
0.01
0.03
0.04
0.03
0.05
0.06
0.04
0.06
0.06
0.06
0.07
Petroleumandcoal
0.02
0.03
0.06
0.01
0.01
0.01
0.02
0.02
0.03
0.03
0.05
0.07
0.03
Plasticsandrubber
0.20
0.23
0.22
0.17
0.27
0.33
0.04
0.07
0.08
0.11
0.00
0.00
0.00
Furniture
0.00
0.01
0.01
0.02
0.04
0.00
0.00
0.00
0.01
0.01
0.01
0.00
0.00
Primarymetal
0.09
0.04
0.09
0.14
0.20
0.22
0.11
0.10
0.12
0.15
0.06
0.06
0.05
Fabricatedmetal
0.01
0.00
0.00
0.00
0.00
0.00
0.00
0.00
0.01
0.01
0.00
0.00
0.00
Machinery
0.07
0.00
0.00
0.00
0.00
0.00
0.00
0.00
0.00
0.00
0.00
0.00
0.00
Electricalequipment
0.02
0.02
0.05
0.09
0.11
0.14
0.12
0.17
0.22
0.04
0.02
0.00
0.00
Motorvehicles
0.11
0.00
0.00
0.01
0.01
0.01
0.01
0.01
0.02
0.03
0.05
0.07
0.06
Manufacturing(NAICS)
0.06
0.00
0.00
0.00
0.00
0.01
0.01
0.01
0.01
0.02
0.02
0.00
0.00
Notes:basedon1000simulationsofmodel(5)where# =12.p-valuesarebasedonthe2 +1Boldanditalicsdenotesignificanceatthe5%and
10%level,respectively.

TableA.21.IRFbasedtestofnonlinearityfor2s.d.shocktotherealoilprice
³ # =36
´ -1973-2009subsample
Horizon
Sector
01
23
45
67
89
10
11
12
Totalindex
0.67
0.03
0.06
0.03
0.06
0.11
0.05
0.07
0.11
0.15
0.14
0.06
0.09
Foodsandtobacco
0.30
0.17
0.32
0.43
0.35
0.30
0.12
0.10
0.14
0.17
0.23
0.29
0.36
Clothing
0.88
0.27
0.29
0.23
0.34
0.28
0.37
0.28
0.36
0.45
0.50
0.55
0.63
Durableconsumergoods
0.67
0.09
0.16
0.26
0.35
0.35
0.25
0.34
0.35
0.43
0.52
0.34
0.35
Miscellaneousdurablegoods
0.17
0.06
0.10
0.12
0.15
0.19
0.20
0.27
0.35
0.35
0.28
0.30
0.38
Nondurableconsumergoods
0.53
0.20
0.28
0.37
0.51
0.63
0.28
0.37
0.46
0.56
0.59
0.64
0.69
Manufacturing(SIC)
0.56
0.02
0.06
0.06
0.08
0.13
0.03
0.06
0.08
0.09
0.11
0.07
0.10
Paperproducts
0.77
0.43
0.64
0.79
0.66
0.77
0.06
0.08
0.11
0.11
0.09
0.11
0.13
Chemicalproducts
0.29
0.29
0.10
0.13
0.20
0.28
0.38
0.47
0.57
0.60
0.62
0.68
0.65
Transitequipment
0.06
0.03
0.06
0.11
0.12
0.08
0.12
0.17
0.15
0.18
0.23
0.07
0.09
Textilesmaterials
0.23
0.43
0.49
0.43
0.38
0.38
0.39
0.44
0.53
0.61
0.69
0.60
0.65
Papermaterials
0.31
0.49
0.32
0.40
0.41
0.54
0.37
0.37
0.42
0.43
0.46
0.52
0.60
Chemicalmaterials
0.79
0.06
0.11
0.02
0.04
0.06
0.05
0.07
0.11
0.14
0.14
0.04
0.06
Motorvehiclesandparts
0.49
0.04
0.03
0.06
0.10
0.06
0.06
0.10
0.13
0.19
0.25
0.24
0.31
Food,beverageandtobacco
0.37
0.17
0.30
0.39
0.31
0.20
0.06
0.06
0.09
0.12
0.16
0.21
0.26
Textilesandproducts
0.89
0.20
0.36
0.31
0.36
0.31
0.42
0.53
0.51
0.57
0.66
0.65
0.63
Apparelandleathergoods
0.98
0.58
0.69
0.57
0.55
0.53
0.64
0.44
0.54
0.62
0.68
0.73
0.78
Paper
0.28
0.44
0.17
0.26
0.27
0.39
0.28
0.23
0.30
0.30
0.35
0.42
0.50
Printingandrelated
0.11
0.18
0.24
0.17
0.11
0.16
0.20
0.26
0.30
0.36
0.39
0.47
0.50
Chemicals
0.42
0.02
0.02
0.02
0.03
0.05
0.07
0.11
0.11
0.16
0.18
0.11
0.13
Petroleumandcoal
0.04
0.11
0.15
0.03
0.06
0.10
0.11
0.15
0.18
0.25
0.21
0.27
0.25
Plasticsandrubber
0.95
0.33
0.42
0.38
0.52
0.59
0.06
0.09
0.13
0.04
0.06
0.05
0.03
Furniture
0.09
0.21
0.36
0.51
0.65
0.18
0.21
0.28
0.36
0.45
0.40
0.46
0.36
Primarymetal
0.06
0.13
0.21
0.18
0.21
0.24
0.10
0.14
0.11
0.14
0.08
0.11
0.15
Fabricatedmetal
0.20
0.04
0.07
0.14
0.15
0.20
0.23
0.32
0.37
0.46
0.32
0.39
0.45
Machinery
0.09
0.05
0.11
0.11
0.14
0.13
0.18
0.14
0.20
0.26
0.25
0.31
0.21
Electricalequipment
0.21
0.31
0.49
0.56
0.64
0.68
0.28
0.36
0.45
0.54
0.39
0.33
0.41
Motorvehicles
0.96
0.07
0.06
0.10
0.15
0.03
0.04
0.06
0.07
0.10
0.13
0.15
0.17
Manufacturing(NAICS)
0.60
0.03
0.07
0.07
0.09
0.14
0.04
0.06
0.09
0.11
0.11
0.08
0.11
Notes:basedon1000simulationsofmodel(5)where# =36.p-valuesarebasedonthe2 +1Boldanditalicsdenotesignificanceatthe5%and
10%level,respectively.

TableA.22.IRFbasedtestofsymmetryfor1s.d.shocktothenominaloilprice(# =1 )-1973-2009subsample
Horizon
Sector
01
23
45
67
89
10
11
12
Totalindex
0.01
0.02
0.06
0.11
0.15
0.15
0.18
0.18
0.11
0.15
0.21
0.26
0.32
Foodsandtobacco
0.24
0.50
0.71
0.84
0.77
0.67
0.58
0.67
0.66
0.63
0.61
0.68
0.75
Clothing
0.35
0.42
0.11
0.18
0.24
0.27
0.32
0.20
0.24
0.32
0.40
0.32
0.38
Durableconsumergoods
0.06
0.11
0.22
0.25
0.37
0.39
0.35
0.21
0.15
0.20
0.26
0.17
0.21
Miscellaneousdurablegoods
0.11
0.25
0.35
0.43
0.56
0.68
0.62
0.66
0.75
0.81
0.81
0.86
0.88
Nondurableconsumergoods
0.07
0.19
0.34
0.50
0.63
0.37
0.42
0.44
0.48
0.49
0.41
0.40
0.47
Manufacturing(SIC)
0.03
0.04
0.08
0.14
0.23
0.26
0.30
0.32
0.20
0.26
0.33
0.34
0.41
Paperproducts
0.18
0.38
0.06
0.01
0.02
0.03
0.06
0.08
0.11
0.14
0.19
0.24
0.31
Chemicalproducts
0.64
0.16
0.11
0.08
0.07
0.12
0.16
0.20
0.27
0.27
0.26
0.33
0.33
Transitequipment
0.60
0.16
0.07
0.09
0.16
0.24
0.18
0.23
0.21
0.28
0.32
0.35
0.41
Textilesmaterials
0.14
0.06
0.13
0.16
0.21
0.16
0.23
0.27
0.35
0.44
0.39
0.47
0.50
Papermaterials
0.12
0.02
0.06
0.10
0.12
0.19
0.24
0.21
0.29
0.36
0.31
0.24
0.28
Chemicalmaterials
0.71
0.01
0.02
0.03
0.06
0.07
0.09
0.13
0.19
0.25
0.31
0.31
0.25
Motorvehiclesandparts
0.70
0.02
0.04
0.02
0.04
0.07
0.08
0.11
0.14
0.12
0.15
0.18
0.23
Food,beverageandtobacco
0.24
0.15
0.27
0.31
0.28
0.21
0.26
0.20
0.24
0.29
0.37
0.45
0.53
Textilesandproducts
0.18
0.08
0.14
0.18
0.27
0.35
0.42
0.47
0.56
0.64
0.72
0.68
0.75
Apparelandleathergoods
0.11
0.28
0.35
0.47
0.56
0.49
0.60
0.63
0.66
0.70
0.72
0.78
0.84
Paper
0.08
0.02
0.06
0.11
0.13
0.20
0.22
0.27
0.34
0.38
0.37
0.33
0.40
Printingandrelated
0.07
0.09
0.14
0.18
0.28
0.29
0.37
0.46
0.56
0.62
0.69
0.74
0.79
Chemicals
0.81
0.00
0.00
0.01
0.01
0.01
0.02
0.03
0.05
0.07
0.10
0.11
0.12
Petroleumandcoal
0.20
0.09
0.19
0.19
0.30
0.40
0.52
0.62
0.71
0.79
0.85
0.87
0.91
Plasticsandrubber
0.08
0.18
0.24
0.31
0.44
0.57
0.67
0.77
0.82
0.88
0.79
0.61
0.67
Furniture
0.03
0.09
0.17
0.29
0.36
0.45
0.43
0.47
0.56
0.65
0.69
0.68
0.61
Primarymetal
0.61
0.16
0.15
0.22
0.32
0.40
0.48
0.55
0.47
0.57
0.65
0.72
0.79
Fabricatedmetal
0.14
0.17
0.26
0.34
0.47
0.60
0.67
0.76
0.82
0.86
0.91
0.89
0.92
Machinery
0.13
0.07
0.16
0.26
0.14
0.20
0.28
0.34
0.40
0.48
0.56
0.58
0.65
Electricalequipment
0.12
0.26
0.43
0.49
0.62
0.74
0.79
0.80
0.86
0.90
0.93
0.42
0.34
Motorvehicles
0.81
0.03
0.07
0.07
0.12
0.18
0.17
0.20
0.24
0.25
0.31
0.37
0.42
Manufacturing(NAICS)
0.11
0.03
0.06
0.09
0.16
0.19
0.13
0.19
0.20
0.25
0.33
0.39
0.47
Notes:basedon1000simulationsofmodel(5)where# =1 .p-valuesarebasedonthe2 +1Boldanditalicsdenotesignificanceatthe5%and
10%level,respectively.

TableA.23.IRFbasedtestofnonlinearityfor1s.d.shocktothenominaloilprice
³ # =12
´ -1973-2009subsample
Horizon
Sector
01
23
45
67
89
10
11
12
Totalindex
0.04
0.04
0.08
0.14
0.16
0.20
0.22
0.27
0.23
0.31
0.38
0.36
0.37
Foodsandtobacco
0.34
0.47
0.68
0.82
0.62
0.59
0.49
0.59
0.46
0.53
0.62
0.66
0.73
Clothing
0.90
0.47
0.04
0.09
0.14
0.17
0.22
0.19
0.27
0.34
0.42
0.49
0.44
Durableconsumergoods
0.03
0.04
0.09
0.15
0.22
0.31
0.39
0.46
0.53
0.51
0.60
0.64
0.71
Miscellaneousdurablegoods
0.02
0.04
0.02
0.06
0.07
0.11
0.16
0.23
0.30
0.34
0.40
0.47
0.53
Nondurableconsumergoods
0.14
0.33
0.34
0.37
0.46
0.54
0.47
0.44
0.42
0.51
0.58
0.66
0.73
Manufacturing(SIC)
0.05
0.03
0.04
0.08
0.11
0.15
0.20
0.21
0.25
0.33
0.41
0.39
0.45
Paperproducts
0.29
0.32
0.50
0.11
0.18
0.24
0.23
0.27
0.32
0.31
0.27
0.33
0.41
Chemicalproducts
0.18
0.38
0.51
0.35
0.46
0.58
0.64
0.67
0.76
0.76
0.83
0.88
0.91
Transitequipment
0.97
0.34
0.22
0.31
0.40
0.31
0.42
0.48
0.29
0.35
0.41
0.24
0.22
Textilesmaterials
0.04
0.06
0.11
0.15
0.22
0.17
0.11
0.12
0.12
0.14
0.17
0.20
0.26
Papermaterials
0.02
0.07
0.06
0.02
0.04
0.06
0.11
0.15
0.19
0.20
0.22
0.27
0.34
Chemicalmaterials
0.28
0.06
0.08
0.12
0.19
0.18
0.21
0.22
0.29
0.38
0.46
0.47
0.51
Motorvehiclesandparts
0.11
0.06
0.11
0.20
0.22
0.31
0.41
0.39
0.42
0.38
0.46
0.54
0.62
Food,beverageandtobacco
0.23
0.33
0.52
0.68
0.56
0.38
0.33
0.42
0.26
0.31
0.39
0.43
0.51
Textilesandproducts
0.08
0.21
0.34
0.49
0.39
0.11
0.13
0.18
0.24
0.31
0.38
0.42
0.46
Apparelandleathergoods
0.81
0.74
0.10
0.17
0.22
0.25
0.32
0.29
0.38
0.44
0.52
0.61
0.50
Paper
0.01
0.04
0.03
0.02
0.03
0.04
0.07
0.11
0.15
0.18
0.21
0.26
0.31
Printingandrelated
0.02
0.04
0.10
0.12
0.19
0.18
0.25
0.32
0.39
0.39
0.48
0.55
0.62
Chemicals
0.11
0.06
0.09
0.16
0.25
0.20
0.25
0.28
0.30
0.38
0.47
0.52
0.52
Petroleumandcoal
0.08
0.10
0.16
0.09
0.15
0.22
0.29
0.37
0.47
0.47
0.55
0.53
0.61
Plasticsandrubber
0.06
0.09
0.19
0.31
0.44
0.57
0.53
0.58
0.58
0.67
0.60
0.67
0.70
Furniture
0.01
0.02
0.06
0.07
0.12
0.09
0.14
0.11
0.14
0.20
0.26
0.33
0.39
Primarymetal
0.45
0.13
0.25
0.37
0.51
0.64
0.67
0.50
0.60
0.65
0.39
0.46
0.54
Fabricatedmetal
0.01
0.01
0.01
0.02
0.03
0.06
0.10
0.13
0.18
0.22
0.22
0.22
0.27
Machinery
0.15
0.01
0.02
0.03
0.06
0.07
0.12
0.17
0.20
0.22
0.29
0.33
0.41
Electricalequipment
0.03
0.08
0.16
0.25
0.26
0.37
0.43
0.38
0.47
0.41
0.49
0.50
0.56
Motorvehicles
0.05
0.06
0.11
0.18
0.22
0.30
0.41
0.45
0.53
0.55
0.57
0.65
0.72
Manufacturing(NAICS)
0.06
0.03
0.04
0.08
0.11
0.16
0.21
0.22
0.26
0.34
0.42
0.40
0.47
Notes:basedon1000simulationsofmodel(5)where# =12.p-valuesarebasedonthe2 +1Boldanditalicsdenotesignificanceatthe5%and
10%level,respectively.

TableA.24.IRFbasedtestofnonlinearityfor1s.d.shocktothenominaloilprice
³ # =36
´ -1973-2009subsample
Horizon
Sector
01
23
45
67
89
10
11
12
Totalindex
0.47
0.11
0.11
0.09
0.15
0.18
0.19
0.15
0.20
0.25
0.25
0.29
0.29
Foodsandtobacco
0.05
0.03
0.07
0.11
0.12
0.07
0.06
0.08
0.13
0.16
0.22
0.27
0.33
Clothing
0.56
0.35
0.17
0.20
0.31
0.25
0.33
0.33
0.40
0.48
0.57
0.63
0.71
Durableconsumergoods
0.12
0.21
0.35
0.51
0.65
0.61
0.66
0.54
0.64
0.72
0.76
0.82
0.86
Miscellaneousdurablegoods
0.27
0.17
0.05
0.06
0.10
0.15
0.22
0.28
0.36
0.44
0.51
0.60
0.67
Nondurableconsumergoods
0.18
0.09
0.18
0.30
0.43
0.54
0.35
0.33
0.41
0.51
0.52
0.60
0.66
Manufacturing(SIC)
0.39
0.10
0.06
0.06
0.11
0.15
0.17
0.13
0.19
0.25
0.27
0.34
0.35
Paperproducts
0.82
0.82
0.94
0.98
0.88
0.94
0.29
0.33
0.41
0.47
0.51
0.59
0.64
Chemicalproducts
0.44
0.29
0.20
0.30
0.37
0.49
0.59
0.67
0.75
0.82
0.84
0.89
0.88
Transitequipment
0.30
0.15
0.13
0.17
0.19
0.22
0.30
0.36
0.39
0.47
0.48
0.36
0.02
Textilesmaterials
0.35
0.58
0.70
0.76
0.61
0.62
0.49
0.40
0.40
0.45
0.54
0.57
0.65
Papermaterials
0.23
0.13
0.18
0.23
0.35
0.47
0.34
0.44
0.54
0.63
0.71
0.78
0.78
Chemicalmaterials
0.95
0.20
0.11
0.06
0.06
0.10
0.10
0.10
0.11
0.11
0.11
0.14
0.17
Motorvehiclesandparts
0.21
0.38
0.54
0.70
0.81
0.69
0.72
0.68
0.71
0.68
0.75
0.82
0.85
Food,beverageandtobacco
0.08
0.05
0.11
0.17
0.15
0.06
0.05
0.08
0.12
0.16
0.21
0.27
0.34
Textilesandproducts
0.43
0.14
0.16
0.14
0.22
0.16
0.20
0.16
0.15
0.16
0.21
0.28
0.35
Apparelandleathergoods
0.67
0.60
0.46
0.52
0.60
0.55
0.67
0.64
0.73
0.80
0.86
0.88
0.90
Paper
0.18
0.16
0.12
0.20
0.29
0.39
0.27
0.35
0.44
0.53
0.62
0.70
0.73
Printingandrelated
0.10
0.25
0.42
0.38
0.49
0.52
0.60
0.69
0.78
0.84
0.88
0.81
0.82
Chemicals
0.75
0.06
0.01
0.02
0.04
0.06
0.07
0.08
0.08
0.08
0.11
0.14
0.15
Petroleumandcoal
0.06
0.12
0.16
0.08
0.14
0.21
0.19
0.26
0.31
0.39
0.48
0.56
0.64
Plasticsandrubber
0.72
0.45
0.66
0.79
0.87
0.93
0.26
0.25
0.26
0.12
0.17
0.20
0.23
Furniture
0.25
0.50
0.70
0.78
0.88
0.29
0.37
0.37
0.43
0.52
0.54
0.62
0.69
Primarymetal
0.61
0.34
0.28
0.31
0.37
0.48
0.47
0.50
0.46
0.54
0.34
0.38
0.45
Fabricatedmetal
0.25
0.06
0.01
0.01
0.02
0.04
0.07
0.09
0.13
0.18
0.17
0.14
0.17
Machinery
0.29
0.17
0.12
0.16
0.24
0.22
0.31
0.36
0.35
0.40
0.32
0.37
0.41
Electricalequipment
0.68
0.51
0.71
0.83
0.79
0.87
0.63
0.60
0.60
0.66
0.54
0.62
0.67
Motorvehicles
0.16
0.28
0.41
0.56
0.70
0.65
0.65
0.69
0.76
0.80
0.86
0.89
0.91
Manufacturing(NAICS)
0.43
0.10
0.06
0.07
0.12
0.16
0.19
0.15
0.21
0.28
0.29
0.35
0.36
Notes:basedon1000simulationsofmodel(5)where# =36.p-valuesarebasedonthe2 +1Boldanditalicsdenotesignificanceatthe5%and
10%level,respectively.

TableA.25.IRFbasedtestofnonlinearityfor1s.d.shocktothenominaloilprice-1973-2009subsample
1
12
36
Sector
01
612
01
612
01
612
Totalindex
0.01
0.02
0.18
0.32
0.04
0.04
0.22
0.37
0.47
0.11
0.19
0.29
Foodsandtobacco
0.24
0.50
0.58
0.75
0.34
0.47
0.49
0.73
0.05
0.03
0.06**
0.33
Clothing
0.35
0.42
0.32
0.38
0.90
0.47
0.22
0.44
0.56
0.35
0.33
0.71
Durableconsumergoods
0.06
0.11
0.35
0.21
0.03
0.04
0.39
0.71
0.12
0.21
0.66
0.86
Miscellaneousdurablegoods
0.11
0.25
0.62
0.88
0.02
0.04
0.16
0.53
0.27
0.17
0.22
0.67
Nondurableconsumergoods
0.07
0.19
0.42
0.47
0.14
0.33
0.47
0.73
0.18
0.09
0.35
0.66
Manufacturing(SIC)
0.03
0.04
0.30
0.41
0.05
0.03
0.20
0.45
0.39
0.10
0.17
0.35
Paperproducts
0.18
0.38
0.06
0.31
0.29
0.32
0.23
0.41
0.82
0.82
0.29
0.64
Chemicalproducts
0.64
0.16
0.16
0.33
0.18
0.38
0.64
0.91
0.44
0.29
0.59
0.88
Transitequipment
0.60
0.16
0.18
0.41
0.97
0.34
0.42
0.22
0.30
0.15
0.30
0.02**
Textilesmaterials
0.14
0.06
0.23
0.50
0.04
0.06
0.11
0.26
0.35
0.58
0.49
0.65
Papermaterials
0.12
0.02
0.24
0.28
0.02
0.07
0.11
0.34
0.23
0.13
0.34
0.78
Chemicalmaterials
0.71
0.01
0.09
0.25
0.28
0.06
0.21
0.51
0.95
0.20
0.10
0.17
Motorvehiclesandparts
0.70
0.02
0.08
0.23
0.11
0.06
0.41
0.62
0.21
0.38
0.72
0.85
Food,beverageandtobacco
0.24
0.15
0.26
0.53
0.23
0.33
0.33
0.51
0.08
0.05
0.05**
0.34
Textilesandproducts
0.18
0.08
0.42
0.75
0.08
0.21
0.13
0.46
0.43
0.14
0.20
0.35
Apparelandleathergoods
0.11
0.28
0.60
0.84
0.81
0.74
0.32
0.50
0.67
0.60
0.67
0.90
Paper
0.08
0.02
0.22
0.40
0.01
0.04
0.07
0.31
0.18
0.16
0.27
0.73
Printingandrelated
0.07
0.09
0.37
0.79
0.02
0.04
0.25
0.62
0.10
0.25
0.60
0.82
Chemicals
0.81
0.00
0.02
0.12
0.11
0.06
0.25
0.52
0.75
0.06
0.07
0.15
Petroleumandcoal
0.20
0.09
0.52
0.91
0.08
0.10
0.29
0.61
0.06
0.12
0.19
0.64
Plasticsandrubber
0.08
0.18
0.67
0.67
0.06
0.09
0.53
0.70
0.72
0.45
0.26
0.23
Furniture
0.03
0.09
0.43
0.61
0.01
0.02
0.14
0.39
0.25
0.50
0.37
0.69
Primarymetal
0.61
0.16
0.48
0.79
0.45
0.13
0.67
0.54
0.61
0.34
0.47
0.45
Fabricatedmetal
0.14
0.17
0.67
0.92
0.01
0.01
0.10
0.27
0.25
0.06
0.07
0.17
Machinery
0.13
0.07
0.28
0.65
0.15
0.01
0.12
0.41
0.29
0.17
0.31
0.41
Electricalequipment
0.12
0.26
0.79
0.34
0.03
0.08
0.43
0.56
0.68
0.51
0.63
0.67
Motorvehicles
0.81
0.03
0.17
0.42
0.05
0.06
0.41
0.72
0.16
0.28
0.65
0.91
Manufacturing(NAICS)
0.11
0.03
0.13
0.47
0.06
0.03
0.21
0.47
0.43
0.10
0.19
0.36
Notes:basedon1000simulationsofmodel(5).p-valuesarebasedonthe2 +1.Boldanditalicsdenotesignificanceatthe5%and10%level,
respectively.**and*denotesignificanceafteraccountingfordataminingata5%and10%level,respectively.

TableA.26.IRFbasedtestofsymmetryfor2s.d.shocktothenominaloilprice
³ # =1
´ -1973-2009subsample
Horizon
Sector
01
23
45
67
89
10
11
12
Totalindex
0.12
0.02
0.06
0.03
0.06
0.02
0.00
0.00
0.00
0.00
0.00
0.00
0.00
Foodsandtobacco
0.28
0.11
0.18
0.26
0.15
0.09
0.11
0.04
0.07
0.04
0.06
0.07
0.11
Clothing
0.07
0.17
0.11
0.17
0.20
0.04
0.06
0.03
0.03
0.04
0.05
0.06
0.08
Durableconsumergoods
0.08
0.02
0.06
0.00
0.01
0.02
0.00
0.00
0.00
0.00
0.00
0.00
0.00
Miscellaneousdurablegoods
0.01
0.04
0.04
0.08
0.14
0.22
0.28
0.32
0.41
0.51
0.56
0.37
0.42
Nondurableconsumergoods
0.11
0.24
0.40
0.56
0.54
0.40
0.33
0.43
0.50
0.47
0.51
0.47
0.51
Manufacturing(SIC)
0.07
0.00
0.01
0.01
0.01
0.01
0.00
0.01
0.00
0.01
0.01
0.01
0.02
Paperproducts
0.19
0.40
0.04
0.00
0.00
0.00
0.00
0.00
0.00
0.00
0.01
0.01
0.01
Chemicalproducts
0.65
0.11
0.08
0.01
0.01
0.02
0.02
0.03
0.04
0.01
0.00
0.00
0.00
Transitequipment
0.63
0.14
0.03
0.04
0.07
0.11
0.02
0.02
0.01
0.01
0.01
0.01
0.01
Textilesmaterials
0.15
0.04
0.08
0.09
0.11
0.02
0.04
0.04
0.06
0.08
0.04
0.06
0.05
Papermaterials
0.12
0.01
0.02
0.05
0.07
0.11
0.15
0.12
0.17
0.20
0.16
0.07
0.06
Chemicalmaterials
0.72
0.00
0.00
0.01
0.01
0.00
0.00
0.01
0.01
0.01
0.01
0.00
0.00
Motorvehiclesandparts
0.70
0.00
0.01
0.00
0.00
0.00
0.00
0.00
0.00
0.00
0.00
0.00
0.00
Food,beverageandtobacco
0.26
0.11
0.19
0.22
0.16
0.06
0.07
0.02
0.04
0.03
0.04
0.06
0.08
Textilesandproducts
0.17
0.03
0.06
0.06
0.10
0.14
0.18
0.18
0.24
0.29
0.37
0.27
0.34
Apparelandleathergoods
0.07
0.19
0.16
0.24
0.30
0.10
0.15
0.08
0.11
0.12
0.13
0.16
0.21
Paper
0.07
0.01
0.01
0.02
0.03
0.06
0.07
0.10
0.13
0.13
0.09
0.03
0.04
Printingandrelated
0.04
0.03
0.04
0.03
0.06
0.07
0.09
0.13
0.19
0.21
0.26
0.22
0.24
Chemicals
0.82
0.00
0.00
0.00
0.00
0.00
0.00
0.00
0.00
0.00
0.00
0.00
0.00
Petroleumandcoal
0.22
0.07
0.14
0.16
0.25
0.36
0.47
0.55
0.64
0.73
0.79
0.82
0.87
Plasticsandrubber
0.08
0.17
0.16
0.18
0.27
0.37
0.48
0.59
0.64
0.72
0.40
0.06
0.07
Furniture
0.01
0.04
0.09
0.16
0.19
0.26
0.11
0.15
0.19
0.25
0.28
0.25
0.12
Primarymetal
0.62
0.14
0.13
0.19
0.29
0.38
0.43
0.49
0.26
0.34
0.40
0.46
0.53
Fabricatedmetal
0.14
0.11
0.17
0.20
0.30
0.41
0.49
0.57
0.65
0.71
0.78
0.69
0.75
Machinery
0.12
0.04
0.09
0.17
0.04
0.06
0.11
0.12
0.10
0.13
0.17
0.15
0.19
Electricalequipment
0.11
0.22
0.36
0.37
0.50
0.62
0.60
0.59
0.65
0.69
0.77
0.06
0.04
Motorvehicles
0.82
0.00
0.01
0.00
0.00
0.01
0.00
0.01
0.01
0.00
0.00
0.00
0.00
Manufacturing(NAICS)
0.07
0.00
0.01
0.01
0.02
0.02
0.00
0.01
0.00
0.01
0.01
0.01
0.02
Notes:basedon1000simulationsofmodel(5)where# =1 .p-valuesarebasedonthe2 +1Boldanditalicsdenotesignificanceatthe5%and
10%level,respectively.

TableA.27.IRFbasedtestofnonlinearityfor2s.d.shocktothenominaloilprice
³ # =12
´ -1973-2009subsample
Horizon
Sector
01
23
45
67
89
10
11
12
Totalindex
0.01
0.00
0.00
0.00
0.01
0.01
0.00
0.01
0.00
0.00
0.00
0.00
0.00
Foodsandtobacco
0.29
0.38
0.59
0.72
0.24
0.23
0.04
0.04
0.03
0.03
0.06
0.07
0.10
Clothing
0.89
0.41
0.01
0.02
0.03
0.03
0.05
0.02
0.03
0.05
0.05
0.03
0.01
Durableconsumergoods
0.01
0.00
0.00
0.00
0.01
0.02
0.01
0.02
0.03
0.05
0.06
0.02
0.03
Miscellaneousdurablegoods
0.00
0.00
0.00
0.00
0.00
0.00
0.00
0.00
0.00
0.00
0.00
0.00
0.00
Nondurableconsumergoods
0.08
0.21
0.11
0.07
0.06
0.10
0.01
0.01
0.00
0.01
0.01
0.01
0.01
Manufacturing(SIC)
0.01
0.00
0.00
0.00
0.00
0.00
0.00
0.00
0.00
0.01
0.01
0.00
0.00
Paperproducts
0.22
0.22
0.39
0.02
0.02
0.04
0.01
0.02
0.03
0.02
0.01
0.01
0.01
Chemicalproducts
0.11
0.22
0.37
0.24
0.34
0.44
0.45
0.29
0.35
0.27
0.30
0.37
0.36
Transitequipment
0.99
0.26
0.17
0.26
0.32
0.13
0.14
0.20
0.01
0.00
0.00
0.00
0.00
Textilesmaterials
0.01
0.01
0.03
0.02
0.05
0.01
0.00
0.00
0.00
0.00
0.00
0.00
0.00
Papermaterials
0.01
0.02
0.02
0.00
0.01
0.02
0.03
0.04
0.06
0.03
0.04
0.04
0.01
Chemicalmaterials
0.20
0.00
0.01
0.01
0.01
0.01
0.01
0.01
0.01
0.02
0.02
0.00
0.00
Motorvehiclesandparts
0.09
0.01
0.00
0.00
0.01
0.01
0.01
0.01
0.01
0.02
0.03
0.04
0.06
Food,beverageandtobacco
0.17
0.21
0.37
0.49
0.15
0.08
0.01
0.01
0.00
0.01
0.01
0.01
0.02
Textilesandproducts
0.02
0.07
0.13
0.22
0.04
0.00
0.00
0.00
0.01
0.01
0.01
0.00
0.00
Apparelandleathergoods
0.82
0.69
0.03
0.06
0.08
0.09
0.12
0.04
0.06
0.07
0.08
0.08
0.02
Paper
0.00
0.00
0.00
0.00
0.00
0.00
0.00
0.01
0.01
0.01
0.01
0.01
0.01
Printingandrelated
0.01
0.00
0.00
0.00
0.00
0.00
0.00
0.00
0.01
0.01
0.01
0.01
0.01
Chemicals
0.07
0.00
0.01
0.02
0.03
0.02
0.02
0.02
0.02
0.02
0.02
0.02
0.03
Petroleumandcoal
0.05
0.06
0.09
0.01
0.01
0.02
0.03
0.04
0.07
0.04
0.06
0.06
0.03
Plasticsandrubber
0.03
0.02
0.03
0.05
0.09
0.13
0.02
0.03
0.03
0.05
0.00
0.00
0.00
Furniture
0.00
0.00
0.00
0.00
0.00
0.00
0.00
0.00
0.00
0.00
0.00
0.00
0.00
Primarymetal
0.46
0.07
0.14
0.15
0.21
0.23
0.12
0.06
0.08
0.11
0.03
0.04
0.04
Fabricatedmetal
0.00
0.00
0.00
0.00
0.00
0.00
0.00
0.00
0.00
0.00
0.00
0.00
0.00
Machinery
0.07
0.00
0.00
0.00
0.00
0.00
0.00
0.00
0.00
0.00
0.00
0.00
0.00
Electricalequipment
0.01
0.02
0.05
0.09
0.06
0.09
0.07
0.06
0.09
0.03
0.01
0.00
0.00
Motorvehicles
0.02
0.00
0.00
0.00
0.01
0.00
0.00
0.01
0.01
0.02
0.03
0.03
0.03
Manufacturing(NAICS)
0.01
0.00
0.00
0.00
0.00
0.00
0.00
0.01
0.01
0.01
0.01
0.00
0.00
Notes:basedon1000simulationsofmodel(5)where# =12.p-valuesarebasedonthe2 +1Boldanditalicsdenotesignificanceatthe5%and
10%level,respectively.

TableA.28.IRFbasedtestofnonlinearityfor2s.d.shocktothenominaloilprice
³ # =36
´ -1973-2009subsample
Horizon
Sector
01
23
45
67
89
10
11
12
Totalindex
0.45
0.03
0.06
0.03
0.05
0.07
0.05
0.07
0.11
0.14
0.14
0.03
0.03
Foodsandtobacco
0.05
0.07
0.13
0.23
0.14
0.16
0.09
0.05
0.05
0.07
0.10
0.11
0.14
Clothing
0.62
0.29
0.20
0.29
0.39
0.17
0.23
0.13
0.17
0.23
0.29
0.31
0.37
Durableconsumergoods
0.12
0.07
0.11
0.19
0.26
0.14
0.04
0.06
0.09
0.12
0.12
0.11
0.09
Miscellaneousdurablegoods
0.23
0.04
0.08
0.13
0.16
0.16
0.16
0.23
0.30
0.38
0.25
0.24
0.29
Nondurableconsumergoods
0.18
0.14
0.14
0.16
0.25
0.34
0.16
0.22
0.28
0.34
0.42
0.45
0.53
Manufacturing(SIC)
0.40
0.02
0.04
0.07
0.08
0.12
0.04
0.07
0.10
0.14
0.16
0.06
0.07
Paperproducts
0.88
0.86
0.94
0.98
0.90
0.94
0.12
0.16
0.14
0.20
0.10
0.09
0.11
Chemicalproducts
0.51
0.20
0.20
0.14
0.23
0.28
0.38
0.49
0.58
0.60
0.56
0.64
0.69
Transitequipment
0.30
0.29
0.40
0.51
0.42
0.33
0.38
0.49
0.27
0.18
0.22
0.11
0.14
Textilesmaterials
0.34
0.63
0.76
0.70
0.74
0.55
0.55
0.51
0.58
0.63
0.70
0.60
0.64
Papermaterials
0.22
0.32
0.17
0.27
0.33
0.44
0.27
0.27
0.34
0.33
0.37
0.45
0.53
Chemicalmaterials
0.96
0.05
0.09
0.03
0.06
0.07
0.09
0.13
0.15
0.16
0.14
0.05
0.06
Motorvehiclesandparts
0.27
0.26
0.20
0.28
0.40
0.30
0.11
0.15
0.18
0.22
0.28
0.33
0.38
Food,beverageandtobacco
0.08
0.11
0.16
0.27
0.16
0.16
0.08
0.04
0.06
0.06
0.09
0.11
0.15
Textilesandproducts
0.52
0.17
0.32
0.31
0.35
0.27
0.37
0.44
0.41
0.42
0.51
0.58
0.56
Apparelandleathergoods
0.74
0.61
0.49
0.61
0.54
0.31
0.39
0.24
0.31
0.33
0.41
0.42
0.49
Paper
0.17
0.31
0.08
0.14
0.17
0.25
0.19
0.16
0.22
0.24
0.29
0.37
0.44
Printingandrelated
0.10
0.18
0.25
0.14
0.09
0.14
0.17
0.24
0.30
0.38
0.40
0.48
0.54
Chemicals
0.75
0.01
0.02
0.04
0.06
0.10
0.11
0.15
0.11
0.15
0.16
0.09
0.12
Petroleumandcoal
0.04
0.11
0.18
0.09
0.07
0.11
0.13
0.19
0.22
0.28
0.25
0.28
0.16
Plasticsandrubber
0.72
0.33
0.39
0.44
0.50
0.63
0.06
0.06
0.08
0.09
0.08
0.06
0.03
Furniture
0.21
0.43
0.64
0.73
0.82
0.21
0.19
0.26
0.34
0.43
0.39
0.40
0.30
Primarymetal
0.58
0.20
0.29
0.40
0.35
0.37
0.14
0.20
0.22
0.21
0.06
0.08
0.08
Fabricatedmetal
0.27
0.01
0.01
0.03
0.06
0.07
0.10
0.14
0.18
0.21
0.20
0.24
0.26
Machinery
0.27
0.03
0.08
0.12
0.15
0.19
0.27
0.17
0.22
0.28
0.29
0.37
0.33
Electricalequipment
0.65
0.43
0.62
0.76
0.68
0.70
0.18
0.24
0.29
0.37
0.36
0.14
0.18
Motorvehicles
0.18
0.13
0.08
0.15
0.23
0.14
0.03
0.06
0.06
0.07
0.09
0.11
0.06
Manufacturing(NAICS)
0.44
0.02
0.06
0.07
0.08
0.12
0.05
0.07
0.11
0.15
0.17
0.08
0.09
Notes:basedon1000simulationsofmodel(5)where# =36.p-valuesarebasedonthe2 +1Boldanditalicsdenotesignificanceatthe5%and
10%level,respectively.

TableA.29.IRFbasedtestofsymmetryfor2s.d.shocktothenominaloilprice-1973-2009subsample
1
12
36
Sector
01
612
01
612
01
612
Totalindex
0.12
0.02
0.00
0.00
0.01
0.00
0.00
0.00
0.45
0.03
0.05
0.03
Foodsandtobacco
0.28
0.11
0.11
0.11
0.29
0.38
0.04
0.10
0.05
0.07
0.09
0.14
Clothing
0.07
0.17
0.06
0.08
0.89
0.41
0.05
0.01
0.62
0.29
0.23
0.37
Durableconsumergoods
0.08
0.02
0.00
0.00
0.01
0.00
0.01
0.03
0.12
0.07
0.04
0.09
Miscellaneousdurablegoods
0.01
0.04
0.28
0.42
0.00
0.00
0.00
0.00
0.23
0.04
0.16
0.29
Nondurableconsumergoods
0.11
0.24
0.33
0.51
0.08
0.21
0.01
0.01
0.18
0.14
0.16
0.53
Manufacturing(SIC)
0.07
0.00
0.00
0.02
0.01
0.00
0.00
0.00
0.40
0.02
0.04
0.07
Paperproducts
0.19
0.40
0.00
0.01
0.22
0.22
0.01
0.01
0.88
0.86
0.12
0.11
Chemicalproducts
0.65
0.11
0.02
0.00
0.11
0.22
0.45
0.36
0.51
0.20
0.38
0.69
Transitequipment
0.63
0.14
0.02
0.01
0.99
0.26
0.14
0.00
0.30
0.29
0.38
0.14
Textilesmaterials
0.15
0.04
0.04
0.05
0.01
0.01
0.00
0.00
0.34
0.63
0.55
0.64
Papermaterials
0.12
0.01
0.15
0.06
0.01
0.02
0.03
0.01
0.22
0.32
0.27
0.53
Chemicalmaterials
0.72
0.00
0.00
0.00
0.20
0.00
0.01
0.00
0.96
0.05
0.09
0.06
Motorvehiclesandparts
0.70
0.00
0.00
0.00
0.09
0.01
0.01
0.06
0.27
0.26
0.11
0.38
Food,beverageandtobacco
0.26
0.11
0.07
0.08
0.17
0.21
0.01
0.02
0.08
0.11
0.08
0.15
Textilesandproducts
0.17
0.03
0.18
0.34
0.02
0.07
0.00
0.00
0.52
0.17
0.37
0.56
Apparelandleathergoods
0.07
0.19
0.15
0.21
0.82
0.69
0.12
0.02
0.74
0.61
0.39
0.49
Paper
0.07
0.01
0.07
0.04
0.00
0.00
0.00
0.01
0.17
0.31
0.19
0.44
Printingandrelated
0.04
0.03
0.09
0.24
0.01
0.00
0.00
0.01
0.10
0.18
0.17
0.54
Chemicals
0.82
0.00
0.00
0.00
0.07
0.00
0.02
0.03
0.75
0.01
0.11
0.12
Petroleumandcoal
0.22
0.07
0.47
0.87
0.05
0.06
0.03
0.03
0.04
0.11
0.13
0.16
Plasticsandrubber
0.08
0.17
0.48
0.07
0.03
0.02
0.02
0.00
0.72
0.33
0.06
0.03
Furniture
0.01
0.04
0.11
0.12
0.00
0.00
0.00
0.00
0.21
0.43
0.19
0.30
Primarymetal
0.62
0.14
0.43
0.53
0.46
0.07
0.12
0.04
0.58
0.20
0.14
0.08
Fabricatedmetal
0.14
0.11
0.49
0.75
0.00
0.00
0.00
0.00
0.27
0.01
0.10
0.26
Machinery
0.12
0.04
0.11
0.19
0.07
0.00
0.00
0.00
0.27
0.03
0.27
0.33
Electricalequipment
0.11
0.22
0.60
0.04
0.01
0.02
0.07
0.00
0.65
0.43
0.18
0.18
Motorvehicles
0.82
0.00
0.00
0.00
0.02
0.00
0.00
0.03
0.18
0.13
0.03
0.06
Manufacturing(NAICS)
0.07
0.00
0.00
0.02
0.01
0.00
0.00
0.00
0.44
0.02
0.05
0.09
Notes:basedon1000simulationsofmodel(5).p-valuesarebasedonthe2 +1.Boldanditalicsdenotesignificanceatthe5%and10%level,
respectively.**and*denotesignificanceafteraccountingfordataminingata5%and10%level,respectively.

02
46
810
12-0
.20
0.2
Totalindex
02
46
810
12-0
.20
0.2
Manufacturing(SIC)
02
46
810
12-0
.20
0.2
Manufacturing(NAICS)
02
46
810
12-0
.10
0.1
Foodsand
tobacco
02
46
810
12-0
.20
0.2
Clothing
02
46
810
12-0
.50
0.5
Durableconsumer
goods
02
46
810
12-0
.20
0.2
02
46
810
12-0
.20
0.2
02
46
810
12-0
.20
0.2
02
46
810
12-0
.10
0.1
02
46
810
12-0
.20
0.2
02
46
810
12-0
.50
0.5
02
46
810
12-0
.20
0.2
02
46
810
12-0
.20
0.2
02
46
810
12-0
.10
0.1
02
46
810
12-0
.10
0.1
02
46
810
12-0
.20
0.2
02
46
810
12-0
.50
0.5
Pos
itive
Neg
ativ
e
x t# = x
t12x t# =
xt36
Est
imat
es a
re b
ased
on
the
VA
R in
(5) w
here
the
num
ber o
f rep
licat
ions
to o
btai
n th
e IR
Fs e
qual
100
0
x t# = x
t1Figu
re A
.1a:
Impu
lse
resp
onse
to o
ne s
tand
ard
devi
atio
n po
sitiv
e an
d ne
gativ
e sh
ocks
to th
e re
al o
il pr
ice
(per
cent
age)

02
46
810
12-0
.20
0.2
Miscellaneousdurablegoods
02
46
810
12-0
.10
0.1
Nondurableconsumer
goods
02
46
810
12-0
.20
0.2
Paperproducts
02
46
810
12-0
.20
0.2
Chemicalproducts
02
46
810
12-101
Transitequipment
02
46
810
12-0
.50
0.5
Textilesmaterials
02
46
810
12-0
.20
0.2
02
46
810
12-0
.10
0.1
02
46
810
12-0
.10
0.1
02
46
810
12-0
.20
0.2
02
46
810
12-101
02
46
810
12-0
.50
0.5
02
46
810
12-0
.20
0.2
02
46
810
12-0
.10
0.1
02
46
810
12-0
.10
0.1
02
46
810
12-0
.20
0.2
02
46
810
12-0
.50
0.5
02
46
810
12-0
.50
0.5
Pos
itive
Neg
ativ
e
Figu
re A
.1b:
Impu
lse
resp
onse
to o
ne s
tand
ard
devi
atio
n po
sitiv
e an
d ne
gativ
e sh
ocks
to th
e re
al o
il pr
ice
(per
cent
age)
x t# = x
t1x t# =
xt12
x t# = x
t36
Est
imat
es a
re b
ased
on
the
VA
R in
(5) w
here
the
num
ber o
f rep
licat
ions
to o
btai
n th
e IR
Fs e
qual
100
0

02
46
810
12-0
.50
0.5
Papermaterials
02
46
810
12-0
.50
0.5
Chemicalmaterials
02
46
810
12-0
.20
0.2
Food, beverage
and tobacco
02
46
810
12-0
.50
0.5
Textilesand
products
02
46
810
12-0
.20
0.2
Appareland leather
goods
02
46
810
12-0
.50
0.5
Paper
02
46
810
12-0
.50
0.5
02
46
810
12-0
.50
0.5
02
46
810
12-0
.20
0.2
02
46
810
12-0
.50
0.5
02
46
810
12-0
.20
0.2
02
46
810
12-0
.50
0.5
02
46
810
12-0
.50
0.5
02
46
810
12-0
.50
0.5
02
46
810
12-0
.10
0.1
02
46
810
12-0
.50
0.5
02
46
810
12-0
.20
0.2
02
46
810
12-0
.50
0.5
Pos
itive
Neg
ativ
e
Figu
re A
.1c:
Impu
lse
resp
onse
to o
ne s
tand
ard
devi
atio
n po
sitiv
e an
d ne
gativ
e sh
ocks
to th
e re
al o
il pr
ice
(per
cent
age)
x t# = x
t1x t# =
xt12
x t# = x
t36
Est
imat
es a
re b
ased
on
the
VA
R in
(5) w
here
the
num
ber o
f rep
licat
ions
to o
btai
n th
e IR
Fs e
qual
100
0
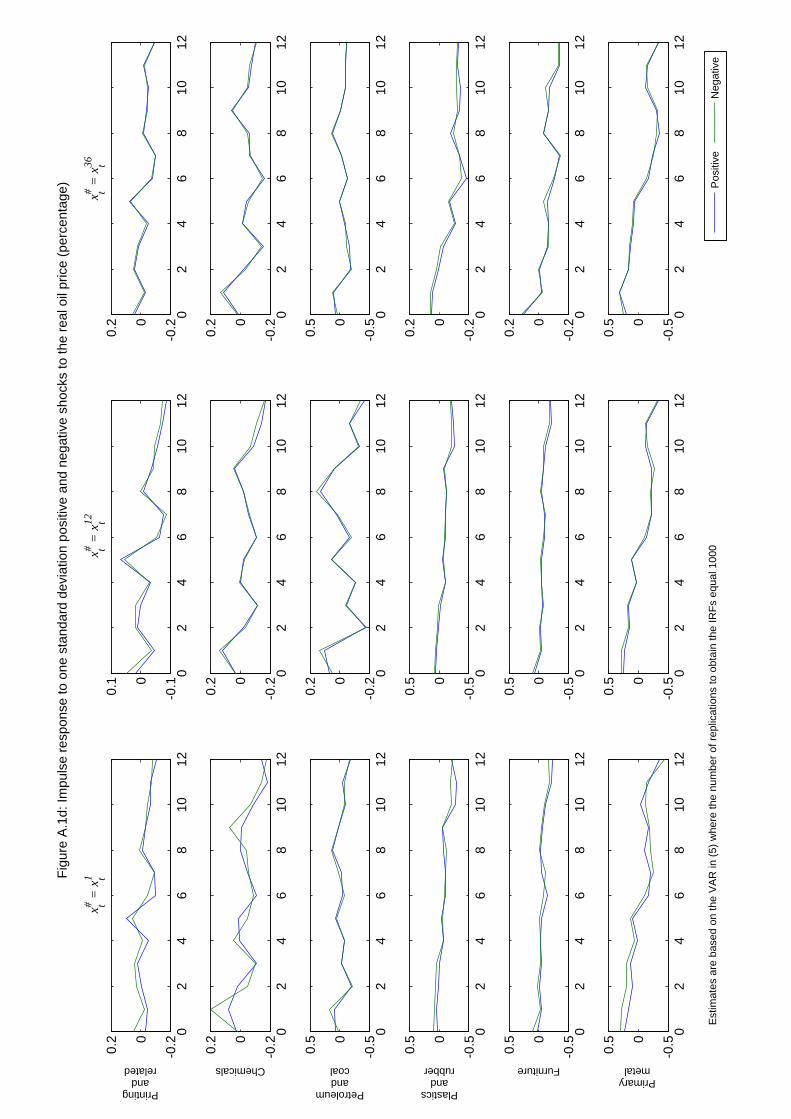
02
46
810
12-0
.20
0.2
Printingand
related
02
46
810
12-0
.20
0.2
Chemicals
02
46
810
12-0
.50
0.5
Petroleumandcoal
02
46
810
12-0
.50
0.5
Plasticsand
rubber
02
46
810
12-0
.50
0.5
Furniture
02
46
810
12-0
.50
0.5
Primarymetal
02
46
810
12-0
.10
0.1
02
46
810
12-0
.20
0.2
02
46
810
12-0
.20
0.2
02
46
810
12-0
.50
0.5
02
46
810
12-0
.50
0.5
02
46
810
12-0
.50
0.5
02
46
810
12-0
.20
0.2
02
46
810
12-0
.20
0.2
02
46
810
12-0
.50
0.5
02
46
810
12-0
.20
0.2
02
46
810
12-0
.20
0.2
02
46
810
12-0
.50
0.5
Pos
itive
Neg
ativ
eE
stim
ates
are
bas
ed o
n th
e V
AR
in (5
) whe
re th
e nu
mbe
r of r
eplic
atio
ns to
obt
ain
the
IRFs
equ
al 1
000
Figu
re A
.1d:
Impu
lse
resp
onse
to o
ne s
tand
ard
devi
atio
n po
sitiv
e an
d ne
gativ
e sh
ocks
to th
e re
al o
il pr
ice
(per
cent
age)
x t# = x
t1x t# =
xt12
x t# = x
t36

02
46
810
12-0
.20
0.2
Fabricatedmetal
02
46
810
12-0
.20
0.2
Machinery
02
46
810
12-0
.20
0.2
Electricalequipment
02
46
810
12-202
Motorvehicles
02
46
810
12-101
Motorvehiclesand parts
02
46
810
12-0
.20
0.2
02
46
810
12-0
.20
0.2
02
46
810
12-0
.20
0.2
02
46
810
12-101
02
46
810
12-101
02
46
810
12-0
.10
0.1
02
46
810
12-0
.20
0.2
02
46
810
12-0
.20
0.2
02
46
810
12-202
02
46
810
12-101
Pos
itive
Neg
ativ
eE
stim
ates
are
bas
ed o
n th
e V
AR
in (5
) whe
re th
e nu
mbe
r of r
eplic
atio
ns to
obt
ain
the
IRFs
equ
al 1
000
x t# = x
t1x t# =
xt12
x t# = x
t36
Figu
re A
.1e:
Impu
lse
resp
onse
to o
ne s
tand
ard
devi
atio
n po
sitiv
e an
d ne
gativ
e sh
ocks
to th
e re
al o
il pr
ice
(per
cent
age)

02
46
810
12-0
.50
0.5
Totalindex
02
46
810
12-0
.50
0.5
Manufacturing(SIC)
02
46
810
12-0
.50
0.5
Manufacturing(NAICS)
02
46
810
12-0
.20
0.2
Foods and
tobacco
02
46
810
12-0
.50
0.5
Clothing
02
46
810
12-101
Durable consumergoods
02
46
810
12-0
.50
0.5
02
46
810
12-0
.50
0.5
02
46
810
12-0
.50
0.5
02
46
810
12-0
.20
0.2
02
46
810
12-0
.50
0.5
02
46
810
12-101
02
46
810
12-0
.50
0.5
02
46
810
12-0
.50
0.5
02
46
810
12-0
.50
0.5
02
46
810
12-0
.20
0.2
02
46
810
12-0
.50
0.5
02
46
810
12-101
Pos
itive
Neg
ativ
e
x t# = x
t12x t# =
xt36
Est
imat
es a
re b
ased
on
the
VA
R in
(5) w
here
the
num
ber o
f rep
licat
ions
to o
btai
n th
e IR
Fs e
qual
100
0
x t# = x
t1Figu
re A
.2a:
Impu
lse
resp
onse
to tw
o st
anda
rd d
evia
tion
posi
tive
and
nega
tive
shoc
ks to
the
real
oil
pric
e (p
erce
ntag
e)

02
46
810
12-0
.50
0.5
Miscellaneousdurablegoods
02
46
810
12-0
.20
0.2
Nondurableconsumer goods
02
46
810
12-0
.50
0.5
Paper products
02
46
810
12-0
.50
0.5
Chemicalproducts
02
46
810
12-202
Transit equipment
02
46
810
12-101
Textiles materials
02
46
810
12-0
.50
0.5
02
46
810
12-0
.20
0.2
02
46
810
12-0
.20
0.2
02
46
810
12-0
.50
0.5
02
46
810
12-505
02
46
810
12-101
02
46
810
12-0
.50
0.5
02
46
810
12-0
.20
0.2
02
46
810
12-0
.50
0.5
02
46
810
12-0
.50
0.5
02
46
810
12-202
02
46
810
12-101
Pos
itive
Neg
ativ
e
x t# = x
t1x t# =
xt36
Est
imat
es a
re b
ased
on
the
VA
R in
(5) w
here
the
num
ber o
f rep
licat
ions
to o
btai
n th
e IR
Fs e
qual
100
0x t# = x
t12
Figu
re A
.2b:
Impu
lse
resp
onse
to tw
o st
anda
rd d
evia
tion
posi
tive
and
nega
tive
shoc
ks to
the
real
oil
pric
e (p
erce
ntag
e)

02
46
810
12-0
.50
0.5
Paper materials
02
46
810
12-101
Chemical materials
02
46
810
12-0
.50
0.5
Food,beverage and tobacco
02
46
810
12-101
Textilesand
products
02
46
810
12-0
.50
0.5
Apparel and leathergoods
02
46
810
12-101
Paper
02
46
810
12-101
02
46
810
12-101
02
46
810
12-0
.50
0.5
02
46
810
12-101
02
46
810
12-0
.50
0.5
02
46
810
12-101
02
46
810
12-101
02
46
810
12-101
02
46
810
12-0
.20
0.2
02
46
810
12-101
02
46
810
12-0
.50
0.5
02
46
810
12-101
Pos
itive
Neg
ativ
e
x t# = x
t36x t# =
xt12
Est
imat
es a
re b
ased
on
the
VA
R in
(5) w
here
the
num
ber o
f rep
licat
ions
to o
btai
n th
e IR
Fs e
qual
100
0
x t# = x
t1Figu
re A
.2c:
Impu
lse
resp
onse
to tw
o st
anda
rd d
evia
tion
posi
tive
and
nega
tive
shoc
ks to
the
real
oil
pric
e (p
erce
ntag
e)

02
46
810
12-0
.50
0.5
Printingand related
02
46
810
12-101
Chemicals
02
46
810
12-101
Petroleumand coal
02
46
810
12-101
Plasticsand rubber
02
46
810
12-101
Furniture
02
46
810
12-202
Primarymetal
02
46
810
12-0
.50
0.5
02
46
810
12-0
.50
0.5
02
46
810
12-0
.50
0.5
02
46
810
12-101
02
46
810
12-101
02
46
810
12-101
02
46
810
12-0
.50
0.5
02
46
810
12-0
.50
0.5
02
46
810
12-101
02
46
810
12-0
.50
0.5
02
46
810
12-0
.50
0.5
02
46
810
12-101
Pos
itive
Neg
ativ
e
x t# = x
t1x t# =
xt12
x t# = x
t36
Est
imat
es a
re b
ased
on
the
VA
R in
(5) w
here
the
num
ber o
f rep
licat
ions
to o
btai
n th
e IR
Fs e
qual
100
0
Figu
re A
.2d:
Impu
lse
resp
onse
to tw
o st
anda
rd d
evia
tion
posi
tive
and
nega
tive
shoc
ks to
the
real
oil
pric
e (p
erce
ntag
e)

02
46
810
12-0
.50
0.5
Fabricatedmetal
02
46
810
12-101
Machinery
02
46
810
12-0
.50
0.5
Electricalequipment
02
46
810
12-505
Motorvehicles
02
46
810
12-505
Motorvehicles and parts
02
46
810
12-0
.50
0.5
02
46
810
12-0
.50
0.5
02
46
810
12-0
.50
0.5
02
46
810
12-505
02
46
810
12-202
02
46
810
12-0
.50
0.5
02
46
810
12-0
.50
0.5
02
46
810
12-0
.50
0.5
02
46
810
12-505
02
46
810
12-202
Pos
itive
Neg
ativ
e
x t# = x
t12x t# =
xt36
Est
imat
es a
re b
ased
on
the
VA
R in
(5) w
here
the
num
ber o
f rep
licat
ions
to o
btai
n th
e IR
Fs e
qual
100
0
x t# = x
t1Figu
re A
.2e:
Impu
lse
resp
onse
to tw
o st
anda
rd d
evia
tion
posi
tive
and
nega
tive
shoc
ks to
the
real
oil
pric
e (p
erce
ntag
e)