Embed Size (px)
Citation preview
For:
Municipality of AnchoragePlanning Division
March 2012

[This page left intentionally blank.]
Anchorage Housing Market Analysis
Prepared for: Municipality of Anchorage
Prepared by:
Juneau Anchorage
with
March 2012
Acknowledgements
The study team would like to express its appreciation to each of the Anchorage Housing Market Analysis
Technical Advisory Committee members who provided their time and professional opinion and expertise
throughout the entire study period. We thank:
• Pita Benz, Cook Inlet Tribal Council
• Mark Butler, Federation of Community Councils
• Tamás Deak, kpb Architects
• Daniel Delfino, Alaska Housing Finance Corporation
• Jim Fredrick, NeighborWorks Anchorage
• Ernie Hall, Anchorage Assembly
• Jeff Judd, Cook Inlet Housing Authority
• Mark Korting, RE/MAX Properties, Inc.
• Bill Popp, Anchorage Economic Development Corporation
• Andre Spinelli, Spinell Homes, Inc.
• Connie Yoshimura, CY Investments, LLC
Municipality of Anchorage Planning Division:
• Lisa Ameen
• Tom Davis, AICP
• Karen Iverson, AICP
This project was funded by the Energy Efficiency and Conservation Block Grant, a program of
the American Recovery and Reinvestment Act.
Table of Contents
Executive Summary .................................................................................................................. 1 Introduction .............................................................................................................................. 7 Methods .................................................................................................................................... 9 Forecast of Housing Demand ................................................................................................. 13
Demographic Findings ........................................................................................................... 13 Housing Preference Survey Findings ....................................................................................... 18 Case Studies of Compact Housing Findings ........................................................................... 19 Baseline Housing Demand Forecast ........................................................................................ 20 Conclusions for Future Housing Demand ............................................................................... 23
Land Supply and Housing Capacity ....................................................................................... 25 Redevelopment ...................................................................................................................... 30
Comparison of Land Supply and Demand............................................................................. 31 Financial Feasibility for Developing Compact Housing........................................................ 34
Feasibility Issues Specific to Anchorage .................................................................................. 34 Feasibility Findings ................................................................................................................. 35
Implications for Housing Policy in Anchorage ...................................................................... 37 Options to Allocate Growth within the Region ....................................................................... 38 No Change in Policy Option .................................................................................................. 40 Housing Policies in Anchorage ............................................................................................... 40
Housing Policy Options for Further Consideration .............................................................. 50 Policies to Help Accommodate Growth .................................................................................. 50 Next Steps ............................................................................................................................. 57
Appendix A: Housing Demand Literature Review and Preliminary Research Appendix B: Household Telephone Survey Results and Household Online Survey Results Appendix C: Anchorage Forecast for Housing Demand 2010 to 2030 Appendix D: Pro Forma Feasibility Analysis Appendix E: Compact Housing Case Studies Appendix F: Buildable Lands Inventory and Housing Capacity Analysis
Anchorage Housing Study Summary McDowell Group, Inc. and ECONorthwest Page 1
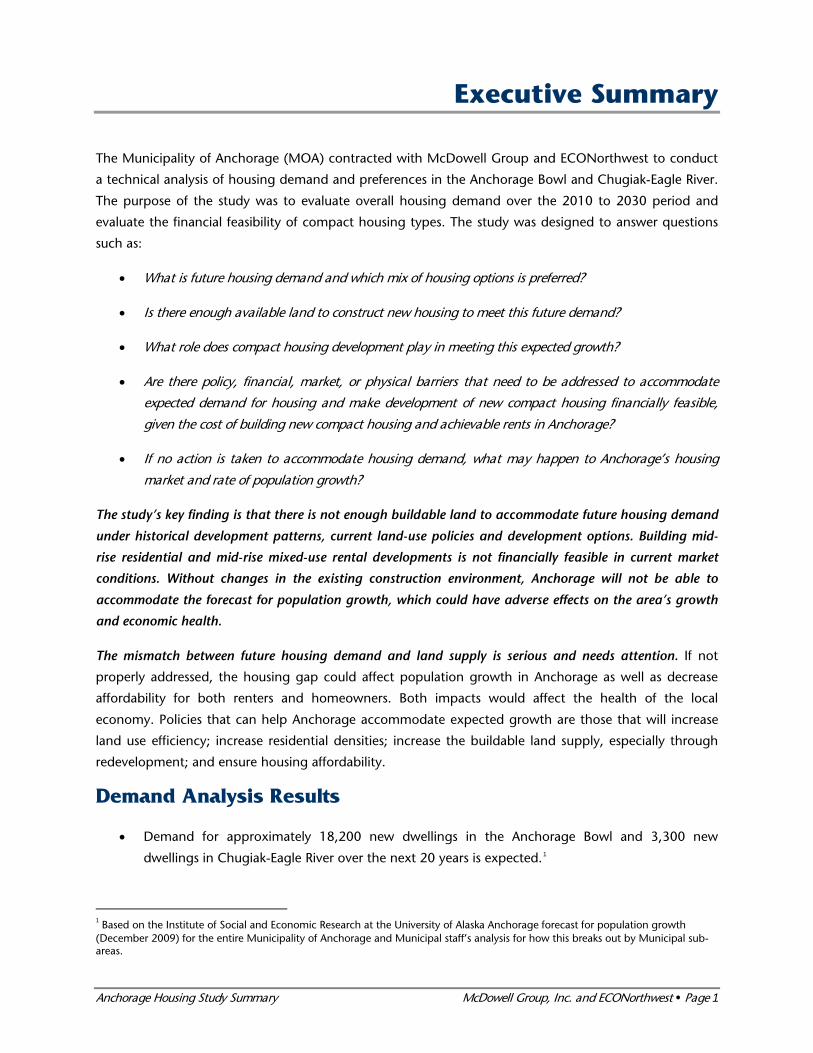
Executive Summary
The Municipality of Anchorage (MOA) contracted with McDowell Group and ECONorthwest to conduct
a technical analysis of housing demand and preferences in the Anchorage Bowl and Chugiak-Eagle River.
The purpose of the study was to evaluate overall housing demand over the 2010 to 2030 period and
evaluate the financial feasibility of compact housing types. The study was designed to answer questions
such as:
• What is future housing demand and which mix of housing options is preferred?
• Is there enough available land to construct new housing to meet this future demand?
• What role does compact housing development play in meeting this expected growth?
• Are there policy, financial, market, or physical barriers that need to be addressed to accommodate
expected demand for housing and make development of new compact housing financially feasible,
given the cost of building new compact housing and achievable rents in Anchorage?
• If no action is taken to accommodate housing demand, what may happen to Anchorage’s housing
market and rate of population growth?
The study’s key finding is that there is not enough buildable land to accommodate future housing demand
under historical development patterns, current land-use policies and development options. Building mid-
rise residential and mid-rise mixed-use rental developments is not financially feasible in current market
conditions. Without changes in the existing construction environment, Anchorage will not be able to
accommodate the forecast for population growth, which could have adverse effects on the area’s growth
and economic health.
The mismatch between future housing demand and land supply is serious and needs attention. If not
properly addressed, the housing gap could affect population growth in Anchorage as well as decrease
affordability for both renters and homeowners. Both impacts would affect the health of the local
economy. Policies that can help Anchorage accommodate expected growth are those that will increase
land use efficiency; increase residential densities; increase the buildable land supply, especially through
redevelopment; and ensure housing affordability.
Demand Analysis Results
• Demand for approximately 18,200 new dwellings in the Anchorage Bowl and 3,300 new
dwellings in Chugiak-Eagle River over the next 20 years is expected.1
1 Based on the Institute of Social and Economic Research at the University of Alaska Anchorage forecast for population growth (December 2009) for the entire Municipality of Anchorage and Municipal staff’s analysis for how this breaks out by Municipal sub-areas.
Anchorage Housing Market Analysis McDowell Group, Inc. and ECONorthwest Page 2
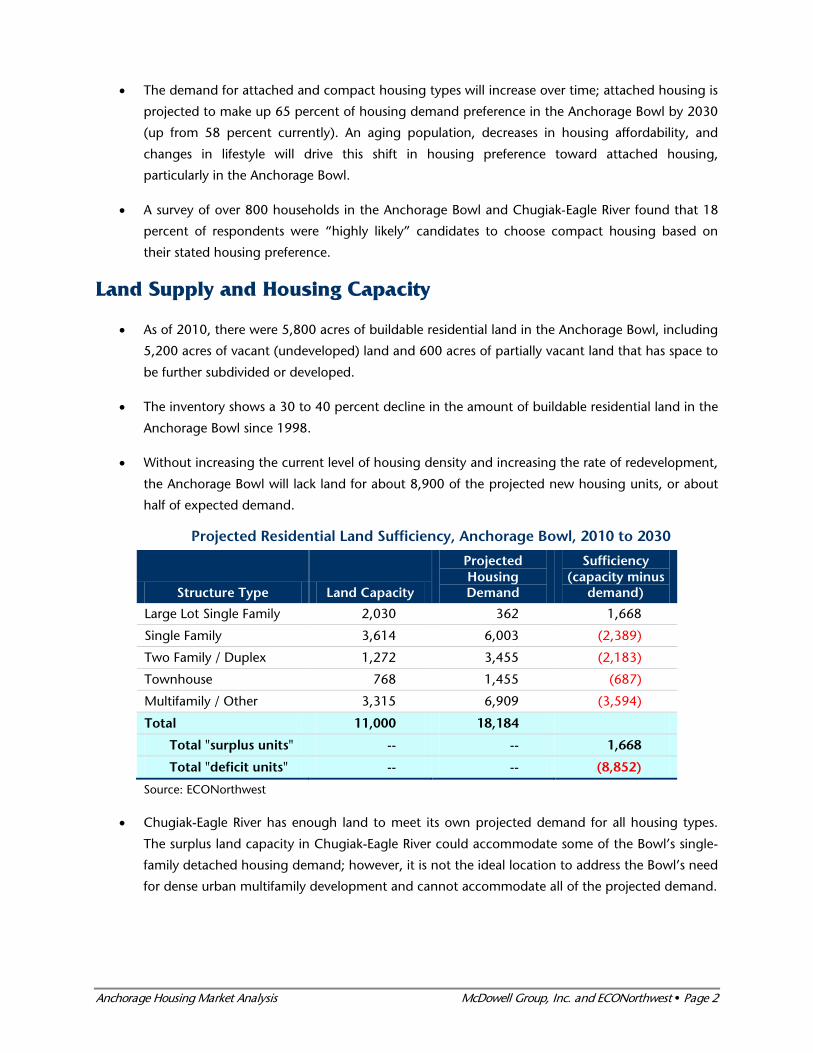
• The demand for attached and compact housing types will increase over time; attached housing is
projected to make up 65 percent of housing demand preference in the Anchorage Bowl by 2030
(up from 58 percent currently). An aging population, decreases in housing affordability, and
changes in lifestyle will drive this shift in housing preference toward attached housing,
particularly in the Anchorage Bowl.
• A survey of over 800 households in the Anchorage Bowl and Chugiak-Eagle River found that 18
percent of respondents were “highly likely” candidates to choose compact housing based on
their stated housing preference.
Land Supply and Housing Capacity
• As of 2010, there were 5,800 acres of buildable residential land in the Anchorage Bowl, including
5,200 acres of vacant (undeveloped) land and 600 acres of partially vacant land that has space to
be further subdivided or developed.
• The inventory shows a 30 to 40 percent decline in the amount of buildable residential land in the
Anchorage Bowl since 1998.
• Without increasing the current level of housing density and increasing the rate of redevelopment,
the Anchorage Bowl will lack land for about 8,900 of the projected new housing units, or about
half of expected demand.
Projected Residential Land Sufficiency, Anchorage Bowl, 2010 to 2030
Structure Type Land Capacity
Projected Housing Demand
Sufficiency (capacity minus
demand)
Large Lot Single Family 2,030 362 1,668
Single Family 3,614 6,003 (2,389)
Two Family / Duplex 1,272 3,455 (2,183)
Townhouse 768 1,455 (687)
Multifamily / Other 3,315 6,909 (3,594)
Total 11,000 18,184
Total "surplus units" -- -- 1,668
Total "deficit units" -- -- (8,852)
Source: ECONorthwest
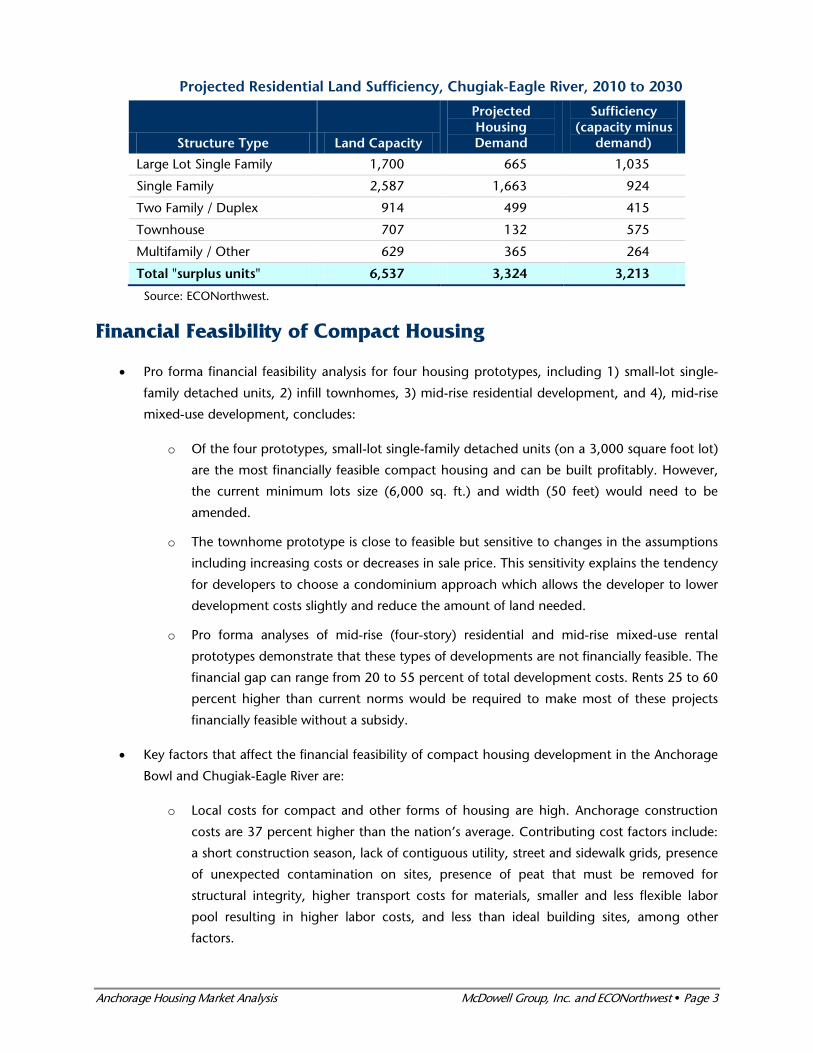
• Chugiak-Eagle River has enough land to meet its own projected demand for all housing types.
The surplus land capacity in Chugiak-Eagle River could accommodate some of the Bowl’s single-
family detached housing demand; however, it is not the ideal location to address the Bowl’s need
for dense urban multifamily development and cannot accommodate all of the projected demand.
Anchorage Housing Market Analysis McDowell Group, Inc. and ECONorthwest Page 3
Projected Residential Land Sufficiency, Chugiak-Eagle River, 2010 to 2030
Structure Type Land Capacity
Projected Housing Demand
Sufficiency (capacity minus
demand)
Large Lot Single Family 1,700 665 1,035
Single Family 2,587 1,663 924
Two Family / Duplex 914 499 415
Townhouse 707 132 575
Multifamily / Other 629 365 264
Total "surplus units" 6,537 3,324 3,213
Source: ECONorthwest.
Financial Feasibility of Compact Housing
• Pro forma financial feasibility analysis for four housing prototypes, including 1) small-lot single-
family detached units, 2) infill townhomes, 3) mid-rise residential development, and 4), mid-rise
mixed-use development, concludes:
o Of the four prototypes, small-lot single-family detached units (on a 3,000 square foot lot)
are the most financially feasible compact housing and can be built profitably. However,
the current minimum lots size (6,000 sq. ft.) and width (50 feet) would need to be
amended.
o The townhome prototype is close to feasible but sensitive to changes in the assumptions
including increasing costs or decreases in sale price. This sensitivity explains the tendency
for developers to choose a condominium approach which allows the developer to lower
development costs slightly and reduce the amount of land needed.
o Pro forma analyses of mid-rise (four-story) residential and mid-rise mixed-use rental
prototypes demonstrate that these types of developments are not financially feasible. The
financial gap can range from 20 to 55 percent of total development costs. Rents 25 to 60
percent higher than current norms would be required to make most of these projects
financially feasible without a subsidy.
• Key factors that affect the financial feasibility of compact housing development in the Anchorage
Bowl and Chugiak-Eagle River are:
o Local costs for compact and other forms of housing are high. Anchorage construction
costs are 37 percent higher than the nation’s average. Contributing cost factors include:
a short construction season, lack of contiguous utility, street and sidewalk grids, presence
of unexpected contamination on sites, presence of peat that must be removed for
structural integrity, higher transport costs for materials, smaller and less flexible labor
pool resulting in higher labor costs, and less than ideal building sites, among other
factors.
Anchorage Housing Market Analysis McDowell Group, Inc. and ECONorthwest Page 4
o Parking is expensive (but necessary) to provide. Reducing parking requirements or other
creative approaches to addressing parking needs could bring housing projects closer to
feasibility.
o The limited access to equity and the conservative lending environment is a barrier to
developing mid-rise residential and mixed-use structures. Many banks require 30 percent
of the project costs to be in the form of equity. Some equity lenders charge up to 20
percent interest. For condominium projects, lenders have high pre-sale requirements.
The current conservative lending environment is not unique to Anchorage
o The Anchorage Bowl and Chugiak-Eagle River lack neighborhoods with a traditional
“main street” architectural form where higher density development typically locates.
Compact housing is easier to finance and sell when it is located near retail and other
types of amenities (such as grocery stores, coffee shops, transit access, etc.).
o Public investment and other creative solutions will be necessary to make mid-rise
multifamily and mixed-use development feasible in Anchorage in the near future.
Implications for Housing Policy in Anchorage
The key conclusions of the analysis are:
• Given the historic density of development and rate of redevelopment, the Anchorage Bowl does
not have sufficient vacant buildable residential land to accommodate the demand for housing
units forecasted over the next 20 years.
• Building mid-rise residential and mid-rise mixed-use rental developments is not financially feasible
in the current market.
Those conclusions lead to an obvious, broad policy question: What can the Municipality do to
accommodate the expected demand for housing? This question is not new to the Municipality—the
preferred growth alternative in Anchorage 2020 was the Urban Transition Scenario, whose policies
included developing more intensive urban centers in Downtown and Midtown and encouraging infill and
redevelopment where appropriate.
Housing Policy Options for Further Consideration
Assuming that Anchorage 2020, still represents the vision for the community, the following are the study
team’s suggestions for housing policies that merit further consideration by policy makers, city planners,
housing advocacy groups, neighborhood community councils, developers, and financial institutions. The
Municipality is already considering some of these options through the Title 21 rewrite process, the
Anchorage 2020 Comprehensive Plan, and other initiatives.
Anchorage Housing Market Analysis McDowell Group, Inc. and ECONorthwest Page 5
Increase Efficient Land Use
• Update the Land-Use Map to increase land use efficiency and implement Anchorage 2020 and the
Title 21 Rewrite.
• Reduce parking requirements for multifamily housing to reduce development costs.
Increase Residential Densities
• Allow small-lot single-family housing on smaller lots (less than 6,000 square feet) and narrower
lots (less than 50 feet) where appropriate and with design standards.
• Provide opportunity areas for building denser housing, such as the centers identified in Anchorage
2020.
• Develop funding solutions to provide infrastructure to support residential densities and more
efficient use of land.
• Implement design standards to ensure development of desirable communities and protection of
land values.
Increase the Supply of Buildable Land
• Phase infrastructure expansion into large land holdings in Chugiak-Eagle River.
• Conserve the residential land supply by limiting rezoning of residential land for other uses.
• Identify publicly owned lands that are suitable and make them available for residential
development.
Facilitate Redevelopment
• Create and implement a redevelopment strategy to encourage infill and more compact
residential development.
• Identify key redevelopment stakeholders, tools, and opportunity areas or sites to implement a
redevelopment strategy.
• Target and clarify the existing tax-abatement and fee-waiver ordinance to increase effectiveness
as a redevelopment tool.
Ensure Affordable Housing
• Expand affordable and workforce housing opportunities by identifying appropriate tools or
financial incentives to create or rehabilitate affordable housing.
Anchorage Housing Market Analysis McDowell Group, Inc. and ECONorthwest Page 6
Improve the Regulatory Process
• Seek ways to further streamline development regulations and the permit process.
Next Steps
This technical report offers a detailed analysis of the housing demand challenges facing the Anchorage
Bowl and Chugiak-Eagle River, and provides a basis for continued work on housing issues. The
Municipality’s next steps are to complete work on the Title 21 Revisions and develop a strategic plan to
implement the preferred recommendations from this report. Some policy options will create more
community or developer resistance, and policy makers and Municipal staff will need to prioritize housing
policies to be adopted based on the outcomes they are most concerned about, as part of a strategic
planning process.
Anchorage Housing Market Analysis McDowell Group, Inc. and ECONorthwest Page 7
Introduction
Anchorage is the largest urban area in Alaska, and is expected to grow by nearly 20 percent over the next
20 years. More people will create a need for more housing. The Anchorage 2020: Anchorage Bowl
Comprehensive Plan (2001) concluded that the amount of land in the Anchorage Bowl needed to
accommodate expected new housing construction through 2020 was greater than the amount of land
available for building that housing (given the existing zoning). The conclusion of the Comprehensive Plan
was that the Municipality would need to provide opportunities for developing housing at greater
densities than in the past and to facilitate infill and redevelopment of underutilized land throughout the
Anchorage Bowl.
The Municipality of Anchorage (MOA) contracted with McDowell Group and ECONorthwest to conduct
an analysis of housing demand and preferences in the Anchorage Bowl and Chugiak-Eagle River. The
purpose of this study is to evaluate overall demand for all types of housing in the Anchorage Bowl and
Chugiak-Eagle River over the 2010 to 2030 period and to evaluate the financial feasibility of compact
housing types. This study provides information about demand for and capacity of residential land in
Anchorage to inform the Municipality’s planning processes, such as the revisions to Title 21, district
planning, or other work on affordable housing issues.
The result of this study is the identification and description of key housing issues related to projected
growth and residential land capacity and a discussion of policy options for the Municipality to address
these issues. The study concludes with the consulting team’s suggestions about housing policies that
merit further consideration by the Municipality, in light of municipal planning goals.
Work on the project started in December 2010 and has resulted in:
• A summary of preliminary research, including research on issues affecting housing demand,
review of relevant data and documents on Anchorage’s housing market, interviews with
stakeholders, and review of “Lower 48” compact housing case studies.
• A survey of housing preferences among current residents within the Municipality.
• A forecast of housing demand in Anchorage from 2010 to 2030. Two forecasts are presented:
(1) a baseline of demand for all housing based on historical trends and (2) a variation that shows
potential housing demand based on forecasts of demographic changes, economic trends, and
housing preferences in Anchorage.
• Case studies of compact housing development in Anchorage.
• An analysis of financial feasibility of selected types of compact housing development in
Anchorage.
Anchorage Housing Market Analysis McDowell Group, Inc. and ECONorthwest Page 8
• An inventory of buildable residential land (prepared by Municipal staff), including the amount
of vacant and partially vacant buildable land and the capacity of that land to accommodate new
dwellings within existing zoning and public policies.
• Implications for housing policy and policy options for how to accommodate growth in
Anchorage through higher density housing development without sacrificing the city’s quality of
life.
Anchorage Housing Market Analysis McDowell Group, Inc. and ECONorthwest Page 9
Methods
Following are key concepts about housing demand discussed throughout this report:
• Housing demand. The term “housing demand” is used in two ways: (1) to refer to factors that
influence the amount of housing, by type, that has been or is likely to be absorbed in the
Anchorage market, and (2) the historical and forecasted amount of that absorption.
• Housing market demand versus housing need. Housing market demand is what households
demonstrate they are willing to pay for in the housing marketplace. Housing need, as used in this
study, distinguishes between: (1) households that are financially able to purchase or rent housing
at an affordable price consistent with their household characteristics, and (2) households that
cannot find and afford such housing. This study focuses on housing market demand, rather than
housing need or affordability.
• Compact housing. The “compactness” of housing is defined for this study by multiple
characteristics: the structure type (detached or attached), the size of the dwelling unit, and the
size of the lot the dwelling is located on. The definition of what constitutes compact housing may
change by location, for example in a downtown neighborhood versus a suburban area. Compact
housing may be either owned or rented.
More specifically, this study defines compact housing as:
(1) Detached housing on individual parcels of land smaller than 6,000 square feet or single-
family detached condos on a common lot, or
(2) Attached housing of all types, some of lower density (townhouses, two-family, and duplexes)
and some of higher density that are commonly stacked
Below is a brief overview of the study methods. More detailed methodological information is available in
the appendices.
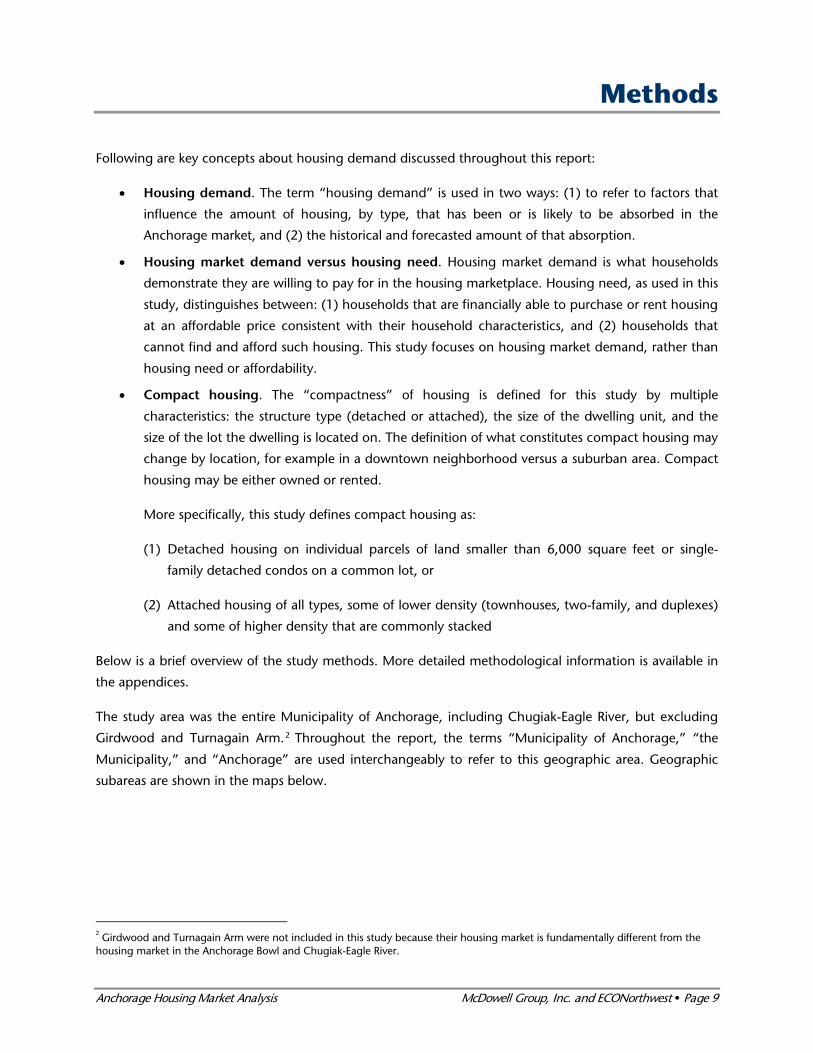
The study area was the entire Municipality of Anchorage, including Chugiak-Eagle River, but excluding
Girdwood and Turnagain Arm.2 Throughout the report, the terms “Municipality of Anchorage,” “the
Municipality,” and “Anchorage” are used interchangeably to refer to this geographic area. Geographic
subareas are shown in the maps below.
2 Girdwood and Turnagain Arm were not included in this study because their housing market is fundamentally different from the housing market in the Anchorage Bowl and Chugiak-Eagle River.
Anchorage Housing Market Analysis McDowell Group, Inc. and ECONorthwest Page 10
Figure 1. Municipality of Anchorage and sub-areas within the Anchorage Bowl
Source: McDowell Group
Technical Advisory Committee
Eleven people were asked by the Municipality of Anchorage to represent a variety of disciplines (such as
realtors, finance, developers, architects, planning and zoning commission members, economic
development professionals, community councils, and the Anchorage Assembly) with interest and
expertise in Anchorage’s housing market. The committee was provided background information, draft
white papers and analyses (many of which were finalized and found in the Appendices) and other
reading material by the study team in advance of six meetings scheduled over the year-long study period.
The committee’s role was advisory, providing impressions, opinions, and feedback on the study’s
assumptions, methods, and findings throughout all the study phases. Committee members are
acknowledged at the front of this summary.
Housing Surveys
A telephone survey collected a wide range of housing and housing-preference data from a statistically
representative sample of households in the Anchorage Bowl and Chugiak-Eagle River. A companion
survey was conducted online to gather more detailed information from a separate sample of residents.
McDowell Group fielded the telephone survey between January 5 and January 14, 2011. A total of 814
telephone surveys were completed. This sample size produced a maximum sampling error of +/- 3.5
percent at the 95 percent confidence level for the sample as a whole.
Anchorage Housing Market Analysis McDowell Group, Inc. and ECONorthwest Page 11
The online survey and Discrete Choice Exercise (DCE) was designed to test the attractiveness of certain
neighborhood amenities in comparison to specified price, location, square footage and outdoor space
alternatives. Specifically, the DCE is a conjoint analysis that quantifies market demand based on how
respondents trade off different factors such as amenities, size and price. The online survey was fielded
between February 4 and February 13, 2011, using a stratified, online panel designed to be representative
of the Anchorage Bowl and Chugiak-Eagle River. A total of 406 complete survey responses were obtained;
298 of these respondents expressed a willingness to consider Compact Urban Housing and completed
the DCE. The maximum sampling error for a random sample of these sizes is +/- 4.9 percent (general
questions) and +/- 5.5 percent (DCE).
Housing Demand
The housing demand analysis (Appendix C) forecasts demand for housing in the Municipality from 2010
to 2030.3 It forecasts demand for five housing types: (1) large-lot single-family, (2) single-family, (3) two-
family and duplex, (4) townhouse, and (5) multifamily and other. Appendix C provides definitions for
each of these housing types.
The forecasts are based on the six main factors that have been shown to affect the amount and type of
housing built in a community: (1) population growth and population demographics, (2) purchasing
power of households, (3) housing preferences, (4) prices and costs of housing, (5) price of housing
substitutes (e.g., transportation), and (6) housing policy. The 20-year forecast begins with historical
trends in population and housing growth, coupled with the official forecasts for population and housing
growth. The analysis then describes how the six factors may increase or decrease demand for different
types of housing.
Financial Feasibility for Building Compact Housing
The evaluation of financial feasibility for building compact housing uses four hypothetical prototypes on
hypothetical sites based on the existing Title 21 Land Use Code. The pro formas project development
costs and revenues to estimate developer return on investment and to identify real estate market
challenges to the development of compact housing. Underlying assumptions in the pro formas were
developed through interviews with the Anchorage development and lending community. The pro formas
also use findings from a rent survey4, industry-standard construction cost estimating sources5. Please refer
to Appendix D for more information about methods, methodological limitations, and assumptions used
in the financial feasibility evaluation.
3 The housing demand was based on population projections produced by the University of Alaska Anchorage’s Institute for Social and Economic Research (ISER). ISER’s assumptions in their base case projections – which extend from 2010 to 2035 – include high oil prices ($95 per barrel in inflation-adjusted 2009 dollars), the construction of a natural gas pipeline, and oil and gas development on the Outer Continental Shelf resulting in new oil production by 2021. The base case assumes that construction of the Knik Arm Bridge will begin in 2013 and that the bridge will open in 2015. 4 AHFC Annual Rental Market Survey, 2011 5 Engineering News Record
Anchorage Housing Market Analysis McDowell Group, Inc. and ECONorthwest Page 12
Compact Housing Case Studies
The purpose of the case studies was to document development of compact housing in Anchorage and to
understand the factors that allowed such development despite financial constraints. The case studies are
based on seven existing compact housing developments in the Anchorage region: Hollybrook Terrace,
Moss Creek, Delaney Square, Strawberry Village, Aurora Square, Park Plaza, and Discovery Park. The case
studies draw from primary research (e.g. interviews with the developers and Municipal staff) to
understand the factors that influenced the developer’s decision to build compact housing in Anchorage,
as well as the market factors and amenities that contributed to the successes and challenges experienced
during the development process.
Buildable Lands Inventory and Housing Capacity Analysis
The Municipal Planning Division conducted an inventory of buildable residential land and projected the
housing capacity of these lands for the 2010-2030 timeframe. Environmental, land use, and urban service
constraints were identified to determine partial and prohibitive constraints on development. The quantity
of vacant and partially vacant residential land was estimated. Three density scenarios were applied to
determine a range of housing capacity estimates for the Anchorage Bowl and Chugiak-Eagle River. The
analysis also included an estimate of the historic rate of redevelopment. Please refer to Appendix F for
more information about methods, assumptions, and results.
Anchorage Housing Market Analysis McDowell Group, Inc. and ECONorthwest Page 13
Forecast of Housing Demand
Economists view housing as a bundle of services for which people are willing to pay some price. Housing
is shelter certainly, but also encompasses proximity to other attractions (jobs, shopping, recreation, etc.),
amenities (type and quality of fixtures and appliances, landscaping, views), prestige, and access to public
services (quality of schools). Because it is impossible to maximize all these services and simultaneously
minimize costs, households must, and do, make tradeoffs. What they can get for their money is
influenced by both economic forces and government policy. Households value what they can get
differently. Each have preferences, which in turn are a function of many factors like income, age of the
head of the household, number of people and children in the household, number of workers and job
locations, number of automobiles, and so on. This section presents key findings about these factors and
how they may affect long-term housing demand in Anchorage.
Demographic Findings
The housing demand forecasts for Anchorage was based on population forecasts for the entire
Municipality of Anchorage developed by the Institute of Social and Economic Research (ISER) at the
University of Alaska Anchorage.6 Based on Municipal planning staff’s breakdown of this forecast for the
Anchorage Bowl and Chugiak-Eagle River sub-regions, it was estimated the Anchorage Bowl will grow by
about 43,400 new people between 2010 and 2030 and Chugiak-Eagle River will add 9,000 people over
the 20-year period.7,8
Growth in population will result in more households and greater demand for housing of all types. Total
future demand for specific types of housing (e.g., single-family housing, duplexes, or apartments) will
result from housing choices made by existing households and new households. Three household
characteristics are strongly correlated with choices about residential location and housing type: age of the
household head, size of the household, and income.
The following section presents the age, size and income characteristics of existing households in
Anchorage. Appendix C describes in greater detail how these and other characteristics interact to create a
range of potential housing choices.
Age of Head of household
Age of head of household is the age of the person identified (in the Census) as the head of household. In
general, head of household age affects housing type and tenure (whether the family rents or owns).
Following are key age trends projected for Anchorage:
6 Goldsmith, Scott. Economic and Demographic Projections for Alaska and Greater Anchorage, 2010-2035. (December 2009). http://www.iser.uaa.alaska.edu/Publications/EconDemProjectionsAnchorage_v4.pdf. 7 This population projection assumes completed construction of the Knik Arm Bridge by 2015. 8 The Alaska Department of Labor and Workforce Development estimated 296,197 people live in the Municipality of Anchorage in 2011.
Anchorage Housing Market Analysis McDowell Group, Inc. and ECONorthwest Page 14
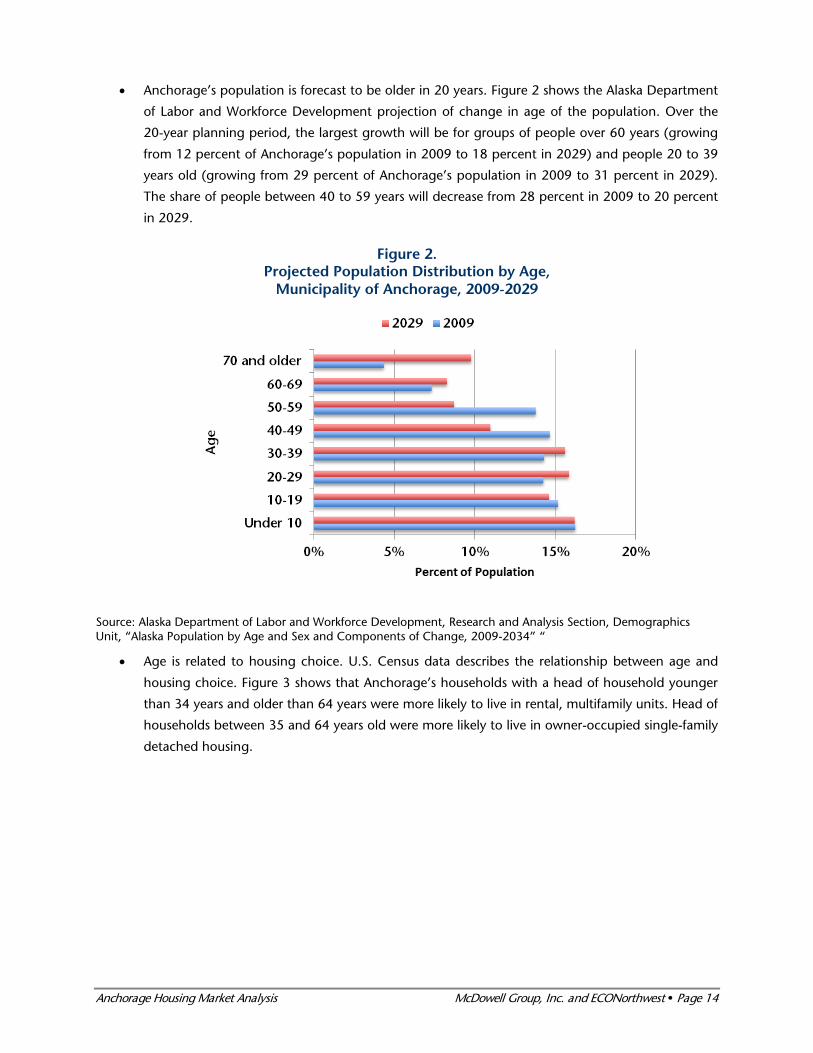
• Anchorage’s population is forecast to be older in 20 years. Figure 2 shows the Alaska Department
of Labor and Workforce Development projection of change in age of the population. Over the
20-year planning period, the largest growth will be for groups of people over 60 years (growing
from 12 percent of Anchorage’s population in 2009 to 18 percent in 2029) and people 20 to 39
years old (growing from 29 percent of Anchorage’s population in 2009 to 31 percent in 2029).
The share of people between 40 to 59 years will decrease from 28 percent in 2009 to 20 percent
in 2029.
Figure 2. Projected Population Distribution by Age,
Municipality of Anchorage, 2009-2029
Source: Alaska Department of Labor and Workforce Development, Research and Analysis Section, Demographics Unit, “Alaska Population by Age and Sex and Components of Change, 2009-2034” “
• Age is related to housing choice. U.S. Census data describes the relationship between age and
housing choice. Figure 3 shows that Anchorage’s households with a head of household younger
than 34 years and older than 64 years were more likely to live in rental, multifamily units. Head of
households between 35 and 64 years old were more likely to live in owner-occupied single-family
detached housing.
Anchorage Housing Market Analysis McDowell Group, Inc. and ECONorthwest Page 15
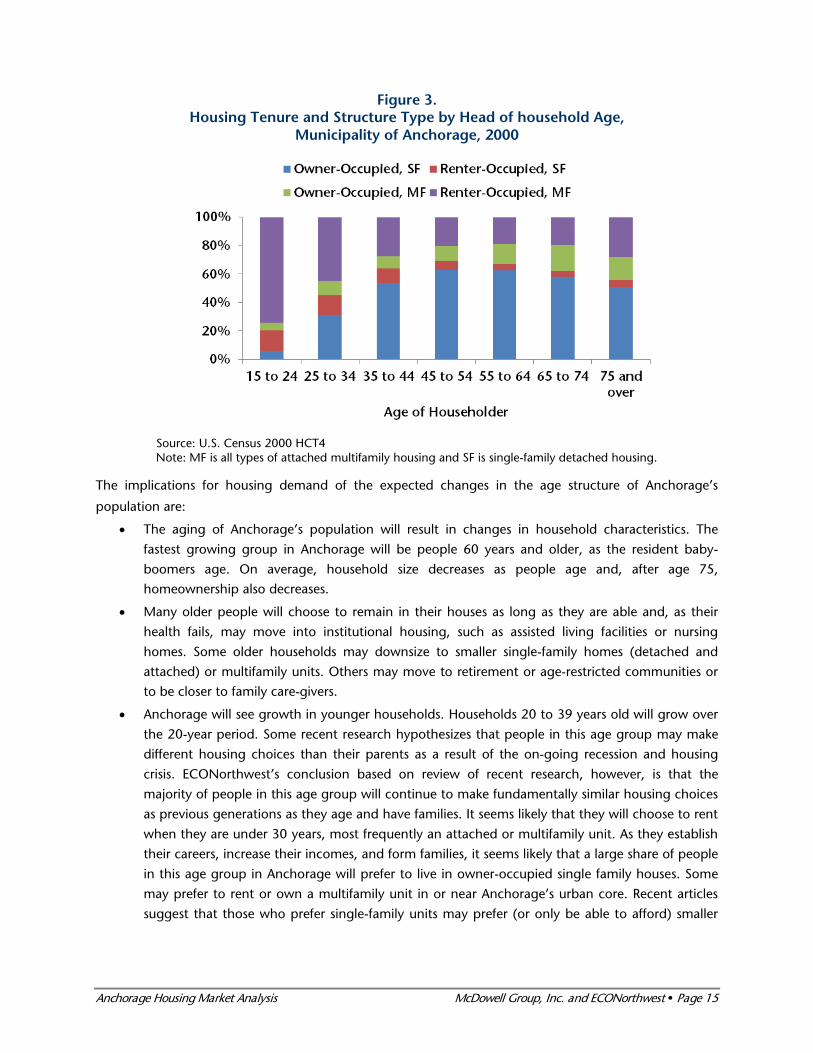
Figure 3. Housing Tenure and Structure Type by Head of household Age,
Municipality of Anchorage, 2000
Source: U.S. Census 2000 HCT4 Note: MF is all types of attached multifamily housing and SF is single-family detached housing.
The implications for housing demand of the expected changes in the age structure of Anchorage’s
population are:
• The aging of Anchorage’s population will result in changes in household characteristics. The
fastest growing group in Anchorage will be people 60 years and older, as the resident baby-
boomers age. On average, household size decreases as people age and, after age 75,
homeownership also decreases.
• Many older people will choose to remain in their houses as long as they are able and, as their
health fails, may move into institutional housing, such as assisted living facilities or nursing
homes. Some older households may downsize to smaller single-family homes (detached and
attached) or multifamily units. Others may move to retirement or age-restricted communities or
to be closer to family care-givers.
• Anchorage will see growth in younger households. Households 20 to 39 years old will grow over
the 20-year period. Some recent research hypothesizes that people in this age group may make
different housing choices than their parents as a result of the on-going recession and housing
crisis. ECONorthwest’s conclusion based on review of recent research, however, is that the
majority of people in this age group will continue to make fundamentally similar housing choices
as previous generations as they age and have families. It seems likely that they will choose to rent
when they are under 30 years, most frequently an attached or multifamily unit. As they establish
their careers, increase their incomes, and form families, it seems likely that a large share of people
in this age group in Anchorage will prefer to live in owner-occupied single family houses. Some
may prefer to rent or own a multifamily unit in or near Anchorage’s urban core. Recent articles
suggest that those who prefer single-family units may prefer (or only be able to afford) smaller
Anchorage Housing Market Analysis McDowell Group, Inc. and ECONorthwest Page 16
single-family units, resulting in increased demand for smaller single-family units and decreased
demand for large single-family units.
Size and Composition of Household
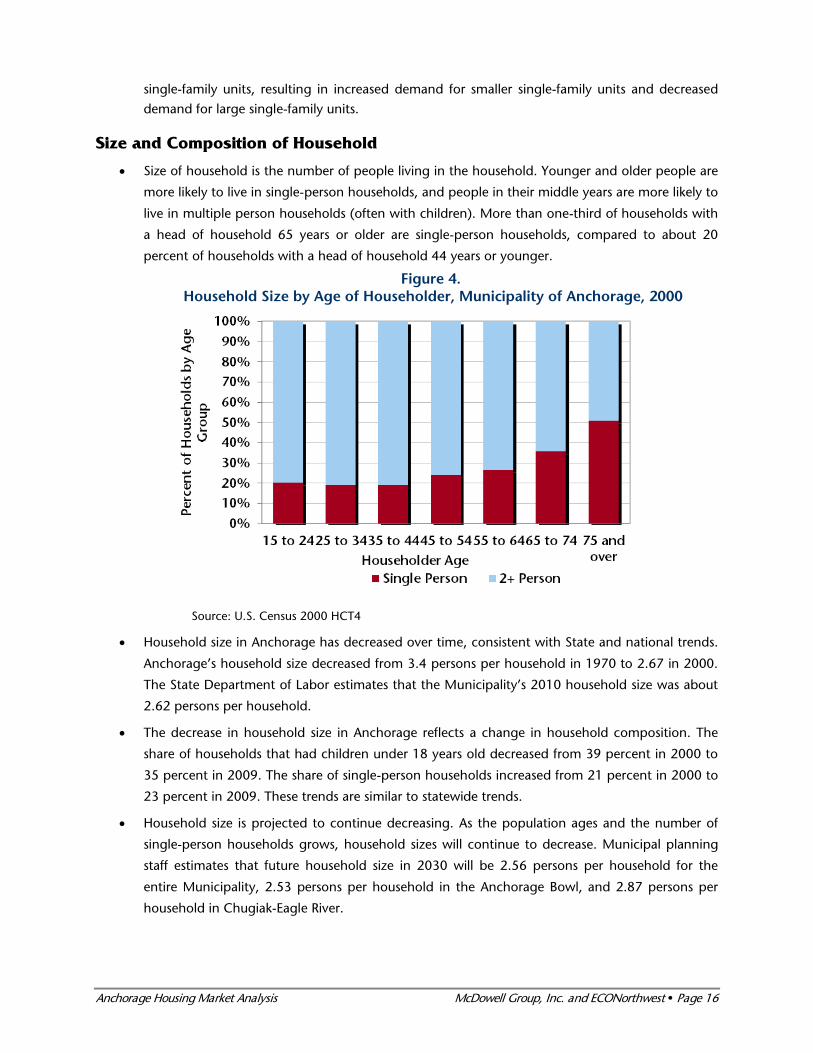
• Size of household is the number of people living in the household. Younger and older people are
more likely to live in single-person households, and people in their middle years are more likely to
live in multiple person households (often with children). More than one-third of households with
a head of household 65 years or older are single-person households, compared to about 20
percent of households with a head of household 44 years or younger.
Figure 4. Household Size by Age of Householder, Municipality of Anchorage, 2000
Source: U.S. Census 2000 HCT4
• Household size in Anchorage has decreased over time, consistent with State and national trends.
Anchorage’s household size decreased from 3.4 persons per household in 1970 to 2.67 in 2000.
The State Department of Labor estimates that the Municipality’s 2010 household size was about
2.62 persons per household.
• The decrease in household size in Anchorage reflects a change in household composition. The
share of households that had children under 18 years old decreased from 39 percent in 2000 to
35 percent in 2009. The share of single-person households increased from 21 percent in 2000 to
23 percent in 2009. These trends are similar to statewide trends.
• Household size is projected to continue decreasing. As the population ages and the number of
single-person households grows, household sizes will continue to decrease. Municipal planning
staff estimates that future household size in 2030 will be 2.56 persons per household for the
entire Municipality, 2.53 persons per household in the Anchorage Bowl, and 2.87 persons per
household in Chugiak-Eagle River.
Anchorage Housing Market Analysis McDowell Group, Inc. and ECONorthwest Page 17
The implication of these changes is demand for smaller units will increase and demand for larger single-
family houses, especially by families with children, will decrease. Demand for smaller units may be met
with a combination of smaller single-family units (ranging from small-lot single-family houses, to condos,
to attached units) and multifamily units.
Income
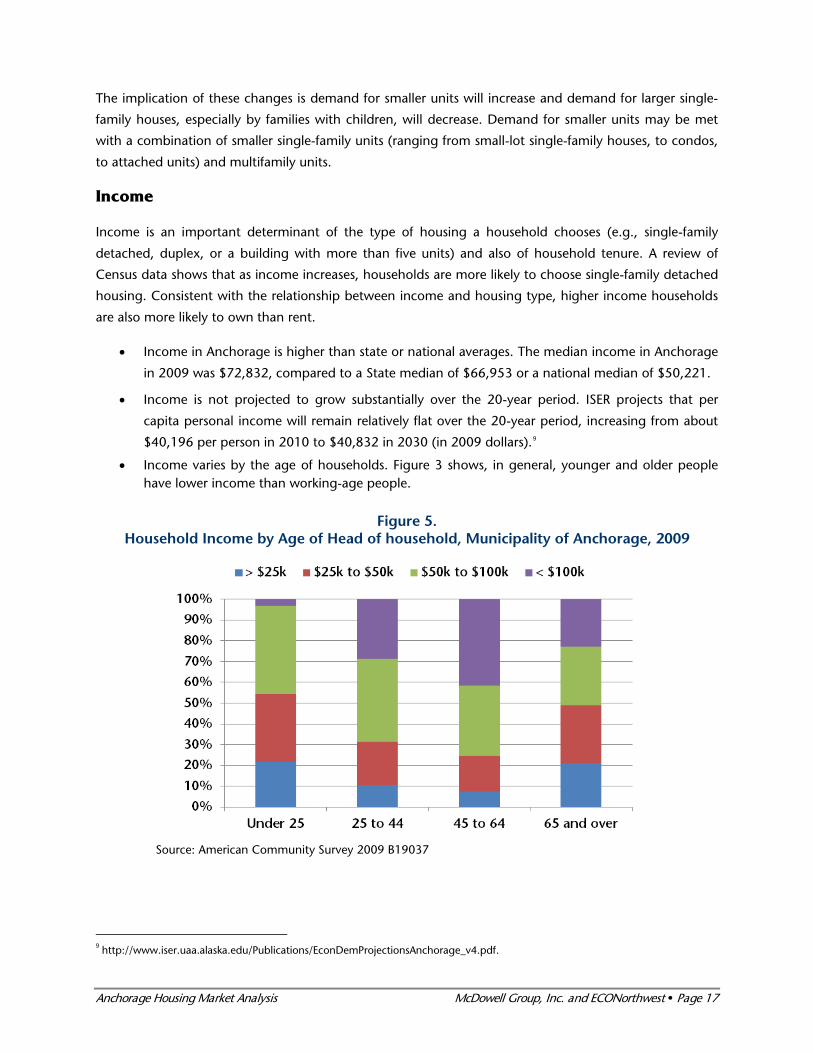
Income is an important determinant of the type of housing a household chooses (e.g., single-family
detached, duplex, or a building with more than five units) and also of household tenure. A review of
Census data shows that as income increases, households are more likely to choose single-family detached
housing. Consistent with the relationship between income and housing type, higher income households
are also more likely to own than rent.
• Income in Anchorage is higher than state or national averages. The median income in Anchorage
in 2009 was $72,832, compared to a State median of $66,953 or a national median of $50,221.
• Income is not projected to grow substantially over the 20-year period. ISER projects that per
capita personal income will remain relatively flat over the 20-year period, increasing from about
$40,196 per person in 2010 to $40,832 in 2030 (in 2009 dollars).9
• Income varies by the age of households. Figure 3 shows, in general, younger and older people have lower income than working-age people.
Figure 5. Household Income by Age of Head of household, Municipality of Anchorage, 2009
Source: American Community Survey 2009 B19037
9 http://www.iser.uaa.alaska.edu/Publications/EconDemProjectionsAnchorage_v4.pdf.
Anchorage Housing Market Analysis McDowell Group, Inc. and ECONorthwest Page 18
The implications of the expected changes in the income of Anchorage’s household on housing demand
are:
• Lack of growth in income may increase demand for compact housing. To the extent that
compact housing is less expensive than larger housing types, the slow growth in income will
increase demand for compact housing.
• Growth in lower-income and less wealthy older households is likely to increase demand for
compact attached or multifamily rental housing. The population forecast shows that the fastest
growing groups over the next 20 years will be people over age 60. Although income declines for
households over 65 years old, these households typically have greater accumulated wealth (e.g.,
housing equity or investments) than younger households. Older households with lower-income
to begin with may be more affected by declines in income if they do not have non-income
wealth.
Housing Preference Survey Findings
A telephone survey was conducted with 814 randomly selected Anchorage and Chugiak-Eagle River
households to collect a range of housing and housing-preference data, including attitudes toward
compact housing. An online survey and Discrete Choice Exercise (DCE) was also conducted to
supplement the telephone survey and test the attractiveness of certain neighborhood amenities in
comparison to specified price, location, square footage and outdoor space alternatives. The main findings
of the surveys were:
• Respondents have a preference for single-family homes. Anchorage and Chugiak-Eagle River
residents heavily favor single-family homes (either attached or detached) over multi-unit
complexes (74 percent vs. 22 percent respectively).
• Respondents have a preference for ownership. Eight of ten survey respondents say they are
more likely to buy than rent their next residence. Younger people, single-person households and
lower-income households are most likely to rent. Forty percent of those renting now say they are
most likely to rent their next home as well.
• Respondents generally prefer centrally located, safe neighborhoods. When Anchorage and
Chugiak-Eagle River residents chose their current neighborhoods, they did so on the basis of a
complex interaction of factors.
• When asked for the single most important reason for choosing their current neighborhood,
the top three responses given included “centrally located” (22 percent), “quiet/private,” (11
percent) and “distance from work” (10 percent).
• When asked what neighborhood amenity will be most important in their next neighborhood
choice, the top response was “neighborhood safety” (22 percent).
Anchorage Housing Market Analysis McDowell Group, Inc. and ECONorthwest Page 19
• 18 percent of respondents were “highly likely” candidates to choose compact housing
based on their stated housing preference. “Highly likely” respondents for compact housing in
the future are those who stated they:
• Are likely to consider a smaller home in the future and
• Prefer a smaller home and shorter commute rather than a larger home and longer
commute and
• Prefer being close to restaurants, stores and entertainment to having a large yard.
• People “highly likely” to choose smaller homes:
• Were a little older than average and less likely to have children at home, but similar to
Anchorage’s population otherwise.
• Generally value the same neighborhood amenities as all respondents but were somewhat
more likely to consider proximity to trails and open space, and also to grocery stores as
important, and they show slightly less interest in play space for children.
• Do not place as high a value on a large yard or the need for storage space for their
recreational equipment.
• This pool of “highly likely” candidates for compact housing will likely increase in the future as
older Alaskans are the fastest growing segment of the population.
Case Studies of Compact Housing Findings
This study included case studies of compact housing in Anchorage. The selection of case studies of
residential developments illustrates a variety of types of compact housing built in Anchorage including:
small (starting around 1,000 square feet) single-family housing, townhouses, stacked condominiums and
apartments. The case studies are presented in Appendix E.
The case studies produced three main conclusions:
• Compact housing can be developed in Anchorage successfully if attention is paid to the
unique characteristics of Anchorage’s housing market. Compact development should create a
sense of place that fits with the Alaskan life style, creating a balance between the conveniences of
a mid-size city and the outdoor lifestyle that attracts people to Alaska. Successful compact
development focuses on natural amenities, open space and views, provides storage for outdoor
activity equipment, and creates a site plan with attention to architectural details. “Horizontal
(site) condominiums,” when well built, can be a suitable product for achieving moderate density.
• Compact housing vacancy rates have been similar to vacancy rates for other rental units in
Anchorage. The vacancy rates of the case studies rental units was less than 5 percent. According
to a survey by the Alaska Housing Finance Corporation Rental vacancy rates were generally below
5 percent between 2000 and 2010.
Anchorage Housing Market Analysis McDowell Group, Inc. and ECONorthwest Page 20
• Financing is a barrier to compact housing projects. Financing is difficult to obtain in the
Anchorage area, consistent with national trends. High pre-sale requirements for condominium
projects are a significant barrier to development.
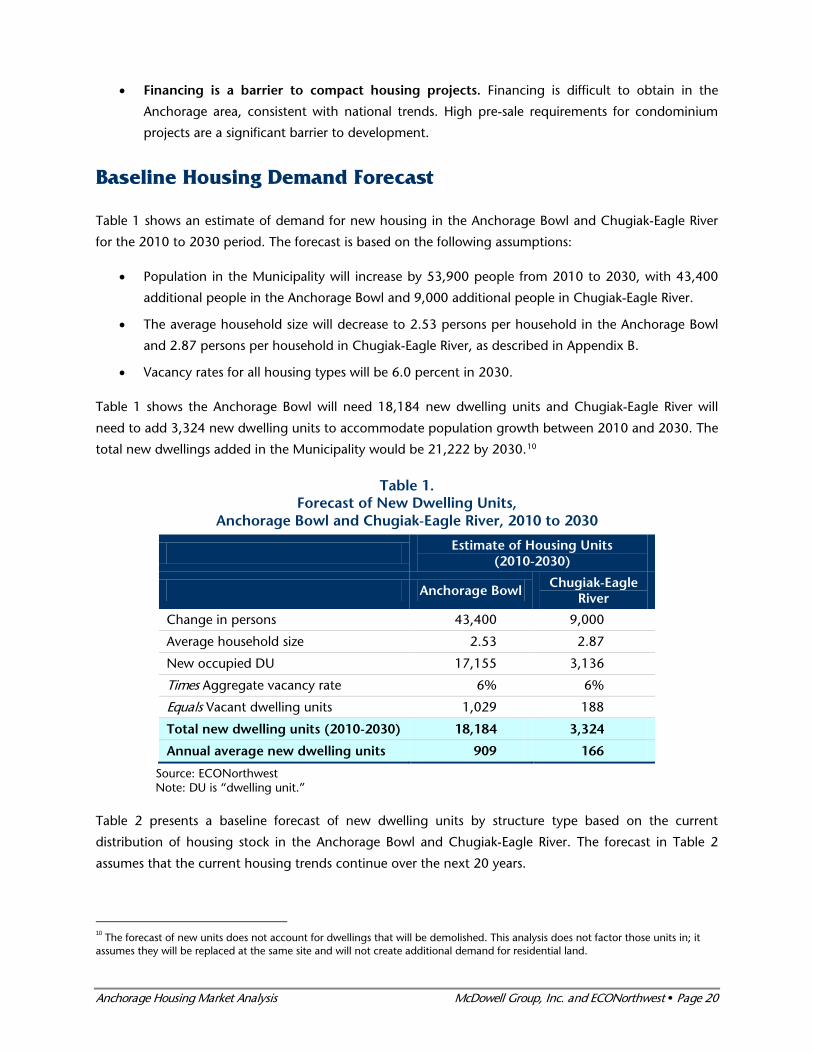
Baseline Housing Demand Forecast
Table 1 shows an estimate of demand for new housing in the Anchorage Bowl and Chugiak-Eagle River
for the 2010 to 2030 period. The forecast is based on the following assumptions:
• Population in the Municipality will increase by 53,900 people from 2010 to 2030, with 43,400
additional people in the Anchorage Bowl and 9,000 additional people in Chugiak-Eagle River.
• The average household size will decrease to 2.53 persons per household in the Anchorage Bowl
and 2.87 persons per household in Chugiak-Eagle River, as described in Appendix B.
• Vacancy rates for all housing types will be 6.0 percent in 2030.
Table 1 shows the Anchorage Bowl will need 18,184 new dwelling units and Chugiak-Eagle River will
need to add 3,324 new dwelling units to accommodate population growth between 2010 and 2030. The
total new dwellings added in the Municipality would be 21,222 by 2030.10
Table 1. Forecast of New Dwelling Units,
Anchorage Bowl and Chugiak-Eagle River, 2010 to 2030
Estimate of Housing Units (2010-2030)
Anchorage Bowl Chugiak-Eagle
River
Change in persons 43,400 9,000
Average household size 2.53 2.87
New occupied DU 17,155 3,136
Times Aggregate vacancy rate 6% 6%
Equals Vacant dwelling units 1,029 188
Total new dwelling units (2010-2030) 18,184 3,324
Annual average new dwelling units 909 166
Source: ECONorthwest Note: DU is “dwelling unit.”
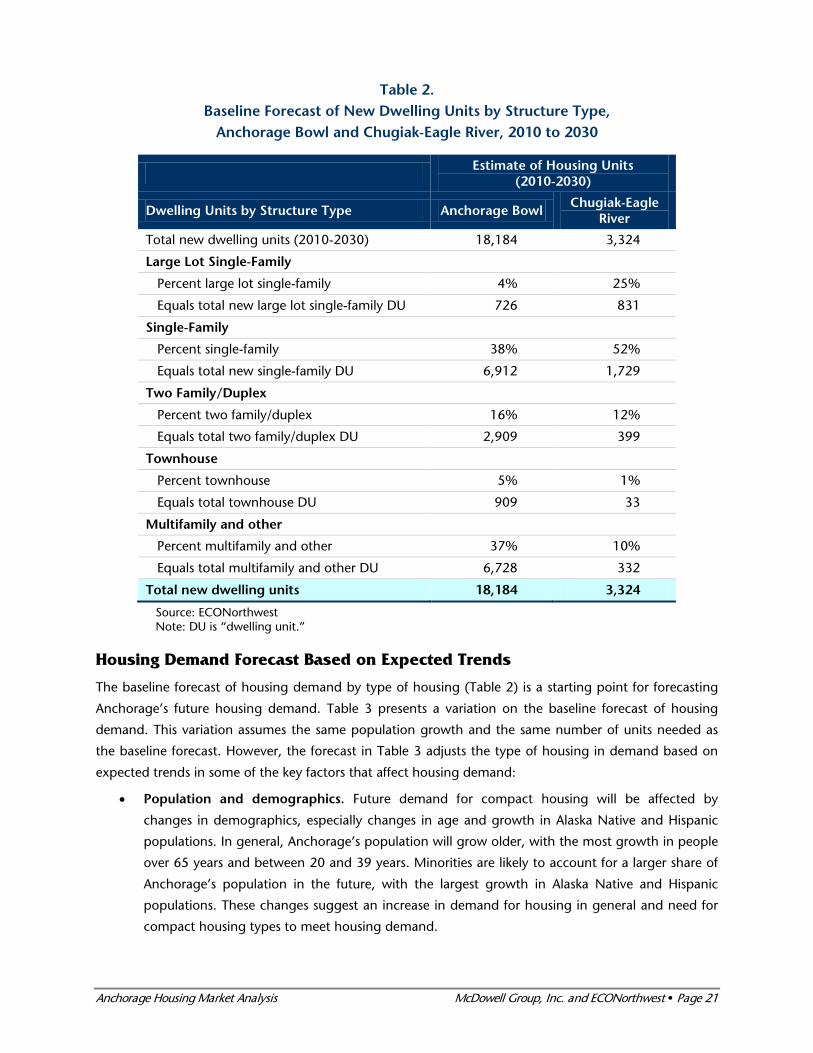
Table 2 presents a baseline forecast of new dwelling units by structure type based on the current
distribution of housing stock in the Anchorage Bowl and Chugiak-Eagle River. The forecast in Table 2
assumes that the current housing trends continue over the next 20 years.
10 The forecast of new units does not account for dwellings that will be demolished. This analysis does not factor those units in; it assumes they will be replaced at the same site and will not create additional demand for residential land.
Anchorage Housing Market Analysis McDowell Group, Inc. and ECONorthwest Page 21
Table 2. Baseline Forecast of New Dwelling Units by Structure Type,
Anchorage Bowl and Chugiak-Eagle River, 2010 to 2030
Estimate of Housing Units (2010-2030)
Dwelling Units by Structure Type Anchorage Bowl Chugiak-Eagle
River
Total new dwelling units (2010-2030) 18,184 3,324
Large Lot Single-Family
Percent large lot single-family 4% 25%
Equals total new large lot single-family DU 726 831
Single-Family
Percent single-family 38% 52%
Equals total new single-family DU 6,912 1,729
Two Family/Duplex
Percent two family/duplex 16% 12%
Equals total two family/duplex DU 2,909 399
Townhouse
Percent townhouse 5% 1%
Equals total townhouse DU 909 33
Multifamily and other
Percent multifamily and other 37% 10%
Equals total multifamily and other DU 6,728 332
Total new dwelling units 18,184 3,324
Source: ECONorthwest Note: DU is “dwelling unit.”
Housing Demand Forecast Based on Expected Trends
The baseline forecast of housing demand by type of housing (Table 2) is a starting point for forecasting
Anchorage’s future housing demand. Table 3 presents a variation on the baseline forecast of housing
demand. This variation assumes the same population growth and the same number of units needed as
the baseline forecast. However, the forecast in Table 3 adjusts the type of housing in demand based on
expected trends in some of the key factors that affect housing demand:
• Population and demographics. Future demand for compact housing will be affected by
changes in demographics, especially changes in age and growth in Alaska Native and Hispanic
populations. In general, Anchorage’s population will grow older, with the most growth in people
over 65 years and between 20 and 39 years. Minorities are likely to account for a larger share of
Anchorage’s population in the future, with the largest growth in Alaska Native and Hispanic
populations. These changes suggest an increase in demand for housing in general and need for
compact housing types to meet housing demand.
Anchorage Housing Market Analysis McDowell Group, Inc. and ECONorthwest Page 22
• Purchasing Power. ISER’s projection for change in real household income is that income will
remain stable over the 20-year period. The lack of growth in household income suggests that, if
real housing costs increase (as discussed below), housing may become less affordable and
demand for compact housing may increase.
• Preferences. The survey of housing preferences in Anchorage shows that respondents have lived
at their current residences for about eight years, suggesting that, on average, most households
will move two or more times over the 20-year period. According to the survey, about half of
residents are willing to accept a smaller home in the right location and about one-fifth of
respondents are “highly likely” candidates for compact housing. The results of the survey suggest
that the types of compact housing that respondents may have a preference for are lower-density
multifamily structures such as duplexes or townhouses.
• Prices and costs of housing. The price of homeownership and renting increased over the last
decade or more. If housing costs continue to grow and purchasing power does not grow at the
same rate, then housing will become less affordable over time. As housing prices increase, some
households may choose smaller dwellings, which may be more expensive on a per-square-foot
basis but will be more affordable than larger housing types. Decreases in housing affordability
suggest increased demand for compact housing.
• Prices of housing substitutes. The most common housing substitute is commuting from a lower
cost housing market (e.g., Mat-Su) to Anchorage. Increases in commuting costs (primarily fuel
price, parking price, and congestion) would result in increased housing demand in Anchorage.
• Housing Policy. Changes in Municipal housing policy could change the supply and cost of
different types of compact housing. For example, if the Municipality allowed small-lot, single-
family detached units (e.g., on lots less than 6,000 sq. ft.), households may choose to purchase
or rent more compact single-family dwellings. The section on policy implications discusses
potential changes to housing policy that may affect demand for compact housing.
• Availability of Land. Availability of land will affect demand for compact housing. Municipal staff
recently completed an analysis of the supply of buildable land that concluded there is not
enough land in Anchorage to accommodate the forecasted demand for most types of housing.
The implications of this finding are discussed in the next section.
There are dozens of ways that the housing mix in the Anchorage Bowl and Chugiak-Eagle River could
vary over the 20-year period. Table 3 presents one variation for compact housing in Anchorage that is
consistent with the research findings from this study.
Anchorage Housing Market Analysis McDowell Group, Inc. and ECONorthwest Page 23
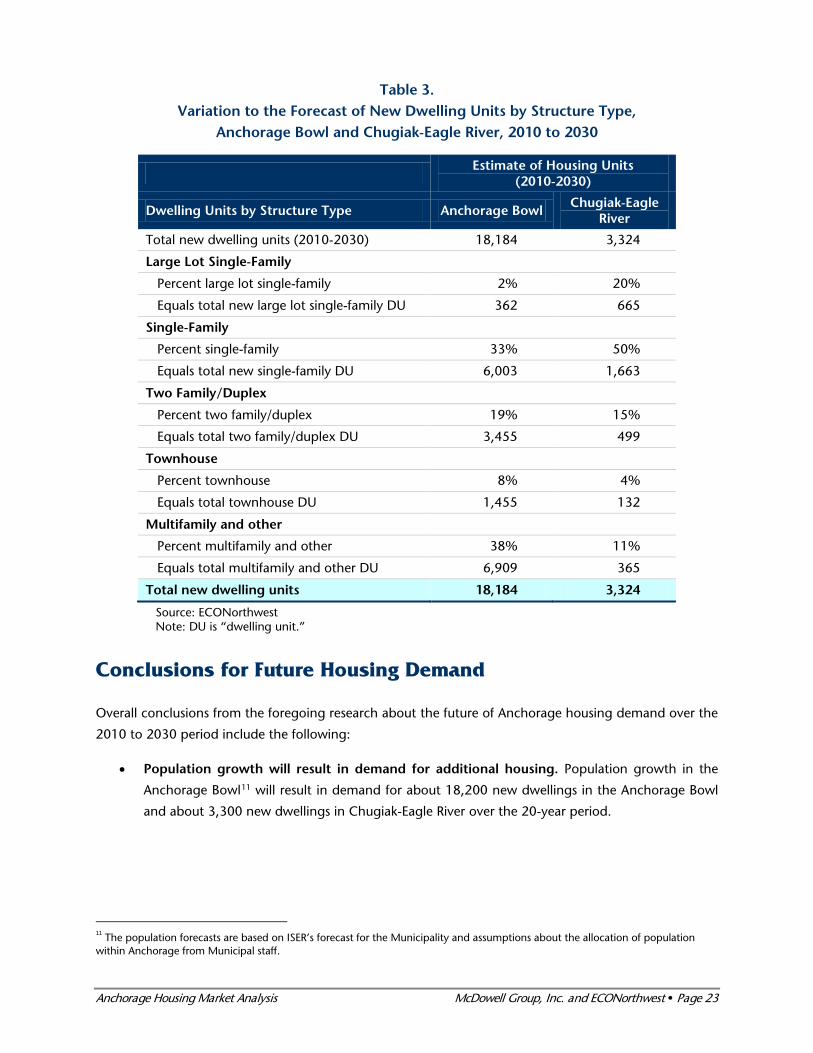
Table 3. Variation to the Forecast of New Dwelling Units by Structure Type,
Anchorage Bowl and Chugiak-Eagle River, 2010 to 2030
Estimate of Housing Units (2010-2030)
Dwelling Units by Structure Type Anchorage Bowl Chugiak-Eagle
River
Total new dwelling units (2010-2030) 18,184 3,324
Large Lot Single-Family
Percent large lot single-family 2% 20%
Equals total new large lot single-family DU 362 665
Single-Family
Percent single-family 33% 50%
Equals total new single-family DU 6,003 1,663
Two Family/Duplex
Percent two family/duplex 19% 15%
Equals total two family/duplex DU 3,455 499
Townhouse
Percent townhouse 8% 4%
Equals total townhouse DU 1,455 132
Multifamily and other
Percent multifamily and other 38% 11%
Equals total multifamily and other DU 6,909 365
Total new dwelling units 18,184 3,324
Source: ECONorthwest Note: DU is “dwelling unit.”
Conclusions for Future Housing Demand
Overall conclusions from the foregoing research about the future of Anchorage housing demand over the
2010 to 2030 period include the following:
• Population growth will result in demand for additional housing. Population growth in the
Anchorage Bowl11 will result in demand for about 18,200 new dwellings in the Anchorage Bowl
and about 3,300 new dwellings in Chugiak-Eagle River over the 20-year period.
11 The population forecasts are based on ISER’s forecast for the Municipality and assumptions about the allocation of population within Anchorage from Municipal staff.
Anchorage Housing Market Analysis McDowell Group, Inc. and ECONorthwest Page 24
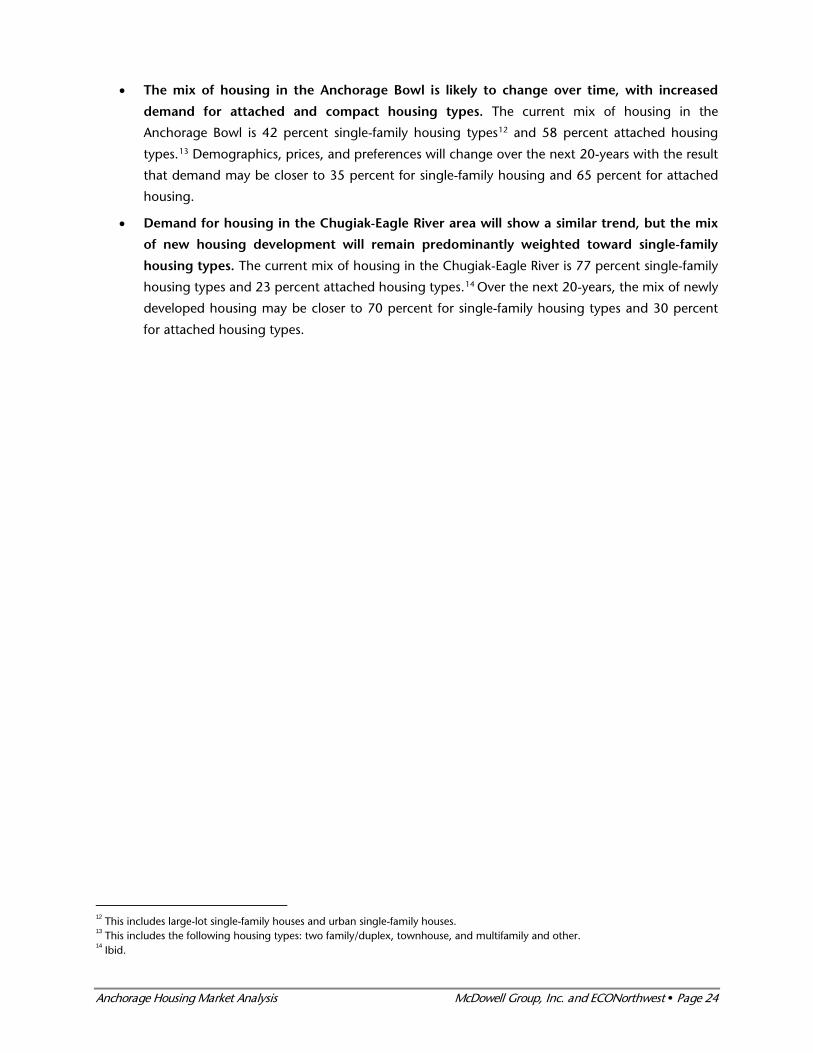
• The mix of housing in the Anchorage Bowl is likely to change over time, with increased
demand for attached and compact housing types. The current mix of housing in the
Anchorage Bowl is 42 percent single-family housing types12 and 58 percent attached housing
types.13 Demographics, prices, and preferences will change over the next 20-years with the result
that demand may be closer to 35 percent for single-family housing and 65 percent for attached
housing.
• Demand for housing in the Chugiak-Eagle River area will show a similar trend, but the mix
of new housing development will remain predominantly weighted toward single-family
housing types. The current mix of housing in the Chugiak-Eagle River is 77 percent single-family
housing types and 23 percent attached housing types.14 Over the next 20-years, the mix of newly
developed housing may be closer to 70 percent for single-family housing types and 30 percent
for attached housing types.
12 This includes large-lot single-family houses and urban single-family houses. 13 This includes the following housing types: two family/duplex, townhouse, and multifamily and other. 14 Ibid.
Anchorage Housing Market Analysis McDowell Group, Inc. and ECONorthwest Page 25
Land Supply and Housing Capacity
Independent of the study of housing demand, staff at the Municipality completed an extensive evaluation
of residential land supply. The methodologies, assumptions, and results of the buildable land inventory
are presented in Appendix F. This section presents a brief summary of the findings.
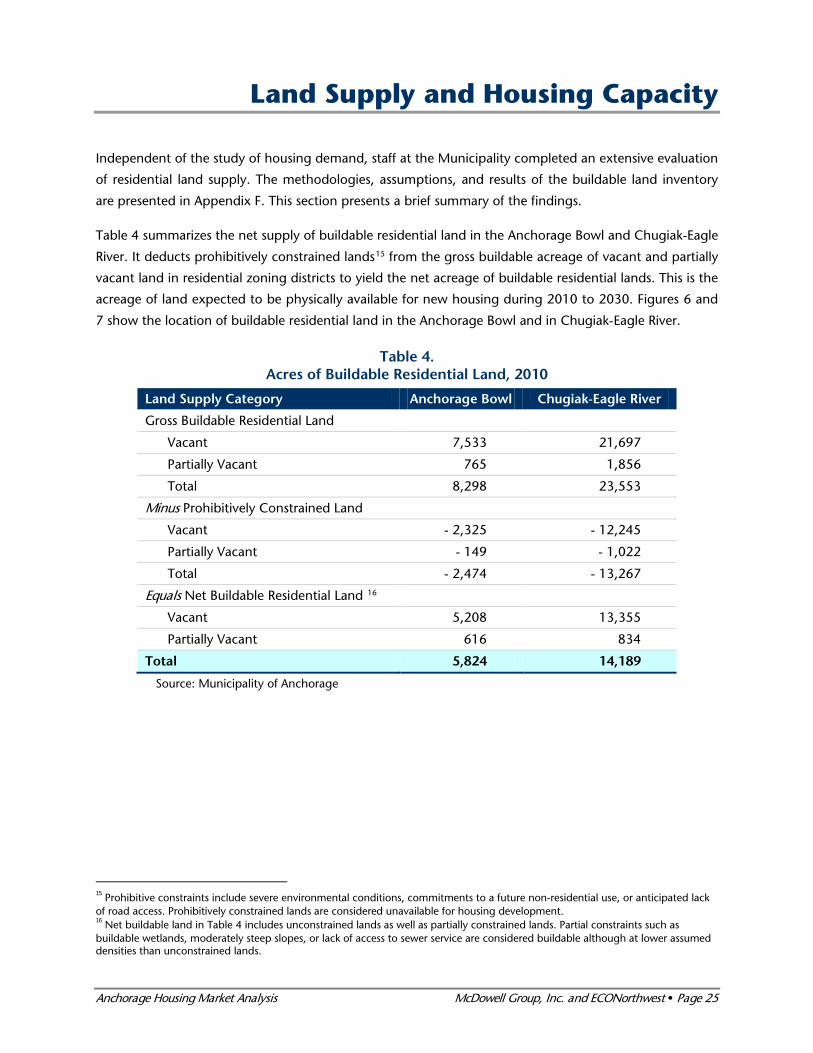
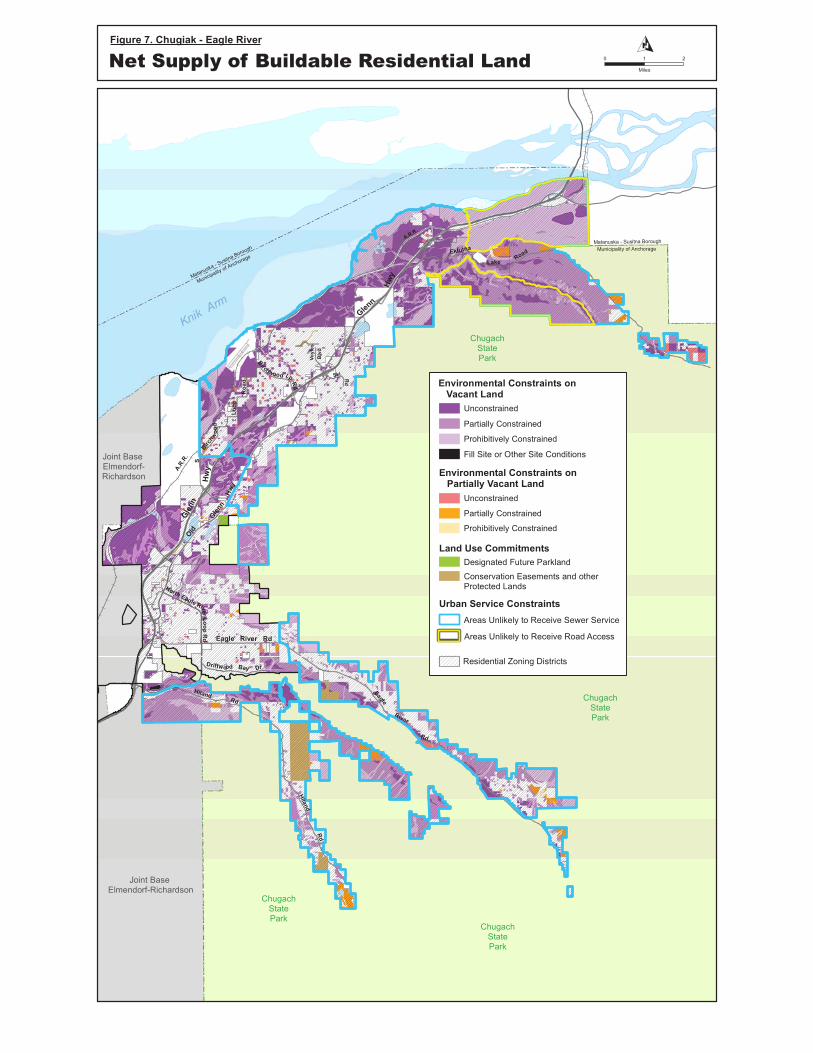
Table 4 summarizes the net supply of buildable residential land in the Anchorage Bowl and Chugiak-Eagle
River. It deducts prohibitively constrained lands15 from the gross buildable acreage of vacant and partially
vacant land in residential zoning districts to yield the net acreage of buildable residential lands. This is the
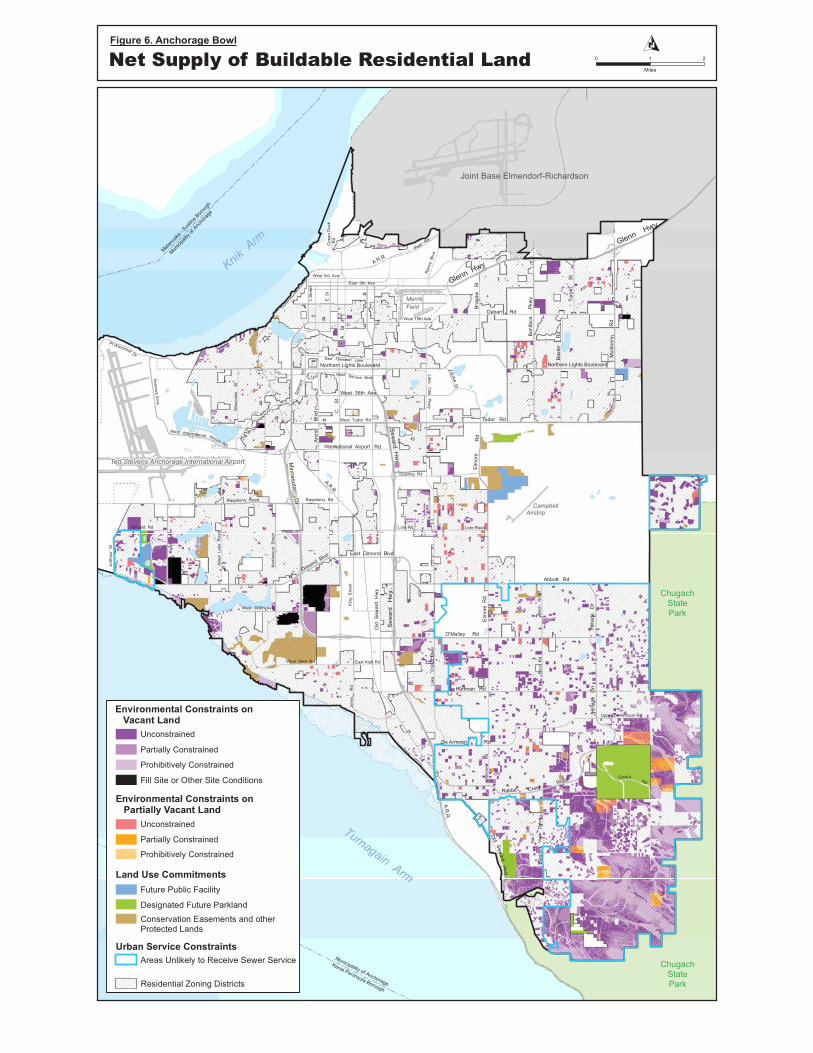
acreage of land expected to be physically available for new housing during 2010 to 2030. Figures 6 and
7 show the location of buildable residential land in the Anchorage Bowl and in Chugiak-Eagle River.
Table 4. Acres of Buildable Residential Land, 2010
Land Supply Category Anchorage Bowl Chugiak-Eagle River
Gross Buildable Residential Land
Vacant 7,533 21,697
Partially Vacant 765 1,856
Total 8,298 23,553
Minus Prohibitively Constrained Land
Vacant - 2,325 - 12,245
Partially Vacant - 149 - 1,022
Total - 2,474 - 13,267
Equals Net Buildable Residential Land 16
Vacant 5,208 13,355
Partially Vacant 616 834
Total 5,824 14,189
Source: Municipality of Anchorage
15 Prohibitive constraints include severe environmental conditions, commitments to a future non-residential use, or anticipated lack of road access. Prohibitively constrained lands are considered unavailable for housing development. 16 Net buildable land in Table 4 includes unconstrained lands as well as partially constrained lands. Partial constraints such as buildable wetlands, moderately steep slopes, or lack of access to sewer service are considered buildable although at lower assumed densities than unconstrained lands.
Anchorage Housing Market Analysis McDowell Group, Inc. and ECONorthwest Page 28
Table 4 shows there were 5,800 acres (net) of buildable residential land in the Anchorage Bowl as of
2010, including 5,200 acres of vacant (undeveloped) land, and 600 acres of partially vacant land that has
space to be further subdivided or developed. This indicates a 30 to 40 percent decline in the amount of
buildable residential land since 1998 in the Anchorage Bowl, when approximately 8,500 acres of vacant
residential lands existed.17
To provide the range of housing capacity that the buildable land supply is likely to accommodate, the
analysis provided the following three density scenarios:
• “Recent Densities” – A continuation of the average residential densities (dwellings per acre) and
mix of housing structure types achieved over the past ten years;
• “Historical Densities” – The average residential densities and mix of housing structure types
achieved by all existing housing stock, regardless of year built; and
• “Accelerated Densities” - A transition to higher average densities closer to the maximum
achievable residential densities allowed by zoning. This scenario assumes the average future
density is the median between recent achieved densities and the maximum allowed density in
each zoning district.
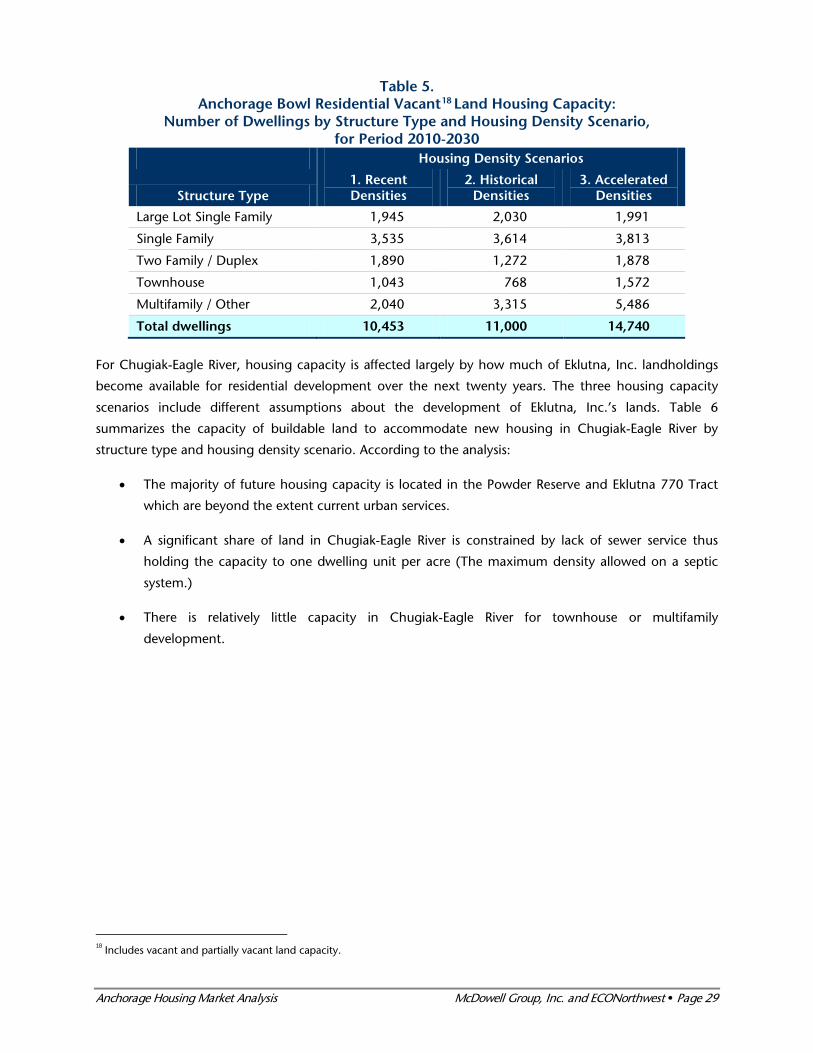
Table 5 summarizes the housing capacity on vacant and partially vacant land in the Anchorage Bowl by
structure type using the three density scenarios. A few key findings stand out:
• Recent achieved densities are lower than historically achieved densities especially in the R-3 and
R-4 districts. This is due to a combination of factors but most notably, a shift from higher density
stacked multifamily housing that was developed in the 1970’s and 1980’s to lower density
ground-orientated townhouse style development constructed more recently.
• In order to accommodate more than 11,000 housing units on the vacant and partially vacant
land supply, there must be trend toward higher density development in the Bowl.
• There is a significant potential for the Anchorage Bowl to accommodate more multifamily
development on vacant and partially vacant land if there is an increase in density. The
“accelerated density” scenario increases the capacity for multifamily units by over 2,000 units.
17 Anchorage 2020/Anchorage Bowl Comprehensive Plan, page 25.
Anchorage Housing Market Analysis McDowell Group, Inc. and ECONorthwest Page 29
Table 5. Anchorage Bowl Residential Vacant18 Land Housing Capacity:
Number of Dwellings by Structure Type and Housing Density Scenario, for Period 2010-2030
Housing Density Scenarios
Structure Type 1. Recent Densities
2. Historical Densities
3. Accelerated Densities
Large Lot Single Family 1,945 2,030 1,991
Single Family 3,535 3,614 3,813
Two Family / Duplex 1,890 1,272 1,878
Townhouse 1,043 768 1,572
Multifamily / Other 2,040 3,315 5,486
Total dwellings 10,453 11,000 14,740
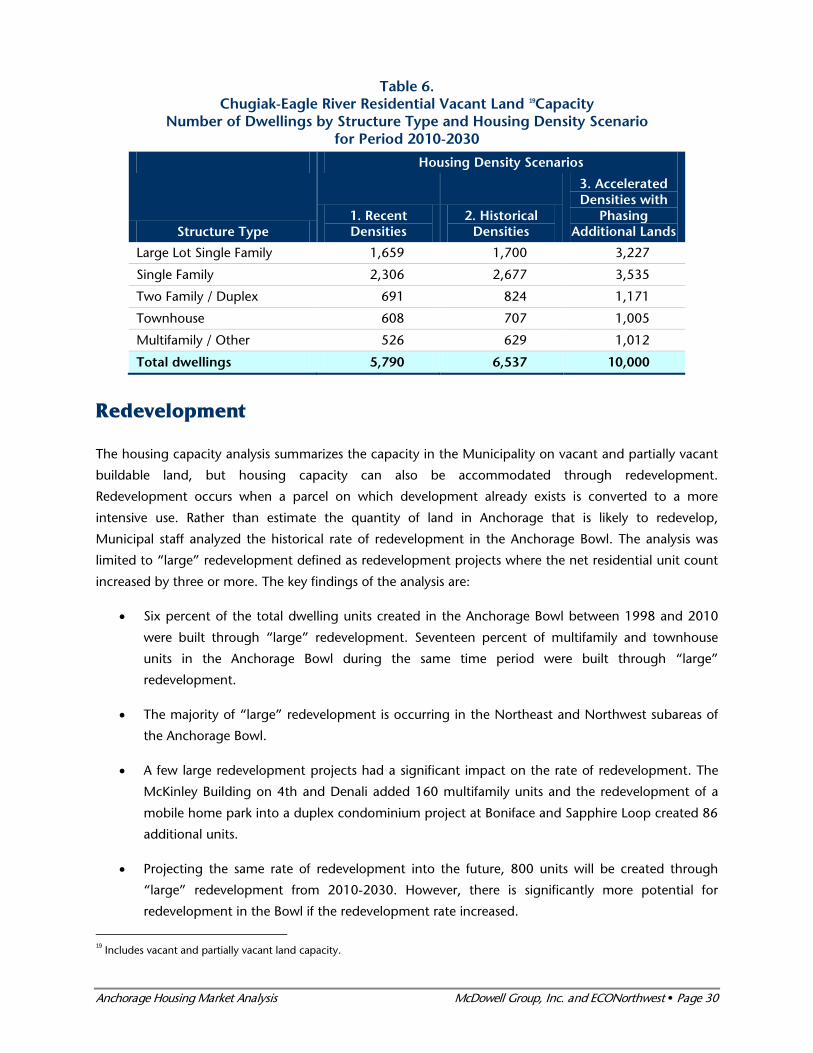
For Chugiak-Eagle River, housing capacity is affected largely by how much of Eklutna, Inc. landholdings
become available for residential development over the next twenty years. The three housing capacity
scenarios include different assumptions about the development of Eklutna, Inc.’s lands. Table 6
summarizes the capacity of buildable land to accommodate new housing in Chugiak-Eagle River by
structure type and housing density scenario. According to the analysis:
• The majority of future housing capacity is located in the Powder Reserve and Eklutna 770 Tract
which are beyond the extent current urban services.
• A significant share of land in Chugiak-Eagle River is constrained by lack of sewer service thus
holding the capacity to one dwelling unit per acre (The maximum density allowed on a septic
system.)
• There is relatively little capacity in Chugiak-Eagle River for townhouse or multifamily
development.
18 Includes vacant and partially vacant land capacity.
Anchorage Housing Market Analysis McDowell Group, Inc. and ECONorthwest Page 30
Table 6. Chugiak-Eagle River Residential Vacant Land 19Capacity
Number of Dwellings by Structure Type and Housing Density Scenario for Period 2010-2030
Housing Density Scenarios
Structure Type 1. Recent Densities
2. Historical Densities
3. Accelerated Densities with
Phasing Additional Lands
Large Lot Single Family 1,659 1,700 3,227
Single Family 2,306 2,677 3,535
Two Family / Duplex 691 824 1,171
Townhouse 608 707 1,005
Multifamily / Other 526 629 1,012
Total dwellings 5,790 6,537 10,000
Redevelopment
The housing capacity analysis summarizes the capacity in the Municipality on vacant and partially vacant
buildable land, but housing capacity can also be accommodated through redevelopment.
Redevelopment occurs when a parcel on which development already exists is converted to a more
intensive use. Rather than estimate the quantity of land in Anchorage that is likely to redevelop,
Municipal staff analyzed the historical rate of redevelopment in the Anchorage Bowl. The analysis was
limited to “large” redevelopment defined as redevelopment projects where the net residential unit count
increased by three or more. The key findings of the analysis are:
• Six percent of the total dwelling units created in the Anchorage Bowl between 1998 and 2010
were built through “large” redevelopment. Seventeen percent of multifamily and townhouse
units in the Anchorage Bowl during the same time period were built through “large”
redevelopment.
• The majority of “large” redevelopment is occurring in the Northeast and Northwest subareas of
the Anchorage Bowl.
• A few large redevelopment projects had a significant impact on the rate of redevelopment. The
McKinley Building on 4th and Denali added 160 multifamily units and the redevelopment of a
mobile home park into a duplex condominium project at Boniface and Sapphire Loop created 86
additional units.
• Projecting the same rate of redevelopment into the future, 800 units will be created through
“large” redevelopment from 2010-2030. However, there is significantly more potential for
redevelopment in the Bowl if the redevelopment rate increased.
19 Includes vacant and partially vacant land capacity.
Anchorage Housing Market Analysis McDowell Group, Inc. and ECONorthwest Page 31
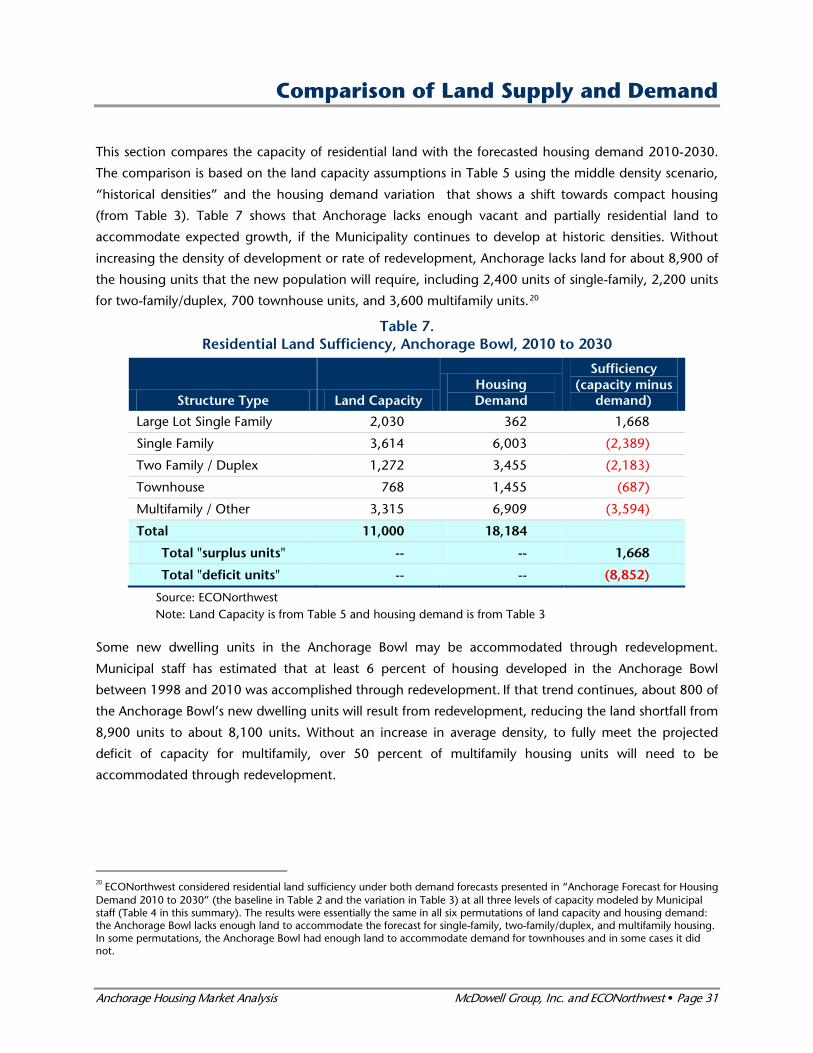
Comparison of Land Supply and Demand
This section compares the capacity of residential land with the forecasted housing demand 2010-2030.
The comparison is based on the land capacity assumptions in Table 5 using the middle density scenario,
“historical densities” and the housing demand variation that shows a shift towards compact housing
(from Table 3). Table 7 shows that Anchorage lacks enough vacant and partially residential land to
accommodate expected growth, if the Municipality continues to develop at historic densities. Without
increasing the density of development or rate of redevelopment, Anchorage lacks land for about 8,900 of
the housing units that the new population will require, including 2,400 units of single-family, 2,200 units
for two-family/duplex, 700 townhouse units, and 3,600 multifamily units.20
Table 7. Residential Land Sufficiency, Anchorage Bowl, 2010 to 2030
Structure Type Land Capacity Housing Demand
Sufficiency (capacity minus
demand)
Large Lot Single Family 2,030 362 1,668
Single Family 3,614 6,003 (2,389)
Two Family / Duplex 1,272 3,455 (2,183)
Townhouse 768 1,455 (687)
Multifamily / Other 3,315 6,909 (3,594)
Total 11,000 18,184
Total "surplus units" -- -- 1,668
Total "deficit units" -- -- (8,852)
Source: ECONorthwest Note: Land Capacity is from Table 5 and housing demand is from Table 3
Some new dwelling units in the Anchorage Bowl may be accommodated through redevelopment.
Municipal staff has estimated that at least 6 percent of housing developed in the Anchorage Bowl
between 1998 and 2010 was accomplished through redevelopment. If that trend continues, about 800 of
the Anchorage Bowl’s new dwelling units will result from redevelopment, reducing the land shortfall from
8,900 units to about 8,100 units. Without an increase in average density, to fully meet the projected
deficit of capacity for multifamily, over 50 percent of multifamily housing units will need to be
accommodated through redevelopment.
20 ECONorthwest considered residential land sufficiency under both demand forecasts presented in “Anchorage Forecast for Housing Demand 2010 to 2030” (the baseline in Table 2 and the variation in Table 3) at all three levels of capacity modeled by Municipal staff (Table 4 in this summary). The results were essentially the same in all six permutations of land capacity and housing demand: the Anchorage Bowl lacks enough land to accommodate the forecast for single-family, two-family/duplex, and multifamily housing. In some permutations, the Anchorage Bowl had enough land to accommodate demand for townhouses and in some cases it did not.
Anchorage Housing Market Analysis McDowell Group, Inc. and ECONorthwest Page 32
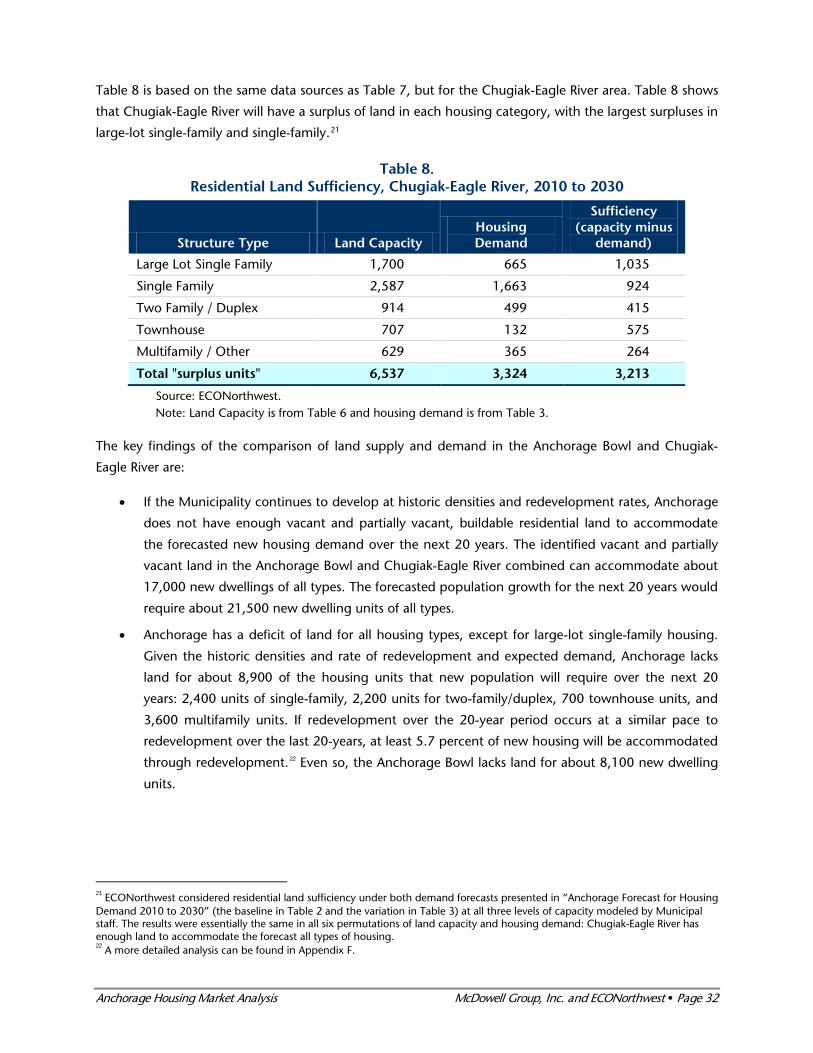
Table 8 is based on the same data sources as Table 7, but for the Chugiak-Eagle River area. Table 8 shows
that Chugiak-Eagle River will have a surplus of land in each housing category, with the largest surpluses in
large-lot single-family and single-family.21
Table 8. Residential Land Sufficiency, Chugiak-Eagle River, 2010 to 2030
Structure Type Land Capacity Housing Demand
Sufficiency (capacity minus
demand)
Large Lot Single Family 1,700 665 1,035
Single Family 2,587 1,663 924
Two Family / Duplex 914 499 415
Townhouse 707 132 575
Multifamily / Other 629 365 264
Total "surplus units" 6,537 3,324 3,213
Source: ECONorthwest. Note: Land Capacity is from Table 6 and housing demand is from Table 3.
The key findings of the comparison of land supply and demand in the Anchorage Bowl and Chugiak-
Eagle River are:
• If the Municipality continues to develop at historic densities and redevelopment rates, Anchorage
does not have enough vacant and partially vacant, buildable residential land to accommodate
the forecasted new housing demand over the next 20 years. The identified vacant and partially
vacant land in the Anchorage Bowl and Chugiak-Eagle River combined can accommodate about
17,000 new dwellings of all types. The forecasted population growth for the next 20 years would
require about 21,500 new dwelling units of all types.
• Anchorage has a deficit of land for all housing types, except for large-lot single-family housing.
Given the historic densities and rate of redevelopment and expected demand, Anchorage lacks
land for about 8,900 of the housing units that new population will require over the next 20
years: 2,400 units of single-family, 2,200 units for two-family/duplex, 700 townhouse units, and
3,600 multifamily units. If redevelopment over the 20-year period occurs at a similar pace to
redevelopment over the last 20-years, at least 5.7 percent of new housing will be accommodated
through redevelopment.22 Even so, the Anchorage Bowl lacks land for about 8,100 new dwelling
units.
21 ECONorthwest considered residential land sufficiency under both demand forecasts presented in “Anchorage Forecast for Housing Demand 2010 to 2030” (the baseline in Table 2 and the variation in Table 3) at all three levels of capacity modeled by Municipal staff. The results were essentially the same in all six permutations of land capacity and housing demand: Chugiak-Eagle River has enough land to accommodate the forecast all types of housing. 22 A more detailed analysis can be found in Appendix F.
Anchorage Housing Market Analysis McDowell Group, Inc. and ECONorthwest Page 33
• Chugiak-Eagle River has a surplus of land for all housing types. Over the next 20 years, Chugiak-
Eagle River has capacity to accommodate about 6,500 new dwelling units while demand is
projected for only 3,300 new dwelling units. The surplus of residential capacity in Chugiak-Eagle
River is not large enough to accommodate the deficit of residential capacity in the Anchorage
Bowl, especially for attached and multifamily housing types.
• The mismatch between demand and supply is serious and needs attention. Of course, these are
just estimates of a hypothetical future. But even if the numbers are rough, they show clearly that
the accepted forecasts for population growth generate a demand for housing units that cannot
be built on the buildable, vacant and partially vacant land at the historic densities.
• Several factors will operate to mitigate the ultimate mismatch. It is very unlikely that the market
will continue to use available land at the same rate until it is all gone, and then be unable to build
housing. Market forces will begin to adjust to restricted supply well before there was no buildable
land. This study has not attempted to estimate when market forces will start to adjust to the
restricted land supply. It is likely that the market has started to make that adjustment, given the
rate of redevelopment over the last 12 years. In a sense, the on-going discussions about the
sufficiency of land, such as this study and the work completed for Anchorage 2020, show that the
private sector and the public sector are attempting to address the issues of a restricted land
supply. Many cities with restricted land supplies continue to grow. They do so, however, by
getting denser: they build on smaller lots and redevelop at higher densities. Anchorage has had
residential redevelopment in the recent past, with at least 5.7 percent of housing developed in
the Anchorage Bowl over the last 12 years accommodated through redevelopment.
Another possibility is that a lack of land in the Anchorage Bowl and resulting higher housing
prices could shift some of that demand to Chugiak-Eagle River, but such a shift must be
supported by public policy and investment. Even if that demand were completely mobile,
Chugiak-Eagle River cannot support all the housing that lacks land in the Anchorage Bowl.
Another possibility is that restricted land supply and higher housing prices will cause the
population growth to be less than what current forecasts are predicting.
Anchorage Housing Market Analysis McDowell Group, Inc. and ECONorthwest Page 34
Financial Feasibility for Developing Compact Housing
Feasibility Issues Specific to Anchorage
Every development environment has peculiarities that affect local feasibility. The three factors unique to
Anchorage (compared to other cities of comparable size) are:
• The development code allows for the development of multiple structures on one lot or
“horizontal condominiums.” The majority of compact housing developed in Anchorage in
recent years has been “horizontal condominiums” Horizontal condominiums can be structured as
a site-condo or a full-service condo. 23 Horizontal condominiums are an attractive development
model in Anchorage because:
1. The developer does not need to subdivide and plat the parcel, which decreases development
time and costs.
2. A horizontal condominium does not have the same setback or street improvement
requirements as a platted subdivision which allows for greater density.
3. The lack of interior lot lines in a horizontal condominium development affords more flexibility
in designing infrastructure.
• Site and development conditions increase construction costs. One widely-used source of
construction cost estimating indicates construction to be 37 percent more costly in Anchorage
than in the U.S. on average because of climate, geography and economic conditions.24
More specifically, Anchorage cost factors include the short construction season; a lack of a
contiguous utility, street and sidewalk grids and unexpected contamination on sites; the presence
of peat which must be removed to allow adequate structural integrity; higher costs for materials
that must be shipped long distances to reach Anchorage; a smaller and less flexible labor pool
resulting in higher labor cost; less than ideal available building sites; and other factors.
• For the most part, Anchorage lacks neighborhoods with a traditional “main street”
architectural form where higher density development typically locates. Many developers
across the country have found that compact housing is easier to finance and sell when it is
located near retail and other types of amenities (grocery stores, coffee shops, transit access, etc.)
The reasons relate primarily to consumer demand. People are willing to live in smaller units, and
sometimes even pay more for less living space, in exchange for a pleasant urban environment,
convenient access to their daily needs, and lower transportation costs. Anchorage lacks the
traditional “main street” architectural forms that support this amenity because Anchorage was
developed after the advent of the automobile.
23 Please see a further explanation in Appendix E. 24 2009 Engineering News-Record Square Foot Cost Book.
Anchorage Housing Market Analysis McDowell Group, Inc. and ECONorthwest Page 35
This limits the ability of developers to capitalize on existing urban form and activity to support
rental prices, which mostly strongly affects the feasibility of the kinds of higher-end compact
development forms (more expensive condos, executive apartments) that require a complete
package of amenities to successfully compete with larger, more suburban style homes at similar
price points.
Feasibility Findings
The feasibility analysis modeled prototypes of four development types:
(1) Small-lot single-family detached unit
(2) Infill townhomes
(3) Mid-rise residential development
(4) Mid-rise mixed-use development
Appendix D describes the assumptions used for the modeling. The analysis found:
Single-family Detached
• The single-family detached prototype on a 3,000 square foot lot is the most financially feasible.
The pro forma indicated that the units can be built profitably. This result does not necessarily
mean that all developers and all banks would automatically invest in such a project. But,
reasonably risk-averse developers/bankers might choose to invest in this type of development.
• The Municipality’s current zoning regulations do not allow for single-family homes built on a lot
smaller than 6,000 square feet except in special circumstances. This makes compact, small-lot
single-family housing on a single lot difficult to build in Anchorage and is an housing policy
option that we suggest the Municipality explore.
Infill Townhomes
• The townhome prototypes are close to feasible. The pro forma shows a return for the developer
of about $173,000 (excluding resources for construction and financing) on a nearly $2 million
construction project. This result does not necessarily mean that all developers and all banks
would automatically invest in a project like this one. But, reasonably risk-averse ones might
choose to invest in this type of development.
• The townhome prototype is close to feasible but sensitive to changes in the assumptions
including increasing costs or decreases in sale price. This sensitivity explains the tendency for
developers to prefer “horizontal condominiums” to a fee-simple subdivisions for this housing
type. A condominium approach allows the developer to slightly lower the development costs and
reduce the amount of land needed, which reduces the financial risk for the developer and the
financer. This is one of the main factors that drives developers to a condominium structure when
developing compact housing.
Anchorage Housing Market Analysis McDowell Group, Inc. and ECONorthwest Page 36
Mid-rise Residential and Mid-rise Mixed-use
• The mid-rise multifamily and the mixed-use rental prototypes are financially infeasible. This
finding is consistent with observations of the market: very few projects of this type are being built
in Anchorage, or elsewhere in the country, without subsidy. The financial gap, depending on a
number of factors such as development and equity financing costs, ranges from 20 percent to 55
percent of total development costs. Rents would have to increase by 25 to 60 percent in order to
make the project feasible.
• The primary factor that makes these building forms financially infeasible is higher costs of
development in Anchorage, including water table and soils issues, contamination, labor, cost of
transportation of materials, and non-contiguous and incomplete availability of infrastructure and
utilities. In response, developers try to reduce their cost, which in some cases leads to a lower
quality product. New lower quality product coming on line can create a cycle that keeps rents
low in the market and distorts the market’s ability to produce higher-end product, because none
is available as a comparable product for the lending community. In addition, mixed-use and mid-
rise residential prototype cost more to develop than single-family homes do, primarily because of
a more expensive construction type to support a multi-story development and the need to
provide structured parking.
• Limited access to equity and the conservative response of the financial community to lending for
these projects also creates a barrier to developing mid-rise residential and mixed-use structures.
In the current market, equity (or cash down payments) requirements are quite high. Many banks
require as much as 30 to even 40 percent of project costs be paid up-front in the form of equity.
A developer without sufficient access to capital to cover these financing costs may need to
borrow equity on the open market. Equity lenders charge a premium for this upfront capital
because it is a fairly risky investment for them. Some equity lenders are charging as much as 15 –
20 percent interest. In some situations, equity financing is simply not available, and projects
cannot move forward. These issues are not unique to Anchorage and exist in many cities in the
Lower 48.
• Public investment and other creative solutions will be necessary to make higher density compact
housing such as mid-rise multifamily and mixed-use rental development feasible in Anchorage, at
least in the near-term. Programs that provide gap financing at low interest rates, partnerships
with private developers, and strategic acquisition of key properties can all help to encourage
more compact housing. The policy section will discuss the specific types of tools available to
begin to close the financing gap.
Like many communities across the nation, the current market for new development in Anchorage
constrains the ability of developers to provide a more compact development form of sufficient
quality to meet development goals. Public investment of some form will be required to make
more widespread development of compact housing feasible. While development costs may be
higher in Anchorage than in other places, this situation is not unique to Anchorage. Many
communities provide subsidies to encourage increased density that is consistent with municipal
goals.
Anchorage Housing Market Analysis McDowell Group, Inc. and ECONorthwest Page 37
Implications for Housing Policy in Anchorage
The key conclusions of the housing demand analysis are:
• Given the historic density of development and rate of redevelopment, the Anchorage Bowl does
not have sufficient vacant buildable residential land to accommodate the demand for housing
units forecasted over the next 20 years. The mismatch between demand for and supply of
residential land is serious and needs attention.
• Building mid-rise residential and mid-rise mixed-use rental developments is not financially feasible
in the conditions of the current market.
Those conclusions lead to an obvious, broad policy question: What can the Municipality do to
accommodate the expected demand for housing?
This question is not new to the Municipality—it was at least partially addressed in Anchorage 2020
Comprehensive Plan. The preferred growth alternative from that effort was the Urban Transition Scenario,
whose policies included developing more intensive urban centers in Downtown and Midtown and
encouraging infill and redevelopment where appropriate. Changes to Anchorage’s zoning code (Title 21)
are under discussion and would be an essential step to implementing key policy recommendations in
Anchorage 2020. However, in the 10 years since that plan was adopted, the Municipality has yet to adopt
policies to implement it. The demand analysis in Appendix C shows that housing preferences (at least as
evidence by the type of housing built and absorbed) have changed little over that period.
In concept, correcting the mismatch can only occur by changing: (1) housing demand, (2) housing
supply, or (3) both (which is what happens in markets as supply and demand look for balance). Local
governments are typically more reluctant to get involved in the demand side of the market (e.g., aiming
at changing demographics or preferences). They are more likely to try to accommodate the forecasted
demand by increasing (1) land supply, or (2) the capacity of a given land supply to accommodate more
dwelling units (i.e., to increase density).
Most local governments have the capacity to expand land supply: cities annex undeveloped land at their
borders.25 The Municipality’s recent study of land supply concludes such expansions are not an option in
the Anchorage Bowl: its area is bounded and defined by natural and built constraints on all sides.
While the intent of Anchorage 2020 is clear and provides a guiding document for how the Bowl should
accommodate growth, it is worth stepping back and exploring options for how the Anchorage/Mat-Su
region could reallocate growth to support the projected housing demand. Hypotheses of what could
happen if no policy action is taken by the Municipality are also presented.
25 Whether infrastructure can be extended to that land at a cost that allows it to be feasibly developed is a different question: the point here is that the potential amount of land can be expanded.
Anchorage Housing Market Analysis McDowell Group, Inc. and ECONorthwest Page 38
Options to Allocate Growth within the Region
Single Family and Two Family Units
The Anchorage Bowl has enough land to accommodate large-lot single-family housing. But given the
amount of vacant land and how it is currently zoned, the Anchorage Bowl will be unable to build about
2,400 single-family units and 2,200 units for two-family/duplex that the population forecasts suggest will
be demanded There are three options for accommodating this growth: in the Bowl, in Chugiak-Eagle
River, or in the Mat-Su Borough.
• Accommodate the demand in the Anchorage Bowl by increasing land efficiency, increasing
density where appropriate, increasing the supply of buildable land, encouraging redevelopment,
and streamlining regulation. Policy options for accommodating the demand in the Anchorage
Bowl are discussed later in this report.
Another way to accommodate new single-family and two-family/duplex housing is through re-
designation of land from other uses, such as commercial uses or lower-density housing, for
single-family housing. The Commercial Land Study also currently being conducted shows a
shortage of land for commercial uses. While there is a surplus of capacity for large-lot single-
family housing, the Hillside District Plan limits the extension of public sewer lines. Even so, it may
be reasonable for Municipal staff to evaluate whether there is an “excess” of land designated for
non-residential or low-density residential uses that would be suitable for these housing types.
Rezoning land will require an update to Anchorage’s Land Use Plan Map.
• Allocate more single-family and two-family/duplex growth in Chugiak-Eagle River. Chugiak-
Eagle River has capacity to accommodate about 900 more single-family dwellings and 400 more
two-family/duplex dwellings than the forecast of demand allocates to Chugiak-Eagle River for the
20-year period.
Whether Chugiak-Eagle River could actually accommodate development of these additional
dwellings would depend on a number of factors, such as: the planned infrastructure (e.g., urban
wastewater and water service) becoming available as expected, transportation capacity for
people living in Chugiak-Eagle River and working in the Anchorage Bowl, and housing market
demand. Getting additional single-family growth would depend on coordination with
landowners, predominantly Eklutna, to develop their land over the 20-year timeframe. This shift
would be encouraged by the likely increase in housing prices in the Anchorage Bowl as demand
outstrips supply.
Anchorage Housing Market Analysis McDowell Group, Inc. and ECONorthwest Page 39
Allow or encourage more of the regional growth to go to Matanuska-Susitna Borough
(Mat-Su). ISER population forecast is for Anchorage and Mat-Su together, allocating growth to
both regions. ISER’s forecast assumes that the Knik Arm Bridge will be built during the 20-year
period siphoning additional growth to the Mat-Su. However, if Anchorage does not have enough
capacity for single-family and two-family/duplex growth currently allocated, even more
households may choose to locate in Mat-Su rather than pay higher housing costs in Anchorage
or choose a different housing type (if available) in Anchorage. Indeed, this was one of the ways
that regional growth has been accommodated in Anchorage and Mat-Su over the last decade or
longer, with more households locating in Mat-Su and commuting to Anchorage for work.
Assuming that some of Anchorage’s single-family housing demand may be accommodated in
Mat-Su has some problems. Mat-Su may not have sufficient land designated and planned for
residential uses in close proximity to areas relatively close to the Knik Arm Bridge, requiring
changes in land designation and the planning to support the changes. Most importantly,
building at urban single-family densities requires urban services (e.g., roads, sanitary sewer,
water, schools, fire). Assuming that Mat-Su does not have adequate urban services in this area,
these services would have to be developed prior to new residential development.
Townhouse and Multifamily Units
Given historical development densities and rate of development, the amount of vacant land, and how it is
currently zoned, the Anchorage Bowl will be unable to build about 700 townhouse units and about
3,600 multifamily units that population forecasts suggest will be demanded. Options for accommodating
these units in the Bowl include increasing land efficiency, increasing density where appropriate,
increasing the supply of buildable land, encouraging redevelopment, and streamlining regulation. These
policy options are discussed later in this report.
Municipal staff will need to take care in developing policies to increase land use efficiency, given existing
policies and historical development densities. Analysis by Municipal staff shows considerable under-build
in R-3 and R-4 zoning districts, with most development averaging well below the maximum allowable
densities. This under-build suggests that the problem in Anchorage is not that allowable multifamily
densities are too low, but that other factors are keeping multifamily development from achieving higher
densities. These factors may include housing preferences (with the housing survey showing that most
people prefer to live in lower density development), parking requirements, or the financing gap identified
in the pro forma analysis for mid-rise development. In general, if the Municipality allows greater density
(and does not directly impose other regulations or fees that restrict it), then the under-build is
fundamentally a market issue: developers’ belief that households will not pay what is necessary to make
the higher density worth building.
Unlike single-family and two-family/duplex housing, these housing types are less likely to shift to
Chugiak-Eagle River or Mat-Su. They are dense, urban housing types that generally locate in urban or
town centers, along transit lines, or near to employment and service centers where they are marketable.
Anchorage Housing Market Analysis McDowell Group, Inc. and ECONorthwest Page 40
No Change in Policy Option
Predicting the exact results of a “no change” scenario are impossible, especially since it is uncertain when
the Title 21 re-writes will be fully adopted and precisely what policies would be included in the new Title
21. The last decade, however, gives an idea of how Anchorage would grow under the existing policies.
• Housing costs may increase faster than they otherwise would have. Over the last decade,
housing prices have increased, rental costs have increased, and housing has become less
affordable. Those changes cannot be solely attributed to Anchorage’s tight land supply (which
may not be excessively tight yet) and have certainly been influenced by State and national
changes in housing costs. As Anchorage’s land capacity decreases over the next 20 years and
beyond, housing will continue to get more expensive as production slows and will affect the
amount of growth in Anchorage.
• More people may locate in the region but outside of the Anchorage Bowl. As housing prices
increase, more people will choose to live in Chugiak-Eagle River or Mat-Su. The changes in
commuting patterns over the past decade show that some households are locating in these areas
and commuting into Anchorage. While this may be a viable choice for people who prefer single-
family housing and do not mind commuting, it is not a viable choice for people who prefer living
closer to work and urban amenities or who may prefer multifamily housing.
• Anchorage may grow slower. If there is not enough multifamily housing, Anchorage may grow
slower over the next 20 years and beyond. People who cannot find a quality home in an
attractive neighborhood at a price they can afford may choose not to locate in Anchorage. If the
population growth turns out to be substantially less than forecasted, one should expect the
employment forecasts to be lower also.
Housing Policies in Anchorage
This section presents housing policies that Anchorage is either using currently or could use to
accommodate the forecast of residential growth in the Municipality. There are many potential housing
policies. Not all policies, however, are appropriate for Anchorage. This focuses on housing policies that
are in use in Anchorage or are potentially appropriate for Anchorage.
Table 9 shows housing policies grouped at the top level by the issue addressed by the policy. Table 9
shows policies that attempt to (1) increase efficient land use, (2) increase residential densities, (3) increase
the buildable land supply, and (4) ensure affordable housing. Table 9 also shows whether the policy is in
use or under consideration by the Municipality, and the way the policy attempts to influence the market
(allow, encourage, or require/prohibit action). In the “use” columns check marks have the expected
meaning; numbers are references to the policy document named in the column heading.
Anchorage Housing Market Analysis McDowell Group, Inc. and ECONorthwest Page 41
Through discussions with the project Advisory Committee and Municipal staff, the list of potential
housing policies presented in Table 9 was reduced to include policies that are appropriate for Anchorage,
given the Municipalities unique characteristics. In addition, Table 9 focuses on policies that increase
capacity to accommodate the forecast for growth and touch only briefly on other important housing
policy issues, such as affordable housing. The Municipality should evaluate policy options to address
these other issues, especially for affordable housing, through a separate process.
Table 9 summarizes a lot of information and allows a lot of inferences. Among them:
• There are a lot of policies a jurisdiction can adopt to address housing issues.
• The Municipality has adopted many of them, and is actively considering many more. There is at
least one policy in each of the four major issue categories that would be “new” to Anchorage:
most of those are under the issue headings of increasing buildable land and affordability.
• Of the 33 policies listed, seven would relax regulation (“allow”), 19 would offer some type of
incentive (“encourage”), and seven would add new regulations (“require / prohibit”). All seven
regulatory policies have been previously recommended in Anchorage 2020.
• Nine out of the ten policies recommended by the Housing and Neighborhood Taskforce
convened in 2009 are listed.
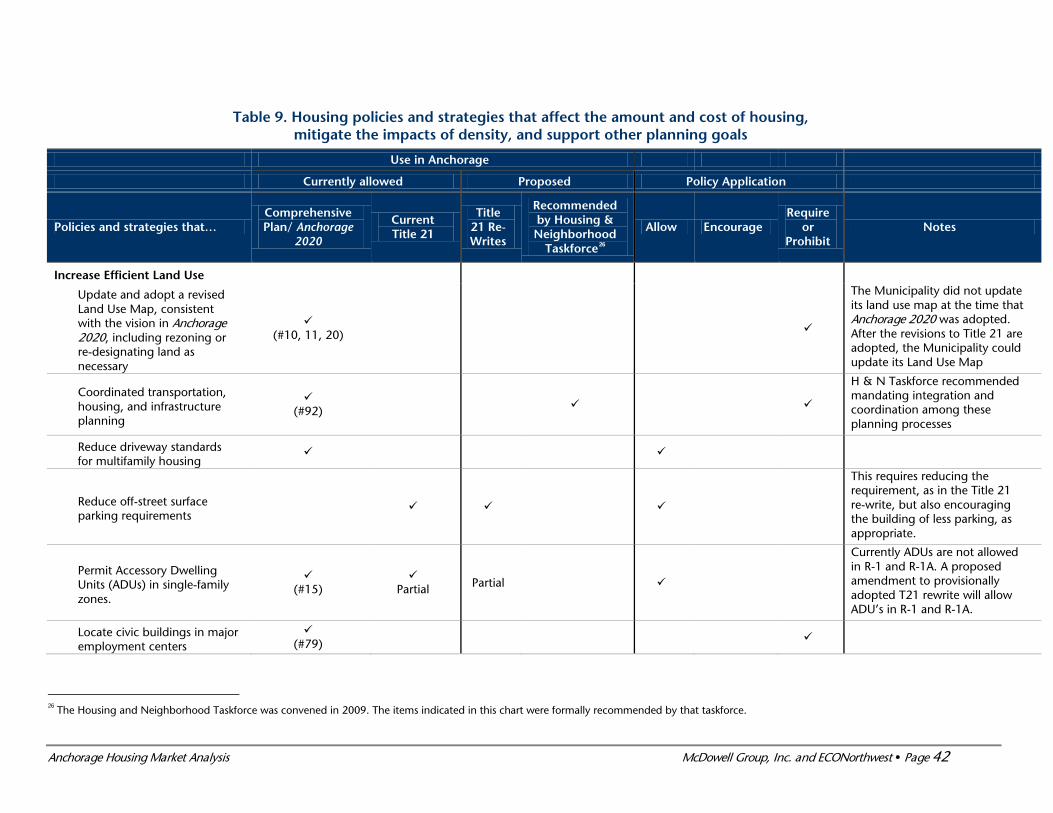
Anchorage Housing Market Analysis McDowell Group, Inc. and ECONorthwest Page 42
Table 9. Housing policies and strategies that affect the amount and cost of housing, mitigate the impacts of density, and support other planning goals
Use in Anchorage
Currently allowed Proposed Policy Application
Policies and strategies that… Comprehensive Plan/ Anchorage
2020
Current Title 21
Title 21 Re-Writes
Recommended by Housing & Neighborhood
Taskforce26
Allow Encourage Require
or Prohibit
Notes
Increase Efficient Land Use
Update and adopt a revised Land Use Map, consistent with the vision in Anchorage 2020, including rezoning or re-designating land as necessary
(#10, 11, 20)
The Municipality did not update its land use map at the time that Anchorage 2020 was adopted. After the revisions to Title 21 are adopted, the Municipality could update its Land Use Map
Coordinated transportation, housing, and infrastructure planning
(#92)
H & N Taskforce recommended mandating integration and coordination among these planning processes
Reduce driveway standards for multifamily housing
Reduce off-street surface parking requirements
This requires reducing the requirement, as in the Title 21 re-write, but also encouraging the building of less parking, as appropriate.
Permit Accessory Dwelling Units (ADUs) in single-family zones.
(#15)
Partial Partial
Currently ADUs are not allowed in R-1 and R-1A. A proposed amendment to provisionally adopted T21 rewrite will allow ADU’s in R-1 and R-1A.
Locate civic buildings in major employment centers
(#79)
26 The Housing and Neighborhood Taskforce was convened in 2009. The items indicated in this chart were formally recommended by that taskforce.
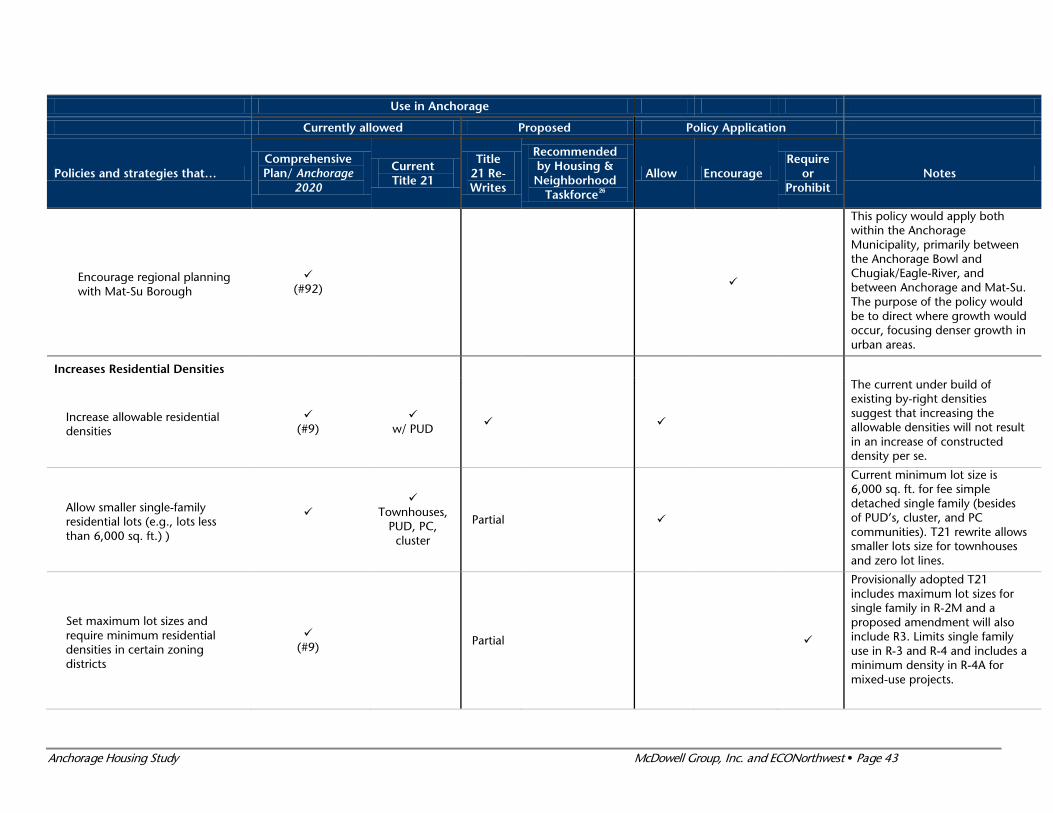
Anchorage Housing Study McDowell Group, Inc. and ECONorthwest Page 43
Use in Anchorage
Currently allowed Proposed Policy Application
Policies and strategies that… Comprehensive Plan/ Anchorage
2020
Current Title 21
Title 21 Re-Writes
Recommended by Housing & Neighborhood
Taskforce26
Allow Encourage Require
or Prohibit
Notes
Encourage regional planning with Mat-Su Borough
(#92)
This policy would apply both within the Anchorage Municipality, primarily between the Anchorage Bowl and Chugiak/Eagle-River, and between Anchorage and Mat-Su. The purpose of the policy would be to direct where growth would occur, focusing denser growth in urban areas.
Increases Residential Densities
Increase allowable residential densities
(#9)
w/ PUD
The current under build of existing by-right densities suggest that increasing the allowable densities will not result in an increase of constructed density per se.
Allow smaller single-family residential lots (e.g., lots less than 6,000 sq. ft.) )
Townhouses,
PUD, PC, cluster
Partial
Current minimum lot size is 6,000 sq. ft. for fee simple detached single family (besides of PUD’s, cluster, and PC communities). T21 rewrite allows smaller lots size for townhouses and zero lot lines.
Set maximum lot sizes and require minimum residential densities in certain zoning districts
(#9) Partial
Provisionally adopted T21 includes maximum lot sizes for single family in R-2M and a proposed amendment will also include R3. Limits single family use in R-3 and R-4 and includes a minimum density in R-4A for mixed-use projects.
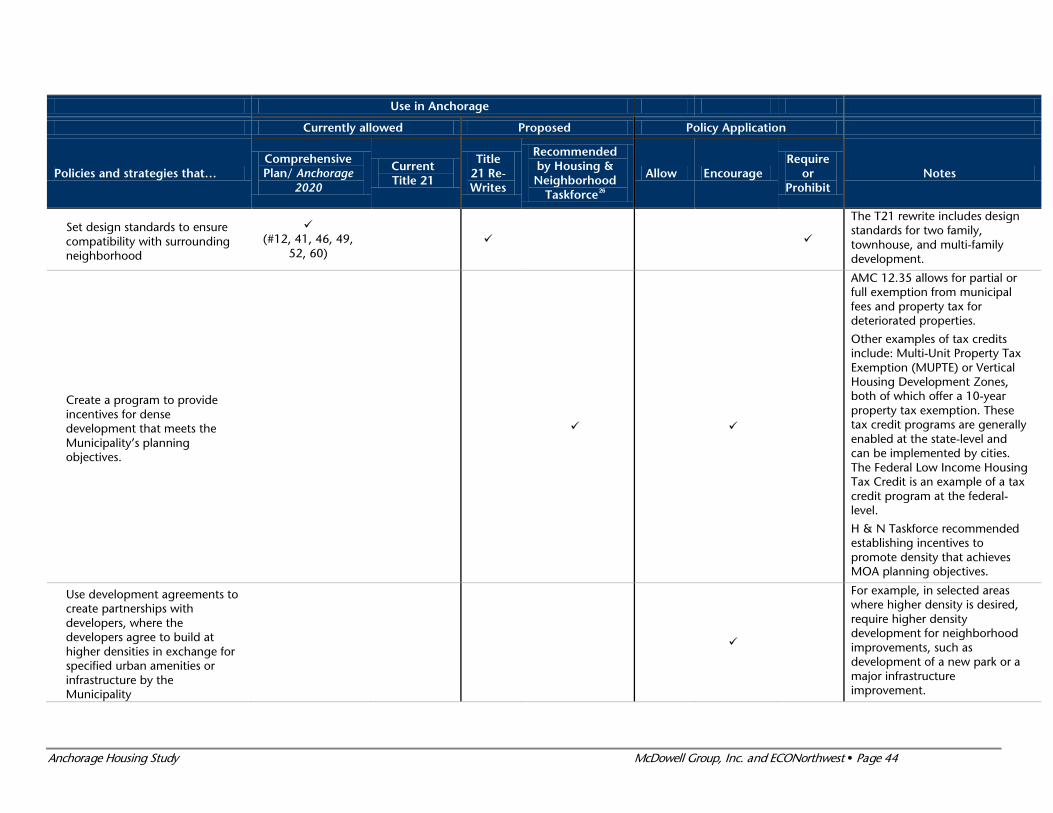
Anchorage Housing Study McDowell Group, Inc. and ECONorthwest Page 44
Use in Anchorage
Currently allowed Proposed Policy Application
Policies and strategies that… Comprehensive Plan/ Anchorage
2020
Current Title 21
Title 21 Re-Writes
Recommended by Housing & Neighborhood
Taskforce26
Allow Encourage Require
or Prohibit
Notes
Set design standards to ensure compatibility with surrounding neighborhood
(#12, 41, 46, 49,
52, 60)
The T21 rewrite includes design standards for two family, townhouse, and multi-family development.
Create a program to provide incentives for dense development that meets the Municipality’s planning objectives.
AMC 12.35 allows for partial or full exemption from municipal fees and property tax for deteriorated properties.
Other examples of tax credits include: Multi-Unit Property Tax Exemption (MUPTE) or Vertical Housing Development Zones, both of which offer a 10-year property tax exemption. These tax credit programs are generally enabled at the state-level and can be implemented by cities. The Federal Low Income Housing Tax Credit is an example of a tax credit program at the federal-level.
H & N Taskforce recommended establishing incentives to promote density that achieves MOA planning objectives.
Use development agreements to create partnerships with developers, where the developers agree to build at higher densities in exchange for specified urban amenities or infrastructure by the Municipality
For example, in selected areas where higher density is desired, require higher density development for neighborhood improvements, such as development of a new park or a major infrastructure improvement.
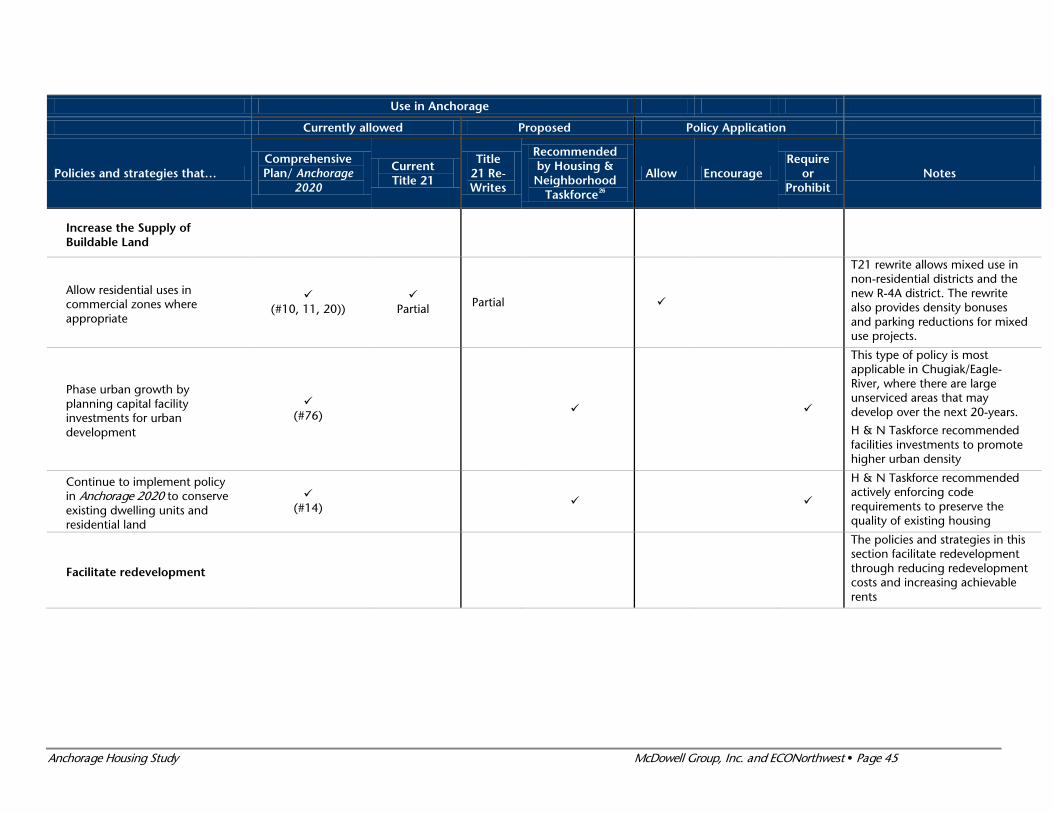
Anchorage Housing Study McDowell Group, Inc. and ECONorthwest Page 45
Use in Anchorage
Currently allowed Proposed Policy Application
Policies and strategies that… Comprehensive Plan/ Anchorage
2020
Current Title 21
Title 21 Re-Writes
Recommended by Housing & Neighborhood
Taskforce26
Allow Encourage Require
or Prohibit
Notes
Increase the Supply of Buildable Land
Allow residential uses in commercial zones where appropriate
(#10, 11, 20))
Partial Partial
T21 rewrite allows mixed use in non-residential districts and the new R-4A district. The rewrite also provides density bonuses and parking reductions for mixed use projects.
Phase urban growth by planning capital facility investments for urban development
(#76)
This type of policy is most applicable in Chugiak/Eagle-River, where there are large unserviced areas that may develop over the next 20-years.
H & N Taskforce recommended facilities investments to promote higher urban density
Continue to implement policy in Anchorage 2020 to conserve existing dwelling units and residential land
(#14)
H & N Taskforce recommended actively enforcing code requirements to preserve the quality of existing housing
Facilitate redevelopment
The policies and strategies in this section facilitate redevelopment through reducing redevelopment costs and increasing achievable rents
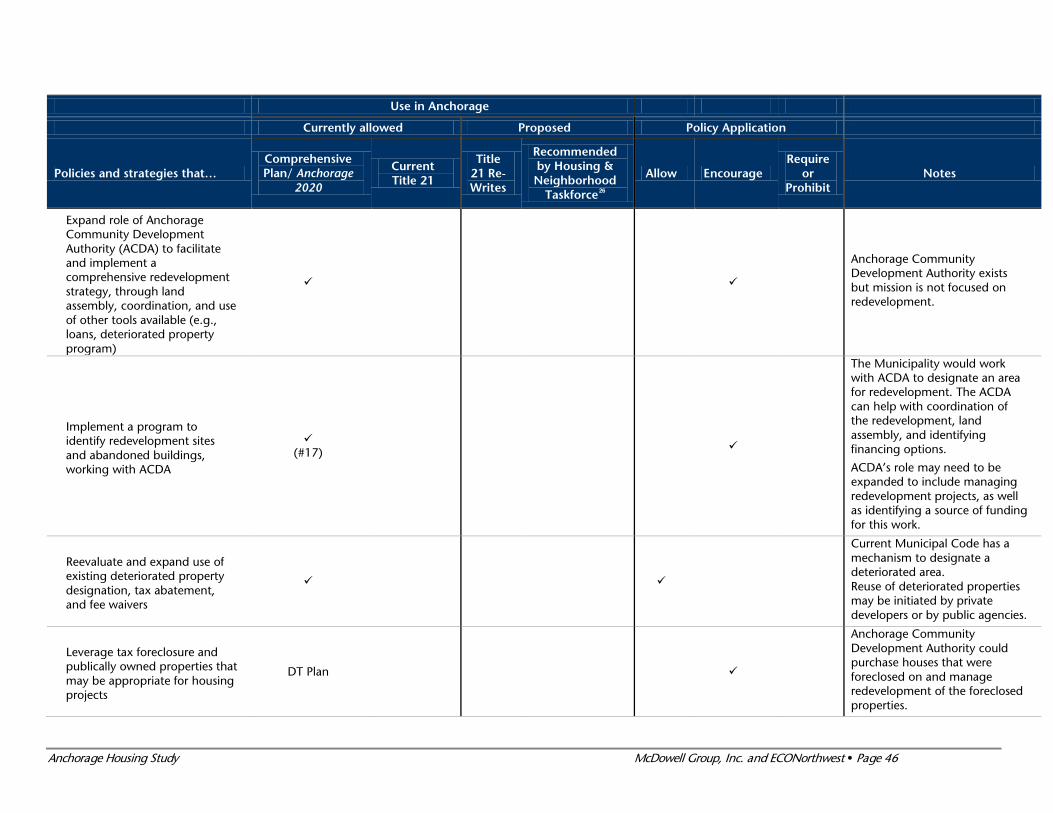
Anchorage Housing Study McDowell Group, Inc. and ECONorthwest Page 46
Use in Anchorage
Currently allowed Proposed Policy Application
Policies and strategies that… Comprehensive Plan/ Anchorage
2020
Current Title 21
Title 21 Re-Writes
Recommended by Housing & Neighborhood
Taskforce26
Allow Encourage Require
or Prohibit
Notes
Expand role of Anchorage Community Development Authority (ACDA) to facilitate and implement a comprehensive redevelopment strategy, through land assembly, coordination, and use of other tools available (e.g., loans, deteriorated property program)
Anchorage Community Development Authority exists but mission is not focused on redevelopment.
Implement a program to identify redevelopment sites and abandoned buildings, working with ACDA
(#17)
The Municipality would work with ACDA to designate an area for redevelopment. The ACDA can help with coordination of the redevelopment, land assembly, and identifying financing options.
ACDA’s role may need to be expanded to include managing redevelopment projects, as well as identifying a source of funding for this work.
Reevaluate and expand use of existing deteriorated property designation, tax abatement, and fee waivers
Current Municipal Code has a mechanism to designate a deteriorated area. Reuse of deteriorated properties may be initiated by private developers or by public agencies.
Leverage tax foreclosure and publically owned properties that may be appropriate for housing projects
DT Plan
Anchorage Community Development Authority could purchase houses that were foreclosed on and manage redevelopment of the foreclosed properties.
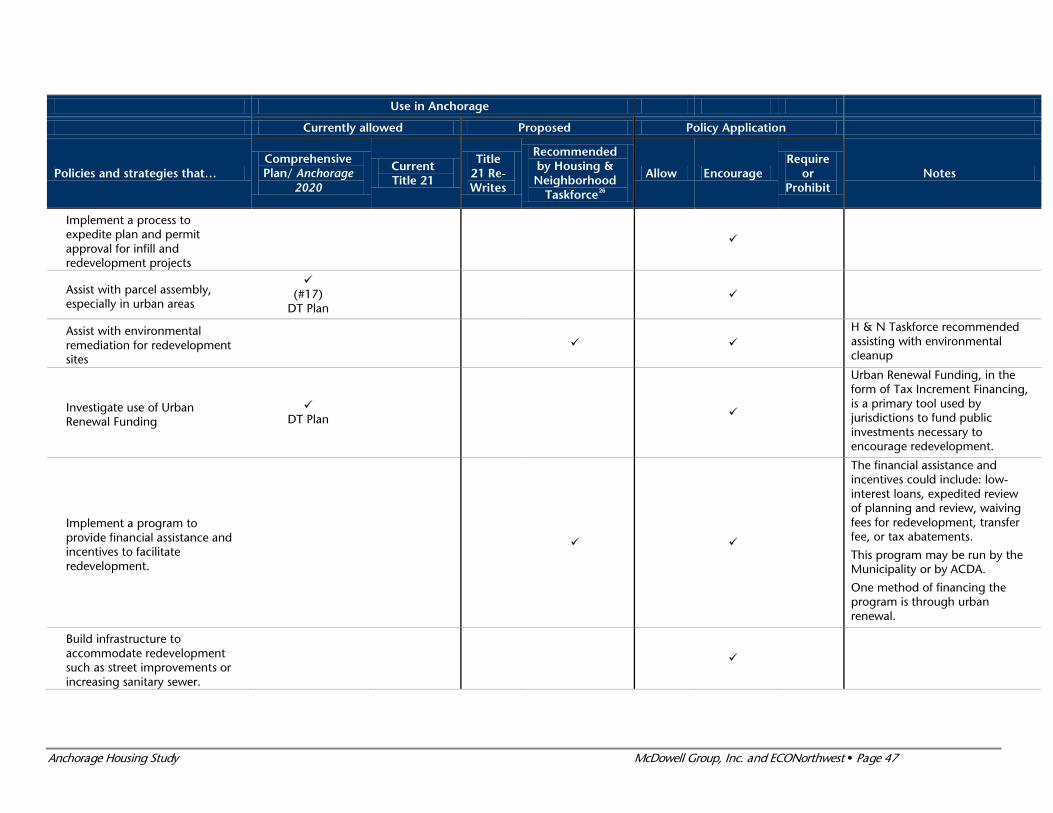
Anchorage Housing Study McDowell Group, Inc. and ECONorthwest Page 47
Use in Anchorage
Currently allowed Proposed Policy Application
Policies and strategies that… Comprehensive Plan/ Anchorage
2020
Current Title 21
Title 21 Re-Writes
Recommended by Housing & Neighborhood
Taskforce26
Allow Encourage Require
or Prohibit
Notes
Implement a process to expedite plan and permit approval for infill and redevelopment projects
Assist with parcel assembly, especially in urban areas
(#17)
DT Plan
Assist with environmental remediation for redevelopment sites
H & N Taskforce recommended assisting with environmental cleanup
Investigate use of Urban Renewal Funding
DT Plan
Urban Renewal Funding, in the form of Tax Increment Financing, is a primary tool used by jurisdictions to fund public investments necessary to encourage redevelopment.
Implement a program to provide financial assistance and incentives to facilitate redevelopment.
The financial assistance and incentives could include: low-interest loans, expedited review of planning and review, waiving fees for redevelopment, transfer fee, or tax abatements.
This program may be run by the Municipality or by ACDA.
One method of financing the program is through urban renewal.
Build infrastructure to accommodate redevelopment such as street improvements or increasing sanitary sewer.

Anchorage Housing Study McDowell Group, Inc. and ECONorthwest Page 48
Use in Anchorage
Currently allowed Proposed Policy Application
Policies and strategies that… Comprehensive Plan/ Anchorage
2020
Current Title 21
Title 21 Re-Writes
Recommended by Housing & Neighborhood
Taskforce26
Allow Encourage Require
or Prohibit
Notes
Leverage federal funding programs for redevelopment including CDBG, HOME, new market tax credits, low-income housing tax credits, HUD 221(d)(4) loan programs, and historic rehabilitation tax credits, more coordination with AFHC
Community currently leverages these resources on a variety of projects throughout the Municipality. Municipal staff could coordinate more Alaska Housing and Finance Corporation to investigate the application of these programs in more depth.
Ensure Affordable Housing
Continue to work with existing partners to expand affordable and workforce housing opportunities
Develop strategic partnerships to create affordable housing
Partnerships include local affordable housing agencies and potentially national affordable nonprofit housing advocates. Partnerships could include private developers who are willing to provide lower-cost housing in exchange for something from the Municipality.
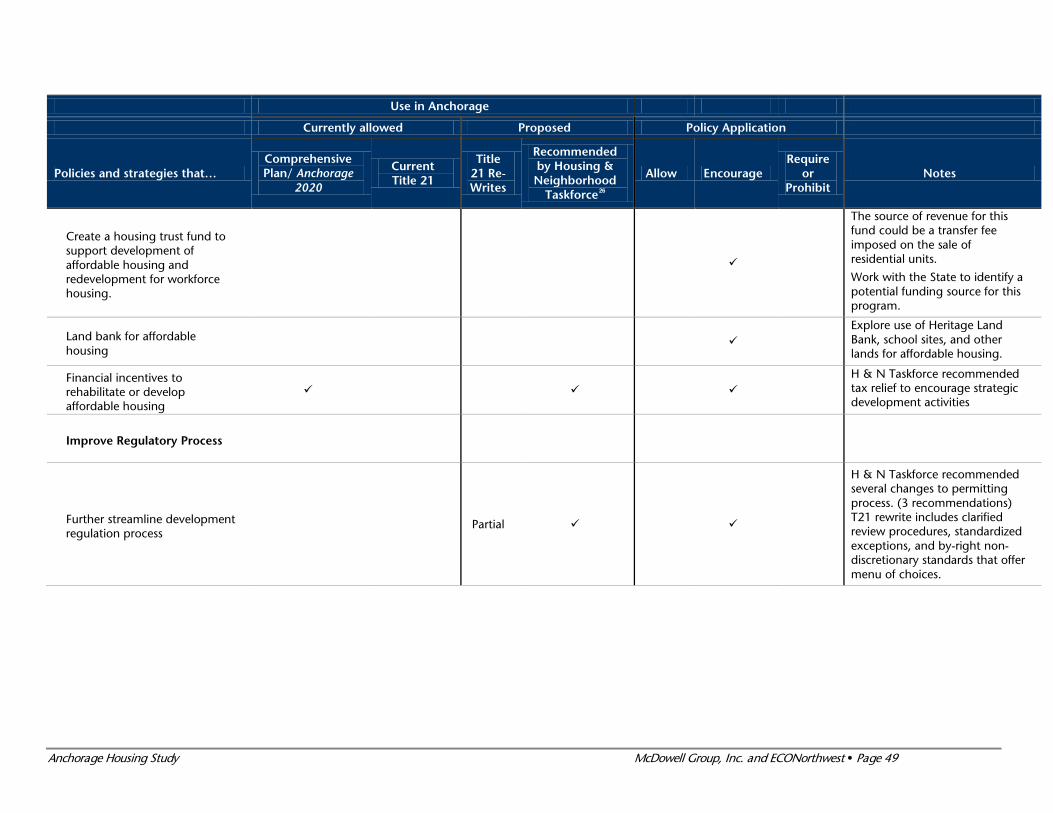
Anchorage Housing Study McDowell Group, Inc. and ECONorthwest Page 49
Use in Anchorage
Currently allowed Proposed Policy Application
Policies and strategies that… Comprehensive Plan/ Anchorage
2020
Current Title 21
Title 21 Re-Writes
Recommended by Housing & Neighborhood
Taskforce26
Allow Encourage Require
or Prohibit
Notes
Create a housing trust fund to support development of affordable housing and redevelopment for workforce housing.
The source of revenue for this fund could be a transfer fee imposed on the sale of residential units.
Work with the State to identify a potential funding source for this program.
Land bank for affordable housing
Explore use of Heritage Land Bank, school sites, and other lands for affordable housing.
Financial incentives to rehabilitate or develop affordable housing
H & N Taskforce recommended tax relief to encourage strategic development activities
Improve Regulatory Process
Further streamline development regulation process
Partial
H & N Taskforce recommended several changes to permitting process. (3 recommendations) T21 rewrite includes clarified review procedures, standardized exceptions, and by-right non-discretionary standards that offer menu of choices.
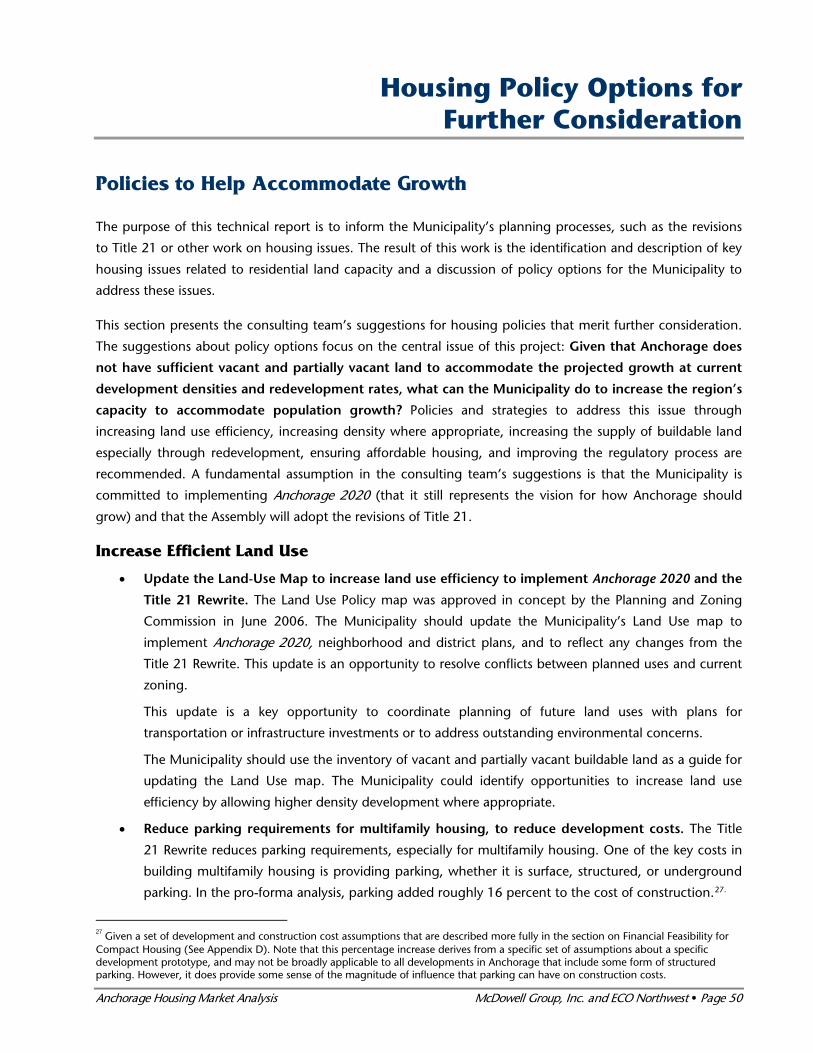
Anchorage Housing Market Analysis McDowell Group, Inc. and ECO Northwest Page 50
Housing Policy Options for Further Consideration
Policies to Help Accommodate Growth
The purpose of this technical report is to inform the Municipality’s planning processes, such as the revisions
to Title 21 or other work on housing issues. The result of this work is the identification and description of key
housing issues related to residential land capacity and a discussion of policy options for the Municipality to
address these issues.
This section presents the consulting team’s suggestions for housing policies that merit further consideration.
The suggestions about policy options focus on the central issue of this project: Given that Anchorage does
not have sufficient vacant and partially vacant land to accommodate the projected growth at current
development densities and redevelopment rates, what can the Municipality do to increase the region’s
capacity to accommodate population growth? Policies and strategies to address this issue through
increasing land use efficiency, increasing density where appropriate, increasing the supply of buildable land
especially through redevelopment, ensuring affordable housing, and improving the regulatory process are
recommended. A fundamental assumption in the consulting team’s suggestions is that the Municipality is
committed to implementing Anchorage 2020 (that it still represents the vision for how Anchorage should
grow) and that the Assembly will adopt the revisions of Title 21.
Increase Efficient Land Use
• Update the Land-Use Map to increase land use efficiency to implement Anchorage 2020 and the
Title 21 Rewrite. The Land Use Policy map was approved in concept by the Planning and Zoning
Commission in June 2006. The Municipality should update the Municipality’s Land Use map to
implement Anchorage 2020, neighborhood and district plans, and to reflect any changes from the
Title 21 Rewrite. This update is an opportunity to resolve conflicts between planned uses and current
zoning.
This update is a key opportunity to coordinate planning of future land uses with plans for
transportation or infrastructure investments or to address outstanding environmental concerns.
The Municipality should use the inventory of vacant and partially vacant buildable land as a guide for
updating the Land Use map. The Municipality could identify opportunities to increase land use
efficiency by allowing higher density development where appropriate.
• Reduce parking requirements for multifamily housing, to reduce development costs. The Title
21 Rewrite reduces parking requirements, especially for multifamily housing. One of the key costs in
building multifamily housing is providing parking, whether it is surface, structured, or underground
parking. In the pro-forma analysis, parking added roughly 16 percent to the cost of construction.27.
27 Given a set of development and construction cost assumptions that are described more fully in the section on Financial Feasibility for Compact Housing (See Appendix D). Note that this percentage increase derives from a specific set of assumptions about a specific development prototype, and may not be broadly applicable to all developments in Anchorage that include some form of structured parking. However, it does provide some sense of the magnitude of influence that parking can have on construction costs.
Anchorage Housing Market Analysis McDowell Group, Inc. and ECO Northwest Page 51
Reducing the requirements for parking is a key way to allow developers to build less expensive
multifamily housing. Leaving the decision about how much parking to provide up to the developer
will give him more flexibility to design the project and set the rental rates.
Increase Residential Densities
• Allow small-lot single-family housing on lots less than 6,000 square feet and narrower than 50
feet, where appropriate and with design standards. The Municipality should allow the type of
development that it wants to happen. For example, the Municipality does not allow small fee-simple
detached residential lots outside of PUDs, cluster housing, or planned community developments. The
Municipality could get more small-lot residential development by lowering the minimum lot size and
adjusting the restrictions about width of lots to allow smaller lots. The Municipality could further
evaluate what zoning districts are appropriate or consider an overlay zoning district for appropriate
parts of town. Special attention to design standards should be included to ensure neighborhood
compatibility.
• Provide opportunity areas for building denser housing, such as centers identified in Anchorage
2020. The Municipality could identify specific opportunity areas for building housing at increased
density, ranging from denser two to four unit housing or higher density multifamily housing. The
opportunity areas may be a city block or they may be larger areas, such as a neighborhood. The
opportunity areas may also provide opportunity for redevelopment, as discussed later in this section.
Using Anchorage 2020 as a guide, MOA may consider focusing on one Town/Neighborhood Center,
where market conditions are appropriate.
• Develop funding solutions to provide infrastructure to support increased residential densities
and more efficient use of land. One of the barriers to developing housing in Anchorage, especially
infill development, is the non-contiguous and incomplete system of infrastructure and utilities.
Development and redevelopment of housing often requires building new or increasing the capacity
of existing infrastructure, such as roads, municipal water, sanitary sewer, or storm-water drainage.
The cost of building the infrastructure depends on the availability and capacity of surrounding
existing infrastructure, as well as the Municipality’s various infrastructure standards. Anchorage has
several subdivisions that were platted forty or more years ago (referred to as “paper plats”) with
minimal infrastructure improvements. The Municipality’s Community Development reports that these
areas have substandard road, water, sanitary sewer, and storm drain improvements.
The Municipality currently funds infrastructure development through a variety of sources: municipal
bonds, state grants, special assessment districts, assessment fees, and other funding sources. The
existing funding system is complex and highly political. Some sources require support of the
Anchorage Assembly or approval of a majority of voters living within the special assessment district.
Developing a complete, well-designed infrastructure system in support of efficient residential
development will require the Municipality to consider different funding sources. The biggest
requirements for funding additional development of infrastructure are: (1) a stable revenue stream
and (2) a good bond rating.
Anchorage Housing Market Analysis McDowell Group, Inc. and ECO Northwest Page 52
The Municipality’s challenge will be identifying and supporting development of one or more stable
revenue streams to support infrastructure development. Some options that the Municipality could
consider are:
• Systems Development Charges. Systems development charges (SDCs), are fees levied on
new development as a way to pay for the municipal cost of the infrastructure necessary to
support the new development. SDCs can be used to pay for a range of infrastructure, such as
streets, sidewalks, municipal water systems, sanitary sewer systems, or parks. SDCs are
collected at the time of development and used to fund future infrastructure development,
some of which may occur years after collection of the SDC, such as building a new
wastewater treatment plant.
Developers are often concerned about SDCs increasing development costs and decreasing
housing affordability. Some municipalities require all new development to pay SDCs,
regardless of the type of development. Other municipalities use SDC waivers as a form of
public investment and incentive for developers to build projects that support development
goals, such as infill development or dense multifamily housing.
• Tax increment financing. Tax increment financing (TIF) can be used to finance the cost of
public infrastructure and stimulate private development within designated urban renewal
areas. TIF can provide funding for capital improvements such as streets, parks, parking
garages, or other infrastructure upgrades for specific projects or specifically designated areas.
TIF is generally used to catalyze redevelopment that stimulates private investments and
increases property values (and property taxes). Using TIF may require legislative changes,
possibly at the state and municipal level, that enable TIF.
• Infrastructure bank. An infrastructure bank is a municipal investment, where the earnings
from the investment are used to make low-interest loans to fund development of
infrastructure for specific projects. An infrastructure bank requires a large capital investment
to establish the bank, which makes infrastructure banks relatively uncommon.
• Implement design standards to ensure development of desirable communities and protection
of land values. One of the reasons that people do not like multifamily housing is that it is often
poorly designed. As a result, existing residents, especially in established neighborhoods, are often
resistant to the idea of building new multifamily housing in their neighborhood.
The Anchorage case studies found that successful compact development focuses on natural
amenities, open space and views, and creates a site plan with attention to architectural details. As
Anchorage continues to develop multifamily housing, having design standards that reflect
community values will be important both for creating desirable neighborhoods, where people want
to live, and for alleviating neighborhood concerns about new multifamily development. This
approach can also help alleviate neighbor opposition and concerns, making it easier to build
multifamily projects.
The revisions to Title 21 include design standards to ensure that new development is compatible with
the existing neighborhood. The consultant team did not evaluate the proposed design standards in
their entirety. The Municipality should evaluate the effectiveness of these standards after they have
been in place for several years.

Anchorage Housing Market Analysis McDowell Group, Inc. and ECO Northwest Page 53
Increase the Supply of Buildable Land
• Phase infrastructure expansion into large land holdings in Eagle River/Chugiak. The area in the
Municipality with the greatest opportunity for greenfield development is in Chugiak-Eagle River,
especially on lands owned by Eklutna, Inc. (e.g., Eklutna 770 and Powder Reserve). The Municipality
could coordinate development of these areas with the landowners, to ensure appropriate
infrastructure to allow these areas to be built at urban densities in a timely manner.
• Conserve residential land supply by limiting rezones to other uses. Anchorage 2020 includes a
policy of conserving existing dwelling units and residential lands. The Municipality could evaluate
ordinances used by other jurisdictions and determine whether a similar ordinance would be
appropriate to elevate and enforce the existing policy.
• Identify publicly owned lands that are suitable and make those lands available for residential
development. Working with the Heritage Land Bank, Anchorage School District and other public
landowners, the Municipality may be able to identify parcels that could support residential
development. The Municipality may consider selling the land below market rate if the resulting
development provides a public good, such as affordable or workforce housing.
Facilitate Redevelopment
• Create a redevelopment strategy to encourage infill and more compact residential
development. The Municipality could work with key stakeholders to create a redevelopment strategy
to encourage infill and more compact housing in the Anchorage Bowl. The strategy would identify
stakeholders who would participate in redevelopment, redevelopment tools, funding sources, and
specific sites that could present redevelopment opportunities. Redevelopment that increases the
supply of compact housing, especially if it is closer to the core of the City and is well-planned and
attractive, can help to achieve many policy objectives. A detailed review of literature regarding the
fiscal impacts of various development types28 found that, in general, denser development costs less
for local governments to build and maintain. On many sites in Anchorage, denser development may
take advantage of existing capacity in infrastructure (roads, sewer, and water lines), reducing the
miles of pipe and pavement that the Municipality must build and maintain.
Infill development can bring more homes closer to jobs, reducing the impacts on transportation
systems and supporting ridership for transit. Increased density of housing, depending on its location,
may mean that more households are within proximity of retail districts, supporting local businesses
and creating more vibrant destinations.
Despite all of these benefits, Anchorage’s historical development patterns strongly suggest that more
compact redevelopment is not likely to occur without some coordinated support that:
(1) Identifies the most appropriate locations for compact housing that will be the most desirable
for residents and therefore generate the highest rents;
(2) Ensures that appropriate infrastructure serves the site and that public amenity (parks or open
spaces, transit access, etc.) is available nearby;
28 Contained in the Oxford Handbook of Economics and Planning, 2011; Juntunen, Moore, and Knapp
Anchorage Housing Market Analysis McDowell Group, Inc. and ECO Northwest Page 54
(3) Supports specific redevelopment projects that can catalyze redevelopment on nearby sites
and create districts with a sense of place and appeal.
In communities where redevelopment strategies have been successful, public sector investments in
infrastructure, storefront improvement grants, and public-private partnerships on catalytic sites have
helped to prove the market for more compact forms of development and generate unsubsidized,
private-sector investment in compact development over time. A good strategy would have the
following elements:
• Identify key stakeholders for redevelopment. The Municipality could identify key stakeholders and
identify stakeholders’ roles and responsibilities. The Municipality could coordinate an inter-
departmental, inter-jurisdictional team to focus on redevelopment including: AWWU
(water/wastewater), Planning, Development Services, Public Works, Fire, Alaska State Department of
Transportation, and other public agencies. In addition, the Anchorage Community Development
Authority (ACDA), as a quasi-public institution, has the ability to facilitate and implement
redevelopment projects but ACDA’s mission is not oriented towards redevelopment. If ACDA is
willing and able to play a key role in redevelopment, the Municipality could work with ACDA as a key
stakeholder in developing and implementing the redevelopment strategy, starting by identifying
other stakeholders.
• Identify redevelopment tools. The Municipality could work with ACDA to identify the tools that the
Municipality is willing and able to use to facilitate redevelopment. Redevelopment tools, which are
listed in Table 8, include (but are not limited to): ability to change zoning, set specific design
requirements, develop infrastructure needed to support redevelopment, provide financial incentives
(e.g., low-interest loans) for redevelopment, parcel assembly, assistance with environmental
remediation, or identify deteriorated properties or publicly owned properties as part of the
redevelopment site.
A key tool used successfully in other cities is a development agreement between the city,
redevelopment agency, and developers. The development agreement describes the investments that
the Municipality and redevelopment agency agree to make (i.e., build specific infrastructure, such as
parks or trails or upgrades/extensions to existing major infrastructure) and, in turn, what the
developer agrees to construct (i.e., build higher density housing in the redevelopment area).
These documents are typically legally binding agreements that describe a process by which each
partner will contribute to the success of the project, share the project’s risk, and ensure that a public
benefit is achieved.
Another important tool is establishing an expedited plan and permit approval process for infill and
redevelopment projects. The Municipality can develop a process that saves developers time and
increases certainty in the entitlement process. The Municipality may consider designating specific
staff in Development Services and Planning to become redevelopment specialists. These individuals
would be responsible for the following tasks for infill and redevelopment projects: identifying
systemic issues, developing solutions, and (if an expedited review process is established) coordinating
expedited review.
Anchorage Housing Market Analysis McDowell Group, Inc. and ECO Northwest Page 55
• Identify funding sources for redevelopment. The Municipality could work with ACDA and the
Alaska Housing Finance Corporation (AHFC) to identify funding sources for redevelopment. Some
funding sources include (but are not limited to): Urban Renewal and tax increment financing, New
Market Tax Credits for redevelopment of distressed areas (which includes some areas in Northwest
and Northeast Anchorage), CDBG and HOME funds, HUD loan programs, and other programs.
• Identify redevelopment opportunity areas or sites. The Municipality could identify opportunity
areas for redevelopment. The previous section suggested identifying specific areas of opportunity for
increased density and public investment to encourage denser development. The same areas that
present opportunities for increased housing density may also be opportunities for redevelopment.
The opportunity areas should be areas where redevelopment is likely to succeed, such as areas in an
appealing location (e.g., close to a job center). Describing a vision for the future of these opportunity
areas, where redevelopment is desirable and will be supported, can reduce developer uncertainty
regarding his investments and cause developers or property owners to think differently about what
might happen on a site. The redevelopment opportunity areas should have some sites that are (or are
close to) “development ready”: sites that are well located and served by sufficient infrastructure
capacity to serve increased density, are either vacant or have buildings that are suitable for adaptive
re-use, with owners who are actively interested in participating in redevelopment.
A logical place to start evaluating potential public incentives in Anchorage would be identifying a
redevelopment opportunity area in a neighborhood with an existing base of higher density housing
and retail amenities, which could grow to include new developments that increase the
neighborhood’s vibrancy and attractiveness. Public sector planning and support to improve specific
streetscapes and make them more pedestrian-friendly, coupled with targeted subsidies for adjacent
development, could help to create a district where housing and retail amenities can be created
simultaneously. Over time, a few successful residential or mixed-use projects might help to “prove
the market” for compact residential development in Anchorage. If a few high-quality, well-located
mixed-use or mid-rise residential developments can be built and successfully sold or rented, it might
begin to show that these types of development are possible in Anchorage, and bring additional
private-sector resources to the table.
• Implement the redevelopment strategy. Once a redevelopment strategy has been developed, tools
and funding sources identified, and one or more area for targeted redevelopment has been
identified, the Municipality could work with its partners in the ACDA to facilitate the redevelopment.
• Target and clarify the existing tax-abatement and fee-waiver ordinance to increase
effectiveness as a redevelopment tool. The existing ordinance29 is intended to encourage property
owners to address deterioration on their properties and is available city-wide for a property that
meets the broad application criteria, and is approved by the Assembly. To date, these incentives have
been used on only a few projects. In order for the tool to effectively rehabilitate deteriorated areas, it
is suggested that the Municipality target the incentive and clarify the application process.
A more targeted tax-abatement program, available in redevelopment opportunity areas and for
compact housing developments that meet certain criteria, could provide additional financial incentive
29 AMC 12.35
Anchorage Housing Market Analysis McDowell Group, Inc. and ECO Northwest Page 56
for developers and property owners to invest in those areas. The Municipality might elect to abate
only those properties that achieve a certain density, or that are affordable to support workforce
housing, or that provide ground-floor retail opportunities, or other criteria.30
While a tax-abatement program can be an effective redevelopment tool, the threshold and approval
process should be clear and relatively simple. The current ordinance requires Assembly approval for
the tax-abatement or fee waiver. Prior to site acquisition, developers need to know that they can
obtain a tax abatement within a reasonably short time period. With the existing requirements, the
Municipality may continue to see only a few applications by developers with sufficient political capital
to apply.
Ensure Affordable Housing
• Expand affordable and workforce housing opportunities. The Municipality and its partners
including AHFC, and affordable housing developers, could identify appropriate tools for creating
affordable housing, such as a housing trust fund, a land trust, a land bank, or financial incentives to
rehabilitate or develop affordable housing. When implementing strategies to encourage market-rate
development, the Municipality could prioritize affordable and workforce housing in development
incentives when appropriate.
Improve Regulatory Process
• Further streamline development regulations. Where possible in the land use code, regulations
should be clear and non-discretionary, exceptions should be standardized, development alternatives
provided as choices in by-right non-discretionary standards, and review processes shortened. Three
to five years after the revision of Title 21 has been adopted, the Municipality may want to evaluate
whether the revisions clarified the development code sufficiently. The Municipality could also
continue to work with key stakeholders to improve other sections of the code and internal policies
that impact development, including the Design Criteria Manual, and the permit process.
30 If the Municipality also decides to pursue tax increment financing, it should think carefully about encouraging abatements, as they will reduce the resources available to a TIF district.
Anchorage Housing Market Analysis McDowell Group, Inc. and ECO Northwest Page 57
Next Steps
The purpose of this report was technical: identifying and describing the key housing issues related to
projected growth and residential land capacity and discussing policy options for the Municipality to address
these issues. In the previous section, the consulting team suggested more than ten housing and housing-
related policies that that merit further consideration by the Municipality, in light of municipal planning goals.
This report, however, does not (and was not meant to) include an implementation strategy for addressing
residential issues. The study team suggested next steps for the Municipality are:
• Complete the Title 21 revision process. While the study team did not evaluate the details of the
Title 21 rewrite, a few of the policies suggested for further consideration are at least partially
addressed in the Title 21 rewrite. Three to five years after the revision of Title 21 has been adopted,
the Municipality may want to evaluate whether the revisions have accomplished the desired
outcomes.
• Develop a strategic plan and implementation strategy. Developing a strategic plan and
implementation strategy will require the Municipality to work with multiple stakeholder groups to
identify the highest priority housing policy options and develop a strategic plan to implement those
housing policies.
• Coordinate with other stakeholder groups. This report identifies issues related to
accommodating expected residential growth, given the Municipality’s land base. Other
housing-related efforts are on-going in Anchorage, such as the Mayor’s Homeless Leadership
Team. Part of developing the strategic plan is identifying the stakeholders groups who should
be involved in the strategic planning process.
• Prioritize housing outcomes. Municipal planning staff and decision makers will need to
prioritize housing issues identified in this report based on the outcomes that the Municipality
is most concerned about achieving sooner. Municipal staff can identify the priorities through
working with stakeholder groups, work sessions with the Anchorage Assembly and Planning
and Zoning Commission, and through community feedback about residents’ priorities.
For example, if the Municipality’s highest priority outcome is increasing capacity for
developing multifamily housing, the Municipality could prioritize developing a
redevelopment strategy over implementing other policies that affect multifamily housing
capacity less (e.g., allowing smaller single-family housing). Developing a redevelopment
strategy will require multiple steps and many stakeholder groups.
• Develop and implement an implementation strategy. Based on the priorities identified for
housing policies, develop an implementation strategy that specifies goals, strategies, and
actions to implement the highest priority housing policies. The implementation strategy
should identify resources necessary to implement the policy, the stakeholder(s) responsible
for implementing the policy, and the schedule for implementing the policy. We suggest that
the Municipality focus on a limited number of housing policy options, which will allow the
Municipality to concentrate resources on addressing the highest priority items.