Embed Size (px)
Citation preview
DEPARTMENT OF MECHANICAL ENGINEERING AND MECHANICS COLLEGE OF ENGINEERING AND TECHNOLOGY OLD DOMINIOiJ UNIVERSITY NORFOLK, V I R G I N I A 23508
,//V-e/c;, z- 2- 7 7d7-30 - STUDIES ON CHEMOVISCOSITY MODELING FOR
THERMOSETTING RESINS
BY
J. M. Bai, Graduate Research Ass is tant
T. H. HOU, Cc-Principal I n v e s t i g a t o r
and
S. N. Tiwar i , P r inc ipa l I n v e s t i g a t o r
L r o g r e s s Report For the pe r iod ended January 31, 1987
Prepared fo r t h e Nat ional Aeronautics and Space Admin i s t ra t i on Langley Research Center ilampton, V i r g i n i a 23665
Under Research Crant NE-1-569 Robert M. Baucom, Technical Monitor MD-Polymeric Materi a1 s Branch
(bASA-CB-180978) STUDIES CT CLE8CVXSCGSITY 1383- 2741337 BGDBI.1136 FOR 1HEBBOSETTIBG BESIBS Progress Beport, per iod emding 3 1 Jau. 1967 (old Ccunioo Univ.) 56 p A v a i l : lTlS HC Unclas B C S / l P &01 CSCL 11B 63/27 0076302
https://ntrs.nasa.gov/search.jsp?R=19870017604 2019-04-09T02:09:28+00:00Z
a
DEPARTMENT OF MECHANICAL ENGINEERING AND MECHANICS COLLEGE OF ENGINEERING AND TECHNOLOGY OLD DOMINION UNIVERSITY NORFOLK, V I R G I N I A 23508
STUDIES ON CHEMOVISCOSITY MODELING FOR THERMOSETTING RESINS
BY
J. M. Bai, Graduate Research Ass is tant
T. H. HOU, Co-Principal I n v e s t i g a t o r
and
S. N. Tiwari , P r inc ipa l I n v e s t i g a t o r
Progress Report For t h e per iod ended January 31, 1987
Prepared f o r t h e Nat ional Aeronautics and Space Admin i s t ra t i on Langley Research Center Hampton, V i r g i n i a 23665
Under Research G r a n t NA6-1-569 Robert M. Baucom, Technical Monitor MD-Polymeric Mated a1 s Branch
Submitted by the Old Dominion University Research Foundation P.O. Box 6369 Norfolk, Virginia 23508
May 1987
I FOREWORD
Th is r e p o r t covers t h e work completed on t h e research p r o j e c t
"Chemoviscosity Modeling f o r Thermosetting Resins" f o r t he per iod ended
January 31, 1987.
Center (Polymeric Ma te r ia l s Branch o f the Ma te r ia l s D i v i s i o n ) under research
g ran t NAG-1-569.
Polymeric Ma te r ia l s Branch.
The work was supported by t h e NASA Langley Research
The grant was monitored by Mr. Robert M. Baucom o f t h e
PRECEDING PAGE BLANK NOT FILMED
iii
STUDIES ON CHEMOVISCOSITY MODELIWG FOR THERMOSETTING RESINS
BY
J. M. Ba i l , T. H. Hou*, and S . N. Tiwari3
SUMMARY
A new a n a l y t i c a l model f o r s imulat ing chemoviscosity o f thermosett ing
r e s i n s has been formu ated. The model i s developed by modify ing t h e wel l -
estab l ished W i l l iams-Landel-Ferry (WLF) theo ry i n polymer rheology f o r
thermop las t ic mater ia ls .
t r a n s i t i o n temperature T g ( t ) and the degree o f cure a ( t ) o f t he r e s i n system
under cure, t h e WLF theory can be modif ied t o account f o r t h e f a c t o r o f
r e a c t i o n time.
constants Cl(t) and C2(T) were determined from t h e isothermal cure data.
Theoret ica l p red ic t i ons o f t h e model f o r t h e r e s i n under dynamic heat ing
cure cyc les were shown t o compare favorably w i t h the experimental data.
This work represents progress toward es tab l i sh ing a chemoviscosity model
which i s capable of not o n l y descr ib ing v i s c o s i t y p r o f i l e s accurate ly under
var ious cure cycles, but also c o r r e l a t i n g v i s c o s i t y da ta t o t h e changes of
phys ica l p roper t i es associated w i t h the s t r u c t u r a l t rans format ion o f t h e
thermoset t ing r e s i n systems dur ing cure.
By in t roducing a r e l a t i o n s h i p between the g lass
Temperature-dependent funct ions o f t h e modif ied WLF t heo ry
IGraduate Research Assistant, Department o f Mechanical Engineering and
*Adjunct Ass is tant Professor, Department o f Mechanical Engineering and Mechanics, Old Dominion Un ive rs i t y , Norfolk, V i r g i n i a 23508.
Mechanics, Old Dominion Un ive rs i t y , Norfolk, V i r g i n i a 23508. Eminent Professor, Department o f Mechanical Engineering and Mechanics, 01 d Domi n i on Un i ver s i t y , Norf o 1 k , V i r g i n i a 2 3508.
i v
TABLE OF CONTENTS
Page
FOREWORD. .......................................................... iii
SUMMARY....... ..................................................... i v
LIST OF SYMBOLS .................................................... i x
Chapter
1. INTRODUCTION ................................................. 1
2. LITERATURE SURVEY.... ........................................ 5
3. EXPERIMENTAL METHOD. ......................................... 1 0
3.1 Thermal Analys is ........................................ 10
3.1.1 Sample Prepara t ion ............................... 1 0 3.1.2 Apparatus ........................................ 10 3.1.3 C a l i b r a t i o n ...................................... 11 3.1.4 Measurements of Degree of Cure a ( t ) .............. 16 3.1.5 Measurements o f Glass T r a n s i t i o n
Temperature Tg( t) ................................ 19
3.2 Rheological Measurements................................ 21
3.2.1 Sample Prepara t ion ............................... 2 1 3.2.2 Apparatus ........................................ 22 3.2.3 C a l i b r a t i o n ...................................... 23 3.2.4 Measurement of Chemoviscosity .................... 23
4. EXPERIMENTAL RESULTS. ........................................ 25
4.1 M a t e r i a l . ............................................... 25 4.2 Experimental Data o f Thermal Ana lys is ................... 25
4.2.1 Degree o f Cure a ( t ) .............................. 25 4.2.2 G1 ass T r a n s i t i o n o f Temperature Tg( t ) . ........... 35
4.3 Experimental Data o f Rheological Measurement............ 41
4.3.1 Isothermal Case .................................. 4 1 4.3.2 Dynamic Case ..................................... 45
5. CHEMOV ISCOSITY MODELING. ..................................... 49
5.1 Theory .................................................. 49 5.2 Chemoviscosity Modeling ................................. 5 1
5.2.1 Isothermal Case.................................. 5 1 5.2.2 Dynamic Heat ing Case ............................. 63
V
TABLE OF CONTENTS - Continued C h apt e r Page
6 . CONCLUSIONS AND RECOMMENDATIONS., ............................ 71
REFERENCES ......................................................... 73
APPENDICES.... 75
A. EVALUATION OF TOTAL HEAT OF REACTION AND DEGREE OF CURE.. .... 76
6. COMPUTER CODE FOR APPENDIX A.......... ....................... 8 3
.....................................................
LIST OF TABLES
Table Page
3.1 DSC c a l i b r a t i o n constant determined from the thermogram o f standard ma te r ia l Indium .................................. 17
4 . 1 Values o f constants o f Eqs. (4 . la) and (4.lb) f o r Hercules 3501-6 r e s i n system under isothermal condition...... 28
4 . 2 To ta l heat o f r e a c t i o n f o r Hercules 3501-6 r e s i n system measured a t d i f f e r e n t r a t e o f heating cond i t i ons .............
4 . 3 G1 ass t r a n s i t i o n temperature measured f o r Hercules 3501-6 r e s i n system du r ing f i v e isothermal cu r ing condi t ions. .................................................. 36
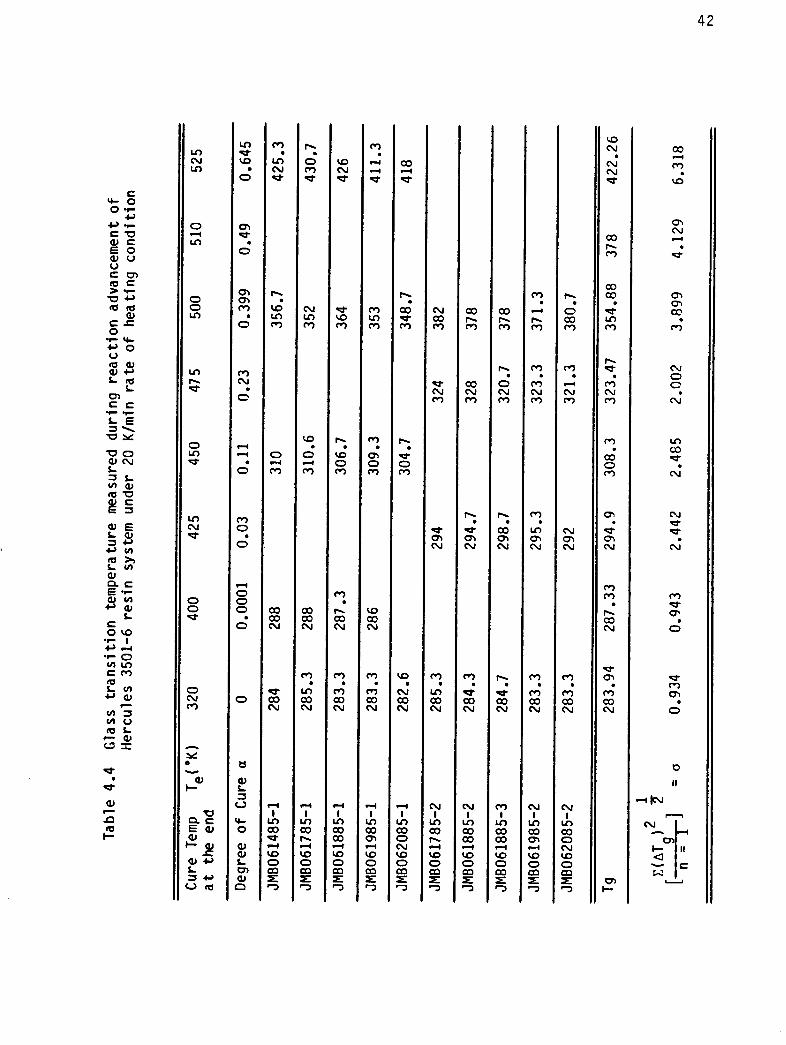
4 .4 Glass t r a n s i t i o n temperature measured dur ing r e a c t i v e advancement o f Hercules 3501-6 r e s i n i n system under
31
20 K/min r a t e o f heat ing cond i t i on ........................... 42
5 . 1 Values o f C and C2 determined f o r seven d i f f e r e n t temperature4 under isothermal condit ion.. .................... 53
5 .2 The ca l cu la ted degree o f cure a ( t ) by d i f f e r e n t t ime step s i z e A t ...................................................... 64
5 . 3 The values o f the f r a c t i o n a l f r e e volwne and thermal expansion c o e f f i c i e n t determined under isothermal condi t ion. ................................................... 69
LIST OF FIGURES
Figure Page
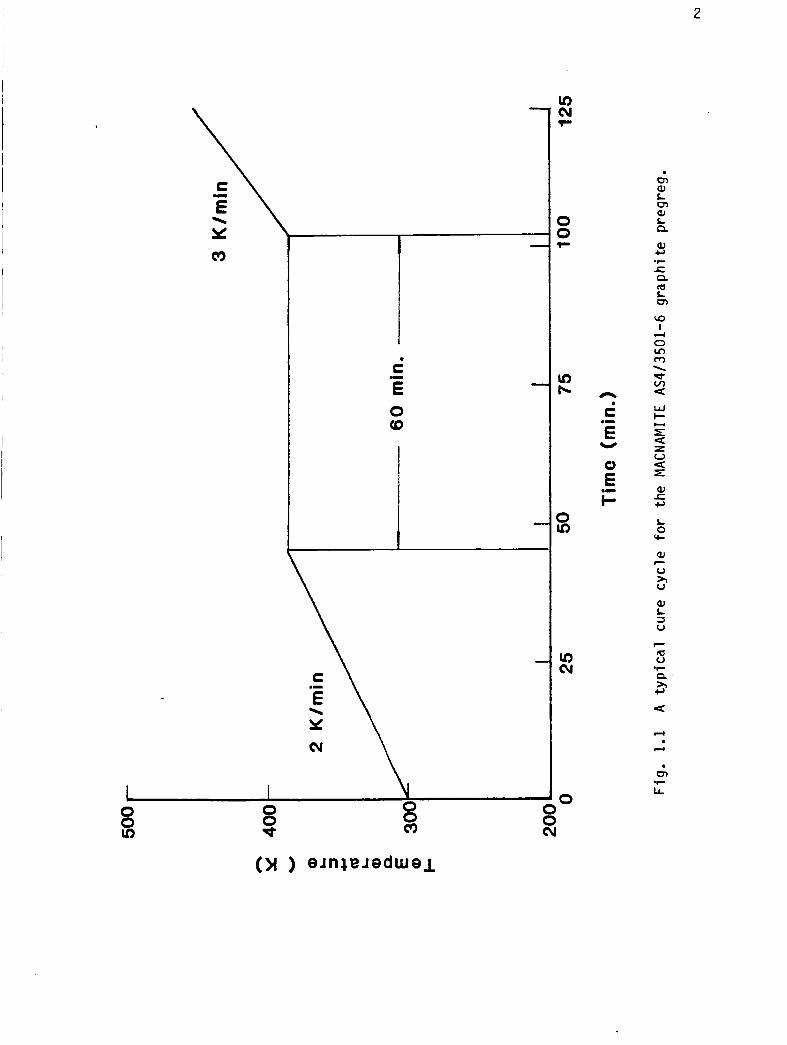
1 .1 A t y p i c a l cure c y c l e f o r t h e MACNAMITE AS4/3501-6 graph i te pregreg. ............................................ 2
v i
Figure
3.1
3.2
3.3
3.4
4 . 1
4 .2
4 . 3
4 .4
4.5
4.6
4.7
4 .8
4 .9
TABLE OF CONTENTS - Continued
L I S T OF FIGURES - Continued
The cons t ruc t i on f o r determining t r a n s i t i o n temperature. ..... The DSC thermograms o f K2Cr4 and Indium under dynamic heat ing condi t ion. ........................................... I l l u s t r a t i o n o f t he DSC thermogram o f Hercules 3501-6 ne t r e s i n s y s t em.............................................
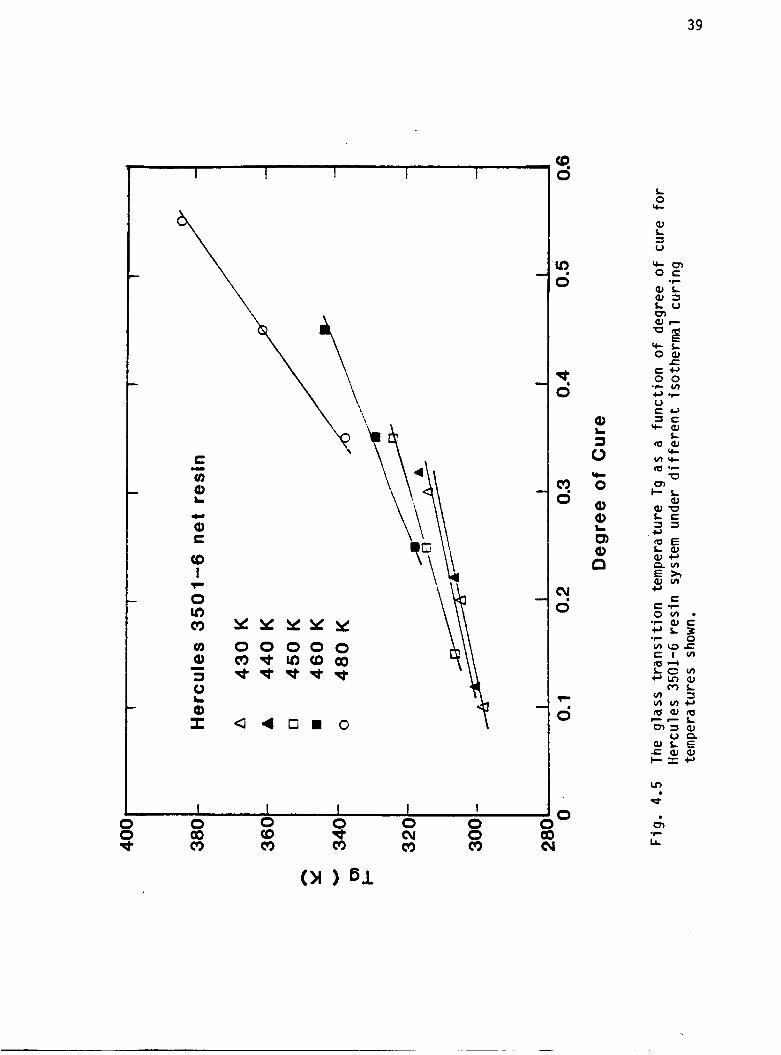
The experimental cure c y c l e o f glass t r a n s i t i o n temperature measurements f o r Hercules 3501-6 under dynamic heat ing c o n d i t i o n .................................................... Rate o f degree o f curve vs. degree o f cure repor ted b y Lee, Loos and Springer [5] f o r Hercules 3501-6 r e s i n system under isothrmal cure cycles; s o l i d l i n e s were c a l c u l a t e d using Eqs. ( 4 . l a ) and ( 4 . l b ) ...................... A t y p i c a l r a t e o f heat generation vs. t ime cure o f Hercules 3501-6 r e s i n system provided by dynamic scanning experiments under 20 K/min r a t e o f heat ing condi t ion. . ....... Degree o f cure a ( t ) measured f o r Hercules 3501-6 r e s i n system cured under f o u r d i f f e r e n t r a t e s o f heat ing condi t ions shown.. ........................................... The t y p i c a l thermogram o f glass t r a n s i t i o n o f Hercules 3501-6 r e s i n system under isothermal cure condi t ion; t h e cu r ing temperatures are 430 and 450 K, r e s p e c t i v e l y .......... The glass t r a n s i t i o n temperature Tg as a f u n c t i o n o f degree of cure f o r Hercules 3501-6 r e s i n system under d i f f e r e n t isothermal c u r i n g temperatures shown...............
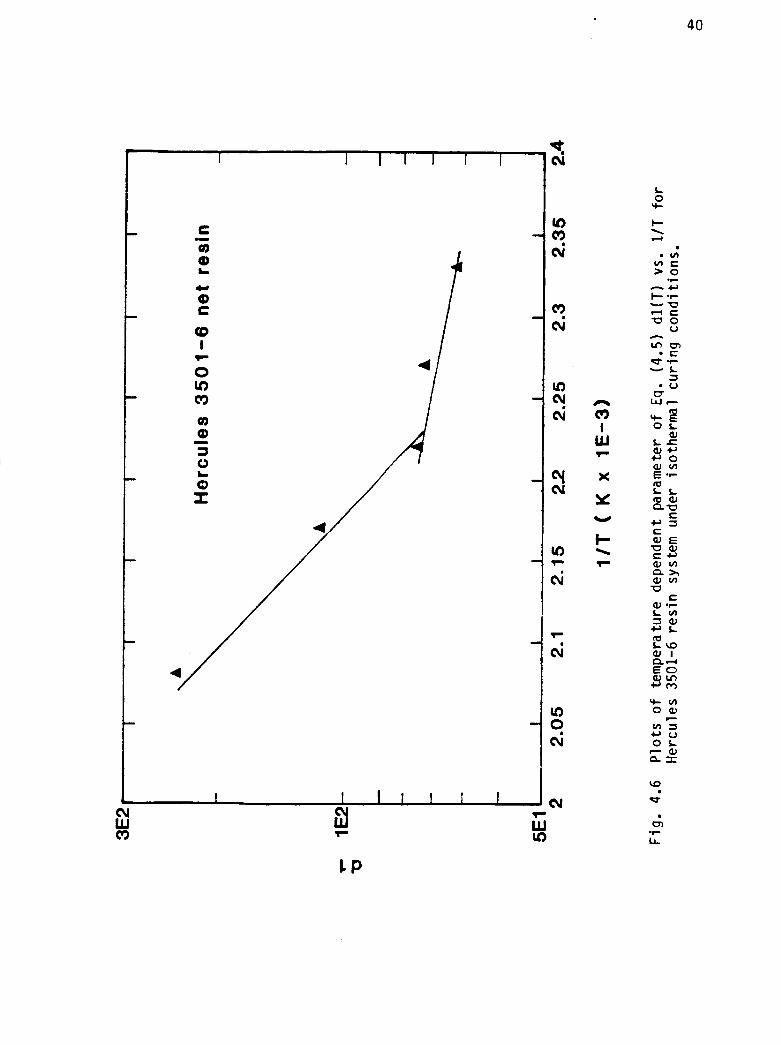
P l o t s o f temperature dependent parameter o f Eq. ( 4 . 5 ) d l ( T ) vs. 1/T f o r Hercules 3501-6 r e s i n system under isothermal c u r i n g condi t ions. . .......................................... P l o t o f Tg ( t ) vs. a ( t ) f o r Hercules 3501-6 r e s i n system under dynamic heat ing c o n d i t i o n a t 20 K/min heat ing rate.....
P l o t o f chemoviscosity ~1 vs. t i m e t f o r Hercules 3501-6 r e s i n system under seven isothermal c u r i n g temperatures shown. ....................................................... P l o t of chemoviscosity n vs. t i m e t f o r Hercules 3501-6 r e s i n system under dynamic cur ing c o n d i t i o n a t 2 K/mi n. ......
Page
13
15
18
20
27
29
32
38
39
40
43
44
46
v i i
4.10
4.11
5.1
5.2
5.3
5.4
5.5
5.6
5.7
5.8
5.9
5.10
5.11
A. 1
TABLE OF CONTENTS - Concluded
LIST OF FIGURES - Concluded
F igure
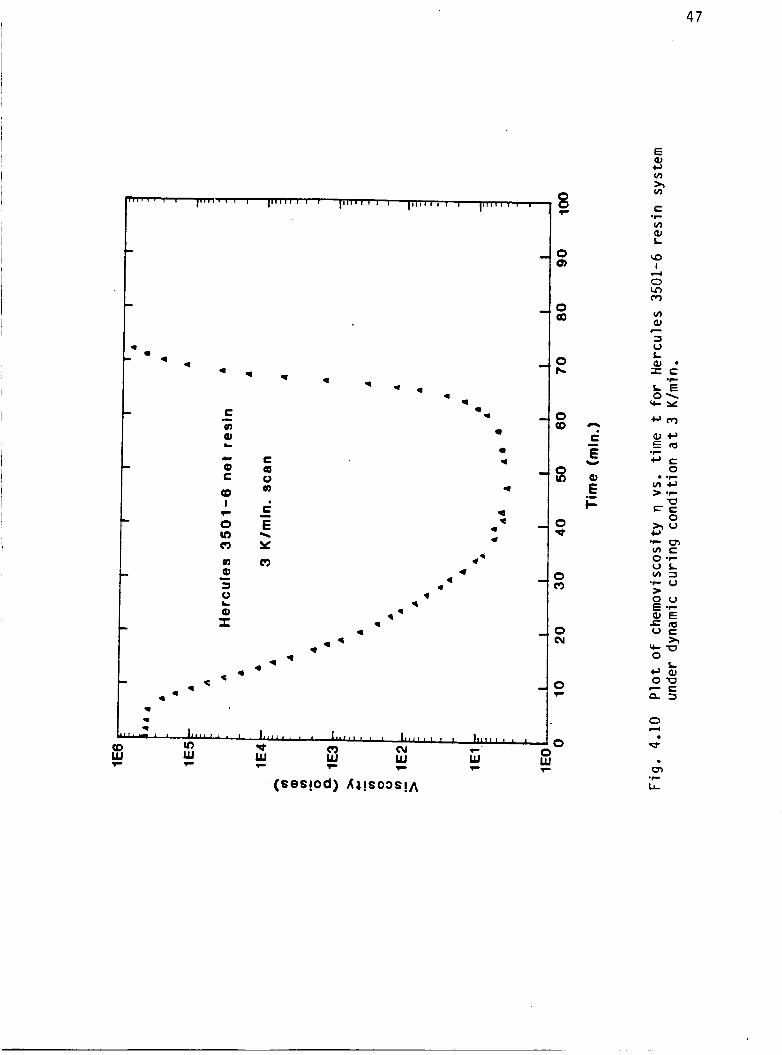
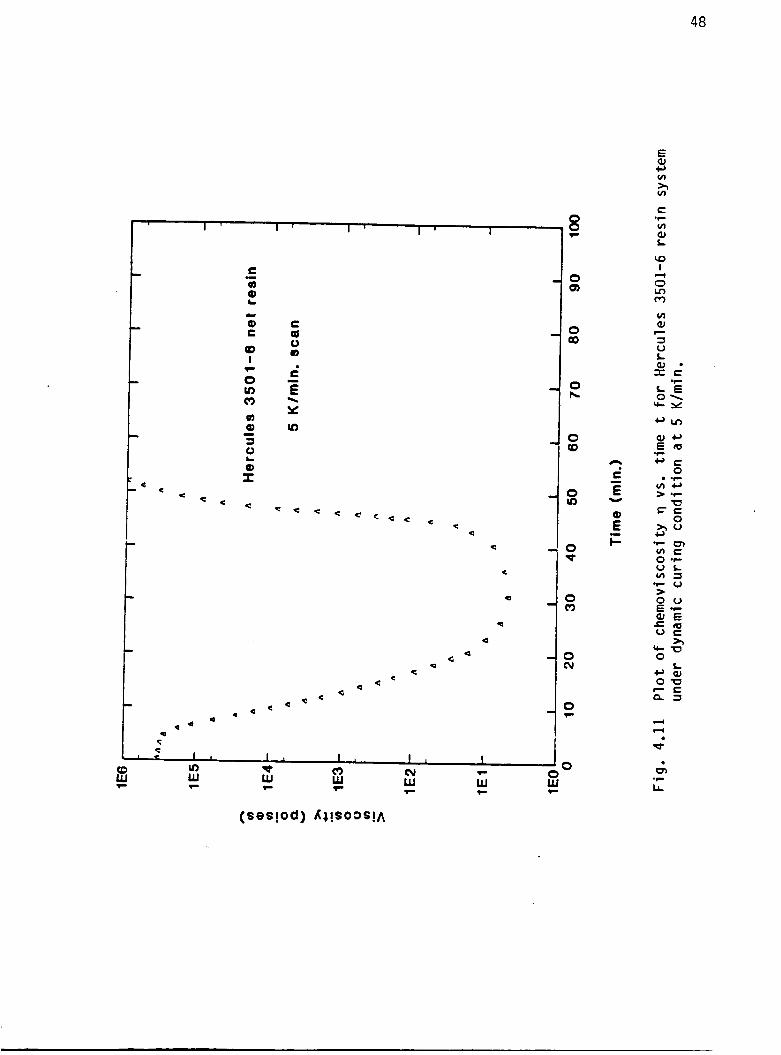
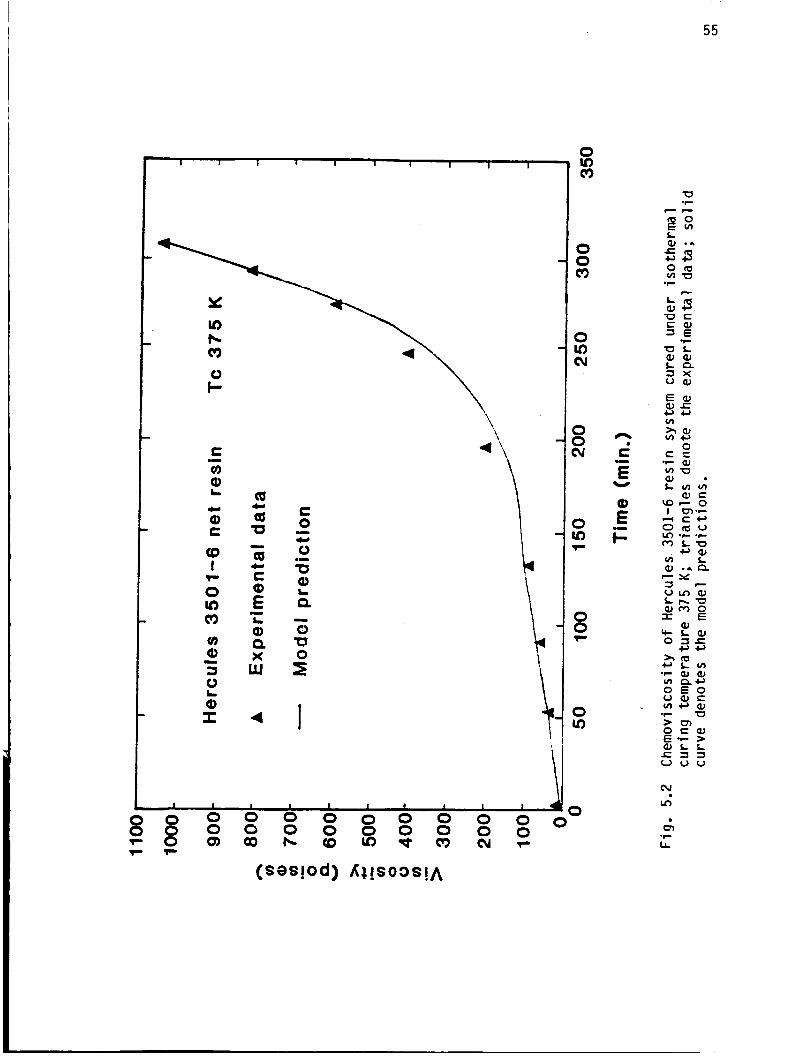
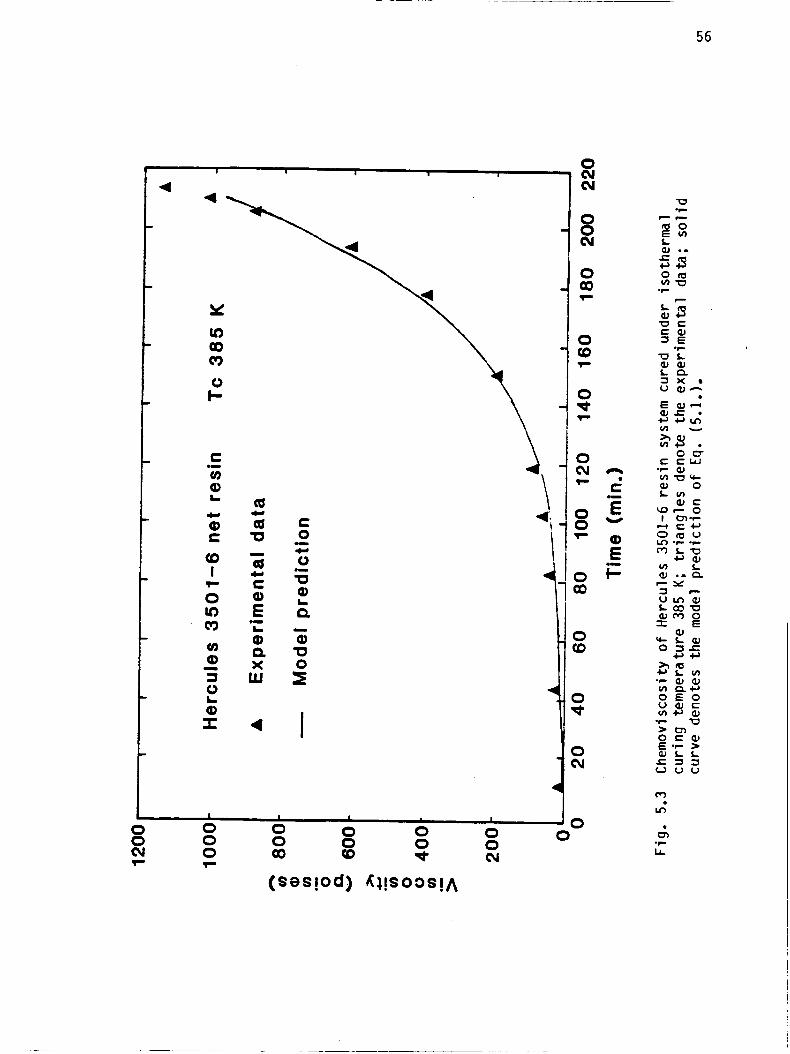
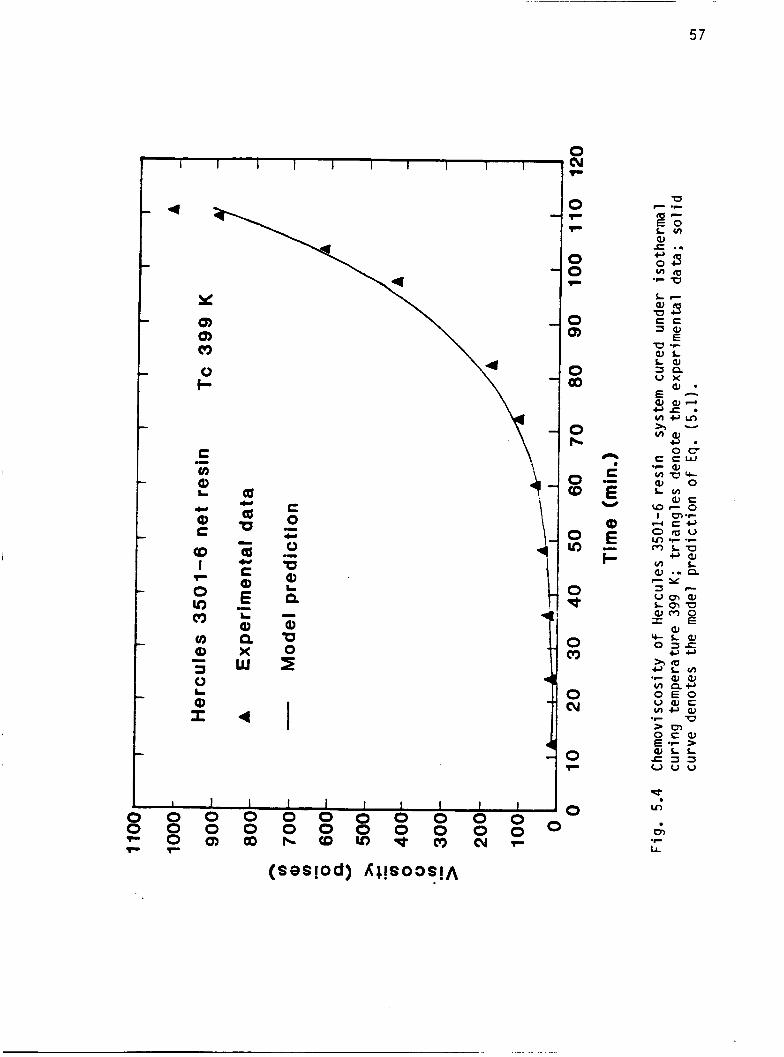
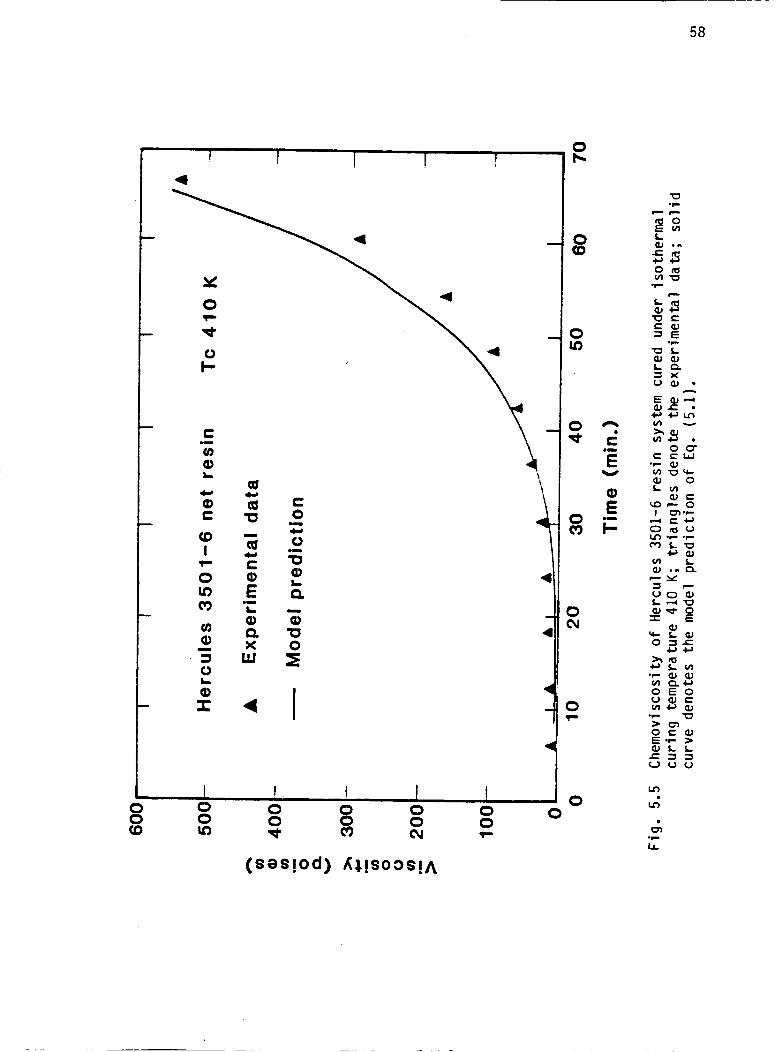
P l o t o f chemoviscosity TI vs. t i m e t f o r Hercules 3501-6 r e s i n system under dynamic c u r i n g c o n d i t i o n a t 3 K/min ...................................................... P l o t o f chemoviscosity TI vs. t i m e t f o r Hercules 3501-6 r e s i n system under dynamic c u r i n g c o n d i t i o n a t 5 K/min ...................................................... Chemoviscosity of Hercules 3501-6 r e s i n system cured under isothermal cu r ing temperature 360 K .................... Chemoviscosity of Hercules 3501-6 r e s i n system cured under isothermal c u r i n g temperature 375 K. ................... Chemoviscosity o f Hercules 3501-6 r e s i n system cured under isothermal cu r ing temperature 385 K .................... Chemoviscosity o f Hercules 3501-6 r e s i n system cured under isothermal cu r ing temperature 399 K.. ................... Chemoviscosity o f Hercules 3501-6 r e s i n system cured under isothermal c u r i n g temperature 410 K....................
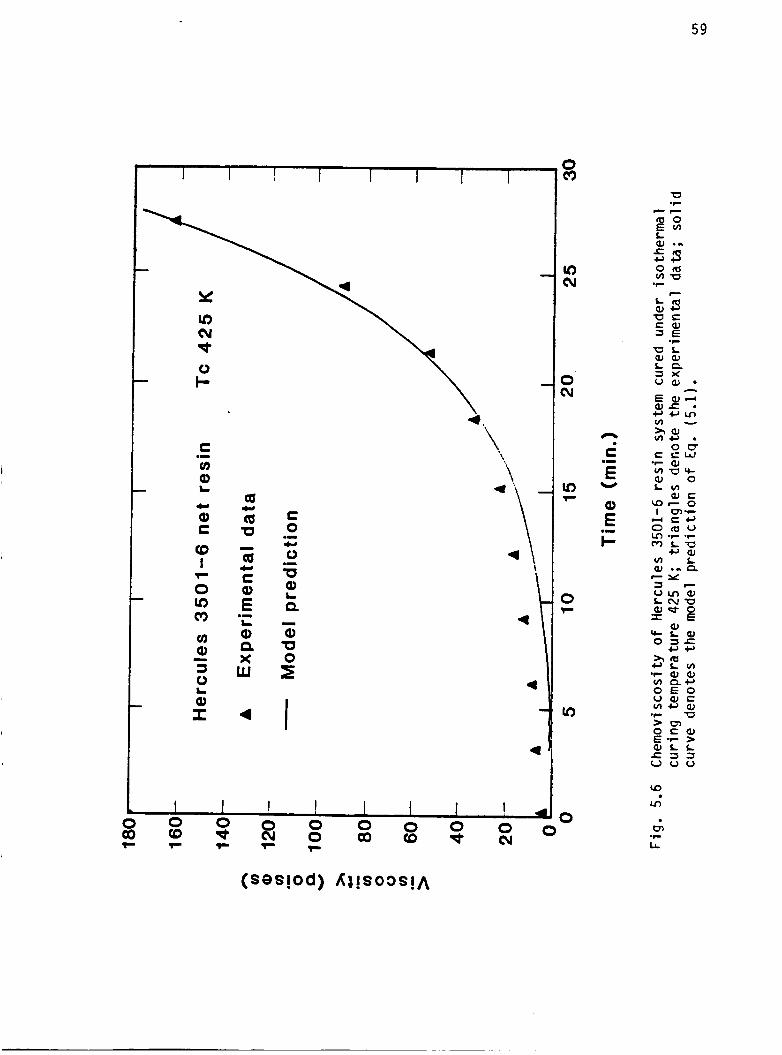
Chemoviscosity o f Hercules 3501-6 r e s i n system cured under isothermal cu r ing temperature 425 K....................
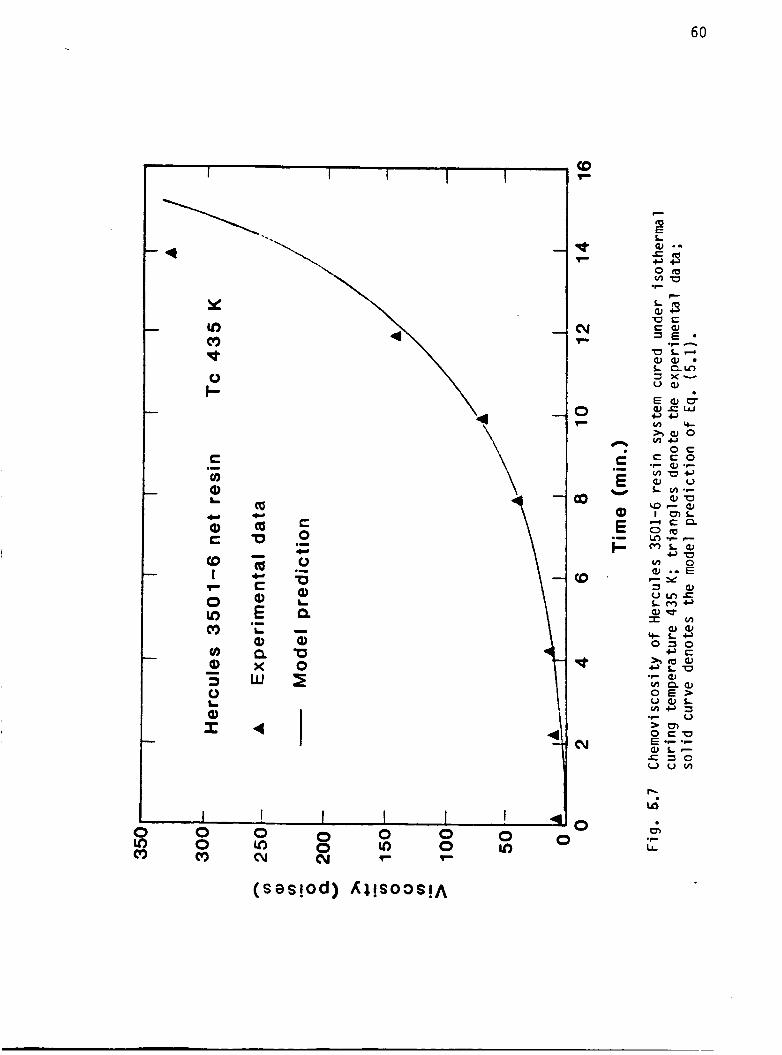
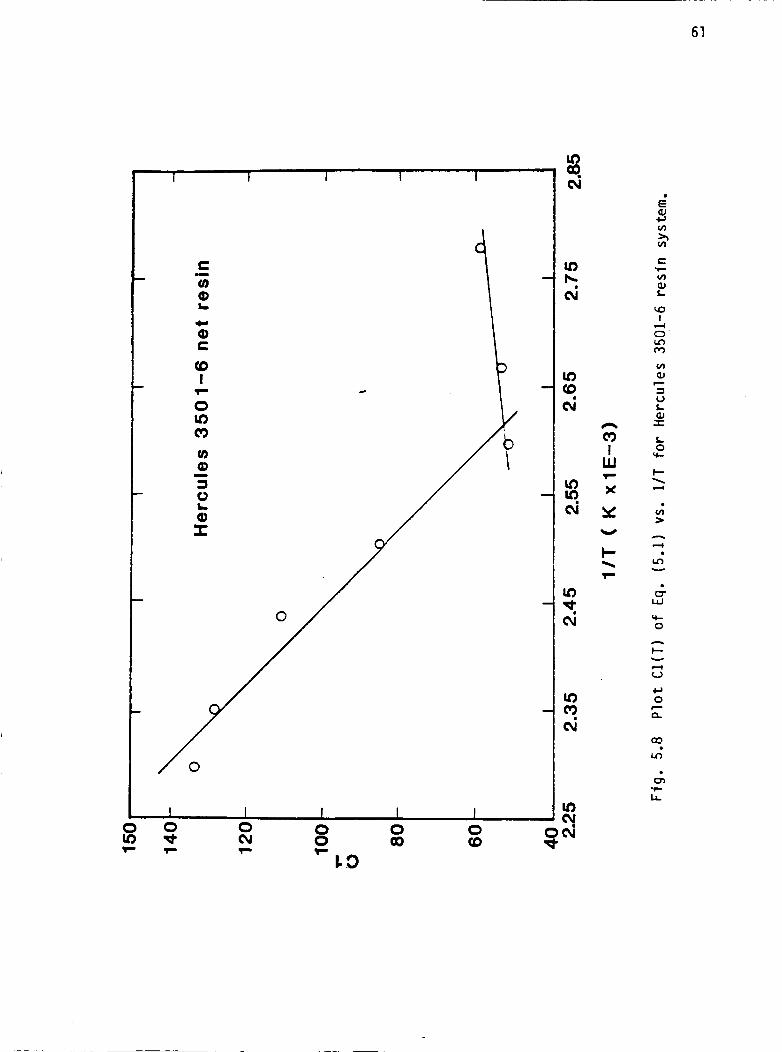
Chemoviscosity o f Hercules 3501-6 r e s i n system cured under isothermal cu r ing temperature 435 K. ................... P l o t o f Cl(T) Eq. (5.1) vs. 1/T f o r Hercules 3501-6 r e s i n sys t ...................................................
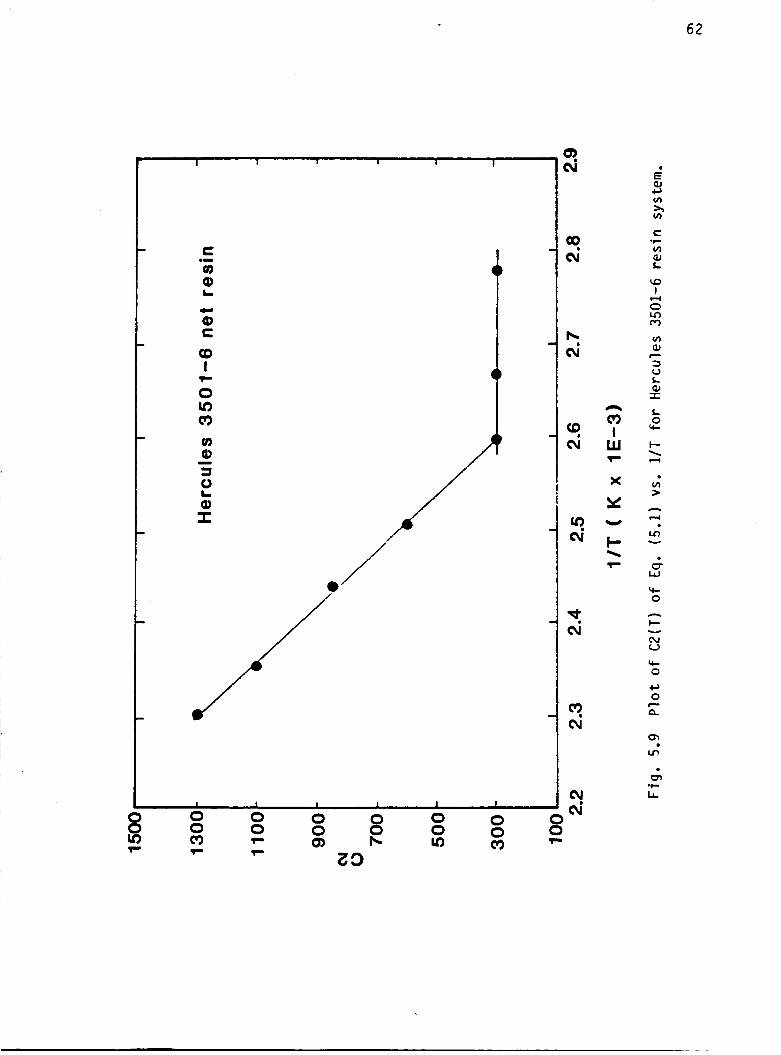
P l o t o f C2(T) Eq. (5.1) vs. 1/T f o r Hercules 3501-6 r e s i n sys t ...................................................
Chemoviscosity o f Hercules 3501-6 r e s i n system under dynamic cu r ing c o n d i t i o n a t heating r a t e o f 2 K/min .... Chemoviscosity o f Hercules 3501-6 r e s i n system under dynamic cu r ing c o n d i t i o n a t heating r a t e o f 3 and 5 K/m r e s p e c t i v e l y ........................................... I l l u s t r a t i o n o f the DSC thermogram o f Hercules 3501-6 i n heat of r e a c t i o n evaluat ion. ........................
.....
n, .....
.....
Page
47
48
54
55
56
57
58
59
60
61
62
65
66
77
v i i i
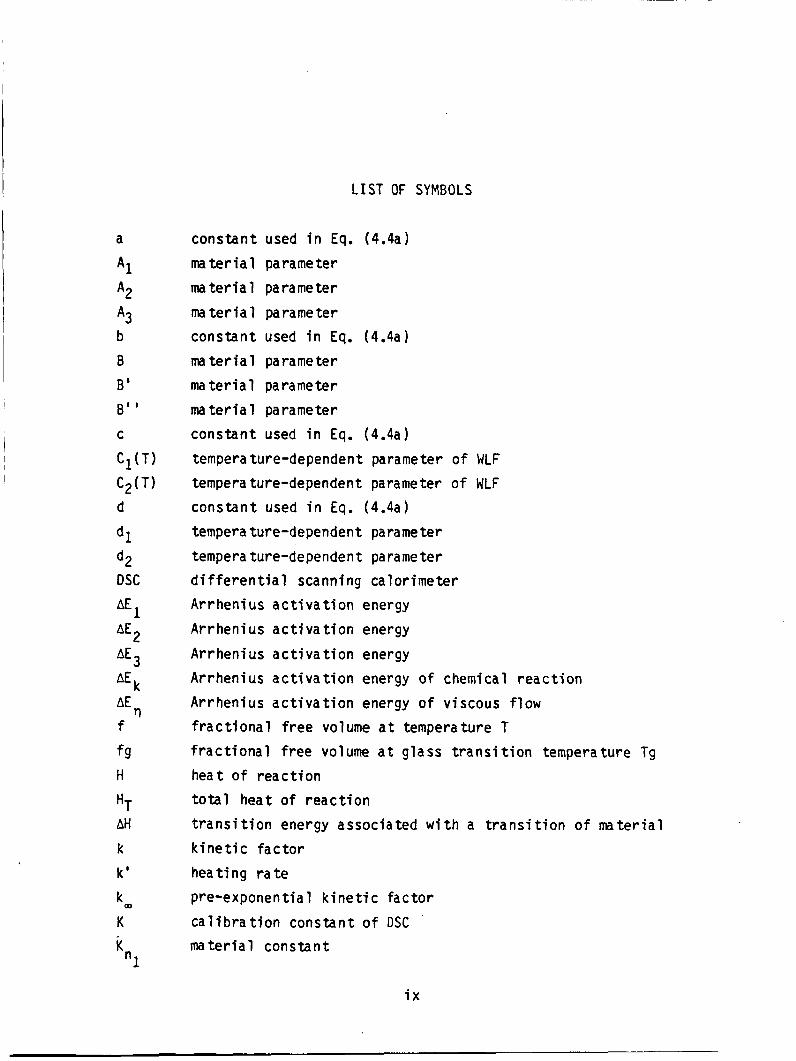
LIST OF SYMBOLS
a
A 1 A2 A3 b
B
B' B ' ' C
C l ( T ) C2(T) d
dl d2
AE 1 AE2 AE 3
DSC
AEk rl
AE
f
f g
"T
H
AH k
k ' k K CD
K
constant used in Eq. (4.4a) material parameter material parameter material parameter constant used i n Eq. (4.4a) material parameter material parameter material parameter constant used i n Eq. (4.4a) tempera ture-dependen t parameter of WLF tempera ture-dependent parameter of WLF constant used i n Eq. (4.4a) tempera ture-dependent parameter tempera ture-dependen t parameter differential scanning calorimeter Arrhenius activation energy Arrhenius activation energy Arrhenius a c t i v a t i o n energy Arrhenius activation energy of chemical reaction Arrhenius a c t i v a t i o n energy of viscous flow fractional free volume a t temperature T fractional free volume a t glass transition temperature Tg heat of reaction total heat of reaction t r a n s i t i o n energy associated w i t h a transition o f material kinetic factor heating rate pre-exponentia 1 kinetic factor calibration constant of DSC material constant
i x
2 K n
KR"3
Rr AR
S
t
tC
t f A t
T
TC
Tg
AT^^^ AT^^^
vf
V
w AW
WLF
Greek
a
af B rl
TD
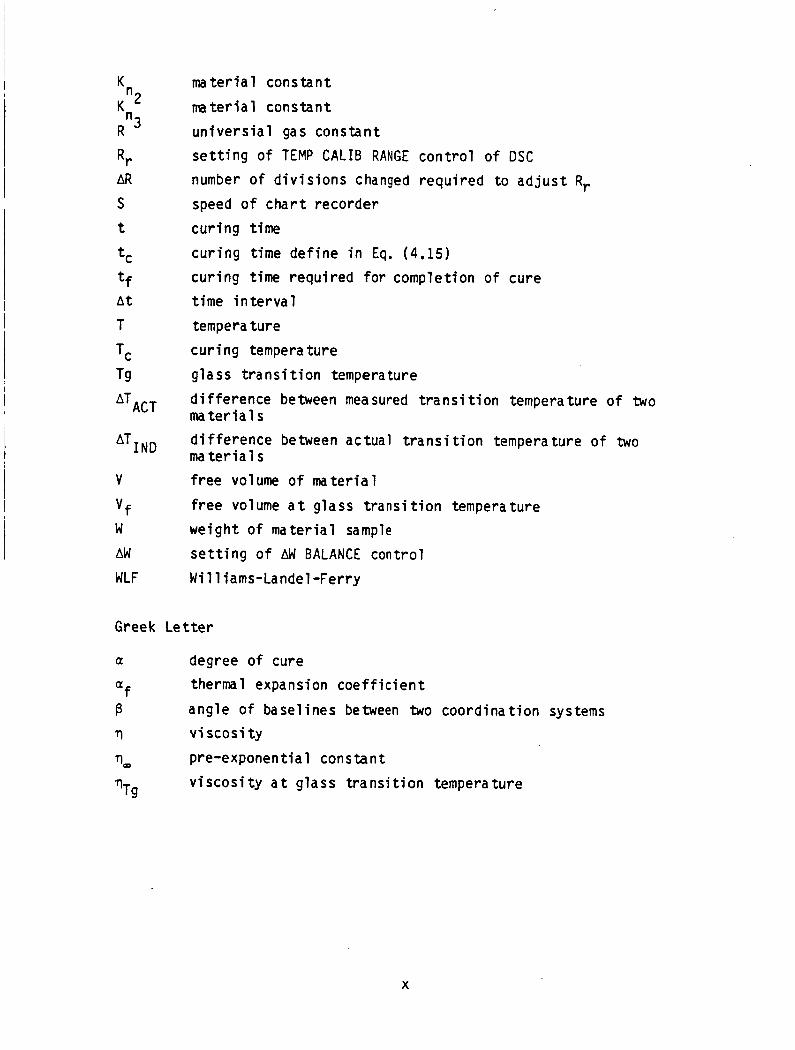
material constant material constant universial gas constant setting of TEMP C A L I B RANGE control o f DSC number o f divisions changed required to adjust Rr speed o f chart recorder curing time curing time define in Eq. (4 .15) curing time required for completion o f cure time interval temperature curing temperature glass transition temperature difference between measured transition temperature of two materials difference between ac tua l t r a n s i t i o n temperature o f two materials free volume of material free volume a t glass transition temperature weight of material sample setting of AW BALANCE control Williams-Landel-Ferry
Letter
degree of cure therm 1 expansion coefficient angle of baselines between two coord ina t ion systems viscosity pre-exponential constant viscosity a t glass transition temperature
X
Chapter 1
INTRODUCTION
Perhaps the single most important property of a polymer w i t h regard
to specifying i t s processing characteristics i s i t s viscosity. Viscos-
i t y governs the resin flow characteristics. For thermopla s t i c
materials, the viscosity i s influenced by local flow geometry a n d can
vary w i t h processing temperature and shear rate. Vi scosi ty control
becomes more cri t ical a n d difficult i n the processing of thermosetting
resins, because o f the onset of chemical reactions and the generation of
heat d u r i n g cure which causes the viscosity t o vary w i t h time. The term
chemoviscosity refers to the variation of viscosity due t o the polymer
chemical reaction. The study of chemoviscosity i s generally called
c hemor heol ogy [1]* . In a typical autoclave operation for the fabrication of composite
materials, the viscosity-time profile must allow f i r s t for the b u b b l i n g
o f f of trapped $as, then fiber compaction w i t h resin flow, and f i n a l l y ,
laminate consolidation under applied pressure before the resin has
gelled and ceases t o flow. A typical cure cycle for the MACNAMITE
AS4/3501-6 graphite pregreg (an amine-cured epoxy resin, Hercules 3501-
6 , reinforced w i t h unidirectional graphite fibers [ Z ] ) i s shown i n F i g .
1.1.
* The numbers i n brackets indicate references. 1
L 0 Le
I / I
3
A t the s t a r t of a cure cycle, the polymerizat ion reaction begins
a n d the polymers chains lengthen. The increase i n viscosity of the
resin due t o polymerization is, however, largely offset by the increase
i n temperature w h i c h i s introduced t h r o u g h the cure cycle and the heat
o f reaction. Consequently, a drop i n resin v iscos i ty of two or three
orders o f magnitude a t the i n i t i a l stage o f cure is n o t uncommon. As
the resin continues t o polymerize, crosslinks are formed and the
viscosity o f the resin system starts t o increase a t a faster rate.
Finally, the rate of increase of viscosity approaches infinity a t
gelation. Therefore, any chemoviscosi t y profile i s closely related t o
the reaction kinetics of the resin systems and the cure cycle
(temperature profile) d u r i n g processing. A fundamental understanding of
the chemoviscosi t y kinetics of thermosetting resin has been necessary i n
order t o o b t a i n a precise processing control . The objective o f present research i s to establ i s h a chemovi scosi t y
model w h i c h i s capable of n o t only describing viscosity rise profiles
accurately under various cure cycles, b u t a1 so correlating viscosity
data t o the changes o f physical properties associated w i t h the
structural transformation of the thermosetting resin systems d u r i n g
cure . The thermal analysis and rheological analysis on net resin system
were conducted by the differential scanning calorimetry and rheometry,
respectively, during the course of the s tudy . By introducing a well-
established viscosity-temperature relationship already existing i n
polymer rheology based on the information of thermal analysis a n d
rheological analysis, an analytical model for chemoviscosi t y profile of
thermosetting resin during cure was formulated. The v i scosi ty
4
calculated by the proposed model could be correlated w i t h the physical
properties t h r o u g h the two tempera ture-dependent functions C1 ( T I and
C2(T) as well a s the glass t ransi t ion temperature. In the fol lowing
chapters, the experimental measurements on the thermal and rehological
properties a re f i r s t introduced and the modeling approaches and results
are then presented.
I
i
I
Chapter 2
LITERATURE SURVEY
Numerous researchers have devoted considerable efforts t o establish
an analytical model for the chemoviscosity growth profile of thermo-
setting resins under cur ing . There are two different basic approaches
i n chemoviscosi t y modeling o f thermosetting resin. The most common
approach to the problem has been by empirically specifying the viscosity
linearly a s an exponential function o f reaction [3,41, or w i t h the a i d
of DSC thermal ana lys i s , the degree o f cure [5].
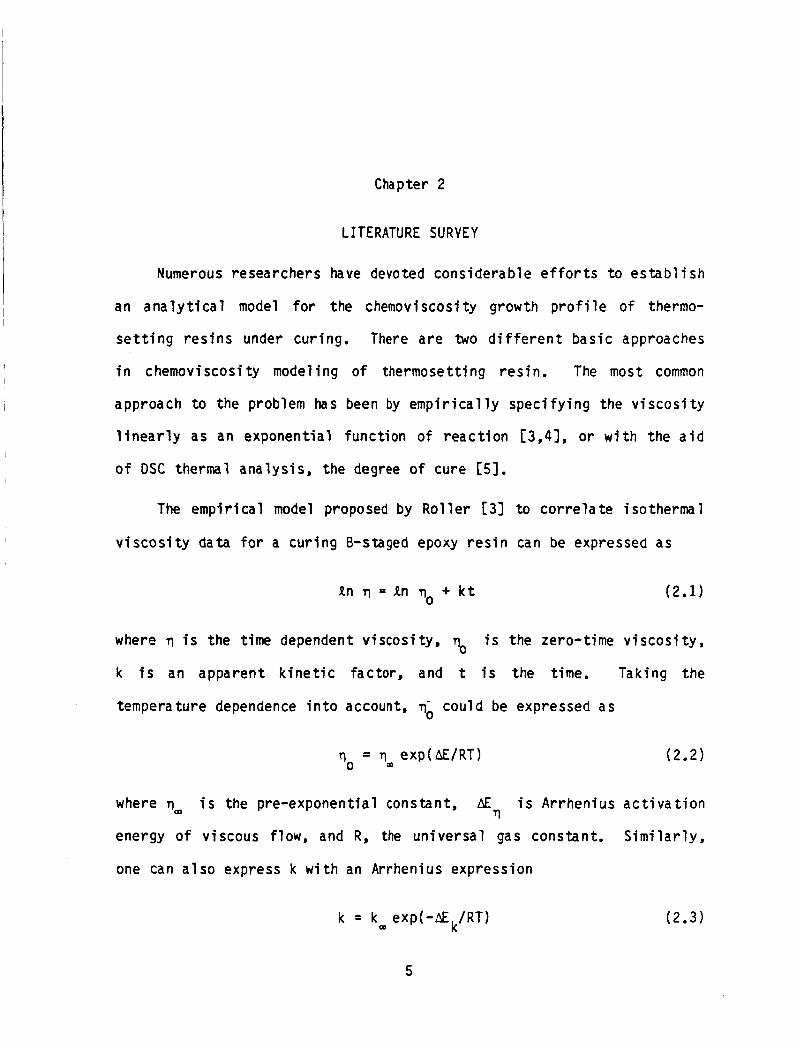
The empirical model proposed by Roller E31 t o correlate isothermal
viscosi ty data for a curing B-staged epoxy resin can be expressed as
A n q = A n qo + k t (2 .1 )
where 7 is the time dependent viscosity, qo i s the zero-time viscosity,
k i s an apparent kinetic factor, and t is the time. Tak ing the
temperature dependence in to account, 11; could be expressed as
where i s the pre-exponential constant, AE is Arrhenius activation
energy of viscous flow, and R, the universal gas constant. Similarly,
one can also express k with an Arrhenius expression
11
k = k m exp(-AEk/RT) (2.3)
3
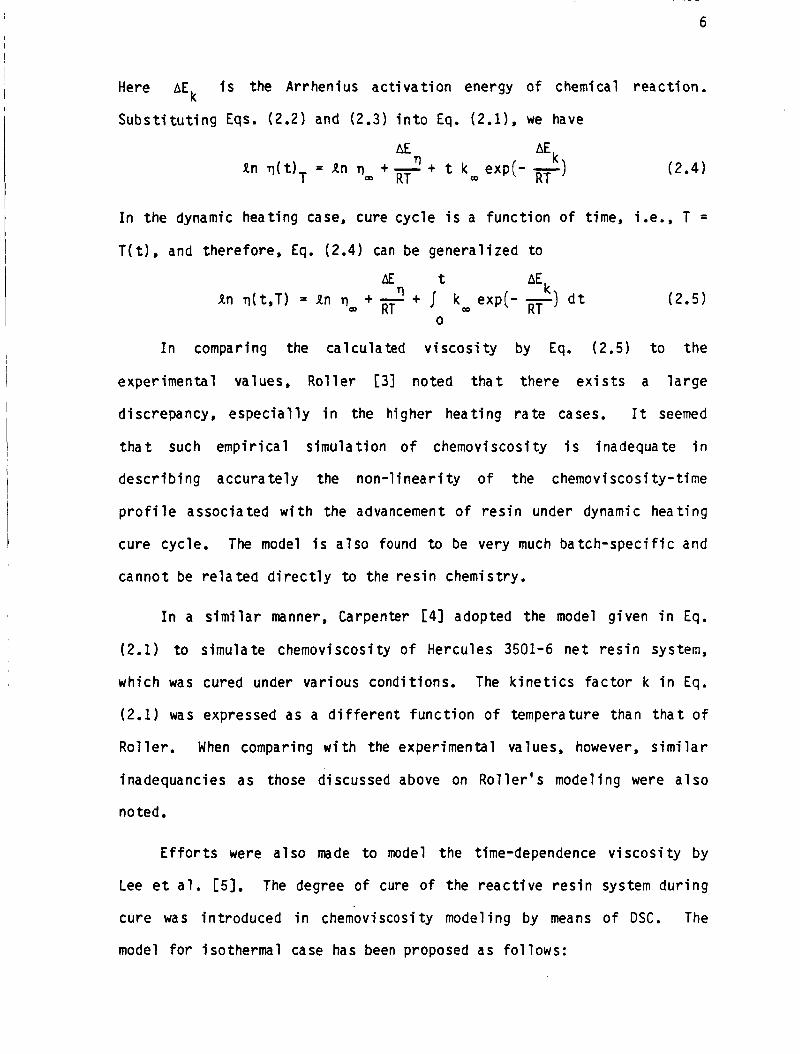
Here AEk i s the Arrhenius a c t i v a t i o n energy o f chemical reac t i on .
S u b s t i t u t i n g Eqs. ( 2 . 2 ) and (2.3) i n t o Eq. (2.11, we have
k AE An q ( t I T = An q + L + t k exp(- -)
= RT m RT (2.4)
I n the dynamic heat ing case, cure cyc le i s a func t i on o f time, i.e., T =
T ( t ) , and therefore, Eq. (2 .4) can be genera l ized t o
(2.5)
I n comparing the ca lcu lated v i s c o s i t y by Eq. (2.5) t o the
exper imental values, R o l l e r C31 noted t h a t there e x i s t s a l a r g e
discrepancy, espec ia l l y i n the higher heat ing r a t e cases. I t seemed
t h a t such empi r i ca l s imu la t ion o f chemoviscosi t y i s inadequate i n
desc r ib ing accura te ly the non- l inear i t y o f the chemoviscosi ty - t ime
p r o f i l e assoc iated w i t h the advancement o f r e s i n under dynamic heat ing
cure cycle. The model i s a l s o found t o be very much ba tch-spec i f i c and
cannot be r e l a t e d d i r e c t l y t o the r e s i n chemistry.
I n a s i m i l a r manner, Carpenter [41 adopted the model given i n Eq.
(2.1) t o s imulate chemoviscosity o f Hercules 3501-6 n e t r e s i n system,
which was cured under var ious condi t ions. The k i n e t i c s f a c t o r k i n Eq.
(2.1) was expressed as a d i f f e r e n t func t ion o f temperature than t h a t o f
Ro l l e r . When comparing w i t h the exper imental values, however, s i m i l a r
inadequancies as those discussed above on R o l l e r ' s modeling were a1 so
noted.
E f f o r t s were a l s o made t o model the time-dependence v i s c o s i t y by
Lee e t a l . [5]. The degree o f cure o f the r e a c t i v e r e s i n system du r ing
cure was in t roduced i n chemoviscosity modeling by means o f DSC. The
model for isothermal case has been proposed as fo l lows:
I
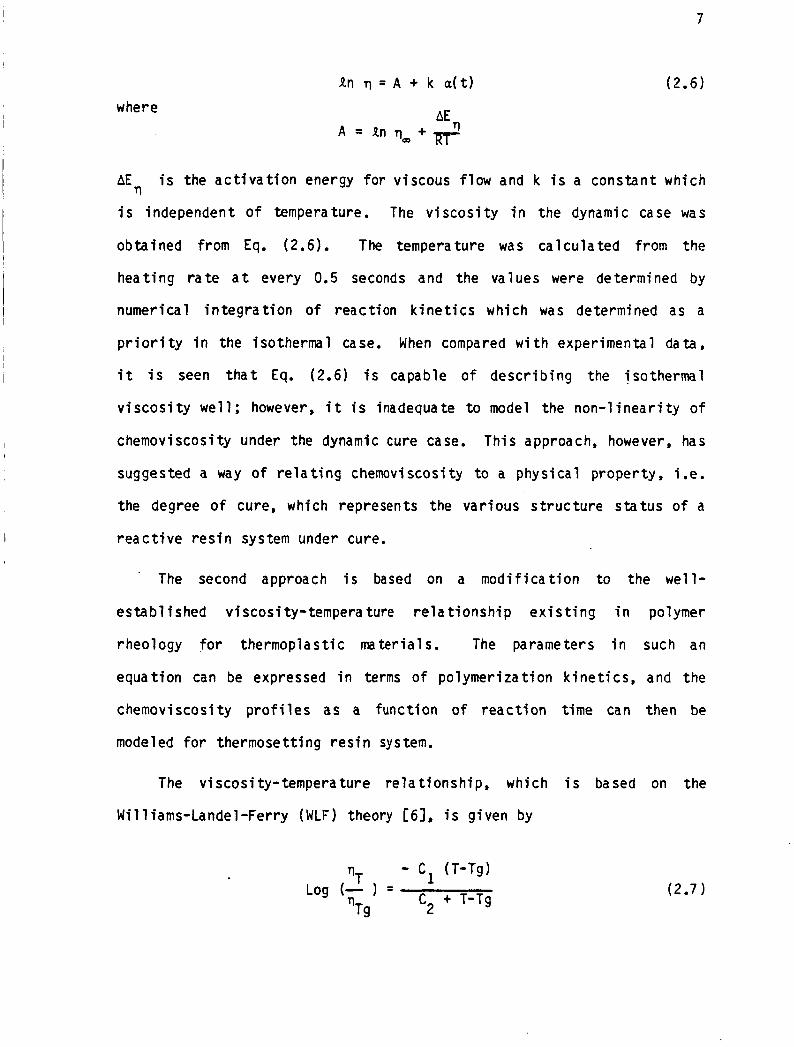
where
AE i s II
tl A = An q m + r
7
(2.6)
he a c t i v a t i o n energy f o r v iscous f low and k i s a constan- whicn
i s independent o f temperature. The v i s c o s i t y i n the dynamic case was
obtained from Eq. (2.6). The temperature was ca l cu la ted from the
heat ing r a t e a t every 0.5 seconds and the values were determined by
numerical i n t e g r a t i o n o f reac t ion k i n e t i c s which was determined as a
p r i o r i t y i n the isothermal case. When compared w i t h experimental data,
i t i s seen t h a t Eq. (2.6) i s capable o f descr ib ing the isothermal
v i s c o s i t y we l l ; however, i t i s inadequate t o model the n o n - l i n e a r i t y o f
chemoviscosity under the dynamic cure case. This approach, however, has
suggested a way o f r e l a t i n g chemoviscosity t o a phys ica l property, i.e.
the degree o f cure, which represents the var ious s t r u c t u r e s ta tus o f a
r e a c t i v e r e s i n system under cure.
. The second approach i s based on a m o d i f i c a t i o n t o the we l l -
es tab l i shed viscosi ty- tempera ture r e l a t i o n s h i p e x i s t i n g i n polymer
rheology f o r thermoplast ic mater ia ls . The parameters i n such an
equat ion can be expressed i n terms of po lymer iza t ion k i n e t i c s , and the
chemoviscosity p r o f i l e s as a func t ion o f r e a c t i o n t ime can then be
mode 1 ed f o r thermose tti ng r e s f n sy s tern.
The v iscos i ty- temperature re la t i onsh ip , which i s based on the
Wil l iams-Landel-Ferry (WLF) theory [6], i s g iven by
8
represents the where C1 and C2 are two material constants, a n d
viscosity a t the glass transition temperature Tg of the given
thermoplastic material. The normal use of the NLF equation f o r
thermoplastic materials requires t h a t Tg be constant while the
temperature T i s varied w i t h i n 100 K above Tg for the specific polymer
under study, and Tg can be replaced by any reference temperature Ts
w i t h i n the experimental range. I t has been extensively documented i n
the 1 i tera ture t h a t tempera ture-dependent viscosity of thermoplastic
materials can be accurately described by the WLF equation w i t h i n 100 K
above i t s glass transition temperature Tg. However, during the curing
of thermosetting resins, the monomers are i n i t i a l l y polymerized and
crosslinks are formed later. This i s a system where T g ( t ) i s chang ing
a n d the curing temperature T i s held constant ( i n an isothermal cure
case, fo r example). The glass t r ans i t i on temperature Tg rises
continuously and may eventually approach the curing temperature. Over
the entire curing cycle, the material structure actually undergoes
cont inuous phase transformation from a low molecular weight liquid t o a
h i g h molecular weight polymeric melt, and eventually transforms t o a
crosslinked network. For a thermosetting resin system under cure, i t i s
%
reasonable to assume t h a t T g ( t ) of the material i s always within 100 K
lower t h a n the cure temperature. The WLF equation should then be
applicable to every instant s t a t e of the resin system under c u r i n g . The
central theme i n modifying the WLF theory t o describe the chemoviscosity
of thermosetting resin i s to take into account the reaction time factor.
The applicability of the modified WLF theory i n chemoviscosity
modeling for thermosetting resin has been studied by Tajima and Crozier
[1,71, Apicella e t al . [8] and Hou C91 among others.
9
Tajima and Crozier C1,71 modeled the chemoviscosity as a f u n c t i o n
o f po lymer iza t ion k i n e t i c s f o r an amine (DDSI-cured epoxy r e s i n by a
mod i f ied WLF equation. The advancement o f r e a c t i o n was determined by
the concent ra t ion of the hardener DDS. The parameters Ts and q(Ts) i n
Eq. (2.7) were al lowed t o vary w i th times, The two mate r ia l parameters
C1 and C2 were assumed t o be independent o f r e a c t i o n time. A f a i r l y
good agreement between ca lcu la ted and exper imental data was observed.
I n h i s i nves t i ga t i on , Hou [91 proposed an a n a l y t i c a l model which
was a l s o based on mod i f i ca t ion o f the WLF theory. Major assumptions
i nvo l ved were t h a t the r a t e of reac t ion i s d i f f us ion c o n t r o l l e d and was
l i n e a r l y i nve rse l y p ropor t i ona l t o the v i s c o s i t y of the medium over the
e n t i r e cure cycle. The modif ied WLF equat ion became a f i r s t order
o rd inary non l inear d i f f e r e n t i a l equation. Numerical so lu t i ons were a l s o
shown t o compare favorably w i t h the exper imental r e s u l t s f o r several
thermoset t ing systems under isothermal and dynamic heat ing cure
cond i t ions . I t was demonstrated 191 t h a t by such mod i f ied WLF equation,
an a n a l y t i c a l model w i t h h igh degree of accuracy f o r the chemoviscosi ty
s imu la t i on f o r any thermosett ing r e s i n system under var ious cure cyc les
can be establ ished. The physical s ign i f i cances o f the ma te r ia l
parameters se lected f o r the model were, however, d i f f i c u l t t o e x t r a c t
f o r the p a r t i c u l a r r e s i n system under i nves t i ga t i on .
A new approach i n chemoviscosity modeling used i n the present study
w i l l be formulated and discussed l a t e r i n Chap. 5.
Chapter 3
EXPERIMENTAL METHODS
3.1 Thermal Analys is
3.1.1 Sample Preparat ion
Sample ranging from 3 to 7 mg i n weight was encapsulated i n a
standard aluminum sample pan. To prevent the sample holder be ing
contaminated by the s p l i t t e d sample, a small ho le was made on the center
o f the l i d . Tweezers were used throughout a l l the t ime f o r sample
handling, load ing and s tor ing. The weight o f the sample was measured
be fore and a f t e r the tes t . The weight losses du r ing the t e s t s were
found t o be n e g l i g i b l e . The prepared samples were s to red i n a
r e f r i g e r a t o r and removed j u s t pr ior t o the measurement.
3.1.2 Apparatus
Perkin-Elmer d i f f e r e n t i a 1 scannf ng ca 1 orime t e r (Model DSC-2 1
coupled t o a h igh q u a l i t y po ten t i one t r i c recorder (Model 3314, a product
o f SOLTEC CORP.) was used i n thermal ana lys is .
The DSC i s a sophis t icated ins t rument f o r the measurement and
c h a r a c t e r i z a t i o n o f the thermal p roper t ies o f mater ia ls . I t cons is t s o f
an analyzer desk, d r a f t sh ie ld , sample holder cover k i t , concealed
c o n t r o l panel cover, vacuum pickup device, etc.
10
11
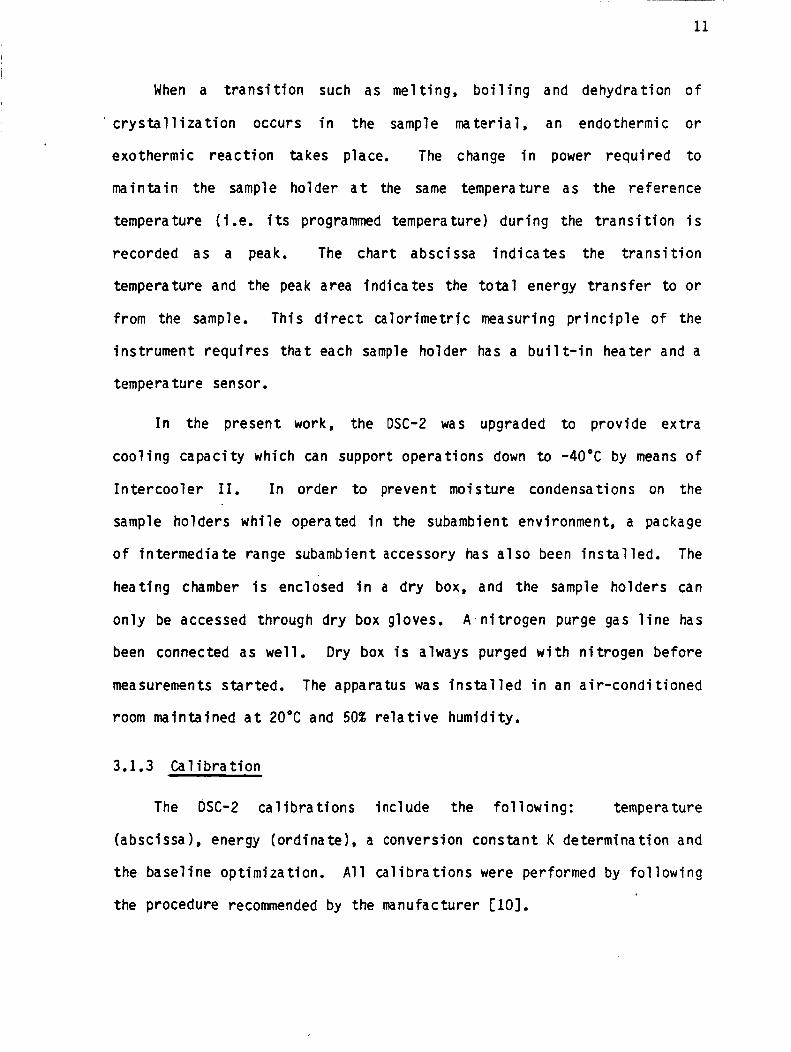
When a transition such as melting, boiling and dehydration o f
crystallization occurs i n the sample material, an endothermic or
exothermic reaction takes place. The change in power required t o
maintain the sample holder a t the same temperature a s the reference
temperature ( i .e. i t s programmed temperature) d u r i n g the transition i s
recorded a s a peak. The chart abscissa indicates the transition
temperature and the peak area indicates the total energy transfer t o or
from the sample. T h i s direct calorimetric measuring principle of the
instrument requires tha t each sample holder has a built-in heater and a
temperature sensor.
In the present work, the DSC-2 was upgraded t o provide extra
cooling capac i ty w h i c h can support operations down t o -40°C by means of
Intercooler 11. In order to prevent moisture condensations on the
sample holders while operated i n the subambient environment, a package
of intermediate range subambient accessory has a1 so been instal led. The
heating chamber i s enclosed i n a d ry box, and the sample holders can
only be accessed through dry box gloves. A,nitrogen purge gas line has
been connected a s well. Dry box is always purged w i t h nitrogen before
measurements started. The apparatus was installed i n an air-conditioned
room maintained a t 20°C and 50% relative humidity.
3.1.3 Calibration
The DSC-2 calibrations include the following: temperature
(abscissa 1, energy (ordinate), a conversion constant K determination and
the baseline opt imizat ion. All calibrations were performed by fo l lowing
the procedure recommended by the manufacturer [lo].
12
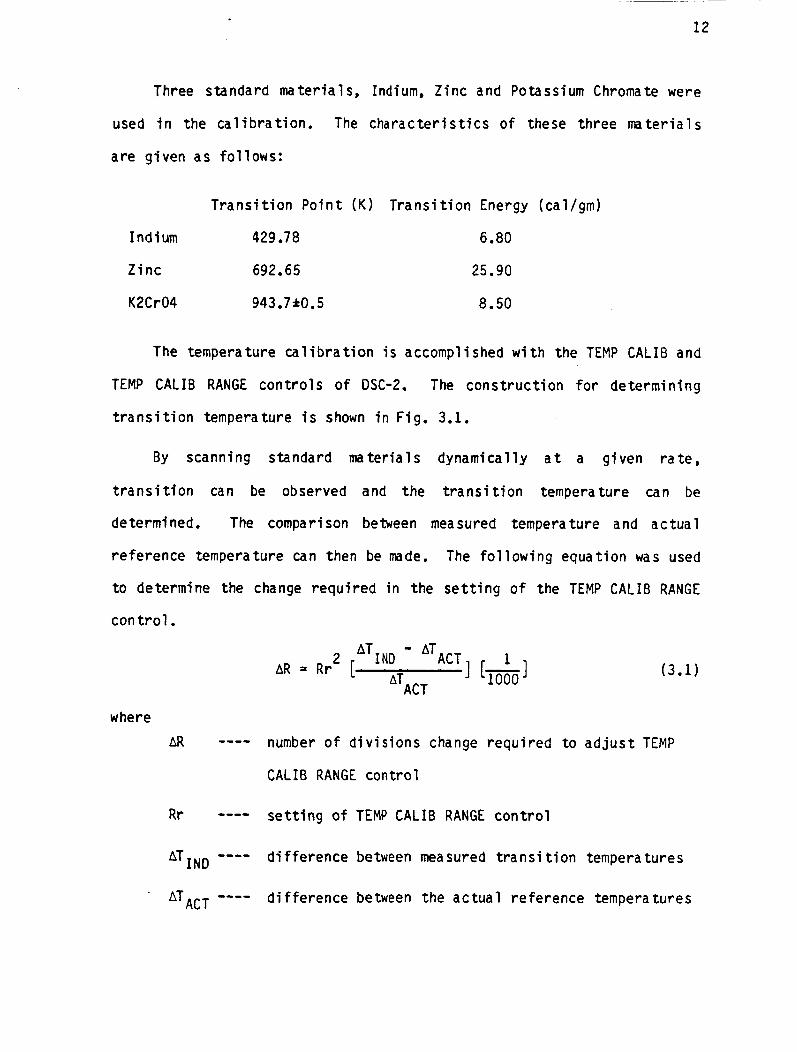
Three standard mater ia ls , Indium, Z inc and Potassium Chromate were
used i n the c a l i b r a t i o n . The c h a r a c t e r i s t i c s o f these th ree m a t e r i a l s
a re g iven a s fo l l ows :
T r a n s i t i o n P o i n t (K) T r a n s i t i o n Energy (cal/gm)
Indium 429.78 6.80
Z i n c 692.65 25.90
K2Cr04 943.7*0.5 8.50
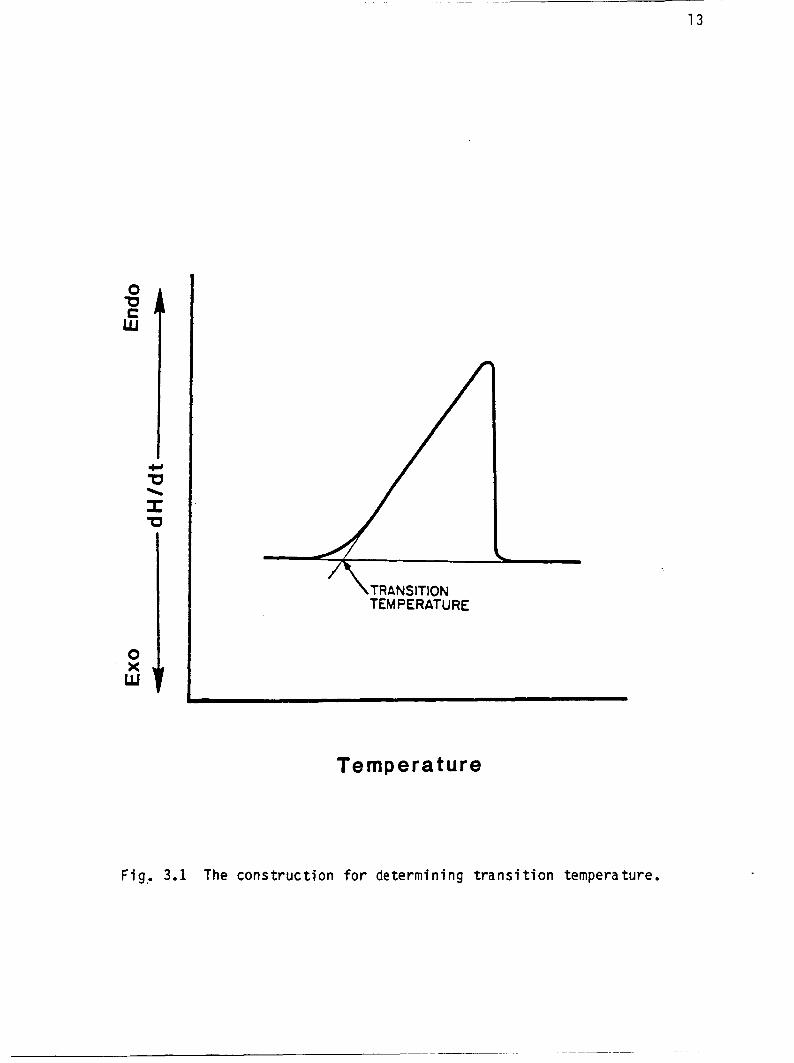
The temperature c a l i b r a t i o n i s accomplished w i t h the TEMP CALIB and
TEMP CALIB RANGE c o n t r o l s o f DSC-2. The c o n s t r u c t i o n f o r de termin ing
t r a n s i t i o n temperature i s shown i n Fig. 3.1.
By scanning standard ma te r ia l s dynamical ly a t a g iven r a t e ,
t r a n s i t i o n can be observed and the t r a n s i t i o n temperature can be
and a c t u a l
on was used
CALIB RANGE
determined . The comparison between measured temperature
re fe rence temperature can then be made. The f o l l o w
t o determine the change r e q u i r e d i n the s e t t i n g of
c o n t r o l . -
[ 1 - 2 ''1 NO 1000
AR = R r [ AT^^^
ng equat
the TEMP
(3.1)
where
AR ---- number o f d i v i s i o n s change r e q u i r e d t o a d j u s t TEMP
CALIB RANGE con t ro l
R r ---- s e t t i n g o f TEMP CALIB RANGE c o n t r o l
---- d i f f e r e n c e between measured t r a n s i t i o n tempera tu res AT IN0
ATACT ---- d i f f e r e n c e between the a c t u a l re fe rence tempera tu res
ii w 0 x 1
13
\TRANSITION TEMPERATURE
Temperature
Fig,. 3.1 The c o n s t r u c t i o n fo r determining t r a n s i t i o n temperature.
14
By means of TEMP CALIB RANGE control adjustment, the difference
between AT^^^ and ATACT can be minimized. The c a l i b r a t i o n on
) i s less t h a n f 0.5 temperature scale i s completed when
K. The observed transition temperature for a l l the standards should be
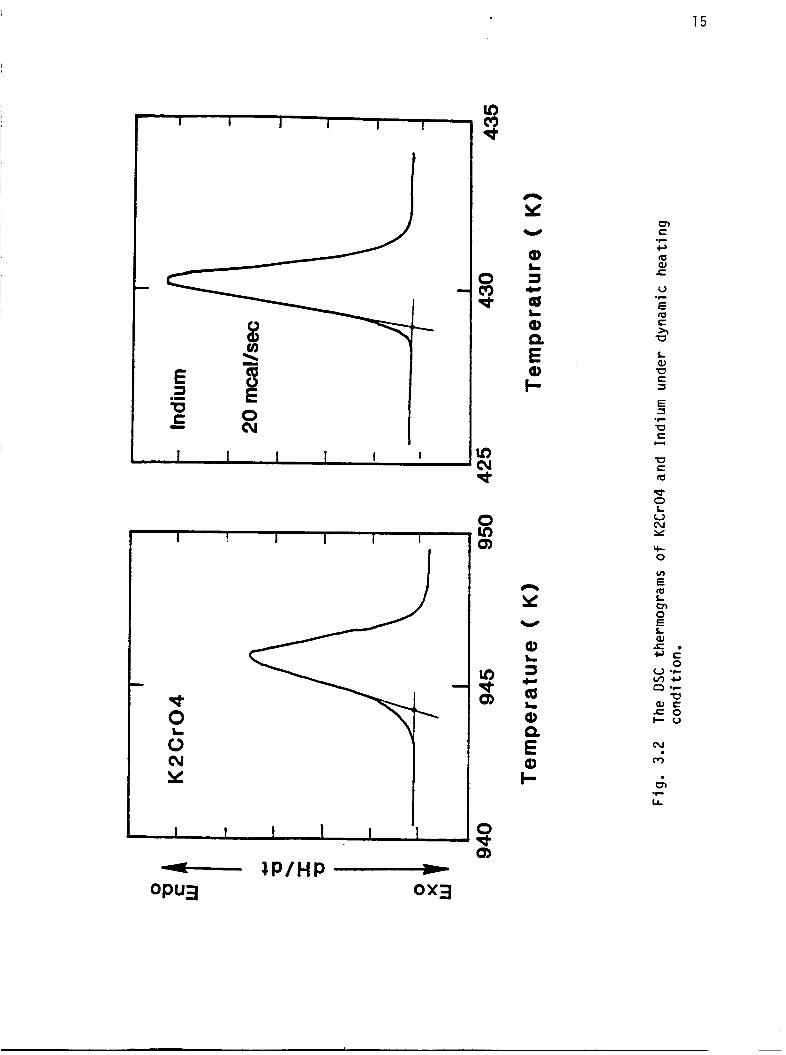
w i t h i n 2 K of their a c t u a l values. A typical thermogram o f K2Cr04 a n d
Indium i s shown i n F i g . 3.2. In the present work, the deviation of
measured temperature and actual temperature was within f 1 K , w h i c h i s
quite sa t i s f ac to ry for our measurement.
AT^^^ AT^^^ -
The energy calibration involves the determination of calibration
constant K and i s accomplished w i t h the AW BALANCE control. In
practice, the measurement of energy w i t h the Model DSC-2 will
necessarily involve considerations o f an instrument calibration
constant, the recorder chart speed, the sensitivity used, and the u n i t
employed for area measurement, etc. To measure the total energy
associated w i t h a transition or reaction, i t i s necessary t o integrate
over the area under the peak w i t h respect to time
A H = , f x d t dH (3.2)
The area of a peak i s directly proportional t o the energy of the change
per u n i t weight, AH, in calories per gram, the sample w e i g h t , W a n d
the cha r t speed S. I t i s also inversely propor t iona l t o the instrument
RANGE setting, Rr. Therefore, we have
( 3 . 3 )
where K i s a proportionality constant and R ' i s setting RANGE o f DSC.
From the calibration w i t h a standard material like Indium or Zinc
through the adjustment of the AN ca l ib ra t ion control , one can o b t a i n
I I I I I I
I I I 1 I I
* 0 0 cv Y
L
I ! I I I I
I 1 1 1 I I 0
PI c
Q aJ t
u .C
E tu C h -0
L a, u E 3
u C Q
d 0 L 0 cu Y
cc 0
'CI a J c J = o c u
cu m . .
PI
LL .r
16
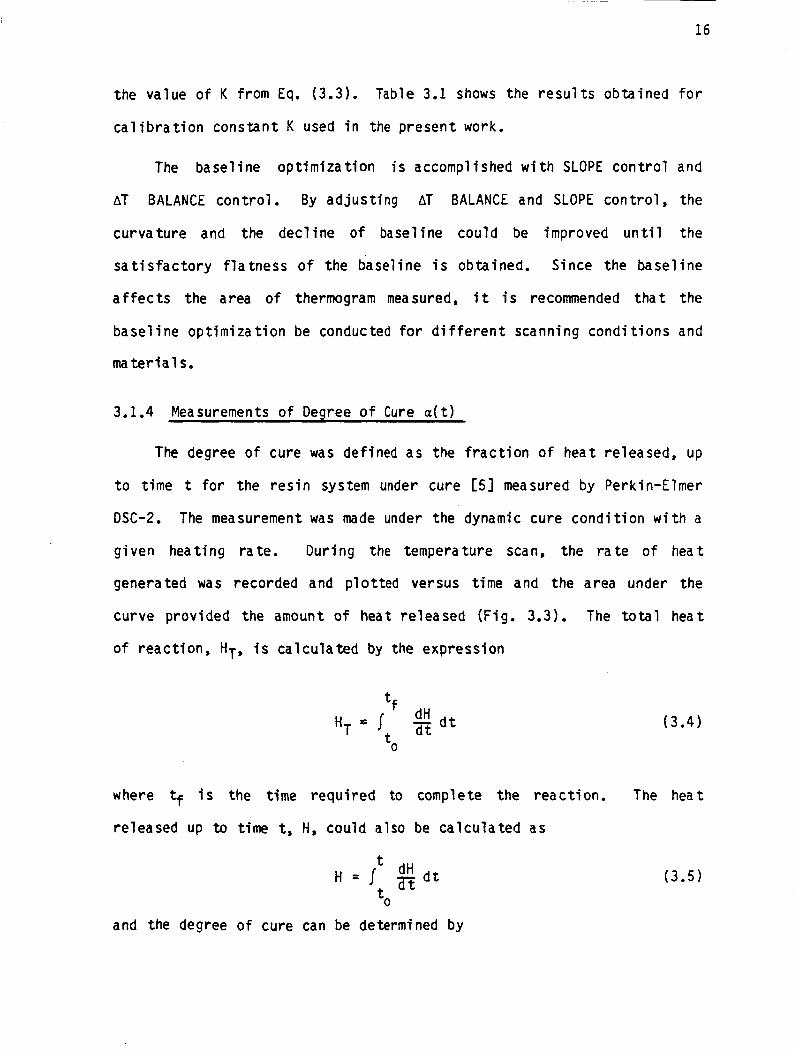
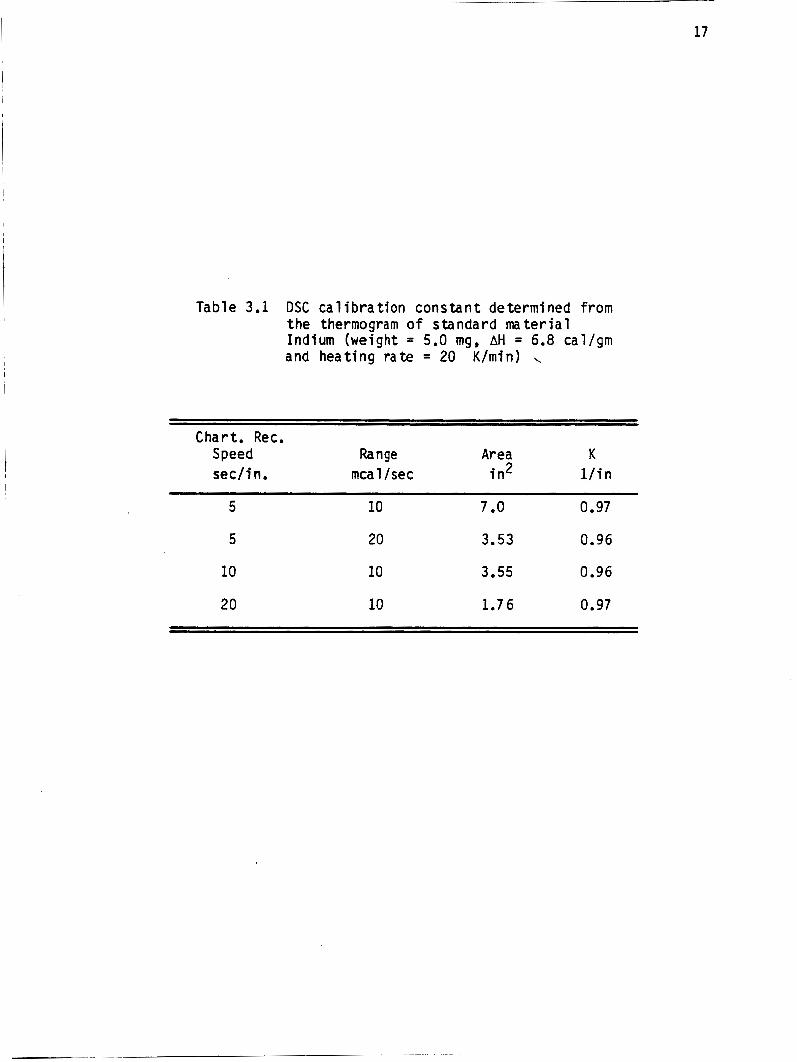
the va lue o f K from Eq. (3.3). Table 3.1 shows the r e s u l t s obta ined f o r
c a l i b r a t i o n cons tan t K used i n the present work.
The base l ine o p t i m i z a t i o n i s accomplished w i t h SLOPE c o n t r o l and
AT BALANCE con t ro l . By ad jus t i ng AT BALANCE and SLOPE c o n t r o l , the
cu rva tu re and the dec l i ne of basel ine cou ld be improved u n t i l the
s a t i s f a c t o r y f l a t n e s s o f the basel ine i s obtained. Since the base l i ne
a f f e c t s the area o f thermogram measured, i t i s recommended t h a t the
base l i ne o p t i m i z a t i o n be conducted f o r d i f f e r e n t scanning c o n d i t i o n s and
ma te r ia l s .
3.1.4 Measurements o f Degree o f Cure a ( t )
The degree o f cure was defined as the f r a c t i o n of heat released, up
t o t ime t f o r the r e s i n system under cure C5l measured by Perk in -= l mer
DSC-2. The measurement was made under the dynamic cure c o n d i t i o n w i t h a
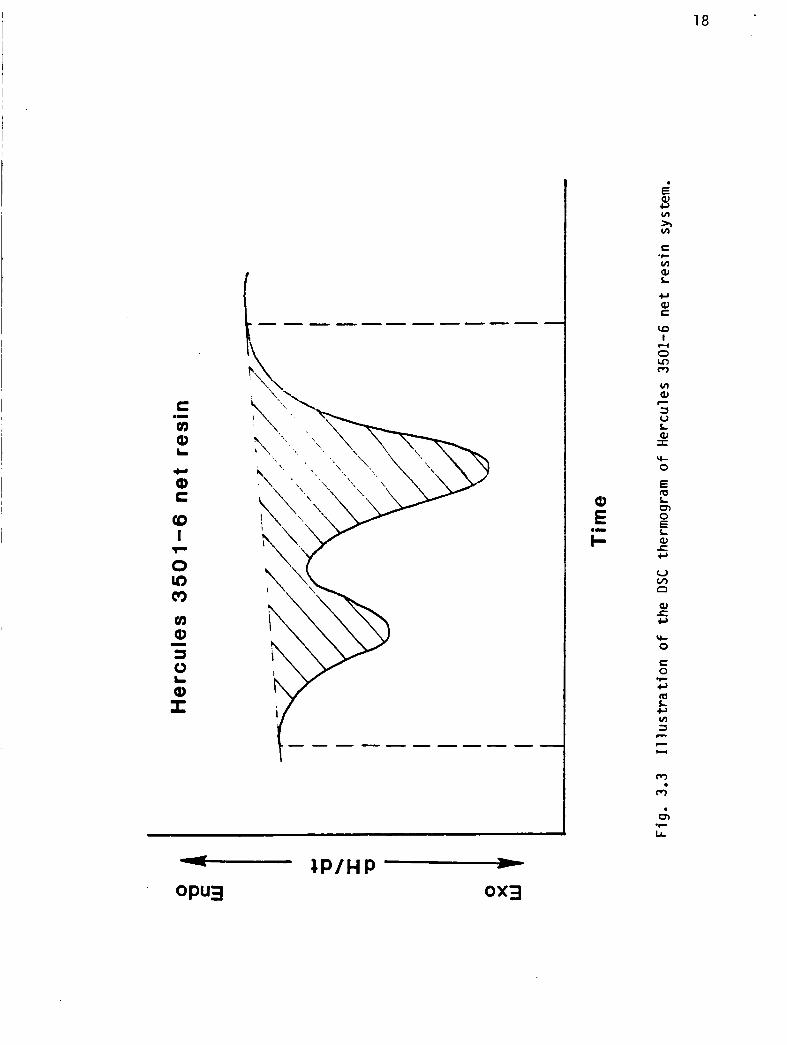
g iven heat ing ra te . Dur ing the temperature scan, the r a t e o f heat
generated was recorded and p l o t t e d versus t ime and the area under the
curve prov ided the amount o f heat re leased (Fig. 3.3). The t o t a l heat
of reac t ion , HT, i s c a l c u l a t e d by the express ion
(3.4) 0
L
where tf i s the t ime r e q u i r e d t o complete the reac t i on . The heat
re leased up t o t ime t, H, cou ld also be c a l c u l a t e d as
+
H = IL $ d t +
(3.5)
and the degree o f cure can be determined by
17
Table 3.1 DSC c a l i b r a t i o n constant determined from the thermogram o f standard m a t e r i a l Indium (weight = 5.0 mg, AH = 6.8 cal/gm and heat ing rate = 20 K/min)
Chart . Rec. Speed Range sec / i n. mca 1 /sec
Area i n2
K l / i n
5 10 7 .O 0.97
5 20 3.53 0.96
10
20
10
10
3.55
1.76
0.96
0.97
18
c cn Q)
.- L.
CI
Q) c
c v) aJ L c, aJ E
.r
4 0 v) m v) aJ 3 V L aJ I u- 0
E m L rn 0 E L aJ r c,
?
% 0 c 0 c, la L c, v) 3
*r
c c Y
19
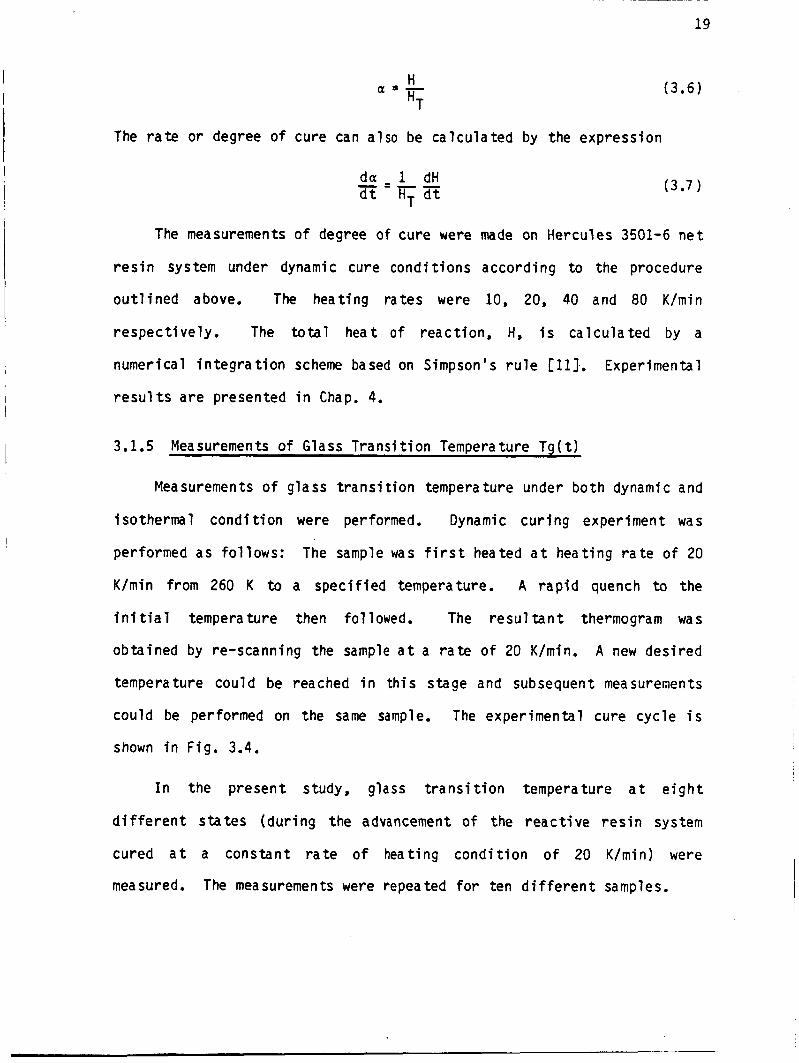
H a = - HT
(3.6)
The rate or degree of cure can also be calculated by the expression
d a 1 dH - = - - d t HT d t
The measurements of degree o f cure were
resin system under dynamic cure c o n d i t i o n s
outlined above. The heating rates were
(3 .7 1
made on Hercules 3501-6 net
according t o the procedure
10, 20, 40 and 80 K / m i n
respectively. The total heat of reaction, H , is calculated by a
numerical integra tion scheme based on Simpson's rule [ll]. Experimental
results are presented i n Chap. 4.
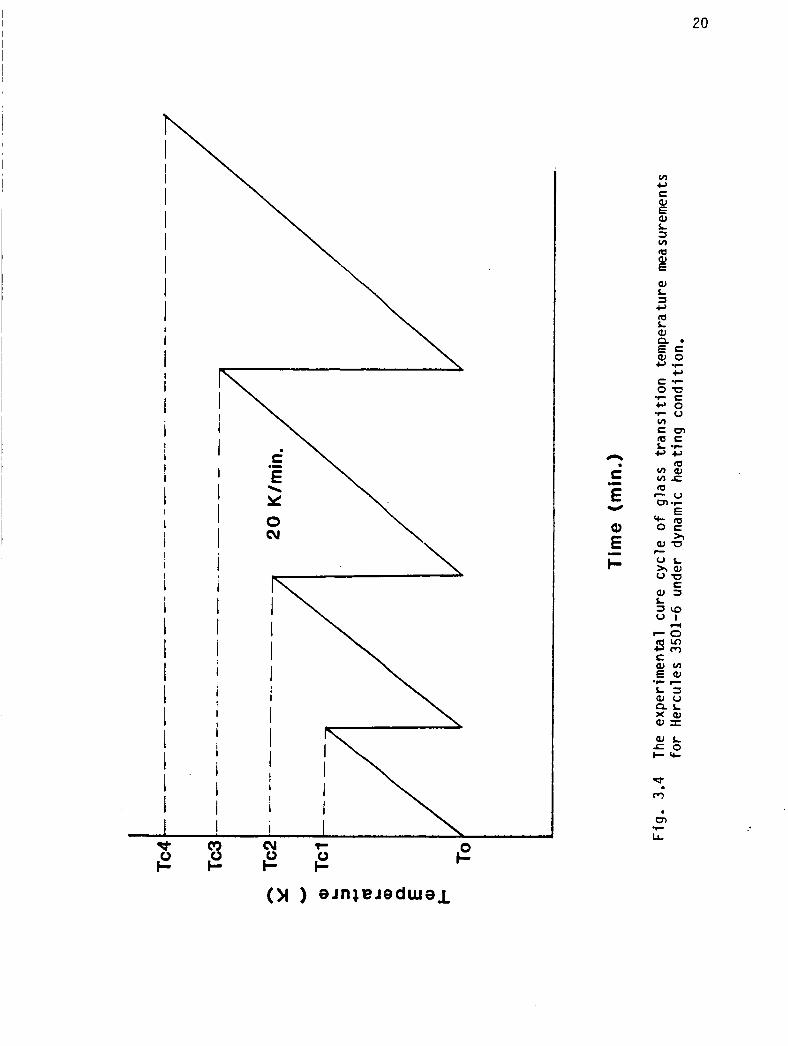
3.1.5 Measurements o f Glass Transition Temperature Tg( t)
Mea suremen ts o f glass transi t ion tempera ture under b o t h dynamic and
isothermal cond i t ion were performed. Dynamic curing experiment was
performed as follows: The sample was f i r s t heated a t heating rate of 20
K / m i n from 260 K to a specified temperature. A r a p i d quench to the
in i t ia l temperature then followed. The resultant thermogram was
obtained by re-scanning the sample a t a rate of 20 K / m i n . A new desired
temperature could be reached i n this stage and subsequent measurements
could be performed on the same sample. The experimental cure cycle i s
shown i n F ig . 3.4.
In the present s tudy , glass transition temperature a t eight
different states (during the advancement of the reactive resin system
cured a t a constant rate of heating cond i t ion of 20 K/min) were
measured. The measurements were repeated for ten different samples.
20
I
I I I I I 1 I I
1 I I I 1
I
I 1
I I
I
I
! I I
I I 1 I I I I 1 1 1 1 I
i i i i I i I I
i 1
I
i 1 1 1
i I
v) c, I= aJ E aJ L 7 v)
m aJ E
aJ L 3 c, m I Q, a . E c a 0 c, *r
U
2 1
I n the isothermal scanning measurement, the experiment was
performed as fo l lows: The sample was f i r s t heated a t a r a t e o f 320
K/min from 260 K to a spec i f i ed cu r ing temperature. A t the complet ion
o f va r ious ho ld ing t imes a t the temperature, a r a p i d quench t o i n i t i a l
temperature f o l l owed. Subsequent thermograms were ob ta ined by re -
scanning the quenched samples a t a r a t e o f 20 K/min from 260 K to a
temperature above i t s Tg. A number o f measurements o f g lass t r a n s i t i o n
temperature under i so therma 1 scanning condi t i o n wa s conducted. The
se lec ted c u r i n g temperatures and the l e n g t h o f c u r i n g t imes were
determined accord ing t o the reac t i on k i n e t i c s repo r ted by Lee e t a l .
CSl.
3.2 Rheological Measurements
3.2.1 Sample Prepara t ion
A1 1 samples were precondi t ioned a t room temperature by press ing
about 30 gm o f r e s i n between two pieces of non-porous Te f lon c l o t h (CHR-
6TB) t o produce a r e s i n wafer w i th a th ickness o f 1.25 mm. The wafers
were s to red i n a vacuum oven f o r a couple of hours a t a temperature o f
abou t 340 K u n t i l the v o l a t i l e bubbles were no longer ev ident . The
sample p recond i t i on ing was used t o remove mois tu re and any o t h e r
v o l a t i l e s t h a t m igh t c rea te e r r a t i c v a r i a t i o n s i n rheology. A f t e r
degasing, the sample was s to red i n the r e f r i g e r a t o r and removed j u s t
p r i o r t o the experimental measurement. A d i s k sample was prepared by a
c i r c u l a r puncher w i t h a diameter o f 2.50 cm.
22
3.2.2 Apparatus
The Rheometrics System Four [12] was used t o measure the
r h e o l o g i c a l p r o p e r t i e s of the ma te r ia l
The Rheometrics System Four i s a f u l l y automated l a b o r a t o r y
i ns t rumen t f o r c h a r a c t e r i z i n g the r h e o l o g i c a l p r o p e r t i e s o f a broad
range o f m a t e r i a l s i n c l u d i n g so l ids, f l u i d s and mel ts . I t i s a modular
designed system o f f ou r independent servos l i n k e d t o a common computer
system f o r c o n t r o l and data acqu is i t i ons . These f o u r servo motors are:
Dynamic, L inear , F l u i d s and Steady which a r e se lec ted f o r optimum
response i n t h e i r respec t i ve modes a l l o w i n g a broad range o f t e s t
geometrics and deforma t i o n h i s to r i es .
The dynamic servo motor and a p a r a l l e l p l a t e t e s t geometry a r e
se lec ted i n the present study t o measure chemoviscosity of the r e a c t i o n
epoxy r e s i n system. Sample temperature i s c o n t r o l l e d w i t h a convected
gas environmental chamber. The torque and normal f o rce generated i n
response t o the imposed motion i s measured by the transducer. The
computer c a l c u l a t e s s t resses from the torque and normal force
mea suremen t s and combines these Val ues w i t h measured sample deforma t i o n
t o c a l c u l a t e values of the se lected r h e o l o g i c a l p roper t i es . The
computer and associated e l e c t r o n i c s a l s o p rov ide p r e c i s i o n c o n t r o l and
r a p i d data a n a l y s i s w i t h r e s u l t s conven ien t ly p r i n t e d o u t i n g raph ica l
and t a b u l a r forms.
I n measuring chemoviscosity of Hercu les 3501-6 epoxy res in , a t ime
sweep mode o r cure mode were se lected r e s p e c t i v e l y i n i so thermal o r
dynamic cure cond i t ion .
23
3.2.3 Calibration
The cal ibrat ion of Rheometrics includes: transducer normal and
torque cal ibrat ion, temperature calibration and phase cal ibrat ion.
Transducer calibration must be performed whenever a transducer i s
changed. Periodic calibration checks should be performed to ensure the
accuracy of test resu l t s . Calibration i s accomplished through adjust-
ment of normal cal ibrat ion control and torque control by comparing
measured data w i t h standard weight.
The phase calibration i s accomplished to compensate for phase s h i f t
i n the electronics through the adjustment of appropriate potentiometer.
Calibration was performed w i t h the dynamic motor i n TORSION RECT u s i n g
an e l a s t i c material such a s steel which possesses a phase angle of zero
degrees and a low viscosity newtonian f l u i d w h i c h possesses a ' phase
angle o f -90 degrees. Calibration i n TORSION RECT or BENDING w i t h a
materia1 such a s s tee l is the preferred method a s the phase angle of
s tee l is not frequency or s t ra in dependent. For newtonian f l u i d s and
e l a s t i c samples, the tolerance i s -0.4 and -0.25 degrees respectively.
3.2.4 Mea suremen t of Chemovi scosi t y
The chemoviscosity data under isothermal condition has been
The selected temperatures were 360, 375, 385, measured previously [13].
399, 410, 425 and 435 K.
The measurement of chemoviscosity i n a dynamic case was conducted
i n present study. Dur ing the measurement, the sample was confined to
the gap between two parallel plates mounted i n the Rheometer. The top
plate was motor driven about i t s axis while the bottom plate was mounted
24
on a torque transducer for force measurement. The t y p i c a l gap between
the parallel plates was 1.2 m. The plates and sample were enclosed i n
a heating chamber where temperature control was provided. Selection of
the strain value was t o assure t h a t the measurements were performed
w i t h i n the material's linear viscoelastic response range.
I t i s well known t h a t the viscoelastic properties of polymeric
materials respond differently t o different frequencies, and selection of
the frequency value was made t o assure t h a t the complex viscosities
measured were w i t h i n the Newtonian region C121. The cure mode of the
Rheometer was used during testing w h i c h automa t i c a l l y programmed
different temperature profiles as the epoxy was cured.
The sample was f i r s t kept a t 300 K for a b o u t 5 minutes before
measurement started. Experimental measurements were performed under
different rates of heating condi t ions.
Chapter 4
EXPERIMENTAL RESULTS
4.1 M a t e r i a l
The m a t e r i a l used i n the study i s Hercules 3501-6 n e t epoxy
res in . Th is thermoset t ing system was se lec ted because o f i t s wide use
i n aerospace indus t r y . The mater ia l rece ived from the manufacturer was
used w i t h o u t f u r t h e r treatment, and was kep t i n the dark and c o l d
c o n d i t i o n s a t around -5'C.
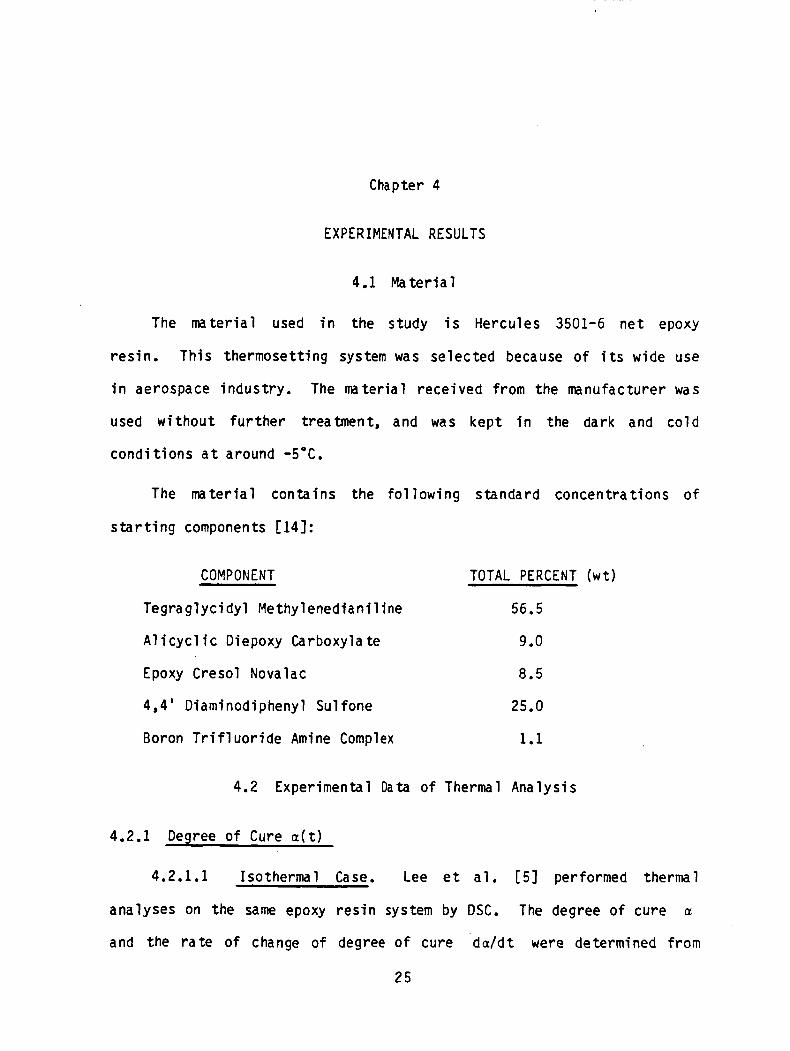
The m a t e r i a l con ta ins the f o l l o w i n g standard concent ra t ions o f
s t a r t i n g components C141:
COMPONENT TOTAL PERCENT (wt )
Tegrag lyc idy l Methy lened ian i l ine 56.5
9.0 A 1 i c y c l i c Diepoxy Carboxylate
Epoxy Cresol Novalac
4 ,4 ' Diaminodiphenyl Sulfone
Boron T r i f l u o r i d e Amine Complex
0.5
25.0
1.1
4.2 Experimental D a t a o f Thermal Ana lys is
4.2.1 Degree o f Cure a ( t )
4.2.1.1 Isothermal Case. Lee e t a l . [SI performed thermal
analyses on the same epoxy r e s i n system by DSC. The degree o f cure 01
and the r a t e o f change o f degree of cure d a / d t were determined f rom
25
26
the results of the isothermal scanning experiments. E i g h t different
temperatures were selected, and the results are reproduced i n F i g .
4.1. I t is noted from the figure t h a t b o t h higher values of the degree
of cure a n d rate o f change of degree of cure are decreasing functions of
cure time t, and eventually level off a t a low value (< 0.1) when a h i g h
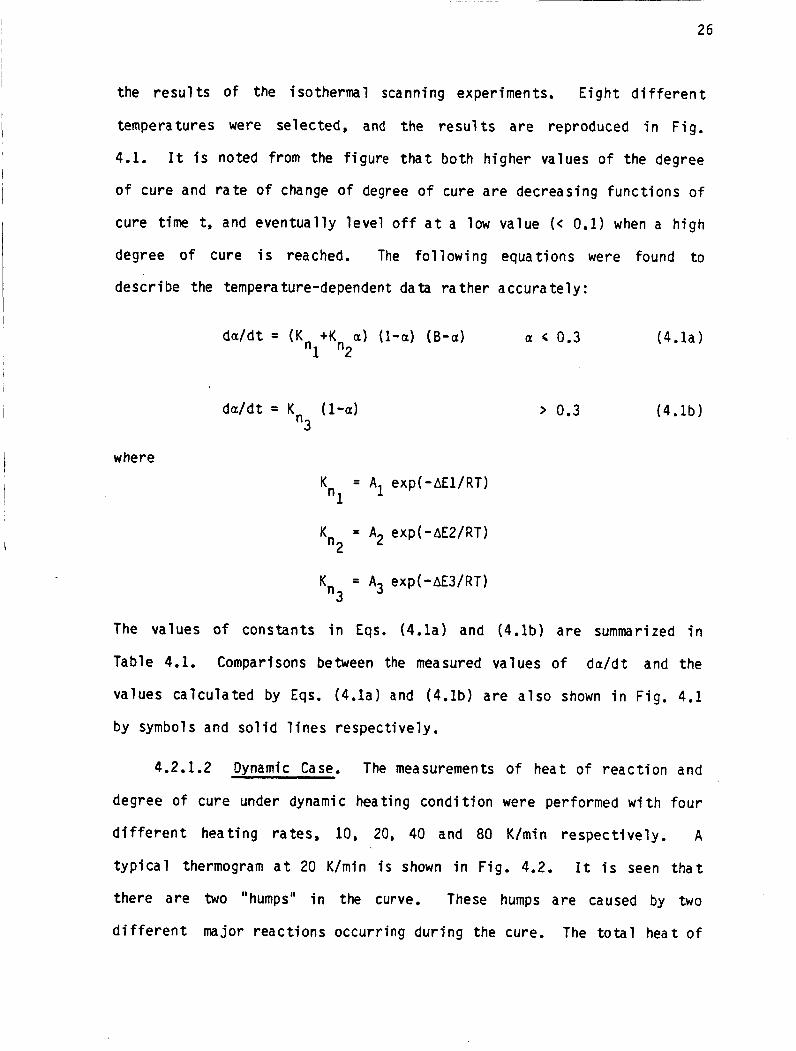
degree o f cure i s reached. The fol lowing equations were found t o
describe the tempera ture-dependent data rather accurately :
where
+ K a) (1-a) (B-a) da/dt = (Knl
d d d t = K ( I -a) "3
K = A1 exp(-AEl/RT)
= A2 exp(-AE2/RT) Kn2
a 0.3
> 0.3
K = A j exp(-AE3/RT) "3
The values o f constants i n Eqs. (4 . la ) and ( 4 . l b ) are summarized i n
Table 4.1. Comparisons between the measured values of d a / d t and the
values calculated by Eqs. ( 4 . l a ) and ( 4 . l b ) are also shown i n F i g . 4.1
by symbols a n d solid lines respectively.
4.2.1.2 Dynamic Case. The measurements o f heat o f reaction and
degree of cure under dynamic hea t ing condition were performed w i t h four
different heating rates, 10, 20, 40 and 80 K/min respectively. A
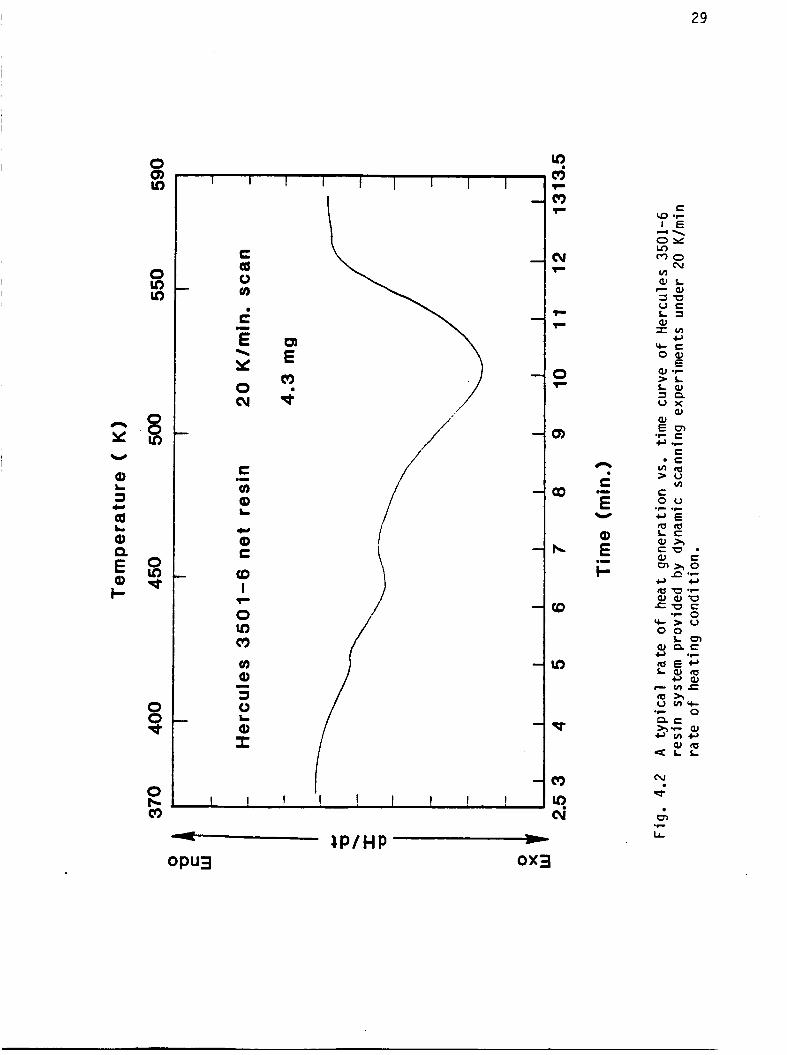
t yp ica l thermogram a t 20 K/min i s shown i n F i g . 4.2. I t is seen t h a t
there are two "humps" i n the curve. These humps are caused by two
different major reactions occurring d u r i n g the cure. The total hea t of
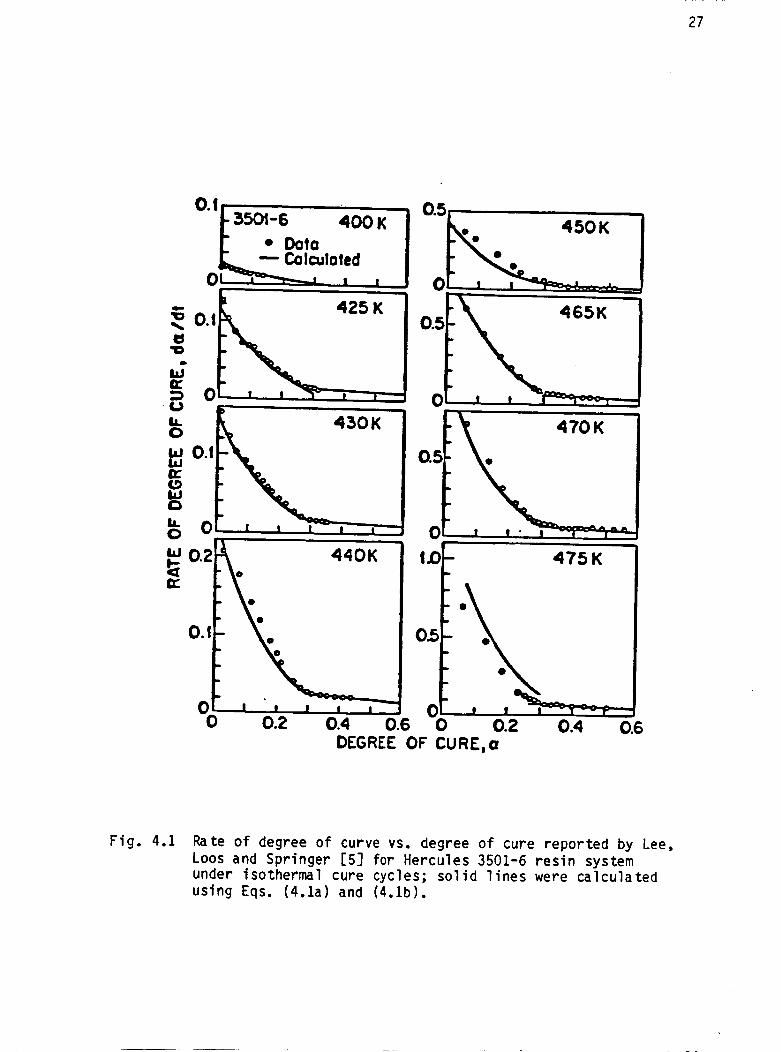
F i g . 4.1 Rate o f degree o f curve vs. degree o f cure repor ted by Lee, Loos and Springer [SI for Hercules 3501-6 r e s i n system under isothermal cure cycles; sol i d l i n e s were c a l c u l a t e d using Eqs. ( 4 . l a ) and ( 4 . l b ) .
28
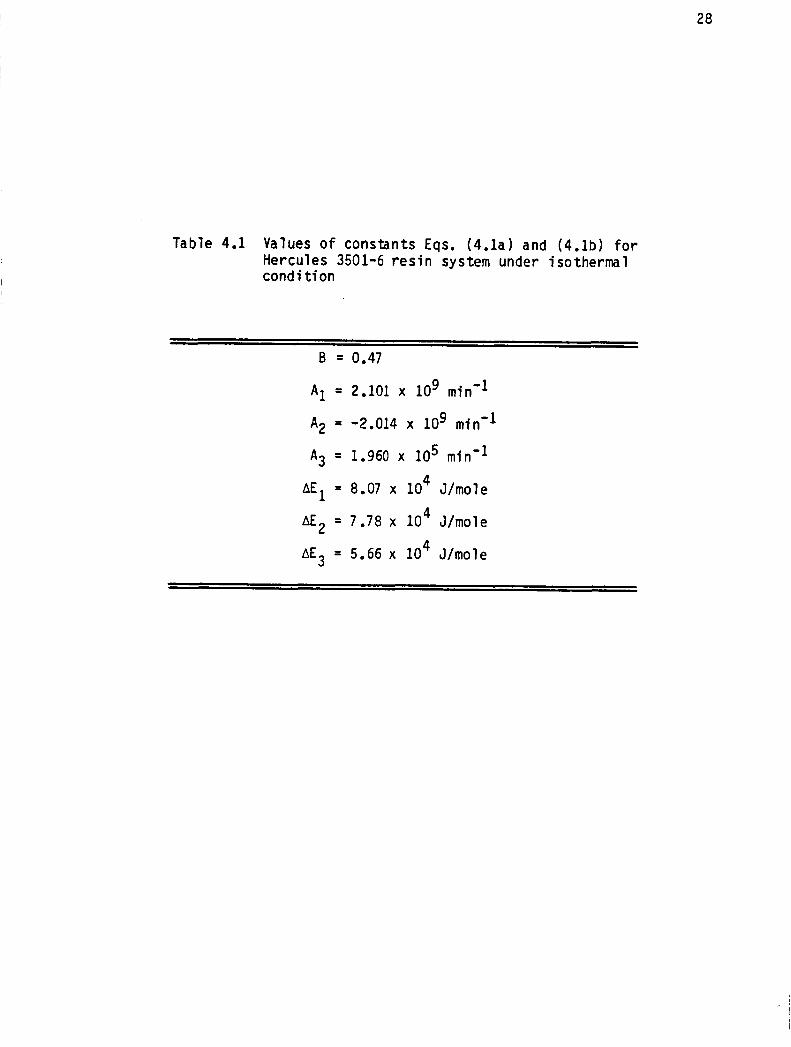
Table 4.1 Values o f constants Eqs. ( 4 . l a ) and ( 4 . l b ) for Hercules 3501-6 resin system under isothermal condition
B = 0.47
A~ = 2.101 x lo9 min-1
A2 = -2.014 x lo9 min'l
A3 = 1.960 x lo5 min'l AE1 = 8.07 x 10 4 J/mole
AE2 = 7.78 x 10 4 J/mole
AE3 = 5.66 x 10 4 J/mole
29
1 I I I I I I 1 I
c Q 0 u)
c H
E Y 0 cv
\
c u) Q)
..I
L
CI al c CD
I
0 v) m u) Q)
J 0 Q) I
r
- L
I
I I I 1 I 1 1 I -
v) d
cv r
0 F
0)
n . I L
CD *- E ~
Y
k g .- I-
v)
a a E m
*- E c, .C
(v
d .
30
r e a c t i o n H was c a l c u l a t e d by numerical i n t e g r a t i o n accord ing t o the
Simpson's r u l e . The a l g o r i t h m was programmed i n FORTRAN and was r u n by
a VAX computer system. Program codings a r e i nc luded i n Appendix B f o r
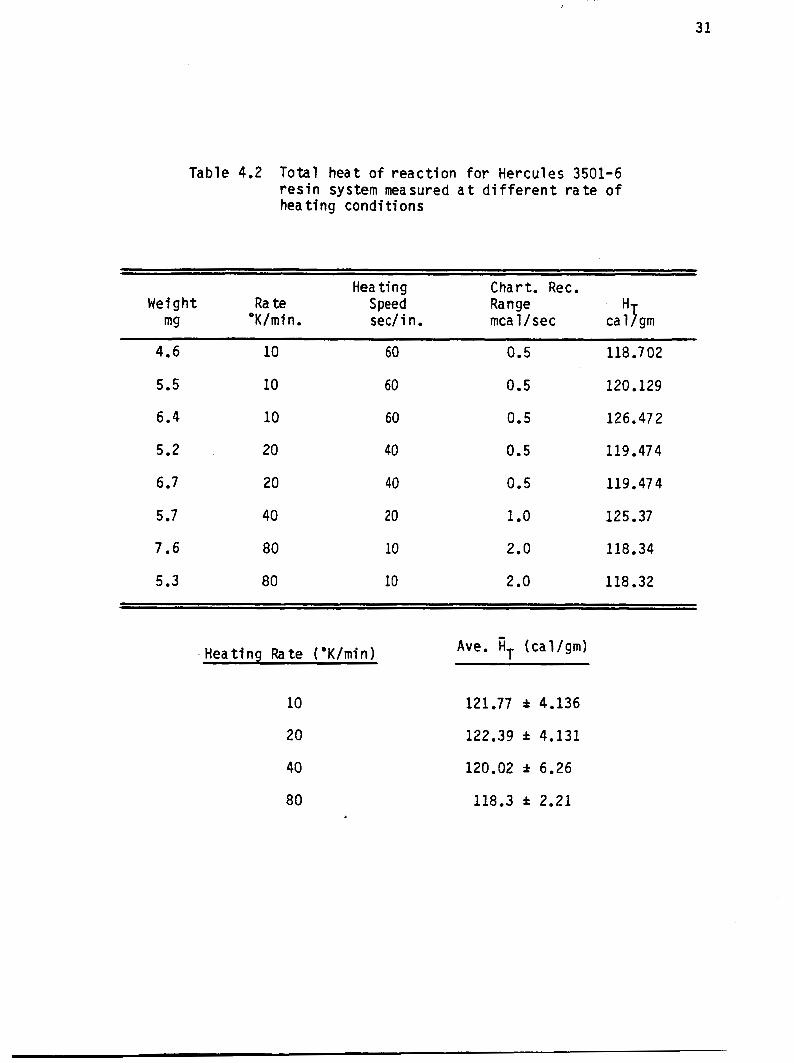
re ferences. Ca lcu la ted r e s u l t s are tabu la ted i n Table 4.2. I t can be
seen t h a t HT i s independent of heat ing ra tes . An average va lue o f H t =
120k5.0 cal/gm was chosen t o be used i n a l l f u t u r e c a l c u l a t i o n s . The
t o t a l heat o f r e a c t i o n ca l cu la ted by Lee e t a l . [SI i n dynamic scanning
exper iment was 113.4 cal/gm. A ten percent d i f f e r e n c e between the two
r e s u l t s i s noted. Th is i s poss ib ly caused by m a t e r i a l s w i t h d i f f e r e n t
a g i n g h i s t o r i e s and the scheme employed i n de termin ing thermogram and
the area under the peak of the curve.
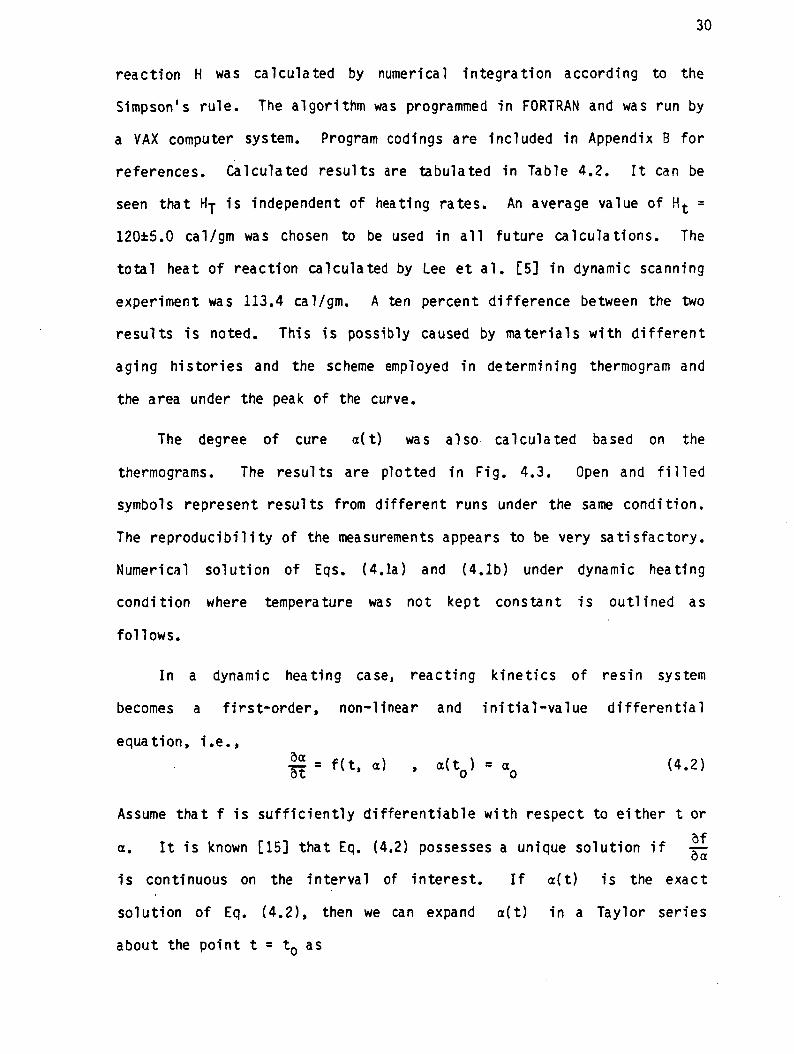
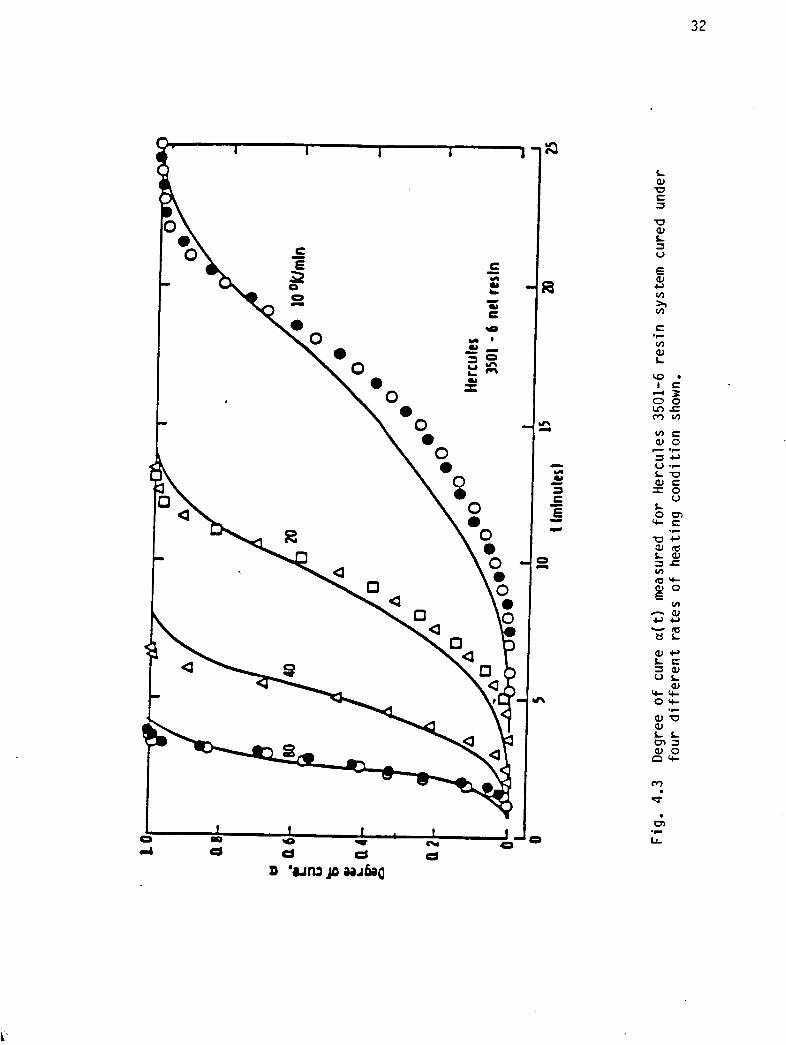
The degree o f cure a ( t ) was a l s o c a l c u l a t e d based on the
thermograms. The r e s u l t s a r e p l o t t e d i n F ig . 4.3. Open and f i l l e d
symbols rep resen t r e s u l t s from d i f f e r e n t runs under the same cond i t i on .
The r e p r o d u c i b i l i t y o f the measurements appears t o be very s a t i s f a c t o r y .
Numerical s o l u t i o n o f Eqs. (4.la) and (4. lb) under dynamic heat ing
c o n d i t i o n where temperature was n o t k e p t cons tan t i s o u t l i n e d as
fo l lows.
I n a dynamic hea t ing case, r e a c t i n g k i n e t i c s o f r e s i n system
becomes a f i r s t - o r d e r , non- l inear and i n i t i a l - v a l u e d i f f e r e n t i a l
equat ion, i .e.,
Assume t h a t f i s s u f f i c i e n t l y d i f f e r e n t i a b l e w i t h r e s p e c t t o e i t h e r t o r
a f a. It i s known [151 t h a t Eq. (4 .2) possesses a unique s o l u t i o n i f
i s cont inuous on the i n t e r v a l of i n t e r e s t . I f a ( t ) i s the e x a c t
s o l u t i o n o f Eq. (4.21, then we can expand a ( t ) i n a Tay lo r s e r i e s
about the p o i n t t = to as
31
Table 4.2 To ta l heat o f r e a c t i o n fo r Hercules 3501-6 r e s i n system measured a t d i f f e r e n t r a t e o f heat ing cond i t i ons
~-
Heating Chart. Rec. Speed Range "T Weight Rate
mg 'K/mi n . s e d i n . mcal/sec ca 1 /gm
4.6
5.5
6.4
5.2
6.7
5.7
7.6
5.3
10
10
10
20
20
40
80
80
60
60
60
40
40
20
10
10
0.5 118.702
0.5 120.129
0.5 126.472
0.5 119.474
0.5 119.474
1.0 125.37
2.0 118.34
2.0 118.32
Heat ing Rate ('K/min) Ave. RT (ca l /gm)
10 121.77 f 4.136
20
40
80
122.39 f 4.131
120.02 f 6.26
118.3 f 2.21
h I I I I 1 t3 L aJ u E 3
-a aJ L V a
E aJ c, vl h vl
t
lA aJ L
.C
V L aJ Y-Y- 0 -
aJu aJ L L m 3 a 0 c3y.
.C
33
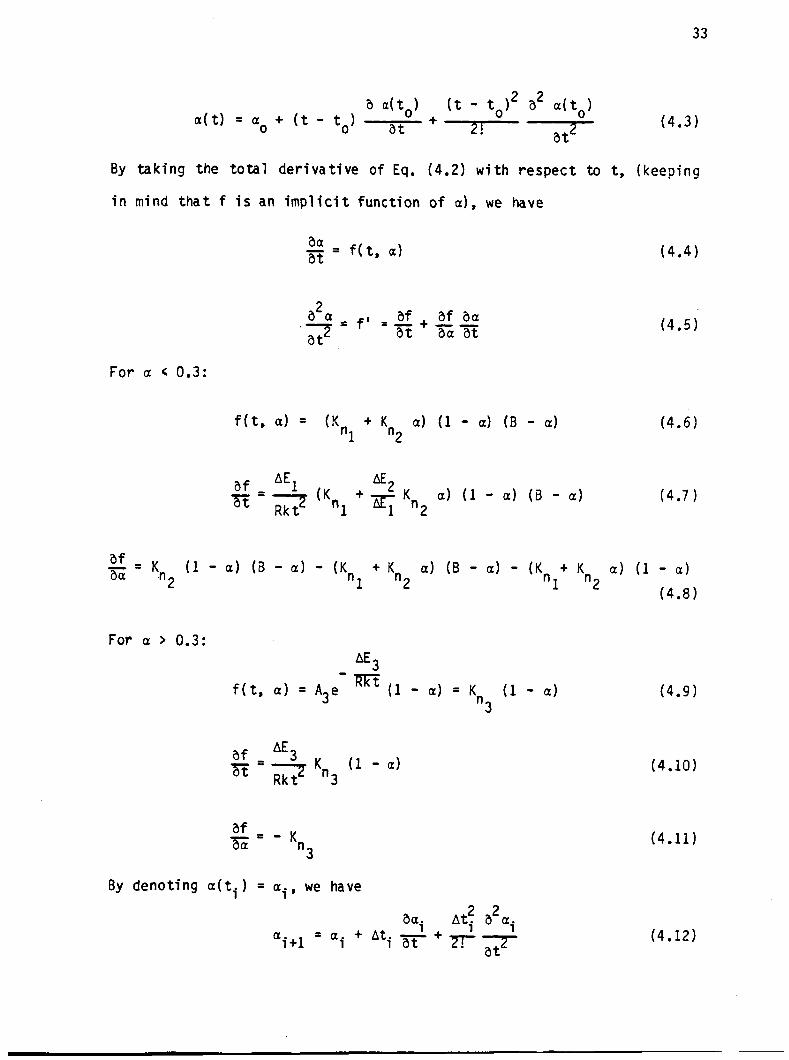
a a ( to ) ( t - to) 2 2 a “ ( t o )
2! (4.3) at2 + ‘0) a t a ( t ) = aO + ( t -
By t a k i n g the t o t a l d e r i v a t i v e o f Eq. (4 .2) w i t h respec t t o t, (keeping
i n mind t h a t f i s an i m p l i c i t f unc t i on o f a), we have
For a < 0.3:
f ( t , a) = (K + K a) ( 1 - a) (B - a) nl “2
(4 .6)
- - af - K ( 1 - a) (B - a ) - (Knl + Kn2 a) ( B - a) - (Knl+ Kn2 a) (1 - a ) aa n2 (4.8)
For a > 0.3: 3
f ( t , a ) = A3e ‘Rkt(l - a) = Kn ( 1 - a) 3
2 2 aai At i a a 1
‘ZTat2 = ai + At i at + i +1 a
(4 .9)
(4.10)
(4.11)
(4.12)
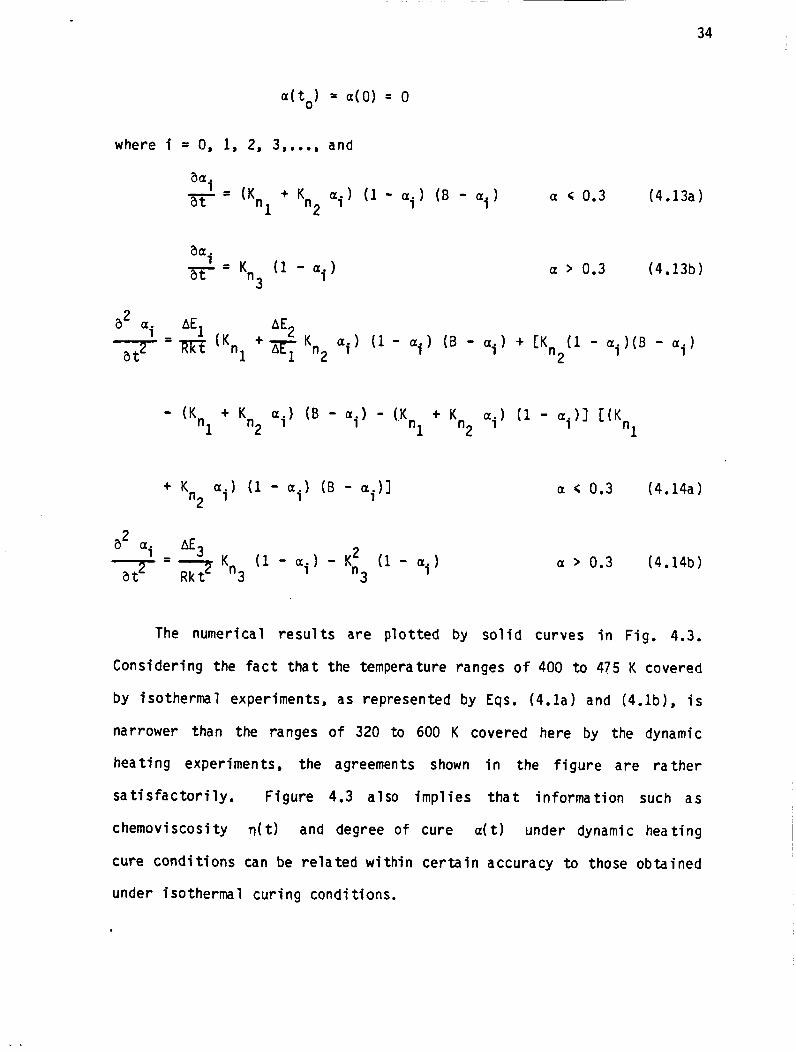
34
where i = 0, 1, 2, 3,,.., and
a > 0.3 (4.13b)
+ K a i ) (1 - a i ) (B - a i ) ] n2
2 2
Kn3 ( l - a i ) (1 - a i ) - a ai AE3
at2 = z Kn3
a < 0.3 (4.14a)
a > 0.3 (4.14b)
The numerical r e s u l t s a r e plotted by so l id curves i n F ig . 4.3.
Consider ing the f a c t t h a t the temperature ranges of 400 t o 475 K covered
by isothermal experiments, a s represented by Eqs. (4 . la ) and (4.lb1, i s
narrower than the ranges of 320 to 600 K covered here by the dynamic
h e a t i n g experiments, the agreements shown i n the f igure are r a the r
s a t i s f a c t o r i l y . Figure 4.3 also implies t h a t information such a s
chemoviscosity q ( t ) and degree of cure a ( t ) under dynamic heating
cure condi t ions can be related w i t h i n certain accuracy to those ob ta ined
u n d e r isothermal curing conditions.
4.2.2 Glass Trans i t i on Temperature T g ( t )
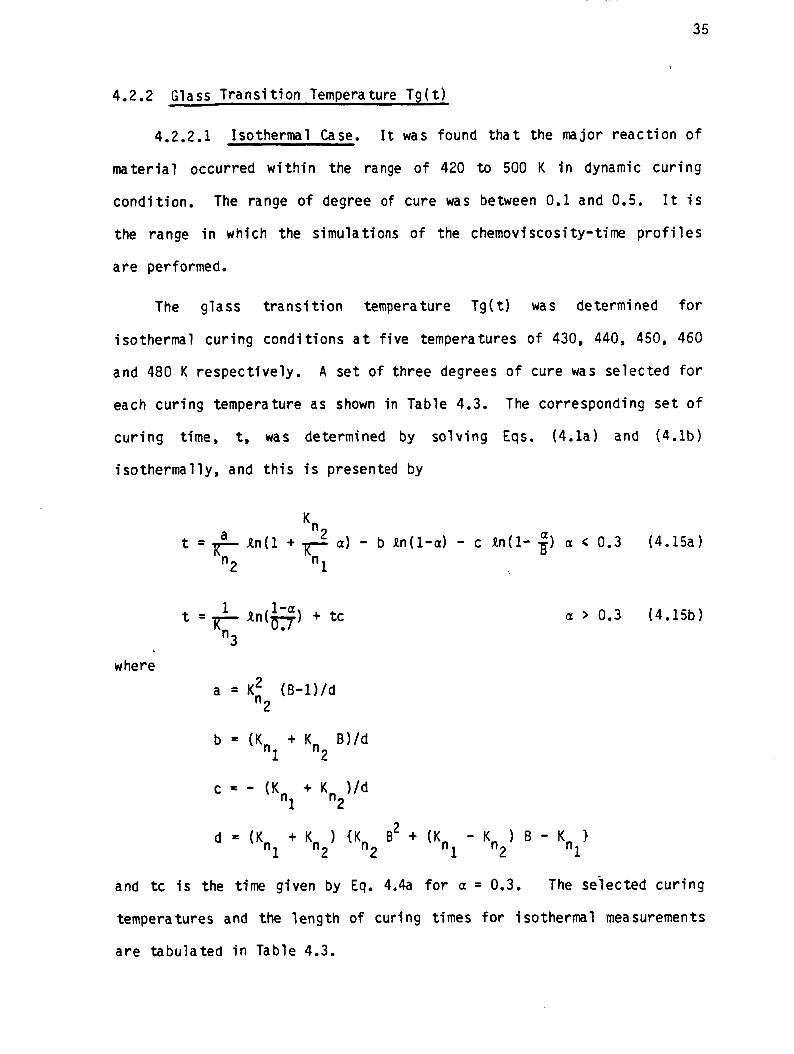
4.2.2.1 Isothermal Case. I t was found t h a t the major r eac t ion o f
mater ia l occurred w i t h i n the range of 420 to 500 K i n dynamic curing
condi t ion . The range of degree o f cure was between 0.1 a n d 0.5. I t i s
the range i n w h i c h the simulations of the chemoviscosity-time p r o f i l e s
are performed.
The g l a s s t r a n s i t i o n temperature T g ( t ) was determined for
isothermal cur ing condi t ions a t f i ve temperatures of 430, 440, 450, 460
and 480 K r e spec t ive ly . A set of three degrees of cure was s e l e c t e d f o r
each curing temperature as shown i n Table 4.3. The corresponding set of
cu r ing time, t, was determined by so lv ing Eqs. ( 4 . l a ) and ( 4 . l b )
i so thermal ly , and this i s presented by
K a n 2
n l t = R n ( 1 + K a ) - b ln(1-a) - c R n ( 1 - i) a < 0.3 (4.15a)
a > 0.3 (4.15b)
where a = K:z (B-l) /d
c = - (K + K ) / d nl n2
n2 1 ( K n 2 B2 + (Kn 1 - - K n l }
and t c is the time given by Eq. 4.4a f o r a = 0.3. The seiected curing
temperatures and the l e n g t h of curing times f o r isothermal measurements
a r e tabula ted i n Table 4.3.
36
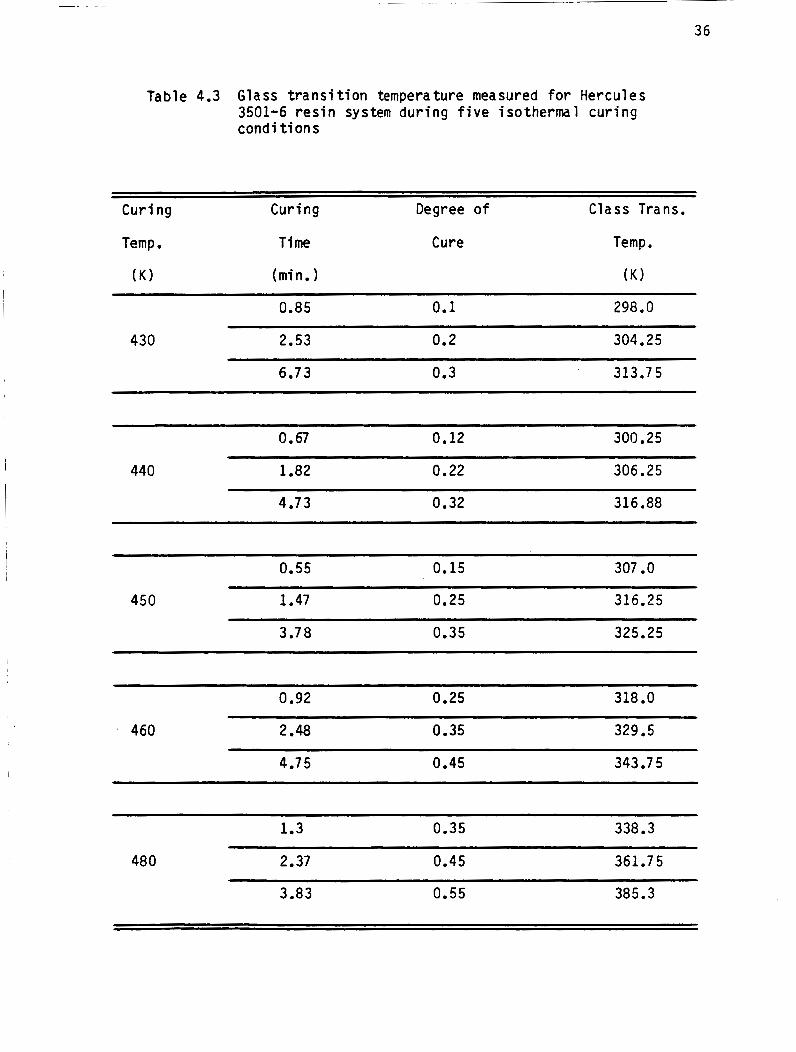
Table 4.3 Glass t r a n s i t i o n temperature measured f o r Hercules 3501-6 r e s i n system dur ing f i v e isothermal cur ing condi ti on s
Curing Curing Degree o f Class Trans.
Temp . T i me
(min. 1
Cure Temp.
0.85 0.1 298.0
430 2.53 0.2 304.25
6.73 0.3 313.7 5
0.67 0.12 300 25
440 1.82 0.22 306.25
4.73 0.32 316.88
450
0.55 0.15 307 .O
1.47 0.25 316.25
3.78 0.35 325.25
0.92 0.25 318.0
460 2.48 0.35 329.5
4.75 0.45 343.7 5
1.3 0.35 338.3
48 0 2.37 0.45 361.75
3.83 0.55 385.3
37
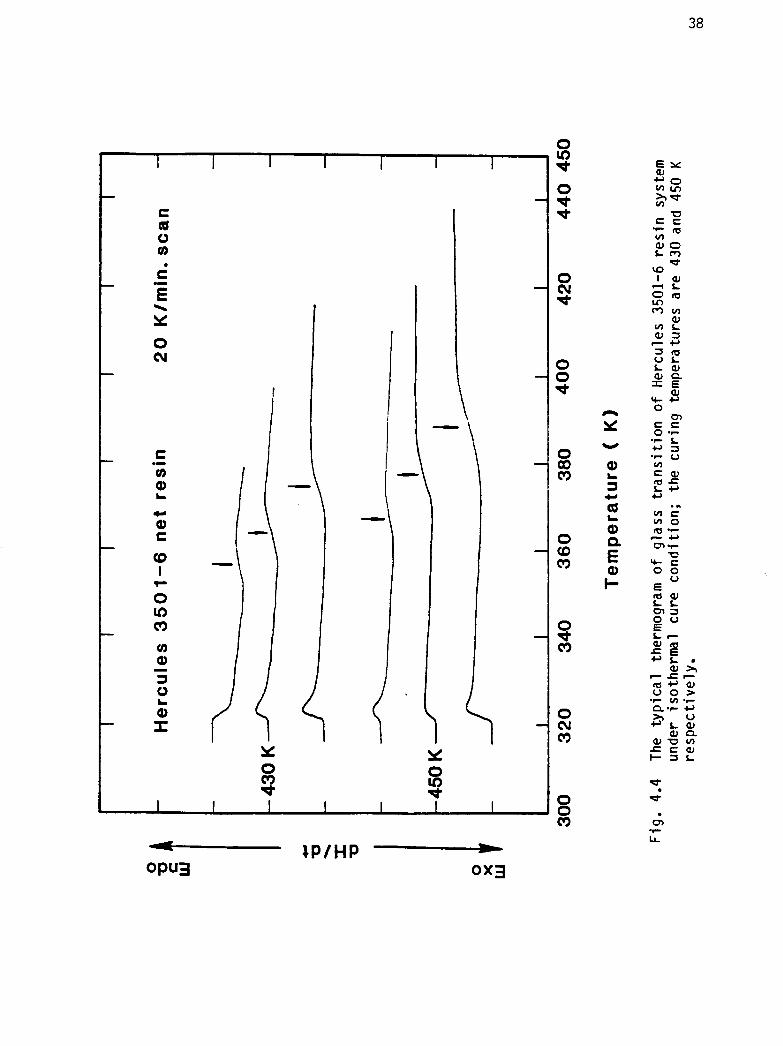
A s e t o f t y p i c a l t races obtained from isothermal measurements i s
shown i n Fig. 4.4. During the glass t r a n s i t i o n , the mater ia1 undergoes
a t r a n s i t i o n from glassy s t a t e t o rubbery s tate, and the s p e c i f i c heat
Cp o f the m a t e r i a l i s changed. Thus, a s tep change i s observed i n the
thermogram. Tg i s determined a t the arrow marks shown i n the curve.
The data ob ta ined from the measurements i s l i s t e d i n Table 4.3.
I t i s found t h a t the glass t r a n s i t i o n temperature i n i so thermal
c u r i n g c o n d i t i o n depends n o t only on the degree o f cure ( o r c u r i n g
t ime) , b u t a l s o the cu r ing temperature. A p l o t o f Tg vs. a a t va r ious
c u r i n g temperatures i s g iven i n Fig. 4.5. The data was f i t t e d by l i n e a r
Leas t Square technique. The r e l a t i o n s h i p between g lass t r a n s i t i o n
temperature and degree o f cure can be expressed as
Tg = d l ( T ) a ( t ) + d2 (4.16)
where d l i s a temperature dependent parameter.
An Arrhenius type p l o t o f d l vs. 1/T i s shown i n Fig. 4.6. By
means of l i n e a r Least Square fit, two s t r a i g h t l i n e s a r e represented,
r e s p e c t i v e l y , by
Logdl (T) = -639.56/T + 3.357 T < 450 K (4.17a)
Logdl (T) = -3216.49/T + 8.879 T > 450 K (4.17b)
The c o r r e l a t i n g f a c t o r s o f the above two l i n e a r f i t s a r e 0.999.
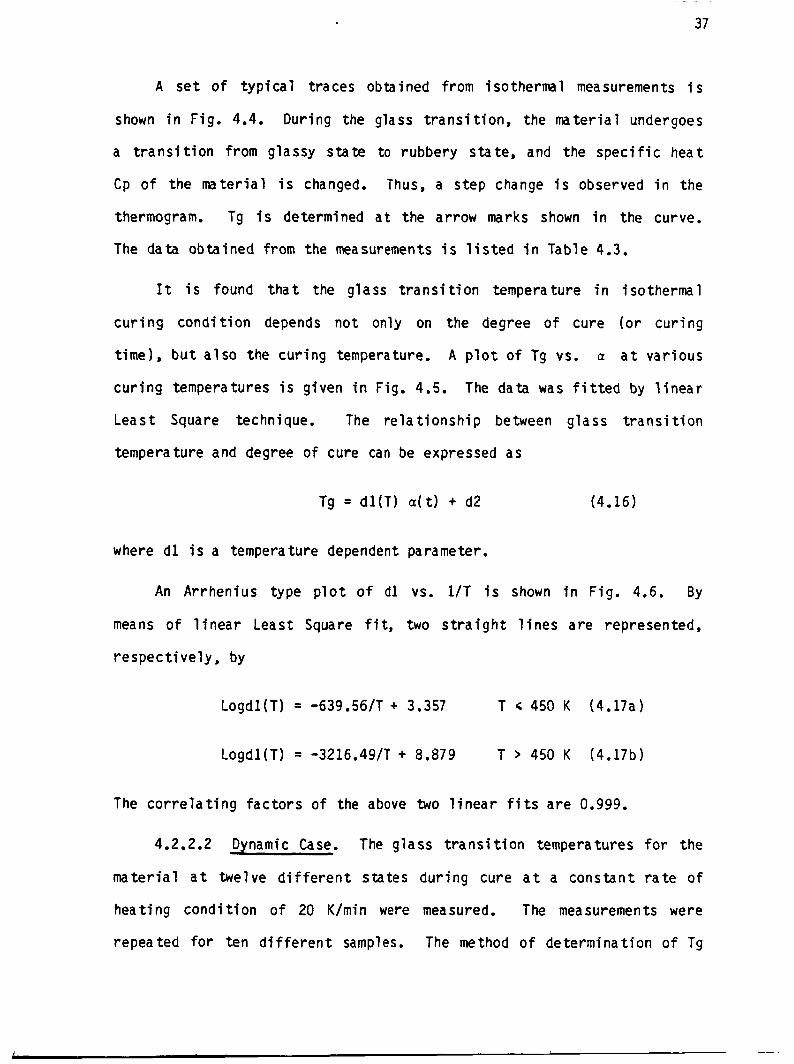
4.2.2.2 Dynamic Case. The g lass t r a n s i t i o n temperatures f o r t h e
m a t e r i a l a t twelve d i f f e r e n t s ta tes d u r i n g cure a t a cons tan t ra te o f
heat ing c o n d i t i o n o f 20 K/min were measured. The measurements were
repeated fo r ten d i f f e r e n t samples. The method o f de termina t ion o f Tg
0
. C .- - E \
Y 0 cv
1 T
- \ T T
Y 0 e9 * i
Y
* 8
0 v) * 0 t *
0 cv *
0 0 *
0 co c')
0 CD 0
0 * c')
0 cu c')
0 0 c')
n z
Q)
Y
L
4-
L
a Q Q)
E" Q) t v
E m w L L m 3 o v E L?
+ L si!
s d . m LL .P
C VI Q)
Q) C
<o I
0
.- L CI
r
ro c9 Y X Y Y Y
I I I I I 0 0 0 0 cD v cu 0 * c9 c’) c‘) c9 c9
9 0
v) 0
t 0
c? 0
c\I 0
r
0
0
I
L 0 Y-
u e o 1 c Y - a ,
L
In
d
cz,
LL
.
. .r
C Q Q)
- L
Y
0, C
I I I t I 1 I
E; v) r
1P
u) m cu'
m 0 I\i
L 0 Y-
N ID
d
m
.
. 'r LL
f rom the t r a c e was the same as t h a t i n the iso thermal case. The
measured r e s u l t s a r e tabu la ted i n Table 4.4 together w i t h degree o f cure
a ( t ) measured by the procedures o u t l i n e d above. Average values o f
T g ( t ) and standard d e v i a t i o n a t d i f f e r e n t r e s i n s t a t e s de f i ned by c u r i n g
t ime t ( o r c u r i n g temperature T) are inc luded as we l l . I t i s noted t h a t
s tandard d e v i a t i o n s increase for inc reas ing scanning temperatures.
D i f f i c u l t i e s i n determin ing Tg accurate ly come from two sources: ( i )
t h e h igher the scanning temperatures, the l e s s sharpness f o r the s tep
change o f dH/dt a t the g lass t r a n s i t i o n temperature and ( i i ) the
ex i s tence of base l i ne slope which i s u s u a l l y d i s t o r t e d a t h igher
temperature regimes. Nevertheless, a 90% confidence l e v e l can be
achieved w i t h f 3% o f the exper imenta l ly determined values o f T g ( t ) .
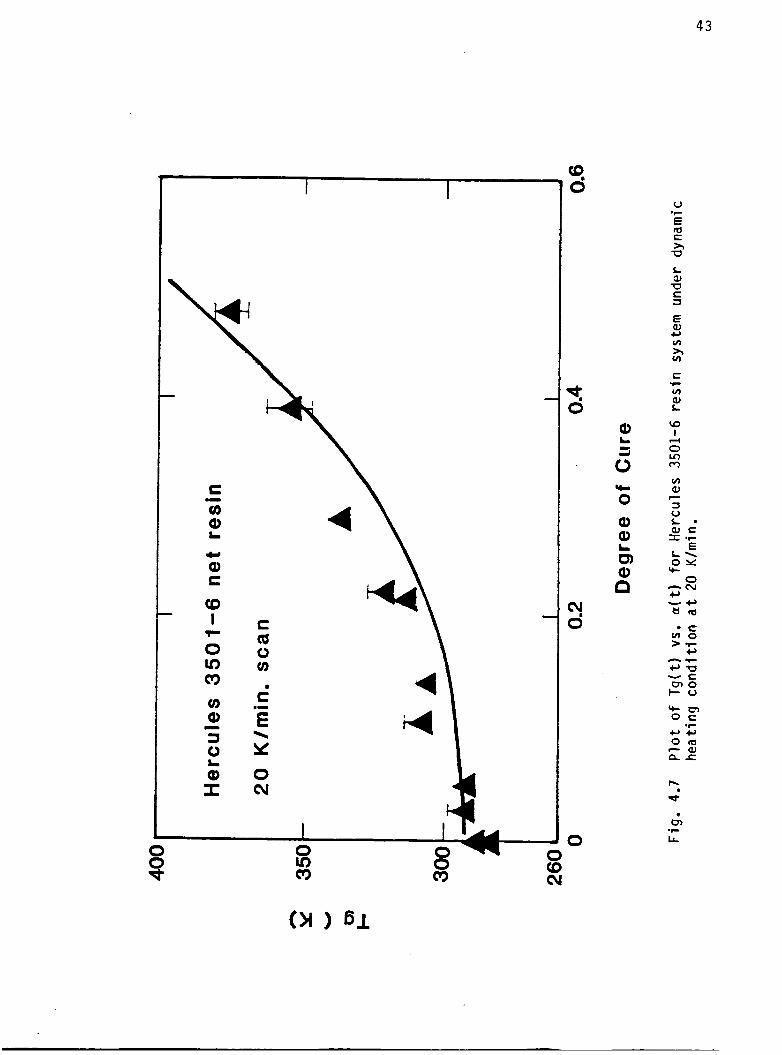
Values o f T g ( t ) a r e p l o t t e d i n F ig , 4.7. For the dynamic case,
cure cyc le T ( t ) = 2 0 t w i t h a constant heat ing r a t e o f 20 K/min i s
s u b s t i t u t e d i n t o Eq. (4.31, the glass t r a n s i t i o n tempera tu res i n dynamic
hea t ing c o n d i t i o n can then be ca lcu la ted from the formulas f o r the
isothermal case. Comparisons between the c a l c u l a t e d values ( t h e s o l i d
curve) and exper imenta l data are shown i n Fig. 4.7. Favorable
comparisons a r e seen f o r the changes o f the g lass t r a n s i t i o n temperature
i n dynamic heat ing case below 0.5 degree o f cure, where the s imu la t i ons
o f the chemoviscosi ty - t ime p r o f i l e s a r e performed.
4.3 Experimental Data o f Rheologica l Measurement
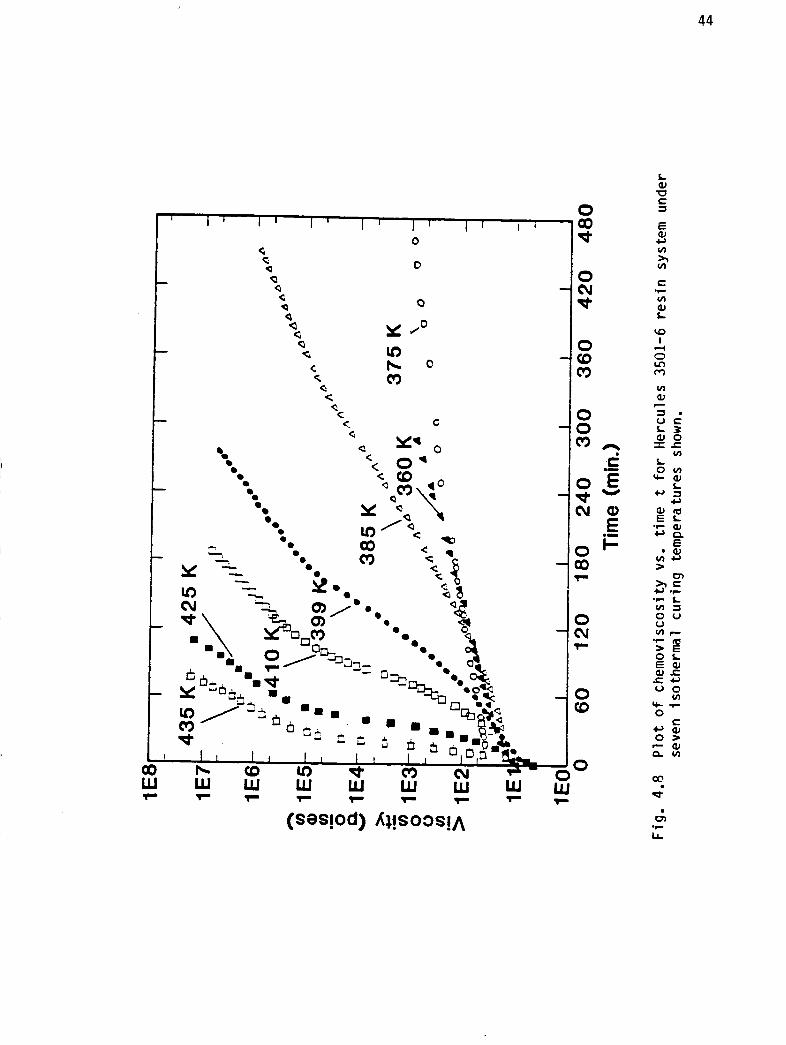
4.3.1 Isothermal Case
The chemoviscosity r e s u l t s obtained f o r i so thermal c o n d i t i o n s a r e
shown i n F ig . 4.8. The c u r i n g temperatures a r e 360, 375, 385, 399, 410,
425 and 435 K. I t i s noted t h a t f o r a h igher cure temperature, a
Lo N L n
0 4 Lo
0 0 L n
Lo
s
0 In d-
L n N d
3 3 U
3 N 3
-4
? 4
Q, - U
EQ, aJ - a L
aJc, L Jc, J m
a r
Lo U (0
0 0
0 - l
0 s
0, m m 0
0
m N a
0
rl 4
0 0
m 0
0 0
PI 0 3 3 3 .
3
U
aJ L 3 L1
e 0
Q, a L cn a 3
m Ln N U
.
h
w Lo m
0
0 4 m
P P N
* D N
+ I
x) a. -I 0 3
E 3
n
n
'5 0 m U
N Ln m
'9 z m
x) x) N
? n 0 U
4 I n r3 4 0 3
3
\
E
10 N U
d 10 m
h
10 0 m
0
1 Ir 03 N
? m 03 N
4 I
x)
9 3 B 3
n
2 n
m . 4 4 d
m u) m
1 m 0 m
a eo N
? m P N
4 I n x) rl -I 9 3 n E '3
co w d
'5 co U m
'I U 0 m
a N eo N
0
-4 I n x) 3 N 0 3 n 5
N 00 m
d N m
U 6, N
? In P N
N I n x) \ -4 9 3 E 3
n
co - m
co tu m
'5 U m N
? U P N
N I n x) x) -I 0 3 E '3
n
1 4 Ir m
T m N m
? In
N m
2 c) x) N
U I
x) rl Q 3 E 3
n
-I
n
t 0 aY m
T d N m
N n N
? c) x) N
U I n x) 3 U 0 3 n E '3
rD
N N U
'u.
00 I- m
W
U In r)
a?
I-
m N m
b.
m eo 3 m
h
U n N
.
m m
XI N
. \
Et n c) x) N
.
0 7 -
c
C Q 0 v)
C .- E Y 0 cu
\
Q)
9 0
0 Q) a, m a, P
L.
cc
L
c C
shor te r c u r i n g t ime i s needed f o r reaching the same v i s c o s i t y l e v e l .
For a g iven time, t, the i n i t i a l decrease o f v i s c o s i t y du r ing the c u r i n g
was a t t r i b u t e d t o the temperature e f f e c t s . Apparently, the non-
l i n e a r i t y o f the isothermal v i s c o s i t y vs. t ime e x i s t s f o r the ma te r ia l .
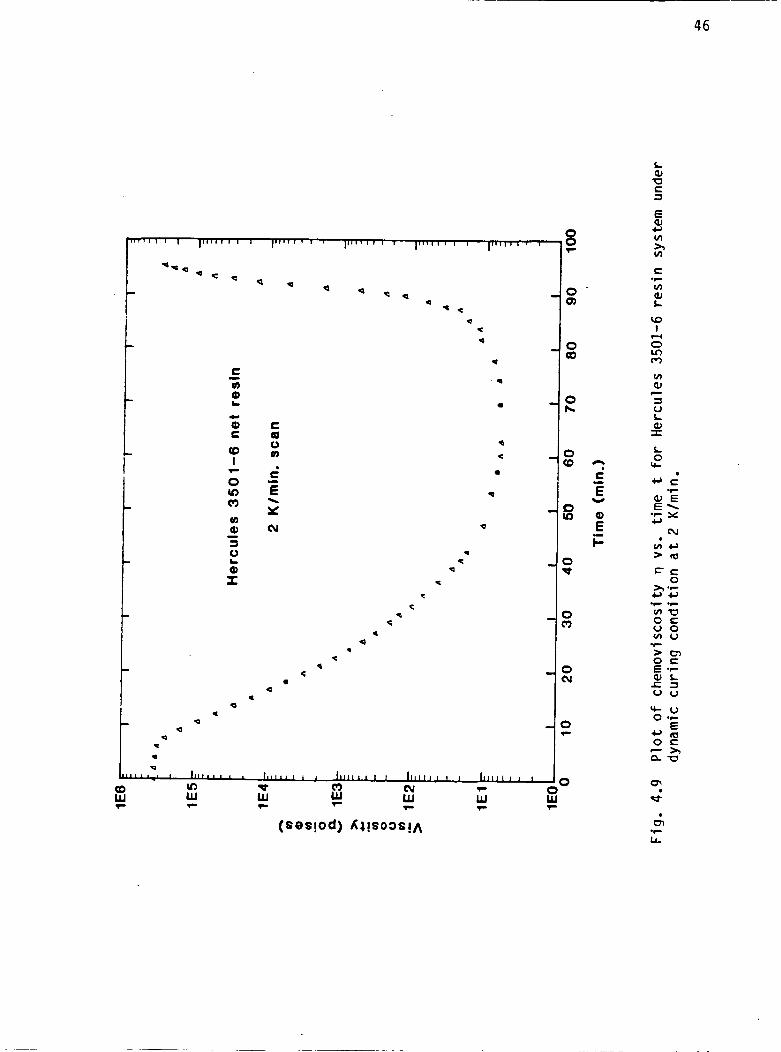
4.3.2 Dynamic Case
Experimental r e s u l t s o f chemoviscosity i n the dynamic case a r e
shown i n F igs. 4.9-4.11. Three d i f f e r e n t dynamic heat ing r a t e s of 2, 3
and 5 K/min were used. The i n i t i a l decrease i n v i s c o s i t y i s caused by
the increase i n cu r ing temperature. A t the ge la t i on , the v i s c o s i t y i s
no ted t o i ncrea se exponen t i a 1 ly .
46
L aJ U c 3
c a
8 Q
c 9
a 9
< a
f
c - m
0 ' D o I
i 0 - r o E
r
c 9
Q
q
4
c
9
a
h
i E
E i=
- Y
a
E aJ c, VI % VI
a 0 L Q, I
L 0
% 2 E
* f a o c
47
E W c)
I " " ' ' ' I ,
i
t
(0 I
. .
Q 9
4 *
8 F
0 0,
0 a
0 h
0 CD
55
0 P
0 m
0 cu
0 F
0
v, h m c m aJ L
*I-
I 4 0 u) m m W
3 V L
c
L E O\ * e y
O V E Q , E 5 g -
h 'c-0 0
0 4
U . CI) .C
48
C Q) - L CI I 0) E E 6
I ( D o Q)
i E
F - 0 m
C
a
9
4
0 Q
0 )c 1 I ' O 0
I c I
E a, c, v)
h v)
c v) a, L W I 4 0 Ln m v) Q,
3 V L a , . T c
O\ v-Y * L n
.C
c
L 'E
h * 'cJ 0
Chapter 5
CHEMOV ISCOSITY MODELING
5.1 Theory
The Williams-Landel-Ferry (WLF) theory [61 states t h a t for Tg < T <
(Tg+100 K ) , the temperature-dependent viscosity i s given by the
expression
qT C l(T-Tg 1 log (T) = - C2 + T-Tg
T!3 (5.1)
where C1 a n d C2 are material constants. The temperature dependency of
the viscosi ty a s shown i n Eq. (5.1) has been tested and found valid for
materials rang ing from dilute polymeric systems and thermoplastic me1 t s
to rubbers a n d elastomer. Equation (5 .1 ) can he derived from the semi-
empirical Doolittle equation w h i c h relates the viscosity to the free
volume of the liquid. T h i s will be discussed later i n this chapter,
The normal use of the WLF equation for thermoplastic materials
requires t h a t the glass transition temperature Tg be constant while the
temperature T is varied for the specific polymer under s tudy . Equation
( 5 . 1 ) i s applicable for a temperature T up t o 100 K higher t h a n the Tg
of the material. However, during cure of thermosetting resin, the
monomers are ini t ia l ly polymerized and cross1 i n k s are formed later.
T h i s i s a system where T g ( t ) is chang ing and the curing temperature T i s
49
50
held constant (e.g. the isothermal case). The glass transition
temperature Tg rises continuously and eventually approaches the curing
temperature. Over the entire c u r i n g cycle, the material structure
actually undergoes a continuous phase transforma t i o n from the low
molecular weight liquid to the h i g h molecular weight polymeric melt, a n d
eventually transforms t o form crosslinking networks. I f i t i s assumed
t h a t T g ( t ) of the material is always lower than the cure temperature T,
and t h a t ( T - T g ( t ) ) is always w i t h i n 100 K, then the WLF theory should be
applicable to a l l polymer structure phases d u r i n g the cure. However,
before Eq. (5.1) can be applied t o describe the chemoviscosity of the
curing resin, modifications have to be made t o properly account for the
reaction time, t, of the thermosetting resin system.
One method of i n t r o d u c i n g reaction time fac tor in to the WLF
equation i s to express the glass transition temperature T g ( t ) as a
func t ion of a ( t ) , the degree of cure. Several different techniques
have been used i n literature which include thermal, spectrophotometric
(FTIR) and chroma tographic (HPLC) measurements t o determine the extent
of cure. In the present s tudy , we assume t h a t for the resin system
under investigation, a ( t ) a t time t is equal t o the fraction of heat
released, as measured by DSC, up to time t for the resin system under
cure. The a ' s thus determined are a func t ion of the curing
temperature and time. The two material constants, C1 and C2, should be
varied w i t h reaction time because of the transformation of different
material structures d u r i n g cure.
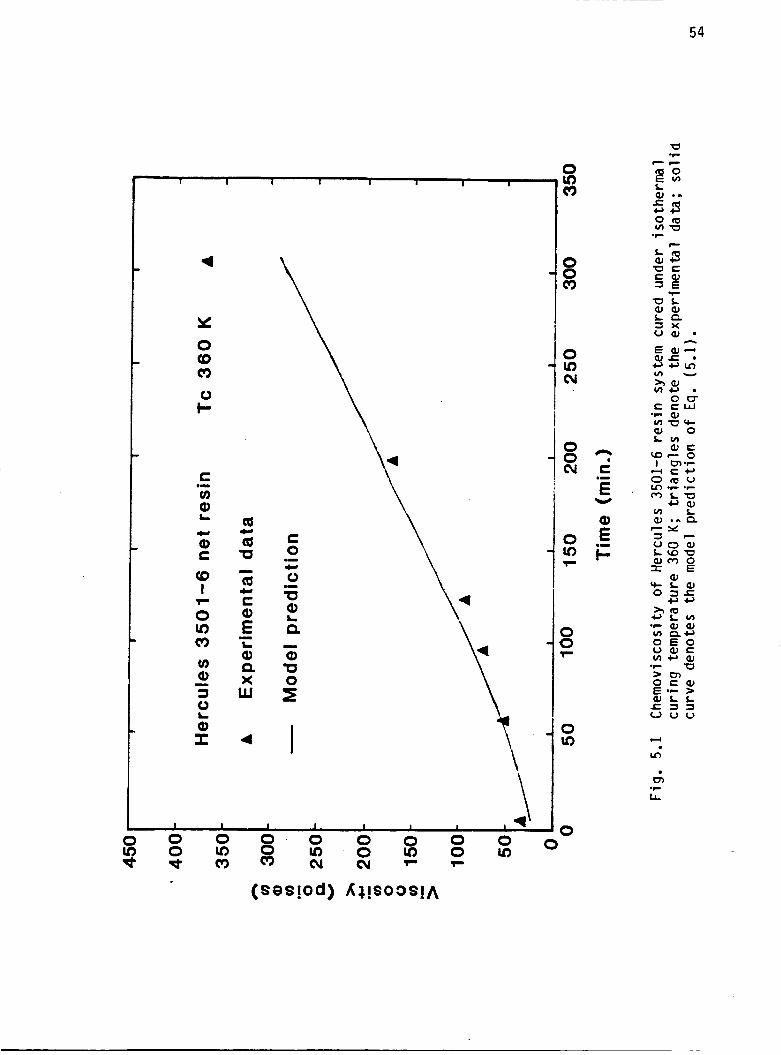
5.2 Chemoviscosi t y Modeling
The procedure used i n modeling o f chemoviscosi t i e s o f Hercules
3501-6 epoxy r e s i n i s descr ibed by the f o l l o w i n g two steps:
1. Temperature-dependent mater ia l constants C1(T) and C2(T) i n Eq.
(5.1) a r e f i r s t determined by the exper imenta l data fo r the
mater ia1 cured under isothermal cond i t ion .
2. The chemoviscosity rl(t,T) es tab l i shed by iso thermal cure data
under procedure 1 i s al lowed t o f o l l o w va r ious dynamic heat ing
cure cyc les T ( t ) . The v i s c o s i t y values thus ca l cu la ted a r e
compared w i t h the experimental data.
5.2.1 Isothermal Case
For the m a t e r i a l cured iso thermal ly , the r e l a t i o n s h i p between
degree o f cure a ( t ) and cu r ing t i m e t i s es tab l i shed by i n t e g r a t i n g
the k i n e t i c s model of Lee e t a l . C51. As discussed i n Chap. 4, t h i s i s
g iven by
K a n2 t = K nn(l + K a) - b An (1-a) - c Jn (1 - f ) a < 0.3 (4.4a) n, n1
a 0.3 (4.4b)
r e e o f cure a ( t ) i s
t = - r A n 1 (m + t c "3
Th'e g lass t r a n s i t i o n temperature Tg( t )
r e l a t e d exper imen ta l l y by
nd the d
Tg = d l ( T ) a ( t ) + d2 (4.5)
52
where Logdl (T) = -639.56/T + 3.357 T < 450 K (4.6a 1
Logdl (T) = -3216.49/T + 8.879 T > 450 K (4.6b)
d2 = 283.0
S u b s t i t u t i n g Eqs. (4.4a1, (4.4b) and (4.5) i n t o Eq. (5.11, t he
c a l c u l a t e d a ( t ) a t
f i t the experimental
constants C1 and C2. - -
a g iven isothermal cure c o n d i t i o n can be made t o
data through the adjustments o f the two m a t e r i a l
i s assigned a During the model c a l c u l a t i o n , kl value o f 10” poises.
g lass- forming substances and polymer systems C161.
Th is i s the v i s c o s i t y determined a t Tg f o r many
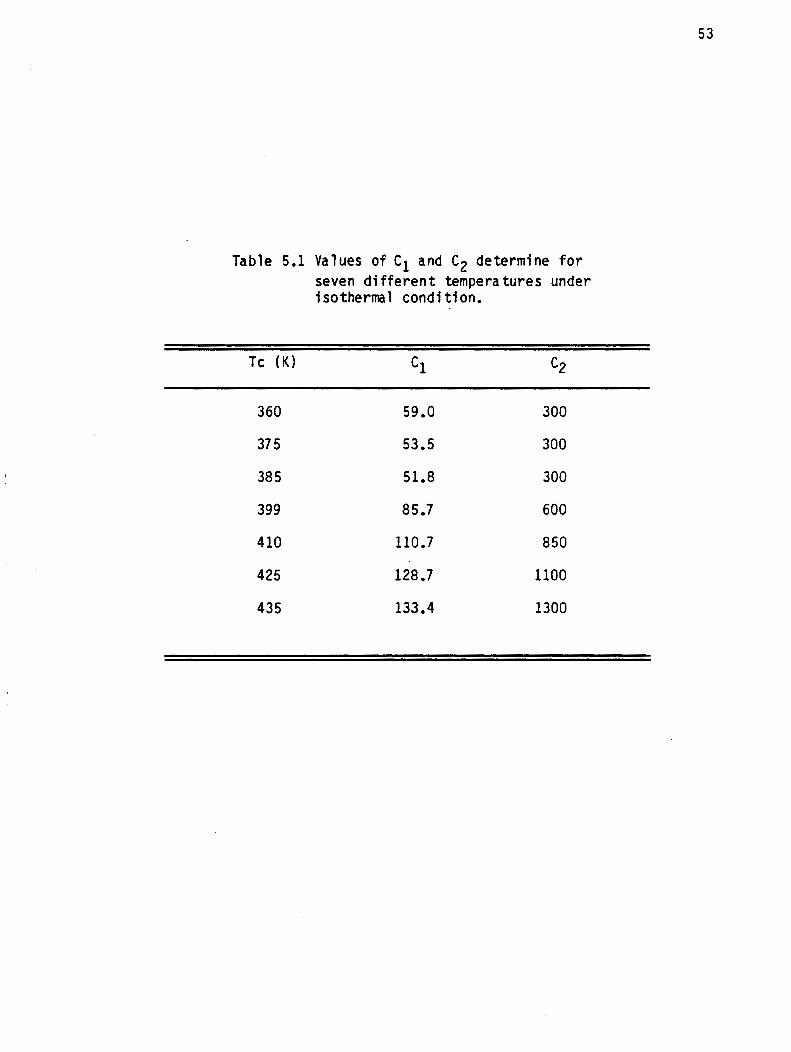
The C1(T) and C2(T) values determined f o r seven d i f f e r e n t
temperatures a r e l i s t e d i n Table 5.1, and the model p r e d i c t i o n s a r e
drawn as a s o l i d l i n e i n Figs. 5.1 t o F ig . 5.7. I t i s noted t h a t the
model i s capable o f desc r ib ing the non- l inear r e l a t i o n s h i p between
v i s c o s i t y which i s below the order of lo3* This i s considered a
s i g n i f i c a n t improvement over the e m p i r i c a l l i n e a r model used by Lee e t
a l . C51.
An Arrhenius p l o t o f C1 and C2 r e s p e c t i v e l y , vs. temperature, i s
shown i n Figs. (5.8) and (5.9). The l i n e a r Least Square technique was
used aga in and was found t o f i t the data reasonably we l l . The two
s t r a i g h t 1 i nes a r e r e p r e sen ted , respec ti ve 1 y , by
C 1 = 4.067~10 - - 54.252 T
fo r T < 382 K (5.2a)
53
Table 5.1 Values of C1 and C2 determine for seven different tempera tures under isothermal condition.
C1 c2 Tc ( K )
360
37 5
38 5
399
410
425
435
~ ~~
59.0 300
53.5 300
51.8 300
85.7 600
110.7 850
128.7 1100
133.4 1300
54
I I I 1 I I I I
Y 0 @ c')
0 I-
L Q)
X W
n
4
n c . .. E Y
.. E I-
oca
v ) w h a v)o 0
0 0 c c w
Lv) a t wr- 0
aJ* 0 X E
+ Ln .
55
r I 1 I I I I 1 I 1
u) b c*)
0 t
\
\
a Q 0
Q C
c,
.I
c
.- E" L a P X w
4
c, 0 W .-
I I I I I I I 1 I I 0 0 0 0 0 0 0 0 0 0 0 0 0
0 0 0 0 0 0 0 0 0 ? 8 Q ) Q b @ O L n d C U r r r
56
Y v) a0 c*)
0 t
I I I
4 1 I
4
\ 4
I I 1 I
0 0 0 0 0 0 0 0 0 0 0 a0 a * cu
0 0 cu r r
V L a J a J L P I X
m u 2 8 .
57
0 I-
C ua al
0) c co I
.- L c
r 0 v) m ua al 5 0 al L
r 4
c 0 - c 0 U - al P L
0 z
J I I 1 I 1 I I 1 1 I 0 0 0 0 0 0 0 0 0 0 0 0 0 0 0 0 0 0 0 0 0 0 0 r O m a O b ~ ~ * C ' ) C U r r r
0 Lv r
0 r r
0 0 r
0 0)
0 a0
0 b
0 <o
0 v)
0 * 0 c3
0 cu
0 r
0
L -
t a 5 o v v
58
8
I .
- 0 - 0
-
e
-
4
- _, 0 cu 4
- 0 r
4
I I I 1 I 0 0 0
0 0 0 0 0 0 0 0
Y 0
* r 0 I-
C v) a .- L
c, a C
(0 I
0 lo c3 VI 01
0 a I
r
II
a L
Q Q U
co c
c,
.I
c,
.I E L 01 P x W
4
c 0
0 ..I
CI
H
U
0 z
aaJ L P
a J b 0 = E
59
I I I I I I I I I I
Y v) cu w 0 c
C
v) .-
L Q)
1 . 1 4
h a J 0 V I - .
C c c w 0 -
60
I I I I 1
L..
Q
Q 0
Q C
c,
- c,
i! .- L Q, P x W
4
I
-\
C 0
0 W Q)
P
Q) 0 0
.- c,
.I
L
- r
I
\
\
\ 4
I I I I I 0 0 0 0
v) 0 lo c9 0 cv cv r r
?
E C .I
Y
E .- I-
aJaJ 7 x- L nv)
61
c
I 1 I I I 0 0 0 0 0 0 cv 0 00 co
P P l o * P r
L3
W I 4 0' u) c3
v) aJ c 3 V L aJ I
. v) y >
. 0- w Y- O
c 4 u e, 0
Y
7 n
62
I I I I I 1
0 0 0 0 0 0
- 1 1 I r - 7 1
- _
Ocv'
N
. E aJ c, ul h ul
c v) aJ L
I 4 0 In m v) aJ 3 u L aJ I L 0 Y-
I- \ 4
.P
c
v) > n 4
In .
Y . 0- w Y- O
I-
(v 0
Y- O c, 0
n
Y
?
n
OI
la . .
WI
L L *r
63
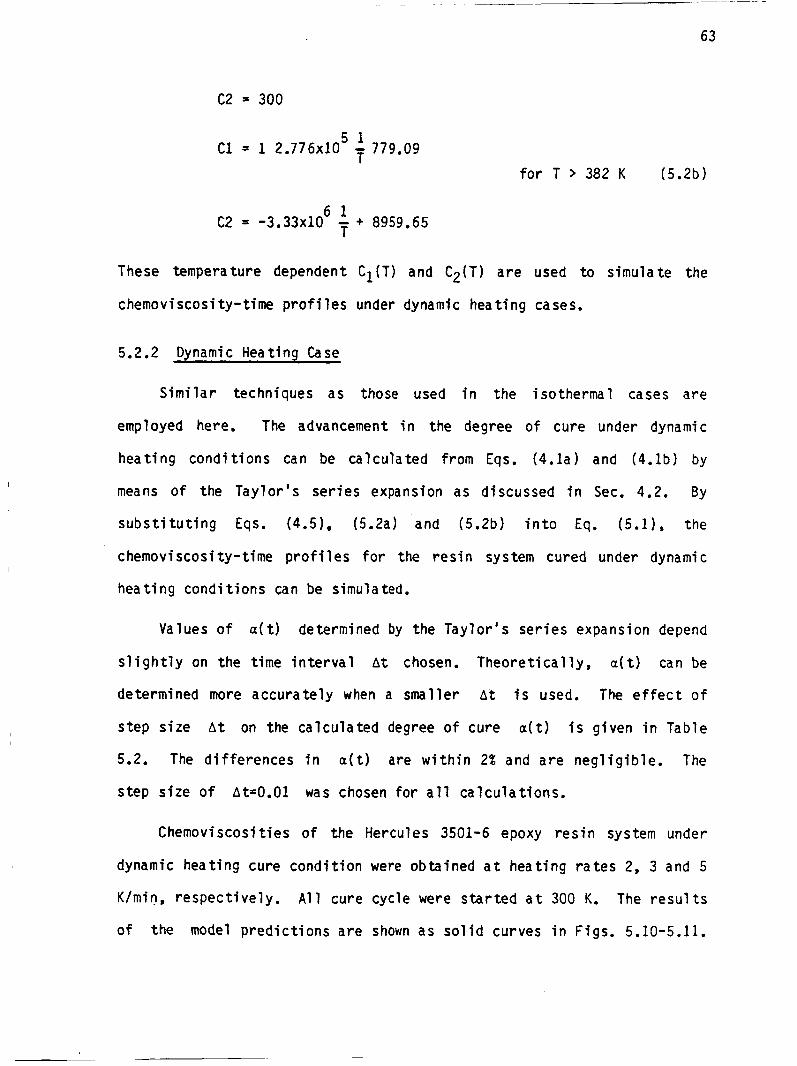
C2 = 300
5 1 T C 1 = 1 2.776~10 - 779.09
fo r T > 382 K (5.2b)
6 1 T C2 = -3.33~10 - + 8959.65
These temperature dependent C l (T) and C2(T) a r e used t o s imu la te the
chemoviscosi t y - t ime p r o f i l e s under dynamic heat ing cases.
5.2.2 Dynamic Heat ing Case
S i m i l a r techniques as those used i n the iso thermal cases a r e
employed here. The advancement i n the degree o f cure under dynamic
h e a t i n g cond i t i ons can be ca lcu la ted from Eqs. (4. la) and (4. lb) by
means o f the Tay lo r ' s se r ies expansion as discussed i n Sec. 4.2. By
s u b s t i t u t i n g Eqs. (4.51, (5.2a) and (5.2b) i n t o Eq. (5.11, the
chemoviscosity-t ime p r o f i l e s f o r the r e s i n system cured under dynamic
hea t ing cond i t i ons can be simulated.
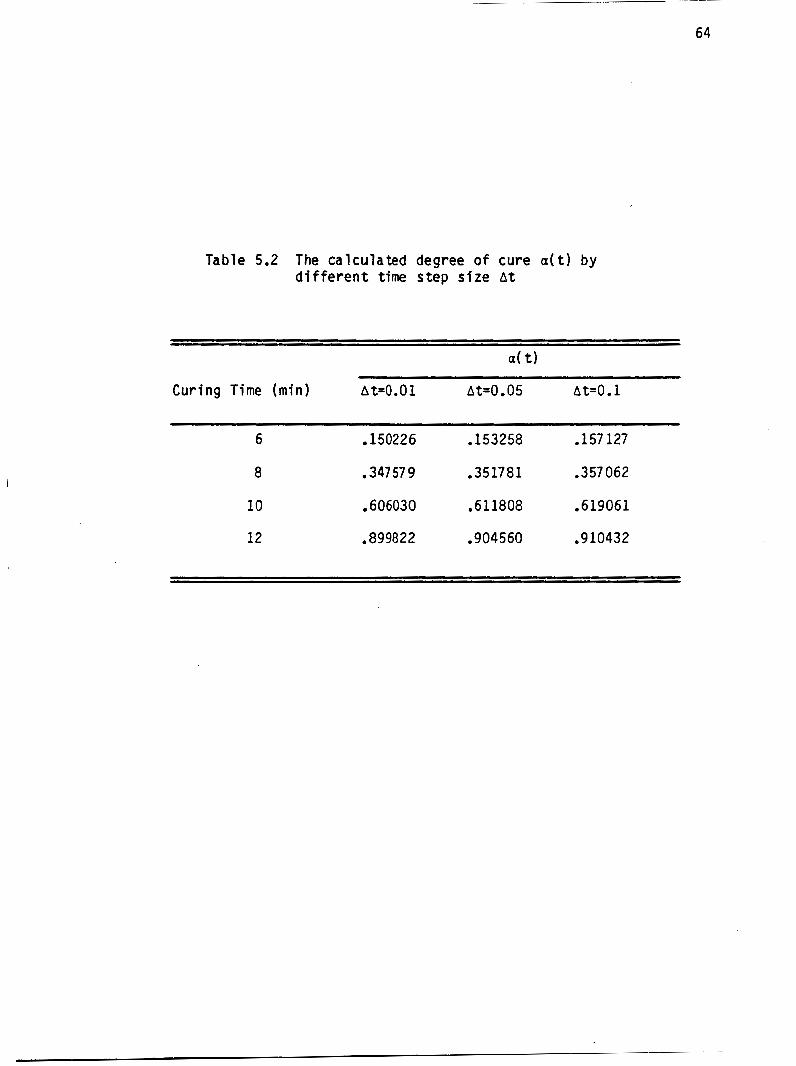
Values o f a ( t ) determined by the T a y l o r ' s s e r i e s expansion depend
s l i g h t l y on the t ime i n t e r v a l A t chosen. T h e o r e t i c a l l y , a ( t ) can be
determined more accu ra te l y when a smal le r A t i s used. The e f f e c t o f
s tep s i z e A t on the ca l cu la ted degree o f cure a ( t ) i s g iven i n Table
5.2. The d i f f e r e n c e s i n a ( t ) are w i t h i n 2% and a r e n e g l i g i b l e . The
s tep s i z e o f At-0.01 was chosen for a l l c a l c u l a t i o n s .
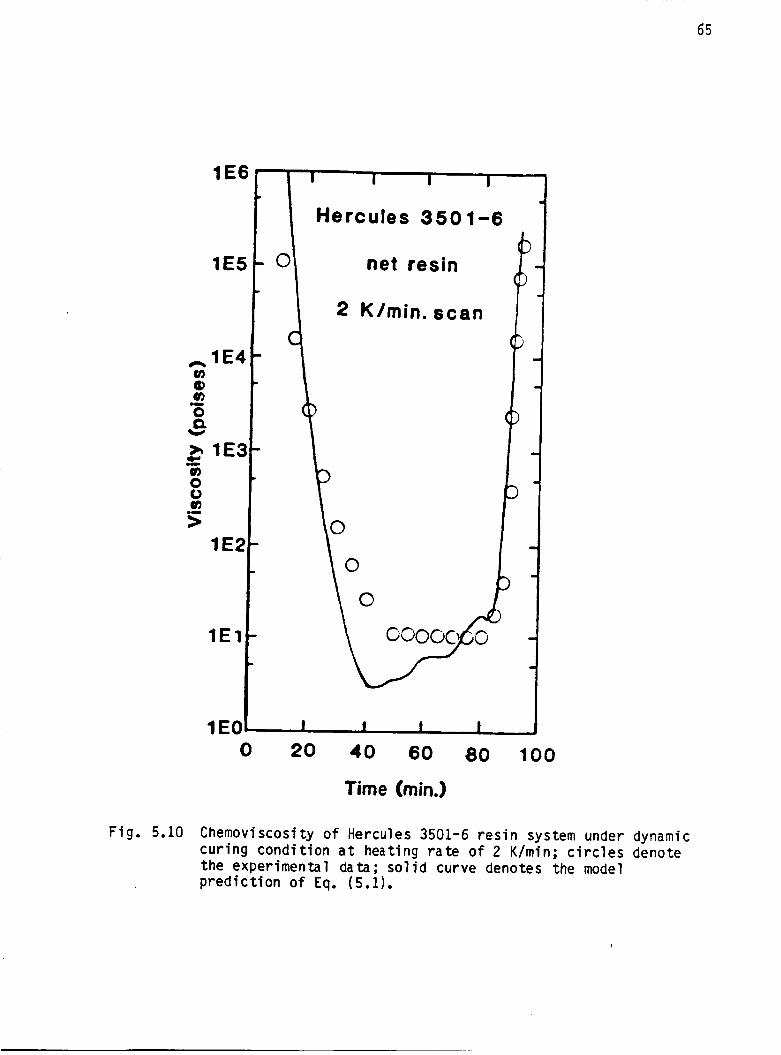
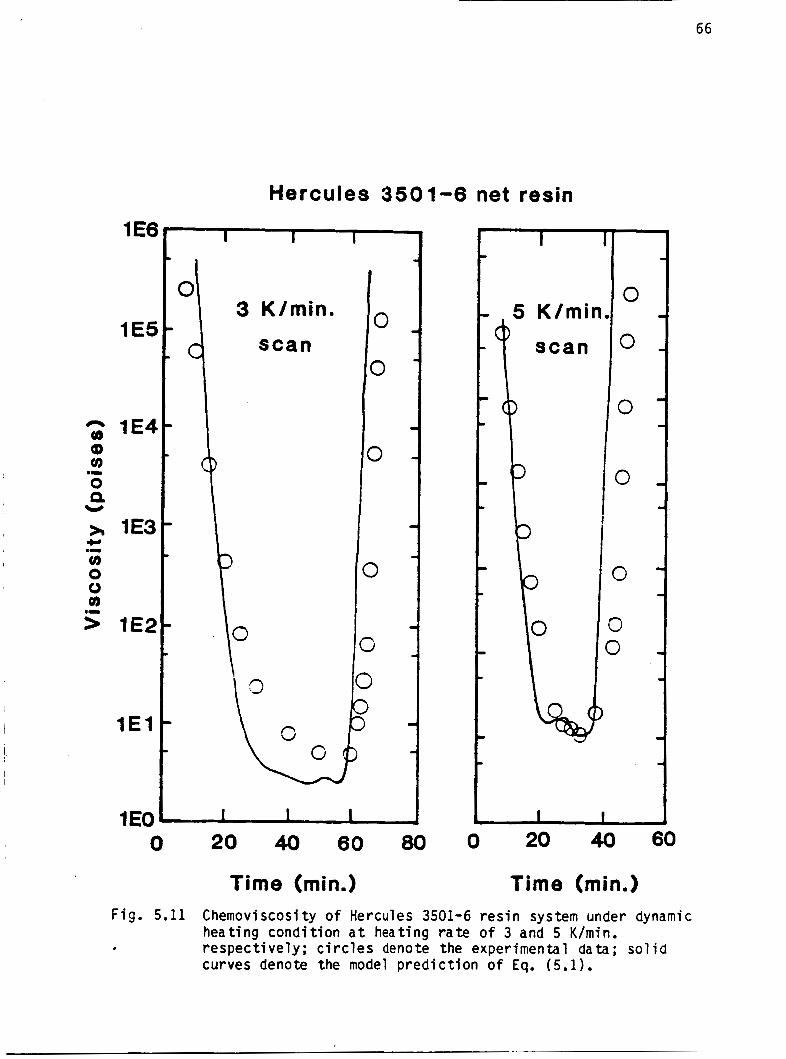
Chemoviscosi t i e s o f the Hercules 3501-6 epoxy r e s i n system under
dynamic heat ing cure c o n d i t i o n were obta ined a t hea t ing r a t e s 2, 3 and 5
K/min, respec t i ve l y . All cure cyc le were s t a r t e d a t 300 K. The r e s u l t s
of the model p r e d i c t i o n s a re shown as s o l i d curves i n F igs. 5.10-5.11.
64
Table 5.2 The ca lcu la ted degree o f cure a ( t ) by d i f f e r e n t time step s i z e A t
a( t )
Curing Time (min) At=0.01 At=O. 05 A t = O . l
6 .150226 .153258 .157 127
8 0 347 57 9 .35 1781 .357062
.606030 .611808 .619061 10
12 .899822 .go4560 .910432
65
Time (rnin.)
F i g . 5.10 Chemovi scosi t y o f Hercules 3501-6 r e s i n system under dynamic cur ing condi t ion a t heating r a t e o f 2 K/min; c i r c l e s denote the experimental data; s o l i d curve denotes the model p r e d i c t i o n o f Eq. (5 .1 ) .
66
1 E8
1 E5
1E4 Qb a v1 0 P
..I
Y
>r 1E3 4- e m
v) 0 0 cn 5 1E2
1El
1EO 1
Hercules 3501-6 net resin
3 K/min.
scan 0
0
0
0 20 40 60 80
Time (min.)
. 5 0
0 K/min.
0
0
0
3 1
0 20 40 60
Time (min.) Fig. 5.11 Chemoviscosity o f Hercules 3501-6 r e s i n system under dynamic
heat ing cond i t i on a t heat ing rate o f 3 and 5 K/min. respec t i ve l y ; c i r c l e s denote the experimental data; sol id curves denote the model p r e d i c t i o n o f Eq. (5.1).
67
I t is noted t h a t the model calculations compared favorably w i t h the
experimental da ta f o r a l l three cases.
The WLF model used i n the present s t u d y was originally derived from
the semiempirical Doolittle equation for the viscosity of a l i q u i d as
E173
v - v R n q = I n A " + B " (5.3)
This gives an expression for the viscosity of a system i n terms of two
constants A and B. The q u a n t i t y V i s the total volume o f the system
while V f i s the free volume available t o the system. Rearrangement o f
Eq. (5.3) gives
Rnq = RnA" + B" (7 - 1) (5.4)
where f i s the fractional free volume V f / V . I t i s assumed t h a t above
me g l a s s transirion temperature, tne Traction tree volume increases
linearly, t h a t is
f = f g + af ( T - Tg) T > Tg (5.5)
where f is the fractional free volume a t T, f g i s the fractional f ree
volume a t Tg, and i s the thermal coefficient of expansion of the
fractional free volume above Tg. Substituting Eq. (5.5) i n t o (5.31, the
Doo1.i t t l e equation becomes
af
(5.6)
Equations (5.1) and (5.6) have the same form, and we can have
68 I
B ' I
=-
f =9
'2 af
(5.7 1
where B", a parameter i n the D o l i t t l e equa-ion, i s exper imenta l l y found
t o be c lose t o u n i t y .
The concept o f f r e e volume i s d i f f i c u l t t o d e r i v e i n a p rec i se
manner. I n an approximate way, we can represent the segment o f a
polymer chain by r i g i d bodies and the f r e e volume as the holes presented
between these segments as a r e s u l t o f packing requirements. Presumably,
the f r e e volume reaches a constant value a t Tg, which i s too small t o
a l l o w the la rge-sca le conformational rearrangements o f the cha in
backbones assoc ia ted w i t h Tg t o occur. Above Tg, on the o ther hand,
f r e e volume increases and becomes s u f f i c i e n t ' l f ( l a r g e t o a l l o w such
mot ions t o occur.
The constants C1 and C2 have been shown t o vary from polymer t o
polymer [18]. Dur ing the cu r ing of thermoset t ing res in , the mononers
a r e i n i t i a l l y polymerized and cross1 i n k s a r e formed l a t e r . The m a t e r i a l
undergoes continuous phase changes from d i l u t e po lymer ic s o l u t i o n s t o
polymer melts, and even tua l l y the elastomers. A s i n g l e s e t o f C 1 and C2
fo r each isothermal cu r ing cond i t i on i s found here, however, t o descr ibe
the chemoviscosi ty - t ime p r o f i l e adequately. Th i s s i n g l e s e t o f values
i s t he re fo re considered to describe a m a t e r i a l s t a t e which represents an
average over var ious s t r u c t u r e s occu r r i ng i n s i d e the m a t e r i a l d u r i n g
cure. Values o f C1 and C2 do vary w i t h d i f f e r e n t i so thermal c u r i n g
temperatures as can be seen i n Table 5.1. The f r a c t i o n a l f r e e volume
and thermal expansion c o e f f i c i e n t c a l c u l a t e d by Eq. (5 .7 ) are g iven i n
Table 5.3.
h
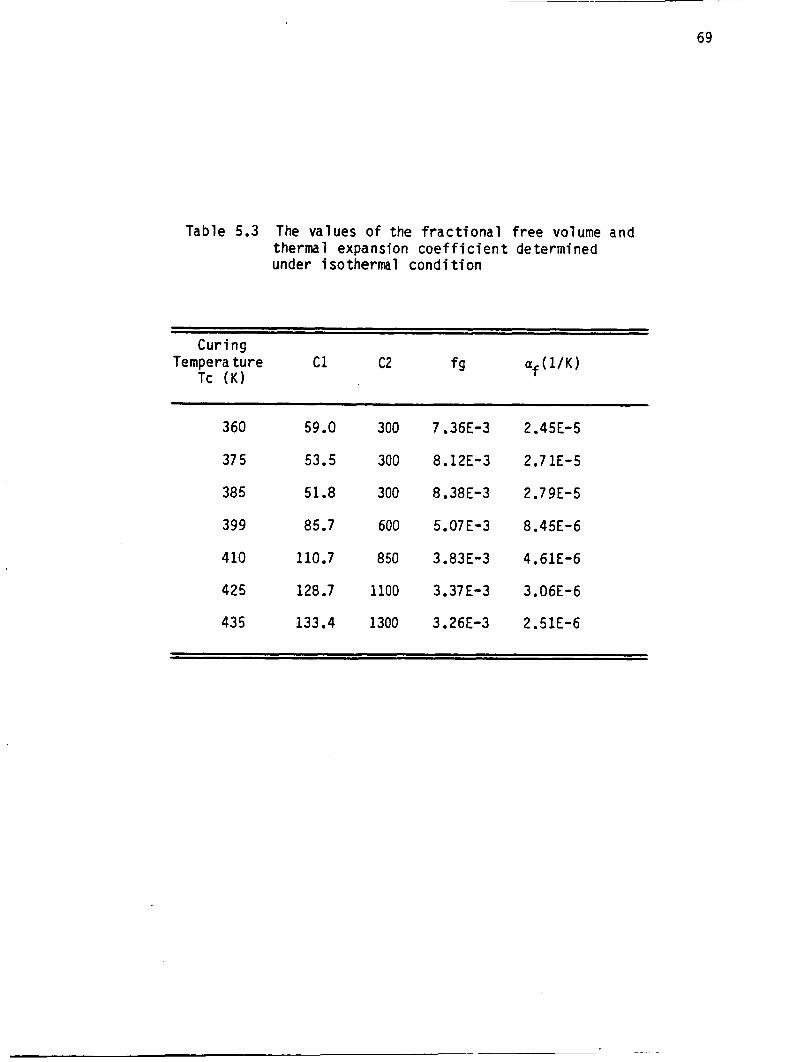
69
Table 5.3 The values of the fractional free volume and thermal expansion coefficient determined under isothermal condition
Temperature c1 c2 Tc ( K )
f g
~
3 60 59.0 300 7.36E-3 2.45E-5
37 5 53.5 300 8.12E-3 2.71E-5
385 51.8 300 8.38E-3 2.79E-5
399 85.7 600 5.07E-3 8.45E-6
4 10 110.7 850 3.83E-3 4.61E-6
425 128 .7 1100 3.37E-3 3.06E-6
435 133.4 1300 3.26E-3 2.51E-6
70
For the thermoset t ing r e s i n system s tud ied here, the magnitude o f
f r a c t i o n a l f r e e volume i s determined by two competing fac to rs . On one
hand, h igher c u r i n g temperatures c rea te l a r g e r d i l a t a t i o n a l e f f e c t s ,
which then generate l a r g e r f r e e volume i n s i d e the ma te r ia l ; on the o the r
hand, i nc reas ing molecular weights as a r e s u l t o f po l ymer i za t i on
r e a c t i o n s reduce the f r e e volume due t o the e l i m i n a t i o n s o f number o f
molecular chain ends. The i n i t i a l decrease i n the f r a c t i o n a l f r e e
volume f g from Tc = 360 t o 385 K i s , there fore , a t t r i b u t e d t o the
i nc reas ing d i l a t a t i o n e f fec ts a t h igher c u r i n g temperatures. This i s
a l s o c o n s i s t e n t w i t h the slokJer advancement of r e a c t i o n s observed i n the
chemoviscosity-t ime p r o f i l e s i n t h i s temperature range. The decrease i n
f g from Tc = 385 t o 435 K suggest t h a t a t t h i s temperature range, the
po lymer i za t i on r e a c t i o n becomes a dominant fac to r .
I
Chapter 6
CONCLUSIONS AND RECOMMENDATIONS
A new analytical model for simulating chemoviscosi t y o f thermo-
setting resin has been formulated. The model i s developed by modifying
the well-established Williams-Landel-Ferry (WLF) theory i n polymer
rheology for thermoplastic materials. From this investigation, the
following conclusions and recommendation are provided:
1. By introducing relations between the glass transition temperature
T g ( t ) and the degree of cure a ( t ) o f the resin system under cure,
the WLF theory is modified to account for the f a c t o r of reaction
time. Thus the model proposed i s capable of simulating viscosity
profiles i n various cure cycles.
2. The reaction kinetics established based on the isothermal cure
condition on the resin system i s related to the case of dynamic
curing condition. T h i s also provides the relation for the viscosity
i n the isothermal and dynamic cases.
3. The glass transition temperature T g ( t ) i n the isothermal case i s
dependent not only on the reaction time t, b u t also on the cure
temperature T. Nevertheless, the relationship o f glass transition
temperature T g ( t ) and degree o f cure a ( t ) established i s a l s o
v a l i d for the case o f dynamic c u r i n g condition.
71
7 2
4. A single set of C1 and C2 i s found to describe adequately a material
state w h i c h represents an average over various structures t h a t occur
inside d u r i n g each isothermal curing cond i t ion . Thus, the C1(T) a n d
C2(T) may be included i n the model t o predict the chemoviscosity
profiles under dynamic curing conditions. Theoretical results
obtained from this model compare favorably well w i t h the
experimental data.
5. I t is recommended t h a t the present research be extended to explore
the a p p l i c a t i o n o f the model to large scale processing.
73
REF E R ENCE S
1. Tajima, Y. A. and Crozier, D., "Thermokinetic Modeling of an Epoxy Resin-I Chemoviscosi ty," Polymer Engineering Science, Vol. 23, A p r i l 1983, pp. 186-190.
2. Kay, A. 0. and Maddock, B. C. , "Exploratory Development on Processing Science of Thick-Section Composites," Lockheed-Georgia Co., At lan ta , Georgia, F33615-82-C-5059, Jan. 1984.
3. Roller, M. B., "Characterization of the Time-Temperature-Viscosi ty Behavior of C u r i n g B-Stage Epoxy Resin," Polymer Engineering Science, Vol. 15, June 1975, pp. 406-414.
4. Carpenter, J. F. , "Processing Science fo r AS/3501-6 Carbon/Epoxy Composites," McDonnell Ai rcraf t Co. , S t . Louis, MO, N00019-81-C- 0184, Jan. 1982.
5. Lee, W. I., Loos, A. C. and Springer, G. S., "Heat of Reaction Degree of Cure and Viscosity o f Hercules 3501-6 Resin," Journal of Composite Materials, Vol. 16, 1982, pp. 510-520.
6. Williams, M. L., Landel, R. F. and Ferry, J. D e , "The Temperature Dependence of Relaxation Mechanisms i n Amorphous Polymers and Other Glass-Forming Liquids," Journal of the American Chemistry Society, Vol . 77 , July 1955, pp. 3/01 - 3701 .
7. Tajima, Y. A. and Crozier, D., "Chemorheology of an Amine Cured Epoxy Resin," SPE ANTEC Conference Proceedings, Society of P l a s t i c s - Engineers, Vol. 30, May 1984 8 PP. 214 2 1 1 .
8. Apicella, A., Nicolais, L. and Halpin, J. C., "The Role o f the Processing Chemo-Rheology on the Aging Behavior of High Performance Epoxy Ma t r i c e s , " 28th National SAMPE Symposium, Society o f the Advancements o f Material and Process tngineering, Vol. 28, 1983, pp. 518-527.
9. Hou, T. H. , "Chemoviscosi ty Modeling for Thermosetting Resins-I," NASA-Langley Research Center, Hampton, Virginia, CR-172443, Nov. 1984.
10. " Ins t ruc t ions of Model DSC-2 Dif fe ren t ia l Scanning Calorimeter," Perkin-Elmer Corp. , Norwark, CT, 1979.
11. Greenspan, 0. , Introduction to Numerical Analysis and Applications, Markham P u b l i s h i n g Co., Chicago, 1911.
74
i
12. Operations Manual o f Rheometric System Four, Rheometrics Inc . , S p r i n g f i e l d , New Jersey, 1981.
13. HOU, T. H, hi, 3. M. and Tiwari, S. N., "Chemoviscosity Modeling fo r Thermosett ing Resins-111 , Chemorheology o f Hercules 3501-6 Resin System," NASA Contractor Report ( t o appear).
14. Sewell, T. A., "Chemical Composition and Processing Spec i f i ca t i ons f o r A i r Force/Navy Advanced Composite Ma t r i x Mater ia ls , " McDonnell A i r c r a f t Co., S t . Louis, MO, F33615-78-C-5177, Dec. 1982.
15. Conte, S. D., Elementary Numerical Analysis, McGraw-Hill Book Co., New York, 1965.
16. Gordon, M. and Simpson. W., "The Rate o f Cure o f Network Polymers and the Superposi t ion Pr inc ip le , " Polymer, Vol. 2, A p r i l 1961; pp. 383-391 .
17. D o o l i t t l e , A. K. and D o o l i t t l e , D. B., "Studies i n Newtonian Flow V. Fu r the r V e r t i f i c a t i o n o f the Free-Space V i s c o s i t y Equation," Journal o f Appl ied Physics. Vol. 28, Aug. 1957, pp. 901-905.
18. Aklnois, J. J., Macknight, W. J. and Shen, M., I n t r o d u c t i o n t o Polymer V i s c o e l a s t i c i t y , John Wiley & Sons, Inc., New York, 1Y12.

75
APPEND ICES
I
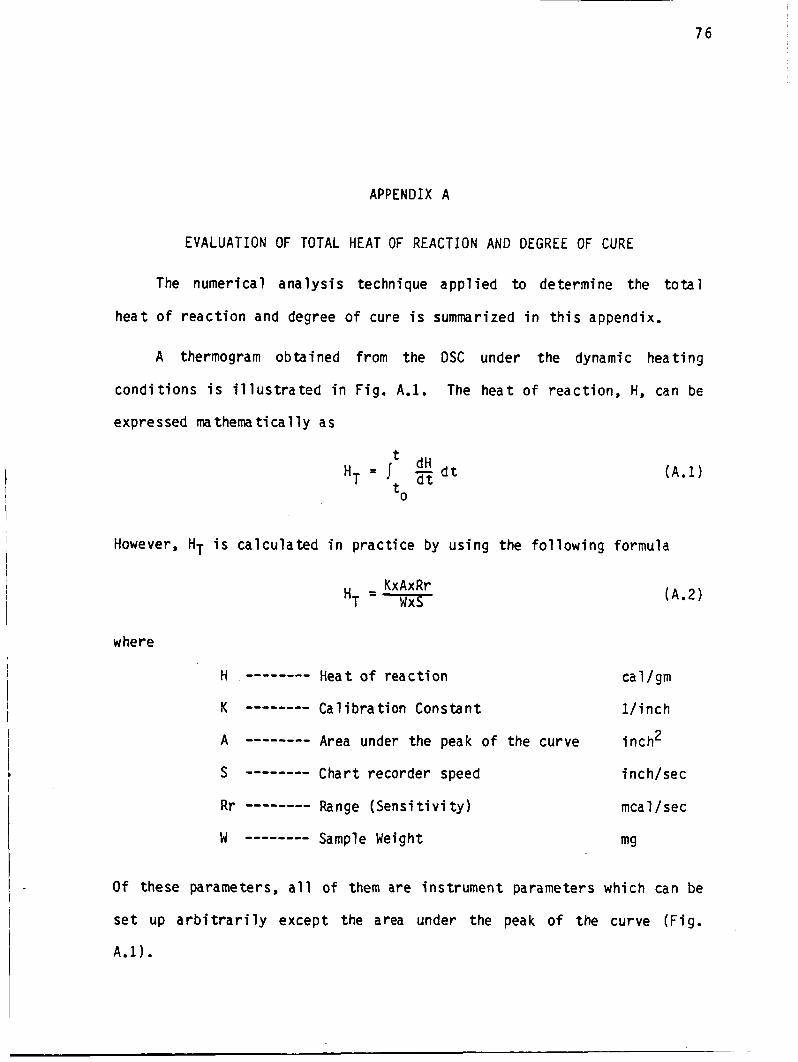
7 6
APPENDIX A
EVALUATION OF TOTAL HEAT OF REACTION AND DEGREE OF CURE
The numerical a n a l y s i s technique a p p l i e d t o determine the t o t a l
heat o f r e a c t i o n and degree o f cure i s summarized i n t h i s appendix.
A thermogram obta ined from the DSC under the dynamic hea t ing
c o n d i t i o n s i s i l l u s t r a t e d i n Fig. A.l. The heat o f reac t i on , H, can be
expressed mathemat ica l ly as
0 L
However, HT i s ca l cu la ted i n p rac t i ce by us ing the f o l l o w i n g formula
KxAxRr HT =-
where
Ca 1 i bra t i o n Cons tan t K --------
( A . 2 )
cal/gm
l / i n c h
Area under the peak o f the curve
Char t recorder speed i nc h/sec s --- ----- R r -------- Range ( S e n s i t i v i t y ) mea 1 / sec
w --------
inch' A --------
Sa mpl e We i g h t mg
O f these parameters, a l l o f them are ins t rument parameters which can be
s e t up a r b i t r a r i l y except the area under the peak o f the curve (F ig .
A.1).
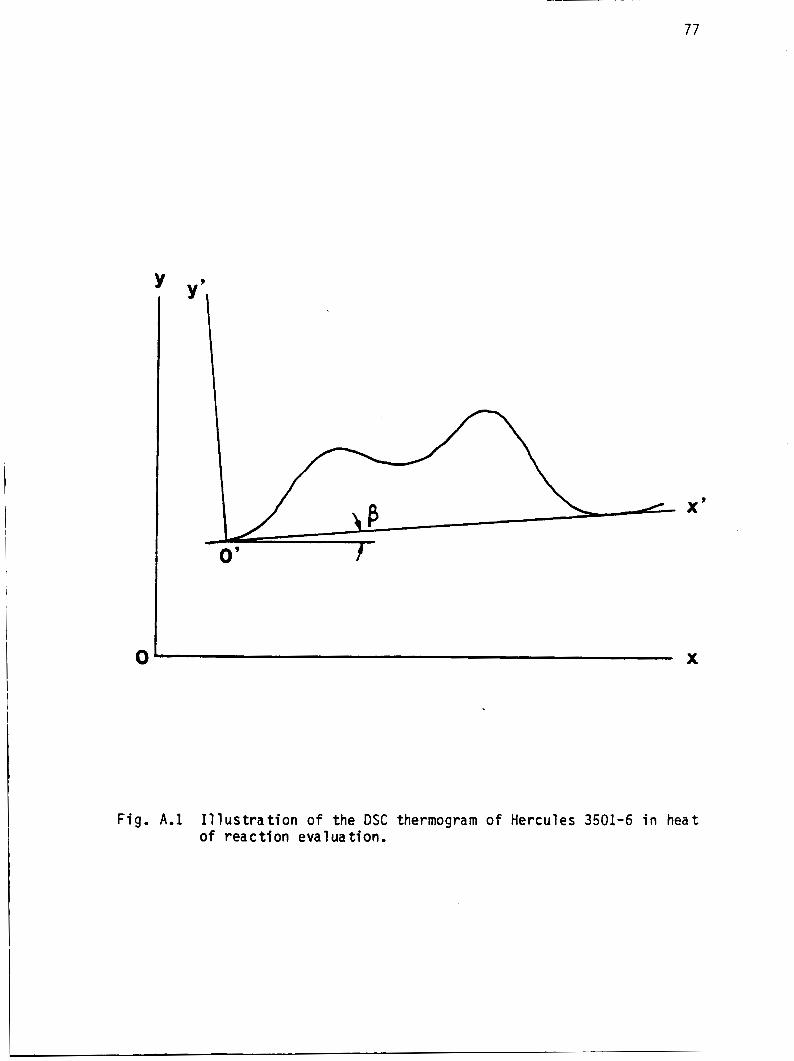
77
Y
A x ’
0’
X
Fig. A . l Illustration o f the DSC thermogram o f Hercules 3501-6 in heat of reaction evaluation.
78
Two numerical techniques, cubic i n t e r p o l a t i n g polynomial approx i -
mat ion and numerical i n t e g r a t i o n were used i n the c a l c u l a t i o n of the
area under the peak o f the curve obta ined from the measurement o f heat
o f r e a c t i o n by DSC.
For the polynomial i n t e r p o l a t i o n , a s e t o f data i s obta ined from
the curve i n the l e n g t h scale as given below:
n X i ( i n c h ) x0, X I , X2 ......... x
I n o rde r t o genera l i ze the ca lcu la t ion , the method o f i n t e r p o l a t i o n w i t h
nonuni formly spaced x values was employed. S i m i l a r l y , we se lec ted the
d i v i d e d d i f f e r e n c e method ins tead o f the Lagrangian polynomial method.
Th is permi ts one t o reuse the previous computation i f i t i s d e s i r a b l e t o
add or s u b t r a c t a p o i n t from the s e t used t o c o n s t r u c t the polynomial.
Looking a t the p r o f i l e o f F ig . A.1, i t was presumed t h a t the data cou ld
be f i t t e d by a cub ic i n t e r p o l a t i n g polynomial. The 3rd-degree
polynomial can be w r i t t e n as fo l lows:
where do, al, a2 and a3 were determined by the d i v i d e d d i f f e r e n c e
method.
The d i v i d e d d i f f e r e n c e i s def ined as
f l - f O fCxo, X I 1 = E
1 0
7 9
a l s o
f ( xo ) = f,
I t i s known t h a t
a. = fo
al = f [ xoDx l l
= fCx x x 3 a2 0’ 1’ 2
a3 = f[XODX1$X2$X31
Thus, Eq. (A.3) can be r e w r i t t e n a s
P3 ( x ) = fo + (x’xo) f[xo’x,] + (x’xo) (X’X,) f[x x x ] 0’ 1’ 2
+ (x-xo) (x-x,) (X-X,) fCx 0’ x 1’ x ZDX3’ ( A . 4 )
Equat ion (A.4) can be a p p l i e d t o every f o u r p a i r s o f g r i d po in ts . I f we
had a s e t of data w i t h ( n + l ) po in ts j u s t l i k e x i and y f ’ we would g e t n-
1/3 cub ic i n t e r p o l a t i n g polynomials.
E ( x ) = R,(X) = (x-x,) (x-x,) (x-x,) (x-x ) f(4)(E) 3 ‘o!
It i s w e l l known t h a t when one uses the cub ic i n t e r p o l a t i n g polynomia l ,
the magnitude o f the e r r o r term i s
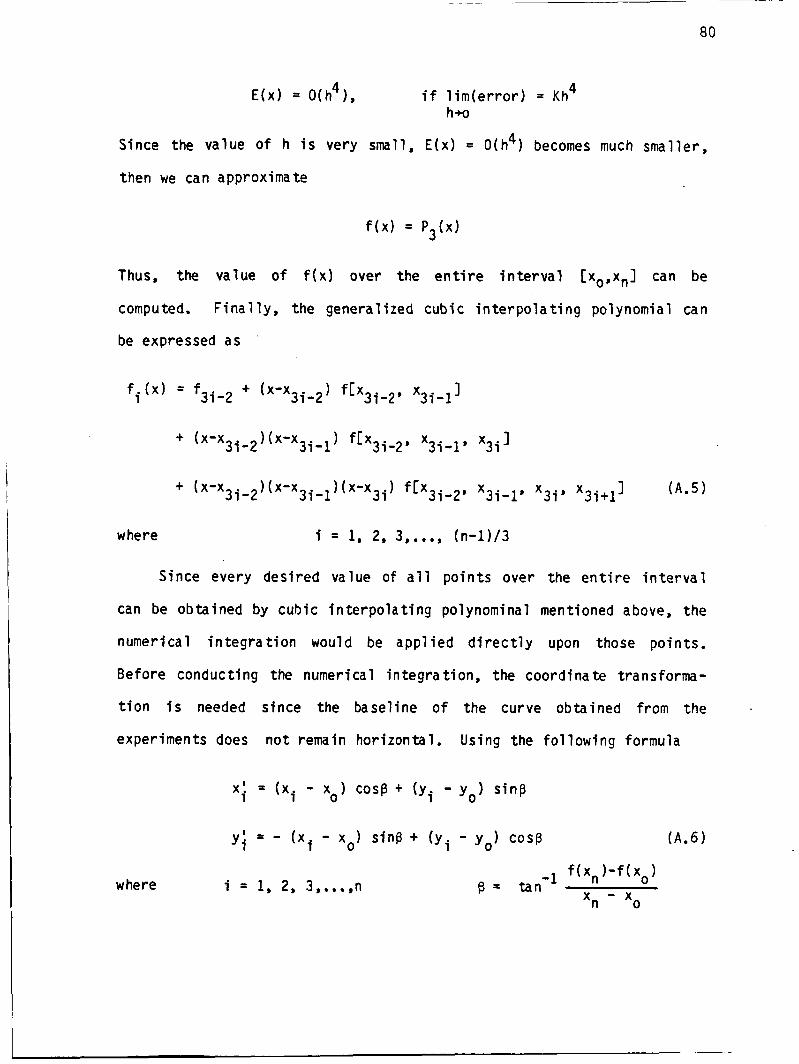
80
4 i f l i m ( e r r o r 1 = Kh 4 E(x) = O(h 1, h+o
Since the value of h i s very small, E(x) = O(h4) becomes much smaller,
then we can approximate
Thus, the value of f ( x ) over the e n t i r e i n t e r v a l [xo,xn] can be
computed. F i n a l l y , the generalized cubic i n t e r p o l a t i n g polynomial can
be expressed as
Since every desired value of a l l po in t s over the e n t i r e i n t e r v a l
can be obtained by cubic i n t e r p o l a t i n g polynominal mentioned above, the
numerical i n teg ra t i o n would be app l i ed d i r e c t l y upon those points.
Before conducting the numerical integra t ion, the coordinate transforma-
t i o n i s needed since the basel ine o f the curve obtained from the
experiments does no t remain hor izontal . Using the fo l l ow ing formula
x ' = (xi - xo) cosp + (yi - y o ) s ine i
y; = - (xi - x,) s ins + (yi - yo ) cos@ (A.6)
where i = 1, 2, 3,...,n f ( xn 1-f ( xo 1
0 xn - x p = tan-'
8 1
a new s e t o f data i n prime coord inates can be obta ined a s
X I i' ' XI 0' x i , x;,...,x' n
I 1 y; : Yo, Y1 ' Y;,.**,Y;
Now, the d i v i d e d d i f f e r e n c e and Eq. (A.4) i n the prime coord inates can
be ob ta ined and a se r ies value o f f ( x ' ) can be ca lcu la ted .
I n c a l c u l a t i n g the area under the peak o f curve, the Simpson Rule
E l l ] , i s employed and t h i s i s given by
x2 A = I f ( x ) dx = (fo+4fl+f2) +m
.* ( A . 7 1
0 X
h5 f ( 4 ) ( 5 ) = O(h5) n a l o c a l e r r o r where
Equat ion (A.7) can be a p p l i e d on every th ree p a i r s o f g r i d p o i n t s f o r a
whole s e t o f data. Thus, f o r e n t i r e i n t e r v a l (xo, xn), the t o t a l area
should be c a l c u l a t e d by the fo l l ow ing equat ion
xn - x where 180 h4 f ( 4 1 ( 5 ) = O(h4) a g loba l e r r o r
Since the value o f h se lec ted i s very small, O(h4) becomes much smaller,
and one may approximate the area by
n c (fi,l+4fi+fi+l) A '3 h
i =1 (A.9)
A program for calculating the area by employing the above procedure has
been coded and l i s t ed in Appendix B.
83
APPENDIX B
COMPUTER CODE FOR APPENDIX A
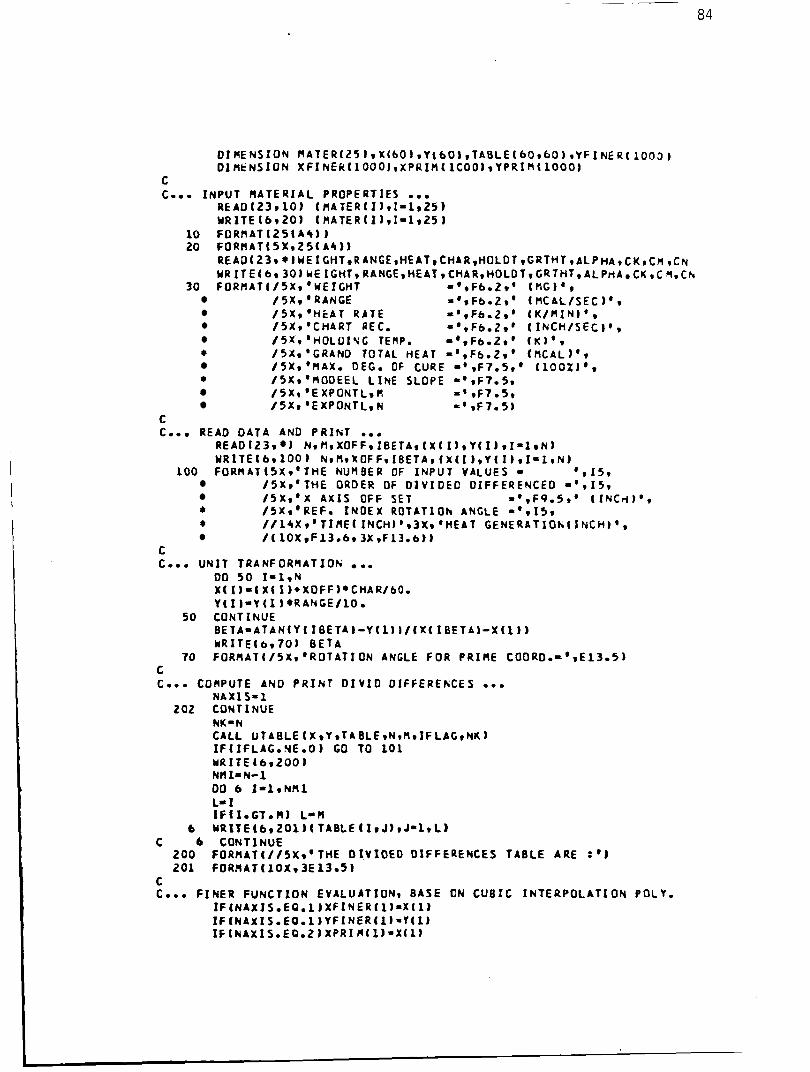
84
01 RE N S I O N D I H k N S I O N X F I N E R 1 1 0 0 0 1 ~ X P R I H ( l C O O l r Y P R 1 ~ ~ l O O O )
H A T E R ( 2 5 I 9 X(60 I r Y ( 6 0 ) . T A B L E ( 60960 1 r Y F I NE R ( 1000 I
C C o o . I N P U T R A T E R I A L P R O P E R T I E S
R E A D (23 r 10 1 t H A T E R ( I 1 r I - l r 2 S 1 W R I T E 1 6 9 2 0 ) I H A T E R ( I r I-1925 I
10 F O R R A T 1 2 5 l A 4 ) 1 20 F O R H A T ( 5 X r 2 5 ( A 4 1 1
R E A D ( 23 WR I T E ( 6 r 3 0 1 &E ICHT, RANGE ( H E A T e CHAR, HOLDTI GRTHT, A L P H A CK
* I H E I GHT * R ANCE (HEAT C H I R r H O L D T T C R T H T r A L P HA t C K 9 C H CN C 4, Ch
30 F O R H A T ( / 5 X r ' Y E I G H T -'tF6.2 V ' (HG 1 ' r / 5 X r 'RANGE s ' r F 6 0 2 r ' ( H C A L / S E C l ' t / S X t ' H i A T R A T E ='*Fb.Zr' ( K / W I N I ' . / S X r ' C H A R T REC. s ' r F 6 0 Z r ' ( I N C H / S E C l ' r / 5 X r ' H O L D I Y G TEMP. = ' r F b . Z r ' (Kb'r
1 / S X r ' C R A N D TOTAL H E A T = ' rFb.Zr ' ( H C A L I ' r / 5 X r ' R A X . DEC. OF CURE - 'rF7.59' (100Z)'r
* /SX. 'HODEEL L I N E S L O P E ='rF7.5r / 5 x * 'E XP0NTL.R =' r F 7 . 5 ~ / s x r ' E X P O N T L - N =' 9F7.5)
C C o o . READ D A T A AND P R I N T ..a
R E A D (23 r ) W R I T E l 6 r l 0 0 ) N r ~ r X O F F r l B E T A r ( X ( I l r Y ( 1 ) r I ~ X ~ N )
100 F O R R A T t S X t ' T H E N U N B E R OF I N P U T V A L U E S - ' t 159 / S X v ' T H E ORDER OF D I V I D E D D I F F E R E N C E D m ' t I 5 r / S X r ' X A X I S OFF S E T f ' r F 9 . 5 ~ ' t 1 N C d ) ' q * / S X r ' R E F . I N O E X R O T A T I O A A N G L E m'r15r
* //~~XI'TIRE(INCHI'~~X~'H€AT C E N E R A T I O H ( 1 N C H b ' ~ / 1 1 0 X r F 1 3 . 6 ~ 3 X r F 1 3 . 6 ) )
N t Hr XOF F r I B E T A r ( X I ) r Y ( I I r Ill N I
C C o o . U N I T T R A N F O R R A T I O N 0 .
DO SO I = X r N X( I l = t X ( I ) * X O F F ) * C H A R / b O . Y t 1 ) - Y t X I * R A N C E / 1 0 .
50 C O N T I N U E B E T A ~ A T A N ( Y I I B E T A l - Y ( l t ~ / ( X ( I B E T A ) - X f l I ) N R I T E t 6 r I O ) B E T A
70 F O R H A T ( / S X I ' R O T A T I O N ANGLE F O R P R I H E C O O R D . = @ r E 1 3 o 5 ) C C o o . COMPUTE A N D P R I N T D I V I D D I F F E R E K C E S ..e
N A X l S i 1
NK-N 202 C O N T I N U E
C A L L U T A B L E ( X r Y * T A B L € r N t R r I F L l C r N K ) I F ( I F L A C . H E . 0 1 GO TO 101 W R I T E 4 6 - 2 0 0 I N H l - N-1 DO 6 I ~ l r N H l L- 1 I F I l . G T . R l L - R W R I T E 16 9 2 0 1 1 ( T A 8 L E ( 1 9 J) 9 J-1- L I 6
C 6 C O N T f N U E 200 F O R H A T ( / / 5 X , ' T H E OXVXOEO D I F F E R E N C E S T A B L E A R E :') 201 F O R A A T ( l O X r 3 E 1 3 ~ S I
C C o o . F I N E R F U N C T I O N E V A L U A T I O N I B A S E CN C U B I C I N T E R P O L A T I O N P O L Y .
IF tNAX15 .EO. 1 I X F I N E R ( 1 I = X ( 1) IF 1NAXIS.EO. 1 ) Y F I N E R ( l I - Y ( 1 J IF I N A X IS. E0.Z 1 X P R I M t 1 ) m X I 1 1
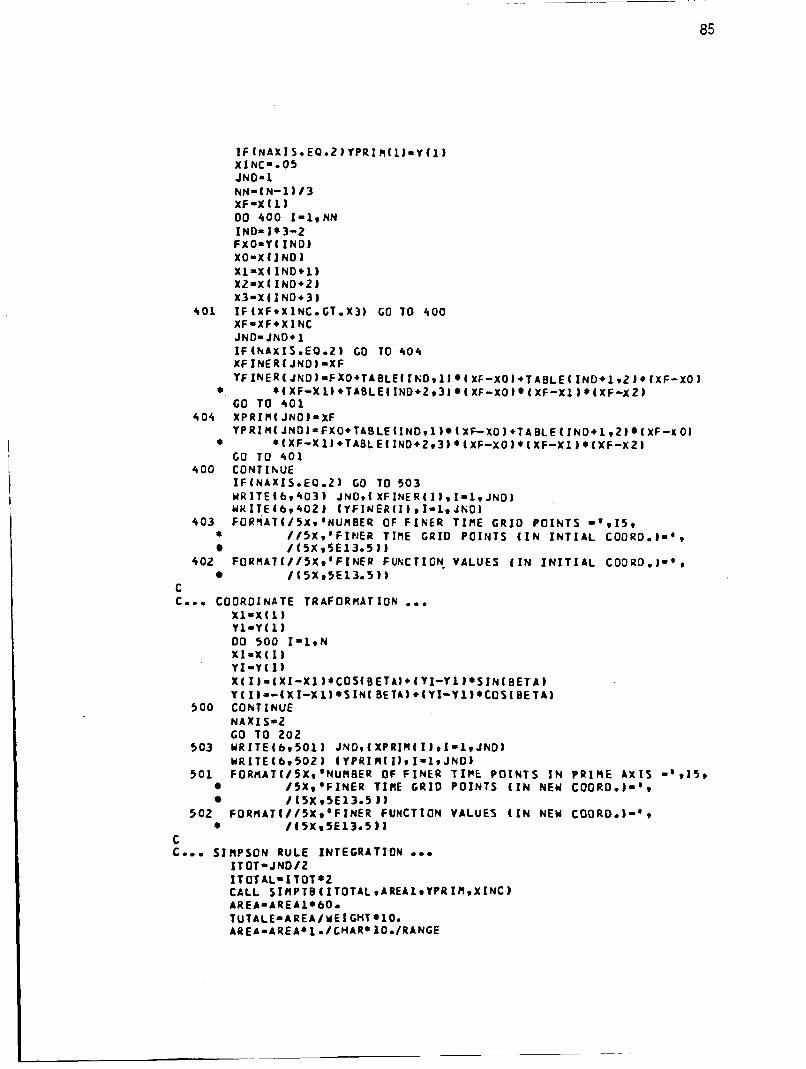
85
IF ( N A X I S . E O . 2 ) Y P R I R ( ~ J - Y I ~ ) XI#C'.OS J N D - 1 NN= lN-1 ) /3 X f -X (1) 00 400 I - l r N N INO= I * 3-2 F X O = Y I I N 0 1 XO=X ( 1 N D 1 x i = x ( 1 ~ 0 4 1 ) X Z = X ( I N D + t J X 3 - X ( I N D + 3 J
X F -X F + X I NC J N D = J N D + 1
X F I N E R t J N D J - X F I F I N E R ( J N D ) r F X O + T A B L E ( I N D 9 1 J ( X F - X O J + T A E L E ( I N O + l r Z I* 1XF-XO 1
GO T O 4 0 1
YP R 1 H I JND J = F X O + T A 6 L E ( I N 0 9 1) ( X F - X O 1 + T A B L E I I N O + 1.2) I XF -I 0)
GO T O 4 0 1
4 0 1 I F ( X f * X I N C . G T . X 3 ) GO T O 400
I F I h A X I S . E O . 2 ) GO TO 404
*. *I X F - X 1 ) + T A B L E 1 I N D + 2 9 3 1 I XF-XO 1 I X F - X 1 J * t X F - X Z J
4 0 4 X P R I H ( J N D J = X F
* * ~ X F - X l J + T A 8 L E ~ I N D + 2 r 3 ~ * I X F - X O J * I X F ~ X l J * ~ X f ~ ~ Z l
4 0 0 C O N T I h U E I F ( N A x I 5 . E O . Z J GO TO 503 W R I T E 1 6 9 4 0 3 WK I T E I 6 9 4 0 2 1
JNDI( X F I N E R I I I 9 1119 J N D J ( Y F I N E R l I J 9 1-19 J h O I
403 F O R M A T I / 5 X * ' N U M B E R OF F I N E R T I R E G R I D P O I N T S -'.I59 * / / S X v ' F I N E R T I R E G R I D P O I N T S ( I N I N T I A L COORD.J= '9
/ ( S X 9 5 E l 3 . 5 11 402 F O R M A T I / / 5 X , ' F I N E R F U k C T I G N . V A L U E S ( I N I N I T I A L CODRD. J - ' 9
/ C S X * 5 € 1 3 . 5 ) ) C C o o . C O O R D I N A T E T R A F O R H A T I O N ..e
X l = x ( l J Y l - Y (1) 00 500 I - L I N X I = X ( 1 ) Y X - Y ( I ) X I I J - I X I - X l J * C ~ ~ ( B E T A ~ ~ ~ ~ I - ~ l ~ * S I N l B E T A ) Y ( I 1 =-( X I - X 1) * S I N ( BETA 1 4 I Y 1-Y 1) *COS 1 BETA)
500 C O N T I N U E N A X I S-2 GO T O 2 0 2 WR I T E ( 6 9 5 0 1 ) Y R ITE ( 69 5 0 2 J
503
5 0 1 F O R ~ ~ A T I / S X I ' N U H B E R OF F I N E R T I P € P O I N T S I N P R I M E A X I S 0 ' 9 1 5 9
J N D 9 t X P R I R t I J 9 1 - 1 9 J N O J 1 Y P R I R ( 1) 9 XI1 9 J N D J
/SX,'FXNER T I R E G R I D P O I N T S ( I N NEW C O O R D . ) - ' * 1 ( 5 X . 5 E l 3 . 5 ) )
502 F O R H A T ( / / ~ X I ' F I N E R F U N C T I O N V A L U E S ( I N NEW COORO.)- ' 9 * / 5 X 1 5 E 1 3 . 5 1) C C... S I R P S O N RULE I N T E G R A T I O N 0 - 0
I T 01- J NO / Z I T O T A L = I TOT *2
T U T A L E = A R E A / Y E I G ~ T * ~ O .
C A L L A R E A - A R E A l * 60
A R E A - A R E A * i . / C H A R ' 10. IRANGE
I !! P TB C I T O T A L * A R E A 1 w YPR I R r X I N C 1
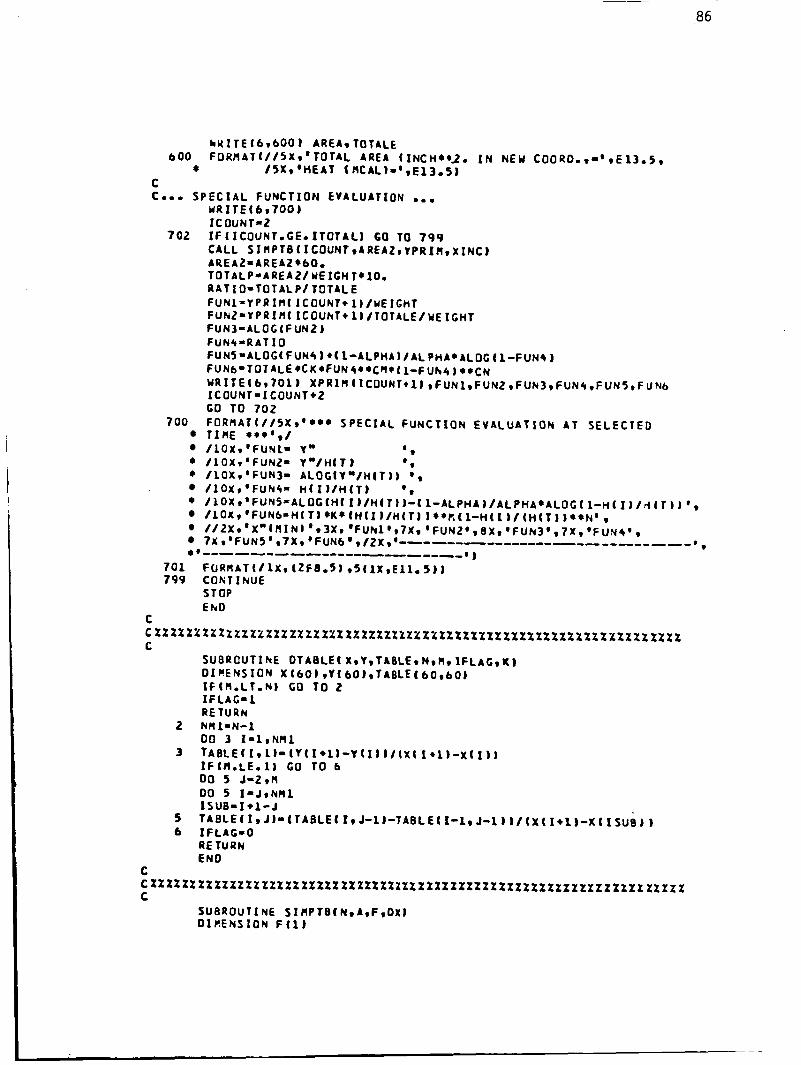
I
7 02
7 00
* * *
I N NEW C O O R O . 9 - ' 9 E 1 3 . 5 9
IC O U N T 4 I F ( I C O U N T * G E m I T O T A L l GO TO 799 C A L L S I H P T B ( I C O U N T ~ A R E A 2 ~ Y P R I ~ ~ X l N C J A R E A Z = A R E A 2 * 6 0 . T O T A L P - A R E A Z / WE I G H T @ l O . R A T I O - T O T A L P / T O T A L E F U N l = Y P R I H ( I C O U N T + lJ/WElCHT F U N 2 - Y P R In( I C O U h T + 1) / T O T A L E / YE ICHT F U N 3 = A L O C ( F U N Z J F U N I = R A T I O F U N S - A L O G ( F U M 4 I + ( L - A L P H A ) / A L P H A * A L O C ( l - F U N I ) F U N b D T O T ~ L E * C K * F U N 4 * * C ~ * ~ l - F U h 4 1 * * C N
I C OUNT= I C O U N T +t GO T O 702
YR I T E t 69 701 1 X P R I R ( I C O U N T + l J 9 FUN19 FUN2 9 FUN39 FUN+ . F U N S * f U N 6
F O R M A T ( / / S X v ' * * * S P E C I A L F U N C T I O N E V A L U A T I O N A T S E L E C T E D T I R E * * * ' e /
/ l O X * ' F U N l = Y " ' 9
/ 1 0 X ' f UNLS Y -/ H( T I ' / L O X 9 ' F U N 3 1 A L O C ( Y -/HI T 1 ) ' .
C
2
3
5 6
C
I F L A C = l R E T U R N Nt! 1 x N - 1 00 3 I - l r N H l
R E TURN E N D
S U E R O U T I NE f I H P 18 I N s A e F r OX 1 D I E E N S I O N F ( 1 J
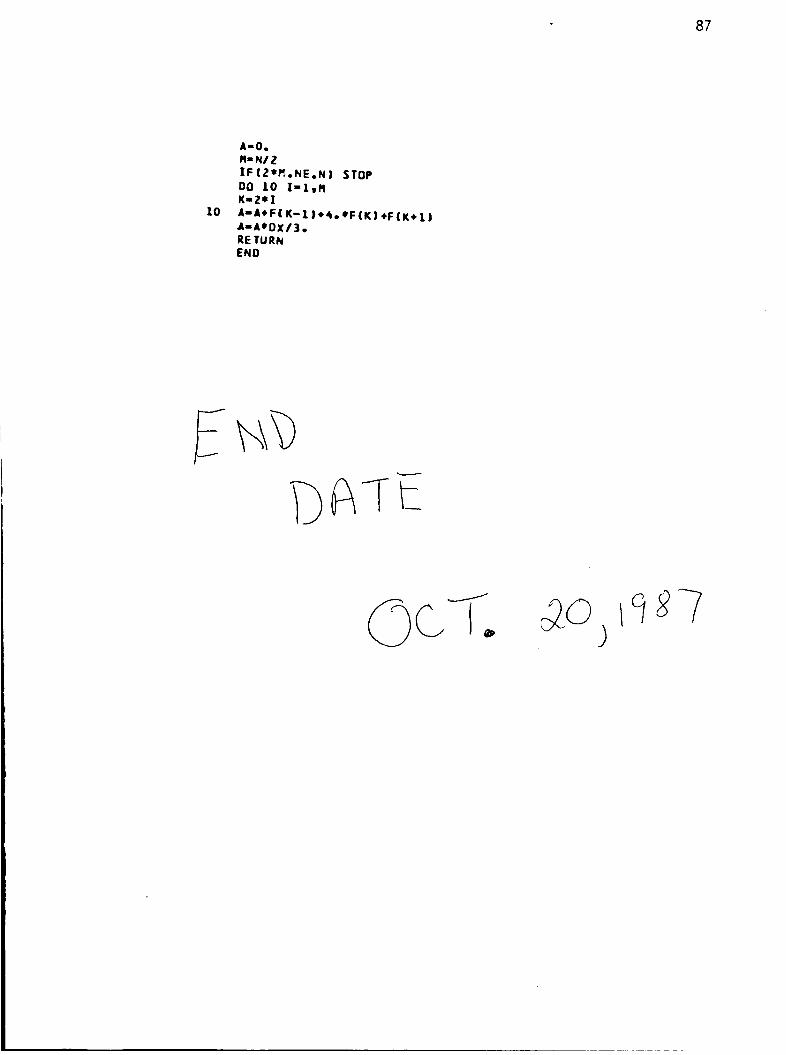
87


![[Nielsen L.E., Landel R.F.] Mechanical Properties (BookFi.org)](https://img.pdfslide.us/doc/110x75/563dbb9e550346aa9aaec22d/nielsen-le-landel-rf-mechanical-properties-bookfiorg.jpg)