Embed Size (px)
Citation preview

Massachusetts
Technical Reference Manual for Estimating Savings from Energy Efficiency Measures
2012 Program Year – Plan Version
October 2011
Massachusetts Technical Reference Manual
October 2011 1 © 2011 Massachusetts Electric and Gas Energy
Efficiency Program Administrators, ALL RIGHTS RESERVED
Table of Contents
TABLE OF CONTENTS ..................................................................................................................................... 1
INTRODUCTION................................................................................................................................................ 5
THE TRM IN THE CONTEXT OF ENERGY EFFICIENCY PROGRAMS.................................................... 6
OVERVIEW ......................................................................................................................................................... 6 PLANNING .......................................................................................................................................................... 6 ANNUAL REPORTING .......................................................................................................................................... 6 UPDATES TO PROGRAM ADMINISTRATOR TRACKING SYSTEMS ............................................................................ 7 EVOLUTION OF PROGRAM AND MEASURE COST EFFECTIVENESS ANALYSIS TOOLS ............................................... 7 EVALUATION, MEASUREMENT AND VERIFICATION .............................................................................................. 8 PLANNING AND REPORTING INFORMATION SYSTEM ............................................................................................. 8 QUALITY CONTROL ............................................................................................................................................ 8
TRM UPDATE PROCESS................................................................................................................................... 9
OVERVIEW ......................................................................................................................................................... 9 KEY STAKEHOLDERS AND RESPONSIBILITIES ....................................................................................................... 9 TRM UPDATE CYCLE ....................................................................................................................................... 10
MEASURE CHARACTERIZATION STRUCTURE ....................................................................................... 11
IMPACT FACTORS FOR CALCULATING ADJUSTED GROSS AND NET SAVINGS ............................. 15
TYPES OF IMPACT FACTORS .............................................................................................................................. 15 STANDARD NET–TO–GROSS FORMULAS ............................................................................................................ 17
RESIDENTIAL ELECTRIC EFFICIENCY MEASURES............................................................................... 19
BEHAVIOR – BASIC EDUCATIONAL MEASURES .................................................................................................. 20 BEHAVIOR – OPOWER ELECTRIC .................................................................................................................... 22 LIGHTING – CFL BULBS ................................................................................................................................... 24 LIGHTING – INDOOR FIXTURES.......................................................................................................................... 28 LIGHTING – OUTDOOR FIXTURES ...................................................................................................................... 31 LIGHTING – TORCHIERES .................................................................................................................................. 33 LIGHTING – LED LIGHTING .............................................................................................................................. 35 LIGHTING – OCCUPANCY SENSORS.................................................................................................................... 37 HOT WATER – DHW MEASURES (ELECTRIC) .................................................................................................... 39 HOT WATER – DHW MEASURES (OIL, GAS AND OTHER)................................................................................... 41 HOT WATER – DISHWASHERS ........................................................................................................................... 43 HOT WATER – WATERBED MATTRESS REPLACEMENT ....................................................................................... 46 HOT WATER – HEAT PUMP WATER HEATER (ELECTRIC).................................................................................... 48 HOT WATER – HEAT PUMP WATER HEATER (OIL AND OTHER FF) ..................................................................... 50 HVAC – CENTRAL AIR CONDITIONING ............................................................................................................. 52 HVAC – AIR SOURCE HEAT PUMP .................................................................................................................... 54 HVAC – DUCTLESS MINISPLIT HEAT PUMP ...................................................................................................... 57 HVAC – DUCTLESS MINISPLIT AIR CONDITIONER ............................................................................................ 60 HVAC – CENTRAL AC QUALITY INSTALLATION VERIFICATION (QIV)............................................................... 62 HVAC – HEAT PUMP QUALITY INSTALLATION VERIFICATION (QIV) ................................................................. 64 HVAC – CENTRAL AC DIGITAL CHECK-UP/TUNE–UP ....................................................................................... 67 HVAC – HEAT PUMP DIGITAL CHECK-UP/TUNE-UP........................................................................................... 69 HVAC – DUCT SEALING................................................................................................................................... 71 HVAC – DOWN SIZE ½ TON ............................................................................................................................. 73 HVAC – RIGHT SIZING ..................................................................................................................................... 75 HVAC – EARLY REPLACEMENT OF CENTRAL AC OR HEAT PUMP UNIT.............................................................. 77 HVAC – QUALITY INSTALLATION WITH DUCT MODIFICATION........................................................................... 80
Massachusetts Technical Reference Manual
October 2011 2 © 2011 Massachusetts Electric and Gas Energy
Efficiency Program Administrators, ALL RIGHTS RESERVED
HVAC – TXV VALVE REPLACEMENT OF FIXED ORIFICE ................................................................................... 82 HVAC – FURNACE FAN MOTORS (ECM) .......................................................................................................... 84 HVAC – BRUSHLESS FAN MOTORS................................................................................................................... 86 HVAC – ROOM AC (LOST OPPORTUNITY) ........................................................................................................ 88 HVAC – WINDOW AC (RETROFIT) ................................................................................................................... 90 HVAC – THERMOSTATS ................................................................................................................................... 95 HVAC – BOILER RESET CONTROLS .................................................................................................................. 97 HVAC – WEATHERIZATION (ELECTRIC)............................................................................................................ 99 HVAC – WEATHERIZATION (OIL AND OTHER FF) ........................................................................................... 101 HVAC – HEATING SYSTEM REPLACEMENT (OIL) ............................................................................................ 103 PROCESS – COMPUTER MONITORS................................................................................................................... 105 PROCESS – COMPUTERS .................................................................................................................................. 107 PROCESS – POOL PUMP ................................................................................................................................... 109 PROCESS – ROOM AIR CLEANER ..................................................................................................................... 111 PROCESS – SET TOP BOXES ............................................................................................................................. 113 PROCESS – SMART STRIPS ............................................................................................................................... 115 PROCESS – TELEVISIONS ................................................................................................................................. 117 REFRIGERATION – REFRIGERATORS (LOST OPPORTUNITY) ............................................................................... 119 REFRIGERATION – REFRIGERATORS (RETROFIT) .............................................................................................. 121 REFRIGERATION – FREEZERS (LOST OPPORTUNITY) ......................................................................................... 124 REFRIGERATION – FREEZERS (RETROFIT) ........................................................................................................ 126 REFRIGERATION – REFRIGERATOR/FREEZER RECYCLING ................................................................................. 128 REFRIGERATION – APPLIANCE REMOVAL ........................................................................................................ 130 ENERGY STAR® HOMES – HEATING, COOLING, AND DHW MEASURES ........................................................ 132 HOME ENERGY SERVICES (MASSSAVE) – VENDOR MEASURES ....................................................................... 134 MULTIFAMILY – VENDOR MEASURES.............................................................................................................. 138 MULTIFAMILY – INSULATION (WALLS, ROOF, FLOOR) (NATIONAL GRID) ......................................................... 141 MULTIFAMILY – DHW MEASURES (SHOWERHEADS AND AERATORS) (NATIONAL GRID) .................................. 143 MULTIFAMILY – DHW MEASURES (TANK AND PIPE WRAP) (NATIONAL GRID) ................................................ 145 MULTIFAMILY – PROGRAMMABLE THERMOSTATS (NATIONAL GRID) ............................................................... 147 MULTIFAMILY – HEAT PUMP TUNE-UP (NATIONAL GRID) ............................................................................... 149 MULTIFAMILY – AIR SEALING (NATIONAL GRID) ............................................................................................ 151 MULTIFAMILY – REFRIGERATORS AND FREEZERS (NATIONAL GRID) ................................................................ 154 MULTIFAMILY – FIXTURES AND CFLS (NATIONAL GRID)................................................................................. 156
COMMERCIAL AND INDUSTRIAL ELECTRIC EFFICIENCY MEASURES.......................................... 160
LIGHTING – ADVANCED LIGHTING DESIGN (PERFORMANCE LIGHTING) ............................................................ 161 LIGHTING – LIGHTING SYSTEMS...................................................................................................................... 165 LIGHTING – LIGHTING CONTROLS ................................................................................................................... 169 LIGHTING – FREEZER/COOLER LEDS .............................................................................................................. 172 HVAC – SINGLE–PACKAGE AND SPLIT SYSTEM UNITARY AIR CONDITIONERS ................................................. 175 HVAC – SINGLE PACKAGE OR SPLIT SYSTEM HEAT PUMP SYSTEMS ................................................................ 180 HVAC – DUAL ENTHALPY ECONOMIZER CONTROLS (DEEC).......................................................................... 185 HVAC – ECM FAN MOTORS .......................................................................................................................... 187 HVAC – ENERGY MANAGEMENT SYSTEM ...................................................................................................... 190 HVAC – HIGH EFFICIENCY CHILLER............................................................................................................... 192 HVAC – HOTEL OCCUPANCY SENSORS........................................................................................................... 196 HVAC – PROGRAMMABLE THERMOSTATS ...................................................................................................... 198 REFRIGERATION – DOOR HEATER CONTROLS .................................................................................................. 200 REFRIGERATION – NOVELTY COOLER SHUTOFF ............................................................................................... 202 REFRIGERATION – ECM EVAPORATOR FAN MOTORS FOR WALK–IN COOLERS AND FREEZERS .......................... 204 REFRIGERATION – CASE MOTOR REPLACEMENT .............................................................................................. 207 REFRIGERATION – COOLER NIGHT COVERS ..................................................................................................... 210 REFRIGERATION – ELECTRONIC DEFROST CONTROL ........................................................................................ 212 REFRIGERATION – EVAPORATOR FAN CONTROLS ............................................................................................ 215 REFRIGERATION – VENDING MISERS ............................................................................................................... 218

Massachusetts Technical Reference Manual
October 2011 3 © 2011 Massachusetts Electric and Gas Energy
Efficiency Program Administrators, ALL RIGHTS RESERVED
FOOD SERVICE – COMMERCIAL ELECTRIC OVENS............................................................................................ 221 FOOD SERVICE – COMMERCIAL ELECTRIC STEAM COOKER .............................................................................. 223 FOOD SERVICE – COMMERCIAL ELECTRIC GRIDDLE......................................................................................... 225 COMPRESSED AIR – HIGH EFFICIENCY AIR COMPRESSORS ............................................................................... 227 COMPRESSED AIR – REFRIGERATED AIR DRYERS ............................................................................................ 230 COMPRESSED AIR – LOW PRESSURE DROP FILTERS ......................................................................................... 233 COMPRESSED AIR – ZERO LOSS CONDENSATE DRAINS .................................................................................... 235 MOTORS/DRIVES – VARIABLE FREQUENCY DRIVES ......................................................................................... 237 CUSTOM MEASURES (LARGE C&I).................................................................................................................. 240 CUSTOM MEASURES (SMALL C&I).................................................................................................................. 244
RESIDENTIAL NATURAL GAS EFFICIENCY MEASURES ..................................................................... 247
BEHAVIOR – OPOWER GAS ........................................................................................................................... 248 HOT WATER – WATER HEATERS ..................................................................................................................... 250 HVAC – BOILERS .......................................................................................................................................... 253 HVAC – BOILER RESET CONTROLS ................................................................................................................ 255 HVAC – COMBO WATER HEATER/BOILER ...................................................................................................... 257 HVAC – EARLY REPLACEMENT BOILER.......................................................................................................... 259 HVAC – FURNACES ....................................................................................................................................... 261 HVAC – HEAT RECOVERY VENTILATOR ......................................................................................................... 263 HVAC – HEATING SYSTEM REPLACEMENT ..................................................................................................... 265 HVAC – THERMOSTATS ................................................................................................................................. 267 HVAC – WI-FI THERMOSTATS ....................................................................................................................... 269 HVAC – WEATHERIZATION ............................................................................................................................ 271 MULTIFAMILY – VENDOR MEASURES.............................................................................................................. 274 MULTIFAMILY – AIR SEALING......................................................................................................................... 276 MULTIFAMILY – DHW SYSTEM ...................................................................................................................... 279 MULTIFAMILY – DHW MEASURES .................................................................................................................. 281 MULTIFAMILY – DUCT SYSTEMS ..................................................................................................................... 283 MULTIFAMILY – HEATING SYSTEM ................................................................................................................. 285 MULTIFAMILY – OTHER INSULATION .............................................................................................................. 287 MULTIFAMILY – PIPE INSULATION .................................................................................................................. 289 MULTIFAMILY – SHELL INSULATION ............................................................................................................... 291 HOME ENERGY SERVICES (GAS WEATHERIZATION) – VENDOR MEASURES....................................................... 295 ENERGY STAR® HOMES – HEATING, COOLING, AND DHW MEASURES ........................................................ 298
COMMERCIAL AND INDUSTRIAL GAS EFFICIENCY MEASURES...................................................... 300
HVAC – BOILERS .......................................................................................................................................... 301 HVAC – BOILER RESET CONTROLS ................................................................................................................ 304 HVAC – COMBO WATER HEATER/BOILER ...................................................................................................... 306 HVAC – CONDENSING UNIT HEATERS ............................................................................................................ 308 HVAC – FURNACES ....................................................................................................................................... 310 HVAC – INFRARED HEATERS ......................................................................................................................... 313 HVAC – THERMOSTATS ................................................................................................................................. 315 HOT WATER – WATER HEATERS ..................................................................................................................... 317 HOT WATER – PRE-RINSE SPRAY VALVE ........................................................................................................ 321 HOT WATER – STEAM TRAPS .......................................................................................................................... 323 HOT WATER – LOW-FLOW SHOWER HEADS .................................................................................................... 325 HOT WATER – FAUCET AERATOR ................................................................................................................... 327 FOOD SERVICE – COMMERCIAL OVENS ........................................................................................................... 329 FOOD SERVICE – COMMERCIAL GRIDDLE ........................................................................................................ 331 FOOD SERVICE – COMMERCIAL FRYER ............................................................................................................ 333 FOOD SERVICE – COMMERCIAL STEAMER ....................................................................................................... 335 CUSTOM MEASURES ....................................................................................................................................... 337
APPENDICES .................................................................................................................................................. 339
Massachusetts Technical Reference Manual
October 2011 4 © 2011 Massachusetts Electric and Gas Energy
Efficiency Program Administrators, ALL RIGHTS RESERVED
APPENDIX A: COMMON LOOKUP TABLES ........................................................................................................ 340 APPENDIX B: COMMON PROGRAM NAMES....................................................................................................... 360 APPENDIX C: NET TO GROSS IMPACT FACTORS................................................................................................ 361 APPENDIX D: NON-RESOURCE IMPACTS .......................................................................................................... 377 APPENDIX E: TABLE OF REFERENCE DOCUMENTS............................................................................................ 396 APPENDIX F: ACRONYMS ................................................................................................................................ 406 APPENDIX G: GLOSSARY ................................................................................................................................ 407

Massachusetts Technical Reference Manual
October 2011 5 © 2011 Massachusetts Electric and Gas Energy
Efficiency Program Administrators, ALL RIGHTS RESERVED
Introduction
This Massachusetts Technical Reference Manual for Estimating Savings from Energy Efficiency
Measures (“TRM”) documents for regulatory agencies, customers, and other stakeholders how the energy efficiency Program Administrators (“PAs”) consistently, reliably, and transparently calculate savings from the installation of efficient equipment, collectively called “measures.” This reference manual provides methods, formulas and default assumptions for estimating energy, peak demand and other resource impacts from efficiency measures. Within this TRM, efficiency measures are organized by the sector for which the measure is eligible and by the primary energy source associated with the measure. The two sectors are Residential and Commercial & Industrial (“C&I”).1 The primary energy sources addressed in this TRM are electricity and natural gas. Each measure is presented in its own section as a “measure characterization.” The measure characterizations provide mathematical equations for determining savings (algorithms), as well as default assumptions and sources, where applicable. In addition, any descriptions of calculation methods or baselines are provided as appropriate. The parameters for calculating savings are listed in the same order for each measure. Algorithms are provided for estimating annual energy and peak demand impacts for primary and secondary energy sources if appropriate. In addition, algorithms or calculated results may be provided for other non-energy impacts (such as water savings or operation and maintenance cost savings). Data assumptions are based on Massachusetts PA data where available. Where Massachusetts-specific data is not available, assumptions may be based on , 1) manufacturer and industry data, 2) a combination of the best available data from jurisdictions in the same region, or 3) credible and realistic factors developed using engineering judgment. The TRM will be reviewed and updated annually to reflect changes in technology, baselines and evaluation results.
1 In this document, the Residential and Low Income programs are represented in a single “Residential” sector due to the degree of overlap in savings assumptions for similar measures in the standard income programs.

Massachusetts Technical Reference Manual
October 2011 6 © 2011 Massachusetts Electric and Gas Energy
Efficiency Program Administrators, ALL RIGHTS RESERVED
The TRM in the Context of Energy Efficiency
Programs
Overview
Due to the ramp-up of energy efficiency spending and savings goals in Massachusetts it is necessary for the acceleration of collaborative efforts focused on:
• Improving processes, • Reexamining the presentation of planning efforts and reporting results, • Developing energy efficiency analysis tools, • Improving source and process documentation, and • Conducting broader and deeper research initiatives.
In addition, due to the number of initiatives underway, it is important to understand the connections between these efforts. Specifically, how does the effort to create and maintain the TRM influence other efforts, and conversely, how is the TRM impacted by other efforts? The purpose of this section is to show how the TRM fits into the process of administering energy efficiency programs in Massachusetts. This section explains how the TRM is connected to the following:
• Planning, • Annual reporting, • Updates to PA tracking systems, • Evolution of program and measure cost effectiveness analysis tools, • Evaluation, Measurement and Verification (“EM&V”), • Planning and Reporting Information System (“PARIS”), and • Quality control.
Planning
The PAs are submitting this version of the TRM (the 2012 TRM) to the Department of Public Utilities (“DPU”) along with their mid term modification proposals for 2012. This version of the 2012 TRM is called the 2012 Program Year – Plan Version TRM. While PAs use many of the same assumptions and algorithms for planning and reporting purposes, the TRM – Plan Version is not meant to document the detailed development of the PAs’ planning assumptions. The TRM – Plan Version provides regulators and stakeholders with a preview of the assumptions and algorithms that the PAs will use for reporting purposes.
Annual Reporting
Each Massachusetts PA submits an Annual Report to the DPU which summarizes the results of its energy efficiency program activities. The first Annual Reports that were filed with a TRM were the 2010 Annual Reports, submitted to the DPU in the summer of 2011. The version of the TRM that was filed at that time

Massachusetts Technical Reference Manual
October 2011 7 © 2011 Massachusetts Electric and Gas Energy
Efficiency Program Administrators, ALL RIGHTS RESERVED
was called the Program Year 2010 – Report Version TRM. The PAs will file a version of the TRM called Program Year 2011 – Report Version TRM at the same time they file the 2011 Annual Reports.
Updates to Program Administrator Tracking Systems
Each Massachusetts PA maintains its own tracking system that contains the energy efficiency data that the PA uses to meet reporting requirements set forth by the DPU. The current design of the PAs’ tracking systems influences the types of assumptions and algorithms that appear in this TRM. The current algorithms leverage inputs that the PAs collect. To the extent that assumptions and algorithms documented in the 2012 TRM – Plan Version were not in use by PAs in 20112, PAs are committed to implementing as many of the common assumptions and algorithms contained in the TRM as are feasible in their tracking systems, or by some other means, by January 2012. If PAs cannot implement changes in time for 2012, PAs are committed to implementing these changes as soon as it is feasible. The January 2012 deadline enables the PAs to use the assumptions and algorithms documented in the 2012 TRM when calculating the savings for the 2012 Annual Reports.
Evolution of Program and Measure Cost Effectiveness Analysis
Tools
The program and measure cost effectiveness analysis tools are Microsoft® Excel® workbooks used by PAs to ensure that the measures and programs that they implement meet the cost effectiveness requirements defined by the DPU in its order Investigation by the Department of Public Utilities on its own Motion into Updating its Energy Efficiency Guidelines Consistent with An Act Relative to Green Communities, D.P.U. 08-50-A (March 16, 2009).3 The PAs also use the output from the cost effectiveness analysis tools to develop the input (data, tables, and graphs) for their Energy Efficiency Plans and Annual Reports. The PAs envision aligning the measure names and the categorization of measures in the TRM with the measure names and categorization of measures in the cost effectiveness analysis tools either directly, or through the use of a translation tool. As stated previously, if the assumptions and algorithms documented in the 2012 TRM are not in use by PAs, the PAs are committed to implementing as many updates as are feasible in their tracking systems, or by some other means, by January 2012. Another means of implementing these updates is by updating the cost effectiveness analysis tool workbooks. For example, some PA tracking systems only calculate gross savings. In this case, any changes to assumptions or calculations that impact net savings need to be made to the cost effectiveness analysis tool workbooks, where the net savings calculations occur.
2 In some cases, one or more PAs discovered that updates to assumptions and algorithms could not be implemented in this timeframe, or all agreed that differences are justified. In the event that an assumption or algorithm could not be implemented in this timeframe, the TRM includes a description of the alternate assumption or algorithm that the PA used to calculate savings, along with the appropriate source documentation. 3 Please see section III. Criteria for Establishing Program Cost-Effectiveness starting on Page 6 for details.

Massachusetts Technical Reference Manual
October 2011 8 © 2011 Massachusetts Electric and Gas Energy
Efficiency Program Administrators, ALL RIGHTS RESERVED
Evaluation, Measurement and Verification
EM&V ensures that “the programs are evaluated, measured, and verified in a way that provides confidence to the public at large that the savings are real and in a way that enables the PAs to report those savings to the Department of Public Utilities with full confidence”.4 The 2012 Program Year – Report Version TRM will be submitted with the 2012 Annual Reports to communicate any updates to assumptions and algorithms due to key learning from EM&V results produced since the 2012 Energy Efficiency Plans and Plan Version TRM were filed. A secondary goal of creating a TRM is to identify areas where savings calculations can be improved. The TRM will inform future EM&V planning as a means to make these improvements.
Planning and Reporting Information System
PARIS is a statewide database maintained by the Department of Energy Resources (“DOER”) that emulates the PAs’ cost effectiveness analysis tools. PAs submit excerpts of the cost effectiveness analysis tool workbooks to DOER which DOER inputs into the PARIS database. As a repository for quantitative data from plans, preliminary reports, and reports, PARIS generates information that includes funding sources, customer profiles, program participation, costs, savings, cost effectiveness and program impact factors from evaluation studies. DOER developed PARIS in 2003 as a collaborative effort with the DPU and the electric PAs. Beginning with the 2010 plans, PARIS holds data from gas PAs as well. As of 2011, PARIS will hold updates made to the PA tracking systems and cost effectiveness analysis tools to align with the assumptions and algorithms shown in the 2012 Plan Version TRM. PAs will submit excerpts of cost effectiveness analysis tool workbooks to DOER. DOER will input these excerpts into the PARIS database.
Quality Control
A secondary function of PARIS is to assist PAs with quality control - to ensure the calculations embodied in the cost effectiveness analysis tool workbooks are accurate. PARIS contains tools and queries which PAs use to ensure that the calculations of net savings are consistent and correct. PAs also conduct their own internal quality control on data. Regulators and stakeholders can use the TRM to confirm that savings inputs and calculations are reasonable and reliable. However, the TRM cannot be used by regulators and stakeholders to replicate the PAs reported savings. The TRM does not provide regulators and stakeholders with data inputs at a level that is detailed enough to enable replication of the savings reported by PAs. These calculations occur within tracking systems, within separate Excel workbooks, and within cost effectiveness analysis tools. However, in the event that regulators and stakeholders request that PAs provide tracking system details, the reproduction of reported data will be possible using the TRM.
4 Form the 2010-2012 Massachusetts Joint Statewide Three-Year Electric Energy Efficiency Plan, October 29, 2009, found at: http://www.ma-eeac.org/docs/DPU-filing/ElectricPlanFinalOct09.pdf. Please see page 275.

Massachusetts Technical Reference Manual
October 2011 9 © 2011 Massachusetts Electric and Gas Energy
Efficiency Program Administrators, ALL RIGHTS RESERVED
TRM Update Process
Overview
This section describes the process for updating the TRM. The update process is synchronized with the filing of program plans and Annual Reports by the PAs with the DPU. Updates to the TRM can include:
• additions of new measures,
• updates to existing TRM measures due to: o changes in baseline equipment or practices, affecting measure savings o changes in efficient equipment or practices, affecting measure savings o changes to deemed savings due the revised assumptions for algorithm parameter values (e.g.,
due to new market research or evaluation studies) o other similar types of changes,
• updates to impact factors (e.g., due to new impact evaluation studies),
• discontinuance of existing TRM measures, and
• updates to the glossary and other background material included in the TRM. Each TRM is associated with a specific program year, which corresponds to the calendar year. This results in two main versions of the TRM for each program year:
• the “Plan Version” is filed with the PA program plans prior to the program year, and
• the “Report Version” includes updates to the “Plan Version” document as needed and is filed with the PA Annual Reports, with the final savings algorithms and factors used to report actual savings.
The TRM for each program year is updated over time as needed to both plan for future program savings and to report actual savings.
Key Stakeholders and Responsibilities
Key stakeholders and their responsibilities for the TRM updates are detailed in the following table.
Stakeholder Responsibilities
TRM Coordinating Committee
� Administrative coordination of TRM activities, including: � Assure collaboration and consensus by the PAs regarding TRM updates � Assure updates are compiled from the PAs and incorporated into the TRM � Coordinate with related program activities (e.g., evaluation and program
reporting processes)
Program Administrators
� Provide one or two representatives each to the TRM Coordinating Committee, either by direct representation or through a proxy (e.g., GasNetworks). Both the planning and evaluation functions should be represented on the Committee.
� Identify needed updates to the TRM � Coordinate with other PAs on all TRM updates � File TRM updates with the DPU

Massachusetts Technical Reference Manual
October 2011 10 © 2011 Massachusetts Electric and Gas Energy
Efficiency Program Administrators, ALL RIGHTS RESERVED
Stakeholder Responsibilities
Department of Energy Resources
� Provide one representative to the TRM Coordinating Committee � Assure coordination with PA submissions of program plans and reported
savings
TRM Update Cycle
The timeline below shows the main milestones of the TRM update cycle over a period of two years. The milestones for the program year (“PY”) 2012 TRM Plan and Report versions are described below the timeline. OCTOBER 2011: The 2012 PY – Plan Version TRM is filed with the PAs’ program plans.
The 2012 Program Year – Plan Version TRM is filed with the DPU jointly with the PAs’ energy efficiency program plans. With regard to the program plans, the TRM is considered a “planning document” in that it provides the documentation for how the PAs plan to count savings for that program year. The TRM is not intended to fully document how the PAs develop their plan estimates for savings. OCTOBER 2011 - JUNE 2013: The 2012 Program Year TRM will be updated as needed based on
evaluation studies and any other updates that will affect reported savings for PY 2012. After the 2012 Program Year – Plan Version TRM has been filed, there may be updates to the TRM to reflect how savings are actually calculated for PY 2012. The most common updates to the TRM will result from new evaluation studies. Results of evaluation studies will be integrated into the working version of the TRM as the studies are completed. Other updates may include the results of working group discussions to achieve greater consistency among PA assumptions. JANUARY 2012: PAs begin to track savings based on the 2012 TRM Beginning in January 2012, the PAs will track savings for PY 2012 based on the 2012 Program Year – Plan Version TRM. JULY 2013: The 2012 Program Year – Report Version TRM will be filed with the PY 2012 Annual
Reports
The 2012 Program Year – Report Version TRM, including any updates relative to the Program Plan version, will be filed with the PAs’ Annual Reports. Updates from the Plan Version may include new evaluation results or changes based on working group discussions, and will be clearly identified in the Report Version AUGUST 2012 - OCTOBER 2012: The PAs prepare the 2013 Program Year – Plan Version TRM
for filing with their 2013 program plans The 2013 Program Year – Plan Version TRM will be based on previous program year versions of the TRM, updated as appropriate for the 2012 program year in preparation for filing with the 2013 program plans. Updates may include results of new evaluations or working group discussions and the addition or removal of energy efficiency measures.
Massachusetts Technical Reference Manual
October 2011 11 © 2011 Massachusetts Electric and Gas Energy
Efficiency Program Administrators, ALL RIGHTS RESERVED
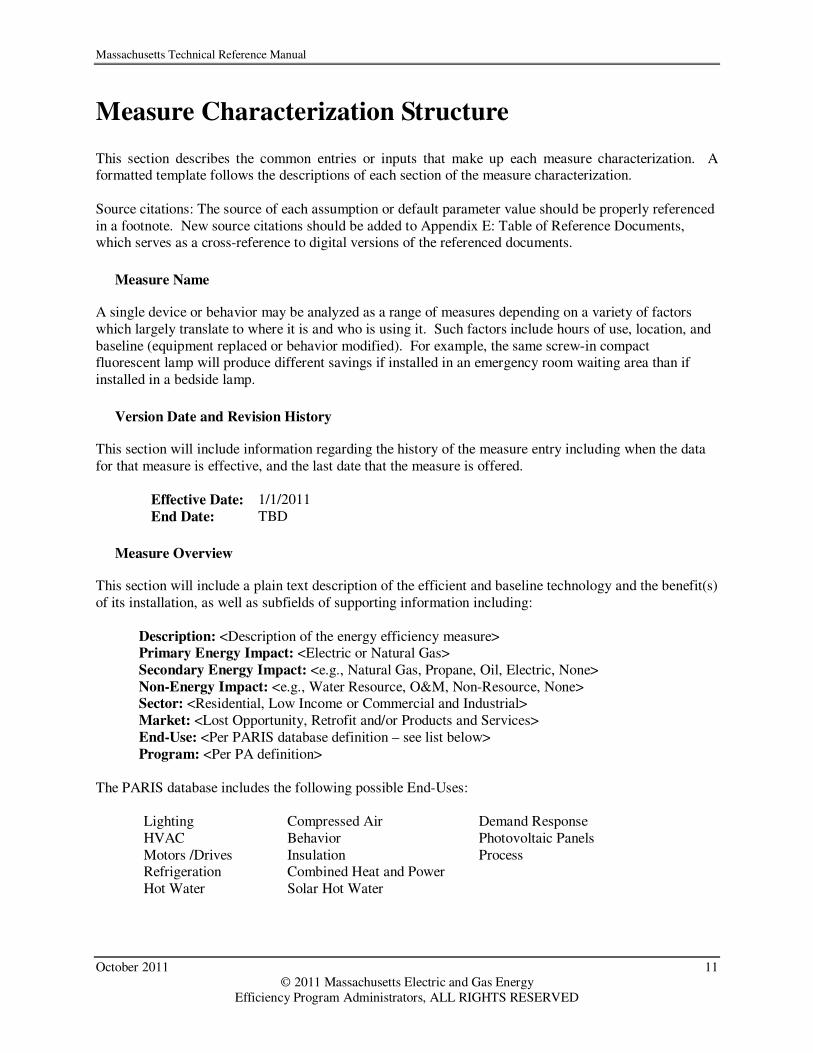
Measure Characterization Structure
This section describes the common entries or inputs that make up each measure characterization. A formatted template follows the descriptions of each section of the measure characterization. Source citations: The source of each assumption or default parameter value should be properly referenced in a footnote. New source citations should be added to Appendix E: Table of Reference Documents, which serves as a cross-reference to digital versions of the referenced documents.
Measure Name
A single device or behavior may be analyzed as a range of measures depending on a variety of factors which largely translate to where it is and who is using it. Such factors include hours of use, location, and baseline (equipment replaced or behavior modified). For example, the same screw-in compact fluorescent lamp will produce different savings if installed in an emergency room waiting area than if installed in a bedside lamp.
Version Date and Revision History
This section will include information regarding the history of the measure entry including when the data for that measure is effective, and the last date that the measure is offered.
Effective Date: 1/1/2011 End Date: TBD
Measure Overview
This section will include a plain text description of the efficient and baseline technology and the benefit(s) of its installation, as well as subfields of supporting information including:
Description: <Description of the energy efficiency measure> Primary Energy Impact: <Electric or Natural Gas> Secondary Energy Impact: <e.g., Natural Gas, Propane, Oil, Electric, None> Non-Energy Impact: <e.g., Water Resource, O&M, Non-Resource, None> Sector: <Residential, Low Income or Commercial and Industrial> Market: <Lost Opportunity, Retrofit and/or Products and Services> End-Use: <Per PARIS database definition – see list below> Program: <Per PA definition>
The PARIS database includes the following possible End-Uses:
Lighting Compressed Air Demand Response HVAC Behavior Photovoltaic Panels Motors /Drives Insulation Process Refrigeration Combined Heat and Power Hot Water Solar Hot Water

Massachusetts Technical Reference Manual
October 2011 12 © 2011 Massachusetts Electric and Gas Energy
Efficiency Program Administrators, ALL RIGHTS RESERVED
Notes
This is an optional section for additional notes regarding anticipated changes going forward. For example, this section would not if there were upcoming statewide evaluations affecting the measure, or any plans for development of statewide tool for calculating measure savings.
Algorithms for Calculating Primary Energy Impacts
This section will describe the method for calculating the primary energy savings in appropriate units, i.e., kWh for electric energy savings or MMBtu for natural gas energy savings. The savings algorithm will be provided in a form similar to the following:
HourskWkWh ×∆=∆ Similarly, the method for calculating electric demand savings will be provided in a form similar to the following:
( ) 1000/EEBASE WattsWattskW −=∆
Below the savings algorithms, a table contains the definitions (and, in some cases, default values) of each input in the equation(s). The inputs for a particular measure may vary and will be reflected as such in this table (see example below). ∆kWh = gross annual kWh savings from the measure
∆kW = gross connected kW savings from the measure
Hours = average hours of use per year
WattsBASE = baseline connected kW
WattsEE = energy efficient connected kW
Baseline Efficiency
This section will include a statement of the assumed equipment/operation efficiency in the absence of program intervention. Multiple baselines will be provided as needed, e.g., for different markets. Baselines may refer to reference tables or may be presented as a table for more complex measures.
High Efficiency
This section will describe the high efficiency case from which the energy and demand savings are determined. The high efficiency case may be based on specific details of the measure installation, minimum requirements for inclusion in the program, or an energy efficiency case based on historical participation. It may refer to tables within the measure characterization or in the appendices or efficiency standards set by organizations such as ENERGY STAR® and the Consortium for Energy Efficiency.
Hours
This section will note operating hours for equipment that is either on or off, or equivalent full load hours for technologies that operate at partial loads, or reduced hours for controls. Reference tables will be used as needed to avoid repetitive entries.

Massachusetts Technical Reference Manual
October 2011 13 © 2011 Massachusetts Electric and Gas Energy
Efficiency Program Administrators, ALL RIGHTS RESERVED
Measure Life
Measure Life includes equipment life and the effects of measure persistence. Equipment life is the number of years that a measure is installed and will operate until failure. Measure persistence takes into account business turnover, early retirement of installed equipment, and other reasons measures might be removed or discontinued.
Secondary Energy Impacts
This section described any secondary energy impacts associated with the energy efficiency measure, including all assumptions and the method of calculation.
Non-Energy Impacts
This section describes any non-energy impacts associated with the energy efficiency measure, including all assumptions and the method of calculation.
Impact Factors for Calculating Adjusted Gross Savings
The section includes a table of impact factor values for adjusting gross savings. Impact factors for calculating net savings (free ridership, spillover and/or net-to-gross ratio) are in Appendix C: Net to Gross Impact Factors. Further descriptions of the impacts factors and the sources on which they are based are described below the table.
Measure Program PA ISR SPF RRE RRSP RRWP CFSP CFWP CFSSP CFWSP
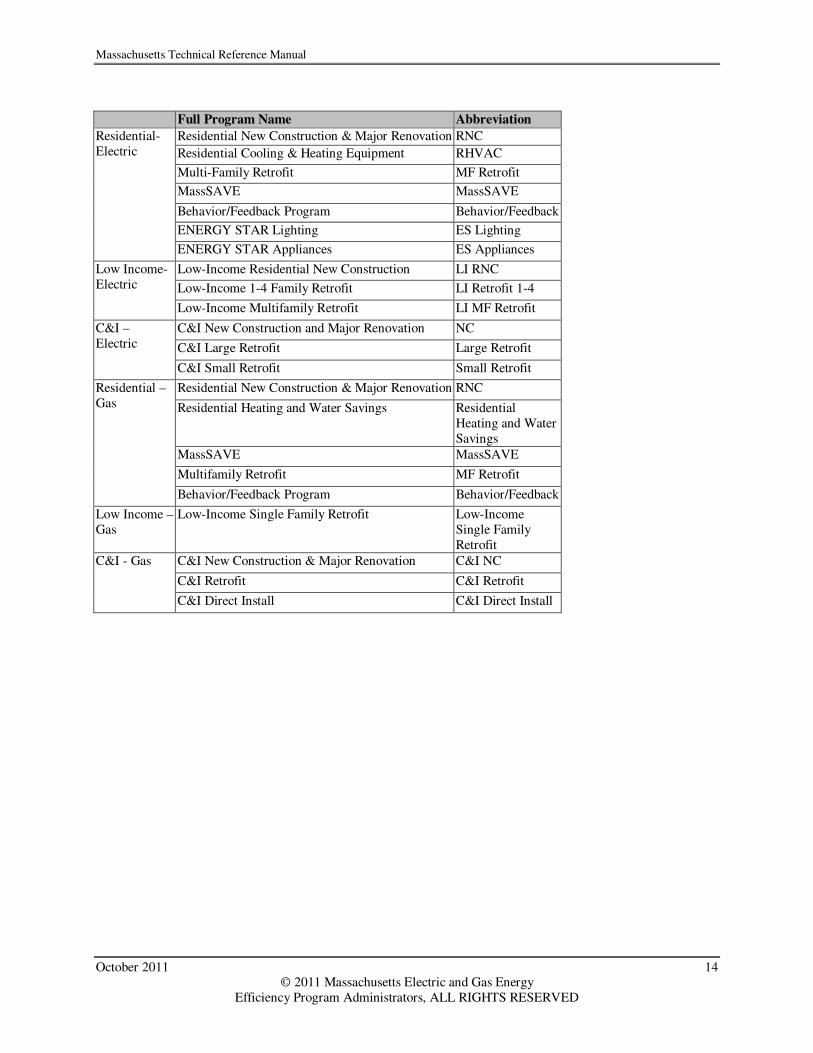
Abbreviated program names may be used in the above table. The mapping of full program names to abbreviated names is given below.
Massachusetts Technical Reference Manual
October 2011 14 © 2011 Massachusetts Electric and Gas Energy
Efficiency Program Administrators, ALL RIGHTS RESERVED
Full Program Name Abbreviation
Residential New Construction & Major Renovation RNC
Residential Cooling & Heating Equipment RHVAC
Multi-Family Retrofit MF Retrofit
MassSAVE MassSAVE
Behavior/Feedback Program Behavior/Feedback
ENERGY STAR Lighting ES Lighting
Residential- Electric
ENERGY STAR Appliances ES Appliances
Low-Income Residential New Construction LI RNC
Low-Income 1-4 Family Retrofit LI Retrofit 1-4
Low Income- Electric
Low-Income Multifamily Retrofit LI MF Retrofit
C&I New Construction and Major Renovation NC
C&I Large Retrofit Large Retrofit
C&I – Electric
C&I Small Retrofit Small Retrofit
Residential New Construction & Major Renovation RNC
Residential Heating and Water Savings Residential Heating and Water Savings
MassSAVE MassSAVE
Multifamily Retrofit MF Retrofit
Residential – Gas
Behavior/Feedback Program Behavior/Feedback
Low Income – Gas
Low-Income Single Family Retrofit Low-Income Single Family Retrofit
C&I New Construction & Major Renovation C&I NC
C&I Retrofit C&I Retrofit
C&I - Gas
C&I Direct Install C&I Direct Install

Massachusetts Technical Reference Manual
October 2011 15 © 2011 Massachusetts Electric and Gas Energy
Efficiency Program Administrators, ALL RIGHTS RESERVED
Impact Factors for Calculating Adjusted Gross and
Net Savings
PAs use the algorithms in the Measure Characterization sections to calculate the gross savings for energy efficiency measures. Impact factors are then applied to make various adjustments to the gross savings estimate to account for the performance of individual measures or energy efficiency programs as a whole in achieving energy reductions as assessed through evaluation studies. Impacts factors address both the technical performance of energy efficiency measures and programs, accounting for the measured energy and demand reductions realized compared to the gross estimated reductions, as well as the programs’ effect on the market for energy efficient products and services. This section describes the types of impact factors used to make such adjustments, and how those impacts are applies to gross savings estimates. Definitions of the impact factors and other terms are also provided in Appendix G: Glossary.
Types of Impact Factors
The impact factors used to adjust savings fall into one of two categories:
Impact factors used to adjust gross savings:
• In-Service Rate (“ISR”)
• Savings Persistence Factor (“SPF”)
• Realization Rate (“RR”)
• Summer and Winter Peak Demand Coincidence Factors (“CF”). Impact factors used to calculate net savings:
• Free-Ridership (“FR”) and Spillover (“SO”) Rates
• Net-to-Gross Ratios (“NTG”). The in-service rate is the actual portion of efficient units that are installed. For example, efficient lamps may have an in-service rate less than 1.00 since some lamps are purchased as replacement units and are not immediately installed. The ISR is 1.00 for most measures. The savings persistence factor is the portion of first-year energy or demand savings expected to persist over the life of the energy efficiency measure. The SPF is developed by conducting surveys of installed equipment several years after installation to determine the actual operational capability of the equipment. The SPF is 1.00 for most measures. In contrast to savings persistence, measure persistence takes into account business turnover, early retirement of installed equipment, and other reasons the installed equipment might be removed or discontinued. Measure persistence is generally incorporated as part of the measure life, and therefore is not included as a separate impact factor. The realization rate is used to adjust the gross savings (as calculated by the savings algorithms) based on impact evaluation studies. The realization rate is equal to the ratio of measure savings developed from an

Massachusetts Technical Reference Manual
October 2011 16 © 2011 Massachusetts Electric and Gas Energy
Efficiency Program Administrators, ALL RIGHTS RESERVED
impact evaluation to the estimated measure savings derived from the savings algorithms. The realization rate does not include the effects of any other impact factors. Depending on the impact evaluation study, there may be separate realization rates for energy (kWh), peak demand (kW), or fossil fuel energy (MMBtu). A coincidence factor adjusts the connected load kW savings derived from the savings algorithm. A coincidence factor represents the fraction of the connected load reduction expected to occur at the same time as a particular system peak period. The coincidence factor includes both coincidence and diversity factors combined into one number, thus there is no need for a separate diversity factor in this TRM. Coincidence factors are provided for both the on-peak and seasonal peak periods as defined by the ISO New England for the Forward Capacity Market (“FCM”), and are calculated consistently with the FCM methodology. Electric demand reduction during the ISO New England peak periods is defined as follows: On-Peak Definition: � Summer On-Peak: average demand reduction from 1:00-5:00 PM on non-holiday weekdays in June
July, and August � Winter On-Peak: average demand reduction from 5:00-7:00 PM on non-holiday weekdays in December
and January Seasonal Peak Definition: � Summer Seasonal Peak: demand reduction when the real-time system hourly load is equal to or greater
than 90% of the most recent “50/50” system peak forecast for June-August � Winter Seasonal Peak: demand reduction when the real-time system hourly load is equal to or greater
than 90% of the most recent “50/50” system peak load forecast for December-January. The values described as Coincidence Factors in the TRM are not always consistent with the strict definition of a Coincidence Factor (CF). It would be more accurate to define the Coincidence Factor as “the value that is multiplied by the Gross kW value to calculate the average kW reduction coincident with the peak periods.” A coincidence factor of 1.00 may be used because the coincidence is already included in the estimate of Gross kW; this is often the case when the “Max kW Reduction” is not calculated and instead the “Gross kW” is estimated using the annual kWh reduction estimate and a loadshape model. A free-rider is a customer who participates in an energy efficiency program (and gets an incentive) but who would have installed some or all of the same measure(s) on their own, with no change in timing of the installation, if the program had not been available. The free-ridership rate is the percentage of savings attributable to participants who would have installed the measures in the absence of program intervention. The spillover rate is the percentage of savings attributable to a measure or program, but additional to the gross (tracked) savings of a program. Spillover includes the effects of 1) participants in the program who install additional energy efficient measures outside of the program as a result of participating in the program, and 2) non-participants who install or influence the installation of energy efficient measures as a result of being aware of the program. These two components are the participant spillover (SOP) and non-participant spillover (SONP). The net savings value is the final value of savings that is attributable to a measure or program. Net savings differs from gross savings because it includes the effects of the free-ridership and/or spillover rates.
Massachusetts Technical Reference Manual
October 2011 17 © 2011 Massachusetts Electric and Gas Energy
Efficiency Program Administrators, ALL RIGHTS RESERVED
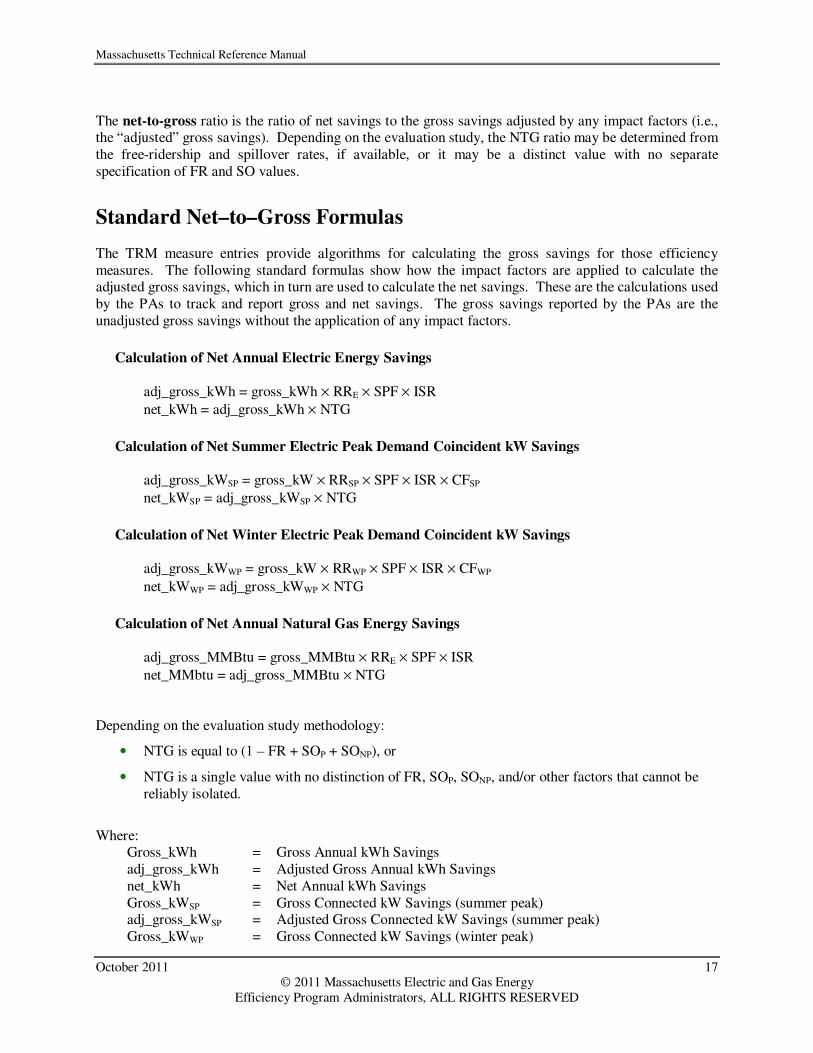
The net-to-gross ratio is the ratio of net savings to the gross savings adjusted by any impact factors (i.e., the “adjusted” gross savings). Depending on the evaluation study, the NTG ratio may be determined from the free-ridership and spillover rates, if available, or it may be a distinct value with no separate specification of FR and SO values.
Standard Net–to–Gross Formulas
The TRM measure entries provide algorithms for calculating the gross savings for those efficiency measures. The following standard formulas show how the impact factors are applied to calculate the adjusted gross savings, which in turn are used to calculate the net savings. These are the calculations used by the PAs to track and report gross and net savings. The gross savings reported by the PAs are the unadjusted gross savings without the application of any impact factors.
Calculation of Net Annual Electric Energy Savings
adj_gross_kWh = gross_kWh × RRE × SPF × ISR
net_kWh = adj_gross_kWh × NTG
Calculation of Net Summer Electric Peak Demand Coincident kW Savings
adj_gross_kWSP = gross_kW × RRSP × SPF × ISR × CFSP
net_kWSP = adj_gross_kWSP × NTG
Calculation of Net Winter Electric Peak Demand Coincident kW Savings
adj_gross_kWWP = gross_kW × RRWP × SPF × ISR × CFWP
net_kWWP = adj_gross_kWWP × NTG
Calculation of Net Annual Natural Gas Energy Savings
adj_gross_MMBtu = gross_MMBtu × RRE × SPF × ISR
net_MMbtu = adj_gross_MMBtu × NTG Depending on the evaluation study methodology:
• NTG is equal to (1 – FR + SOP + SONP), or
• NTG is a single value with no distinction of FR, SOP, SONP, and/or other factors that cannot be reliably isolated.
Where:
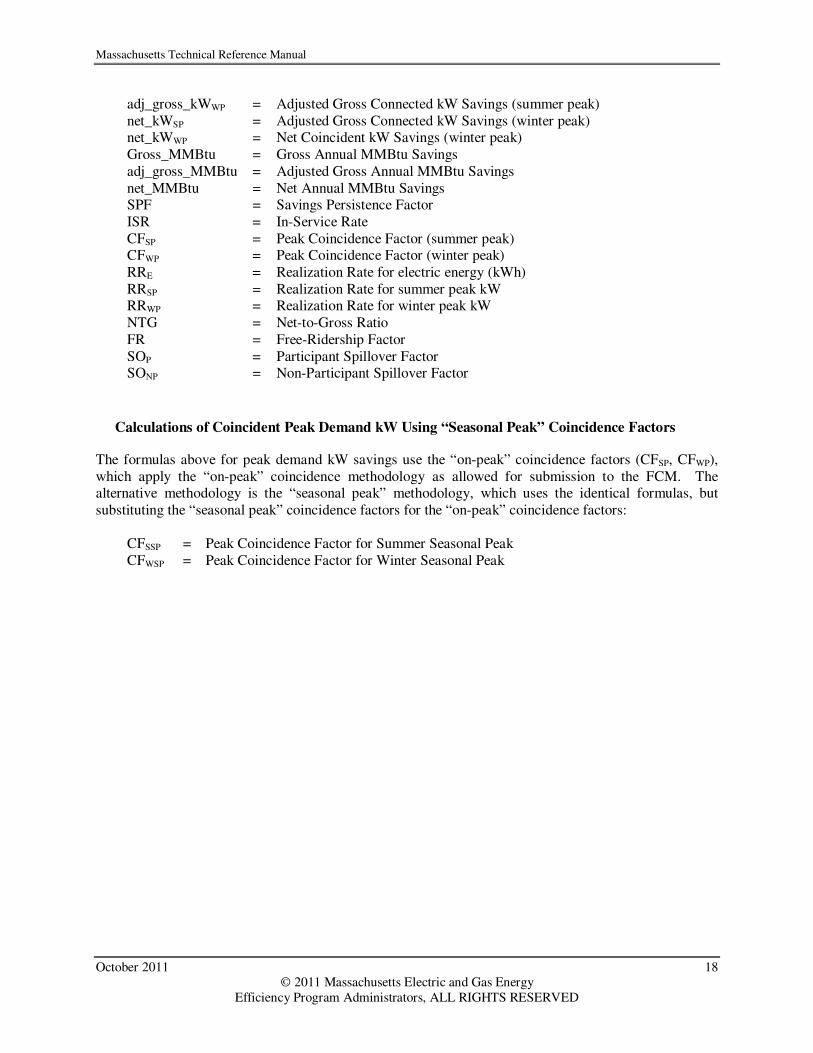
Gross_kWh = Gross Annual kWh Savings adj_gross_kWh = Adjusted Gross Annual kWh Savings net_kWh = Net Annual kWh Savings Gross_kWSP = Gross Connected kW Savings (summer peak) adj_gross_kWSP = Adjusted Gross Connected kW Savings (summer peak) Gross_kWWP = Gross Connected kW Savings (winter peak)
Massachusetts Technical Reference Manual
October 2011 18 © 2011 Massachusetts Electric and Gas Energy
Efficiency Program Administrators, ALL RIGHTS RESERVED
adj_gross_kWWP = Adjusted Gross Connected kW Savings (summer peak) net_kWSP = Adjusted Gross Connected kW Savings (winter peak) net_kWWP = Net Coincident kW Savings (winter peak) Gross_MMBtu = Gross Annual MMBtu Savings adj_gross_MMBtu = Adjusted Gross Annual MMBtu Savings net_MMBtu = Net Annual MMBtu Savings SPF = Savings Persistence Factor ISR = In-Service Rate CFSP = Peak Coincidence Factor (summer peak) CFWP = Peak Coincidence Factor (winter peak) RRE = Realization Rate for electric energy (kWh) RRSP = Realization Rate for summer peak kW RRWP = Realization Rate for winter peak kW NTG = Net-to-Gross Ratio FR = Free-Ridership Factor SOP = Participant Spillover Factor SONP = Non-Participant Spillover Factor
Calculations of Coincident Peak Demand kW Using “Seasonal Peak” Coincidence Factors
The formulas above for peak demand kW savings use the “on-peak” coincidence factors (CFSP, CFWP), which apply the “on-peak” coincidence methodology as allowed for submission to the FCM. The alternative methodology is the “seasonal peak” methodology, which uses the identical formulas, but substituting the “seasonal peak” coincidence factors for the “on-peak” coincidence factors:
CFSSP = Peak Coincidence Factor for Summer Seasonal Peak CFWSP = Peak Coincidence Factor for Winter Seasonal Peak
Massachusetts Technical Reference Manual Residential Electric Efficiency Measures
October 2011 19 © 2011 Massachusetts Electric and Gas Energy
Efficiency Program Administrators, ALL RIGHTS RESERVED
Residential Electric Efficiency Measures

Massachusetts Technical Reference Manual Residential Electric Efficiency Measures
October 2011 20 © 2011 Massachusetts Electric and Gas Energy
Efficiency Program Administrators, ALL RIGHTS RESERVED
Behavior – Basic Educational Measures
Version Date and Revision History
Effective Date: 1/1/2011 End Date: TBD
Measure Overview
Description: Installation of basic educational measures during an audit to help customers become more aware of energy efficiency. Primary Energy Impact: Electric Secondary Energy Impact: None Non-Energy Impact: Low-Income Annual Discounted Rate Cost Reduction, Low-Income One-Time Arrearage Reduction Sector: Low Income Market: Retrofit End Use: Behavior Program: Low-Income 1-4 Family Retrofit, Low-Income Multifamily Retrofit
Algorithms for Calculating Primary Energy Impact
Unit savings are deemed based on study results:
kWhkWh ∆=∆
),max( WPSP kWkWkW ∆∆=∆
Where: Unit = Completed audit ∆kWh = Average annual kWh savings per unit: 138 kWh5 ∆kW = Max kW Reduction: 0.038 kW6
Baseline Efficiency
The baseline efficiency case assumes no measures installed.
High Efficiency
The high efficiency case includes basic educational measures such as, low flow showerheads, pool and air conditioner timers, and programmable thermostats.
Hours
Not applicable.
5 The Cadmus Group, Inc. (2009). Impact Evaluation of the 2007 Appliance Management Program and Low Income
Weatherization Program. Prepared for National Grid. 6 Estimated using demand allocation methodology described in: Quantec, LLC (2000). Impact Evaluation: Single-Family
EnergyWise Program. Prepared for National Grid.

Massachusetts Technical Reference Manual Residential Electric Efficiency Measures
October 2011 21 © 2011 Massachusetts Electric and Gas Energy
Efficiency Program Administrators, ALL RIGHTS RESERVED
Measure Life
The measure life is 5 years.7
Secondary Energy Impacts
There are no secondary energy impacts for this measure.
Non-Energy Impacts
Benefit Type Description Savings
Annual Non-Resource See Appendix D: Non-Resource Impacts See Appendix D: Non-Resource Impacts
One-Time Non-Resource See Appendix D: Non-Resource Impacts See Appendix D: Non-Resource Impacts
Impact Factors for Calculating Adjusted Gross Savings
Measure Name Program PA ISR SPF RRE RRSP RRWP CFSP CFWP
Baseload LI 1-4 Retrofit All 1.00 1.00 1.00 1.00 1.00 0.35 1.00
Baseload LI MF Retrofit All (not National Grid) 1.00 1.00 1.00 1.00 1.00 0.35 1.00
In-Service Rates All installations have 100% in service rate since all PAs programs include verification of equipment installations. Savings Persistence Factor All PAs use 100% savings persistence factors. Realization Rates
Realization rates are set to 100% since deemed savings are based on evaluation results. Coincidence Factors
Coincidence factors are estimated using the demand allocation methodology described in the 2000 EnergyWise program impact evaluation.8
7 Massachusetts Common Assumption. 8 Quantec, LLC (2000). Impact Evaluation: Single-Family EnergyWise Program. Prepared for National Grid.
Massachusetts Technical Reference Manual Residential Electric Efficiency Measures
October 2011 22 © 2011 Massachusetts Electric and Gas Energy
Efficiency Program Administrators, ALL RIGHTS RESERVED
Behavior – OPOWER Electric
Version Date and Revision History
Effective Date: 1/1/2011 (revised for 1/1/2012) End Date: TBD
Measure Overview
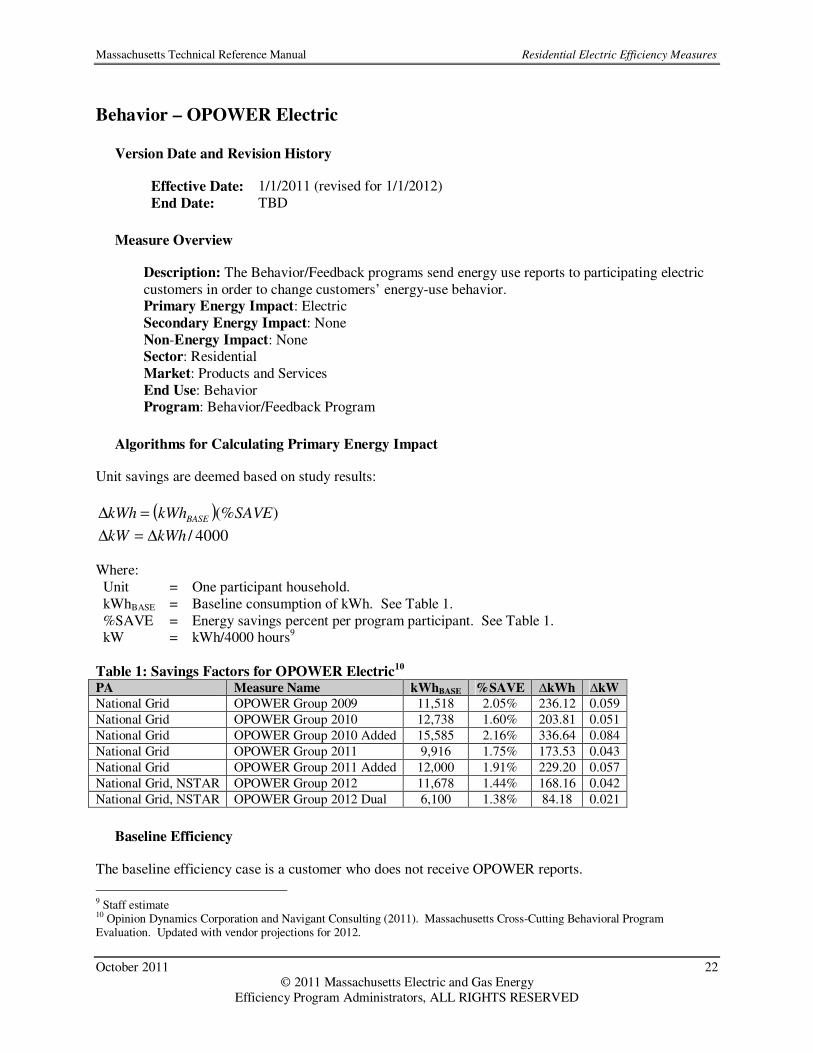
Description: The Behavior/Feedback programs send energy use reports to participating electric customers in order to change customers’ energy-use behavior. Primary Energy Impact: Electric Secondary Energy Impact: None Non-Energy Impact: None Sector: Residential Market: Products and Services End Use: Behavior Program: Behavior/Feedback Program
Algorithms for Calculating Primary Energy Impact
Unit savings are deemed based on study results:
( ) )(%SAVEkWhkWh BASE=∆
4000/kWhkW ∆=∆ Where: Unit = One participant household. kWhBASE = Baseline consumption of kWh. See Table 1. %SAVE = Energy savings percent per program participant. See Table 1. kW = kWh/4000 hours9
Table 1: Savings Factors for OPOWER Electric10
PA Measure Name kWhBASE %SAVE ∆kWh ∆kW
National Grid OPOWER Group 2009 11,518 2.05% 236.12 0.059
National Grid OPOWER Group 2010 12,738 1.60% 203.81 0.051
National Grid OPOWER Group 2010 Added 15,585 2.16% 336.64 0.084
National Grid OPOWER Group 2011 9,916 1.75% 173.53 0.043
National Grid OPOWER Group 2011 Added 12,000 1.91% 229.20 0.057
National Grid, NSTAR OPOWER Group 2012 11,678 1.44% 168.16 0.042
National Grid, NSTAR OPOWER Group 2012 Dual 6,100 1.38% 84.18 0.021
Baseline Efficiency
The baseline efficiency case is a customer who does not receive OPOWER reports.
9 Staff estimate 10 Opinion Dynamics Corporation and Navigant Consulting (2011). Massachusetts Cross-Cutting Behavioral Program Evaluation. Updated with vendor projections for 2012.

Massachusetts Technical Reference Manual Residential Electric Efficiency Measures
October 2011 23 © 2011 Massachusetts Electric and Gas Energy
Efficiency Program Administrators, ALL RIGHTS RESERVED
High Efficiency
The high efficiency case is a customer who receives an OPOWER report.
Hours
Not applicable.
Measure Life
The measure life is 1 year.
Secondary Energy Impacts
The impacts described in this section are specific to NSTAR’s Opower program. See Behavior – OPOWER Gas in the Residential Gas section for information about National Grid’s program.
Measure Energy Type Savings11
∆MMBtu/Unit
Dual Fuel (Gas) NG - Res Gas Old Bldg 14.69 Therms 1.47
Non-Energy Impacts
There are no non-energy impacts for this measure.
Impact Factors for Calculating Adjusted Gross Savings
Measure Name Program PA ISR SPF RRE RRSP RRWP CFSP CFWP
OPOWER Group Behavior/Feedback National Grid 1.00 1.00 1.00 1.00 1.00 0.25 1.00
In-Service Rates In-services rates are 100% since the program tracks all participating customers.
Savings Persistence Factor Savings persistence is 100% since the measure life for each participant is 1 year.
Realization Rates Realization rates are 100% because deemed savings are based on assumptions from year-to-date vendor findings
Coincidence Factors
Coincidence Factors are based on staff estimates. 12
11 ODC (August 2011) NSTAR Home Energy Report: Heating Season Program Channeling Findings. 12 Staff estimate as evaluation results were not available.
Massachusetts Technical Reference Manual Residential Electric Efficiency Measures
October 2011 24 © 2011 Massachusetts Electric and Gas Energy
Efficiency Program Administrators, ALL RIGHTS RESERVED
Lighting – CFL Bulbs
Version Date and Revision History
Effective Date: 1/1/2011 End Date: TBD
Measure Overview
Description: Compact fluorescent lamps offer comparable luminosity to incandescent lamps at significantly less wattage and significantly longer lamp lifetimes. Primary Energy Impact: Electric Secondary Energy Impact: None Non-Energy Impact: One Time Non-Resource, Low-Income Annual Discounted Rate Cost Reduction Sector: Residential, Low-Income Market: Lost Opportunity End Use: Lighting Program: ENERGY STAR Lighting, Residential New Construction & Major Renovation, Home Energy Services, Multi-Family Retrofit, Low-Income Residential New Construction, Low-Income 1-4 Family Retrofit, Low-Income Multifamily Retrofit
Algorithms for Calculating Primary Energy Impact
Unit savings are deemed based on study results:
kWhkWh ∆=∆
kWkW ∆=∆ Where: Unit = Rebated CFL Bulb ∆kWh = Average annual kWh reduction. See Table 2. ∆kW = Average kW reduction. See Table 2.
Massachusetts Technical Reference Manual Residential Electric Efficiency Measures
October 2011 25 © 2011 Massachusetts Electric and Gas Energy
Efficiency Program Administrators, ALL RIGHTS RESERVED
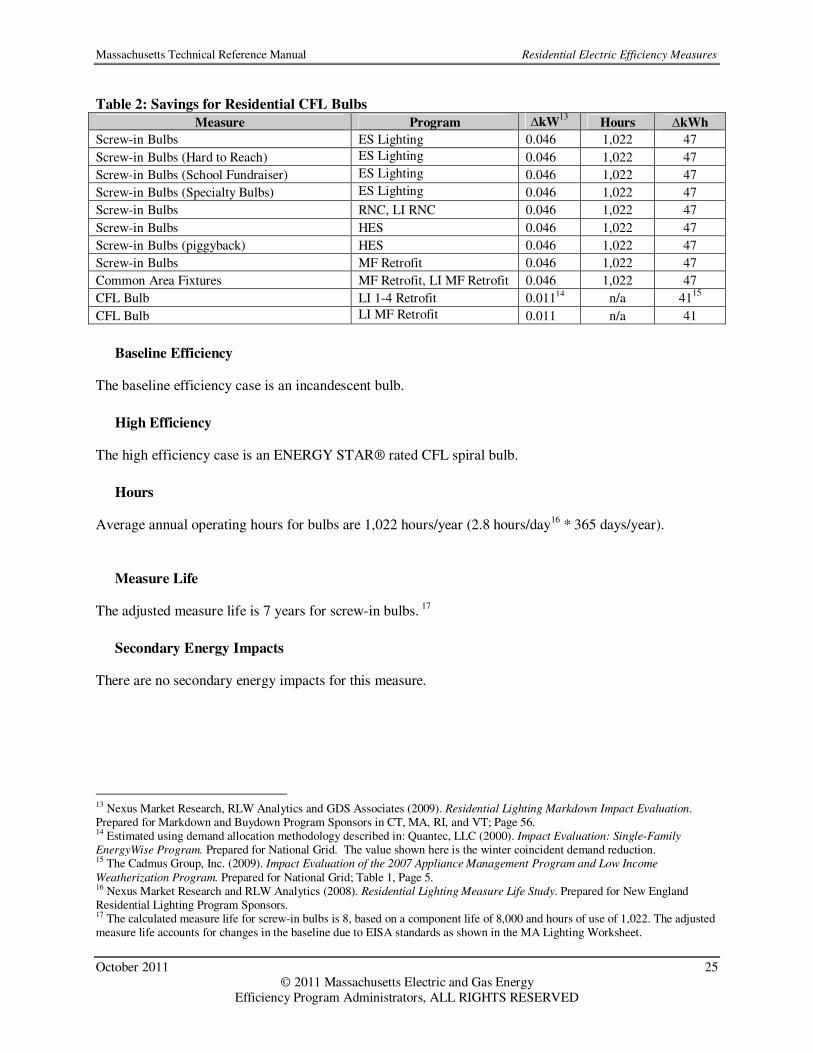
Table 2: Savings for Residential CFL Bulbs
Measure Program ∆kW13
Hours ∆kWh Screw-in Bulbs ES Lighting 0.046 1,022 47
Screw-in Bulbs (Hard to Reach) ES Lighting 0.046 1,022 47
Screw-in Bulbs (School Fundraiser) ES Lighting 0.046 1,022 47
Screw-in Bulbs (Specialty Bulbs) ES Lighting 0.046 1,022 47
Screw-in Bulbs RNC, LI RNC 0.046 1,022 47
Screw-in Bulbs HES 0.046 1,022 47
Screw-in Bulbs (piggyback) HES 0.046 1,022 47
Screw-in Bulbs MF Retrofit 0.046 1,022 47
Common Area Fixtures MF Retrofit, LI MF Retrofit 0.046 1,022 47
CFL Bulb LI 1-4 Retrofit 0.01114 n/a 4115
CFL Bulb LI MF Retrofit 0.011 n/a 41
Baseline Efficiency
The baseline efficiency case is an incandescent bulb.
High Efficiency
The high efficiency case is an ENERGY STAR® rated CFL spiral bulb.
Hours
Average annual operating hours for bulbs are 1,022 hours/year (2.8 hours/day16 * 365 days/year).
Measure Life
The adjusted measure life is 7 years for screw-in bulbs. 17
Secondary Energy Impacts
There are no secondary energy impacts for this measure.
13 Nexus Market Research, RLW Analytics and GDS Associates (2009). Residential Lighting Markdown Impact Evaluation. Prepared for Markdown and Buydown Program Sponsors in CT, MA, RI, and VT; Page 56. 14 Estimated using demand allocation methodology described in: Quantec, LLC (2000). Impact Evaluation: Single-Family
EnergyWise Program. Prepared for National Grid. The value shown here is the winter coincident demand reduction. 15 The Cadmus Group, Inc. (2009). Impact Evaluation of the 2007 Appliance Management Program and Low Income
Weatherization Program. Prepared for National Grid; Table 1, Page 5. 16 Nexus Market Research and RLW Analytics (2008). Residential Lighting Measure Life Study. Prepared for New England Residential Lighting Program Sponsors. 17 The calculated measure life for screw-in bulbs is 8, based on a component life of 8,000 and hours of use of 1,022. The adjusted measure life accounts for changes in the baseline due to EISA standards as shown in the MA Lighting Worksheet.

Massachusetts Technical Reference Manual Residential Electric Efficiency Measures
October 2011 26 © 2011 Massachusetts Electric and Gas Energy
Efficiency Program Administrators, ALL RIGHTS RESERVED
Non-Energy Impacts
Benefit Type Description Savings
Annual Non-Resource See Appendix D: Non-Resource Impacts See Appendix D: Non-Resource Impacts
One-Time Non-Resource See Appendix D: Non-Resource Impacts See Appendix D: Non-Resource Impacts
Impact Factors for Calculating Adjusted Gross Savings
Measure Name Program PA ISR SPF RRE RRSP RRWP CFSP CFWP
Screw-in Bulbs ES Lighting All 0.97 1.00 1.00 1.00 1.00 0.11 0.22
Screw-in Bulbs (Hard to Reach) ES Lighting All 1.00 1.00 1.00 1.00 1.00 0.11 0.22
Screw-in Bulbs (School Fundraiser) ES Lighting All 0.50 1.00 1.00 1.00 1.00 0.11 0.22
Screw-in Bulbs (Specialty Bulbs) ES Lighting All 1.00 1.00 1.00 1.00 1.00 0.11 0.22
Screw-in Bulbs RNC, LI RNC All 0.99 1.00 1.00 1.00 1.00 0.11 0.22
Screw-in Bulbs HES All 0.90 1.00 1.00 1.00 1.00 0.11 0.22
Screw-in Bulbs (piggyback) HES All 0.90 1.00 1.00 1.00 1.00 0.11 0.22
Screw-in Bulbs MF Retrofit All (not National Grid)
1.00 1.00 1.00 1.00 1.00 0.11 0.22
Common Area Fixtures MF Retrofit All (not National Grid)
1.00 1.00 1.00 1.00 1.00 0.11 0.22
CFL Bulb LI 1-4 Retrofit All 1.00 1.00 1.00 1.00 1.00 0.35 1. 00
CFL Bulb LI MF Retrofit All (not
National Grid) 1.00 1.00 1.00 1.00 1.00 0.35 1.00
In-Service Rate � ES Lighting, MF Retrofit, LI 1-4 Retrofit, LI MF Retrofit: PAs assume a 100% installation rate for direct install
programs. � RNC, LI RNC: 2006 ENERGY STAR® Homes New Homebuyer Survey Report18 � HES: Impact evaluation of the MA, RI, VT 2003 Residential Lighting Programs19
Savings Persistence Factor All PAs use 100% savings persistence factors. Realization Rates Realization rates are 100% since savings estimates are based on evaluation results.
Coincidence Factors � ES Lighting, RNC, LI RNC, HES, MF Retrofit: Coincidence factors are based on the 2009 Lighting Markdown
Study.20
18 Nexus Market Research & Dorothy Conant (2006). Massachusetts ENERGY STAR® Homes: 2005 Baseline Study: Part II:
Homeowner Survey Analysis Incorporating Inspection Data Final Report. Prepared for the Massachusetts Joint Management Committee. 19 Nexus Market Research and RLW Analytics (2004). Impact Evaluation of the Massachusetts, Rhode Island, and Vermont 2003
Residential Lighting Programs. Submitted to The Cape Light Compact, State of Vermont Public Service Department for Efficiency Vermont, National Grid, Northeast Utilities, NSTAR and Unitil Energy Systems, Inc. 20 Nexus Market Research, RLW Analytics and GDS Associates (2009). Residential Lighting Markdown Impact Evaluation. Prepared for Markdown and Buydown Program Sponsors in CT, MA, RI, and VT.

Massachusetts Technical Reference Manual Residential Electric Efficiency Measures
October 2011 27 © 2011 Massachusetts Electric and Gas Energy
Efficiency Program Administrators, ALL RIGHTS RESERVED
� LI MF Retrofit, LI 1-4 Retrofit: Coincidence factors are estimated using the demand allocation methodology described in the 2000 EnergyWise program impact evaluation.21
21 Quantec, LLC (2000). Impact Evaluation: Single-Family EnergyWise Program. Prepared for National Grid.

Massachusetts Technical Reference Manual Residential Electric Efficiency Measures
October 2011 28 © 2011 Massachusetts Electric and Gas Energy
Efficiency Program Administrators, ALL RIGHTS RESERVED
Lighting – Indoor Fixtures
Version Date and Revision History
Effective Date: 1/1/2011 End Date: TBD
Measure Overview
Description: The installation of ENERGY STAR® compact fluorescent (CFL) indoor fixtures. Compact fluorescent fixtures offer comparable luminosity to incandescent fixtures at significantly less wattage and significantly longer lifetimes. Hardwired fluorescent fixtures offer comparable luminosity to incandescent fixtures at significantly lower wattage and offer significantly longer lifespan. Primary Energy Impact: Electric Secondary Energy Impact: None Non-Energy Impact: One-Time O&M Cost Reduction, Low-Income Annual Discounted Rate Cost Reduction Sector: Residential, Low-Income Market: Lost Opportunity, Retrofit End Use: Lighting Program: Low-Income 1-4 Family Retrofit, Low-Income Multifamily Retrofit, ENERGY STAR Lighting, Residential New Construction & Major Renovation, Low-Income Residential New Construction, Multi-Family Retrofit
Algorithms for Calculating Primary Energy Impact
Unit savings are deemed based on study results:
kWhkWh ∆=∆
kWkW ∆=∆
Where: Unit = Installation of CFL fixture ∆kWh = Average annual kWh savings per unit. See Table 3. ∆kW = Max kW reduction. See Table 3.

Massachusetts Technical Reference Manual Residential Electric Efficiency Measures
October 2011 29 © 2011 Massachusetts Electric and Gas Energy
Efficiency Program Administrators, ALL RIGHTS RESERVED
Table 3: Savings for Residential Indoor Fixtures
Measure Program ∆kW22
Hours ∆kWh Indoor Fixture ES Lighting 0.049 912.5 44
Indoor Fixture RNC, LI RNC 0.049 912.5 44
Indoor Fixture MF Retrofit 0.049 912.5 44
CFL Fixture LI 1-4 Retrofit 0.03523 n/a 12824
CFL Fixture LI MF Retrofit 0.035 n/a 128
Baseline Efficiency
The baseline efficiency case is an incandescent, screw-based fixture with an incandescent lamp.
High Efficiency
The high efficiency case is an ENERGY STAR® qualified compact fluorescent light fixture wired for exclusive use with pin-based CFLs.
Hours
The average annual operating hours are 912.5 hours/year (2.5 hours/day25 * 365 days/year).
Measure Life
The adjusted measure life is 7 years for indoor fixtures.26
Secondary Energy Impact
There are no secondary energy impacts for this measure.
Non-Energy Impacts
Benefit Type Description Savings
Annual Non-Resource See Appendix D: Non-Resource Impacts See Appendix D: Non-Resource Impacts
One-Time Non-Resource See Appendix D: Non-Resource Impacts See Appendix D: Non-Resource Impacts
22 Nexus Market Research and RLW Analytics (2004). Impact Evaluation of the Massachusetts, Rhode Island, and Vermont 2003
Residential Lighting Programs. Submitted to The Cape Light Compact, State of Vermont Public Service Department for Efficiency Vermont, National Grid, Northeast Utilities, NSTAR and Unitil Energy Systems, Inc.; Table 1-8. 23 Estimated using demand allocation methodology described in: Quantec, LLC (2000). Impact Evaluation: Single-Family
EnergyWise Program. Prepared for National Grid. 24 Environmental Protection Agency (2009). Life Cycle Cost Estimate for ENERGY STAR Qualified Lighting Fixtures. 25 Nexus Market Research and RLW Analytics (2004). Impact Evaluation of the Massachusetts, Rhode Island, and Vermont 2003
Residential Lighting Programs. Submitted to The Cape Light Compact, State of Vermont Public Service Department for Efficiency Vermont, National Grid, Northeast Utilities, NSTAR and Unitil Energy Systems, Inc.; Page 104. 26 The adjusted measure life accounts for changes in the baseline due to EISA standards as shown in the MA Lighting Worksheet

Massachusetts Technical Reference Manual Residential Electric Efficiency Measures
October 2011 30 © 2011 Massachusetts Electric and Gas Energy
Efficiency Program Administrators, ALL RIGHTS RESERVED
Impact Factors for Calculating Adjusted Gross Savings
Measure Name Program PA ISR SPF RRE RRSP RRWP CFSP CFWP
Indoor Fixture ES Lighting All 0.95 1.00 1.00 1.00 1.00 0.11 0.22
Indoor Fixture RNC, LI RNC All 0.96 1.00 1.00 1.00 1.00 0.11 0.22
Indoor Fixture MF Retrofit All (not National Grid) 0.95 1.00 1.00 1.00 1.00 0.11 0.22
CFL Fixture LI 1-4 Retrofit All 1.00 1.00 1.00 1.00 1.00 0.35 1.00
CFL Fixture LI MF Retrofit All (not National Grid) 1.00 1.00 1.00 1.00 1.00 0.35 1.00
In-Service Rates � ES Lighting: 2004 Impact Evaluation of MA, RI, VT Residential Lighting Program27 � RNC, LI RNC: 2006 ENERGY STAR® Homes New Homebuyer Survey Report28 � MF Retrofit: Impact Evaluation of 2005 EnergyWise Program29 � LI 1-4 Retrofit, LI MF Retrofit: PAs assume 100% in-service rates. Savings Persistence Factor All PAs use 100% savings persistence factors. Realization Rates Realization rates are set to 100% since deemed savings are based on evaluation results. Coincidence Factors Coincidence factors for indoor fixtures are based on the 2009 Lighting Markdown Study.30 Coincidence factors for CFL fixtures are estimated using the demand allocation methodology described in the 2000 EnergyWise program impact evaluation.31
27 Nexus Market Research and RLW Analytics (2004). Impact Evaluation of the Massachusetts, Rhode Island, and Vermont 2003
Residential Lighting Programs. Submitted to The Cape Light Compact, State of Vermont Public Service Department for Efficiency Vermont, National Grid, Northeast Utilities, NSTAR and Unitil Energy Systems, Inc.; Page 11. 28 Nexus Market Research & Dorothy Conant (2006). Massachusetts ENERGY STAR® Homes: 2005 Baseline Study: Part II:
Homeowner Survey Analysis Incorporating Inspection Data Final Report. Prepared for the Massachusetts Joint Management Committee; Table 8.1 29 Summit Blue Consulting, LLC (2006). Impact Evaluation of 2005 EnergyWise Program – Final Report. Prepared for National Grid. 30 Nexus Market Research, RLW Analytics and GDS Associates (2009). Residential Lighting Markdown Impact Evaluation. Prepared for Markdown and Buydown Program Sponsors in CT, MA, RI, and VT. 31 Quantec, LLC (2000). Impact Evaluation: Single-Family EnergyWise Program. Prepared for National Grid.

Massachusetts Technical Reference Manual Residential Electric Efficiency Measures
October 2011 31 © 2011 Massachusetts Electric and Gas Energy
Efficiency Program Administrators, ALL RIGHTS RESERVED
Lighting – Outdoor Fixtures
Version Date and Revision History
Effective Date: 1/1/2011 End Date: TBD
Measure Overview
Description: The installation of hardwired ENERGY STAR® fluorescent outdoor fixtures with pin-based bulbs. Savings for this measure are attributable to high efficiency outdoor lighting fixtures and are treated similarly to indoor fixtures. Primary Energy Impact: Electric Secondary Energy Impact: None Non-Energy Impact: One-time Non-Resource Sector: Residential Market: Lost Opportunity, Retrofit End Use: Lighting Program: ENERGY STAR Lighting, MF Retrofit, Low-Income Multifamily Retrofit
Algorithms for Calculating Primary Energy Impact
Unit savings are deemed based on the following algorithms which use averaged inputs:
HourskWkWh ×∆=∆
kWkW ∆=∆
Where:
Unit = Rebated outdoor fixture ∆kWh = Average annual kWh reduction: 156 kWh (calculated) ∆kW = Average connected kW reduction: 0.095 kW32 Hours = Average annual operating hours
Baseline Efficiency
The baseline efficiency case is an incandescent, screw-based fixture with an incandescent bulb.
High Efficiency
The high efficiency case is an ENERGY STAR® fixture wired for exclusive use with a pin based CFL.
Hours
The average annual operating hours are 1,642.5 hours/year (4.5 hours per day33 * 365 days per year).
32 Nexus Market Research and RLW Analytics (2004). Impact Evaluation of the Massachusetts, Rhode Island, and Vermont 2003
Residential Lighting Programs. Submitted to The Cape Light Compact, State of Vermont Public Service Department for Efficiency Vermont, National Grid, Northeast Utilities, NSTAR and Unitil Energy Systems, Inc.; Table 1-8.

Massachusetts Technical Reference Manual Residential Electric Efficiency Measures
October 2011 32 © 2011 Massachusetts Electric and Gas Energy
Efficiency Program Administrators, ALL RIGHTS RESERVED
Measure Life
The measure life is 6 years for markdown outdoor fixtures.34
Secondary Energy Impacts
There are no secondary energy impacts for this measure.
Non-Energy Impacts
Benefit Type Description Savings
Annual Non-Resource See Appendix D: Non-Resource Impacts See Appendix D: Non-Resource Impacts
One-Time Non-Resource See Appendix D: Non-Resource Impacts See Appendix D: Non-Resource Impacts
Impact Factors for Calculating Adjusted Gross Savings
Measure Name Program PA ISR SPF RRE RRSP RRWP CFSP CFWP
Outdoor Fixture ES Lighting All 0.87 1.00 1.00 1.00 1.00 0.11 0.22
Outdoor Fixture MF Retrofit All (not National Grid) 0.87 1.00 1.00 1.00 1.00 0.11 0.22
In-Service Rates � ES Lighting: 2004 Impact Evaluation of MA, RI, VT Residential Lighting Program35 � MF Retrofit: Impact Evaluation of 2005 EnergyWise Program36 Savings Persistence Factor All PAs use 100% savings persistence factors. Realization Rates Realization rates are based on Massachusetts Common Assumptions.
Coincidence Factors Coincidence factors are based on the 2009 Lighting Markdown Study.37
33 Nexus Market Research and RLW Analytics (2004). Impact Evaluation of the Massachusetts, Rhode Island, and Vermont 2003
Residential Lighting Programs. Submitted to The Cape Light Compact, State of Vermont Public Service Department for Efficiency Vermont, National Grid, Northeast Utilities, NSTAR and Unitil Energy Systems, Inc.; Page 104 34 Nexus Market Research and RLW Analytics (2008). Residential Lighting Measure Life Study. Prepared for New England Residential Lighting Program Sponsors; Page 1. 35 Nexus Market Research and RLW Analytics (2004). Impact Evaluation of the Massachusetts, Rhode Island, and Vermont 2003
Residential Lighting Programs. Submitted to The Cape Light Compact, State of Vermont Public Service Department for Efficiency Vermont, National Grid, Northeast Utilities, NSTAR and Unitil Energy Systems, Inc.; Page 11. 36 Summit Blue Consulting, LLC (2006). Impact Evaluation of 2005 EnergyWise Program – Final Report. Prepared for National Grid. 37 Nexus Market Research, RLW Analytics and GDS Associates (2009). Residential Lighting Markdown Impact Evaluation. Prepared for Markdown and Buydown Program Sponsors in CT, MA, RI, and VT.

Massachusetts Technical Reference Manual Residential Electric Efficiency Measures
October 2011 33 © 2011 Massachusetts Electric and Gas Energy
Efficiency Program Administrators, ALL RIGHTS RESERVED
Lighting – Torchieres
Version Date and Revision History
Effective Date: 1/1/2011 End Date: TBD
Measure Overview
Description: The installation of high-efficiency ENERGY STAR® torchieres. High efficiency torchieres use fluorescent in place of halogen or incandescent bulbs to provide comparable luminosity at significantly reduced wattage. Primary Energy Impact: Electric Secondary Energy Impact: None Non-Energy Impact: Low-Income Annual Discounted Rate Cost Reduction Sector: Residential, Low-Income Market: Lost Opportunity, Retrofit End Use: Lighting Program: ENERGY STAR Lighting, HES, Low-Income 1-4 Family Retrofit, Low-Income Multifamily Retrofit
Algorithms for Calculating Primary Energy Impact
Unit savings are based on the following algorithms which use averaged inputs:
HourskWkWh ×∆=∆
kWkW ∆=∆
Where:
Unit = Rebated ENERGY STAR® Torchiere ∆kWh = Average annual kWh reduction: 106 kWh (calculated) ∆kW = Average connected kW reduction: 0.088 kW38 Hours = Average annual operating hours
Baseline Efficiency
The baseline efficiency case is a halogen or incandescent torchiere fixture.
High Efficiency
The high efficiency case is a fluorescent torchiere fixture.
38 Nexus Market Research and RLW Analytics (2004). Impact Evaluation of the Massachusetts, Rhode Island, and Vermont 2003
Residential Lighting Programs. Submitted to The Cape Light Compact, State of Vermont Public Service Department for Efficiency Vermont, National Grid, Northeast Utilities, NSTAR and Unitil Energy Systems, Inc.; Table 1-8. Adjusted to account for changes to the baseline technology.

Massachusetts Technical Reference Manual Residential Electric Efficiency Measures
October 2011 34 © 2011 Massachusetts Electric and Gas Energy
Efficiency Program Administrators, ALL RIGHTS RESERVED
Hours
The average annual operating hours are 1,204.5 hours/year (3.3 hours/day39 * 365 days/year).
Measure Life
The measure life is 8 years.40
Secondary-Energy Impacts
There are no secondary energy impacts for this measure.
Non-Energy Impacts
Benefit Type Description Savings
Annual Non-Resource See Appendix D: Non-Resource Impacts See Appendix D: Non-Resource Impacts
One-Time Non-Resource See Appendix D: Non-Resource Impacts See Appendix D: Non-Resource Impacts
Impact Factors for Calculating Adjusted Gross Savings
Measure Name Program PA ISR SPF RRE RRSP RRWP CFSP CFWP
Torchieres ES Lighting All 0.83 1.00 1.00 1.00 1.00 0.11 0.22
Torchieres HES All 0.83 1.00 1.00 1.00 1.00 0.11 0.22
Torchieres RNC All 0.83 1.00 1.00 1.00 1.00 0.11 0.22
Torchieres LI 1-4 Retrofit CLC only 1.00 1.00 1.00 1.00 1.00 0.11 0.22
Torchieres LI MF Retrofit CLC only 1.00 1.00 1.00 1.00 1.00 0.11 0.22
In-Service Rates � ES Lighting, HES: 2004 Impact Evaluation of MA, RI, VT Residential Lighting Program41 � Low Income: Assumed to be 100% for Low-Income customers. Savings Persistence Factor All PAs use 100% savings persistence factors. Realization Rates Realization rates are based on Massachusetts Common Assumptions.
Coincidence Factors Coincidence factors are based on the 2009 Lighting Markdown Study.42
39 Nexus Market Research and RLW Analytics (2004). Impact Evaluation of the Massachusetts, Rhode Island, and Vermont 2003
Residential Lighting Programs. Submitted to The Cape Light Compact, State of Vermont Public Service Department for Efficiency Vermont, National Grid, Northeast Utilities, NSTAR and Unitil Energy Systems, Inc.; Page 104 40 Ibid. 41 Nexus Market Research and RLW Analytics (2004). Impact Evaluation of the Massachusetts, Rhode Island, and Vermont 2003
Residential Lighting Programs. Submitted to The Cape Light Compact, State of Vermont Public Service Department for Efficiency Vermont, National Grid, Northeast Utilities, NSTAR and Unitil Energy Systems, Inc.; Page 11. 42 Nexus Market Research, RLW Analytics and GDS Associates (2009). Residential Lighting Markdown Impact Evaluation. Prepared for Markdown and Buydown Program Sponsors in CT, MA, RI, and VT.

Massachusetts Technical Reference Manual Residential Electric Efficiency Measures
October 2011 35 © 2011 Massachusetts Electric and Gas Energy
Efficiency Program Administrators, ALL RIGHTS RESERVED
Lighting – LED Lighting
Version Date and Revision History
Effective Date: 1/1/2011 End Date: TBD
Measure Overview
Description: The installation of Light-Emitting Diode (LED) screw-in bulbs. LEDs offer comparable luminosity to incandescent bulbs at significantly less wattage and significantly longer lamp lifetimes. Primary Energy Impact: Electric Secondary Energy Impact: None Non-Energy Impact: Annual Discounted Rate Cost Reduction (Low Income only) Sector: Residential Market: Lost Opportunity End Use: Lighting Program: ENERGY STAR Lighting, Residential New Construction & Major Renovation, Low-Income Residential New Construction
Algorithms for Calculating Primary Energy Impact
Unit savings are based on the following algorithms which use averaged inputs:
( ) HourskWkWkWh LEDBASE ×−=∆
kWkW ∆=∆
Where:
Unit = Rebated LED lamp or fixture
∆kWh = Average annual energy savings: 48 kWh43
kWBASE = Average connected kW of baseline bulb: 65 Watts kWLED = Average connected kW of LED bulb: 18 Watts
∆kW = Average connected kW reduction: 0.047 kW
Hours = Average annual operating hours
Baseline Efficiency
The baseline efficiency case is a 65-watt incandescent bulb in a screw-based socket or fluorescent under cabinet light.
High Efficiency
The high efficiency case is an 18-watt LED downlight.
43 Homes: Energy Star. LED Light Bulbs for Consumers.
http://www.energystar.gov/index.cfm?fuseaction=find_a_product.showProductGroup&pgw_code=ILB. Accessed on 10/15/10.

Massachusetts Technical Reference Manual Residential Electric Efficiency Measures
October 2011 36 © 2011 Massachusetts Electric and Gas Energy
Efficiency Program Administrators, ALL RIGHTS RESERVED
Hours
The average annual operating hours are 1, 022 hours/year (2.8 hours/day44 * 365 days/year).
Measure Life
The measure life is 20 years.45
Secondary-Energy Impacts
There are no secondary energy impacts for this measure.
Non-Energy Impacts
Benefit Type Description Savings
Annual Non-Resource See Appendix D: Non-Resource Impacts See Appendix D: Non-Resource Impacts
One-Time Non-Resource See Appendix D: Non-Resource Impacts See Appendix D: Non-Resource Impacts
No operations and maintenance cost adjustments are claimed for this measure. At this time, the incremental cost is unclear given the continual changes in LED technology. In addition, the measure life savings from not replacing incandescent bulbs are also unclear.
Impact Factors for Calculating Adjusted Gross Savings
Measure Name Program PA ISR SPF RRE RRSP RRWP CFSP CFWP
LED Lamp ES Lighting All 1.00 1.00 1.00 1.00 1.00 0.11 0.22
LED Fixture ES Lighting All 1.00 1.00 1.00 1.00 1.00 0.11 0.22
LED Fixture RNC, LI RNC All 1.00 1.00 1.00 1.00 1.00 0.11 0.22
In-Service Rates In-service rates are set to 100% based on the assumption that all purchased units are installed. Savings Persistence Factor All PAs use 100% savings persistence factors. Realization Rates Realization rates are based on Massachusetts Common Assumptions. Coincidence Factors Coincidence factors are from the 2009 Lighting Markdown Study.46
44 Nexus Market Research, RLW Analytics and GDS Associates (2009). Residential Lighting Markdown Impact Evaluation. Prepared for Markdown and Buydown Program Sponsors in CT, MA, RI, and VT; Page 6. 45 Expected lifetime from ENERGY STAR ®. 46 Nexus Market Research, RLW Analytics and GDS Associates (2009). Residential Lighting Markdown Impact Evaluation. Prepared for Markdown and Buydown Program Sponsors in CT, MA, RI, and VT.

Massachusetts Technical Reference Manual Residential Electric Efficiency Measures
October 2011 37 © 2011 Massachusetts Electric and Gas Energy
Efficiency Program Administrators, ALL RIGHTS RESERVED
Lighting – Occupancy Sensors
Version Date and Revision History
Effective Date: 1/1/2011 End Date: TBD
Measure Overview
Description: The installation of occupancy sensors for lighting fixtures. Energy savings are achieved by reducing the annual operating hours of the connected lighting fixtures. Primary Energy Impact: Electric Secondary Energy Impact: None Non-Energy Impact: None Sector: Residential Market: Retrofit End Use: Lighting Program: Multi-Family Retrofit
Algorithms for Calculating Primary Energy Impact
Unit savings are based on the following algorithms which use averaged inputs47:
UnoccupiedHourskWkWh %××=∆
0=∆kW Where: Unit = Rebated occupancy sensor ∆kWh = Annual energy savings: 99 kWh ∆kW = Average kW reduction is 0 during peak periods kW = Average connected kW: 0.094 kW48 Hours = Average annual operating hours for connected lighting wattage without controls %Unoccupied = Average % of time that controlled space is unoccupied: 35%49
Baseline Efficiency
The baseline efficiency case is a lighting fixture that operates without controls.
High Efficiency
The high efficiency case is a lighting fixture that operates with connected occupancy sensors.
47 Waste Reduction Partners (2004). Occupancy Sensors - Utility Savings Initiative - Fact Sheet; Page 2, algorithm based on the Lighting Fixture Basis formula. 48 Ibid; Page 2, based on the savings for a 3-lamp T8. 49 Ibid; Page 2, assumption based on the U.S. EPA Prediction for Corridors.

Massachusetts Technical Reference Manual Residential Electric Efficiency Measures
October 2011 38 © 2011 Massachusetts Electric and Gas Energy
Efficiency Program Administrators, ALL RIGHTS RESERVED
Hours
The average annual operating hours before the measure installation is 3,000 hours per year.50
Measure Life
The measure life is 10 years.51
Secondary-Energy Impacts
There are no secondary energy impacts counted for this measure.
Non-Energy Impacts
Benefit Type Description Savings
Annual Non-Resource See Appendix D: Non-Resource Impacts See Appendix D: Non-Resource Impacts
One-Time Non-Resource See Appendix D: Non-Resource Impacts See Appendix D: Non-Resource Impacts
Impact Factors for Calculating Adjusted Gross Savings
Measure Name Program PA ISR SPF RRE RRSP RRWP CFSP CFWP
Common Area Occupancy Sensors MF Retrofit All 1.00 1.00 1.00 1.00 1.00 0.00 0.00
In-Service Rates In-service rates are set to 100% based on the assumption that all purchased units are installed. Savings Persistence Factor All PAs use 100% savings persistence factors. Realization Rates Realization rates are based on Massachusetts Common Assumptions. Coincidence Factors Coincidence factors are set to zero since demand savings typically occur during off- peak periods.
50 Ibid; assumption from the Lighting Fixture Basis formula. 51 GDS Associates, Inc. (2007). Measure Life Report: Residential and Commercial/Industrial Lighting and HVAC Measures. Prepared for The New England State Program Working Group.

Massachusetts Technical Reference Manual Residential Electric Efficiency Measures
October 2011 39 © 2011 Massachusetts Electric and Gas Energy
Efficiency Program Administrators, ALL RIGHTS RESERVED
Hot Water – DHW Measures (Electric)
Version Date and Revision History
Effective Date: 1/1/2011 End Date: TBD
Measure Overview
Description: Installation of domestic hot water (DHW) measures including low flow showerheads, faucet aerators, and tank and pipe wraps in homes with electric water heating. Primary Energy Impact: Electric Secondary Energy Impact: None Non-Energy Impact: Residential Water, Low-Income Annual Discounted Rate Cost Reduction Sector: Low Income Market: Retrofit End Use: Hot Water Program: Low-Income 1-4 Family Retrofit, Low-Income Multifamily Retrofit
Notes
The savings estimates described in this section are only used for the Low-Income 1-4 Family Retrofit program (all PAs) and the Low-Income Multifamily Retrofit programs (all PAs except National Grid). The savings algorithms for similar measures installed through National Grid’s Low-Income Multifamily program are described in the Multifamily – DHW sections.
Algorithms for Calculating Primary Energy Impact
Unit savings are deemed based on study results:
kWhkWh ∆=∆
kWkW ∆=∆ Where: Unit = Household with hot water efficiency measures installed ∆kWh = Average annual energy savings per unit: 134 kWh52 ∆kW = Average demand reduction per unit: 0.017 kW53
Baseline Efficiency
The baseline efficiency case is the existing hot water equipment.
52 The Cadmus Group, Inc. (2009). Impact Evaluation of the 2007 Appliance Management Program and Low Income
Weatherization Program. Prepared for National Grid. 53 Estimated using demand allocation methodology described in: Quantec, LLC (2000). Impact Evaluation: Single-Family
EnergyWise Program. Prepared for National Grid.

Massachusetts Technical Reference Manual Residential Electric Efficiency Measures
October 2011 40 © 2011 Massachusetts Electric and Gas Energy
Efficiency Program Administrators, ALL RIGHTS RESERVED
High Efficiency
The high efficiency case includes low flow showerheads and faucet aerators as well as tank and pipe wraps.
Hours
Not applicable.
Measure Life
The measure life is 7 years.54
Secondary Energy Impacts
There are no secondary energy impacts for this measure.
Non-Energy Impacts
Benefit Type Description Savings
Residential Water Residential water savings per participant55 4,028 Gallons/Participant
Annual Non-Resource See Appendix D: Non-Resource Impacts See Appendix D: Non-Resource Impacts
One-Time Non-Resource See Appendix D: Non-Resource Impacts See Appendix D: Non-Resource Impacts
Impact Factors for Calculating Adjusted Gross Savings
Measure Name Program PA ISR SPF RRE RRSP RRWP CFSP CFWP
DHW Measures (Electric) LI 1-4 Retrofit All 1.00 1.00 1.00 1.00 1.00 0.75 1.00
DHW Measures (Electric) LI MF Retrofit All (not National Grid) 1.00 1.00 1.00 1.00 1.00 0.75 1.00
In-Service Rates All installations have 100% in service rate since all PAs programs include verification of equipment installations. Savings Persistence Factor All PAs use 100% savings persistence factors. Realization Rates Realization rates are set to 100% since deemed savings are based on evaluation results. Coincidence Factors Coincidence factors are estimated using the demand allocation methodology described in the 2000 EnergyWise program impact evaluation.56
54 Massachusetts Common Assumption. 55 NMR Group, Inc., Tetra Tech (2011). Massachusetts Special and Cross-Sector Studies Area, Residential and Low-Income
Non-Energy Impacts (NEI) Evaluation, Prepared for Massachusetts Program Administrators 56 Quantec, LLC (2000). Impact Evaluation: Single-Family EnergyWise Program. Prepared for National Grid.
Massachusetts Technical Reference Manual Residential Electric Efficiency Measures
October 2011 41 © 2011 Massachusetts Electric and Gas Energy
Efficiency Program Administrators, ALL RIGHTS RESERVED
Hot Water – DHW Measures (Oil, Gas and Other)
Version Date and Revision History
Effective Date: 1/1/2011 End Date: TBD
Measure Overview
Description: Installation of domestic hot water (DHW) measures including low flow showerheads, faucet aerators, and tank and pipe wraps in homes that have oil or gas water heaters. Primary Energy Impact: Oil or Gas Secondary Energy Impact: None Non-Energy Impact: Residential Water, Low-Income Annual Discounted Rate Cost Reduction Sector: Low Income Market: Retrofit End Use: Hot Water Program: Low-Income 1-4 Family Retrofit, Low-Income Multifamily Retrofit
Notes
The savings estimates described in this section are only used for the Low-Income 1-4 Family Retrofit program (all PAs) and the Low-Income Multifamily Retrofit programs (all PAs except National Grid). The savings algorithms for similar measures installed through National Grid’s Low-Income Multifamily program are described in the Multifamily – DHW sections.
Algorithms for Calculating Primary Energy Impact
No electric savings are claimed for this measure.
Baseline Efficiency
The baseline efficiency case is the existing hot water equipment.
High Efficiency
The high efficiency case includes low flow showerheads and faucet aerators as well as tank and pipe wraps.
Hours
Not applicable.

Massachusetts Technical Reference Manual Residential Electric Efficiency Measures
October 2011 42 © 2011 Massachusetts Electric and Gas Energy
Efficiency Program Administrators, ALL RIGHTS RESERVED
Measure Life
The measure life is 7 years.57
Secondary Energy Impacts
Measure Energy Type Savings58
∆MMBtu/Unit
DHW Measures (Gas/Other) NG – Residential DHW 9 Therms 0.9
DHW Measures (Oil) Oil 6.4 Gallons 0.9
Non-Energy Impacts
Benefit Type Description Savings
Residential Water Residential water savings per participant59 4,028 Gallons/Participant
Annual Non-Resource See Appendix D: Non-Resource Impacts See Appendix D: Non-Resource Impacts
One-Time Non-Resource See Appendix D: Non-Resource Impacts See Appendix D: Non-Resource Impacts
Impact Factors for Calculating Adjusted Gross Savings
Measure Name Program PA ISR SPF RRE RRSP RRWP CFSP CFWP
DHW Measures (Gas/Other) LI 1-4 Retrofit All 1.00 1.00 1.00 1.00 1.00 0.00 0.00
DHW Measures (Oil) LI 1-4 Retrofit All 1.00 1.00 1.00 1.00 1.00 0.00 0.00
In-Service Rates All installations have 100% in service rate since all PAs programs include verification of equipment installations. Savings Persistence Factor All PAs use 100% savings persistence factors. Realization Rates Realization rates are set to 100% since deemed savings are based on evaluation results. Coincidence Factors Coincidence factors are estimated using the demand allocation methodology described in the 2000 EnergyWise program impact evaluation.60
57 Massachusetts Common Assumption. 58 The Cadmus Group, Inc. (2009). Impact Evaluation of the 2007 Appliance Management Program and Low Income
Weatherization Program. Prepared for National Grid. 59 NMR Group, Inc., Tetra Tech (2011). Massachusetts Special and Cross-Sector Studies Area, Residential and Low-Income
Non-Energy Impacts (NEI) Evaluation, Prepared for Massachusetts Program Administrators 60 Quantec, LLC (2000). Impact Evaluation: Single-Family EnergyWise Program. Prepared for National Grid.

Massachusetts Technical Reference Manual Residential Electric Efficiency Measures
October 2011 43 © 2011 Massachusetts Electric and Gas Energy
Efficiency Program Administrators, ALL RIGHTS RESERVED
Hot Water – Dishwashers
Version Date and Revision History
Effective Date: 1/1/2011 End Date: TBD
Measure Overview
Description: Installation of ENERGY STAR® qualified dishwashers in residential homes during new construction or major renovation. ENERGY STAR® dishwashers are on average, 10% more energy-efficient than non-qualified models. Primary Energy Impact: Electric Secondary Energy Impact: Natural Gas, Oil, Propane Non-Energy Impact: Residential Water, Low-Income Annual Discounted Rate Cost Reduction Sector: Residential Market: Lost Opportunity End Use: Hot Water Program: Residential New Construction & Major Renovation, Low-Income Residential New Construction
Algorithms for Calculating Primary Energy Impact
Unit savings are deemed based on Energy Star calculations:
kWhkWh ∆=∆
kWkW ∆=∆ Where: Unit = Installation of ENERGY® dishwasher ∆kWh = Average annual energy reduction per unit: 74 kWh with electric water heating and 33 kWh
with non-electric water heating; 61 ∆kW = Average demand reduction per unit: 0.001 kW62
Baseline Efficiency
The baseline efficiency case is a conventional standard sized non-ENERGY STAR® qualified model meeting Federal Standards energy performance metric criteria effective January 1, 2010 for dishwashers with maximum energy consumption of less than or equal to 355 kwh/year and maximum water consumption of 6.5 gallons of water/cycle.63
61 Environmental Protection Agency (2010). Life Cycle Cost Estimate for ENERGY STAR Residential Dishwasher. 62 Estimated using demand allocation methodology described in: Quantec, LLC (2000). Impact Evaluation: Single-Family
EnergyWise Program. Prepared for National Grid. 63 Home: ENERGY STAR (2010). Dishwasher Key Product Criteria. http://www.energystar.gov/index.cfm?c=dishwash.pr_crit_dishwashers. Accessed on 10/20/10.

Massachusetts Technical Reference Manual Residential Electric Efficiency Measures
October 2011 44 © 2011 Massachusetts Electric and Gas Energy
Efficiency Program Administrators, ALL RIGHTS RESERVED
High Efficiency
The high efficiency case is an ENERGY STAR® qualified standard sized dishwasher meeting the energy performance metric criteria effective July 1, 2011 for dishwashers with maximum energy consumption of greater than or equal to 307 kwh/year and maximum water consumption of 5.0 gallons/cycle.
Hours
Dishwashers are assumed to run 215 cycles per year.64
Measure Life
The measure life is 10 years.65
Secondary Energy Impacts
Gas, Oil and Propane savings occur in homes where the water is heated by that fuel.
Measure Energy Type ∆MMBtu/Unit66
Dishwashers (Gas) NG – Residential DHW 0.19
Dishwashers (Oil) Oil 0.19
Dishwashers (Propane) Propane 0.19
Non-Energy Impacts
Benefit Type Description Savings
Residential Water Reduction in annual water usage compared to
conventional unit 67
430 Gallons/Unit
Annual Non-Resource See Appendix D: Non-Resource Impacts See Appendix D: Non-Resource Impacts
One-Time Non-Resource See Appendix D: Non-Resource Impacts See Appendix D: Non-Resource Impacts
Impact Factors for Calculating Adjusted Gross Savings
Measure Name Program PA ISR SPF RRE RRSP RRWP CFSP CFWP
Dishwashers RNC, LI RNC All 1.00 1.00 1.00 1.00 1.00 0.75 1.00
In-Service Rates All installations have 100% in service rate since all PAs programs include verification of equipment installations. Savings Persistence Factor All PAs use 100% savings persistence factors.
64 Environmental Protection Agency (2010). Life Cycle Cost Estimate for ENERGY STAR Residential Dishwasher. 65 Ibid. 66 Environmental Protection Agency (2010). Life Cycle Cost Estimate for ENERGY STAR Residential Dishwasher. Oil and Propane MMBtu savings are assumed to be the same as ENERGY STAR estimated gas savings. 67 Ibid.
Massachusetts Technical Reference Manual Residential Electric Efficiency Measures
October 2011 45 © 2011 Massachusetts Electric and Gas Energy
Efficiency Program Administrators, ALL RIGHTS RESERVED
Realization Rates Realization rates are based on Massachusetts Common Assumptions. Coincidence Factors Coincidence factors are based on Massachusetts Common Assumptions.
Massachusetts Technical Reference Manual Residential Electric Efficiency Measures
October 2011 46 © 2011 Massachusetts Electric and Gas Energy
Efficiency Program Administrators, ALL RIGHTS RESERVED
Hot Water – Waterbed Mattress Replacement
Version Date and Revision History
Effective Date: 1/1/2011 End Date: TBD
Measure Overview
Description: Replacement of waterbed mattress with a standard mattress. Primary Energy Impact: Electric Secondary Energy Impact: None Non-Energy Impact: Low-Income Annual Discounted Rate Cost Reduction Sector: Low Income Market: Retrofit End Use: Hot Water Program: Low-Income 1-4 Family Retrofit, Low-Income Multifamily Retrofit
Algorithms for Calculating Primary Energy Impact
Unit savings are deemed based on study results:
kWhkWh ∆=∆
kWkW ∆=∆
Where: Unit = Mattress replacement ∆kWh = Average annual energy reduction per unit: 872 kWh68 ∆kW = Average demand reduction per unit: 0.109 kW69
Baseline Efficiency
The baseline efficiency case is an existing waterbed mattress.
High Efficiency
The high efficiency case is a new standard mattress.
Hours
Not applicable.
68 The Cadmus Group, Inc. (2009). Impact Evaluation of the 2007 Appliance Management Program and Low Income
Weatherization Program. Prepared for National Grid. 69 Estimated using demand allocation methodology described in: Quantec, LLC (2000). Impact Evaluation: Single-Family
EnergyWise Program. Prepared for National Grid.

Massachusetts Technical Reference Manual Residential Electric Efficiency Measures
October 2011 47 © 2011 Massachusetts Electric and Gas Energy
Efficiency Program Administrators, ALL RIGHTS RESERVED
Measure Life
The measure life is 10 years.70
Secondary Energy Impacts
There are no secondary energy impacts for this measure.
Non-Energy Impacts
Benefit Type Description Savings
Annual Non-Resource See Appendix D: Non-Resource Impacts See Appendix D: Non-Resource Impacts
One-Time Non-Resource See Appendix D: Non-Resource Impacts See Appendix D: Non-Resource Impacts
Impact Factors for Calculating Adjusted Gross Savings
Measure Name Program PA ISR SPF RRE RRSP RRWP CFSP CFWP
Waterbed LI 1-4 Retrofit All 1.00 1.00 1.00 1.00 1.00 0.75 1.00
Waterbed LI MF Retrofit All (not National Grid) 1.00 1.00 1.00 1.00 1.00 0.75 1.00
In-Service Rates All installations have 100% in service rate since all PAs programs include verification of equipment installations. Savings Persistence Factor All PAs use 100% savings persistence factors. Realization Rates
Realization rates are set to 100% since deemed savings are based on evaluation results. Coincidence Factors
Coincidence factors are estimated using the demand allocation methodology described in the 2000 EnergyWise program impact evaluation.71
70 See the response to the question “How do I know when I need to buy a new mattress?” at the following link for more details: http://www.serta.com/#/best-mattress-FAQs-mattresses-Serta-Number-1-Best-Selling-Mattress.html (8/19/2010). 71 Quantec, LLC (2000). Impact Evaluation: Single-Family EnergyWise Program. Prepared for National Grid.

Massachusetts Technical Reference Manual Residential Electric Efficiency Measures
October 2011 48 © 2011 Massachusetts Electric and Gas Energy
Efficiency Program Administrators, ALL RIGHTS RESERVED
Hot Water – Heat Pump Water Heater (Electric)
Version Date and Revision History
Effective Date: 1/1/2012 End Date: TBD
Measure Overview
Description: Installation of a heat pump water heater (HPWH) instead of an electric resistance water heater. Primary Energy Impact: Electric Secondary Energy Impact: None Non-Energy Impact: None Sector: Residential Market: Lost Opportunity End Use: Hot Water Program: Residential Cooling & Heating Equipment
Notes
The Heat Pump Hot Water Heater is part of an on going pilot study. The savings given in the 2012 Plan TRM version are based on preliminary results and engineering estimates. The pilot study will be completed in December 2012 in order to obtain a full year of metered data.
Algorithms for Calculating Primary Energy Impact
Unit savings are deemed based on preliminary study results:
kWhkWh ∆=∆
kWkW ∆=∆
Where: Unit = Household with heat pump water heater installed ∆kWh = Average annual energy savings per unit. See table below. ∆kW = Average demand reduction per unit. See table below.
HPWH Size ∆kW72
∆kWh73
50 gallon 3.32 1,817
80 gallon 3.32 2,712
72 Demand savings based on engineering estimates. Savings based on 50 gallon tank, which will be conservative for the > 50 gallon scenario. 73 Energy savings based on metered data from 14 in home installations over a 9 month period (November 2010 – July 2011). Savings are discounted by 5% to account for approximately 10% of units installed in conditioned spaces.
Massachusetts Technical Reference Manual Residential Electric Efficiency Measures
October 2011 49 © 2011 Massachusetts Electric and Gas Energy
Efficiency Program Administrators, ALL RIGHTS RESERVED
Baseline Efficiency
The baseline efficiency case is a new, standard efficiency electric resistance hot water heater.
High Efficiency
The high efficiency case is a high efficiency heat pump water heater.
Hours
Not applicable.
Measure Life
The measure life is 10 years.74
Secondary Energy Impacts
There are no secondary energy impacts for this measure.
Non-Energy Impacts
There are no non-energy impacts for this measure.
Impact Factors for Calculating Adjusted Gross Savings
Measure Name Program PA ISR SPF RRE RRSP RRWP CFSP CFWP
HPWH (Electric) RNC All 1.00 1.00 1.00 1.00 1.00 0.75 1.00
In-Service Rates All installations have 100% in service rate since all PAs programs include verification of equipment installations. Savings Persistence Factor All PAs use 100% savings persistence factors. Realization Rates Realization rates are set to 100% since deemed savings are based on evaluation results. Coincidence Factors Coincidence factors are estimated using the demand allocation methodology described in the 2000 EnergyWise program impact evaluation.75
74 Based on warranty of equipment. 75 Quantec, LLC (2000). Impact Evaluation: Single-Family EnergyWise Program. Prepared for National Grid.
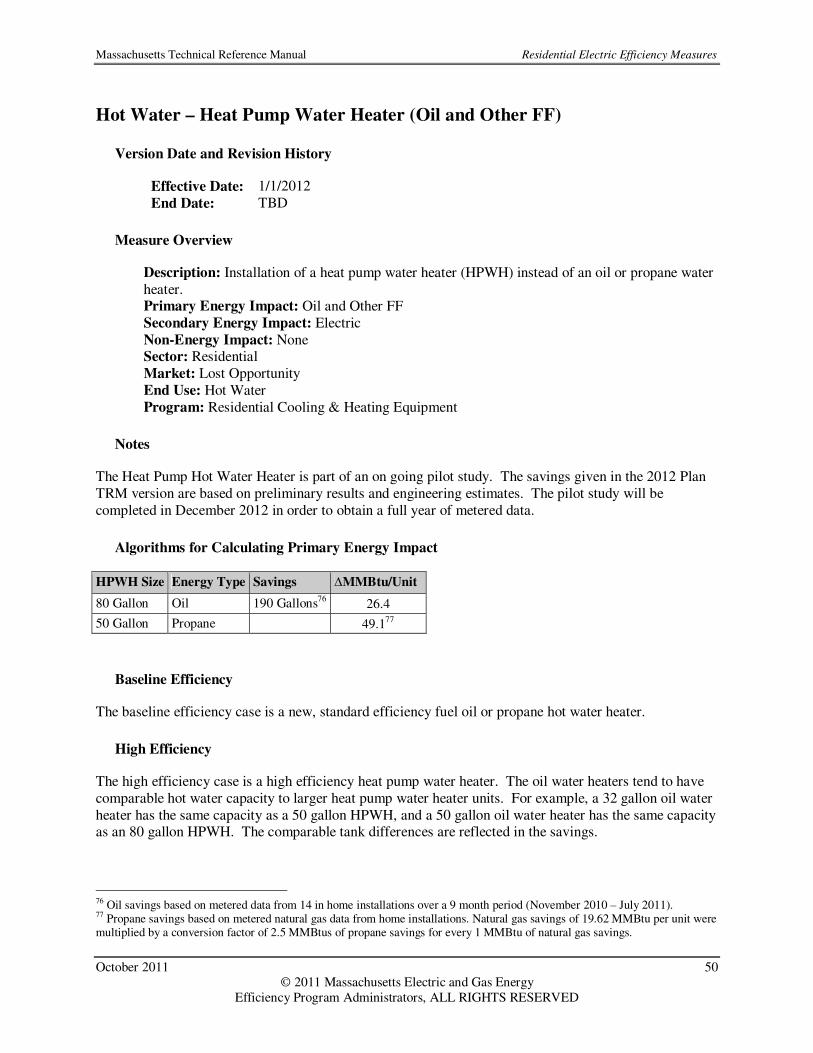
Massachusetts Technical Reference Manual Residential Electric Efficiency Measures
October 2011 50 © 2011 Massachusetts Electric and Gas Energy
Efficiency Program Administrators, ALL RIGHTS RESERVED
Hot Water – Heat Pump Water Heater (Oil and Other FF)
Version Date and Revision History
Effective Date: 1/1/2012 End Date: TBD
Measure Overview
Description: Installation of a heat pump water heater (HPWH) instead of an oil or propane water heater. Primary Energy Impact: Oil and Other FF Secondary Energy Impact: Electric Non-Energy Impact: None Sector: Residential Market: Lost Opportunity End Use: Hot Water Program: Residential Cooling & Heating Equipment
Notes
The Heat Pump Hot Water Heater is part of an on going pilot study. The savings given in the 2012 Plan TRM version are based on preliminary results and engineering estimates. The pilot study will be completed in December 2012 in order to obtain a full year of metered data.
Algorithms for Calculating Primary Energy Impact
HPWH Size Energy Type Savings ∆MMBtu/Unit
80 Gallon Oil 190 Gallons76 26.4
50 Gallon Propane 49.177
Baseline Efficiency
The baseline efficiency case is a new, standard efficiency fuel oil or propane hot water heater.
High Efficiency
The high efficiency case is a high efficiency heat pump water heater. The oil water heaters tend to have comparable hot water capacity to larger heat pump water heater units. For example, a 32 gallon oil water heater has the same capacity as a 50 gallon HPWH, and a 50 gallon oil water heater has the same capacity as an 80 gallon HPWH. The comparable tank differences are reflected in the savings.
76 Oil savings based on metered data from 14 in home installations over a 9 month period (November 2010 – July 2011). 77 Propane savings based on metered natural gas data from home installations. Natural gas savings of 19.62 MMBtu per unit were multiplied by a conversion factor of 2.5 MMBtus of propane savings for every 1 MMBtu of natural gas savings.

Massachusetts Technical Reference Manual Residential Electric Efficiency Measures
October 2011 51 © 2011 Massachusetts Electric and Gas Energy
Efficiency Program Administrators, ALL RIGHTS RESERVED
Hours
Not applicable.
Measure Life
The measure life is 10 years.78
Secondary Energy Impacts
There is an electric penalty for this measure since the HPWH uses more electricity than the baseline oil water heater, see table below.
HPWH Size kWh Penalty79
kW Penalty80
80 Gallon -1795.11 -1.902
50 Gallon -1551.87 -1.902
Non-Energy Impacts
There are no non-energy impacts for this measure.
Impact Factors for Calculating Adjusted Gross Savings
Measure Name Program PA ISR SPF RRE RRSP RRWP CFSP CFWP
HPWH (Oil and Other FF) RHVAC All 1.00 1.00 0.00 0.00 0.00 0.75 1.00
In-Service Rates All installations have 100% in service rate since all PAs programs include verification of equipment installations. Savings Persistence Factor All PAs use 100% savings persistence factors. Realization Rates Realization rates are set to 100% since deemed savings are based on evaluation results. Coincidence Factors Coincidence factors are estimated using the demand allocation methodology described in the 2000 EnergyWise program impact evaluation.81
78 Based on warranty of equipment. 79 Electric penalty based on metered data from 14 in home installations over a 9 month period (November 2010 – July 2011). Penalty represents total annual operating energy use for a HPWH. 80 Demand penalty based on engineering estimates. Savings based on 50 gallon tank, which will be conservative for the > 50 gallon scenario. 81 Quantec, LLC (2000). Impact Evaluation: Single-Family EnergyWise Program. Prepared for National Grid.
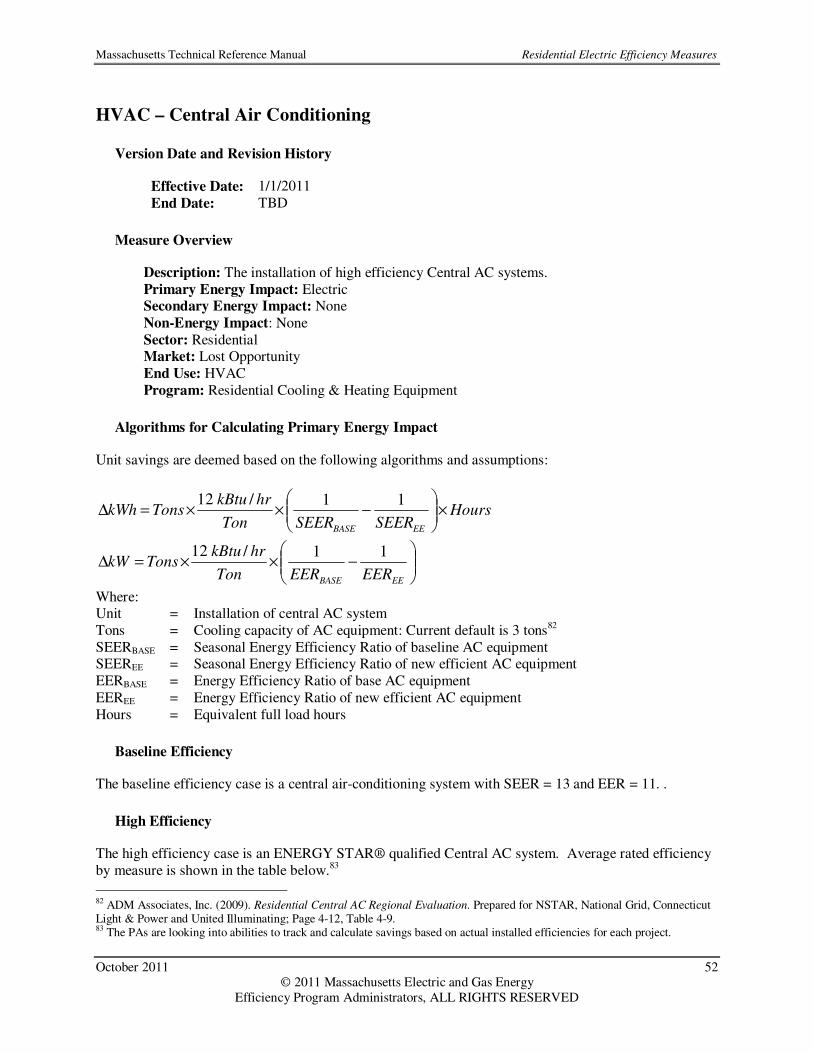
Massachusetts Technical Reference Manual Residential Electric Efficiency Measures
October 2011 52 © 2011 Massachusetts Electric and Gas Energy
Efficiency Program Administrators, ALL RIGHTS RESERVED
HVAC – Central Air Conditioning
Version Date and Revision History
Effective Date: 1/1/2011 End Date: TBD
Measure Overview
Description: The installation of high efficiency Central AC systems. Primary Energy Impact: Electric Secondary Energy Impact: None Non-Energy Impact: None Sector: Residential Market: Lost Opportunity End Use: HVAC Program: Residential Cooling & Heating Equipment
Algorithms for Calculating Primary Energy Impact
Unit savings are deemed based on the following algorithms and assumptions:
HoursSEERSEERTon
hrkBtuTonskWh
EEBASE
×
−××=∆
11/12
−××=∆
EEBASE EEREERTon
hrkBtuTonskW
11/12
Where: Unit = Installation of central AC system Tons = Cooling capacity of AC equipment: Current default is 3 tons82 SEERBASE = Seasonal Energy Efficiency Ratio of baseline AC equipment SEEREE = Seasonal Energy Efficiency Ratio of new efficient AC equipment EERBASE = Energy Efficiency Ratio of base AC equipment EEREE = Energy Efficiency Ratio of new efficient AC equipment Hours = Equivalent full load hours
Baseline Efficiency
The baseline efficiency case is a central air-conditioning system with SEER = 13 and EER = 11. .
High Efficiency
The high efficiency case is an ENERGY STAR® qualified Central AC system. Average rated efficiency by measure is shown in the table below.83
82 ADM Associates, Inc. (2009). Residential Central AC Regional Evaluation. Prepared for NSTAR, National Grid, Connecticut Light & Power and United Illuminating; Page 4-12, Table 4-9. 83 The PAs are looking into abilities to track and calculate savings based on actual installed efficiencies for each project.

Massachusetts Technical Reference Manual Residential Electric Efficiency Measures
October 2011 53 © 2011 Massachusetts Electric and Gas Energy
Efficiency Program Administrators, ALL RIGHTS RESERVED
Table 4: Savings for Residential Central Air Conditioners Measure EEREE SEEREE ∆kW ∆kWh
CoolSmart AC (SEER 14.5 / EER 12.0) 12.0 14.5 0.273 103
CoolSmart AC (SEER 15.0 / EER 12.5) 12.5 15.0 0.393 133
CoolSmart AC (SEER 15.0 / EER 13.0) 13.0 15.0 0.503 133
CoolSmart AC (SEER 16.0 / EER 13.0) 13.0 16.0 0.503 187
Hours
The equivalent full load cooling hours are 360 hours per year.84
Measure Life
The measure life is 18 years.85
Secondary Energy Impacts
There are no secondary energy impacts for this measure.
Non-Energy Impacts
Benefit Type Description Savings
Annual Non-Resource See Appendix D: Non-Resource Impacts See Appendix D: Non-Resource Impacts
One-Time Non-Resource See Appendix D: Non-Resource Impacts See Appendix D: Non-Resource Impacts
Impact Factors for Calculating Adjusted Gross Savings
Measure Name Program PA ISR SPF RRE RRSP RRWP CFSP CFWP
CoolSmart AC RHVAC All 1.00 1.00 1.00 1.00 1.00 0.25 0.00
In-Service Rates All installations have 100% in service rate since all PAs programs include verification of equipment installations. Savings Persistence Factor All PAs use 100% savings persistence factors. Realization Rates Realization rates are set to 100% based on Massachusetts Common Assumptions.
Coincidence Factors Coincidence factors are based on evaluation study results.86
84 ADM Associates, Inc. (2009). Residential Central AC Regional Evaluation. Prepared for NSTAR, National Grid, Connecticut Light & Power and United Illuminating; Page 4-5, Table 4-3. 85 GDS Associates, Inc. (2007). Measure Life Report: Residential and Commercial/Industrial Lighting and HVAC Measures. Prepared for The New England State Program Working Group; Page 1-3, Table 1. 86 ADM Associates, Inc. (2009). Residential Central AC Regional Evaluation. Prepared for NSTAR, National Grid, Connecticut Light & Power and United Illuminating; Page 4-12 Table 4-9.
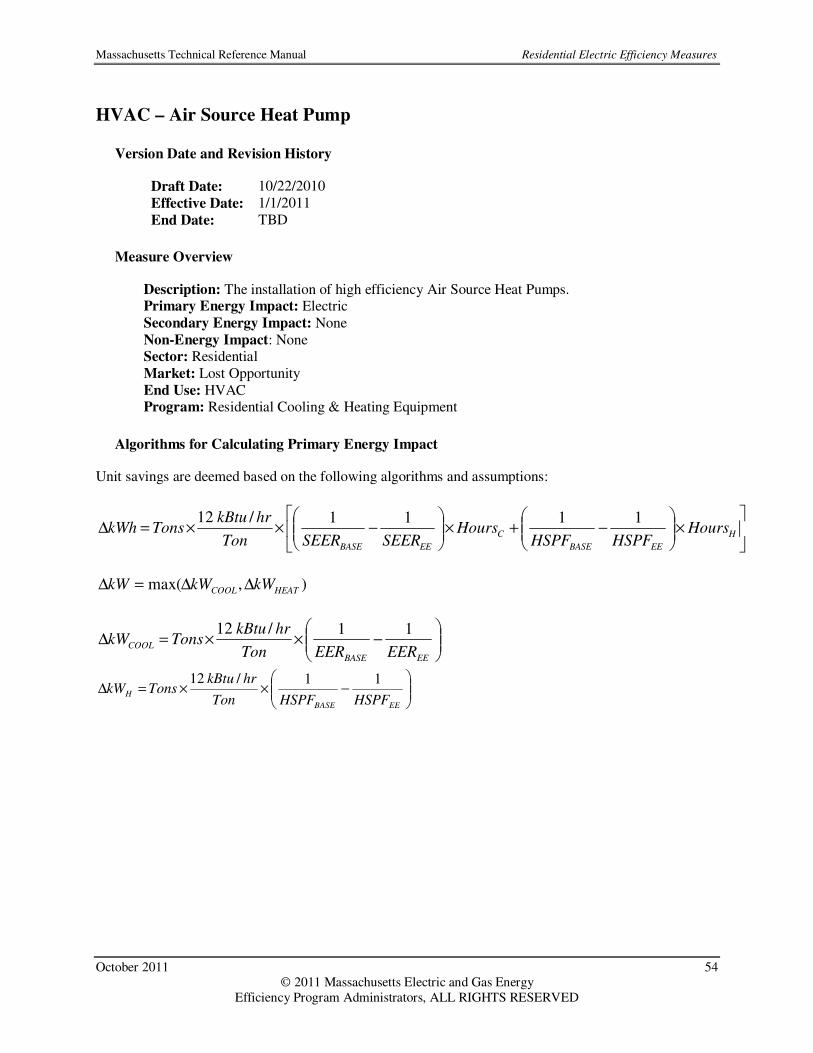
Massachusetts Technical Reference Manual Residential Electric Efficiency Measures
October 2011 54 © 2011 Massachusetts Electric and Gas Energy
Efficiency Program Administrators, ALL RIGHTS RESERVED
HVAC – Air Source Heat Pump
Version Date and Revision History
Draft Date: 10/22/2010 Effective Date: 1/1/2011 End Date: TBD
Measure Overview
Description: The installation of high efficiency Air Source Heat Pumps. Primary Energy Impact: Electric Secondary Energy Impact: None Non-Energy Impact: None Sector: Residential Market: Lost Opportunity End Use: HVAC Program: Residential Cooling & Heating Equipment
Algorithms for Calculating Primary Energy Impact
Unit savings are deemed based on the following algorithms and assumptions:
×
−+×
−××=∆ H
EEBASE
C
EEBASE
HoursHSPFHSPF
HoursSEERSEERTon
hrkBtuTonskWh
1111/12
),max( HEATCOOL kWkWkW ∆∆=∆
−××=∆
EEBASE
COOLEEREERTon
hrkBtuTonskW
11/12
−××=∆
EEBASE
HHSPFHSPFTon
hrkBtuTonskW
11/12

Massachusetts Technical Reference Manual Residential Electric Efficiency Measures
October 2011 55 © 2011 Massachusetts Electric and Gas Energy
Efficiency Program Administrators, ALL RIGHTS RESERVED
Where: Unit = Installation of heat pump system Tons = Capacity of HP equipment: Current default is 3 tons87 SEERBASE = Seasonal efficiency of baseline HP equipment SEEREE = Seasonal efficiency of new efficient HP equipment EERBASE = Peak efficiency of base HP equipment EEREE = Peak efficiency of new efficient HP equipment HSPFBASE = Heating efficiency of baseline HP equipment HSPFEE = Heating efficiency of new efficient HP equipment HoursC = EFLH for cooling HoursH = EFLH for heating
Baseline Efficiency
The baseline efficiency case is an air-source heat pump with SEER = 13, EER = 11and HSPF = 7. 7.
High Efficiency
The high efficiency case is an ENERGY STAR® qualified Air Source Heat Pump.
Table 5: Savings for Residential Air-Source Heat Pumps Measure EEREE SEEREE HSPFEE ∆kWC ∆kWH ∆kWh
CoolSmart HP (SEER 14.5 / EER 12.0 / HSPF 8.2) 12.0 14.5 8.2 0.273 0.347 519
CoolSmart HP (SEER 15.0 / EER 12.5 / HSPF 8.5) 12.5 15.0 8.5 0.393 0.502 735
Hours
Equivalent full load hours are 1200 hours/year for heating88 and 360 hours/year for cooling.89
Measure Life
The measure life is 18 years.90
Secondary Energy Impacts
There are no secondary energy impacts for this measure.
87 ADM Associates, Inc. (2009). Residential Central AC Regional Evaluation. Prepared for NSTAR, National Grid, Connecticut Light & Power and United Illuminating; Page 4-12, Table 4-9. 88 Massachusetts Common Assumption. 89 ADM Associates, Inc. (2009). Residential Central AC Regional Evaluation. Prepared for NSTAR, National Grid, Connecticut Light & Power and United Illuminating; Page 4-5, Table 4-3. 90 GDS Associates, Inc. (2007). Measure Life Report: Residential and Commercial/Industrial Lighting and HVAC Measures.
Prepared for The New England State Program Working Group; Page 1-3, Table 1.
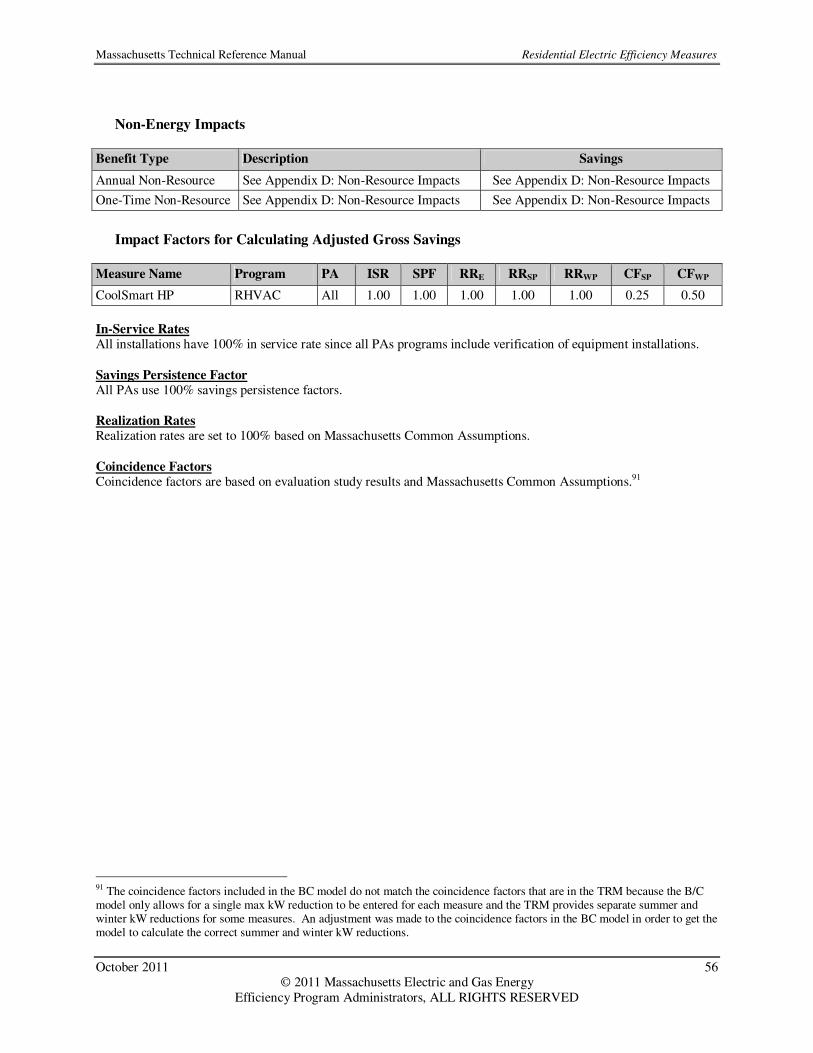
Massachusetts Technical Reference Manual Residential Electric Efficiency Measures
October 2011 56 © 2011 Massachusetts Electric and Gas Energy
Efficiency Program Administrators, ALL RIGHTS RESERVED
Non-Energy Impacts
Benefit Type Description Savings
Annual Non-Resource See Appendix D: Non-Resource Impacts See Appendix D: Non-Resource Impacts
One-Time Non-Resource See Appendix D: Non-Resource Impacts See Appendix D: Non-Resource Impacts
Impact Factors for Calculating Adjusted Gross Savings
Measure Name Program PA ISR SPF RRE RRSP RRWP CFSP CFWP
CoolSmart HP RHVAC All 1.00 1.00 1.00 1.00 1.00 0.25 0.50
In-Service Rates All installations have 100% in service rate since all PAs programs include verification of equipment installations. Savings Persistence Factor All PAs use 100% savings persistence factors. Realization Rates Realization rates are set to 100% based on Massachusetts Common Assumptions. Coincidence Factors Coincidence factors are based on evaluation study results and Massachusetts Common Assumptions.91
91 The coincidence factors included in the BC model do not match the coincidence factors that are in the TRM because the B/C model only allows for a single max kW reduction to be entered for each measure and the TRM provides separate summer and winter kW reductions for some measures. An adjustment was made to the coincidence factors in the BC model in order to get the model to calculate the correct summer and winter kW reductions.

Massachusetts Technical Reference Manual Residential Electric Efficiency Measures
October 2011 57 © 2011 Massachusetts Electric and Gas Energy
Efficiency Program Administrators, ALL RIGHTS RESERVED
HVAC – Ductless MiniSplit Heat Pump
Version Date and Revision History
Effective Date: 1/1/2011 End Date: TBD
Measure Overview
Description: The installation of a more efficient ENERGY STAR® rated Ductless Mini Split HP system. Energy is savings by a more efficient heating and cooling unit and from the elimination of duct losses. Primary Energy Impact: Electric Secondary Energy Impact: None Non-Energy Impact: None Sector: Residential Market: Lost Opportunity End Use: HVAC Program: Residential Cooling & Heating Equipment
Algorithms for Calculating Primary Energy Impact
Unit savings are deemed based on the following algorithms and assumptions:
×
−+×
−×=∆ H
EEBASEC
EEBASEHP Hours
HSPFHSPFHours
SEERSEERTon
hrkBtuTonskWh
1111/12
−××=∆
EEBASE
COOLEEREERTon
hrkBtuTonskW
11/12
−××=∆
EEBASE
HEATHSPFHSPFTon
hrkBtuTonskW
11/12
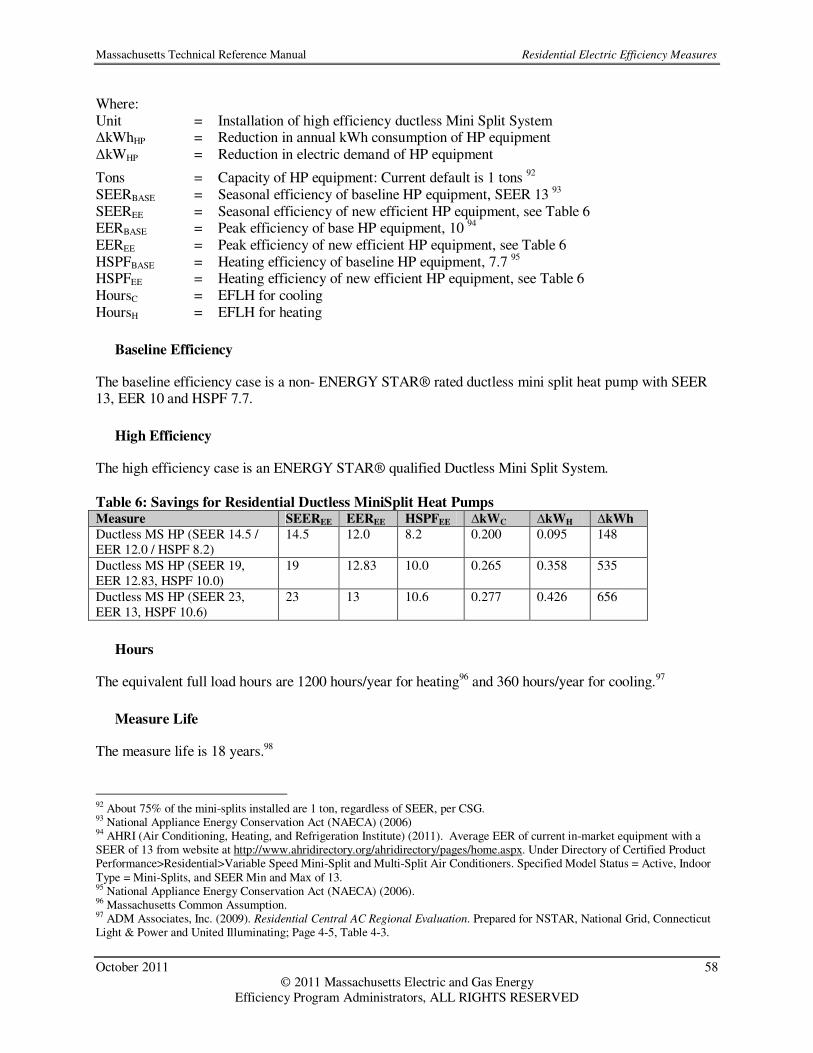
Massachusetts Technical Reference Manual Residential Electric Efficiency Measures
October 2011 58 © 2011 Massachusetts Electric and Gas Energy
Efficiency Program Administrators, ALL RIGHTS RESERVED
Where: Unit = Installation of high efficiency ductless Mini Split System ∆kWhHP = Reduction in annual kWh consumption of HP equipment ∆kWHP = Reduction in electric demand of HP equipment
Tons = Capacity of HP equipment: Current default is 1 tons 92 SEERBASE = Seasonal efficiency of baseline HP equipment, SEER 13 93 SEEREE = Seasonal efficiency of new efficient HP equipment, see Table 6 EERBASE = Peak efficiency of base HP equipment, 10 94 EEREE = Peak efficiency of new efficient HP equipment, see Table 6 HSPFBASE = Heating efficiency of baseline HP equipment, 7.7 95 HSPFEE = Heating efficiency of new efficient HP equipment, see Table 6 HoursC = EFLH for cooling HoursH = EFLH for heating
Baseline Efficiency
The baseline efficiency case is a non- ENERGY STAR® rated ductless mini split heat pump with SEER 13, EER 10 and HSPF 7.7.
High Efficiency
The high efficiency case is an ENERGY STAR® qualified Ductless Mini Split System. Table 6: Savings for Residential Ductless MiniSplit Heat Pumps Measure SEEREE EEREE HSPFEE ∆kWC ∆kWH ∆kWh
Ductless MS HP (SEER 14.5 / EER 12.0 / HSPF 8.2)
14.5 12.0 8.2 0.200 0.095 148
Ductless MS HP (SEER 19, EER 12.83, HSPF 10.0)
19 12.83 10.0 0.265 0.358 535
Ductless MS HP (SEER 23, EER 13, HSPF 10.6)
23 13 10.6 0.277 0.426 656
Hours
The equivalent full load hours are 1200 hours/year for heating96 and 360 hours/year for cooling.97
Measure Life
The measure life is 18 years.98
92 About 75% of the mini-splits installed are 1 ton, regardless of SEER, per CSG. 93 National Appliance Energy Conservation Act (NAECA) (2006) 94 AHRI (Air Conditioning, Heating, and Refrigeration Institute) (2011). Average EER of current in-market equipment with a SEER of 13 from website at http://www.ahridirectory.org/ahridirectory/pages/home.aspx. Under Directory of Certified Product Performance>Residential>Variable Speed Mini-Split and Multi-Split Air Conditioners. Specified Model Status = Active, Indoor Type = Mini-Splits, and SEER Min and Max of 13. 95 National Appliance Energy Conservation Act (NAECA) (2006). 96 Massachusetts Common Assumption. 97 ADM Associates, Inc. (2009). Residential Central AC Regional Evaluation. Prepared for NSTAR, National Grid, Connecticut Light & Power and United Illuminating; Page 4-5, Table 4-3.
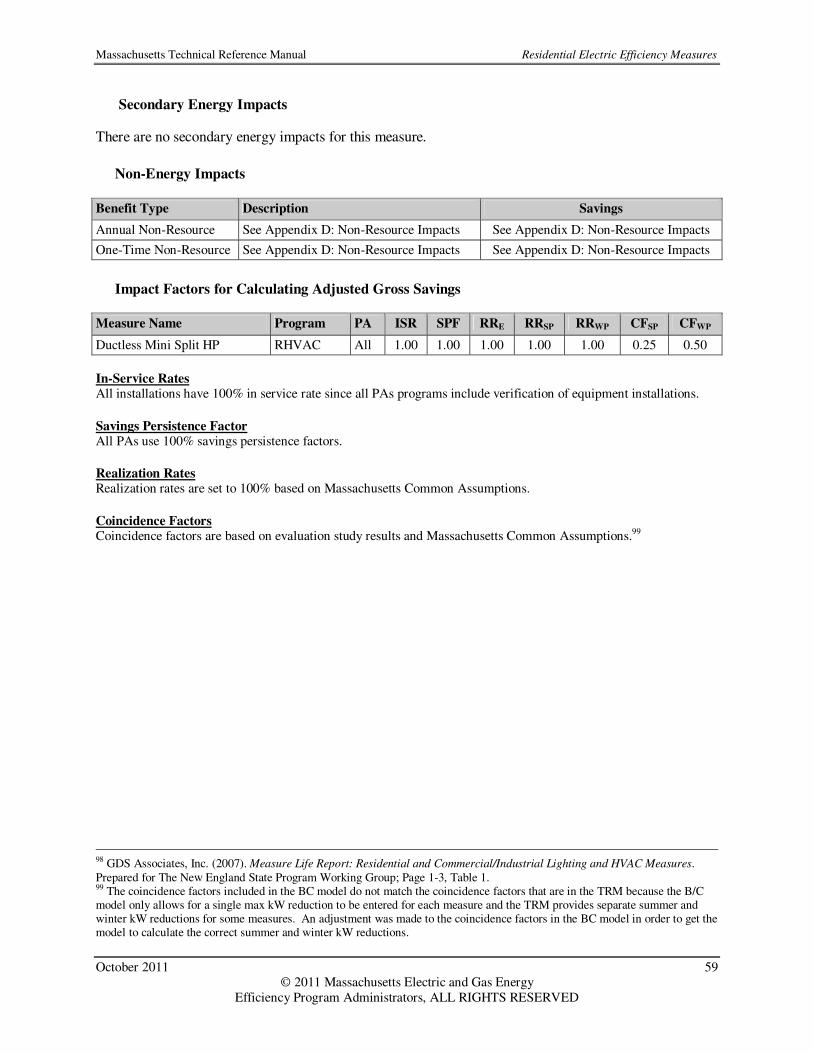
Massachusetts Technical Reference Manual Residential Electric Efficiency Measures
October 2011 59 © 2011 Massachusetts Electric and Gas Energy
Efficiency Program Administrators, ALL RIGHTS RESERVED
Secondary Energy Impacts
There are no secondary energy impacts for this measure.
Non-Energy Impacts
Benefit Type Description Savings
Annual Non-Resource See Appendix D: Non-Resource Impacts See Appendix D: Non-Resource Impacts
One-Time Non-Resource See Appendix D: Non-Resource Impacts See Appendix D: Non-Resource Impacts
Impact Factors for Calculating Adjusted Gross Savings
Measure Name Program PA ISR SPF RRE RRSP RRWP CFSP CFWP
Ductless Mini Split HP RHVAC All 1.00 1.00 1.00 1.00 1.00 0.25 0.50
In-Service Rates All installations have 100% in service rate since all PAs programs include verification of equipment installations.
Savings Persistence Factor All PAs use 100% savings persistence factors.
Realization Rates Realization rates are set to 100% based on Massachusetts Common Assumptions.
Coincidence Factors Coincidence factors are based on evaluation study results and Massachusetts Common Assumptions.99
98 GDS Associates, Inc. (2007). Measure Life Report: Residential and Commercial/Industrial Lighting and HVAC Measures. Prepared for The New England State Program Working Group; Page 1-3, Table 1. 99 The coincidence factors included in the BC model do not match the coincidence factors that are in the TRM because the B/C model only allows for a single max kW reduction to be entered for each measure and the TRM provides separate summer and winter kW reductions for some measures. An adjustment was made to the coincidence factors in the BC model in order to get the model to calculate the correct summer and winter kW reductions.
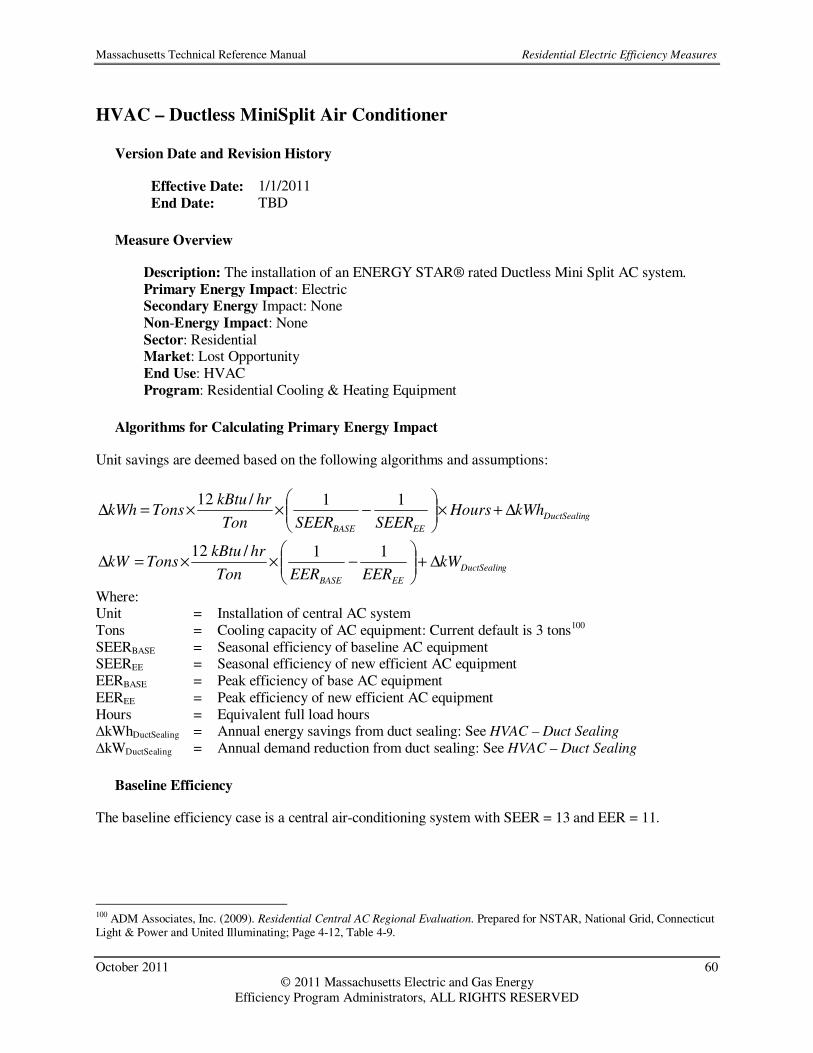
Massachusetts Technical Reference Manual Residential Electric Efficiency Measures
October 2011 60 © 2011 Massachusetts Electric and Gas Energy
Efficiency Program Administrators, ALL RIGHTS RESERVED
HVAC – Ductless MiniSplit Air Conditioner
Version Date and Revision History
Effective Date: 1/1/2011 End Date: TBD
Measure Overview
Description: The installation of an ENERGY STAR® rated Ductless Mini Split AC system. Primary Energy Impact: Electric Secondary Energy Impact: None Non-Energy Impact: None Sector: Residential Market: Lost Opportunity End Use: HVAC Program: Residential Cooling & Heating Equipment
Algorithms for Calculating Primary Energy Impact
Unit savings are deemed based on the following algorithms and assumptions:
gDuctSealin
EEBASE
kWhHoursSEERSEERTon
hrkBtuTonskWh ∆+×
−××=∆
11/12
gDuctSealin
EEBASE
kWEEREERTon
hrkBtuTonskW ∆+
−××=∆
11/12
Where: Unit = Installation of central AC system Tons = Cooling capacity of AC equipment: Current default is 3 tons100 SEERBASE = Seasonal efficiency of baseline AC equipment SEEREE = Seasonal efficiency of new efficient AC equipment EERBASE = Peak efficiency of base AC equipment EEREE = Peak efficiency of new efficient AC equipment Hours = Equivalent full load hours ∆kWhDuctSealing = Annual energy savings from duct sealing: See HVAC – Duct Sealing ∆kWDuctSealing = Annual demand reduction from duct sealing: See HVAC – Duct Sealing
Baseline Efficiency
The baseline efficiency case is a central air-conditioning system with SEER = 13 and EER = 11.
100 ADM Associates, Inc. (2009). Residential Central AC Regional Evaluation. Prepared for NSTAR, National Grid, Connecticut Light & Power and United Illuminating; Page 4-12, Table 4-9.

Massachusetts Technical Reference Manual Residential Electric Efficiency Measures
October 2011 61 © 2011 Massachusetts Electric and Gas Energy
Efficiency Program Administrators, ALL RIGHTS RESERVED
High Efficiency
The high efficiency case is a Ductless Mini Split system with SEER = 14 and EER = 11.5, and with duct sealing measures implemented. Measure EEREE SEEREE ∆kW ∆kWh
Ductless Mini Split AC 11.5 14 0.442 283
Hours
Equivalent full load cooling hours are 360 hours per year.101
Measure Life
The measure life is 18 years.102
Secondary Energy Impacts
There are no secondary energy impacts for this measure.
Non-Energy Impacts
Benefit Type Description Savings
Annual Non-Resource See Appendix D: Non-Resource Impacts See Appendix D: Non-Resource Impacts
One-Time Non-Resource See Appendix D: Non-Resource Impacts See Appendix D: Non-Resource Impacts
Impact Factors for Calculating Adjusted Gross Savings
Measure Name Program PA ISR SPF RRE RRSP RRWP CFSP CFWP
Ductless Mini Split AC RHVAC All 1.00 1.00 1.00 1.00 1.00 0.25 0.00
In-Service Rates All installations have 100% in service rate since all PAs programs include verification of equipment installations. Savings Persistence Factor All PAs use 100% savings persistence factors. Realization Rates Realization rates are set to 100% based on Massachusetts Common Assumptions. Coincidence Factors Coincidence factors are based on evaluation study results103.
101 ADM Associates, Inc. (2009). Residential Central AC Regional Evaluation. Prepared for NSTAR, National Grid, Connecticut Light & Power and United Illuminating; Page 4-5, Table 4-3. 102 GDS Associates, Inc. (2007). Measure Life Report: Residential and Commercial/Industrial Lighting and HVAC Measures. Prepared for The New England State Program Working Group; Page 1-3, Table 1. 103 ADM Associates, Inc. (2009). Residential Central AC Regional Evaluation. Prepared for NSTAR, National Grid, Connecticut Light & Power and United Illuminating; Page 4-12 Table 4-9.

Massachusetts Technical Reference Manual Residential Electric Efficiency Measures
October 2011 62 © 2011 Massachusetts Electric and Gas Energy
Efficiency Program Administrators, ALL RIGHTS RESERVED
HVAC – Central AC Quality Installation Verification (QIV)
Version Date and Revision History
Effective Date: 1/1/2011 End Date: TBD
Measure Overview
Description: The verification of proper charge and airflow during installation of new Central AC system. Primary Energy Impact: Electric Secondary Energy Impact: None Non-Energy Impact: None Sector: Residential Market: Lost Opportunity End Use: HVAC Program: Residential Cooling & Heating Equipment
Algorithms for Calculating Primary Energy Impact
Unit savings are deemed based on the following algorithms and assumptions:
%51/12
××××=∆ HoursSEERTon
hrkBtuTonskWh
%51/12
×××=∆EERTon
hrkBtuTonskW
Where: Units = Completed QIV ∆kW = Average demand reduction per unit: 0.164 kW (calculated) ∆kWh = Average annual energy reduction per unit: 50 kWh (calculated) Tons = Cooling capacity of AC equipment: Current default is 3 tons 104 SEER = Seasonal efficiency of AC equipment: Default = 13 EER = Peak efficiency of AC equipment: Default = 11 Hours = Equivalent full load hours 5% = Average percent demand reduction: 5.0%105
Baseline Efficiency
The baseline efficiency case is a baseline cooling system (SEER = 13 and EER = 11) whose installation is inconsistent with manufacturer specifications.
104 ADM Associates, Inc. (2009). Residential Central AC Regional Evaluation. Prepared for NSTAR, National Grid, Connecticut Light & Power and United Illuminating; Page 4-12, Table 4-9. 105 Massachusetts Common Assumption.

Massachusetts Technical Reference Manual Residential Electric Efficiency Measures
October 2011 63 © 2011 Massachusetts Electric and Gas Energy
Efficiency Program Administrators, ALL RIGHTS RESERVED
High Efficiency
The high efficiency case is the same baseline cooling system whose installation is consistent with manufacturer specifications.
Hours
Equivalent full load cooling hours are 360 hours per year.106
Measure Life
The measure life is 18 years.107
Secondary Energy Impacts
There are no secondary energy impacts for this measure.
Non-Energy Impacts
Benefit Type Description Savings
Annual Non-Resource See Appendix D: Non-Resource Impacts See Appendix D: Non-Resource Impacts
One-Time Non-Resource See Appendix D: Non-Resource Impacts See Appendix D: Non-Resource Impacts
Impact Factors for Calculating Adjusted Gross Savings
Measure Name Program PA ISR SPF RRE RRSP RRWP CFSP CFWP
CoolSmart AC QIV ES RHVAC All 1.00 1.00 1.00 1.00 1.00 0.25 0.00
CoolSmart AC QIV NES RHVAC All 1.00 1.00 1.00 1.00 1.00 0.25 0.00
In-Service Rates All installations have 100% in service rate since all PAs programs include verification of equipment installations. Savings Persistence Factor All PAs use 100% savings persistence factors. Realization Rates Realization rates are set to 100% based on Massachusetts Common Assumptions.
Coincidence Factors Coincidence factors are based on evaluation study results108.
106 ADM Associates, Inc. (2009). Residential Central AC Regional Evaluation. Prepared for NSTAR, National Grid, Connecticut Light & Power and United Illuminating; Page 4-5, Table 4-3. 107 GDS Associates, Inc. (2007). Measure Life Report: Residential and Commercial/Industrial Lighting and HVAC Measures. Prepared for The New England State Program Working Group; Page 1-3, Table 1. 108 ADM Associates, Inc. (2009). Residential Central AC Regional Evaluation. Prepared for NSTAR, National Grid, Connecticut Light & Power and United Illuminating; Page 4-12 Table 4-9.
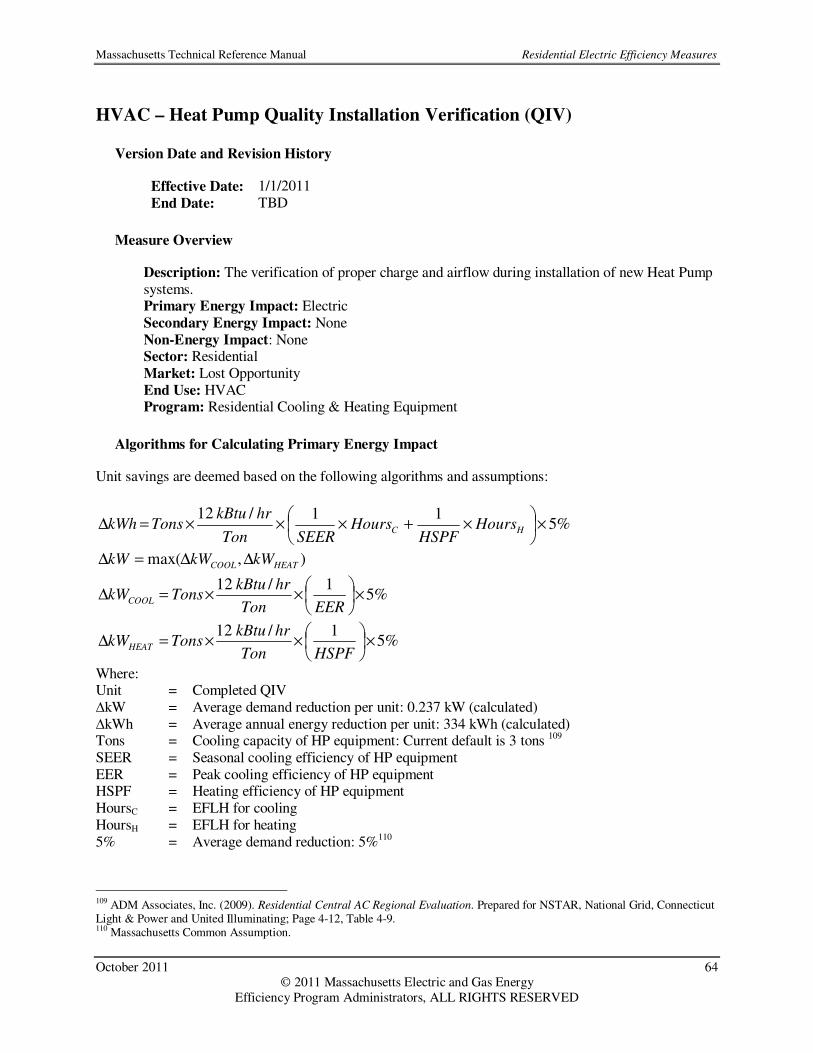
Massachusetts Technical Reference Manual Residential Electric Efficiency Measures
October 2011 64 © 2011 Massachusetts Electric and Gas Energy
Efficiency Program Administrators, ALL RIGHTS RESERVED
HVAC – Heat Pump Quality Installation Verification (QIV)
Version Date and Revision History
Effective Date: 1/1/2011 End Date: TBD
Measure Overview
Description: The verification of proper charge and airflow during installation of new Heat Pump systems. Primary Energy Impact: Electric Secondary Energy Impact: None Non-Energy Impact: None Sector: Residential Market: Lost Opportunity End Use: HVAC Program: Residential Cooling & Heating Equipment
Algorithms for Calculating Primary Energy Impact
Unit savings are deemed based on the following algorithms and assumptions:
%511/12
×
×+×××=∆ HC Hours
HSPFHours
SEERTon
hrkBtuTonskWh
),max( HEATCOOL kWkWkW ∆∆=∆
%51/12
×
××=∆
EERTon
hrkBtuTonskWCOOL
%51/12
×
××=∆
HSPFTon
hrkBtuTonskWHEAT
Where: Unit = Completed QIV ∆kW = Average demand reduction per unit: 0.237 kW (calculated) ∆kWh = Average annual energy reduction per unit: 334 kWh (calculated) Tons = Cooling capacity of HP equipment: Current default is 3 tons 109 SEER = Seasonal cooling efficiency of HP equipment EER = Peak cooling efficiency of HP equipment HSPF = Heating efficiency of HP equipment HoursC = EFLH for cooling HoursH = EFLH for heating 5% = Average demand reduction: 5%110
109 ADM Associates, Inc. (2009). Residential Central AC Regional Evaluation. Prepared for NSTAR, National Grid, Connecticut Light & Power and United Illuminating; Page 4-12, Table 4-9. 110 Massachusetts Common Assumption.

Massachusetts Technical Reference Manual Residential Electric Efficiency Measures
October 2011 65 © 2011 Massachusetts Electric and Gas Energy
Efficiency Program Administrators, ALL RIGHTS RESERVED
Baseline Efficiency
The baseline efficiency case is a baseline heating and cooling system (SEER = 13, EER = 11 and HSPF = 7.6) whose installation is inconsistent with manufacturer specifications.
High Efficiency
The high efficiency case is the same heating and cooling system whose installation is consistent with manufacturer specifications.
Hours
The equivalent full load heating hours are 1,200 hours per year and the equivalent full load cooling hours are 360 hours per year.111
Measure Life
The measure life is 18 years.112
Secondary Energy Impacts
There are no secondary energy impacts for this measure.
Non-Energy Impacts
Benefit Type Description Savings
Annual Non-Resource See Appendix D: Non-Resource Impacts See Appendix D: Non-Resource Impacts
One-Time Non-Resource See Appendix D: Non-Resource Impacts See Appendix D: Non-Resource Impacts
Impact Factors for Calculating Adjusted Gross Savings
Measure Name Program PA ISR SPF RRE RRSP RRWP CFSP CFWP
CoolSmart HP QIV ES RHVAC All 1.00 1.00 1.00 1.00 1.00 0.25 0.50
CoolSmart HP QIV NES RHVAC All 1.00 1.00 1.00 1.00 1.00 0.25 0.50
In-Service Rates All installations have 100% in service rate since all PAs programs include verification of equipment installations. Savings Persistence Factor All PAs use 100% savings persistence factors. Realization Rates Realization rates are set to 100% based on Massachusetts Common Assumptions.
111 ADM Associates, Inc. (2009). Residential Central AC Regional Evaluation. Prepared for NSTAR, National Grid, Connecticut Light & Power and United Illuminating; Page 4-5, Table 4-3. 112 GDS Associates, Inc. (2007). Measure Life Report: Residential and Commercial/Industrial Lighting and HVAC Measures. Prepared for The New England State Program Working Group; Page 1-3, Table 1.

Massachusetts Technical Reference Manual Residential Electric Efficiency Measures
October 2011 66 © 2011 Massachusetts Electric and Gas Energy
Efficiency Program Administrators, ALL RIGHTS RESERVED
Coincidence Factors Coincidence factors are based on Massachusetts Common Assumptions.113
113 The coincidence factors included in the BC model do not match the coincidence factors that are in the TRM because the B/C model only allows for a single max kW reduction to be entered for each measure and the TRM provides separate summer and winter kW reductions for some measures. An adjustment was made to the coincidence factors in the BC model in order to get the model to calculate the correct summer and winter kW reductions.

Massachusetts Technical Reference Manual Residential Electric Efficiency Measures
October 2011 67 © 2011 Massachusetts Electric and Gas Energy
Efficiency Program Administrators, ALL RIGHTS RESERVED
HVAC – Central AC Digital Check-up/Tune–up
Version Date and Revision History
Effective Date: 1/1/2011 End Date: TBD
Measure Overview
Description: Tune-up of an existing central AC system. Primary Energy Impact: Electric Secondary Energy Impact: None Non-Energy Impact: None Sector: Residential Market: Lost Opportunity End Use: HVAC Program: Residential Cooling & Heating Equipment
Algorithms for Calculating Primary Energy Impact
Unit savings are deemed based on the following algorithms and assumptions:
%51/12
××××=∆ HoursSEERTon
hrkBtuTonskWh
%51/12
×××=∆EERTon
hrkBtuTonskW
Where: Unit = Completed tune-up ∆kWh = Average annual energy reduction per unit: 65 kWh (calculated) ∆kW = Average demand reduction per unit: 0.212 kW (calculated) Tons = Cooling capacity of AC equipment: Current default is 3 tons114 SEER = Seasonal efficiency of AC equipment EER = Peak efficiency of AC equipment Hours = Equivalent full load hours 5% = Average demand reduction: 5%115
Baseline Efficiency
The baseline efficiency case is a baseline cooling system (SEER = 13 and EER = 11) that does not operate according to manufacturer specifications.
114 ADM Associates, Inc. (2009). Residential Central AC Regional Evaluation. Prepared for NSTAR, National Grid, Connecticut Light & Power and United Illuminating; Page 4-12, Table 4-9. 115 Massachusetts Common Assumption.

Massachusetts Technical Reference Manual Residential Electric Efficiency Measures
October 2011 68 © 2011 Massachusetts Electric and Gas Energy
Efficiency Program Administrators, ALL RIGHTS RESERVED
High Efficiency
The high efficiency case is the same cooling system that operates according to manufacturer specifications.
Hours
The equivalent full load cooling hours are 360 hours per year.116
Measure Life
The measure life is 5 years.117
Secondary Energy Impacts
There are no secondary energy impacts for this measure.
Non-Energy Impacts
Benefit Type Description Savings
Annual Non-Resource See Appendix D: Non-Resource Impacts See Appendix D: Non-Resource Impacts
One-Time Non-Resource See Appendix D: Non-Resource Impacts See Appendix D: Non-Resource Impacts
Impact Factors for Calculating Adjusted Gross Savings
Measure Name Program PA ISR SPF RRE RRSP RRWP CFSP CFWP
CoolSmart AC Digital Check-up/Tune-up RHVAC All 1.00 1.00 1.00 1.00 1.00 0.25 0.00
In-Service Rates All installations have 100% in service rate since all PAs programs include verification of equipment installations. Savings Persistence Factor All PAs use 100% savings persistence factors. Realization Rates Realization rates are based on Massachusetts Common Assumptions. Coincidence Factors Coincidence factors are based on evaluation study results118.
116 ADM Associates, Inc. (2009). Residential Central AC Regional Evaluation. Prepared for NSTAR, National Grid, Connecticut Light & Power and United Illuminating; Page 4-5, Table 4-3. 117 GDS Associates, Inc. (2007). Measure Life Report: Residential and Commercial/Industrial Lighting and HVAC Measures. Prepared for The New England State Program Working Group; Page 1-3, Table 1. 118 ADM Associates, Inc. (2009). Residential Central AC Regional Evaluation. Prepared for NSTAR, National Grid, Connecticut Light & Power and United Illuminating; Page 4-12 Table 4-9.

Massachusetts Technical Reference Manual Residential Electric Efficiency Measures
October 2011 69 © 2011 Massachusetts Electric and Gas Energy
Efficiency Program Administrators, ALL RIGHTS RESERVED
HVAC – Heat Pump Digital Check-up/Tune-up
Version Date and Revision History
Effective Date: 1/1/2011 End Date: TBD
Measure Overview
Description: Tune-up of an existing heat pump system. Primary Energy Impact: Electric Secondary Energy Impact: None Non-Energy Impact: None Sector: Residential Market: Lost Opportunity End Use: HVAC Program: Residential Cooling & Heating Equipment
Algorithms for Calculating Primary Energy Impact
Unit savings are deemed based on the following algorithms and assumptions:
%511/12
×
×+×××=∆ HC Hours
HSPFHours
SEERTon
hrkBtuTonskWh
),max( HEATCOOL kWkWkW ∆∆=∆
%51/12
×
××=∆
EERTon
hrkBtuTonskWCOOL
%51/12
×
××=∆
HSPFTon
hrkBtuTonskWHEAT
Where: Unit = Completed tune-up ∆kWh = Average annual energy reduction per unit: 373 kWh (calculated) ∆kW = Average demand reduction per unit: 0.257 kW (calculated) Tons = Cooling capacity of HP equipment: Current default is 3 tons119 SEER = Seasonal cooling efficiency of HP equipment EER = Peak cooling efficiency of HP equipment HSPF = Heating efficiency of HP equipment HoursC = EFLH for cooling HoursH = EFLH for heating 5% = Average demand reduction: 5%120
Baseline Efficiency
119 ADM Associates, Inc. (2009). Residential Central AC Regional Evaluation. Prepared for NSTAR, National Grid, Connecticut Light & Power and United Illuminating; Page 4-12, Table 4-9. 120 Massachusetts Common Assumption.

Massachusetts Technical Reference Manual Residential Electric Efficiency Measures
October 2011 70 © 2011 Massachusetts Electric and Gas Energy
Efficiency Program Administrators, ALL RIGHTS RESERVED
The baseline efficiency case is a system baseline heating and cooling system (SEER = 13, EER = 11 and HSPF = 76) that does not operating according to manufacturer specifications.
High Efficiency
The high efficiency case is the same heating and cooling system that does operate according to manufacturer specifications.
Hours
The equivalent full load hours are 1200 hours per year for heating121 and 360 hours per year for cooling.122
Measure Life
The measure life is 5 years123
Secondary Energy Impacts
There are no secondary energy impacts for this measure.
Non-Energy Impacts
Benefit Type Description Savings
Annual Non-Resource See Appendix D: Non-Resource Impacts See Appendix D: Non-Resource Impacts
One-Time Non-Resource See Appendix D: Non-Resource Impacts See Appendix D: Non-Resource Impacts
Impact Factors for Calculating Adjusted Gross Savings
Measure Name Program PA ISR SPF RRE RRSP RRWP CFSP CFWP
CoolSmart HP Digital Check-up/Tune-up RHVAC All 1.00 1.00 1.00 1.00 1.00 0.25 0.50
In-Service Rates All installations have 100% in service rate since all PAs programs include verification of equipment installations. Savings Persistence Factor All PAs use 100% savings persistence factors. Realization Rates Realization rates are set to 100% based on Massachusetts Common Assumptions. Coincidence Factors Coincidence factors are based on evaluation study results and Massachusetts Common Assumptions.124
121 Massachusetts Common Assumption. 122 ADM Associates, Inc. (2009). Residential Central AC Regional Evaluation. Prepared for NSTAR, National Grid, Connecticut Light & Power and United Illuminating; Page 4-5, Table 4-3. 123 GDS Associates, Inc. (2007). Measure Life Report: Residential and Commercial/Industrial Lighting and HVAC Measures. Prepared for The New England State Program Working Group; Page 1-3, Table 1.

Massachusetts Technical Reference Manual Residential Electric Efficiency Measures
October 2011 71 © 2011 Massachusetts Electric and Gas Energy
Efficiency Program Administrators, ALL RIGHTS RESERVED
HVAC – Duct Sealing
Version Date and Revision History
Effective Date: 1/1/2011 End Date: TBD
Measure Overview
Description: A 66% reduction in duct leakage from 15% to 5% of supplied CFM. Primary Energy Impact: Electric Secondary Energy Impact: None Non-Energy Impact: None Sector: Residential Market: Lost Opportunity End Use: HVAC Program: Residential Cooling & Heating Equipment
Algorithms for Calculating Primary Energy Impact
Unit savings are deemed based on results of DOE2 modeling:
kWhkWh ∆=∆
kWkW ∆=∆ Where: Unit = Completed job ∆kW = Average demand reduction per unit: 0.300 kW125 ∆kWh = Average annual energy reduction per unit: 212 kWh126
Baseline Efficiency
The baseline efficiency case is assumes a 15% leakage.
High Efficiency
The high efficiency case is a system with duct leakage reduced by 66% to 5% leakage.
124 The coincidence factors included in the BC model do not match the coincidence factors that are in the TRM because the B/C model only allows for a single max kW reduction to be entered for each measure and the TRM provides separate summer and winter kW reductions for some measures. An adjustment was made to the coincidence factors in the BC model in order to get the model to calculate the correct summer and winter kW reductions. 125 RLW Analytics (2002). Market Research for the Rhode Island, Massachusetts, and Connecticut Residential HVAC Market. Prepared for National Grid, Northeast Utilities, NSTAR, Fitchburg Gas and Electric Light Company and United Illuminating; Page 3, Table 2. 126 Ibid
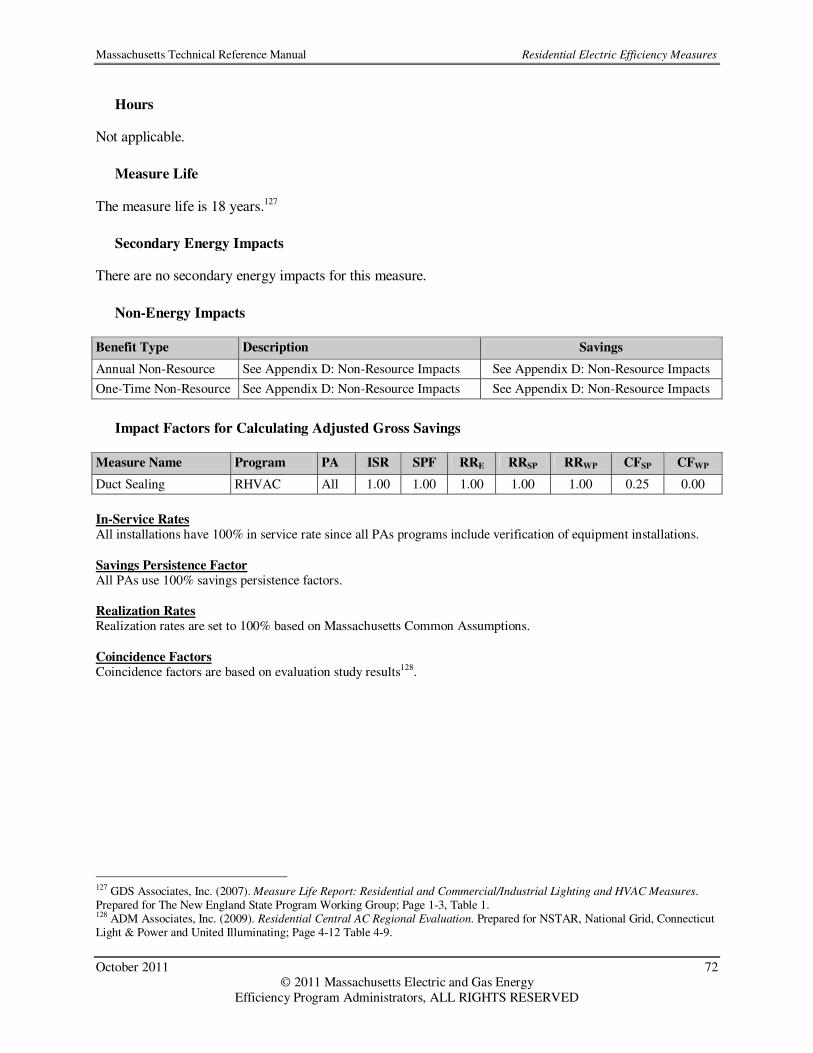
Massachusetts Technical Reference Manual Residential Electric Efficiency Measures
October 2011 72 © 2011 Massachusetts Electric and Gas Energy
Efficiency Program Administrators, ALL RIGHTS RESERVED
Hours
Not applicable.
Measure Life
The measure life is 18 years.127
Secondary Energy Impacts
There are no secondary energy impacts for this measure.
Non-Energy Impacts
Benefit Type Description Savings
Annual Non-Resource See Appendix D: Non-Resource Impacts See Appendix D: Non-Resource Impacts
One-Time Non-Resource See Appendix D: Non-Resource Impacts See Appendix D: Non-Resource Impacts
Impact Factors for Calculating Adjusted Gross Savings
Measure Name Program PA ISR SPF RRE RRSP RRWP CFSP CFWP
Duct Sealing RHVAC All 1.00 1.00 1.00 1.00 1.00 0.25 0.00
In-Service Rates All installations have 100% in service rate since all PAs programs include verification of equipment installations. Savings Persistence Factor All PAs use 100% savings persistence factors. Realization Rates Realization rates are set to 100% based on Massachusetts Common Assumptions.
Coincidence Factors Coincidence factors are based on evaluation study results128.
127 GDS Associates, Inc. (2007). Measure Life Report: Residential and Commercial/Industrial Lighting and HVAC Measures. Prepared for The New England State Program Working Group; Page 1-3, Table 1. 128 ADM Associates, Inc. (2009). Residential Central AC Regional Evaluation. Prepared for NSTAR, National Grid, Connecticut Light & Power and United Illuminating; Page 4-12 Table 4-9.

Massachusetts Technical Reference Manual Residential Electric Efficiency Measures
October 2011 73 © 2011 Massachusetts Electric and Gas Energy
Efficiency Program Administrators, ALL RIGHTS RESERVED
HVAC – Down Size ½ Ton
Version Date and Revision History
Effective Date: 1/1/2011 End Date: TBD
Measure Overview
Description: Reduction in system size consistent with manual J calculations. Primary Energy Impact: Electric Secondary Energy Impact: None Non-Energy Impact: One-Time Cost Reduction Sector: Residential Market: Lost Opportunity End Use: HVAC Program: Residential Cooling & Heating Equipment
Algorithms for Calculating Primary Energy Impact
Unit savings are deemed based on results of DOE2 modeling:
TonTonkWhkWh 21/ ×∆=∆
TonTonkWkW 21/ ×∆=∆
Where: Units = Completed job ∆kW/Ton = Average demand reduction per ton: 0.295 kW129 ∆kWh/Ton = Average annual energy reduction per ton: 203 kWh130
Baseline Efficiency
The baseline efficiency case is a system that is not sized in accordance with manual J calculation.
High Efficiency
The high efficiency case is a system that is sized in accordance with manual J calculation.
Hours
Not applicable.
129 RLW Analytics (2002). Market Research for the Rhode Island, Massachusetts, and Connecticut Residential HVAC Market. Prepared for National Grid, Northeast Utilities, NSTAR, Fitchburg Gas and Electric Light Company and United Illuminating; Page 3, Table 2 130 ibid.
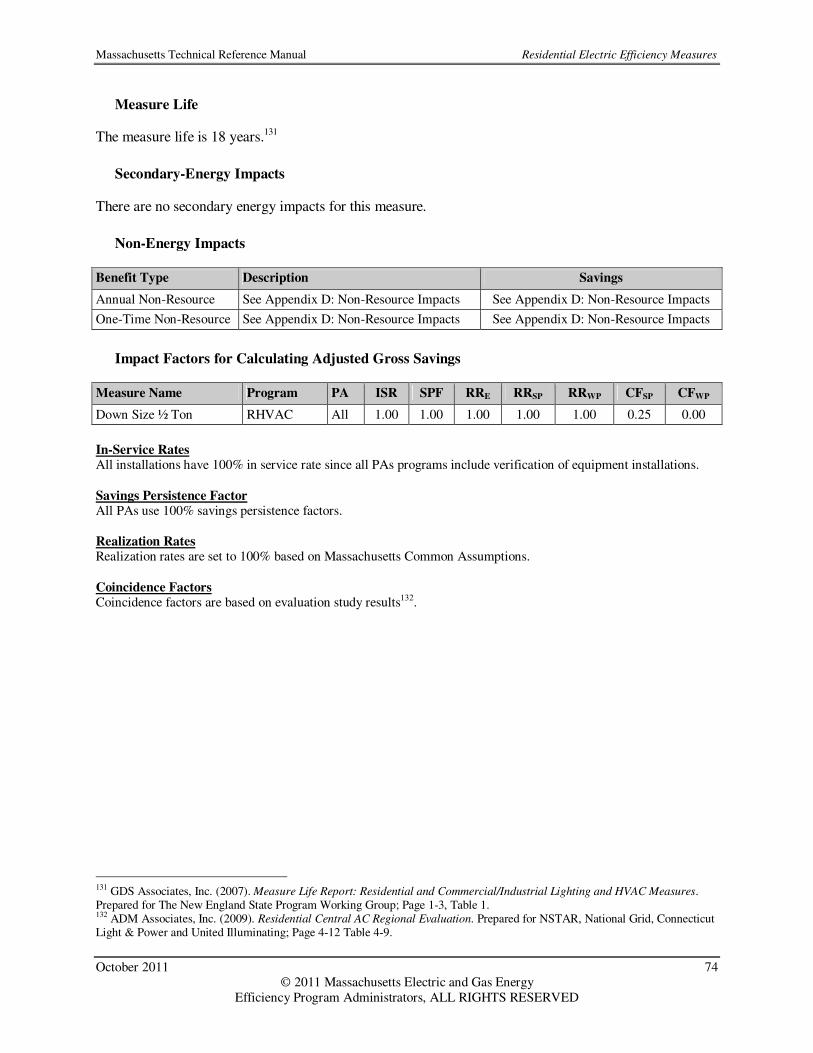
Massachusetts Technical Reference Manual Residential Electric Efficiency Measures
October 2011 74 © 2011 Massachusetts Electric and Gas Energy
Efficiency Program Administrators, ALL RIGHTS RESERVED
Measure Life
The measure life is 18 years.131
Secondary-Energy Impacts
There are no secondary energy impacts for this measure.
Non-Energy Impacts
Benefit Type Description Savings
Annual Non-Resource See Appendix D: Non-Resource Impacts See Appendix D: Non-Resource Impacts
One-Time Non-Resource See Appendix D: Non-Resource Impacts See Appendix D: Non-Resource Impacts
Impact Factors for Calculating Adjusted Gross Savings
Measure Name Program PA ISR SPF RRE RRSP RRWP CFSP CFWP
Down Size ½ Ton RHVAC All 1.00 1.00 1.00 1.00 1.00 0.25 0.00
In-Service Rates All installations have 100% in service rate since all PAs programs include verification of equipment installations. Savings Persistence Factor All PAs use 100% savings persistence factors. Realization Rates Realization rates are set to 100% based on Massachusetts Common Assumptions.
Coincidence Factors Coincidence factors are based on evaluation study results132.
131 GDS Associates, Inc. (2007). Measure Life Report: Residential and Commercial/Industrial Lighting and HVAC Measures. Prepared for The New England State Program Working Group; Page 1-3, Table 1. 132 ADM Associates, Inc. (2009). Residential Central AC Regional Evaluation. Prepared for NSTAR, National Grid, Connecticut Light & Power and United Illuminating; Page 4-12 Table 4-9.

Massachusetts Technical Reference Manual Residential Electric Efficiency Measures
October 2011 75 © 2011 Massachusetts Electric and Gas Energy
Efficiency Program Administrators, ALL RIGHTS RESERVED
HVAC – Right Sizing
Version Date and Revision History
Effective Date: 1/1/2011 End Date: TBD
Measure Overview
Description: Documentation that system size is in compliance with manual J calculations. Primary Energy Impact: Electric Secondary Energy Impact: None Non-Energy Impact: O&M Sector: Residential Market: Lost Opportunity End Use: HVAC Program: Residential Cooling & Heating Equipment
Algorithms for Calculating Primary Energy Impact
Unit savings are deemed based on results of DOE2 modeling:
kWhkWh ∆=∆
kWkW ∆=∆ Where: Units = completed job ∆kWh = Average annual energy reduction per unit: 123 kWh133 ∆kW = Average demand reduction per unit: 0.150 kW134
Baseline Efficiency
The baseline efficiency case is a system that is not sized in accordance with manual J calculation.
High Efficiency
The high efficiency case is a system that is sized in accordance with manual J calculation.
Hours
Not applicable.
133 RLW Analytics (2002). Market Research for the Rhode Island, Massachusetts, and Connecticut Residential HVAC Market. Prepared for National Grid, Northeast Utilities, NSTAR, Fitchburg Gas and Electric Light Company and United Illuminating; Page 3, Table 2. 134 Ibid.

Massachusetts Technical Reference Manual Residential Electric Efficiency Measures
October 2011 76 © 2011 Massachusetts Electric and Gas Energy
Efficiency Program Administrators, ALL RIGHTS RESERVED
Measure Life
The measure life is 18 years.135
Secondary Energy Impacts
There are no secondary energy impacts for this measure.
Non-Energy Impacts
Benefit Type Description Savings
Annual Non-Resource See Appendix D: Non-Resource Impacts See Appendix D: Non-Resource Impacts
One-Time Non-Resource See Appendix D: Non-Resource Impacts See Appendix D: Non-Resource Impacts
Impact Factors for Calculating Adjusted Gross Savings
Measure Name Program PA ISR SPF RRE RRSP RRWP CFSP CFWP
Right Sizing Tier 1 RHVAC All 1.00 1.00 1.00 1.00 1.00 0.25 0.00
Right Sizing Tier 2 RHVAC All 1.00 1.00 1.00 1.00 1.00 0.25 0.00
In-Service Rates All installations have 100% in service rate since all PAs programs include verification of equipment installations. Savings Persistence Factor All PAs use 100% savings persistence factors. Realization Rates Realization rates are set to 100% based on Massachusetts Common Assumptions.
Coincidence Factors Coincidence factors are based on evaluation study results136.
135 GDS Associates, Inc. (2007). Measure Life Report: Residential and Commercial/Industrial Lighting and HVAC Measures. Prepared for The New England State Program Working Group; Page 1-3, Table 1. 136 ADM Associates, Inc. (2009). Residential Central AC Regional Evaluation. Prepared for NSTAR, National Grid, Connecticut Light & Power and United Illuminating; Page 4-12 Table 4-9.

Massachusetts Technical Reference Manual Residential Electric Efficiency Measures
October 2011 77 © 2011 Massachusetts Electric and Gas Energy
Efficiency Program Administrators, ALL RIGHTS RESERVED
HVAC – Early Replacement of Central AC or Heat Pump Unit
Version Date and Revision History
Effective Date: 1/1/2011 End Date: TBD
Measure Overview
Description: Early replacement of Central Air Conditioning or Heat Pump Unit. This measure represents the additional savings achieved for the early replacement of existing inefficient AC or heat pump units over the remaining life of the existing equipment. Primary Energy Impact: Electric Secondary Energy Impact: None Non-Energy Impact: None Sector: Residential Market: Retrofit End Use: HVAC Program: Residential Cooling & Heating Equipment
Algorithms for Calculating Primary Energy Impact
Unit savings are deemed based on the following algorithms and assumptions:
×
−+×
−××=∆ H
EEBASE
C
EEBASE
HoursHSPFHSPF
HoursSEERSEERTon
hrkBtuTonskWh
1111/12
( )HEATCOOL kWkWkW ∆∆=∆ ,max
−××=∆
EEBASE
COOLEEREERTon
hrkBtuTonskW
11/12
−××=∆
EEBASE
HEATHSPFHSPFTon
hrkBtuTonskW
11/12
Where: Unit = Replacement of existing inefficient system with new efficient system Tons = Capacity of AC/HP equipment: Current default is 3 tons137 SEERBASE = Seasonal efficiency of baseline AC equipment SEEREE = Seasonal efficiency of new efficient AC equipment EERBASE = Peak efficiency of base AC equipment EEREE = Peak efficiency of new efficient AC equipment HSPFBASE = Heating efficiency of baseline HP equipment HSPFEE = Heating efficiency of new efficient HP equipment HoursC = EFLH for cooling HoursH = EFLH for heating
137 ADM Associates, Inc. (2009). Residential Central AC Regional Evaluation. Prepared for NSTAR, National Grid, Connecticut Light & Power and United Illuminating; Page 4-12, Table 4-9.

Massachusetts Technical Reference Manual Residential Electric Efficiency Measures
October 2011 78 © 2011 Massachusetts Electric and Gas Energy
Efficiency Program Administrators, ALL RIGHTS RESERVED
Baseline Efficiency
The baseline efficiency case is assumed to be a typical 10-12 year-old central air-conditioning or heat pump unit with SEER 10, EER 8.5, HSPF 7.0.
High Efficiency
For the retirement savings over the remaining life of existing AC unit, the efficient case is a SEER 13, EER 11, HSPF 7.6 unit. For the high efficiency savings over lifetime of the new AC unit, the efficient case is a new high efficiency SEER 14.5, EER 12, 8.2 HSPF unit. Measure EERBASE SEERBASE HSPFBASE EEREE SEEREE HSPFEE ∆kWC ∆kWH ∆kWh
Early Replacement AC RETIRE
8.5 10 n/a 11 13 n/a 0.963 0.000 299
Early Replacement AC EE
11 13 n/a 12 14.5 n/a 0.273 0.000 103
Early Replacement HPRETIRE
8.5 10 7.0 11 13 7.6 0.963 0.406 786
Early Replacement HPEE
11 13 7.6 12 14.5 8.2 0.273 0.347 519
Hours
The equivalent full load hours are 1,200 hours per year for heating138 and 360 hours per year for cooling.139
Measure Life
The remaining life for the existing unit is 7 years140, and the measure life of new equipment is 18 years141
Secondary Energy Impacts
There are no secondary energy impacts for this measure.
Non-Energy Impacts
Benefit Type Description Savings
Annual Non-Resource See Appendix D: Non-Resource Impacts See Appendix D: Non-Resource Impacts
One-Time Non-Resource See Appendix D: Non-Resource Impacts See Appendix D: Non-Resource Impacts
138 Massachusetts Common Assumption. 139 ADM Associates, Inc. (2009). Residential Central AC Regional Evaluation. Prepared for NSTAR, National Grid, Connecticut Light & Power and United Illuminating; Page 4-5, Table 4-3. 140 Massachusetts Common Assumption: The early replacement measure life of 7 years was determined by subtracting the estimated target age range of existing equipment between 10 and 12 years old from the 18 year measure life for new equipment. 141 GDS Associates, Inc. (2007). Measure Life Report: Residential and Commercial/Industrial Lighting and HVAC Measures. Prepared for The New England State Program Working Group; Page 1-3, Table 1.

Massachusetts Technical Reference Manual Residential Electric Efficiency Measures
October 2011 79 © 2011 Massachusetts Electric and Gas Energy
Efficiency Program Administrators, ALL RIGHTS RESERVED
Impact Factors for Calculating Adjusted Gross Savings
Measure Name Program PA ISR SPF RRE RRSP RRWP CFSP CFWP
Early Replacement AC RHVAC All 1.00 1.00 1.00 1.00 1.00 0.25 0.00
Early Replacement HP RHVAC All 1.00 1.00 1.00 1.00 1.00 0.25 0.50
In-Service Rates All installations have 100% in service rate since all PAs programs include verification of equipment installations. Savings Persistence Factor All PAs use 100% savings persistence factors. Realization Rates Realization rates are set to 100% based on Massachusetts Common Assumptions.
Coincidence Factors Coincidence factors are based on evaluation study results142 and Massachusetts Common Assumptions. 143
142 ADM Associates, Inc. (2009). Residential Central AC Regional Evaluation. Prepared for NSTAR, National Grid, Connecticut Light & Power and United Illuminating; Page 4-12 Table 4-9. 143 The coincidence factors included in the BC model do not match the coincidence factors that are in the TRM because the B/C model only allows for a single max kW reduction to be entered for each measure and the TRM provides separate summer and winter kW reductions for some measures. An adjustment was made to the coincidence factors in the BC model in order to get the model to calculate the correct summer and winter kW reductions.
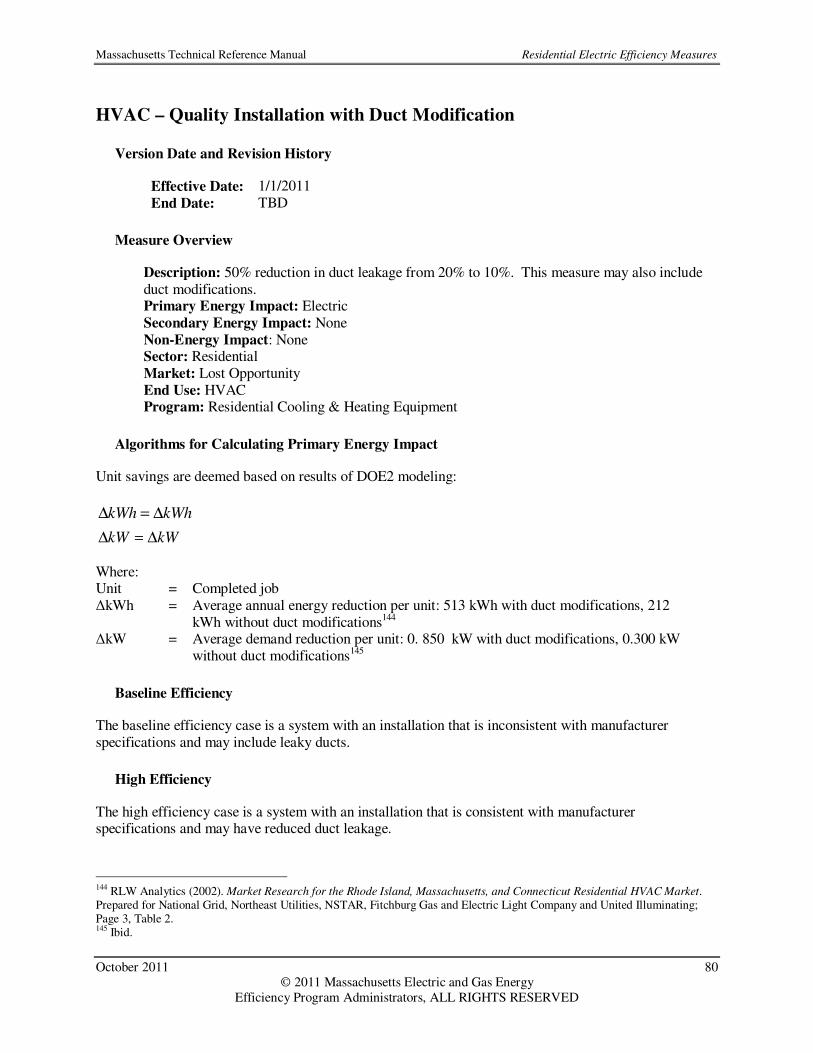
Massachusetts Technical Reference Manual Residential Electric Efficiency Measures
October 2011 80 © 2011 Massachusetts Electric and Gas Energy
Efficiency Program Administrators, ALL RIGHTS RESERVED
HVAC – Quality Installation with Duct Modification
Version Date and Revision History
Effective Date: 1/1/2011 End Date: TBD
Measure Overview
Description: 50% reduction in duct leakage from 20% to 10%. This measure may also include duct modifications. Primary Energy Impact: Electric Secondary Energy Impact: None Non-Energy Impact: None Sector: Residential Market: Lost Opportunity End Use: HVAC Program: Residential Cooling & Heating Equipment
Algorithms for Calculating Primary Energy Impact
Unit savings are deemed based on results of DOE2 modeling:
kWhkWh ∆=∆
kWkW ∆=∆ Where: Unit = Completed job ∆kWh = Average annual energy reduction per unit: 513 kWh with duct modifications, 212
kWh without duct modifications144 ∆kW = Average demand reduction per unit: 0. 850 kW with duct modifications, 0.300 kW
without duct modifications145
Baseline Efficiency
The baseline efficiency case is a system with an installation that is inconsistent with manufacturer specifications and may include leaky ducts.
High Efficiency
The high efficiency case is a system with an installation that is consistent with manufacturer specifications and may have reduced duct leakage.
144 RLW Analytics (2002). Market Research for the Rhode Island, Massachusetts, and Connecticut Residential HVAC Market. Prepared for National Grid, Northeast Utilities, NSTAR, Fitchburg Gas and Electric Light Company and United Illuminating; Page 3, Table 2. 145 Ibid.
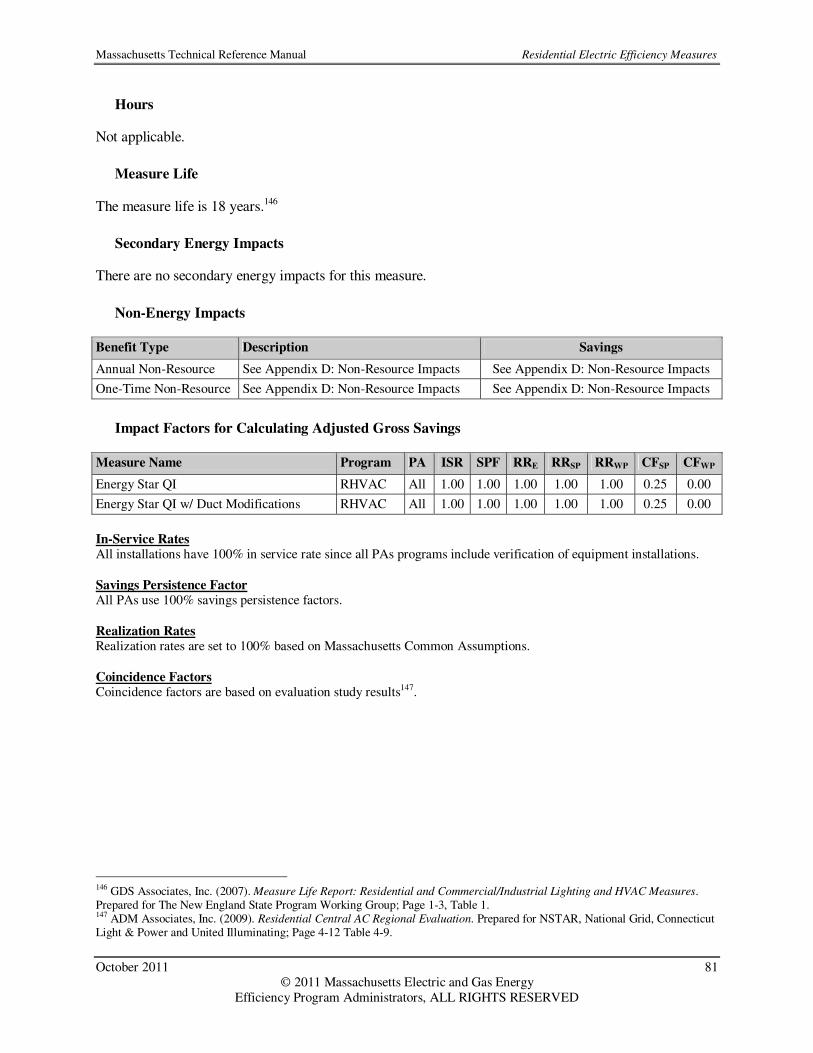
Massachusetts Technical Reference Manual Residential Electric Efficiency Measures
October 2011 81 © 2011 Massachusetts Electric and Gas Energy
Efficiency Program Administrators, ALL RIGHTS RESERVED
Hours
Not applicable.
Measure Life
The measure life is 18 years.146
Secondary Energy Impacts
There are no secondary energy impacts for this measure.
Non-Energy Impacts
Benefit Type Description Savings
Annual Non-Resource See Appendix D: Non-Resource Impacts See Appendix D: Non-Resource Impacts
One-Time Non-Resource See Appendix D: Non-Resource Impacts See Appendix D: Non-Resource Impacts
Impact Factors for Calculating Adjusted Gross Savings
Measure Name Program PA ISR SPF RRE RRSP RRWP CFSP CFWP
Energy Star QI RHVAC All 1.00 1.00 1.00 1.00 1.00 0.25 0.00
Energy Star QI w/ Duct Modifications RHVAC All 1.00 1.00 1.00 1.00 1.00 0.25 0.00
In-Service Rates All installations have 100% in service rate since all PAs programs include verification of equipment installations. Savings Persistence Factor All PAs use 100% savings persistence factors. Realization Rates Realization rates are set to 100% based on Massachusetts Common Assumptions.
Coincidence Factors Coincidence factors are based on evaluation study results147.
146 GDS Associates, Inc. (2007). Measure Life Report: Residential and Commercial/Industrial Lighting and HVAC Measures. Prepared for The New England State Program Working Group; Page 1-3, Table 1. 147 ADM Associates, Inc. (2009). Residential Central AC Regional Evaluation. Prepared for NSTAR, National Grid, Connecticut Light & Power and United Illuminating; Page 4-12 Table 4-9.
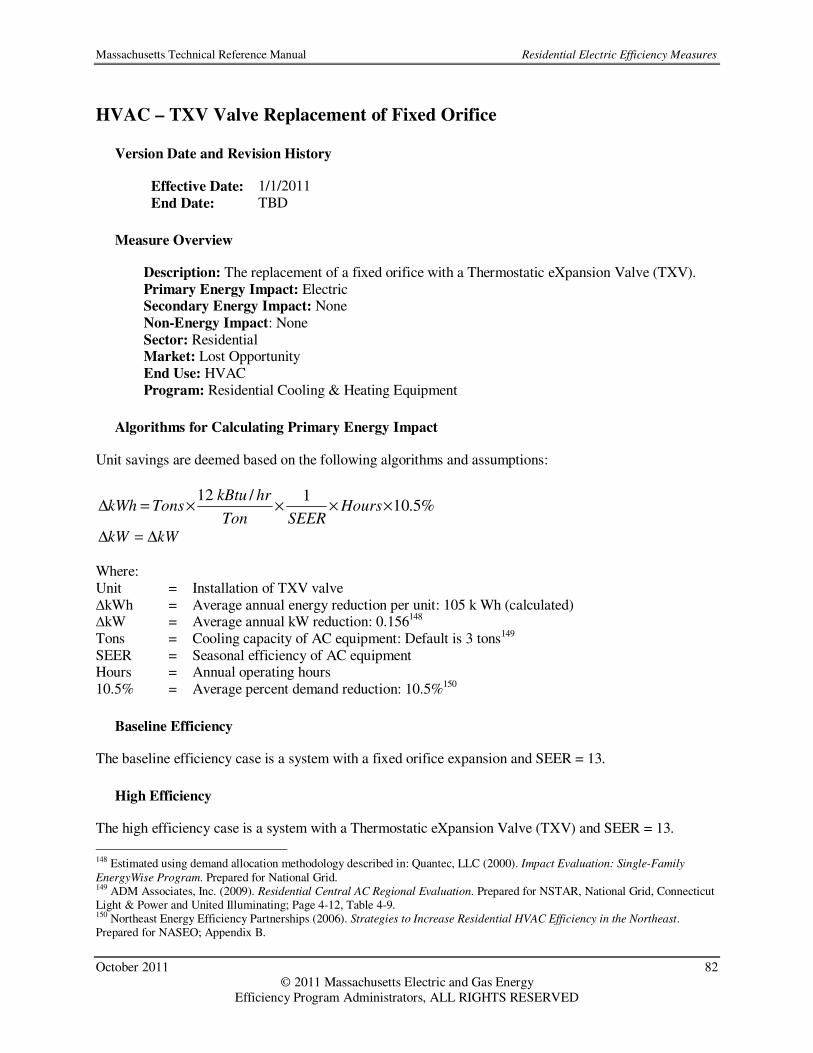
Massachusetts Technical Reference Manual Residential Electric Efficiency Measures
October 2011 82 © 2011 Massachusetts Electric and Gas Energy
Efficiency Program Administrators, ALL RIGHTS RESERVED
HVAC – TXV Valve Replacement of Fixed Orifice
Version Date and Revision History
Effective Date: 1/1/2011 End Date: TBD
Measure Overview
Description: The replacement of a fixed orifice with a Thermostatic eXpansion Valve (TXV). Primary Energy Impact: Electric Secondary Energy Impact: None Non-Energy Impact: None Sector: Residential Market: Lost Opportunity End Use: HVAC Program: Residential Cooling & Heating Equipment
Algorithms for Calculating Primary Energy Impact
Unit savings are deemed based on the following algorithms and assumptions:
%5.101/12
××××=∆ HoursSEERTon
hrkBtuTonskWh
kWkW ∆=∆ Where: Unit = Installation of TXV valve ∆kWh = Average annual energy reduction per unit: 105 k Wh (calculated) ∆kW = Average annual kW reduction: 0.156148 Tons = Cooling capacity of AC equipment: Default is 3 tons149 SEER = Seasonal efficiency of AC equipment Hours = Annual operating hours 10.5% = Average percent demand reduction: 10.5%150
Baseline Efficiency
The baseline efficiency case is a system with a fixed orifice expansion and SEER = 13.
High Efficiency
The high efficiency case is a system with a Thermostatic eXpansion Valve (TXV) and SEER = 13.
148 Estimated using demand allocation methodology described in: Quantec, LLC (2000). Impact Evaluation: Single-Family
EnergyWise Program. Prepared for National Grid. 149 ADM Associates, Inc. (2009). Residential Central AC Regional Evaluation. Prepared for NSTAR, National Grid, Connecticut Light & Power and United Illuminating; Page 4-12, Table 4-9. 150 Northeast Energy Efficiency Partnerships (2006). Strategies to Increase Residential HVAC Efficiency in the Northeast. Prepared for NASEO; Appendix B.

Massachusetts Technical Reference Manual Residential Electric Efficiency Measures
October 2011 83 © 2011 Massachusetts Electric and Gas Energy
Efficiency Program Administrators, ALL RIGHTS RESERVED
Hours
Not applicable.
Measure Life
The measure life is 7 years.151
Secondary Energy Impacts
There are no secondary energy impacts for this measure.
Non-Energy Impacts
Benefit Type Description Savings
Annual Non-Resource See Appendix D: Non-Resource Impacts See Appendix D: Non-Resource Impacts
One-Time Non-Resource See Appendix D: Non-Resource Impacts See Appendix D: Non-Resource Impacts
Impact Factors for Calculating Adjusted Gross Savings
Measure Name Program PA ISR SPF RRE RRSP RRWP CFSP CFWP
TXV Replacement of Fixed Orifice RHVAC All 1.00 1.00 1.00 1.00 1.00 0.25 0.00
In-Service Rates All installations have 100% in service rate since all PAs programs include verification of equipment installations. Savings Persistence Factor All PAs use 100% savings persistence factors. Realization Rates Realization rates are set to 100% based on Massachusetts Common Assumptions.
Coincidence Factors Coincidence factors are based on evaluation study results152.
151 GDS Associates, Inc. (2007). Measure Life Report: Residential and Commercial/Industrial Lighting and HVAC Measures. Prepared for The New England State Program Working Group. 152 ADM Associates, Inc. (2009). Residential Central AC Regional Evaluation. Prepared for NSTAR, National Grid, Connecticut Light & Power and United Illuminating; Page 4-12 Table 4-9.
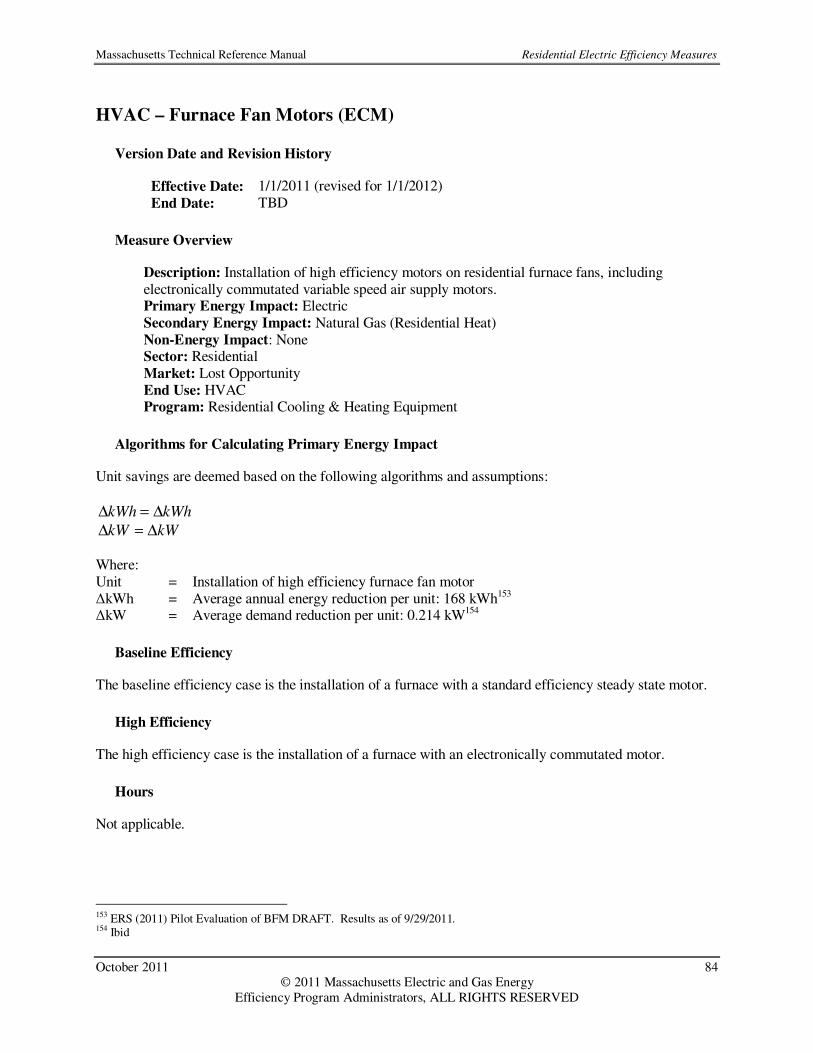
Massachusetts Technical Reference Manual Residential Electric Efficiency Measures
October 2011 84 © 2011 Massachusetts Electric and Gas Energy
Efficiency Program Administrators, ALL RIGHTS RESERVED
HVAC – Furnace Fan Motors (ECM)
Version Date and Revision History
Effective Date: 1/1/2011 (revised for 1/1/2012) End Date: TBD
Measure Overview
Description: Installation of high efficiency motors on residential furnace fans, including electronically commutated variable speed air supply motors. Primary Energy Impact: Electric Secondary Energy Impact: Natural Gas (Residential Heat) Non-Energy Impact: None Sector: Residential Market: Lost Opportunity End Use: HVAC Program: Residential Cooling & Heating Equipment
Algorithms for Calculating Primary Energy Impact
Unit savings are deemed based on the following algorithms and assumptions:
kWhkWh ∆=∆
kWkW ∆=∆ Where: Unit = Installation of high efficiency furnace fan motor ∆kWh = Average annual energy reduction per unit: 168 kWh153 ∆kW = Average demand reduction per unit: 0.214 kW154
Baseline Efficiency
The baseline efficiency case is the installation of a furnace with a standard efficiency steady state motor.
High Efficiency
The high efficiency case is the installation of a furnace with an electronically commutated motor.
Hours
Not applicable.
153 ERS (2011) Pilot Evaluation of BFM DRAFT. Results as of 9/29/2011. 154 Ibid

Massachusetts Technical Reference Manual Residential Electric Efficiency Measures
October 2011 85 © 2011 Massachusetts Electric and Gas Energy
Efficiency Program Administrators, ALL RIGHTS RESERVED
Measure Life
The measure life is 18 years.155
Secondary Energy Impacts
A heating penalty results due to reduced heat loss of the efficient furnace motor.
Measure Energy Type ∆MMBtu/Unit156
CoolSmart Warm Air Furnace ECM Natural Gas (Residential Heat) -0.716
Non-Energy Impacts
Benefit Type Description Savings
Annual Non-Resource See Appendix D: Non-Resource Impacts See Appendix D: Non-Resource Impacts
One-Time Non-Resource See Appendix D: Non-Resource Impacts See Appendix D: Non-Resource Impacts
Impact Factors for Calculating Adjusted Gross Savings
Measure Name Program PA ISR SPF RRE RRSP RRWP CFSP CFWP
CoolSmart Warm Air Furnace ECM RHVAC All 1.00 1.00 1.00 1.00 1.00 0. 00 0.16
In-Service Rates All installations have 100% in service rate since all PAs programs include verification of equipment installations. Savings Persistence Factor All PAs use 100% savings persistence factors. Realization Rates Realization rates are set to 100% based on Massachusetts Common Assumptions.
Coincidence Factors Coincidence factors are based evaluation results157.
155 Sachs, Harvey (2003). Energy Savings from Efficient Furnace Air Handlers in Massachusetts. 156 ERS (2011) Pilot Evaluation of BFM DRAFT. Results as of 9/29/2011. 157 Ibid.
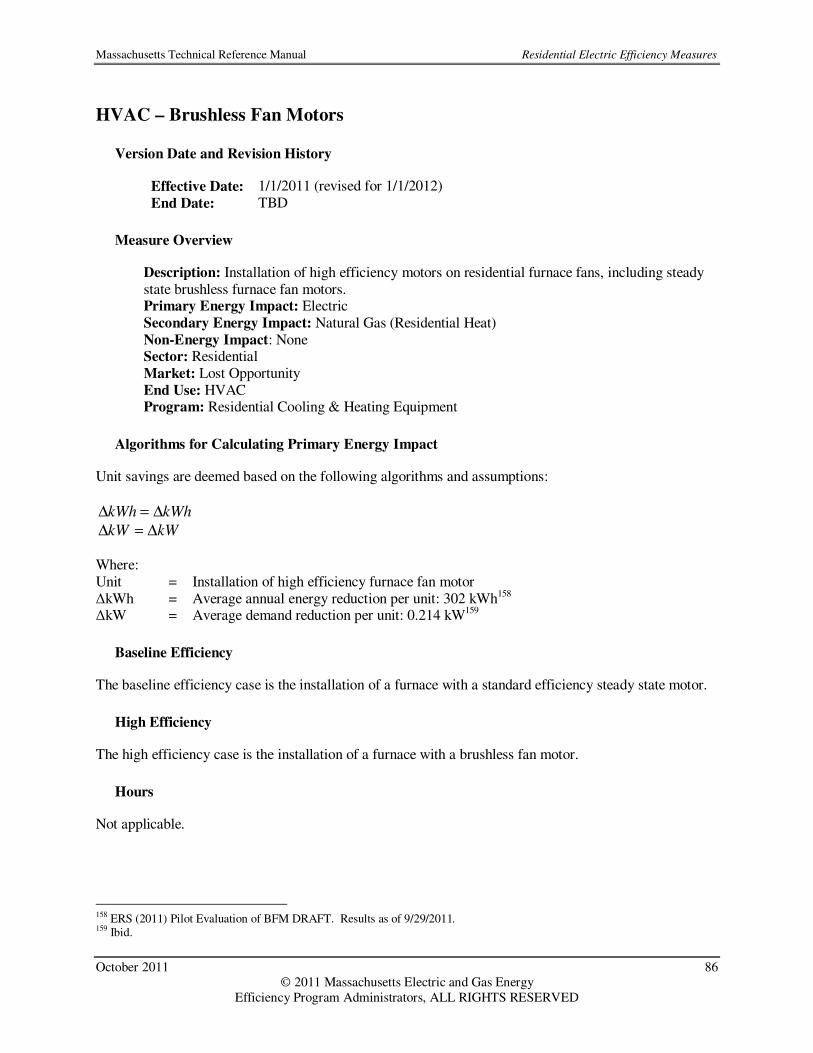
Massachusetts Technical Reference Manual Residential Electric Efficiency Measures
October 2011 86 © 2011 Massachusetts Electric and Gas Energy
Efficiency Program Administrators, ALL RIGHTS RESERVED
HVAC – Brushless Fan Motors
Version Date and Revision History
Effective Date: 1/1/2011 (revised for 1/1/2012) End Date: TBD
Measure Overview
Description: Installation of high efficiency motors on residential furnace fans, including steady state brushless furnace fan motors. Primary Energy Impact: Electric Secondary Energy Impact: Natural Gas (Residential Heat) Non-Energy Impact: None Sector: Residential Market: Lost Opportunity End Use: HVAC Program: Residential Cooling & Heating Equipment
Algorithms for Calculating Primary Energy Impact
Unit savings are deemed based on the following algorithms and assumptions:
kWhkWh ∆=∆
kWkW ∆=∆ Where: Unit = Installation of high efficiency furnace fan motor ∆kWh = Average annual energy reduction per unit: 302 kWh158 ∆kW = Average demand reduction per unit: 0.214 kW159
Baseline Efficiency
The baseline efficiency case is the installation of a furnace with a standard efficiency steady state motor.
High Efficiency
The high efficiency case is the installation of a furnace with a brushless fan motor.
Hours
Not applicable.
158 ERS (2011) Pilot Evaluation of BFM DRAFT. Results as of 9/29/2011. 159 Ibid.
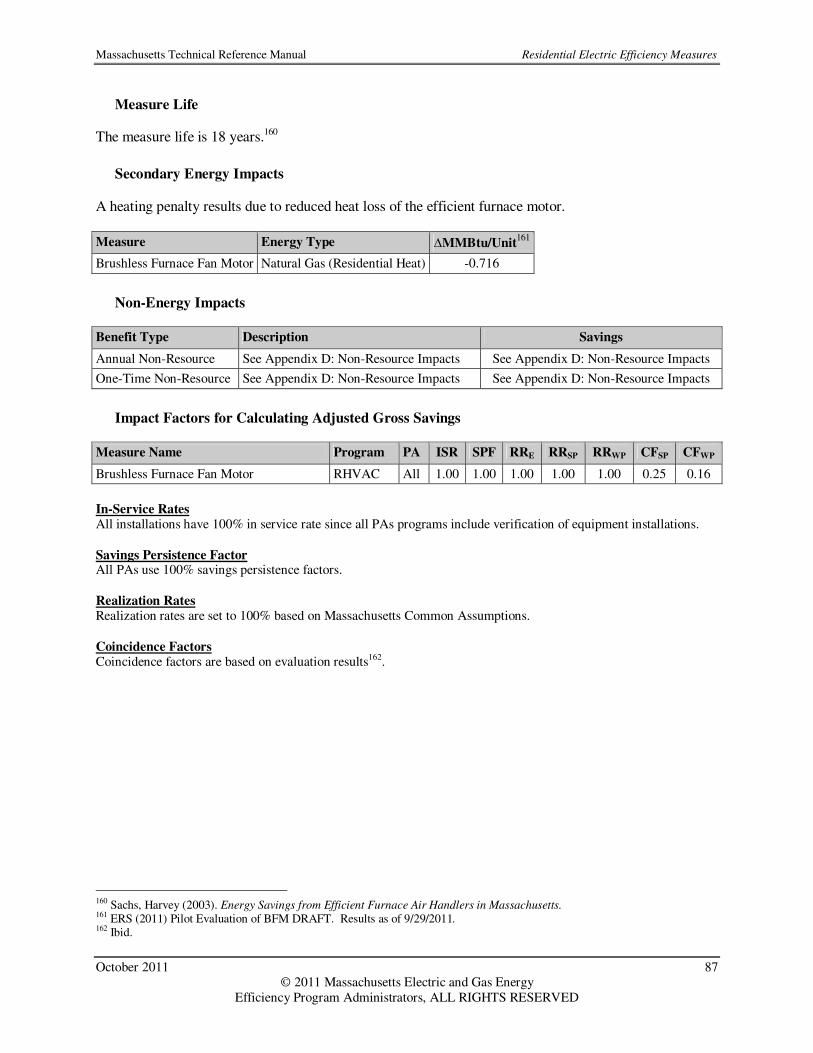
Massachusetts Technical Reference Manual Residential Electric Efficiency Measures
October 2011 87 © 2011 Massachusetts Electric and Gas Energy
Efficiency Program Administrators, ALL RIGHTS RESERVED
Measure Life
The measure life is 18 years.160
Secondary Energy Impacts
A heating penalty results due to reduced heat loss of the efficient furnace motor.
Measure Energy Type ∆MMBtu/Unit161
Brushless Furnace Fan Motor Natural Gas (Residential Heat) -0.716
Non-Energy Impacts
Benefit Type Description Savings
Annual Non-Resource See Appendix D: Non-Resource Impacts See Appendix D: Non-Resource Impacts
One-Time Non-Resource See Appendix D: Non-Resource Impacts See Appendix D: Non-Resource Impacts
Impact Factors for Calculating Adjusted Gross Savings
Measure Name Program PA ISR SPF RRE RRSP RRWP CFSP CFWP
Brushless Furnace Fan Motor RHVAC All 1.00 1.00 1.00 1.00 1.00 0.25 0.16
In-Service Rates All installations have 100% in service rate since all PAs programs include verification of equipment installations. Savings Persistence Factor All PAs use 100% savings persistence factors. Realization Rates Realization rates are set to 100% based on Massachusetts Common Assumptions.
Coincidence Factors Coincidence factors are based on evaluation results162.
160 Sachs, Harvey (2003). Energy Savings from Efficient Furnace Air Handlers in Massachusetts. 161 ERS (2011) Pilot Evaluation of BFM DRAFT. Results as of 9/29/2011. 162 Ibid.

Massachusetts Technical Reference Manual Residential Electric Efficiency Measures
October 2011 88 © 2011 Massachusetts Electric and Gas Energy
Efficiency Program Administrators, ALL RIGHTS RESERVED
HVAC – Room AC (Lost Opportunity)
Version Date and Revision History
Effective Date: 1/1/2011 End Date: TBD
Measure Overview
Description: The installation of ENERGY STAR® qualified room air conditioners. ENERGY STAR® qualified air conditioners are typically 10% more efficient than models meeting federal standards. Primary Energy Impact: Electric Secondary Energy Impact: None Non-Energy Impact: None Sector: Residential Market: Lost Opportunity, Retrofit End Use: HVAC Program: ENERGY STAR Appliances, Multifamily Retrofit
Algorithms for Calculating Primary Energy Impact
Unit savings are based on the following algorithms which use averaged inputs:
kWhkWh ∆=∆
HourskWhkW /∆=∆
Where: Unit = Rebated room AC unit ∆kWh = Average annual energy savings per unit: 49 kWh163 ∆kW = Average demand reduction per unit: 0.24 kW Hours = Equivalent full load hours
Baseline Efficiency
The baseline efficiency case is a window AC unit that meets the minimum federal efficiency standard for efficiency which currently is EER 9.8.
High Efficiency
The high efficiency level is a room AC unit meeting or exceeding the federal efficiency standard by 10% or more. Average size is 10,000 Btu and average EERs is 10.8.
163 Environmental Protection Agency (2009). Life Cycle Cost Estimate for ENERGY STAR Room Air Conditioner. Interactive Excel Spreadsheet found at www.energystar.gov/ia/business/bulk_purchasing/bpsavings_calc/CalculatorConsumerRoomAC.xls.
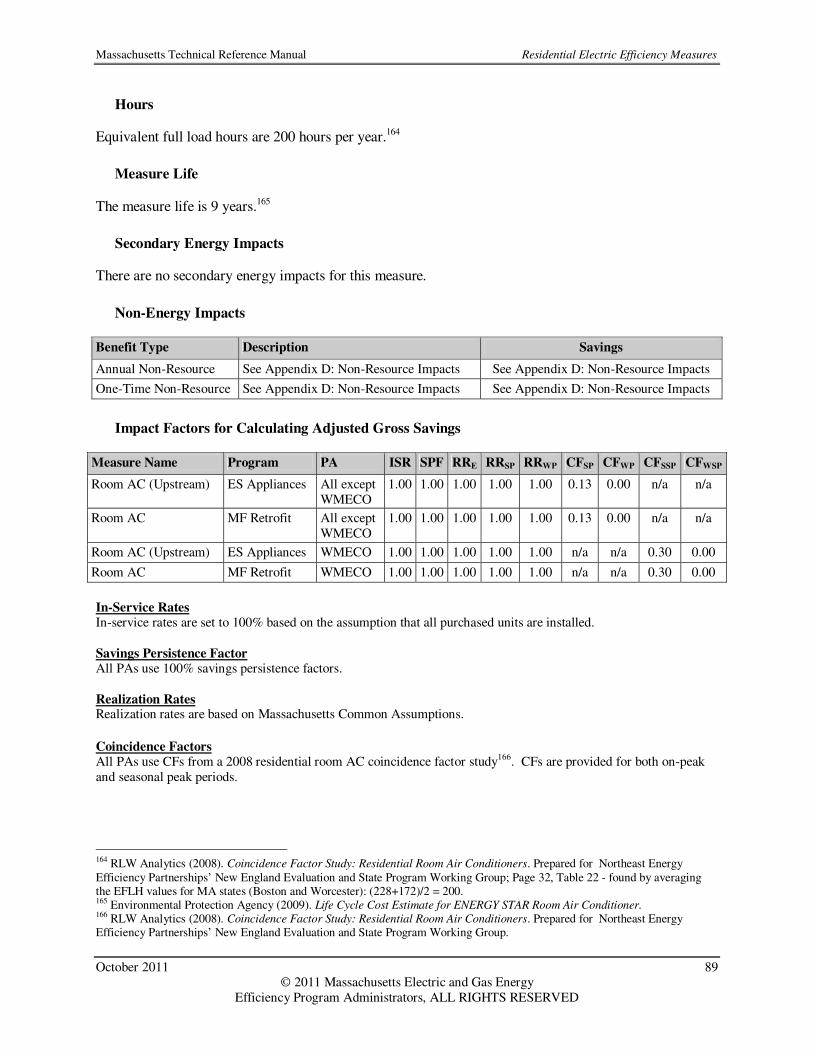
Massachusetts Technical Reference Manual Residential Electric Efficiency Measures
October 2011 89 © 2011 Massachusetts Electric and Gas Energy
Efficiency Program Administrators, ALL RIGHTS RESERVED
Hours
Equivalent full load hours are 200 hours per year.164
Measure Life
The measure life is 9 years.165
Secondary Energy Impacts
There are no secondary energy impacts for this measure.
Non-Energy Impacts
Benefit Type Description Savings
Annual Non-Resource See Appendix D: Non-Resource Impacts See Appendix D: Non-Resource Impacts
One-Time Non-Resource See Appendix D: Non-Resource Impacts See Appendix D: Non-Resource Impacts
Impact Factors for Calculating Adjusted Gross Savings
Measure Name Program PA ISR SPF RRE RRSP RRWP CFSP CFWP CFSSP CFWSP
Room AC (Upstream) ES Appliances All except WMECO
1.00 1.00 1.00 1.00 1.00 0.13 0.00 n/a n/a
Room AC MF Retrofit All except WMECO
1.00 1.00 1.00 1.00 1.00 0.13 0.00 n/a n/a
Room AC (Upstream) ES Appliances WMECO 1.00 1.00 1.00 1.00 1.00 n/a n/a 0.30 0.00
Room AC MF Retrofit WMECO 1.00 1.00 1.00 1.00 1.00 n/a n/a 0.30 0.00
In-Service Rates In-service rates are set to 100% based on the assumption that all purchased units are installed.
Savings Persistence Factor All PAs use 100% savings persistence factors. Realization Rates Realization rates are based on Massachusetts Common Assumptions.
Coincidence Factors All PAs use CFs from a 2008 residential room AC coincidence factor study166. CFs are provided for both on-peak and seasonal peak periods.
164 RLW Analytics (2008). Coincidence Factor Study: Residential Room Air Conditioners. Prepared for Northeast Energy Efficiency Partnerships’ New England Evaluation and State Program Working Group; Page 32, Table 22 - found by averaging the EFLH values for MA states (Boston and Worcester): (228+172)/2 = 200. 165 Environmental Protection Agency (2009). Life Cycle Cost Estimate for ENERGY STAR Room Air Conditioner. 166 RLW Analytics (2008). Coincidence Factor Study: Residential Room Air Conditioners. Prepared for Northeast Energy Efficiency Partnerships’ New England Evaluation and State Program Working Group.

Massachusetts Technical Reference Manual Residential Electric Efficiency Measures
October 2011 90 © 2011 Massachusetts Electric and Gas Energy
Efficiency Program Administrators, ALL RIGHTS RESERVED
HVAC – Window AC (Retrofit)
Version Date and Revision History
Effective Date: 1/1/2011 End Date: TBD
Measure Overview
Description: Replacement of existing inefficient room air conditioners with more efficient models. This is only offered as a measure when an AC timer would not reduce usage during the peak period. Primary Energy Impact: Electric Secondary Energy Impact: None Non-Energy Impact: Low-Income Annual Discounted Rate Cost Reduction, Low-Income Annual Participant Benefit Sector: Low Income Market: Retrofit End Use: HVAC Program: Low-Income 1-4 Family Retrofit, Low-Income Multifamily Retrofit
Algorithms for Calculating Primary Energy Impact
Unit savings are deemed based on study results:
kWhkWh ∆=∆
kWkW ∆=∆ Where: Unit = Replacement of an existing window AC unit with a new efficient window AC unit ∆kWh = Average annual kWh savings per unit: 100 kWh167 ∆kW = Max load kW reduction: 0.214 kW168
Baseline Efficiency
The baseline efficiency case is the existing air conditioning unit.
High Efficiency
The high efficiency case is the high efficiency room air conditioning unit.
Hours
Not applicable.
167 Quantec, LLC (2005). Evaluation of National Grid’s 2003 Appliance Management Program: Room Air Conditioning
Metering and Non-Energy Benefits Study. Prepared for National Grid. 168 Estimated using demand allocation methodology described in: Quantec, LLC (2000). Impact Evaluation: Single-Family
EnergyWise Program. Prepared for National Grid.
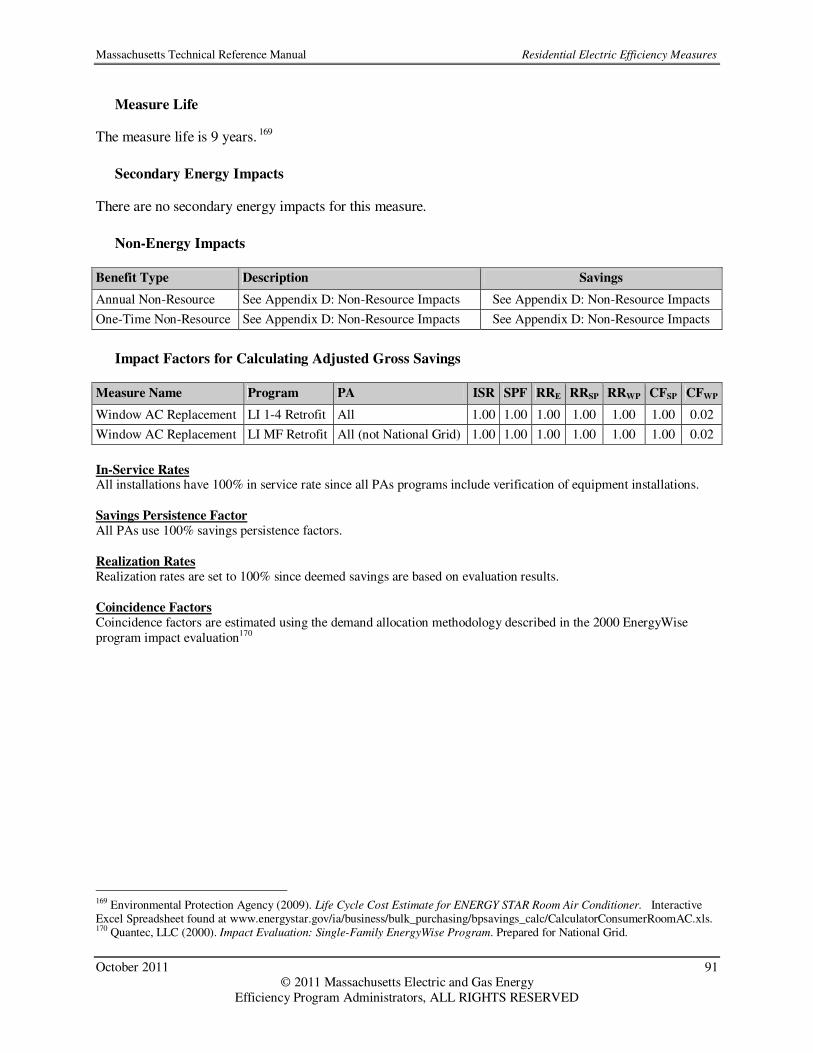
Massachusetts Technical Reference Manual Residential Electric Efficiency Measures
October 2011 91 © 2011 Massachusetts Electric and Gas Energy
Efficiency Program Administrators, ALL RIGHTS RESERVED
Measure Life
The measure life is 9 years. 169
Secondary Energy Impacts
There are no secondary energy impacts for this measure.
Non-Energy Impacts
Benefit Type Description Savings
Annual Non-Resource See Appendix D: Non-Resource Impacts See Appendix D: Non-Resource Impacts
One-Time Non-Resource See Appendix D: Non-Resource Impacts See Appendix D: Non-Resource Impacts
Impact Factors for Calculating Adjusted Gross Savings
Measure Name Program PA ISR SPF RRE RRSP RRWP CFSP CFWP
Window AC Replacement LI 1-4 Retrofit All 1.00 1.00 1.00 1.00 1.00 1.00 0.02
Window AC Replacement LI MF Retrofit All (not National Grid) 1.00 1.00 1.00 1.00 1.00 1.00 0.02
In-Service Rates All installations have 100% in service rate since all PAs programs include verification of equipment installations. Savings Persistence Factor All PAs use 100% savings persistence factors. Realization Rates Realization rates are set to 100% since deemed savings are based on evaluation results. Coincidence Factors Coincidence factors are estimated using the demand allocation methodology described in the 2000 EnergyWise program impact evaluation170
169 Environmental Protection Agency (2009). Life Cycle Cost Estimate for ENERGY STAR Room Air Conditioner. Interactive Excel Spreadsheet found at www.energystar.gov/ia/business/bulk_purchasing/bpsavings_calc/CalculatorConsumerRoomAC.xls. 170 Quantec, LLC (2000). Impact Evaluation: Single-Family EnergyWise Program. Prepared for National Grid.

Massachusetts Technical Reference Manual Residential Electric Efficiency Measures
October 2011 92 © 2011 Massachusetts Electric and Gas Energy
Efficiency Program Administrators, ALL RIGHTS RESERVED
HVAC – Dehumidifiers
Version Date and Revision History
Effective Date: 1/1/2011 End Date: TBD
Measure Overview
Description: Early retirement of existing dehumidifiers and replacement with high efficiency dehumidifiers Primary Energy Impact: Electric Secondary Energy Impact: None Non-Energy Impact: Low-Income Annual Discounted Rate Cost Reduction Sector: Residential, Low Income Market: Lost Opportunity, Retrofit End Use: HVAC Program: ENERGY STAR Appliances, Low-Income 1-4 Family Retrofit
Notes
Cape Light Compact is the only PA planning to offer this measure in 2011.
Algorithms for Calculating Primary Energy Impact
Unit savings are deemed based on the following algorithms and assumptions:
HoursEffEff
CapacitykWhEEBASE
EE ×
−××=∆
11
24
473.0
HoursEffEff
CapacitykWhBASERETIRE
RETIRE ×
−××=∆
11
24
473.0
HourskWhkW EEEE /∆=∆
HourskWhkW RETIRERETIRE /∆=∆
Where: Unit = Replacement of existing dehumidifier with new ENERGY STAR® dehumidifier ∆kWhEE = Annual energy savings due to ES unit compared to new baseline unit: 66 kWh ∆kWhRETIRE = Annual energy savings of baseline units compared to existing unit: 77 kWh ∆kWEE = ES replacement demand load savings: 0.038 kW ∆kWRETIRE = Retired demand load savings: 0.044 kW Capacity = Average capacity of dehumidifier in Pints/24 Hours: 35 Pints/Day171 EffBASE = Average efficiency of conventional model in Liters/kWh EffEE = Average efficiency of ENERGY STAR® model in Liters/kWh EffRETIRE = Average efficiency of existing model in Liters/kWh Hours = Dehumidifier annual operating hours
171 35 pints per day was the average turn in at the Cape Light Compact’s May 2010 event. This event retired 125 units.

Massachusetts Technical Reference Manual Residential Electric Efficiency Measures
October 2011 93 © 2011 Massachusetts Electric and Gas Energy
Efficiency Program Administrators, ALL RIGHTS RESERVED
0.473 = Conversion factor: 0.473 Liters/Pint 24 = Conversion factor: 24 Hours/Day
Baseline Efficiency
The baseline efficiency case for a retired dehumidifier (EffRETIRED) is 1.20 L/kWh172, which is the pre-EPACT 2005 efficiency for a 35 pint/day unit. The baseline efficiency for an existing unit (EffBASE) is 1.30 L/kWh173, which is the current federal standard for a 35 pint/day unit.
High Efficiency
The high efficiency case is an ENERGY STAR® replacement unit with an efficiency of 1.40 L/kWh174.
Hours
Average annual operating hours are 1,706 hours, calculated as the sum of average operating hours in the summer, winter and spring/fall seasons, where seasonal hours are calculated at the number of days in that season multiplies by the mean operating hours/day. Season Mean Hours/Day
175 % Days in Season
176 Seasonal Operating Hours
Summer 7.8 25% 712
Winter 2.3 25% 210
Spring/Fall 4.3 50% 785
All - - 1,706*
*Cape Light Compact Annual Hours are adjusted by a factor of 1.02 to account for longer operating hours for Cape Light Compact customers compared to customers in other program territories. The adjustment factor represents the weighted average increase in operating hours compared to PA-average hours over all seasons.
Measure Life
The measure life of a replacement unit is 12 years.177 The remaining measure life of a retired unit is 5 years.178
Secondary Energy Impacts
There are no secondary energy impacts for this measure.
172 Environmental Protection Agency (2002). Life Cycle Cost Estimate for ENERGY STAR Dehumidifiers. 173 Appliance Standards Awareness Project (2007). Dehumidifiers. Website accessed on 6/30/10. 174 Environmental Protection Agency (2002). Life Cycle Cost Estimate for ENERGY STAR Dehumidifiers. 175 Opinion Dynamics Corporation (2009). Massachusetts Residential Saturation Survey (RASS) - Volume 1: Summary Results
and Analysis. Prepared for Cape Light Compact, National Grid, NSTAR Electric, Unitil and Western Massachusetts Electric Company; Page 94, Table 17. 176 Simplifying assumption. 177 Environmental Protection Agency (2002). Life Cycle Cost Estimate for ENERGY STAR Dehumidifiers. 178 On average, turn-in units at the Cape Light Compact’s May 2010 event were 7 years old. The full measure life of 12 years minus the average age of the retired equipment of 7 years equals a remaining life of 5 years.

Massachusetts Technical Reference Manual Residential Electric Efficiency Measures
October 2011 94 © 2011 Massachusetts Electric and Gas Energy
Efficiency Program Administrators, ALL RIGHTS RESERVED
Non-Energy Impacts
Benefit Type Description Savings
Annual Non-Resource See Appendix D: Non-Resource Impacts See Appendix D: Non-Resource Impacts
One-Time Non-Resource See Appendix D: Non-Resource Impacts See Appendix D: Non-Resource Impacts
Impact Factors for Calculating Adjusted Gross Savings
Measure Name Program PA ISR SPF RRE RRSP RRWP CFSP CFWP
Dehumidifiers ES Appliances CLC 1.00 1.00 1.00 1.00 1.00 0.85 0. 00
Dehumidifiers LI 1-4 Retrofit CLC 1.00 1.00 1.00 1.00 1.00 0.85 0.00
In-Service Rates In-service rates are set to 100% based on the assumption that all purchased units are installed. Savings Persistence Factor All PAs use 100% savings persistence factors. Realization Rates Realization rates are based on Massachusetts Common Assumptions. Coincidence Factors Coincidence factors are based on Massachusetts Common Assumptions.
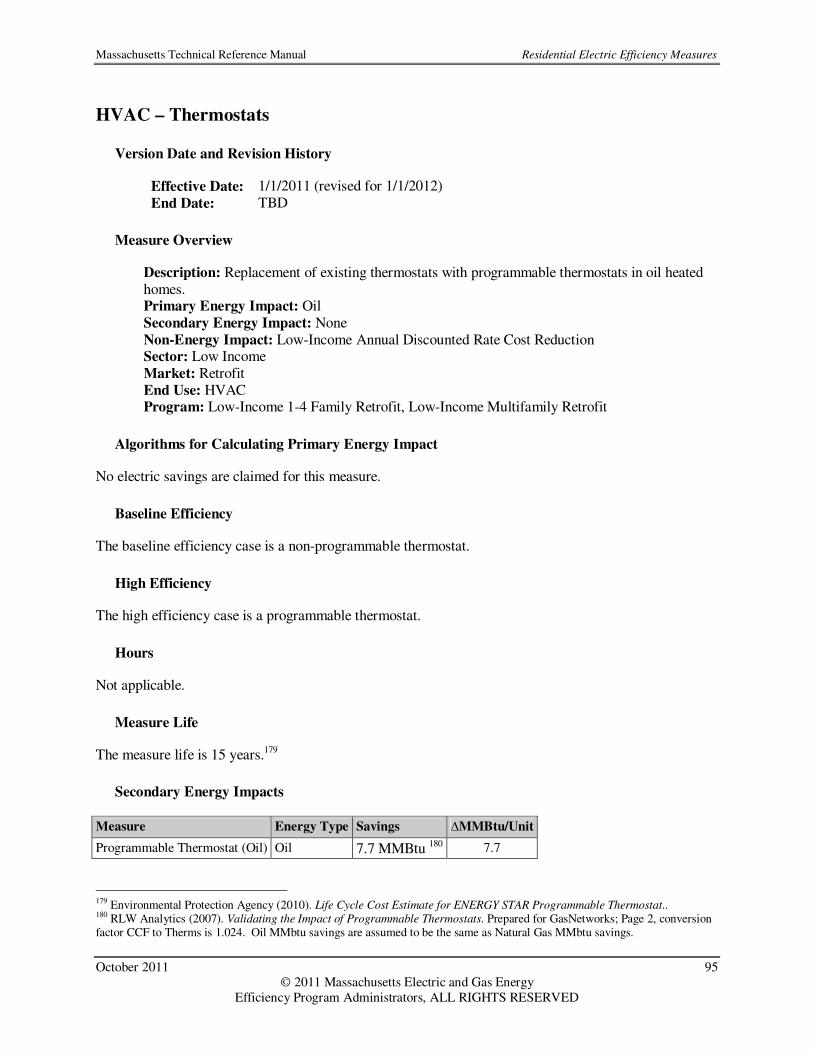
Massachusetts Technical Reference Manual Residential Electric Efficiency Measures
October 2011 95 © 2011 Massachusetts Electric and Gas Energy
Efficiency Program Administrators, ALL RIGHTS RESERVED
HVAC – Thermostats
Version Date and Revision History
Effective Date: 1/1/2011 (revised for 1/1/2012) End Date: TBD
Measure Overview
Description: Replacement of existing thermostats with programmable thermostats in oil heated homes. Primary Energy Impact: Oil Secondary Energy Impact: None Non-Energy Impact: Low-Income Annual Discounted Rate Cost Reduction Sector: Low Income Market: Retrofit End Use: HVAC Program: Low-Income 1-4 Family Retrofit, Low-Income Multifamily Retrofit
Algorithms for Calculating Primary Energy Impact
No electric savings are claimed for this measure.
Baseline Efficiency
The baseline efficiency case is a non-programmable thermostat.
High Efficiency
The high efficiency case is a programmable thermostat.
Hours
Not applicable.
Measure Life
The measure life is 15 years.179
Secondary Energy Impacts
Measure Energy Type Savings ∆MMBtu/Unit
Programmable Thermostat (Oil) Oil 7.7 MMBtu 180 7.7
179 Environmental Protection Agency (2010). Life Cycle Cost Estimate for ENERGY STAR Programmable Thermostat.. 180 RLW Analytics (2007). Validating the Impact of Programmable Thermostats. Prepared for GasNetworks; Page 2, conversion factor CCF to Therms is 1.024. Oil MMbtu savings are assumed to be the same as Natural Gas MMbtu savings.

Massachusetts Technical Reference Manual Residential Electric Efficiency Measures
October 2011 96 © 2011 Massachusetts Electric and Gas Energy
Efficiency Program Administrators, ALL RIGHTS RESERVED
Non-Energy Impacts
Benefit Type Description Savings
Annual Non-Resource See Appendix D: Non-Resource Impacts See Appendix D: Non-Resource Impacts
One-Time Non-Resource See Appendix D: Non-Resource Impacts See Appendix D: Non-Resource Impacts
Impact Factors for Calculating Adjusted Gross Savings
Measure Name Program PA ISR SPF RRE RRSP RRWP CFSP CFWP
Programmable Thermostat (Oil) LI 1-4 Retrofit, LI MF Retrofit
All 1.00 1.00 1.00 1.00 1.00 0.00 0.00
In-Service Rates All installations have 100% in service rate since all PAs programs include verification of equipment installations. Savings Persistence Factor All PAs use 100% savings persistence factors. Realization Rates Realization rates are set to 100% since deemed savings are based on evaluation results. Coincidence Factors Coincidence factors are set to zero since there are no electric savings for this measure.

Massachusetts Technical Reference Manual Residential Electric Efficiency Measures
October 2011 97 © 2011 Massachusetts Electric and Gas Energy
Efficiency Program Administrators, ALL RIGHTS RESERVED
HVAC – Boiler Reset Controls
Version Date and Revision History
Effective Date: 1/1/2011 End Date: TBD
Measure Overview
Description: Installation of weather responsive controls on oil boilers. Primary Energy Impact: Oil Secondary Energy Impact: None Non-Energy Impact: Low-Income Annual Discounted Rate Cost Reduction Sector: Residential, Low-Income Market: Retrofit End Use: HVAC Program: HES, Low-Income 1-4 Family Retrofit
Algorithms for Calculating Primary Energy Impact
No electric savings are claimed for this measure.
Baseline Efficiency
The baseline efficiency case has boiler controls installed.
High Efficiency
The high efficiency case includes weather responsive controls installed on the boiler.
Hours
Not applicable.
Measure Life
The measure life is 15 years.181
Secondary Energy Impacts
Measure Energy Type Savings182
∆MMBtu/Unit
Boiler Reset Controls (Oil) Oil 7.9 MMBtu/Unit 7.9
181 ACEEE (2006). Emerging Technologies Report: Advanced Boiler Controls. Prepared for ACEEE; Page 2. 182 Ibid.
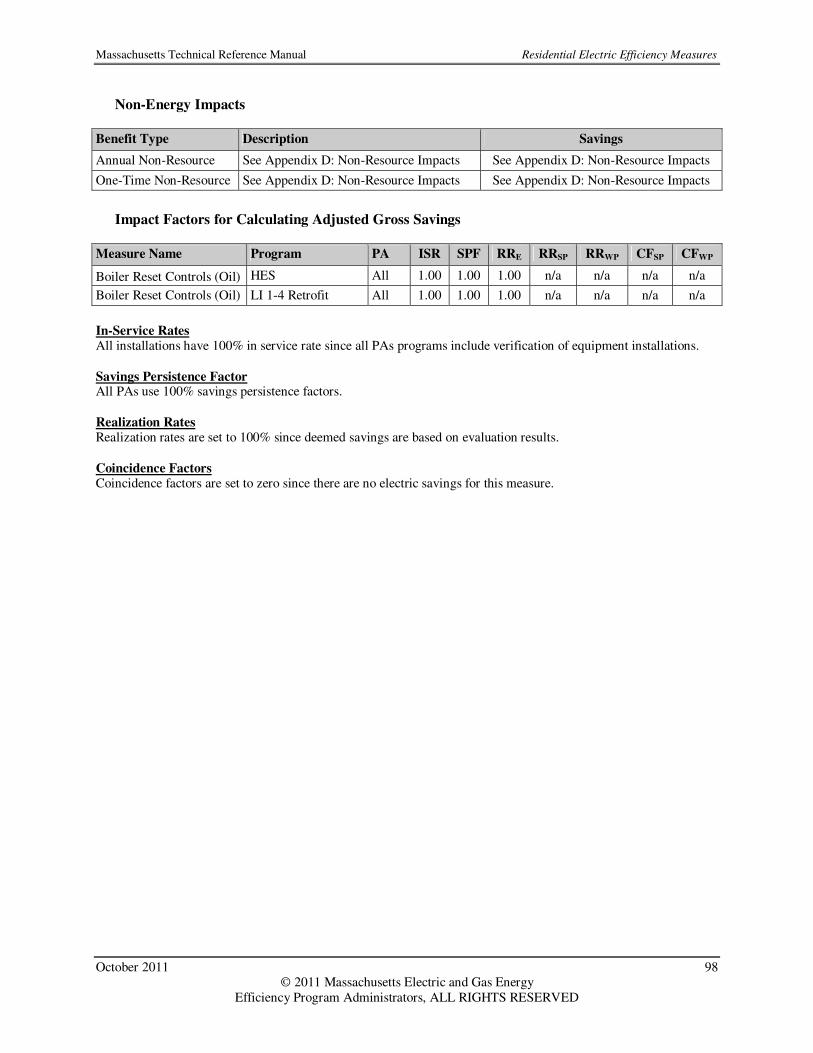
Massachusetts Technical Reference Manual Residential Electric Efficiency Measures
October 2011 98 © 2011 Massachusetts Electric and Gas Energy
Efficiency Program Administrators, ALL RIGHTS RESERVED
Non-Energy Impacts
Benefit Type Description Savings
Annual Non-Resource See Appendix D: Non-Resource Impacts See Appendix D: Non-Resource Impacts
One-Time Non-Resource See Appendix D: Non-Resource Impacts See Appendix D: Non-Resource Impacts
Impact Factors for Calculating Adjusted Gross Savings
Measure Name Program PA ISR SPF RRE RRSP RRWP CFSP CFWP
Boiler Reset Controls (Oil) HES All 1.00 1.00 1.00 n/a n/a n/a n/a
Boiler Reset Controls (Oil) LI 1-4 Retrofit All 1.00 1.00 1.00 n/a n/a n/a n/a
In-Service Rates All installations have 100% in service rate since all PAs programs include verification of equipment installations. Savings Persistence Factor All PAs use 100% savings persistence factors. Realization Rates Realization rates are set to 100% since deemed savings are based on evaluation results. Coincidence Factors Coincidence factors are set to zero since there are no electric savings for this measure.

Massachusetts Technical Reference Manual Residential Electric Efficiency Measures
October 2011 99 © 2011 Massachusetts Electric and Gas Energy
Efficiency Program Administrators, ALL RIGHTS RESERVED
HVAC – Weatherization (Electric)
Version Date and Revision History
Effective Date: 1/1/2011 End Date: TBD
Measure Overview
Description: Installation of weatherization measures such as air sealing and insulation in electrically heated homes. Primary Energy Impact: Electric Secondary Energy Impact: None Non-Energy Impact: Low-Income Annual Discounted Rate Cost Reduction; Low-Income One-Time Arrearage Reduction; Low-Income Annual Fire, Illness and Moving Avoidance Benefits; Low-Income One-Time Property Value Benefit Sector: Low Income Market: Retrofit End Use: HVAC Program: Low-Income 1-4 Family Retrofit, Low-Income Multifamily Retrofit
Notes
The savings estimates described in this section are only used for the Low-Income 1-4 Family Retrofit program (all PAs) and the Low-Income Multifamily Retrofit programs (all PAs except National Grid). The savings algorithms for similar measures installed through National Grid’s Low-Income Multifamily program are described in the Multifamily – Insulation and Multifamily – Air Sealing sections.
Algorithms for Calculating Primary Energy Impact
Unit savings are deemed based on study results:
kWhkWh ∆=∆
kWkW ∆=∆ Where: Unit = Electrically-heated household with weatherization measures installed ∆kWh = Average annual energy reduction: 374 kWh183 ∆kW = Average demand reduction: 0.047 kW184
Baseline Efficiency
The baseline efficiency case is any existing home shell measures.
183 The Cadmus Group, Inc. (2009). Impact Evaluation of the 2007 Appliance Management Program and Low Income
Weatherization Program. Prepared for National Grid; Table 1. 184 Estimated using demand allocation methodology described in: Quantec, LLC (2000). Impact Evaluation: Single-Family
EnergyWise Program. Prepared for National Grid.

Massachusetts Technical Reference Manual Residential Electric Efficiency Measures
October 2011 100 © 2011 Massachusetts Electric and Gas Energy
Efficiency Program Administrators, ALL RIGHTS RESERVED
High Efficiency
The high efficiency case includes increased weatherization insulation levels.
Hours
Not applicable.
Measure Life
The measure life is 20 years.185
Secondary Energy Impacts
There are no secondary energy impacts for this measure.
Non-Energy Impacts
Benefit Type Description Savings
Annual Non-Resource See Appendix D: Non-Resource Impacts See Appendix D: Non-Resource Impacts
One-Time Non-Resource See Appendix D: Non-Resource Impacts See Appendix D: Non-Resource Impacts
Impact Factors for Calculating Adjusted Gross Savings
Measure Name Program PA ISR SPF RRE RRSP RRWP CFSP CFWP
Weatherization (Electric) LI 1-4 Retrofit All 1.00 1.00 1.00 1.00 1.00 0.03 1.00
Weatherization (Electric) LI MF Retrofit All (not National Grid) 1.00 1.00 1.00 1.00 1.00 0.03 1.00
In-Service Rates All installations have 100% in service rate since all PAs programs include verification of equipment installations. Savings Persistence Factor All PAs use 100% savings persistence factors. Realization Rates Realization rates are set to 100% since deemed savings are based on evaluation results. Coincidence Factors Coincidence factors are estimated using the demand allocation methodology described in the 2000 EnergyWise program impact evaluation.186
185 Massachusetts Common Assumption. 186 Quantec, LLC (2000). Impact Evaluation: Single-Family EnergyWise Program. Prepared for National Grid.

Massachusetts Technical Reference Manual Residential Electric Efficiency Measures
October 2011 101 © 2011 Massachusetts Electric and Gas Energy
Efficiency Program Administrators, ALL RIGHTS RESERVED
HVAC – Weatherization (Oil and Other FF)
Version Date and Revision History
Effective Date: 1/1/2011 End Date: TBD
Measure Overview
Description: Installation of weatherization measures such as air sealing and insulation in oil or propane heated homes. Electric savings are achieved from reduced fan run time for heating and cooling systems. Primary Energy Impact: Oil and Other FF Secondary Energy Impact: Electric Non-Energy Impact: Low-Income Annual Discounted Rate Cost Reduction; Low-Income One-Time Arrearage Reduction; Low-Income Annual Fire, Illness and Moving Avoidance Benefits; Low-Income One-Time Property Value Benefit (Electric and Oil) Sector: Low Income Market: Retrofit End Use: HVAC Program: Low-Income 1-4 Family Retrofit
Notes
The savings estimates described in this section are only used for the Low-Income 1-4 Family Retrofit program (all PAs) and the Low-Income Multifamily Retrofit programs (all PAs except National Grid). The savings algorithms for similar measures installed through National Grid’s Low-Income Multifamily program are described in the Multifamily – Insulation and Multifamily – Air Sealing sections.
Algorithms for Calculating Primary Energy Impact
Unit savings are deemed based on study results:
kWhkWh ∆=∆
kWkW ∆=∆ Where: Unit = Oil or propane heated household with weatherization measures installed ∆kWh = Average annual energy reduction per unit: it: 70 kWh187 ∆kW = Average demand reduction per unit: 0.009 kW188
Baseline Efficiency
The baseline efficiency case is any existing home shell measures.
187 The Cadmus Group, Inc. (2009). Impact Evaluation of the 2007 Appliance Management Program and Low Income
Weatherization Program. Prepared for National Grid. 188 Estimated using demand allocation methodology described in: Quantec, LLC (2000). Impact Evaluation: Single-Family
EnergyWise Program. Prepared for National Grid.

Massachusetts Technical Reference Manual Residential Electric Efficiency Measures
October 2011 102 © 2011 Massachusetts Electric and Gas Energy
Efficiency Program Administrators, ALL RIGHTS RESERVED
High Efficiency
The high efficiency case includes increased weatherization insulation levels.
Hours
Not applicable.
Measure Life
The measure life is 20 years.189
Secondary Energy Impacts
Measure Energy Type ∆MMBtu/Unit190
Weatherization (Oil) Oil 13.7
Weatherization (Other FF) Propane 13.7
Non-Energy Impacts
Benefit Type Description Savings
Annual Non-Resource See Appendix D: Non-Resource Impacts See Appendix D: Non-Resource Impacts
One-Time Non-Resource See Appendix D: Non-Resource Impacts See Appendix D: Non-Resource Impacts
Impact Factors for Calculating Adjusted Gross Savings
Measure Name Program PA ISR SPF RRE RRSP RRWP CFSP CFWP
Weatherization (Oil and Other FF)
LI 1-4 Retrofit All 1.00 1.00 1.00 1.00 1.00 0.03 1.00
In-Service Rates All installations have 100% in service rate since all PAs programs include verification of equipment installations. Savings Persistence Factor All PAs use 100% savings persistence factors. Realization Rates Realization rates are set to 100% since deemed savings are based on evaluation results. Coincidence Factors Coincidence factors are estimated using the demand allocation methodology described in the 2000 EnergyWise program impact evaluation.191
189 GDS Associates, Inc. (2007). Measure Life Report: Residential and Commercial/Industrial Lighting and HVAC Measures. Prepared for The New England State Program Working Group; Page A-2. 190 The Cadmus Group, Inc. (2009). Impact Evaluation of the 2007 Appliance Management Program and Low Income
Weatherization Program. Prepared for National Grid. 191 Quantec, LLC (2000). Impact Evaluation: Single-Family EnergyWise Program. Prepared for National Grid.

Massachusetts Technical Reference Manual Residential Electric Efficiency Measures
October 2011 103 © 2011 Massachusetts Electric and Gas Energy
Efficiency Program Administrators, ALL RIGHTS RESERVED
HVAC – Heating System Replacement (Oil)
Version Date and Revision History
Effective Date: 1/1/2011 End Date: TBD
Measure Overview
Description: Replacement of existing oil heating system with a new high efficiency system. Electric savings can be attributed to reduced fan run time and reduced usage of electric space heaters. Primary Energy Impact: Oil Secondary Energy Impact: Electric Non-Energy Impact: Annual Discounted Rate Cost Reduction, One-Time Arrearage Reduction, Annual Fire, Illness and Moving Avoidance Benefits, One-Time Property Value Benefit Sector: Low Income Market: Retrofit End Use: HVAC Program: Low-Income 1-4 Family Retrofit, Low-Income Multifamily Retrofit
Notes
The savings estimates described in this section are only used for the Low-Income 1-4 Family Retrofit program (all PAs) and the Low-Income Multifamily Retrofit programs (all PAs except National Grid).
Algorithms for Calculating Primary Energy Impact
Unit savings are deemed based on study results:
kWhkWh ∆=∆
kWkW ∆=∆ Where: Unit = Installation of new high efficiency oil heating system ∆kWh = Average annual energy reduction per unit: 194 kWh192 ∆kW = Average demand reduction per unit: 0.024 kW193
Baseline Efficiency
The baseline efficiency case is the existing inefficient heating equipment.
192 The Cadmus Group, Inc. (2009). Impact Evaluation of the 2007 Appliance Management Program and Low Income
Weatherization Program. Prepared for National Grid. 193 Estimated using demand allocation methodology described in: Quantec, LLC (2000). Impact Evaluation: Single-Family
EnergyWise Program. Prepared for National Grid.

Massachusetts Technical Reference Manual Residential Electric Efficiency Measures
October 2011 104 © 2011 Massachusetts Electric and Gas Energy
Efficiency Program Administrators, ALL RIGHTS RESERVED
High Efficiency
The high efficiency case is the new efficient heating equipment.
Hours
Not applicable.
Measure Life
The measure life is 18 years.194
Secondary Energy Impacts
Measure Energy Type ∆MMBtu/Unit195
Heating System Replacement (Oil) Oil 12.2
Non-Energy Impacts
Benefit Type Description Savings
Annual Non-Resource See Appendix D: Non-Resource Impacts See Appendix D: Non-Resource Impacts
One-Time Non-Resource See Appendix D: Non-Resource Impacts See Appendix D: Non-Resource Impacts
Impact Factors for Calculating Adjusted Gross Savings
Measure Name Program PA ISR SPF RRE RRSP RRWP CFSP CFWP
Heating System Replacement (Oil)
LI 1-4 Retrofit
All 1.00 1.00 1.00 1.00 1.00 0.03 1.00
Heating System Replacement (Oil)
LI MF Retrofit
All (not National Grid)
1.00 1.00 1.00 1.00 1.00 0.03 1.00
In-Service Rates All installations have 100% in service rate since all PAs programs include verification of equipment installations. Savings Persistence Factor All PAs use 100% savings persistence factors. Realization Rates Realization rates are set to 100% since deemed savings are based on evaluation results. Coincidence Factors Coincidence factors are estimated using the demand allocation methodology described in the 2000 EnergyWise program impact evaluation.196
194 Environmental Protection Agency (2009). Life Cycle Cost Estimate for ENERGY STAR Furnace. 195 The Cadmus Group, Inc. (2009). Impact Evaluation of the 2007 Appliance Management Program and Low Income
Weatherization Program. Prepared for National Grid. 196 Quantec, LLC (2000). Impact Evaluation: Single-Family EnergyWise Program. Prepared for National Grid.

Massachusetts Technical Reference Manual Residential Electric Efficiency Measures
October 2011 105 © 2011 Massachusetts Electric and Gas Energy
Efficiency Program Administrators, ALL RIGHTS RESERVED
Process – Computer Monitors
Version Date and Revision History
Effective Date: 1/1/2011 End Date: TBD
Measure Overview
Description: Rebates for ENERGY STAR® Computer Monitors Primary Energy Impact: Electric Secondary Energy Impact: None Non-Energy Impact: None Sector: Residential Market: Lost Opportunity End Use: Process Program: ENERGY STAR Appliances
Algorithms for Calculating Primary Energy Impact
Unit savings are deemed based on study results:
kWhkWh ∆=∆
kWkW ∆=∆ Where: Unit = Rebated ENERGY STAR® computer monitor ∆kWh = Average annual kWh savings per unit: 35 kWh197 ∆kW = Average annual kW savings per unit: 0.010 kW198
Baseline Efficiency
The baseline efficiency case is a conventional computer monitor.
High Efficiency
The high efficiency case is an ENERGY STAR® rated LCD monitor.
Hours
Not applicable.
197 Deemed savings developed based on assumptions in Consortium for Energy Efficiency (2008). Consumer Electronics
Program Guide: Information on Voluntary Approaches for the Promotion of Energy Efficient Consumer Electronics - Products
and Practices; Page 9, Table 1. 198 Estimated using demand allocation methodology described in: Quantec, LLC (2000). Impact Evaluation: Single-Family
EnergyWise Program. Prepared for National Grid.

Massachusetts Technical Reference Manual Residential Electric Efficiency Measures
October 2011 106 © 2011 Massachusetts Electric and Gas Energy
Efficiency Program Administrators, ALL RIGHTS RESERVED
Measure Life
The measure life is 5 years.199
Secondary Energy Impacts
There are no secondary energy impacts for this measure.
Non-Energy Impacts
Benefit Type Description Savings
Annual Non-Resource See Appendix D: Non-Resource Impacts See Appendix D: Non-Resource Impacts
One-Time Non-Resource See Appendix D: Non-Resource Impacts See Appendix D: Non-Resource Impacts
Impact Factors for Calculating Adjusted Gross Savings
Measure Name Program PA ISR SPF RRE RRSP RRWP CFSP CFWP
Computer Monitors ES Appliances All 1.00 1.00 1.00 1.00 1.00 0.35 1. 00
In-Service Rates In-service rates are set to 100% based on the assumption that all purchased units are installed. Savings Persistence Factor All PAs use 100% savings persistence factors.
Realization Rates Realization rates are based on Massachusetts Common Assumptions. Coincidence Factors Coincidence factors are based on Massachusetts Common Assumptions.
199 Consortium for Energy Efficiency (2008). Consumer Electronics Program Guide: Information on Voluntary Approaches for
the Promotion of Energy Efficient Consumer Electronics - Products and Practices.

Massachusetts Technical Reference Manual Residential Electric Efficiency Measures
October 2011 107 © 2011 Massachusetts Electric and Gas Energy
Efficiency Program Administrators, ALL RIGHTS RESERVED
Process – Computers
Version Date and Revision History
Effective Date: 1/1/2011 End Date: TBD
Measure Overview
Description: Rebates for ENERGY STAR® computers. Primary Energy Impact: Electric Secondary Energy Impact: None Non-Energy Impact: None Sector: Residential Market: Lost Opportunity End Use: Process Program: ENERGY STAR Appliances
Algorithms for Calculating Primary Energy Impact
Unit savings are based on engineering estimate of delta kW between computers that are idle, in sleep mode, or off:
kWhkWh ∆=∆
kWkW ∆=∆ Where: Unit = Rebated ENERGY STAR® desktop computer ∆kWh = Average annual kWh reduction per unit: 70 kWh200 ∆kW = Average kW savings per unit: 0.009 kW201
Baseline Efficiency
The baseline efficiency case is a conventional desktop computer.
High Efficiency
The high efficiency case is an ENERGY STAR® rated desktop computer.
Hours
The operational hours include: 3,322 annual idle hours, 399 annual sleep hours, and 5,039 annual off hours.202
200 Environmental Protection Agency (2010). Life Cycle Cost Estimate for ENERGY STAR Office Equipment. 201 Ibid. 202 Ibid.

Massachusetts Technical Reference Manual Residential Electric Efficiency Measures
October 2011 108 © 2011 Massachusetts Electric and Gas Energy
Efficiency Program Administrators, ALL RIGHTS RESERVED
Measure Life
The measure life is 4 years.203
Secondary Energy Impacts
There are no secondary energy impacts for this measure.
Non-Energy Impacts
Benefit Type Description Savings
Annual Non-Resource See Appendix D: Non-Resource Impacts See Appendix D: Non-Resource Impacts
One-Time Non-Resource See Appendix D: Non-Resource Impacts See Appendix D: Non-Resource Impacts
Impact Factors for Calculating Adjusted Gross Savings
Measure Name Program PA ISR SPF RRE RRSP RRWP CFSP CFWP
Desktop Computers ES Appliances All 1.00 1.00 1.00 1.00 1.00 0.35 1. 00
In-Service Rates In-service rates are set to 100% based on the assumption that all purchased units are installed. Savings Persistence Factor All PAs use 100% savings persistence factors. Realization Rates Realization rates are based on Massachusetts Common Assumptions.
Coincidence Factors Coincidence factors are based on Massachusetts Common Assumptions.
203 Ibid.

Massachusetts Technical Reference Manual Residential Electric Efficiency Measures
October 2011 109 © 2011 Massachusetts Electric and Gas Energy
Efficiency Program Administrators, ALL RIGHTS RESERVED
Process – Pool Pump
Version Date and Revision History
Effective Date: 1/1/2011 End Date: TBD
Measure Overview
Description: The installation of a 2-speed or variable speed drive pool pump. Operating a pool pump for a longer period of time at a lower wattage can move the same amount of water using significantly less energy. Primary Energy Impact: Electric Secondary Energy Impact: None Non-Energy Impact: None Sector: Residential Market: Lost Opportunity End Use: Process Program: ENERGY STAR Appliances
Algorithms for Calculating Primary Energy Impact
Unit savings are deemed based on the following algorithms which use averaged inputs:
%55)( ××=∆ HourskWkWhBASE
kWkW ∆=∆ Where: Unit = Rebated 2-speed or variable speed pool pump ∆kWh = Average annual kWh reduction: 400 kWh204 ∆kW = Average annual kW reduction: 0.071 kW205 Hours = Average annual operating hours of pump kWBASE = connected kW of baseline pump 55% = average percent energy reduction from switch to 2-speed or variable speed pump206
Baseline Efficiency
The baseline efficiency case is a single speed pump.
204 Estimated using the difference between a Standard Efficiency Single Speed Pump and a Two-Speed with both Speeds Combined * Number of Days in the NE summer season ((13.8 kWh – 9.4 kWh) * 91). Pacific Gas and Electric The Multi-Speed
Pool Pump Fact Sheet. 205 Estimated using demand allocation methodology described in: Quantec, LLC (2000). Impact Evaluation: Single-Family
EnergyWise Program. Prepared for National Grid. 206 Davis Energy Group (2008). Proposal Information Template for Residential Pool Pump Measure Revisions. Prepared for Pacific Gas and Electric Company; Page 2.
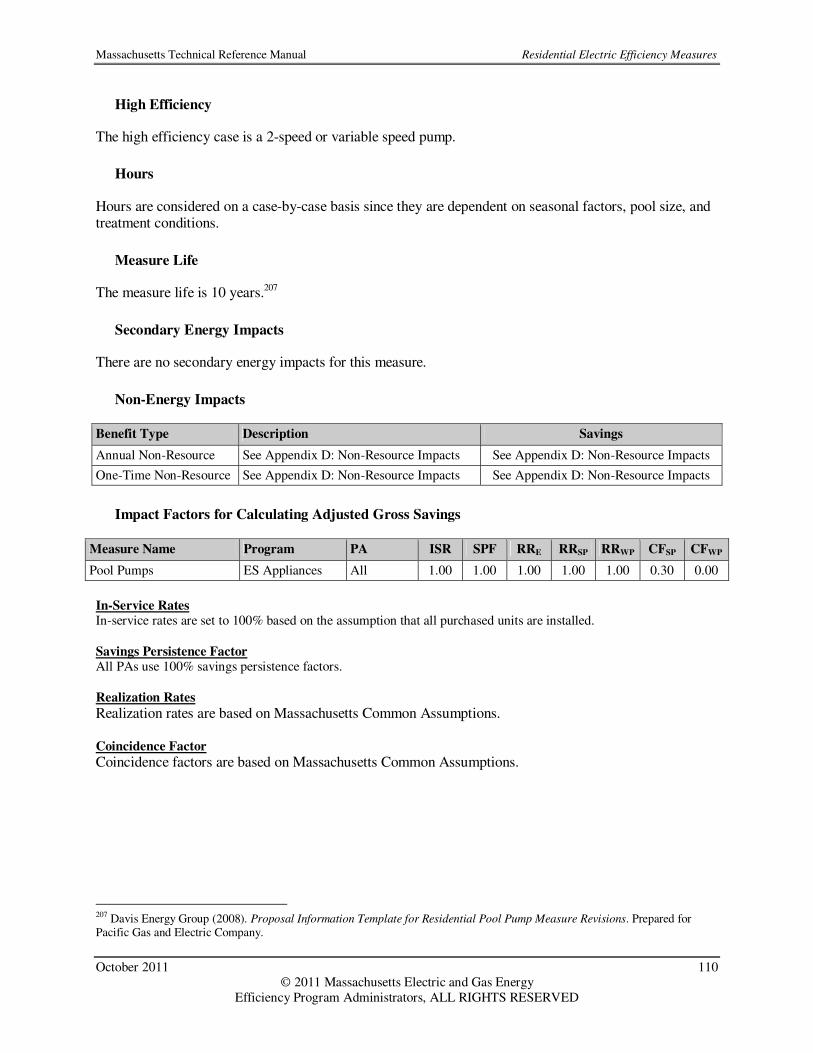
Massachusetts Technical Reference Manual Residential Electric Efficiency Measures
October 2011 110 © 2011 Massachusetts Electric and Gas Energy
Efficiency Program Administrators, ALL RIGHTS RESERVED
High Efficiency
The high efficiency case is a 2-speed or variable speed pump.
Hours
Hours are considered on a case-by-case basis since they are dependent on seasonal factors, pool size, and treatment conditions.
Measure Life
The measure life is 10 years.207
Secondary Energy Impacts
There are no secondary energy impacts for this measure.
Non-Energy Impacts
Benefit Type Description Savings
Annual Non-Resource See Appendix D: Non-Resource Impacts See Appendix D: Non-Resource Impacts
One-Time Non-Resource See Appendix D: Non-Resource Impacts See Appendix D: Non-Resource Impacts
Impact Factors for Calculating Adjusted Gross Savings
Measure Name Program PA ISR SPF RRE RRSP RRWP CFSP CFWP
Pool Pumps ES Appliances All 1.00 1.00 1.00 1.00 1.00 0.30 0.00
In-Service Rates In-service rates are set to 100% based on the assumption that all purchased units are installed. Savings Persistence Factor All PAs use 100% savings persistence factors. Realization Rates
Realization rates are based on Massachusetts Common Assumptions. Coincidence Factor
Coincidence factors are based on Massachusetts Common Assumptions.
207 Davis Energy Group (2008). Proposal Information Template for Residential Pool Pump Measure Revisions. Prepared for Pacific Gas and Electric Company.
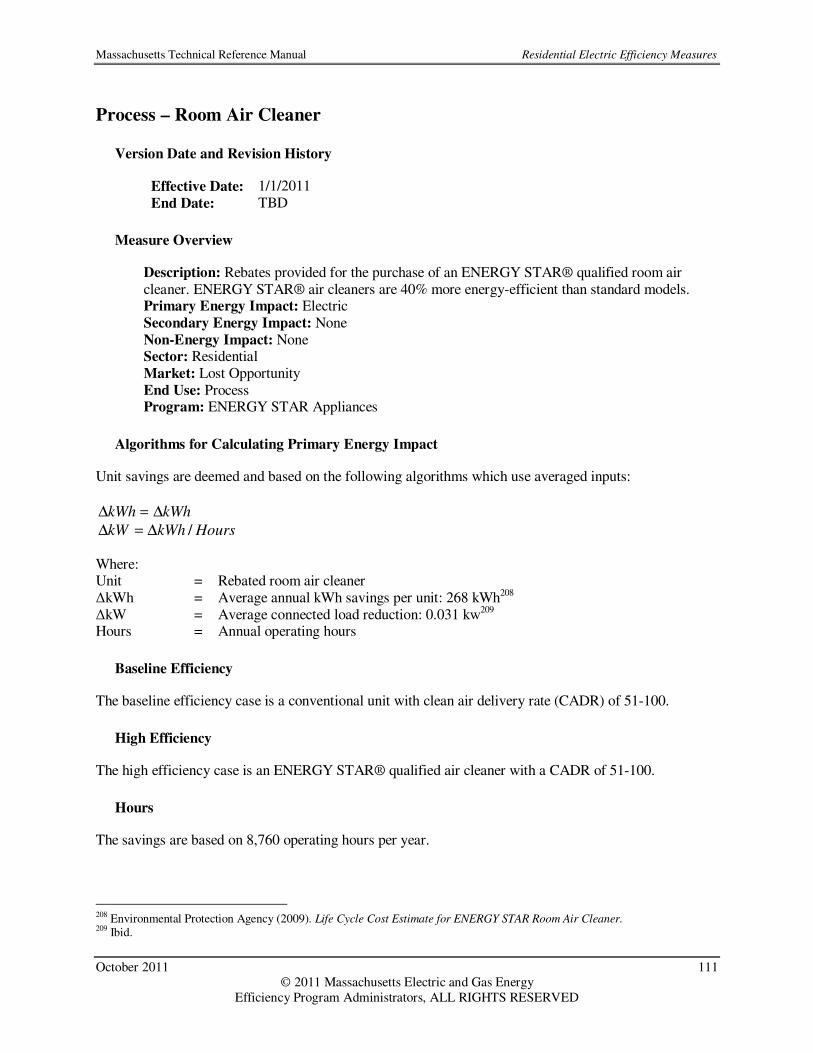
Massachusetts Technical Reference Manual Residential Electric Efficiency Measures
October 2011 111 © 2011 Massachusetts Electric and Gas Energy
Efficiency Program Administrators, ALL RIGHTS RESERVED
Process – Room Air Cleaner
Version Date and Revision History
Effective Date: 1/1/2011 End Date: TBD
Measure Overview
Description: Rebates provided for the purchase of an ENERGY STAR® qualified room air cleaner. ENERGY STAR® air cleaners are 40% more energy-efficient than standard models. Primary Energy Impact: Electric Secondary Energy Impact: None Non-Energy Impact: None Sector: Residential Market: Lost Opportunity End Use: Process Program: ENERGY STAR Appliances
Algorithms for Calculating Primary Energy Impact
Unit savings are deemed and based on the following algorithms which use averaged inputs:
kWhkWh ∆=∆
HourskWhkW /∆=∆ Where: Unit = Rebated room air cleaner ∆kWh = Average annual kWh savings per unit: 268 kWh208 ∆kW = Average connected load reduction: 0.031 kw209 Hours = Annual operating hours
Baseline Efficiency
The baseline efficiency case is a conventional unit with clean air delivery rate (CADR) of 51-100.
High Efficiency
The high efficiency case is an ENERGY STAR® qualified air cleaner with a CADR of 51-100.
Hours
The savings are based on 8,760 operating hours per year.
208 Environmental Protection Agency (2009). Life Cycle Cost Estimate for ENERGY STAR Room Air Cleaner. 209 Ibid.
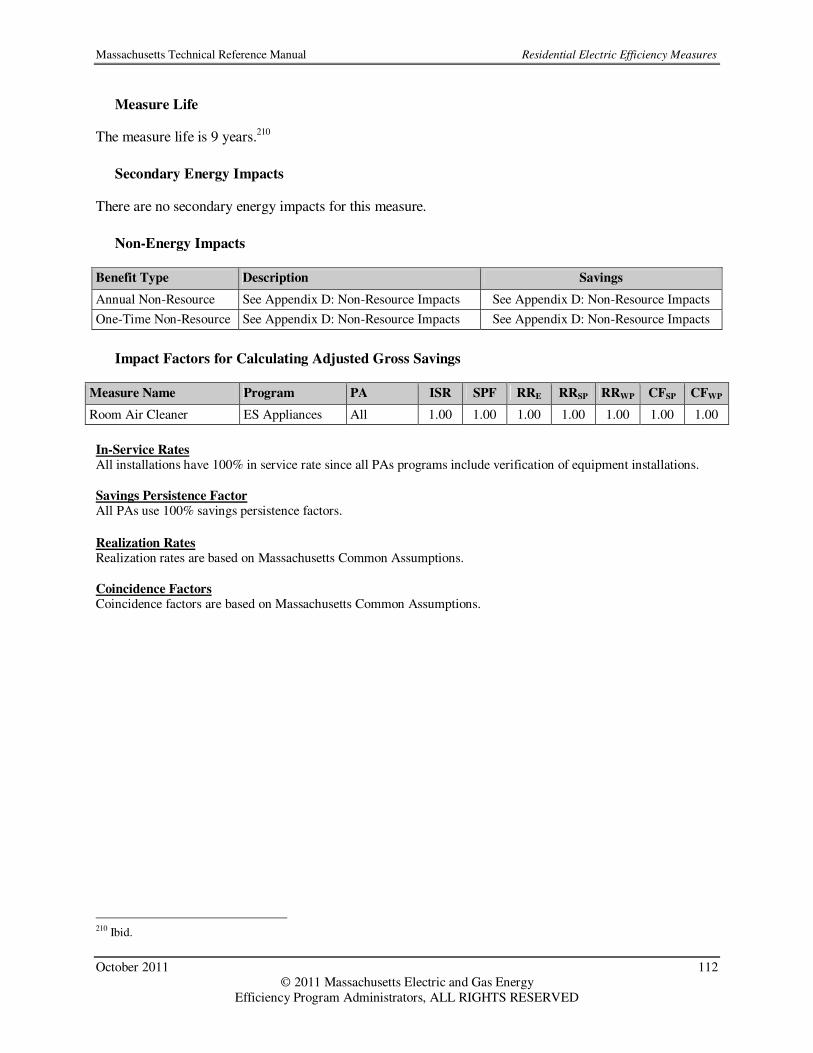
Massachusetts Technical Reference Manual Residential Electric Efficiency Measures
October 2011 112 © 2011 Massachusetts Electric and Gas Energy
Efficiency Program Administrators, ALL RIGHTS RESERVED
Measure Life
The measure life is 9 years.210
Secondary Energy Impacts
There are no secondary energy impacts for this measure.
Non-Energy Impacts
Benefit Type Description Savings
Annual Non-Resource See Appendix D: Non-Resource Impacts See Appendix D: Non-Resource Impacts
One-Time Non-Resource See Appendix D: Non-Resource Impacts See Appendix D: Non-Resource Impacts
Impact Factors for Calculating Adjusted Gross Savings
Measure Name Program PA ISR SPF RRE RRSP RRWP CFSP CFWP
Room Air Cleaner ES Appliances All 1.00 1.00 1.00 1.00 1.00 1.00 1.00
In-Service Rates All installations have 100% in service rate since all PAs programs include verification of equipment installations. Savings Persistence Factor All PAs use 100% savings persistence factors.
Realization Rates Realization rates are based on Massachusetts Common Assumptions. Coincidence Factors Coincidence factors are based on Massachusetts Common Assumptions.
210 Ibid.

Massachusetts Technical Reference Manual Residential Electric Efficiency Measures
October 2011 113 © 2011 Massachusetts Electric and Gas Energy
Efficiency Program Administrators, ALL RIGHTS RESERVED
Process – Set Top Boxes
Version Date and Revision History
Effective Date: 1/1/2011 End Date: TBD
Measure Overview
Description: Rebates for ENERGY STAR® Set Top Boxes. Primary Energy Impact: Electric Secondary Energy Impact: None Non-Energy Impact: None Sector: Residential Market: Lost Opportunity End Use: Process Program: ENERGY STAR Appliances
Algorithms for Calculating Primary Energy Impact
Unit savings are deemed based on study results:
kWhkWh ∆=∆
kWkW ∆=∆ Where: Unit = Rebated set-top box ∆kWh = Average annual kWh savings per unit: 36.3 kWh211 ∆kW = Average connected load reduction: 0.008 kW212
Baseline Efficiency
The baseline efficiency case is a conventional set-top box that is not ENERGY STAR ® rated.
High Efficiency
The high efficiency case is an ENERGY STAR ® rated set-stop box that is 30% more efficient than conventional models.
Hours
The savings are based on 8,760 operational hours per year.
211 Home: ENERGY STAR (2010). Set-top Boxes & Cable Boxes for Consumers. http://www.energystar.gov/index.cfm?fuseaction=find_a_product.showProductGroup&pgw_code=ST. Accessed on 10/11/11; savings found by taking 30% of the average Total Energy Consumption from the Qualified Set-top Box Product List. 212 Estimated using demand allocation methodology described in: Quantec, LLC (2000). Impact Evaluation: Single-Family
EnergyWise Program. Prepared for National Grid.

Massachusetts Technical Reference Manual Residential Electric Efficiency Measures
October 2011 114 © 2011 Massachusetts Electric and Gas Energy
Efficiency Program Administrators, ALL RIGHTS RESERVED
Measure Life
The measure life is 4 years.213
Secondary Energy Impacts
There are no secondary energy impacts for this measure.
Non-Energy Impacts
Benefit Type Description Savings
Annual Non-Resource See Appendix D: Non-Resource Impacts See Appendix D: Non-Resource Impacts
One-Time Non-Resource See Appendix D: Non-Resource Impacts See Appendix D: Non-Resource Impacts
Impact Factors for Calculating Adjusted Gross Savings
Measure Name Program PA ISR SPF RRE RRSP RRWP CFSP CFWP
Set Top Box ES Appliances All 1.00 1.00 1.00 1.00 1.00 0.35 1.00
In-Service Rates In-service rates are set to 100% based on the assumption that all purchased units are installed. Savings Persistence Factor All PAs use 100% savings persistence factors.
Realization Rates Realization rates are based on Massachusetts Common Assumptions. Coincidence Factors Coincidence factors are based on Massachusetts Common Assumptions.
213 Massachusetts Common Assumption.

Massachusetts Technical Reference Manual Residential Electric Efficiency Measures
October 2011 115 © 2011 Massachusetts Electric and Gas Energy
Efficiency Program Administrators, ALL RIGHTS RESERVED
Process – Smart Strips
Version Date and Revision History
Effective Date: 1/1/2011 End Date: TBD
Measure Overview
Description: Switches off plug load using current sensors and switching devices which turn off plug load when electrical current drops below threshold low levels. Smart Strips can be used on electrical home appliances or in the workplace. Primary Energy Impact: Electric Secondary Energy Impact: None Non-Energy Impact: Annual Discounted Rate Cost Reduction (Low Income only) Sector: Residential, Low Income Market: Lost Opportunity, Retrofit End Use: Process Program: ENERGY STAR Appliances, HES, Low-Income 1-4 Family Retrofit, Multi-Family Retrofit, Low-Income Multifamily Retrofit
Algorithms for Calculating Primary Energy Impact
Unit savings are deemed based on study results:
kWhkWh ∆=∆
kWkW ∆=∆ Unit = Rebated smart strip ∆kWh = Average annual kWh savings per unit: 79 kWh214 ∆kW = Max kW savings per unit: 0.060 kW215
Baseline Efficiency
The baseline efficiency case is no power strip and leaving peripherals on or using a power surge protector.
High Efficiency
The high efficiency case is a Smart Strip Energy Efficient Power Bar
Hours
Since the power strip is assumed to be plugged in all year, the savings are based on 8,760 operational hours per year.
214 ECOS 2009 Smart Plug Strips: Draft Report. 215 Estimated using demand allocation methodology described in: Quantec, LLC (2000). Impact Evaluation: Single-
Family EnergyWise Program. Prepared for National Grid.

Massachusetts Technical Reference Manual Residential Electric Efficiency Measures
October 2011 116 © 2011 Massachusetts Electric and Gas Energy
Efficiency Program Administrators, ALL RIGHTS RESERVED
Measure Life
The measure life is 5 years216
Secondary-Energy Impacts
There are no secondary energy impacts for this measure.
Non-Energy Impacts
Benefit Type Description Savings
Annual Non-Resource See Appendix D: Non-Resource Impacts See Appendix D: Non-Resource Impacts
One-Time Non-Resource See Appendix D: Non-Resource Impacts See Appendix D: Non-Resource Impacts
Impact Factors for Calculating Adjusted Gross Savings
Measure Name Program PA ISR SPF RRE RRSP RRWP CFSP CFWP
Smart Strips ES Appliances All 1.00 1.00 1.00 1.00 1.00 0.35 1. 00
Smart Strips HES All 1.00 1.00 1.00 1.00 1.00 0.35 1.00
Smart Strips MF Retrofit All 1.00 1.00 1.00 1.00 1.00 0.35 1.00
Smart Strips LI 1-4 Retrofit All 1.00 1.00 1.00 1.00 1.00 0.35 1.00
Smart Strips LI MF Retrofit All 1.00 1.00 1.00 1.00 1.00 0.35 1.00
In-Service Rates In-service rates are set to 100% based on the assumption that all purchased units are installed. Savings Persistence Factor All PAs use 100% savings persistence factors. Realization Rates Realization rates are set to 100% based on Massachusetts Common Assumptions.
Coincidence Factors Coincidence factors are based on Massachusetts Common Assumptions.
216 Massachusetts Common Assumption.

Massachusetts Technical Reference Manual Residential Electric Efficiency Measures
October 2011 117 © 2011 Massachusetts Electric and Gas Energy
Efficiency Program Administrators, ALL RIGHTS RESERVED
Process – Televisions
Version Date and Revision History
Effective Date: 1/1/2011 End Date: TBD
Measure Overview
Description: Rebates for televisions that meet ENERGY STAR® version 4.1 and 5.1 specifications. Primary Energy Impact: Electric Secondary Energy Impact: None Non-Energy Impact: None Sector: Residential Market: Lost Opportunity End Use: Process Program: ENERGY STAR Appliances
Algorithms for Calculating Primary Energy Impact
Unit savings are deemed based on the following algorithms and assumptions:
kWhkWh ∆=∆
kWkW ∆=∆ Where: Unit = Rebated television ∆kWh = Average annual kWh reduction per unit. See Table 7. ∆kW = Average electric demand reduction per unit. See Table 7.
Baseline Efficiency
The baseline efficiency case is a CEE Tier 1 television.
High Efficiency
The high efficiency case is an ENERGY STAR® qualified television, which uses about 40% less energy than standard units. Qualifying ENERGY STAR® TV products include standard TVs, HD-ready TVs, and the large flat-screen plasma TVs.217 The savings, which are weighted between on and standby modes, for various models are given in the following table. Table 7: Savings for Televisions Television Size ∆kW ∆kWh
LCD/TV 0.021 75
Version 4.1 TV <60” 0.021 180
217 Homes: Energy Star. Televisions for Consumers.
http://www.energystar.gov/index.cfm?fuseaction=find_a_product.showProductGroup&pgw_code=TV. Accessed on 10/11/10.

Massachusetts Technical Reference Manual Residential Electric Efficiency Measures
October 2011 118 © 2011 Massachusetts Electric and Gas Energy
Efficiency Program Administrators, ALL RIGHTS RESERVED
Version 4.1 TV >=60” 0.043 372
Version 5.1 TV <60” 0.027 235
Version 5.1 TV >=60” 0.06 528
Version 5.3 TV <60” 0.028 246
Version 5.3 TV >=60” 0.062 544
Hours
Since the TV is assumed to be plugged in all year, the savings are based on 8,760 operational hours per year. The weighted savings are based on 5 hours on and 19 hours standby each day.
Measure Life
The measure life is 6 years.218
Secondary Energy Impacts
There are no secondary energy impacts for this measure.
Non-Energy Impacts
Benefit Type Description Savings
Annual Non-Resource See Appendix D: Non-Resource Impacts See Appendix D: Non-Resource Impacts
One-Time Non-Resource See Appendix D: Non-Resource Impacts See Appendix D: Non-Resource Impacts
Impact Factors for Calculating Adjusted Gross Savings
Measure Name Program PA ISR SPF RRE RRSP RRWP CFSP CFWP
LCD/TV ES Appliances All 1.00 1.00 1.00 1.00 1.00 0.50 0.85
Version 4.1 TV < 60" ES Appliances All 1.00 1.00 1.00 1.00 1.00 0.50 0.85
Version 4.1 TV >= 60" ES Appliances All 1.00 1.00 1.00 1.00 1.00 0.50 0.85
Version 5.1 TV < 60" ES Appliances All 1.00 1.00 1.00 1.00 1.00 0.50 0.85
Version 5.1 TV >= 60" ES Appliances All 1.00 1.00 1.00 1.00 1.00 0.50 0.85
In-Service Rates In-service rates are set to 100% based on the assumption that all purchased units are installed. Savings Persistence Factor All PAs use 100% savings persistence factors.
Realization Rates Realization rates are based on Massachusetts Common Assumptions. Coincidence Factors Coincidence factors are based on Massachusetts Common Assumptions.
218 Environmental Protection Agency (2008). Life Cycle Cost Estimate for ENERGY STAR Television.
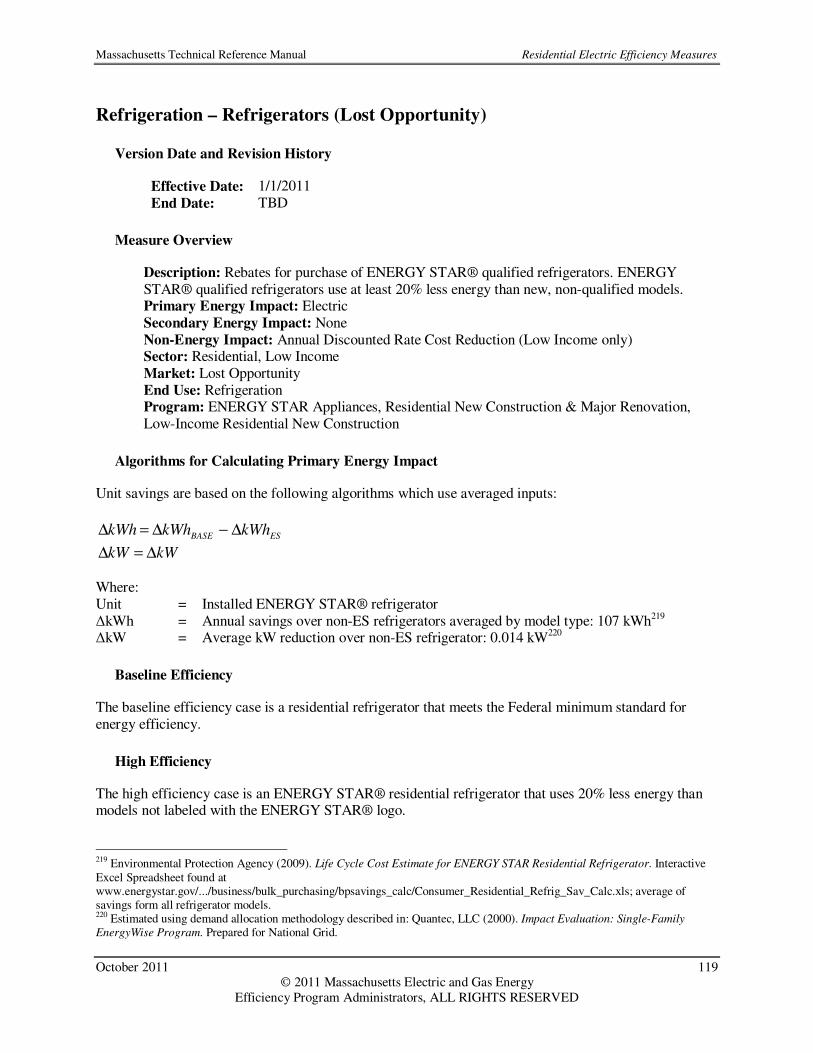
Massachusetts Technical Reference Manual Residential Electric Efficiency Measures
October 2011 119 © 2011 Massachusetts Electric and Gas Energy
Efficiency Program Administrators, ALL RIGHTS RESERVED
Refrigeration – Refrigerators (Lost Opportunity)
Version Date and Revision History
Effective Date: 1/1/2011 End Date: TBD
Measure Overview
Description: Rebates for purchase of ENERGY STAR® qualified refrigerators. ENERGY STAR® qualified refrigerators use at least 20% less energy than new, non-qualified models. Primary Energy Impact: Electric Secondary Energy Impact: None Non-Energy Impact: Annual Discounted Rate Cost Reduction (Low Income only) Sector: Residential, Low Income Market: Lost Opportunity End Use: Refrigeration Program: ENERGY STAR Appliances, Residential New Construction & Major Renovation, Low-Income Residential New Construction
Algorithms for Calculating Primary Energy Impact
Unit savings are based on the following algorithms which use averaged inputs:
ESBASEkWhkWhkWh ∆−∆=∆
kWkW ∆=∆ Where: Unit = Installed ENERGY STAR® refrigerator ∆kWh = Annual savings over non-ES refrigerators averaged by model type: 107 kWh219 ∆kW = Average kW reduction over non-ES refrigerator: 0.014 kW220
Baseline Efficiency
The baseline efficiency case is a residential refrigerator that meets the Federal minimum standard for energy efficiency.
High Efficiency
The high efficiency case is an ENERGY STAR® residential refrigerator that uses 20% less energy than models not labeled with the ENERGY STAR® logo.
219 Environmental Protection Agency (2009). Life Cycle Cost Estimate for ENERGY STAR Residential Refrigerator. Interactive Excel Spreadsheet found at www.energystar.gov/.../business/bulk_purchasing/bpsavings_calc/Consumer_Residential_Refrig_Sav_Calc.xls; average of savings form all refrigerator models. 220 Estimated using demand allocation methodology described in: Quantec, LLC (2000). Impact Evaluation: Single-Family
EnergyWise Program. Prepared for National Grid.
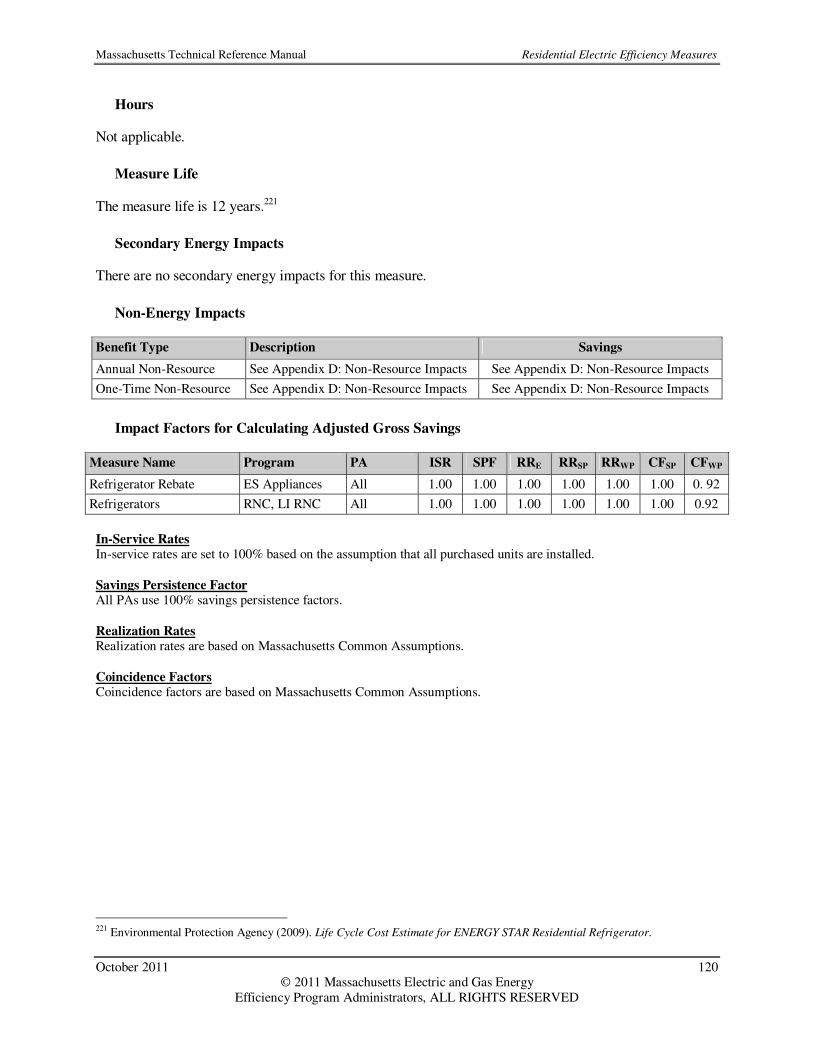
Massachusetts Technical Reference Manual Residential Electric Efficiency Measures
October 2011 120 © 2011 Massachusetts Electric and Gas Energy
Efficiency Program Administrators, ALL RIGHTS RESERVED
Hours
Not applicable.
Measure Life
The measure life is 12 years.221
Secondary Energy Impacts
There are no secondary energy impacts for this measure.
Non-Energy Impacts
Benefit Type Description Savings
Annual Non-Resource See Appendix D: Non-Resource Impacts See Appendix D: Non-Resource Impacts
One-Time Non-Resource See Appendix D: Non-Resource Impacts See Appendix D: Non-Resource Impacts
Impact Factors for Calculating Adjusted Gross Savings
Measure Name Program PA ISR SPF RRE RRSP RRWP CFSP CFWP
Refrigerator Rebate ES Appliances All 1.00 1.00 1.00 1.00 1.00 1.00 0. 92
Refrigerators RNC, LI RNC All 1.00 1.00 1.00 1.00 1.00 1.00 0.92
In-Service Rates In-service rates are set to 100% based on the assumption that all purchased units are installed. Savings Persistence Factor All PAs use 100% savings persistence factors. Realization Rates Realization rates are based on Massachusetts Common Assumptions.
Coincidence Factors Coincidence factors are based on Massachusetts Common Assumptions.
221 Environmental Protection Agency (2009). Life Cycle Cost Estimate for ENERGY STAR Residential Refrigerator.

Massachusetts Technical Reference Manual Residential Electric Efficiency Measures
October 2011 121 © 2011 Massachusetts Electric and Gas Energy
Efficiency Program Administrators, ALL RIGHTS RESERVED
Refrigeration – Refrigerators (Retrofit)
Version Date and Revision History
Effective Date: 1/1/2011 End Date: TBD
Measure Overview
Description: This measure covers the replacement of an existing inefficient refrigerator with a new ENERGY STAR® rated refrigerator. ENERGY STAR® qualified refrigerators use at least 20% less energy than non-qualified models. Primary Energy Impact: Electric Secondary Energy Impact: None Non-Energy Impact: Low Income only: Annual Discounted Rate Cost Reduction, One-Time Avoided Refrigerator Purchase Sector: Residential, Low Income Market: Retrofit End Use: Refrigeration Program: Home Energy Services, Multi-Family Retrofit, Low-Income Multifamily Retrofit, Low-Income 1-4 Family Retrofit
Algorithms for Calculating Primary Energy Impact
For HES, Multi-Family Retrofit and Low-Income Multifamily Retrofit:
Unit savings are deemed based on the following algorithms and averaged inputs:
EERETIRE kWhkWhkWh ∆+∆=∆
EERETIRE kWkWkW ∆+∆=∆
Where: Unit = Replacement of existing refrigerator with new ENERGY STAR® Refrigerator ∆kWh RETIRE = Annual energy savings over remaining life of existing equipment: 884 kWh222 ∆kWh EE = Annual energy savings over full life of new ES refrigerator: 107 kWh223 ∆kWRETIRE = Average demand reduction over remaining life of existing equipment: 0.030 kW224 ∆kW EE = Average demand reduction over full life of new ES refrigerator: 0.010 kW225
For Low-Income 1-4 Family Retrofit: Unit savings are deemed based on study results:
222 Michael Blasnik & Associates (2004). Measurement & Verification of Residential Refrigerator Energy Use, 2003 - 2004
Metering Study. Prepared for NSTAR, National Grid and WMECO. 223 The PAs use the Lost Opportunity savings of 107 kWh as the annual savings over the life of the new ES refrigerator. See Refrigerator(Lost Opportunity) section. 224 Estimated using demand allocation methodology described in: Quantec, LLC (2000). Impact Evaluation: Single-Family
EnergyWise Program. Prepared for National Grid. 225 Ibid.
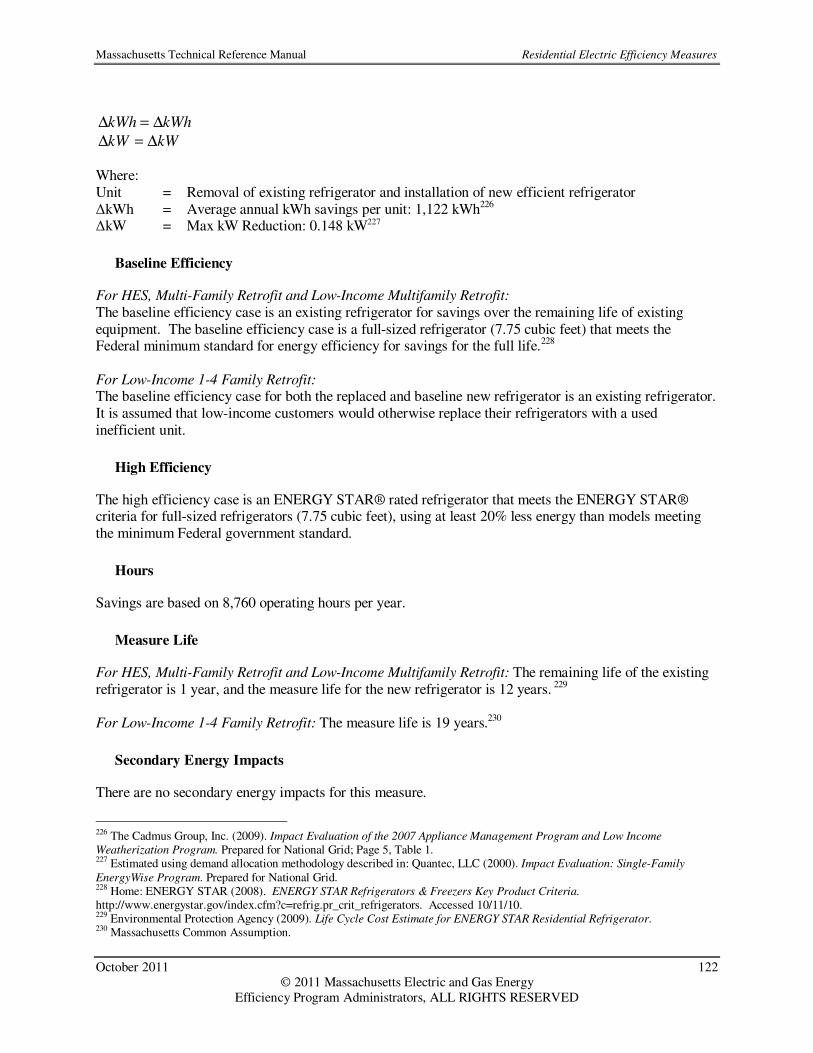
Massachusetts Technical Reference Manual Residential Electric Efficiency Measures
October 2011 122 © 2011 Massachusetts Electric and Gas Energy
Efficiency Program Administrators, ALL RIGHTS RESERVED
kWhkWh ∆=∆
kWkW ∆=∆ Where: Unit = Removal of existing refrigerator and installation of new efficient refrigerator ∆kWh = Average annual kWh savings per unit: 1,122 kWh226 ∆kW = Max kW Reduction: 0.148 kW227
Baseline Efficiency
For HES, Multi-Family Retrofit and Low-Income Multifamily Retrofit:
The baseline efficiency case is an existing refrigerator for savings over the remaining life of existing equipment. The baseline efficiency case is a full-sized refrigerator (7.75 cubic feet) that meets the Federal minimum standard for energy efficiency for savings for the full life.228 For Low-Income 1-4 Family Retrofit: The baseline efficiency case for both the replaced and baseline new refrigerator is an existing refrigerator. It is assumed that low-income customers would otherwise replace their refrigerators with a used inefficient unit.
High Efficiency
The high efficiency case is an ENERGY STAR® rated refrigerator that meets the ENERGY STAR® criteria for full-sized refrigerators (7.75 cubic feet), using at least 20% less energy than models meeting the minimum Federal government standard.
Hours
Savings are based on 8,760 operating hours per year.
Measure Life
For HES, Multi-Family Retrofit and Low-Income Multifamily Retrofit: The remaining life of the existing refrigerator is 1 year, and the measure life for the new refrigerator is 12 years. 229
For Low-Income 1-4 Family Retrofit: The measure life is 19 years.230
Secondary Energy Impacts
There are no secondary energy impacts for this measure.
226 The Cadmus Group, Inc. (2009). Impact Evaluation of the 2007 Appliance Management Program and Low Income
Weatherization Program. Prepared for National Grid; Page 5, Table 1. 227 Estimated using demand allocation methodology described in: Quantec, LLC (2000). Impact Evaluation: Single-Family
EnergyWise Program. Prepared for National Grid. 228 Home: ENERGY STAR (2008). ENERGY STAR Refrigerators & Freezers Key Product Criteria. http://www.energystar.gov/index.cfm?c=refrig.pr_crit_refrigerators. Accessed 10/11/10. 229 Environmental Protection Agency (2009). Life Cycle Cost Estimate for ENERGY STAR Residential Refrigerator. 230 Massachusetts Common Assumption.

Massachusetts Technical Reference Manual Residential Electric Efficiency Measures
October 2011 123 © 2011 Massachusetts Electric and Gas Energy
Efficiency Program Administrators, ALL RIGHTS RESERVED
Non-Energy Impacts
Benefit Type Description Savings
Annual Non-Resource See Appendix D: Non-Resource Impacts See Appendix D: Non-Resource Impacts
One-Time Non-Resource See Appendix D: Non-Resource Impacts See Appendix D: Non-Resource Impacts
Impact Factors for Calculating Adjusted Gross Savings
Measure Program PA ISR SPF RRE RRSP RRWP CFSP CFWP
Refrigerators HES All 1.00 1.00 1.00 1.00 1.00 1.00 0.92
Refrigerators MF Retrofit, LI MF Retrofit
All (not National Grid)
1.00 1.00 1.00 1.00 1.00 1.00 0.92
Refrigerator Replacement
LI 1-4 Retrofit All 1.00 1.00 1.00 1.00 1.00 1.00 0.92
In-Service Rates In-service rates are 100% as it is assumed all refrigerators are in-use. Savings Persistence Factor All PAs use 100% savings persistence factors. Realization Rates � HES, MF Retrofit, LI MF Retrofit: Realization rates are based on Massachusetts Common Assumptions. � LI 1-4 Retrofit: Realization rates are set to 100% since deemed savings are based on evaluation results.
Coincidence Factors Coincidence factors are estimated using the demand allocation methodology described in the 2000 EnergyWise program impact evaluation.231
231 Quantec, LLC (2000). Impact Evaluation: Single-Family EnergyWise Program. Prepared for National Grid.

Massachusetts Technical Reference Manual Residential Electric Efficiency Measures
October 2011 124 © 2011 Massachusetts Electric and Gas Energy
Efficiency Program Administrators, ALL RIGHTS RESERVED
Refrigeration – Freezers (Lost Opportunity)
Version Date and Revision History
Effective Date: 1/1/2011 End Date: TBD
Measure Overview
Description: Rebates provided for the purchase of ENERGY STAR® freezers. ENERGY STAR® qualified freezers use at least 10% less energy than new, non-qualified models and return even greater savings compared to old models. Primary Energy Impact: Electric Secondary Energy Impact: None Non-Energy Impact: None Sector: Residential Market: Lost Opportunity End Use: Refrigeration Program: ENERGY STAR Appliances
Algorithms for Calculating Primary Energy Impact
Unit savings are based on the following algorithms which use averaged inputs:
ESBASE kWhkWhkWh ∆−∆=∆
hourskWhkW 8760/∆=∆ Where: Unit = Installed ENERGY STAR® freezer ∆kWh = Annual savings over non-ES freezers averaged by model type: 54 kWh232 ∆kW = Average kW reduction over non-ES freezer: 0.006 kW
Baseline Efficiency
The baseline efficiency case is a residential freezer that meets the Federal minimum standard for energy efficiency.
High Efficiency
The high efficiency case is based on an ENERGY STAR® rated freezer that uses 10% less energy than models not labeled with the ENERGY STAR® logo.
Hours
Not applicable.
232 Environmental Protection Agency (2011). Life Cycle Cost Estimate for ENERGY STAR Freezer. Accessed 9/7/2011.
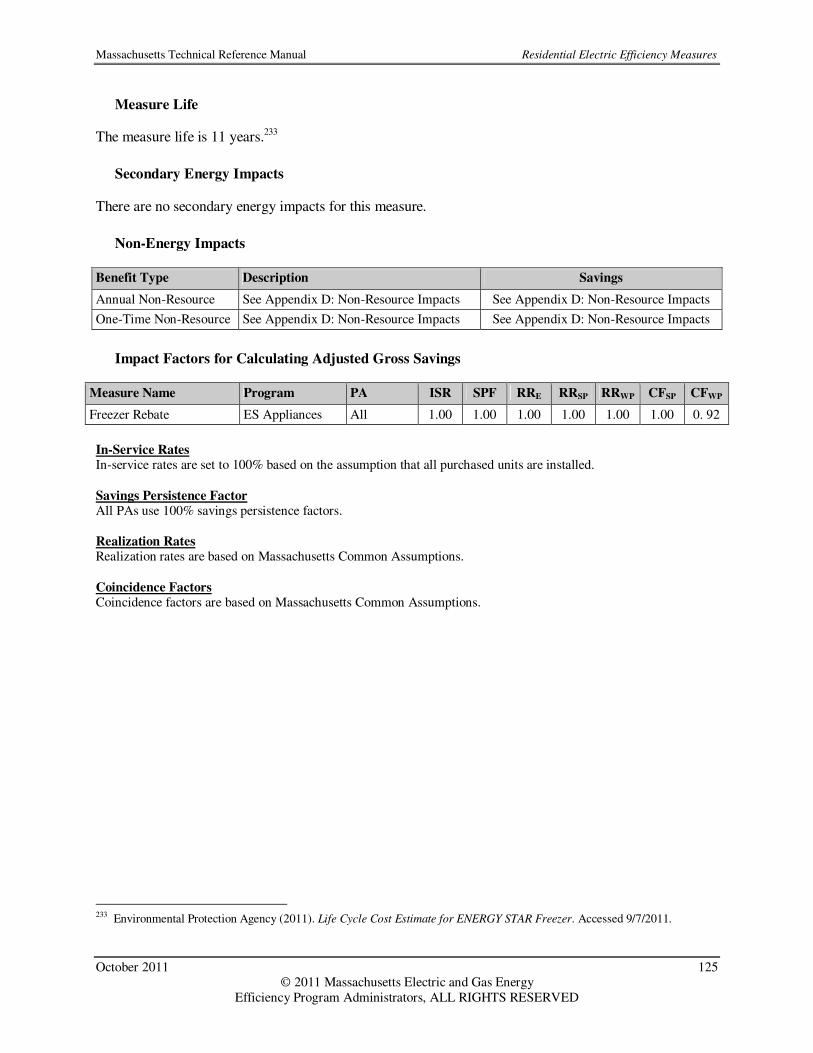
Massachusetts Technical Reference Manual Residential Electric Efficiency Measures
October 2011 125 © 2011 Massachusetts Electric and Gas Energy
Efficiency Program Administrators, ALL RIGHTS RESERVED
Measure Life
The measure life is 11 years.233
Secondary Energy Impacts
There are no secondary energy impacts for this measure.
Non-Energy Impacts
Benefit Type Description Savings
Annual Non-Resource See Appendix D: Non-Resource Impacts See Appendix D: Non-Resource Impacts
One-Time Non-Resource See Appendix D: Non-Resource Impacts See Appendix D: Non-Resource Impacts
Impact Factors for Calculating Adjusted Gross Savings
Measure Name Program PA ISR SPF RRE RRSP RRWP CFSP CFWP
Freezer Rebate ES Appliances All 1.00 1.00 1.00 1.00 1.00 1.00 0. 92
In-Service Rates In-service rates are set to 100% based on the assumption that all purchased units are installed. Savings Persistence Factor All PAs use 100% savings persistence factors. Realization Rates Realization rates are based on Massachusetts Common Assumptions. Coincidence Factors Coincidence factors are based on Massachusetts Common Assumptions.
233 Environmental Protection Agency (2011). Life Cycle Cost Estimate for ENERGY STAR Freezer. Accessed 9/7/2011.

Massachusetts Technical Reference Manual Residential Electric Efficiency Measures
October 2011 126 © 2011 Massachusetts Electric and Gas Energy
Efficiency Program Administrators, ALL RIGHTS RESERVED
Refrigeration – Freezers (Retrofit)
Version Date and Revision History
Effective Date: 1/1/2011 End Date: TBD
Measure Overview
Description: This measure covers the replacement of an existing inefficient freezer with a new energy efficient model. Primary Energy Impact: Electric Secondary Energy Impact: None Non-Energy Impact: Low Income only: Annual Discounted Rate Cost Reduction, One-Time Avoided Refrigerator Purchase Sector: Low Income Market: Retrofit End Use: Refrigeration Program: Low-Income 1-4 Family Retrofit, Low-Income Multifamily Retrofit
Algorithms for Calculating Primary Energy Impact
Unit savings are deemed based on study results:
kWhkWh ∆=∆
kWkW ∆=∆ Where: Unit = Removal of existing freezer and installation of new efficient freezer ∆kWh = Average annual kWh savings per unit: 637 kWh234 ∆kW = Max kW Reduction: 0.084 kW 235
Baseline Efficiency
The baseline efficiency case for both the replaced and baseline new freezer is represented by the existing freezer. It is assumed that low-income customers would replace their freezers with a used inefficient unit.
High Efficiency
The high efficiency case is a new high efficiency freezer.
Hours
Not applicable.
234 The Cadmus Group, Inc. (2009). Impact Evaluation of the 2007 Appliance Management Program and Low Income
Weatherization Program. Prepared for National Grid; Page 5, Table 1. 235 Estimated using demand allocation methodology described in: Quantec, LLC (2000). Impact Evaluation: Single-Family
EnergyWise Program. Prepared for National Grid.
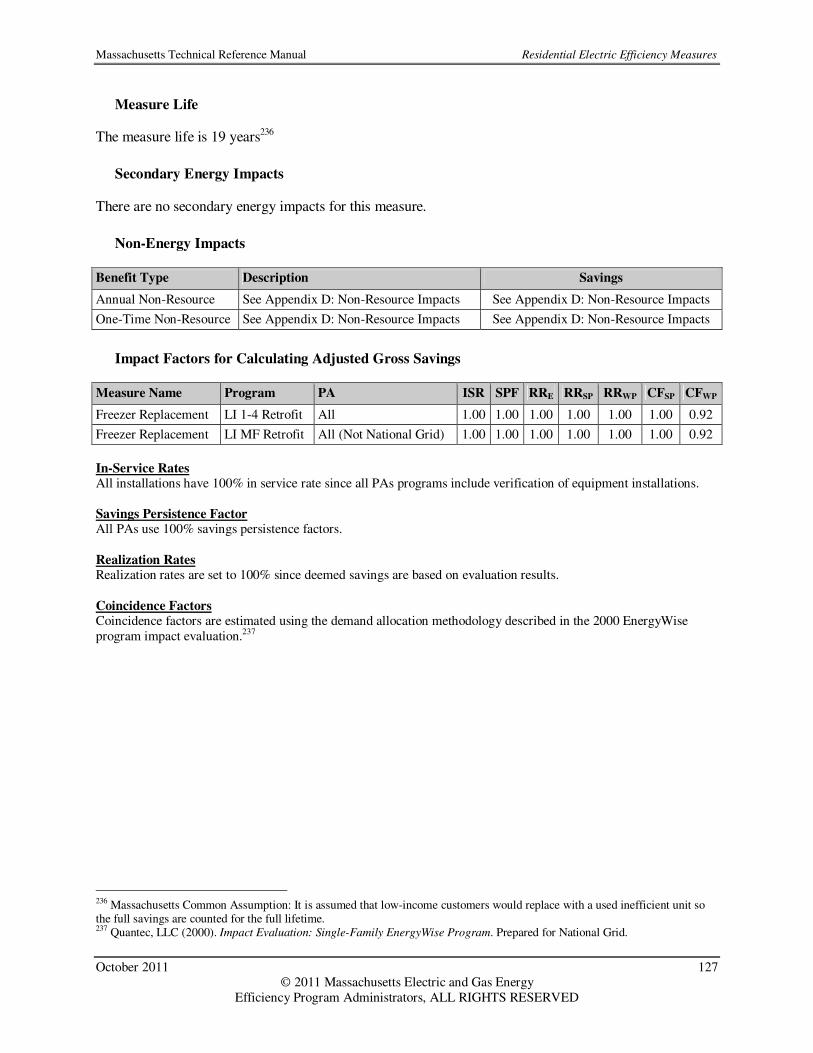
Massachusetts Technical Reference Manual Residential Electric Efficiency Measures
October 2011 127 © 2011 Massachusetts Electric and Gas Energy
Efficiency Program Administrators, ALL RIGHTS RESERVED
Measure Life
The measure life is 19 years236
Secondary Energy Impacts
There are no secondary energy impacts for this measure.
Non-Energy Impacts
Benefit Type Description Savings
Annual Non-Resource See Appendix D: Non-Resource Impacts See Appendix D: Non-Resource Impacts
One-Time Non-Resource See Appendix D: Non-Resource Impacts See Appendix D: Non-Resource Impacts
Impact Factors for Calculating Adjusted Gross Savings
Measure Name Program PA ISR SPF RRE RRSP RRWP CFSP CFWP
Freezer Replacement LI 1-4 Retrofit All 1.00 1.00 1.00 1.00 1.00 1.00 0.92
Freezer Replacement LI MF Retrofit All (Not National Grid) 1.00 1.00 1.00 1.00 1.00 1.00 0.92
In-Service Rates All installations have 100% in service rate since all PAs programs include verification of equipment installations. Savings Persistence Factor All PAs use 100% savings persistence factors. Realization Rates Realization rates are set to 100% since deemed savings are based on evaluation results. Coincidence Factors Coincidence factors are estimated using the demand allocation methodology described in the 2000 EnergyWise program impact evaluation.237
236 Massachusetts Common Assumption: It is assumed that low-income customers would replace with a used inefficient unit so the full savings are counted for the full lifetime. 237 Quantec, LLC (2000). Impact Evaluation: Single-Family EnergyWise Program. Prepared for National Grid.

Massachusetts Technical Reference Manual Residential Electric Efficiency Measures
October 2011 128 © 2011 Massachusetts Electric and Gas Energy
Efficiency Program Administrators, ALL RIGHTS RESERVED
Refrigeration – Refrigerator/Freezer Recycling
Version Date and Revision History
Effective Date: 1/1/2011 End Date: TBD
Measure Overview
Description: The retirement of old, inefficient secondary refrigerators and freezers. Primary Energy Impact: Electric Secondary Energy Impact: None Non-Energy Impact: None Sector: Residential Market: Retrofit End Use: Refrigeration Program: ENERGY STAR Appliances
Algorithms for Calculating Primary Energy Impact
Unit savings are deemed and are obtained from the referenced study.
kWhkWh ∆=∆
8760/kWhkW ∆=∆ Where: Unit = Removed secondary refrigerator or freezer ∆kWh = Average annual kWh savings per unit. See Table 8. ∆kW = Average kW reduction per unit. See Table 8.
Table 8: Savings for Refrigerator/Freezer Recycling Measure Program ∆kW ∆kWh
238
Refrigerator Recycle Primary Energy Star Products 0.061 533
Refrigerator Recycle Secondary Replaced Energy Star Products 0.079 696
Refrigerator Recycle Secondary Not Replaced Energy Start Products 0.095 835
Freezer Recycle Energy Start Products 0.076 663
Refrigerator Recycle (combined) Energy Star Products 0.086 755
Baseline Efficiency
The baseline efficiency case is an old, inefficient secondary working refrigerator or freezer. Estimated average usage is based on combined weight of freezer energy use and refrigerator energy use.
High Efficiency
The high efficiency case assumes no replacement of secondary unit.
238 NMR Group, Inc. (2011). Massachusetts Appliance Turn-In Program Evaluation Integrated Report Findings – FINAL. Prepared for National Grid, NSTAR Electric, Cape Light Compact, and Western Massachusetts Electric Company.

Massachusetts Technical Reference Manual Residential Electric Efficiency Measures
October 2011 129 © 2011 Massachusetts Electric and Gas Energy
Efficiency Program Administrators, ALL RIGHTS RESERVED
Hours
Refrigerator and freezer operating hours are 8,760 hours/year.
Measure Life
The measure life is 8 years.239
Secondary Energy Impacts
There are no secondary energy impacts for this measure.
Non-Energy Impacts
Benefit Type Description Savings
Annual Non-Resource See Appendix D: Non-Resource Impacts See Appendix D: Non-Resource Impacts
One-Time Non-Resource See Appendix D: Non-Resource Impacts See Appendix D: Non-Resource Impacts
Impact Factors for Calculating Adjusted Gross Savings
Measure Name Program PA ISR SPF RRE RRSP RRWP CFSP CFWP
Refrigerator Recycling ES Appliances All 1.00 1.00 1.00 1.00 1.00 1.00 0.92
Freezer Recycling ES Appliances All 1.00 1.00 1.00 1.00 1.00 1.00 0.92
In-Service Rates All installations have 100% in service rate since all PAs programs include verification of equipment installations. Savings Persistence Factor All PAs use 100% savings persistence factors.
Realization Rates Realization rates are based on Massachusetts Common Assumptions. Coincidence Factors Coincidence factors are based on Massachusetts Common Assumptions.
239 Ibid.

Massachusetts Technical Reference Manual Residential Electric Efficiency Measures
October 2011 130 © 2011 Massachusetts Electric and Gas Energy
Efficiency Program Administrators, ALL RIGHTS RESERVED
Refrigeration – Appliance Removal
Version Date and Revision History
Effective Date: 1/1/2011 End Date: TBD
Measure Overview
Description: Removal of second working refrigerator or freezer. Primary Energy Impact: Electric Secondary Energy Impact: None Non-Energy Impact: Annual Discounted Rate Cost Reduction Sector: Low Income Market: Retrofit End Use: Refrigeration Program: Low-Income 1-4 Family Retrofit
Algorithms for Calculating Primary Energy Impact
Unit savings are deemed based on study results:
kWhkWh ∆=∆
kWkW ∆=∆ Where: Unit = Removal of secondary refrigerator or freezer with no replacement ∆kWh = Average annual kWh savings per unit: 1,321 kWh240 ∆kW = Max kW reduction: 0.174 kW 241
Baseline Efficiency
The baseline efficiency case is the old, inefficient secondary working refrigerator or freezer.
High Efficiency
The high efficiency case assumes no replacement of secondary unit.
Hours
Not applicable.
240 The Cadmus Group, Inc. (2009). Impact Evaluation of the 2007 Appliance Management Program and Low Income
Weatherization Program. Prepared for National Grid; average of refrigerator and freezer removal, Table 15. 241 Estimated using demand allocation methodology described in: Quantec, LLC (2000). Impact Evaluation: Single-Family
EnergyWise Program. Prepared for National Grid.

Massachusetts Technical Reference Manual Residential Electric Efficiency Measures
October 2011 131 © 2011 Massachusetts Electric and Gas Energy
Efficiency Program Administrators, ALL RIGHTS RESERVED
Measure Life
The measure life is 5 years.242
Secondary Energy Impacts
There are no secondary energy impacts for this measure.
Non-Energy Impacts
Benefit Type Description Savings
Annual Non-Resource See Appendix D: Non-Resource Impacts See Appendix D: Non-Resource Impacts
One-Time Non-Resource See Appendix D: Non-Resource Impacts See Appendix D: Non-Resource Impacts
Impact Factors for Calculating Adjusted Gross Savings
Measure Name Program PA ISR SPF RRE RRSP RRWP CFSP CFWP
Appliance Removal LI 1-4 Retrofit All 1.00 1.00 1.00 1.00 1.00 1.00 0.92
In-Service Rates All installations have 100% in service rate since all PAs programs include verification of equipment installations. Savings Persistence Factor All PAs use 100% savings persistence factors. Realization Rates Realization rates are set to 100% since deemed savings are based on evaluation results. Coincidence Factors Coincidence factors are estimated using the demand allocation methodology described in the 2000 EnergyWise program impact evaluation.243
242 Massachusetts Common Assumption. 243 Quantec, LLC (2000). Impact Evaluation: Single-Family EnergyWise Program. Prepared for National Grid.

Massachusetts Technical Reference Manual Residential Electric Efficiency Measures
October 2011 132 © 2011 Massachusetts Electric and Gas Energy
Efficiency Program Administrators, ALL RIGHTS RESERVED
ENERGY STAR® Homes – Heating, Cooling, and DHW Measures
Version Date and Revision History
Effective Date: 1/1/2011 End Date: TBD
Measure Overview
Description: To capture lost opportunities, encourage the construction of energy-efficient homes, and drive the market to one in which new homes are moving towards net-zero energy. Primary Energy Impact: Electric Secondary Energy Impact: Natural Gas, Oil, Propane Non-Energy Impact: Annual Discounted Rate Cost Reduction (Low Income only) Sector: Residential, Low Income Market: Lost Opportunity End Use: HVAC, Hot Water Program: Residential New Construction & Major Renovation, Low-Income Residential New Construction
Algorithms for Calculating Primary Energy Impact
As part of the ENERGY STAR® certification process, projected energy use is calculated for each home completed through the program and a geometrically matching baseline home (User Defined Reference Home) using Beacon, an ICF International proprietary DOE-2 based building energy simulation tool. The difference between the projected energy consumption of these two homes represents the energy savings produced by the certified home. This process is used to calculate electric demand as well as electric and fossil fuel energy savings due to heating, cooling, and water heating for all homes, both single family and multifamily. This process is documented in “Energy/Demand Savings Calculation and Reporting Methodology for the Massachusetts ENERGY STAR® Homes Program.”244
Baseline Efficiency
The User Defined Reference Home was revised for 2006 as a result of the baseline study completed in 2006.245 246
High Efficiency
The high efficiency case is represented by the specific energy characteristics of each “as-built” home completed through the program.
244 ICF International (2008). Energy/Demand Savings Calculation and Reporting Methodology for the Massachusetts ENERGY
STAR ® Homes Program. Prepared for Joint Management Committee. 245 Nexus Market Research & Dorothy Conant (2006). Massachusetts ENERGY STAR® Homes: 2005 Baseline Study: Part I:
Inspection Data Analysis Final Report. Prepared for the Massachusetts Joint Management Committee. 246 Nexus Market Research & Dorothy Conant (2006). Massachusetts ENERGY STAR® Homes: 2005 Baseline Study: Part II:
Homeowner Survey Analysis Incorporating Inspection Data Final Report. Prepared for the Massachusetts Joint Management Committee.
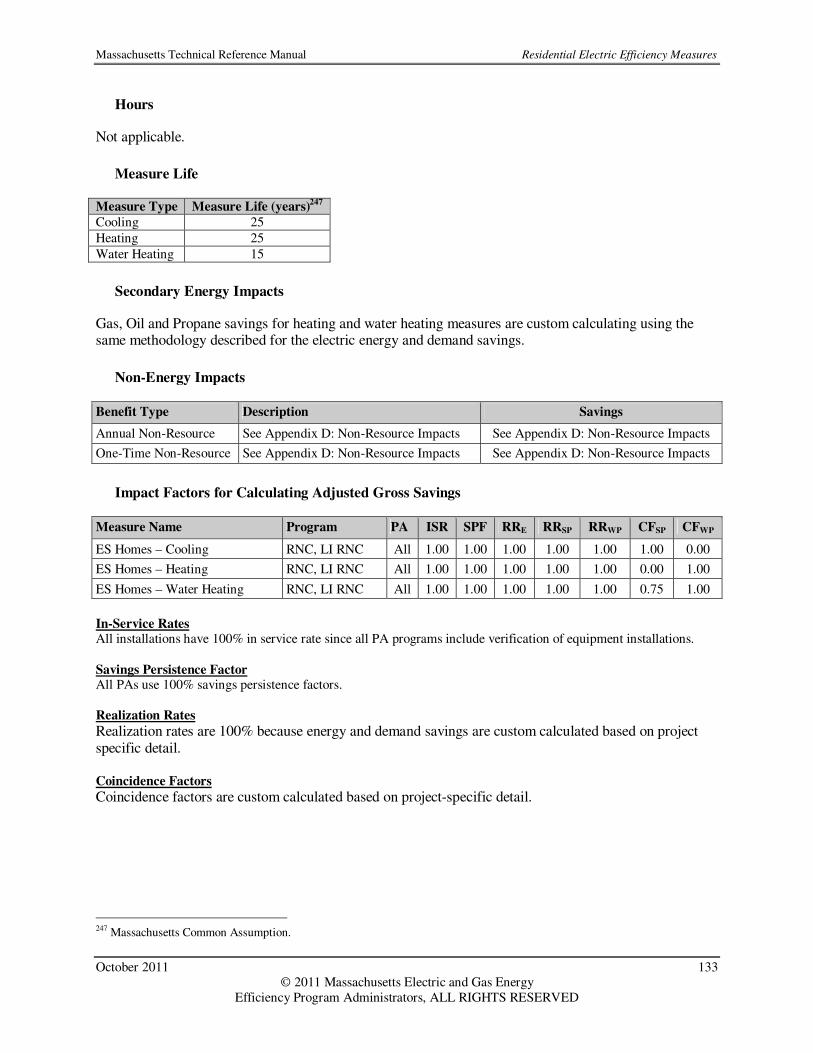
Massachusetts Technical Reference Manual Residential Electric Efficiency Measures
October 2011 133 © 2011 Massachusetts Electric and Gas Energy
Efficiency Program Administrators, ALL RIGHTS RESERVED
Hours
Not applicable.
Measure Life
Measure Type Measure Life (years)247
Cooling 25
Heating 25
Water Heating 15
Secondary Energy Impacts
Gas, Oil and Propane savings for heating and water heating measures are custom calculating using the same methodology described for the electric energy and demand savings.
Non-Energy Impacts
Benefit Type Description Savings
Annual Non-Resource See Appendix D: Non-Resource Impacts See Appendix D: Non-Resource Impacts
One-Time Non-Resource See Appendix D: Non-Resource Impacts See Appendix D: Non-Resource Impacts
Impact Factors for Calculating Adjusted Gross Savings
Measure Name Program PA ISR SPF RRE RRSP RRWP CFSP CFWP
ES Homes – Cooling RNC, LI RNC All 1.00 1.00 1.00 1.00 1.00 1.00 0.00
ES Homes – Heating RNC, LI RNC All 1.00 1.00 1.00 1.00 1.00 0.00 1.00
ES Homes – Water Heating RNC, LI RNC All 1.00 1.00 1.00 1.00 1.00 0.75 1.00
In-Service Rates All installations have 100% in service rate since all PA programs include verification of equipment installations. Savings Persistence Factor All PAs use 100% savings persistence factors. Realization Rates
Realization rates are 100% because energy and demand savings are custom calculated based on project specific detail. Coincidence Factors
Coincidence factors are custom calculated based on project-specific detail.
247 Massachusetts Common Assumption.
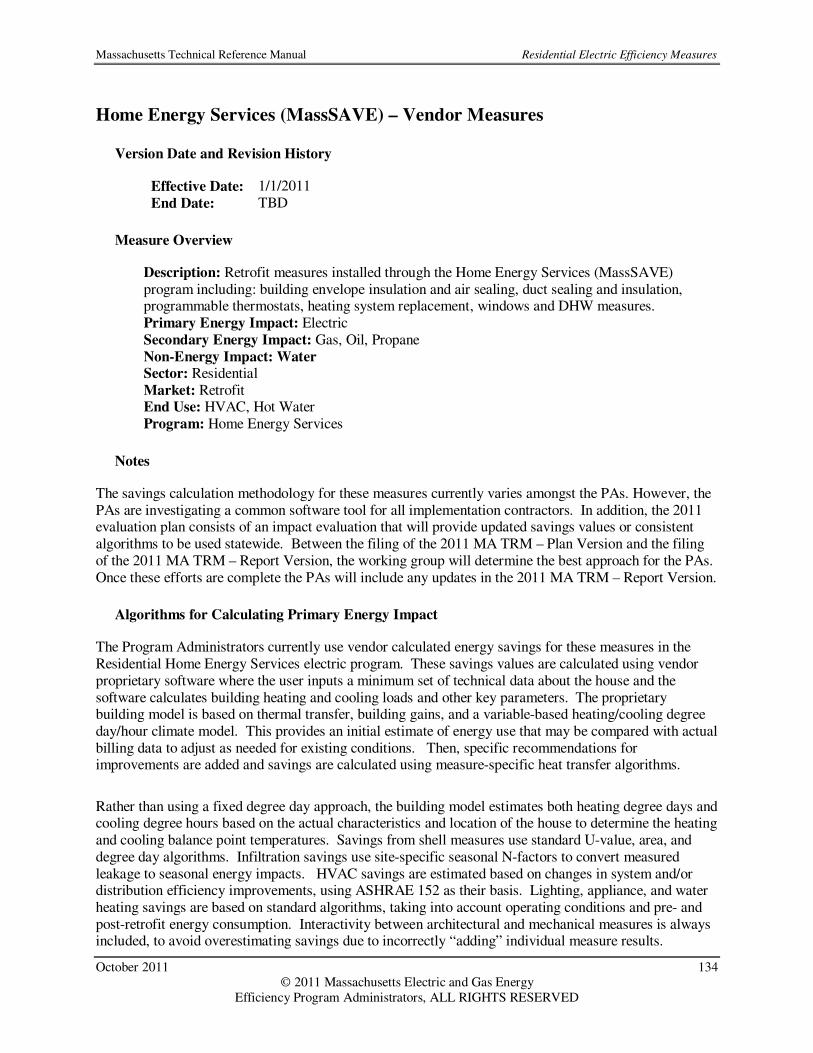
Massachusetts Technical Reference Manual Residential Electric Efficiency Measures
October 2011 134 © 2011 Massachusetts Electric and Gas Energy
Efficiency Program Administrators, ALL RIGHTS RESERVED
Home Energy Services (MassSAVE) – Vendor Measures
Version Date and Revision History
Effective Date: 1/1/2011 End Date: TBD
Measure Overview
Description: Retrofit measures installed through the Home Energy Services (MassSAVE) program including: building envelope insulation and air sealing, duct sealing and insulation, programmable thermostats, heating system replacement, windows and DHW measures. Primary Energy Impact: Electric Secondary Energy Impact: Gas, Oil, Propane Non-Energy Impact: Water Sector: Residential Market: Retrofit End Use: HVAC, Hot Water Program: Home Energy Services
Notes
The savings calculation methodology for these measures currently varies amongst the PAs. However, the PAs are investigating a common software tool for all implementation contractors. In addition, the 2011 evaluation plan consists of an impact evaluation that will provide updated savings values or consistent algorithms to be used statewide. Between the filing of the 2011 MA TRM – Plan Version and the filing of the 2011 MA TRM – Report Version, the working group will determine the best approach for the PAs. Once these efforts are complete the PAs will include any updates in the 2011 MA TRM – Report Version.
Algorithms for Calculating Primary Energy Impact
The Program Administrators currently use vendor calculated energy savings for these measures in the Residential Home Energy Services electric program. These savings values are calculated using vendor proprietary software where the user inputs a minimum set of technical data about the house and the software calculates building heating and cooling loads and other key parameters. The proprietary building model is based on thermal transfer, building gains, and a variable-based heating/cooling degree day/hour climate model. This provides an initial estimate of energy use that may be compared with actual billing data to adjust as needed for existing conditions. Then, specific recommendations for improvements are added and savings are calculated using measure-specific heat transfer algorithms.
Rather than using a fixed degree day approach, the building model estimates both heating degree days and cooling degree hours based on the actual characteristics and location of the house to determine the heating and cooling balance point temperatures. Savings from shell measures use standard U-value, area, and degree day algorithms. Infiltration savings use site-specific seasonal N-factors to convert measured leakage to seasonal energy impacts. HVAC savings are estimated based on changes in system and/or distribution efficiency improvements, using ASHRAE 152 as their basis. Lighting, appliance, and water heating savings are based on standard algorithms, taking into account operating conditions and pre- and post-retrofit energy consumption. Interactivity between architectural and mechanical measures is always included, to avoid overestimating savings due to incorrectly “adding” individual measure results.
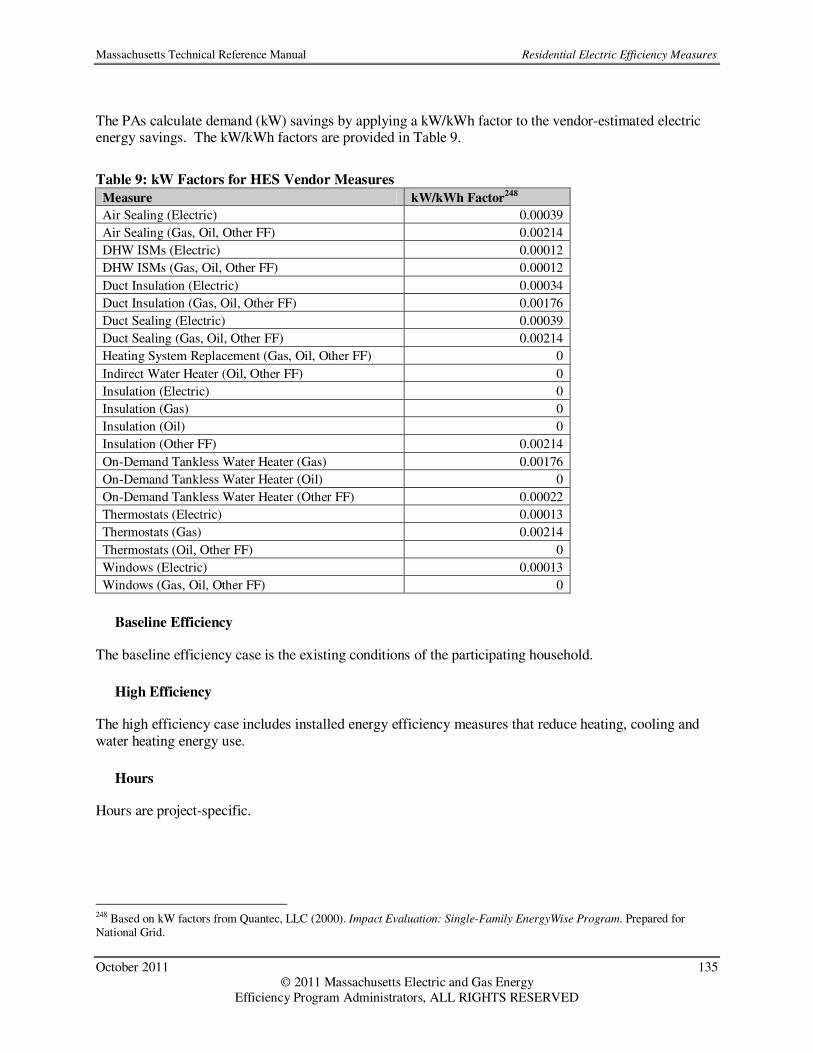
Massachusetts Technical Reference Manual Residential Electric Efficiency Measures
October 2011 135 © 2011 Massachusetts Electric and Gas Energy
Efficiency Program Administrators, ALL RIGHTS RESERVED
The PAs calculate demand (kW) savings by applying a kW/kWh factor to the vendor-estimated electric energy savings. The kW/kWh factors are provided in Table 9.
Table 9: kW Factors for HES Vendor Measures
Measure kW/kWh Factor248
Air Sealing (Electric) 0.00039
Air Sealing (Gas, Oil, Other FF) 0.00214
DHW ISMs (Electric) 0.00012
DHW ISMs (Gas, Oil, Other FF) 0.00012
Duct Insulation (Electric) 0.00034
Duct Insulation (Gas, Oil, Other FF) 0.00176
Duct Sealing (Electric) 0.00039
Duct Sealing (Gas, Oil, Other FF) 0.00214
Heating System Replacement (Gas, Oil, Other FF) 0
Indirect Water Heater (Oil, Other FF) 0
Insulation (Electric) 0
Insulation (Gas) 0
Insulation (Oil) 0
Insulation (Other FF) 0.00214
On-Demand Tankless Water Heater (Gas) 0.00176
On-Demand Tankless Water Heater (Oil) 0
On-Demand Tankless Water Heater (Other FF) 0.00022
Thermostats (Electric) 0.00013
Thermostats (Gas) 0.00214
Thermostats (Oil, Other FF) 0
Windows (Electric) 0.00013
Windows (Gas, Oil, Other FF) 0
Baseline Efficiency
The baseline efficiency case is the existing conditions of the participating household.
High Efficiency
The high efficiency case includes installed energy efficiency measures that reduce heating, cooling and water heating energy use.
Hours
Hours are project-specific.
248 Based on kW factors from Quantec, LLC (2000). Impact Evaluation: Single-Family EnergyWise Program. Prepared for National Grid.
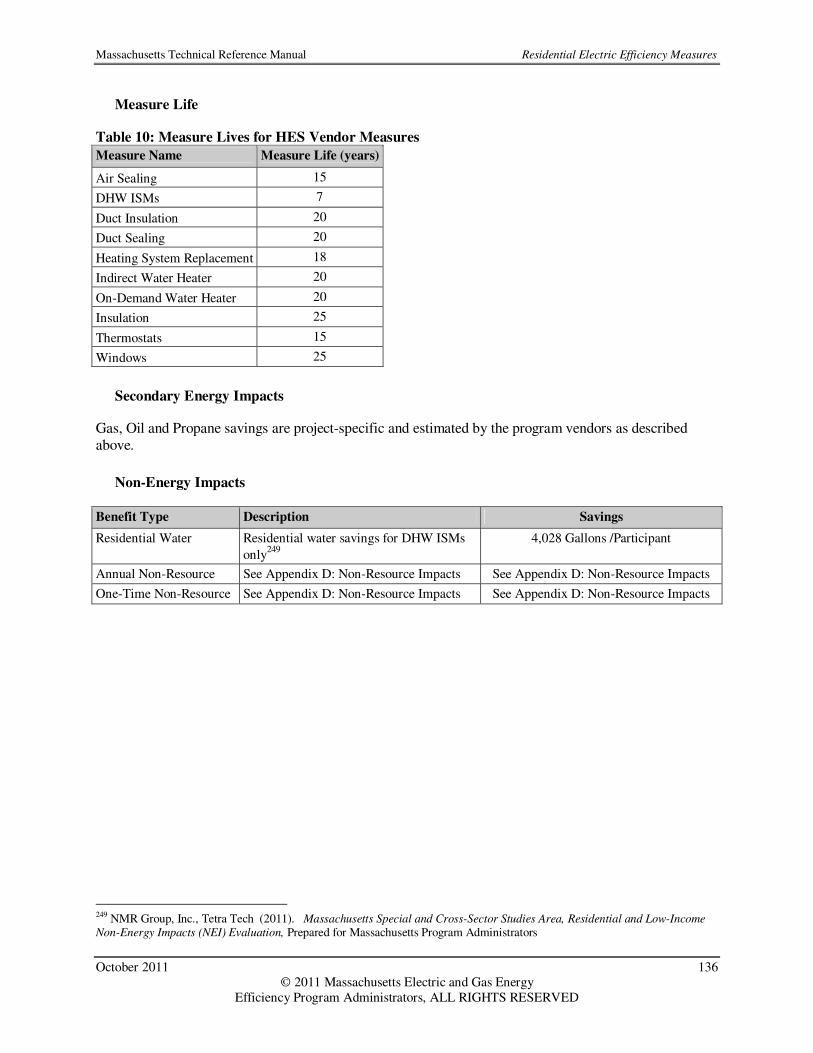
Massachusetts Technical Reference Manual Residential Electric Efficiency Measures
October 2011 136 © 2011 Massachusetts Electric and Gas Energy
Efficiency Program Administrators, ALL RIGHTS RESERVED
Measure Life
Table 10: Measure Lives for HES Vendor Measures
Measure Name Measure Life (years)
Air Sealing 15
DHW ISMs 7
Duct Insulation 20
Duct Sealing 20
Heating System Replacement 18
Indirect Water Heater 20
On-Demand Water Heater 20
Insulation 25
Thermostats 15
Windows 25
Secondary Energy Impacts
Gas, Oil and Propane savings are project-specific and estimated by the program vendors as described above.
Non-Energy Impacts
Benefit Type Description Savings
Residential Water Residential water savings for DHW ISMs
only249
4,028 Gallons /Participant
Annual Non-Resource See Appendix D: Non-Resource Impacts See Appendix D: Non-Resource Impacts
One-Time Non-Resource See Appendix D: Non-Resource Impacts See Appendix D: Non-Resource Impacts
249 NMR Group, Inc., Tetra Tech (2011). Massachusetts Special and Cross-Sector Studies Area, Residential and Low-Income
Non-Energy Impacts (NEI) Evaluation, Prepared for Massachusetts Program Administrators
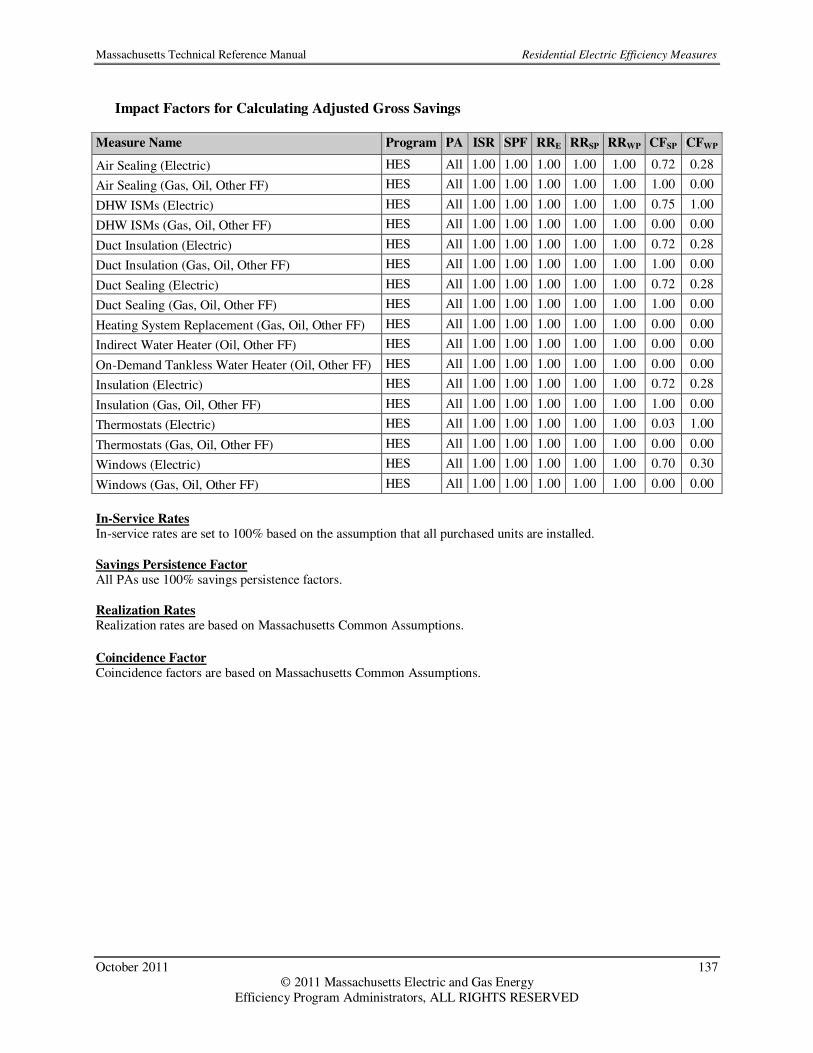
Massachusetts Technical Reference Manual Residential Electric Efficiency Measures
October 2011 137 © 2011 Massachusetts Electric and Gas Energy
Efficiency Program Administrators, ALL RIGHTS RESERVED
Impact Factors for Calculating Adjusted Gross Savings
Measure Name Program PA ISR SPF RRE RRSP RRWP CFSP CFWP
Air Sealing (Electric) HES All 1.00 1.00 1.00 1.00 1.00 0.72 0.28
Air Sealing (Gas, Oil, Other FF) HES All 1.00 1.00 1.00 1.00 1.00 1.00 0.00
DHW ISMs (Electric) HES All 1.00 1.00 1.00 1.00 1.00 0.75 1.00
DHW ISMs (Gas, Oil, Other FF) HES All 1.00 1.00 1.00 1.00 1.00 0.00 0.00
Duct Insulation (Electric) HES All 1.00 1.00 1.00 1.00 1.00 0.72 0.28
Duct Insulation (Gas, Oil, Other FF) HES All 1.00 1.00 1.00 1.00 1.00 1.00 0.00
Duct Sealing (Electric) HES All 1.00 1.00 1.00 1.00 1.00 0.72 0.28
Duct Sealing (Gas, Oil, Other FF) HES All 1.00 1.00 1.00 1.00 1.00 1.00 0.00
Heating System Replacement (Gas, Oil, Other FF) HES All 1.00 1.00 1.00 1.00 1.00 0.00 0.00
Indirect Water Heater (Oil, Other FF) HES All 1.00 1.00 1.00 1.00 1.00 0.00 0.00
On-Demand Tankless Water Heater (Oil, Other FF) HES All 1.00 1.00 1.00 1.00 1.00 0.00 0.00
Insulation (Electric) HES All 1.00 1.00 1.00 1.00 1.00 0.72 0.28
Insulation (Gas, Oil, Other FF) HES All 1.00 1.00 1.00 1.00 1.00 1.00 0.00
Thermostats (Electric) HES All 1.00 1.00 1.00 1.00 1.00 0.03 1.00
Thermostats (Gas, Oil, Other FF) HES All 1.00 1.00 1.00 1.00 1.00 0.00 0.00
Windows (Electric) HES All 1.00 1.00 1.00 1.00 1.00 0.70 0.30
Windows (Gas, Oil, Other FF) HES All 1.00 1.00 1.00 1.00 1.00 0.00 0.00
In-Service Rates In-service rates are set to 100% based on the assumption that all purchased units are installed. Savings Persistence Factor All PAs use 100% savings persistence factors. Realization Rates Realization rates are based on Massachusetts Common Assumptions.
Coincidence Factor Coincidence factors are based on Massachusetts Common Assumptions.

Massachusetts Technical Reference Manual Residential Electric Efficiency Measures
October 2011 138 © 2011 Massachusetts Electric and Gas Energy
Efficiency Program Administrators, ALL RIGHTS RESERVED
Multifamily – Vendor Measures
Version Date and Revision History
Effective Date: 1/1/2011 (revised for 1/1/2012) End Date: TBD
Measure Overview
Description: Retrofit measures installed through the PAs Multi-Family programs including: building envelope insulation and air sealing, duct sealing and insulation, programmable thermostats, heating system replacement, windows and DHW measures. Primary Energy Impact: Electric Secondary Energy Impact: Gas, Oil, Propane Non-Energy Impact: Residential Water Sector: Residential Market: Retrofit End Use: HVAC, Hot Water Program: Multi-Family Retrofit
Notes
The savings calculation methodology for these measures currently varies amongst the PAs. However, the PAs are investigating opportunities to align their program offerings and savings calculation assumptions and methodologies. In addition, the 2011 evaluation plan consists of an impact evaluation which will provide updated savings values or consistent algorithms to be used statewide. Between the filing of the 2011 MA TRM – Plan Version and the filing of the 2011 MA TRM – Report Version, the working group will determine the best approach for the PAs. Once these efforts are complete the PAs will include any updates in the 2011 MA TRM – Report Version. This section applies to Cape Light Compact, NSTAR, Unitil, and Western Massachusetts Electric Company multi-family programs. The algorithms and assumptions for similar measures in National
Grid’s residential and low-income multi-family programs are described in the other Multifamily measure
sections.
Algorithms for Calculating Primary Energy Impact
The Program Administrators currently use vendor calculated savings for these measures in the Residential Multifamily Retrofit programs for standard income residential customers. These savings values are calculated using vendor proprietary software where the user inputs a minimum set of technical data about the house and the software calculates building heating and cooling loads and other key parameters. The proprietary building model is based on thermal transfer, building gains, and a variable-based heating/cooling degree day/hour climate model. This provides an initial estimate of energy use that may be compared with actual billing data to adjust as needed for existing conditions. Then, specific recommendations for improvements are added, and savings are calculated using measure-specific heat transfer algorithms.
Rather than using a fixed degree day approach, the building model estimates both heating degree days and cooling degree hours based on the actual characteristics and location of the house to determine the heating

Massachusetts Technical Reference Manual Residential Electric Efficiency Measures
October 2011 139 © 2011 Massachusetts Electric and Gas Energy
Efficiency Program Administrators, ALL RIGHTS RESERVED
and cooling balance point temperatures. Savings from shell measures use standard U-value, area, and degree day algorithms. Infiltration savings use site-specific seasonal N-factors to convert measured leakage to seasonal energy impacts. HVAC savings are estimated based on changes in system and/or distribution efficiency improvements, using ASHRAE 152 as their basis. Lighting, appliance, and water heating savings are based on standard algorithms, taking into account operating conditions and pre- and post-retrofit energy consumption. Interactivity between architectural and mechanical measures is always included, to avoid overestimating savings due to incorrectly “adding” individual measure results.
Baseline Efficiency
The baseline efficiency case is the existing conditions of the participating facility.
High Efficiency
The high efficiency case includes installed energy efficiency measures that reduce heating, cooling and water heating energy use.
Hours
Hours are project-specific.
Measure Life
Measure Name Measure Life (years)
Air Sealing 15
DHW Measures 7
Insulation 25
Thermostats 15
Secondary Energy Impacts
Gas, Oil and Propane savings are project-specific.
Non-Energy Impacts
Benefit Type Description Savings
Residential Water Residential water savings for DHW
measures250
4,028 Gallons /Participant
Annual Non-Resource See Appendix D: Non-Resource Impacts See Appendix D: Non-Resource Impacts
One-Time Non-Resource See Appendix D: Non-Resource Impacts See Appendix D: Non-Resource Impacts
250 NMR Group, Inc., Tetra Tech (2011). Massachusetts Special and Cross-Sector Studies Area, Residential and Low-Income
Non-Energy Impacts (NEI) Evaluation, Prepared for Massachusetts Program Administrators

Massachusetts Technical Reference Manual Residential Electric Efficiency Measures
October 2011 140 © 2011 Massachusetts Electric and Gas Energy
Efficiency Program Administrators, ALL RIGHTS RESERVED
Impact Factors for Calculating Adjusted Gross Savings
Measure Name Program PA ISR SPF RRE RRSP RRWP CFSP CFWP
Air Sealing (Electric) MF Retrofit All (not National Grid) 1.00 1.00 1.00 1.00 1.00 0.75 1.00
Air Sealing (FF) MF Retrofit All (not National Grid) 1.00 1.00 1.00 1.00 1.00 0.47 0.53
DHW Measures (Electric) MF Retrofit All (not National Grid) 1.00 1.00 1.00 1.00 1.00 0.75 1.00
DHW Measures (FF) MF Retrofit All (not National Grid) 1.00 1.00 1.00 1.00 1.00 0.75 1.00
Insulation (Electric) MF Retrofit All (not National Grid) 1.00 1.00 1.00 1.00 1.00 0.47 0.53
Insulation (FF) MF Retrofit All (not National Grid) 1.00 1.00 1.00 1.00 1.00 0.47 0.53
Thermostats (Electric) MF Retrofit All (not National Grid) 1.00 1.00 1.00 1.00 1.00 0.66 0.50
Thermostats (FF) MF Retrofit All (not National Grid) 1.00 1.00 1.00 1.00 1.00 0.00 0.00
In-Service Rates In-service rates are set to 100% based on the assumption that all purchased units are installed. Savings Persistence Factor All PAs use 100% savings persistence factors. Realization Rates Realization rates are set to 100% since this program has not been evaluated and similar evaluation support this
assumption.251
Coincidence Factor Coincidence factors are based on Massachusetts Common Assumptions.
251 Massachusetts Common Assumption: Assumed 100% realization rate is supported by the results of multiple impact evaluations of National Grid’s EnergyWise program.

Massachusetts Technical Reference Manual Residential Electric Efficiency Measures
October 2011 141 © 2011 Massachusetts Electric and Gas Energy
Efficiency Program Administrators, ALL RIGHTS RESERVED
Multifamily – Insulation (Walls, Roof, Floor) (National Grid)
Version Date and Revision History
Effective Date: 1/1/2011 End Date: TBD
Measure Overview
Description: Insulation upgrades are applied in existing facilities. Primary Energy Impact: Electric Secondary Energy Impact: None Non-Energy Impact: Low-Income Annual Discounted Rate Cost Reduction; Low-Income Annual Fire, Illness and Moving Avoidance Benefits; Low-Income One-Time Property Value Benefit Sector: Residential, Low Income Market: Retrofit End Use: HVAC Program: Multi-Family Retrofit, Low-Income Multifamily Retrofit
Notes
The savings algorithms and assumptions described in this section are specific to National Grid’s Multi-Family Retrofit and Low-Income Multifamily Retrofit programs. See Multifamily – Vendor Measures for information about other PAs’ Multi-Family programs.
Algorithms for Calculating Primary Energy Impact
−−
−××=∆
EEBASE VALUERVALUERSQFTkWhSQFTkWh
11/
kWhkWkWhkW /×∆=∆ Where: SQFT = Square feet of insulation installed R-VALUEBASE = R-Value of the existing insulation R-VALUEEE = R-Value of the new installed insulation kWh/SQFT = Average annual kWh reduction per SQFT of insulation. See Table below. kW/kWh = Average annual kW reduction per kWh reduction: 0.000125 kW/kWh252 Insulation Type kWh/Sqft
253
Basement 10.62 Attic 38.803 WALL (N, S) 11.477 WALL (W, E) 10.025
252 Estimated using demand allocation methodology described in: Quantec, LLC (2000). Impact Evaluation: Single-Family
EnergyWise Program. Prepared for National Grid. 253 National Grid Multifamily Screening Tool. This was developed in the early 1990’s. Documentation of the specific variables is unavailable. Evaluation results have consistently shown realization rates close to 100%.
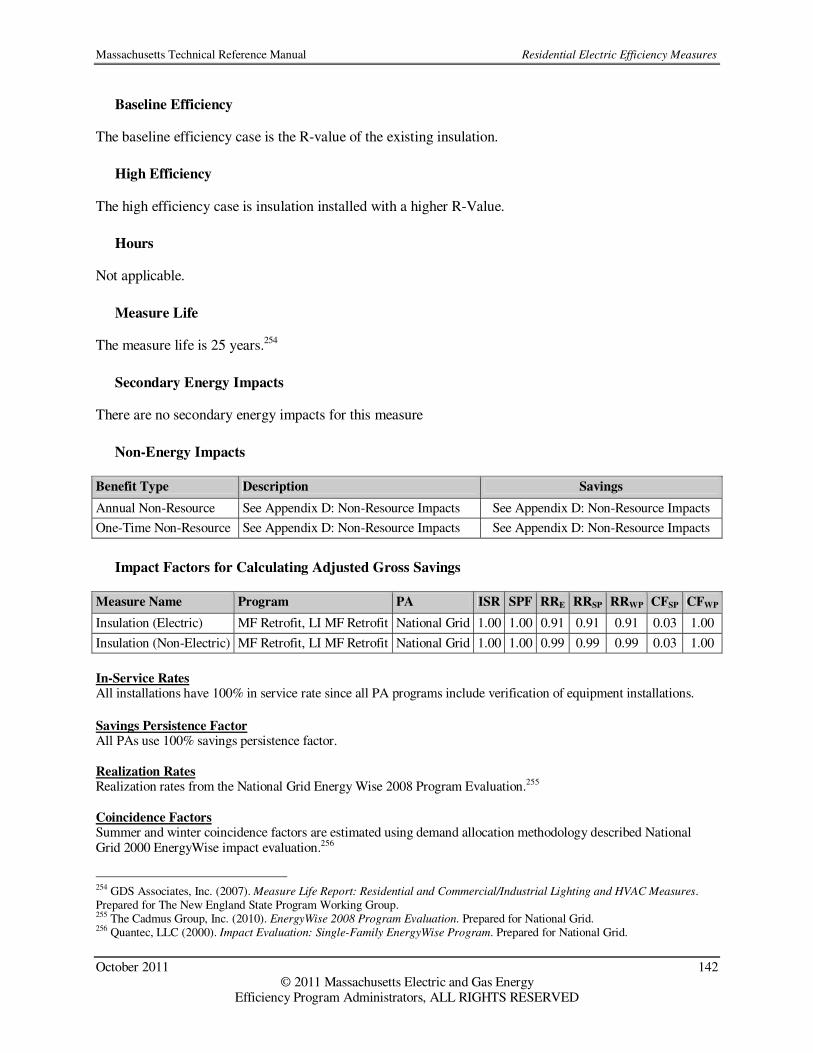
Massachusetts Technical Reference Manual Residential Electric Efficiency Measures
October 2011 142 © 2011 Massachusetts Electric and Gas Energy
Efficiency Program Administrators, ALL RIGHTS RESERVED
Baseline Efficiency
The baseline efficiency case is the R-value of the existing insulation.
High Efficiency
The high efficiency case is insulation installed with a higher R-Value.
Hours
Not applicable.
Measure Life
The measure life is 25 years.254
Secondary Energy Impacts
There are no secondary energy impacts for this measure
Non-Energy Impacts
Benefit Type Description Savings
Annual Non-Resource See Appendix D: Non-Resource Impacts See Appendix D: Non-Resource Impacts
One-Time Non-Resource See Appendix D: Non-Resource Impacts See Appendix D: Non-Resource Impacts
Impact Factors for Calculating Adjusted Gross Savings
Measure Name Program PA ISR SPF RRE RRSP RRWP CFSP CFWP
Insulation (Electric) MF Retrofit, LI MF Retrofit National Grid 1.00 1.00 0.91 0.91 0.91 0.03 1.00
Insulation (Non-Electric) MF Retrofit, LI MF Retrofit National Grid 1.00 1.00 0.99 0.99 0.99 0.03 1.00
In-Service Rates All installations have 100% in service rate since all PA programs include verification of equipment installations. Savings Persistence Factor All PAs use 100% savings persistence factor. Realization Rates Realization rates from the National Grid Energy Wise 2008 Program Evaluation.255
Coincidence Factors Summer and winter coincidence factors are estimated using demand allocation methodology described National Grid 2000 EnergyWise impact evaluation.256
254 GDS Associates, Inc. (2007). Measure Life Report: Residential and Commercial/Industrial Lighting and HVAC Measures. Prepared for The New England State Program Working Group. 255 The Cadmus Group, Inc. (2010). EnergyWise 2008 Program Evaluation. Prepared for National Grid. 256 Quantec, LLC (2000). Impact Evaluation: Single-Family EnergyWise Program. Prepared for National Grid.

Massachusetts Technical Reference Manual Residential Electric Efficiency Measures
October 2011 143 © 2011 Massachusetts Electric and Gas Energy
Efficiency Program Administrators, ALL RIGHTS RESERVED
Multifamily – DHW Measures (Showerheads and Aerators) (National Grid)
Version Date and Revision History
Effective Date: 1/1/2011 End Date: TBD
Measure Overview
Description: An existing showerhead or aerator with a high flow rate is replaced with a new low flow showerhead or aerator. Primary Energy Impact: Electric Secondary Energy Impact: None Non-Energy Impact: Residential Water, Low-Income Annual Discounted Rate Cost Reduction Sector: Residential, Low Income Market: Retrofit End Use: Hot Water Program: Multi-Family Retrofit, Low-Income Multifamily Retrofit
Notes
The savings algorithms and assumptions described in this section are specific to National Grid’s Multi-Family Retrofit and Low-Income Multifamily Retrofit programs. See the section Multifamily – Vendor
Measures for information about other PAs’ Multi-Family programs.
Algorithms for Calculating Primary Energy Impact
Unit savings are deemed based on study results:
kWhkWh ∆=∆
kWhkWkWhkW /×∆=∆
Unit = Showerhead or aerator installation. ∆kWh = Average annual kWh reduction per unit: 80.3 kWh257 kW/kWh = Average kW reduction per kWh reduction: 0.000125 kW/kWh258
Baseline Efficiency
The baseline efficiency case is an existing shower head or faucet aerator with a high flow.
High Efficiency
High efficiency is a low flow showerhead or faucet aerator.
257 National Grid Multifamily Screening Tool. This was developed in the early 1990’s. Documentation of the specific variables is unavailable. Evaluation results have consistently shown realization rates close to 100%. 258 Estimated using demand allocation methodology described in: Quantec, LLC (2000). Impact Evaluation: Single-Family
EnergyWise Program. Prepared for National Grid.
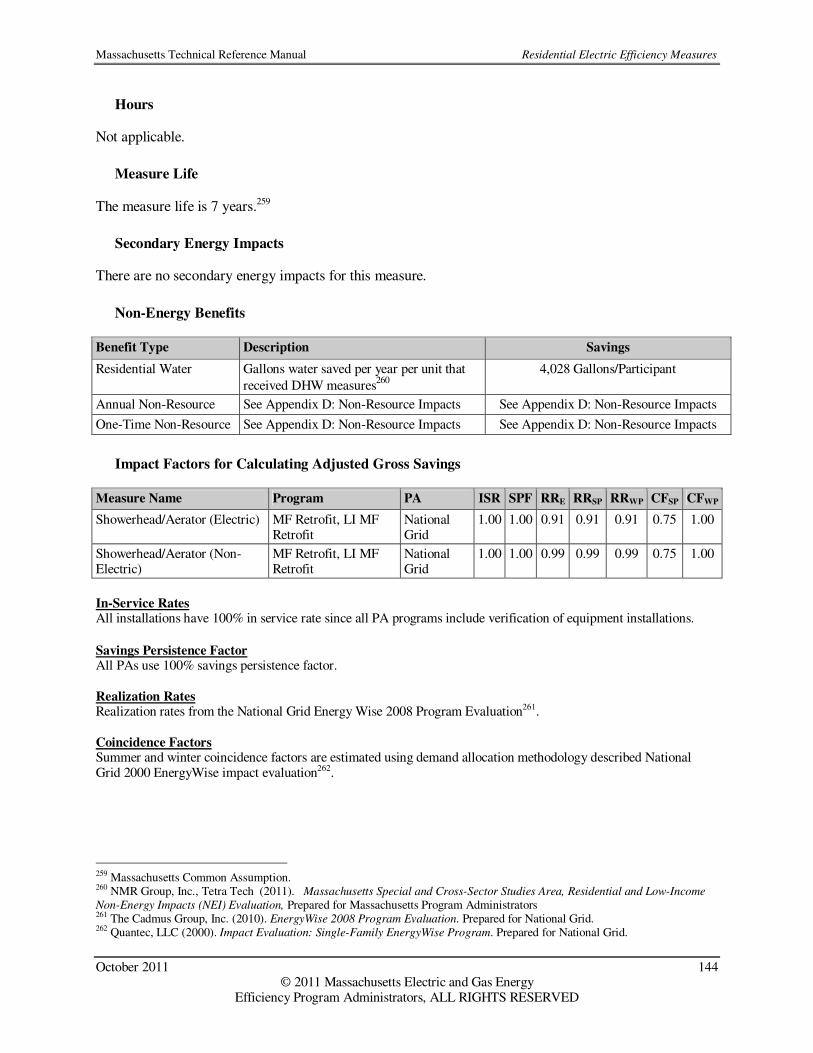
Massachusetts Technical Reference Manual Residential Electric Efficiency Measures
October 2011 144 © 2011 Massachusetts Electric and Gas Energy
Efficiency Program Administrators, ALL RIGHTS RESERVED
Hours
Not applicable.
Measure Life
The measure life is 7 years.259
Secondary Energy Impacts
There are no secondary energy impacts for this measure.
Non-Energy Benefits
Benefit Type Description Savings
Residential Water Gallons water saved per year per unit that
received DHW measures260
4,028 Gallons/Participant
Annual Non-Resource See Appendix D: Non-Resource Impacts See Appendix D: Non-Resource Impacts
One-Time Non-Resource See Appendix D: Non-Resource Impacts See Appendix D: Non-Resource Impacts
Impact Factors for Calculating Adjusted Gross Savings
Measure Name Program PA ISR SPF RRE RRSP RRWP CFSP CFWP
Showerhead/Aerator (Electric) MF Retrofit, LI MF Retrofit
National Grid
1.00 1.00 0.91 0.91 0.91 0.75 1.00
Showerhead/Aerator (Non-Electric)
MF Retrofit, LI MF Retrofit
National Grid
1.00 1.00 0.99 0.99 0.99 0.75 1.00
In-Service Rates All installations have 100% in service rate since all PA programs include verification of equipment installations. Savings Persistence Factor All PAs use 100% savings persistence factor. Realization Rates Realization rates from the National Grid Energy Wise 2008 Program Evaluation261. Coincidence Factors Summer and winter coincidence factors are estimated using demand allocation methodology described National Grid 2000 EnergyWise impact evaluation262.
259 Massachusetts Common Assumption. 260 NMR Group, Inc., Tetra Tech (2011). Massachusetts Special and Cross-Sector Studies Area, Residential and Low-Income
Non-Energy Impacts (NEI) Evaluation, Prepared for Massachusetts Program Administrators 261 The Cadmus Group, Inc. (2010). EnergyWise 2008 Program Evaluation. Prepared for National Grid. 262 Quantec, LLC (2000). Impact Evaluation: Single-Family EnergyWise Program. Prepared for National Grid.
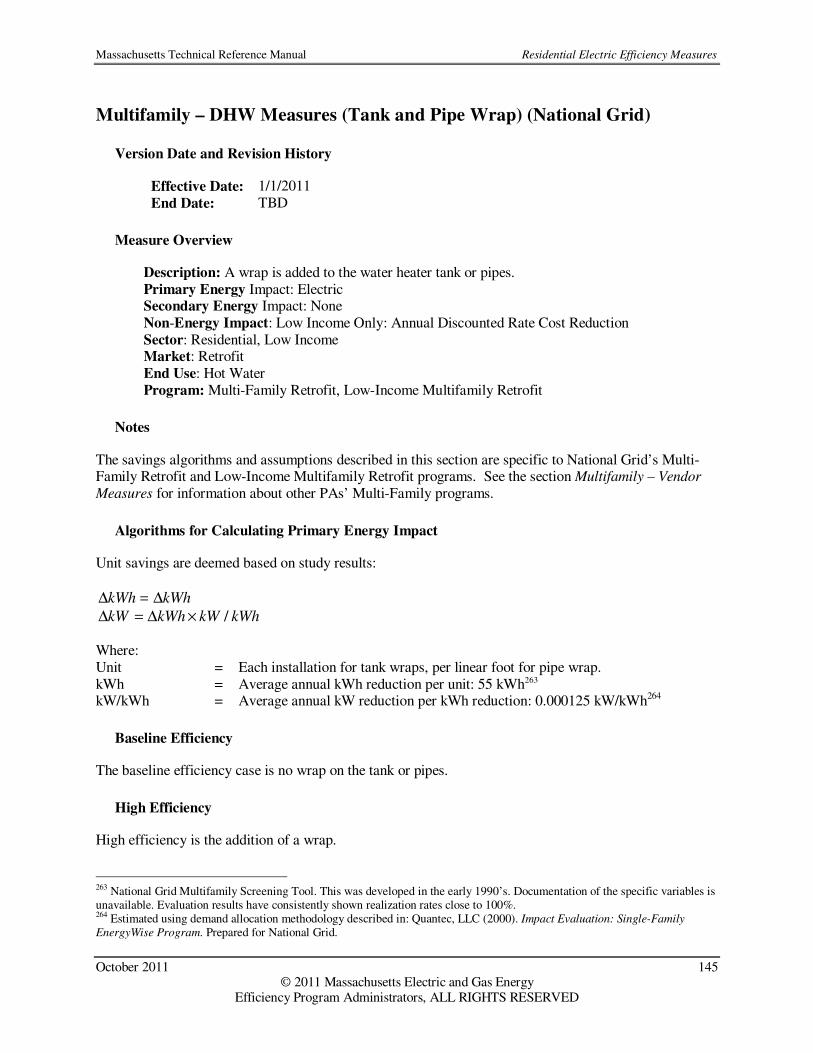
Massachusetts Technical Reference Manual Residential Electric Efficiency Measures
October 2011 145 © 2011 Massachusetts Electric and Gas Energy
Efficiency Program Administrators, ALL RIGHTS RESERVED
Multifamily – DHW Measures (Tank and Pipe Wrap) (National Grid)
Version Date and Revision History
Effective Date: 1/1/2011 End Date: TBD
Measure Overview
Description: A wrap is added to the water heater tank or pipes. Primary Energy Impact: Electric Secondary Energy Impact: None Non-Energy Impact: Low Income Only: Annual Discounted Rate Cost Reduction Sector: Residential, Low Income Market: Retrofit End Use: Hot Water Program: Multi-Family Retrofit, Low-Income Multifamily Retrofit
Notes
The savings algorithms and assumptions described in this section are specific to National Grid’s Multi-Family Retrofit and Low-Income Multifamily Retrofit programs. See the section Multifamily – Vendor
Measures for information about other PAs’ Multi-Family programs.
Algorithms for Calculating Primary Energy Impact
Unit savings are deemed based on study results:
kWhkWh ∆=∆
kWhkWkWhkW /×∆=∆ Where: Unit = Each installation for tank wraps, per linear foot for pipe wrap. kWh = Average annual kWh reduction per unit: 55 kWh263 kW/kWh = Average annual kW reduction per kWh reduction: 0.000125 kW/kWh264
Baseline Efficiency
The baseline efficiency case is no wrap on the tank or pipes.
High Efficiency
High efficiency is the addition of a wrap.
263 National Grid Multifamily Screening Tool. This was developed in the early 1990’s. Documentation of the specific variables is unavailable. Evaluation results have consistently shown realization rates close to 100%. 264 Estimated using demand allocation methodology described in: Quantec, LLC (2000). Impact Evaluation: Single-Family
EnergyWise Program. Prepared for National Grid.

Massachusetts Technical Reference Manual Residential Electric Efficiency Measures
October 2011 146 © 2011 Massachusetts Electric and Gas Energy
Efficiency Program Administrators, ALL RIGHTS RESERVED
Hours
Not applicable.
Measure Life
The measure life is 7 years.265
Secondary-Energy Impacts
There are no secondary energy impacts for this measure.
Non-Energy Impacts
Benefit Type Description Savings
Annual Non-Resource See Appendix D: Non-Resource Impacts See Appendix D: Non-Resource Impacts
One-Time Non-Resource See Appendix D: Non-Resource Impacts See Appendix D: Non-Resource Impacts
Impact Factors for Calculating Adjusted Gross Savings
Measure Name Program PA ISR SPF RRE RRSP RRWP CFSP CFWP
Tank/Pipe Wrap (Electric) MF Retrofit, LI MF Retrofit
National Grid
1.00 1.00 0.91 0.91 0.91 0.75 1.00
Tank/Pipe Wrap (Non-Electric)
MF Retrofit, LI MF Retrofit
National Grid
1.00 1.00 0.99 0.99 0.99 0.75 1.00
In-Service Rates All installations have 100% in service rate since all PA programs include verification of equipment installations. Savings Persistence Factor All PAs use 100% savings persistence factor. Realization Rates Realization rates from the National Grid Energy Wise 2008 Program Evaluation.266 Coincidence Factors Summer and winter coincidence factors are estimated using demand allocation methodology described National Grid 2000 EnergyWise impact evaluation.267
265 Massachusetts Common Assumption. 266 The Cadmus Group, Inc. (2010). EnergyWise 2008 Program Evaluation. Prepared for National Grid. 267 Quantec, LLC (2000). Impact Evaluation: Single-Family EnergyWise Program. Prepared for National Grid.

Massachusetts Technical Reference Manual Residential Electric Efficiency Measures
October 2011 147 © 2011 Massachusetts Electric and Gas Energy
Efficiency Program Administrators, ALL RIGHTS RESERVED
Multifamily – Programmable Thermostats (National Grid)
Version Date and Revision History
Effective Date: 1/1/2011 (revised for 1/1/2012) End Date: TBD
Measure Overview
Description: Installation of programmable thermostats Primary Energy Impact: Electric Secondary Energy Impact: None Non-Energy Impact: Low-Income Annual Discounted Rate Cost Reduction Sector: Residential, Low-Income Market: Retrofit End Use: HVAC Program: Multi-Family Retrofit, Low-Income Multifamily Retrofit
Notes
The savings algorithms and assumptions described in this section are specific to National Grid’s Multi-Family Retrofit and Low-Income Multifamily Retrofit programs. See the section Multifamily – Vendor
Measures for information about other PAs’ Multi-Family programs.
Algorithms for Calculating Primary Energy Impact
Unit savings are deemed based on study results:
kWhkWh ∆=∆
kWhkWkWhkW /×∆=∆ Where: Unit = Installation of programmable thermostat. ∆kWh = Average annual kWh reduction per unit: 288 kWh268 kW/kWh = Average annual kW reduction per kWh reduction: 0.000125 kW/kWh269
Baseline Efficiency
The baseline efficiency case is a system without a set back programmable thermostat.
268 National Grid Multifamily Screening Tool. This was developed in the early 1990’s. Documentation of the specific variables is unavailable. Evaluation results have consistently shown realization rates close to 100%. 269 Estimated using demand allocation methodology described in: Quantec, LLC (2000). Impact Evaluation: Single-Family
EnergyWise Program. Prepared for National Grid.

Massachusetts Technical Reference Manual Residential Electric Efficiency Measures
October 2011 148 © 2011 Massachusetts Electric and Gas Energy
Efficiency Program Administrators, ALL RIGHTS RESERVED
High Efficiency
The high efficiency case is a system with a set-back programmable and fixed set point (common areas) thermostats.
Hours
Not applicable.
Measure Life
The measure life is 15 years.270
Secondary Energy Impacts
There are no secondary energy impacts for this measure.
Non-Energy Impacts
Benefit Type Description Savings
Annual Non-Resource See Appendix D: Non-Resource Impacts See Appendix D: Non-Resource Impacts
One-Time Non-Resource See Appendix D: Non-Resource Impacts See Appendix D: Non-Resource Impacts
Impact Factors for Calculating Adjusted Gross Savings
Measure Name Program PA ISR SPF RRE RRSP RRWP CFSP CFWP
Programmable Thermostat (Electric)
MF Retrofit, LI MF Retrofit
National Grid
1.00 1.00 0.91 0.91 0.91 0.03 1.00
Programmable Thermostat (Non-Electric)
MF Retrofit, LI MF Retrofit
National Grid
1.00 1.00 0.99 0.99 0.99 0.03 1.00
In-Service Rates All installations have 100% in service rate since all PA programs include verification of equipment installations. Savings Persistence Factor All PAs use 100% savings persistence factor. Realization Rates Realization rates from the National Grid Energy Wise 2008 Program Evaluation271.
Coincidence Factors Summer and winter coincidence factors are estimated using demand allocation methodology described National Grid 2000 EnergyWise impact evaluation272.
270 Environmental Protection Agency (2010). Life Cycle Cost Estimate for ENERGY STAR Programmable Thermostat. 271 The Cadmus Group, Inc. (2010). EnergyWise 2008 Program Evaluation. Prepared for National Grid. 272 Quantec, LLC (2000). Impact Evaluation: Single-Family EnergyWise Program. Prepared for National Grid.

Massachusetts Technical Reference Manual Residential Electric Efficiency Measures
October 2011 149 © 2011 Massachusetts Electric and Gas Energy
Efficiency Program Administrators, ALL RIGHTS RESERVED
Multifamily – Heat Pump Tune-Up (National Grid)
Version Date and Revision History
Effective Date: 1/1/2011 End Date: TBD
Measure Overview
Description: Heat pump tune-up for electrically-heated homes only. Primary Energy Impact: Electric Secondary Energy Impact: None Non-Energy Impact: Low-Income Annual Discounted Rate Cost Reduction Sector: Residential, Low-Income Market: Retrofit End Use: HVAC Program: Multi-Family Retrofit, Low-Income Multifamily Retrofit
Notes
The savings algorithms and assumptions described in this section are specific to National Grid’s Multi-Family Retrofit and Low-Income Multifamily Retrofit programs. See the section Multifamily – Vendor
Measures for information about other PAs’ Multi-Family programs.
Algorithms for Calculating Primary Energy Impact
Unit savings are deemed based on study results:
kWhkWh ∆=∆
kWhkWkWhkW /×∆=∆ Where: Unit = Heat pump tune-up performed ∆kWh = Average annual kWh reduction per unit: 1162 kWh273 kW/kWh = Average kW reduction per kWh reduction: 0.000125 kW/kWh274
Baseline Efficiency
The baseline efficiency case is an existing heat pump that is not tuned up.
High Efficiency
The high efficiency case is an existing heat pump that is tuned up.
273 National Grid Multifamily Screening Tool. This was developed in the early 1990’s. Documentation of the specific variables is unavailable. Evaluation results have consistently shown realization rates close to 100%. 274 Estimated using demand allocation methodology described in: Quantec, LLC (2000). Impact Evaluation: Single-Family
EnergyWise Program. Prepared for National Grid.

Massachusetts Technical Reference Manual Residential Electric Efficiency Measures
October 2011 150 © 2011 Massachusetts Electric and Gas Energy
Efficiency Program Administrators, ALL RIGHTS RESERVED
Hours
Not applicable.
Measure Life
The measure life is 5 years.275
Secondary Energy Impacts
There are no secondary energy impacts for this measure.
Non-Energy Impacts
Benefit Type Description Savings
Annual Non-Resource See Appendix D: Non-Resource Impacts See Appendix D: Non-Resource Impacts
One-Time Non-Resource See Appendix D: Non-Resource Impacts See Appendix D: Non-Resource Impacts
Impact Factors for Calculating Adjusted Gross Savings
Measure Name Program PA ISR SPF RRE RRSP RRWP CFSP CFWP
Heat Pump Tune-up (Electric)
MF Retrofit, LI MF Retrofit
National Grid
1.00 1.00 0.91 0.91 0.91 0.03 1.00
In-Service Rates All installations have 100% in service rate since all PA programs include verification of equipment installations. Savings Persistence Factor All PAs use 100% savings persistence factor. Realization Rates Realization rates from the National Grid Energy Wise 2008 Program Evaluation.276
Coincidence Factors Summer and winter coincidence factors are estimated using demand allocation methodology described National Grid 2000 EnergyWise impact evaluation.277
275 Massachusetts Common Assumption. 276 The Cadmus Group, Inc. (2010). EnergyWise 2008 Program Evaluation. Prepared for National Grid. 277 Quantec, LLC (2000). Impact Evaluation: Single-Family EnergyWise Program. Prepared for National Grid.
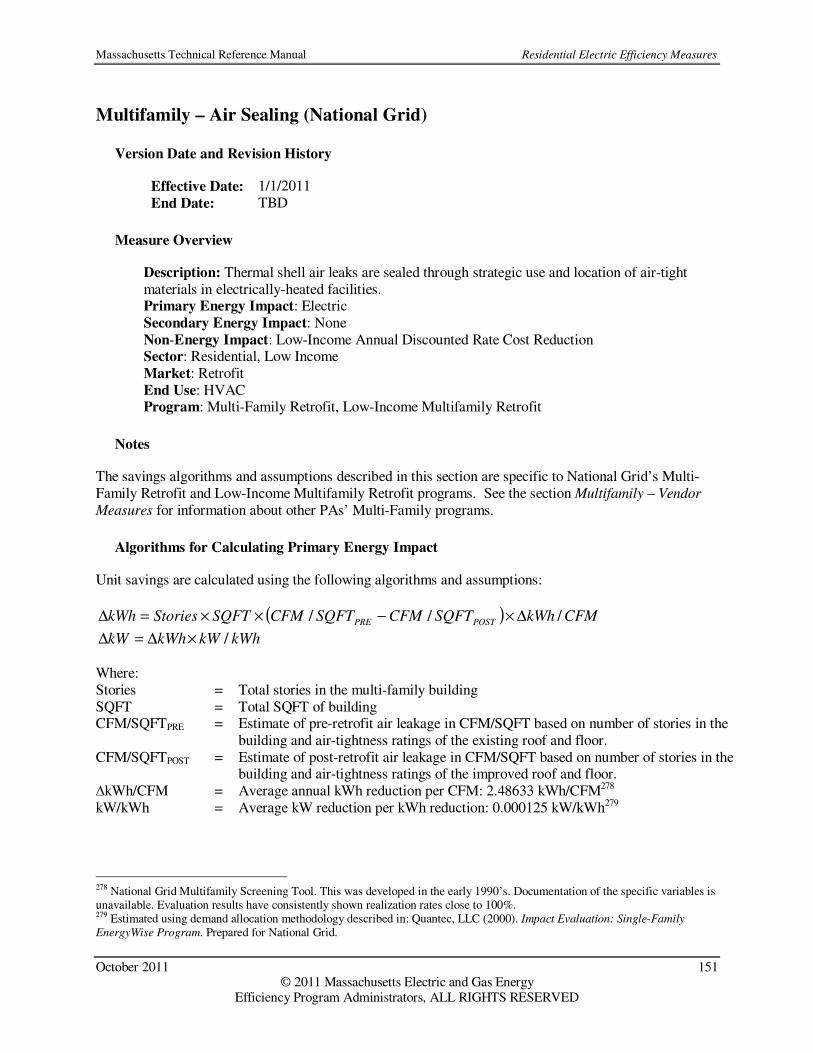
Massachusetts Technical Reference Manual Residential Electric Efficiency Measures
October 2011 151 © 2011 Massachusetts Electric and Gas Energy
Efficiency Program Administrators, ALL RIGHTS RESERVED
Multifamily – Air Sealing (National Grid)
Version Date and Revision History
Effective Date: 1/1/2011 End Date: TBD
Measure Overview
Description: Thermal shell air leaks are sealed through strategic use and location of air-tight materials in electrically-heated facilities. Primary Energy Impact: Electric Secondary Energy Impact: None Non-Energy Impact: Low-Income Annual Discounted Rate Cost Reduction Sector: Residential, Low Income Market: Retrofit End Use: HVAC Program: Multi-Family Retrofit, Low-Income Multifamily Retrofit
Notes
The savings algorithms and assumptions described in this section are specific to National Grid’s Multi-Family Retrofit and Low-Income Multifamily Retrofit programs. See the section Multifamily – Vendor
Measures for information about other PAs’ Multi-Family programs.
Algorithms for Calculating Primary Energy Impact
Unit savings are calculated using the following algorithms and assumptions:
( ) CFMkWhSQFTCFMSQFTCFMSQFTStorieskWh POSTPRE /// ∆×−××=∆
kWhkWkWhkW /×∆=∆ Where: Stories = Total stories in the multi-family building SQFT = Total SQFT of building CFM/SQFTPRE = Estimate of pre-retrofit air leakage in CFM/SQFT based on number of stories in the
building and air-tightness ratings of the existing roof and floor. CFM/SQFTPOST = Estimate of post-retrofit air leakage in CFM/SQFT based on number of stories in the
building and air-tightness ratings of the improved roof and floor. ∆kWh/CFM = Average annual kWh reduction per CFM: 2.48633 kWh/CFM278 kW/kWh = Average kW reduction per kWh reduction: 0.000125 kW/kWh279
278 National Grid Multifamily Screening Tool. This was developed in the early 1990’s. Documentation of the specific variables is unavailable. Evaluation results have consistently shown realization rates close to 100%. 279 Estimated using demand allocation methodology described in: Quantec, LLC (2000). Impact Evaluation: Single-Family
EnergyWise Program. Prepared for National Grid.
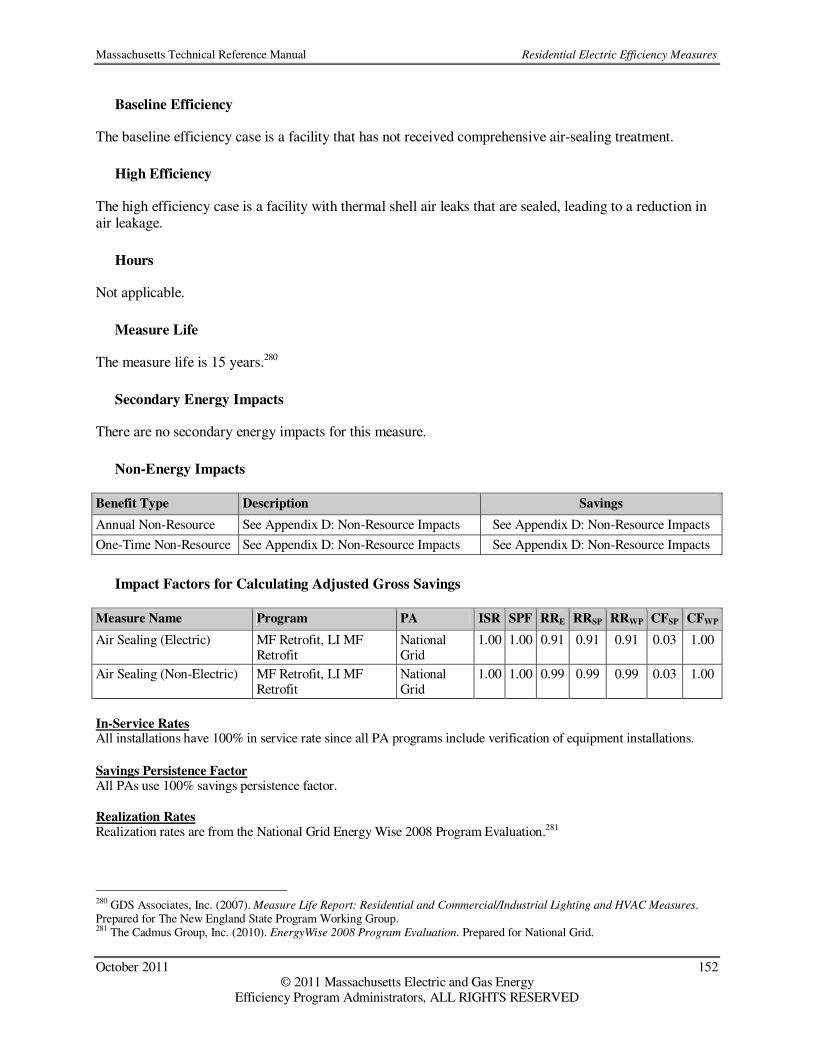
Massachusetts Technical Reference Manual Residential Electric Efficiency Measures
October 2011 152 © 2011 Massachusetts Electric and Gas Energy
Efficiency Program Administrators, ALL RIGHTS RESERVED
Baseline Efficiency
The baseline efficiency case is a facility that has not received comprehensive air-sealing treatment.
High Efficiency
The high efficiency case is a facility with thermal shell air leaks that are sealed, leading to a reduction in air leakage.
Hours
Not applicable.
Measure Life
The measure life is 15 years.280
Secondary Energy Impacts
There are no secondary energy impacts for this measure.
Non-Energy Impacts
Benefit Type Description Savings
Annual Non-Resource See Appendix D: Non-Resource Impacts See Appendix D: Non-Resource Impacts
One-Time Non-Resource See Appendix D: Non-Resource Impacts See Appendix D: Non-Resource Impacts
Impact Factors for Calculating Adjusted Gross Savings
Measure Name Program PA ISR SPF RRE RRSP RRWP CFSP CFWP
Air Sealing (Electric) MF Retrofit, LI MF Retrofit
National Grid
1.00 1.00 0.91 0.91 0.91 0.03 1.00
Air Sealing (Non-Electric) MF Retrofit, LI MF Retrofit
National Grid
1.00 1.00 0.99 0.99 0.99 0.03 1.00
In-Service Rates All installations have 100% in service rate since all PA programs include verification of equipment installations. Savings Persistence Factor All PAs use 100% savings persistence factor. Realization Rates Realization rates are from the National Grid Energy Wise 2008 Program Evaluation.281
280 GDS Associates, Inc. (2007). Measure Life Report: Residential and Commercial/Industrial Lighting and HVAC Measures. Prepared for The New England State Program Working Group. 281 The Cadmus Group, Inc. (2010). EnergyWise 2008 Program Evaluation. Prepared for National Grid.
Massachusetts Technical Reference Manual Residential Electric Efficiency Measures
October 2011 153 © 2011 Massachusetts Electric and Gas Energy
Efficiency Program Administrators, ALL RIGHTS RESERVED
Coincidence Factors Summer and winter coincidence factors are estimated using demand allocation methodology described National Grid 2000 EnergyWise impact evaluation.282
282 Quantec, LLC (2000). Impact Evaluation: Single-Family EnergyWise Program. Prepared for National Grid.
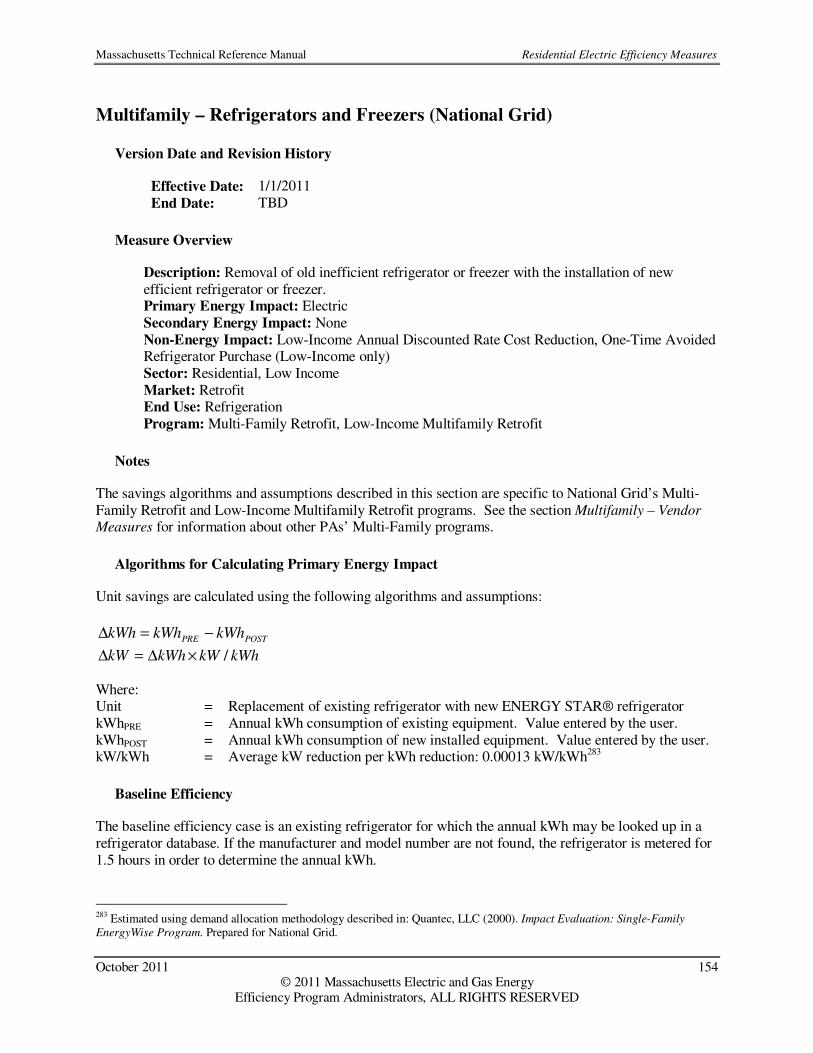
Massachusetts Technical Reference Manual Residential Electric Efficiency Measures
October 2011 154 © 2011 Massachusetts Electric and Gas Energy
Efficiency Program Administrators, ALL RIGHTS RESERVED
Multifamily – Refrigerators and Freezers (National Grid)
Version Date and Revision History
Effective Date: 1/1/2011 End Date: TBD
Measure Overview
Description: Removal of old inefficient refrigerator or freezer with the installation of new efficient refrigerator or freezer. Primary Energy Impact: Electric Secondary Energy Impact: None Non-Energy Impact: Low-Income Annual Discounted Rate Cost Reduction, One-Time Avoided Refrigerator Purchase (Low-Income only) Sector: Residential, Low Income Market: Retrofit End Use: Refrigeration Program: Multi-Family Retrofit, Low-Income Multifamily Retrofit
Notes
The savings algorithms and assumptions described in this section are specific to National Grid’s Multi-Family Retrofit and Low-Income Multifamily Retrofit programs. See the section Multifamily – Vendor Measures for information about other PAs’ Multi-Family programs.
Algorithms for Calculating Primary Energy Impact
Unit savings are calculated using the following algorithms and assumptions:
POSTPRE kWhkWhkWh −=∆
kWhkWkWhkW /×∆=∆ Where: Unit = Replacement of existing refrigerator with new ENERGY STAR® refrigerator kWhPRE = Annual kWh consumption of existing equipment. Value entered by the user. kWhPOST = Annual kWh consumption of new installed equipment. Value entered by the user. kW/kWh = Average kW reduction per kWh reduction: 0.00013 kW/kWh283
Baseline Efficiency
The baseline efficiency case is an existing refrigerator for which the annual kWh may be looked up in a refrigerator database. If the manufacturer and model number are not found, the refrigerator is metered for 1.5 hours in order to determine the annual kWh.
283 Estimated using demand allocation methodology described in: Quantec, LLC (2000). Impact Evaluation: Single-Family
EnergyWise Program. Prepared for National Grid.

Massachusetts Technical Reference Manual Residential Electric Efficiency Measures
October 2011 155 © 2011 Massachusetts Electric and Gas Energy
Efficiency Program Administrators, ALL RIGHTS RESERVED
High Efficiency
The high efficiency case is a new more efficiency refrigerator. The manufacture and model number is looked up in a refrigerator database to determine annual kWh.
Measure Life
The measure life is 12 years for non low income284 and 19 years for low income.285
Hours
Not applicable.
Secondary Energy Impacts
There are no secondary energy impacts for this measure.
Non-Energy Impacts
Benefit Type Description Savings
Annual Non-Resource See Appendix D: Non-Resource Impacts See Appendix D: Non-Resource Impacts
One-Time Non-Resource See Appendix D: Non-Resource Impacts See Appendix D: Non-Resource Impacts
Impact Factors for Calculating Adjusted Gross Savings
Measure Name Program PA ISR SPF RRE RRSP RRWP CFSP CFWP
Refrig/Freezers (Electric) MF Retrofit, LI MF Retrofit
National Grid 1.00 1.00 0.91 0.91 0.91 1.00 0.92
Refrig/Freezers (Non-Electric) MF Retrofit, LI MF Retrofit
National Grid 1.00 1.00 0.99 0.99 0.99 1.00 0.92
In-Service Rates All installations have 100% in service rate since all PA programs include verification of equipment installations. Savings Persistence Factor All PAs use 100% savings persistence factor. Realization Rates Realization rates from the National Grid Energy Wise 2008 Program Evaluation.286 Coincidence Factors Summer and winter coincidence factors are estimated using demand allocation methodology described National Grid 2000 EnergyWise impact evaluation.287
284 Environmental Protection Agency (2009). Life Cycle Cost Estimate for ENERGY STAR Residential Refrigerator. 285 Massachusetts Common Assumption. 286 The Cadmus Group, Inc. (2010). EnergyWise 2008 Program Evaluation. Prepared for National Grid. 287 Quantec, LLC (2000). Impact Evaluation: Single-Family EnergyWise Program. Prepared for National Grid.

Massachusetts Technical Reference Manual Residential Electric Efficiency Measures
October 2011 156 © 2011 Massachusetts Electric and Gas Energy
Efficiency Program Administrators, ALL RIGHTS RESERVED
Multifamily – Fixtures and CFLs (National Grid)
Version Date and Revision History
Effective Date: 1/1/2011 End Date: TBD
Measure Overview
Description: Removal of existing inefficient fixtures/bulbs with the installation of new efficient fixtures/bulbs Primary Energy Impact: Electric Secondary Energy Impact: None Non-Energy Impact: O&M, Low-Income Annual Discounted Rate Cost Reduction Sector: Residential, Low-Income Market: Retrofit End Use: Lighting Program: Multi-Family Retrofit, Low-Income Multifamily Retrofit
Notes
The savings algorithms and assumptions described in this section are specific to National Grid’s Multi-Family Retrofit and Low-Income Multifamily Retrofit programs. See the section Multifamily – Vendor
Measures for information about other PAs’ Multi-Family programs.
Algorithms for Calculating Primary Energy Impact
Unit savings are calculated using the following algorithms and assumptions:
( ) ( )[ ] 521000/ ×××−××=∆ EEEEEEPREPREPRE HoursWattsQTYHoursWattsQTYkWh
kWhkWkWhkW /×∆=∆
Where: QTYPRE = Quantity of pre-retrofit fixtures/bulbs QTYEE = Quantity of efficient fixtures/bulbs installed WattsPRE = Rated watts of pre-retrofit fixtures/bulbs WattsEE = Rated watts of efficient fixtures/bulbs installed HoursPRE = Weekly hours of operation for pre-retrofit case lighting fixtures/bulbs HoursEE = Weekly hours of operation for efficient lighting fixtures/bulbs 52 = Weeks per year kW/kWh = Average kW reduction per kWh reduction: 0.000273 kW/kWh288
Baseline Efficiency
The baseline efficiency case is the existing fixture and bulbs.
288 Estimated using demand allocation methodology described in: Quantec, LLC (2000). Impact Evaluation: Single-Family
EnergyWise Program. Prepared for National Grid.

Massachusetts Technical Reference Manual Residential Electric Efficiency Measures
October 2011 157 © 2011 Massachusetts Electric and Gas Energy
Efficiency Program Administrators, ALL RIGHTS RESERVED
High Efficiency
The high efficiency case is the new fixture and lamps.
Measure Life
The measure life is 7 years for CFLs and 7 years for fixtures.289
Hours
Operating hours are estimated by the vendor for each facility. Typical assumptions are 24 hours/day for common area lighting, 12 hours/day for exterior lighting, and 3 hours/day for in-unit lighting, but may be adjusted based on type of housing. Estimates are verified with facility maintenance staff when possible.
Secondary Energy Impacts
There are no secondary energy impacts for this measure.
Non-Energy Impacts
Benefit Type Description Savings
Annual Non-Resource See Appendix D: Non-Resource Impacts See Appendix D: Non-Resource Impacts
One-Time Non-Resource See Appendix D: Non-Resource Impacts See Appendix D: Non-Resource Impacts
Impact Factors for Calculating Adjusted Gross Savings
Measure Name Program PA ISR SPF RRE RRSP RRWP CFSP CFWP
CFLs (Electric) MF Retrofit, LI MF Retrofit National Grid 1.00 1.00 0.91 0.91 0.91 0.35 1. 00
CFLs (Non-Electric) MF Retrofit, LI MF Retrofit National Grid 1.00 1.00 0.99 0.99 0.99 0.35 1.00
Fixtures (Electric) MF Retrofit, LI MF Retrofit National Grid 1.00 1.00 0.91 0.91 0.91 0.35 1.00
Fixtures (Non-Electric) MF Retrofit, LI MF Retrofit National Grid 1.00 1.00 0.99 0.99 0.99 0.35 1.00
In-Service Rates All installations have 100% in service rate since all PA programs include verification of equipment installations. Savings Persistence Factor All PAs use 100% savings persistence factor. Realization Rates Realization rates from the National Grid Energy Wise 2008 Program Evaluation.290 Coincidence Factors Summer and winter coincidence factors are estimated using demand allocation methodology described National Grid 2000 EnergyWise impact evaluation.291
289 The adjusted measure life accounts for changes in the baseline due to EISA standards as shown in the MA Lighting Worksheet 290 The Cadmus Group, Inc. (2010). EnergyWise 2008 Program Evaluation. Prepared for National Grid. 291
Quantec, LLC (2000). Impact Evaluation: Single-Family EnergyWise Program. Prepared for National Grid.

Massachusetts Technical Reference Manual Residential Electric Efficiency Measures
October 2011 158 © 2011 Massachusetts Electric and Gas Energy
Efficiency Program Administrators, ALL RIGHTS RESERVED
Custom Measures
Version Date and Revision History
Effective Date: 1/1/2011 End Date: TBD
Measure Overview
Description: Installation of complex custom energy efficiency measures including solar hot water installations and fuel switching projects. Primary Energy Impact: Electric Secondary Energy Impact: Project-specific Non-Energy Impact: Project-specific Sector: Residential, Low Income Market: Lost Opportunity, Retrofit End Use: All Program: All
Algorithms for Calculating Primary Energy Impact
Gross energy and demand savings estimates for custom projects are calculated using engineering analysis with project-specific details. Custom analyses typically include a weather dependent load bin analysis, whole building energy model simulation, end-use metering or other engineering analysis and include estimates of savings, costs, and an evaluation of the projects’ cost-effectiveness.
Baseline Efficiency
The baseline efficiency case for Lost Opportunity projects assumes compliance with the efficiency requirements as mandated by Massachusetts State Building Code or industry accepted standard practice. The baseline efficiency case for retrofit projects is the same as the existing, or pre-retrofit, case for the facility.
High Efficiency
The high efficiency case is specific to the custom project and may include one or more energy efficiency measures. Energy and demand savings calculations are based on projected or measured changes in equipment efficiencies and operating characteristics and are determined on a case-by-case basis. The project must be proven cost-effective in order to qualify for energy efficiency incentives.
Hours
All hours for custom savings analyses should be determined on a case-by-case basis.
Measure Life
For both lost-opportunity and retrofit custom applications, the measure life is determined based on specific project using the common measure life recommendations.

Massachusetts Technical Reference Manual Residential Electric Efficiency Measures
October 2011 159 © 2011 Massachusetts Electric and Gas Energy
Efficiency Program Administrators, ALL RIGHTS RESERVED
Secondary Energy Impacts
All secondary energy impacts should be determined on a case-by-case basis.
Non-Energy Impacts
All non-energy impacts should be determined on a case-by-case basis.
Impact Factors for Calculating Adjusted Gross Savings
Measure Name Program PA ISR SPF RRE RRSP RRWP CFSP CFWP
Solar DHW HES All 1.00 1.00 1.00 1.00 1.00 custom custom
Solar DHW LI 1-4 Retrofit All 1.00 1.00 1.00 1.00 1.00 custom custom
Fuel Switching HES All 1.00 1.00 1.00 1.00 1.00 custom custom
In-Service Rates All installations have 100% in service rate since all PAs programs include verification of equipment installations. Savings Persistence Factor All PAs use 100% savings persistence factors. Realization Rates Realization rates are set to zero since project savings estimates are based on project-specific detail. Coincidence Factors Coincidence factors for summer and winter peak periods are custom-calculated based on project-specific detail.

Massachusetts Technical Reference Manual Commercial and Industrial Electric Efficiency Measures
October 2011 160 © 2011 Massachusetts Electric and Gas Energy
Efficiency Program Administrators, ALL RIGHTS RESERVED
Commercial and Industrial Electric Efficiency
Measures

Massachusetts Technical Reference Manual Commercial and Industrial Electric Efficiency Measures
October 2011 161 © 2011 Massachusetts Electric and Gas Energy
Efficiency Program Administrators, ALL RIGHTS RESERVED
Lighting – Advanced Lighting Design (Performance Lighting)
Version Date and Revision History
Effective Date: 1/1/2011 (Revised 1/1/2012) End Date: TBD
Measure Overview
Description: Advanced lighting design refers to the implementation of various lighting design principles aimed at creating a quality and appropriate lighting experience while reducing unnecessary light usage. This is often done by a professional in a new construction situation. Advanced lighting design uses techniques like maximizing task lighting and efficient fixtures to create a system of optimal energy efficiency and functionality. Primary Energy Impact: Electric Secondary Energy Impact: Gas, Oil Non-Energy Impact: O&M Sector: Commercial and Industrial Market: Lost Opportunity End Use: Lighting Program: C&I New Construction & Major Renovation
Algorithms for Calculating Primary Energy Impact
∑∑==
××−
××=∆
m
j
jjEEjEEn
i
iiiBASEHoursWattsCountHoursAreaLPD
kWh1
,,
1
,
10001000
∑∑==
×−
×=∆
m
j
jEEjEEn
i
iiBASEWattsCountAreaLPD
kW1
,,
1
,
10001000
Where: n = Total number of spaces in Space-by-Space Method or 1 for Building Area Method m Total number of efficient fixture types installed LPDBASE,i = Baseline lighting power density for building or space type i (Watts/ft2) Areai = Area of building or space i (ft2) Hoursi = Annual hours of operation of the lighting equipment for building or space type i CountEE,j = Quantity of efficient fixture type j WattsEE,j = Wattage of fixture type j (Watts) 1000 = Conversion factor: 1000 watts per 1 kW Note on HVAC system interaction: Additional Electric savings from cooling system interaction are included in the calculation of adjusted gross savings for Lighting Systems projects. The HVAC interaction adjustment factor is determined from lighting project evaluations and is included in the energy realization rates and demand coincidence factors and realization rates.

Massachusetts Technical Reference Manual Commercial and Industrial Electric Efficiency Measures
October 2011 162 © 2011 Massachusetts Electric and Gas Energy
Efficiency Program Administrators, ALL RIGHTS RESERVED
Baseline Efficiency
The Baseline Efficiency assumes compliance with lighting power density requirements as mandated by Massachusetts State Building Code. As described in Chapter 13 of the aforementioned document, energy efficiency must be met via compliance with the International Energy Conservation Code (IECC) 2009. IECC offers one compliance path, the Building Area Method. ASHRAE 90.1-2007 offers two compliance paths. For completeness, the lighting power density requirements for both the Building Area Method and the Space-by-Space Method are presented.292 Table 45 and
292 IECC 2009 presents requirements consistent with ASHRAE 90.1-2007 for the Building Area Method but does not present requirements for the Space-by-Space Method.

Massachusetts Technical Reference Manual Commercial and Industrial Electric Efficiency Measures
October 2011 163 © 2011 Massachusetts Electric and Gas Energy
Efficiency Program Administrators, ALL RIGHTS RESERVED
Table 46 in Appendix A: Common Lookup Tables detail the specific power requirements by compliance path.
High Efficiency
The high efficiency scenario assumes lighting systems that achieve lighting power densities below those required by Massachusetts State Building Code. Actual site lighting power densities should be determined on a case-by-case basis. Please refer to the current year application form for minimum percentage better than code efficiency requirements.
Hours
The annual hours of operation for lighting systems are site-specific and should be determined on a case-by-case basis. If site-specific hours are unavailable, refer to the default hours in Table 50 in Appendix A: Common Lookup Tables
Measure Life
The measure life for all new construction lighting installations is 15 years.293
Secondary Energy Impacts
Heating energy will be increased due to reduced lighting waste heat. This impact is estimated as an average impact in heating fossil fuel consumption per unit of energy saved.
Measure Energy Type Impact (MMBtu/∆kWh)294
Interior Lighting C&I Gas Heat -0.0003649
Interior Lighting Oil -0.0007129
Non-Energy Impacts
Annual non-energy benefits are claimed due to the reduced operation and maintenance costs associated with the longer measure lived of lamps and ballasts as compared to the base or pre-retrofit case. See Appendix D: Non-Resource Impacts.
Impact Factors for Calculating Adjusted Gross Savings
Measure Program PA ISR SPF RRE RRSP RRWP CFSP CFWP CFSSP CFWSP
All NC National Grid 1.00 1.00 1.07 0.80 0.73 custom custom n/a n/a
All NC NSTAR 1.00 1.00 1.14 1.11 1.30 0.85 0.59 n/a n/a
All NC CLC 1.00 1.00 1.14 1.11 1.30 0.85 0.59 n/a n/a
All NC Unitil 1.00 1.00 1.00 1.00 1.00 0.85 0.59 n/a n/a
All NC WMECO 1.00 1.00 1.05 1.23 1.05 n/a n/a custom custom
293 Energy & Resource Solutions (2005). Measure Life Study. Prepared for The Massachusetts Joint Utilities; Table 1-1. 294 Optimal Energy, Inc. (2008). MEMO: Non-Electric Benefits Analysis Update. Prepared for NSTAR. Final savings values calculated in spreadsheet analysis as noted on pg 5 of the memo.
Massachusetts Technical Reference Manual Commercial and Industrial Electric Efficiency Measures
October 2011 164 © 2011 Massachusetts Electric and Gas Energy
Efficiency Program Administrators, ALL RIGHTS RESERVED
In-Service Rates All installations have 100% in service rate since programs include verification of equipment installations. Savings Persistence Factor All PAs use 100% savings persistence factor.
Realization Rates � National Grid: energy and demand RRs derived from impact evaluation of National Grid 2008 custom lighting
installations295; final realization rates developed in 2008 custom program analysis study296 � NSTAR, CLC: energy and demand RRs from impact evaluation of NSTAR 2007 lighting installations297 � Unitil: energy and demand RRs are 100% for all C&I New Construction projects based on no evaluations � WMECO: energy RRs are from 2007/2008 Large C&I Programs impact evaluation298 Coincidence Factors � National Grid, WMECO: CFs are custom calculated based on site-specific information. � NSTAR, Unitil, CLC: CFs from the 2011 NEEP C&I Lighting Loadshape Study299
295 KEMA, Inc. (2009). National Grid USA 2008 Custom Lighting Impact Evaluation, Final Report. Prepared for National Grid. 296 KEMA, Inc. (2009). Sample Design and Impact Evaluation Analysis of the the 2008 Custom Program. Prepared for National Grid; Table 19. 297 KEMA, Inc. (2009). 2007 Business & Construction Solutions (BS/CS) Programs - Measurement and Verification of 2007
Lighting Measures. Prepared for NSTAR; Table Ex 3. 298 KEMA, Inc. (2010). 2007/2008 Large C&I Programs, Phase 1 Report Memo for Lighting and Process Measures. Prepared for Western Massachusetts Electric Company. 299 KEMA (2011). C&I Lighting Loadshape Project – Final Report. Prepared for the Regional Evaluation, Measurement and Verification Forum.

Massachusetts Technical Reference Manual Commercial and Industrial Electric Efficiency Measures
October 2011 165 © 2011 Massachusetts Electric and Gas Energy
Efficiency Program Administrators, ALL RIGHTS RESERVED
Lighting – Lighting Systems
Version Date and Revision History
Effective Date: 1/1/2011 (Revised 1/1/2012) End Date: TBD
Measure Overview
Description: This measure promotes the installation of efficient lighting including, but not limited to, efficient fluorescent lamps, ballasts, and fixtures, solid state lighting, and efficient high intensity discharge (HID) lamps, ballasts, and fixtures. Primary Energy Impact: Electric Secondary Energy Impact: Gas, Oil Non-Energy Impact: O&M Sector: Commercial & Industrial Market: Lost Opportunity, Retrofit End Use: Lighting Program: C&I New Construction & Major Renovation, C&I Large Retrofit, C&I Small Retrofit
Algorithms for Calculating Primary Energy Impact
)(1000
*
1000
*
1 1
HoursWattsCountWattsCount
kWhn
i
m
j EE
jj
BASE
ii
−
=∆ ∑ ∑
= =
∑ ∑= =
−
=∆
n
i
m
j EE
jj
BASE
iiWattsCountWattsCount
kW1 1 1000
*
1000
*
Where: n = Total number of fixture types in baseline or pre-retrofit case m = Total number of installed fixture types Counti = Quantity of existing fixtures of type i (for lost-opportunity, Counti = Countj). Wattsi = Existing fixture or baseline wattage for fixture type i Countj = Quantity of efficient fixtures of type j. Wattsj = Efficient fixture wattage for fixture type j. 1000 = Conversion factor: 1000 watts per kW. Hours = Lighting annual hours of operation. Note on HVAC system interaction: Additional Electric savings from cooling system interaction are included in the calculation of adjusted gross savings for Lighting Systems projects. The HVAC interaction adjustment factor is determined from lighting project evaluations and is included in the energy realization rates and demand coincidence factors and realization rates (See Impact Factors section).
Baseline Efficiency
For retrofit installations, the baseline efficiency case is project-specific and is determined using actual fixture counts from the existing space. Existing fixture wattages are provided in the MassSAVE Retrofit

Massachusetts Technical Reference Manual Commercial and Industrial Electric Efficiency Measures
October 2011 166 © 2011 Massachusetts Electric and Gas Energy
Efficiency Program Administrators, ALL RIGHTS RESERVED
Lighting Wattage Tables300. For lost opportunity installations, the baseline efficiency case is determined using assumed baseline wattages for each of the installed fixtures301.
High Efficiency
For both new construction and retrofit installations, the high efficiency case is project-specific and is determined using actual fixture counts for the project and the MassSave Wattage Tables302 in Appendix A: Common Lookup Tables
Hours
The annual hours of operation for lighting systems are site-specific and should be determined on a case-by-case basis. If site-specific hours of operation are unavailable, refer to the default hours presented in Table 50 in Appendix A: Common Lookup Tables
Measure Life
Lighting system measure lives vary by market sector and equipment type. Measure Lives for C&I Lighting Systems
303 Measure Life (years)
Equipment Type Retrofit Lost Opportunity
Bulb – CFL screw base 5 N/A
Fluorescent Fixture 13 15
Hardwired CFL 13 15
LED Exit Signs 13 15
HID (interior and exterior) 13 15
LED Lighting Fixtures 13 15
LED Integral Replacement Lamps 13 15
LED Low Bay – Garage & Canopy Fixtures 13 15
Secondary Energy Impacts
Heating energy will be increased due to reduced lighting waste heat. This impact is estimated as an average impact in heating fossil fuel consumption per unit of energy saved.
Measure Energy Type Impact (MMBtu/∆kWh)304
Interior Lighting C&I Gas Heat -0.0003649
Interior Lighting Oil -0.0007129
300 MassSave (2010). C&I Retrofit Lighting Wattage Tables. 301 Massachusetts Common Assumption: Baseline wattage per fixture type based on comparable code-compliant installations and standard practice. 302 MassSave (2010). C&I New Construction Lighting Wattage Tables AND MassSave (2010). C&I Retrofit Lighting Wattage
Tables. 303 Energy & Resource Solutions (2005). Measure Life Study. Prepared for The Massachusetts Joint Utilities; Table 1-1 AND GDS Associates, Inc. (2007). Measure Life Report: Residential and Commercial/Industrial Lighting and HVAC Measures. Prepared for The New England State Program Working Group; Table 2 304 Optimal Energy, Inc. (2008). MEMO: Non-Electric Benefits Analysis Update. Prepared for NSTAR. Final savings values calculated in spreadsheet analysis as noted on pg 5 of the memo.

Massachusetts Technical Reference Manual Commercial and Industrial Electric Efficiency Measures
October 2011 167 © 2011 Massachusetts Electric and Gas Energy
Efficiency Program Administrators, ALL RIGHTS RESERVED
Non-Energy Impacts
Annual non-energy benefits are claimed due to the reduced operation and maintenance costs associated with the longer measure lived of lamps and ballasts as compared to the base or pre-retrofit case. See Appendix D: Non-Resource Impacts.
Impact Factors for Calculating Adjusted Gross Savings
Measure Program PA ISR SPF RRE RRSP RRWP CFSP CFWP CFSSP CFWSP
Large C&I New Construction and Large C&I Retrofit
All NC CLC 1.00 1.00 1.14 1.11 1.30 0.85 0.59 n/a n/a
All Retrofit CLC 1.00 1.00 1.01 1.18 1.26 0.85 0.59 n/a n/a
All NC National Grid 1.00 1.00 0.99 0.97 0.97 0.98 0.73 n/a n/a
All Retrofit National Grid 1.00 1.00 1.04 1.03 1.03 0.89 0.63 n/a n/a
All NC NSTAR 1.00 1.00 1.14 1.11 1.30 0.85 0.59 n/a n/a
All Retrofit NSTAR 1.00 1.00 1.01 1.18 1.26 0.85 0.59 n/a n/a
All NC Unitil 1.00 1.00 1.00 1.00 1.00 0.85 0.59 n/a n/a
All Retrofit Unitil 1.00 1.00 1.00 1.00 1.00 0.85 0.59 n/a n/a
All Retrofit WMECO 1.00 1.00 1.05 1.23 1.05 n/a n/a custom custom
Small C&I Retrofit
All Retrofit CLC 1.00 1.00 1.08 0.99 0.99 0.77 0.39 n/a n/a
All Retrofit National Grid 1.00 1.00 1.08 0.98 0.98 0.79 0.39 n/a n/a
CFLs, Interior
Retrofit National Grid 1.00 0.87 1.08
0.98 0.98 0.79 0.39 n/a n/a
All Retrofit NSTAR 1.00 1.00 1.08 0.99 0.99 0.77 0.39 n/a n/a
All Retrofit Unitil 1.00 1.00 1.08 0.99 0.99 0.77 0.39 n/a n/a
All Retrofit WMECO 1.00 1.00 0.83 0.88 0.88 n/a n/a 0.61 0.29
In-Service Rates All installations have 100% in service rate since all PAs programs include verification of equipment installations. Savings Persistence Factor All PAs use 100% savings persistence factors with one exception: National Grid uses 0.87 for screw-in CFLs installed through the C&I Small Retrofit program based on 1996 savings persistence study305. Realization Rates
New Construction & Major Renovation Commercial
� National Grid energy and demand RRs from impact evaluation of National Grid’s 2007 Design 2000plus (New Construction) Lighting installations306. Demand RR is the connected demand RR; energy RR includes connected demand RR, hours of use RR and HVAC Interactive adjustment.
� NSTAR, CLC energy and demand RRs from impact evaluation of NSTAR’s Business & Construction Solutions Programs Lighting installations307. Energy and demand realization rates include interactive adjustments.
� Unitil: energy and demand RRs are 100% for all C&I New Construction projects based on no evaluations
305 HEC, Inc. (1996). Persistence of Savings Study. Prepared for New England Power Service Company. 306 KEMA, Inc. (2009). Design 2000plus Lighting Hours of Use and Load Shapes Measurement Study. Prepared for National Grid. 307 RLW Analytics (2008). Business & Construction Solutions (BS/CS) Programs Measurement & Verification - 2006 Final
Report. Prepared for NSTAR Electric and Gas
Massachusetts Technical Reference Manual Commercial and Industrial Electric Efficiency Measures
October 2011 168 © 2011 Massachusetts Electric and Gas Energy
Efficiency Program Administrators, ALL RIGHTS RESERVED
� WMECO: energy RRs are from 2007/2008 Large C&I Programs impact evaluation308 C&I Large Retrofit
� National Grid energy RR is from impact evaluation of National Grid’s 2007 Energy Initiative (Large Retrofit) Lighting program309. Energy RR is the ratio measured electric energy savings to gross estimates of electric energy savings, and includes electric HVAC interaction adjustment by default. National Grid demand RRs are from impact evaluation of National Grid’s 2003 Energy Initiative Lighting program310. Demand RR is the connected demand RR.
� NSTAR, CLC, Unitil, WMECO: Same as New Construction & Major Renovation Commercial
C&I Small Retrofit
� Energy RRs are the statewide results from the 2011 Small C&I Non-Controlled Lighting impact evaluation311 � National Grid, NSTAR, CLC, Unitil: demand RRs are from the statewide results from the 2011 Small C&I
Non-Controlled Lighting impact evaluation312 Coincidence Factors New Construction & Major Renovation Commercial All CFs are from the 2011 NEEP C&I Lighting Loadshape Project313 except: National Grid CFs from National Grid’s 2007 Design 2000plus Lighting subprogram314
C&I Large Retrofit
All CFs are from the 2011 NEEP C&I Lighting Loadshape Project315 except WMECO which uses custom CFs based on project-specific detail.
C&I Small Retrofit
All CFSP values are from the 2011 NEEP C&I Lighting Loadshape Project316 All CFWP values are the statewide results from the 2011 Small C&I Non-Controlled Lighting impact evaluation317 except WMECO which uses custom CFs based on project-specific detail.
308 KEMA, Inc. (2010). 2007/2008 Large C&I Programs, Phase 1 Report Memo for Lighting and Process Measures. Prepared for Western Massachusetts Electric Company. 309 Summit Blue Consulting, LLC (2008). Large Commercial and Industrial Retrofit Program Impact Evaluation 2007 – Final
Report. Prepared for National Grid. 310 RLW Analytics (2004). 2003 Energy Initiative "EI" Program Lighting Impact Evaluation - Final Report. Prepared for National Grid. 311 Cadmus Group (2011). Non-Controls Lighting Evaluation for the Massachusetts Small Commercial Direct Install Program. Prepared for Massachusetts Utilities. 312 Ibid. 313 KEMA (2011). C&I Lighting Loadshape Project – Final Report. Prepared for the Regional Evaluation, Measurement and Verification Forum. 314 KEMA, Inc. (2009). Design 2000plus Lighting Hours of Use and Load Shapes Measurement Study. Prepared for National Grid. 315 KEMA (2011). C&I Lighting Loadshape Project – Final Report. Prepared for the Regional Evaluation, Measurement and Verification Forum. 316 Ibid. 317 Cadmus Group (2011). Non-Controls Lighting Evaluation for the Massachusetts Small Commercial Direct Install Program. Prepared for Massachusetts Utilities.
Massachusetts Technical Reference Manual Commercial and Industrial Electric Efficiency Measures
October 2011 169 © 2011 Massachusetts Electric and Gas Energy
Efficiency Program Administrators, ALL RIGHTS RESERVED
Lighting – Lighting Controls
Version Date and Revision History
Effective Date: 1/1/2011 (Revised 1/1/2012) End Date: TBD
Measure Overview
Description: This measure promotes the installation of lighting controls in both lost-opportunity and retrofit applications. Promoted technologies include occupancy sensors and daylight dimming controls. Primary Energy Impact: Electric Secondary Energy Impact: Heating energy (non-electric) Non-Energy Impacts: O&M
Sector: Commercial & Industrial Market: Lost Opportunity, Retrofit End Use: Lighting Program: C&I New Construction & Major Renovation, C&I Large Retrofit, C&I Small Retrofit
Algorithms for Calculating Primary Energy Impact
( )( )EEBASE HoursHourskWControlledkW −=∆
( )kWControlledkW =∆
Where: Controlled kW = Controlled fixture wattage HoursBASE = Total annual hours that the connected Watts operated in the pre-retrofit
case (retrofit installations) or would have operated with code-compliance controls (new construction installations).
HoursEE = Total annual hours that the connect Watts operate with the lighting controls implemented.
Note on HVAC system interaction: Additional Electric savings from cooling system interaction are included in the calculation of adjusted gross savings for Lighting Systems projects. The HVAC interaction adjustment factor is determined from lighting project evaluations and is included in the energy realization rates and demand coincidence factors and realization rates (See Impact Factors section).
Baseline Efficiency
The baseline efficiency case assumes no controls (retrofit) or code-compliant controls (new construction).
High Efficiency
The high efficiency case involves lighting fixtures connected to controls that reduce the pre-retrofit or baseline hours of operation.
Massachusetts Technical Reference Manual Commercial and Industrial Electric Efficiency Measures
October 2011 170 © 2011 Massachusetts Electric and Gas Energy
Efficiency Program Administrators, ALL RIGHTS RESERVED
Hours
The annual hours of reduction for lighting controls are site-specific and should be determined on a case-by-case basis. If site-specific hours are unavailable, refer to the default hours in Table 50 in Appendix A: Common Lookup Tables
Measure Life
Lighting system measure lives vary by market sector and equipment type. Measure Lives for C&I Lighting Controls
318
Measure Life (years)
Measure Retrofit Lost Opportunity
Occupancy Sensors 9 10
Daylight Dimming 9 10
Secondary Energy Impacts
Heating energy will be increased due to reduced lighting waste heat. This impact is estimated as an average impact in heating fossil fuel consumption per unit of energy saved.
Measure Energy Type Impact (MMBtu/∆kWh)319
Interior Lighting C&I Gas Heat -0.0003649 MMBtu/kWh
Interior Lighting Oil -0.0007129 MMBtu/kWh
Non-Energy Impacts
Annual non-energy benefits are claimed due to the reduced operation and maintenance costs associated with the longer measure lived of lamps and ballasts as compared to the base or pre-retrofit case. See Appendix D: Non-Resource Impacts.
318 Energy & Resource Solutions (2005). Measure Life Study. Prepared for The Massachusetts Joint Utilities; Table 1-1. 319 Optimal Energy, Inc. (2008). MEMO: Non-Electric Benefits Analysis Update. Prepared for NSTAR. Final savings values calculated in spreadsheet analysis as noted on pg 5 of the memo.
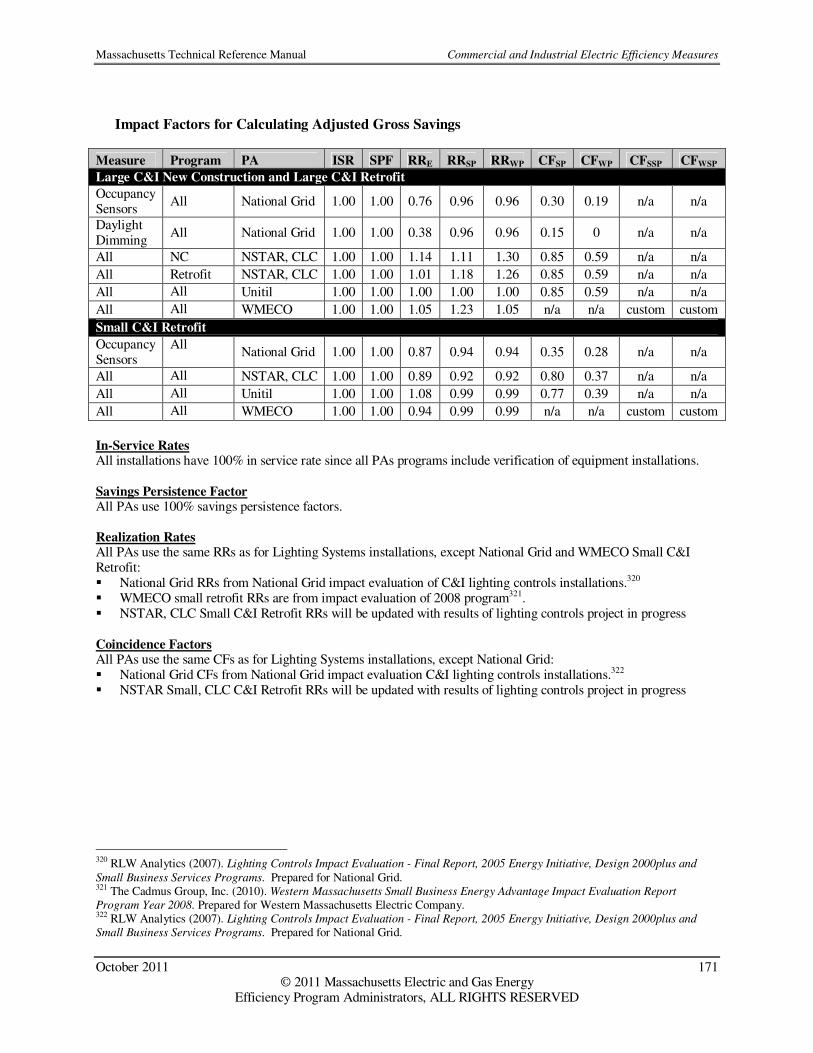
Massachusetts Technical Reference Manual Commercial and Industrial Electric Efficiency Measures
October 2011 171 © 2011 Massachusetts Electric and Gas Energy
Efficiency Program Administrators, ALL RIGHTS RESERVED
Impact Factors for Calculating Adjusted Gross Savings
Measure Program PA ISR SPF RRE RRSP RRWP CFSP CFWP CFSSP CFWSP
Large C&I New Construction and Large C&I Retrofit
Occupancy Sensors
All National Grid 1.00 1.00 0.76 0.96 0.96 0.30 0.19 n/a n/a
Daylight Dimming
All National Grid 1.00 1.00 0.38 0.96 0.96 0.15 0 n/a n/a
All NC NSTAR, CLC 1.00 1.00 1.14 1.11 1.30 0.85 0.59 n/a n/a
All Retrofit NSTAR, CLC 1.00 1.00 1.01 1.18 1.26 0.85 0.59 n/a n/a
All All Unitil 1.00 1.00 1.00 1.00 1.00 0.85 0.59 n/a n/a
All All WMECO 1.00 1.00 1.05 1.23 1.05 n/a n/a custom custom
Small C&I Retrofit
Occupancy Sensors
All National Grid 1.00 1.00 0.87 0.94 0.94 0.35 0.28 n/a n/a
All All NSTAR, CLC 1.00 1.00 0.89 0.92 0.92 0.80 0.37 n/a n/a
All All Unitil 1.00 1.00 1.08 0.99 0.99 0.77 0.39 n/a n/a
All All WMECO 1.00 1.00 0.94 0.99 0.99 n/a n/a custom custom
In-Service Rates All installations have 100% in service rate since all PAs programs include verification of equipment installations. Savings Persistence Factor All PAs use 100% savings persistence factors. Realization Rates All PAs use the same RRs as for Lighting Systems installations, except National Grid and WMECO Small C&I Retrofit: � National Grid RRs from National Grid impact evaluation of C&I lighting controls installations.320 � WMECO small retrofit RRs are from impact evaluation of 2008 program321. � NSTAR, CLC Small C&I Retrofit RRs will be updated with results of lighting controls project in progress Coincidence Factors All PAs use the same CFs as for Lighting Systems installations, except National Grid: � National Grid CFs from National Grid impact evaluation C&I lighting controls installations.322 � NSTAR Small, CLC C&I Retrofit RRs will be updated with results of lighting controls project in progress
320 RLW Analytics (2007). Lighting Controls Impact Evaluation - Final Report, 2005 Energy Initiative, Design 2000plus and
Small Business Services Programs. Prepared for National Grid. 321 The Cadmus Group, Inc. (2010). Western Massachusetts Small Business Energy Advantage Impact Evaluation Report
Program Year 2008. Prepared for Western Massachusetts Electric Company. 322 RLW Analytics (2007). Lighting Controls Impact Evaluation - Final Report, 2005 Energy Initiative, Design 2000plus and
Small Business Services Programs. Prepared for National Grid.
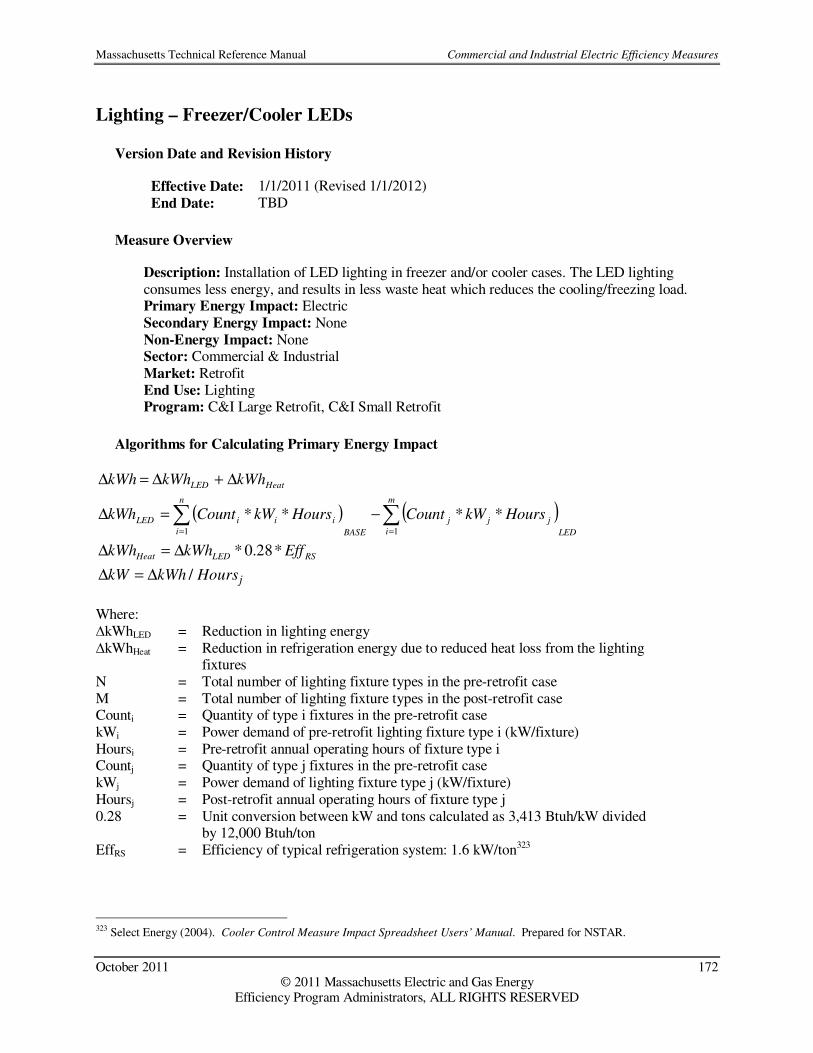
Massachusetts Technical Reference Manual Commercial and Industrial Electric Efficiency Measures
October 2011 172 © 2011 Massachusetts Electric and Gas Energy
Efficiency Program Administrators, ALL RIGHTS RESERVED
Lighting – Freezer/Cooler LEDs
Version Date and Revision History
Effective Date: 1/1/2011 (Revised 1/1/2012) End Date: TBD
Measure Overview
Description: Installation of LED lighting in freezer and/or cooler cases. The LED lighting consumes less energy, and results in less waste heat which reduces the cooling/freezing load. Primary Energy Impact: Electric Secondary Energy Impact: None Non-Energy Impact: None Sector: Commercial & Industrial Market: Retrofit End Use: Lighting Program: C&I Large Retrofit, C&I Small Retrofit
Algorithms for Calculating Primary Energy Impact
HeatLED kWhkWhkWh ∆+∆=∆
( ) ( )LED
m
i
jjj
BASE
n
i
iiiLED HourskWCountHourskWCountkWh ∑∑==
−=∆11
****
RSLEDHeat EffkWhkWh *28.0*∆=∆
jHourskWhkW /∆=∆
Where: ∆kWhLED = Reduction in lighting energy ∆kWhHeat = Reduction in refrigeration energy due to reduced heat loss from the lighting
fixtures N = Total number of lighting fixture types in the pre-retrofit case M = Total number of lighting fixture types in the post-retrofit case Counti = Quantity of type i fixtures in the pre-retrofit case kWi = Power demand of pre-retrofit lighting fixture type i (kW/fixture) Hoursi = Pre-retrofit annual operating hours of fixture type i Countj = Quantity of type j fixtures in the pre-retrofit case kWj = Power demand of lighting fixture type j (kW/fixture) Hoursj = Post-retrofit annual operating hours of fixture type j 0.28 = Unit conversion between kW and tons calculated as 3,413 Btuh/kW divided
by 12,000 Btuh/ton EffRS = Efficiency of typical refrigeration system: 1.6 kW/ton323
323 Select Energy (2004). Cooler Control Measure Impact Spreadsheet Users’ Manual. Prepared for NSTAR.
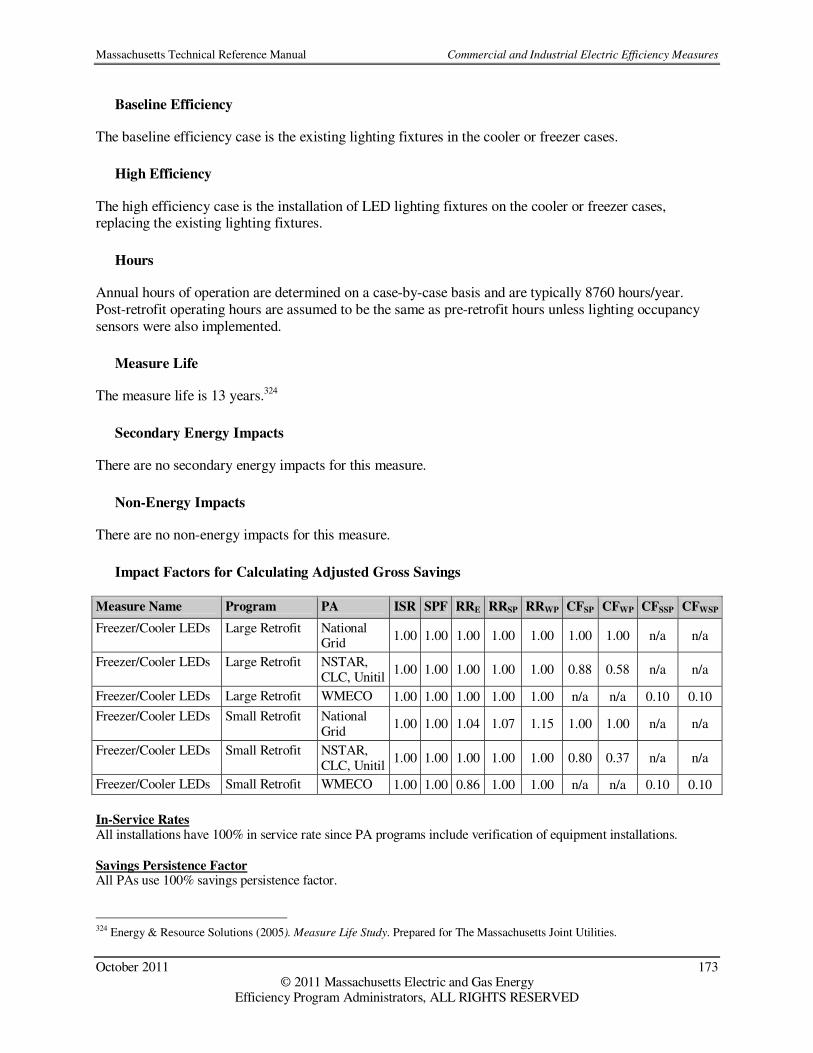
Massachusetts Technical Reference Manual Commercial and Industrial Electric Efficiency Measures
October 2011 173 © 2011 Massachusetts Electric and Gas Energy
Efficiency Program Administrators, ALL RIGHTS RESERVED
Baseline Efficiency
The baseline efficiency case is the existing lighting fixtures in the cooler or freezer cases.
High Efficiency
The high efficiency case is the installation of LED lighting fixtures on the cooler or freezer cases, replacing the existing lighting fixtures.
Hours
Annual hours of operation are determined on a case-by-case basis and are typically 8760 hours/year. Post-retrofit operating hours are assumed to be the same as pre-retrofit hours unless lighting occupancy sensors were also implemented.
Measure Life
The measure life is 13 years.324
Secondary Energy Impacts
There are no secondary energy impacts for this measure.
Non-Energy Impacts
There are no non-energy impacts for this measure.
Impact Factors for Calculating Adjusted Gross Savings
Measure Name Program PA ISR SPF RRE RRSP RRWP CFSP CFWP CFSSP CFWSP
Freezer/Cooler LEDs Large Retrofit National Grid
1.00 1.00 1.00 1.00 1.00 1.00 1.00 n/a n/a
Freezer/Cooler LEDs Large Retrofit NSTAR, CLC, Unitil
1.00 1.00 1.00 1.00 1.00 0.88 0.58 n/a n/a
Freezer/Cooler LEDs Large Retrofit WMECO 1.00 1.00 1.00 1.00 1.00 n/a n/a 0.10 0.10
Freezer/Cooler LEDs Small Retrofit National Grid
1.00 1.00 1.04 1.07 1.15 1.00 1.00 n/a n/a
Freezer/Cooler LEDs Small Retrofit NSTAR, CLC, Unitil
1.00 1.00 1.00 1.00 1.00 0.80 0.37 n/a n/a
Freezer/Cooler LEDs Small Retrofit WMECO 1.00 1.00 0.86 1.00 1.00 n/a n/a 0.10 0.10
In-Service Rates All installations have 100% in service rate since PA programs include verification of equipment installations. Savings Persistence Factor All PAs use 100% savings persistence factor.
324 Energy & Resource Solutions (2005). Measure Life Study. Prepared for The Massachusetts Joint Utilities.
Massachusetts Technical Reference Manual Commercial and Industrial Electric Efficiency Measures
October 2011 174 © 2011 Massachusetts Electric and Gas Energy
Efficiency Program Administrators, ALL RIGHTS RESERVED
Realization Rates � National Grid: RRs for small retrofit installations based on impact evaluation of 2005 small retrofit custom
measures325; RRs for large retrofit installations are 100% based on no evaluations � NSTAR, CLC, Unitil: energy and demand RRs are 100% based on no evaluations � WMECO small retrofit RRs are from impact evaluation of 2008 program326. Coincidence Factors � National Grid: CFs set to 100% because pre-retrofit unit operate 8760 hours/year. � NSTAR, CLC, Unitil: CFs from 2007 State Program Working Group study327 � WMECO: CFs based on engineering estimates.
325 RLW Analytics (2007). Small Business Services Custom Measure Impact Evaluation. Prepared for National Grid. 326 The Cadmus Group, Inc. (2010). Western Massachusetts Small Business Energy Advantage Impact Evaluation Report
Program Year 2008. Prepared for Western Massachusetts Electric Company. 327 RLW Analytics (2007). Coincidence Factor Study: Residential and Commercial Industrial Lighting Measures. Prepared for the New England State Program Working Group (SPWG); Table i-29 & Table i-30 (On-Peak) and Table i-31 & Table i-32 (Seasonal Peak).
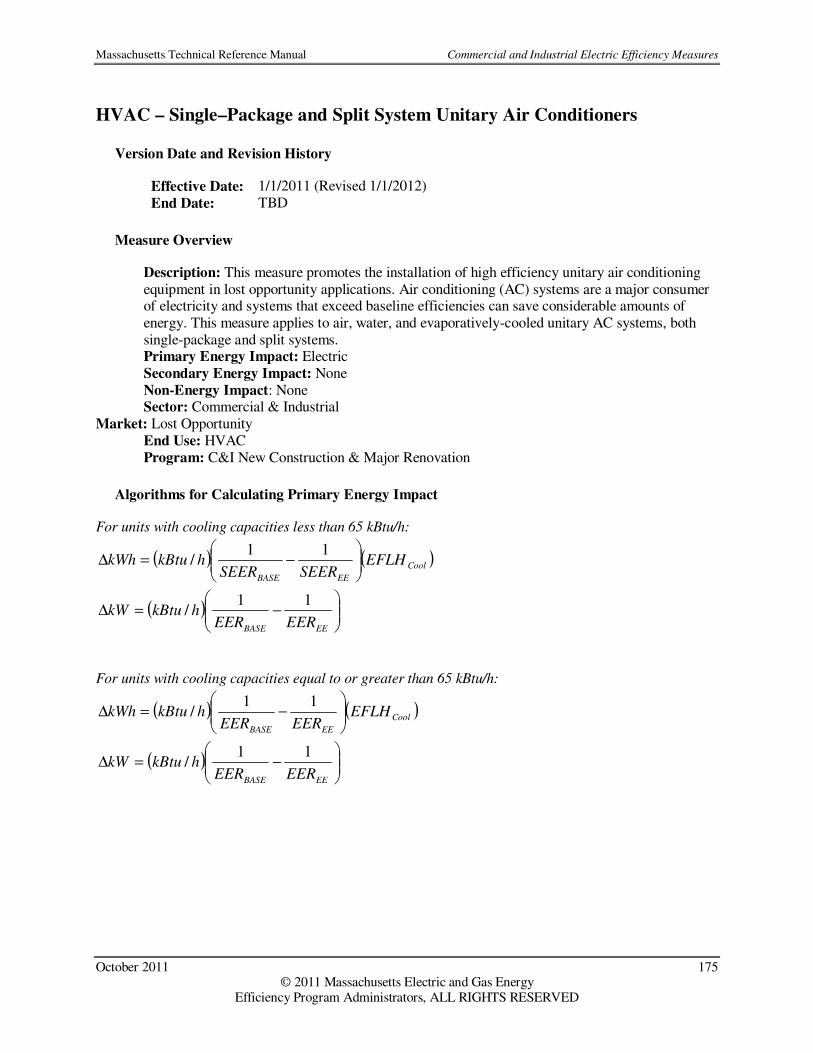
Massachusetts Technical Reference Manual Commercial and Industrial Electric Efficiency Measures
October 2011 175 © 2011 Massachusetts Electric and Gas Energy
Efficiency Program Administrators, ALL RIGHTS RESERVED
HVAC – Single–Package and Split System Unitary Air Conditioners
Version Date and Revision History
Effective Date: 1/1/2011 (Revised 1/1/2012) End Date: TBD
Measure Overview
Description: This measure promotes the installation of high efficiency unitary air conditioning equipment in lost opportunity applications. Air conditioning (AC) systems are a major consumer of electricity and systems that exceed baseline efficiencies can save considerable amounts of energy. This measure applies to air, water, and evaporatively-cooled unitary AC systems, both single-package and split systems. Primary Energy Impact: Electric Secondary Energy Impact: None Non-Energy Impact: None Sector: Commercial & Industrial
Market: Lost Opportunity End Use: HVAC Program: C&I New Construction & Major Renovation
Algorithms for Calculating Primary Energy Impact
For units with cooling capacities less than 65 kBtu/h:
( ) ( )Cool
EEBASE
EFLHSEERSEER
hkBtukWh
−=∆
11/
( )
−=∆
EEBASE EEREERhkBtukW
11/
For units with cooling capacities equal to or greater than 65 kBtu/h:
( ) ( )Cool
EEBASE
EFLHEEREER
hkBtukWh
−=∆
11/
( )
−=∆
EEBASE EEREERhkBtukW
11/
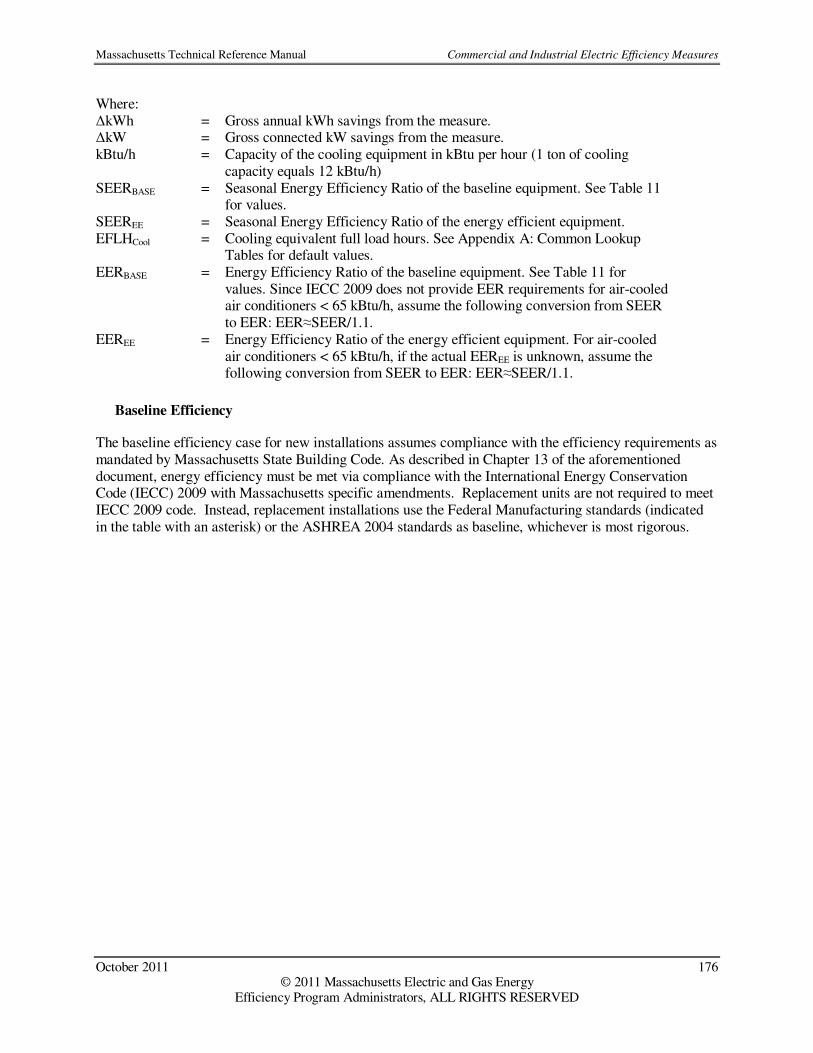
Massachusetts Technical Reference Manual Commercial and Industrial Electric Efficiency Measures
October 2011 176 © 2011 Massachusetts Electric and Gas Energy
Efficiency Program Administrators, ALL RIGHTS RESERVED
Where: ∆kWh = Gross annual kWh savings from the measure. ∆kW = Gross connected kW savings from the measure. kBtu/h = Capacity of the cooling equipment in kBtu per hour (1 ton of cooling
capacity equals 12 kBtu/h) SEERBASE = Seasonal Energy Efficiency Ratio of the baseline equipment. See Table 11
for values. SEEREE = Seasonal Energy Efficiency Ratio of the energy efficient equipment. EFLHCool = Cooling equivalent full load hours. See Appendix A: Common Lookup
Tables for default values. EERBASE = Energy Efficiency Ratio of the baseline equipment. See Table 11 for
values. Since IECC 2009 does not provide EER requirements for air-cooled air conditioners < 65 kBtu/h, assume the following conversion from SEER to EER: EER≈SEER/1.1.
EEREE = Energy Efficiency Ratio of the energy efficient equipment. For air-cooled air conditioners < 65 kBtu/h, if the actual EEREE is unknown, assume the following conversion from SEER to EER: EER≈SEER/1.1.
Baseline Efficiency
The baseline efficiency case for new installations assumes compliance with the efficiency requirements as mandated by Massachusetts State Building Code. As described in Chapter 13 of the aforementioned document, energy efficiency must be met via compliance with the International Energy Conservation Code (IECC) 2009 with Massachusetts specific amendments. Replacement units are not required to meet IECC 2009 code. Instead, replacement installations use the Federal Manufacturing standards (indicated in the table with an asterisk) or the ASHREA 2004 standards as baseline, whichever is most rigorous.

Massachusetts Technical Reference Manual Commercial and Industrial Electric Efficiency Measures
October 2011 177 © 2011 Massachusetts Electric and Gas Energy
Efficiency Program Administrators, ALL RIGHTS RESERVED
Table 11 details the specific efficiency requirements by equipment type and capacity.
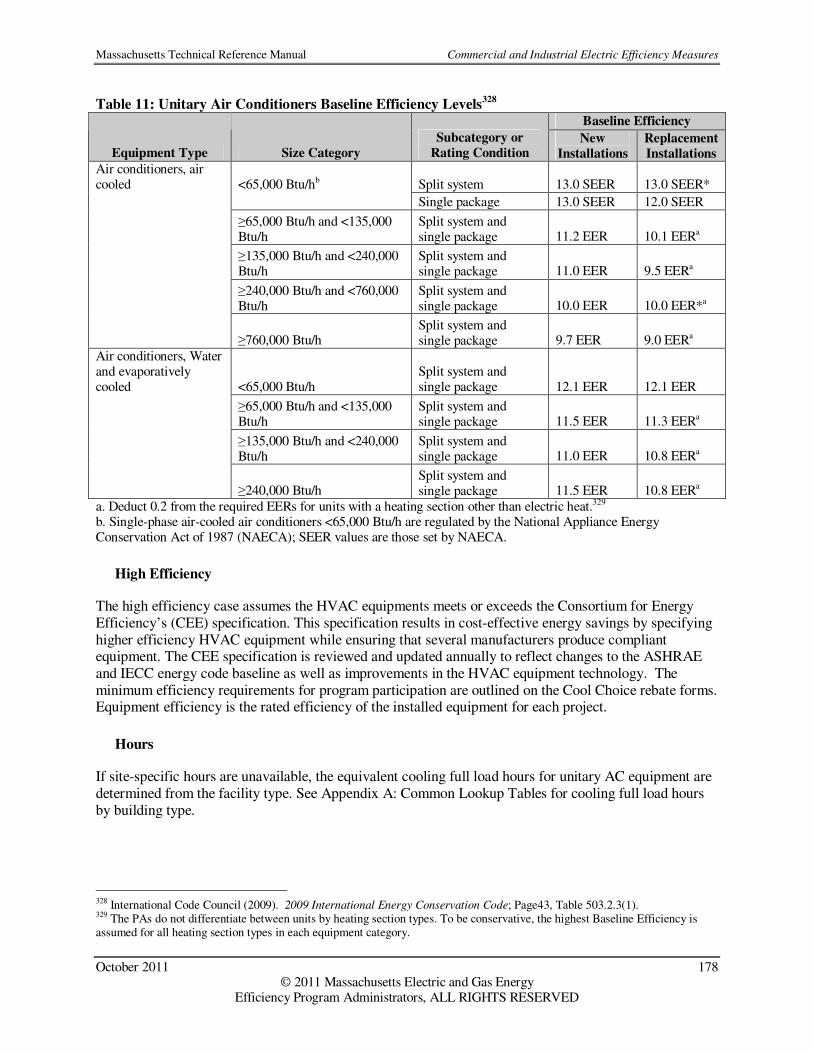
Massachusetts Technical Reference Manual Commercial and Industrial Electric Efficiency Measures
October 2011 178 © 2011 Massachusetts Electric and Gas Energy
Efficiency Program Administrators, ALL RIGHTS RESERVED
Table 11: Unitary Air Conditioners Baseline Efficiency Levels328
Baseline Efficiency
Equipment Type Size Category
Subcategory or
Rating Condition New
Installations
Replacement
Installations
Air conditioners, air cooled <65,000 Btu/hb Split system 13.0 SEER 13.0 SEER*
Single package 13.0 SEER 12.0 SEER
≥65,000 Btu/h and <135,000 Btu/h
Split system and single package 11.2 EER 10.1 EERa
≥135,000 Btu/h and <240,000 Btu/h
Split system and single package 11.0 EER 9.5 EERa
≥240,000 Btu/h and <760,000 Btu/h
Split system and single package 10.0 EER 10.0 EER*a
≥760,000 Btu/h Split system and single package 9.7 EER 9.0 EERa
Air conditioners, Water and evaporatively cooled <65,000 Btu/h
Split system and single package 12.1 EER 12.1 EER
≥65,000 Btu/h and <135,000 Btu/h
Split system and single package 11.5 EER 11.3 EERa
≥135,000 Btu/h and <240,000 Btu/h
Split system and single package 11.0 EER 10.8 EERa
≥240,000 Btu/h Split system and single package 11.5 EER 10.8 EERa
a. Deduct 0.2 from the required EERs for units with a heating section other than electric heat.329 b. Single-phase air-cooled air conditioners <65,000 Btu/h are regulated by the National Appliance Energy Conservation Act of 1987 (NAECA); SEER values are those set by NAECA.
High Efficiency
The high efficiency case assumes the HVAC equipments meets or exceeds the Consortium for Energy Efficiency’s (CEE) specification. This specification results in cost-effective energy savings by specifying higher efficiency HVAC equipment while ensuring that several manufacturers produce compliant equipment. The CEE specification is reviewed and updated annually to reflect changes to the ASHRAE and IECC energy code baseline as well as improvements in the HVAC equipment technology. The minimum efficiency requirements for program participation are outlined on the Cool Choice rebate forms. Equipment efficiency is the rated efficiency of the installed equipment for each project.
Hours
If site-specific hours are unavailable, the equivalent cooling full load hours for unitary AC equipment are determined from the facility type. See Appendix A: Common Lookup Tables for cooling full load hours by building type.
328 International Code Council (2009). 2009 International Energy Conservation Code; Page43, Table 503.2.3(1). 329 The PAs do not differentiate between units by heating section types. To be conservative, the highest Baseline Efficiency is assumed for all heating section types in each equipment category.

Massachusetts Technical Reference Manual Commercial and Industrial Electric Efficiency Measures
October 2011 179 © 2011 Massachusetts Electric and Gas Energy
Efficiency Program Administrators, ALL RIGHTS RESERVED
Measure Life
The measure life is 15 years.330
Secondary Energy Impacts
There are no secondary energy impacts for this measure.
Non-Energy Impacts
There are no non-energy impacts for this measure.
Impact Factors for Calculating Adjusted Gross Savings
Measure Program PA ISR SPF RRE RRSP RRWP CFSP CFWP CFSSP CFWSP
Unitary AC NC CLC 1.00 1.00 1.00 0.74 0.00 0.45 0.00 n/a n/a
Unitary AC NC National Grid 1.00 1.00 1.00 1.00 1.00 0.40 0.00 n/a n/a
Unitary AC NC NSTAR 1.00 1.00 1.00 0.74 0.00 0.45 0.00 n/a n/a
Unitary AC NC Unitil 1.00 1.00 1.00 1.00 1.00 0.33 0.00 n/a n/a
Unitary AC NC WMECO 1.00 1.00 1.91 1.20 1.09 n/a n/a 0.42 0.00
In-Service Rates All installations have 100% in service rate since all programs include verification of equipment installations. Savings Persistence Factor All PAs use 100% savings persistence factors.
Realization Rates � CLC, National Grid, NSTAR, Unitil: Energy RRs set to 1.00 based 2011 NEEP C&I Unitary AC Loadshape
Project.331 The PAs use average evaluation Cooling Hours in the kWh savings calculations. � WMECO: RRs are from 2007/2008 Large C&I Programs impact evaluation332 Coincidence Factors CFs based 2011 NEEP C&I Unitary AC Loadshape Project.333
330 Energy & Resource Solutions (2005). Measure Life Study. Prepared for The Massachusetts Joint Utilities; Table 1-1. 331 KEMA (2011). C&I Unitary AC LoadShape Project – Final Report. Prepared for the Regional Evaluation, Measurement & Verification Forum. 332 KEMA, Inc. (2010). 2007/2008 Large C&I Programs, Phase 1 Report Memo for Lighting and Process Measures. Prepared for Western Massachusetts Electric Company. 333 KEMA (2011). C&I Unitary AC LoadShape Project – Final Report. Prepared for the Regional Evaluation, Measurement & Verification Forum.

Massachusetts Technical Reference Manual Commercial and Industrial Electric Efficiency Measures
October 2011 180 © 2011 Massachusetts Electric and Gas Energy
Efficiency Program Administrators, ALL RIGHTS RESERVED
HVAC – Single Package or Split System Heat Pump Systems
Version Date and Revision History
Effective Date: 1/1/2011 (Revised 1/1/2012) End Date: TBD
Measure Overview
Description: This measure applies to the installation of high-efficiency air cooled, water source, ground water source, and ground source heat pump systems. Primary Energy Impact: Electric Secondary Energy Impact: None Non-Energy Impact: None Sector: Commercial & Industrial Market: Lost Opportunity End Use: HVAC Program: C&I New Construction & Major Renovation
Algorithms for Calculating Primary Energy Impact
For air cooled units with cooling capacities less than 65 kBtu/h:
HeatCool kWhkWhkWh ∆+∆=∆
( ) ( )COOL
EEBASE
Cool EFLHSEERSEER
hkBtukWh
−=∆
11/
( ) ( )HEAT
EEBASE
Heat EFLHHSPFHSPF
hkBtukWh
−=∆
11/
( )
−=∆
EEBASE
CoolEEREER
hkBtukW11
/
For all water source, groundwater source, ground source units, and air cooled units with cooling
capacities equal to or greater than 65 kBtu/h:
HeatCool kWhkWhkWh ∆+∆=∆
( ) ( )COOL
EEBASE
COOLCool EFLHSEERSEER
hkBtukWh
−=∆
11/
( )( )HEAT
EEBASE
HEAT
Heat EFLHCOPCOP
hkBtukWh
−=∆
11
412.3
/
( )
−=∆
EEBASE
CoolEEREER
hkBtukW11
/
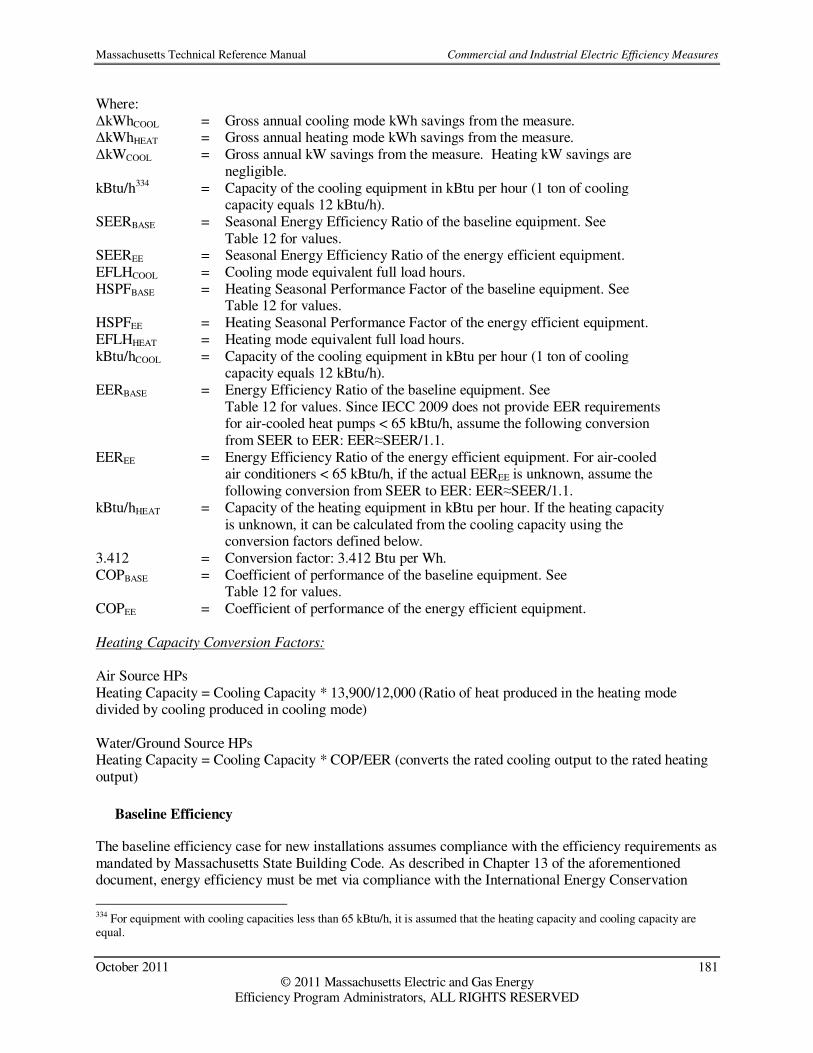
Massachusetts Technical Reference Manual Commercial and Industrial Electric Efficiency Measures
October 2011 181 © 2011 Massachusetts Electric and Gas Energy
Efficiency Program Administrators, ALL RIGHTS RESERVED
Where: ∆kWhCOOL = Gross annual cooling mode kWh savings from the measure. ∆kWhHEAT = Gross annual heating mode kWh savings from the measure. ∆kWCOOL = Gross annual kW savings from the measure. Heating kW savings are
negligible. kBtu/h334 = Capacity of the cooling equipment in kBtu per hour (1 ton of cooling
capacity equals 12 kBtu/h). SEERBASE = Seasonal Energy Efficiency Ratio of the baseline equipment. See
Table 12 for values. SEEREE = Seasonal Energy Efficiency Ratio of the energy efficient equipment. EFLHCOOL = Cooling mode equivalent full load hours. HSPFBASE = Heating Seasonal Performance Factor of the baseline equipment. See
Table 12 for values. HSPFEE = Heating Seasonal Performance Factor of the energy efficient equipment. EFLHHEAT = Heating mode equivalent full load hours. kBtu/hCOOL = Capacity of the cooling equipment in kBtu per hour (1 ton of cooling
capacity equals 12 kBtu/h). EERBASE = Energy Efficiency Ratio of the baseline equipment. See
Table 12 for values. Since IECC 2009 does not provide EER requirements for air-cooled heat pumps < 65 kBtu/h, assume the following conversion from SEER to EER: EER≈SEER/1.1.
EEREE = Energy Efficiency Ratio of the energy efficient equipment. For air-cooled air conditioners < 65 kBtu/h, if the actual EEREE is unknown, assume the following conversion from SEER to EER: EER≈SEER/1.1.
kBtu/hHEAT = Capacity of the heating equipment in kBtu per hour. If the heating capacity is unknown, it can be calculated from the cooling capacity using the conversion factors defined below.
3.412 = Conversion factor: 3.412 Btu per Wh. COPBASE = Coefficient of performance of the baseline equipment. See
Table 12 for values. COPEE = Coefficient of performance of the energy efficient equipment. Heating Capacity Conversion Factors:
Air Source HPs Heating Capacity = Cooling Capacity * 13,900/12,000 (Ratio of heat produced in the heating mode divided by cooling produced in cooling mode) Water/Ground Source HPs Heating Capacity = Cooling Capacity * COP/EER (converts the rated cooling output to the rated heating output)
Baseline Efficiency
The baseline efficiency case for new installations assumes compliance with the efficiency requirements as mandated by Massachusetts State Building Code. As described in Chapter 13 of the aforementioned document, energy efficiency must be met via compliance with the International Energy Conservation
334 For equipment with cooling capacities less than 65 kBtu/h, it is assumed that the heating capacity and cooling capacity are equal.

Massachusetts Technical Reference Manual Commercial and Industrial Electric Efficiency Measures
October 2011 182 © 2011 Massachusetts Electric and Gas Energy
Efficiency Program Administrators, ALL RIGHTS RESERVED
Code (IECC) 2009 with Massachusetts specific amendments. Table 12 details the specific efficiency requirements by equipment type and capacity. The baseline efficiency case for replacement units are not required to meet the IECC 2009. Instead, replacement installations use the Federal Manufacturing standards (indicated in the table with an asterisk) or the ASHREA 2004 standards as baseline, whichever is most rigorous. details the specific efficiency requirements by equipment type and capacity.
Table 12: Unitary and Applied Heat Pumps Baseline Efficiency Levels335
Baseline Efficiency
(New / Replacement) Equipment
Type
Size Category
(Cooling Capacity)
Subcategory or Rating
Condition Cooling Mode Heating Mode
Air cooled <65,000 Btu/hb Split system 13.0 SEER / 13.0 SEER*
7.7 HSPF / 6.6 HSPF
Single package 13.0 SEER / 12.0 SEER
7.7 HSPF / 6.6 HSPF
≥65,000 Btu/h and <135,000 Btu/h
Split system and single package / 47°F db/43°F wb outdoor air
11.0 EERa / 9.9 EER
3.3 COP / 3.2 COP
≥135,000 Btu/h and <240,000 Btu/h
Split system and single package / 47°F db/43°F wb outdoor air
10.6 EERa / 10.6 EER*
3.2 COP / 3.1 COP
≥240,000 Btu/h
Split system and single package / 47°F db/43°F wb outdoor air
9.5 EERa / 9.5 EER
3.2 COP / 3.1 COP
Water source <17,000 Btu/h
86°F entering water (Cooling Mode) / 68°F entering water (Heating Mode)
11.2 EER / 11.2 EER
4.2 COP / 4.2 COP
≥17,000 Btu/h and <135,000 Btu/h
86°F entering water / 68°F entering water (Heating Mode)
12.0 EER / 12.0 EER
4.2 COP / 4.2 COP
Groundwater source <135,000 Btu/h
59°F entering water (Cooling Mode) / 50°F entering water (Heating Mode)
16.2 EER / 16.2 EER
3.6 COP / 3.6 COP
Ground source <135,000 Btu/h
77°F entering water / 32°F entering water (Heating Mode)
13.4 EER / 13.4 EER
3.1 COP / 3.1 COP
db = dry-bulb temperature, °F; wb = wet-bulb temperature, °F. a. Deduct 0.2 from the required EERs for units with a heating section other than electric heat336. b. Single-phase air-cooled air conditioners <65,000 Btu/h are regulated by the National Appliance Energy Conservation Act of 1987 (NAECA); SEER values are those set by NAECA.
High Efficiency
The high efficiency case assumes the HVAC equipments meets or exceeds the Consortium for Energy Efficiency’s (CEE) specification. This specification results in cost-effective energy savings by specifying higher efficiency HVAC equipment while ensuring that several manufacturers produce compliant
335 International Code Council (2009). 2009 International Energy Conservation Code; Page 44, Table 503.2.3(2). 336 The PAs do not differentiate between units by heating section types. To be conservative, the highest baseline efficiency is assumed for all heating section types in each equipment category.
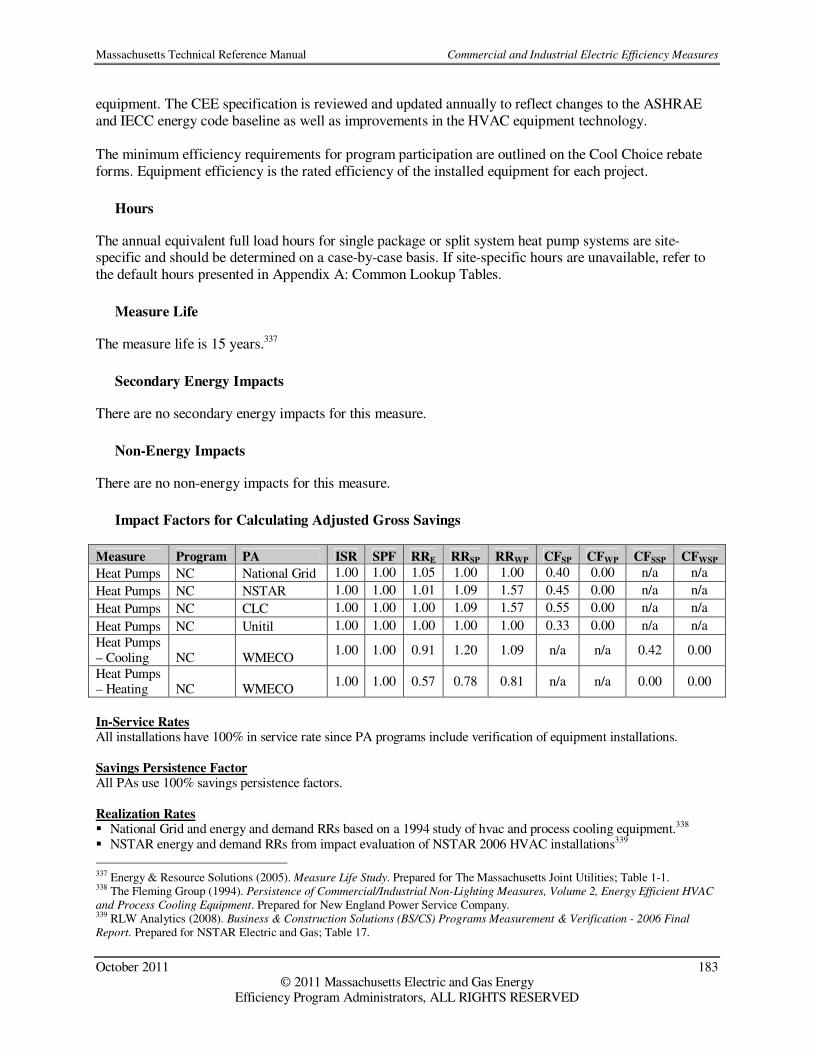
Massachusetts Technical Reference Manual Commercial and Industrial Electric Efficiency Measures
October 2011 183 © 2011 Massachusetts Electric and Gas Energy
Efficiency Program Administrators, ALL RIGHTS RESERVED
equipment. The CEE specification is reviewed and updated annually to reflect changes to the ASHRAE and IECC energy code baseline as well as improvements in the HVAC equipment technology. The minimum efficiency requirements for program participation are outlined on the Cool Choice rebate forms. Equipment efficiency is the rated efficiency of the installed equipment for each project.
Hours
The annual equivalent full load hours for single package or split system heat pump systems are site-specific and should be determined on a case-by-case basis. If site-specific hours are unavailable, refer to the default hours presented in Appendix A: Common Lookup Tables.
Measure Life
The measure life is 15 years.337
Secondary Energy Impacts
There are no secondary energy impacts for this measure.
Non-Energy Impacts
There are no non-energy impacts for this measure.
Impact Factors for Calculating Adjusted Gross Savings
Measure Program PA ISR SPF RRE RRSP RRWP CFSP CFWP CFSSP CFWSP
Heat Pumps NC National Grid 1.00 1.00 1.05 1.00 1.00 0.40 0.00 n/a n/a
Heat Pumps NC NSTAR 1.00 1.00 1.01 1.09 1.57 0.45 0.00 n/a n/a
Heat Pumps NC CLC 1.00 1.00 1.00 1.09 1.57 0.55 0.00 n/a n/a
Heat Pumps NC Unitil 1.00 1.00 1.00 1.00 1.00 0.33 0.00 n/a n/a
Heat Pumps – Cooling NC WMECO
1.00 1.00 0.91 1.20 1.09 n/a n/a 0.42 0.00
Heat Pumps – Heating NC WMECO
1.00 1.00 0.57 0.78 0.81 n/a n/a 0.00 0.00
In-Service Rates All installations have 100% in service rate since PA programs include verification of equipment installations. Savings Persistence Factor All PAs use 100% savings persistence factors.
Realization Rates � National Grid and energy and demand RRs based on a 1994 study of hvac and process cooling equipment.338 � NSTAR energy and demand RRs from impact evaluation of NSTAR 2006 HVAC installations339
337 Energy & Resource Solutions (2005). Measure Life Study. Prepared for The Massachusetts Joint Utilities; Table 1-1. 338 The Fleming Group (1994). Persistence of Commercial/Industrial Non-Lighting Measures, Volume 2, Energy Efficient HVAC
and Process Cooling Equipment. Prepared for New England Power Service Company. 339 RLW Analytics (2008). Business & Construction Solutions (BS/CS) Programs Measurement & Verification - 2006 Final
Report. Prepared for NSTAR Electric and Gas; Table 17.

Massachusetts Technical Reference Manual Commercial and Industrial Electric Efficiency Measures
October 2011 184 © 2011 Massachusetts Electric and Gas Energy
Efficiency Program Administrators, ALL RIGHTS RESERVED
� CLC realization rates same as Unitary AC. � Unitil realization rates same as Unitary AC. � WMECO: RRs are from 2007/2008 Large C&I Programs impact evaluation340 Coincidence Factors � CFs based 2011 NEEP C&I Unitary AC Loadshape Project.341
340 KEMA, Inc. (2011). 2007/2008 Large C&I Programs, 341 KEMA (2011). C&I Unitary AC LoadShape Project – Final Report. Prepared for the Regional Evaluation, Measurement & Verification Forum.

Massachusetts Technical Reference Manual Commercial and Industrial Electric Efficiency Measures
October 2011 185 © 2011 Massachusetts Electric and Gas Energy
Efficiency Program Administrators, ALL RIGHTS RESERVED
HVAC – Dual Enthalpy Economizer Controls (DEEC)
Version Date and Revision History
Effective Date: 1/1/2011 (Revised 1/1/2012) End Date: TBD
Measure Overview
Description: The measure is to upgrade the outside-air dry-bulb economizer to a dual enthalpy economizer. The system will continuously monitor the enthalpy of both the outside air and return air. The system will control the system dampers adjust the outside quantity based on the two readings. Primary Energy Impact: Electric Secondary Energy Impact: None Non-Energy Impact: None Sector: Commercial & Industrial Market: Lost Opportunity, Retrofit End Use: HVAC Program: C&I New Construction and Major Renovation
Algorithms for Calculating Primary Energy Impacts
( ) ( )kWhSAVEhkBtu
TonhkBtukWh
=∆
/12
1/
( ) ( )kWSAVEhkBtu
TonhkBtukW
=∆
/12
1/
Where: kBtu/h = Capacity of the cooling equipment in kBtu per hour (1 ton of cooling capacity equals
12 kBtu/h). SAVEkWh = Average annual kWh reduction per ton of cooling capacity: 289 kWh/ton342 SAVEkW = Average kW reduction per ton of cooling capacity: 0.289 kW/ton343
Baseline Efficiency
The baseline efficiency case for this measure assumes the relevant HVAC equipment is operating with a fixed dry-bulb economizer.
High Efficiency
The high efficiency case is the installation of an outside air economizer utilizing two enthalpy sensors, one for outdoor air and one for return air.
342 Patel, Dinesh (2001). Energy Analysis: Dual Enthalpy Control. Prepared for NSTAR. 343 Ibid.

Massachusetts Technical Reference Manual Commercial and Industrial Electric Efficiency Measures
October 2011 186 © 2011 Massachusetts Electric and Gas Energy
Efficiency Program Administrators, ALL RIGHTS RESERVED
Hours
Not applicable.
Measure Life
The measure life is 10 years for lost-opportunity applications.344 The measure life is 7 years for retrofit installations.345
Secondary Energy Impacts
There are no secondary energy impacts for this measure.
Non-Energy Impacts
There are no non-energy impacts for this measure.
Impact Factors for Calculating Adjusted Gross Savings
Measure Program PA ISR SPF RRE RRSP RRWP CFSP CFWP CFSSP CFWSP
DEEC NC National Grid 1.00 1.00 1.00 1.00 1.00 0.40 0.00 n/a n/a
DEEC NC NSTAR 1.00 1.00 1.01 1.09 1.57 0.45 0.00 n/a n/a
DEEC NC CLC 1.00 1.00 1.00 1.09 1.57 0.55 0.00 n/a n/a
DEEC NC Unitil 1.00 1.00 1.00 1.00 1.00 0.332 0.00 n/a n/a
DEEC NC WMECO 1.00 1.00 0.91 1.20 1.09 n/a n/a 0.00 0.00
In-Service Rates All installations have 100% in service rate since PA programs include verification of equipment installations. Savings Persistence Factor All PAs use 100% savings persistence factors. . Realization Rates � National Grid RRs are 1.0 since there have been no impact evaluations of the prescriptive savings calculations. � NSTAR energy and demand RRs from impact evaluation of NSTAR 2006 HVAC installations346 � CLC realization rates same as Unitary AC. � Unitil realization rates same as Unitary AC. � WMECO: RRs are from 2007/2008 Large C&I Programs impact evaluation.347
Coincidence Factors � National Grid, NSTAR, CLC, Unitil: CFs based 2011 NEEP C&I Unitary AC Loadshape Project348. � WMECO: CFs set to 0.00 since no DEEC savings are occur during seasonal peak periods.
344 Energy & Resource Solutions (2005). Measure Life Study. Prepared for The Massachusetts Joint Utilities; Table 1-1 345 GDS Associates, Inc. (2007). Measure Life Report: Residential and Commercial/Industrial Lighting and HVAC Measures. Prepared for The New England State Program Working Group; Table 2. 346 RLW Analytics (2008). Business & Construction Solutions (BS/CS) Programs Measurement & Verification - 2006 Final
Report. Prepared for NSTAR Electric and Gas; Table 17. 347 KEMA, Inc. (2011). 2007/2008 Large C&I Programs, 348 KEMA (2011). C&I Unitary AC LoadShape Project – Final Report. Prepared for the Regional Evaluation, Measurement & Verification Forum.

Massachusetts Technical Reference Manual Commercial and Industrial Electric Efficiency Measures
October 2011 187 © 2011 Massachusetts Electric and Gas Energy
Efficiency Program Administrators, ALL RIGHTS RESERVED
HVAC – ECM Fan Motors
Version Date and Revision History
Effective Date: 1/1/2011 (Revised 1/1/2012) End Date: TBD
Measure Overview
Description: This measure is offered through the Cool Choice program and promotes the installation of electronically commutated motors (ECMs) on fan powered terminal boxes, fan coils, and HVAC supply fans on small unitary equipment. Primary Energy Impact: Electric Secondary Energy Impact: None Non-Energy Impact: None Sector: Commercial & Industrial Market: Lost Opportunity End Use: HVAC Program: C&I New Construction & Major Renovation
Algorithms for Calculating Electric Energy Impact
( )( )( )( )HoursFlowFactorSizeBoxCFMDesignkWh ANNUAL%=∆
( )( )( )SPSP FlowFactorSizeBoxCFMDesignkW %=∆
( )( )( )WPWP FlowFactorSizeBoxCFMDesignkW %=∆
Where: Design CFM = Capacity of the VAV box in cubic feet per minute Box Size Factor = Savings factor in Watts/CFM. See Table 13 for values.
%FlowANNUAL = Average % of design flow over all operating hours. See Table 13 for values. %Flow SP = Average % of design flow during summer peak period. See Table 13 for values. %Flow WP = Average % of design flow during summer peak period. See Table 13 for values. Hours = Annual operating hours for VAV box fans
Table 13: ECM Fan Motor Savings Factors 349
Factor Box Size Value Units
Box Size Factor < 1000 CFM 0.32 Watts/CFM Box Size Factor ≥ 1000 CFM 0.21 Watts/CFM %FlowANNUAL All 0.52 - %Flow SP All 0.63 - %Flow WP All 0.33 -
349 Factors based on engineering analysis developed at National Grid.

Massachusetts Technical Reference Manual Commercial and Industrial Electric Efficiency Measures
October 2011 188 © 2011 Massachusetts Electric and Gas Energy
Efficiency Program Administrators, ALL RIGHTS RESERVED
Baseline Efficiency
The baseline efficiency case for this measure assumes the VAV box fans are powered by a single speed fractional horsepower permanent split capacitor (PSC) induction motor.
High Efficiency
The high efficiency case must have a motor installed on new, qualifying HVAC equipment.
Hours
The annual operating hours for ECMs on VAV box fans are site-specific and should be determined on a case-by-case basis.
Measure Life
The measure life is 20 years for lost-opportunity applications.350
Algorithms for Calculating Secondary Energy Impacts
There are no secondary energy impacts for this measure.
Non-Energy Impacts
There are no non-energy impacts for this measure.
Impact Factors for Calculating Adjusted Gross Savings
Measure Program PA ISR SPF RRE RRSP RRWP CFSP CFWP CFSSP CFWSP
ECM Fan Motors NC National Grid 1.00 1.00 1.00 1.00 1.00 1.00 1.00 n/a n/a
ECM Fan Motors NC NSTAR, CLC 1.00 1.00 1.01 1.09 1.57 0.82 0.05 n/a n/a
ECM Fan Motors NC Unitil 1.00 1.00 1.00 1.00 1.00 1.00 0.82 n/a n/a
ECM Fan Motors NC WMECO 1.00 1.00 1.31 0.85 0.60 n/a n/a 0.72 0.00
In-Service Rates All installations have 100% in service rate since all PAs programs include verification of equipment installations. Savings Persistence Factor All PAs use 100% savings persistence factors.
Realization Rates � National Grid: RRs based on engineering estimates � NSTAR, CLC: energy and demand RRs from impact evaluation of NSTAR 2006 HVAC installations351 � Unitil: energy and demand RRs are 100% for all C&I New Construction projects based on no evaluations � WMECO: RRs are from 2007/2008 Large C&I Programs impact evaluation352
350 Energy & Resource Solutions (2005). Measure Life Study. Prepared for The Massachusetts Joint Utilities; Table 1-1. 351 RLW Analytics (2008). Business & Construction Solutions (BS/CS) Programs Measurement & Verification - 2006 Final
Report. Prepared for NSTAR Electric and Gas; Table 17. 352 KEMA, Inc. (2011). 2007/2008 Large C&I Programs,

Massachusetts Technical Reference Manual Commercial and Industrial Electric Efficiency Measures
October 2011 189 © 2011 Massachusetts Electric and Gas Energy
Efficiency Program Administrators, ALL RIGHTS RESERVED
Coincidence Factors � National Grid: CFs based on engineering estimates. � NSTAR, CLC, Unitil: CFs based on standard assumptions. � WMECO: CFs from 2005 coincidence factor study.353
353 RLW Analytics (2007). Final Report, 2005 Coincidence Factor Study. Prepared for Connecticut Energy Conservation Management Board, United Illuminating and Connecticut Light & Power.

Massachusetts Technical Reference Manual Commercial and Industrial Electric Efficiency Measures
October 2011 190 © 2011 Massachusetts Electric and Gas Energy
Efficiency Program Administrators, ALL RIGHTS RESERVED
HVAC – Energy Management System
Version Date and Revision History
Effective Date: 1/1/2011 (Revised 1/1/2012) End Date: TBD
Measure Overview
Description: The measure is the installation of a new building energy management system (EMS) or the expansion of an existing energy management system for control of non-lighting electric and gas end-uses in an existing building on existing equipment. Primary Energy Impact: Electric Secondary Energy Impact: Gas, Oil Non-Energy Impact: None Sector: Commercial & Industrial Market: Retrofit End Use: HVAC Program: C&I New Construction & Major Renovation, C&I Large Retrofit, C&I Small Retrofit
Algorithms for Calculating Primary Energy Impacts
Gross energy and demand savings for energy management systems (EMS) are custom calculated using the PA’s EMS savings calculation tools. These tools are used to calculate energy and demand savings based on project-specific details including hours of operation, HVAC system equipment and efficiency and points controlled.354
Baseline Efficiency
The baseline for this measure assumes the relevant HVAC equipment has no control.
High Efficiency
The high efficiency case is the installation of a new EMS or the expansion of an existing EMS to control additional non-lighting electric or gas equipment. The EMS must be installed in an existing building on existing equipment.
Hours
Not applicable.
Measure Life
For lost-opportunity applications, the measure life is 15 years355. For retrofit applications, the measure life is 10 years356. 354 Descriptions of the EMS savings calculation tools are included in the TRM Library “C&I Spreadsheet Tools” folder. 355 Energy & Resource Solutions (2005). Measure Life Study. Prepared for The Massachusetts Joint Utilities; Table 1-1. 356 Ibid.

Massachusetts Technical Reference Manual Commercial and Industrial Electric Efficiency Measures
October 2011 191 © 2011 Massachusetts Electric and Gas Energy
Efficiency Program Administrators, ALL RIGHTS RESERVED
Secondary Energy Impacts
Heating Impacts: Gas and oil heat impacts are counted for EMS measures for reduction in space heating. If the heating system impacts are not calculated in the EMS savings calculation tool, they can be approximated using the interaction factors described below:
Measure Energy Type Impact (MMBtu/∆kWh)357
EMS C&I Gas Heat 0.001277
EMS Oil 0.002496
Non-Energy Impacts
There are no non-energy impacts for this measure.
Impact Factors for Calculating Adjusted Gross Savings
Measure Program PA ISR SPF RRE RRSP RRWP CFSP CFWP CFSSP CFWSP
EMS Large Retrofit National Grid 1.00 1.00 1.04 1.03 1.03 custom custom n/a n/a
EMS Large Retrofit NSTAR, CLC 1.00 1.00 1.01 1.09 1.57 0.82 0.05 n/a n/a
EMS Large Retrofit Unitil 1.00 1.00 1.00 1.00 1.00 1.82 0.05 n/a n/a
EMS Large Retrofit WMECO 1.00 1.00 0.57 0.78 0.81 n/a n/a custom custom
EMS Small Retrofit CLC 1.00 1.00 1.01 1.09 1.57 0.82 0.05 n/a n/a
In-Service Rates All installations have 100% in service rate since all PAs programs include verification of equipment installations. Savings Persistence Factor All PAs use 100% savings persistence factors. Realization Rates � National Grid RRs derived from a 1994 study of hvac and process cooling equipment.358 � NSTAR, CLC energy and demand RRs from impact evaluation of NSTAR 2006 HVAC installations359 � Unitil: energy and demand RRs are 100% for all C&I New Construction projects based on no evaluations � WMECO: RRs are based on end use from 2007/2008 Large C&I Programs impact evaluation360 Coincidence Factors � National Grid, WMECO: CFs are custom calculated. � NSTAR, CLC, Unitil: CFs based on standard assumptions.
357 Optimal Energy, Inc. (2008). MEMO: Non-Electric Benefits Analysis Update. Prepared for NSTAR. Final savings values calculated in spreadsheet analysis as noted on pg 5 of the memo. 358 The Fleming Group (1994). Persistence of Commercial/Industrial Non-Lighting Measures, Volume 3, Energy Management
Control Systems. Prepared for New England Power Service Company. 359 RLW Analytics (2008). Business & Construction Solutions (BS/CS) Programs Measurement & Verification - 2006 Final
Report. Prepared for NSTAR Electric and Gas; Table 17. 360 KEMA, Inc. (2011). 2007/2008 Large C&I Programs,

Massachusetts Technical Reference Manual Commercial and Industrial Electric Efficiency Measures
October 2011 192 © 2011 Massachusetts Electric and Gas Energy
Efficiency Program Administrators, ALL RIGHTS RESERVED
HVAC – High Efficiency Chiller
Version Date and Revision History
Effective Date: 1/1/2011 (Revised 1/1/2012) End Date: TBD
Measure Overview
Description: This measure promotes the installation of efficient water-cooled and air-cooled water chilling packages for comfort cooling applications. Eligible chillers include air-cooled, water cooled rotary screw and scroll, and water cooled centrifugal chillers for single chiller systems or for the lead chiller only in multi-chiller systems. Primary Energy Impact: Electric Secondary Energy Impact: None Non-Energy Impact: None Sector: Commercial & Industrial Market: Lost Opportunity End Use: HVAC Program: C&I New Construction & Major Renovation
Algorithms for Calculating Primary Energy Impacts
Gross energy and demand savings for chiller installations may be custom calculated using the PA’s Chillers savings calculation tool. These tools are used to calculated energy and demand savings based on site-specific chiller plant details including specific chiller plan equipment, operational staging, operating load profile and load profile.361 Alternatively, the energy and demand savings may be calculated using the following algorithms and inputs. Please note that consistent efficiency types (FL or IPLV) must be used between the baseline and high efficiency cases:
Air-Cooled Chillers:
( ) ( )HoursEEREER
TonskWhEEBASE
−=∆
1212
( ) ( )LFEEREER
TonskWEEBASE
−=∆
1212
Water-Cooled Chillers:
( )( )HourstonkWtonkWTonskWh EEBASE //)( −=∆
361 Descriptions of the Chiller savings calculation tools are included in the TRM Library “C&I Spreadsheet Tools” folder.

Massachusetts Technical Reference Manual Commercial and Industrial Electric Efficiency Measures
October 2011 193 © 2011 Massachusetts Electric and Gas Energy
Efficiency Program Administrators, ALL RIGHTS RESERVED
( )( )LFtonkWtonkWTonskW EEBASE //)( −=∆
Where: Tons = Rated capacity of the cooling equipment EERBASE = Energy Efficiency Ratio of the baseline equipment. See Table 14 for values. EEREE = Energy Efficiency Ratio of the efficient equipment. Site-specific. kW/tonBASE = Energy efficiency rating of the baseline equipment. See Table 14 for values. kW/tonEE = Energy efficiency rating of the efficient equipment. Site-specific. Hours = Equivalent full load hours for chiller operation LF = Load Factor. See table below
Baseline Efficiency
The baseline efficiency case assumes compliance with the efficiency requirements as mandated by Massachusetts State Building Code. As described in Chapter 13 of the aforementioned document, energy efficiency must be met via compliance with the International Energy Conservation Code (IECC) 2009. Table 14 details the specific efficiency requirements by equipment type and capacity. Table 14: Water Chilling Packages - Minimum Efficiency Requirements
364
Path A Path B
Equipment Type
Size Category
(Tons) Units Full Load IPLV Full Load IPLV
< 150 EER 9.562 12.5 NA NA Air-cooled chillers
≥ 150 EER 9.562 12.75 NA NA < 75 kW/ton 0.780 0.63 0.800 0.600
≥ 75 and < 150 kW/ton 0.775 0.615 0.790 0.586 ≥ 150 and < 300 kW/ton 0.680 0.580 0.718 0.540
Water cooled, electrically operated, positive displacement (rotary screw and scroll) ≥ 300 kW/ton 0.620 0.540 0.639 0.490
< 150 kW/ton 0.634 0.596 0.639 0.450 ≥ 150 and < 300 kW/ton 0.634 0.596 0.639 0.450 ≥ 300 and < 600 kW/ton 0.576 0.549 0.600 0.400
Water cooled, electrically operated, centrifugal
≥ 600 kW/ton 0.570 0.539 0.590 0.400 Note: Compliance with this standard may be obtained by meeting the minimum requirements of Path A or B, however, both the Full Load and
IPLV must be met to fulfill the requirements of Path A or B.
362 National Grid load factors based on 1994 study. 363 WMECO load factors based on staff estimates. 364 DOE (2009). 2009 IECC Based Building Codes; Table 503.2.3(7): Water Chilling Packages, Efficiency Requirements - as of 1/1/2010 minimum efficiency values.
Load Factor362,363
Equipment Type PA
Full Load IPLV
Air-cooled chillers National Grid 0.715 Water cooled chillers < 300 Tons National Grid 0.882 0.823 Water cooled chillers > 300 Tons National Grid 0.762 0.765
All WMECO 0.80 0.80 All CLC Site Specific Site Specific

Massachusetts Technical Reference Manual Commercial and Industrial Electric Efficiency Measures
October 2011 194 © 2011 Massachusetts Electric and Gas Energy
Efficiency Program Administrators, ALL RIGHTS RESERVED
High Efficiency
The high efficiency scenario assumes water chilling packages that exceed the efficiency levels required by Massachusetts State Building Code and meet the minimum efficiency requirements as stated in the New Construction HVAC energy efficiency rebate forms. Energy and demand savings calculations are based on actual equipment efficiencies should be determined on a case-by-case basis.
Hours
The equivalent full load hours of operation for water chilling packages are site-specific and should be determined on a case-by-case basis. If site-specific EFLH is unavailable, refer to the default hours presented in Appendix A: Table 51.
Measure Life
The measure life is 23 years.365
Secondary Energy Impacts
There are no secondary energy impacts counted for this measure.
Non-Energy Impacts
There are no non-energy impacts for this measure.
Impact Factors for Calculating Adjusted Gross Savings
Measure Program PA ISR SPF RRE RRSP RRWP CFSP CFWP CFSSP CFWSP
Chillers NC National Grid 1.00 1.00 1.04 1.00 1.00 1.00 0.00 n/a n/a
Chillers NC NSTAR, CLC 1.00 1.00 1.01 1.09 1.57 0.82 0.05 n/a n/a
Chillers NC Unitil 1.00 1.00 1.00 1.00 1.00 1.00 0.00 n/a n/a
Chillers NC WMECO 1.00 1.00 0.91 1.20 1.09 n/a n/a custom custom
In-Service Rates All installations have 100% in service rate since all PAs programs include verification of equipment installations.
Savings Persistence Factor All PAs use 100% savings persistence factors. Realization Rates � National Grid energy RRs based on a 1994 study of hvac and process cooling equipment.366 � NSTAR, CLC energy and demand RRs from impact evaluation of NSTAR 2006 HVAC installations367 � Unitil: energy and demand RRs are 100% for all C&I New Construction projects based on no evaluations � WMECO: RRs are based on end use from 2007/2008 Large C&I Programs impact evaluation368
365 GDS Associates, Inc. (2007). Measure Life Report: Residential and Commercial/Industrial Lighting and HVAC Measures. Prepared for The New England State Program Working Group. 366 The Fleming Group (1994). Persistence of Commercial/Industrial Non-Lighting Measures, Volume 2, Energy Efficient HVAC
and Process Cooling Equipment. Prepared for New England Power Service Company. 367 RLW Analytics (2008). Business & Construction Solutions (BS/CS) Programs Measurement & Verification - 2006 Final
Report. Prepared for NSTAR Electric and Gas; Table 17.
Massachusetts Technical Reference Manual Commercial and Industrial Electric Efficiency Measures
October 2011 195 © 2011 Massachusetts Electric and Gas Energy
Efficiency Program Administrators, ALL RIGHTS RESERVED
Coincidence Factors � National Grid: CFs estimated based on 1993-1994 evaluation research and engineering estimates. � NSTAR, CLC, Unitil: CFs based on standard assumptions. � Unitil CFs set to 1.0 for summer and 0.0 for winter since no space cooling savings during winter. � WMECO: CFs are custom calculated
368 KEMA, Inc. (2011). 2007/2008 Large C&I Programs,

Massachusetts Technical Reference Manual Commercial and Industrial Electric Efficiency Measures
October 2011 196 © 2011 Massachusetts Electric and Gas Energy
Efficiency Program Administrators, ALL RIGHTS RESERVED
HVAC – Hotel Occupancy Sensors
Version Date and Revision History
Effective Date: 1/1/2011 (Revised 1/1/2012) End Date: TBD
Measure Overview
Description: The measure is to the installation of hotel occupancy sensors (HOS) to control packaged terminal AC units (PTACs) with electric heat, heat pump units and/or fan coil units in hotels that operate all 12 months of the year. Primary Energy Impact: Electric Secondary Energy Impact: None Non-Energy Impact: None Sector: Commercial & Industrial Market: Retrofit End Use: HVAC Program: C&I Large Retrofit, C&I Small Retrofit
Algorithms for Calculating Primary Energy Impacts
Unit savings are deemed based on evaluation results:
kWhSAVEkWh =∆
kWSAVEkW =∆
Where: Unit = Installed hotel room occupancy sensor SAVEkWh = Average annual kWh reduction per unit: 438 kWh369 SAVEkW = Average annual kWh reduction per unit: 0.09 kW370
Baseline Efficiency
The baseline efficiency case assumes the equipment has no occupancy based controls.
High Efficiency
The high efficiency case is the installation of controls that include (a) occupancy sensors, (b) window/door switches for rooms that have operable window or patio doors, and (c) set back to 65 F in the heating mode and set forward to 78 F in the cooling mode when occupancy detector is in the unoccupied mode. Sensors controlled by a front desk system are not eligible.
369 MassSave (2010). Energy Analysis: Hotel Guest Occupancy Sensors. Prepared for National Grid and NSTAR. 370 Ibid.
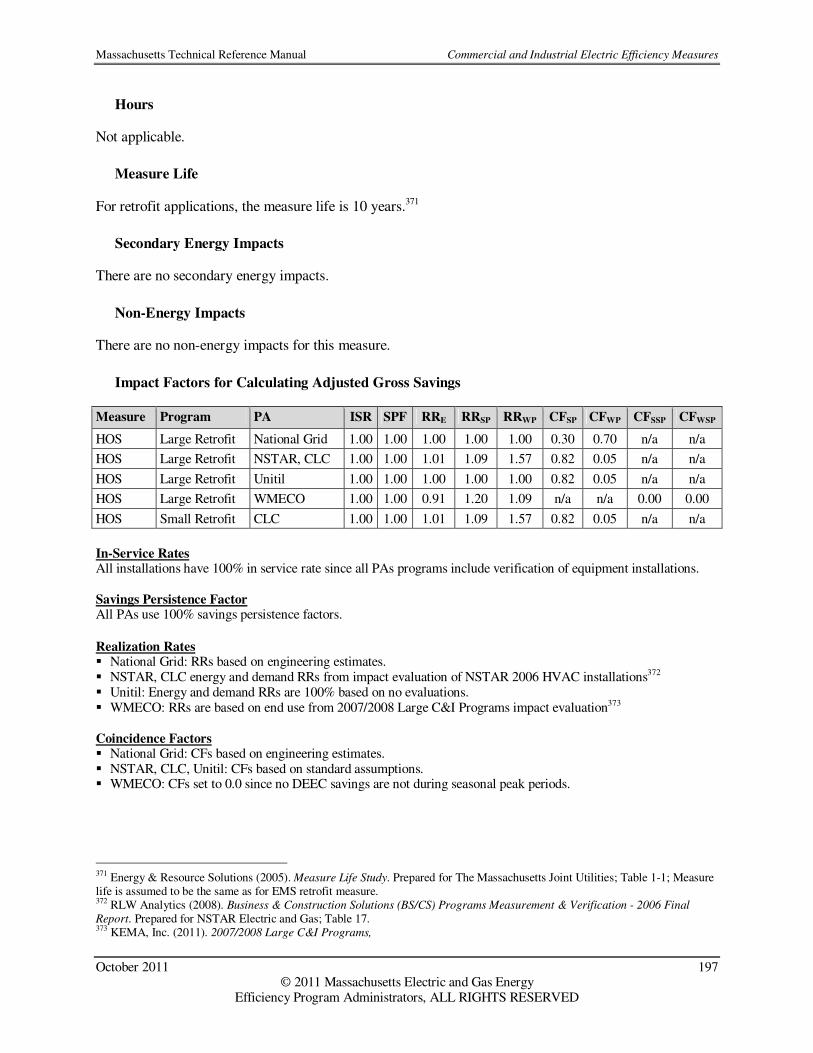
Massachusetts Technical Reference Manual Commercial and Industrial Electric Efficiency Measures
October 2011 197 © 2011 Massachusetts Electric and Gas Energy
Efficiency Program Administrators, ALL RIGHTS RESERVED
Hours
Not applicable.
Measure Life
For retrofit applications, the measure life is 10 years.371
Secondary Energy Impacts
There are no secondary energy impacts.
Non-Energy Impacts
There are no non-energy impacts for this measure.
Impact Factors for Calculating Adjusted Gross Savings
Measure Program PA ISR SPF RRE RRSP RRWP CFSP CFWP CFSSP CFWSP
HOS Large Retrofit National Grid 1.00 1.00 1.00 1.00 1.00 0.30 0.70 n/a n/a
HOS Large Retrofit NSTAR, CLC 1.00 1.00 1.01 1.09 1.57 0.82 0.05 n/a n/a
HOS Large Retrofit Unitil 1.00 1.00 1.00 1.00 1.00 0.82 0.05 n/a n/a
HOS Large Retrofit WMECO 1.00 1.00 0.91 1.20 1.09 n/a n/a 0.00 0.00
HOS Small Retrofit CLC 1.00 1.00 1.01 1.09 1.57 0.82 0.05 n/a n/a
In-Service Rates All installations have 100% in service rate since all PAs programs include verification of equipment installations. Savings Persistence Factor All PAs use 100% savings persistence factors.
Realization Rates � National Grid: RRs based on engineering estimates. � NSTAR, CLC energy and demand RRs from impact evaluation of NSTAR 2006 HVAC installations372 � Unitil: Energy and demand RRs are 100% based on no evaluations. � WMECO: RRs are based on end use from 2007/2008 Large C&I Programs impact evaluation373 Coincidence Factors � National Grid: CFs based on engineering estimates. � NSTAR, CLC, Unitil: CFs based on standard assumptions. � WMECO: CFs set to 0.0 since no DEEC savings are not during seasonal peak periods.
371 Energy & Resource Solutions (2005). Measure Life Study. Prepared for The Massachusetts Joint Utilities; Table 1-1; Measure life is assumed to be the same as for EMS retrofit measure. 372 RLW Analytics (2008). Business & Construction Solutions (BS/CS) Programs Measurement & Verification - 2006 Final
Report. Prepared for NSTAR Electric and Gas; Table 17. 373 KEMA, Inc. (2011). 2007/2008 Large C&I Programs,

Massachusetts Technical Reference Manual Commercial and Industrial Electric Efficiency Measures
October 2011 198 © 2011 Massachusetts Electric and Gas Energy
Efficiency Program Administrators, ALL RIGHTS RESERVED
HVAC – Programmable Thermostats
Version Date and Revision History
Effective Date: 1/1/2011 (Revised 1/1/2012) End Date: TBD
Measure Overview
Description: This measure involves the installation of a programmable thermostat for cooling and/or heating systems in spaces with either no or erratic existing control. Primary Energy Impact: Electric Secondary Energy Impact: None Non-Energy Impact: None Sector: Commercial & Industrial Market: Retrofit End Use: HVAC Program: C&I Small Retrofit
Algorithms for Calculating Primary Energy Impacts
( )( )kWhSAVESQFTkWh =∆
( )( )kWSAVESQFTkW =∆
Where: SQFT = Square feet of controlled space SAVEkWh = Average kW reduction per SQFT of controlled space. See Table 15. SAVEkW = Average annual kWh reduction per SQFT of controlled. See Table 15.
Table 15: Savings Factors (Save)374
Equipment Type SAVEkWh (kWh/SQFT) SAVEkW (kW/SQFT)
Cool Only No Existing Control 0.539 0.00 Cool Only Erratic Existing Control 0.154 0.00 Heat Only No Existing Control 0.418 0.00 Heat Only Erratic Existing Control 0.119 0.00 Cool and Heat No Existing Control 0.957 0.00 Cool and Heat Erratic Existing Control 0.273 0.00 Heat Pump No Existing Control 0.848 0.00 Heat Pump Erratic Existing Control 0.242 0.00
Baseline Efficiency
The baseline efficiency case includes spaces with either no or erratic heating and/or cooling control as indicated in the equipment type selection.
374 Massachusetts common assumptions.

Massachusetts Technical Reference Manual Commercial and Industrial Electric Efficiency Measures
October 2011 199 © 2011 Massachusetts Electric and Gas Energy
Efficiency Program Administrators, ALL RIGHTS RESERVED
High Efficiency
The high efficiency case includes control of the space cooling and/or heating system as indicated in the equipment type selection.
Hours
Not applicable.
Measure Life
For retrofit applications, the measure life is 8 years.375
Secondary Energy Impacts
There are no secondary energy impacts for this measure.
Non-Energy Impacts
There are no non-energy impacts for this measure.
Impact Factors for Calculating Adjusted Gross Savings
Measure Program PA ISR SPF RRE RRSP RRWP CFSP CFWP CFSSP CFWSP
Thermostats Small Retrofit National Grid 1.00 1.00 1.00 1.00 1.00 0.00 0.00 n/a n/a
Thermostats Small Retrofit NSTAR, CLC 1.00 1.00 0.91 0.92 0.92 0.00 0.00 n/a n/a
Thermostats Small Retrofit Unitil 1.00 1.00 1.00 1.00 1.00 0.00 0.00 n/a n/a
Thermostats Small Retrofit WMECO 1.00 1.00 1.00 1.00 1.00 n/a n/a 0.00 0.00
In-Service Rates All installations have 100% in service rate since PA programs include verification of equipment installations. Savings Persistence Factor All PAs use 100% savings persistence factor. Realization Rates � National Grid, Unitil: RRs set to 100% based on no evaluations. � NSTAR, CLC: RRs based on NSTAR 2002-2004 small retrofit program impact evaluations. � WMECO: RRs from impact evaluation of 2008 small retrofit program.376 � Coincidence Factors � National Grid, WMECO, Unitil, NSTAR, CLC: CFs set to zero since no savings are expected during peak
periods.
375 Energy & Resource Solutions (2005). Measure Life Study. Prepared for The Massachusetts Joint Utilities; Table 1-1. 376 The Cadmus Group, Inc. (2010). Western Massachusetts Small Business Energy Advantage Impact Evaluation Report
Program Year 2008. Prepared for Western Massachusetts Electric Company.

Massachusetts Technical Reference Manual Commercial and Industrial Electric Efficiency Measures
October 2011 200 © 2011 Massachusetts Electric and Gas Energy
Efficiency Program Administrators, ALL RIGHTS RESERVED
Refrigeration – Door Heater Controls
Version Date and Revision History
Effective Date: 1/1/2011 (Revised 1/1/2012) End Date: TBD
Measure Overview
Description: Installation of controls to reduce the run time of door and frame heaters for freezers and walk-in or reach-in coolers. The reduced heating results in a reduced cooling load.377 Primary Energy Impact: Electric Secondary Energy Impact: None Non-Energy Impact: None Sector: Commercial & Industrial Market: Retrofit End Use: Refrigeration Program: C&I Small Retrofit
Algorithms for Calculating Primary Energy Impact
8760*%* OFFkWkWh DH=∆
OFFkWkW DH %*=∆
Where: kWDH = Total demand of the door heater, calculated as Volts * Amps / 1000 8760 = Door heater annual run hours before controls %OFF Door heater Off time378: 46% for freezer door heaters or 74% for cooler door
heaters)
Baseline Efficiency
The baseline efficiency case is a cooler or freezer door heater that operates 8,760 hours per year without any controls.
High Efficiency
The high efficiency case is a cooler or freezer door heater connected to a heater control system, which controls the door heaters by measuring the ambient humidity and temperature of the store, calculating the dewpoint, and using pulse width modulation (PWM) to control the anti-sweat heater based on specific algorithms for freezer and cooler doors. Door temperature is typically maintained about 5oF above the store air dewpoint temperature.379
377 The assumptions and algorithms used in this section are specific to NRM products. 378 The value is an estimate by NRM based on hundreds of downloads of hours of use data from Door Heater controllers. These values are also supported by Select Energy Services, Inc. (2004). Cooler Control Measure Impact Spreadsheet User’s Manual. Prepared for NSTAR. 379 Select Energy Services, Inc. (2004). Analysis of Cooler Control Energy Conservation Measures. Prepared for NSTAR.

Massachusetts Technical Reference Manual Commercial and Industrial Electric Efficiency Measures
October 2011 201 © 2011 Massachusetts Electric and Gas Energy
Efficiency Program Administrators, ALL RIGHTS RESERVED
Hours
Pre-retrofit hours are 8,760 hours per year. After controls are installed, the door heaters in freezers are on for an average 4,730.4 hours/year (46% off time) and the door heaters for coolers are on for an average 2,277.6 hours/year (74% off time).
Measure Life
The measure life for cooler and freezer door heater controls is 10 years.380
Secondary Energy Impacts
There are no secondary energy impacts for this measure.
Non-Energy Impacts
There are no non-energy impacts for this measure.
Impact Factors for Calculating Adjusted Gross Savings
Measure Program PA ISR SPF RRE RRSP RRWP CFSP CFWP CFSSP CFWSP
Door Heater Control Small Retrofit National Grid 1.00 1.00 1.00 1.00 1.00 0.50 1.00 n/a n/a
Door Heater Control Small Retrofit NSTAR, CLC 1.00 1.00 0.91 0.92 0.92 0.50 1.00 n/a n/a
Door Heater Control Small Retrofit Unitil 1.00 1.00 1.00 1.00 1.00 0.50 1.00 n/a n/a
Door Heater Control Small Retrofit WMECO 1.00 1.00 0.86 0.57 0.57 n/a n/a 0.10 0.10
In-Service Rates All installations have 100% in service rate since all PAs’ programs include verification of equipment installations. Savings Persistence Factor All PAs use 100% savings persistence factor. Realization Rates � National Grid: energy RR based on staff estimates. � NSTAR, CLC: RRs based on NSTAR 2002-2004 small retrofit program impact evaluations. � Unitil: RRs set to 100% based on no evaluations. � WMECO: RRs from impact evaluation of 2008 small retrofit program.381 Coincidence Factors � National Grid, Unitil, NSTAR, CLC: CFs from the 1995 HEC study of walk-in cooler anti-sweat door heater
controls.382 � WMECO: CFs based on staff estimates.
380 Energy & Resource Solutions (2005). Measure Life Study. Prepared for The Massachusetts Joint Utilities; Table 1-1. 381 The Cadmus Group, Inc. (2010). Western Massachusetts Small Business Energy Advantage Impact Evaluation Report
Program Year 2008. Prepared for Western Massachusetts Electric Company. 382 HEC, Inc. (1995). Analysis of Door Master Walk-In Cooler Anti-Sweat Door Heater Controls Installed at Ten Sites in
Massachusetts. Prepared for New England Power Service Company; Table 9. Adjusted to account for updated RR.
Massachusetts Technical Reference Manual Commercial and Industrial Electric Efficiency Measures
October 2011 202 © 2011 Massachusetts Electric and Gas Energy
Efficiency Program Administrators, ALL RIGHTS RESERVED
Refrigeration – Novelty Cooler Shutoff
Version Date and Revision History
Effective Date: 1/1/2011 (Revised 1/1/2012) End Date: TBD
Measure Overview
Description: Installation of controls to shut off a facility’s novelty coolers for non-perishable goods based on pre-programmed store hours. Energy savings occur as coolers cycle off during facility unoccupied hours.383 Primary Energy Impact: Electric Secondary Energy Impact: None Non-Energy Impact: None Sector: Commercial & Industrial Market: Retrofit End Use: Refrigeration Program: C&I Small Retrofit
Algorithms for Calculating Primary Energy Impact
( ) )()( HoursOFFDCkWkWh AVGNC=∆
0=∆kW Where: ∆kW = 0 since savings are assumed to occur during evening hours and are therefore not
coincident with either summer or winter peak periods. kWNC = Power demand of novelty cooler calculated from equipment nameplate data and
estimated 0.85 power factor384 HoursOFF = Potential hours off every night per year, estimated as one less than the number of hours
the store is closed per day DCAVG = Weighted average annual duty cycle: 48.75%385
Baseline Efficiency
The baseline efficiency case is the novelty coolers operating 8,760 hours per year.
High Efficiency
The high efficiency case is the novelty coolers operating fewer than 8,760 hours per year since they are controlled to cycle each night based on pre-programmed facility unoccupied hours.
383 The assumptions and algorithms used in this section are specific to NRM products. 384 Conservative value based on 15 years of NRM field observations and experience. 385 Ibid; the estimated duty cycles for Novelty Coolers are supported by Select Energy Services, Inc. (2004). Cooler Control
Measure Impact Spreadsheet Users’ Manual. Prepared for NSTAR. The study gives a less conservative value than used by NRM.

Massachusetts Technical Reference Manual Commercial and Industrial Electric Efficiency Measures
October 2011 203 © 2011 Massachusetts Electric and Gas Energy
Efficiency Program Administrators, ALL RIGHTS RESERVED
Hours
Energy and demand savings are based on the reduced operation hours of the cooler equipment. Hours reduced per day are estimated on a case-by-case basis, and are typically calculated as one less than the number of hours per day that the facility is closed each day.
Measure Life
The measure life is 10 years.386
Secondary Energy Impacts
There are no secondary energy impacts for this measure.
Non-Energy Impacts
There are no non-energy impacts for this measure.
Impact Factors for Calculating Adjusted Gross Savings
Measure Name Program PA ISR SPF RRE RRSP RRWP CFSP CFWP CFSP CFWP
Novelty Cooler Shutoff Small Retrofit National Grid 1.00 1.00 1.00 1.00 1.00 0.00 0.00 n/a n/a
Novelty Cooler Shutoff Small Retrofit NSTAR, CLC 1.00 1.00 0.91 0.92 0.92 0.00 0.00 n/a n/a
Novelty Cooler Shutoff Small Retrofit Unitil 1.00 1.00 1.00 1.00 1.00 0.00 0.00 n/a n/a
Novelty Cooler Shutoff Small Retrofit WMECO 1.00 1.00 0.86 0.57 0.57 n/a n/a 0.00 0.00
In-Service Rates All installations have 100% in service rate since all PAs’ programs include verification of equipment installations. Savings Persistence Factor All PAs use 100% savings persistence factor.
Realization Rates � National Grid: energy RR based on staff estimates.. � NSTAR, CLC: RRs based on NSTAR 2002-2004 small retrofit program impact evaluations. � Unitil: RRs set to 100% based on no evaluations. � WMECO: RRs from impact evaluation of 2008 small retrofit program.387 Coincidence Factors Coincidence factors are set to zero since demand savings typically occur during off-peak hours.
386 Energy & Resource Solutions (2005). Measure Life Study. Prepared for The Massachusetts Joint Utilities; Table 1-1. 387 The Cadmus Group, Inc. (2010). Western Massachusetts Small Business Energy Advantage Impact Evaluation Report
Program Year 2008. Prepared for Western Massachusetts Electric Company.

Massachusetts Technical Reference Manual Commercial and Industrial Electric Efficiency Measures
October 2011 204 © 2011 Massachusetts Electric and Gas Energy
Efficiency Program Administrators, ALL RIGHTS RESERVED
Refrigeration – ECM Evaporator Fan Motors for Walk–in Coolers and
Freezers
Version Date and Revision History
Effective Date: 1/1/2011 (Revised 1/1/2012) End Date: TBD
Measure Overview
Description: Installation of various sizes of electronically commutated motors (ECMs) in walk-in coolers and freezers to replace existing evaporator fan motors.388 Primary Energy Impact: Electric Secondary Energy Impact: None Non-Energy Impact: None Sector: Commercial & Industrial Market: Retrofit End Use: Refrigeration Program: C&I Small Retrofit
Algorithms for Calculating Primary Energy Impact
HeatFan kWhkWhkWh ∆+∆=∆
HoursLRFkWkWh FanFan **=∆
RSFanHeat EffkWhkWh *28.0*∆=∆
760,8/kWhkW ∆=∆
Where: ∆kWhFan = Energy savings due to increased efficiency of evaporator fan motor ∆kWhHeat = Energy savings due to reduced heat from the evaporator fans kWFan = Power demand of evaporator fan calculated from equipment nameplate data
and estimated 0.55 power factor/adjustment389: Amps x Voltage x PF x √Phase
LRF = Load reduction factor for motor replacement (65%)390 Hours = Annual fan operating hours. 0.28 = Conversion factor between kW and tons: 3,413 Btuh/kW divided by 12,000
Btuh/ton EffRS = Efficiency of typical refrigeration system: 1.6 kW/ton391 ∆kW = Average demand savings 8,760 = Hours per year
388 The assumptions and algorithms used in this section are specific to NRM products. 389 Conservative value based on 15 years of NRM field observations and experience. 390 Load factor is an estimate by NRM based on several pre- and post-meter readings of installations; the value is supported by RLW Analytics (2007). Small Business Services Custom Measure Impact Evaluation. Prepared for National Grid. 391 Assumed average refrigeration efficiency for typical installations. Conservative value based on 15 years of NRM field observations and experience. Value supported by Select Energy (2004). Cooler Control Measure Impact Spreadsheet Users’
Manual. Prepared for NSTAR.
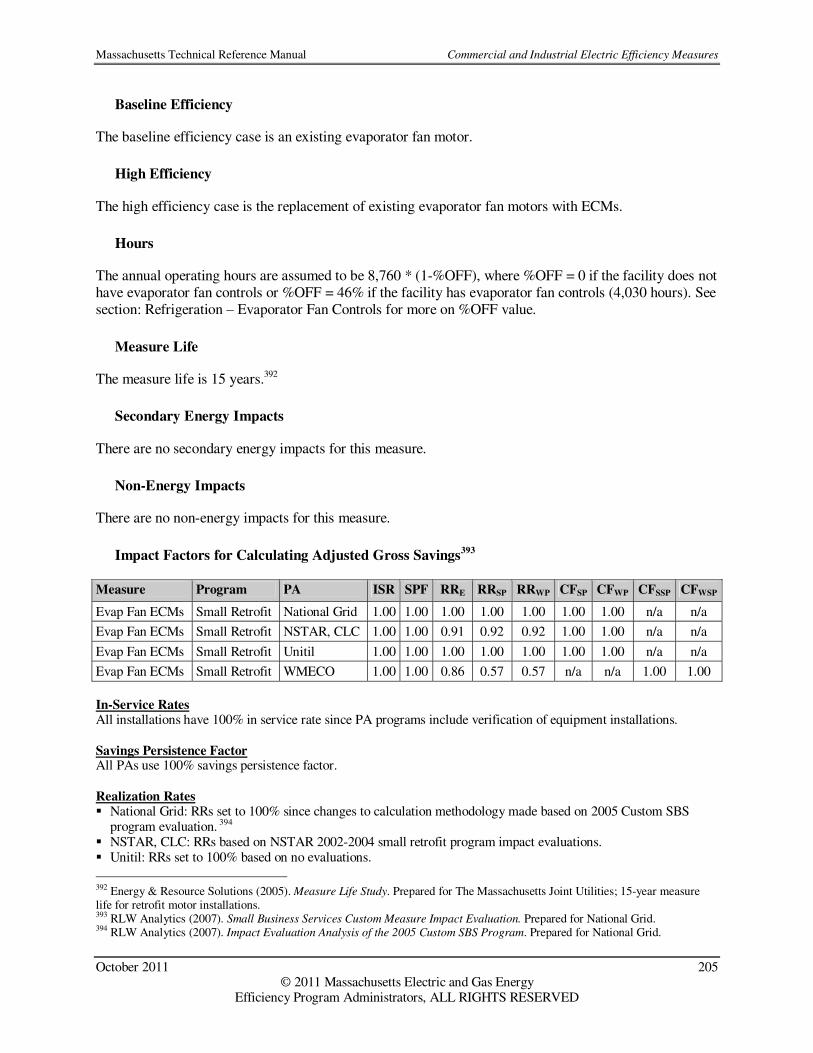
Massachusetts Technical Reference Manual Commercial and Industrial Electric Efficiency Measures
October 2011 205 © 2011 Massachusetts Electric and Gas Energy
Efficiency Program Administrators, ALL RIGHTS RESERVED
Baseline Efficiency
The baseline efficiency case is an existing evaporator fan motor.
High Efficiency
The high efficiency case is the replacement of existing evaporator fan motors with ECMs.
Hours
The annual operating hours are assumed to be 8,760 * (1-%OFF), where %OFF = 0 if the facility does not have evaporator fan controls or %OFF = 46% if the facility has evaporator fan controls (4,030 hours). See section: Refrigeration – Evaporator Fan Controls for more on %OFF value.
Measure Life
The measure life is 15 years.392
Secondary Energy Impacts
There are no secondary energy impacts for this measure.
Non-Energy Impacts
There are no non-energy impacts for this measure.
Impact Factors for Calculating Adjusted Gross Savings393
Measure Program PA ISR SPF RRE RRSP RRWP CFSP CFWP CFSSP CFWSP
Evap Fan ECMs Small Retrofit National Grid 1.00 1.00 1.00 1.00 1.00 1.00 1.00 n/a n/a
Evap Fan ECMs Small Retrofit NSTAR, CLC 1.00 1.00 0.91 0.92 0.92 1.00 1.00 n/a n/a
Evap Fan ECMs Small Retrofit Unitil 1.00 1.00 1.00 1.00 1.00 1.00 1.00 n/a n/a
Evap Fan ECMs Small Retrofit WMECO 1.00 1.00 0.86 0.57 0.57 n/a n/a 1.00 1.00
In-Service Rates All installations have 100% in service rate since PA programs include verification of equipment installations. Savings Persistence Factor All PAs use 100% savings persistence factor. Realization Rates � National Grid: RRs set to 100% since changes to calculation methodology made based on 2005 Custom SBS
program evaluation. 394 � NSTAR, CLC: RRs based on NSTAR 2002-2004 small retrofit program impact evaluations. � Unitil: RRs set to 100% based on no evaluations.
392 Energy & Resource Solutions (2005). Measure Life Study. Prepared for The Massachusetts Joint Utilities; 15-year measure life for retrofit motor installations. 393 RLW Analytics (2007). Small Business Services Custom Measure Impact Evaluation. Prepared for National Grid. 394 RLW Analytics (2007). Impact Evaluation Analysis of the 2005 Custom SBS Program. Prepared for National Grid.

Massachusetts Technical Reference Manual Commercial and Industrial Electric Efficiency Measures
October 2011 206 © 2011 Massachusetts Electric and Gas Energy
Efficiency Program Administrators, ALL RIGHTS RESERVED
� WMECO: RRs from impact evaluation of 2008 small retrofit program.395 Coincidence Factors All: CFs set to 1 since demand savings are average
395 The Cadmus Group, Inc. (2010). Western Massachusetts Small Business Energy Advantage Impact Evaluation Report
Program Year 2008. Prepared for Western Massachusetts Electric Company.

Massachusetts Technical Reference Manual Commercial and Industrial Electric Efficiency Measures
October 2011 207 © 2011 Massachusetts Electric and Gas Energy
Efficiency Program Administrators, ALL RIGHTS RESERVED
Refrigeration – Case Motor Replacement
Version Date and Revision History
Effective Date: 1/1/2011 (Revised 1/1/2012) End Date: TBD
Measure Overview
Description: Installation of electronically commutated motors (ECMs) in multi-deck and freestanding coolers and freezers, typically on the retail floor of convenience stores, liquor stores, and grocery stores.396 Primary Energy Impact: Electric Secondary Energy Impact: None Non-Energy Impact: None Sector: Commercial & Industrial Market: Retrofit End Use: Refrigeration Program: C&I Small Retrofit
Algorithms for Calculating Primary Energy Impacts
HeatMotor kWhkWhkWh ∆+∆=∆
HoursLRFkWkWh Motormotor **=∆
RSMotorheat EffkWhkWh *28.0*∆=∆
760,8/kWhkW ∆=∆ Where: ∆kWhMotor = Energy savings due to increased efficiency of case motor ∆kWhHeat = Energy savings due to reduced heat from evaporator fans kWmotor = Metered load of case motor LRF = Load reduction factor: 53% when shaded pole motors are replaced, 29%
when PSC motors are replaced397 Hours = Average runtime of case motors (8,500 hours)398 0.28 = Conversion of kW to tons: 3,413 Btuh/kW divided by 12,000 Btuh/ton. EffRS = Efficiency of typical refrigeration system (1.6 kW/ton) 399 ∆kW = Average demand savings 8,760 = Hours per year
396 The assumptions and algorithms used in this section are specific to NRM products. 397 Load factor is an estimate by NRM based on several pre- and post-meter readings of installations 398 Conservative value based on 15 years of NRM field observations and experience. 399 Assumed average refrigeration efficiency for typical installations. Conservative value based on 15 years of NRM field observations and experience. Value supported by Select Energy (2004). Cooler Control Measure Impact Spreadsheet Users’
Manual. Prepared for NSTAR.

Massachusetts Technical Reference Manual Commercial and Industrial Electric Efficiency Measures
October 2011 208 © 2011 Massachusetts Electric and Gas Energy
Efficiency Program Administrators, ALL RIGHTS RESERVED
Baseline Efficiency
The baseline efficiency case is the existing case motor.
High Efficiency
The high efficiency case is the replacement of the existing case motor with an ECM.
Hours
Hours are the annual operating hours of the case motors.
Measure Life
The measure life is 15 years.400
Secondary Energy Impacts
There are no secondary energy impacts for this measure.
Non-Energy Impacts
There are no non-energy impacts for this measure.
Impact Factors for Calculating Adjusted Gross Savings
Measure Name Program PA ISR SPF RRE RRSP RRWP CFSP CFWP CFSSP CFWSP
Case ECMs Small Retrofit National Grid 1.00 1.00 1.00 1.00 1.00 1.00 1.00 n/a n/a
Case ECMs Small Retrofit NSTAR, CLC 1.00 1.00 0.91 0.92 0.92 1.00 1.00 n/a n/a
Case ECMs Small Retrofit Unitil 1.00 1.00 1.00 1.00 1.00 1.00 1.00 n/a n/a
Case ECMs Small Retrofit WMECO 1.00 1.00 0.86 0.57 0.57 n/a n/a 1.00 1.00
In-Service Rates All installations have 100% in service rate since all PAs’ programs include verification of equipment installations. Savings Persistence Factor All PAs use 100% savings persistence factor. Realization Rates � National Grid: RRs set to 100% since changes to calculation methodology made based on 2005 Custom SBS
program evaluation. 401 � Unitil: RRs set to 100% based on no evaluations. � NSTAR, CLC: RRs based on NSTAR 2002-2004 small retrofit program impact evaluations. � WMECO: RRs from impact evaluation of 2008 small retrofit program402.
400 Energy & Resource Solutions (2005). Measure Life Study. Prepared for The Massachusetts Joint Utilities; 15-year measure life for retrofit motor installations. 401 RLW Analytics (2007). Impact Evaluation Analysis of the 2005 Custom SBS Program. Prepared for National Grid. 402 The Cadmus Group, Inc. (2010). Western Massachusetts Small Business Energy Advantage Impact Evaluation Report
Program Year 2008. Prepared for Western Massachusetts Electric Company.

Massachusetts Technical Reference Manual Commercial and Industrial Electric Efficiency Measures
October 2011 209 © 2011 Massachusetts Electric and Gas Energy
Efficiency Program Administrators, ALL RIGHTS RESERVED
Coincidence Factors All: CFs set to 1 since demand savings are average

Massachusetts Technical Reference Manual Commercial and Industrial Electric Efficiency Measures
October 2011 210 © 2011 Massachusetts Electric and Gas Energy
Efficiency Program Administrators, ALL RIGHTS RESERVED
Refrigeration – Cooler Night Covers
Version Date and Revision History
Effective Date: 1/1/2011 (Revised 1/1/2012) End Date: TBD
Measure Overview
Description: Installation of retractable aluminum woven fabric covers for open-type refrigerated display cases, where the covers are deployed during the facility unoccupied hours in order to reduce refrigeration energy consumption. Primary Energy Impact: Electric Secondary Energy Impact: None Non-Energy Impact: None Sector: Commercial & Industrial Market: Retrofit End Use: Refrigeration Program: C&I Small Retrofit
Algorithms for Calculating Primary Energy Impact
))()(( HoursSaveWidthkWh =∆
))(( SaveWidthkW =∆
Where: Width = Width of the opening that the night covers protect (ft) Save = Savings factor based on the temperature of the case (kW/ft). See Table 16. Hours = Annual hours that the night covers are in use
Table 16: Savings Factors403
Cooler Case Temperature Savings Factor
Low Temperature (-35 F to -5 F) 0.03 kW/ft Medium Temperature (0 F to 30 F) 0.02 kW/ft High Temperature (35 F to 55 F) 0.01 kW/ft
Baseline Efficiency
The baseline efficiency case is the annual operation of open-display cooler cases.
High Efficiency
The high efficiency case is the use of night covers to protect the exposed area of display cooler cases during unoccupied hours.
403 CL&P Program Savings Documentation for 2011 Program Year (2010). Factors based on Southern California Edison (1997). Effects of the Low Emissive Shields on Performance and Power Use of a Refrigerated Display Case.
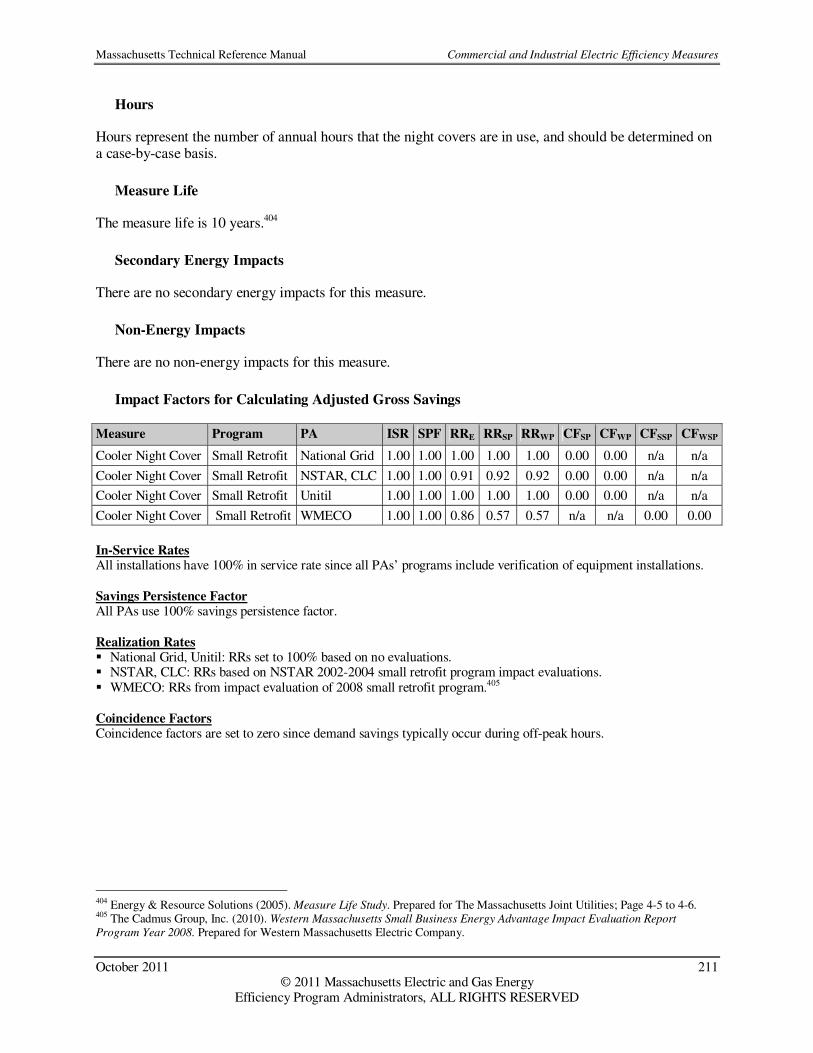
Massachusetts Technical Reference Manual Commercial and Industrial Electric Efficiency Measures
October 2011 211 © 2011 Massachusetts Electric and Gas Energy
Efficiency Program Administrators, ALL RIGHTS RESERVED
Hours
Hours represent the number of annual hours that the night covers are in use, and should be determined on a case-by-case basis.
Measure Life
The measure life is 10 years.404
Secondary Energy Impacts
There are no secondary energy impacts for this measure.
Non-Energy Impacts
There are no non-energy impacts for this measure.
Impact Factors for Calculating Adjusted Gross Savings
Measure Program PA ISR SPF RRE RRSP RRWP CFSP CFWP CFSSP CFWSP
Cooler Night Cover Small Retrofit National Grid 1.00 1.00 1.00 1.00 1.00 0.00 0.00 n/a n/a
Cooler Night Cover Small Retrofit NSTAR, CLC 1.00 1.00 0.91 0.92 0.92 0.00 0.00 n/a n/a
Cooler Night Cover Small Retrofit Unitil 1.00 1.00 1.00 1.00 1.00 0.00 0.00 n/a n/a
Cooler Night Cover Small Retrofit WMECO 1.00 1.00 0.86 0.57 0.57 n/a n/a 0.00 0.00
In-Service Rates All installations have 100% in service rate since all PAs’ programs include verification of equipment installations. Savings Persistence Factor All PAs use 100% savings persistence factor.
Realization Rates � National Grid, Unitil: RRs set to 100% based on no evaluations. � NSTAR, CLC: RRs based on NSTAR 2002-2004 small retrofit program impact evaluations. � WMECO: RRs from impact evaluation of 2008 small retrofit program.405 Coincidence Factors Coincidence factors are set to zero since demand savings typically occur during off-peak hours.
404 Energy & Resource Solutions (2005). Measure Life Study. Prepared for The Massachusetts Joint Utilities; Page 4-5 to 4-6. 405 The Cadmus Group, Inc. (2010). Western Massachusetts Small Business Energy Advantage Impact Evaluation Report
Program Year 2008. Prepared for Western Massachusetts Electric Company.

Massachusetts Technical Reference Manual Commercial and Industrial Electric Efficiency Measures
October 2011 212 © 2011 Massachusetts Electric and Gas Energy
Efficiency Program Administrators, ALL RIGHTS RESERVED
Refrigeration – Electronic Defrost Control
Version Date and Revision History
Effective Date: 1/1/2011 (Revised 1/1/2012) End Date: TBD
Measure Overview
Description: A control mechanism to skip defrost cycles when defrost is unnecessary.406 Primary Energy Impact: Electric Secondary Energy Impact: None Non-Energy Impact: None Sector: Commercial & Industrial Market: Retrofit End Use: Refrigeration Program: C&I Small Retrofit
Algorithms for Calculating Primary Energy Impacts
HeatDefrost kWhkWhkWh ∆+∆=∆
DRFHourskWkWh DefrostDefrost **=∆
RSDefrostHeat EffkWhkWh *28.0*∆=∆
760,8/kWhkW ∆=∆
Where: ∆kWhDefrost = Energy savings resulting from an increase in operating efficiency due to the
addition of electronic defrost controls. ∆kWhHeat = Energy savings due to reduced heat from reduced number of defrosts. kWDefrost = Load of electric defrost. Hours = Number of hours defrost occurs over a year without the defrost controls. DRF = Defrost reduction factor- percent reduction in defrosts required per year
(35%)407 0.28 = Conversion of kW to tons: 3,413 Btuh/kW divided by 12,000 Btuh/ton. EffRS = Efficiency of typical refrigeration system (1.6 kW/ton)408 ∆kW = Average demand savings 8,760 = Hours per year
406 The assumptions and algorithms used in this section are specific to NRM products. 407 Ibid; supported by 3rd party evaluation: Independent Testing was performed by Intertek Testing Service on a Walk-in Freezer that was retrofitted with Smart Electric Defrost capability. 408 Assumed average refrigeration efficiency for typical installations. Conservative value based on 15 years of NRM field observations and experience. Value supported by Select Energy (2004). Cooler Control Measure Impact Spreadsheet Users’
Manual. Prepared for NSTAR.

Massachusetts Technical Reference Manual Commercial and Industrial Electric Efficiency Measures
October 2011 213 © 2011 Massachusetts Electric and Gas Energy
Efficiency Program Administrators, ALL RIGHTS RESERVED
Baseline Efficiency
The baseline efficiency case is an evaporator fan electric defrost system that uses a time clock mechanism to initiate defrost.
High Efficiency
The high efficiency case is an evaporator fan defrost system with electric defrost controls.
Hours
The number of defrost cycles is estimated to decrease by 35% from an average number of defrost cycles of 1460 defrosts/year at 40 minutes each for a total of 973 hours/year. 409 The number of defrost cycles with the defrost controls is 949 cycles/year, or 633 hours/year.
Measure Life
The measure life is 10 years.410
Secondary Energy Impacts
There are no secondary energy impacts for this measure.
Non-Energy Impacts
There are no non-energy impacts for this measure.
Impact Factors for Calculating Adjusted Gross Savings
Measure Name Program PA ISR SPF RRE RRSP RRWP CFSP CFWP CFSSP CFWSP
Defrost Control Small Retrofit National Grid 1.00 1.00 1.00 1.00 1.00 1.00 1.00 n/a n/a
Defrost Control Small Retrofit NSTAR, CLC 1.00 1.00 0.91 0.92 0.92 1.00 1.00 n/a n/a
Defrost Control Small Retrofit Unitil 1.00 1.00 1.00 1.00 1.00 1.00 1.00 n/a n/a
Defrost Control Small Retrofit WMECO 1.00 1.00 0.86 0.57 0.57 n/a n/a 1.00 1.00
In-Service Rates All installations have 100% in service rate since all PAs’ programs include verification of equipment installations. Savings Persistence Factor All PAs use 100% savings persistence factor.
Realization Rates � National Grid, Unitil: RRs set to 100% based on no evaluations. � NSTAR, CLC: RRs based on NSTAR 2002-2004 small retrofit program impact evaluations. � WMECO: RRs from impact evaluation of 2008 small retrofit program.411
409 Conservative value based on 15 years of NRM field observations and experience. 410 Energy & Resource Solutions (2005). Measure Life Study. Prepared for The Massachusetts Joint Utilities.
Massachusetts Technical Reference Manual Commercial and Industrial Electric Efficiency Measures
October 2011 214 © 2011 Massachusetts Electric and Gas Energy
Efficiency Program Administrators, ALL RIGHTS RESERVED
Coincidence Factors � All: CFs set to 1 since demand savings are average
411 The Cadmus Group, Inc. (2010). Western Massachusetts Small Business Energy Advantage Impact Evaluation Report
Program Year 2008. Prepared for Western Massachusetts Electric Company.

Massachusetts Technical Reference Manual Commercial and Industrial Electric Efficiency Measures
October 2011 215 © 2011 Massachusetts Electric and Gas Energy
Efficiency Program Administrators, ALL RIGHTS RESERVED
Refrigeration – Evaporator Fan Controls
Version Date and Revision History
Effective Date: 1/1/2011 (Revised 1/1/2012) End Date: TBD
Measure Overview
Description: Installation of controls to modulate the evaporator fans based on temperature control. Energy savings include: fan energy savings from reduced fan operating hours, refrigeration energy savings from reduced waste heat, and compressor energy savings resulting from the electronic temperature control. Electronic controls allow less fluctuation in temperature, thereby creating savings.412 Primary Energy Impact: Electric Secondary Energy Impact: None Non-Energy Impact: None Sector: Commercial & Industrial Market: Retrofit End Use: Refrigeration Program: C&I Small Retrofit
Algorithms for Calculating Primary Energy Impact
ControlHeatFan kWhkWhkWhkWh ∆+∆+∆=∆
OFFkWkWh FanFan %*8760*=∆
RSFanHeat EffkWhkWh *28.0*∆=∆
[ ] %5*)%1(*8760** OffkWHourskWkWh FanCPCPControl −+=∆
8760/kWhkW ∆=∆
412 The assumptions and algorithms used in this section are specific to NRM products.

Massachusetts Technical Reference Manual Commercial and Industrial Electric Efficiency Measures
October 2011 216 © 2011 Massachusetts Electric and Gas Energy
Efficiency Program Administrators, ALL RIGHTS RESERVED
Where: ∆kWhFan = Energy savings due to evaporator being shut off ∆kWhHeat = Energy savings due to reduced heat from the evaporator fans ∆kWhControl = Energy savings due to the electronic controls on compressor and evaporator kWFan = Power demand of evaporator fan calculated from equipment nameplate data
and estimated 0.55 power factor/ adjustment413: Amps x Voltage x PF x √Phase
%OFF = Percent of annual hours that the evaporator is turned off: 46%414 0.28 = Conversion of kW to tons: 3,413 Btuh/kW divided by 12,000 Btuh/ton. EffRS = Efficiency of typical refrigeration system: 1.6 kW/ton415 kWCP = Total power demand of compressor motor and condenser fan calculated from
equipment nameplate data and estimated 0.85 power factor416: Amps x Voltage x PF x √Phase
HoursCP = Equivalent annual full load hours of compressor operation: 4,072 hours417 5% = Reduced run-time of compressor and evaporator due to electronic
temperature controls418 ∆kW = Average demand savings 8,760 = Hours per year
Baseline Efficiency
The baseline efficiency case assumes evaporator fans that run 8760 annual hours with no temperature control.
High Efficiency
The high efficiency case is the use of an energy management system to control evaporator fan operation based on temperature.
Hours
The operation of the fans is estimated to be reduced by 46% from the 8,760 hours in the base case scenario.
Measure Life
The measure life is 10 years419.
413 Conservative value based on 15 years of NRM field observations and experience. 414 The value is an estimate by NRM based on hundreds of downloads of hours of use data. These values are also supported by Select Energy Services, Inc. (2004). Cooler Control Measure Impact Spreadsheet User’s Manual. Prepared for NSTAR. 415 Assumed average refrigeration efficiency for typical installations. Conservative value based on 15 years of NRM field observations and experience. Value supported by Select Energy (2004). Cooler Control Measure Impact Spreadsheet Users’
Manual. Prepared for NSTAR. 416 This value is an estimate by NRM based on hundreds of downloads of hours of use data from the electronic controller. 417 Conservative value based on 15 years of NRM field observations and experience. 418 Conservative estimate supported by less conservative values given by several utility-sponsored 3rd Party studies including: Select Energy Services, Inc. (2004). Analysis of Cooler Control Energy Conservation Measures. Prepared for NSTAR. 419 Energy & Resource Solutions (2005). Measure Life Study. Prepared for The Massachusetts Joint Utilities; Table 1-1.

Massachusetts Technical Reference Manual Commercial and Industrial Electric Efficiency Measures
October 2011 217 © 2011 Massachusetts Electric and Gas Energy
Efficiency Program Administrators, ALL RIGHTS RESERVED
Secondary Energy Impacts
There are no secondary energy impacts for this measure.
Non-Energy Impacts
There are no non-energy impacts for this measure.
Impact Factors for Calculating Adjusted Gross Savings
Measure Name Program PA ISR SPF RRE RRSP RRWP CFSP CFWP CFSSP CFWSP
Evap Fan Control Small Retrofit National Grid 1 1 1.00 1.00 1.00 1.00 1.00 n/a n/a
Evap Fan Control Small Retrofit NSTAR, CLC 1 1 0.91 0.92 0.92 1.00 1.00 n/a n/a
Evap Fan Control Small Retrofit Unitil 1 1 1.00 1.00 1.00 1.00 1.00 n/a n/a
Evap Fan Control Small Retrofit WMECO 1 1 0.86 0.57 0.57 n/a n/a 1.00 1.00
In-Service Rates All installations have 100% in service rate since all PAs’ programs include verification of equipment installations. Savings Persistence Factor All PAs use 100% savings persistence factor. Realization Rates � National Grid set to 100% after small retrofit RRs from 1996 savings analysis420 suggestions for more accurate
calculations adopted. � NSTAR, CLC: RRs based on NSTAR 2002-2004 small retrofit program impact evaluations. � Unitil: RRs set to 100% based on no evaluations. � WMECO: RRs from impact evaluation of 2008 small retrofit program421. Coincidence Factors � All: CFs set to 1 since demand savings are average
420 HEC, Inc. (1996). Analysis of Savings from Walk-In Cooler Air Economizers and Evaporator Fan Controls. Prepared for New England Power Service Company. 421 The Cadmus Group, Inc. (2010). Western Massachusetts Small Business Energy Advantage Impact Evaluation Report
Program Year 2008. Prepared for Western Massachusetts Electric Company.

Massachusetts Technical Reference Manual Commercial and Industrial Electric Efficiency Measures
October 2011 218 © 2011 Massachusetts Electric and Gas Energy
Efficiency Program Administrators, ALL RIGHTS RESERVED
Refrigeration – Vending Misers
Version Date and Revision History
Effective Date: 1/1/2011 (Revised 1/1/2012) End Date: TBD
Measure Overview
Description: Controls can significantly reduce the energy consumption of vending machine lighting and refrigeration systems. Qualifying controls must power down these systems during periods of inactivity but, in the case of refrigerated machines, must always maintain a cool product that meets customer expectations. This measure applies to refrigerated beverage vending machines, non-refrigerated snack vending machines, and glass front refrigerated coolers. This measure should not be applied to ENERGY STAR® qualified vending machines, as they already have built-in controls. Primary Energy Impact: Electric Secondary Energy Impact: None Non-Energy Impact: None Sector: Commercial & Industrial Market: Retrofit End Use: Refrigeration Program: C&I Large Retrofit, C&I Small Retrofit
Algorithms for Calculating Primary Energy Impact
Unit savings are deemed based on the following algorithms and assumptions:
( )( )( )SAVEHourskWkWh RATED=∆
HourskWhkW /∆=∆
Where: kWrated = Rated kW of connected equipment. See Table 17 for default rated kW by
connected equipment type. Hours = Operating hours of the connected equipment: default of 8,760 hours SAVE = Percent savings factor for the connected equipment. See Table 17 for
values.

Massachusetts Technical Reference Manual Commercial and Industrial Electric Efficiency Measures
October 2011 219 © 2011 Massachusetts Electric and Gas Energy
Efficiency Program Administrators, ALL RIGHTS RESERVED
Table 17: Vending Machine and Cooler Controls Savings Factors 422
Equipment Type kWRATED SAVE (%) ∆kW ∆kWh
Refrigerated Beverage Vending Machines 0.40 46 0.184 1612 Non-Refrigerated Snack Vending Machines 0.085 46 0.039 343 Glass Front Refrigerated Coolers 0.46 30 0.138 1208
Baseline Efficiency
The baseline efficiency case is a standard efficiency refrigerated beverage vending machine, non-refrigerated snack vending machine, or glass front refrigerated cooler without a control system capable of powering down lighting and refrigeration systems during periods of inactivity.
High Efficiency
The high efficiency case is a standard efficiency refrigerated beverage vending machine, non-refrigerated snack vending machine, or glass front refrigerated cooler with a control system capable of powering down lighting and refrigeration systems during periods of inactivity.
Hours
It is assumed that the connected equipment operates 24 hours per day, 7 days per week for a total annual operating hours of 8,760.
Measure Life
The measure life is 5 years.423
Secondary Energy Impacts
There are no secondary energy impacts for this measure.
Non-Energy Impacts
There are no non-energy impacts for this measure.
422 USA Technologies Energy Management Product Sheets (2006). http://www.usatech.com/energy_management/energy_productsheets.php. Accessed 9/1/09. 423 Energy & Resource Solutions (2005). Measure Life Study. Prepared for The Massachusetts Joint Utilities; Table 1-1.

Massachusetts Technical Reference Manual Commercial and Industrial Electric Efficiency Measures
October 2011 220 © 2011 Massachusetts Electric and Gas Energy
Efficiency Program Administrators, ALL RIGHTS RESERVED
Impact Factors for Calculating Adjusted Gross Savings
Measure Program PA ISR SPF RRE RRSP RRWP CFSP CFWP CFSSP CFWSP
Vending Misers Large Retrofit National Grid 1 1 1.00 1.00 1.00 0.00 0.00 n/a n/a
Vending Misers Small Retrofit National Grid 1 1 1.00 1.00 1.00 0.00 0.00 n/a n/a
Vending Misers Large Retrofit NSTAR 1 1 0.85 0.41 0.24 0.00 0.00 n/a n/a
Vending Misers Small Retrofit NSTAR 1 1 0.91 0.92 0.92 0.00 0.00 n/a n/a
Vending Misers Large Retrofit CLC 1 1 0.85 0.41 0.24 0.00 0.00 n/a n/a
Vending Misers Small Retrofit CLC 1 1 0.91 0.92 0.92 0.00 0.00 n/a n/a
Vending Misers Large Retrofit Unitil 1 1 1.00 1.00 1.00 0.00 0.00 n/a n/a
Vending Misers Small Retrofit Unitil 1 1 1.00 1.00 1.00 0.00 0.00 n/a n/a
Vending Misers Large Retrofit WMECO 1 1 0.91 2.08 0.87 n/a n/a 0.00 0.00
Vending Misers Small Retrofit WMECO 1 1 0.86 0.57 0.57 n/a n/a 0.00 0.00
In-Service Rates All installations have 100% in service rate since all PAs’ programs include verification of equipment installations. Savings Persistence Factor All PAs use 100% savings persistence factor. Realization Rates � National Grid, Unitil: RRs set to 100% since savings estimated are based on study results. � NSTAR, CLC: large retrofit RRs from impact evaluation of NSTAR 2006 refrigeration installations424; small
retrofit RRs from impact evaluation of 2002 program year425 � WMECO: RRs from impact evaluation of 2008 small retrofit program426; large retrofit RRs are based on end use
from 2007/2008 Large C&I Programs impact evaluation427
Coincidence Factors � National Grid, Unitil, NSTAR, CLC, WMECO: CFs based on staff estimates- assumed that savings occur during
off peak hours.
424 RLW Analytics (2008). Business & Construction Solutions (BS/CS) Programs Measurement & Verification - 2006 Final
Report. Prepared for NSTAR Electric and Gas; Table 17. 425 RLW Analytics (2003). Small Business Solutions Program Year 2002 Impact Evaluation - Final Report. Prepared for NSTAR. 426 The Cadmus Group, Inc. (2010). Western Massachusetts Small Business Energy Advantage Impact Evaluation Report
Program Year 2008. Prepared for Western Massachusetts Electric Company. 427 KEMA, Inc. (2011). 2007/2008 Large C&I Programs,
Massachusetts Technical Reference Manual Commercial and Industrial Electric Efficiency Measures
October 2011 221 © 2011 Massachusetts Electric and Gas Energy
Efficiency Program Administrators, ALL RIGHTS RESERVED
Food Service – Commercial Electric Ovens
Version Date and Revision History
Effective Date: 1/1/2012 End Date: TBD
Measure Overview
Description: Installation of a qualified ENERGY STAR® commercial oven. ENERGY STAR® commercial ovens save energy during preheat, cooking and idle times due to improved cooking efficiency, and preheat and idle energy rates. Primary Energy Impact: Electric Secondary Energy Impact: None Non-Energy Impact: None Sector: Commercial Market: Lost Opportunity End Use: Food Service Program: C&I New Construction & Major Renovation
Algorithms for Calculating Primary Energy Impacts
Unit savings are deemed based on study results:
kWhkWh ∆=∆
HourskWhkW /∆=∆ Where: ∆kWh = gross annual kWh savings from the measure: 2,262 kWh428 ∆kW = gross average kW savings from the measure: 0.52 kW
Baseline Efficiency
The baseline efficiency case is a convection oven with a cooking energy efficiency of 65%, production capacity of 70 pounds per hour, preheat energy of 1.5 kWh and idle energy rate of 2.0 kW.
High Efficiency
The high efficiency case is a convection oven with a cooking energy efficiency of 70%, production capacity of 80 pounds per hour, preheat energy of 1.0 kWh and idle energy rate of 1.5 kW.
Hours
The average commercial oven is assumed to operate 4,380 hours per year429.
428 Pacific Gas & Electric Company – Customer Energy Efficiency Department (2007). Work Paper PGECOFST101,
Commercial Convection Oven, Revision #0. 429 Ibid.

Massachusetts Technical Reference Manual Commercial and Industrial Electric Efficiency Measures
October 2011 222 © 2011 Massachusetts Electric and Gas Energy
Efficiency Program Administrators, ALL RIGHTS RESERVED
Measure Life
The measure life for a new commercial electric oven is 12 years430.
Secondary Energy Impacts
There are no secondary energy impacts for this measure.
Non-Energy Impacts
There are no non-energy impacts for this measure.
Impact Factors for Calculating Adjusted Gross Savings
Measure Program PA ISR SPF RRE RRSP RRWP CFSP CFWP
Electric Convection Oven D2 All 1.00 1.00 1.00 1.00 1.00 1.00 1.00
In-Service Rates All installations have 100% in service rate since programs include verification of equipment installations. Savings Persistence Factor All PAs use 100% savings persistence factor. Realization Rates
100% realization rates are assumed because savings are based on researched assumptions by FSTC. Coincidence Factors
Coincidence factors are 1.0 for both summer and winter seasons because the cooking equipment is assumed to operate throughout the on-peak demand periods.
430 Pacific Gas & Electric Company – Customer Energy Efficiency Department (2007). Work Paper PGECOFST101,
Commercial Convection Oven, Revision #0.

Massachusetts Technical Reference Manual Commercial and Industrial Electric Efficiency Measures
October 2011 223 © 2011 Massachusetts Electric and Gas Energy
Efficiency Program Administrators, ALL RIGHTS RESERVED
Food Service – Commercial Electric Steam Cooker
Version Date and Revision History
Effective Date: 1/1/2012 End Date: TBD
Measure Overview
Description: Installation of a qualified ENERGY STAR® commercial steam cooker. ENERGY STAR® steam cookers save energy during cooling and idle times due to improved cooking efficiency and idle energy rates. Primary Energy Impact: Electric Secondary Energy Impact: None Non-Energy Impact: Water, Wastewater Sector: Commercial Market: Lost Opportunity End Use: Food Service Program: C&I New Construction & Major Renovation
Algorithms for Calculating Primary Energy Impacts
Unit savings are deemed based on study results:
( )( )( )HoursQuantitySAVEkWh =∆
( )( )QuantitySAVEkW =∆
Where: ∆kWh = gross annual kWh savings from the measure ∆kW = average kW savings from the measure: 2.23 kW SAVE = Savings per pan: 3,258 kWh/pan431 Quantity = Number of pans. Default of 3 pans. Hours = Average annual equipment operating hours
Baseline Efficiency
The Baseline Efficiency case is a conventional electric steam cooker with a cooking energy efficiency of 30%, pan production capacity of 23.3 pounds per hour, and an idle energy rate of 1.2 kW.
High Efficiency
The High Efficiency case is an ENERGY STAR® electric steam cooker with a cooking energy efficiency of 50%, pan production capacity of 16.7 pounds per hour, and an idle energy rate of 0.4 kW.
431 ENERGY STAR® Commercial Kitchen Equipment Savings Calculator: Steam Cooker Calcs. < http://www.energystar.gov/ia/business/bulk_purchasing/bpsavings_calc/commercial_kitchen_equipment_calculator.xls >
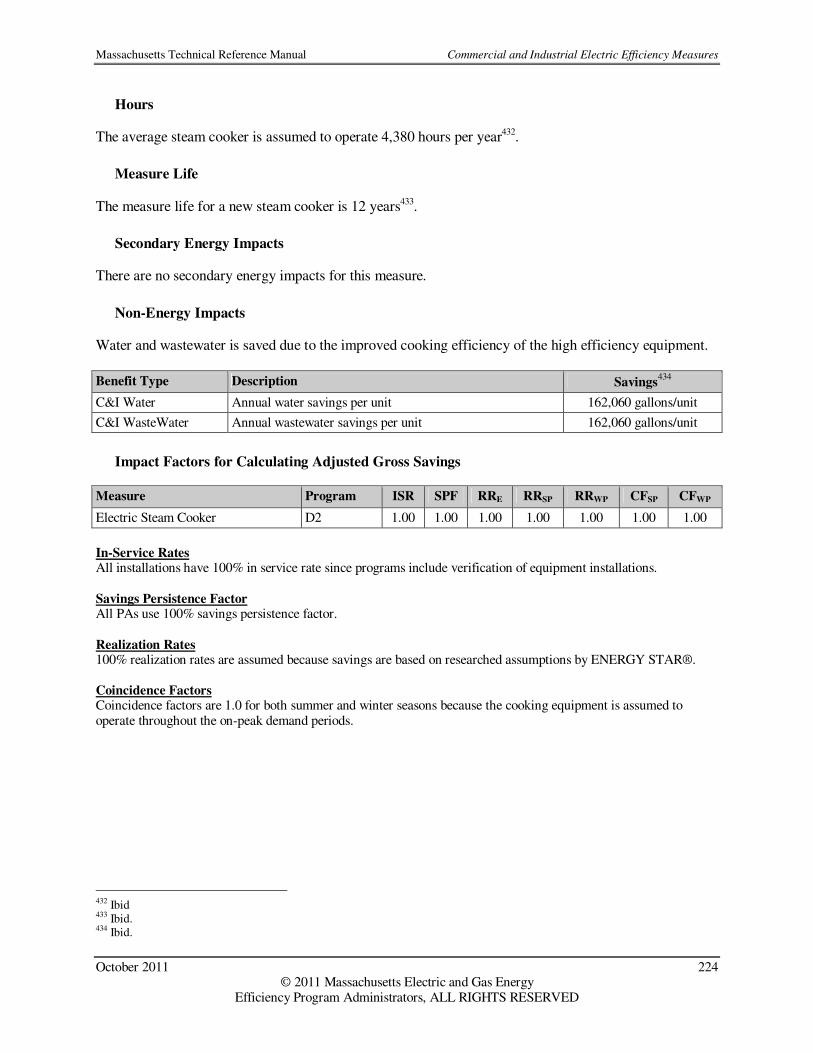
Massachusetts Technical Reference Manual Commercial and Industrial Electric Efficiency Measures
October 2011 224 © 2011 Massachusetts Electric and Gas Energy
Efficiency Program Administrators, ALL RIGHTS RESERVED
Hours
The average steam cooker is assumed to operate 4,380 hours per year432.
Measure Life
The measure life for a new steam cooker is 12 years433.
Secondary Energy Impacts
There are no secondary energy impacts for this measure.
Non-Energy Impacts
Water and wastewater is saved due to the improved cooking efficiency of the high efficiency equipment.
Benefit Type Description Savings434
C&I Water Annual water savings per unit 162,060 gallons/unit
C&I WasteWater Annual wastewater savings per unit 162,060 gallons/unit
Impact Factors for Calculating Adjusted Gross Savings
Measure Program ISR SPF RRE RRSP RRWP CFSP CFWP
Electric Steam Cooker D2 1.00 1.00 1.00 1.00 1.00 1.00 1.00
In-Service Rates All installations have 100% in service rate since programs include verification of equipment installations. Savings Persistence Factor All PAs use 100% savings persistence factor. Realization Rates 100% realization rates are assumed because savings are based on researched assumptions by ENERGY STAR®. Coincidence Factors Coincidence factors are 1.0 for both summer and winter seasons because the cooking equipment is assumed to operate throughout the on-peak demand periods.
432 Ibid 433 Ibid. 434 Ibid.
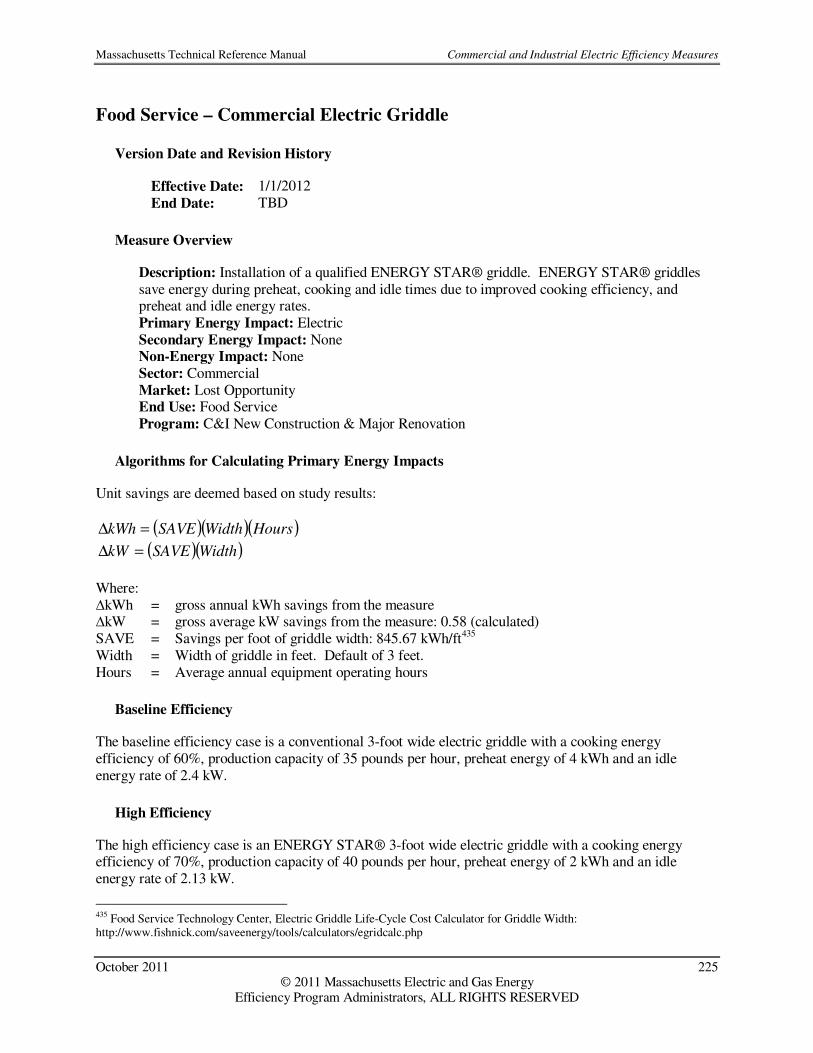
Massachusetts Technical Reference Manual Commercial and Industrial Electric Efficiency Measures
October 2011 225 © 2011 Massachusetts Electric and Gas Energy
Efficiency Program Administrators, ALL RIGHTS RESERVED
Food Service – Commercial Electric Griddle
Version Date and Revision History
Effective Date: 1/1/2012 End Date: TBD
Measure Overview
Description: Installation of a qualified ENERGY STAR® griddle. ENERGY STAR® griddles save energy during preheat, cooking and idle times due to improved cooking efficiency, and preheat and idle energy rates. Primary Energy Impact: Electric Secondary Energy Impact: None Non-Energy Impact: None Sector: Commercial Market: Lost Opportunity End Use: Food Service Program: C&I New Construction & Major Renovation
Algorithms for Calculating Primary Energy Impacts
Unit savings are deemed based on study results:
( )( )( )HoursWidthSAVEkWh =∆
( )( )WidthSAVEkW =∆
Where: ∆kWh = gross annual kWh savings from the measure ∆kW = gross average kW savings from the measure: 0.58 (calculated) SAVE = Savings per foot of griddle width: 845.67 kWh/ft435 Width = Width of griddle in feet. Default of 3 feet. Hours = Average annual equipment operating hours
Baseline Efficiency
The baseline efficiency case is a conventional 3-foot wide electric griddle with a cooking energy efficiency of 60%, production capacity of 35 pounds per hour, preheat energy of 4 kWh and an idle energy rate of 2.4 kW.
High Efficiency
The high efficiency case is an ENERGY STAR® 3-foot wide electric griddle with a cooking energy efficiency of 70%, production capacity of 40 pounds per hour, preheat energy of 2 kWh and an idle energy rate of 2.13 kW.
435 Food Service Technology Center, Electric Griddle Life-Cycle Cost Calculator for Griddle Width: http://www.fishnick.com/saveenergy/tools/calculators/egridcalc.php
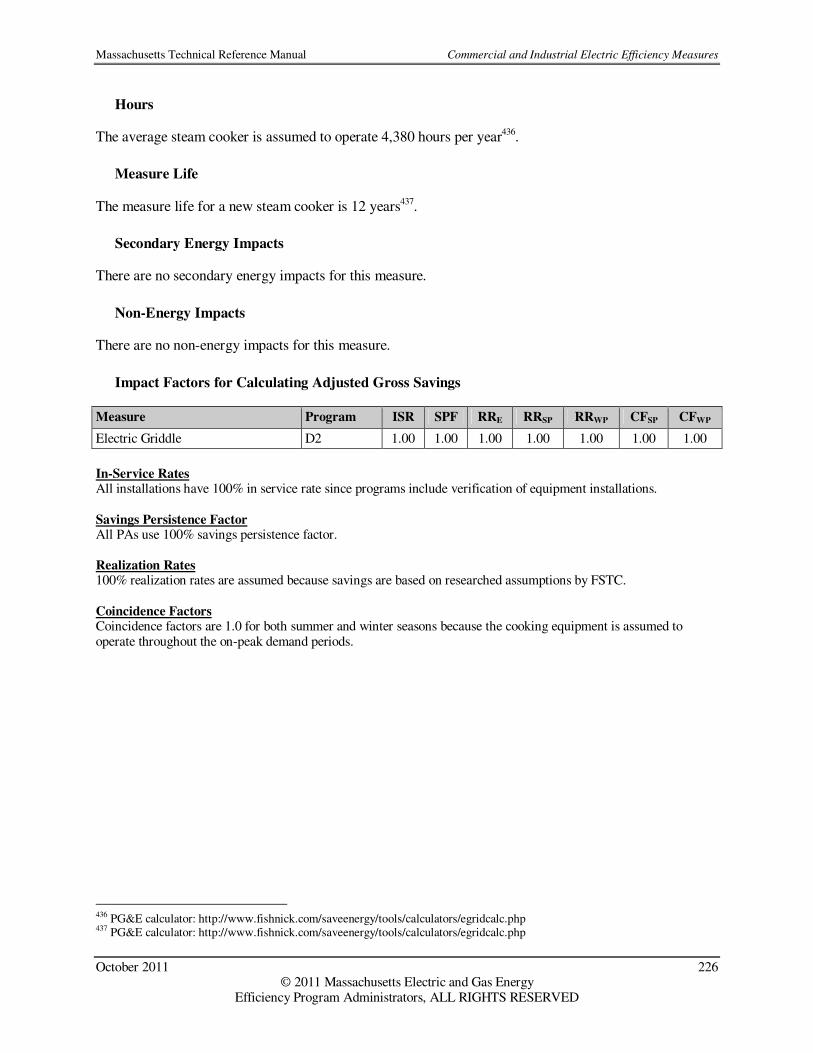
Massachusetts Technical Reference Manual Commercial and Industrial Electric Efficiency Measures
October 2011 226 © 2011 Massachusetts Electric and Gas Energy
Efficiency Program Administrators, ALL RIGHTS RESERVED
Hours
The average steam cooker is assumed to operate 4,380 hours per year436.
Measure Life
The measure life for a new steam cooker is 12 years437.
Secondary Energy Impacts
There are no secondary energy impacts for this measure.
Non-Energy Impacts
There are no non-energy impacts for this measure.
Impact Factors for Calculating Adjusted Gross Savings
Measure Program ISR SPF RRE RRSP RRWP CFSP CFWP
Electric Griddle D2 1.00 1.00 1.00 1.00 1.00 1.00 1.00
In-Service Rates All installations have 100% in service rate since programs include verification of equipment installations. Savings Persistence Factor All PAs use 100% savings persistence factor. Realization Rates 100% realization rates are assumed because savings are based on researched assumptions by FSTC.
Coincidence Factors Coincidence factors are 1.0 for both summer and winter seasons because the cooking equipment is assumed to operate throughout the on-peak demand periods.
436 PG&E calculator: http://www.fishnick.com/saveenergy/tools/calculators/egridcalc.php 437 PG&E calculator: http://www.fishnick.com/saveenergy/tools/calculators/egridcalc.php

Massachusetts Technical Reference Manual Commercial and Industrial Electric Efficiency Measures
October 2011 227 © 2011 Massachusetts Electric and Gas Energy
Efficiency Program Administrators, ALL RIGHTS RESERVED
Compressed Air – High Efficiency Air Compressors
Version Date and Revision History
Effective Date: 1/1/2011 (Revised 1/1/2012) End Date: TBD
Measure Overview
Description: Covers the installation of oil flooded, rotary screw compressors with Load/No Load, Variable Speed Drive, or Variable Displacement capacity control with properly sized air receiver. Efficient air compressors use various control schemes to improve compression efficiencies at partial loads. When an air compressor fitted with Load/No Load, Variable Speed Drive, or Variable Displacement capacity controls is used in conjunction with a properly-sized air receiver, considerable amounts of energy can be saved. Primary Energy Impact: Electric Secondary Energy Impact: None Non-Energy Impact: None Sector: Commercial & Industrial Market: Lost Opportunity, Retrofit End Use: Compressed Air Program: C&I New Construction, C&I Large Retrofit
Algorithms for Calculating Primary Energy Impacts
( )( )( )HoursSAVEHPkWh COMPRESSOR=∆
( )( )SAVEHPkW COMPRESSOR=∆
Where: HPCOMPRESSOR = Nominal rated horsepower of high efficiency air compressor. Save = Air compressor kW reduction per HP. See Table 18 for values. Hours = Annual operating hours of the air compressor.
Table 18: Air Compressor kW Reduction per Horsepower
kW Reduction per Horsepower (Save)438
Control Type
Nominal
Horsepower (HP) Lost Opportunity Retrofit
Load/No Load ≥15 and <25 0.076 0.102
Load/No Load ≥25 and <=75 0.114 0.102
VSD ≥15 and <25 0.159 0.207
VSD ≥25 and <=75 0.228 0.206
Variable Displacement ≥50 and <=75 0.110 0.116
438 From NSTAR analysis based on metering data. The location of original data and analysis is unknown; however, these values are supported by multiple 3rd party impact evaluations.
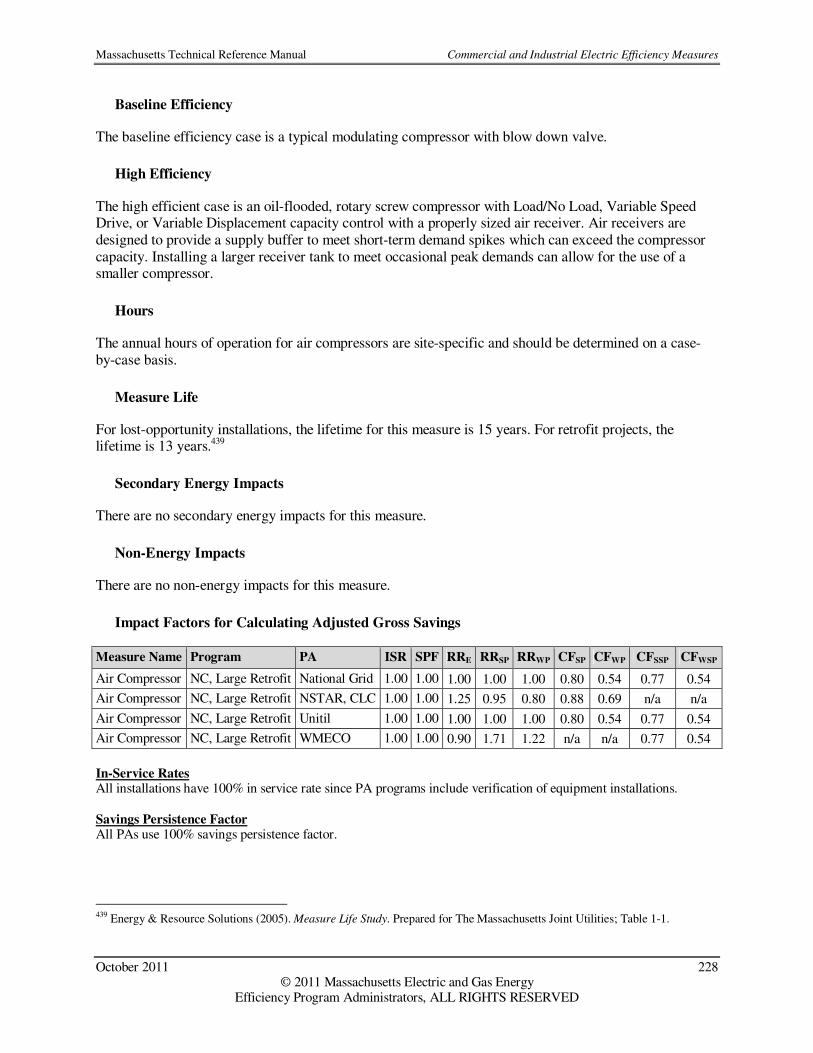
Massachusetts Technical Reference Manual Commercial and Industrial Electric Efficiency Measures
October 2011 228 © 2011 Massachusetts Electric and Gas Energy
Efficiency Program Administrators, ALL RIGHTS RESERVED
Baseline Efficiency
The baseline efficiency case is a typical modulating compressor with blow down valve.
High Efficiency
The high efficient case is an oil-flooded, rotary screw compressor with Load/No Load, Variable Speed Drive, or Variable Displacement capacity control with a properly sized air receiver. Air receivers are designed to provide a supply buffer to meet short-term demand spikes which can exceed the compressor capacity. Installing a larger receiver tank to meet occasional peak demands can allow for the use of a smaller compressor.
Hours
The annual hours of operation for air compressors are site-specific and should be determined on a case-by-case basis.
Measure Life
For lost-opportunity installations, the lifetime for this measure is 15 years. For retrofit projects, the lifetime is 13 years.439
Secondary Energy Impacts
There are no secondary energy impacts for this measure.
Non-Energy Impacts
There are no non-energy impacts for this measure.
Impact Factors for Calculating Adjusted Gross Savings
Measure Name Program PA ISR SPF RRE RRSP RRWP CFSP CFWP CFSSP CFWSP
Air Compressor NC, Large Retrofit National Grid 1.00 1.00 1.00 1.00 1.00 0.80 0.54 0.77 0.54
Air Compressor NC, Large Retrofit NSTAR, CLC 1.00 1.00 1.25 0.95 0.80 0.88 0.69 n/a n/a
Air Compressor NC, Large Retrofit Unitil 1.00 1.00 1.00 1.00 1.00 0.80 0.54 0.77 0.54
Air Compressor NC, Large Retrofit WMECO 1.00 1.00 0.90 1.71 1.22 n/a n/a 0.77 0.54
In-Service Rates All installations have 100% in service rate since PA programs include verification of equipment installations. Savings Persistence Factor All PAs use 100% savings persistence factor.
439 Energy & Resource Solutions (2005). Measure Life Study. Prepared for The Massachusetts Joint Utilities; Table 1-1.

Massachusetts Technical Reference Manual Commercial and Industrial Electric Efficiency Measures
October 2011 229 © 2011 Massachusetts Electric and Gas Energy
Efficiency Program Administrators, ALL RIGHTS RESERVED
Realization Rates � National Grid, Unitil: RRs based on impact evaluation of PY 2004 compressed air installations.440
� NSTAR, CLC: energy and demand RRs from impact evaluation of NSTAR 2006 compressed air installations441 � WMECO: energy RRs are from 2007/2008 Large C&I Programs impact evaluation442 Coincidence Factors � National Grid, Unitil, WMECO: CFs based on impact evaluation of PY 2004 compressed air installations.443
� NSTAR, CLC: CFs based on standard assumptions.
440 Ibid. 441 RLW Analytics (2008). Business & Construction Solutions (BS/CS) Programs Measurement & Verification - 2006 Final
Report. Prepared for NSTAR Electric and Gas; Table 17. 442 KEMA, Inc. (2010). 2007/2008 Large C&I Programs, Phase 1 Report Memo for Lighting and Process Measures. Prepared for Western Massachusetts Electric Company. 443 DMI (2006). Impact Evaluation of 2004 Compressed Air Prescriptive Rebates. Prepared for National Grid; results analyzed in RLW Analytics (2006). Sample Design and Impact Evaluation Analysis for Prescriptive Compressed Air Measures in the Energy
Intiative and Design 2000 Programs. Prepared for National Grid.

Massachusetts Technical Reference Manual Commercial and Industrial Electric Efficiency Measures
October 2011 230 © 2011 Massachusetts Electric and Gas Energy
Efficiency Program Administrators, ALL RIGHTS RESERVED
Compressed Air – Refrigerated Air Dryers
Version Date and Revision History
Effective Date: 1/1/2011 (Revised 1/1/2012) End Date: TBD
Measure Overview
Description: The installation of cycling or variable frequency drive (VFD)-equipped refrigerated compressed air dryers. Refrigerated air dryers remove the moisture from a compressed air system to enhance overall system performance. An efficient refrigerated dryer cycles on and off or uses a variable speed drive as required by the demand for compressed air instead of running continuously. Only properly sized refrigerated air dryers used in a single-compressor system are eligible. Primary Energy Impact: Electric Secondary Energy Impact: None Non-Energy Impact: None Sector: Commercial & Industrial Market: Lost Opportunity End Use: Compressed Air Program: C&I New Construction and Major Renovation
Algorithms for Calculating Primary Energy Impact
( )( )( )HoursSAVECFMkWh DRYER=∆
( )( )SAVECFMkW DRYER=∆
Where: CFMDRYER = Full flow rated capacity of the refrigerated air dryer in cubic feet per minute
(CFM). Obtain from equipment’s Compressed Air Gas Institute Datasheet. Save = Refrigerated air dryer kW reduction per dryer full flow rated CFM. See Table
19. Hours = Annual operating hours of the refrigerated air dryer.
Table 19: Default kW Reduction per CFM by Dryer Capacity (SAVE) Dryer Capacity (CFMDRYER) kW Reduction per CFM (Save)
444
<100 0.00474 ≥100 and <200 0.00359 ≥200 and <300 0.00316 ≥300 and <400 0.00290 ≥400 0.00272
444 From NSTAR analysis based on metering data. The location of original data and analysis is unknown; however, these values are supported by multiple 3rd party impact evaluations. Single set of savings numbers used since VFD and cycling savings similar down to 40-50% load and prescriptive compressor loading is in the 50-60% range.
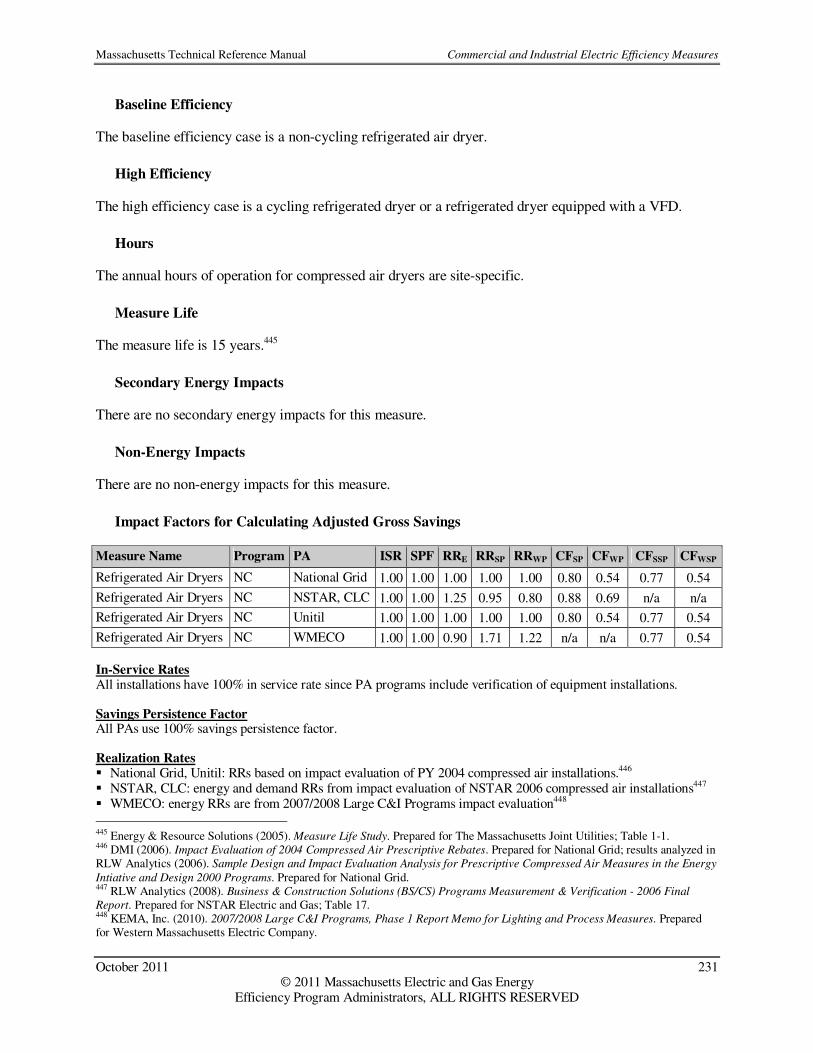
Massachusetts Technical Reference Manual Commercial and Industrial Electric Efficiency Measures
October 2011 231 © 2011 Massachusetts Electric and Gas Energy
Efficiency Program Administrators, ALL RIGHTS RESERVED
Baseline Efficiency
The baseline efficiency case is a non-cycling refrigerated air dryer.
High Efficiency
The high efficiency case is a cycling refrigerated dryer or a refrigerated dryer equipped with a VFD.
Hours
The annual hours of operation for compressed air dryers are site-specific.
Measure Life
The measure life is 15 years.445
Secondary Energy Impacts
There are no secondary energy impacts for this measure.
Non-Energy Impacts
There are no non-energy impacts for this measure.
Impact Factors for Calculating Adjusted Gross Savings
Measure Name Program PA ISR SPF RRE RRSP RRWP CFSP CFWP CFSSP CFWSP
Refrigerated Air Dryers NC National Grid 1.00 1.00 1.00 1.00 1.00 0.80 0.54 0.77 0.54
Refrigerated Air Dryers NC NSTAR, CLC 1.00 1.00 1.25 0.95 0.80 0.88 0.69 n/a n/a
Refrigerated Air Dryers NC Unitil 1.00 1.00 1.00 1.00 1.00 0.80 0.54 0.77 0.54
Refrigerated Air Dryers NC WMECO 1.00 1.00 0.90 1.71 1.22 n/a n/a 0.77 0.54
In-Service Rates All installations have 100% in service rate since PA programs include verification of equipment installations.
Savings Persistence Factor All PAs use 100% savings persistence factor.
Realization Rates � National Grid, Unitil: RRs based on impact evaluation of PY 2004 compressed air installations.446 � NSTAR, CLC: energy and demand RRs from impact evaluation of NSTAR 2006 compressed air installations447 � WMECO: energy RRs are from 2007/2008 Large C&I Programs impact evaluation448
445 Energy & Resource Solutions (2005). Measure Life Study. Prepared for The Massachusetts Joint Utilities; Table 1-1. 446 DMI (2006). Impact Evaluation of 2004 Compressed Air Prescriptive Rebates. Prepared for National Grid; results analyzed in RLW Analytics (2006). Sample Design and Impact Evaluation Analysis for Prescriptive Compressed Air Measures in the Energy
Intiative and Design 2000 Programs. Prepared for National Grid. 447 RLW Analytics (2008). Business & Construction Solutions (BS/CS) Programs Measurement & Verification - 2006 Final
Report. Prepared for NSTAR Electric and Gas; Table 17. 448 KEMA, Inc. (2010). 2007/2008 Large C&I Programs, Phase 1 Report Memo for Lighting and Process Measures. Prepared for Western Massachusetts Electric Company.

Massachusetts Technical Reference Manual Commercial and Industrial Electric Efficiency Measures
October 2011 232 © 2011 Massachusetts Electric and Gas Energy
Efficiency Program Administrators, ALL RIGHTS RESERVED
Coincidence Factors � National Grid, Unitil, WMECO: CFs based on impact evaluation of PY 2004 compressed air installations.449 � NSTAR, CLC: CFs based on standard assumptions.
449 DMI (2006). Impact Evaluation of 2004 Compressed Air Prescriptive Rebates. Prepared for National Grid; results analyzed in RLW Analytics (2006). Sample Design and Impact Evaluation Analysis for Prescriptive Compressed Air Measures in the Energy
Intiative and Design 2000 Programs. Prepared for National Grid.

Massachusetts Technical Reference Manual Commercial and Industrial Electric Efficiency Measures
October 2011 233 © 2011 Massachusetts Electric and Gas Energy
Efficiency Program Administrators, ALL RIGHTS RESERVED
Compressed Air – Low Pressure Drop Filters
Version Date and Revision History
Effective Date: 1/1/2011 End Date: TBD
Measure Overview
Description: Filters remove solids and aerosols from compressed air systems. Low pressure drop filters have longer lives and lower pressure drops than traditional coalescing filters resulting in higher efficiencies. Primary Energy Impact: Electric Secondary Energy Impact: None Non-Energy Impact: None Sector: Commercial & Industrial Market: Lost Opportunity & Retrofit End Use: Compressed Air Program: C&I New Construction, C&I Large Retrofit
Algorithms for Calculating Primary Energy Impacts
( )( )( )( )( )HoursSavingsHPQuantitykWh COMP %7457.0=∆
( )( )( )( )SavingsHPQuantitykW COMP %7457.0=∆
Where: ∆kWh = Energy savings ∆kW = Demand savings Quantity = Number of filters installed HPCOMP = Average compressor load 0.7457 = Conversion from HP to kW % Savings = Percent change in pressure drop. Site specific. Hours = Annual operating hours of the lower pressure drop filter.
Baseline Efficiency
The baseline efficiency case is a standard coalescing filter with initial drop of between 1 and 2 pounds per sq inch (psi) with an end of life drop of 10 psi.
High Efficiency
The high efficiency case is a low pressure drop filter with initial drop not exceeding 1 psi over life and 3 psi at element change. Filters must be deep-bed, “mist eliminator” style and installed on a single operating compressor rated 15 – 75 HP.

Massachusetts Technical Reference Manual Commercial and Industrial Electric Efficiency Measures
October 2011 234 © 2011 Massachusetts Electric and Gas Energy
Efficiency Program Administrators, ALL RIGHTS RESERVED
Hours
The annual hours of operation are site specific and will be determined on a case by case basis.
Measure Life
For lost-opportunity installations, the lifetime for this measure is 5 years. For retrofit projects, the lifetime is 3 years.450
Secondary Energy Impacts
There are no secondary energy impacts for this measure.
Non-Energy Impacts
There are no non-energy impacts for this measure.
Impact Factors for Calculating Adjusted Gross Savings
Measure Name Program PA ISR SPF RRE RRSP RRWP CFSP CFWP CFSSP CFWSP
LP Drop Filter NC, Large Retrofit National Grid 1.00 1.00 1.00 1.00 1.00 0.80 0.54 0.77 0.54
LP Drop Filter NC, Large Retrofit NSTAR, CLC 1.00 1.00 1.25 0.95 0.80 0.88 0.69 n/a n/a
LP Drop Filter NC, Large Retrofit Unitil 1.00 1.00 1.00 1.00 1.00 0.80 0.54 0.77 0.54
LP Drop Filter NC, Large Retrofit WMECO 1.00 1.00 0.90 1.71 1.22 n/a n/a custom custom
In-Service Rates All installations have 100% in service rate since PA programs include verification of equipment installations. Savings Persistence Factor All PAs use 100% savings persistence factor.
Realization Rates � National Grid, Unitil: RRs based on impact evaluation of PY 2004 compressed air installations.451 � NSTAR, CLC: energy and demand RRs from impact evaluation of NSTAR 2006 compressed air installations452 � WMECO: RRs from 2011 WMECO C&I impact evaluation.453
Coincidence Factors
� National Grid, Unitil: CFs based on impact evaluation of PY 2004 compressed air installations.454 � NSTAR, CLC: CFs based on standard assumptions. � WMEC: CFs are custom calculated.
450 Based on typical replacement schedules for low pressure filters (NSTAR staff estimates). 451 DMI (2006). Impact Evaluation of 2004 Compressed Air Prescriptive Rebates. Prepared for National Grid; results analyzed in RLW Analytics (2006). Sample Design and Impact Evaluation Analysis for Prescriptive Compressed Air Measures in the Energy
Intiative and Design 2000 Programs. Prepared for National Grid. 452 RLW Analytics (2008). Business & Construction Solutions (BS/CS) Programs Measurement & Verification - 2006 Final
Report. Prepared for NSTAR Electric and Gas; Table 17. 453 KEMA (2011). 2007/2008 Large C&I Programs. Prepared for Western Massachusetts Electric Company. 454 DMI (2006). Impact Evaluation of 2004 Compressed Air Prescriptive Rebates. Prepared for National Grid; results analyzed in RLW Analytics (2006). Sample Design and Impact Evaluation Analysis for Prescriptive Compressed Air Measures in the Energy
Intiative and Design 2000 Programs. Prepared for National Grid.

Massachusetts Technical Reference Manual Commercial and Industrial Electric Efficiency Measures
October 2011 235 © 2011 Massachusetts Electric and Gas Energy
Efficiency Program Administrators, ALL RIGHTS RESERVED
Compressed Air – Zero Loss Condensate Drains
Version Date and Revision History
Effective Date: 1/1/2011 End Date: TBD
Measure Overview
Description: Drains remove water from a compressed air system. Zero loss condensate drains remove water from a compressed air system without venting any air, resulting in less air demand and consequently greater efficiency. Primary Energy Impact: Electric Secondary Energy Impact: None Non-Energy Impact: None Sector: Commercial & Industrial Market: Lost Opportunity & Retrofit End Use: Compressed Air Program: C&I New Construction, C&I Large Retrofit
Algorithms for Calculating Primary Energy Impacts
( )( )( )( )HoursSAVECFMCFMkWh savedpipe=∆
( )( )( )SAVECFMCFMkW savepipe=∆
Where: ∆kWh = Energy Savings ∆kW = Demand savings CFMpipe = CFM capacity of piping. Site specific. CFMsaved = Average CFM saved per CFM of piping capacity: 0.049 Save = Average savings per CFM: 0.24386 kW/CFM455 Hours = Annual operating hours of the zero loss condensate drain.
Baseline Efficiency
The baseline efficiency case is installation of a standard condensate drain on a compressor system.
High Efficiency
The high efficiency case is installation of a zero loss condensate drain on a single operating compressor rated ≤ 75 HP.
Hours
The annual hours of operation are site specific and will be determined on a case by case basis.
455 Based on NSTAR analysis assuming a typical timed drain settings discharge scenario.

Massachusetts Technical Reference Manual Commercial and Industrial Electric Efficiency Measures
October 2011 236 © 2011 Massachusetts Electric and Gas Energy
Efficiency Program Administrators, ALL RIGHTS RESERVED
Measure Life
For lost-opportunity installations, the lifetime for this measure is 15 years. For retrofit projects, the lifetime is 13 years.456
Secondary Energy Impacts
There are no secondary energy impacts for this measure.
Non-Energy Impacts
There are no non-energy impacts for this measure.
Impact Factors for Calculating Adjusted Gross Savings
Measure Name Program PA ISR SPF RRE RRSP RRWP CFSP CFWP CFSSP CFWSP
Zero Loss Drain NC, Large Retrofit National Grid 1.00 1.00 1.00 1.00 1.00 0.80 0.54 0.77 0.54
Zero Loss Drain NC, Large Retrofit NSTAR, CLC 1.00 1.00 1.25 0.95 0.80 0.88 0.69 n/a n/a
Zero Loss Drain NC, Large Retrofit Unitil 1.00 1.00 1.00 1.00 1.00 0.80 0.54 0.77 0.54
Zero Loss Drain NC, Large Retrofit WMECO 1.00 1.00 0.90 1.71 1.22 n/a n/a custom custom
In-Service Rates All installations have 100% in service rate since PA programs include verification of equipment installations. Savings Persistence Factor All PAs use 100% savings persistence factor.
Realization Rates � National Grid, Unitil: RRs based on impact evaluation of PY 2004 compressed air installations.457 � NSTAR, CLC: energy and demand RRs from impact evaluation of NSTAR 2006 compressed air installations458 � WMECO: RRs from 2011 WMECO C&I impact evaluation.459
Coincidence Factors � National Grid, Unitil: CFs based on impact evaluation of PY 2004 compressed air installations.460 � NSTAR, CLC: CFs based on standard assumptions. � WMECO: CFs are custom calculated.
456 Energy & Resource Solutions (2005). Measure Life Study. Prepared for The Massachusetts Joint Utilities; Table 1-1. Drains not expected to change during life of compressor. 457 DMI (2006). Impact Evaluation of 2004 Compressed Air Prescriptive Rebates. Prepared for National Grid; results analyzed in RLW Analytics (2006). Sample Design and Impact Evaluation Analysis for Prescriptive Compressed Air Measures in the Energy
Intiative and Design 2000 Programs. Prepared for National Grid. 458 RLW Analytics (2008). Business & Construction Solutions (BS/CS) Programs Measurement & Verification - 2006 Final
Report. Prepared for NSTAR Electric and Gas; Table 17. 459 KEMA (2011). 2007/2008 Large C&I Programs. Prepared for Western Massachusetts Electric Company. 460 DMI (2006). Impact Evaluation of 2004 Compressed Air Prescriptive Rebates. Prepared for National Grid; results analyzed in RLW Analytics (2006). Sample Design and Impact Evaluation Analysis for Prescriptive Compressed Air Measures in the Energy
Intiative and Design 2000 Programs. Prepared for National Grid.

Massachusetts Technical Reference Manual Commercial and Industrial Electric Efficiency Measures
October 2011 237 © 2011 Massachusetts Electric and Gas Energy
Efficiency Program Administrators, ALL RIGHTS RESERVED
Motors/Drives – Variable Frequency Drives
Version Date and Revision History
Effective Date: 1/1/2011 (Revised 1/1/2012) End Date: TBD
Measure Overview
Description: This measure covers the installation of variable speed drives according to the terms and conditions stated on the statewide worksheet. The measure covers multiple end use types and building types. The installation of this measure saves energy since the power required to rotate a pump or fan at lower speeds requires less power than when rotated at full speed. Primary Energy Impact: Electric Secondary Energy Impact: None Non-Energy Impact: None Sector: Commercial & Industrial Market: Lost Opportunity, Retrofit End Use: Motors/Drives Program: C&I New Construction & Major Renovation, C&I Large Retrofit, C&I Small Retrofit
Notes
The Large Commercial & Industrial Evaluation Research Area will be commencing an impact evaluation of this measure starting the Fall of 2010. The results of this study will result in either modifications to the savings factors or the realization rates and will be used for reporting on the 2011 program year.
Algorithms for Calculating Primary Energy Impacts
( ) ( )HPkWhHPkWhmotor
/1
=∆
η
( ) ( )SP
motor
HPkWHPkW /1
=∆
η
Where: HP = Rated horsepower for the impacted motor. ηmotor = Motor efficiency kWh/HP = Annual electric energy reduction based on building and equipment type. See Table 20. kW/HPSP = Summer demand reduction based on building and equipment type. See Table 20. kW/HPWP = Winter demand reduction based on building and equipment type. See Table 20.

Massachusetts Technical Reference Manual Commercial and Industrial Electric Efficiency Measures
October 2011 238 © 2011 Massachusetts Electric and Gas Energy
Efficiency Program Administrators, ALL RIGHTS RESERVED
Table 20: Savings Factors for C&I VFDs (kWh/HP and kW/HP)461
Buil
din
g E
xhau
st
Fan
Coo
ling T
ow
er F
an
Chil
led W
ater
P
um
p
Boil
er F
eed W
ater
P
um
p
Hot
Wat
er
Cir
cula
ting.
Pum
p
MA
F -
Mak
e-up
Air
Fan
Ret
urn
Fan
Sup
ply
Fan
WS
Hea
t P
um
p
Cir
cula
ting L
oop
Annual Energy Savings Factors (kWh/HP)
University/College 3,641 449 745 2,316 2,344 3,220 1,067 1,023 3,061 Elm/H School 3,563 365 628 1,933 1,957 3,402 879 840 2,561 Multi-Family 3,202 889 1,374 2,340 2,400 3,082 1,374 1,319 3,713 Hotel/Motel 3,151 809 1,239 2,195 2,239 3,368 1,334 1,290 3,433 Health 3,375 1,705 2,427 2,349 2,406 3,002 1,577 1,487 3,670 Warehouse 3,310 455 816 2,002 2,087 3,229 1,253 1,205 2,818 Restaurant 3,440 993 1,566 1,977 2,047 2,628 1,425 1,363 3,542 Retail 3,092 633 1,049 1,949 2,000 2,392 1,206 1,146 2,998 Grocery 3,126 918 1,632 1,653 1,681 2,230 1,408 1,297 3,285 Offices 3,332 950 1,370 1,866 1,896 3,346 1,135 1,076 3,235
Summer Demand Savings Factors (kW/HPSP) University/College 0.109 -0.023 0.056 0.457 0.457 0.109 0.102 0.064 0.056 Elm/H School 0.377 -0.023 0.056 0.457 0.457 0.109 0.102 0.064 0.275 Multi-Family 0.109 -0.023 0.056 0.457 0.457 0.109 0.102 0.064 0.056 Hotel/Motel 0.109 -0.023 0.056 0.457 0.457 0.109 0.102 0.064 0.056 Health 0.109 -0.023 0.056 0.457 0.457 0.109 0.102 0.064 0.056 Warehouse 0.109 -0.023 0.056 0.457 0.457 0.261 0.102 0.064 0.056 Restaurant 0.261 -0.023 0.056 0.457 0.457 0.109 0.102 0.064 0.178 Retail 0.109 -0.023 0.056 0.457 0.457 0.109 0.102 0.064 0.056 Grocery 0.261 -0.023 0.056 0.457 0.457 0.109 0.102 0.064 0.178 Offices 0.109 -0.023 0.056 0.457 0.457 0.109 0.102 0.064 0.056
Winter Demand Savings Factors (kW/HPWP) University/College 0.377 -0.006 0.457 0.457 0.457 0.109 0.113 0.113 0.457 Elementary/High School 0.457 -0.006 0.457 0.457 0.457 0.109 0.113 0.113 0.457 Multi-Family 0.109 -0.006 0.457 0.355 0.384 0.109 0.113 0.113 0.355 Hotel/Motel 0.109 -0.006 0.457 0.418 0.444 0.109 0.113 0.113 0.418 Health 0.377 -0.006 0.457 0.275 0.298 0.109 0.113 0.113 0.275 Warehouse 0.377 -0.006 0.457 0.178 0.193 0.261 0.113 0.113 0.178 Restaurant 0.109 -0.006 0.457 0.355 0.384 0.109 0.113 0.113 0.355 Retail 0.109 -0.006 0.457 0.275 0.298 0.109 0.113 0.113 0.275 Grocery 0.457 -0.006 0.457 0.418 0.444 0.109 0.113 0.113 0.418 Offices 0.457 -0.006 0.457 0.418 0.444 0.109 0.113 0.113 0.418
Baseline Efficiency
The baseline efficiency case for this measure varies with the equipment type. All baselines assume either a constant speed motor or 2-speed motor. In the baselines, air or water volume/temperature is controlled using valves, dampers, and/or reheats.
461 Chan, Tumin (2010). Formulation of a Prescriptive Incentive for the VFD and Motors & VFD impact tables at NSTAR. Prepared for NSTAR.
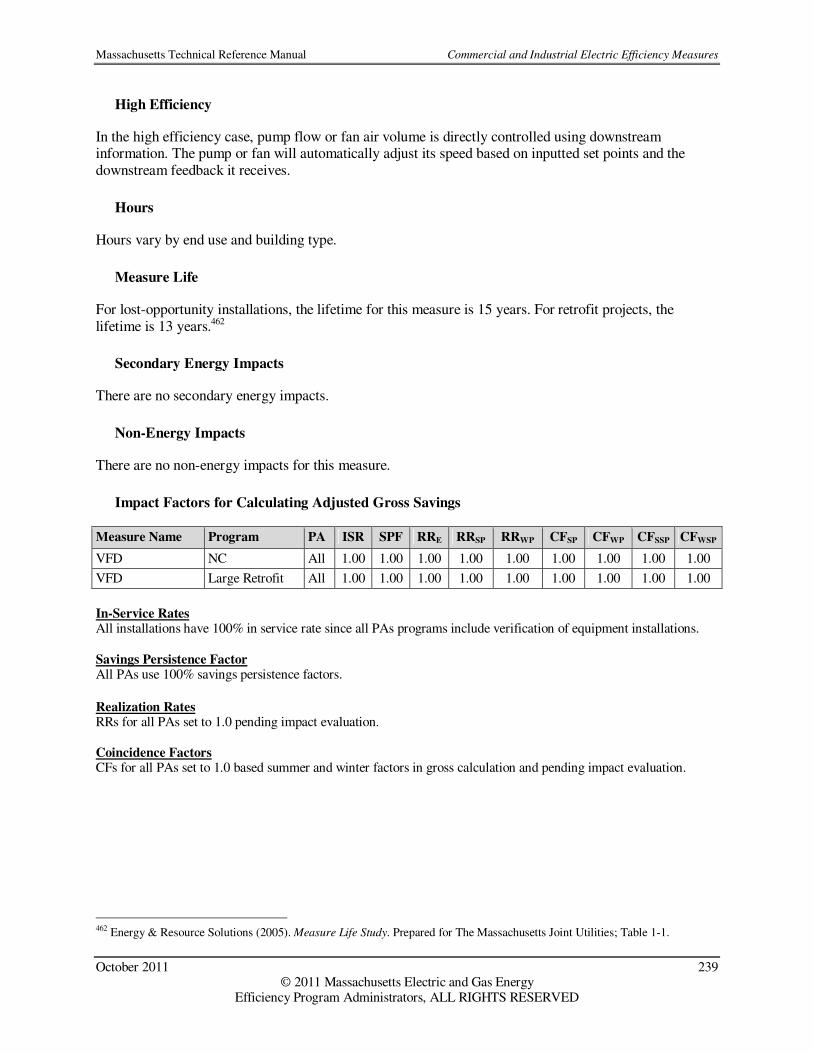
Massachusetts Technical Reference Manual Commercial and Industrial Electric Efficiency Measures
October 2011 239 © 2011 Massachusetts Electric and Gas Energy
Efficiency Program Administrators, ALL RIGHTS RESERVED
High Efficiency
In the high efficiency case, pump flow or fan air volume is directly controlled using downstream information. The pump or fan will automatically adjust its speed based on inputted set points and the downstream feedback it receives.
Hours
Hours vary by end use and building type.
Measure Life
For lost-opportunity installations, the lifetime for this measure is 15 years. For retrofit projects, the lifetime is 13 years.462
Secondary Energy Impacts
There are no secondary energy impacts.
Non-Energy Impacts
There are no non-energy impacts for this measure.
Impact Factors for Calculating Adjusted Gross Savings
Measure Name Program PA ISR SPF RRE RRSP RRWP CFSP CFWP CFSSP CFWSP
VFD NC All 1.00 1.00 1.00 1.00 1.00 1.00 1.00 1.00 1.00
VFD Large Retrofit All 1.00 1.00 1.00 1.00 1.00 1.00 1.00 1.00 1.00
In-Service Rates All installations have 100% in service rate since all PAs programs include verification of equipment installations. Savings Persistence Factor All PAs use 100% savings persistence factors.
Realization Rates RRs for all PAs set to 1.0 pending impact evaluation. Coincidence Factors CFs for all PAs set to 1.0 based summer and winter factors in gross calculation and pending impact evaluation.
462 Energy & Resource Solutions (2005). Measure Life Study. Prepared for The Massachusetts Joint Utilities; Table 1-1.

Massachusetts Technical Reference Manual Commercial and Industrial Electric Efficiency Measures
October 2011 240 © 2011 Massachusetts Electric and Gas Energy
Efficiency Program Administrators, ALL RIGHTS RESERVED
Custom Measures (Large C&I)
Version Date and Revision History
Effective Date: 1/1/2011 (Revised 1/1/2012) End Date: TBD
Measure Overview
Description: The Custom project track is offered for energy efficiency projects involving complex site-specific applications that require detailed engineering analysis and/or projects which do not qualify for incentives under any of the prescriptive rebate offering. Projects offered through the custom approach must pass a cost-effectiveness test based on project-specific costs and savings. Primary Energy Impact: Electric Secondary Energy Impact: Project Specific Non-Energy Impact: Project Specific Sector: Commercial & Industrial Market: Lost Opportunity, Retrofit End Use: All Program: C&I New Construction & Major Renovation, C&I Large Retrofit
Notes
In 2011 the PAs agreed on the following set of categories for Large C&I custom projects. All Large C&I Custom projects will be assigned to one of the following categories for future statewide impact evaluation.
Custom
Category
Description
Comprehensive Design
New construction projects which address multiple end-uses, reach 20%+ total energy savings, and use whole-building simulations for ex-ante savings estimates and Retrofit projects which address multiple end-uses, reach 15%+ electric energy savings, and do not require whole-building simulations.
Compressed Air New construction and/or retrofit projects for compressed air systems. CHP Combined Heat and Power projects. HVAC New construction and/or retrofit projects for HVAC system equipment and controls. Lighting New construction and/or retrofit projects for lighting system equipment and controls. Motor New construction and/or retrofit projects for motor installations or controls. Other New construction and/or retrofit projects that do not fit in with other categories. Process New construction and/or retrofit projects for process system equipment and controls. Refrigeration New construction and/or retrofit projects for refrigeration system equipment and
controls. Verified Savings Retrofit “Pay-for-Performance” projects for which savings are estimated based on
post-installation measurement and verification.
Algorithms for Calculating Primary Energy Impact
Gross energy and demand savings estimates for custom projects are calculated using engineering analysis with project-specific details. Custom analyses typically include a weather dependent load bin analysis,

Massachusetts Technical Reference Manual Commercial and Industrial Electric Efficiency Measures
October 2011 241 © 2011 Massachusetts Electric and Gas Energy
Efficiency Program Administrators, ALL RIGHTS RESERVED
whole building energy model simulation, end-use metering or other engineering analysis and include estimates of savings, costs, and an evaluation of the projects’ cost-effectiveness.
Baseline Efficiency
For Lost Opportunity projects, the baseline efficiency case assumes compliance with the efficiency requirements as mandated by Massachusetts State Building Code or industry accepted standard practice. For retrofit projects, the baseline efficiency case is the same as the existing, or pre-retrofit, case for the facility.
High Efficiency
The high efficiency scenario is specific to the custom project and may include one or more energy efficiency measures. Energy and demand savings calculations are based on projected or measured changes in equipment efficiencies and operating characteristics and are determined on a case-by-case basis. The project must be proven cost-effective in order to qualify for energy efficiency incentives.
Hours
All hours for custom savings analyses should be determined on a case-by-case basis.
Measure Life
For both lost-opportunity and retrofit custom applications, the measure life is determined based on specific project using the common custom measure life recommendations.463
Secondary Energy Impacts
All secondary energy impacts should be determined on a case-by-case basis.
Non-Energy Impacts
All non-energy impacts should be determined on a case-by-case basis.
463 Energy & Resource Solutions (2005). Measure Life Study. Prepared for The Massachusetts Joint Utilities; Table 1-2.

Massachusetts Technical Reference Manual Commercial and Industrial Electric Efficiency Measures
October 2011 242 © 2011 Massachusetts Electric and Gas Energy
Efficiency Program Administrators, ALL RIGHTS RESERVED
Impact Factors for Calculating Adjusted Gross Savings
Measure PA ISR SPF RRE RRSP RRWP CFSP CFWP CFSSP CFWSP
NSTAR, CLC, Unitil, WMECO
1.00 1.00 0.91 0.64 0.60 custom custom custom custom Comprehensive Design
National Grid 1.00 1.00 0.97 0.64 0.55 custom custom n/a n/a
National Grid 1.00 1.00 0.82 0.80 0.83 custom custom n/a n/a NSTAR, CLC 1.00 1.00 1.25 0.95 0.80 custom custom n/a n/a Unitil 1.00 1.00 1.00 1.00 1.00 custom custom n/a n/a
Compressed Air
WMECO 1.00 1.00 0.90 1.71 1.22 n/a n/a custom custom
CHP All except National Grid
1.00 1.00 1.00 1.00 1.00 custom custom custom custom
CHP National Grid 1.00 1.00 0.90 1.00 1.00 custom custom custom custom
CLC, Unitil, WMECO
1.00 1.00 1.10 0.88 0.86 custom custom custom custom
National Grid 1.00 1.00 1.01 0.84 0.82 custom custom n/a n/a HVAC
NSTAR 1.00 1.00 1.24 0.94 0.75 custom custom n/a n/a National Grid 1.00 1.00 1.07 0.80 0.73 custom custom n/a n/a NSTAR, CLC 1.00 1.00 1.03 1.16 1.26 custom custom n/a n/a Unitil 1.00 1.00 1.00 1.00 1.00 custom custom n/a n/a
Lighting
WMECO 1.00 1.00 1.06 1.058 1.06 n/a n/a custom custom National Grid 1.00 1.00 0.82 0.80 0.83 custom custom n/a n/a NSTAR, CLC 1.00 1.00 0.67 0.85 0.78 custom custom n/a n/a Unitil 1.00 1.00 1.00 1.00 1.00 custom custom n/a n/a
Motor
WMECO 1.00 1.00 1.31 0.85 0.60 n/a n/a custom custom
National Grid 1.00 1.00 0.82 0.80 0.83 custom custom n/a n/a NSTAR, CLC 1.00 1.00 1.03 1.48 0.72 custom custom n/a n/a Unitil 1.00 1.00 1.00 1.00 1.00 custom custom n/a n/a
Process
WMECO 1.00 1.00 0.90 1.71 1.22 n/a n/a custom custom National Grid 1.00 1.00 0.82 0.80 0.83 custom custom n/a n/a
NSTAR, CLC 1.00 1.00 0.85 0.41 0.24 custom custom n/a n/a Unitil 1.00 1.00 1.00 1.00 1.00 custom custom n/a n/a
Refrigeration
WMECO 1.00 1.00 0.90 2.08 0.87 n/a n/a custom custom Verified Savings464
Statewide 1.00 1.00 1.00 1.00 1.00 custom custom custom custom
Note: Unless otherwise stated, PA’s use Statewide results.
In-Service Rates All installations have 100% in service rate since all PA programs include verification of equipment installations. Savings Persistence Factor All PAs use 100% savings persistence factor.
464 The PAs assume 100% realization rates for verified savings projects because gross savings assumptions are based on post-installation verification and analysis. This custom category is new in 2011 and has not been evaluated.

Massachusetts Technical Reference Manual Commercial and Industrial Electric Efficiency Measures
October 2011 243 © 2011 Massachusetts Electric and Gas Energy
Efficiency Program Administrators, ALL RIGHTS RESERVED
Realization Rates � Comprehensive: Realization rates from statewide impact evaluation completed in 2011. National Grid uses PA
specific values, all other PA’s use statewide values due to small sample size. 465 � HVAC: Realization rates from statewide impact evaluation completed in 2011. National Grid and NSTAR use PA
specific values, all other PA’s use statewide values due to small sample size. 466 � CHP: Realization Rates set to 90% pending finalized � Compressed Air, Lighting, Motor, Other, Process, and Refrigeration realization rates based on previous PA-
specific impact evaluations. No statewide evaluations have been performed for these categories: o National Grid rates from impact evaluation analysis of the National Grid 2009 custom program467.
Compressed Air, Motor, Other and Refrigeration projects are included in the Process populatiors. o NSTAR, CLC rates for Lighting from NSTAR impact evaluation of large C&I PY 2007 lighting
measures468; rates for non-lighting from NSTAR impact evaluation of large C&I 2006 programs.469 o Unitil RRs have not been evaluated for this program so 100% is used. o WMECO energy RRs are from 2007/2008 Large C&I Programs impact evaluation470
Coincidence Factors For all PAs, gross summer and winter peak coincidence factors are custom-calculated for each custom project based on project-specific information. The actual or measured coincidence factors are included in the summer and winter demand realization rates.
465 KEMA, Inc. and SBW (2011). Impact Evaluation of 2008 and 2009 Custom CDA Installations. Prepared for Massachusetts Energy Efficiency Program Administrators and Massachusetts Energy Efficiency Advisory Council. 466 KEMA, Inc. and DMI (2011). Impact Evaluation of 2009 Custom HVAC Installations. Prepared for Massachusetts Energy Efficiency Program Administrators and Massachusetts Energy Efficiency Advisory Council. 467 KEMA, Inc. (2010). Sample Design and Impact Evaluation Analysis of the 2009 Custom Program. Prepared for National Grid; Table 17. 468 KEMA, Inc. (2009). 2007 Business & Construction Solutions (BS/CS) Programs - Measurement and Verification of 2007
Lighting Measures. Prepared for NSTAR; Table Ex 1. 469 RLW Analytics (2008). Business & Construction Solutions (BS/CS) Programs Measurement & Verification - 2006 Final
Report. Prepared for NSTAR Electric and Gas; Tables 14-18. 470 KEMA, Inc. (2010). 2007/2008 Large C&I Programs, Phase 1 Report Memo for Lighting and Process Measures. Prepared for Western Massachusetts Electric Company.
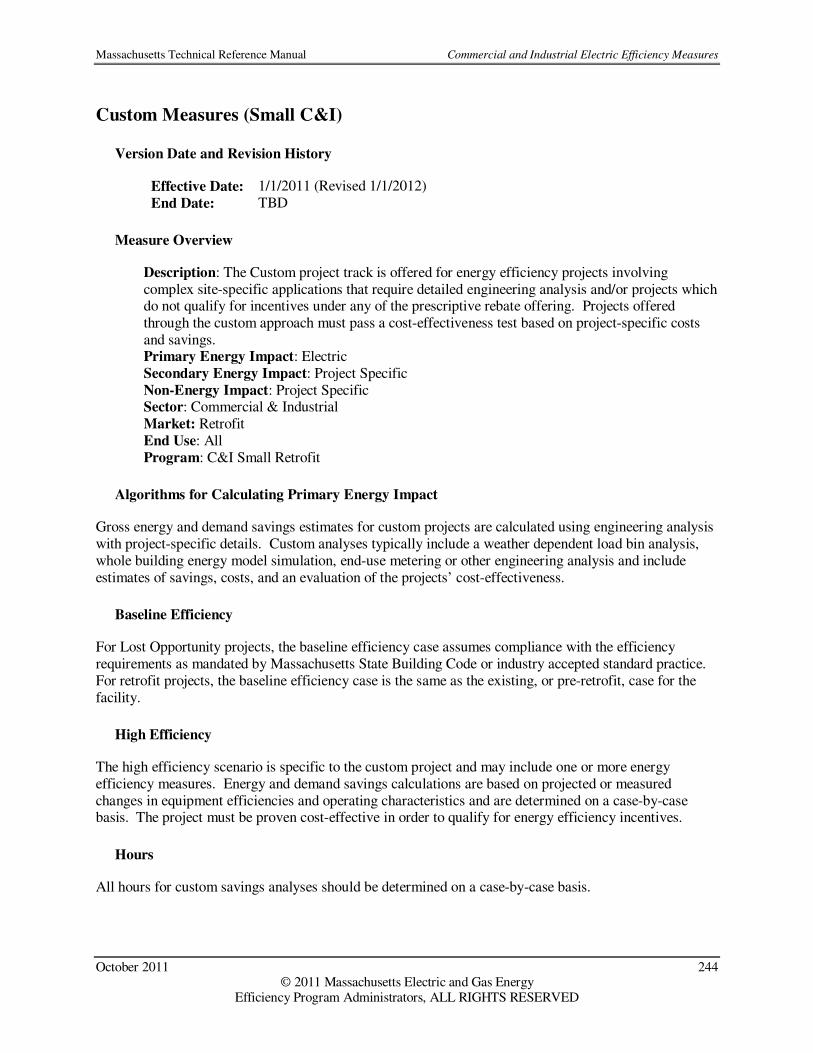
Massachusetts Technical Reference Manual Commercial and Industrial Electric Efficiency Measures
October 2011 244 © 2011 Massachusetts Electric and Gas Energy
Efficiency Program Administrators, ALL RIGHTS RESERVED
Custom Measures (Small C&I)
Version Date and Revision History
Effective Date: 1/1/2011 (Revised 1/1/2012) End Date: TBD
Measure Overview
Description: The Custom project track is offered for energy efficiency projects involving complex site-specific applications that require detailed engineering analysis and/or projects which do not qualify for incentives under any of the prescriptive rebate offering. Projects offered through the custom approach must pass a cost-effectiveness test based on project-specific costs and savings. Primary Energy Impact: Electric Secondary Energy Impact: Project Specific Non-Energy Impact: Project Specific Sector: Commercial & Industrial Market: Retrofit End Use: All Program: C&I Small Retrofit
Algorithms for Calculating Primary Energy Impact
Gross energy and demand savings estimates for custom projects are calculated using engineering analysis with project-specific details. Custom analyses typically include a weather dependent load bin analysis, whole building energy model simulation, end-use metering or other engineering analysis and include estimates of savings, costs, and an evaluation of the projects’ cost-effectiveness.
Baseline Efficiency
For Lost Opportunity projects, the baseline efficiency case assumes compliance with the efficiency requirements as mandated by Massachusetts State Building Code or industry accepted standard practice. For retrofit projects, the baseline efficiency case is the same as the existing, or pre-retrofit, case for the facility.
High Efficiency
The high efficiency scenario is specific to the custom project and may include one or more energy efficiency measures. Energy and demand savings calculations are based on projected or measured changes in equipment efficiencies and operating characteristics and are determined on a case-by-case basis. The project must be proven cost-effective in order to qualify for energy efficiency incentives.
Hours
All hours for custom savings analyses should be determined on a case-by-case basis.

Massachusetts Technical Reference Manual Commercial and Industrial Electric Efficiency Measures
October 2011 245 © 2011 Massachusetts Electric and Gas Energy
Efficiency Program Administrators, ALL RIGHTS RESERVED
Measure Life
For both lost-opportunity and retrofit custom applications, the measure life is determined based on specific project using the common custom measure life recommendations.471
Secondary Energy Impacts
All secondary energy impacts should be determined on a case-by-case basis.
Non-Energy Impacts
All non-energy impacts should be determined on a case-by-case basis.
Impact Factors for Calculating Adjusted Gross Savings
Measure PA ISR SPF RRE RRSP RRWP CFSP CFWP CFSSP CFWSP
Lighting National Grid 1.00 1.00 1.04 1.02 1.13 custom custom n/a n/a
Refrigeration National Grid 1.00 1.00 1.60 1.49 0.69 custom custom n/a n/a Other National Grid 1.00 1.00 0.81 0.77 0.53 custom custom n/a n/a Lighting NSTAR, CLC 1.00 1.00 1.08 0.99 0.99 custom custom n/a n/a Non-Lighting NSTAR, CLC 1.00 1.00 0.91 0.92 0.92 custom custom n/a n/a Lighting Unitil 1.00 1.00 1.08 0.99 0.99 custom custom n/a n/a
Non-Lighting Unitil 1.00 1.00 1.08 1.00 1.00 custom custom n/a n/a
Lighting WMECO 1.00 1.00 0.83 0.54 0.25 n/a n/a custom custom Refrigeration WMECO 1.00 1.00 0.86 0.57 0.57 n/a n/a custom custom Other WMECO 1.00 1.00 1.00 1.00 1.00 n/a n/a custom custom
In-Service Rates All installations have 100% in service rate since all PA programs include verification of equipment installations. Savings Persistence Factor All PAs use 100% savings persistence factor.
Realization Rates � National Grid RRs derived from impact evaluation of 2005 SBS program472 � NSTAR and CLC RRs from the 2011 Small C&I Non-Controlled Lighting impact evaluation 473; non-lighting
energy and all demand RRs based on NSTAR 2002–2004 small retrofit impact evaluations � Unitil RRs from Small Business program impact evaluation.474 � WMECO: RRs from impact evaluation of 2008 small retrofit program.475
471 Energy & Resource Solutions (2005). Measure Life Study. Prepared for The Massachusetts Joint Utilities; Table 1-2. 472 RLW Analytics (2007). Small Business Services Custom Measure Impact Evaluation. Prepared for National Grid; Table 4. 473 Cadmus Group (2011). Non-Controls Lighting Evaluation for the Massachusetts Small Commercial Direct Install Program. Prepared for Massachussetts Utilities. 474 Summit Blue Consulting, LLC (2008). Multiple Small Business Services Programs Impact Evaluation 2007 – Final Report
Update. Prepared for Cape Light Compact, National Grid, NSTAR, Unitil and Western Massachusetts Electric Company. 475 The Cadmus Group, Inc. (2010). Western Massachusetts Small Business Energy Advantage Impact Evaluation Report
Program Year 2008. Prepared for Western Massachusetts Electric Company.

Massachusetts Technical Reference Manual Commercial and Industrial Electric Efficiency Measures
October 2011 246 © 2011 Massachusetts Electric and Gas Energy
Efficiency Program Administrators, ALL RIGHTS RESERVED
Coincidence Factors For all PAs, gross summer and winter peak coincidence factors are custom-calculated for each custom project based on project-specific information. The actual or measured coincidence factors are included in the summer and winter demand realization rates.
Massachusetts Technical Reference Manual Residential Natural Gas Efficiency Measures
October 2011 247 © 2011 Massachusetts Electric and Gas Energy
Efficiency Program Administrators, ALL RIGHTS RESERVED
Residential Natural Gas Efficiency Measures

Massachusetts Technical Reference Manual Residential Natural Gas Efficiency Measures
October 2011 248 © 2011 Massachusetts Electric and Gas Energy
Efficiency Program Administrators, ALL RIGHTS RESERVED
Behavior – OPOWER Gas
Version Date and Revision History
Effective Date: 1/1/2012 End Date: TBD
Measure Overview
Description: The Behavior/Feedback programs send monthly energy use reports to participating gas customers in order to change customers’ energy-use behavior. Primary Energy Impact: Natural Gas (Residential Heat) Secondary Energy Impact: None Non-Energy Impact: None Sector: Residential Market: Products and Services End Use: Behavior Program: Behavior/Feedback Program
Algorithms for Calculating Primary Energy Impact
Unit saving are deemed based on study results:
))(%( SAVEMMBtuMMBtu BASE=∆
Where: Unit = One participant household ∆MMBtu = Average annual gas heating MMBtu savings per unit. See Table 21. MMBtuBASE = Average baseline consumption MMBtu per unit. See Table 21. %SAVE = Annual percent of MMBtu savings per unit. See Table 21.
Table 21: Savings Factors for Behavior/Feedback Program476
Measure PA MMBtuBASE %SAVE ∆MMBtu
OPOWER Group 2009 National Grid 137.2 1.46 2.00 OPOWER Group 2010 National Grid 141.4 1.10 1.56 OPOWER Group 2011 National Grid 102.7 1.10 1.13 OPOWER Group 2011 Add National Grid 135.8 0.97 1.32 OPOWER Group 2012 National Grid 135.8 0.97 1.32 OPOWER Group 2012 Dual National Grid 162.1 0.97 1.57
Baseline Efficiency
The baseline efficiency case is a customer who does not receive Behavior/Feedback program reports.
476 ODC/Navigant (2011) Massachusetts Cross-cutting Behavioral Program Evaluation, updated with vendor projections for 2012.

Massachusetts Technical Reference Manual Residential Natural Gas Efficiency Measures
October 2011 249 © 2011 Massachusetts Electric and Gas Energy
Efficiency Program Administrators, ALL RIGHTS RESERVED
High Efficiency
The high efficiency case is a customer who does receive Behavior/Feedback program reports.
Hours
Not applicable.
Measure Life
The measure life is 1 year477.
Secondary Energy Impacts
There are no secondary energy impacts for this measure
Non-Energy Impacts
There are no-non-energy impacts for this measure.
Impact Factors for Calculating Adjusted Gross Savings
Measure Name Program PA ISR SPF RRE RRSP RRWP CFSP CFWP
OPOWER Group Behavior/Feedback National Grid 1.00 1.00 1.00 n/a n/a n/a n/a
OPOWER Group Behavior/Feedback NSTAR 1.00 1.00 1.00 n/a n/a n/a n/a
In-Service Rates All installations have 100% in service rate since programs include verification of equipment installations. Savings Persistence Factor All PAs use 100% savings persistence factor. Realization Rates RRs are 100% because deemed savings are based on assumptions from year-to-date vendor findings. The summer and winter peak realization rates are not applicable for this measure since there are no electric savings claimed. Coincidence Factors Not applicable for this measure since no electric savings are claimed.
477 Vendor estimate.

Massachusetts Technical Reference Manual Residential Natural Gas Efficiency Measures
October 2011 250 © 2011 Massachusetts Electric and Gas Energy
Efficiency Program Administrators, ALL RIGHTS RESERVED
Hot Water – Water Heaters
Version Date and Revision History
Effective Date: 1/1/2011 (Revised for 1/1/2012) End Date: TBD
Measure Overview
Description: Installation of high efficiency gas water heaters: Indirect water heaters use a storage tank that is heated by the main boiler. The energy stored by the water tank allows the boiler to turn off and on less often, saving considerable energy. Condensing water heaters recover energy by using either a larger heat exchanger or a second heat exchanger to reduce the flue-gas temperature to the point that water vapor condenses, thus releasing even more energy. Stand-alone storage water heaters are high efficiency water heaters that are not combined with space heating devices. Tankless water heaters circulate water through a heat exchanger to be heated for immediate use, eliminating the standby heat loss associated with a storage tank. Primary Energy Impact: Natural Gas (Residential DHW) Secondary Energy Impact: None
Non-Energy Impact: Annual Non-Resource, One-Time Non-Resource
Sector: Residential
Market: Lost Opportunity End Use: Hot Water Program: Residential Heating and Water Heating
Algorithms for Calculating Primary Energy Impact
Unit savings are deemed based on study results:
MMBtuMMBtu ∆=∆ Where: Units = Number of stand alone storage water heaters installed.
∆MMBtu = Annual MMBtu savings per unit. See Table 22. Table 22: Savings for Residential Water Heaters Equipment Type Efficiency Requirement ∆MMBtu
EF >=0.80 7.4 478
Condensing Water Heater TE >=95 25.0479
Indirect Water Heater ENERGY STAR® Boiler 8.0 480
Stand-Alone Storage Water Heater EF >= 0.67 3.7 481
EF >= 0.82 9.7 482 On-Demand Tankless Water Heater
EF >= 0.95 10.3 483
478 DOE (2008). ENERGY STAR® Residential Water Heaters: Final Criteria Analysis. Prepared for the DOE; Page 10. 479 GDS Associates, Inc. (2009). Natural Gas Energy Efficiency Potential in Massachusetts. Prepared for GasNetworks. 480 Nexus Market Research and The Cadmus Group (2010). HEHE Process and Impact Evaluation. Prepared for GasNetworks. 481 DOE (2008). ENERGY STAR® Residential Water Heaters: Final Criteria Analysis. Prepared for the DOE; Page 10. 482 Nexus Market Research and The Cadmus Group (2010). HEHE Process and Impact Evaluation. Prepared for GasNetworks.

Massachusetts Technical Reference Manual Residential Natural Gas Efficiency Measures
October 2011 251 © 2011 Massachusetts Electric and Gas Energy
Efficiency Program Administrators, ALL RIGHTS RESERVED
Baseline Efficiency
The baseline efficiency case is a stand alone tank water heater with an energy factor of 0.575.
High Efficiency
The high efficiency case is a stand-alone storage water heater with an energy factor >= 0.62, a condensing water heater with an energy factor >= 0.8, a tankless water heater with an energy factor >= 0.82, or an indirect water heater attached to an ENERGY STAR® rated forced hot water gas boiler.
Hours
Not applicable.
Measure Life
The measure lives vary by water heater type and are described in the table below. Table 23: Measure Lives for Residential Water Heaters Measure Measure Life (years)
Condensing Water Heater 15 484
Indirect Water Heater 20 485
Stand-Alone Storage Water Heater 13 486
On-Demand Tankless Water Heater 20 487
Secondary Energy Impacts
There are no secondary energy impacts for this measure.
Non-Energy Impacts
Benefit Type Description Savings
Annual Non-Resource See Appendix D: Non-Resource Impacts See Appendix D: Non-Resource Impacts
One-Time Non-Resource See Appendix D: Non-Resource Impacts See Appendix D: Non-Resource Impacts
483 DOE (2008). ENERGY STAR® Residential Water Heaters: Final Criteria Analysis. Prepared for the DOE; Page 10, energy consumption estimated using the DOE test procedure. Based on the following formula: (41,045 BTU/EF x 365)/1,000,000. 484 DOE (2008). ENERGY STAR® Residential Water Heaters: Final Criteria Analysis. Prepared for the DOE; Page 10. 485 GDS Associates, Inc. (2009). Natural Gas Energy Efficiency Potential in Massachusetts. Prepared for GasNetworks. 486 DOE (2008). ENERGY STAR® Residential Water Heaters: Final Criteria Analysis. Prepared for the DOE; Page 10. 487 Ibid.
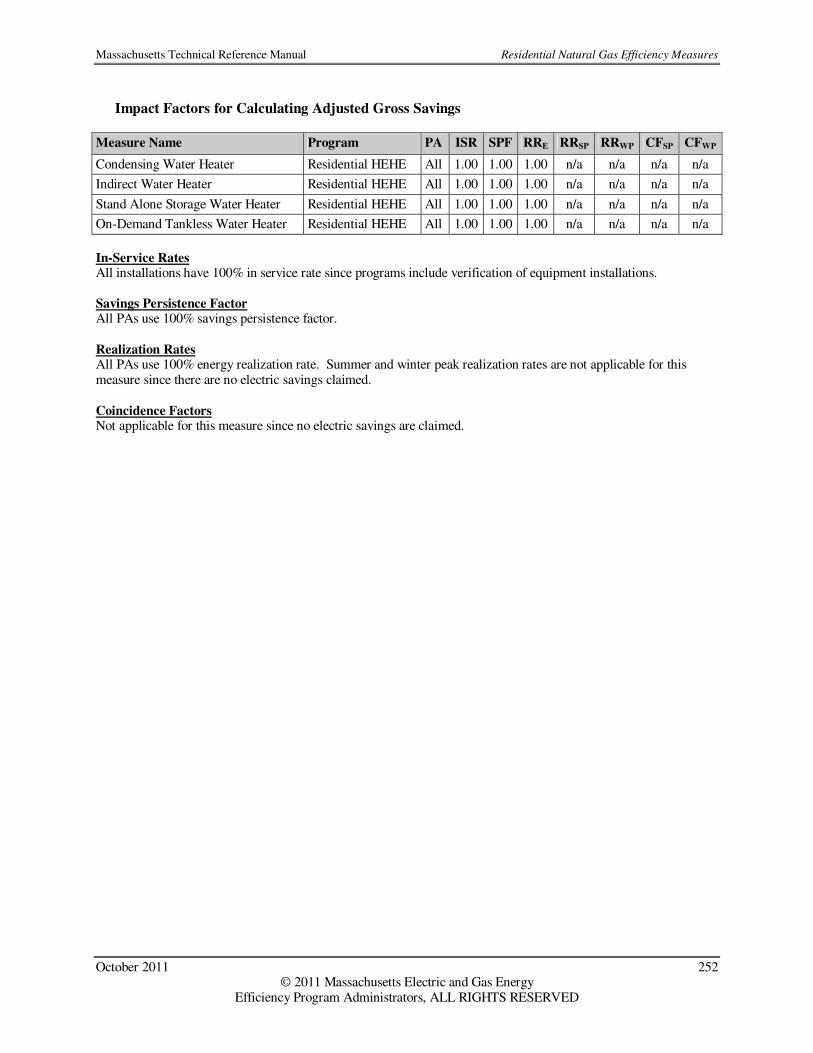
Massachusetts Technical Reference Manual Residential Natural Gas Efficiency Measures
October 2011 252 © 2011 Massachusetts Electric and Gas Energy
Efficiency Program Administrators, ALL RIGHTS RESERVED
Impact Factors for Calculating Adjusted Gross Savings
Measure Name Program PA ISR SPF RRE RRSP RRWP CFSP CFWP
Condensing Water Heater Residential HEHE All 1.00 1.00 1.00 n/a n/a n/a n/a
Indirect Water Heater Residential HEHE All 1.00 1.00 1.00 n/a n/a n/a n/a
Stand Alone Storage Water Heater Residential HEHE All 1.00 1.00 1.00 n/a n/a n/a n/a
On-Demand Tankless Water Heater Residential HEHE All 1.00 1.00 1.00 n/a n/a n/a n/a
In-Service Rates All installations have 100% in service rate since programs include verification of equipment installations. Savings Persistence Factor All PAs use 100% savings persistence factor. Realization Rates All PAs use 100% energy realization rate. Summer and winter peak realization rates are not applicable for this measure since there are no electric savings claimed. Coincidence Factors Not applicable for this measure since no electric savings are claimed.

Massachusetts Technical Reference Manual Residential Natural Gas Efficiency Measures
October 2011 253 © 2011 Massachusetts Electric and Gas Energy
Efficiency Program Administrators, ALL RIGHTS RESERVED
HVAC – Boilers
Version Date and Revision History
Effective Date: 1/1/2011 End Date: TBD
Measure Overview
Description: Installation of a new high efficiency gas-fired boiler for space heating. Primary Energy Impact: Natural Gas (Residential Heat) Secondary Energy Impact: None Non-Energy Impact: Annual Non-Resource, One-Time Non-Resource Sector: Residential Market: Lost Opportunity End Use: HVAC Program: Residential Heating and Water Heating
Algorithms for Calculating Primary Energy Impact
Unit savings are deemed based on study results:
MMBtuMMBtu ∆=∆ Where: Unit = Installation of high efficiency boiler
∆MMBtu = Annual MMBtu savings per unit. See Table 24 for values. Table 24: Savings for Residential Boilers Measure ∆MMBtu
Boiler (AFUE >= 90%) 13.7 488
Boiler (AFUE >= 96%) 21.3 489
Baseline Efficiency
The baseline efficiency case is an 80% AFUE boiler.
High Efficiency
The high efficiency case is a boiler with an AFUE of 90% or greater.
Hours
Not applicable.
488 Nexus Market Research and The Cadmus Group (2010). HEHE Process and Impact Evaluation. Prepared for GasNetworks.. 489 GDS Associates, Inc. (2009). Natural Gas Energy Efficiency Potential in Massachusetts. Prepared for GasNetworks.

Massachusetts Technical Reference Manual Residential Natural Gas Efficiency Measures
October 2011 254 © 2011 Massachusetts Electric and Gas Energy
Efficiency Program Administrators, ALL RIGHTS RESERVED
Measure Life
The measure life is 20 years.490
Secondary Energy Impacts
There are no secondary energy impacts for this measure.
Non-Energy Impacts
Benefit Type Description Savings
Annual Non-Resource See Appendix D: Non-Resource Impacts See Appendix D: Non-Resource Impacts
One-Time Non-Resource See Appendix D: Non-Resource Impacts See Appendix D: Non-Resource Impacts
Impact Factors for Calculating Adjusted Gross Savings
Measure Program PA ISR SPF RRE RRSP RRWP CFSP CFWP
Boiler (AFUE >=85%) Residential HEHE All 1.00 1.00 1.00 n/a n/a n/a n/a
Boiler (AFUE >=90%) Residential HEHE All 1.00 1.00 1.00 n/a n/a n/a n/a
Boiler (AFUE >=95%) Residential HEHE All 1.00 1.00 1.00 n/a n/a n/a n/a
In-Service Rates All installations have 100% in service rate since programs include verification of equipment installations. Savings Persistence Factor All PAs use 100% savings persistence factor. Realization Rates All PAs use 100% energy realization rate. The summer and winter peak realization rates are not applicable for this measure since there are no electric savings claimed. Coincidence Factors Not applicable for this measure since no electric savings are claimed.
490 Environmental Protection Agency (2009). Life Cycle Cost Estimate for ENERGY STAR Qualified Boilers.

Massachusetts Technical Reference Manual Residential Natural Gas Efficiency Measures
October 2011 255 © 2011 Massachusetts Electric and Gas Energy
Efficiency Program Administrators, ALL RIGHTS RESERVED
HVAC – Boiler Reset Controls
Version Date and Revision History
Effective Date: 1/1/2011 End Date: TBD
Measure Overview
Description: Boiler Reset Controls are devices that automatically control boiler water temperature based on outdoor temperature using a software program. Primary Energy Impact: Natural Gas (Residential Heat) Secondary Energy Impact: None Non-Energy Impact: None Sector: Residential Market: Retrofit End Use: HVAC Program: Residential Heating and Water Heating
Algorithms for Calculating Primary Energy Impact
Unit savings are deemed based on study results:
MMBtuMMBtu ∆=∆ Where: Unit = Installed boiler reset control ∆MMBtu = Annual MMBtu savings per unit: 7.9 MMBtu491
Baseline Efficiency
The baseline efficiency case is a boiler without reset controls.
High Efficiency
The high efficiency case is a boiler with reset controls.
Hours
Not applicable.
Measure Life
The measure life is 15 years.492
491 ACEEE (2006). Emerging Technologies Report: Advanced Boiler Controls. Prepared for ACEEE; Page 2. 492 Ibid.
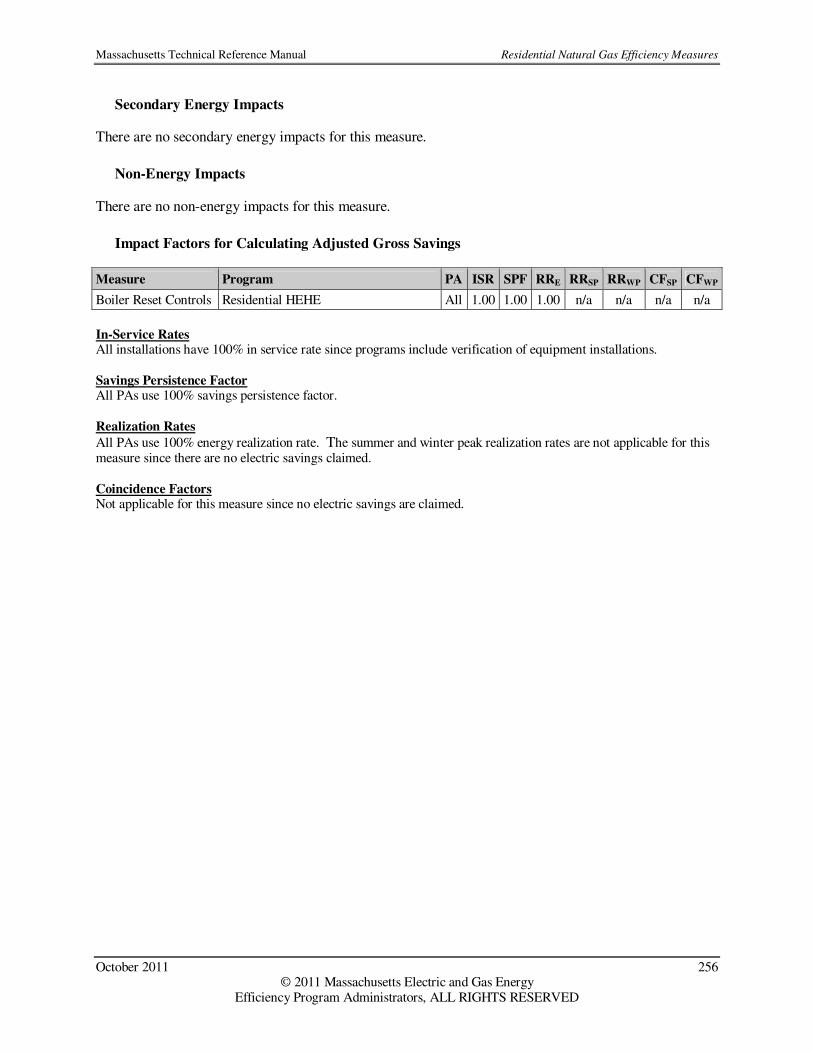
Massachusetts Technical Reference Manual Residential Natural Gas Efficiency Measures
October 2011 256 © 2011 Massachusetts Electric and Gas Energy
Efficiency Program Administrators, ALL RIGHTS RESERVED
Secondary Energy Impacts
There are no secondary energy impacts for this measure.
Non-Energy Impacts
There are no non-energy impacts for this measure.
Impact Factors for Calculating Adjusted Gross Savings
Measure Program PA ISR SPF RRE RRSP RRWP CFSP CFWP
Boiler Reset Controls Residential HEHE All 1.00 1.00 1.00 n/a n/a n/a n/a
In-Service Rates All installations have 100% in service rate since programs include verification of equipment installations. Savings Persistence Factor All PAs use 100% savings persistence factor. Realization Rates
All PAs use 100% energy realization rate. The summer and winter peak realization rates are not applicable for this measure since there are no electric savings claimed.
Coincidence Factors Not applicable for this measure since no electric savings are claimed.

Massachusetts Technical Reference Manual Residential Natural Gas Efficiency Measures
October 2011 257 © 2011 Massachusetts Electric and Gas Energy
Efficiency Program Administrators, ALL RIGHTS RESERVED
HVAC – Combo Water Heater/Boiler
Version Date and Revision History
Effective Date: 1/1/2011 End Date: TBD
Measure Overview
Description: This measure promotes the installation of a combined high-efficiency boiler and water heating unit. Combined boiler and water heating systems are more efficient than separate systems because they eliminate the standby heat losses of an additional tank. Primary Energy Impact: Natural Gas (Residential Heat) Secondary Energy Impact: None
Non-Energy Impact: Annual Non-Resource, One-Time Non-Resource Sector: Residential Market: Lost Opportunity End Use: Residential Heat Program: Residential Heating and Water Heating
Algorithms for Calculating Primary Energy Impact
Unit savings are deemed based on study results:
MMBtuMMBtu ∆=∆ Where: Units = Installation of integrated water heater/boiler unit ∆MMBtu = Annual MMBtu savings per unit: See Table 25.
Table 25: Savings for Residential Combo Water Heater/Boilers Measure ∆MMBtu
Combo Water Heater/Condensing Boiler 21.1493
Baseline Efficiency
The baseline efficiency case is an 80% AFUE boiler with a 0.594 EF water heater.
High Efficiency
The high efficiency case is an integrated water heater/boiler unit with a 90% AFUE condensing boiler and a 0.9 EF water heater.
Hours
Not applicable.
493 GDS Associates, Inc. (2009). Natural Gas Energy Efficiency Potential in Massachusetts. Prepared for GasNetworks.

Massachusetts Technical Reference Manual Residential Natural Gas Efficiency Measures
October 2011 258 © 2011 Massachusetts Electric and Gas Energy
Efficiency Program Administrators, ALL RIGHTS RESERVED
Measure Life
The measure life is 20 years.494
Secondary Energy Impacts
There are no secondary energy impacts for this measure.
Non-Energy Impacts
Benefit Type Description Savings
Annual Non-Resource See Appendix D: Non-Resource Impacts See Appendix D: Non-Resource Impacts
One-Time Non-Resource See Appendix D: Non-Resource Impacts See Appendix D: Non-Resource Impacts
Impact Factors for Calculating Adjusted Gross Savings
Measure Name Program PA ISR SPF RRE RRSP RRWP CFSP CFWP
Combo Water Heater/Condensing Boiler Residential HEHE
All 1.00 1.00 1.00 n/a n/a n/a n/a
Combo Water Heater/Non-Condensing Boiler
Residential HEHE
All 1.00 1.00 1.00 n/a n/a n/a n/a
In-Service Rates All installations have 100% in service rate since programs include verification of equipment installations. Savings Persistence Factor All PAs use 100% savings persistence factor. Realization Rates All PAs use 100% energy realization rate. The summer and winter peak realization rates are not applicable for this measure since there are no electric savings claimed. Coincidence Factors Not applicable for this measure since no electric savings are claimed.
494 Environmental Protection Agency (2009). Life Cycle Cost Estimate for ENERGY STAR Qualified Boilers; measure life assumed to be the same as a boiler.
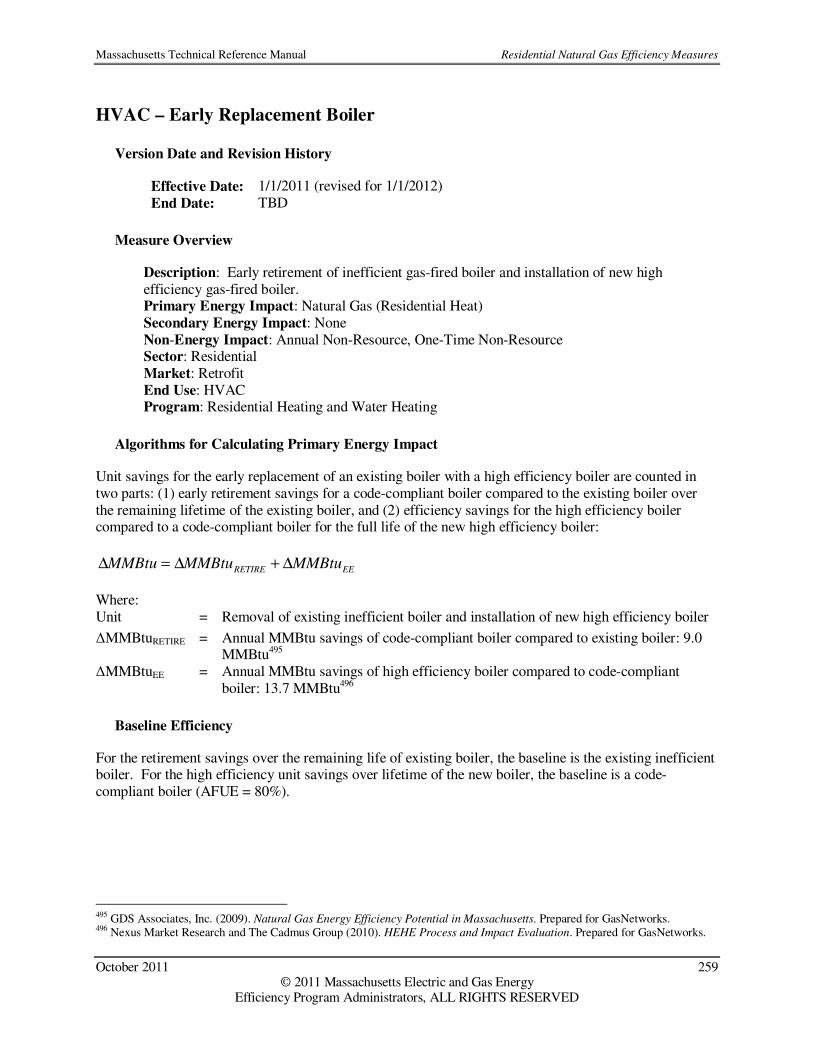
Massachusetts Technical Reference Manual Residential Natural Gas Efficiency Measures
October 2011 259 © 2011 Massachusetts Electric and Gas Energy
Efficiency Program Administrators, ALL RIGHTS RESERVED
HVAC – Early Replacement Boiler
Version Date and Revision History
Effective Date: 1/1/2011 (revised for 1/1/2012) End Date: TBD
Measure Overview
Description: Early retirement of inefficient gas-fired boiler and installation of new high efficiency gas-fired boiler. Primary Energy Impact: Natural Gas (Residential Heat) Secondary Energy Impact: None Non-Energy Impact: Annual Non-Resource, One-Time Non-Resource Sector: Residential Market: Retrofit End Use: HVAC Program: Residential Heating and Water Heating
Algorithms for Calculating Primary Energy Impact
Unit savings for the early replacement of an existing boiler with a high efficiency boiler are counted in two parts: (1) early retirement savings for a code-compliant boiler compared to the existing boiler over the remaining lifetime of the existing boiler, and (2) efficiency savings for the high efficiency boiler compared to a code-compliant boiler for the full life of the new high efficiency boiler:
EERETIRE MMBtuMMBtuMMBtu ∆+∆=∆
Where: Unit = Removal of existing inefficient boiler and installation of new high efficiency boiler
∆MMBtuRETIRE = Annual MMBtu savings of code-compliant boiler compared to existing boiler: 9.0 MMBtu495
∆MMBtuEE = Annual MMBtu savings of high efficiency boiler compared to code-compliant boiler: 13.7 MMBtu496
Baseline Efficiency
For the retirement savings over the remaining life of existing boiler, the baseline is the existing inefficient boiler. For the high efficiency unit savings over lifetime of the new boiler, the baseline is a code-compliant boiler (AFUE = 80%).
495 GDS Associates, Inc. (2009). Natural Gas Energy Efficiency Potential in Massachusetts. Prepared for GasNetworks. 496 Nexus Market Research and The Cadmus Group (2010). HEHE Process and Impact Evaluation. Prepared for GasNetworks.

Massachusetts Technical Reference Manual Residential Natural Gas Efficiency Measures
October 2011 260 © 2011 Massachusetts Electric and Gas Energy
Efficiency Program Administrators, ALL RIGHTS RESERVED
High Efficiency
For the retirement savings over the remaining life of existing boiler, the efficient case is a code-compliant boiler (AFUE = 80%). For the high efficiency savings over lifetime of the new boiler, the efficient case is a new high efficiency (AFUE >= 90%).
Hours
Not applicable.
Measure Life
The remaining life for the existing unit is 14 years497, and the measure life of new equipment is 20 years.498
Secondary Energy Impacts
There are no secondary energy impacts for this measure.
Non-Energy Impacts
Benefit Type Description Savings
Annual Non-Resource See Appendix D: Non-Resource Impacts See Appendix D: Non-Resource Impacts
One-Time Non-Resource See Appendix D: Non-Resource Impacts See Appendix D: Non-Resource Impacts
Impact Factors for Calculating Adjusted Gross Savings
Measure Program PA ISR SPF RRE RRSP RRWP CFSP CFWP
Early Replacement Boiler (Retire) Residential HEHE All 1.00 1.00 1.00 n/a n/a n/a n/a
Early Replacement Boiler (EE) Residential HEHE All 1.00 1.00 1.00 n/a n/a n/a n/a
In-Service Rates All installations have 100% in service rate since programs include verification of equipment installations. Savings Persistence Factor All PAs use 100% savings persistence factor. Realization Rates All PAs use 100% energy realization rate. The summer and winter peak realization rates are not applicable for this measure since there are no electric savings claimed. Coincidence Factors Not applicable for this measure since no electric savings are claimed.
497 Massachusetts Common Assumption: The remaining life of 14 years was determined by subtracting the average age of existing equipment (estimated by program vendor at 26 years) from the full lifetime of standard efficiency boilers (estimated by program vendor at 40 years). 498 Environmental Protection Agency (2009). Life Cycle Cost Estimate for ENERGY STAR Qualified Boilers.

Massachusetts Technical Reference Manual Residential Natural Gas Efficiency Measures
October 2011 261 © 2011 Massachusetts Electric and Gas Energy
Efficiency Program Administrators, ALL RIGHTS RESERVED
HVAC – Furnaces
Version Date and Revision History
Effective Date: 1/1/2011 (revised for 1/1/2012) End Date: TBD
Measure Overview
Description: Installation of a new high efficiency space heating gas-fired furnace with an electronically commutated motor (ECM) for the fan. Primary Energy Impact: Natural Gas (Residential Heat) Secondary Energy Impact: Electric Non-Energy Impact: Annual Non-Resource, One-Time Non-Resource Sector: Residential Market: Lost Opportunity End Use: HVAC Program: Residential Heating and Water Heating
Algorithms for Calculating Primary Energy Impact
Unit savings are deemed based on study results:
MMBtuMMBtu ∆=∆ Where: Units = Installation of furnace with ECM ∆MMBtu = Annual MMBtu savings per unit. See Table 26. Table 26: Savings for Residential Furnaces Equipment Type Efficiency ∆MMBtu
AFUE = 95% 18.0 499 Furnace (Forced Hot Air) w/ECM
AFUE = 96% 20.7 500
Baseline Efficiency
The baseline efficiency case is a 78% AFUE furnace.
High Efficiency
The high efficiency case is a new furnace with AFUE >= 95% with an electronically commutated motor installed.
499 GDS Associates, Inc. (2009). Natural Gas Energy Efficiency Potential in Massachusetts. Prepared for GasNetworks; value adjusted based on results of: Nexus Market Research and The Cadmus Group (2010). HEHE Process and Impact Evaluation. Prepared for GasNetworks.. 500 Ibid.
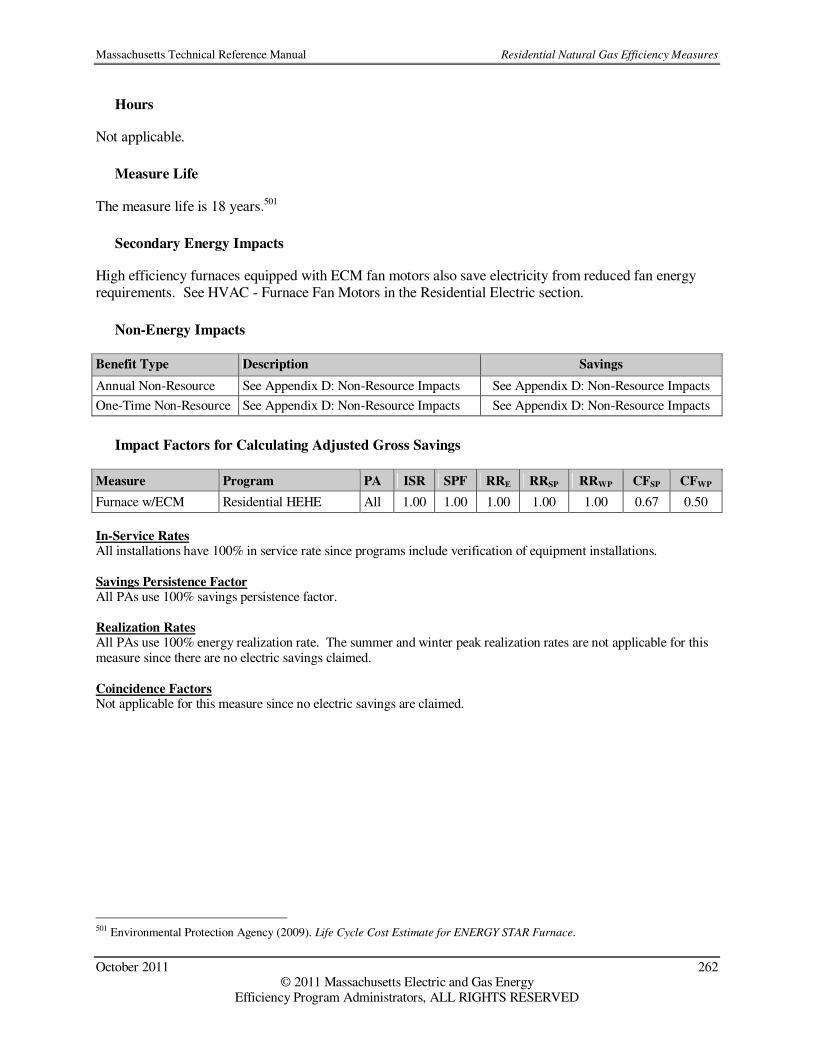
Massachusetts Technical Reference Manual Residential Natural Gas Efficiency Measures
October 2011 262 © 2011 Massachusetts Electric and Gas Energy
Efficiency Program Administrators, ALL RIGHTS RESERVED
Hours
Not applicable.
Measure Life
The measure life is 18 years.501
Secondary Energy Impacts
High efficiency furnaces equipped with ECM fan motors also save electricity from reduced fan energy requirements. See HVAC - Furnace Fan Motors in the Residential Electric section.
Non-Energy Impacts
Benefit Type Description Savings
Annual Non-Resource See Appendix D: Non-Resource Impacts See Appendix D: Non-Resource Impacts
One-Time Non-Resource See Appendix D: Non-Resource Impacts See Appendix D: Non-Resource Impacts
Impact Factors for Calculating Adjusted Gross Savings
Measure Program PA ISR SPF RRE RRSP RRWP CFSP CFWP
Furnace w/ECM Residential HEHE All 1.00 1.00 1.00 1.00 1.00 0.67 0.50
In-Service Rates All installations have 100% in service rate since programs include verification of equipment installations. Savings Persistence Factor All PAs use 100% savings persistence factor. Realization Rates All PAs use 100% energy realization rate. The summer and winter peak realization rates are not applicable for this measure since there are no electric savings claimed. Coincidence Factors Not applicable for this measure since no electric savings are claimed.
501 Environmental Protection Agency (2009). Life Cycle Cost Estimate for ENERGY STAR Furnace.

Massachusetts Technical Reference Manual Residential Natural Gas Efficiency Measures
October 2011 263 © 2011 Massachusetts Electric and Gas Energy
Efficiency Program Administrators, ALL RIGHTS RESERVED
HVAC – Heat Recovery Ventilator
Version Date and Revision History
Effective Date: 1/1/2011 (revised for 2012) End Date: TBD
Measure Overview
Description: Heat Recovery Ventilators (HRV) can help make mechanical ventilation more cost effective by reclaiming energy from exhaust airflows. Primary Energy Impact: Natural Gas (Residential Heat) Secondary Energy Impact: Electric Non-Energy Impact: None
Sector: Residential Market: Lost Opportunity End Use: HVAC Program: Residential Heating and Water Heating
Algorithms for Calculating Primary Energy Impact
Unit savings are deemed based on study results:
MMbtuMMbtu ∆=∆ Where: Units = Number of heat recovery ventilation systems installed
∆MMBtu = Annual MMBtu savings per unit: 7.7 MMBtu 502
Baseline Efficiency
The baseline efficiency case is an ASHRAE 62.2-compliant exhaust fan system with no heat recovery.
High Efficiency
The high efficiency case is an exhaust fan system with heat recovery.
Hours
Not applicable.
Measure Life
The measure life is 20 years.503
502 GDS Associates, Inc. (2009). Natural Gas Energy Efficiency Potential in Massachusetts. Prepared for GasNetworks.
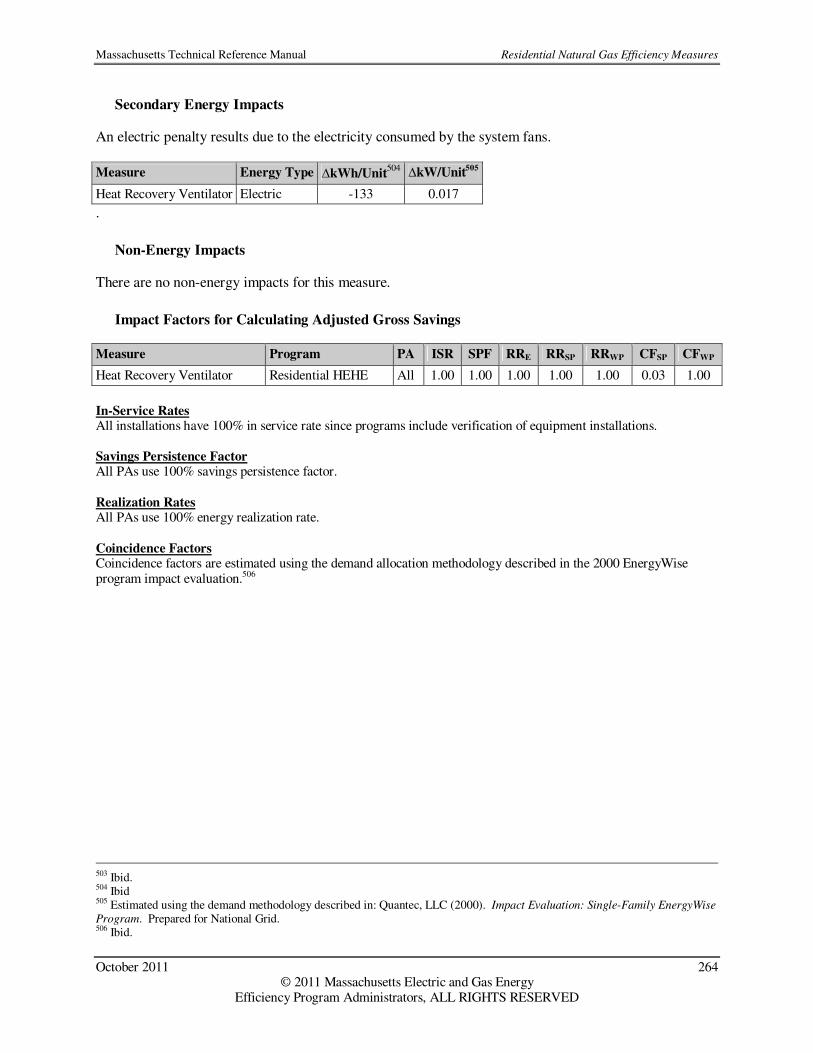
Massachusetts Technical Reference Manual Residential Natural Gas Efficiency Measures
October 2011 264 © 2011 Massachusetts Electric and Gas Energy
Efficiency Program Administrators, ALL RIGHTS RESERVED
Secondary Energy Impacts
An electric penalty results due to the electricity consumed by the system fans.
Measure Energy Type ∆kWh/Unit504
∆kW/Unit505
Heat Recovery Ventilator Electric -133 0.017
.
Non-Energy Impacts
There are no non-energy impacts for this measure.
Impact Factors for Calculating Adjusted Gross Savings
Measure Program PA ISR SPF RRE RRSP RRWP CFSP CFWP
Heat Recovery Ventilator Residential HEHE All 1.00 1.00 1.00 1.00 1.00 0.03 1.00
In-Service Rates All installations have 100% in service rate since programs include verification of equipment installations. Savings Persistence Factor All PAs use 100% savings persistence factor. Realization Rates All PAs use 100% energy realization rate.
Coincidence Factors Coincidence factors are estimated using the demand allocation methodology described in the 2000 EnergyWise program impact evaluation.506
503 Ibid. 504 Ibid 505 Estimated using the demand methodology described in: Quantec, LLC (2000). Impact Evaluation: Single-Family EnergyWise
Program. Prepared for National Grid. 506 Ibid.

Massachusetts Technical Reference Manual Residential Natural Gas Efficiency Measures
October 2011 265 © 2011 Massachusetts Electric and Gas Energy
Efficiency Program Administrators, ALL RIGHTS RESERVED
HVAC – Heating System Replacement
Version Date and Revision History
Effective Date: 1/1/2011 End Date: TBD
Measure Overview
Description: Replacement of an existing gas heating system with a new high efficiency system. Electric savings are achieved from reduced fan run time. Primary Energy Impact: Natural Gas (Residential Heat) Secondary Energy Impact: Electric Non-Energy Impact: Annual Non-Resource, One-Time Non-Resource Sector: Low-Income Market: Retrofit End Use: HVAC Program: Low-Income Single Family Retrofit
Algorithms for Calculating Primary Energy Impact
Unit savings are deemed based on study results:
MMBtuMMBtu ∆=∆ Where: Unit = Installation of new high efficiency gas heating system. ∆MMBtu = Annual MMBtu savings per unit: See Table 27. Table 27: Savings for Heating System Replacement (Gas) PA Savings ∆MMBtu
CMA, Berkshire, NE Gas 358.05 therms per home 507 35.8 National Grid, CLC 122 therms per home 508 12.2 NSTAR 300 therms per home 509 30.0 Unitil 380 therms per home 510 38.0
Baseline Efficiency
The baseline efficiency case is the existing inefficient heating equipment.
High Efficiency
The high efficiency case is the new efficient heating equipment.
507 Oppenheim, Jerrold (2005). MEMO: Heating System Replacements. Prepared for Bay State Gas Company. 508 The Cadmus Group (2009). Impact Evaluation of the 2007 Appliance Management Program and Low Income Weatherization
Program. Prepared for National Grid; Page 5, Table 1. 509 NSTAR Analysis of Heating System Replacements (2005). Prepared by Art Wilcox, LEAN. 510 Savings estimated using SMOC-ERS Software.

Massachusetts Technical Reference Manual Residential Natural Gas Efficiency Measures
October 2011 266 © 2011 Massachusetts Electric and Gas Energy
Efficiency Program Administrators, ALL RIGHTS RESERVED
Hours
Not applicable.
Measure Life
The measure life is 18 years511 for new furnaces and 20 years512 for new boilers.
Secondary Energy Impacts
Unit electric savings are deemed based on study results.
Table 28: Electric Savings for Heating System Replacement (Gas) PA ∆kWh ∆kW
All 0 0 National Grid, CLC 194 513
0.024 514
Non-Energy Impacts
Benefit Type Description Savings
Annual Non-Resource See Appendix D: Non-Resource Impacts See Appendix D: Non-Resource Impacts
One-Time Non-Resource See Appendix D: Non-Resource Impacts See Appendix D: Non-Resource Impacts
Impact Factors for Calculating Adjusted Gross Savings
Measure Name Program PA ISR SPF RRE RRSP RRWP CFSP CFWP
Heating System Replacement (Gas) LI SF Retrofit All 1.00 1.00 1.00 1.00 1.00 0.03 1.00
In-Service Rates All installations have 100% in service rate since programs include verification of equipment installations. Savings Persistence Factor All PAs use 100% savings persistence factor. Realization Rates Realization rates are set to 100% because savings estimates are based on evaluation and analysis results. Coincidence Factors Coincidence factors are only relevant where electric demand savings are claimed. For National Grid, the CFs are
developed based on Quantec demand allocation methodology 515
511 Environmental Protection Agency (2009). Life Cycle Cost Estimate for ENERGY STAR Furnace. 512 Environmental Protection Agency (2009). Life Cycle Cost Estimate for ENERGY STAR Qualified Boilers. 513 The Cadmus Group (2009). Impact Evaluation of the 2007 Appliance Management Program and Low Income Weatherization
Program. Prepared for National Grid; Page 5, Table 1. 514 Estimated using demand allocation methodology described in: Quantec, LLC (2000). Impact Evaluation: Single-Family
EnergyWise Program. Prepared for National Grid. 515 Ibid.

Massachusetts Technical Reference Manual Residential Natural Gas Efficiency Measures
October 2011 267 © 2011 Massachusetts Electric and Gas Energy
Efficiency Program Administrators, ALL RIGHTS RESERVED
HVAC – Thermostats
Version Date and Revision History
Effective Date: 1/1/2011 End Date: TBD
Measure Overview
Description: Installation of a 7-day programmable thermostat, which gives the ability to adjust heating or air-conditioning operating times according to a pre-set schedule. Primary Energy Impact: Natural Gas (Residential Heat) Secondary Energy Impact: None
Non-Energy Impact: Annual Non-Resource, One-Time Non-Resource
Sector: Residential Market: Retrofit End Use: HVAC
Program: Residential Heating and Water Heating, Home Energy Services, Multifamily Retrofit, Low-Income Multifamily Retrofit
Algorithms for Calculating Primary Energy Impact
Unit savings are deemed based on study results:
MMBtuMMBtu ∆=∆ Where: Units = Number of Programmable T-stats installed ∆MMBtu = Annual MMBtu savings per unit: 7.7 MMBtu516
Baseline Efficiency
The baseline efficiency case is an HVAC system using natural gas to provide space heating without a programmable thermostat.
High Efficiency
The high efficiency case is an HVAC system that has a 7-day programmable thermostat installed.
Hours
Not applicable.
516 RLW Analytics (2007). Validating the Impact of Programmable Thermostats. Prepared for GasNetworks; Page 2, conversion factor CCF to Therms is 1.024.

Massachusetts Technical Reference Manual Residential Natural Gas Efficiency Measures
October 2011 268 © 2011 Massachusetts Electric and Gas Energy
Efficiency Program Administrators, ALL RIGHTS RESERVED
Measure Life
The measure life is 15 years.517
Secondary Energy Impacts
There are no secondary energy impacts for this measure.
Non-Energy Impacts
Benefit Type Description Savings
Annual Non-Resource See Appendix D: Non-Resource Impacts See Appendix D: Non-Resource Impacts
One-Time Non-Resource See Appendix D: Non-Resource Impacts See Appendix D: Non-Resource Impacts
Impact Factors for Calculating Adjusted Gross Savings
Measure Program PA ISR SPF RRE RRSP RRWP CFSP CFWP
Programmable Thermostats Residential HEHE All 1.00 1.00 1.00 n/a n/a n/a n/a
Programmable Thermostats HES All 1.00 1.00 1.00 n/a n/a n/a n/a
Programmable Thermostats MF Retrofit All 1.00 1.00 1.00 n/a n/a n/a n/a
Programmable Thermostats LI MF Retrofit All 1.00 1.00 1.00 n/a n/a n/a n/a
In-Service Rates All installations have 100% in service rate since programs include verification of equipment installations. Savings Persistence Factor All PAs use 100% savings persistence factor. Realization Rates
All PAs use 100% energy realization rate. The summer and winter peak realization rates are not applicable for this measure since there are no electric savings claimed. Coincidence Factors Not applicable for this measure since no electric savings are claimed.
517 Environmental Protection Agency (2010). Life Cycle Cost Estimate for ENERGY STAR Programmable Thermostat.

Massachusetts Technical Reference Manual Residential Natural Gas Efficiency Measures
October 2011 269 © 2011 Massachusetts Electric and Gas Energy
Efficiency Program Administrators, ALL RIGHTS RESERVED
HVAC – Wi-Fi Thermostats
Version Date and Revision History
Draft Date: 9/14/2011 Effective Date: 1/1/2012 End Date: TBD
Measure Overview
Description: A communicating thermostat which allows remote set point adjustment and control via remote application. System requires an outdoor air temperature algorithm in the control logic to operate heating and cooling systems
Primary Energy Impact: Natural Gas (Residential Heat) Secondary Energy Impact: Electric
Non-Energy Impact: Annual Non-Resource, One-Time Non-Resource
Sector: Residential Market: Retrofit End Use: HVAC
Program: Residential Heating and Water Heating
Algorithms for Calculating Primary Energy Impact
Unit savings are deemed based on study results:
MMBtuMMBtu ∆=∆ Where: Units = Number of Wi-Fi T-stats installed ∆MMBtu = Annual MMBtu savings per unit: 6.6 MMBtu518
Baseline Efficiency
The baseline efficiency case is an HVAC system using natural gas to provide space heating without a programmable thermostat.
High Efficiency
The high efficiency case is an HVAC system that has an Wi-Fi thermostat installed.
Hours
Not applicable.
518 Cadmus Group (2011). Memo: Wi-fi Programmable Thermostat Billing Analysis. Prepared for Keith Miller and Whitney Domigan, National Grid
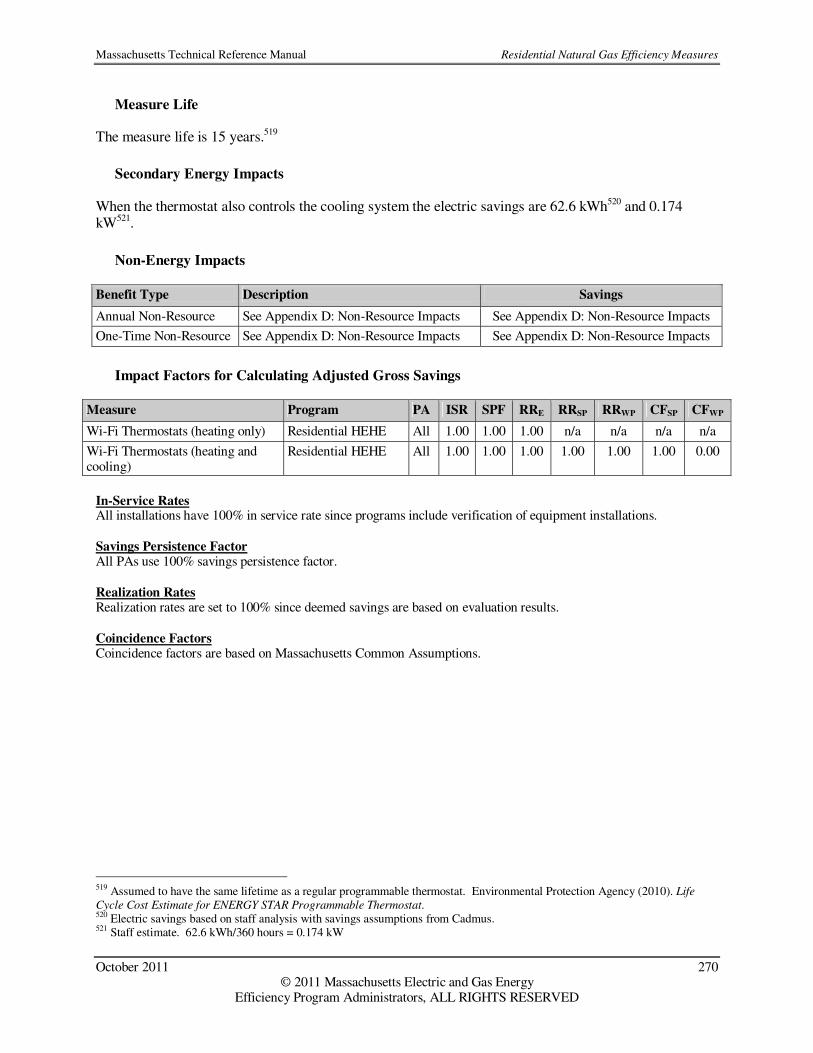
Massachusetts Technical Reference Manual Residential Natural Gas Efficiency Measures
October 2011 270 © 2011 Massachusetts Electric and Gas Energy
Efficiency Program Administrators, ALL RIGHTS RESERVED
Measure Life
The measure life is 15 years.519
Secondary Energy Impacts
When the thermostat also controls the cooling system the electric savings are 62.6 kWh520 and 0.174 kW521.
Non-Energy Impacts
Benefit Type Description Savings
Annual Non-Resource See Appendix D: Non-Resource Impacts See Appendix D: Non-Resource Impacts
One-Time Non-Resource See Appendix D: Non-Resource Impacts See Appendix D: Non-Resource Impacts
Impact Factors for Calculating Adjusted Gross Savings
Measure Program PA ISR SPF RRE RRSP RRWP CFSP CFWP
Wi-Fi Thermostats (heating only) Residential HEHE All 1.00 1.00 1.00 n/a n/a n/a n/a
Wi-Fi Thermostats (heating and cooling)
Residential HEHE All 1.00 1.00 1.00 1.00 1.00 1.00 0.00
In-Service Rates All installations have 100% in service rate since programs include verification of equipment installations. Savings Persistence Factor All PAs use 100% savings persistence factor. Realization Rates Realization rates are set to 100% since deemed savings are based on evaluation results.
Coincidence Factors Coincidence factors are based on Massachusetts Common Assumptions.
519 Assumed to have the same lifetime as a regular programmable thermostat. Environmental Protection Agency (2010). Life
Cycle Cost Estimate for ENERGY STAR Programmable Thermostat. 520 Electric savings based on staff analysis with savings assumptions from Cadmus. 521 Staff estimate. 62.6 kWh/360 hours = 0.174 kW
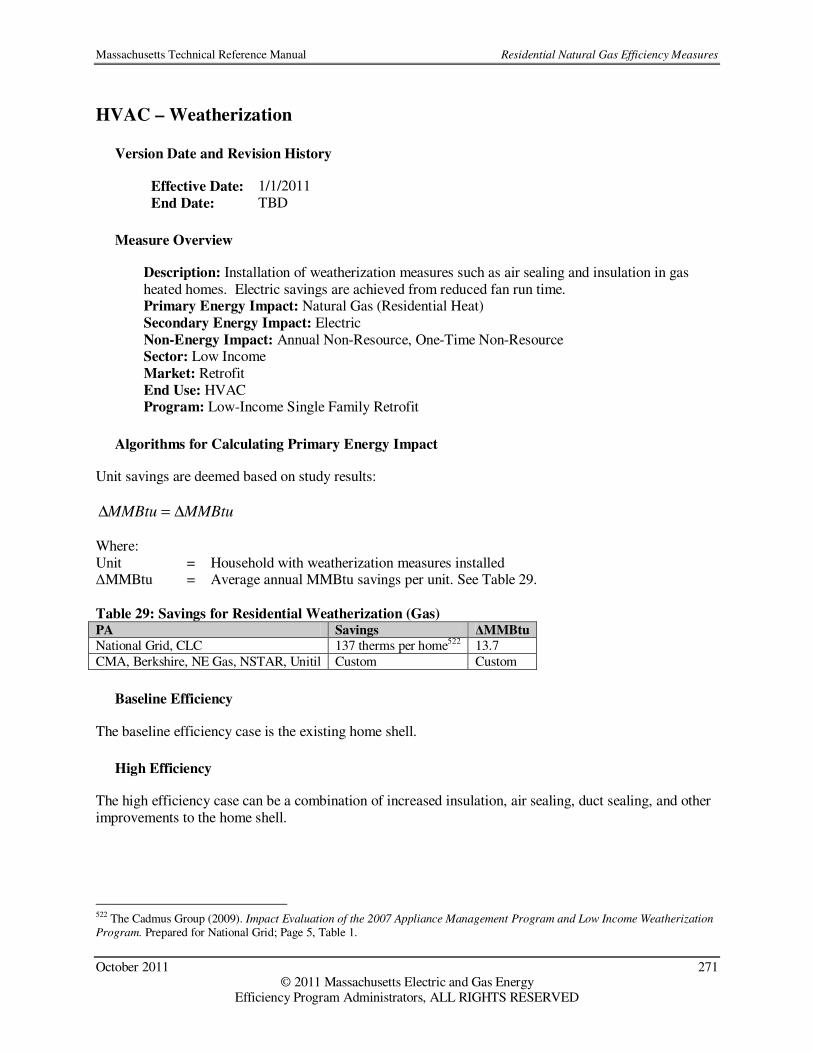
Massachusetts Technical Reference Manual Residential Natural Gas Efficiency Measures
October 2011 271 © 2011 Massachusetts Electric and Gas Energy
Efficiency Program Administrators, ALL RIGHTS RESERVED
HVAC – Weatherization
Version Date and Revision History
Effective Date: 1/1/2011 End Date: TBD
Measure Overview
Description: Installation of weatherization measures such as air sealing and insulation in gas heated homes. Electric savings are achieved from reduced fan run time. Primary Energy Impact: Natural Gas (Residential Heat) Secondary Energy Impact: Electric Non-Energy Impact: Annual Non-Resource, One-Time Non-Resource Sector: Low Income Market: Retrofit End Use: HVAC Program: Low-Income Single Family Retrofit
Algorithms for Calculating Primary Energy Impact
Unit savings are deemed based on study results:
MMBtuMMBtu ∆=∆ Where: Unit = Household with weatherization measures installed ∆MMBtu = Average annual MMBtu savings per unit. See Table 29. Table 29: Savings for Residential Weatherization (Gas) PA Savings ∆MMBtu
National Grid, CLC 137 therms per home522 13.7 CMA, Berkshire, NE Gas, NSTAR, Unitil Custom Custom
Baseline Efficiency
The baseline efficiency case is the existing home shell.
High Efficiency
The high efficiency case can be a combination of increased insulation, air sealing, duct sealing, and other improvements to the home shell.
522 The Cadmus Group (2009). Impact Evaluation of the 2007 Appliance Management Program and Low Income Weatherization
Program. Prepared for National Grid; Page 5, Table 1.

Massachusetts Technical Reference Manual Residential Natural Gas Efficiency Measures
October 2011 272 © 2011 Massachusetts Electric and Gas Energy
Efficiency Program Administrators, ALL RIGHTS RESERVED
Hours
Not applicable.
Measure Life
The measure lives for weatherization projects may differ depending on the measures implemented. The final measure life of each application is weighted based on the mix of weatherization measures installed. The measure life for each type of weatherization measure is based on statewide measure lives for residential energy efficiency measures523. If installation details are not tracked, the measure life is assumed to be 20 years524.
Secondary Energy Impact
Unit savings are deemed based on study results. Table 30: Electric Savings for Weatherization (Gas) PA ∆kWh ∆kW
All 0 0 National Grid, CLC 70 525 0.01 526
Non-Energy Benefits
Benefit Type Description Savings
Annual Non-Resource See Appendix D: Non-Resource Impacts See Appendix D: Non-Resource Impacts
One-Time Non-Resource See Appendix D: Non-Resource Impacts See Appendix D: Non-Resource Impacts
Impact Factors for Calculating Adjusted Gross Savings
Measure Name Program PA ISR SPF RRE RRSP RRWP CFSP CFWP
Weatherization (Gas) LI SF Retrofit All 1.00 1.00 1.00 1.00 1.00 0.03 1.00
In-Service Rates All installations have 100% in service rate since programs include verification of equipment installations. Savings Persistence Factor All PAs use 100% savings persistence factor. Realization Rates Realization rates are set to 100% because savings estimates are based on evaluation and analysis results.
523 GDS Associates, Inc. (2007). Measure Life Report: Residential and Commercial/Industrial Lighting and HVAC Measures. Prepared for The New England State Program Working Group. 524 Ibid. 525 The Cadmus Group (2009). Impact Evaluation of the 2007 Appliance Management Program and Low Income Weatherization
Program. Prepared for National Grid; Page 5, Table 1. 526 Estimated using demand allocation methodology described in: Quantec, LLC (2000). Impact Evaluation: Single-Family
EnergyWise Program. Prepared for National Grid.
Massachusetts Technical Reference Manual Residential Natural Gas Efficiency Measures
October 2011 273 © 2011 Massachusetts Electric and Gas Energy
Efficiency Program Administrators, ALL RIGHTS RESERVED
Coincidence Factors Coincidence factors are only relevant where electric demand savings are claimed. For National Grid, the CFs are
developed based on Quantec demand allocation methodology 527
527 Ibid.

Massachusetts Technical Reference Manual Residential Natural Gas Efficiency Measures
October 2011 274 © 2011 Massachusetts Electric and Gas Energy
Efficiency Program Administrators, ALL RIGHTS RESERVED
Multifamily – Vendor Measures
Version Date and Revision History
Effective Date: 1/1/2011 End Date: TBD
Measure Overview
Description: Retrofit measures installed in multi-family facilities including: building envelope insulation, air sealing, and DHW measures. Primary Energy Impact: Natural Gas (Residential Heat), Natural Gas (Residential DHW) Secondary Energy Impact: None Non-Energy Impact: Annual Non-Resource, One-Time Non-Resource Sector: Residential Market: Retrofit End Use: HVAC Program: Multifamily Retrofit, Low-Income Multifamily Retrofit
Notes
The PAs, except National Grid, currently use vendor-calculated savings for their Multifamily gas programs. The vendor methodology and other measure characterization for these programs are described in this section. The savings methodology used for National Grid’s program is described in the Multifamily measure characterizations following this section.
Algorithms for Calculating Primary Energy Impact
The Program Administrators use vendor calculated savings for measures in the Multifamily gas programs. The vendors who perform the measure implementations calculate estimated savings for each project based on project-specific detail.
Baseline Efficiency
The baseline efficiency case is the existing conditions of the participating facility.
High Efficiency
The high efficiency case includes installed energy efficiency measures that reduce heating energy use.
Hours
Hours are project-specific.
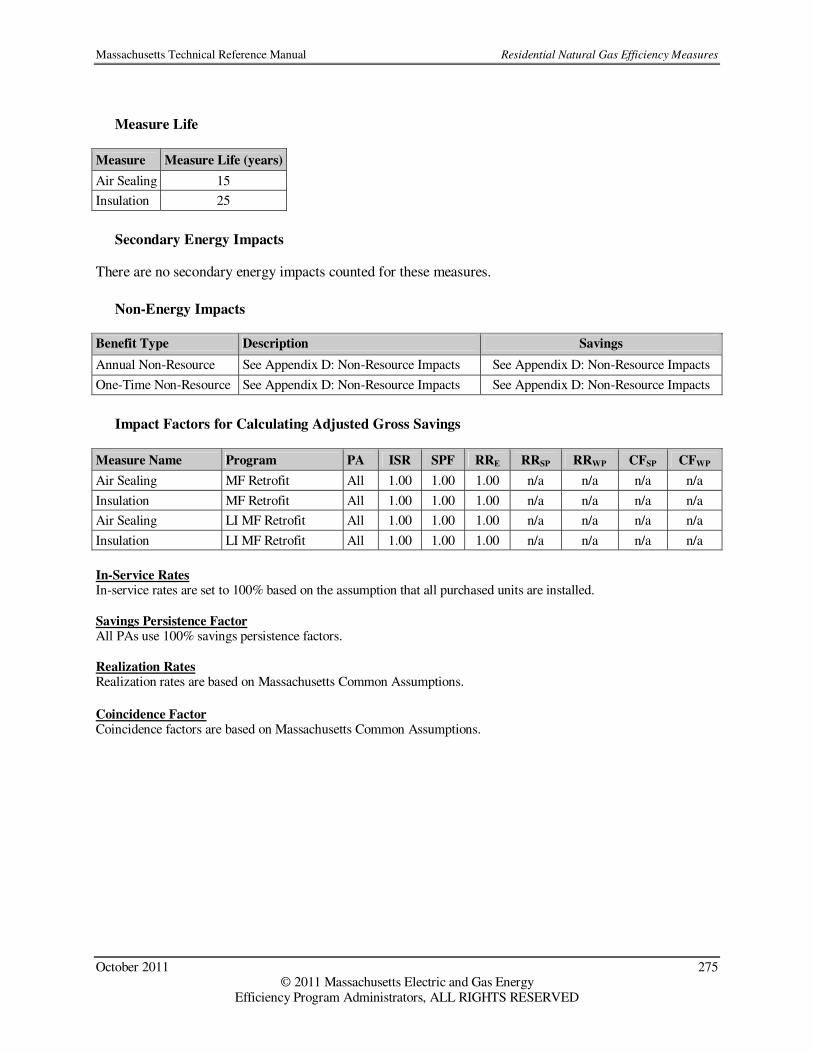
Massachusetts Technical Reference Manual Residential Natural Gas Efficiency Measures
October 2011 275 © 2011 Massachusetts Electric and Gas Energy
Efficiency Program Administrators, ALL RIGHTS RESERVED
Measure Life
Measure Measure Life (years)
Air Sealing 15
Insulation 25
Secondary Energy Impacts
There are no secondary energy impacts counted for these measures.
Non-Energy Impacts
Benefit Type Description Savings
Annual Non-Resource See Appendix D: Non-Resource Impacts See Appendix D: Non-Resource Impacts
One-Time Non-Resource See Appendix D: Non-Resource Impacts See Appendix D: Non-Resource Impacts
Impact Factors for Calculating Adjusted Gross Savings
Measure Name Program PA ISR SPF RRE RRSP RRWP CFSP CFWP
Air Sealing MF Retrofit All 1.00 1.00 1.00 n/a n/a n/a n/a
Insulation MF Retrofit All 1.00 1.00 1.00 n/a n/a n/a n/a
Air Sealing LI MF Retrofit All 1.00 1.00 1.00 n/a n/a n/a n/a
Insulation LI MF Retrofit All 1.00 1.00 1.00 n/a n/a n/a n/a
In-Service Rates In-service rates are set to 100% based on the assumption that all purchased units are installed. Savings Persistence Factor All PAs use 100% savings persistence factors. Realization Rates Realization rates are based on Massachusetts Common Assumptions.
Coincidence Factor Coincidence factors are based on Massachusetts Common Assumptions.

Massachusetts Technical Reference Manual Residential Natural Gas Efficiency Measures
October 2011 276 © 2011 Massachusetts Electric and Gas Energy
Efficiency Program Administrators, ALL RIGHTS RESERVED
Multifamily – Air Sealing
Version Date and Revision History
Draft Date: 06/30/2011 Effective Date: 1/1/2012 End Date: TBD
Measure Overview
Description: Thermal shell air leaks are sealed through strategic use and location of air-tight materials. Primary Energy Impact: Natural Gas (Residential Heat) Secondary Energy Impact: None Non-Energy Impact: Annual Non-Resource, One-Time Non-Resource Sector: Residential, Low-Income Market: Retrofit End Use: HVAC Program: National Grid only: Multifamily Retrofit, Low-Income Multifamily Retrofit
Algorithms for Calculating Primary Energy Impact
( )000,000,1
1018.024 ×××××−×=∆
fSeasonalEf
FactorCorrectionHDDACHACHBldgVolumeMMBtu POSTPRE
Where: CFM50PRE = CFM50 measurement before air sealing (ft3/min) CFM50POST = CFM50 measurement after air sealing (ft3/min) LBL = LBL Factor528 BldgVolume = Total volume of the project building (ft3) ACHPRE = Air changes per hour measured before air sealing (1/hr) ACHPOST = Air changes per hour measured after air sealing (1/hr) 0.018 = Heat capacity of 1 cubic foot of air at 70 °F (Btu/ft3-°F) HDD = Heating degree days (°F-day) 24 = Hours per day (hr/day) 60 = Minutes per hour (min/hr) CorrectionFactor = Correction factor determined by auditor (e.g. for seasonal homes): Default = 1. SeasonalEff = Heating system efficiency factor determined by auditor: Default = 0.7 for homes
heated with natural gas. 1/1,000,000 = Conversion from Btu to MMBtu
528 The LBL Factor is determined as the product of the N-factor and a Height Correction Factor according to BPI Protocol. The N-factor is assumed to be 18.5 for all installations in New England; the Height Correction Factor is determined based on the number of stories in the facility.

Massachusetts Technical Reference Manual Residential Natural Gas Efficiency Measures
October 2011 277 © 2011 Massachusetts Electric and Gas Energy
Efficiency Program Administrators, ALL RIGHTS RESERVED
Baseline Efficiency
The baseline efficiency case is the existing building before the air sealing measure is implemented. The baseline building is characterized by the existing CFM50 measurement (CFM50PRE) for single family homes, or the existing air changes per hour (ACHPRE) for multi-family facilities, which is measured prior to the implementation of the air sealing measure.
High Efficiency
The baseline efficiency case is the existing building after the air sealing measure is implemented. The high efficiency building is characterized by the new CFM50 measurement for single family homes (CFM50POST), or the new air changes per hour (ACHPOST) for multi-family facilities, which is measured after the air sealing measure is implemented.
Hours
Heating hours are characterized by the heating degree days for the facility. The heating degree days are looked up based on the nearest weather station to the customer, as selected by the program vendor.
Measure Life
The measure life is 15 years.529
Secondary Energy Impacts
There are no secondary energy impacts for this measure.
Non-Energy Impacts
Benefit Type Description Savings
Annual Non-Resource See Appendix D: Non-Resource Impacts See Appendix D: Non-Resource Impacts
One-Time Non-Resource See Appendix D: Non-Resource Impacts See Appendix D: Non-Resource Impacts
Impact Factors for Calculating Adjusted Gross Savings
Measure Name Program PA ISR SPF RRE RRSP RRWP CFSP CFWP
MF SPACE Air Sealing MF Retrofit National Grid 1.00 1.00 1.00 n/a n/a n/a n/a
MF SPACE Air Sealing LI MF Retrofit National Grid 1.00 1.00 1.00 n/a n/a n/a n/a
In-Service Rates All installations have 100% in service rate since all PA programs include verification of equipment installations. Savings Persistence Factor All PAs use 100% savings persistence factor.
529 GDS Associates, Inc. (2007). Measure Life Report: Residential and Commercial/Industrial Lighting and HVAC Measures. Prepared for The New England State Program Working Group.

Massachusetts Technical Reference Manual Residential Natural Gas Efficiency Measures
October 2011 278 © 2011 Massachusetts Electric and Gas Energy
Efficiency Program Administrators, ALL RIGHTS RESERVED
Realization Rates The energy realization rates are 100% based on no evaluations. Coincidence Factors There are no electric savings for this measure.

Massachusetts Technical Reference Manual Residential Natural Gas Efficiency Measures
October 2011 279 © 2011 Massachusetts Electric and Gas Energy
Efficiency Program Administrators, ALL RIGHTS RESERVED
Multifamily – DHW System
Version Date and Revision History
Draft Date: 06/30/2011 Effective Date: 1/1/2012 End Date: TBD
Measure Overview
Description: Installation of high efficiency water heating equipment to replace the existing inefficient water heater. Primary Energy Impact: Natural Gas (Residential DHW) Secondary Energy Impact: None Non-Energy Impact: Annual Non-Resource, One-Time Non-Resource Sector: Low Income Market: Retrofit End Use: DHW Program: National Grid only: Low-Income Multifamily Retrofit
Algorithms for Calculating Primary Energy Impact
−××=∆
EEBASE EFEFUnit
MMBtuUnitsMMBtu
1118
Where: Unit = Total number of apartment units utilizing the water heater 18 MMBtu/Unit = Average annual water heating energy demand per apartment unit530 EFBASE = Energy Factor for the baseline water heater EFEE = Energy Factor for the new efficient water heater
Baseline Efficiency
The baseline water heating equipment is assumed to have an Energy Factor = 0.575.
High Efficiency
The high efficiency case includes the new efficient water heater with an Energy Factor > 0.575.
Hours
Not applicable.
530 GDS Associates, Inc. (2009). Natural Gas Energy Efficiency Potential in Massachusetts. Prepared for GasNetworks.

Massachusetts Technical Reference Manual Residential Natural Gas Efficiency Measures
October 2011 280 © 2011 Massachusetts Electric and Gas Energy
Efficiency Program Administrators, ALL RIGHTS RESERVED
Measure Life
Measure Measure Life (years)
Indirect Water Heater 20 531
Stand-Alone Storage Water Heater 13 532
On-Demand Tankless Water Heater 20 533
Secondary Energy Impacts
There are no secondary energy impacts for this measure.
Non-Energy Impacts
Benefit Type Description Savings
Annual Non-Resource See Appendix D: Non-Resource Impacts See Appendix D: Non-Resource Impacts
One-Time Non-Resource See Appendix D: Non-Resource Impacts See Appendix D: Non-Resource Impacts
Impact Factors for Calculating Adjusted Gross Savings
Measure Name Program PA ISR SPF RRE RRSP RRWP CFSP CFWP
MF DHW System LI MF Retrofit National Grid 1.00 1.00 1.00 n/a n/a n/a n/a
In-Service Rates All installations have 100% in service rate since all PA programs include verification of equipment installations. Savings Persistence Factor All PAs use 100% savings persistence factor. Realization Rates The energy realization rate is 100% based on no evaluations. Coincidence Factors There are no electric savings for this measure.
531 GDS Associates, Inc. (2009). Natural Gas Energy Efficiency Potential in Massachusetts. Prepared for GasNetworks. 532 DOE (2008). ENERGY STAR® Residential Water Heaters: Final Criteria Analysis. Prepared for the DOE; Page 10. 533 Ibid.
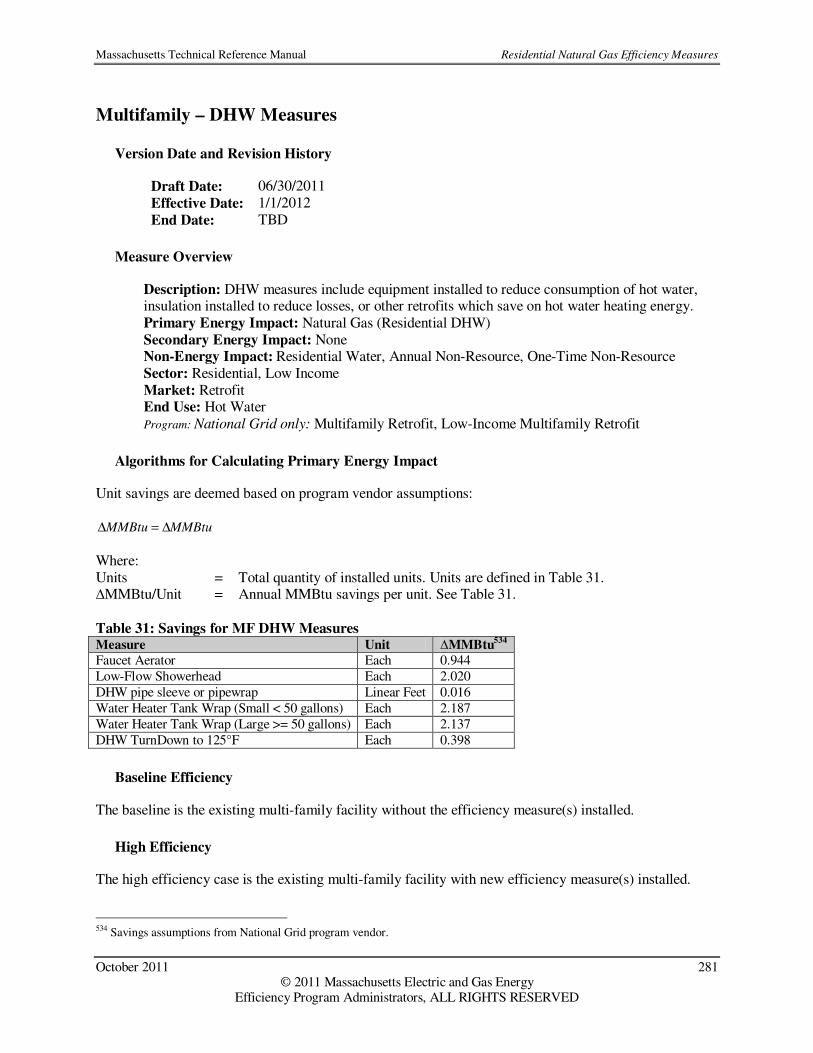
Massachusetts Technical Reference Manual Residential Natural Gas Efficiency Measures
October 2011 281 © 2011 Massachusetts Electric and Gas Energy
Efficiency Program Administrators, ALL RIGHTS RESERVED
Multifamily – DHW Measures
Version Date and Revision History
Draft Date: 06/30/2011 Effective Date: 1/1/2012 End Date: TBD
Measure Overview
Description: DHW measures include equipment installed to reduce consumption of hot water, insulation installed to reduce losses, or other retrofits which save on hot water heating energy. Primary Energy Impact: Natural Gas (Residential DHW) Secondary Energy Impact: None Non-Energy Impact: Residential Water, Annual Non-Resource, One-Time Non-Resource Sector: Residential, Low Income Market: Retrofit End Use: Hot Water Program: National Grid only: Multifamily Retrofit, Low-Income Multifamily Retrofit
Algorithms for Calculating Primary Energy Impact
Unit savings are deemed based on program vendor assumptions:
MMBtuMMBtu ∆=∆
Where: Units = Total quantity of installed units. Units are defined in Table 31. ∆MMBtu/Unit = Annual MMBtu savings per unit. See Table 31. Table 31: Savings for MF DHW Measures Measure Unit ∆MMBtu
534
Faucet Aerator Each 0.944 Low-Flow Showerhead Each 2.020 DHW pipe sleeve or pipewrap Linear Feet 0.016 Water Heater Tank Wrap (Small < 50 gallons) Each 2.187 Water Heater Tank Wrap (Large >= 50 gallons) Each 2.137 DHW TurnDown to 125°F Each 0.398
Baseline Efficiency
The baseline is the existing multi-family facility without the efficiency measure(s) installed.
High Efficiency
The high efficiency case is the existing multi-family facility with new efficiency measure(s) installed.
534 Savings assumptions from National Grid program vendor.

Massachusetts Technical Reference Manual Residential Natural Gas Efficiency Measures
October 2011 282 © 2011 Massachusetts Electric and Gas Energy
Efficiency Program Administrators, ALL RIGHTS RESERVED
Hours
Not applicable.
Measure Life
The measure life for all DHW measures is 7 years.535
Secondary Energy Impacts
There are no secondary energy impacts for this measure.
Non-Energy Impacts
Benefit Type Description Savings
Annual Resource Residential water savings for low-flow showerheads 536
3,696 gallons/unit
Annual Resource Residential water savings for faucet aerators 537 332 gallons/unit
Annual Non-Resource See Appendix D: Non-Resource Impacts See Appendix D: Non-Resource Impacts
One-Time Non-Resource
See Appendix D: Non-Resource Impacts See Appendix D: Non-Resource Impacts
Impact Factors for Calculating Adjusted Gross Savings
Measure Name Program PA ISR SPF RRE RRSP RRWP CFSP CFWP
MF DHW Measures MF Retrofit National Grid 1.00 1.00 1.00 n/a n/a n/a n/a
MF DHW Measures LI MF Retrofit National Grid 1.00 1.00 1.00 n/a n/a n/a n/a
In-Service Rates All installations have 100% in service rate since all PA programs include verification of equipment installations. Savings Persistence Factor All PAs use 100% savings persistence factor. Realization Rates The energy realization rates are 100% based on no evaluations. Coincidence Factors There are no electric savings for this measure.
535 Massachusetts Common Assumption. 536 NMR Group and Tetra Tech (2011). Residential and Low-Income Non-Energy Impacts (NEI) Evaluation Prepared for MA Program Administrators 537 Ibid

Massachusetts Technical Reference Manual Residential Natural Gas Efficiency Measures
October 2011 283 © 2011 Massachusetts Electric and Gas Energy
Efficiency Program Administrators, ALL RIGHTS RESERVED
Multifamily – Duct Systems
Version Date and Revision History
Draft Date: 06/30/2011 Effective Date: 1/1/2012 End Date: TBD
Measure Overview
Description: Ducts are sealed by reconnecting disconnected duct joints and sealing gaps or seams with mastic and fiber-mesh tape as appropriate Primary Energy Impact: Natural Gas (Residential Heat) Secondary Energy Impact: None Non-Energy Impact: Annual Non-Resource Sector: Residential, Low Income Market: Retrofit End Use: HVAC Program: National Grid only: Multifamily Retrofit, Low-Income Multifamily Retrofit
Algorithms for Calculating Primary Energy Impact
000,000,1
1% ××=∆ SAVEtioningConsumpAnnualHeatMMBtu
Where: AnnualHeatingConsumption = The total annual heating consumption for the facility (Btu) %SAVE = Average reduction in energy consumption. See Table 32. 1/1,000,000 = Conversion from Btu to MMBtu Table 32: Savings Factors for MF Duct Systems Measure Type %SAVE538 Surface Area < 50 SQFT 7% Surface Area > 50 SQFT and < 200 SQFT 3% Surface Area > 200 SQFT 1%
Baseline Efficiency
The baseline efficiency case is the existing facility or equipment prior to the implementation of duct sealing.
High Efficiency
The baseline efficiency case is the existing facility or equipment after the implementation of duct sealing.
538 Savings assumptions from National Grid program vendor.

Massachusetts Technical Reference Manual Residential Natural Gas Efficiency Measures
October 2011 284 © 2011 Massachusetts Electric and Gas Energy
Efficiency Program Administrators, ALL RIGHTS RESERVED
Hours
Not applicable.
Measure Life
The measure life is 20 years.539
Secondary Energy Impacts
There are no secondary energy impacts for this measure.
Non-Energy Impacts
Benefit Type Description Savings
Annual Non-Resource See Appendix D: Non-Resource Impacts See Appendix D: Non-Resource Impacts
One-Time Non-Resource See Appendix D: Non-Resource Impacts See Appendix D: Non-Resource Impacts
Impact Factors for Calculating Adjusted Gross Savings
Measure Name Program ISR SPF RRE RRSP RRWP CFSP CFWP
MF SPACE Duct Sealing MF Retrofit 1.00 1.00 1.00 n/a n/a n/a n/a
MF SPACE Duct Sealing LI MF Retrofit 1.00 1.00 1.00 n/a n/a n/a n/a
In-Service Rates All installations have 100% in service rate since all PA programs include verification of equipment installations. Savings Persistence Factor All PAs use 100% savings persistence factor. Realization Rates The energy realization rate is 100% based on no evaluations.
Coincidence Factors There are no electric savings for this measure.
539 GDS Associates, Inc. (2007). Measure Life Report: Residential and Commercial/Industrial Lighting and HVAC Measures. Prepared for The New England State Program Working Group.

Massachusetts Technical Reference Manual Residential Natural Gas Efficiency Measures
October 2011 285 © 2011 Massachusetts Electric and Gas Energy
Efficiency Program Administrators, ALL RIGHTS RESERVED
Multifamily – Heating System
Version Date and Revision History
Draft Date: 06/30/2011 Effective Date: 1/1/2012 End Date: TBD
Measure Overview
Description: Installation of high efficiency heating equipment to replace the existing inefficient gas-fired furnace, hydronic boiler, steam boiler or condensing boiler. Primary Energy Impact: Natural Gas (Residential Heat) Secondary Energy Impact: None Non-Energy Impact: Annual Non-Resource, One-Time Non-Resource Sector: Low Income Market: Retrofit End Use: HVAC Program: National Grid only: Multifamily Retrofit, Low-Income Multifamily Retrofit
Algorithms for Calculating Primary Energy Impact
000,000,1
111××
−×=∆ Heat
EEBASE
EFLHAFUEAFUEhr
BtuMMBtu
Where: Btu/hr = Nominal heating capacity of the installed equipment (Btu/hr) AFUEBASE = Average fuel utilization efficiency of the existing equipment (%) AFUEEE = Average fuel utilization efficiency of the efficient equipment (%) EFLHHeat = Equivalent full load heating hours for the facility (Hr) 1/1,000,000 = Conversion from Btu to MMBtu
Baseline Efficiency
The baseline efficiency is determined based on the type of heating equipment installed and the table of baseline efficiencies (AFUEBASE) below. Table 33: Baseline Efficiencies for MF Heat System Equipment
Equipment Type AFUEBASE 540
Boiler 75% Furnace 78%
High Efficiency
The high efficiency case is characterized by the rated efficiency (AFUEEE) of the new high efficiency furnace or boiler.
540 Federal Register / Vol. 73, No. 145 / Monday, July 28, 2008 / Rules and Regulations Pg. 43613

Massachusetts Technical Reference Manual Residential Natural Gas Efficiency Measures
October 2011 286 © 2011 Massachusetts Electric and Gas Energy
Efficiency Program Administrators, ALL RIGHTS RESERVED
Hours
The equivalent full load hours are assumed to be 1,418 for all multi-family residential facilities in Massachusetts (see Appendix A Table 21 in 2011 Plan TRM).
Measure Life
Equipment Type Lifetime (years)
Boiler 20 541 Furnace 18 542
Secondary Energy Impacts
There are no secondary energy impacts for this measure.
Non-Energy Impacts
Benefit Type Description Savings
Annual Non-Resource See Appendix D: Non-Resource Impacts See Appendix D: Non-Resource Impacts
One-Time Non-Resource See Appendix D: Non-Resource Impacts See Appendix D: Non-Resource Impacts
Impact Factors for Calculating Adjusted Gross Savings
Measure Name Program PA ISR SPF RRE RRSP RRWP CFSP CFWP
MF Heat System LI MF Retrofit National Grid 1.00 1.00 1.00 n/a n/a n/a n/a
In-Service Rates All installations have 100% in service rate since all PA programs include verification of equipment installations. Savings Persistence Factor All PAs use 100% savings persistence factor. Realization Rates The energy realization rate is 100% based on no evaluations. Coincidence Factors There are no electric savings for this measure.
541 Environmental Protection Agency (2009). Life Cycle Cost Estimate for ENERGY STAR Qualified Boilers. 542 Environmental Protection Agency (2009). Life Cycle Cost Estimate for ENERGY STAR Furnace.

Massachusetts Technical Reference Manual Residential Natural Gas Efficiency Measures
October 2011 287 © 2011 Massachusetts Electric and Gas Energy
Efficiency Program Administrators, ALL RIGHTS RESERVED
Multifamily – Other Insulation
Version Date and Revision History
Draft Date: 06/30/2011 Effective Date: 1/1/2012 End Date: TBD
Measure Overview
Description: Insulation upgrades applied in existing facilities. Primary Energy Impact: Natural Gas (Residential Heat) Secondary Energy Impact: None Non-Energy Impact: Annual Non-Resource Sector: Residential, Low-Income Market: Retrofit End Use: HVAC Program: National Grid only: Multifamily Retrofit, Low-Income Multifamily Retrofit
Algorithms for Calculating Primary Energy Impact
Unit savings are deemed based on program vendor assumptions:
MMBtuMMBtu ∆=∆
Where: Units = Total quantity of installed units. ∆MMBtu/Unit = Deemed savings per unit installed. Table 34: Savings for MF Other Insulation Measure Unit ∆MMBtu
543
Existing hatches: weatherstrip, insulate, dam perimeter Each 1.382 Attic staircase cover (Therma-dome) Each 2.763
Baseline Efficiency
The baseline efficiency case is the existing facility or equipment prior to the implementation of additional insulation.
High Efficiency
The baseline efficiency case is the existing facility or equipment after the implementation of additional insulation.
543 Savings assumptions from National Grid program vendor.

Massachusetts Technical Reference Manual Residential Natural Gas Efficiency Measures
October 2011 288 © 2011 Massachusetts Electric and Gas Energy
Efficiency Program Administrators, ALL RIGHTS RESERVED
Hours
Not applicable.
Measure Life
The measure life is 15 years.544
Secondary Energy Impacts
Benefit Type Description Savings
Annual Non-Resource See Appendix D: Non-Resource Impacts See Appendix D: Non-Resource Impacts
One-Time Non-Resource See Appendix D: Non-Resource Impacts See Appendix D: Non-Resource Impacts
Non-Energy Impacts
There are no non-energy impacts for this measure
Impact Factors for Calculating Adjusted Gross Savings
Measure Name Program PA ISR SPF RRE RRSP RRWP CFSP CFWP
MF SPACE Other Insulation MF Retrofit National Grid 1.00 1.00 1.00 n/a n/a n/a n/a
MF SPACE Other Insulation LI MF Retrofit National Grid 1.00 1.00 1.00 n/a n/a n/a n/a
In-Service Rates All installations have 100% in service rate since all PA programs include verification of equipment installations. Savings Persistence Factor All PAs use 100% savings persistence factor. Realization Rates The energy realization rates are 100% based on no evaluations.
Coincidence Factors There are no electric savings for this measure.
544 GDS Associates, Inc. (2007). Measure Life Report: Residential and Commercial/Industrial Lighting and HVAC Measures. Prepared for The New England State Program Working Group.

Massachusetts Technical Reference Manual Residential Natural Gas Efficiency Measures
October 2011 289 © 2011 Massachusetts Electric and Gas Energy
Efficiency Program Administrators, ALL RIGHTS RESERVED
Multifamily – Pipe Insulation
Version Date and Revision History
Draft Date: 06/30/2011 Effective Date: 1/1/2012 End Date: TBD
Measure Overview
Description: Insulation upgrades to existing heating system pipes. Primary Energy Impact: Natural Gas (Residential Heat) Secondary Energy Impact: None Non-Energy Impact: Annual Non-Resource, One-Time Non-Resource Sector: Residential, Low Income Market: Retrofit End Use: HVAC Program: National Grid only: Multifamily Retrofit, Low-Income Multifamily Retrofit
Algorithms for Calculating Primary Energy Impact
LFMMBtuLFMMBtu /×=∆
Where: LF = Linear feet of installed pipe insulation MMBtu/LF = Deemed MMBtu savings per linear foot of installed insulation Table 35: Savings for MF Pipe Insulation
Measure Unit MMBtu/LF545
Heating System Pipe Insulation Linear Feet 0.160
Baseline Efficiency
The baseline efficiency case is the existing facility or equipment prior to the implementation of additional insulation.
High Efficiency
The baseline efficiency case is the existing facility or equipment after the implementation of additional insulation.
Hours
Not applicable.
545 Savings assumptions from National Grid program vendor.

Massachusetts Technical Reference Manual Residential Natural Gas Efficiency Measures
October 2011 290 © 2011 Massachusetts Electric and Gas Energy
Efficiency Program Administrators, ALL RIGHTS RESERVED
Measure Life
The measure life is 15 years.546
Secondary Energy Impacts
There are no secondary energy impacts for this measure.
Non-Energy Impacts
Benefit Type Description Savings
Annual Non-Resource See Appendix D: Non-Resource Impacts See Appendix D: Non-Resource Impacts
One-Time Non-Resource See Appendix D: Non-Resource Impacts See Appendix D: Non-Resource Impacts
Impact Factors for Calculating Adjusted Gross Savings
Measure Name Program PA ISR SPF RRE RRSP RRWP CFSP CFWP
MF Pipe Insulation MF Retrofit National Grid 1.00 1.00 1.00 n/a n/a n/a n/a
MF Pipe Insulation LI MF Retrofit National Grid 1.00 1.00 1.00 n/a n/a n/a n/a
In-Service Rates All installations have 100% in service rate since all PA programs include verification of equipment installations. Savings Persistence Factor All PAs use 100% savings persistence factor. Realization Rates The energy realization rate is 100% based on no evaluations.
Coincidence Factors There are no electric savings for this measure.
546 GDS Associates, Inc. (2007). Measure Life Report: Residential and Commercial/Industrial Lighting and HVAC Measures. Prepared for The New England State Program Working Group.

Massachusetts Technical Reference Manual Residential Natural Gas Efficiency Measures
October 2011 291 © 2011 Massachusetts Electric and Gas Energy
Efficiency Program Administrators, ALL RIGHTS RESERVED
Multifamily – Shell Insulation
Version Date and Revision History
Draft Date: 06/30/2011 Effective Date: 1/1/2012 End Date: TBD
Measure Overview
Description: Shell insulation upgrades are applied in existing facilities including improved insulation in attics, basements and sidewalls. Primary Energy Impact: Natural Gas (Residential Heat) Secondary Energy Impact: None Non-Energy Impact: Annual Non-Resource, One-Time Non-Resource Sector: Residential, Low-Income Market: Retrofit End Use: HVAC Program: National Grid only: Multifamily Retrofit, Low-Income Multifamily Retrofit
Algorithms for Calculating Primary Energy Impact
000,000,1
124
11××××
+−×=∆
fSeasonalEf
FactorCorrectionHDD
RRRSQFTMMBtu
ADDBASEBASE
Where: SQFT = Square feet of insulation installed (ft2) RBASE = Total R-value of the existing attic, basement or sidewall (ft2-hr-°F/Btu) RADD = R-value of the added insulation (ft2-hr-°F/Btu) HDD = Heating degree days (°F-day) 24 = Hours per day (hr/day) CorrectionFactor = Correction factor determined by auditor (e.g. for seasonal homes): Default = 1. SeasonalEff = Heating system seasonal efficiency factor determined by auditor: Default = 0.7 1/1,000,000 = Conversion from Btu to MMBtu
Baseline Efficiency
The baseline efficiency case is characterized by the total R-value of the existing attic, basement or sidewall (RBASE). This is calculated as the R-value of the existing insulation, estimated by the program contractor, plus the R-value of the ceiling, floor, or wall (for all projects: RCEILING = 3.36; RFLOOR = 6.16; RWALL = 6.65)547.
547 Savings assumptions from National Grid program vendor.

Massachusetts Technical Reference Manual Residential Natural Gas Efficiency Measures
October 2011 292 © 2011 Massachusetts Electric and Gas Energy
Efficiency Program Administrators, ALL RIGHTS RESERVED
High Efficiency
The high efficiency case is characterized by the total R-value of the attic after the installation of additional attic, basement or sidewall insulation. This is calculated as the sum of the existing R-value (RBASE) plus the R-value of the added insulation (RADD).
Hours
Heating hours are characterized by the heating degree days for the facility. The heating degree days are looked up based on the nearest weather station to the customer, as selected by the program vendor.
Measure Life
The measure life is 25 years.548
Secondary Energy Impacts
There are no secondary energy impacts for this measure.
Non-Energy Impacts
Benefit Type Description Savings
Annual Non-Resource See Appendix D: Non-Resource Impacts See Appendix D: Non-Resource Impacts
One-Time Non-Resource See Appendix D: Non-Resource Impacts See Appendix D: Non-Resource Impacts
Impact Factors for Calculating Adjusted Gross Savings
Measure Name Program PA ISR SPF RRE RRSP RRWP CFSP CFWP
MF SPACE Shell Insulation MF Retrofit National Grid 1.00 1.00 1.00 n/a n/a n/a n/a
MF SPACE Shell Insulation LI MF Retrofit National Grid 1.00 1.00 1.00 n/a n/a n/a n/a
In-Service Rates All installations have 100% in service rate since all PA programs include verification of equipment installations. Savings Persistence Factor All PAs use 100% savings persistence factor. Realization Rates The energy realization rates are 100% based on no evaluations.
Coincidence Factors There are no electric savings for this measure.
548 GDS Associates, Inc. (2007). Measure Life Report: Residential and Commercial/Industrial Lighting and HVAC Measures. Prepared for The New England State Program Working Group.
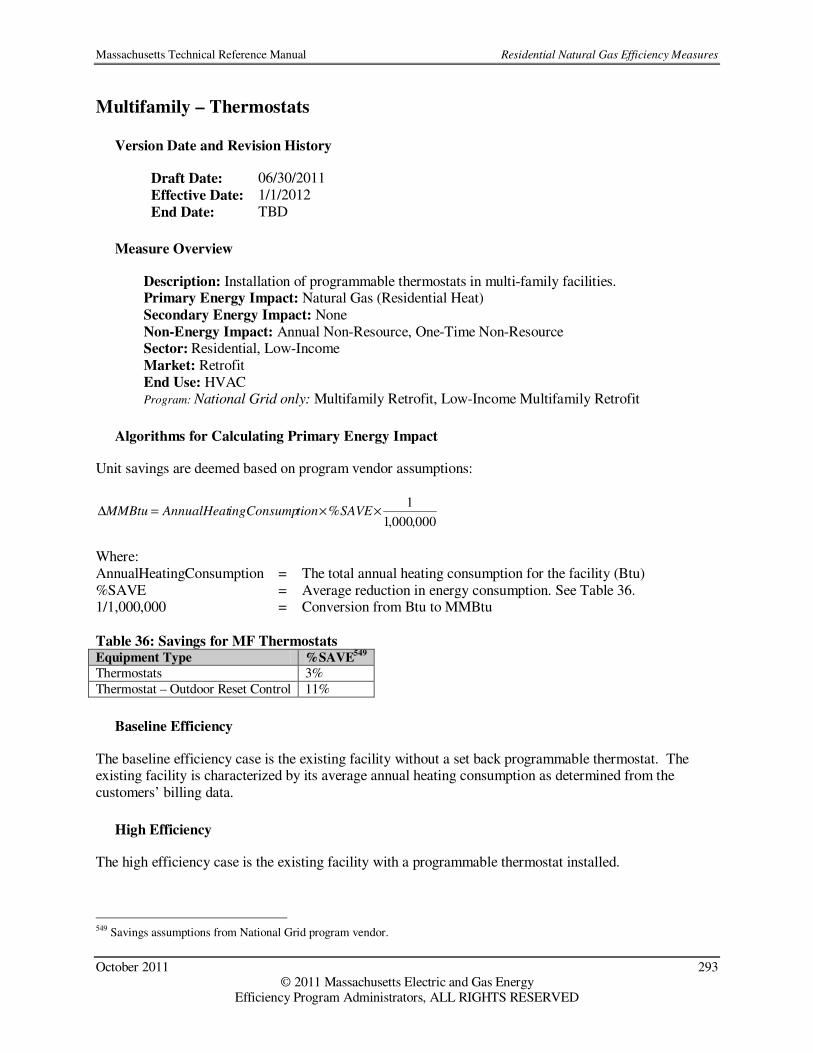
Massachusetts Technical Reference Manual Residential Natural Gas Efficiency Measures
October 2011 293 © 2011 Massachusetts Electric and Gas Energy
Efficiency Program Administrators, ALL RIGHTS RESERVED
Multifamily – Thermostats
Version Date and Revision History
Draft Date: 06/30/2011 Effective Date: 1/1/2012 End Date: TBD
Measure Overview
Description: Installation of programmable thermostats in multi-family facilities. Primary Energy Impact: Natural Gas (Residential Heat) Secondary Energy Impact: None Non-Energy Impact: Annual Non-Resource, One-Time Non-Resource Sector: Residential, Low-Income Market: Retrofit End Use: HVAC Program: National Grid only: Multifamily Retrofit, Low-Income Multifamily Retrofit
Algorithms for Calculating Primary Energy Impact
Unit savings are deemed based on program vendor assumptions:
000,000,1
1% ××=∆ SAVEtioningConsumpAnnualHeatMMBtu
Where: AnnualHeatingConsumption = The total annual heating consumption for the facility (Btu) %SAVE = Average reduction in energy consumption. See Table 36. 1/1,000,000 = Conversion from Btu to MMBtu
Table 36: Savings for MF Thermostats Equipment Type %SAVE
549
Thermostats 3% Thermostat – Outdoor Reset Control 11%
Baseline Efficiency
The baseline efficiency case is the existing facility without a set back programmable thermostat. The existing facility is characterized by its average annual heating consumption as determined from the customers’ billing data.
High Efficiency
The high efficiency case is the existing facility with a programmable thermostat installed.
549 Savings assumptions from National Grid program vendor.
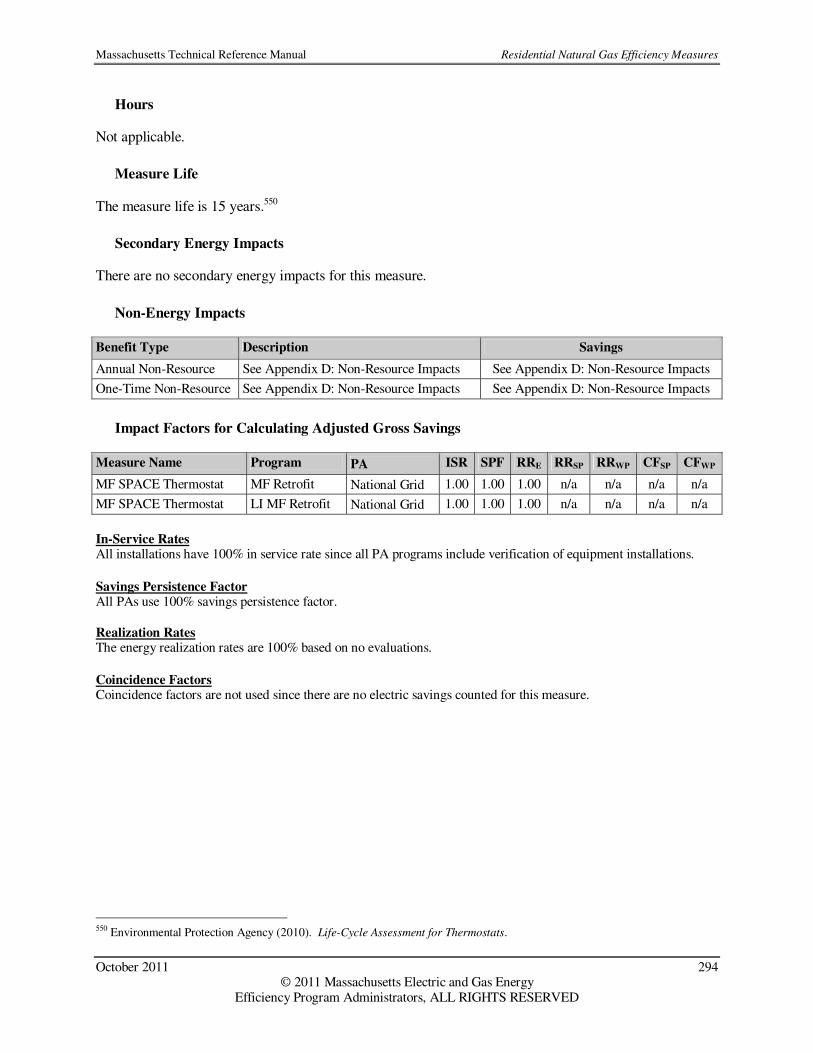
Massachusetts Technical Reference Manual Residential Natural Gas Efficiency Measures
October 2011 294 © 2011 Massachusetts Electric and Gas Energy
Efficiency Program Administrators, ALL RIGHTS RESERVED
Hours
Not applicable.
Measure Life
The measure life is 15 years.550
Secondary Energy Impacts
There are no secondary energy impacts for this measure.
Non-Energy Impacts
Benefit Type Description Savings
Annual Non-Resource See Appendix D: Non-Resource Impacts See Appendix D: Non-Resource Impacts
One-Time Non-Resource See Appendix D: Non-Resource Impacts See Appendix D: Non-Resource Impacts
Impact Factors for Calculating Adjusted Gross Savings
Measure Name Program PA ISR SPF RRE RRSP RRWP CFSP CFWP
MF SPACE Thermostat MF Retrofit National Grid 1.00 1.00 1.00 n/a n/a n/a n/a
MF SPACE Thermostat LI MF Retrofit National Grid 1.00 1.00 1.00 n/a n/a n/a n/a
In-Service Rates All installations have 100% in service rate since all PA programs include verification of equipment installations. Savings Persistence Factor All PAs use 100% savings persistence factor. Realization Rates The energy realization rates are 100% based on no evaluations.
Coincidence Factors Coincidence factors are not used since there are no electric savings counted for this measure.
550 Environmental Protection Agency (2010). Life-Cycle Assessment for Thermostats.
Massachusetts Technical Reference Manual Residential Natural Gas Efficiency Measures
October 2011 295 © 2011 Massachusetts Electric and Gas Energy
Efficiency Program Administrators, ALL RIGHTS RESERVED
Home Energy Services (Gas Weatherization) – Vendor Measures
Version Date and Revision History
Draft Date: 08/26/2011 Effective Date: 1/1/2012 End Date: TBD
Measure Overview
Description: Retrofit measures installed through the Home Energy Services program including: building envelope insulation, air sealing, and exterior doors. Primary Energy Impact: Natural Gas (Residential Heat) Secondary Energy Impact: None Non-Energy Impact: Annual Non-Resource, One-Time Non-Resource Sector: Residential Market: Retrofit End Use: HVAC Program: Home Energy Services (Gas Weatherization)
Algorithms for Calculating Primary Energy Impact
The Program Administrators use vendor calculated savings for measures in the Residential Home Energy Services gas program. These savings values are calculated using vendor proprietary software where the user inputs a minimum set of technical data about the house and the software calculates building heating and cooling loads and other key parameters. The proprietary building model is based on thermal transfer, building gains, and a variable-based heating/cooling degree day/hour climate model. This provides an initial estimate of energy use that may be compared with actual billing data to adjust as needed for existing conditions. Then, specific recommendations for improvements are added and savings are calculated using measure-specific heat transfer algorithms.
Rather than using a fixed degree day approach, the building model estimates both heating degree days and cooling degree hours based on the actual characteristics and location of the house to determine the heating and cooling balance point temperatures. Savings from shell measures use standard U-value, area, and degree day algorithms. Infiltration savings use site-specific seasonal N-factors to convert measured leakage to seasonal energy impacts. HVAC savings are estimated based on changes in system and/or distribution efficiency improvements, using ASHRAE 152 as their basis. Interactivity between architectural and mechanical measures is always included, to avoid overestimating savings due to incorrectly “adding” individual measure results.
Baseline Efficiency
The baseline efficiency case is the existing conditions of the participating household.
High Efficiency
The high efficiency case includes installed energy efficiency measures that reduce heating energy use.
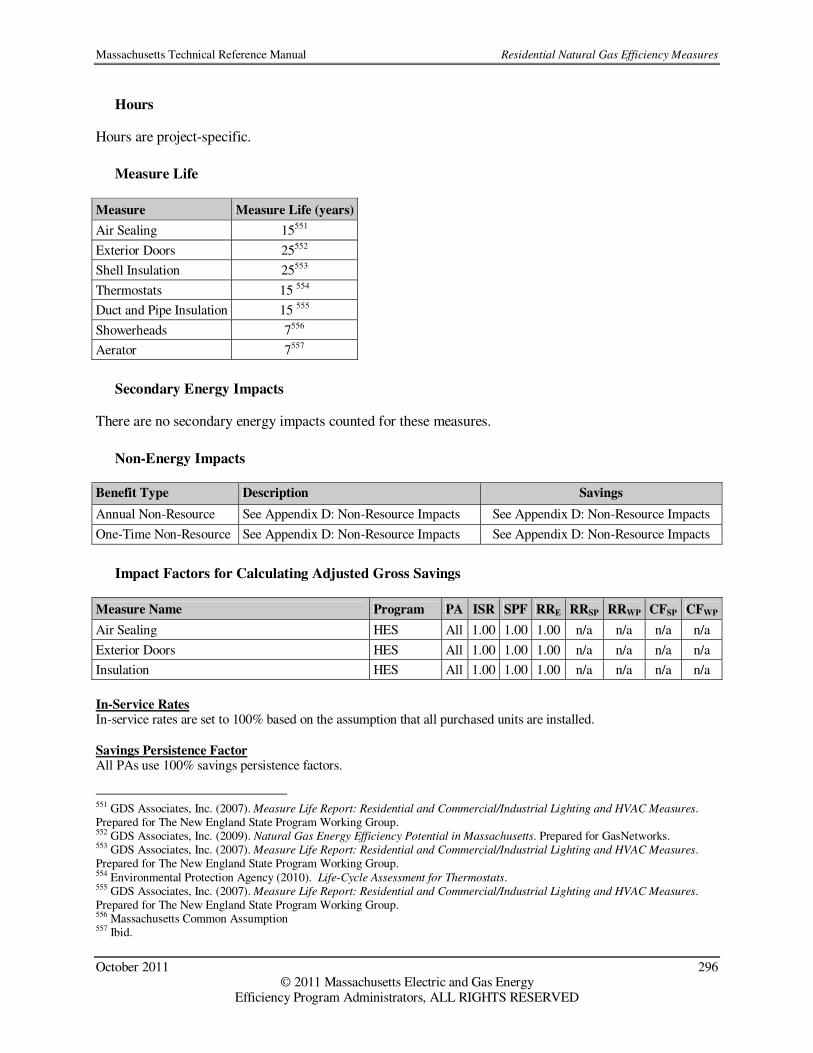
Massachusetts Technical Reference Manual Residential Natural Gas Efficiency Measures
October 2011 296 © 2011 Massachusetts Electric and Gas Energy
Efficiency Program Administrators, ALL RIGHTS RESERVED
Hours
Hours are project-specific.
Measure Life
Measure Measure Life (years)
Air Sealing 15551
Exterior Doors 25552
Shell Insulation 25553
Thermostats 15 554
Duct and Pipe Insulation 15 555
Showerheads 7556
Aerator 7557
Secondary Energy Impacts
There are no secondary energy impacts counted for these measures.
Non-Energy Impacts
Benefit Type Description Savings
Annual Non-Resource See Appendix D: Non-Resource Impacts See Appendix D: Non-Resource Impacts
One-Time Non-Resource See Appendix D: Non-Resource Impacts See Appendix D: Non-Resource Impacts
Impact Factors for Calculating Adjusted Gross Savings
Measure Name Program PA ISR SPF RRE RRSP RRWP CFSP CFWP
Air Sealing HES All 1.00 1.00 1.00 n/a n/a n/a n/a
Exterior Doors HES All 1.00 1.00 1.00 n/a n/a n/a n/a
Insulation HES All 1.00 1.00 1.00 n/a n/a n/a n/a
In-Service Rates In-service rates are set to 100% based on the assumption that all purchased units are installed. Savings Persistence Factor All PAs use 100% savings persistence factors.
551 GDS Associates, Inc. (2007). Measure Life Report: Residential and Commercial/Industrial Lighting and HVAC Measures. Prepared for The New England State Program Working Group. 552 GDS Associates, Inc. (2009). Natural Gas Energy Efficiency Potential in Massachusetts. Prepared for GasNetworks. 553 GDS Associates, Inc. (2007). Measure Life Report: Residential and Commercial/Industrial Lighting and HVAC Measures. Prepared for The New England State Program Working Group. 554 Environmental Protection Agency (2010). Life-Cycle Assessment for Thermostats. 555 GDS Associates, Inc. (2007). Measure Life Report: Residential and Commercial/Industrial Lighting and HVAC Measures. Prepared for The New England State Program Working Group. 556 Massachusetts Common Assumption 557 Ibid.

Massachusetts Technical Reference Manual Residential Natural Gas Efficiency Measures
October 2011 297 © 2011 Massachusetts Electric and Gas Energy
Efficiency Program Administrators, ALL RIGHTS RESERVED
Realization Rates Realization rates are based on Massachusetts Common Assumptions.
Coincidence Factor Coincidence factors are based on Massachusetts Common Assumptions.

Massachusetts Technical Reference Manual Residential Natural Gas Efficiency Measures
October 2011 298 © 2011 Massachusetts Electric and Gas Energy
Efficiency Program Administrators, ALL RIGHTS RESERVED
ENERGY STAR® Homes – Heating, Cooling, and DHW Measures
Version Date and Revision History
Effective Date: 1/1/2011 End Date: TBD
Measure Overview
Description: To capture lost opportunities, encourage the construction of energy-efficient homes, and drive the market to one in which new homes are moving towards net-zero energy. Primary Energy Impact: Natural Gas (Residential Heat) Secondary Energy Impact: Electric, Oil, Propane Non-Energy Impact: None Sector: Residential, Low-Income Market: Lost Opportunity End Use: HVAC, Hot Water Program: Residential New Construction & Major Renovation
Algorithms for Calculating Primary Energy Impact
As part of the ENERGY STAR® certification process, projected energy use is calculated for each home completed through the program and a geometrically matching baseline home (User Defined Reference Home) using Beacon, an ICF International proprietary DOE-2 based building energy simulation tool. The difference between the projected energy consumption of these two homes represents the energy savings produced by the certified home. This process is used to calculate electric demand as well as electric and fossil fuel energy savings due to heating, cooling, and water heating for all homes, both single family and multifamily. This process is documented in “Energy/Demand Savings Calculation and Reporting Methodology for the Massachusetts ENERGY STAR® Homes Program.”558
Baseline Efficiency
The User Defined Reference Home was revised for 2006 as a result of the baseline study completed in 2006.559 560
High Efficiency
The high efficiency case is represented by the specific energy characteristics of each “as-built” home completed through the program.
558 ICF International (2008). Energy/Demand Savings Calculation and Reporting Methodology for the Massachusetts ENERGY
STAR ® Homes Program. Prepared for Joint Management Committee. 559 Nexus Market Research & Dorothy Conant (2006). Massachusetts ENERGY STAR® Homes: 2005 Baseline Study: Part I:
Inspection Data Analysis Final Report. Prepared for the Massachusetts Joint Management Committee. 560 Nexus Market Research & Dorothy Conant (2006). Massachusetts ENERGY STAR® Homes: 2005 Baseline Study: Part II:
Homeowner Survey Analysis Incorporating Inspection Data Final Report. Prepared for the Massachusetts Joint Management Committee.

Massachusetts Technical Reference Manual Residential Natural Gas Efficiency Measures
October 2011 299 © 2011 Massachusetts Electric and Gas Energy
Efficiency Program Administrators, ALL RIGHTS RESERVED
Hours
Not applicable.
Measure Life
Measure Type Measure Life (years)561
Cooling 25 Heating 25 Water Heating 15
Secondary Energy Impacts
Electric, Oil and Propane savings for heating and water heating measures are custom calculating using the same methodology described for the electric energy and demand savings.
Non-Energy Impacts
Benefit Type Description Savings
Annual Non-Resource See Appendix D: Non-Resource Impacts See Appendix D: Non-Resource Impacts
One-Time Non-Resource See Appendix D: Non-Resource Impacts See Appendix D: Non-Resource Impacts
Impact Factors for Calculating Adjusted Gross Savings
Measure Name Program PA ISR SPF RRE RRSP RRWP CFSP CFWP
ES Homes – Cooling RNC, LI RNC All 1.00 1.00 1.00 1.00 1.00 1.00 0.00
ES Homes – Heating RNC, LI RNC All 1.00 1.00 1.00 1.00 1.00 0.00 1.00
ES Homes – Water Heating RNC, LI RNC All 1.00 1.00 1.00 1.00 1.00 0.75 1.00
In-Service Rates All installations have 100% in service rate since all PA programs include verification of equipment installations. Savings Persistence Factor All PAs use 100% savings persistence factors. Realization Rates Realization rates are 100% because energy and demand savings are custom calculated based on project specific detail. Coincidence Factors Coincidence factors are custom calculated based on project-specific detail.
561 Massachusetts Common Assumption.

Massachusetts Technical Reference Manual Commercial and Industrial Natural Gas Efficiency Measures
October 2011 300 © 2011 Massachusetts Electric and Gas Energy
Efficiency Program Administrators, ALL RIGHTS RESERVED
Commercial and Industrial Gas Efficiency Measures

Massachusetts Technical Reference Manual Commercial and Industrial Natural Gas Efficiency Measures
October 2011 301 © 2011 Massachusetts Electric and Gas Energy
Efficiency Program Administrators, ALL RIGHTS RESERVED
HVAC – Boilers
Version Date and Revision History
Effective Date: 1/1/2011 (revised for 1/1/2012) End Date: TBD
Measure Overview
Description: The installation of a high efficiency natural gas fired condensing hot water boiler. High-efficiency condensing boilers can take advantage of improved design, sealed combustion and condensing flue gases in a second heat exchanger to achieve improved efficiency. Primary Energy Impact: Natural Gas Secondary Energy Impact: None Non-Energy Impact: None Sector: Commercial & Industrial Market: Lost Opportunity End Use: HVAC Program: C&I New Construction & Major Renovation
Notes
The PAs decided to screen steam and hydronic boilers as custom measures beginning in PY 2012 so they were removed from the TRM.
Algorithms for Calculating Primary Energy Impact
Unit savings are deemed based on study results:
MMBtuMMBtu ∆=∆ Where: Unit = Installed high efficiency boiler ∆MMBtu = Average annual MMBtu savings per unit. See Table 37 for values.
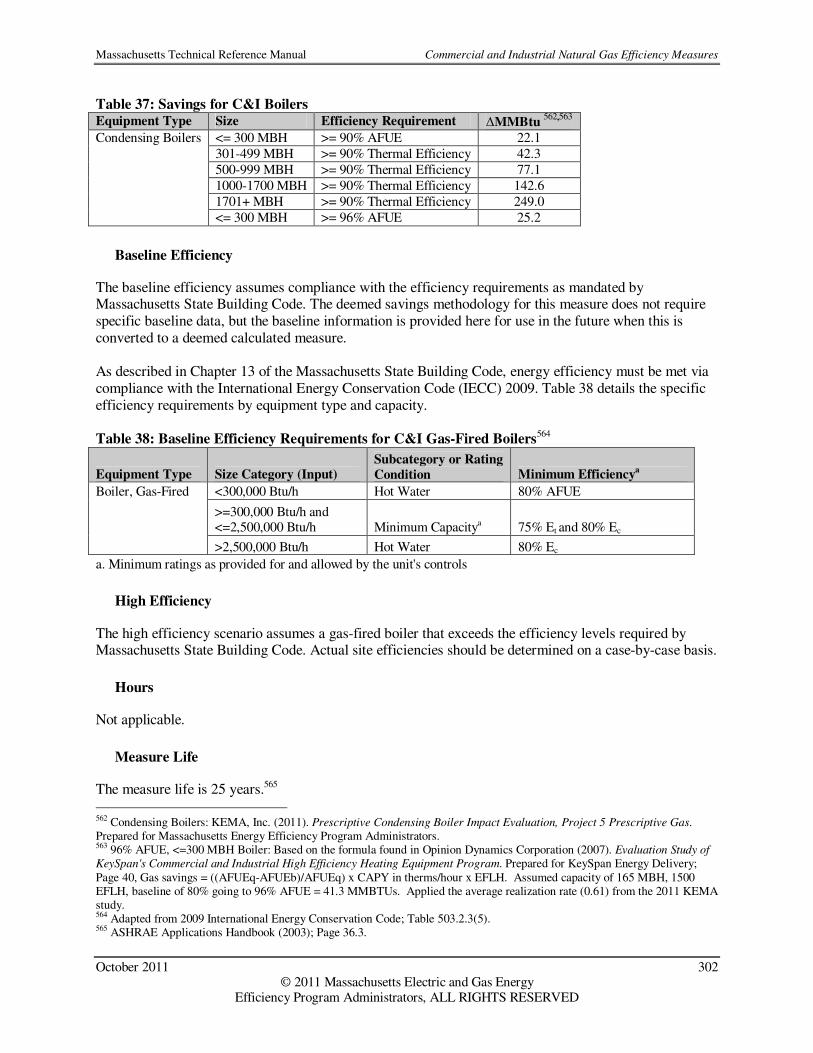
Massachusetts Technical Reference Manual Commercial and Industrial Natural Gas Efficiency Measures
October 2011 302 © 2011 Massachusetts Electric and Gas Energy
Efficiency Program Administrators, ALL RIGHTS RESERVED
Table 37: Savings for C&I Boilers Equipment Type Size Efficiency Requirement ∆MMBtu
562,563
<= 300 MBH >= 90% AFUE 22.1 301-499 MBH >= 90% Thermal Efficiency 42.3 500-999 MBH >= 90% Thermal Efficiency 77.1 1000-1700 MBH >= 90% Thermal Efficiency 142.6 1701+ MBH >= 90% Thermal Efficiency 249.0
Condensing Boilers
<= 300 MBH >= 96% AFUE 25.2
Baseline Efficiency
The baseline efficiency assumes compliance with the efficiency requirements as mandated by Massachusetts State Building Code. The deemed savings methodology for this measure does not require specific baseline data, but the baseline information is provided here for use in the future when this is converted to a deemed calculated measure. As described in Chapter 13 of the Massachusetts State Building Code, energy efficiency must be met via compliance with the International Energy Conservation Code (IECC) 2009. Table 38 details the specific efficiency requirements by equipment type and capacity. Table 38: Baseline Efficiency Requirements for C&I Gas-Fired Boilers
564
Equipment Type Size Category (Input) Subcategory or Rating
Condition Minimum Efficiencya
Boiler, Gas-Fired <300,000 Btu/h Hot Water 80% AFUE
>=300,000 Btu/h and <=2,500,000 Btu/h Minimum Capacitya 75% Et and 80% Ec
>2,500,000 Btu/h Hot Water 80% Ec
a. Minimum ratings as provided for and allowed by the unit's controls
High Efficiency
The high efficiency scenario assumes a gas-fired boiler that exceeds the efficiency levels required by Massachusetts State Building Code. Actual site efficiencies should be determined on a case-by-case basis.
Hours
Not applicable.
Measure Life
The measure life is 25 years.565 562 Condensing Boilers: KEMA, Inc. (2011). Prescriptive Condensing Boiler Impact Evaluation, Project 5 Prescriptive Gas. Prepared for Massachusetts Energy Efficiency Program Administrators. 563 96% AFUE, <=300 MBH Boiler: Based on the formula found in Opinion Dynamics Corporation (2007). Evaluation Study of
KeySpan's Commercial and Industrial High Efficiency Heating Equipment Program. Prepared for KeySpan Energy Delivery; Page 40, Gas savings = ((AFUEq-AFUEb)/AFUEq) x CAPY in therms/hour x EFLH. Assumed capacity of 165 MBH, 1500 EFLH, baseline of 80% going to 96% AFUE = 41.3 MMBTUs. Applied the average realization rate (0.61) from the 2011 KEMA study. 564 Adapted from 2009 International Energy Conservation Code; Table 503.2.3(5). 565 ASHRAE Applications Handbook (2003); Page 36.3.
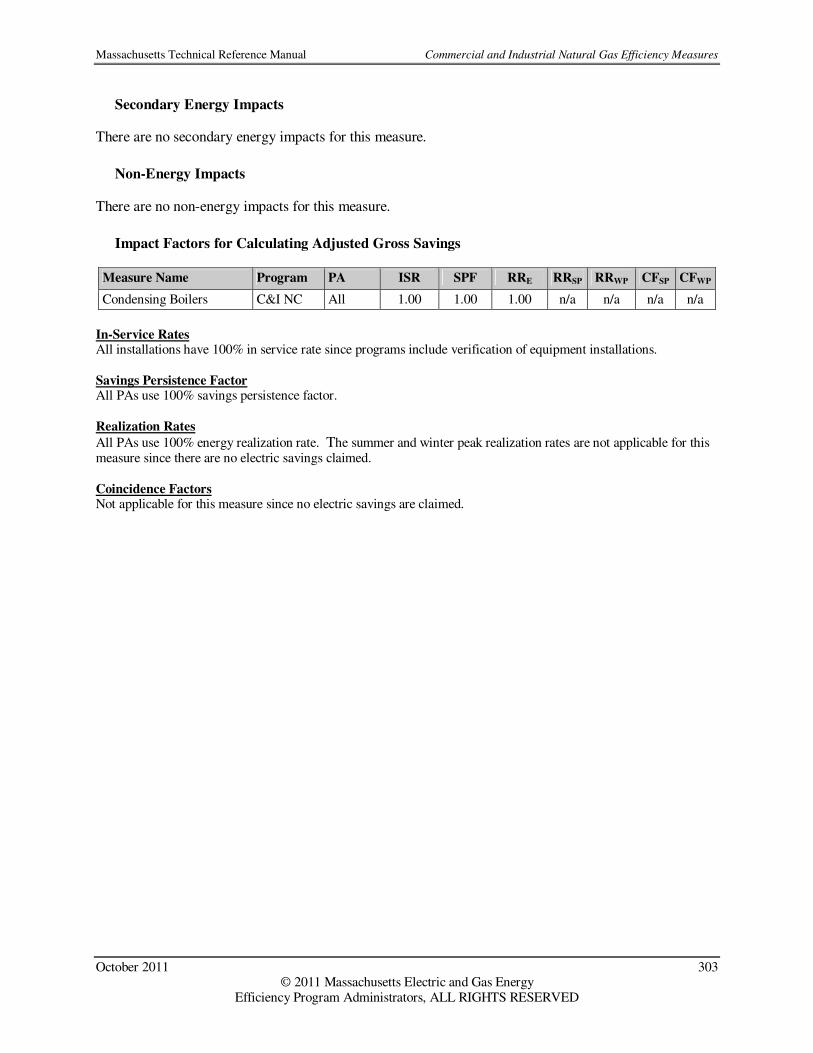
Massachusetts Technical Reference Manual Commercial and Industrial Natural Gas Efficiency Measures
October 2011 303 © 2011 Massachusetts Electric and Gas Energy
Efficiency Program Administrators, ALL RIGHTS RESERVED
Secondary Energy Impacts
There are no secondary energy impacts for this measure.
Non-Energy Impacts
There are no non-energy impacts for this measure.
Impact Factors for Calculating Adjusted Gross Savings
Measure Name Program PA ISR SPF RRE RRSP RRWP CFSP CFWP
Condensing Boilers C&I NC All 1.00 1.00 1.00 n/a n/a n/a n/a
In-Service Rates All installations have 100% in service rate since programs include verification of equipment installations. Savings Persistence Factor All PAs use 100% savings persistence factor. Realization Rates
All PAs use 100% energy realization rate. The summer and winter peak realization rates are not applicable for this measure since there are no electric savings claimed.
Coincidence Factors Not applicable for this measure since no electric savings are claimed.

Massachusetts Technical Reference Manual Commercial and Industrial Natural Gas Efficiency Measures
October 2011 304 © 2011 Massachusetts Electric and Gas Energy
Efficiency Program Administrators, ALL RIGHTS RESERVED
HVAC – Boiler Reset Controls
Version Date and Revision History
Effective Date: 1/1/2011 End Date: TBD
Measure Overview
Description: Boiler Reset Controls are devices that automatically control boiler water temperature based on outdoor or return water temperature using a software program. Primary Energy Impact: Natural Gas Secondary Energy Impact: None Non-Energy Impact: None Sector: Commercial & Industrial Market: Retrofit End Use: HVAC Program: C&I Retrofit
Algorithms for Calculating Primary Energy Impact
Unit savings are deemed based on study results:
MMBtuMMBtu ∆=∆ Where: Unit = Installed boiler reset control ∆MMBtu = Average annual MMBtu savings per unit: 35.5 MMBtu566
Baseline Efficiency
The baseline efficiency case is a boiler without reset controls.
High Efficiency
The high efficiency case is a boiler with reset controls.
Hours
Not applicable.
Measure Life
The measure life is 15 years.567
566 GDS Associates, Inc. (2009). Natural Gas Energy Efficiency Potential in Massachusetts. Prepared for GasNetworks; the GDS Study assumes 710.46 MMBTU base use with 5% savings factor. 567 ACEEE (2006). Emerging Technologies Report: Advanced Boiler Controls. Prepared for ACEEE; Page 2

Massachusetts Technical Reference Manual Commercial and Industrial Natural Gas Efficiency Measures
October 2011 305 © 2011 Massachusetts Electric and Gas Energy
Efficiency Program Administrators, ALL RIGHTS RESERVED
Secondary Energy Impacts
There are no secondary energy impacts for this measure.
Non-Energy Impacts
There are no non-energy impacts for this measure.
Impact Factors for Calculating Adjusted Gross Savings
Measure Name Program PA ISR SPF RRE RRSP RRWP CFSP CFWP
Boiler Reset Controls C&I Retrofit All 1.00 1.00 1.00 n/a n/a n/a n/a
In-Service Rates All installations have 100% in service rate since programs include verification of equipment installations. Savings Persistence Factor All PAs use 100% savings persistence factor. Realization Rates
All PAs use 100% energy realization rate. The summer and winter peak realization rates are not applicable for this measure since there are no electric savings claimed.
Coincidence Factors Not applicable for this measure since no electric savings are claimed.
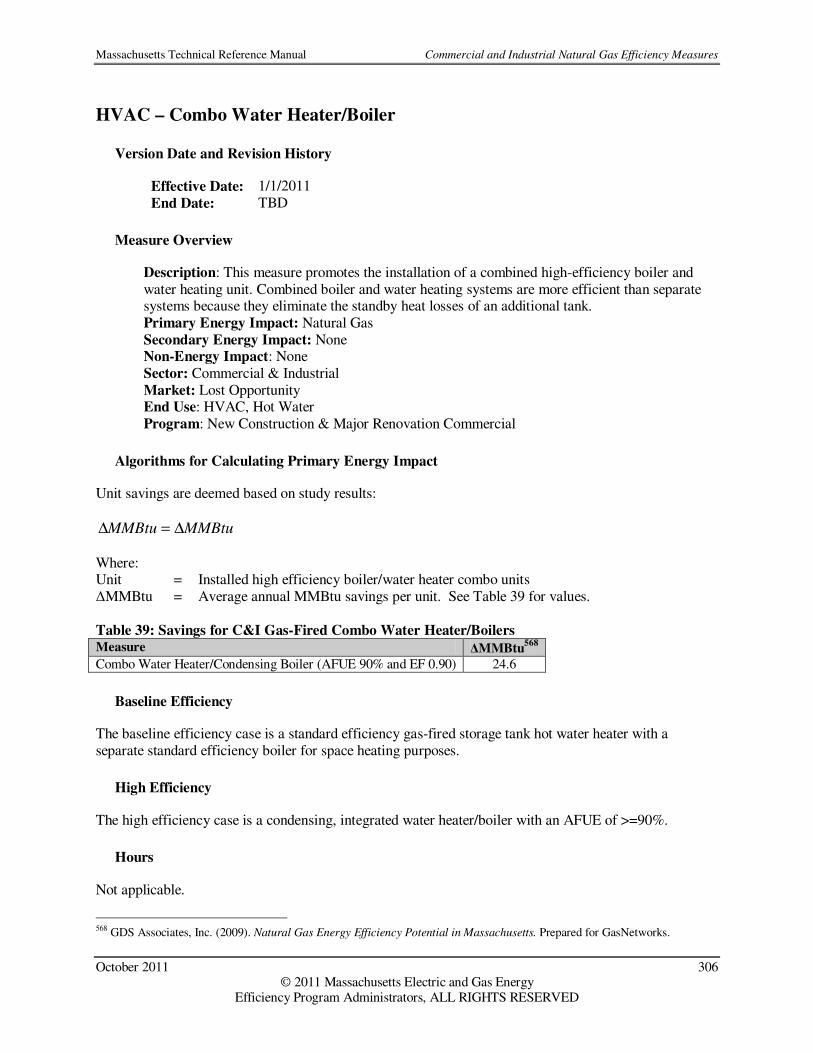
Massachusetts Technical Reference Manual Commercial and Industrial Natural Gas Efficiency Measures
October 2011 306 © 2011 Massachusetts Electric and Gas Energy
Efficiency Program Administrators, ALL RIGHTS RESERVED
HVAC – Combo Water Heater/Boiler
Version Date and Revision History
Effective Date: 1/1/2011 End Date: TBD
Measure Overview
Description: This measure promotes the installation of a combined high-efficiency boiler and water heating unit. Combined boiler and water heating systems are more efficient than separate systems because they eliminate the standby heat losses of an additional tank. Primary Energy Impact: Natural Gas Secondary Energy Impact: None Non-Energy Impact: None Sector: Commercial & Industrial Market: Lost Opportunity End Use: HVAC, Hot Water Program: New Construction & Major Renovation Commercial
Algorithms for Calculating Primary Energy Impact
Unit savings are deemed based on study results:
MMBtuMMBtu ∆=∆ Where: Unit = Installed high efficiency boiler/water heater combo units ∆MMBtu = Average annual MMBtu savings per unit. See Table 39 for values.
Table 39: Savings for C&I Gas-Fired Combo Water Heater/Boilers Measure ∆MMBtu
568
Combo Water Heater/Condensing Boiler (AFUE 90% and EF 0.90) 24.6
Baseline Efficiency
The baseline efficiency case is a standard efficiency gas-fired storage tank hot water heater with a separate standard efficiency boiler for space heating purposes.
High Efficiency
The high efficiency case is a condensing, integrated water heater/boiler with an AFUE of >=90%.
Hours
Not applicable.
568 GDS Associates, Inc. (2009). Natural Gas Energy Efficiency Potential in Massachusetts. Prepared for GasNetworks.
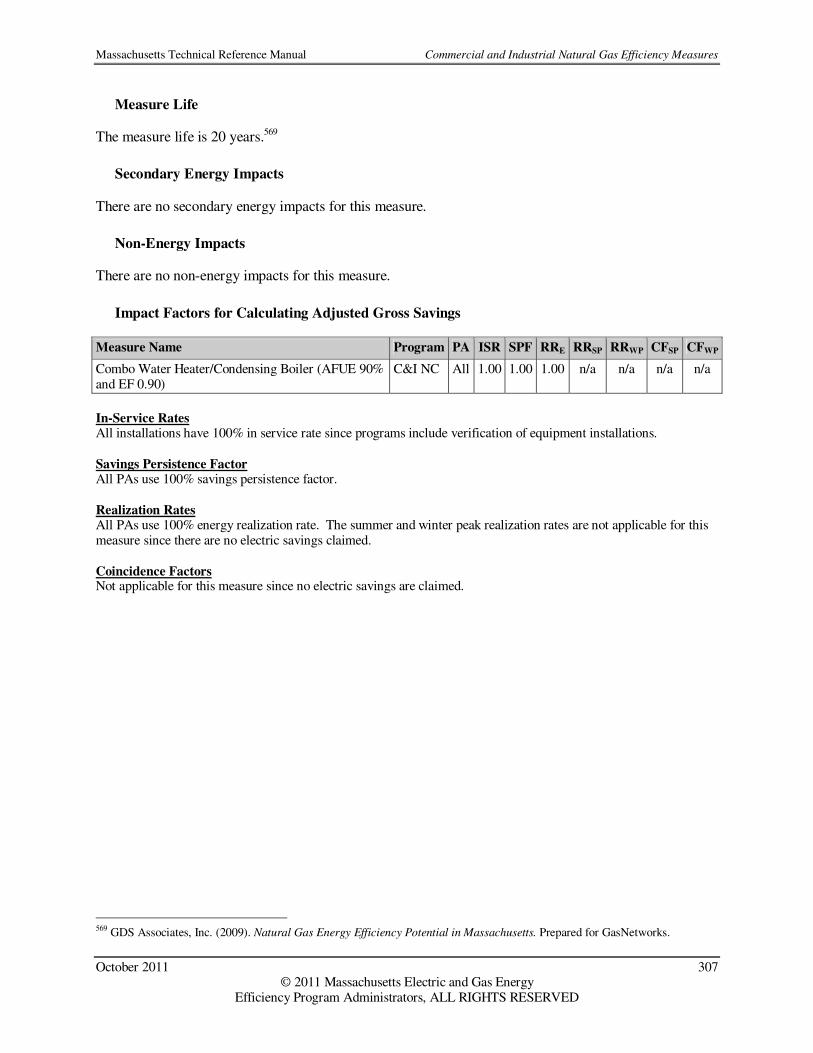
Massachusetts Technical Reference Manual Commercial and Industrial Natural Gas Efficiency Measures
October 2011 307 © 2011 Massachusetts Electric and Gas Energy
Efficiency Program Administrators, ALL RIGHTS RESERVED
Measure Life
The measure life is 20 years.569
Secondary Energy Impacts
There are no secondary energy impacts for this measure.
Non-Energy Impacts
There are no non-energy impacts for this measure.
Impact Factors for Calculating Adjusted Gross Savings
Measure Name Program PA ISR SPF RRE RRSP RRWP CFSP CFWP
Combo Water Heater/Condensing Boiler (AFUE 90% and EF 0.90)
C&I NC All 1.00 1.00 1.00 n/a n/a n/a n/a
In-Service Rates All installations have 100% in service rate since programs include verification of equipment installations. Savings Persistence Factor All PAs use 100% savings persistence factor. Realization Rates All PAs use 100% energy realization rate. The summer and winter peak realization rates are not applicable for this measure since there are no electric savings claimed. Coincidence Factors Not applicable for this measure since no electric savings are claimed.
569 GDS Associates, Inc. (2009). Natural Gas Energy Efficiency Potential in Massachusetts. Prepared for GasNetworks.

Massachusetts Technical Reference Manual Commercial and Industrial Natural Gas Efficiency Measures
October 2011 308 © 2011 Massachusetts Electric and Gas Energy
Efficiency Program Administrators, ALL RIGHTS RESERVED
HVAC – Condensing Unit Heaters
Version Date and Revision History
Effective Date: 1/1/2011 End Date: TBD
Measure Overview
Description: Installation of a condensing gas-fired unit heater for space heating with capacity up to 300 MBH and minimum combustion efficiency of 90%. Primary Energy Impact: Natural Gas Secondary Energy Impact: None Non-Energy Impact: None Sector: Commercial & Industrial Market: Lost Opportunity End Use: HVAC Program: C&I New Construction & Major Renovation
Algorithms for Calculating Primary Energy Impact
Unit savings are deemed based on study results:
MMBtuMMBtu ∆=∆ Where: Unit = Installed condensing unit heater ∆MMBtu = Average annual MMBtu savings per unit: 40.9 MMBtu570
Baseline Efficiency
The baseline efficiency case is a standard efficiency gas fired unit heater with minimum combustion efficiency of 80%, interrupted or intermittent ignition device (IID), and either power venting or an automatic flue damper.571
High Efficiency
The high efficiency case is a condensing gas unit heater with 90% AFUE or greater.
Hours
Not applicable.
570 NYSERDA Deemed Savings Database (Rev 11); Measure Name: A.UNIT-HEATER-COND.<300000.CI._._.N. The database provides savings of 204.6 MMBtu per million BTU/hr of heater input capacity. Assume average unit size of 200,000 BTU capacity. 571 2009 International Energy Conservation Code

Massachusetts Technical Reference Manual Commercial and Industrial Natural Gas Efficiency Measures
October 2011 309 © 2011 Massachusetts Electric and Gas Energy
Efficiency Program Administrators, ALL RIGHTS RESERVED
Measure Life
The measure life is 18 years.572
Secondary Energy Impacts
There are no secondary energy impacts for this measure.
Non-Energy Impacts
There are no non-energy impacts for this measure.
Impact Factors for Calculating Adjusted Gross Savings
Measure Name Program PA ISR SPF RRE RRSP RRWP CFSP CFWP
Condensing Unit Heaters C&I NC All 1.00 1.00 1.00 n/a n/a n/a n/a
In-Service Rates All installations have 100% in service rate since programs include verification of equipment installations. Savings Persistence Factor All PAs use 100% savings persistence factor. Realization Rates
All PAs use 100% energy realization rate. The summer and winter peak realization rates are not applicable for this measure since there are no electric savings claimed. Coincidence Factors Not applicable for this measure since no electric savings are claimed.
572 Ecotrope, Inc. (2003). Natural Gas Efficiency and Conservation Measure Resource Assessment for the Residential and
Commercial Sectors. Prepared for the Energy Trust of Oregon.

Massachusetts Technical Reference Manual Commercial and Industrial Natural Gas Efficiency Measures
October 2011 310 © 2011 Massachusetts Electric and Gas Energy
Efficiency Program Administrators, ALL RIGHTS RESERVED
HVAC – Furnaces
Version Date and Revision History
Effective Date: 1/1/2011 (revised for 1/1/2012) End Date: TBD
Measure Overview
Description: The installation of a high efficiency natural gas warm air furnace with an electronically commutated motor (ECM) for the fan. High efficiency furnaces are better at converting fuel into direct heat and better insulated to reduce heat loss. ECM fan motors significantly reduce fan motor electric consumption as compared to both shaped-pole and permanent split capacitor motors. Primary Energy Impact: Natural Gas Secondary Energy Impact: Electric Non-Energy Impact: None Sector: Commercial & Industrial Market: Lost Opportunity End Use: HVAC Program: C&I New Construction & Major Renovation
Algorithms for Calculating Primary Energy Impact
Unit savings are deemed based on study results:
MMBtuMMBtu ∆=∆ Where: Unit = Installed high efficiency furnace. ∆MMBtu = Average annual MMBtu savings per unit. See Table 40 for values.
Table 40: Savings for C&I Gas-Fired Furnaces Equipment Type Efficiency ∆MMBtu
AFUE = 95% 18.0 573 Furnace (Forced Hot Air) w/ECM
AFUE = 96% 20.7 574
Baseline Efficiency
The baseline efficiency assumes compliance with the efficiency requirements as mandated by Massachusetts State Building Code. The deemed savings methodology for this measure does not require specific baseline data, but the baseline information is provided here for use in the future if this is converted to a deemed calculated measure.
573 GDS Associates, Inc. (2009). Natural Gas Energy Efficiency Potential in Massachusetts. Prepared for GasNetworks; value adjusted based on results of: Nexus Market Research and The Cadmus Group (2010). HEHE Process and Impact Evaluation. Prepared for GasNetworks... 574 Ibid.
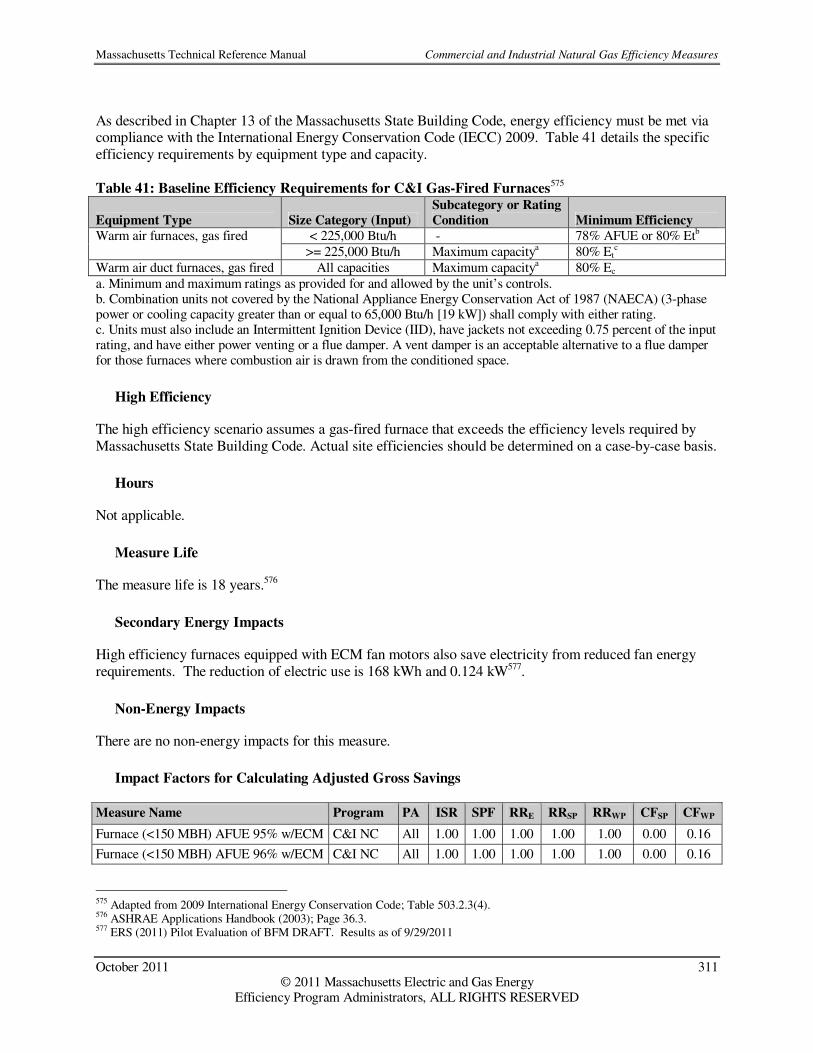
Massachusetts Technical Reference Manual Commercial and Industrial Natural Gas Efficiency Measures
October 2011 311 © 2011 Massachusetts Electric and Gas Energy
Efficiency Program Administrators, ALL RIGHTS RESERVED
As described in Chapter 13 of the Massachusetts State Building Code, energy efficiency must be met via compliance with the International Energy Conservation Code (IECC) 2009. Table 41 details the specific efficiency requirements by equipment type and capacity. Table 41: Baseline Efficiency Requirements for C&I Gas-Fired Furnaces
575
Equipment Type Size Category (Input)
Subcategory or Rating
Condition Minimum Efficiency
Warm air furnaces, gas fired < 225,000 Btu/h - 78% AFUE or 80% Etb >= 225,000 Btu/h Maximum capacitya 80% Et
c Warm air duct furnaces, gas fired All capacities Maximum capacitya 80% Ec a. Minimum and maximum ratings as provided for and allowed by the unit’s controls. b. Combination units not covered by the National Appliance Energy Conservation Act of 1987 (NAECA) (3-phase power or cooling capacity greater than or equal to 65,000 Btu/h [19 kW]) shall comply with either rating. c. Units must also include an Intermittent Ignition Device (IID), have jackets not exceeding 0.75 percent of the input rating, and have either power venting or a flue damper. A vent damper is an acceptable alternative to a flue damper for those furnaces where combustion air is drawn from the conditioned space.
High Efficiency
The high efficiency scenario assumes a gas-fired furnace that exceeds the efficiency levels required by Massachusetts State Building Code. Actual site efficiencies should be determined on a case-by-case basis.
Hours
Not applicable.
Measure Life
The measure life is 18 years.576
Secondary Energy Impacts
High efficiency furnaces equipped with ECM fan motors also save electricity from reduced fan energy requirements. The reduction of electric use is 168 kWh and 0.124 kW577.
Non-Energy Impacts
There are no non-energy impacts for this measure.
Impact Factors for Calculating Adjusted Gross Savings
Measure Name Program PA ISR SPF RRE RRSP RRWP CFSP CFWP
Furnace (<150 MBH) AFUE 95% w/ECM C&I NC All 1.00 1.00 1.00 1.00 1.00 0.00 0.16
Furnace (<150 MBH) AFUE 96% w/ECM C&I NC All 1.00 1.00 1.00 1.00 1.00 0.00 0.16
575 Adapted from 2009 International Energy Conservation Code; Table 503.2.3(4). 576 ASHRAE Applications Handbook (2003); Page 36.3. 577 ERS (2011) Pilot Evaluation of BFM DRAFT. Results as of 9/29/2011

Massachusetts Technical Reference Manual Commercial and Industrial Natural Gas Efficiency Measures
October 2011 312 © 2011 Massachusetts Electric and Gas Energy
Efficiency Program Administrators, ALL RIGHTS RESERVED
In-Service Rates All installations have 100% in service rate since programs include verification of equipment installations. Savings Persistence Factor All PAs use 100% savings persistence factor. Realization Rates All PAs use 100% energy realization rate.
Coincidence Factors Not applicable for this measure since no electric savings are claimed.

Massachusetts Technical Reference Manual Commercial and Industrial Natural Gas Efficiency Measures
October 2011 313 © 2011 Massachusetts Electric and Gas Energy
Efficiency Program Administrators, ALL RIGHTS RESERVED
HVAC – Infrared Heaters
Version Date and Revision History
Effective Date: 1/1/2011 End Date: TBD
Measure Overview
Description: The installation of a gas-fired low intensity infrared heating system in place of unit heater, furnace, or other standard efficiency equipment. Infrared heating uses radiant heat as opposed to warm air to heat buildings. In commercial environments with high air exchange rates, heat loss is minimal because the space’s heat comes from surfaces rather than air. Primary Energy Impact: Natural Gas Secondary Energy Impact: None Non-Energy Impact: None Sector: Commercial & Industrial Market: Lost Opportunity End Use: HVAC Program: C&I New Construction & Major Renovation
Algorithms for Calculating Primary Energy Impact
Unit savings are deemed based on study results:
MMBtuMMBtu ∆=∆ Where: Unit = Installed infrared heating unit ∆MMBtu = Average annual MMBtu savings per unit: 74.4 MMBtu578
Baseline Efficiency
The baseline efficiency case is a standard efficiency gas-fired unit heater with combustion efficiency of 80%.
High Efficiency
The high efficiency case is a gas-fired low-intensity infrared heating unit.
Hours
Not applicable.
578 The savings are based on modeled data from 62 low-intensity infrared heaters installed through the Columbia Gas of MA custom commercial and industrial energy efficiency program. See “Infrared Samples - Bay State Gas.xls” for additional project data.
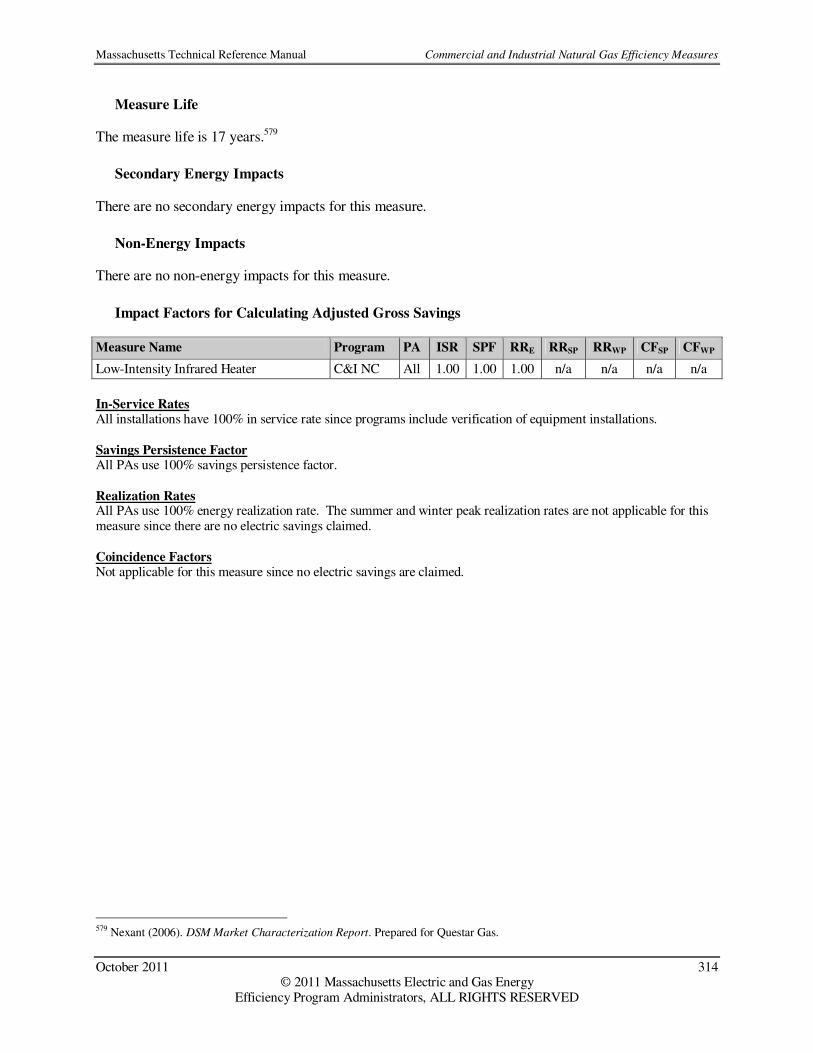
Massachusetts Technical Reference Manual Commercial and Industrial Natural Gas Efficiency Measures
October 2011 314 © 2011 Massachusetts Electric and Gas Energy
Efficiency Program Administrators, ALL RIGHTS RESERVED
Measure Life
The measure life is 17 years.579
Secondary Energy Impacts
There are no secondary energy impacts for this measure.
Non-Energy Impacts
There are no non-energy impacts for this measure.
Impact Factors for Calculating Adjusted Gross Savings
Measure Name Program PA ISR SPF RRE RRSP RRWP CFSP CFWP
Low-Intensity Infrared Heater C&I NC All 1.00 1.00 1.00 n/a n/a n/a n/a
In-Service Rates All installations have 100% in service rate since programs include verification of equipment installations. Savings Persistence Factor All PAs use 100% savings persistence factor. Realization Rates All PAs use 100% energy realization rate. The summer and winter peak realization rates are not applicable for this measure since there are no electric savings claimed. Coincidence Factors Not applicable for this measure since no electric savings are claimed.
579 Nexant (2006). DSM Market Characterization Report. Prepared for Questar Gas.

Massachusetts Technical Reference Manual Commercial and Industrial Natural Gas Efficiency Measures
October 2011 315 © 2011 Massachusetts Electric and Gas Energy
Efficiency Program Administrators, ALL RIGHTS RESERVED
HVAC – Thermostats
Version Date and Revision History
Effective Date: 1/1/2011 End Date: TBD
Measure Overview
Description: Installation of a 7-day programmable thermostat with the ability to adjust heating or air-conditioning operating times according to a pre-set schedule to meet occupancy needs and minimize redundant HVAC operation. Primary Energy Impact: Natural Gas Secondary Energy Impact: None Non-Energy Impact: None Sector: Commercial & Industrial Market: Retrofit End Use: HVAC Program: C&I Retrofit, C&I Direct Install
Algorithms for Calculating Primary Energy Impact
Unit savings are deemed based on study results:
MMBtuMMBtu ∆=∆ Where: Unit = Installed programmable thermostat ∆MMBtu = Average annual MMBtu reduction per unit: 7.7 MMBtu580
Baseline Efficiency
The baseline efficiency case is an HVAC system using natural gas to provide space heating without a programmable thermostat.
High Efficiency
The high efficiency case is an HVAC system using natural gas to provide space heating with a 7-day programmable thermostat installed.
Hours
Not applicable.
580 RLW Analytics (2007). Validating the Impact of Programmable Thermostats. Prepared for GasNetworks; Page 2, conversion factor CCF to Therms is 1.024.
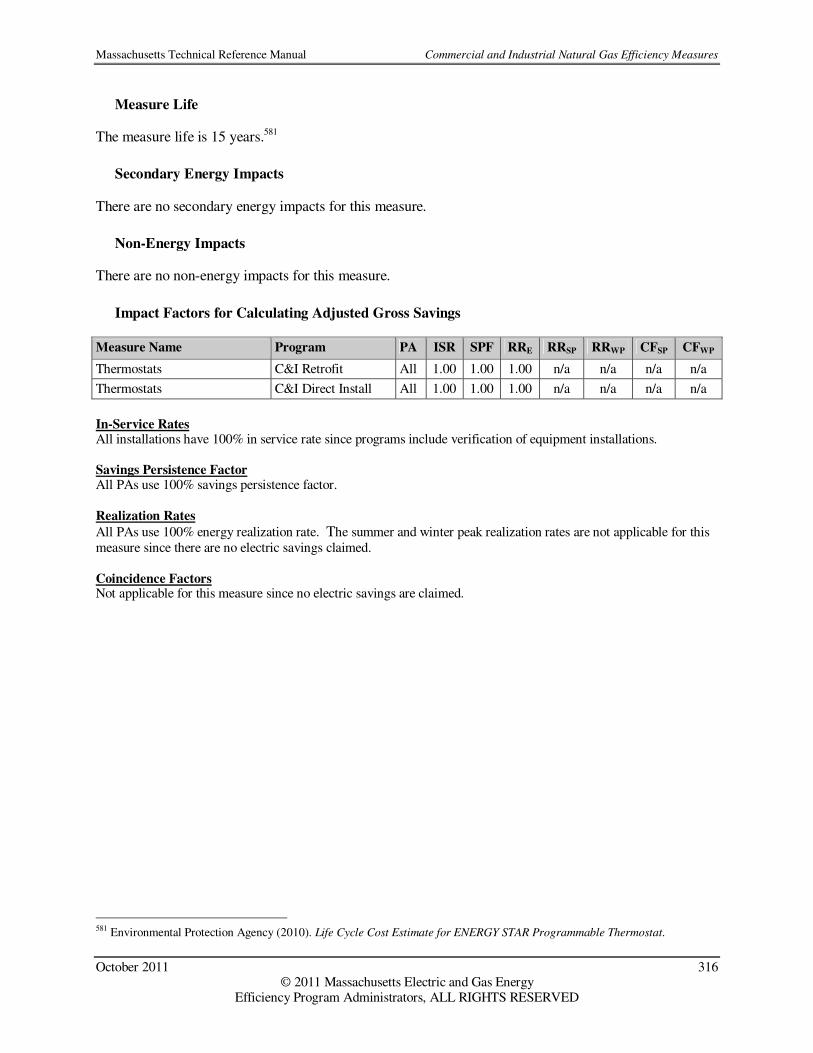
Massachusetts Technical Reference Manual Commercial and Industrial Natural Gas Efficiency Measures
October 2011 316 © 2011 Massachusetts Electric and Gas Energy
Efficiency Program Administrators, ALL RIGHTS RESERVED
Measure Life
The measure life is 15 years.581
Secondary Energy Impacts
There are no secondary energy impacts for this measure.
Non-Energy Impacts
There are no non-energy impacts for this measure.
Impact Factors for Calculating Adjusted Gross Savings
Measure Name Program PA ISR SPF RRE RRSP RRWP CFSP CFWP
Thermostats C&I Retrofit All 1.00 1.00 1.00 n/a n/a n/a n/a
Thermostats C&I Direct Install All 1.00 1.00 1.00 n/a n/a n/a n/a
In-Service Rates All installations have 100% in service rate since programs include verification of equipment installations. Savings Persistence Factor All PAs use 100% savings persistence factor. Realization Rates
All PAs use 100% energy realization rate. The summer and winter peak realization rates are not applicable for this measure since there are no electric savings claimed.
Coincidence Factors Not applicable for this measure since no electric savings are claimed.
581 Environmental Protection Agency (2010). Life Cycle Cost Estimate for ENERGY STAR Programmable Thermostat.

Massachusetts Technical Reference Manual Commercial and Industrial Natural Gas Efficiency Measures
October 2011 317 © 2011 Massachusetts Electric and Gas Energy
Efficiency Program Administrators, ALL RIGHTS RESERVED
Hot Water – Water Heaters
Version Date and Revision History
Effective Date: 1/1/2011 (revised for 1/1/2012) End Date: TBD
Measure Overview
Description: Installation of a high-efficiency gas-fired water heater. Indirect water heaters use a storage tank that is heated by the main boiler. The energy stored by the water tank allows the boiler to turn off and on less often, saving considerable energy. Tankless water heaters circulate water through a heat exchanger to be heated for immediate use, eliminating the standby heat loss associated with a storage tank. Primary Energy Impact: Natural Gas Secondary Energy Impact: None Non-Energy Impact: None Sector: Commercial & Industrial Market: Lost Opportunity End Use: Hot water Program: C&I New Construction & Major Renovation
Algorithms for Calculating Primary Energy Impact
Unit savings are deemed based on study results:
MMBtuMMBtu ∆=∆ Where: Unit = Installed condensing stand-alone water heater ∆MMBtu = Average annual MMBtu savings per unit. See Table 42.

Massachusetts Technical Reference Manual Commercial and Industrial Natural Gas Efficiency Measures
October 2011 318 © 2011 Massachusetts Electric and Gas Energy
Efficiency Program Administrators, ALL RIGHTS RESERVED
Table 42: Savings for C&I Water Heaters Measure ∆MMBtu
Condensing Stand-Alone Water Heater (75-300 MBH) 25.0 582
Free-Standing Water Heater (EF 0.67) 3.0 583
Indirect Water Heater (EF 0.82 and CAE 85%) 30.4 584
On-Demand Tankless Water Heater (EF 0.82) 7.1585
On-Demand Tankless Water Heater (EF 0.95) 9.59 586
Baseline Efficiency
The baseline efficiency case assumes compliance with the efficiency requirements as mandated by Massachusetts State Building Code. As described in Chapter 13 of the State Building Code, energy efficiency must be met via compliance with the International Energy Conservation Code (IECC) 2009. The two documents present nearly identical requirements for gas-fired storage water heaters. The assumed efficiency slightly exceeds the minimum required by code to reflect the typical baseline unit available in the marketplace.
For indirect, on-demand tankless and free-standing water heaters the baseline is a code-compliant gas-fired storage water heater with EF = 0.59. For condensing stand-alone water heaters, the assumed baseline is a stand-alone tank water heater with a thermal efficiency of 80%.587
High Efficiency
Condensing Stand-Alone: The high efficiency case is a condensing stand alone commercial water heater with a thermal efficiency of 95% or greater and a capacity between 75,000 Btu and 300,000 Btu. Free-Standing: The high efficiency case is an ENERGY STAR® gas-fired freestanding hot water heater with an Energy Factor of at least 0.67 and a nominal input of 75,000 BTU/hour. Indirect: The high efficiency scenario is an indirect water heater with a Combined Appliance Efficiency (CAE) of 85% or greater. On-Demand Tankless: The high efficiency equipment is a gas-fired instantaneous hot water heater with an Energy Factor of at least 0.82.
582 GDS Associates, Inc. (2009). Natural Gas Energy Efficiency Potential in Massachusetts. Prepared for GasNetworks; Page 2 of Appendix B-2, measure GDS C-WH-3. The GDS study references “ESource (2007). Gas Fired Water Heater Screening
Tool. http://www.esource.com/BEA/demo/PDF/P_PA_41.pdf. Accessed on 10/22/10; used 0.96 Thermal Efficiency and 250 gallons per day.” 583 GDS Associates, Inc. (2009). Natural Gas Energy Efficiency Potential in Massachusetts. Prepared for GasNetworks; Appendix B-2. 584 GDS Associates, Inc. (2009). Natural Gas Energy Efficiency Potential in Massachusetts. Prepared for GasNetworks; Page 2 of Appendix B-2, measure GDS C-WH-11. The GDS study references “ESource (2007). Gas Fired Water Heater Screening
Tool. http://www.esource.com/BEA/demo/PDF/P_PA_41.pdf. Accessed on 10/22/10; used 0.96 Thermal Efficiency and 250 gallons per day.” 585 GDS Associates, Inc. (2009). Natural Gas Energy Efficiency Potential in Massachusetts. Prepared for GasNetworks; Page 2 of Appendix B-2, measure GDS C-WH-5. The GDS study references “FEMP Calculator for Electric & Gas Water Heaters (assumes 64 gal/day) Base use =27.1 MMBTU.” 586 GDS Associates, Inc. (2009). Natural Gas Energy Efficiency Potential in Massachusetts. Prepared for GasNetworks; Page 2 of Appendix B-2, measure GDS C-WH-7. The GDS study references “FEMP Calculator for Electric & Gas Water Heaters (assumes 64 gal/day) Base use =25.3 MMBTU.” 587 Adapted from 2009 International Energy Conservation Code; Table 504.2.
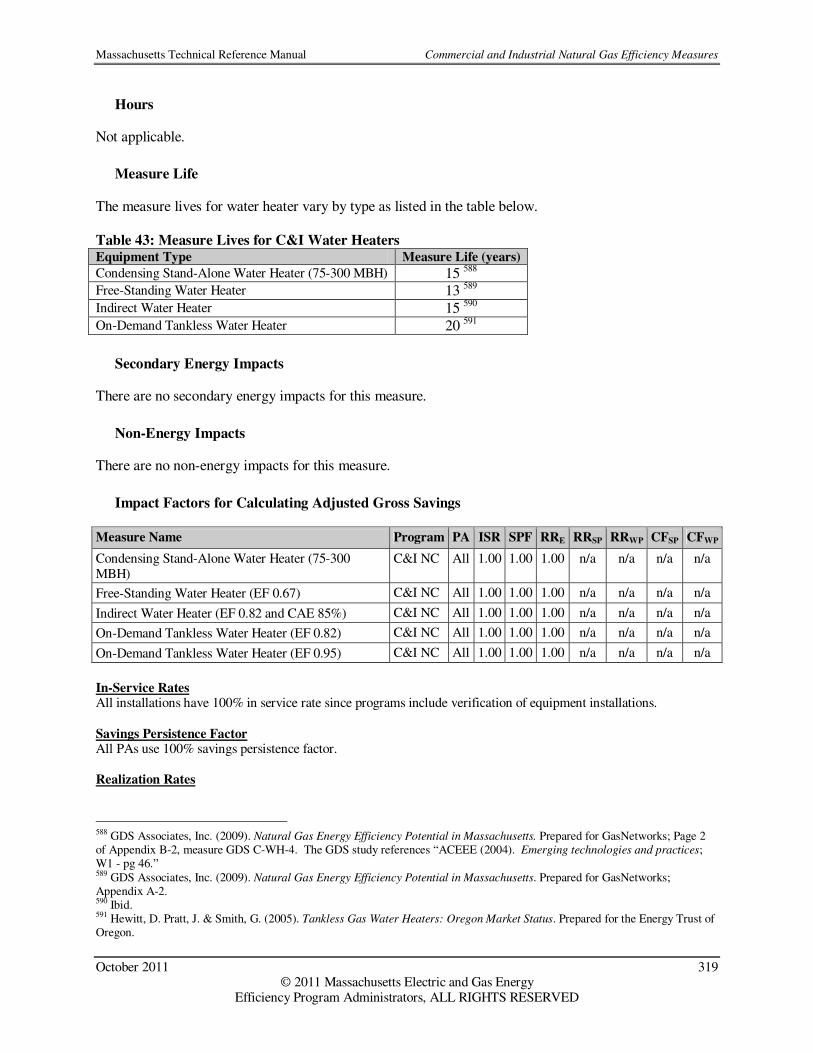
Massachusetts Technical Reference Manual Commercial and Industrial Natural Gas Efficiency Measures
October 2011 319 © 2011 Massachusetts Electric and Gas Energy
Efficiency Program Administrators, ALL RIGHTS RESERVED
Hours
Not applicable.
Measure Life
The measure lives for water heater vary by type as listed in the table below.
Table 43: Measure Lives for C&I Water Heaters Equipment Type Measure Life (years)
Condensing Stand-Alone Water Heater (75-300 MBH) 15 588
Free-Standing Water Heater 13 589
Indirect Water Heater 15 590
On-Demand Tankless Water Heater 20 591
Secondary Energy Impacts
There are no secondary energy impacts for this measure.
Non-Energy Impacts
There are no non-energy impacts for this measure.
Impact Factors for Calculating Adjusted Gross Savings
Measure Name Program PA ISR SPF RRE RRSP RRWP CFSP CFWP
Condensing Stand-Alone Water Heater (75-300 MBH)
C&I NC All 1.00 1.00 1.00 n/a n/a n/a n/a
Free-Standing Water Heater (EF 0.67) C&I NC All 1.00 1.00 1.00 n/a n/a n/a n/a
Indirect Water Heater (EF 0.82 and CAE 85%) C&I NC All 1.00 1.00 1.00 n/a n/a n/a n/a
On-Demand Tankless Water Heater (EF 0.82) C&I NC All 1.00 1.00 1.00 n/a n/a n/a n/a
On-Demand Tankless Water Heater (EF 0.95) C&I NC All 1.00 1.00 1.00 n/a n/a n/a n/a
In-Service Rates All installations have 100% in service rate since programs include verification of equipment installations. Savings Persistence Factor All PAs use 100% savings persistence factor. Realization Rates
588 GDS Associates, Inc. (2009). Natural Gas Energy Efficiency Potential in Massachusetts. Prepared for GasNetworks; Page 2 of Appendix B-2, measure GDS C-WH-4. The GDS study references “ACEEE (2004). Emerging technologies and practices; W1 - pg 46.” 589 GDS Associates, Inc. (2009). Natural Gas Energy Efficiency Potential in Massachusetts. Prepared for GasNetworks; Appendix A-2. 590 Ibid. 591 Hewitt, D. Pratt, J. & Smith, G. (2005). Tankless Gas Water Heaters: Oregon Market Status. Prepared for the Energy Trust of Oregon.

Massachusetts Technical Reference Manual Commercial and Industrial Natural Gas Efficiency Measures
October 2011 320 © 2011 Massachusetts Electric and Gas Energy
Efficiency Program Administrators, ALL RIGHTS RESERVED
All PAs use 100% energy realization rate. The summer and winter peak realization rates are not applicable for this measure since there are no electric savings claimed.
Coincidence Factors Not applicable for this measure since no electric savings are claimed.

Massachusetts Technical Reference Manual Commercial and Industrial Natural Gas Efficiency Measures
October 2011 321 © 2011 Massachusetts Electric and Gas Energy
Efficiency Program Administrators, ALL RIGHTS RESERVED
Hot Water – Pre-Rinse Spray Valve
Version Date and Revision History
Effective Date: 1/1/2011 End Date: TBD
Measure Overview
Description: Retrofitting existing standard spray nozzles in locations where service water is supplied by natural gas fired hot water heater with new low flow pre-rinse spray nozzles with an average flow rate of 1.6 GPM. Primary Energy Impact: Natural Gas Secondary Energy Impact: None Non-Energy Impact: C&I Water, C&I Sewer Sector: Commercial, Industrial Market: Retrofit End Use: Hot Water Program: C&I Retrofit, C&I Direct Install
Algorithms for Calculating Primary Energy Impact
Unit savings are deemed based on study results:
MMBtuMMBtu ∆=∆ Where: Unit = Installed pre-rinse spray valve ∆MMBtu = Average annual MMBtu savings per unit: 33.6 MMBtu592
Baseline Efficiency
The baseline efficiency case is a standard efficiency spray valve.
High Efficiency
The high efficiency case is a low flow pre-rinse spray valve with an average flow rate of 1.6 GPM.
Hours
Not applicable.
592 SBW Consulting, Inc. (2004). Evaluation, Measurement & Verification Report for the CUWCC Pre-Rinse Spray Head
Distribution Program. Prepared for the California Urban Water Conservation Council; Page 20, savings of 0.92 therms per day * 365 days per year = 335.8 therms.

Massachusetts Technical Reference Manual Commercial and Industrial Natural Gas Efficiency Measures
October 2011 322 © 2011 Massachusetts Electric and Gas Energy
Efficiency Program Administrators, ALL RIGHTS RESERVED
Measure Life
The measure life is 5 years.593
Secondary Energy Impacts
There are no secondary energy impacts for this measure.
Non-Energy Impacts
Benefit Type Description Savings594
C&I Water C&I water savings 62,305 gallons/unit
C&I Sewer C&I sewer water savings 62,305 gallons/unit
Impact Factors for Calculating Adjusted Gross Savings
Measure Name Program PA ISR SPF RRE RRSP RRWP CFSP CFWP
Pre-Rinse Spray Valve C&I Retrofit All 1.00 1.00 1.00 n/a n/a n/a n/a
Pre-Rinse Spray Valve C&I Direct Install All 1.00 1.00 1.00 n/a n/a n/a n/a
In-Service Rates All installations have 100% in service rate since programs include verification of equipment installations. Savings Persistence Factor All PAs use 100% savings persistence factor. Realization Rates
All PAs use 100% energy realization rate. The summer and winter peak realization rates are not applicable for this measure since there are no electric savings claimed. Coincidence Factors Not applicable for this measure since no electric savings are claimed.
593 Veritec Consulting (2005). Region of Waterloo Pre-Rinse Spray Valve Pilot Study, Final Report; Page 8. 594 SBW Consulting, Inc. (2004). Evaluation, Measurement & Verification Report for the CUWCC Pre-Rinse Spray Head
Distribution Program. Prepared for the California Urban Water Conservation Council; Page 18, savings based on assumptions of 2.24 gallons per minute flow rate, 1.27 hours per day, 365 days per year.

Massachusetts Technical Reference Manual Commercial and Industrial Natural Gas Efficiency Measures
October 2011 323 © 2011 Massachusetts Electric and Gas Energy
Efficiency Program Administrators, ALL RIGHTS RESERVED
Hot Water – Steam Traps
Version Date and Revision History
Effective Date: 1/1/2011 (revised for 1/1/2012) End Date: TBD
Measure Overview
Description: Repair or replace malfunctioning steam traps. Primary Energy Impact: Natural Gas Secondary Energy Impact: None Non-Energy Impact: None Sector: Commercial & Industrial Market: Retrofit End Use: HVAC Program: C&I Retrofit
Algorithms for Calculating Primary Energy Impact
Unit savings are deemed based on study results:
MMBtuMMBtu ∆=∆ Where: Unit = Repaired/replaced steam trap ∆MMBtu = Average annual MMBtu savings per unit: 25.7 MMBtu595
Baseline Efficiency
The baseline efficiency case is a failed steam trap.
High Efficiency
The high efficiency case is a repaired or replaced steam trap.
Hours
Not applicable.
595 National Grid 2008 based on historical steam trap surveys. Steam losses in lbs/hr are found using “Boiler Efficiency Institute (1987). Steam Efficiency Improvement.; Page 34, Table 4.1 under Steam Leak Rate Through Holes. Average loss rate for all trap sizes 1/32” to 1/4” for low steam pressures (5 psig and 10 psig) and high pressures (50 psig and 100 psig). Assume trap failure effective for 540 EFLH per year. Determine to equivalent therms per year and factor for frequency encountered = [80% * (78.50 + 111.46)/2] + [20% * (1,108.04 + 1,982.18)/2] = 385.01 BTU/trap-year. Assume that 50% of traps fail in the open position and savings is grossed up by the efficiency of the boiler supplying the steam of (inverse of 75%). Net savings is 257 therms per trap.

Massachusetts Technical Reference Manual Commercial and Industrial Natural Gas Efficiency Measures
October 2011 324 © 2011 Massachusetts Electric and Gas Energy
Efficiency Program Administrators, ALL RIGHTS RESERVED
Measure Life
The measure life is 3 year.596
Secondary Energy Impacts
There are no secondary energy impacts for this measure.
Non-Energy Impacts
There are no non-energy impacts for this measure.
Impact Factors for Calculating Adjusted Gross Savings
Measure Name Program PA ISR SPF RRE RRSP RRWP CFSP CFWP
Steam Traps All C&I Retrofit 1.00 1.00 1.00 n/a n/a n/a n/a
In-Service Rates All installations have 100% in service rate since programs include verification of equipment installations. Savings Persistence Factor All PAs use 100% savings persistence factor. Realization Rates
All PAs use 100% energy realization rate. The summer and winter peak realization rates are not applicable for this measure since there are no electric savings claimed.
Coincidence Factors Not applicable for this measure since no electric savings are claimed.
596 Massachusetts Common Assumption. Most sources suggest a measure life or equipment life of five years. Massachusetts PAs have traditionally taken equipment life and applied a factor to account for measure persistence when determining measure life.

Massachusetts Technical Reference Manual Commercial and Industrial Natural Gas Efficiency Measures
October 2011 325 © 2011 Massachusetts Electric and Gas Energy
Efficiency Program Administrators, ALL RIGHTS RESERVED
Hot Water – Low-Flow Shower Heads
Version Date and Revision History
Effective Date: 1/1/2011 End Date: TBD
Measure Overview
Description: Installation of a low flow showerhead with a flow rate of 1.5 GPM or less in a commercial setting with service water heated by natural gas. Primary Energy Impact: Natural Gas Secondary Energy Impact: None Non-Energy Impact: C&I Water, C&I Sewer Sector: Commercial Market: Retrofit End Use: Hot water Program: C&I Direct Install, C&I Retrofit
Algorithms for Calculating Primary Energy Impact
Unit savings are deemed based on study results:
MMBtuMMBtu ∆=∆ Where: Unit = Installed low-flow shower head.
∆MMBtu = Average annual MMBtu savings per unit: 5.2 MMBtu597
Baseline Efficiency
The baseline efficiency case is a 2.5 GPM showerhead.
High Efficiency
The high efficiency case is a 1.5 GPM showerhead.
Hours
The savings estimates for this measure are determined empirically in terms of units installed and so the equivalent heating full load hours are not directly used, however, the calculator used to determine the deemed savings uses a default operation of 20 minutes a day, 365 days a year.
597 GDS Associates, Inc. (2009). Natural Gas Energy Efficiency Potential in Massachusetts. Prepared for GasNetworks; Table B-2a, measure C-WH-15.

Massachusetts Technical Reference Manual Commercial and Industrial Natural Gas Efficiency Measures
October 2011 326 © 2011 Massachusetts Electric and Gas Energy
Efficiency Program Administrators, ALL RIGHTS RESERVED
Measure Life
The measure life is 10 years.598
Secondary Energy Impacts
There are no secondary energy impacts for this measure.
Non-Energy Impacts
Benefit Type Description Savings599
C&I Water C&I water savings 7,300 gallons/unit
C&I Sewer C&I sewer water savings 7,300 gallons/unit
Impact Factors for Calculating Adjusted Gross Savings
Measure Name Program PA ISR SPF RRE RRSP RRWP CFSP CFWP
Low-Flow Shower Heads C&I Direct Install All 1.00 1.00 1.00 n/a n/a n/a n/a
In-Service Rates All installations have 100% in service rate since programs include verification of equipment installations. Savings Persistence Factor All PAs use 100% savings persistence factor. Realization Rates
All PAs use 100% energy realization rate. The summer and winter peak realization rates are not applicable for this measure since there are no electric savings claimed.
Coincidence Factors Not applicable for this measure since no electric savings are claimed.
598 GDS Associates, Inc. (2009). Natural Gas Energy Efficiency Potential in Massachusetts. Prepared for GasNetworks; Table B-2a, measure C-WH-15. 599 US DOE-Federal Energy Management Program (FEMP): Energy Cost Calculator for Faucets and Showerheads. Accessed 9/13/2011.

Massachusetts Technical Reference Manual Commercial and Industrial Natural Gas Efficiency Measures
October 2011 327 © 2011 Massachusetts Electric and Gas Energy
Efficiency Program Administrators, ALL RIGHTS RESERVED
Hot Water – Faucet Aerator
Version Date and Revision History
Effective Date: 1/1/2011 End Date: TBD
Measure Overview
Description: Installation of a faucet aerator with a flow rate of 1.5 GPM or less on an existing faucet with high flow in a commercial setting with service water heated by natural gas. Primary Energy Impact: Natural Gas Secondary Energy Impact: None Non-Energy Impact: C&I Water, C&I Sewer Sector: Commercial Market: Retrofit End Use: Hot water Program: C&I Direct Install, C&I Retrofit
Algorithms for Calculating Primary Energy Impact
Unit savings are deemed based on study results:
MMBtuMMBtu ∆=∆ Where: Unit = Installed faucet aerator
∆MMBtu = Average annual MMBtu savings per unit: 1.7 MMBtu600
Baseline Efficiency
The baseline efficiency case is a 2.2 GPM faucet.
High Efficiency
The high efficiency case is a faucet with 1.5 GPM or less aerator installed.
Hours
The savings estimates for this measure are determined empirically in terms of units installed and so the equivalent heating full load hours are not directly used, however, the calculator used to determine the deemed savings uses a default operation of 30 minutes a day, 260 days a year.
600 GDS Associates, Inc. (2009). Natural Gas Energy Efficiency Potential in Massachusetts. Prepared for GasNetworks; Table B-2a, measure C-WH-16.

Massachusetts Technical Reference Manual Commercial and Industrial Natural Gas Efficiency Measures
October 2011 328 © 2011 Massachusetts Electric and Gas Energy
Efficiency Program Administrators, ALL RIGHTS RESERVED
Measure Life
The measure life is 10 years.601
Secondary Energy Impacts
There are no secondary energy impacts for this measure.
Non-Energy Impacts
Benefit Type Description Savings602
C&I Water C&I water savings 5,460 gallons/unit
C&I Sewer C&I sewer water savings 5,460 gallons/unit
Impact Factors for Calculating Adjusted Gross Savings
Measure Name Program PA ISR SPF RRE RRSP RRWP CFSP CFWP
Faucet Aerator C&I Direct Install All 1.00 1.00 1.00 1.00 1.00 n/a n/a
In-Service Rates All installations have 100% in service rate since programs include verification of equipment installations. Savings Persistence Factor All PAs use 100% savings persistence factor. Realization Rates
All PAs use 100% energy realization rate. The summer and winter peak realization rates are not applicable for this measure since there are no electric savings claimed.
Coincidence Factors Not applicable for this measure since no electric savings are claimed.
601 GDS Associates, Inc. (2009). Natural Gas Energy Efficiency Potential in Massachusetts. Prepared for GasNetworks; Table B-2a, measure C-WH-16. 602 US DOE-Federal Energy Management Program (FEMP): Energy Cost Calculator for Faucets and Showerheads. Accessed 9/13/2011.

Massachusetts Technical Reference Manual Commercial and Industrial Natural Gas Efficiency Measures
October 2011 329 © 2011 Massachusetts Electric and Gas Energy
Efficiency Program Administrators, ALL RIGHTS RESERVED
Food Service – Commercial Ovens
Version Date and Revision History
Effective Date: 1/1/2011 (revised for 1/1/2012) End Date: TBD
Measure Overview
Description: Installation of High Efficiency Gas Ovens Primary Energy Impact: Natural Gas Secondary Energy Impact: None Non-Energy Impact: Water Sector: Commercial & Industrial Market: Lost Opportunity End Use: Process Program: C&I New Construction & Major Renovation
Algorithms for Calculating Primary Energy Impact
Unit savings are deemed based on study results:
MMBtuMMBtu ∆=∆ Where: Unit = Installed high efficiency gas oven ∆MMBtu = Average annual MMBtu savings per unit. See Table 44 for values.
Table 44: Baseline and High Efficiency Ratings and Savings for C&I Ovens Equipment Type Baseline Efficiency Efficiency Requirement ∆MMBtu
Gas-Fired Convection Oven 30% >= 44% 24.8603 Gas-Fired Combination Oven 35% >= 44% 110.3 604 Gas-Fired Conveyer Oven 20% Heavy Load >= 44% 84.5605 Gas-Fired Rack Oven 30% >= 50% 211.3606
Baseline Efficiency
The baseline efficiency case is a standard efficiency oven. See Table 44 for values by oven type.
603 Consortium for Energy Efficiency (2008). Technology Opportunity Assessment: Convection Ovens; Page 5. 604 Food Service Technology Center (2010). Gas Combination Oven Life-Cycle Cost Calculator. http://www.fishnick.com/saveenergy/tools/calculators/gcombicalc.php. Accessed 9/6/11. 605 Food Service Technology Center (2010). Gas Conveyor Oven Life-Cycle Cost Calculator. http://www.fishnick.com/saveenergy/tools/calculators/gconvovencalc.php. Accessed 6/10/10. 606 Food Service Technology Center (2010). Gas Conveyor Oven Life-Cycle Cost Calculator. http://www.fishnick.com/saveenergy/tools/calculators/grackovencalc.php. Accessed 6/10/10.

Massachusetts Technical Reference Manual Commercial and Industrial Natural Gas Efficiency Measures
October 2011 330 © 2011 Massachusetts Electric and Gas Energy
Efficiency Program Administrators, ALL RIGHTS RESERVED
High Efficiency
High efficiency case is an oven that meets or exceeds the high efficiency ratings per oven type shown in Table 44.
Hours
Not applicable.
Measure Life
The measure life is 12 years for all commercial ovens. 607
Secondary Energy Impacts
There are no secondary energy impacts for this measure.
Non-Energy Impacts
43,800 Gallons of water608 for the combination oven
Impact Factors for Calculating Adjusted Gross Savings
Measure Name Program PA ISR SPF RRE RRSP RRWP CFSP CFWP
Gas-Fired Convection Oven (>=40%) C&I NC All 1.00 1.00 1.00 n/a n/a n/a n/a
Gas-Fired Combination Oven (>=40%) C&I NC All 1.00 1.00 1.00 n/a n/a n/a n/a
Gas-Fired Conveyer Oven (>=40%) C&I NC All 1.00 1.00 1.00 n/a n/a n/a n/a
Gas-Fired Rack Oven (>=50%) C&I NC All 1.00 1.00 1.00 n/a n/a n/a n/a
In-Service Rates All installations have 100% in service rate since programs include verification of equipment installations. Savings Persistence Factor All PAs use 100% savings persistence factor. Realization Rates
All PAs use 100% energy realization rate. The summer and winter peak realization rates are not applicable for this measure since there are no electric savings claimed.
Coincidence Factors Not applicable for this measure since no electric savings are claimed.
607 Food Service Technology Center (2010). Gas Combination Oven Life-Cycle Cost Calculator. http://www.fishnick.com/saveenergy/tools/calculators/gcombicalc.php. Accessed 6/10/10. AND Food Service Technology Center (2009). Gas Rack Oven Life-Cycle Cost Calculator. http://www.fishnick.com/saveenergy/tools/calculators/grackovencalc.php. Accessed on 6/10/10. 608 Food Service Technology Center (2010). Gas Combination Oven Life-Cycle Cost Calculator. http://www.fishnick.com/saveenergy/tools/calculators/gcombicalc.php. Accessed 9/6/11.

Massachusetts Technical Reference Manual Commercial and Industrial Natural Gas Efficiency Measures
October 2011 331 © 2011 Massachusetts Electric and Gas Energy
Efficiency Program Administrators, ALL RIGHTS RESERVED
Food Service – Commercial Griddle
Version Date and Revision History
Effective Date: 1/1/2011 End Date: TBD
Measure Overview
Description: Installation of a gas griddle with an efficiency of 38%. Primary Energy Impact: Natural Gas Secondary Energy Impact: None Non-Energy Impact: None Sector: Commercial & Industrial Market: Lost Opportunity End Use: Process Program: C&I New Construction & Major Renovation
Algorithms for Calculating Primary Energy Impact
Unit savings are deemed based on study results:
MMBtuMMBtu ∆=∆ Where: Unit = Installed high efficiency gas griddle. ∆MMBtu = Average annual MMBtu savings per unit: 18.5 MMBtu609
Baseline Efficiency
The baseline efficiency case is a standard efficiency (30% efficient) gas griddle.
High Efficiency
The high efficiency case is a gas griddle with an efficiency of 38%.
Hours
Not applicable.
Measure Life
The measure life is 12 years.610
609 Food Service Technology Center (2010). Gas Griddle Life-Cycle Cost Calculator. http://www.fishnick.com/saveenergy/tools/calculators/ggridcalc.php. Accessed on 10/22/10. 610 Ibid.

Massachusetts Technical Reference Manual Commercial and Industrial Natural Gas Efficiency Measures
October 2011 332 © 2011 Massachusetts Electric and Gas Energy
Efficiency Program Administrators, ALL RIGHTS RESERVED
Secondary Energy Impacts
There are no secondary energy impacts for this measure.
Non-Energy Impacts
There are no non-energy impacts for this measure.
Impact Factors for Calculating Adjusted Gross Savings
Measure Name Program PA ISR SPF RRE RRSP RRWP CFSP CFWP
Gas-Fired Griddle C&I NC All 1.00 1.00 1.00 n/a n/a n/a n/a
In-Service Rates All installations have 100% in service rate since programs include verification of equipment installations. Savings Persistence Factor All PAs use 100% savings persistence factor. Realization Rates
All PAs use 100% energy realization rate. The summer and winter peak realization rates are not applicable for this measure since there are no electric savings claimed.
Coincidence Factors Not applicable for this measure since no electric savings are claimed.
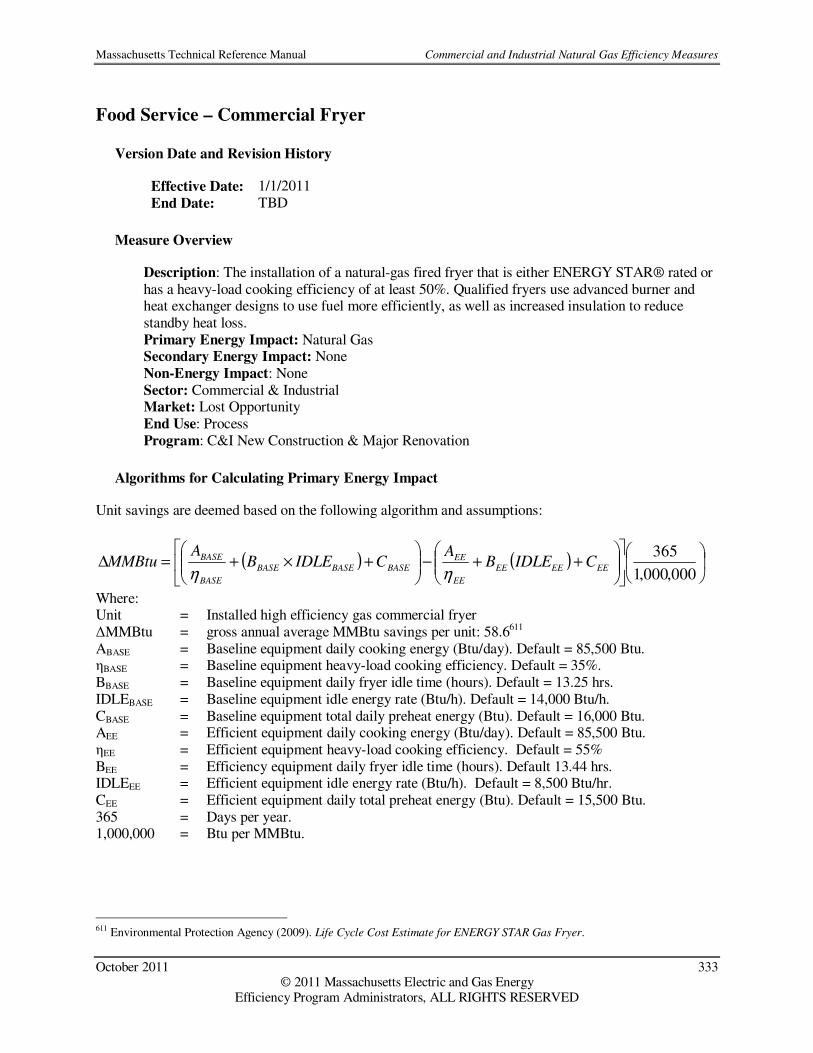
Massachusetts Technical Reference Manual Commercial and Industrial Natural Gas Efficiency Measures
October 2011 333 © 2011 Massachusetts Electric and Gas Energy
Efficiency Program Administrators, ALL RIGHTS RESERVED
Food Service – Commercial Fryer
Version Date and Revision History
Effective Date: 1/1/2011 End Date: TBD
Measure Overview
Description: The installation of a natural-gas fired fryer that is either ENERGY STAR® rated or has a heavy-load cooking efficiency of at least 50%. Qualified fryers use advanced burner and heat exchanger designs to use fuel more efficiently, as well as increased insulation to reduce standby heat loss. Primary Energy Impact: Natural Gas Secondary Energy Impact: None Non-Energy Impact: None Sector: Commercial & Industrial Market: Lost Opportunity End Use: Process Program: C&I New Construction & Major Renovation
Algorithms for Calculating Primary Energy Impact
Unit savings are deemed based on the following algorithm and assumptions:
( ) ( )
++−
+×+=∆
000,000,1
365EEEEEE
EE
EE
BASEBASEBASE
BASE
BASE CIDLEBA
CIDLEBA
MMBtuηη
Where: Unit = Installed high efficiency gas commercial fryer ∆MMBtu = gross annual average MMBtu savings per unit: 58.6611 ABASE = Baseline equipment daily cooking energy (Btu/day). Default = 85,500 Btu. ηBASE = Baseline equipment heavy-load cooking efficiency. Default = 35%. BBASE = Baseline equipment daily fryer idle time (hours). Default = 13.25 hrs. IDLEBASE = Baseline equipment idle energy rate (Btu/h). Default = 14,000 Btu/h. CBASE = Baseline equipment total daily preheat energy (Btu). Default = 16,000 Btu. AEE = Efficient equipment daily cooking energy (Btu/day). Default = 85,500 Btu. ηEE = Efficient equipment heavy-load cooking efficiency. Default = 55% BEE = Efficiency equipment daily fryer idle time (hours). Default 13.44 hrs. IDLEEE = Efficient equipment idle energy rate (Btu/h). Default = 8,500 Btu/hr. CEE = Efficient equipment daily total preheat energy (Btu). Default = 15,500 Btu. 365 = Days per year. 1,000,000 = Btu per MMBtu.
611 Environmental Protection Agency (2009). Life Cycle Cost Estimate for ENERGY STAR Gas Fryer.

Massachusetts Technical Reference Manual Commercial and Industrial Natural Gas Efficiency Measures
October 2011 334 © 2011 Massachusetts Electric and Gas Energy
Efficiency Program Administrators, ALL RIGHTS RESERVED
Baseline Efficiency
The baseline efficiency case is a typical low-efficiency gas-fired fryer with 35% cooking efficiency, 16,000 Btu preheat energy, 14,000 Btu/h Idle Energy Rate, 60 lbs/h production capacity612.
High Efficiency
The high efficiency case cooking efficiency and Idle Energy Rate are site specific and can be determined on a case-by-case basis. To simplify the savings algorithm, typical values for food load (150 lbs/day) and preheat energy (15,500 Btu) are assumed.
Hours
Not applicable.
Measure Life
The measure life is 12 years.613
Secondary Energy Impacts
There are no secondary energy impacts for this measure.
Non-Energy Impacts
There are no non-energy impacts for this measure.
Impact Factors for Calculating Adjusted Gross Savings
Measure Name Program PA ISR SPF RRE RRSP RRWP CFSP CFWP
Gas-Fired Commercial Fryer C&I NC All 1.00 1.00 1.00 n/a n/a n/a n/a
In-Service Rates All installations have 100% in service rate since programs include verification of equipment installations. Savings Persistence Factor All PAs use 100% savings persistence factor. Realization Rates
All PAs use 100% energy realization rate. The summer and winter peak realization rates are not applicable for this measure since there are no electric savings claimed.
Coincidence Factors Not applicable for this measure since no electric savings are claimed.
612 Food Service Technology Center (2010). Gas Fryer Life-Cycle Cost Calculator. http://www.fishnick.com/saveenergy/tools/calculators/gfryercalc.php. Accessed on 10/19/2010. 613 Ibid.
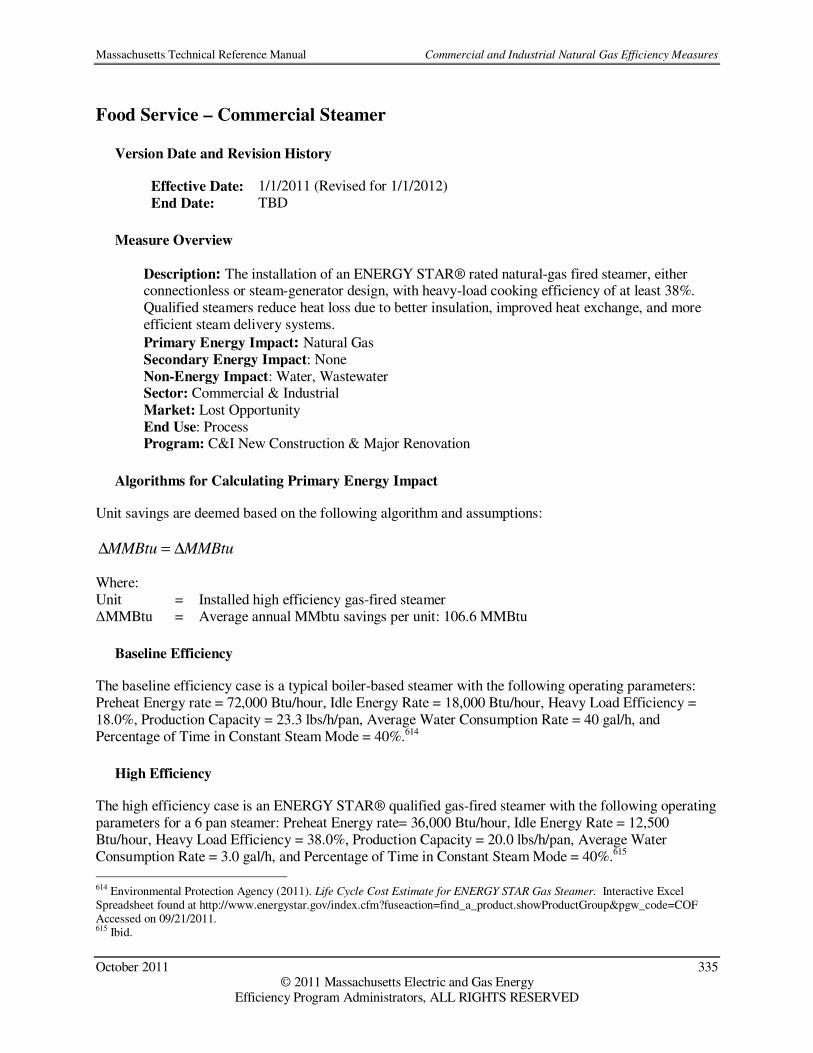
Massachusetts Technical Reference Manual Commercial and Industrial Natural Gas Efficiency Measures
October 2011 335 © 2011 Massachusetts Electric and Gas Energy
Efficiency Program Administrators, ALL RIGHTS RESERVED
Food Service – Commercial Steamer
Version Date and Revision History
Effective Date: 1/1/2011 (Revised for 1/1/2012) End Date: TBD
Measure Overview
Description: The installation of an ENERGY STAR® rated natural-gas fired steamer, either connectionless or steam-generator design, with heavy-load cooking efficiency of at least 38%. Qualified steamers reduce heat loss due to better insulation, improved heat exchange, and more efficient steam delivery systems.
Primary Energy Impact: Natural Gas Secondary Energy Impact: None Non-Energy Impact: Water, Wastewater Sector: Commercial & Industrial Market: Lost Opportunity End Use: Process Program: C&I New Construction & Major Renovation
Algorithms for Calculating Primary Energy Impact
Unit savings are deemed based on the following algorithm and assumptions:
MMBtuMMBtu ∆=∆ Where: Unit = Installed high efficiency gas-fired steamer ∆MMBtu = Average annual MMbtu savings per unit: 106.6 MMBtu
Baseline Efficiency
The baseline efficiency case is a typical boiler-based steamer with the following operating parameters: Preheat Energy rate = 72,000 Btu/hour, Idle Energy Rate = 18,000 Btu/hour, Heavy Load Efficiency = 18.0%, Production Capacity = 23.3 lbs/h/pan, Average Water Consumption Rate = 40 gal/h, and Percentage of Time in Constant Steam Mode = 40%.614
High Efficiency
The high efficiency case is an ENERGY STAR® qualified gas-fired steamer with the following operating parameters for a 6 pan steamer: Preheat Energy rate= 36,000 Btu/hour, Idle Energy Rate = 12,500 Btu/hour, Heavy Load Efficiency = 38.0%, Production Capacity = 20.0 lbs/h/pan, Average Water Consumption Rate = 3.0 gal/h, and Percentage of Time in Constant Steam Mode = 40%.615
614 Environmental Protection Agency (2011). Life Cycle Cost Estimate for ENERGY STAR Gas Steamer. Interactive Excel Spreadsheet found at http://www.energystar.gov/index.cfm?fuseaction=find_a_product.showProductGroup&pgw_code=COF Accessed on 09/21/2011. 615 Ibid.

Massachusetts Technical Reference Manual Commercial and Industrial Natural Gas Efficiency Measures
October 2011 336 © 2011 Massachusetts Electric and Gas Energy
Efficiency Program Administrators, ALL RIGHTS RESERVED
Hours
The deemed savings assumes 4,380 annual operating hours (12 hours a day * 365 days/year).616
Measure Life
The measure life is 12 years.617
Secondary Energy Impacts
There are no secondary energy impacts for this measure.
Non-Energy Impacts
Benefit Type Description Savings618
C&I Water C&I Water Savings 162,060 gallons/unit
C&I Wastewater C&I Wastewater Savings 162,060 gallons/unit
Impact Factors for Calculating Adjusted Gross Savings
Measure Name Program PA ISR SPF RRE RRSP RRWP CFSP CFWP
Gas-Fired Steamer C&I NC All 1.00 1.00 1.00 1.00 1.00 n/a n/a
In-Service Rates All installations have 100% in service rate since programs include verification of equipment installations. Savings Persistence Factor All PAs use 100% savings persistence factor. Realization Rates
All PAs use 100% energy realization rate. The summer and winter peak realization rates are not applicable for this measure since there are no electric savings claimed.
Coincidence Factors Not applicable for this measure since no electric savings are claimed.
616 Ibid 617 Ibid. 618 Ibid.

Massachusetts Technical Reference Manual Commercial and Industrial Natural Gas Efficiency Measures
October 2011 337 © 2011 Massachusetts Electric and Gas Energy
Efficiency Program Administrators, ALL RIGHTS RESERVED
Custom Measures
Version Date and Revision History
Effective Date: 1/1/2011 (revised for 1/1/2012) End Date: TBD
Measure Overview
Description: The Custom project track is offered for energy efficiency projects involving complex site-specific applications that require detailed engineering analysis and/or projects which do not qualify for incentives under any of the prescriptive rebate offering. Projects offered through the custom approach must pass a cost-effectiveness test based on project-specific costs and savings. Primary Energy Impact: Natural Gas (Heating, Water Heating, or All) Secondary Energy Impact: Project Specific Non-Energy Impact: Project Specific Sector: Commercial & Industrial Market: Lost Opportunity, Retrofit End Use: All Program: All
Algorithms for Calculating Primary Energy Impact
Gross energy and demand savings estimates for custom projects are calculated using engineering analysis and project-specific details. Custom analyses typically include a weather dependent load bin analysis, whole building energy model simulation, or other engineering analysis and include estimates of savings, costs, and an evaluation of the project’s cost-effectiveness.
Baseline Efficiency
For Lost Opportunity projects, the baseline efficiency case assumes compliance with the efficiency requirements as mandated by Massachusetts State Building Code or industry accepted standard practice. For retrofit projects, the baseline efficiency case is the same as the existing, or pre-retrofit, case for the facility.
High Efficiency
The high efficiency scenario is specific to the custom project and may include one or more energy efficiency measures. Energy and demand savings calculations are based on projected changes in equipment efficiencies and operating characteristics and are determined on a case-by-case basis. The project must be proven cost-effective in order to qualify for energy efficiency incentives.
Hours
All hours for custom savings analyses should be determined on a case-by-case basis.

Massachusetts Technical Reference Manual Commercial and Industrial Natural Gas Efficiency Measures
October 2011 338 © 2011 Massachusetts Electric and Gas Energy
Efficiency Program Administrators, ALL RIGHTS RESERVED
Measure Life
For both lost-opportunity and retrofit custom applications, the measure life is determined on a case-by-case basis.
Secondary Energy Impacts
All secondary energy impacts should be determined on a case-by-case basis.
Non-Energy Impacts
All non-energy impacts should be determined on a case-by-case basis.
Impact Factors for Calculating Adjusted Gross Savings
Measure Program PA ISR SPF RRE RRSP RRWP CFSP CFWP
Custom NC NC Statewide 1.00 1.00 0.88 n/a n/a n/a n/a
Custom NC NC National Grid 1.00 1.00 0.75 n/a n/a n/a n/a
Custom NC NC Columbia Gas 1.00 1.00 1.09 n/a n/a n/a n/a Custom Retrofit Retrofit Statewide 1.00 1.00 0.88 n/a n/a n/a n/a Custom Retrofit Retrofit National Grid 1.00 1.00 0.75 n/a n/a n/a n/a Custom Retrofit Retrofit Columbia Gas 1.00 1.00 1.09 n/a n/a n/a n/a
In-Service Rates All installations have 100% in service rate since programs include verification of equipment installations. Savings Persistence Factor All PAs use 100% savings persistence factor. Realization Rates Realization rates are from 2011 impact evaluation of Custom Gas installations619. National Grid and Columbia Gas use PA-specific results; all other PAs use the statewide result. Coincidence Factors Not applicable for this measure since no electric savings are claimed.
619 KEMA, Itron and ERS (2011). Impact Evaluation of 2009 Custom Gas Installations. Prepared for Massachusetts Energy Efficiency Program Administrators and Massachusetts Energy Efficiency Advisory Council; See Table 4-4 and Table 4-5.

Massachusetts Technical Reference Manual Appendices
October 2011 339 © 2011 Massachusetts Electric and Gas Energy
Efficiency Program Administrators, ALL RIGHTS RESERVED
Appendices

Massachusetts Technical Reference Manual Appendix A: Common Lookup Tables
October 2011 340 © 2011 Massachusetts Electric and Gas Energy
Efficiency Program Administrators, ALL RIGHTS RESERVED
Appendix A: Common Lookup Tables
Table 45: Lighting Power Densities Using the Building Area Method (WATTSb,i)
620
Building Area Type Lighting Power Density (W/ft2)
Automotive Facility 0.9
Convention Center 1.2
Court House 1.2
Dining: Bar Lounge/Leisure 1.3
Dining: Cafeteria/Fast Food 1.4
Dining: Family 1.6
Dormitory 1.0
Exercise Center 1.0
Gymnasium 1.1
Healthcare-Clinic 1.0
Hospital 1.2
Hotel 1.0
Library 1.3
Manufacturing Facility 1.3
Motel 1.0
Motion Picture Theatre 1.2
Multi-Family 0.7
Museum 1.1
Office 1.0
Parking Garage 0.3
Penitentiary 1.0
Performing Arts Theatre 1.6
Police/Fire Station 1.0
Post Office 1.1
Religious Building 1.3
Retail 1.5
School/University 1.2
Sports Arena 1.1
Town Hall 1.1
Transportation 1.0
Warehouse 0.8
Workshop 1.4
620 IECC 2009 Lighting Provisions, Section 505 Electrical Power and Lighting Systems, Table 505.5.2 Interior Lighting Power Allowances, Lighting provisions pgs.5-6.

Massachusetts Technical Reference Manual Appendix A: Common Lookup Tables
October 2011 341 © 2011 Massachusetts Electric and Gas Energy
Efficiency Program Administrators, ALL RIGHTS RESERVED
Table 46: Lighting Power Densities Using the Space-by-Space Method (WATTSb,i)621
Common Space Types Lighting Power
Density (W/ft2)
Office – Enclosed 1.1
Office - Open Plan 1.1
Conference/Meeting/Multipurpose 1.3
Classroom/Lecture/Training 1.4
For Penitentiary 1.3
Lobby 1.3
For Hotel 1.1
For Performing Arts Theater 3.3
For Motion Picture Theater 1.1
Audience/Seating Area 0.9
For Gymnasium 0.4
For Exercise Center 0.3
For Convention Center 0.7
For Penitentiary 0.7
For Religious Buildings 1.7
For Sports Arena 0.4
For Performing Arts Theater 2.6
For Motion Picture Theater 1.2
For Transportation 0.5
Atrium - First Three Floors 0.6
Atrium - Each Additional Floor 0.2
Lounge/Recreation 1.2
For Hospital 0.8
Dining Area 0.9
For Penitentiary 1.3
For Hotel 1.3
For Motel 1.2
For Bar Lounge/Leisure Dining 1.4
For Family Dining 2.1
Food Preparation 1.2
Laboratory 1.4
Restrooms 0.9
Dressing/Locker/Fitting Room 0.6
Corridor/Transition 0.5
For Hospitals 1.0
For Manufacturing Facilities 0.5
Stairs – Active 0.6
Active Storage 0.8
For Hospital 0.9
Inactive Storage 0.3
For Museum 0.8
Electrical/Mechanical 1.5
621 ASHRAE 90.1-2007 Energy Standard for Building Except Low-Rise Residential Buildings, Table 9.6.1, pp.63-64.

Massachusetts Technical Reference Manual Appendix A: Common Lookup Tables
October 2011 342 © 2011 Massachusetts Electric and Gas Energy
Efficiency Program Administrators, ALL RIGHTS RESERVED
Common Space Types Lighting Power
Density (W/ft2)
Gymnasium/Exercise Center
Exercise Area 0.9
Playing Area 1.4
Court House/Police Station/Penitentiary
Courtroom 1.9
Confinement Cells 0.9
Judges Chambers 1.3
Fire Stations
Engine Room 0.8
Sleeping Quarters 0.3
Post Office – Sorting Area 1.2
Convention Center - Exhibit Space 1.3
Library
Card File and Cataloging 1.1
Stacks 1.7
Reading Area 1.2
Hospital
Emergency 2.7
Recovery 0.8
Nurses' Station 1.0
Exam/Treatment 1.5
Pharmacy 1.2
Patient Room 0.7
Operating Room 2.2
Nursery 0.6
Medical Supply 1.4
Physical Therapy 0.9
Radiology 0.4
Laundry-Washing 0.6
Automobile - Service/Repair 0.7
Manufacturing
Low Bay (< 25 ft. Floor to Ceiling Height) 1.2
High Bay (≥ 25 ft. Floor to Ceiling Height) 1.7
Detailed Manufacturing 2.1
Equipment Room 1.2
Control Room 0.5
Hotel/Motel Guest Rooms 1.1
Dormitory - Living Quarters 1.1
Museum
General Exhibition 1.0
Restoration 1.7
Bank/Office - Banking Activity Areas 1.5
Workshop 1.9
Sales Area [for accent lighting, see Section 9.6.2(b)] 1.7
Religious Buildings
Worship Pulpit, Choir 2.4

Massachusetts Technical Reference Manual Appendix A: Common Lookup Tables
October 2011 343 © 2011 Massachusetts Electric and Gas Energy
Efficiency Program Administrators, ALL RIGHTS RESERVED
Common Space Types Lighting Power
Density (W/ft2)
Fellowship Hall 0.9
Retail
Sales Area [for accent lighting, see Section 9.6.3(c)] 1.7
Mall Concourse 1.7
Sports Arena
Ring Sports Arena 2.7
Court Sports Arena 2.3
Indoor Playing Field Area 1.4
Warehouse
Fine Material Storage 1.4
Medium/Bulky Material Storage 0.9
Parking Garage - Garage Area 0.2
Transportation
Airport – Concourse 0.6
Airport/Train/Bus - Baggage Area 1.0
Terminal - Ticket Counter 1.5

Massachusetts Technical Reference Manual Appendix A: Common Lookup Tables
October 2011 344 © 2011 Massachusetts Electric and Gas Energy
Efficiency Program Administrators, ALL RIGHTS RESERVED
Table 47: MassSAVE New Construction Proposed Lighting Wattage Tables
2012 MassSAVE C&I Lighting Rated Wattage Tables developed by Lighting Worksheet Team
Device
Code Device Description
Rated
Watts
LED Exit Signs
1E0002 2.0 WATT LED 2
1E0003 3.0 WATT LED 3
1E0005 5.0 WLED 5
1E0005C 0.5 WATT LEC 0.5
1E0008 8.0 WLED 8
1E0015 1.5 WATT LED 1.5
1E0105 10.5 WATT LED 10.5
Compact Fluorescents (CFL’s)
2C0007S 2/7W COMPACT HW 18
1C0005S 5W COMPACT HW 7
1C0007S 7W COMPACT HW 9
1C0009S 9W COMPACT HW 11
1C0011S 11W COMPACT HW 13
1C0013S 13W COMPACT HW 15
1C0018E 18W COMPACT HW ELIG 20
1C0018S 18W COMPACT HW 20
1C0022S 22W COMPACT HW 24
1C0023E 1/23W COMPACT HW ELIG 25
1C0026E 26W COMPACT HW ELIG 28
1C0026S 26W COMPACT HW 28
1C0028S 28W COMPACT HW 30
1C0032E 32W COMPACT HW ELIG 34
1C0032S 32W CIRCLINE HW 34
1C0042E 1/42W COMPACT HW ELIG 48
1C0044S 44W CIRCLINE HW 46
1C0057E 1/57W COMPACT HW ELIG 65
1C2232S 22/32W CIRCLINE HW 58
1C2D10E 10W 2D COMPACT HW ELIG 12
1C2D16E 16W 2D COMPACT HW ELIG 18
1C2D21E 21W 2D COMPACT HW ELIG 22
1C2D28E 28W 2D COMPACT HW ELIG 28
1C2D38E 38W 2D COMP.HW ELIG 36
1C3240S 32/40W CIRCLINE HW 80
2C0005S 2/5W COMPACT HW 14
2C0009S 2/9W COMPACT HW 22
2C0011S 2/11W COMPACT HW 26
2C0013E 2/13W COMPACT HW ELIG 28
2C0013S 2/13W COMPACT HW 30
2C0018E 2/18W COMP. HW ELIG 40
2C0026E 2/26W COMP. HW ELIG 54
2C0032E 2/32W COMPACT HW ELIG 68
Device Device Description Rated
Code Watts
Compact Fluorescents (CFL’s) (cont)
2C0042E 2/42W COMPACT HW ELIG 100
3C0009S 3/9W COMPACT HW 33
3C0013S 3/13W COMPACT HW 45
3C0018E 3/18W COMPACT HW ELIG 60
3C0026E 3/26W COMPACT HW ELIG 82
3C0032E 3/32W COMPACT HW ELIG 114
3C0042E 3/42W COMPACT HW ELIG 141
4C0018E 4/18W COMPACT HW ELIG 80
4C0026E 4/26W COMPACT HW ELIG 108
4C0032E 4/32W COMPACT HW ELIG 152
4C0042E 4/42W COMPACT HW ELIG 188
6C0026E 6/26W COMPACT HW ELIG 162
6C0032E 6/32W COMPACT HW ELIG 228
6C0042E 6/42W COMPACT HW ELIG 282
8C0026E 8/26W COMPACT HW ELIG 216
8C0032E 8/32W COMPACT HW ELIG 304
8C0042E 8/42W COMPACT HW ELIG 376
T5 Systems
1F14SSE 1L2’ 14W T5/ELIG 16
2F14SSE 2L2’ 14W T5/ELIG 32
3F14SSE 3L2’ 14W T5/ELIG 50
4F14SSE 4L2’ 14W T5/ELIG 68
1F24HSE 1L2’ 24W T5HO/ELIG 29
2F24HSE 2L2’ 24W T5HO/ELIG 52
3F24HSE 3L2’ 24W T5HO/ELIG 80
1F21SSE 1L3' 21W T5/ELIG 24
2F21SSE 2L3' 21W T5/ELIG 47
1F39HSE 1L3' 39W T5HO/ELIG 42
2F39HSE 2L3' 39W T5HO/ELIG 85
1F28SSE 1L4' 28W T5/ELIG 32
2F28SSE 2L4' 28W T5/ELIG 63
3F28SSE 3L4' 28W T5/ELIG 95
4F28SSE 4L4' 28W T5/ELIG 126
6F28SSE 6L4' 28W T5/ELIG 189
1F47HSE 1L4' 47W T5HO/ELIG 53
2F47HSE 2L4' 47W T5HO/ELIG 103
3F47HSE 3L4' 47W T5HO/ELIG 157
4F47HSE 4L4' 47W T5HO/ELIG 200
5F47HSE 5L4' 47W T5HO/ELIG 260
6F47HSE 6L4' 47W T5HO/ELIG 303
1F50HSE 1L4' 50W T5HO/ELIG 58
2F50HSE 2L4' 50W T5HO/ELIG 110

Massachusetts Technical Reference Manual Appendix A: Common Lookup Tables
October 2011 345 © 2011 Massachusetts Electric and Gas Energy
Efficiency Program Administrators, ALL RIGHTS RESERVED
Device
Code Device Description
Rated
Watts
T5 Systems (cont.)
3F50HSE 3L4' 50W T5HO/ELIG 168
4F50HSE 4L4' 50W T5HO/ELIG 215
5F50HSE 5L4' 50W T5HO/ELIG 278
6F50HSE 6L4' 50W T5HO/ELIG 325
1F54HSE 1L4' 54W T5HO/ELIG 59
2F54HSE 2L4' 54W T5HO/ELIG 117
3F54HSE 3L4' 54W T5HO/ELIG 177
4F54HSE 4L4’ 54W T5HO/ELIG 234
5F54HSE 5L4' 54W T5HO/ELIG 294
6F54HSE 6L4’ 54W T5HO/ELIG 351
8F54HSE 8L4' 54W T5HO/ELIG 468
10F54HSE 10L4’ 54W T5HO/ELIG 585
Two Foot High Efficient T8 Systems
1F17ESL 1L2' 17W T8EE/ELEE LOW
PWR 14
1F17ESN 1L2' 17W T8EE/ELEE 17
1F17ESH 1L2' 17W T8EE/ELEE HIGH
PWR 20
1F28BXE 1L2' F28BX/ELIG 32
2F17ESL 2L2' 17W T8EE/ELEE LOW
PWR 27
2F17ESN 2L2' 17W T8EE/ELEE 32
2F17ESH 2L2' 17W T8EE/ELEE HIGH
PWR 40
2F28BXE 2L2' F28BX/ELIG 63
3F17ESL 3L2' 17W T8EE/ELEE LOW
PWR 39
3F17ESN 3L2' 17W T8EE/ELEE 46
3F17ESH 3L2' 17W T8EE/ELEE HIGH
PWR 61
3F28BXE 3L2' F28BX/ELIG 94
Three Foot High Efficient T8 Systems
1F25ESL 1L3' 25W T8EE/ELEE LOW
PWR 21
1F25ESN 1L3' 25W T8EE/ELEE 24
1F25ESH 1L3' 25W T8EE/ELEE HIGH
PWR 30
2F25ESL 2L3' 25W T8EE/ELEE LOW
PWR 40
2F25ESN 2L3' 25W T8EE/ELEE 45
2F25ESH 2L3' 25W T8EE/ELEE HIGH
PWR 60
3F25ESL 3L3' 25W T8EE/ELEE LOW
PWR 58
3F25ESN 3L3' 25W T8EE/ELEE 67
3F25ESH 3L3' 25W T8EE/ELEE HIGH
PWR 90
Device
Code Device Description
Rated
Watts
Four Foot T8 High Efficient / Reduce Wattage Systems
1F25EEH 1L4' 25W T8EE/ELEE HIGH
PWR 30
1F25EEE 1L4' 25W T8EE/ELEE 22
1F25EEL 1L4' 25W T8EE/ELEE LOW
PWR 19
2F25EEH 2L4' 25W T8EE/ELEE HIGH
PWR 57
2F25EEE 2L4' 25W T8EE/ELEE 43
2F25EEL 2L4' 25W T8EE/ELEE LOW
PWR 37
3F25EEH 3L4' 25W T8EE/ELEE HIGH
PWR 86
3F25EEE 3L4' 25W T8EE/ELEE 64
3F25EEL 3L4' 25W T8EE/ELEE LOW
PWR 57
4F25EEH 4L4' 25W T8EE/ELEE HIGH
PWR 111
4F25EEE 4L4' 25W T8EE/ELEE 86
4F25EEL 4L4' 25W T8EE/ELEE LOW
PWR 75
1F28EEH 1L4' 28W T8EE/ELEE HIGH
PWR 33
1F28EEE 1L4' 28W T8EE/ELEE 24
1F28EEL 1L4' 28W T8EE/ELEE LOW
PWR 22
2F28EEH 2L4' 28WT8EE/ELEE HIGH
PWR 64
2F28EEE 2L4' 28W T8EE/ELEE 48
2F28EEL 2L4' 28W T8EE/ELEE LOW
PWR 42
3F28EEH 3L4' 28W T8EE/ELEE HIGH
PWR 96
3F28EEE 3L4' 28W T8EE/ELEE 72
3F28EEL 3L4' 28W T8EE/ELEE LOW
PWR 63
4F28EEH 4L4' 28W T8EE/ELEE HIGH
PWR 126
4F28EEE 4L4' 28W T8EE/ELEE 94
4F28EEL 4L4' 28W T8EE/ELEE LOW
PWR 83
1F30EEH 1L4' 30W T8EE/ELEE HIGH
PWR 36
1F30EEE 1L4' 30W T8EE/ELEE 26
1F30EEL 1L4' 30W T8EE/ELEE LOW
PWR 24
2F30EEH 2L4' 30WT8EE/ELEE HIGH
PWR 69
2F30EEE 2L4' 30W T8EE/ELEE 52
2F30EEL 2L4' 30W T8EE/ELEE LOW
PWR 45
3F30EEH 3L4' 30W T8EE/ELEE HIGH
PWR 103
3F30EEE 3L4' 30W T8EE/ELEE 77
3F30EEL 3L4' 30W T8EE/ELEE LOW PWR 68

Massachusetts Technical Reference Manual Appendix A: Common Lookup Tables
October 2011 346 © 2011 Massachusetts Electric and Gas Energy
Efficiency Program Administrators, ALL RIGHTS RESERVED
Device
Code Device Description
Rated
Watts
Four Foot T8 High Efficient / Reduce Wattage Systems
(cont.)
4F30EEH 4L4' 30W T8EE/ELEE HIGH
PWR 133
4F30EEE 4L4' 30W T8EE/ELEE 101
4F30EEL 4L4' 30W T8EE/ELEE LOW
PWR 89
1F32EEH 1L4' 32W T8EE/ELEE HIGH
PWR 38
1F32EEE 1L4' 32W T8EE/ELEE 28
1F32EEL 1L4' 32W T8EE/ELEE LOW
PWR 25
2F32EEH 2L4' 32W T8EE/ELEE HIGH
PWR 73
2F32EEE 2L4' 32W T8EE/ELEE 53
2F32EEL 2L4' 32W T8EE/ELEE LOW
PWR 47
3F32EEH 3L4' 32W T8EE/ELEE HIGH
PWR 109
3F32EEE 3L4' 32W T8EE/ELEE 82
3F32EEL 3L4' 32W T8EE/ELEE LOW
PWR 72
4F32EEH 4L4' 32W T8EE/ELEE HIGH
PWR 141
4F32EEE 4L4' 32W T8EE/ELEE 107
4F32EEL 4L4' 32W T8EE/ELEE LOW
PWR 95
6F32EEH 6L4' 32W T8EE/ELEE HIGH
PWR 218
6F32EEE 6L4' 32W T8EE/ELEE 168
6F32EEL 6L4' 32W T8EE/ELEE LOW
PWR 146
Eight Foot T8 Systems
1F59SSE 1L8' T8/ELIG 60
1F80SSE 1L8' T8 HO/ELIG 85
2F59SSE 2L8' T8/ELIG 109
2F59SSL 2L8' T8/ELIG LOW PWR 100
2F80SSE 2L8' T8 HO/ELIG 160
LED Lighting Fixtures
1L002 2 WATT LED 2
1L003 3 WATT LED 3
1L004 4 WATT LED 04
1L005 5 WATT LED 05
1L006 6 WATT LED 06
1L007 7 WATT LED 07
1L008 8 WATT LED 08
1L009 9 WATT LED 09
1L010 10 WATT LED 10
1L011 11 WATT LED 11
1L012 12 WATT LED 12
Device
Code Device Description
Rated
Watts
LED Lighting Fixtures (cont.)
1L013 13 WATT LED 13
1L014 14 WATT LED 14
1L015 15 WATT LED 15
1L016 16 WATT LED 16
1L017 17 WATT LED 17
1L018 18 WATT LED 18
1L019 19 WATT LED 19
1L020 20 WATT LED 20
1L021 21 WATT LED 21
1L022 22 WATT LED 22
1L023 23 WATT LED 23
1L024 24 WATT LED 24
1L025 25 WATT LED 25
1L026 26 WATT LED 26
1L027 27 WATT LED 27
1L028 28 WATT LED 28
1L029 29 WATT LED 29
1L030 30 WATT LED 30
1L031 31 WATT LED 31
1L032 32 WATT LED 32
1L033 33 WATT LED 33
1L034 34 WATT LED 34
1L035 35 WATT LED 35
1L036 36 WATT LED 36
1L037 37 WATT LED 37
1L038 38 WATT LED 38
1L039 39 WATT LED 39
1L040 40 WATT LED 40
1L041 41 WATT LED 41
1L042 42 WATT LED 42
1L043 43 WATT LED 43
1L044 44 WATT LED 44
1L045 45 WATT LED 45
1L046 46 WATT LED 46
1L047 47 WATT LED 47
1L048 48 WATT LED 48
1L049 49 WATT LED 49
1L050 50 WATT LED 50
1L055 55 WATT LED 55
1L060 60 WATT LED 60
1L070 70 WATT LED 70
1L073 73 WATT LED 73
1L075 75 WATT LED 75
1L080 90 WATT LED 90
1L085 85 WATT LED 85
1L090 90 WATT LED 90

Massachusetts Technical Reference Manual Appendix A: Common Lookup Tables
October 2011 347 © 2011 Massachusetts Electric and Gas Energy
Efficiency Program Administrators, ALL RIGHTS RESERVED
Device
Code Device Description
Device
Code
LED Lighting Fixtures (cont.)
1L095 95 WATT LED 95
1L100 100 WATT LED 100
1L106 106 WATT LED 106
1L107 107 WATT LED 107
1L116 116 WATT LED 116
1L120 120 WATT LED 120
1L125 125 WATT LED 125
1L130 130 WATT LED 130
1L135 135 WATT LED 135
1L140 140 WATT LED 140
1L145 145 WATT LED 145
1L150 150 WATT LED 150
1L155 155 WATT LED 155
1L160 160 WATT LED 160
1L165 165 WATT LED 165
1L170 170 WATT LED 170
1L175 175 WATT LED 175
1L180 180 WATT LED 180
1L185 185 WATT LED 185
1L190 190 WATT LED 190
1L200 200 WATT LED 200
Device
Code Device Description
Device
Code
LED Lighting Fixtures (cont.)
1L210 210 WATT LED 210
1L220 220 WATT LED 220
1L240 240 WATT LED 240
Electronic Metal Halide Lamps
1M0150E 150W METAL HALIDE EB 160
1M0200E 200W METAL HALIDE EB 215
1M0250E 250W METAL HALIDE EB 270
1M0320E 320W METAL HALIDE EB 345
1M0350E 350W METAL HALIDE EB 375
1M0400E 400W METAL HALIDE EB 430
1M0450E 400W METAL HALIDE EB 480
MH Track Lighting
1M0020E 20W MH SPOT 25
1M0025E 25W MH SPOT 25
1M0035E 35W MH SPOT 44
1M0039E 39W MH SPOT 47
1M0050E 50W MH SPOT 60
1M0070E 70W MH SPOT 80
1M0100E 100W MH SPOT 111
1M0150E 150W MH SPOT 162

Massachusetts Technical Reference Manual Appendix A: Common Lookup Tables
October 2011 348 © 2011 Massachusetts Electric and Gas Energy
Efficiency Program Administrators, ALL RIGHTS RESERVED
Table 48: MassSAVE Retrofit Existing Lighting Wattage Tables
2012 MassSAVE C&I Lighting Rated Wattage Tables developed by Lighting Worksheet Team
Device
Code Device Description
Rated
Watts
Incandescent Lamps
1I0015 15W INC 15
1I0020 20W INC 20
1I0025 25W INC 25
1I0034 34W INC 34
1I0036 36W INC 36
1I0040 40W INC 40
1I0042 42W INC 42
1I0045 45W INC 45
1I0050 50W INC 50
1I0052 52W INC 52
1I0054 54W INC 54
1I0055 55W INC 55
1I0060 60W INC 60
1I0065 65W INC 65
1I0067 67W INC 67
1I0069 69W INC 69
1I0072 72W INC 72
1I0075 75W INC 75
1I0080 80W INC 80
1I0085 85W INC 85
1I0090 90W INC 90
1I0093 93W INC 93
1I0100 100W INC 100
1I0120 120W INC 120
1I0125 125W INC 125
1I0135 135W INC 135
1I0150 150W INC 150
1I0200 200W INC 200
1I0300 300W INC 300
1I0448 448W INC 448
1I0500 500W INC 500
1I0750 750W INC 750
1I1000 1000W INC 1000
1I1500 1500W INC 1500
Low Voltage Halogen Fixture ( includes
Transformer)
1R0020 20W LV HALOGEN FIXT 30
1R0025 25W LV HALOGEN FIXT 35
1R0035 35W LV HALOGEN FIXT 45
1R0042 42W LV HALOGEN FIXT 52
1R0050 50W LV HALOGEN FIXT 60
1R0065 65W LV HALOGEN FIXT 75
Device
Code Device Description
Rated
Watts
Low Voltage Halogen Fixture ( includes
Transformer) (cont.)
1R0075 75W LV HALOGEN FIXT 85
Halogen/Quartz Lamps
1T0035 35W HALOGEN LAMP 35
1T0040 40W HALOGEN LAMP 40
1T0042 42W HALOGEN LAMP 42
1T0045 45W HALOGEN LAMP 45
1T0047 47W HALOGEN LAMP 47
1T0050 50W HALOGEN LAMP 50
1T0052 52W HALOGEN LAMP 52
1T0055 55W HALOGEN LAMP 55
1T0060 60W HALOGEN LAMP 60
1T0072 72W HALOGEN LAMP 72
1T0075 75W HALOGEN LAMP 75
1T0090 90W HALOGEN LAMP 90
1T0100 100W HALOGEN LAMP 100
1T0150 150W HALOGEN LAMP 150
1T0200 200W HALOGEN LAMP 200
1T0250 250W HALOGEN LAMP 250
1T0300 300W HALOGEN LAMP 300
1T0350 350W HALOGEN LAMP 350
1T0400 400W HALOGEN LAMP 400
1T0425 425W HALOGEN LAMP 425
1T0500 500W HALOGEN LAMP 500
1T0750 750W HALOGEN LAMP 750
1T0900 900W HALOGEN LAMP 900
1T1000 1000W HALOGEN LAMP 1000
1T1200 1200W HALOGEN LAMP 1200
1T1500 1500W HALOGEN LAMP 1500
Mercury Vapor (MV)
1V0040S 40W MERCURY 50
1V0050S 50W MERCURY 75
1V0075S 75W MERCURY 95
1V0100S 100W MERCURY 120
1V0175S 175W MERCURY 205
1V0250S 250W MERCURY 290
1V0400S 400W MERCURY 455
1V0700S 700W MERCURY 775
1V1000S 1000W MERCURY 1075
2V0400S 2/400W MERCURY 880

Massachusetts Technical Reference Manual Appendix A: Common Lookup Tables
October 2011 349 © 2011 Massachusetts Electric and Gas Energy
Efficiency Program Administrators, ALL RIGHTS RESERVED
Device
Code Device Description
Rated
Watts
Low Pressure Sodium (LPS)
1L0035S 35W LPS 60
1L0055S 55W LPS 85
1L0090S 90W LPS 130
1L0135S 135W LPS 180
1L0180S 180W LPS 230
High Pressure Sodium (HPS)
1H0035S 35W HPS 45
1H0050S 50W HPS 65
1H0070S 70W HPS 90
1H0100S 100W HPS 130
1H0150S 150W HPS 190
1H0200S 200W HPS 240
1H0225S 225W HPS 275
1H0250S 250W HPS 295
1H0310S 310W HPS 350
1H0360S 360W HPS 435
1H0400S 400W HPS 460
1H0600S 600W HPS 675
1H0750S 750W HPS 835
1H1000S 1000W HPS 1085
Metal Halide (MH)
1M0032S 32W METAL HALIDE 40
1M0050S 50W METAL HALIDE 65
1M0070S 70W METAL HALIDE 95
1M0100S 100W METAL HALIDE 120
1M0150S 150W METAL HALIDE 190
1M0175S 175W METAL HALIDE 205
1M0250S 250W METAL HALIDE 295
1M0360S 360W METAL HALIDE 430
1M0400S 400W METAL HALIDE 455
1M0750S 750W METAL HALIDE 825
1M1000S 1000W METAL HALIDE 1075
1M1500S 1500W METAL HALIDE 1615
1M1800S 1800W METAL HALIDE 1875
Pulse Start Metal Halide Lamp/Ballast
1M0100P 100W MH CWA 128
1M0100R 100W MH LINEAR 118
1M0150P 150W MH CWA 190
1M0150R 150W MH LINEAR 172
1M0175P 175W MH CWA 208
1M0175R 175W MH LINEAR 190
1M0200P 200W MH CWA 232
Device
Code Device Description Rated
Watts
Pulse Start Metal Halide Lamp/Ballast (cont.)
1M0200R 200W MH LINEAR 218
1M0250P 250W MH CWA 288
1M0250R 250W MH LINEAR 265
1M0300P 300W MH CWA 342
1M0300R 300W MH LINEAR 324
1M0320P 320W MH CWA 365
1M0320R 320W MH LINEAR 345
1M0350P 350W MH CWA 400
1M0350R 350W MH LINEAR 375
1M0400P 400W MH CWA 455
1M0400R 400W MH LINEAR 430
1M0450P 450W MH CWA 508
1M0450R 450W MH LINEAR 480
1M0750P 750W MH CWA 815
1M0750R 750W MH LINEAR 805
1M0875P 875W MH CWA 950
1M0875R 875W MH LINEAR 927
1M1000P 1000W MH CWA 1080
Two Foot T8 / T12 Systems
1F20SSS F20T12/HPF(1) 32
1F80BXE 1L2' F80BXE/ELIG 90
1F55BXE 1L2' F55BX/ELIG 56
2F17SSE 2L2' 17W T8/ELIG 37
2F17SSL 2L2' 17W T8/ELIG LOW
POWER 27
2F17SSM 2L2' 17W T8/EEMAG 45
2F20SSS F20T12/HPF(2) 56
2F24HSS 2L2' 24 T12HO/STD/STD 85
2F40BXE 2L2' F40BX/ELIG 72
2F50BXE 2L2' F50BX/ELIG 108
2F55BXE 2L2'55BXE/ELIG 112
3F17SSE 3L2' 17W T8/ELIG 53
3F17SSL 3L2' 17W T8/ELIG LOW
POWER 39
3F20SSS F20T12/HPF(3) 78
3F40BXE 3L2' F40BX/ELIG 102
3F50BXE 3L2' F50BX/ELIG 162
3F55BXE 3L2' F55BX/ELIG 168
4F17SSE 4L2' 17W T8/ELIG 62
4F36BXE 4L2' F36BX/ELIG 148
4F40BXE 4L2' F40BX/ELIG 144
4F40BXH 4L 40W T5 (Std.) HIGH LMN 170
4F50BXE 4L2' F50BX/ELIG 216
4F55BXE 4L2' F55BX/ELIG 224
5F40BXE 5L2' F40BX/ELIG 190

Massachusetts Technical Reference Manual Appendix A: Common Lookup Tables
October 2011 350 © 2011 Massachusetts Electric and Gas Energy
Efficiency Program Administrators, ALL RIGHTS RESERVED
Device
Code Device Description Rated
Watts
Two Foot T8 / T12 Systems (cont.)
5F50BXE 5L2' F50BX/ELIG 270
5F55BXE 5L2' F55BX/ELIG 280
6F36BXE 6L2' F36BX/ELIG 212
6F40BXE 6L2' F40BX/ELIG 204
6F50BXE 6L2' F50BX/ELIG 324
6F55BXE 6L2' F55BX/ELIG 336
8F36BXE 8L2' F36BX/ELIG 296
8F40BXE 8L2' F40BX/ELIG 288
8F50BXE 8L2' F50BX/ELIG 432
8F55BXE 8L2' F55BX/ELIG 448
9F36BXE 9L2' F36BX/ELIG 318
9F40BXE 9L2' F40BX/ELIG 306
9F50BXE 9L2' F50BX/ELIG 486
9F55BXE 9L2' F55BX/ELIG 504
12F40BE 12L2' F40BX/ELIG 408
12F50BE 12L2' F50BX/ELIG 648
12F55BE 12L2' F55BX/ELIG 672
Three Foot T8 / T12 Systems
1F30SEM 1L3' 30W T12 EE/EEMAG 38
1F30SES 1L3' 30W T12 EE/STD 42
1F30SSS 1L3' 30W T12 STD/STD 46
1F25SSE 1L3' 25W T8/ELIG 24
1F25SSH 1L3' 25W T8/ELIG HIGH LMN 28
2F30SEE 2L3' 30W T12 EE/ELIG 49
2F30SEM 2L3' 30W T12 EE/EEMAG 66
2F30SES 2L3' 30W T12 EE/STD 73
2F30SSS 2L3' 30W T12 STD/STD 80
2F25SSE 2L3' 25W T8/ELIG 47
2F25SSM 2L3' 25W T8/EEMAG 65
3F30SSS 3L3' 30W T12 STD/STD 140
3F30SES 3L3' 30W T12 EE/STD 127
3F25SSE 3L3’ 25W T8/ELIG 68
4F25SSE 4L3' 25W T8/ELIG 88
Four Foot F48 T8 Systems
1F48SES 1L4' F48T12EE/STD 50
1F48SSS 1L4' F48T12/STD 60
2F48SES 2L4' F48T12EE/STD 82
2F48SSS 2L4' F48T12/STD 102
3F48SES 3L4' F48T12EE/STD 132
3F48SSS 3L4' F48T12/STD 162
4F48SES 4L4' F48T12EE/STD 164
4F48SSS 4L4' F48T12/STD 204
Device
Code Device Description Rated
Watts
Four Foot F48HO T8 Systems
1F48HES 1L4' F48HO/EE/STD 80
1F48HSS 1L4' F48H0/STD/STD 85
2F48HES 2L4' F48HO/EE/STD 135
2F48HSS 2L4' F48H0/STD/STD 145
3F48HES 3L4' F48HO/EE/STD 215
3F48HSS 3L4' F48H0/STD/STD 230
4F48HES 4L4' F48HO/EE/STD 270
4F48HSS 4L4' F48H0/STD/STD 290
Four Foot F48VHO T12 Systems
1F48VES 1L4' F48VHO/EE/STD 123
1F48VSS 1L4' F48VHO/STD/STD 138
2F48VES 2L4' F48VHO/EE/STD 210
2F48VSS 2L4' F48VHO/STD/STD 240
3F48VES 3L4' F48VHO/EE/STD 333
3F48VSS 3L4' F48VHO/STD/STD 378
4F48VES 4L4' F48VHO/EE/STD 420
4F48VSS 4L4' F48VHO/STD/STD 480
Four Foot T12 Systems
1F40SEE 1L4' EE/ELIG 38
1F40SEM 1L4' EE/EEMAG 40
1F40SES 1L4' EE/STD 50
1F40SSE 1L4' STD/ELIG 46
1F40SSM 1L4' STD/EEMAG 50
1F40SSS 1L4' STD/STD 57
1F40HSE 1L4' HO/STD/ELIG 59
2F40SEE 2L4' EE/ELIG 60
2F40SEM 2L4' EE/EEMAG 70
2F40SES 2L4' EE/STD 80
2F40SSE 2L4' STD/ELIG 72
2F40SSM 2L4' STD/EEMAG 86
2F40SSS 2L4' STD/STD 94
3F40SEE 3L4' EE/ELIG 90
3F40SEM 3L4' EE/EEMAG 110
3F40SES 3L4' EE/STD 130
3F40SSE 3L4' STD/ELIG 110
3F40SSM 3L4' STD/EEMAG 136
3F40SSS 3L4' STD/STD 151
4F40SEE 4L4' EE/ELIG 120
4F40SEM 4L4' EE/EEMAG 140
4F40SES 4L4' EE/STD 160
4F40SSE 4L4' STD/ELIG 144
4F40SSM 4L4' STD/EEMAG 172
4F40SSS 4L4' STD/STD 188
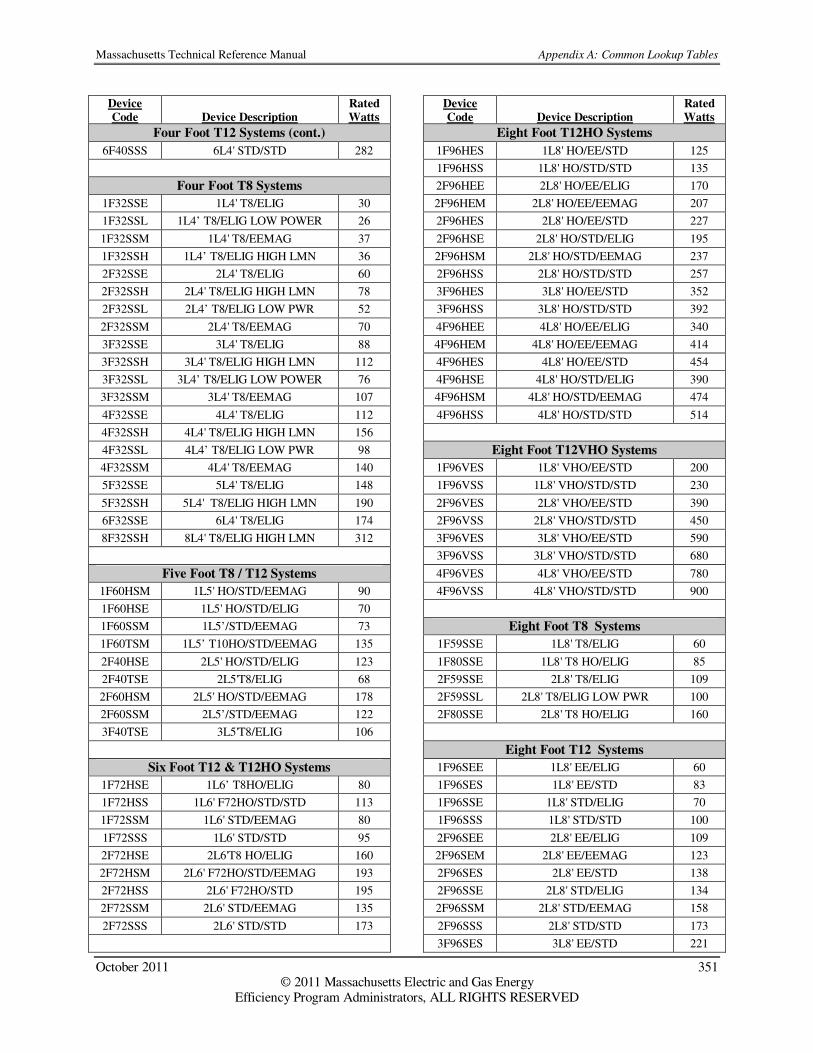
Massachusetts Technical Reference Manual Appendix A: Common Lookup Tables
October 2011 351 © 2011 Massachusetts Electric and Gas Energy
Efficiency Program Administrators, ALL RIGHTS RESERVED
Device
Code Device Description Rated
Watts
Four Foot T12 Systems (cont.)
6F40SSS 6L4' STD/STD 282
Four Foot T8 Systems
1F32SSE 1L4' T8/ELIG 30
1F32SSL 1L4’ T8/ELIG LOW POWER 26
1F32SSM 1L4' T8/EEMAG 37
1F32SSH 1L4’ T8/ELIG HIGH LMN 36
2F32SSE 2L4' T8/ELIG 60
2F32SSH 2L4' T8/ELIG HIGH LMN 78
2F32SSL 2L4’ T8/ELIG LOW PWR 52
2F32SSM 2L4' T8/EEMAG 70
3F32SSE 3L4' T8/ELIG 88
3F32SSH 3L4' T8/ELIG HIGH LMN 112
3F32SSL 3L4’ T8/ELIG LOW POWER 76
3F32SSM 3L4' T8/EEMAG 107
4F32SSE 4L4' T8/ELIG 112
4F32SSH 4L4' T8/ELIG HIGH LMN 156
4F32SSL 4L4’ T8/ELIG LOW PWR 98
4F32SSM 4L4' T8/EEMAG 140
5F32SSE 5L4' T8/ELIG 148
5F32SSH 5L4' T8/ELIG HIGH LMN 190
6F32SSE 6L4' T8/ELIG 174
8F32SSH 8L4' T8/ELIG HIGH LMN 312
Five Foot T8 / T12 Systems
1F60HSM 1L5' HO/STD/EEMAG 90
1F60HSE 1L5' HO/STD/ELIG 70
1F60SSM 1L5’/STD/EEMAG 73
1F60TSM 1L5’ T10HO/STD/EEMAG 135
2F40HSE 2L5' HO/STD/ELIG 123
2F40TSE 2L5'T8/ELIG 68
2F60HSM 2L5' HO/STD/EEMAG 178
2F60SSM 2L5’/STD/EEMAG 122
3F40TSE 3L5'T8/ELIG 106
Six Foot T12 & T12HO Systems
1F72HSE 1L6’ T8HO/ELIG 80
1F72HSS 1L6' F72HO/STD/STD 113
1F72SSM 1L6' STD/EEMAG 80
1F72SSS 1L6' STD/STD 95
2F72HSE 2L6'T8 HO/ELIG 160
2F72HSM 2L6' F72HO/STD/EEMAG 193
2F72HSS 2L6' F72HO/STD 195
2F72SSM 2L6' STD/EEMAG 135
2F72SSS 2L6' STD/STD 173
Device
Code Device Description Rated
Watts
Eight Foot T12HO Systems
1F96HES 1L8' HO/EE/STD 125
1F96HSS 1L8' HO/STD/STD 135
2F96HEE 2L8' HO/EE/ELIG 170
2F96HEM 2L8' HO/EE/EEMAG 207
2F96HES 2L8' HO/EE/STD 227
2F96HSE 2L8' HO/STD/ELIG 195
2F96HSM 2L8' HO/STD/EEMAG 237
2F96HSS 2L8' HO/STD/STD 257
3F96HES 3L8' HO/EE/STD 352
3F96HSS 3L8' HO/STD/STD 392
4F96HEE 4L8' HO/EE/ELIG 340
4F96HEM 4L8' HO/EE/EEMAG 414
4F96HES 4L8' HO/EE/STD 454
4F96HSE 4L8' HO/STD/ELIG 390
4F96HSM 4L8' HO/STD/EEMAG 474
4F96HSS 4L8' HO/STD/STD 514
Eight Foot T12VHO Systems
1F96VES 1L8' VHO/EE/STD 200
1F96VSS 1L8' VHO/STD/STD 230
2F96VES 2L8' VHO/EE/STD 390
2F96VSS 2L8' VHO/STD/STD 450
3F96VES 3L8' VHO/EE/STD 590
3F96VSS 3L8' VHO/STD/STD 680
4F96VES 4L8' VHO/EE/STD 780
4F96VSS 4L8' VHO/STD/STD 900
Eight Foot T8 Systems
1F59SSE 1L8' T8/ELIG 60
1F80SSE 1L8' T8 HO/ELIG 85
2F59SSE 2L8' T8/ELIG 109
2F59SSL 2L8' T8/ELIG LOW PWR 100
2F80SSE 2L8' T8 HO/ELIG 160
Eight Foot T12 Systems
1F96SEE 1L8' EE/ELIG 60
1F96SES 1L8' EE/STD 83
1F96SSE 1L8' STD/ELIG 70
1F96SSS 1L8' STD/STD 100
2F96SEE 2L8' EE/ELIG 109
2F96SEM 2L8' EE/EEMAG 123
2F96SES 2L8' EE/STD 138
2F96SSE 2L8' STD/ELIG 134
2F96SSM 2L8' STD/EEMAG 158
2F96SSS 2L8' STD/STD 173
3F96SES 3L8' EE/STD 221

Massachusetts Technical Reference Manual Appendix A: Common Lookup Tables
October 2011 352 © 2011 Massachusetts Electric and Gas Energy
Efficiency Program Administrators, ALL RIGHTS RESERVED
Device
Code Device Description Rated
Watts
Eight Foot T12 Systems (cont.)
3F96SSS 3L8' STD/STD 273
4F96SEE 4L8' EE/ELIG 218
4F96SEM 4L8' EE/EEMAG 246
Device
Code Device Description Rated
Watts
Eight Foot T12 Systems (cont.)
4F96SES 4L8' EE/STD 276
4F96SSE 4L8' STD/ELIG 268
4F96SSM 4L8' STD/EEMAG 316
4F96SSS 4L8' STD/STD 346
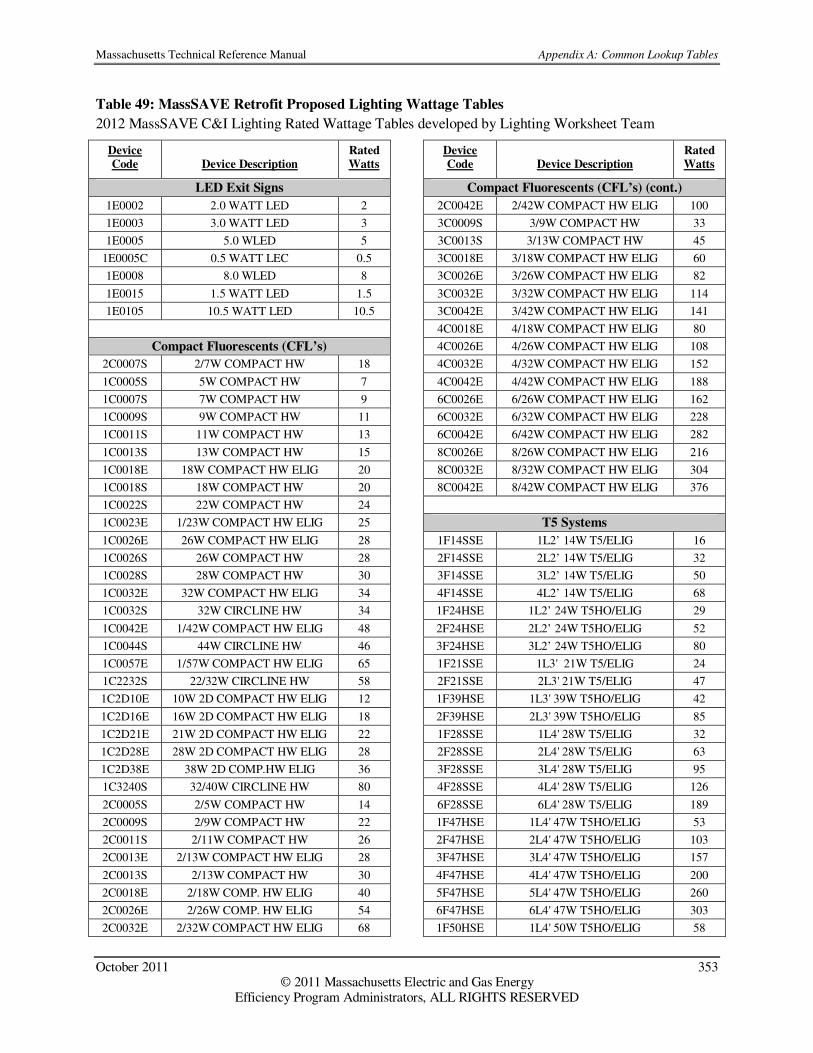
Massachusetts Technical Reference Manual Appendix A: Common Lookup Tables
October 2011 353 © 2011 Massachusetts Electric and Gas Energy
Efficiency Program Administrators, ALL RIGHTS RESERVED
Table 49: MassSAVE Retrofit Proposed Lighting Wattage Tables
2012 MassSAVE C&I Lighting Rated Wattage Tables developed by Lighting Worksheet Team
Device
Code Device Description
Rated
Watts
LED Exit Signs
1E0002 2.0 WATT LED 2
1E0003 3.0 WATT LED 3
1E0005 5.0 WLED 5
1E0005C 0.5 WATT LEC 0.5
1E0008 8.0 WLED 8
1E0015 1.5 WATT LED 1.5
1E0105 10.5 WATT LED 10.5
Compact Fluorescents (CFL’s)
2C0007S 2/7W COMPACT HW 18
1C0005S 5W COMPACT HW 7
1C0007S 7W COMPACT HW 9
1C0009S 9W COMPACT HW 11
1C0011S 11W COMPACT HW 13
1C0013S 13W COMPACT HW 15
1C0018E 18W COMPACT HW ELIG 20
1C0018S 18W COMPACT HW 20
1C0022S 22W COMPACT HW 24
1C0023E 1/23W COMPACT HW ELIG 25
1C0026E 26W COMPACT HW ELIG 28
1C0026S 26W COMPACT HW 28
1C0028S 28W COMPACT HW 30
1C0032E 32W COMPACT HW ELIG 34
1C0032S 32W CIRCLINE HW 34
1C0042E 1/42W COMPACT HW ELIG 48
1C0044S 44W CIRCLINE HW 46
1C0057E 1/57W COMPACT HW ELIG 65
1C2232S 22/32W CIRCLINE HW 58
1C2D10E 10W 2D COMPACT HW ELIG 12
1C2D16E 16W 2D COMPACT HW ELIG 18
1C2D21E 21W 2D COMPACT HW ELIG 22
1C2D28E 28W 2D COMPACT HW ELIG 28
1C2D38E 38W 2D COMP.HW ELIG 36
1C3240S 32/40W CIRCLINE HW 80
2C0005S 2/5W COMPACT HW 14
2C0009S 2/9W COMPACT HW 22
2C0011S 2/11W COMPACT HW 26
2C0013E 2/13W COMPACT HW ELIG 28
2C0013S 2/13W COMPACT HW 30
2C0018E 2/18W COMP. HW ELIG 40
2C0026E 2/26W COMP. HW ELIG 54
2C0032E 2/32W COMPACT HW ELIG 68
Device
Code Device Description
Rated
Watts
Compact Fluorescents (CFL’s) (cont.)
2C0042E 2/42W COMPACT HW ELIG 100
3C0009S 3/9W COMPACT HW 33
3C0013S 3/13W COMPACT HW 45
3C0018E 3/18W COMPACT HW ELIG 60
3C0026E 3/26W COMPACT HW ELIG 82
3C0032E 3/32W COMPACT HW ELIG 114
3C0042E 3/42W COMPACT HW ELIG 141
4C0018E 4/18W COMPACT HW ELIG 80
4C0026E 4/26W COMPACT HW ELIG 108
4C0032E 4/32W COMPACT HW ELIG 152
4C0042E 4/42W COMPACT HW ELIG 188
6C0026E 6/26W COMPACT HW ELIG 162
6C0032E 6/32W COMPACT HW ELIG 228
6C0042E 6/42W COMPACT HW ELIG 282
8C0026E 8/26W COMPACT HW ELIG 216
8C0032E 8/32W COMPACT HW ELIG 304
8C0042E 8/42W COMPACT HW ELIG 376
T5 Systems
1F14SSE 1L2’ 14W T5/ELIG 16
2F14SSE 2L2’ 14W T5/ELIG 32
3F14SSE 3L2’ 14W T5/ELIG 50
4F14SSE 4L2’ 14W T5/ELIG 68
1F24HSE 1L2’ 24W T5HO/ELIG 29
2F24HSE 2L2’ 24W T5HO/ELIG 52
3F24HSE 3L2’ 24W T5HO/ELIG 80
1F21SSE 1L3' 21W T5/ELIG 24
2F21SSE 2L3' 21W T5/ELIG 47
1F39HSE 1L3' 39W T5HO/ELIG 42
2F39HSE 2L3' 39W T5HO/ELIG 85
1F28SSE 1L4' 28W T5/ELIG 32
2F28SSE 2L4' 28W T5/ELIG 63
3F28SSE 3L4' 28W T5/ELIG 95
4F28SSE 4L4' 28W T5/ELIG 126
6F28SSE 6L4' 28W T5/ELIG 189
1F47HSE 1L4' 47W T5HO/ELIG 53
2F47HSE 2L4' 47W T5HO/ELIG 103
3F47HSE 3L4' 47W T5HO/ELIG 157
4F47HSE 4L4' 47W T5HO/ELIG 200
5F47HSE 5L4' 47W T5HO/ELIG 260
6F47HSE 6L4' 47W T5HO/ELIG 303
1F50HSE 1L4' 50W T5HO/ELIG 58

Massachusetts Technical Reference Manual Appendix A: Common Lookup Tables
October 2011 354 © 2011 Massachusetts Electric and Gas Energy
Efficiency Program Administrators, ALL RIGHTS RESERVED
Device
Code Device Description
Rated
Watts
T5 Systems (cont.)
2F50HSE 2L4' 50W T5HO/ELIG 110
3F50HSE 3L4' 50W T5HO/ELIG 168
4F50HSE 4L4' 50W T5HO/ELIG 215
5F50HSE 5L4' 50W T5HO/ELIG 278
6F50HSE 6L4' 50W T5HO/ELIG 325
1F54HSE 1L4' 54W T5HO/ELIG 59
2F54HSE 2L4' 54W T5HO/ELIG 117
3F54HSE 3L4' 54W T5HO/ELIG 177
4F54HSE 4L4’ 54W T5HO/ELIG 234
5F54HSE 5L4' 54W T5HO/ELIG 294
6F54HSE 6L4’ 54W T5HO/ELIG 351
8F54HSE 8L4' 54W T5HO/ELIG 468
10F54HSE 10L4’ 54W T5HO/ELIG 585
Two Foot High Efficient T8 Systems
1F17ESL 1L2' 17W T8EE/ELEE LOW
PWR 14
1F17ESN 1L2' 17W T8EE/ELEE 17
1F17ESH 1L2' 17W T8EE/ELEE HIGH
PWR 20
1F28BXE 1L2' F28BX/ELIG 32
2F17ESL 2L2' 17W T8EE/ELEE LOW
PWR 27
2F17ESN 2L2' 17W T8EE/ELEE 32
2F17ESH 2L2' 17W T8EE/ELEE HIGH
PWR 40
2F28BXE 2L2' F28BX/ELIG 63
3F17ESL 3L2' 17W T8EE/ELEE LOW
PWR 39
3F17ESN 3L2' 17W T8EE/ELEE 46
3F17ESH 3L2' 17W T8EE/ELEE HIGH
PWR 61
3F28BXE 3L2' F28BX/ELIG 94
Three Foot High Efficient T8 Systems
1F25ESL 1L3' 25W T8EE/ELEE LOW
PWR 21
1F25ESN 1L3' 25W T8EE/ELEE 24
1F25ESH 1L3' 25W T8EE/ELEE HIGH
PWR 30
2F25ESL 2L3' 25W T8EE/ELEE LOW
PWR 40
2F25ESN 2L3' 25W T8EE/ELEE 45
2F25ESH 2L3' 25W T8EE/ELEE HIGH
PWR 60
3F25ESL 3L3' 25W T8EE/ELEE LOW
PWR 58
3F25ESN 3L3' 25W T8EE/ELEE 67
3F25ESH 3L3' 25W T8EE/ELEE HIGH
PWR 90
Device
Code Device Description
Rated
Watts
Four Foot T8 High Efficient / Reduce Wattage Systems
1F25EEH 1L4' 25W T8EE/ELEE HIGH
PWR 30
1F25EEE 1L4' 25W T8EE/ELEE 22
1F25EEL 1L4' 25W T8EE/ELEE LOW
PWR 19
2F25EEH 2L4' 25W T8EE/ELEE HIGH
PWR 57
2F25EEE 2L4' 25W T8EE/ELEE 43
2F25EEL 2L4' 25W T8EE/ELEE LOW
PWR 37
3F25EEH 3L4' 25W T8EE/ELEE HIGH
PWR 86
3F25EEE 3L4' 25W T8EE/ELEE 64
3F25EEL 3L4' 25W T8EE/ELEE LOW
PWR 57
4F25EEH 4L4' 25W T8EE/ELEE HIGH
PWR 111
4F25EEE 4L4' 25W T8EE/ELEE 86
4F25EEL 4L4' 25W T8EE/ELEE LOW
PWR 75
1F28EEH 1L4' 28W T8EE/ELEE HIGH
PWR 33
1F28EEE 1L4' 28W T8EE/ELEE 24
1F28EEL 1L4' 28W T8EE/ELEE LOW
PWR 22
2F28EEH 2L4' 28WT8EE/ELEE HIGH
PWR 64
2F28EEE 2L4' 28W T8EE/ELEE 48
2F28EEL 2L4' 28W T8EE/ELEE LOW
PWR 42
3F28EEH 3L4' 28W T8EE/ELEE HIGH
PWR 96
3F28EEE 3L4' 28W T8EE/ELEE 72
3F28EEL 3L4' 28W T8EE/ELEE LOW
PWR 63
4F28EEH 4L4' 28W T8EE/ELEE HIGH
PWR 126
4F28EEE 4L4' 28W T8EE/ELEE 94
4F28EEL 4L4' 28W T8EE/ELEE LOW
PWR 83
1F30EEH 1L4' 30W T8EE/ELEE HIGH
PWR 36
1F30EEE 1L4' 30W T8EE/ELEE 26
1F30EEL 1L4' 30W T8EE/ELEE LOW
PWR 24
2F30EEH 2L4' 30WT8EE/ELEE HIGH
PWR 69
2F30EEE 2L4' 30W T8EE/ELEE 52
2F30EEL 2L4' 30W T8EE/ELEE LOW
PWR 45
3F30EEH 3L4' 30W T8EE/ELEE HIGH
PWR 103
3F30EEE 3L4' 30W T8EE/ELEE 77

Massachusetts Technical Reference Manual Appendix A: Common Lookup Tables
October 2011 355 © 2011 Massachusetts Electric and Gas Energy
Efficiency Program Administrators, ALL RIGHTS RESERVED
Device
Code Device Description
Rated
Watts
Four Foot T8 High Efficient / Reduce Wattage Systems
(cont.)
3F30EEL 3L4' 30W T8EE/ELEE LOW
PWR 68
4F30EEH 4L4' 30W T8EE/ELEE HIGH
PWR 133
4F30EEE 4L4' 30W T8EE/ELEE 101
4F30EEL 4L4' 30W T8EE/ELEE LOW
PWR 89
1F32EEH 1L4' 32W T8EE/ELEE HIGH
PWR 38
1F32EEE 1L4' 32W T8EE/ELEE 28
1F32EEL 1L4' 32W T8EE/ELEE LOW
PWR 25
2F32EEH 2L4' 32W T8EE/ELEE HIGH
PWR 73
2F32EEE 2L4' 32W T8EE/ELEE 53
2F32EEL 2L4' 32W T8EE/ELEE LOW
PWR 47
3F32EEH 3L4' 32W T8EE/ELEE HIGH
PWR 109
3F32EEE 3L4' 32W T8EE/ELEE 82
3F32EEL 3L4' 32W T8EE/ELEE LOW
PWR 72
4F32EEH 4L4' 32W T8EE/ELEE HIGH
PWR 141
4F32EEE 4L4' 32W T8EE/ELEE 107
4F32EEL 4L4' 32W T8EE/ELEE LOW
PWR 95
6F32EEH 6L4' 32W T8EE/ELEE HIGH
PWR 218
6F32EEE 6L4' 32W T8EE/ELEE 168
6F32EEL 6L4' 32W T8EE/ELEE LOW
PWR 146
Eight Foot T8 Systems
1F59SSE 1L8' T8/ELIG 60
1F80SSE 1L8' T8 HO/ELIG 85
2F59SSE 2L8' T8/ELIG 109
2F59SSL 2L8' T8/ELIG LOW PWR 100
2F80SSE 2L8' T8 HO/ELIG 160
LED Lighting Fixtures
1L002 2 WATT LED 2
1L003 3 WATT LED 3
1L004 4 WATT LED 04
1L005 5 WATT LED 05
1L006 6 WATT LED 06
1L007 7 WATT LED 07
1L008 8 WATT LED 08
1L009 9 WATT LED 09
Device
Code Device Description
Rated
Watts
LED Lighting Fixtures (cont.)
1L010 10 WATT LED 10
1L011 11 WATT LED 11
1L012 12 WATT LED 12
1L013 13 WATT LED 13
1L014 14 WATT LED 14
1L015 15 WATT LED 15
1L016 16 WATT LED 16
1L017 17 WATT LED 17
1L018 18 WATT LED 18
1L019 19 WATT LED 19
1L020 20 WATT LED 20
1L021 21 WATT LED 21
1L022 22 WATT LED 22
1L023 23 WATT LED 23
1L024 24 WATT LED 24
1L025 25 WATT LED 25
1L026 26 WATT LED 26
1L027 27 WATT LED 27
1L028 28 WATT LED 28
1L029 29 WATT LED 29
1L030 30 WATT LED 30
1L031 31 WATT LED 31
1L032 32 WATT LED 32
1L033 33 WATT LED 33
1L034 34 WATT LED 34
1L035 35 WATT LED 35
1L036 36 WATT LED 36
1L037 37 WATT LED 37
1L038 38 WATT LED 38
1L039 39 WATT LED 39
1L040 40 WATT LED 40
1L041 41 WATT LED 41
1L042 42 WATT LED 42
1L043 43 WATT LED 43
1L044 44 WATT LED 44
1L045 45 WATT LED 45
1L046 46 WATT LED 46
1L047 47 WATT LED 47
1L048 48 WATT LED 48
1L049 49 WATT LED 49
1L050 50 WATT LED 50
1L055 55 WATT LED 55
1L060 60 WATT LED 60
1L070 70 WATT LED 70

Massachusetts Technical Reference Manual Appendix A: Common Lookup Tables
October 2011 356 © 2011 Massachusetts Electric and Gas Energy
Efficiency Program Administrators, ALL RIGHTS RESERVED
1L073 73 WATT LED 73
Device
Code Device Description
Rated
Watts
LED Lighting Fixtures (cont.)
1L075 75 WATT LED 75
1L080 90 WATT LED 90
1L085 85 WATT LED 85
1L090 90 WATT LED 90
1L095 95 WATT LED 95
1L100 100 WATT LED 100
1L106 106 WATT LED 106
1L107 107 WATT LED 107
1L116 116 WATT LED 116
1L120 120 WATT LED 120
1L125 125 WATT LED 125
1L130 130 WATT LED 130
1L135 135 WATT LED 135
1L140 140 WATT LED 140
1L145 145 WATT LED 145
1L150 150 WATT LED 150
1L155 155 WATT LED 155
1L160 160 WATT LED 160
1L165 165 WATT LED 165
1L170 170 WATT LED 170
1L175 175 WATT LED 175
1L180 180 WATT LED 180
1L185 185 WATT LED 185
1L190 190 WATT LED 190
1L200 200 WATT LED 200
Device
Code Device Description
Rated
Watts
LED Lighting Fixtures (cont.)
1L210 210 WATT LED 210
1L220 220 WATT LED 220
1L240 240 WATT LED 240
Electronic Metal Halide Lamps
1M0150E 150W METAL HALIDE EB 160
1M0200E 200W METAL HALIDE EB 215
1M0250E 250W METAL HALIDE EB 270
1M0320E 320W METAL HALIDE EB 345
1M0350E 350W METAL HALIDE EB 375
1M0400E 400W METAL HALIDE EB 430
1M0450E 400W METAL HALIDE EB 480
MH Track Lighting
1M0020E 20W MH SPOT 25
1M0025E 25W MH SPOT 25
1M0035E 35W MH SPOT 44
1M0039E 39W MH SPOT 47
1M0050E 50W MH SPOT 60
1M0070E 70W MH SPOT 80
1M0100E 100W MH SPOT 111
1M0150E 150W MH SPOT 162

Massachusetts Technical Reference Manual Appendix A: Common Lookup Tables
October 2011 357 © 2011 Massachusetts Electric and Gas Energy
Efficiency Program Administrators, ALL RIGHTS RESERVED
Table 50: Default Effective Lighting Hours by Building Type622
Building Type Annual Operating Hours
Assembly 2857 (one shift)
Automobile 4056 (retail)
Big Box 4057 (retail)
Community College 3255
Dormitory 3,056
Fast Food 5110
Full Service Restaurant 5110
Grocery 6074
Heavy Industrial 4,057
Hospital 8036
Hotel 8583
Large Refrigerated Space 2602 (warehouse)
Large Office 3610
Light Industrial 4,730 (two shift)
Motel 8583
Multi Story Retail 4089
Multifamily high-rise 7665 (Common Area)
Multifamily low-rise 7665 (Common Area)
Other 3951
Religious 1955
K-12 Schools 2596
Small Office 3610
Small Retail 4089
University 3255
Warehouse 3759
Table 51: Cooling and Heating Equivalent Full Load Hours
Building (or Space) Type Cooling Full Load Hours (EFLHcool) Heating Full Load Hours
(EFLHheat)
Average – CLC 1,172 530
Average – NSTAR 1,172 N/A
Average – National Grid 989 881
Average – Unitil 719 1,398
Average – WMECO 755 1,329
Site Specific - NSTAR 800, 1000-6000 at 1000 hour increments N/A
� Average Cooling EFLHs from the 2010 NEEP HVAC Loadshape study.623 � Average Heating EFLHs derived from 2010 NEEP HVAC Loadshape study624 and the Connecticut
Program Savings Document for 2011 Program Year. 625
622 Lighting hours developed from Massachusetts Common Assumptions and New York Standard Approach for Estimating Energy Savings from Energy Efficiency Programs (2010). Values are provided for use when site-specific hours are not available. 623 KEMA (2011). C&I Unitary AC LoadShape Project – Final Report. Prepared for the Regional Evaluation, Measurement & Verification Forum. 624 Ibid. 625 United Illuminating Company, Connecticut Light & Power Company (2010). UI and CL&P Program Savings Documentation
for 2011 Program Year.
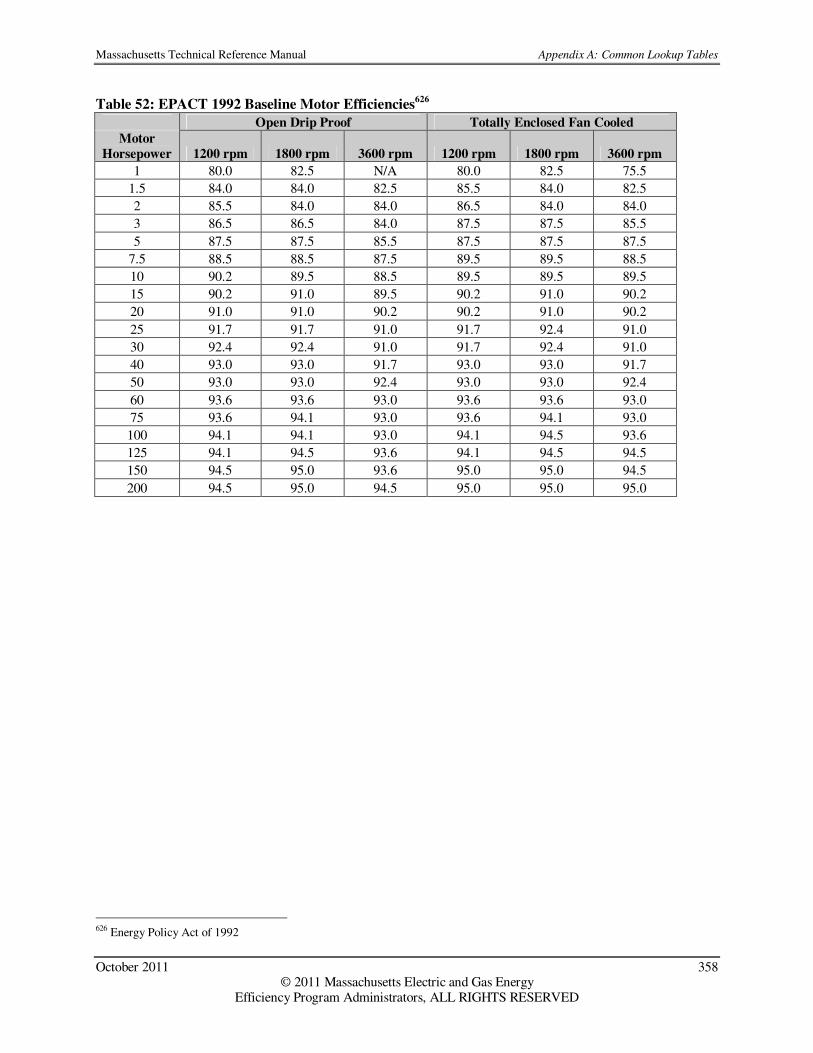
Massachusetts Technical Reference Manual Appendix A: Common Lookup Tables
October 2011 358 © 2011 Massachusetts Electric and Gas Energy
Efficiency Program Administrators, ALL RIGHTS RESERVED
Table 52: EPACT 1992 Baseline Motor Efficiencies626
Open Drip Proof Totally Enclosed Fan Cooled
Motor
Horsepower 1200 rpm 1800 rpm 3600 rpm 1200 rpm 1800 rpm 3600 rpm
1 80.0 82.5 N/A 80.0 82.5 75.5
1.5 84.0 84.0 82.5 85.5 84.0 82.5
2 85.5 84.0 84.0 86.5 84.0 84.0
3 86.5 86.5 84.0 87.5 87.5 85.5
5 87.5 87.5 85.5 87.5 87.5 87.5
7.5 88.5 88.5 87.5 89.5 89.5 88.5
10 90.2 89.5 88.5 89.5 89.5 89.5
15 90.2 91.0 89.5 90.2 91.0 90.2
20 91.0 91.0 90.2 90.2 91.0 90.2
25 91.7 91.7 91.0 91.7 92.4 91.0
30 92.4 92.4 91.0 91.7 92.4 91.0
40 93.0 93.0 91.7 93.0 93.0 91.7
50 93.0 93.0 92.4 93.0 93.0 92.4
60 93.6 93.6 93.0 93.6 93.6 93.0
75 93.6 94.1 93.0 93.6 94.1 93.0
100 94.1 94.1 93.0 94.1 94.5 93.6
125 94.1 94.5 93.6 94.1 94.5 94.5
150 94.5 95.0 93.6 95.0 95.0 94.5
200 94.5 95.0 94.5 95.0 95.0 95.0
626 Energy Policy Act of 1992

Massachusetts Technical Reference Manual Appendix A: Common Lookup Tables
October 2011 359 © 2011 Massachusetts Electric and Gas Energy
Efficiency Program Administrators, ALL RIGHTS RESERVED
Table 53: Minimum Premium Efficiency Motors Compliance Efficiencies627
Open Drip Proof Totally Enclosed Fan Cooled
Motor
Horsepower 1200 rpm 1800 rpm 3600 rpm 1200 rpm 1800 rpm 3600 rpm
1 82.5 85.5 N/A 82.5 85.5 77.0
1.5 86.5 86.5 84 87.5 86.5 84
2 87.5 86.5 85.5 88.5 86.5 85.5
3 88.5 89.5 85.5 89.5 89.5 86.5
5 89.5 89.5 86.5 89.5 89.5 88.5
7.5 90.2 91 88.5 91 91.7 89.5
10 91.7 91.7 89.5 91 91.7 90.2
15 97.7 93 90.2 91.7 92.4 91
20 92.4 93 91 91.7 93 91
25 93 93.6 91.7 93 93.6 91.7
30 93.6 94.1 91.7 93 93.6 91.7
40 94.1 94.1 92.4 94.1 94.1 92.4
50 94.1 94.5 93 94.1 94.5 93
60 94.5 95 93.6 94.5 95 93.6
75 94.5 95 93.6 94.5 95.4 93.6
100 95 95.4 93.6 95 95.4 94.1
125 95 95.4 94.1 95 95.4 95
150 95.4 95.8 94.1 95.8 95.8 95
200 95.4 95.8 95 95.8 96.2 95.4
627 NEMA Premium MG1-2006 Table 12-12

Massachusetts Technical Reference Manual Appendix B: Common Program Names
October 2011 360 © 2011 Massachusetts Electric and Gas Energy
Efficiency Program Administrators, ALL RIGHTS RESERVED
Appendix B: Common Program Names
The common Program Naming (CPN) of the efficiency programs offered by the program administrators is a work in progress. Among other things, the goals of the CPN are to:
• avoid the use of product names (e.g., OPower),
• provide a commonality for gas and electric programs (e.g., MassSAVE for electric, and weatherization for gas), and
• characterize programs such that a consistent primary name (e.g., Retrofit) is used for all sectors. CPN was introduced to PAs in the late summer of 2009. Given the tight schedule for filing 2010-2012 program plans, the PAs agreed to work to incorporate these names at a later date. The PAs will work with the DOER to integrate these into future plan updates.

Massachusetts Technical Reference Manual Appendix C: Net-to-Gross Impact Factors
October 2011 361 © 2011 Massachusetts Electric and Gas Energy
Efficiency Program Administrators, ALL RIGHTS RESERVED
Appendix C: Net to Gross Impact Factors
Residential Electric Measures
Measure PA FR SOP SONP NTG
Residential New Construction & Major Renovation
Dishwashers All 0% 0% 0% 100%
ES Homes - Cooling All 0% 0% 0% 100%
ES Homes - Heating All 0% 0% 0% 100%
ES Homes - Water Heating All 0% 0% 0% 100%
Indoor Fixture All 0% 0% 0% 100%
LED Fixture All 0% 0% 0% 100%
Refrigerators All 0% 0% 0% 100%
Screw-in Bulbs All 0% 0% 0% 100%
Residential Cooling & Heating Equipment
Brushless Furnace Fan Motor All 15% 0% 0% 85%
CoolSmart AC (SEER >= 15 / EER >= 12.5) All 15% 0% 0% 85%
CoolSmart AC (SEER >= 15 / EER >= 13) All 15% 0% 0% 85%
CoolSmart AC (SEER 14.5 / EER 12) All 15% 0% 0% 85%
CoolSmart AC Digital Check-up/Tune-up All 15% 0% 0% 85%
CoolSmart AC MS (SEER 16 / EER 13) All 15% 0% 0% 85%
CoolSmart AC QIV ES All 15% 0% 0% 85%
CoolSmart AC QIV NES All 15% 0% 0% 85%
CoolSmart HP (SEER >= 15) All 15% 0% 0% 85%
CoolSmart HP (SEER 14.5 / EER 12) All 15% 0% 0% 85%
CoolSmart HP Digital Check-up/Tune-up All 15% 0% 0% 85%
CoolSmart HP MS (SEER 19 / EER 12.8 / HSPF 10.1) All 15% 0% 0% 85%
CoolSmart HP MS (SEER 23 / EER 13 / HSPF 10.6) All 15% 0% 0% 85%
CoolSmart HP QIV ES All 15% 0% 0% 85%
CoolSmart HP QIV NES All 15% 0% 0% 85%
CoolSmart Warm Air Furnace ECM All 15% 0% 0% 85%
Down Size 1/2 Ton All 15% 0% 0% 85%
Duct Sealing All 15% 0% 0% 85%
Ductless Mini Split AC All 15% 0% 0% 85%
Ductless Mini Split HP All 15% 0% 0% 85%
Ductless Mini Split HP/AC Retrofit All 15% 0% 0% 85%
Early Replacement of AC/HP Equipment All 15% 0% 0% 85%
Energy Star QI All 15% 0% 0% 85%
Energy Star QI w/ Duct modifications All 15% 0% 0% 85%
Right Sizing All 15% 0% 0% 85%
HPWH, Electric, 80 gal All 0% 0% 0% 100%
HPWH, Electric, 50 gal All 0% 0% 0% 100%
HPWH, Propane, 50 gal CLC 0% 0% 0% 100%
HPWH, Oil, 80 gal All 0% 0% 0% 100%
HPWH, Oil, 50 gal All 0% 0% 0% 100%

Massachusetts Technical Reference Manual Appendix C: Net-to-Gross Impact Factors
October 2011 362 © 2011 Massachusetts Electric and Gas Energy
Efficiency Program Administrators, ALL RIGHTS RESERVED
TXV Replacement of Fixed Orifice All 15% 0% 0% 85%
Residential Retrofit 1-4
Air Sealing, Electric All 7% 0% 0% 93%
Air Sealing, Gas All 7% 0% 0% 93%
Air Sealing, Oil All 7% 0% 0% 93%
Air Sealing, Other FF All 7% 0% 0% 93%
Boiler Reset Controls All 0% 0% 0% 100%
DHW ISMs, Electric All 2% 0% 0% 98%
DHW ISMs, Gas All 2% 0% 0% 98%
DHW ISMs, Oil All 2% 0% 0% 98%
DHW ISMs, Other FF All 2% 0% 0% 98%
Duct Insulation, Electric All 20% 8% 50% 138%
Duct Insulation, Gas All 20% 8% 50% 138%
Duct Insulation, Oil All 20% 8% 50% 138%
Duct Insulation, Other FF All 20% 8% 50% 138%
Duct Seal, Electric All 7% 0% 0% 93%
Duct Seal, Gas All 7% 0% 0% 93%
Duct Seal, Oil All 7% 0% 0% 93%
Duct Seal, Other FF All 7% 0% 0% 93%
ES Window, Electric All 0% 0% 0% 100%
ES Window, Gas All 0% 0% 0% 100%
ES Window, Oil All 0% 0% 0% 100%
ES Window, Other FF All 0% 0% 0% 100%
Heating System Replacement, Gas All 28% 0% 0% 72%
Heating System Replacement, Oil All 28% 0% 0% 72%
Heating System Replacement, Other FF All 28% 0% 0% 72%
Indirect Water Heater, Oil All 25% 0% 0% 75%
Indirect Water Heater, Other FF All 25% 0% 0% 75%
Insulation, Electric All 20% 8% 50% 138%
Insulation, Gas All 20% 8% 50% 138%
Insulation, Oil All 20% 8% 50% 138%
Insulation, Other FF All 20% 8% 50% 138%
Refrigerator (ES Value) All 5% 0% 0% 95%
Refrigerator (Retriement Value) All 5% 0% 0% 95%
Screw-in Bulbs All 22% 19% 0% 97%
Screw-in Bulbs (piggyback) All 22% 19% 0% 97%
Smart Strips All 0% 0% 0% 100%
Thermostats, Electric All 11% 0% 0% 89%
Thermostats, Gas All 11% 0% 0% 89%
Thermostats, Oil All 11% 0% 0% 89%
Thermostats, Other FF All 11% 0% 0% 89%
Torchiere All 6% 3% 0% 97%
Residential Retrofit Multifamily
Air Sealing (Electric) All 3% 0% 0% 97%

Massachusetts Technical Reference Manual Appendix C: Net-to-Gross Impact Factors
October 2011 363 © 2011 Massachusetts Electric and Gas Energy
Efficiency Program Administrators, ALL RIGHTS RESERVED
Air Sealing (FF) All 3% 0% 0% 97%
CFL (Electric) All 3% 0% 0% 97%
CFL (Non-Electric) All 3% 0% 0% 97%
Common Area Interior Fixtures All 3% 0% 0% 97%
Common Area Occupancy Sensors All 3% 0% 0% 97%
DHW Measures (FF) All 3% 0% 0% 97%
DHW Measures (Electric) All 3% 0% 0% 97%
Fixtures (Electric) National Grid 3% 0% 0% 97%
Fixtures (Non-Electric) National Grid 3% 0% 0% 97%
Heat Pump Tune-Up (Electric) All 3% 0% 0% 97%
Indoor Fixture All 8% 4% 0% 96%
Insulation (Electric) All 3% 0% 0% 97%
Insulation (FF) All 3% 0% 0% 97%
Outdoor Fixture All 12% 7% 0% 95%
Programmable Thermostats (Electric) All 3% 0% 0% 97%
Programmable Thermostats (FF) All 3% 0% 0% 97%
Refrigerator (ES Value) All 3% 0% 0% 97%
Refrigerator (Retirement Value) All 3% 0% 0% 97%
Refrigerators/Freezers (Electric Heat) National Grid 3% 0% 0% 97%
Refrigerators/Freezers (Non-Electric Heat) National Grid 3% 0% 0% 97%
Room AC All 35% 0% 0% 65%
Screw-in Bulbs All 3% 0% 0% 97%
Smart Strips All 0% 0% 0% 100%
SPACE Air Sealing (Electric) National Grid 3% 0% 0% 97%
SPACE Air Sealing (Non-Electric) National Grid 3% 0% 0% 97%
SPACE Insulation (Electric) National Grid 3% 0% 0% 97%
SPACE Insulation (Non-Electric) National Grid 3% 0% 0% 97%
SPACE Thermostats (Electric) National Grid 3% 0% 0% 97%
SPACE Thermostats (Non-Electric) National Grid 3% 0% 0% 97%
Behavior/Feedback Program
Group 2009 Pilot National Grid 0% 0% 0% 100%
Group 2010 Added National Grid 0% 0% 0% 100%
Group 2010 February National Grid 0% 0% 0% 100%
Group 2011 February National Grid 0% 0% 0% 100%
Group 2012 February National Grid 0% 0% 0% 100%
2012 Dual Fuel NSTAR 0% 0% 0% 100%
Residential Lighting
Indoor Fixture All 8% 4% 0% 96%
LED Fixture All 0% 0% 0% 100%
LED Lamp All 0% 0% 0% 100%
Outdoor Fixture All 12% 7% 0% 95%
Screw-in Bulbs All 57% 0% 0% 43%
Screw-in Bulbs (Hard to Reach) All 40% 0% 0% 60%
Screw-in Bulbs (School Fundraiser) All 0% 0% 0% 100%
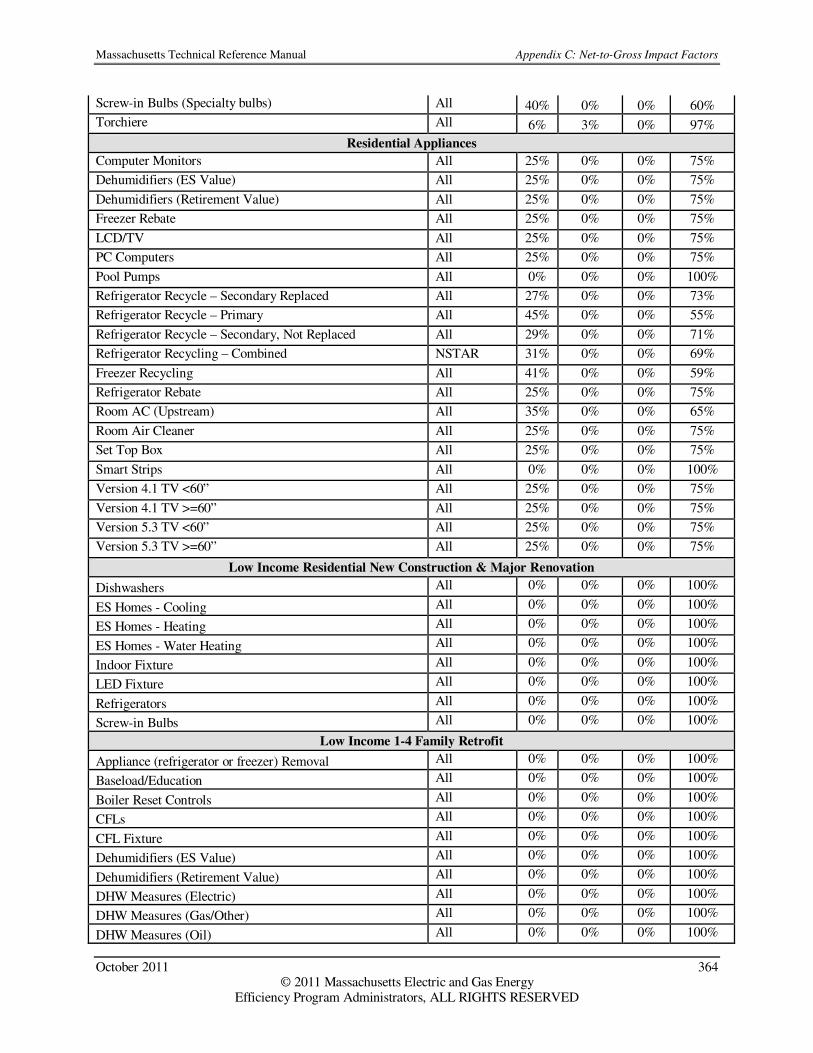
Massachusetts Technical Reference Manual Appendix C: Net-to-Gross Impact Factors
October 2011 364 © 2011 Massachusetts Electric and Gas Energy
Efficiency Program Administrators, ALL RIGHTS RESERVED
Screw-in Bulbs (Specialty bulbs) All 40% 0% 0% 60%
Torchiere All 6% 3% 0% 97%
Residential Appliances
Computer Monitors All 25% 0% 0% 75%
Dehumidifiers (ES Value) All 25% 0% 0% 75%
Dehumidifiers (Retirement Value) All 25% 0% 0% 75%
Freezer Rebate All 25% 0% 0% 75%
LCD/TV All 25% 0% 0% 75%
PC Computers All 25% 0% 0% 75%
Pool Pumps All 0% 0% 0% 100%
Refrigerator Recycle – Secondary Replaced All 27% 0% 0% 73%
Refrigerator Recycle – Primary All 45% 0% 0% 55%
Refrigerator Recycle – Secondary, Not Replaced All 29% 0% 0% 71%
Refrigerator Recycling – Combined NSTAR 31% 0% 0% 69%
Freezer Recycling All 41% 0% 0% 59%
Refrigerator Rebate All 25% 0% 0% 75%
Room AC (Upstream) All 35% 0% 0% 65%
Room Air Cleaner All 25% 0% 0% 75%
Set Top Box All 25% 0% 0% 75%
Smart Strips All 0% 0% 0% 100%
Version 4.1 TV <60” All 25% 0% 0% 75%
Version 4.1 TV >=60” All 25% 0% 0% 75%
Version 5.3 TV <60” All 25% 0% 0% 75%
Version 5.3 TV >=60” All 25% 0% 0% 75%
Low Income Residential New Construction & Major Renovation
Dishwashers All 0% 0% 0% 100%
ES Homes - Cooling All 0% 0% 0% 100%
ES Homes - Heating All 0% 0% 0% 100%
ES Homes - Water Heating All 0% 0% 0% 100%
Indoor Fixture All 0% 0% 0% 100%
LED Fixture All 0% 0% 0% 100%
Refrigerators All 0% 0% 0% 100%
Screw-in Bulbs All 0% 0% 0% 100%
Low Income 1-4 Family Retrofit
Appliance (refrigerator or freezer) Removal All 0% 0% 0% 100%
Baseload/Education All 0% 0% 0% 100%
Boiler Reset Controls All 0% 0% 0% 100%
CFLs All 0% 0% 0% 100%
CFL Fixture All 0% 0% 0% 100%
Dehumidifiers (ES Value) All 0% 0% 0% 100%
Dehumidifiers (Retirement Value) All 0% 0% 0% 100%
DHW Measures (Electric) All 0% 0% 0% 100%
DHW Measures (Gas/Other) All 0% 0% 0% 100%
DHW Measures (Oil) All 0% 0% 0% 100%

Massachusetts Technical Reference Manual Appendix C: Net-to-Gross Impact Factors
October 2011 365 © 2011 Massachusetts Electric and Gas Energy
Efficiency Program Administrators, ALL RIGHTS RESERVED
Electric Weatherization All 0% 0% 0% 100%
Freezer Replacement All 0% 0% 0% 100%
Heating System Replacement (Oil) All 0% 0% 0% 100%
Oil Weatherization All 0% 0% 0% 100%
Gas Weatherization CLC 0% 0% 0% 100%
Other FF Weatherization CLC 0% 0% 0% 100%
Programmable Thermostats (Oil) All 0% 0% 0% 100%
Refrigerator Replacement All 0% 0% 0% 100%
Smart Strips All 0% 0% 0% 100%
Torchieres All 0% 0% 0% 100%
Waterbed All 0% 0% 0% 100%
Window AC Replacement All 0% 0% 0% 100%
Low Income Multi-Family Retrofit
Baseload All 0% 0% 0% 100%
CFL Fixtures All 0% 0% 0% 100%
CFLs All 0% 0% 0% 100%
DHW Measures All 0% 0% 0% 100%
Electric Weatherization All 0% 0% 0% 100%
Oil Weatherization CLC, Unitil 0% 0% 0% 100%
Freezer Replacement All 0% 0% 0% 100%
Heating System Replacement (Oil) All 0% 0% 0% 100%
Programmable Thermostats (Oil) CLC, Unitil 0% 0% 0% 100%
Refrigerator (ES Value) All 0% 0% 0% 100%
Refrigerator (Retirement Value) All 0% 0% 0% 100%
Second Refrigerator Removal CLC 0% 0% 0% 100%
Smart Strips All 0% 0% 0% 100%
Torchieres All 0% 0% 0% 100%
Waterbed All 0% 0% 0% 100%
Window AC Replacement All 0% 0% 0% 100%
Evaluations
Unless otherwise stated below, all PA’s use Massachusetts common assumptions for all residential electric measure free-ridership and spillover values. All PAs base the NTG factors for the ENERGY STAR Lighting Screw-In Bulbs and Screw-In Bulbs (Specialty bulbs) measures on the Massachusetts ENERGY STAR® Lighting Program: 2010 Annual Report.628 All PAs base the NTG factors for the MassSAVE Screw-In Bulbs, Screw-In Bulbs (piggyback), Refrigerator, Air Sealing, Insulation, Duct Seal, Duct Insulation, Thermostats, Heating System Replacement and Indirect Water Heater measures on the 2010 Net-to-Gross Findings: Home Energy Assessment study.629
628 NMR Group, Inc (2011). Massachusetts ENERGY STAR
® Lighting Program: 2010 Annual Report. Prepared for the Electric Program Administrators of Massachusetts; June 13, 2011. 629 The Cadmus Group (2011). 2010 Net-to-Gross Findings: Home Energy Assessment. Prepared for the Electric and Gas Program Administrators of Massachusetts; July 5, 2011.

Massachusetts Technical Reference Manual Appendix C: Net-to-Gross Impact Factors
October 2011 366 © 2011 Massachusetts Electric and Gas Energy
Efficiency Program Administrators, ALL RIGHTS RESERVED
Commercial Electric Measures
Measure PA FR SOP SONP NTG
C&I New Construction and Major Renovation
Advanced Lighting Design (Performance Lighting) National Grid 33% 29% 0% 96%
Advanced Lighting Design (Performance Lighting) NSTAR 12% 4% 0% 92%
Advanced Lighting Design (Performance Lighting) Unitil 19.9% 8.8% 0% 88.9%
Advanced Lighting Design (Performance Lighting) WMECo 20% 7% 0% 89%
Advanced Lighting Design (Performance Lighting) CLC 20% 0% 0% 80%
Lighting Controls National Grid 33% 29% 0% 96%
Lighting Controls NSTAR 12% 4% 0% 92%
Lighting Controls Unitil 19.9% 8.8% 0% 88.9%
Lighting Controls WMECo 20% 7% 0% 89%
Lighting Controls CLC 20% 0% 0% 80%
Lighting Systems National Grid 33% 29% 0% 96%
Lighting Systems NSTAR 12% 4% 0% 92%
Lighting Systems Unitil 19.9% 8.8% 0% 88.9%
Lighting Systems WMECo 20% 7% 0% 89%
Lighting Systems CLC 20% 0% 0% 80%
Demand Control Ventilation (DCV) National Grid 26% 2% 0% 75%
Demand Control Ventilation (DCV) NSTAR 21% 14% 0% 94%
Demand Control Ventilation (DCV) Unitil 30.6% 0% 3.6% 73%
Demand Control Ventilation (DCV) WMECo 30% 1% 0% 71%
Demand Control Ventilation (DCV) CLC 22% 12% 0% 90%
Dual Enthalpy Economizer Controls (DEEC) National Grid 26% 2% 0% 75%
Dual Enthalpy Economizer Controls (DEEC) NSTAR 21% 14% 0% 94%
Dual Enthalpy Economizer Controls (DEEC) Unitil 30.6% 0% 3.6% 73%
Dual Enthalpy Economizer Controls (DEEC) WMECo 30% 1% 0% 71% Dual Enthalpy Economizer Controls (DEEC) CLC 22% 12% 0% 90%
ECM Fan Motors National Grid 26% 2% 0% 75%
ECM Fan Motors NSTAR 21% 14% 0% 94%
ECM Fan Motors Unitil 30.6% 0% 3.6% 73%
ECM Fan Motors WMECo 30% 1% 0% 71%
ECM Fan Motors CLC 22% 12% 0% 90%
Energy Management System (EMS) CLC 22% 12% 0% 90%
HE Chiller National Grid 26% 2% 0% 75%
HE Chiller NSTAR 21% 14% 0% 94%
HE Chiller Unitil 30.6% 0% 3.6% 73%
HE Chiller WMECo 30% 1% 0% 71%
HE Chiller CLC 22% 12% 0% 90%
Single-Package and SS Heat Pump Systems National Grid 29% 2% 0% 73%
Single-Package and SS Heat Pump Systems NSTAR 21% 14% 0% 94%
Single-Package and SS Heat Pump Systems Unitil 30.6% 0% 3.6% 73%
Single-Package and SS Heat Pump Systems WMECo 30% 1% 0% 71%
Single-Package and SS Heat Pump Systems CLC 22% 12% 0% 90%
Single-Package and SS Unitary air conditioners National Grid 29% 2% 0% 73%
Single-Package and SS Unitary air conditioners NSTAR 21% 14% 0% 94%
Single-Package and SS Unitary air conditioners Unitil 30.6% 0% 3.6% 73%

Massachusetts Technical Reference Manual Appendix C: Net-to-Gross Impact Factors
October 2011 367 © 2011 Massachusetts Electric and Gas Energy
Efficiency Program Administrators, ALL RIGHTS RESERVED
Single-Package and SS Unitary air conditioners WMECo 30% 1% 0% 71%
Single-Package and SS Unitary air conditioners CLC 22% 12% 0% 90%
HE Air Compressor National Grid 32% 0% 2% 70%
HE Air Compressor NSTAR 37% 10% 1% 74%
HE Air Compressor Unitil 30.6% 0% 3.6% 73%
HE Air Compressor WMECo 34% 4% 2% 94%
HE Air Compressor CLC 34% 4% 2% 72%
Refrigerated Air Dryers National Grid 32% 0% 2% 70%
Refrigerated Air Dryers NSTAR 37% 10% 1% 74%
Refrigerated Air Dryers Unitil 30.6% 0% 3.6% 73%
Refrigerated Air Dryers WMECo 34% 4% 2% 94%
Refrigerated Air Dryers CLC 34% 4% 2% 72%
Variable Frequency Drives National Grid 25% 0% 8% 82%
Variable Frequency Drives NSTAR 23% 2% 8% 86%
Variable Frequency Drives Unitil 30.6% 0% 3.6% 73%
Variable Frequency Drives WMECo 23% 1% 8% 88%
Variable Frequency Drives CLC 23% 1% 8% 86%
Commercial Electric Ovens All 0% 0% 0% 100%
Commercial Electric Steam Cooker All 0% 0% 0% 100%
Commercial Electric Griddle All 0% 0% 0% 100%
Custom National Grid 16% 29% 0% 113%
Custom Unitil 20.% 11.5% 0% 92.3%
Custom - Compressed Air NSTAR 37% 10% 1% 74%
Custom - Cooling WMECo 30% 1% 0% 71%
Custom - HVAC NSTAR 21% 14% 0% 94%
Custom - HVAC CLC 22% 12% 0% 90%
Custom - Lighting NSTAR 12% 4% 0% 92%
Custom - Lighting WMECo 20% 7% 0% 88%
Custom - Lighting CLC 20% 0% 0% 80%
Custom - Motors NSTAR 23% 2% 8% 86%
Custom - Process WMECo 7% 0% 0% 93%
Custom - Process Equipment NSTAR 10% 1% 0% 91%
Custom - Refrigeration NSTAR 13% 35% 0% 122%
Custom - Refrigeration CLC 13% 35% 0% 122%
C&I Large Retrofit
Lighting Controls National Grid 17% 13% 0% 96%
Lighting Controls NSTAR 18% 18% 0% 101%
Lighting Controls Unitil 16.9% 8.4% 0% 91.5%
Lighting Controls WMECo 20% 3% 0% 85%
Lighting Controls CLC 17% 5% 0% 88%
Lighting Systems National Grid 17% 13% 0% 96%
Lighting Systems NSTAR 18% 18% 0% 101%
Lighting Systems Unitil 16.9% 8.4% 0% 91.5%
Lighting Systems WMECo 20% 3% 0% 85%
Lighting Systems CLC 17% 5% 0% 88%
Vending Machine and Cooler Controls (Lighting) NSTAR 18% 18% 0% 101%
Energy Management System (EMS) National Grid 11% 4% 0% 93%
Energy Management System (EMS) NSTAR 13% 6% 0% 93%
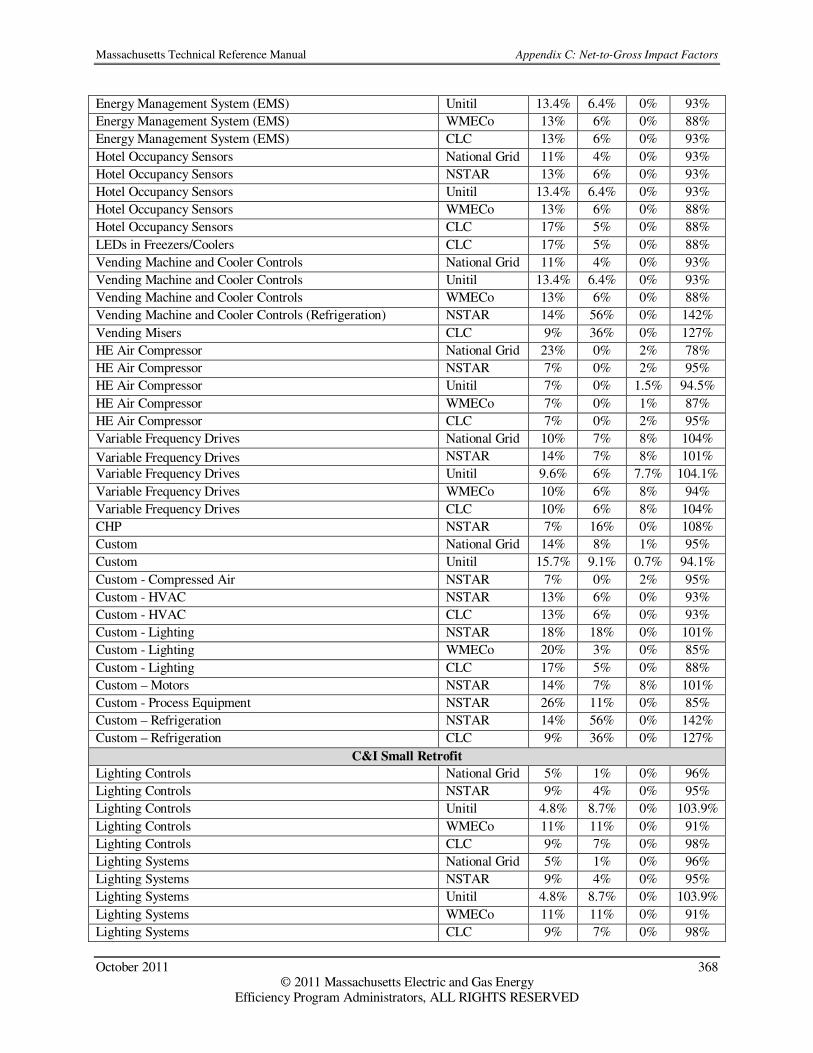
Massachusetts Technical Reference Manual Appendix C: Net-to-Gross Impact Factors
October 2011 368 © 2011 Massachusetts Electric and Gas Energy
Efficiency Program Administrators, ALL RIGHTS RESERVED
Energy Management System (EMS) Unitil 13.4% 6.4% 0% 93%
Energy Management System (EMS) WMECo 13% 6% 0% 88%
Energy Management System (EMS) CLC 13% 6% 0% 93%
Hotel Occupancy Sensors National Grid 11% 4% 0% 93%
Hotel Occupancy Sensors NSTAR 13% 6% 0% 93%
Hotel Occupancy Sensors Unitil 13.4% 6.4% 0% 93%
Hotel Occupancy Sensors WMECo 13% 6% 0% 88%
Hotel Occupancy Sensors CLC 17% 5% 0% 88%
LEDs in Freezers/Coolers CLC 17% 5% 0% 88%
Vending Machine and Cooler Controls National Grid 11% 4% 0% 93%
Vending Machine and Cooler Controls Unitil 13.4% 6.4% 0% 93%
Vending Machine and Cooler Controls WMECo 13% 6% 0% 88%
Vending Machine and Cooler Controls (Refrigeration) NSTAR 14% 56% 0% 142%
Vending Misers CLC 9% 36% 0% 127%
HE Air Compressor National Grid 23% 0% 2% 78%
HE Air Compressor NSTAR 7% 0% 2% 95%
HE Air Compressor Unitil 7% 0% 1.5% 94.5%
HE Air Compressor WMECo 7% 0% 1% 87%
HE Air Compressor CLC 7% 0% 2% 95%
Variable Frequency Drives National Grid 10% 7% 8% 104%
Variable Frequency Drives NSTAR 14% 7% 8% 101%
Variable Frequency Drives Unitil 9.6% 6% 7.7% 104.1%
Variable Frequency Drives WMECo 10% 6% 8% 94%
Variable Frequency Drives CLC 10% 6% 8% 104%
CHP NSTAR 7% 16% 0% 108%
Custom National Grid 14% 8% 1% 95%
Custom Unitil 15.7% 9.1% 0.7% 94.1%
Custom - Compressed Air NSTAR 7% 0% 2% 95%
Custom - HVAC NSTAR 13% 6% 0% 93%
Custom - HVAC CLC 13% 6% 0% 93%
Custom - Lighting NSTAR 18% 18% 0% 101%
Custom - Lighting WMECo 20% 3% 0% 85%
Custom - Lighting CLC 17% 5% 0% 88%
Custom – Motors NSTAR 14% 7% 8% 101%
Custom - Process Equipment NSTAR 26% 11% 0% 85%
Custom – Refrigeration NSTAR 14% 56% 0% 142%
Custom – Refrigeration CLC 9% 36% 0% 127%
C&I Small Retrofit
Lighting Controls National Grid 5% 1% 0% 96%
Lighting Controls NSTAR 9% 4% 0% 95%
Lighting Controls Unitil 4.8% 8.7% 0% 103.9%
Lighting Controls WMECo 11% 11% 0% 91%
Lighting Controls CLC 9% 7% 0% 98%
Lighting Systems National Grid 5% 1% 0% 96%
Lighting Systems NSTAR 9% 4% 0% 95%
Lighting Systems Unitil 4.8% 8.7% 0% 103.9%
Lighting Systems WMECo 11% 11% 0% 91%
Lighting Systems CLC 9% 7% 0% 98%

Massachusetts Technical Reference Manual Appendix C: Net-to-Gross Impact Factors
October 2011 369 © 2011 Massachusetts Electric and Gas Energy
Efficiency Program Administrators, ALL RIGHTS RESERVED
Energy Management Systems (EMS) CLC 7% 14% 0% 107%
Hotel Occupancy Sensors CLC 7% 14% 0% 107%
Programmable Thermostats National Grid 2% 2% 0% 100%
Programmable Thermostats NSTAR 10% 27% 0% 117%
Programmable Thermostats Unitil 6.8% 14% 0% 107.2%
Programmable Thermostats CLC 7% 14% 0% 107%
Case Motor Replacement National Grid 2% 2% 0% 100%
Case Motor Replacement NSTAR 2% 13% 0% 111%
Case Motor Replacement Unitil 2.2% 9.2% 0% 107%
Case Motor Replacement WMECo 3% 2% 0% 99%
Case Motor Replacement CLC 4% 0% 0% 96%
Cooler Night Covers National Grid 2% 2% 0% 100%
Cooler Night Covers NSTAR 2% 13% 0% 111%
Cooler Night Covers Unitil 2.2% 9.2% 0% 107%
Cooler Night Covers WMECo 3% 2% 0% 99%
Cooler Night Covers CLC 4% 0% 0% 96%
Cooler/Freezer Door Heater Control National Grid 2% 2% 0% 100%
Cooler/Freezer Door Heater Control NSTAR 2% 13% 0% 111%
Cooler/Freezer Door Heater Control Unitil 2.2% 9.2% 0% 107%
Cooler/Freezer Door Heater Control WMECo 3% 2% 0% 99%
Cooler/Freezer Door Heater Control CLC 4% 0% 0% 96%
Cooler/Freezer Evaporator Fan Controls National Grid 2% 2% 0% 100%
Cooler/Freezer Evaporator Fan Controls NSTAR 2% 13% 0% 111%
Cooler/Freezer Evaporator Fan Controls Unitil 2.2% 9.2% 0% 107%
Cooler/Freezer Evaporator Fan Controls WMECo 3% 2% 0% 99%
Cooler/Freezer Evaporator Fan Controls CLC 4% 0% 0% 96%
ECM for Evaporator Fans in Walk-in Coolers and Freezers National Grid 2% 2% 0% 100%
ECM for Evaporator Fans in Walk-in Coolers and Freezers NSTAR 2% 13% 0% 111%
ECM for Evaporator Fans in Walk-in Coolers and Freezers Unitil 2.2% 9.2% 0% 107%
ECM for Evaporator Fans in Walk-in Coolers and Freezers WMECo 3% 2% 0% 99%
ECM for Evaporator Fans in Walk-in Coolers and Freezers CLC 4% 0% 0% 96%
Electronic Defrost Control National Grid 2% 2% 0% 100%
Electronic Defrost Control NSTAR 2% 13% 0% 111%
Electronic Defrost Control Unitil 2.2% 9.2% 0% 107%
Electronic Defrost Control WMECo 3% 2% 0% 99%
Electronic Defrost Control CLC 4% 0% 0% 96%
LEDs in Freezers/Coolers National Grid 5% 1% 0% 96%
LEDs in Freezers/Coolers NSTAR 9% 4% 0% 95%
LEDs in Freezers/Coolers Unitil 4.8% 8.7% 0% 103.9%
LEDs in Freezers/Coolers WMECo 11% 1% 0% 91%
LEDs in Freezers/Coolers CLC 9% 7% 0% 98%
Novelty Cooler Shutoff National Grid 2% 2% 0% 100%
Novelty Cooler Shutoff NSTAR 2% 13% 0% 111%
Novelty Cooler Shutoff Unitil 2% 9% 0% 107%
Novelty Cooler Shutoff WMECo 3% 2% 0% 99%
Novelty Cooler Shutoff CLC 4% 0% 0% 96%
Vending Misers CLC 4% 0% 0% 96%
Variable Frequency Drives CLC 14% 0% 0% 86%
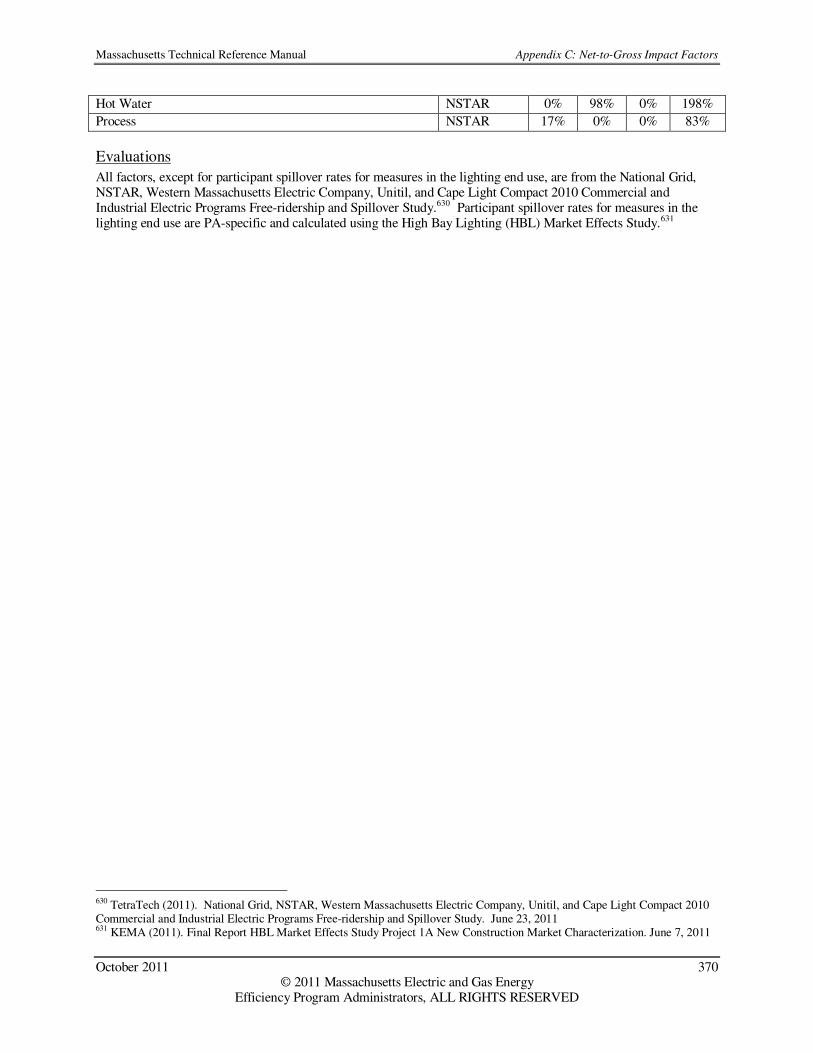
Massachusetts Technical Reference Manual Appendix C: Net-to-Gross Impact Factors
October 2011 370 © 2011 Massachusetts Electric and Gas Energy
Efficiency Program Administrators, ALL RIGHTS RESERVED
Hot Water NSTAR 0% 98% 0% 198%
Process NSTAR 17% 0% 0% 83%
Evaluations
All factors, except for participant spillover rates for measures in the lighting end use, are from the National Grid, NSTAR, Western Massachusetts Electric Company, Unitil, and Cape Light Compact 2010 Commercial and Industrial Electric Programs Free-ridership and Spillover Study.630 Participant spillover rates for measures in the lighting end use are PA-specific and calculated using the High Bay Lighting (HBL) Market Effects Study.631
630 TetraTech (2011). National Grid, NSTAR, Western Massachusetts Electric Company, Unitil, and Cape Light Compact 2010 Commercial and Industrial Electric Programs Free-ridership and Spillover Study. June 23, 2011 631 KEMA (2011). Final Report HBL Market Effects Study Project 1A New Construction Market Characterization. June 7, 2011

Massachusetts Technical Reference Manual Appendix C: Net-to-Gross Impact Factors
October 2011 371 © 2011 Massachusetts Electric and Gas Energy
Efficiency Program Administrators, ALL RIGHTS RESERVED
Residential Natural Gas Measures
Measure Name Program PA FR SOP SONP NTG
Residential New Construction and Major Renovation
Refrigerators All 0% 0% 0% 100%
ES Homes - Cooling All 0% 0% 0% 100%
ES Homes - Heating All 0% 0% 0% 100%
ES Homes - Water Heating All 0% 0% 0% 100%
Indoor Fixture All 0% 0% 0% 100%
LED Fixture All 0% 0% 0% 100%
Screw-in Bulbs All 0% 0% 0% 100%
Dishwashers All 0% 0% 0% 100%
Residential Heating and Water Heating
Boiler (AFUE >= 90%) All 60% 14% 0% 54% Boiler (AFUE >= 96%) All 25% 14% 0% 89% HTR Boiler (AFUE >= 90%) All 20% 0% 0% 80%
HTR Boiler (AFUE >= 96%) All 8% 0% 0% 92% Boiler Reset Controls All 0% 0% 0% 100% HTR Boiler Reset Controls All 0% 0% 0% 100%
Condensing Water Heater All 37% 0% 0% 63% HTR Condensing Water Heater All 12% 0% 0% 88% Early Replacement Boiler All 0% 0% 0% 100%
ES Programmable Thermostats All 58% 0% 0% 42% HTR ES Programmable Thermostats All 19% 0% 0% 81% Wi-Fi Thermostat NGRID 0% 0% 0% 100%
Furnace w/ ECM (AFUE = 95%) All 40% 19% 0% 79% Furnace w/ ECM (AFUE = 96%) All 25% 19% 0% 94% HTR Furnace w/ ECM (AFUE = 95%) All 13% 0% 0% 87%
HTR Furnace w/ ECM (AFUE = 96%) All 8% 0% 0% 92% Heat Recovery Ventilator All 0% 0% 0% 100% HTR Heat Recovery Ventilator All 0% 0% 0% 100%
Indirect Water Heater All 66% 0% 0% 34% HTR Indirect Water Heater All 22% 0% 0% 78% Integrated water heater/condensing boiler All 60% 14% 0% 54%
HTR Integrated water heater/condensing boiler All 20% 0% 0% 80% Stand Alone Storage Water Heater (EF >= 0.67) All 37% 0% 0% 63% HTR Stand Alone Storage Water Heater (EF >= 0.67) All 12% 0% 0% 88%
Tankless Water Heaters (EF >= 0.82) All 63% 0% 0% 37% Tankless Water Heaters (EF >= 0.95) All 37% 0% 0% 63% HTR Tankless Water Heaters (EF >= 0.82) All 21% 0% 0% 79%
HTR Tankless Water Heaters (EF >= 0.95) All 12% 0% 0% 88% Gas Heating System Replacement (Low Income) All 0% 0% 0% 100% Gas Weatherization (Low Income) All 0% 0% 0% 100%
Home Energy Services (Gas Weatherization)
Faucet Aerators All 0% 0% 0% 100%

Massachusetts Technical Reference Manual Appendix C: Net-to-Gross Impact Factors
October 2011 372 © 2011 Massachusetts Electric and Gas Energy
Efficiency Program Administrators, ALL RIGHTS RESERVED
Low-Flow Shower Heads All 0% 0% 0% 100%
Air Sealing All 7% 0% 0% 93%
Exterior Doors All 0% 0% 0% 100%
Insulation All 20% 8% 50% 138%
Thermostats All 11% 0% 0% 89%
Multifamily
Faucet Aerators All 23% 0% 0% 77%
Low-Flow Shower Heads All 23% 0% 0% 77%
Air Sealing All 0% 0% 0% 100%
Insulation All 20% 0% 0% 80%
Thermostats All 12% 0% 0% 88%
Low Income (Single Family and Multifamily)
Gas Heating System Replacement All 0% 0% 0% 100%
Gas Weatherization All 0% 0% 0% 100%
Faucet Aerators All 0% 0% 0% 100%
Low-Flow Shower Heads All 0% 0% 0% 100%
Air Sealing All 0% 0% 0% 100%
Insulation All 0% 0% 0% 100%
Thermostats All 0% 0% 0% 100%
Behavior/Feedback Program
Group 2009 Pilot National Grid 0% 0% 0% 100%
Group 2010 October National Grid 0% 0% 0% 100%
Group 2011 October National Grid 0% 0% 0% 100%
Group 2012 October National Grid 0% 0% 0% 100%
Group 2010 August NSTAR 0% 0% 0% 100%
Group 2011 January NSTAR 0% 0% 0% 100%
Evaluations
All NTG factors are set to 100% based on no completed evaluations, unless noted otherwise below. In the Residential Heating and Water Heating program, free-ridership rates are based on the results of the 2010 impact evaluation632 , the 2011 NTG study633 or NTGR agreed upon with the PAs and Consultants. The hard-to-reach (HTR) version of each of these measures has assumed free-ridership rates set to 1/3 the value of the non-HTR measure634. In the Multifamily program, NTG rates are based on the 2010 NTG Study635 while Home Energy Services (Gas Weatherization) is based on the results of the Home Energy Assessment NTG study636.
632 Nexus Market Research (2010). HEHE Process and Impact Evaluation. Prepared for GasNetworks 633 Nexus Market Research (2011). Estimated Net-To-Gross (NTG) Factors for the Massachusetts Program Administrators
(PAs) 2010 Residential New Construction Programs, Residential HEHE and Multi-Family Gas Programs, and Commercial and
Industrial Gas Programs. Prepared for Massachusetts Program Administrators and the Energy Efficiency Advisory Council. Study 11 in the 2010 Massachusetts Electric Energy Efficiency Annual Report 634 Massachusetts common assumption. 635 Nexus Market Research (2011). Estimated Net-To-Gross (NTG) Factors for the Massachusetts Program Administrators
(PAs) 2010 Residential New Construction Programs, Residential HEHE and Multi-Family Gas Programs, and Commercial and
Industrial Gas Programs. Prepared for Massachusetts Program Administrators and the Energy Efficiency Advisory Council. Study 11 in the 2010 Massachusetts Electric Energy Efficiency Annual Report

Massachusetts Technical Reference Manual Appendix C: Net-to-Gross Impact Factors
October 2011 373 © 2011 Massachusetts Electric and Gas Energy
Efficiency Program Administrators, ALL RIGHTS RESERVED
Commercial Natural Gas Measures
TRM Measure Group Program PA FR SOP SONP NTG
C&I New Construction & Major Renovation
Gas Condensing Hot Water Boilers NGRID 19.9% 2.4% 0% 82.5%
Gas Condensing Hot Water Boilers NSTAR 28.8% 0.3% 0% 71.5%
Gas Condensing Hot Water Boilers Columbia 45.6% 14.3% 0% 68.7%
Gas Condensing Hot Water Boilers Berkshire 39.3% 43.9% 0% 104.6%
Gas Condensing Hot Water Boilers NEG 27.2% 8.0% 0% 80.8%
Gas Condensing Hot Water Boilers Unitil 32.1% 0% 0% 67.9%
Integrated Water Heater/Condensing Boiler (0.90 EF, 0.90 AFUE)
NGRID 19.9% 2.4% 0% 82.5%
Integrated Water Heater/Condensing Boiler (0.90 EF, 0.90 AFUE)
NSTAR 28.8% 0.3% 0% 71.5%
Integrated Water Heater/Condensing Boiler (0.90 EF, 0.90 AFUE)
Columbia 45.6% 14.3% 0% 68.7%
Integrated Water Heater/Condensing Boiler (0.90 EF, 0.90 AFUE)
Berkshire 39.3% 43.9% 0% 104.6%
Integrated Water Heater/Condensing Boiler (0.90 EF, 0.90 AFUE)
NEG 27.2% 8.0% 0% 80.8%
Integrated Water Heater/Condensing Boiler (0.90 EF, 0.90 AFUE)
Unitil 32.1% 0% 0% 67.9%
Condensing Stand-Alone Water Heater NGRID 19.9% 2.4% 0% 82.5%
Condensing Stand-Alone Water Heater NSTAR 28.8% 0.3% 0% 71.5%
Condensing Stand-Alone Water Heater Columbia 45.6% 14.3% 0% 68.7%
Condensing Stand-Alone Water Heater Berkshire 39.3% 43.9% 0% 104.6%
Condensing Stand-Alone Water Heater NEG 27.2% 8.0% 0% 80.8%
Condensing Stand-Alone Water Heater Unitil 32.1% 0% 0% 67.9%
Furnaces NGRID 19.9% 2.4% 0% 82.5%
Furnaces NSTAR 28.8% 0.3% 0% 71.5%
Furnaces Columbia 45.6% 14.3% 0% 68.7%
Furnaces Berkshire 39.3% 43.9% 0% 104.6%
Furnaces NEG 27.2% 8.0% 0% 80.8%
Furnaces Unitil 32.1% 0% 0% 67.9%
Infrared Heaters NGRID 19.9% 2.4% 0% 82.5%
Infrared Heaters NSTAR 28.8% 0.3% 0% 71.5%
Infrared Heaters Columbia 45.6% 14.3% 0% 68.7%
Infrared Heaters Berkshire 39.3% 43.9% 0% 104.6%
Infrared Heaters NEG 27.2% 8.0% 0% 80.8%
Infrared Heaters Unitil 32.1% 0% 0% 67.9%
Water Heaters NGRID 19.9% 2.4% 0% 82.5%
Water Heaters NSTAR 28.8% 0.3% 0% 71.5%
Water Heaters Columbia 45.6% 14.3% 0% 68.7%
Water Heaters Berkshire 39.3% 43.9% 0% 104.6%
636 Cadmus (2011). 2010 Net-to-Gross Findings: Home Energy Assessment. The Electric and Gas Program Administrators of Massachusetts. Study 6 in the 2010 Massachusetts Electric Energy Efficiency Annual Report

Massachusetts Technical Reference Manual Appendix C: Net-to-Gross Impact Factors
October 2011 374 © 2011 Massachusetts Electric and Gas Energy
Efficiency Program Administrators, ALL RIGHTS RESERVED
Water Heaters NEG 27.2% 8.0% 0% 80.8%
Water Heaters Unitil 32.1% 0% 0% 67.9%
Commercial Ovens NGRID 19.9% 2.4% 0% 82.5%
Commercial Ovens NSTAR 28.8% 0.3% 0% 71.5%
Commercial Ovens Columbia 45.6% 14.3% 0% 68.7%
Commercial Ovens Berkshire 39.3% 43.9% 0% 104.6%
Commercial Ovens NEG 27.2% 8.0% 0% 80.8%
Commercial Ovens Unitil 32.1% 0% 0% 67.9%
Commercial Griddle NGRID 19.9% 2.4% 0% 82.5%
Commercial Griddle NSTAR 28.8% 0.3% 0% 71.5%
Commercial Griddle Columbia 45.6% 14.3% 0% 68.7%
Commercial Griddle Berkshire 39.3% 43.9% 0% 104.6%
Commercial Griddle NEG 27.2% 8.0% 0% 80.8%
Commercial Griddle Unitil 32.1% 0% 0% 67.9%
Commercial Fryers NGRID 19.9% 2.4% 0% 82.5%
Commercial Fryers NSTAR 28.8% 0.3% 0% 71.5%
Commercial Fryers Columbia 45.6% 14.3% 0% 68.7%
Commercial Fryers Berkshire 39.3% 43.9% 0% 104.6%
Commercial Fryers NEG 27.2% 8.0% 0% 80.8%
Commercial Fryers Unitil 32.1% 0% 0% 67.9%
Commercial Steamer NGRID 19.9% 2.4% 0% 82.5%
Commercial Steamer NSTAR 28.8% 0.3% 0% 71.5%
Commercial Steamer Columbia 45.6% 14.3% 0% 68.7%
Commercial Steamer Berkshire 39.3% 43.9% 0% 104.6%
Commercial Steamer NEG 27.2% 8.0% 0% 80.8%
Commercial Steamer Unitil 32.1% 0% 0% 67.9%
Custom Measures NGRID 31.2% 0.3% 0% 69.1%
Custom Measures NSTAR 24.0% 4.6% 0% 80.6%
Custom Measures Columbia 32.6% 44.2% 0% 111.6%
Custom Measures Berkshire 29.3% 21.5% 0% 92.2%
Custom Measures NEG 29.3% 21.5% 0% 92.2%
Custom Measures Unitil 29.3% 21.5% 0% 92.2%
C&I Retrofit
Boiler Reset Controls NGRID 19.9% 2.4% 0% 82.5%
Boiler Reset Controls NSTAR 28.8% 0.3% 0% 71.5%
Boiler Reset Controls Columbia 45.6% 14.3% 0% 68.7%
Boiler Reset Controls Berkshire 39.3% 43.9% 0% 104.6%
Boiler Reset Controls NEG 27.2% 8.0% 0% 80.8%
Boiler Reset Controls Unitil 32.1% 0% 0% 67.9%
ES Programmable Thermostats NGRID 19.9% 2.4% 0% 82.5%
ES Programmable Thermostats NSTAR 28.8% 0.3% 0% 71.5%
ES Programmable Thermostats Columbia 45.6% 14.3% 0% 68.7%
ES Programmable Thermostats Berkshire 39.3% 43.9% 0% 104.6%
ES Programmable Thermostats NEG 27.2% 8.0% 0% 80.8%
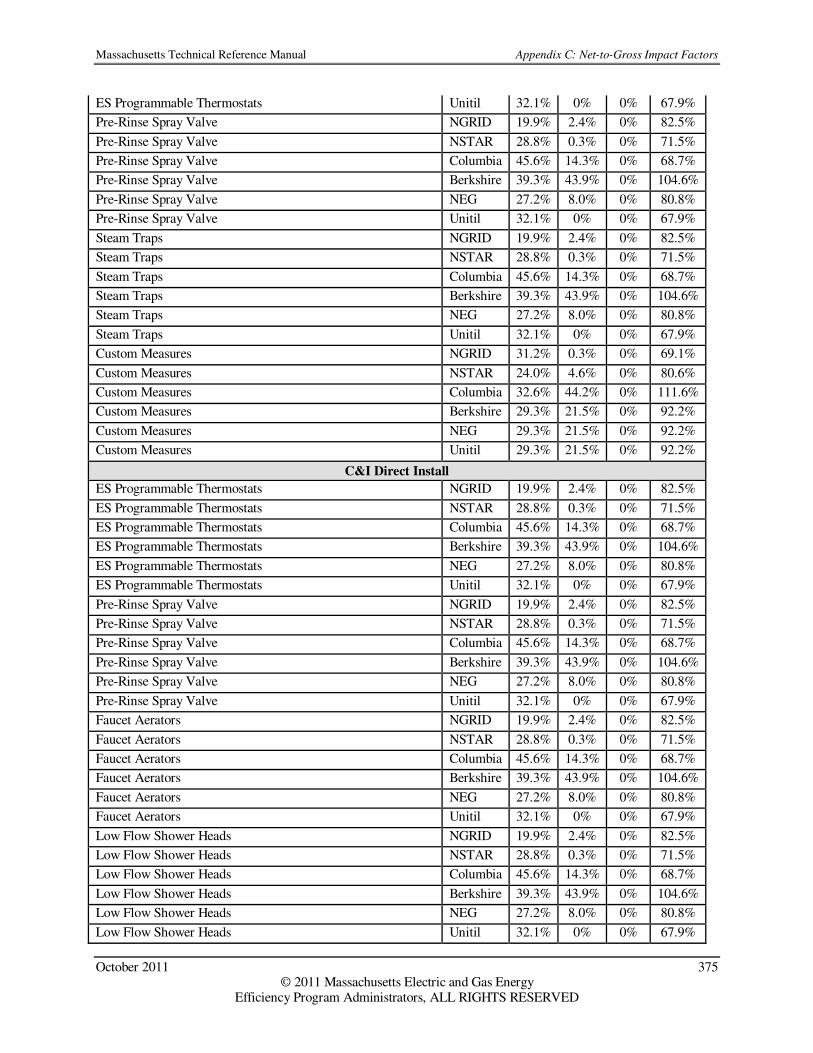
Massachusetts Technical Reference Manual Appendix C: Net-to-Gross Impact Factors
October 2011 375 © 2011 Massachusetts Electric and Gas Energy
Efficiency Program Administrators, ALL RIGHTS RESERVED
ES Programmable Thermostats Unitil 32.1% 0% 0% 67.9%
Pre-Rinse Spray Valve NGRID 19.9% 2.4% 0% 82.5%
Pre-Rinse Spray Valve NSTAR 28.8% 0.3% 0% 71.5%
Pre-Rinse Spray Valve Columbia 45.6% 14.3% 0% 68.7%
Pre-Rinse Spray Valve Berkshire 39.3% 43.9% 0% 104.6%
Pre-Rinse Spray Valve NEG 27.2% 8.0% 0% 80.8%
Pre-Rinse Spray Valve Unitil 32.1% 0% 0% 67.9%
Steam Traps NGRID 19.9% 2.4% 0% 82.5%
Steam Traps NSTAR 28.8% 0.3% 0% 71.5%
Steam Traps Columbia 45.6% 14.3% 0% 68.7%
Steam Traps Berkshire 39.3% 43.9% 0% 104.6%
Steam Traps NEG 27.2% 8.0% 0% 80.8%
Steam Traps Unitil 32.1% 0% 0% 67.9%
Custom Measures NGRID 31.2% 0.3% 0% 69.1%
Custom Measures NSTAR 24.0% 4.6% 0% 80.6%
Custom Measures Columbia 32.6% 44.2% 0% 111.6%
Custom Measures Berkshire 29.3% 21.5% 0% 92.2%
Custom Measures NEG 29.3% 21.5% 0% 92.2%
Custom Measures Unitil 29.3% 21.5% 0% 92.2%
C&I Direct Install
ES Programmable Thermostats NGRID 19.9% 2.4% 0% 82.5%
ES Programmable Thermostats NSTAR 28.8% 0.3% 0% 71.5%
ES Programmable Thermostats Columbia 45.6% 14.3% 0% 68.7%
ES Programmable Thermostats Berkshire 39.3% 43.9% 0% 104.6%
ES Programmable Thermostats NEG 27.2% 8.0% 0% 80.8%
ES Programmable Thermostats Unitil 32.1% 0% 0% 67.9%
Pre-Rinse Spray Valve NGRID 19.9% 2.4% 0% 82.5%
Pre-Rinse Spray Valve NSTAR 28.8% 0.3% 0% 71.5%
Pre-Rinse Spray Valve Columbia 45.6% 14.3% 0% 68.7%
Pre-Rinse Spray Valve Berkshire 39.3% 43.9% 0% 104.6%
Pre-Rinse Spray Valve NEG 27.2% 8.0% 0% 80.8%
Pre-Rinse Spray Valve Unitil 32.1% 0% 0% 67.9%
Faucet Aerators NGRID 19.9% 2.4% 0% 82.5%
Faucet Aerators NSTAR 28.8% 0.3% 0% 71.5%
Faucet Aerators Columbia 45.6% 14.3% 0% 68.7%
Faucet Aerators Berkshire 39.3% 43.9% 0% 104.6%
Faucet Aerators NEG 27.2% 8.0% 0% 80.8%
Faucet Aerators Unitil 32.1% 0% 0% 67.9%
Low Flow Shower Heads NGRID 19.9% 2.4% 0% 82.5%
Low Flow Shower Heads NSTAR 28.8% 0.3% 0% 71.5%
Low Flow Shower Heads Columbia 45.6% 14.3% 0% 68.7%
Low Flow Shower Heads Berkshire 39.3% 43.9% 0% 104.6%
Low Flow Shower Heads NEG 27.2% 8.0% 0% 80.8%
Low Flow Shower Heads Unitil 32.1% 0% 0% 67.9%

Massachusetts Technical Reference Manual Appendix C: Net-to-Gross Impact Factors
October 2011 376 © 2011 Massachusetts Electric and Gas Energy
Efficiency Program Administrators, ALL RIGHTS RESERVED
Evaluations
All NTG factors are based on the results of the 2010 Commercial and Industrial Natural Gas Programs Free-ridership and Spillover Study conducted by TetraTech for the MA Gas PAs.637 This study developed free-ridership and participant spillover rates for each PA for prescriptive and custom measures. PAs that had fewer than 10 customers surveyed for a program type used the statewide rates.
637 TetraTech (2011). National Grid, NSTAR, Unitil, Berkshire Gas, Columbia Gas, and New England Gas
2010 Commercial and Industrial Natural Gas Programs Free-ridership and Spillover Study. Draft Report September 12, 2011

Massachusetts Technical Reference Manual Appendix D: Non Resource Benefits
October 2011 377 © 2011 Massachusetts Electric and Gas Energy
Efficiency Program Administrators, ALL RIGHTS RESERVED
Appendix D: Non-Resource Impacts
Residential Program Non-Energy Impacts
End
Use
TRM
Measures NEI Description
Value or
Algorithm Basis Duration
Notes on
Programs
Indoor Fixture Outdoor Fixture LED Fixture
Lighting Quality and Lifetime
O&M savings due to more efficient fixtures
$3.50 per measure
One Time
Lighting
CFL Bulb LED Bulb
Lighting Quality and Lifetime
O&M savings due to more efficient bulbs
$3.00 per measure
One Time
Products Refrigerator/ Freezer Recycling
Refrigerator/ Freezer Turn-in
Non-energy benefits of turning in a refrigerator and/or freezer as part of the MA turn-in program. The total benefit is comprised of 3 parts: $1.06 for avoided landfill space, $1.25 for recycling of plastics and glass, and $170.22 for incineration of insulating foam
$172.53 per measure
One Time
Appliance Turn-in programs only
Heating System (Retrofit and Rebate)
Improved Safety
Reduced incidence of fire and carbon monoxide exposure as a result of installing a new heating system
$45.05 per measure
Annual
Low Income programs only
HVAC
Window AC (Retrofit)
Window Air Conditioner Replacement
Non-energy benefits associated with installing a new room air conditioner replacement
$45.00 per measure
Annual
Low Income programs only
All Measures with oil savings
National Security
Reducing the need for foreign energy imports thereby increasing national security
MMBTU Oil Savings *
$1.83
per measure
Annual Retrofit programs only
Various All electric measures with kWh savings and all gas measures with MMBTU
Rate Discounts
Financial savings to utility as a result of a smaller portion of energy being sold at the low income rate
Elec: (kwh savings per
measure)*(R1-R2)
Gas: (therms savings per
measure)*(R3-R4)
per measure
Annual
Low Income programs only

Massachusetts Technical Reference Manual Appendix D: Non Resource Benefits
October 2011 378 © 2011 Massachusetts Electric and Gas Energy
Efficiency Program Administrators, ALL RIGHTS RESERVED
savings
(1) The NEIs in this table represent impacts that accrue specifically measures in the 2012 MA portfolio of programs. Additional NEIs that accrue to participants are used in the benefit - cost analysis of the programs but are not detailed in this manual. (2) The DHW measures NEI is applied to the DHW ISMs measures that are bundled together and are modeled in units of households, assuming one showerhead and one faucet aerator per household. (3) Source of NEIs is "Massachusetts Program Administrators: Massachusetts Special and Cross-Sector Studies Area, Residential and Low-Income Non-Energy Impacts (NEI) Evaluation," NMR Group, Inc., Tetra Tech. August 15, 2011.

Massachusetts Technical Reference Manual Appendix D: Non Resource Benefits
October 2011 379 © 2011 Massachusetts Electric and Gas Energy
Efficiency Program Administrators, ALL RIGHTS RESERVED
Commercial & Industrial Program Non-Energy Impacts
End
Use TRM Measures NEI Description Value Basis Type
New Construction CFL O&M
O&M Savings
Operation & Maintenance savings from fewer replacements over the life of the more efficient measure
$17.93 Unit Annual
Retrofit CFL O&M O&M Savings
Operation & Maintenance savings from fewer replacements over the life of the more efficient measure
$18.67 Unit Annual
New Construction LED Traffic Light O&M
O&M Savings
Operation & Maintenance savings from fewer replacements over the life of the more efficient measure
$30.02 Unit Annual
Retrofit LED Traffic Light O&M
O&M Savings
Operation & Maintenance savings from fewer replacements over the life of the more efficient measure
$29.37 Unit Annual
New Construction and Retrofit Control/Sensor O&M
O&M Savings
Operation & Maintenance savings from fewer replacements over the life of the more efficient measure
$6.69 kW Saved Annual
Retrofit Fluorescent Lamp-Ballast O&M
O&M Savings
Operation & Maintenance savings from fewer replacements over the life of the more efficient measure
$0.41 Unit Annual
SBS Retrofit Fluorescent Lamp-Ballast w/ Reflector O&M
O&M Savings
Operation & Maintenance savings from fewer replacements over the life of the more efficient measure
$0.91 Unit Annual
Lighting
Retrofit Exit Sign O&M
O&M Savings
Operation & Maintenance savings from fewer replacements over the life of the more efficient measure
$33.65 Unit Annual
(1) Source is Optimal Energy, Inc. MEMO "Non-Electric Benefits Analysis Update" November 7, 2008. In addition to the NEIs in these tables, the 2011 study of Residential and Low Income NEIs identified a number of participant-based NEIs which are claimed in the 2012 plan. These NEIs and their application are summarized in the tables below.

Massachusetts Technical Reference Manual Appendix D: Non Resource Benefits
October 2011 380 © 2011 Massachusetts Electric and Gas Energy
Efficiency Program Administrators, ALL RIGHTS RESERVED
Per Participant Non-Energy Impacts for Electric Programs
Program NEI Description Measure
Category Value Duration
Notes on Model
Application
Thermal Comfort
Greater participant-perceived comfort in home
$77.00 Annual
Noise Reduction
Less participant-perceived noise in the home
$40.00 Annual
Residential New Construction
Property Value Increase
Increased value of property and expected ease of selling home
N/A
$72.00 Annual
Values are applied to the "Heating" measure quantity in this program as an approximation of program participants.
Heating System
$48.63
Cooling System
$3.92 Thermal Comfort
Greater participant-perceived comfort in home
Heating and Cooling System
$5.05
Annual
Cooling System
$2.83 Noise Reduction
Less participant-perceived noise in the home
Heating and Cooling System
$1.42
Annual
Heating System
$17.42
Cooling System
$1.54
Home Durability
Increased home durability in terms of maintenance requirements because of better quality heating, cooling and structural materials
Heating and Cooling System
$1.98
Annual
Heating System
$102.40
Cooling System
$7.54 Equipment Maintenance
Reduced maintenance costs of owning newer and/or more efficient appliance equipment
Heating and Cooling System
$9.42
Annual
Heating System
$1.56
Residential Cooling and Heating Equipment
Health Benefits Fewer colds and viruses, improved indoor air
Cooling System
$0.13
Annual
Values are applied per participant. Since program participants = rebates, measure category values are counted for every unit. The "heating and cooling system" values are applied to heat pumps.

Massachusetts Technical Reference Manual Appendix D: Non Resource Benefits
October 2011 381 © 2011 Massachusetts Electric and Gas Energy
Efficiency Program Administrators, ALL RIGHTS RESERVED
Program NEI Description Measure
Category Value Duration
Notes on Model
Application
quality and ease of maintaining healthy relative humidity as a result of weatherization in home
Heating and Cooling System
$0.16
Heating System
$678.52
Cooling System
$62.65 Property Value Increase
Increased value of property and expected ease of selling home Heating and
Cooling System
$80.69
One Time
Thermal Comfort
Greater participant-perceived comfort in home
$125.00 Annual
Noise Reduction
Less participant-perceived noise in the home
$31.00 Annual
Home Durability
Increased home durability in terms of maintenance requirements because of better quality heating, cooling and structural materials
$149.00 Annual
Equipment Maintenance
Reduced maintenance costs of owning newer and/or more efficient appliance equipment
$124.00 Annual
MassSave
Health Benefits
Fewer colds and viruses, improved indoor air quality and ease of maintaining healthy relative humidity as a result of weatherization in home
N/A
$4.00 Annual
As an approximation of program weatherization participants, values are reduced to 30% of original value and applied to the planned audits for the 2012 National Grid MassSave program. 30% represents the approximate conversion rate of audits to weatherization participants.

Massachusetts Technical Reference Manual Appendix D: Non Resource Benefits
October 2011 382 © 2011 Massachusetts Electric and Gas Energy
Efficiency Program Administrators, ALL RIGHTS RESERVED
Program NEI Description Measure
Category Value Duration
Notes on Model
Application
Property Value Increase
Increased value of property and expected ease of selling home
$1,998.00 One Time
Thermal Comfort
Greater participant-perceived comfort in home
$125.00 Annual
Noise Reduction
Less participant-perceived noise in the home
$31.00 Annual
Home Durability
Increased home durability in terms of maintenance requirements because of better quality heating, cooling and structural materials
$149.00 Annual
Equipment Maintenance
Reduced maintenance costs of owning newer and/or more efficient appliance equipment
$124.00 Annual
Health Benefits
Fewer colds and viruses, improved indoor air quality and ease of maintaining healthy relative humidity as a result of weatherization in home
$4.00 Annual
Multifamily Retrofit
Property Value Increase
Increased value of property and expected ease of selling home
N/A
$1,998.00 One Time
Values are applied to the 2012 quantity of the SPACE measure as an approximation of weatherization program participants.
Low Income Residential New Construction
Arrearages
Reduced arrearage carrying costs as a result of customers being more able to pay their lower bills
N/A $2.61 Annual
Values are applied to the "Heating" measure quantity in this program as an approximation of program participants.

Massachusetts Technical Reference Manual Appendix D: Non Resource Benefits
October 2011 383 © 2011 Massachusetts Electric and Gas Energy
Efficiency Program Administrators, ALL RIGHTS RESERVED
Program NEI Description Measure
Category Value Duration
Notes on Model
Application
Bad Debt Write-offs
Reduced costs to utility of uncollectable, unpaid balances as a result of customers being more able to pay their lower bills
$3.74 Annual
Terminations and Reconnections
Reduced costs associated with terminations and reconnections to utility due to nonpayment as a result of customers being more able to pay their lower bills
$0.43 Annual
Customer Calls and Collections
Utility savings in staff time and materials for fewer customer calls as a result of more timely bill payments
$0.58 Annual
Notices
Financial savings to utility as a result of fewer notices sent to customers for late payments and terminations
$0.34 Annual
Thermal Comfort
Greater participant-perceived comfort in home
$101.00 Annual
Noise Reduction
Less participant-perceived noise in the home
$30.00 Annual

Massachusetts Technical Reference Manual Appendix D: Non Resource Benefits
October 2011 384 © 2011 Massachusetts Electric and Gas Energy
Efficiency Program Administrators, ALL RIGHTS RESERVED
Program NEI Description Measure
Category Value Duration
Notes on Model
Application
Home Durability
Increased home durability in terms of maintenance requirements because of better quality heating, cooling and structural materials
$35.00 Annual
Equipment Maintenance
Reduced maintenance costs of owning newer and/or more efficient appliance equipment
$54.00 Annual
Health Benefits
Fewer colds and viruses, improved indoor air quality and ease of maintaining healthy relative humidity as a result of weatherization in home
$19.00 Annual
Property Value Increase
Increased value of property and expected ease of selling home
$949.00 One Time
Arrearages
Reduced arrearage carrying costs as a result of customers being more able to pay their lower bills
$2.61 Annual
Low Income 1 to 4 Family Retrofit
Bad Debt Write-offs
Reduced costs to utility of uncollectable, unpaid balances as a result of customers being more able to pay their lower bills
N/A
$3.74 Annual
As an approximation of program weatherization participants, values are reduced to 33% of original value and applied to the planned audits for the 2012 National Grid MassSave program. 33% represents the approximate conversion rate of audits to weatherization participants.

Massachusetts Technical Reference Manual Appendix D: Non Resource Benefits
October 2011 385 © 2011 Massachusetts Electric and Gas Energy
Efficiency Program Administrators, ALL RIGHTS RESERVED
Program NEI Description Measure
Category Value Duration
Notes on Model
Application
Terminations and Reconnections
Reduced costs associated with terminations and reconnections to utility due to nonpayment as a result of customers being more able to pay their lower bills
$0.43 Annual
Customer Calls and Collections
Utility savings in staff time and materials for fewer customer calls as a result of more timely bill payments
$0.58 Annual
Notices
Financial savings to utility as a result of fewer notices sent to customers for late payments and terminations
$0.34 Annual
Thermal Comfort
Greater participant-perceived comfort in home
$101.00 Annual
Noise Reduction
Less participant-perceived noise in the home
$30.00 Annual
Home Durability
Increased home durability in terms of maintenance requirements because of better quality heating, cooling and structural materials
$35.00 Annual

Massachusetts Technical Reference Manual Appendix D: Non Resource Benefits
October 2011 386 © 2011 Massachusetts Electric and Gas Energy
Efficiency Program Administrators, ALL RIGHTS RESERVED
Program NEI Description Measure
Category Value Duration
Notes on Model
Application
Equipment Maintenance
Reduced maintenance costs of owning newer and/or more efficient appliance equipment
$54.00 Annual
Health Benefits
Fewer colds and viruses, improved indoor air quality and ease of maintaining healthy relative humidity as a result of weatherization in home
$19.00 Annual
Property Value Increase
Increased value of property and expected ease of selling home
$949.00 One Time
Safety-Related Emergency Calls
Financial savings to the utility as a result of fewer safety related emergency calls being made
Heating System
$8.43 Annual
As an approximation of program participants with heating equipment, this value is applied to the 2012 planned quantity for the Heating System Replacement measure.
Arrearages
Reduced arrearage carrying costs as a result of customers being more able to pay their lower bills
$2.61 Annual Low Income Multifamily Retrofit
Bad Debt Write-offs
Reduced costs to utility of uncollectable, unpaid balances as a result of customers being more able to pay their lower bills
N/A
$3.74 Annual
Values are applied to the SPACE measure quantity as an approximation of weatherization program participants.

Massachusetts Technical Reference Manual Appendix D: Non Resource Benefits
October 2011 387 © 2011 Massachusetts Electric and Gas Energy
Efficiency Program Administrators, ALL RIGHTS RESERVED
Program NEI Description Measure
Category Value Duration
Notes on Model
Application
Terminations and Reconnections
Reduced costs associated with terminations and reconnections to utility due to nonpayment as a result of customers being more able to pay their lower bills
$0.43 Annual
Customer Calls and Collections
Utility savings in staff time and materials for fewer customer calls as a result of more timely bill payments
$0.58 Annual
Notices
Financial savings to utility as a result of fewer notices sent to customers for late payments and terminations
$0.34 Annual
Thermal Comfort
Greater participant-perceived comfort in home
$101.00 Annual
Noise Reduction
Less participant-perceived noise in the home
$30.00 Annual
Home Durability
Increased home durability in terms of maintenance requirements because of better quality heating, cooling and structural materials
$35.00 Annual

Massachusetts Technical Reference Manual Appendix D: Non Resource Benefits
October 2011 388 © 2011 Massachusetts Electric and Gas Energy
Efficiency Program Administrators, ALL RIGHTS RESERVED
Program NEI Description Measure
Category Value Duration
Notes on Model
Application
Equipment Maintenance
Reduced maintenance costs of owning newer and/or more efficient appliance equipment
$54.00 Annual
Health Benefits
Fewer colds and viruses, improved indoor air quality and ease of maintaining healthy relative humidity as a result of weatherization in home
$19.00 Annual
Property Value Increase
Increased value of property and expected ease of selling home
$949.00 One Time
Safety-Related Emergency Calls
Financial savings to the utility as a result of fewer safety related emergency calls being made
Heating System
$8.43 Annual
Rental Units Marketability
Financial savings to owners of LI rental housing as a result of increased marketability of the more efficient housing.
$0.96 Annual
Property Durability
Financial savings to owners of LI rental housing as a result of more durable and efficient materials being installed.
N/A
$36.85 Annual
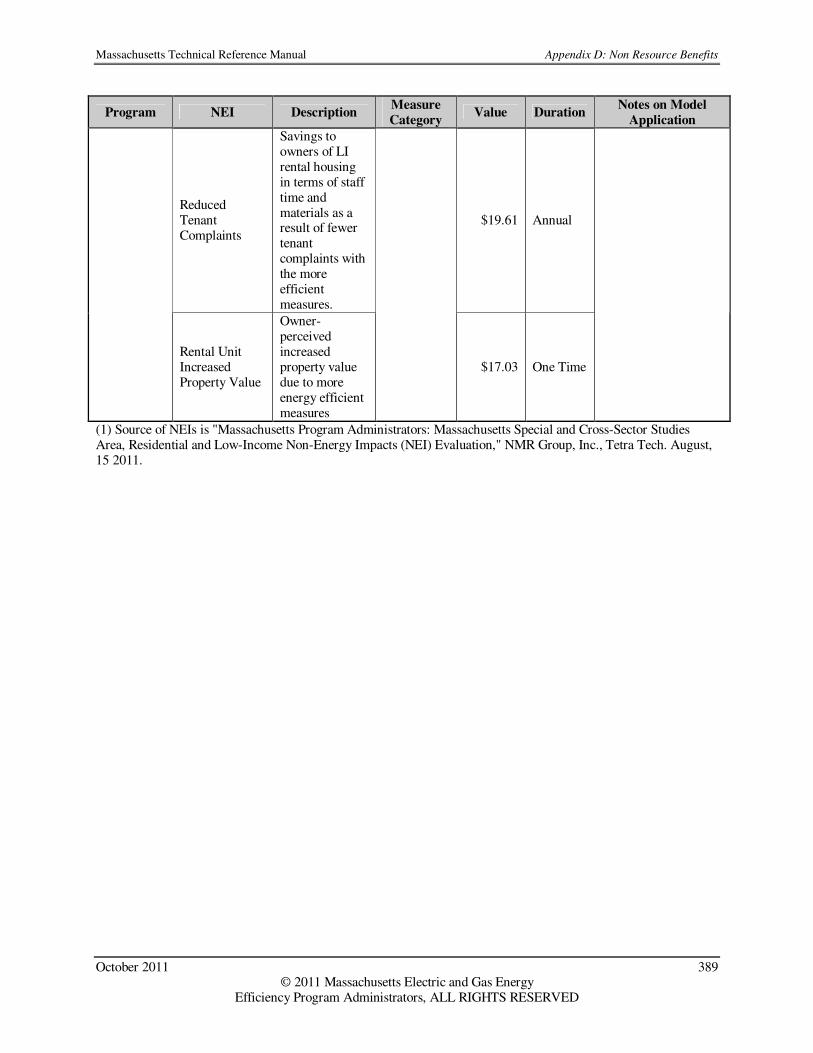
Massachusetts Technical Reference Manual Appendix D: Non Resource Benefits
October 2011 389 © 2011 Massachusetts Electric and Gas Energy
Efficiency Program Administrators, ALL RIGHTS RESERVED
Program NEI Description Measure
Category Value Duration
Notes on Model
Application
Reduced Tenant Complaints
Savings to owners of LI rental housing in terms of staff time and materials as a result of fewer tenant complaints with the more efficient measures.
$19.61 Annual
Rental Unit Increased Property Value
Owner-perceived increased property value due to more energy efficient measures
$17.03 One Time
(1) Source of NEIs is "Massachusetts Program Administrators: Massachusetts Special and Cross-Sector Studies Area, Residential and Low-Income Non-Energy Impacts (NEI) Evaluation," NMR Group, Inc., Tetra Tech. August, 15 2011.
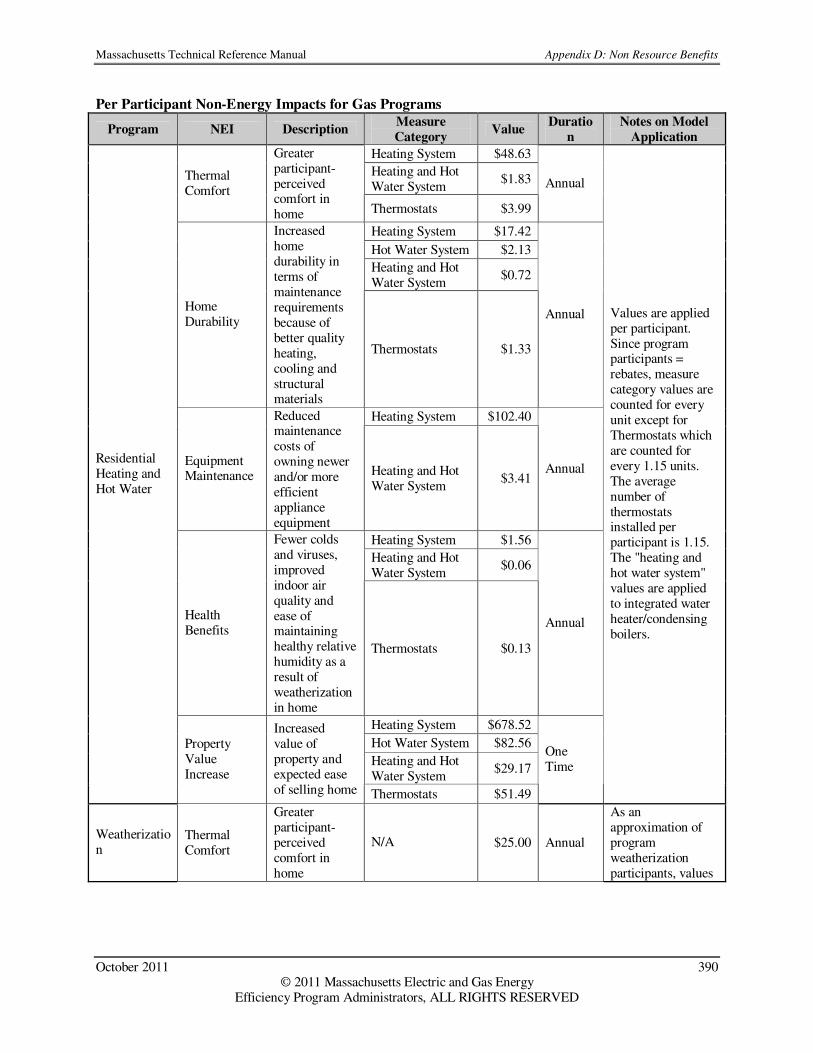
Massachusetts Technical Reference Manual Appendix D: Non Resource Benefits
October 2011 390 © 2011 Massachusetts Electric and Gas Energy
Efficiency Program Administrators, ALL RIGHTS RESERVED
Per Participant Non-Energy Impacts for Gas Programs
Program NEI Description Measure
Category Value
Duratio
n
Notes on Model
Application
Heating System $48.63
Heating and Hot Water System
$1.83 Thermal Comfort
Greater participant-perceived comfort in home Thermostats $3.99
Annual
Heating System $17.42
Hot Water System $2.13
Heating and Hot Water System
$0.72
Home Durability
Increased home durability in terms of maintenance requirements because of better quality heating, cooling and structural materials
Thermostats $1.33
Annual
Heating System $102.40
Equipment Maintenance
Reduced maintenance costs of owning newer and/or more efficient appliance equipment
Heating and Hot Water System
$3.41 Annual
Heating System $1.56
Heating and Hot Water System
$0.06
Health Benefits
Fewer colds and viruses, improved indoor air quality and ease of maintaining healthy relative humidity as a result of weatherization in home
Thermostats $0.13
Annual
Heating System $678.52
Hot Water System $82.56
Heating and Hot Water System
$29.17
Residential Heating and Hot Water
Property Value Increase
Increased value of property and expected ease of selling home Thermostats $51.49
One Time
Values are applied per participant. Since program participants = rebates, measure category values are counted for every unit except for Thermostats which are counted for every 1.15 units. The average number of thermostats installed per participant is 1.15. The "heating and hot water system" values are applied to integrated water heater/condensing boilers.
Weatherization
Thermal Comfort
Greater participant-perceived comfort in home
N/A $25.00 Annual
As an approximation of program weatherization participants, values

Massachusetts Technical Reference Manual Appendix D: Non Resource Benefits
October 2011 391 © 2011 Massachusetts Electric and Gas Energy
Efficiency Program Administrators, ALL RIGHTS RESERVED
Program NEI Description Measure
Category Value
Duratio
n
Notes on Model
Application
Noise Reduction
Less participant-perceived noise in the home
$11.22 Annual
Home Durability
Increased home durability in terms of maintenance requirements because of better quality heating, cooling and structural materials
$9.57 Annual
Health Benefits
Fewer colds and viruses, improved indoor air quality and ease of maintaining healthy relative humidity as a result of weatherization in home
$0.79 Annual
Property Value Increase
Increased value of property and expected ease of selling home
$381.28 One Time
are applied to the 2012 insulation measure quantity.
Insulation $25.15
Thermal Comfort
Greater participant-perceived comfort in home
Air Sealing $10.13 Annual
Insulation $11.54
Noise Reduction
Less participant-perceived noise in the home
Air Sealing $4.88 Annual
Multifamily Retrofit
Home Increased Insulation $9.82 Annual
As an approximation of program weatherization participants, values are reduced to 75% and applied to the 2012 air sealing & insulation measure. 75% represents the number of planned

Massachusetts Technical Reference Manual Appendix D: Non Resource Benefits
October 2011 392 © 2011 Massachusetts Electric and Gas Energy
Efficiency Program Administrators, ALL RIGHTS RESERVED
Program NEI Description Measure
Category Value
Duratio
n
Notes on Model
Application
Durability home durability in terms of maintenance requirements because of better quality heating, cooling and structural materials
Air Sealing $3.95
Insulation $0.80
Health Benefits
Fewer colds and viruses, improved indoor air quality and ease of maintaining healthy relative humidity as a result of weatherization in home
Air Sealing $0.32 Annual
Insulation $378.05 Property Value Increase
Increased value of property and expected ease of selling home
Air Sealing $135.83
One Time
units that result in weatherization participants.
Thermal Comfort
Greater participant-perceived comfort in home
$77.00 Annual
Noise Reduction
Less participant-perceived noise in the home
$40.00 Annual
Residential New Construction
Property Value Increase
Increased value of property and expected ease of selling home
N/A
$72.00 Annual
Values are applied to the "Heating" measure quantity in this program as an approximation of program participants.
Low Income Single Family Low Income Multifamily
Arrearages
Reduced arrearage carrying costs as a result of customers being more able to pay their lower bills
N/A $2.61 Annual Values are applied to program participants.

Massachusetts Technical Reference Manual Appendix D: Non Resource Benefits
October 2011 393 © 2011 Massachusetts Electric and Gas Energy
Efficiency Program Administrators, ALL RIGHTS RESERVED
Program NEI Description Measure
Category Value
Duratio
n
Notes on Model
Application
Bad Debt Write-offs
Reduced costs to utility of uncollectable, unpaid balances as a result of customers being more able to pay their lower bills
$3.74 Annual
Terminations and Reconnections
Reduced costs associated with terminations and reconnections to utility due to nonpayment as a result of customers being more able to pay their lower bills
$0.43 Annual
Customer Calls and Collections
Utility savings in staff time and materials for fewer customer calls as a result of more timely bill payments
$0.58 Annual
Notices
Financial savings to utility as a result of fewer notices sent to customers for late payments and terminations
$0.34 Annual
Safety-Related Emergency Calls
Financial savings to the utility as a result of fewer safety related emergency calls being made
Heating System $8.43 Annual
As an approximation of program participants with heating equipment, this value is applied to the 2012 planned quantity for the Heating System Replacement measure.
Thermal Greater Insulation $25.38 Annual As an
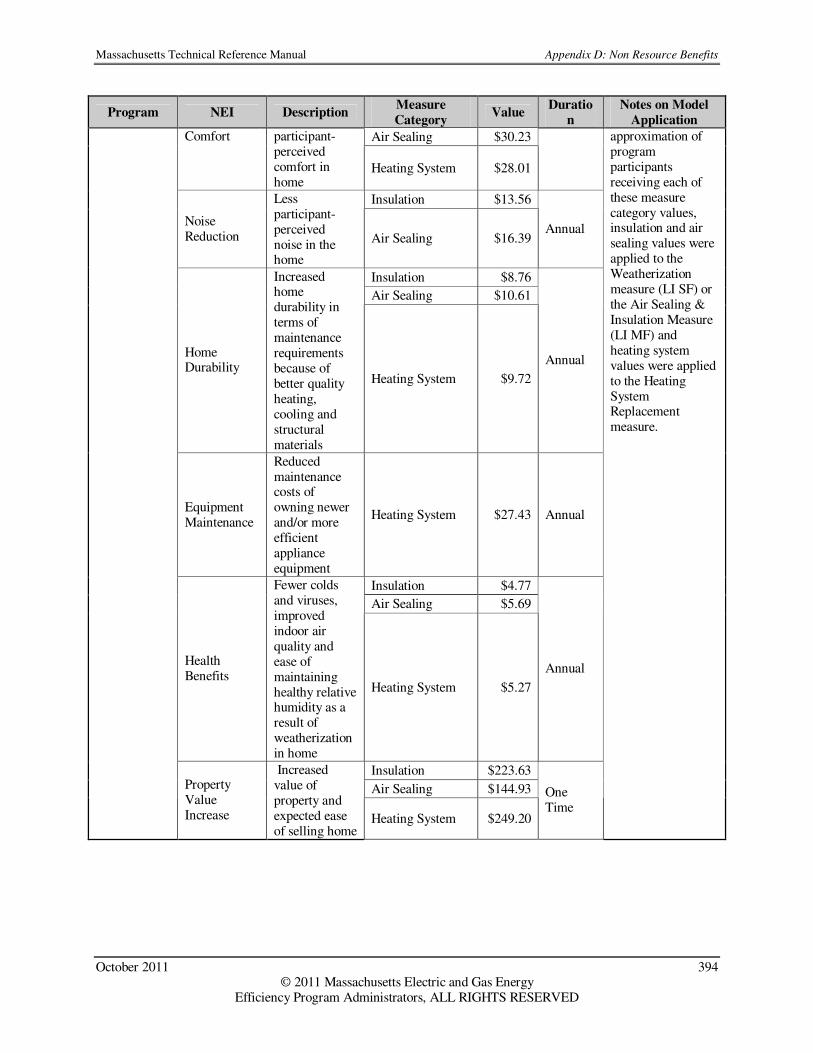
Massachusetts Technical Reference Manual Appendix D: Non Resource Benefits
October 2011 394 © 2011 Massachusetts Electric and Gas Energy
Efficiency Program Administrators, ALL RIGHTS RESERVED
Program NEI Description Measure
Category Value
Duratio
n
Notes on Model
Application
Air Sealing $30.23 Comfort participant-perceived comfort in home
Heating System $28.01
Insulation $13.56
Noise Reduction
Less participant-perceived noise in the home
Air Sealing $16.39 Annual
Insulation $8.76
Air Sealing $10.61
Home Durability
Increased home durability in terms of maintenance requirements because of better quality heating, cooling and structural materials
Heating System $9.72
Annual
Equipment Maintenance
Reduced maintenance costs of owning newer and/or more efficient appliance equipment
Heating System $27.43 Annual
Insulation $4.77
Air Sealing $5.69
Health Benefits
Fewer colds and viruses, improved indoor air quality and ease of maintaining healthy relative humidity as a result of weatherization in home
Heating System $5.27
Annual
Insulation $223.63
Air Sealing $144.93 Property Value Increase
Increased value of property and expected ease of selling home
Heating System $249.20
One Time
approximation of program participants receiving each of these measure category values, insulation and air sealing values were applied to the Weatherization measure (LI SF) or the Air Sealing & Insulation Measure (LI MF) and heating system values were applied to the Heating System Replacement measure.
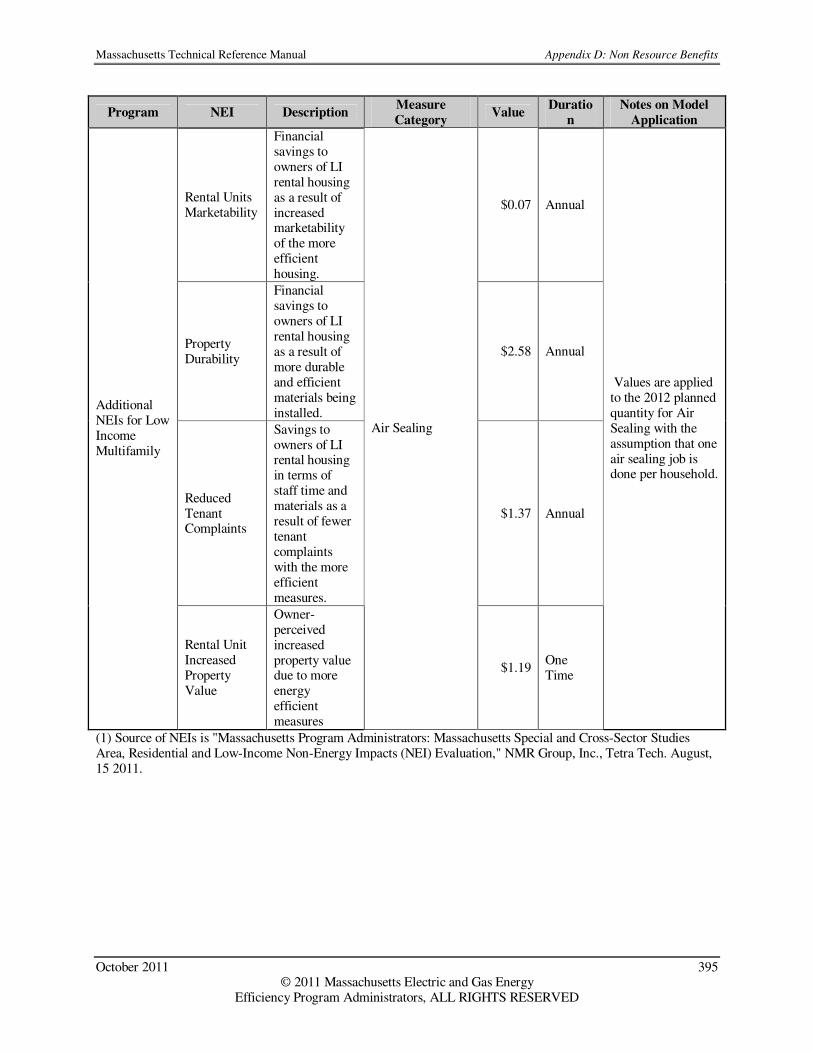
Massachusetts Technical Reference Manual Appendix D: Non Resource Benefits
October 2011 395 © 2011 Massachusetts Electric and Gas Energy
Efficiency Program Administrators, ALL RIGHTS RESERVED
Program NEI Description Measure
Category Value
Duratio
n
Notes on Model
Application
Rental Units Marketability
Financial savings to owners of LI rental housing as a result of increased marketability of the more efficient housing.
$0.07 Annual
Property Durability
Financial savings to owners of LI rental housing as a result of more durable and efficient materials being installed.
$2.58 Annual
Reduced Tenant Complaints
Savings to owners of LI rental housing in terms of staff time and materials as a result of fewer tenant complaints with the more efficient measures.
$1.37 Annual
Additional NEIs for Low Income Multifamily
Rental Unit Increased Property Value
Owner-perceived increased property value due to more energy efficient measures
Air Sealing
$1.19 One Time
Values are applied to the 2012 planned quantity for Air Sealing with the assumption that one air sealing job is done per household.
(1) Source of NEIs is "Massachusetts Program Administrators: Massachusetts Special and Cross-Sector Studies Area, Residential and Low-Income Non-Energy Impacts (NEI) Evaluation," NMR Group, Inc., Tetra Tech. August, 15 2011.

Massachusetts Technical Reference Manual Appendix E: Table of Referenced Documents
October 2011 396 © 2011 Massachusetts Electric and Gas Energy
Efficiency Program Administrators, ALL RIGHTS RESERVED
Appendix E: Table of Reference Documents
Full Citation Digital Filename Weblink
ACEEE (2006). Emerging Technologies Report: Advanced Boiler Controls. Prepared for ACEEE.
ACEEE_2006_Emerging_Technologies_Report_Advanced_Boiler_Controls (blank)
ADM Associates, Inc. (2009). Residential Central AC Regional Evaluation. Prepared for NSTAR, National Grid, Connecticut Light & Power and United Illuminating.
ADM_2009_Residential_Central_AC_Regional_Evaluation (blank)
Appliance Standards Awareness Project (2007). Dehumidifiers. ASAP_2007_Dehumidifiers_2011 08 05 (blank) Chan, Tumin (2010). Formulation of a Prescriptive Incentive for the VFD and Motors & VFD impact tables at NSTAR. Prepared for NSTAR.
Chan_2010_Formulation_of_Prescriptive_VFD_Impact_Tables_NSTAR (blank)
Consortium for Energy Efficiency (2008). Consumer Electronics Program Guide: Information on Voluntary Approaches for the Promotion of Energy Efficient Consumer Electronics - Products and Practices. CEE_2008_Consumer_Electronics_Program_Guide (blank) Consortium for Energy Efficiency (2008). Technology Opportunity Assessment: Convection Ovens
CEE_2008_Technology_Opportunity_Assessment_Convection_Ovens (blank)
Davis Energy Group (2008). Proposal Information Template for Residential Pool Pump Measure Revisions. Prepared for Pacific Gas and Electric Company. Davis_2008_Residential_Pool_Pump_Measure_Revisions (blank) DMI (2006). Impact Evaluation of 2004 Compressed Air Prescriptive Rebates. Prepared for National Grid.
DMI_2006_Impact_Evaluation_2004_Compressed_Air_Prescriptive_Rebates (blank)
DOE (2008). ENERGY STAR® Residential Water Heaters: Final Criteria Analysis. Prepared for the DOE.
DOE_2008_ENERGY_STAR_Residential_Water_Heaters_Final_Criteria_Analysis (blank)
ECOS (2009) Smart Plug Strips: Draft Report. ECOS_2009_Smart_Plug_Strips_Draft_Report.pdf (blank)
E Source (2007). Gas Fired Water Heater Screening Tool. ESource_2007_Water_Heating_Gas_Fired_Tank_Water_Heaters.pdf
http://www.esource.com/escrc/0013000000DP22YAAT/BEA1/PA/PA_WaterHeating/PA-41_calc
Ecotrope, Inc. (2003). Natural Gas Efficiency and Conservation Measure Resource Assessment for the Residential and Commercial Sectors. Prepared for the Energy Trust of Oregon.
Ecotrope_2003_Natural_Gas_Efficiency_and_Conservation_Measure_Resource_Assessment (blank)
Energy & Resource Solutions (2005). Measure Life Study. Prepared for The Massachusetts Joint Utilities. ERS_2005_Measure_Life_Study (blank)
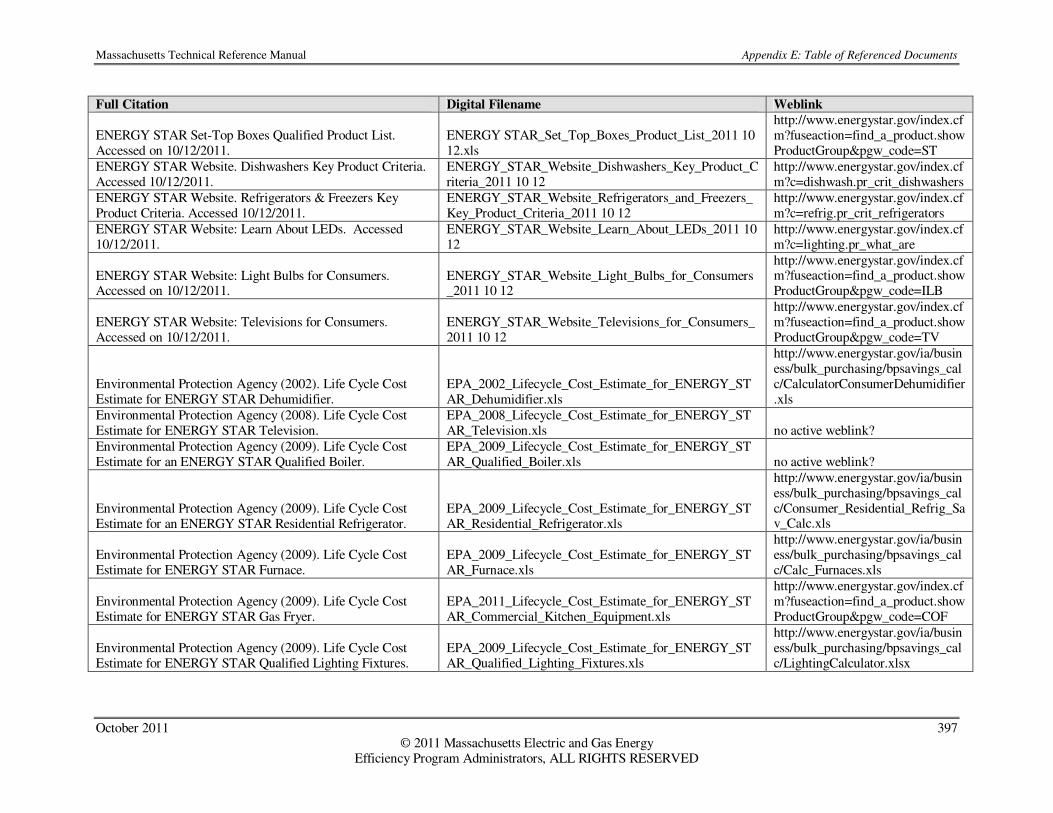
Massachusetts Technical Reference Manual Appendix E: Table of Referenced Documents
October 2011 397 © 2011 Massachusetts Electric and Gas Energy
Efficiency Program Administrators, ALL RIGHTS RESERVED
Full Citation Digital Filename Weblink
ENERGY STAR Set-Top Boxes Qualified Product List. Accessed on 10/12/2011.
ENERGY STAR_Set_Top_Boxes_Product_List_2011 10 12.xls
http://www.energystar.gov/index.cfm?fuseaction=find_a_product.showProductGroup&pgw_code=ST
ENERGY STAR Website. Dishwashers Key Product Criteria. Accessed 10/12/2011.
ENERGY_STAR_Website_Dishwashers_Key_Product_Criteria_2011 10 12
http://www.energystar.gov/index.cfm?c=dishwash.pr_crit_dishwashers
ENERGY STAR Website. Refrigerators & Freezers Key Product Criteria. Accessed 10/12/2011.
ENERGY_STAR_Website_Refrigerators_and_Freezers_Key_Product_Criteria_2011 10 12
http://www.energystar.gov/index.cfm?c=refrig.pr_crit_refrigerators
ENERGY STAR Website: Learn About LEDs. Accessed 10/12/2011.
ENERGY_STAR_Website_Learn_About_LEDs_2011 10 12
http://www.energystar.gov/index.cfm?c=lighting.pr_what_are
ENERGY STAR Website: Light Bulbs for Consumers. Accessed on 10/12/2011.
ENERGY_STAR_Website_Light_Bulbs_for_Consumers_2011 10 12
http://www.energystar.gov/index.cfm?fuseaction=find_a_product.showProductGroup&pgw_code=ILB
ENERGY STAR Website: Televisions for Consumers. Accessed on 10/12/2011.
ENERGY_STAR_Website_Televisions_for_Consumers_2011 10 12
http://www.energystar.gov/index.cfm?fuseaction=find_a_product.showProductGroup&pgw_code=TV
Environmental Protection Agency (2002). Life Cycle Cost Estimate for ENERGY STAR Dehumidifier.
EPA_2002_Lifecycle_Cost_Estimate_for_ENERGY_STAR_Dehumidifier.xls
http://www.energystar.gov/ia/business/bulk_purchasing/bpsavings_calc/CalculatorConsumerDehumidifier.xls
Environmental Protection Agency (2008). Life Cycle Cost Estimate for ENERGY STAR Television.
EPA_2008_Lifecycle_Cost_Estimate_for_ENERGY_STAR_Television.xls no active weblink?
Environmental Protection Agency (2009). Life Cycle Cost Estimate for an ENERGY STAR Qualified Boiler.
EPA_2009_Lifecycle_Cost_Estimate_for_ENERGY_STAR_Qualified_Boiler.xls no active weblink?
Environmental Protection Agency (2009). Life Cycle Cost Estimate for an ENERGY STAR Residential Refrigerator.
EPA_2009_Lifecycle_Cost_Estimate_for_ENERGY_STAR_Residential_Refrigerator.xls
http://www.energystar.gov/ia/business/bulk_purchasing/bpsavings_calc/Consumer_Residential_Refrig_Sav_Calc.xls
Environmental Protection Agency (2009). Life Cycle Cost Estimate for ENERGY STAR Furnace.
EPA_2009_Lifecycle_Cost_Estimate_for_ENERGY_STAR_Furnace.xls
http://www.energystar.gov/ia/business/bulk_purchasing/bpsavings_calc/Calc_Furnaces.xls
Environmental Protection Agency (2009). Life Cycle Cost Estimate for ENERGY STAR Gas Fryer.
EPA_2011_Lifecycle_Cost_Estimate_for_ENERGY_STAR_Commercial_Kitchen_Equipment.xls
http://www.energystar.gov/index.cfm?fuseaction=find_a_product.showProductGroup&pgw_code=COF
Environmental Protection Agency (2009). Life Cycle Cost Estimate for ENERGY STAR Qualified Lighting Fixtures.
EPA_2009_Lifecycle_Cost_Estimate_for_ENERGY_STAR_Qualified_Lighting_Fixtures.xls
http://www.energystar.gov/ia/business/bulk_purchasing/bpsavings_calc/LightingCalculator.xlsx

Massachusetts Technical Reference Manual Appendix E: Table of Referenced Documents
October 2011 398 © 2011 Massachusetts Electric and Gas Energy
Efficiency Program Administrators, ALL RIGHTS RESERVED
Full Citation Digital Filename Weblink
Environmental Protection Agency (2009). Life Cycle Cost Estimate for ENERGY STAR Room Air Cleaner.
EPA_2009_Lifecycle_Cost_Estimate_for_ENERGY_STAR_Room_Air_Cleaner.xls
http://www.energystar.gov/ia/business/bulk_purchasing/bpsavings_calc/CalculatorRoomAirCleaner.xls
Environmental Protection Agency (2009). Life Cycle Cost Estimate for ENERGY STAR Room Air Conditioner.
EPA_2009_Lifecycle_Cost_Estimate_for_ENERGY_STAR_Room_Air_Conditioner.xls
http://www.energystar.gov/ia/business/bulk_purchasing/bpsavings_calc/CalculatorConsumerRoomAC.xls
Environmental Protection Agency (2010). Life Cycle Cost Estimate for ENERGY STAR Office Equipment.
EPA_2010_Lifecycle_Cost_Estimate_for_ENERGY_STAR_Office_Equipment.xls
http://www.energystar.gov/index.cfm?c=ofc_equip.pr_office_equipment
Environmental Protection Agency (2010). Life Cycle Cost Estimate for ENERGY STAR Programmable Thermostat.
EPA_2010_Lifecycle_Cost_Estimate_for_ENERGY_STAR_Programmable_Thermostat.xls
http://www.energystar.gov/ia/business/bulk_purchasing/bpsavings_calc/CalculatorProgrammableThermostat.xls
Environmental Protection Agency (2010). Life Cycle Cost Estimate for ENERGY STAR Residential Dishwasher.
EPA_2009_Lifecycle_Cost_Estimate_for_ENERGY_STAR_Residential_Dishwasher.xls
http://www.energystar.gov/ia/business/bulk_purchasing/bpsavings_calc/CalculatorConsumerDishwasher.xls
Environmental Protection Agency (2011). Life Cycle Cost Estimate for ENERGY STAR Commercial Kitchen Equipment.
EPA_2011_Lifecycle_Cost_Estimate_for_ENERGY_STAR_Commercial_Kitchen_Equipment.xls
http://www.energystar.gov/index.cfm?fuseaction=find_a_product.showProductGroup&pgw_code=COF
Environmental Protection Agency (2011). Life Cycle Cost Estimate for ENERGY STAR Freezer.
EPA_2011_Lifecycle_Cost_Estimate_for_ENERGY_STAR_Residential_Freezer.xls
http://www.energystar.gov/ia/business/bulk_purchasing/bpsavings_calc/Consumer_Residential_Freezer_Sav_Calc.xls
Federal Energy Management Program (2011). Energy Cost Calculator for Faucets and Showerheads. Accessed on 10/12/2011.
FEMP_2011_Energy_Cost_Calculator_for_Faucets_2011 10 12
http://www1.eere.energy.gov/femp/technologies/eep_faucets_showerheads_calc.html
Federal Energy Management Program (2011). Energy Cost Calculator for Electric and Gas Water Heaters. Accessed on 10/16/2011.
FEMP_2011_Energy_Cost_Calculator_for_Electric_and_Gas_Water_Heaters_2011 10 16.pdf
http://www1.eere.energy.gov/femp/technologies/eep_waterheaters_calc.html
Food Service Technology Center (2011). Electric Griddle Life-Cycle Cost Calculation. Accessed on 10/12/2011.
FSTC_2010_Electric_Griddle_LifeCycle_Cost_Calculation_2010 10 12
http://www.fishnick.com/saveenergy/tools/calculators/egridcalc.php
Food Service Technology Center (2011). Gas Combination Oven Life-Cycle Cost Calculation. Accessed 10/12/2011.
FSTC_2011_Gas_Combination_Oven_LifeCycle_Cost_Calculation_2011 10 12
http://www.fishnick.com/saveenergy/tools/calculators/gcombicalc.php
Food Service Technology Center (2011). Gas Conveyor Oven Life-Cycle Cost Calculation. Accessed on 10/12/2011.
FSTC_2011_Gas_Conveyor_Oven_LifeCycle_Cost_Calculation_2011 10 12
http://www.fishnick.com/saveenergy/tools/calculators/gconvovencalc.php
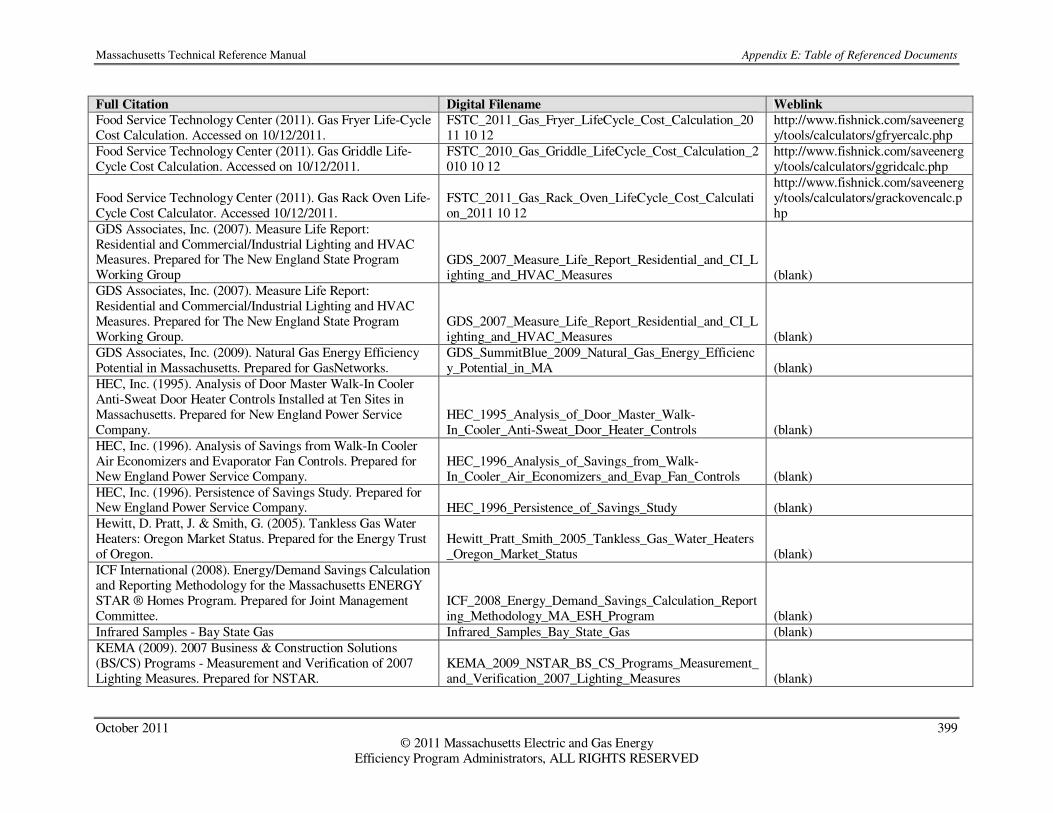
Massachusetts Technical Reference Manual Appendix E: Table of Referenced Documents
October 2011 399 © 2011 Massachusetts Electric and Gas Energy
Efficiency Program Administrators, ALL RIGHTS RESERVED
Full Citation Digital Filename Weblink
Food Service Technology Center (2011). Gas Fryer Life-Cycle Cost Calculation. Accessed on 10/12/2011.
FSTC_2011_Gas_Fryer_LifeCycle_Cost_Calculation_2011 10 12
http://www.fishnick.com/saveenergy/tools/calculators/gfryercalc.php
Food Service Technology Center (2011). Gas Griddle Life-Cycle Cost Calculation. Accessed on 10/12/2011.
FSTC_2010_Gas_Griddle_LifeCycle_Cost_Calculation_2010 10 12
http://www.fishnick.com/saveenergy/tools/calculators/ggridcalc.php
Food Service Technology Center (2011). Gas Rack Oven Life-Cycle Cost Calculator. Accessed 10/12/2011.
FSTC_2011_Gas_Rack_Oven_LifeCycle_Cost_Calculation_2011 10 12
http://www.fishnick.com/saveenergy/tools/calculators/grackovencalc.php
GDS Associates, Inc. (2007). Measure Life Report: Residential and Commercial/Industrial Lighting and HVAC Measures. Prepared for The New England State Program Working Group
GDS_2007_Measure_Life_Report_Residential_and_CI_Lighting_and_HVAC_Measures (blank)
GDS Associates, Inc. (2007). Measure Life Report: Residential and Commercial/Industrial Lighting and HVAC Measures. Prepared for The New England State Program Working Group.
GDS_2007_Measure_Life_Report_Residential_and_CI_Lighting_and_HVAC_Measures (blank)
GDS Associates, Inc. (2009). Natural Gas Energy Efficiency Potential in Massachusetts. Prepared for GasNetworks.
GDS_SummitBlue_2009_Natural_Gas_Energy_Efficiency_Potential_in_MA (blank)
HEC, Inc. (1995). Analysis of Door Master Walk-In Cooler Anti-Sweat Door Heater Controls Installed at Ten Sites in Massachusetts. Prepared for New England Power Service Company.
HEC_1995_Analysis_of_Door_Master_Walk-In_Cooler_Anti-Sweat_Door_Heater_Controls (blank)
HEC, Inc. (1996). Analysis of Savings from Walk-In Cooler Air Economizers and Evaporator Fan Controls. Prepared for New England Power Service Company.
HEC_1996_Analysis_of_Savings_from_Walk-In_Cooler_Air_Economizers_and_Evap_Fan_Controls (blank)
HEC, Inc. (1996). Persistence of Savings Study. Prepared for New England Power Service Company. HEC_1996_Persistence_of_Savings_Study (blank) Hewitt, D. Pratt, J. & Smith, G. (2005). Tankless Gas Water Heaters: Oregon Market Status. Prepared for the Energy Trust of Oregon.
Hewitt_Pratt_Smith_2005_Tankless_Gas_Water_Heaters_Oregon_Market_Status (blank)
ICF International (2008). Energy/Demand Savings Calculation and Reporting Methodology for the Massachusetts ENERGY STAR ® Homes Program. Prepared for Joint Management Committee.
ICF_2008_Energy_Demand_Savings_Calculation_Reporting_Methodology_MA_ESH_Program (blank)
Infrared Samples - Bay State Gas Infrared_Samples_Bay_State_Gas (blank) KEMA (2009). 2007 Business & Construction Solutions (BS/CS) Programs - Measurement and Verification of 2007 Lighting Measures. Prepared for NSTAR.
KEMA_2009_NSTAR_BS_CS_Programs_Measurement_and_Verification_2007_Lighting_Measures (blank)

Massachusetts Technical Reference Manual Appendix E: Table of Referenced Documents
October 2011 400 © 2011 Massachusetts Electric and Gas Energy
Efficiency Program Administrators, ALL RIGHTS RESERVED
Full Citation Digital Filename Weblink
KEMA (2009). Design 2000plus Lighting Hours of Use and Load Shapes Measurement Study. Prepared for National Grid.
KEMA_2009_NGRID_D2_Lighting_HOU_Load_Shapes_Measurement_Study (blank)
KEMA (2009). National Grid USA 2008 Custom Lighting Impact Evaluation, Final Report. Prepared for National Grid.
KEMA_2009_NGRID_2008_Custom_Lighting_Impact_Evaluation (blank)
KEMA (2009). Sample Design and Impact Evaluation Analysis of the the 2008 Custom Program. Prepared for National Grid.
KEMA_2009_NGRID_Sample_Design_and_Impact_Evaluation_Analysis_2008_Custom_Program (blank)
KEMA (2010). 2007/2008 Large C&I Programs - Phase 1 Report Memo for Lighting and Process Measures. Prepared for Western Massachusetts Electric Company.
KEMA_2010_WMECO_2007-2008_LCI_Programs_Phase1_Report_Memo_Lighting_and_Process_Measures (blank)
KEMA (2010). Sample Design and Impact Evaluation Analysis of the 2009 Custom Program. Prepared for National Grid.
KEMA_2010_NGRID_Sample_Design_and_Impact_Evaluation_Analysis_2009_Custom_Program (blank)
KEMA (2011). 2007/2008 Large C&I Programs Final Report. Prepared for Western Massachusetts Electric Company.
KEMA_2011_WMECO_2007-2008_Large_CI_Programs_Final_Report (blank)
KEMA (2011). C&I Lighting Loadshape Project – Final Report. Prepared for the Regional Evaluation, Measurement and Verification Forum.
KEMA_2011_NEEP_EMV_CI_Lighting_Load_Shape_Project (blank)
KEMA (2011). C&I Unitary HVAC LoadShape Project – Final Report. Prepared for the Regional Evaluation, Measurement & Verification Forum.
KEMA_2011_NEEP_EMV_CI_Unitary_HVAC_Load_Shape_Project (blank)
KEMA (2011). Prescriptive Condensing Boiler Impact Evaluation, Project 5 Prescriptive Gas. Prepared for Massachusetts Energy Efficiency Program Administrators.
KEMA_2011_LCIEC_Prescriptive_Condensing_Boiler_Impact_Evaluation_Project5_PrescriptiveGas (blank)
KEMA and DMI (2011). Impact Evaluation of 2009 Custom HVAC Installations. Prepared for Massachusetts Energy Efficiency Program Administrators and Massachusetts Energy Efficiency Advisory Council.
KEMA_DMI_2011_LCIEC_Impact_Evaluation_2009_Custom_HVAC_Installations (blank)
KEMA and SBW (2011). Impact Evaluation of 2008 and 2009 Custom CDA Installations. Prepared for Massachusetts Energy Efficiency Program Administrators and Massachusetts Energy Efficiency Advisory Council.
KEMA_SBW_2011_LCIEC_Impact_Evaluation_2008-2009_Custom_CDA_Installations (blank)
KEMA, Itron and Energy & Resource Solutions (2011). Impact Evaluation of 2009 Custom Gas Installations. Prepared for Massachusetts Energy Efficiency Program Administrators and Massachusetts Energy Efficiency Advisory Council.
KEMA_Itron_ERS_2011_LCIEC_Impact_Evaluation_2009_Custom_Gas_Installations (blank)
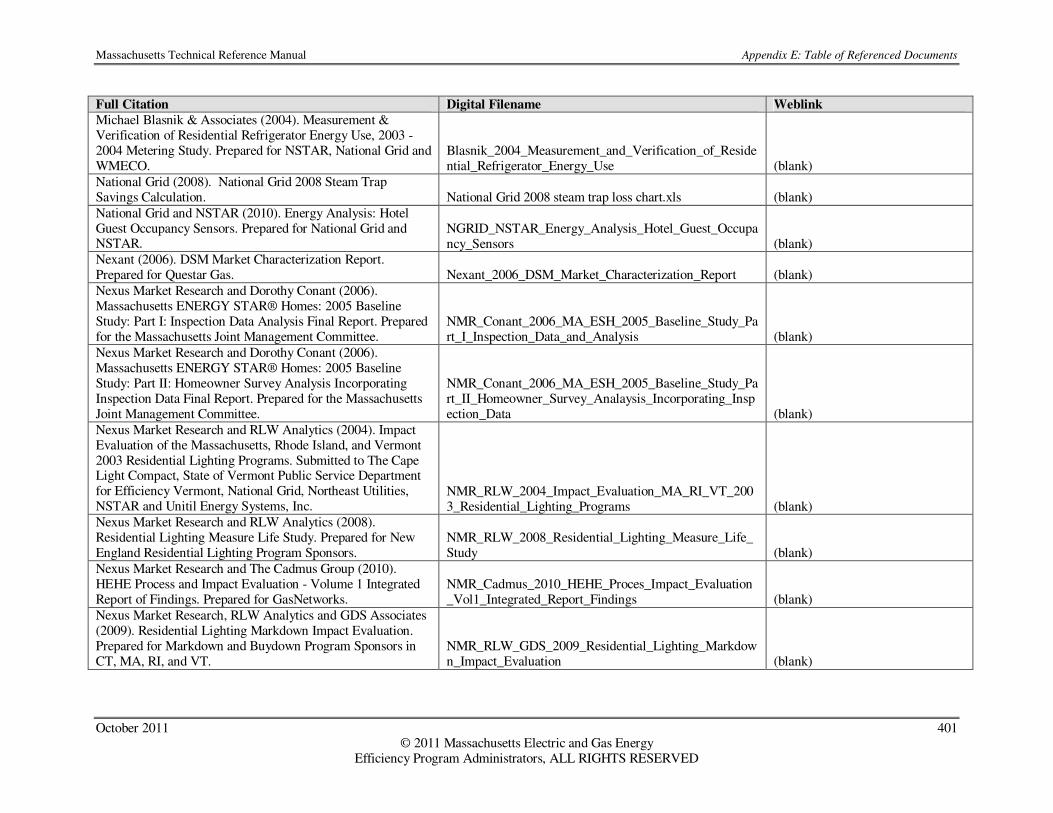
Massachusetts Technical Reference Manual Appendix E: Table of Referenced Documents
October 2011 401 © 2011 Massachusetts Electric and Gas Energy
Efficiency Program Administrators, ALL RIGHTS RESERVED
Full Citation Digital Filename Weblink
Michael Blasnik & Associates (2004). Measurement & Verification of Residential Refrigerator Energy Use, 2003 - 2004 Metering Study. Prepared for NSTAR, National Grid and WMECO.
Blasnik_2004_Measurement_and_Verification_of_Residential_Refrigerator_Energy_Use (blank)
National Grid (2008). National Grid 2008 Steam Trap Savings Calculation. National Grid 2008 steam trap loss chart.xls (blank) National Grid and NSTAR (2010). Energy Analysis: Hotel Guest Occupancy Sensors. Prepared for National Grid and NSTAR.
NGRID_NSTAR_Energy_Analysis_Hotel_Guest_Occupancy_Sensors (blank)
Nexant (2006). DSM Market Characterization Report. Prepared for Questar Gas. Nexant_2006_DSM_Market_Characterization_Report (blank) Nexus Market Research and Dorothy Conant (2006). Massachusetts ENERGY STAR® Homes: 2005 Baseline Study: Part I: Inspection Data Analysis Final Report. Prepared for the Massachusetts Joint Management Committee.
NMR_Conant_2006_MA_ESH_2005_Baseline_Study_Part_I_Inspection_Data_and_Analysis (blank)
Nexus Market Research and Dorothy Conant (2006). Massachusetts ENERGY STAR® Homes: 2005 Baseline Study: Part II: Homeowner Survey Analysis Incorporating Inspection Data Final Report. Prepared for the Massachusetts Joint Management Committee.
NMR_Conant_2006_MA_ESH_2005_Baseline_Study_Part_II_Homeowner_Survey_Analaysis_Incorporating_Inspection_Data (blank)
Nexus Market Research and RLW Analytics (2004). Impact Evaluation of the Massachusetts, Rhode Island, and Vermont 2003 Residential Lighting Programs. Submitted to The Cape Light Compact, State of Vermont Public Service Department for Efficiency Vermont, National Grid, Northeast Utilities, NSTAR and Unitil Energy Systems, Inc.
NMR_RLW_2004_Impact_Evaluation_MA_RI_VT_2003_Residential_Lighting_Programs (blank)
Nexus Market Research and RLW Analytics (2008). Residential Lighting Measure Life Study. Prepared for New England Residential Lighting Program Sponsors.
NMR_RLW_2008_Residential_Lighting_Measure_Life_Study (blank)
Nexus Market Research and The Cadmus Group (2010). HEHE Process and Impact Evaluation - Volume 1 Integrated Report of Findings. Prepared for GasNetworks.
NMR_Cadmus_2010_HEHE_Proces_Impact_Evaluation_Vol1_Integrated_Report_Findings (blank)
Nexus Market Research, RLW Analytics and GDS Associates (2009). Residential Lighting Markdown Impact Evaluation. Prepared for Markdown and Buydown Program Sponsors in CT, MA, RI, and VT.
NMR_RLW_GDS_2009_Residential_Lighting_Markdown_Impact_Evaluation (blank)

Massachusetts Technical Reference Manual Appendix E: Table of Referenced Documents
October 2011 402 © 2011 Massachusetts Electric and Gas Energy
Efficiency Program Administrators, ALL RIGHTS RESERVED
Full Citation Digital Filename Weblink
NMR Group (2011). Massachusetts Appliance Turn-In Program Evaluation Integrated Report Findings. Prepared for National Grid, NSTAR Electric, Cape Light Compact, and Western Massachusetts Electric Company.
NMR_2011_MA_Appliance_Turn-In_Program_Evaluation (blank)
Northeast Energy Efficiency Partnerships (2006). Strategies to Increase Residential HVAC Efficiency in the Northeast. Prepared for National Association of State Energy Offices.
NEEP_2006_Strategies_Increase_Residential_HVAC_Efficiency_Northeast (blank)
Opinion Dynamics Corporation (2007). Evaluation Study of KeySpan's Commercial and Industrial High Efficiency Heating Equipment Program. Prepared for KeySpan Energy Delivery.
ODC_2007_Evaluation_Study_KeySpan_CI_HEHE_Program (blank)
Opinion Dynamics Corporation (2009). Massachusetts Residential Saturation Survey (RASS) - Volume 1: Summary Results and Analysis. Prepared for Cape Light Compact, National Grid, NSTAR Electric, Unitil and Western Massachusetts Electric Company.
ODC_2009_MA_Residential_Appliance_Saturation_Survey_Vol1_Summary_Results_Analysis (blank)
Opinion Dynamics Corporation and Navigant Consulting (2011). Massachusetts Cross-Cutting Behavioral Program Evaluation.
ODC_Navigant_2011_MACC_Behavioral_Program_Evaluation_Vol1 AND ODC_Navigant_2011_MACC_Behavioral_Program_Evaluation_Vol2 (blank)
Oppenheim, Jerrold (2000). MEMO: Low-income DSM program non-energy benefits.
Oppenheim_2000_MEMO_LI_DSM_Program_NonEnergy_Benefits (blank)
Optimal Energy, Inc. (2008). MEMO: Non-Electric Benefits Analysis Update. Prepared for NSTAR. Optimal_2008_NonElectric_Benefits_Analysis_Update (blank) Pacific Gas & Electric Company – Customer Energy Efficiency Department (2007). Work Paper PGECOFST101, Commercial Convection Oven, Revision #0.
PGE_2007_Commercial_Convection_Oven_Work_Paper_PGECOFST10_Rev0 (blank)
Pacific Gas & Electric Company (2006). The Multi Speed Pool Pump Fact Sheet. PGE_2006_MultiSpeed_Pool_Pump_Fact_Sheet (blank) Patel, Dinesh (2001). Energy Analysis: Dual Enthalpy Control. Prepared for NSTAR. Patel_2001_Energy_Analysis_Dual_Enthalpy_Controls (blank) Quantec, LLC (2000). Impact Evaluation: Single-Family EnergyWise Program. Prepared for National Grid.
Quantec_2000_Impact_Evaluation_Single_Family_EnergyWise_Program (blank)
Quantec, LLC (2005). Evaluation of National Grid’s 2003 Appliance Management Program: Room Air Conditioning Metering and Non-Energy Benefits Study. Prepared for National Grid.
Quantec_2005_Evaluation_NGRID_2003_AMP_Room_AC_Metering_and_NonEnergy_Benefits_Study (blank)

Massachusetts Technical Reference Manual Appendix E: Table of Referenced Documents
October 2011 403 © 2011 Massachusetts Electric and Gas Energy
Efficiency Program Administrators, ALL RIGHTS RESERVED
Full Citation Digital Filename Weblink
RLW Analytics (2002). Market Research for the Rhode Island, Massachusetts, and Connecticut Residential HVAC Market. Prepared for National Grid, Northeast Utilities, NSTAR, Fitchburg Gas and Electric Light Company and United Illuminating.
RLW_2002_Market_Research_RI_MA_CT_Residential_HVAC_Market (blank)
RLW Analytics (2003). Small Business Solutions Program Year 2002 Impact Evaluation - Final Report. Prepared for NSTAR.
RLW_2003_NSTAR_Small_Business_Solutions_PY2002_Impact_Evaluation (blank)
RLW Analytics (2004). 2003 Energy Initiative "EI" Program Lighting Impact Evaluation - Final Report. Prepared for National Grid.
RLW_2004_NGRID_2003_EI_Lighting_Impact_Evaluation (blank)
RLW Analytics (2006). Sample Design and Impact Evaluation Analysis for Prescriptive Compressed Air Measures in the Energy Intiative and Design 2000 Programs. Prepared for National Grid.
RLW_2006_NGRID_Sample_Design_and_Impact_Evaluation_Analysis_Prescriptive_Compressed_Air_Measures (blank)
RLW Analytics (2006). Custom Services Impact Evaluation - Final Report: 2004 Measure Installations. Prepared for Northeast Utilities.
RLW_2006_NU_Custom_Services_Impact_Evaluation_2004_Measure_Installations (blank)
RLW Analytics (2007). Coincidence Factor Study: Residential and Commercial Industrial Lighting Measures. Prepared for the New England State Program Working Group.
RLW_2007_Coincidence_Factor_Study_Residential_and_Commercial_Industrial_Lighting_Measures (blank)
RLW Analytics (2007). Final Report, 2005 Coincidence Factor Study. Prepared for Connecticut Energy Conservation Management Board, United Illuminating and Connecticut Light & Power. (blank) (blank) RLW Analytics (2007). Impact Evaluation Analysis of the 2005 Custom SBS Program. Prepared for National Grid.
RLW_2007_NGRID_Impact_Evaluation_Analysis_2005_Custom_SBS_Program (blank)
RLW Analytics (2007). Lighting Controls Impact Evaluation - Final Report, 2005 Energy Initiative, Design 2000plus and Small Business Services Programs. Prepared for National Grid.
RLW_2007_NGRID_Lighting_Controls_Impact_Evaluation (blank)
RLW Analytics (2007). Small Business Services Custom Measure Impact Evaluation. Prepared for National Grid.
RLW_2007_NGRID_SBS_Custom_Measure_Impact_Evaluation (blank)
RLW Analytics (2007). Validating the Impact of Programmable Thermostats. Prepared for GasNetworks.
RLW_2007_Validating_Impacts_of_Programmable_Thermostats (blank)
RLW Analytics (2008). Business & Construction Solutions (BS/CS) Programs Measurement & Verification - 2006 Final Report. Prepared for NSTAR Electric and Gas.
RLW_2008_NSTAR_BS_CS_Programs_Measurement_and_Verification_2006_Final_Report (blank)
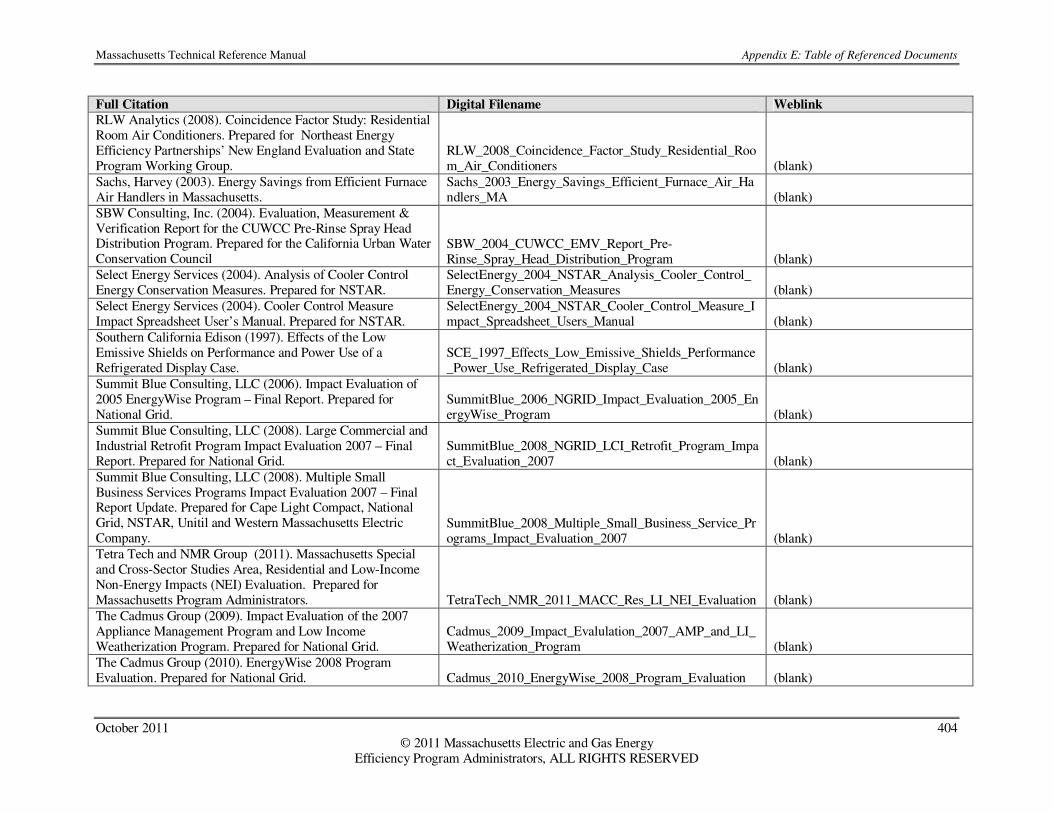
Massachusetts Technical Reference Manual Appendix E: Table of Referenced Documents
October 2011 404 © 2011 Massachusetts Electric and Gas Energy
Efficiency Program Administrators, ALL RIGHTS RESERVED
Full Citation Digital Filename Weblink
RLW Analytics (2008). Coincidence Factor Study: Residential Room Air Conditioners. Prepared for Northeast Energy Efficiency Partnerships’ New England Evaluation and State Program Working Group.
RLW_2008_Coincidence_Factor_Study_Residential_Room_Air_Conditioners (blank)
Sachs, Harvey (2003). Energy Savings from Efficient Furnace Air Handlers in Massachusetts.
Sachs_2003_Energy_Savings_Efficient_Furnace_Air_Handlers_MA (blank)
SBW Consulting, Inc. (2004). Evaluation, Measurement & Verification Report for the CUWCC Pre-Rinse Spray Head Distribution Program. Prepared for the California Urban Water Conservation Council
SBW_2004_CUWCC_EMV_Report_Pre-Rinse_Spray_Head_Distribution_Program (blank)
Select Energy Services (2004). Analysis of Cooler Control Energy Conservation Measures. Prepared for NSTAR.
SelectEnergy_2004_NSTAR_Analysis_Cooler_Control_Energy_Conservation_Measures (blank)
Select Energy Services (2004). Cooler Control Measure Impact Spreadsheet User’s Manual. Prepared for NSTAR.
SelectEnergy_2004_NSTAR_Cooler_Control_Measure_Impact_Spreadsheet_Users_Manual (blank)
Southern California Edison (1997). Effects of the Low Emissive Shields on Performance and Power Use of a Refrigerated Display Case.
SCE_1997_Effects_Low_Emissive_Shields_Performance_Power_Use_Refrigerated_Display_Case (blank)
Summit Blue Consulting, LLC (2006). Impact Evaluation of 2005 EnergyWise Program – Final Report. Prepared for National Grid.
SummitBlue_2006_NGRID_Impact_Evaluation_2005_EnergyWise_Program (blank)
Summit Blue Consulting, LLC (2008). Large Commercial and Industrial Retrofit Program Impact Evaluation 2007 – Final Report. Prepared for National Grid.
SummitBlue_2008_NGRID_LCI_Retrofit_Program_Impact_Evaluation_2007 (blank)
Summit Blue Consulting, LLC (2008). Multiple Small Business Services Programs Impact Evaluation 2007 – Final Report Update. Prepared for Cape Light Compact, National Grid, NSTAR, Unitil and Western Massachusetts Electric Company.
SummitBlue_2008_Multiple_Small_Business_Service_Programs_Impact_Evaluation_2007 (blank)
Tetra Tech and NMR Group (2011). Massachusetts Special and Cross-Sector Studies Area, Residential and Low-Income Non-Energy Impacts (NEI) Evaluation. Prepared for Massachusetts Program Administrators. TetraTech_NMR_2011_MACC_Res_LI_NEI_Evaluation (blank) The Cadmus Group (2009). Impact Evaluation of the 2007 Appliance Management Program and Low Income Weatherization Program. Prepared for National Grid.
Cadmus_2009_Impact_Evalulation_2007_AMP_and_LI_Weatherization_Program (blank)
The Cadmus Group (2010). EnergyWise 2008 Program Evaluation. Prepared for National Grid. Cadmus_2010_EnergyWise_2008_Program_Evaluation (blank)

Massachusetts Technical Reference Manual Appendix E: Table of Referenced Documents
October 2011 405 © 2011 Massachusetts Electric and Gas Energy
Efficiency Program Administrators, ALL RIGHTS RESERVED
Full Citation Digital Filename Weblink
The Cadmus Group (2010). Western Massachusetts Small Business Energy Advantage Impact Evaluation Report Program Year 2008. Prepared for Western Massachusetts Electric Company.
Cadmus_2010_WMECO_SBEA_Impact_Evalulation_Report_PY2008 (blank)
The Cadmus Group (2011). MEMO: BFM Initial Results. Prepared for Gail Azulay, NSTAR and Bob Wirtshafter, EEAC. Cadmus_2011_MEMO_BFM_Initial_Results (blank) The Cadmus Group (2011). Memo: Wi-fi Programmable Thermostat Billing Analysis. Prepared for Keith Miller and Whitney Domigan, National Grid.
Cadmus_2011_MEMO_WiFi_Programmable_Thermostat_Billing_Analysis (blank)
The Fleming Group (1994). Persistence of Commercial/Industrial Non-Lighting Measures, Volume 2, Energy Efficient HVAC and Process Cooling Equipment. Prepared for New England Power Service Company.
Fleming_1994_Persistence_CI_NonLighting_Measures_Vol2_Energy_Efficiency_HVAC_and_Process (blank)
The Fleming Group (1994). Persistence of Commercial/Industrial Non-Lighting Measures, Volume 3, Energy Management Control Systems. Prepared for New England Power Service Company.
Fleming_1994_Persistence_CI_NonLighting_Measures_Vol3_Energy_Management_Control_Systems (blank)
United Illuminating Company and Connecticut Light & Power Company (2010). UI and CL&P Program Savings Documentation for 2011 Program Year. 2011_CT_PSD (blank) USA Technologies Energy Management Product Sheets (2006). USATech_2006_Energy_Management_Product_Sheets (blank) Veritec Consulting (2005). Region of Waterloo Pre-Rinse Spray Valve Pilot Study, Final Report. Veritec_2005_Pre-Rinse_Spray_Valve_Pilot_Study (blank) Waste Reduction Partners (2004). Occupancy Sensors - Utility Savings Initiative - Fact Sheet.
WRP_2004_Occupancy_Sensors_Utility_Savings_Initiative_Fact_Sheet (blank)
Wilcox, Art and LEAN (2005). NSTAR Analysis of Heating System Replacements. Prepared for NSTAR.
Wilcox_LEAN_2005_NSTAR_Analysis_Heating_System_Replacements.xls (blank)

Massachusetts Technical Reference Manual Appendix F: Acronyms
October 2011 406 © 2011 Massachusetts Electric and Gas Energy
Efficiency Program Administrators, ALL RIGHTS RESERVED
Appendix F: Acronyms
ACRONYM DESCRIPTION AC Air Conditioning AFUE Annual Fuel Utilization Efficiency (see the Glossary) AHU Air Handling Unit Btu British Thermal Unit (see the Glossary) CF Coincidence Factor (see the Glossary) CFL Compact Fluorescent Lamp CHP Combined Heat and Power COP Coefficient of Performance (see the Glossary) DCV Demand Controlled Ventillation DHW Domestic Hot Water DOER Department of Energy Resources DSM Demand Side Management (see the Glossary) ECM Electrically Commutated Motor EER Energy Efficiency Ratio (see the Glossary) EF Efficiency Factor EFLH Equivalent Full Load Hours (see the Glossary)
ES ENERGY STAR® (see the Glossary) FCM Forward Capacity Market FR Free-Ridership (see the Glossary) HE High-Efficiency HID High-Intensity Discharge (a lighting technology) HP Horse Power (see the Glossary) HSPF Heating Seasonal Performance Factor (see the Glossary) HVAC Heating, Ventilating, and Air Conditioning ISO Independent System Operator ISR In-Service Rate (see the Glossary) kW Kilo-Watt, a unit of electric demand equal to 1,000 watts kWh Kilowatt-Hour, a unit of energy (1 kilowatt of power supplied for one hour) LED Light-Emitting Diode (one type of solid-state lighting) LCD Liquid Crystal Display (a technology used for computer monitors and similar displays) MMBtu One million British Thermal Units (see “Btu” in the Glossary) MW Megawatt – a measure of electric demand equal to 1,000 kilowatts MWh Megawatt-hour – a measure of energy equal to 1,000 kilowatt-hours NEB Non-Electric Benefit (see the Glossary) NEI Non-Energy Impact NE-ISO New England Independent System Operator NTG Net-to-Gross (see the Glossary) O&M Operations and Maintenance PA Program Administrator (see the Glossary) PARIS Planning And Reporting Information System (a DOER database - see the Glossary) PC Personal Computer RR Realization Rate (see the Glossary) SEER Seasonal Energy Efficiency Ratio (see the Glossary) SO Spillover (see the Glossary) SPF Savings Persistence Factor (see the Glossary) SSL Solid-State Lighting (e.g., LED lighting) VSD Variable-Speed Drive

Massachusetts Technical Reference Manual Appendix G: Glossary
October 2011 407 © 2011 Massachusetts Electric and Gas Energy
Efficiency Program Administrators, ALL RIGHTS RESERVED
Appendix G: Glossary
This glossary provides definitions as they are applied in this TRM for Massachusetts’ energy efficiency programs. Alternate definitions may be used for some terms in other contexts.
TERM DESCRIPTION
Adjusted Gross Savings
Gross savings (as calculated by the measure savings algorithms) that have been subsequently adjusted by the application of all impact factors except the net-to-gross factors (free-ridership and spillover). For more detail, see the section on Impact Factors for Calculating Adjusted Gross and Net Savings.
AFUE Annual Fuel Utilization Efficiency. The measure of seasonal or annual efficiency of a furnace or boiler. AFUE takes into account the cyclic on/off operation and associated energy losses of the heating unit as it responds to changes in the load, which in turn is affected by changes in weather and occupant controls.
Baseline Efficiency The level of efficiency of the equipment that would have been installed without any influence from the program or, for retrofit cases where site-specific information is available, the actual efficiency of the existing equipment.
Btu British thermal unit. A Btu is approximately the amount of energy needed to heat one pound of water by one degree Fahrenheit.
Coefficient of Performance (COP)
Coefficient of Performance is a measure of the efficiency of a heat pump, air conditioner, or refrigeration system. A COP value is given as the Btu output of a device divided by the Btu input of the device. The input and output are determined at AHRI testing standards conditions designed to reflect peak load operation.
Coincidence Factor (CF)
Coincidence Factors represent the fraction of connected load expected to occur concurrent to a particular system peak period; separate CF are found for summer and winter peaks. The CF given in the TRM includes both coincidence and diversity factors multiplied into one number. Coincidence factors are provided for peak periods defined by the NE-ISO for FCM purposes and calculated consistent with the FCM methodology.
Connected Load kW Savings
The connected load kW savings is the power saved by the equipment while in use. In some cases the savings reflect the maximum power draw of equipment at full load. In other cases the connected load may be variable, which must be accounted for in the savings algorithm.
Deemed Savings Savings values (electric, fossil fuel and/or non-energy benefits) determined from savings algorithms with assumed values for all algorithm parameters. Alternatively, deemed savings values may be determined from evaluation studies. A measure with deemed savings will have the same savings per unit since all measure assumptions are the same. Deemed savings are used by program administrators to report savings for measures with well-defined performance characteristics relative to baseline efficiency cases. Deemed savings can simplify program planning and design, but may lead to over- or under-estimation of savings depending on product performance.
Deemed Calculated Savings
Savings values (electric, fossil fuel and/or non-energy benefits) that depend on a standard savings algorithm and for which at least one of the algorithm parameters (e.g., hours of operation) is project specific.
Demand Savings The reduction in demand due to installation of an energy efficiency measure, usually expressed as kW and measured at the customer's meter (see Connected Load kW Savings).
Demand Side Management (DSM)
Strategies used to manage energy demand including energy efficiency, load management, fuel substitution, and load building.
Diversity A characteristic of a variety of electric loads whereby individual maximum demands occur at different times. For example, 50 efficient light fixtures may be installed, but they are not necessarily all on at the same time. See Coincidence Factor.
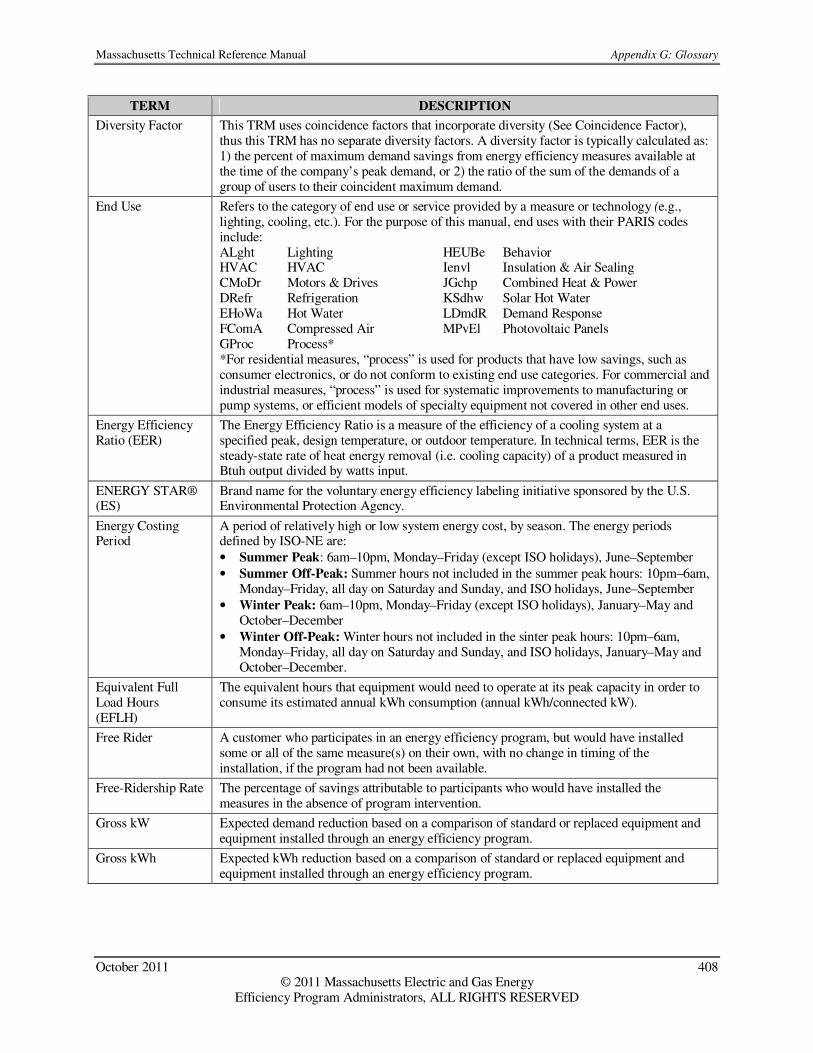
Massachusetts Technical Reference Manual Appendix G: Glossary
October 2011 408 © 2011 Massachusetts Electric and Gas Energy
Efficiency Program Administrators, ALL RIGHTS RESERVED
TERM DESCRIPTION
Diversity Factor This TRM uses coincidence factors that incorporate diversity (See Coincidence Factor), thus this TRM has no separate diversity factors. A diversity factor is typically calculated as: 1) the percent of maximum demand savings from energy efficiency measures available at the time of the company’s peak demand, or 2) the ratio of the sum of the demands of a group of users to their coincident maximum demand.
End Use Refers to the category of end use or service provided by a measure or technology (e.g., lighting, cooling, etc.). For the purpose of this manual, end uses with their PARIS codes include: ALght Lighting HEUBe Behavior HVAC HVAC Ienvl Insulation & Air Sealing CMoDr Motors & Drives JGchp Combined Heat & Power DRefr Refrigeration KSdhw Solar Hot Water EHoWa Hot Water LDmdR Demand Response FComA Compressed Air MPvEl Photovoltaic Panels GProc Process* *For residential measures, “process” is used for products that have low savings, such as consumer electronics, or do not conform to existing end use categories. For commercial and industrial measures, “process” is used for systematic improvements to manufacturing or pump systems, or efficient models of specialty equipment not covered in other end uses.
Energy Efficiency Ratio (EER)
The Energy Efficiency Ratio is a measure of the efficiency of a cooling system at a specified peak, design temperature, or outdoor temperature. In technical terms, EER is the steady-state rate of heat energy removal (i.e. cooling capacity) of a product measured in Btuh output divided by watts input.
ENERGY STAR® (ES)
Brand name for the voluntary energy efficiency labeling initiative sponsored by the U.S. Environmental Protection Agency.
Energy Costing Period
A period of relatively high or low system energy cost, by season. The energy periods defined by ISO-NE are:
• Summer Peak: 6am–10pm, Monday–Friday (except ISO holidays), June–September
• Summer Off-Peak: Summer hours not included in the summer peak hours: 10pm–6am, Monday–Friday, all day on Saturday and Sunday, and ISO holidays, June–September
• Winter Peak: 6am–10pm, Monday–Friday (except ISO holidays), January–May and October–December
• Winter Off-Peak: Winter hours not included in the sinter peak hours: 10pm–6am, Monday–Friday, all day on Saturday and Sunday, and ISO holidays, January–May and October–December.
Equivalent Full Load Hours (EFLH)
The equivalent hours that equipment would need to operate at its peak capacity in order to consume its estimated annual kWh consumption (annual kWh/connected kW).
Free Rider A customer who participates in an energy efficiency program, but would have installed some or all of the same measure(s) on their own, with no change in timing of the installation, if the program had not been available.
Free-Ridership Rate The percentage of savings attributable to participants who would have installed the measures in the absence of program intervention.
Gross kW Expected demand reduction based on a comparison of standard or replaced equipment and equipment installed through an energy efficiency program.
Gross kWh Expected kWh reduction based on a comparison of standard or replaced equipment and equipment installed through an energy efficiency program.
Massachusetts Technical Reference Manual Appendix G: Glossary
October 2011 409 © 2011 Massachusetts Electric and Gas Energy
Efficiency Program Administrators, ALL RIGHTS RESERVED
TERM DESCRIPTION
Gross Savings A saving estimate calculated from objective technical factors. In this TRM, “gross savings” are calculated with the measure algorithms and do not include any application of impact factors. Once impact factors are applied, the savings are called “Adjusted Gross Savings”. For more detail, see the section on Impact Factors for Calculating Adjusted Gross and Net Savings.
High Efficiency (HE)
Refers to the efficiency measures that are installed and promoted by the energy efficiency programs.
Horsepower (HP) A unit for measuring the rate of doing work. One horsepower equals about three-fourths of a kilowatt (745.7 watts).
Heating Seasonal Performance Factor (HSPF)
A measure of the seasonal heating mode efficiencies of heat pumps expressed as the ratio of the total heating output to the total seasonal input energy.
Impact Factor Generic term for a value used to adjust the gross savings estimated by the savings algorithms in order to reflect the actual savings attributable to the efficiency program. In this TRM, impact factors include realization rates, in-service rates, savings persistence, peak demand coincidence factors, free-ridership, spillover and net-to-gross factors. See the section on Impact Factors for more detail.
In-Service Rate The percentage of units that are actually installed. For example, efficient lamps may have an in-service rate less than 100% since some lamps are purchased as replacement units and are not immediately installed. The in-service rate for most measures is 100%.
Measure Life The number of years that an efficiency measure is expected to garner savings. These are generally based on engineering lives, but sometimes adjusted based on observations of market conditions.
Lost Opportunity Refers to a measure being installed at the time of planned investment in new equipment or systems. Often this reflects either new construction, renovation, remodeling, planned expansion or replacement, or replacement of failure.
Measure A product (a piece of equipment), combination of products, or process designed to provide energy and/or demand savings. Measure can also refer to a service or a practice that provides savings. Measure can also refer to a specific combination of technology and market/customer/practice/strategy (e.g., direct install low income CFL).
Net Savings The final value of savings that is attributable to a program or measure. Net savings differs from gross savings (or adjusted gross savings) because it includes adjustments due to free-ridership and/or spillover. Net savings is sometimes referred to as "verified” or “final” savings. For more detail see the section on Impact Factors for Calculating Adjusted Gross and Net Savings.
Net-to-Gross Ratio The ratio of net savings to the adjusted gross savings (for a measure or program). The adjusted gross savings include any adjustment by the impact factors other than free-ridership or spillover. Net-to-gross is usually expressed as a percent.
Non-Electric Benefits (NEBs)
Quantifiable benefits (beyond electric savings) that are the result of the installation of a measure. Fossil fuel, water, and maintenance are examples of non-electric benefits. Non-electric benefits can be negative (i.e. increased maintenance or increased fossil fuel usage which results from a measure) and therefore are sometimes referred to as “non-electric impacts”.
Non-Participant A customer who is eligible to participate in a program, but does not. A non-participant may install a measure because of a program, but the installation of the measure is not through regular program channels; as a result, their actions are normally only detected through evaluations.
On-Peak kW See Summer/Winter On-peak kW
Operating Hours Hours that a piece of equipment is expected to be in operation, not necessarily at full load (typically expressed per year).

Massachusetts Technical Reference Manual Appendix G: Glossary
October 2011 410 © 2011 Massachusetts Electric and Gas Energy
Efficiency Program Administrators, ALL RIGHTS RESERVED
TERM DESCRIPTION
PARIS Planning And Reporting Information System, a statewide database maintained by the Department of Energy Resources (DOER) that emulates the program administrators’ screening model. As a repository for quantitative data from plans, preliminary reports, and reports, PARIS generates information that includes funding sources, customer profiles, program participation, costs, savings, cost-effectiveness and program impact factors from evaluation studies. DOER developed PARIS in 2003 as a collaborative effort with the Department of Public Utilities and the electric program administrators. Beginning with the 2010 plans, PARIS holds data from gas program administrators.
Participant A customer who installs a measure through regular program channels and receives any benefit (i.e. incentive) that is available through the program because of their participation. Free-riders are a subset of this group.
Prescriptive Measure
A prescriptive measure is generally offered by use of a prescriptive form with a prescribed incentive based on the parameters of the efficient equipment or practice.
Program Administrator (PA)
Those entities that oversee public benefit funds in the implementation of energy efficiency programs. This generally includes regulated utilities, other organizations chosen to implement such programs, and state energy offices. The Massachusetts electric PAs include Cape Light Compact, National Grid, NSTAR, Western Massachusetts Electric Company (WMECo), and Unitil. The Massachusetts natural gas PAs include Bay State Gas, Berkshire Gas, and New England Gas.
Realization Rate (RR)
The ratio of measure savings developed from impact evaluations to the estimated measure savings derived from the TRM savings algorithms. This factor is used to adjust the estimated savings when significant justification for such adjustment exists. The components of the realization rate are described in detail in the section on Impact Factors.
Retrofit The replacement of a piece of equipment or device before the end of its useful or planned life for the purpose of achieving energy savings. "Retrofit" measures are sometimes referred to as "early retirement" when the removal of the old equipment is aggressively pursued.
Savings Persistence Factor (SPF)
Percentage of first-year energy or demand savings expected to persist over the life of the installed energy efficiency equipment. The SPF is developed by conducting surveys of installed equipment several years after installation to determine the operational capability of the equipment. In contrast, measure persistence takes into account business turnover, early retirement of installed equipment, and other reasons the installed equipment might be removed or discontinued. Measure persistence is generally incorporated as part of the measure life, and therefore is not included as a separate impact factor.
Seasonal Energy Efficiency Ratio (SEER)
A measurement of the efficiency of a central air conditioner over an entire season. In technical terms, SEER is a measure of equipment the total cooling of a central air conditioner or heat pump (in Btu) during the normal cooling season as compared to the total electric energy input (in watt-hours) consumed during the same period.
Seasonal Peak kW See Summer/Winter Seasonal Peak kW, and Summer/Winter On-Peak Peak kW.
Sector A system for grouping customers with similar characteristics. For the purpose of this manual, the sectors are Commercial and Industrial (C&I), Small Business, Residential, and Low Income.
Spillover Rate The percentage of savings attributable to the program, but additional to the gross (tracked) savings of a program. Spillover includes the effects of (a) participants in the program who install additional energy efficient measures outside of the program as a result of hearing about the program and (b) non-participants who install or influence the installation of energy efficient measures as a result of being aware of the program.
Summer/Winter On-Peak kW
The average demand reduction during the summer/winter on-peak period. The summer on-peak period is 1pm-5pm on non-holiday weekdays in June, July and August; the winter on-peak period is 5pm-7pm on non-holiday weekdays in December and January.

Massachusetts Technical Reference Manual Appendix G: Glossary
October 2011 411 © 2011 Massachusetts Electric and Gas Energy
Efficiency Program Administrators, ALL RIGHTS RESERVED
TERM DESCRIPTION
Summer/Winter Seasonal Peak kW
The demand reduction occurring when the actual, real-time hourly load for Monday through Friday on non-holidays, during the months of June, July, August, December, and January, as determined by the ISO, is equal to or greater than 90% of the most recent 50/50 system peak load forecast, as determined by the ISO, for the applicable summer or winter season.
Ton Unit of measure for determining cooling capacity. One ton equals 12,000 Btu.
Watt A unit of electrical power. Equal to 1/1000 of a kilowatt.