Embed Size (px)
Citation preview
RE
VI
EW
20
06
E C O N O M I C C O M M I S S I O N F O R E U R O P E
C o n v e n t i o n o n L o n g - r a n g e T r a n s b o u n d a r y A i r P o l l u t i o n
STRATEGIES AND POLICIES FOR
AIR POLLUTION ABATEMENT
For more information, consult the Convention’s web site, or contact: Keith Bull, Secretary, Executive Body of the Convention, Palais des Nations, CH-1211 Geneva 10, Switzerland (Tel. +41-22-917-2354 / Fax: +41-22-917-0621).
UNECE Information Service Phone: +41 (0) 22 917 44 44Palais des Nations Fax: +41 (0) 22 917 05 05CH-1211 Geneva 10 E-mail: [email protected] Web site: www.unece.org
EC
E STR
ATEGIES A
ND
PO
LICIES FO
R A
IR P
OLLU
TION
AB
ATEMEN
T U
NITED
NATIO
NS

ECE/EB.AIR/93
ECONOMIC COMMISSION FOR EUROPE Geneva
STRATEGIES AND POLICIESFOR AIR POLLUTION ABATEMENT
2006 Review prepared underThe Convention on Long-range Transboundary Air Pollution
United NationsNew York and Geneva, 2007
2
NOTE
Symbols of United Nations documents are composed of capital letters combined with fi gures. Mention of such symbols indicates a reference to a United Nations document.
The designations employed and the presentation of the material in this publication do not imply the expression of any opinion whatsoever on the part of the Secretariat of the United Nations concerning the legal status of any country, territory, city or area, or of its authorities, or concerning the delimitation of its frontiers or boundaries.
In United Nations texts, the term ìton” refers to metric tons (1,000 kg or 2,204.6 lbs).
Acknowledgements
The secretariat would like to acknowledge the work of Ms. Stephanie Mansourian, consultant, in preparing this publication. It would also like to acknowledge the invaluable contribution of the Convention’s Programme Centres, as well as national experts.
ECE/EB.AIR/93
UNITED NATIONS PUBLICATIONSales No. E.07.II.E.24
ISBN 978-92-1-116977-5
Copyright ® United Nations, 2007All rights reserved
UNECE Information Service Phone: +41 (0) 22 917 44 44Palais des Nations Fax: +41 (0) 22 917 05 05CH-1211 Geneva 10 E-mail: [email protected] Web site: www.unece.org
For more information, consult the Convention’s web site, or contact: Keith Bull,
Secretary, Executive Body of the Convention, Palais des Nations, CH-1211 Geneva 10, Switzerland (Tel. +41-22-917-2354 / Fax: +41-22-917-0621).
ECE/EB.AIR/93
UNITED NATIONS PUBLICATIONSales No. E.07.II.E.24
ISBN 978-92-1-116977-5
TABLE OF CONTENTS
Page
PREFACE 5
EXECUTIVE SUMMARY 7
INTRODUCTION 11
I. CONVENTION ON LONG-RAGE TRANSBOUNDARY AIR POLLUTION 13 A. Recent progress and the status of the Convention and its protocols 13
B. The Convention’s Executive Body and its main subsidiary bodies 14
C. Capacity-building activities 17
D. Future work under the Convention 17
II. TRENDS IN AIR POLLUTION EMISSIONS AND EFFECTS 19 A. Emission Levels and trends 19
B. Trends in eff ects 20
III. IMPLEMENTATION OF AND PROGRESS IN NATIONAL STRATEGIES AND POLICIES 23
A. The 1985 Protocol on the Reduction of Sulphur Emissions or Their Transboundary
Fluxes by At Least 30 Per Cent 23
B. The 1988 Protocol Concerning the Control of Emissions of Nitrogen Oxides or
Their Transboundary Fluxes 25
C . The 1991 Protocol Concerning the Control of Emissions of Volatile Organic Compounds
or Their Transboundary Fluxes 27
D. The 1994 Oslo Protocol on Further Reductions of Sulphur Emissions 30
E. The 1998 Protocol on Heavy Metals 32
F. The 1998 Protocol on Persistent Organic Pollutants 37
G. The 1999 Gothenburg Protocol to Abate Acidifi cation,
Eutrophication and Ground-level Ozone 37
IV. STRATEGIES AND POLICIES FOR CONTROLLING LONG-RANGE TRANSBOUNDARY AIR POLLUTION IN THE UNECE REGION 41
A. General trends and priorities in combating air pollution 41
B. Innovative approaches and emerging technologies 42
C. Cross-sectoral and multi-pollutant approaches 43
D. Market-oriented policies and economic instruments 45
3
ANNEX 47
Table 1: Sulphur content of gas oil (% or ppm) 47
Table 2: Selected measures for reducing lead, mercury and cadmium emissions, by sector 48
Figure 1: Parties to the Convention on Long-range Transboundary Air Pollution 48
Figure 2: Organizational structure of the Convention 49
Figure 3: Fifth percentile of the maximum critical load for sulphur within the EMEP-50 km grid 50
Figure 4: Fifth percentile of the critical load of nutrient nitrogen within the EMEP-50 km grid 50
Figure 5: Emission trends of sulphur in the EMEP area, 1990-2005, 2010 51
Figure 6: Emission trends of nitrogen oxides in the EMEP area, 1990-2005, 2010 51
Figure 7: Emission trends of ammonia in the EMEP area, 1990-2005, 2010 52
Figure 8: Emission trends of NMVOCs in the EMEP area, 1990-2005, 2010 52
Figure 9: Emission trends of POPs in the EMEP area, 1990-2005 53
Figure 10: Emission trends of heavy metals in the EMEP area, 1990-2005 54
Figure 11: Emission trends of particulate matter in the EMEP area, 1990-2005, 2010 55
Figure 12 a: United States NOx Emission Trends in PEMA States (1990-2004) 55
Figure 12 b: United States VOC Emission Trends in PEMA States (1990-2004) 56
Figure 12 c: Canada NOx Emission Trends in PEMA Region (1990-2002) 56
Figure 12 d: Canada VOC Emission Trends in PEMA Region (1990-2002) 57
Figure 12 e: Trends in SO2 Emissions: Canada and the United States 57
Figure 13: Emissions of sulphur in 2005 at 50km resolution 58
Figure 14: Emissions of nitrogen oxides in 2005 at 50 km resolution 58
Figure 15: Emissions of ammonia in 2005 at 50 km resolution 59
Figure 16: Emissions of NMVOCs in 2005 at 50 km resolution 59
Figure 17a: Emissions of PM coarse in 2005 at 50 km resolution 60
Figure 17b: Emissions of PM 2.5 in 2005 at 50 km resolution 60
Figure 18: Anthropogenic emissions per sector of SOx in 2005 in the EMEP area 61
Figure 19: Anthropogenic emissions per sector of NOx in 2005 in the EMEP area 61
Figure 20: Anthropogenic emissions per sector of NMVOCs in 2005 in the EMEP area 62
Figure 21: Anthropogenic emissions per sector of ammonia in 2005 in the EMEP area 62
Figure 22 a: Anthropogenic emissions per sector of PM 2.5. in 2005 in the EMEP area 63
Figure 22 b: Anthropogenic emissions per sector of PM coarse in 2005 in the EMEP area 63
Figure 23: Sectoral emissions for heavy metals in 2005 in the EMEP area 64
Figure 24: Sectoral emissions for POPs in 2005 in the EMEP area 65
Figure 25: Reduction in emissions of NOx in the ECE region (1990-2005) 66
Figure 26: Reduction in emissions of NMVOCs in the ECE region (1990-2005) 66
Figure 27: Reduction in emissions of sulphur in the ECE region (1990-2005) 67
Figure 28: Reduction in emissions of ammonia in the ECE region (1990-2005) 67
Figure 29: Percentage reduction in SO2, NOx, NH3 and NMVOC (1990-2005) 68
Figure 30: Eff ects of pollutants covered by the Convention’s protocols 70
Figure 31: Ecosystem area protected from acidifi cation in every EMEP-50 km
grid cell for the years 1990, 2000, 2010 and 2020 71
Figure 32: Ecosystem area protected from eutrophication in every EMEP-50 km grid cell for
the years 1990, 2000, 2010 and 2020 72
Figure 33: Status of ratifi cation of protocols as of 15 September 2007 73
S T R A T E G I E S A N D P O L I C I E S F O R A I R P O L L U T I O N A B A T E M E N T
ST
RA
TE
GI
ES
A
ND
P
OL
IC
IE
S
FO
R
AI
R
PO
LL
UT
IO
N
AB
AT
EM
EN
T
The Convention on Long-range Transboundary Air Pollution, signed in Geneva in 1979, is a landmark international agreement. For
more than 25 years it has been instrumental in reducing emissions contributing to transboundary air pollution in the UNECE region through coordinated e� orts on research, monitoring and the development of emission reduction strategies on regional air pollution and its e� ects.
The 2006 summary review of strategies and policies for air pollution abatement is based on replies by Parties to the Convention to the 2006 questionnaire on strategies and policies as well as other information provided by Parties. The questionnaire asked Parties for information on their implementation of the protocols to the Convention as well as general policy information related to the integration of air pollution mitigation policies with economic, transport, energy, waste management, spatial planning and other policy frameworks.
Each of the protocols includes reporting obligations by Parties. At its twenty-third session, the Executive Body decided that the questionnaire would represent the uniform reporting framework referred to in article 8.2 of the Protocol on Nitrogen Oxides, article 8.4 of the Protocol on Volatile Organic Compounds, article
5.1 of the 1994 Protocol on Sulphur, article 9.2 of the Protocol on Persistent Organic Pollutants, article 7. 2 of the Protocol on Heavy Metals and article 7.2 of the Gothenburg Protocol (ECE/EB.AIR/87, para. 70(b)).
The overall aim of the reviews of strategies and policies is:
(a) To assess the progress made by Parties and the region as a whole in implementing obligations under the Convention and its protocols and to further their implementation;
(b) To facilitate the exchange of information between Parties, which is foreseen in the Convention and its protocols; and
(c) To raise awareness about the problems of air pollution, as well as to make the contribution of the Convention and successful abatement strategies more visible.
As of 15 September 2007, 51 member countries of UNECE and the European Community were Party to the Convention. The review re� ects the continued e� orts made by Parties to comply with their obligations under international environmental agreements, and to contribute to a cleaner environment in the region.
5
PREFACE
6
6 / S T R A T E G I E S A N D P O L I C I E S F O R A I R P O L L U T I O N A B A T E M E N T
6
ST
RA
TE
GI
ES
A
ND
P
OL
IC
IE
S
FO
R
AI
R
PO
LL
UT
IO
N
AB
AT
EM
EN
T
The Convention on Long-range Transboundary Air Pollution, signed in Geneva in 1979, is a landmark international agreement. For more
than 25 years it has been instrumental in reducing emissions contributing to transboundary air pollu-tion in the UNECE region through coordinated e� orts on research, monitoring and the develop-ment of emission reduction strategies on regional air pollution and its e� ects. As of 15 September 2007, 51 member states of UNECE and the European Community were Parties to the Convention.
The 2006 Review was prepared mainly on the basis of replies to a questionnaire on strategies and policies for air pollution abatement received from 24 Parties. The questionnaire was used as a tool for determining compliance by Parties to the Convention and its Protocols, as well as for the collection and dissemination of more general information on air pollution abatement technologies and trends.
Early sections of the Review summarize the status of rati� cation of the Convention and its protocols (part I, section A); describe the Convention and the activities of its main subsidiary bodies (section B); underline the importance of capacity-building activities (section C); and re� ect possible areas of future work under the Convention (section D). Part II describes trends in air pollution emissions and e� ects. Parts III and IV summarize replies by Parties to the questionnaire, showing progress made in the compliance with and implementation of each Protocol, as well as general strategies and policies pursued for air pollution abatement.
The Convention’s work continues to be under-pinned by strong science. Monitoring gives basic information on pollutant levels and environmental
damage and recovery as well as providing data that are essential to derive response mechanisms and for developing predictive models. Linking these scienti� c activities and policy development, for example using integrated assessment modelling, remains an important feature of the Convention’s approach to develop protocols and abate air pollution. Concentrations of sulphur dioxide in Europe continued to decrease: 65% from 1990 to 2004. Concentrations of other pollutants have also decreased over the same period: nitrogen oxide (NOx) by 30%, volatile organic compounds (VOCs) by 38% and ammonia by 22%.
E� ects, particularly acidi� cation, have fallen in line with the drop in emissions. This was especially notable in fresh waters in some regions. However, there remain concerns about nitrogen depositions, ozone concentrations, and the e� ects of particulate matter on human health.
The Executive Body has placed increased emphasis on the implementation of the Convention and its Protocols, in particular in Parties with economies in transition. The project “Capacity Building for Air Quality Management and the Application of Clean Coal Combustion Technologies in Central Asia” (CAPACT) was one concrete response to this need. Further capacity-building was foreseen under an action plan for countries of Eastern Europe, Caucasus and Central Asia (EECCA), approved in 2005 by the Executive Body. The EECCA action plan aimed, inter alia, to create awareness of air pollution and its e� ects on health and the environment, ensure political commitment at the ministerial level to tackle air pollution problems, develop emission estimates and scenarios, set up monitoring stations and extend EMEP modelling to Central Asia, and develop ecosystem sensitivity maps and health damage estimates.
EXECUTIVE SUMMARY
7
Current priorities under the Convention have included the fi nalization of the reviews of the three most recent protocols: the 1998 Protocol on Heavy Metals, the 1998 Protocol on Persistent Organic Pollutants (POPs) and the 1999 Protocol to Abate Acidifi cation, Eutrophication and Ground-level Ozone (Gothenburg Protocol). For the Gothenburg Protocol there is already increased interest in the health eff ects of particulate matter and in the issue of how hemispheric transport of air pollution might be addressed in a revised or amended protocol. In addition, many Parties are keen to consider synergies and tradeoff s with climate change and take account of the nitrogen cycle in protocol development. For the Protocol on POPs, there will be a continued focus on new substances. Expert peer reviewers have evaluated proposed substances and recommendations have been made to the Executive Body for their addition to one or more of the annexes in the Protocol. Exploration of management options to control the use of some of these substances is also a priority, as is the determination of the most appropriate way (from a legal perspective) to amend the Protocol. For the Protocol on Heavy Metals, while no new substances have been proposed, Parties have been encouraged to work on an eff ects-based approach to formulating future optimized control strategies for heavy metals.
Implementation of protocols and progress on national strategies and policies
All eight protocols to the Convention are now in force, and Parties were asked in the questionnaire to comment on their implementation.
National strategies, policies and programmes used by governments to abate or reduce sulphur emissions under both the Protocol on the Reduction of Sulphur Emission or Their Transboundary Fluxes by At Least 30 Per Cent (Helsinki, 1985) and the Protocol on Further Reductions of Sulphur Emissions (Oslo, 1994) included the control of the sulphur content of fuel, energy effi ciency measures, the promotion of renewable energy and the application of best available technologies (BAT). Approaches used by Parties to reduce sulphur emissions included investment in alternative energy sources such as wind power generation to reduce dependence on sulphur-emitting fossil fuels, or promoting renewable energy sources, including hydropower and biomass, and the use of natural gas in large industrial plants. Parties have promoted renewable energy and energy effi ciency through market-based incentives such as tax incentives, subsidies and eco-labelling.
The Protocol Concerning the Control of Emissions of Nitrogen Oxides or Their Transboundary Fluxes (Sofi a, 1988) calls on Parties to apply national emission standards to all major source categories and new stationary and mobile source using economically feasible BAT, while developing pollution control measures for existing stationary sources. The Protocol also requires Parties to make unleaded fuel suffi ciently available to facilitate the circulation of vehicles equipped with catalytic converters. The transport sector continued to be a main source of NOx emissions in most countries. Parties therefore focused on enforced speed limits and traffi c management schemes, as well as subsidies to improve public transport systems, emphasis on a modal shift from road to rail transport, and improvements in vehicle fuel effi ciency, including the replacement of older, more polluting vehicles with newer, cleaner ones. Technical measures to reduce NOx emissions from stationary sources included selective catalytic reduction units retrofi tted on existing coal- and gas-fi red electric utility boilers; low-NOx burners retrofi tted to combustion units; and, a cap-and-trade programme for large electricity-generating units and large industrial boilers and turbines. Emissions from large stationary sources were often controlled through permits and licences.
The Protocol on the Control of Emissions of Volatile Organic Compounds or Their Transboundary Fluxes (Geneva, 1991) requires Parties to reduce their VOC emissions by 30% by 1999, from selected base years between 1984 and 1990, and to maintain them below those levels. Strategies pursued by Parties included legislation targeting VOC emissions from transport; use of BAT to control and reduce VOC emissions from existing stationary sources in major source categories, such as leak repairs, operating and performance standards, biofi ltration, vapour processing at tank loading, end-of-pipe technology, low-solvent alternatives, new drying technology, less volatile cleaning agents, incineration and closed moulding in polyester processing and recycling; and measures to reduce the volatility of petrol during refuelling operations.
The 1998 Protocol on Heavy Metals (Aarhus, 1998) targets three particularly harmful metals that are listed in an annex to the Protocol: cadmium, lead and mercury. Leaded petrol was largely phased out by Parties or was in the process of being phased out. The most common strategies to tackle pollution from heavy metals were economic instruments; voluntary agreements; conservation; clean energy sources; clean transport
S T R A T E G I E S A N D P O L I C I E S F O R A I R P O L L U T I O N A B A T E M E N T
8
systems; dust abatement measures; phasing out of processes that emit heavy metals; and product control measures.
The objective of the Protocol on Persistent Organic Pollutants (Aarhus, 1998) is to control, reduce or eliminate discharges, emissions and losses of POPs. The Protocol currently recognizes a list of 16 POPs that resist degradation under natural conditions and that have been associated with adverse eff ects on human health and the environment. Measures used by Parties to reduce and control POPs included better management of toxic waste; regulating emissions from waste incineration plants; and regulations limiting the import, production, supply, use and export of substances that might present a hazard to the environment.
The Protocol to Abate Acidifi cation, Eutrophication and Ground-level Ozone (Gothenburg, 1999) is an innovative multi-eff ect, multi-pollutant protocol that aims to simultaneously address the three eff ects it describes through controlling the pollutants causing them. It promotes action within the UNECE region and sets an example for action worldwide. The Protocol seeks to control and reduce emissions of sulphur, NOx, ammonia and VOCs from anthropogenic sources. It is the fi rst Protocol under the Convention to tackle more than one pollutant, and the fi rst to address ammonia. It sets emission ceilings for 2010 for the four pollutants, negotiated on the basis of scientifi c assessments of pollution eff ects and abatement options. Once the Protocol is fully implemented, Europe’s emissions should be cut signifi cantly for sulphur (63%), NOx (41%), VOCs (40%) and ammonia (17%), compared to 1990. Over the same time in the North American Pollutant Emission Management Area (PEMA), levels for Canada and the United States of NOx/VOC are expected to fall by 34%/29% and 51%/49% respectively. Sulphur levels in Canada and the United States fell 36% and 27% respectively by 2004.
Aside from the strategies and policies cited by Parties for reducing sulphur, NOx and VOCs, approaches used to abate ammonia, in particular from agricultural sources, included covering stores of solid manure that were not in daily use, covers on slurry containers on livestock holdings, bans on surface spreading, reductions in the time that applied manure was allowed to remain on the ground surface, bans on ammonia treatment of straw, and limiting local ammonia volatilization from livestock in the vicinity of vulnerable natural habitat types. Other Parties cited voluntary measures such as incorporating manure within four hours after spreading, using injection
techniques for slurry and urine spreading, and using band spreaders. Many of these measures were refl ected in national advisory codes of good agricultural practices.
General trends and priorities in combating air pollution
In addition to providing information on Protocols in force, Parties described their general policy directions and priorities in tackling air pollution. These included public information campaigns and voluntary schemes, dissuasive taxes and fi nes, and positive incentives to promote the use of renewable energy and cleaner fuels, including biofuels (biodiesel, bioethanol). There were clear trends in all responding countries to retrofi t old vehicles, which involved retrofi tting soot fi lters on all categories of vehicles and mobile machinery. Environmental impact assessments were increasingly required for major new projects in an attempt to reduce their negative environmental impact. Many Parties reported they were investing in new technologies to reduce air pollution or to mitigate its impact and were supporting the development of new environmental technologies, including in heating and control systems, domestic hot water and sanitary systems, ventilation, white goods, lighting and industry. Cross-sectoral and multi-pollutant approaches were gaining in popularity, including the integration of air pollution policies into sectoral policies, particularly agricultural, energy, health and transport policy.
Compliance mechanism
The text of the below paragraphs was submitted by the Chair of the Implementation Committee in response to a request by delegations to clarify the compliance procedures under the Convention. An eff ective compliance mechanism is an important component of the success of the Convention. Parties must demonstrate that they have complied with their obligations under the Convention. This includes both their obligations to reduce emissions under Protocols they are Party to and their obligation to report this information. Reporting on strategies and policies, emission reporting and emission reduction are all monitored by an Implementation Committee, which oversees compliance by Parties with their respective obligations.
The Implementation Committee was established by a decision of the Executive Body in 1997 (EB Decision 1997/2) laying out its three primary tasks:
E X E C U T I V E S U M M A R Y
9
• To consider submissions or referrals on individual Parties’ compliance;
• To periodically review compliance by the Parties with the reporting requirements of the Protocols; and
• To carry out in-depth reviews of compliance with specifi ed obligations in an individual Protocol.
Based on submissions and referrals, the Committee examines whether an individual Party is in non-compliance with a specifi c obligation under a given Protocol as alleged in the submission or referral. If the Committee fi nds, based on information received from the Party concerned or through the secretariat, that there is a case of non-compliance, it submits to the Executive Body, together with its report, recommendations on action that could be taken to bring about full compliance.
Unlike this consideration of individual cases, the other two tasks do not include examination of individual Parties’ compliance, but are mainly an overall review of
the state of health of the Protocols. Even if, while carrying out these tasks, the Committee identifi es possible non-compliance by an individual Party with some obligations, this does not trigger a more thorough examination, since the Committee cannot examine an individual Party’s compliance without a specifi c submission or referral by a Party or the Secretariat.
The Committee submits each year a detailed report about its work and fi ndings to the Executive Body (ECE/EB.AIR/2006/3). Together with the Committee’s recommendations, this allows the Executive Body to take the decisions it considers necessary to promote overall and individual compliance with the Convention and the Protocols.
The Committee reviews compliance by Parties with their obligations to report on strategies and policies for air pollution abatement, based on their replies to questionnaire on strategies and policies. The Committees fi ndings for 2006 are contained in its report to the EB (ECE/EB.AIR/2006/3/Add.1).
S T R A T E G I E S A N D P O L I C I E S F O R A I R P O L L U T I O N A B A T E M E N T
ST
RA
TE
GI
ES
A
ND
P
OL
IC
IE
S
FO
R
AI
R
PO
LL
UT
IO
N
AB
AT
EM
EN
T
The 2006 review of strategies and policies for air pollution abatement is one of a series of such reviews prepared under the Convention
on Long-range Transboundary Air Pollution. They aim to identify Parties’ progress, aid information exchange as well as raise awareness about air pollution problems and the work of the Convention towards solving them. This review does not constitute a review and assessment of compliance by Parties with their substantive and reporting obligations under the protocols, as carried out by the Convention’s Implementation Committee.
To provide background information, chapter I of the review summarizes brie� y the work of the Convention and its subsidiary bodies. Chapter II is based on information provided by the EMEP Meteorological Synthesizing Centres-East and West (MSC-W and MSC-E) using data submitted by Parties and data submitted to the International Cooperative Programmes under the Convention’s Working Group on E� ects. It summarizes the trends in air pollution and e� ects in the region in recent years and identi� es some of the consequences of the strategies and policies taken.
Chapters III and IV of this review draw mainly on replies from Parties to a questionnaire on national
strategies and policies. To address the aims described in the preface and to help Parties report on their obligations and to provide a basis for reviewing their actions, the Executive Body, at its twenty-third session, approved the 2006 draft questionnaire on strategies and policies for air pollution abatement (EB AIR/2005/4, Adds.1 and 2). Similar to other strategies and policies questionnaires in recent years, the 2006 questionnaire was made up of two parts, one that covered the obligations of protocols, the other a general policy part. Replies relating to the protocol obligations are re� ected in chapter III, those to the general policy responses are in chapter IV.
The questionnaire was made available to Parties on the Internet between 15 February and 31 May 2006. Twenty-four Parties responded to all or parts of the questionnaire. Information supplied by other means was collected up to 15 July 2006. Emission data used for this review were those up to 31 March 2006. As requested by the Executive Body, the Parties’ replies to the 2006 questionnaire are available on the Convention’s website.
The review was approved for publication by the Executive Body at its twenty-� fth session in December 2006.
1 1
INTRODUCTION
1 11 1
ST
RA
TE
GI
ES
A
ND
P
OL
IC
IE
S
FO
R
AI
R
PO
LL
UT
IO
N
AB
AT
EM
EN
T S T R A T E G I E S A N D P O L I C I E S F O R A I R P O L L U T I O N A B A T E M E N T
A. Recent progress and the status of the Convention and its protocols
W ith the accession of Albania to the Convention in December 2005 and the succession of Montenegro in June 2006,
the Convention’s Parties now number 51. (See � gure 1: Parties to the Convention on Long-range Transboundary Air Pollution). Virtually the entire area of the UNECE region in Europe and North America is now covered by the Convention. While only two countries from Central Asia are Party to the Convention (Kazakhstan and Kyrgyzstan), the remaining three (Tajikistan, Turkmenistan, and Uzbekistan) are involved in work that can lead to accession. Capacity-building in Eastern Europe, Caucasus and Central Asia (EECCA) and in South-Eastern Europe (SEE) is increasingly important in the Convention’s work, and some of the work is described in section C below.
Already at the time of the last review of strategies and policies for air pollution abatement, the Convention had successfully negotiated and adopted eight legally binding protocols to control speci� c pollutants. With the entry into force of the 1998 Aarhus Protocol on Persistent Organic Pollutants, the 1998 Aarhus Protocol on Heavy Metals in 2003 and the 1999 Gothenburg Protocol to Abate Acidi� cation, Eutrophication and Ground-level Ozone in 2005, all eight protocols to the Convention are now in force. Continued
e� orts by Parties to ratify or accede to the more recent protocols will further strengthen the endeavours to meet the targets set by the protocols. Overall targets for the region for most pollutants covered by the protocols are being met, though the successes of individual Parties vary.
Even so, most Parties to protocols are meeting their obligations and some are achieving much more than the set targets through e� ective national action. Only a few Parties have been identi� ed by the Convention’s Implementation Committee as failing to meet the requirements they have signed up to, and these are explaining to the Convention’s Executive Body how they will accelerate action in order to meet obligations in the future.
Since the 2002 review was published, the Convention has continued to make advances in its work on air pollution control and abatement. With the fall in emissions of sulphur and nitrogen oxides we are beginning to see recovery of sensitive ecosystems in some areas. Further details are provided in section II.B. The underpinning science also continues to develop and progress in the work of the Convention’s Working Group on E� ects and the Cooperative Programme on Monitoring and Evaluation of the Long-range Transmission of Air Pollutants in Europe (EMEP) is outlined in the sections below.
The website for the Convention, (www.unece.org/env/lrtap) provides further information on the Convention’s work.
1 3
CONVENTION ON LONG-RANGE TRANSBOUNDARY AIR POLLUTION
1
1 31 31 3
S T R A T E G I E S A N D P O L I C I E S F O R A I R P O L L U T I O N A B A T E M E N T
1 4 1 5
B. The Convention’s Executive Body and its main subsidiary bodies
The Executive Body (the meeting of the Parties) is the governing and decision-making body of the Convention. At its meetings, its three main subsidiary bodies and the Convention’s Implementation Committee provide reports on their work. The Executive Body is responsible for adopting protocols, decisions, reports (such as this review) and agreeing its annual workplans as well as developing strategies for its future work.
Refl ecting the Convention’s science-based approach to emission control strategies, the Executive Body has two scientifi c subsidiary bodies, the Working Group on Eff ects and the EMEP Steering Body. The Working Group on Strategies and Review is the main negotiating body for the Convention and is responsible for reviewing protocols, identifying any need for amendment or revision and making recommendations for such changes.
The Implementation Committee consists of 9 elected members covering a cross-section of the geographical spread and expertise of the Convention. It draws the attention of the Executive Body to cases of non-compliance by Parties with their obligations under the protocols to the Convention and recommends action for encouraging compliance.
The work of the three main subsidiary bodies is described below with reference to recent structural changes and achievements. (See fi gure 2: The organizational structure of the Convention).
Activities of EMEP
EMEP was established before the adoption of the Convention but its implementation and development, including reference to work on monitoring, modelling and emissions reporting, is described within the text of article 9 of the Convention. The programme is comprised of four main elements: (a) collection of emission data; (b) measurements of air and precipitation quality; (c) modelling of atmospheric transport and deposition of air pollution; and (d) integrated assessment modelling.
The work of EMEP continues to expand and involves increasing numbers of Parties. There are now 41 Parties to the EMEP Protocol, which provides funding for three
EMEP Centres, and increasing numbers of Parties are establishing monitoring stations and reporting their emissions.
Parties to protocols are obliged to report their emissions of the associated pollutants; all Parties to the Convention are encouraged to report emissions and most do so. MSC-W holds a database of emission data that are publicly available. In recent years, EMEP’s Task Force on Emission Inventories and Projections has developed a review procedure for improving the quality of reported data. Pilot reviews are already taking place and a regular review mechanism will be implemented soon.
Emission data are used by MSC-W and MSC-E to model the transport of pollutants between countries. Models developed by the centres cover all the pollutants of the protocols and they form the basis for developing strategies for abatement measures to protect human populations and sensitive ecosystems. Since 2002 the MSC-W and the MSC-E models have been reviewed and compared with other available models; they were judged state of the art and fi t for application to the future work of the Convention.
EMEP has made progress too in its monitoring activities. The Executive Body has approved a monitoring strategy, developed by EMEP’s Chemical Coordinating Centre and its Task Force on Measurements and Modelling, that describes three levels of commitment. The lowest level provides basic monitoring information on the major air pollutants; the second level requires more in-depth monitoring of a wider range of substances, while the third level is aimed at research and intensive monitoring campaigns.
A new area of work under EMEP is hemispheric transport of air pollution. This refl ects the Executive Body’s concern about the amount of pollution that is believed to move into and out of the UNECE region (see section D below). A new Task Force has been established under the EMEP Steering Body to coordinate scientifi c work in this area, to fi nd out the extent of the problem and understand how it might be accounted for in the development of future strategies.
Key to the development of air pollution strategies for most of the major pollutants has been the use of integrated assessment models that use emissions data, transport models, abatement costs and eff ects to develop cost-optimized strategies that provide maximum benefi ts. EMEP’s Task Force on Integrated Assessment Modelling directs and oversees this modelling work
C O N V E N T I O N O N L O N G - R A N G E T R A N S B O U N D A R Y A I R P O L L U T I O N
1 5
that has been the major driving force in developing the Oslo Protocol and the Gothenburg Protocol. Recently, the RAINS model, developed by EMEP’s Centre for Integrated Assessment Modelling (CIAM), has also been peer reviewed. Parties were reassured that the model was considered eff ective for most pollutants whilst its eff ectiveness for others could be improved through Parties providing better data. The model is being used for the fi rst review of the Gothenburg Protocol.
Activities of the Working Group on E� ects
The Working Group on Eff ects was established to develop international cooperation in research and monitoring to provide information on the degree, geographic extent and trends of pollutant impacts. It manages six international cooperative programmes (ICPs) that study aquatic and terrestrial ecosystems and materials; these are each led by a Task Force and supported by a programme centre. A joint task force of the Executive Body and the World Health Organization (WHO) was set up to consider the health eff ects of air pollution.
The Working Group receives regular reports from its ICPs and the Task Force on Health. It also prepares major reports for the Executive Body. Its 2004 substantive report reviewed and assessed the status of air pollution eff ects and their recorded trends in the UNECE region. The report was based, in large part, on the long-term results of the monitoring and modelling work of the ICPs and the Task Force on Health.
The reports of the Task Force on Health attempt to identify relationships between concentrations of air pollutants and their eff ects using, for example, the analysis of data from epidemiological studies. In recent years the Task Force has reported on the eff ects of ozone (in particular agreeing on a new indicator for ozone health impacts), particulate matter (PM), persistent organic pollutants (POPs) and heavy metals.
Eff ects of pollution on buildings and materials have been studied by ICP Materials, which, through its monitoring programme, has derived dose-response functions to quantify the eff ects of multiple pollutants causing corrosion and soiling. The ICP has now extended its evaluation of eff ects to cultural heritage sites.
ICP Modelling and Mapping has been responsible for developing and maintaining up-to-date maps of critical loads that show the threshold of eff ects for acidifi cation and eutrophication (see fi gures 3 and 4: Critical load
maps for sulphur and nutrient nitrogen). These maps were the basis for setting targets for the Oslo Protocol and Gothenburg Protocol. The work has now been extended to dynamic modelling and deriving target loads from the models; many national focal centres have provided data on this since 2003. The programme has also developed critical loads of heavy metals and the Programme’s Coordination Centre for Eff ects (CCE) and MSC-E have now mapped areas at risk from the deposition of cadmium, lead and mercury both for ecosystem and health eff ects. CCE together with CIAM have developed methods for linking emissions and critical load exceedances in integrated assessment models.
Monitoring by ICP Vegetation has shown the widespread eff ects of ozone on crops and other vegetation across Europe. Recently, a new “fl ux-based” approach was proposed for assessing the risk of ozone-induced eff ects on crops and forest trees in integrated assessment models, though the previously used concentration-based approach is still being further developed for quantifying eff ects on (semi-) natural vegetation. Calculations by ICP Vegetation and MSC-W, using both approaches for wheat and for beech, showed critical ozone levels were widely exceeded across Europe. However, the two approaches showed diff erent spatial patterns of predicted damage.
The Working Group on Eff ects’ environmental monitoring networks provide long-term data series on important environmental eff ects, covering most of Europe and parts of North America. The extensive defoliation and intensive forest sites of ICP Forests have shown the continued damage to forests from a variety of causes, including air pollution. The numerous lakes and streams monitored by ICP Waters have shown trends in both damage and, more recently, recovery of aquatic systems in many parts of the region. Biomonitoring by ICP Vegetation and in-depth monitoring by ICP Integrated Monitoring provide detailed information on changes to biota that are responding to a variety of environmental factors including air pollution.
Site monitoring data from the programmes have been important for calculating ecosystem-specifi c critical loads and for validating critical loads and critical levels maps. Site-specifi c data are also important for developing complex dynamic models that are able to predict future changes in the environment resulting from air pollution control strategies. The Working Group’s Joint Expert Group on Dynamic Modelling brings together experts from all programmes to share knowledge and to coordinate activities on dynamic modelling.
S T R A T E G I E S A N D P O L I C I E S F O R A I R P O L L U T I O N A B A T E M E N T
1 6 1 7
Identifying the eff ects of air pollution is not always an easy task. There are many confounding factors and, increasingly the Working Group and its programmes need to take account of changes in climate and impacts on biodiversity when evaluating the results of their work.
Activities of the Working Group on Strategies and Review
Through the 1990s, the Convention’s Working Group Strategies focused most of its eff orts on negotiating protocols for consideration by the Executive Body. In 1999, the Working Group was renamed the Working Group on Strategies and Review to recognize that much of its future work would be to prepare reviews of existing protocols and present the results to the Parties for their consideration and possible action. The Working Group continues to deal with other policy-related questions and recommends decisions on these to the Executive Body.
At the time of writing, the review of the Protocol on POPs had been completed, the review of the Protocol on Heavy Metals was in its fi nal stages, and that for the Gothenburg Protocol was in progress. The Working Group was therefore heavily committed to its work on preparing reviews and making recommendations for possible revisions to all three instruments.
In 1999, the Executive Body established an Expert Group on POPs under the Working Group to prepare information in readiness for the review of, and possible addition of substances to, the Protocol after it had entered into force. A similar Expert Group on Heavy Metals met for the fi rst time in 2003. With the entry into force of the two protocols, the Expert Groups were retitled Task Forces with new mandates to prepare the documentation for the formal review processes required by the protocols as well as making recommendations on possible future revisions. They were also charged with reviewing, in accordance with the Protocol requirements, any new substances proposed by Parties for addition to the protocols. The Task Force on POPs is currently reviewing a number of substances that are being considered for addition to the annexes to the Protocol.
The entry into force of the 1999 Gothenburg Protocol, in May 2005, heralded a new area for review. Some activities such as those carried out by the Expert Group on Ammonia Abatement and the Task Force on Integrated Assessment Modelling were well established and these bodies had been working on their contributions to
the review process even before it had formally started. The Expert Group was responsible for developing a Framework Advisory Code of Good Agricultural Practice for Reducing Ammonia Emissions; this was needed before entry into force of the Protocol since each Party was obliged to publish a code within one year of entry into force of the Protocol.
Identifying the costs and benefi ts of abatement technologies has long been a focus of the Convention’s work. To develop work in this area, the Executive Body, in 2001, established the Expert Group on Techno-economic Issues. This Group has examined data on the costs and eff ectiveness of various techniques and technologies and has created a database of information to allow Parties to compare in-country cost estimates and derive cost-eff ective reduction strategies. In future, the Expert Group will also consider the impact of emerging technologies on air pollution abatement. Such technical information may play a signifi cant role in any updates to the technical annexes to the protocols.
Even at the time of the adoption of the Gothenburg Protocol in 1999, some Parties were voicing their concerns about the eff ects of fi ne PM. While it was recognized that the Protocol would decrease PM indirectly through controls of sulphur, nitrogen oxides and ammonia, no specifi c measures were included to control PM emissions. Recent work by WHO and CIAM has indicated that there are signifi cant health eff ects due to PM across Europe (see section II B below). The Executive Body therefore, in 2004, established an Expert Group on Particulate Matter under the Working Group. It was charged with looking into the possibilities for PM controls through understanding more of the problems and the available abatement measures. The Expert Group is preparing information that can be considered in the review of the Gothenburg Protocol.
C. Capacity-building activities
The Executive Body is placing increased emphasis on the implementation of the Convention and its protocols and has stressed the importance of capacity-building for Parties with economies in transition.
At the nineteenth session of the Executive Body, the delegation of Kazakhstan, at that time a new Party to the Convention, stressed the need for assistance to build capacity in countries with economies in transition. In response, the secretariat developed the project “Capacity-Building for Air Quality Management and the
C O N V E N T I O N O N L O N G - R A N G E T R A N S B O U N D A R Y A I R P O L L U T I O N
1 7
Application of Clean Coal Combustion Technologies in Central Asia” (CAPACT), which attracted funding from the United Nations Development Account. Kazakhstan was the focus for the project, but all fi ve Central Asian States were to be involved in workshops and related activities. The three-year project started in 2004 and will run until 2007. It includes the development of a national implementation plan as well as the establishment of an EMEP monitoring site in Kazakhstan. There is a particular focus on monitoring and reporting of emissions, with the aim of assisting countries to accede to the Convention as well as to its EMEP and most recent protocols. The project is being carried out in cooperation with the United Nations Environment Programme (UNEP), which also has an interest in air pollution issues in Central Asia, with the aim of strengthening cooperation between European and Asian monitoring programmes. For further information on CAPACT see www.unece.org/ie/capact.
At recent sessions of the Executive Body, other Parties with economies in transition noted the value of the CAPACT project and expressed a desire for similar capacity-building support. To this end, Parties have donated to the Convention’s Trust Fund to enable CAPACT workshops to be extended for participation of experts from all UNECE countries with economies in transition.
To support capacity-building further, the Executive Body at its twenty-third session in December 2005, agreed an action plan for countries of EECCA. The 12 countries are at various stages of implementing the Convention and its protocols: nine (Armenia, Azerbaijan, Belarus, Georgia, Kazakhstan, Kyrgyzstan, the Republic of Moldova, the Russian Federation and Ukraine) are already Parties to the Convention, three (Tajikistan, Turkmenistan and Uzbekistan) have yet to accede; three are Parties to the EMEP Protocol, the 1985 Protocol on Sulphur and the 1988 Protocol on Nitrogen Oxides. The Republic of Moldova is Party to the Protocol on POPs and the Protocol on Heavy Metals. However, all have stressed the need for further capacity- building and the EECCA action plan is designed to address this.
The EECCA action plan aims, inter alia, to create awareness about air pollution and its eff ects on health and the environment, assure political commitment at the ministerial level to tackle air pollution problems, develop emission estimates and scenarios, set up monitoring stations and extend EMEP modelling to Central Asia and develop ecosystem sensitivity maps and health damage estimates. The plan aims to coordinate activities with
the Convention’s scientifi c centres and seeks to further develop funding mechanisms.
D. Future work under the Convention
The Convention has a heavy workload for the future with the reviews of the three most recent protocols prompting possible new areas of work. For the Gothenburg Protocol there has already been an expansion of interest in the health eff ects of PM and in the need to consider how hemispheric transport of air pollution might be addressed within a revised or amended protocol. In addition, many Parties are aware of the synergies between the causes and eff ects of climate change and those of air pollution. Greenhouse gases and major air pollutants come from many of the same sources and some gases contribute to both global warming and air pollution. There may also be a need to reconsider the eff ects of air pollution, which could be very diff erent in a future changed climate.
At least for the next few years there will be a continued focus on adding new substances to the Protocol on POPs. Expert peer reviewers are evaluating proposed substances and making recommendations, through the Task Force on POPs, to the Executive Body for their addition to one or more of the annexes in the Protocol. The Task Force on POPs will continue to explore management options to control the use of some of these substances. An ad hoc group of legal experts has identifi ed various options for amending the Protocol, and these will be considered by the Parties.
For the Protocol on Heavy Metals, no new substances have been proposed for addition to the annexes. However, the Protocol requires that the Parties encourage work on an eff ects-based approach for formulating future optimized control strategies and that, following the fi rst review, they develop a workplan on further steps to reduce emissions to the atmosphere. The Working Group on Eff ects has reported that scientifi cally sound methods exist to form a satisfactory basis for an eff ects-based approach based on critical loads, but decisions have yet to be taken on how such work might be applied in the future.
The new work, as well as ongoing activities, will require continued support and encouragement of the scientifi c bodies of the Convention. The scientifi c and technical activities have always underpinned the decision
S T R A T E G I E S A N D P O L I C I E S F O R A I R P O L L U T I O N A B A T E M E N T
ST
RA
TE
GI
ES
A
ND
P
OL
IC
IE
S
FO
R
AI
R
PO
LL
UT
IO
N
AB
AT
EM
EN
T
making of the Convention and Parties are expected to continue to base their decisions upon sound science and the advice provided by the Convention’s scientifi c community.
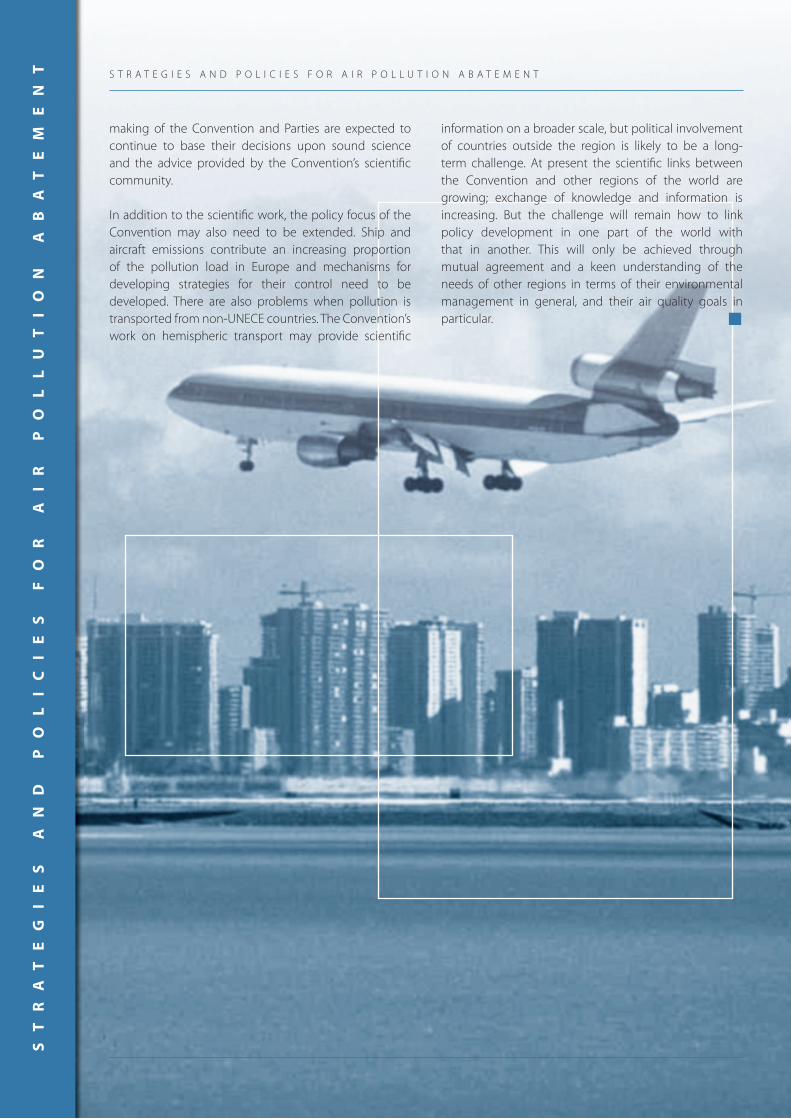
In addition to the scientifi c work, the policy focus of the Convention may also need to be extended. Ship and aircraft emissions contribute an increasing proportion of the pollution load in Europe and mechanisms for developing strategies for their control need to be developed. There are also problems when pollution is transported from non-UNECE countries. The Convention’s work on hemispheric transport may provide scientifi c
information on a broader scale, but political involvement of countries outside the region is likely to be a long-term challenge. At present the scientifi c links between the Convention and other regions of the world are growing; exchange of knowledge and information is increasing. But the challenge will remain how to link policy development in one part of the world with that in another. This will only be achieved through mutual agreement and a keen understanding of the needs of other regions in terms of their environmental management in general, and their air quality goals in particular.
A. Emission levels and trends
Under the Convention, the reporting of high-quality emission data is essential both for assessing the state of air pollution within
the UNECE region, through the use of transport models, and for establishing the compliance of Parties with their protocol commitments. Parties submit data each year in accordance with the Convention’s Emission Reporting Guidelines and using the EMEP/CORINAIR Atmospheric Emission Inventory Guidebook. For this review, emission data are those submitted by Parties in 2006 for their 2004 emissions. Emission totals for the major air pollutants were reported by approximately 75% of the Parties to the Convention.
Emissions of sulphur dioxide (SO2) in Europe continued to show a clear downward trend. The total emission for all Parties to the Convention within the geographical scope of EMEP was estimated to be 14,896 Gg (SO2) in 2004 representing s a decrease of 65% since 1990 (see � gure 5: Emission trends of sulphur in the EMEP area 1990-2004 and 2010). This implies that, over the whole EMEP area, the emission target for SO2 set by the Gothenburg Protocol for 2010 was already reached in 2004. However, there are signi� cant di� erences in the achievements of individual Parties. About half of the Parties to the Convention have already reached their targets set by the Gothenburg Protocol, the other half still need to reduce their emissions.
For emissions of nitrogen oxides (NOx) the situation is not as satisfactory. Total emissions of all Parties within the EMEP area have fallen to 17,741Gg (NO2) in 2004, only 30% less than the 1990 levels (see � gure 6: Emission trends of nitrogen oxides in
the EMEP area 1990-2004 and 2010). However, 40% of Parties to the Convention have reached their targets set by the Gothenburg Protocol for 2010, but, nevertheless, a further 15% decrease in the total emission from the EMEP region is needed to reach the overall 2010 target.
Estimated ammonia emissions in the EMEP region have fallen by 22% from the 1990 levels; in 2004 they totalled 6,774 Gg (NH3). These � gures imply that 65% of all Parties to the Convention have already reached the goal of the Gothenburg Protocol and that the total ammonia emission in the EMEP area is now close to the Protocol target set for 2010 (see � gure 7: Emission trends of ammonia in the EMEP area 1990-2004 and 2010).
For non-methane volatile organic compounds, emissions in 2004 were 15,247 Gg, a decrease of 38% from 1990 levels. The Protocol goals require a further 2% to 6% reduction by 2010, which implies that action is still required by many Parties (see � gure 8: Emission trends of NMVOCs in the EMEP area, 1990-2005 and 2010).
For POPs, emissions of polychlorinated dibenzo-(p)dioxins and dibenzofurans within the EMEP domain were estimated, for the Parties to the Convention, to be 11,211 g I-TEQ (PCDD/Fs) in 2004. This represents a decrease in PCDD/Fs emissions by 18% since 1990. Benzo[a]pyrene emissions in 2004 were estimated at 471 mg/year, a fall of 18% from 1990 levels (see � gure 9: Emission trends of POPs in the EMEP area, 1990-2005).
Most o� cial submissions of emission data for heavy metals continued to have signi� cant uncertainties. Therefore, emission trends of
1 9
TRENDS IN AIR POLLUTION EMISSIONS AND EFFECTS
2
lead, cadmium, and mercury for the period 1990-2004 were calculated from offi cially reported data and unoffi cial estimates. Between 1990 and 2004 total anthropogenic emissions in the EMEP region decreased for all three metals: for lead by about 84% (from 35.4 Gg/year to 5.6 Gg/year), for cadmium by about 47% (from 0.468 Gg/year to 0.248 Gg/year), and for mercury by about 44% (from 0.324 Gg/year to 0.182 Gg/year) (see fi gure 10: Emission trends of heavy metals in the EMEP area, 1990-2005 and 2010).
Emission trend estimates for NOx, SO2 and NMVOCs for both the United States and Canada are shown in fi gures 12 a - e.
Gridded maps showing European emissions in 2005 for sulphur, nitrogen oxides, ammonia, NMVOCs and PM are provided in fi gures 13-17. Sources of emissions by sector for the EMEP area are presented in fi gures 18-25. Reduction in emissions of SO2, NOx, NH3 and NMVOC (1990- 2005) are provided in fi gures 26-29.
B. Trends in e� ects
Trends in eff ects demonstrate the eff ectiveness of the Convention in meeting its goal “to protect man and his environment against air pollution” (article 2 of the Convention). The work of the eff ects programme has been described above. This section summarizes the status and trends of the eff ects still being observed. (See fi gure 30: Eff ects of pollutants covered by the Convention’s protocols)
For human health eff ects, the Task Force on Health has evaluated the impacts of current ozone levels, which cause tens of thousands premature deaths, signifi cantly increase the need for medical attention and restrict the activity of many. Current predictions of ozone concentrations indicate that these eff ects will not change signifi cantly in the next 10 years. For fi ne particles (commonly measured as particulate matter < 2.5 micrometres, PM2.5), WHO and CIAM have calculated that current concentrations are reducing life expectancy across Europe by several months on average. (See also fi gure 11: Emission trends of PM in the EMEP area 2000-2005 and 2010). In some regions this may be two years or more, while the most severe eff ects are on vulnerable groups - PM causes acute and chronic illnesses, in particular in children and adults with health problems. While current policies are expected to cut population exposure to PM over the next decade, widespread eff ects will remain.
A review by the Task Force on Health on the health risks of POPs highlighted known health risks and identifi ed gaps in information necessary for risk assessment. For heavy metals, the Task Force assessed the health eff ects and concluded that emissions of cadmium, lead and mercury should be further reduced to diminish the risks of direct and indirect impacts, e.g. via food consumption.
Trends in the eff ects on materials identifi ed by ICP Materials over the period 1987-1997 showed decreasing corrosion that follow the fall in concentrations of acidifying air pollutants. The corrosion of carbon steel and limestone in 1997 was reduced by 60% over the 10-year period, that of zinc by about 40%. In 1997-2003 the corrosion rate of carbon steel continued to fall, but the rates for zinc and limestone increased slightly.
Eff ects on forests have been assessed through crown condition observations at 6000 ICP Forests “extensive monitoring sites”. Since 1986 an overall increase in defoliation was observed. More than 24% of the trees assessed in 2004 were classifi ed as “damaged” though the damage was unlikely to be solely from air pollution. Recently, some recovery has been observed but this has high spatial and temporal variation. Dynamic modelling at 35 of these sites showed, for sensitive soils, a marked increase in acidity during the last century and only partial recovery after 1990.
Freshwaters in Europe and North America are responding positively to decreasing emissions of sulphur and nitrogen. Acidifi cation is falling though accumulated sulphur in catchment soils over the past century may delay the recovery of many lakes and streams. Also decreases in nitrate concentrations in waters are only modest. ICP Waters has reported biological recovery of fi sh and invertebrates at some locations where chemical recovery was suffi cient. Both steady-state and dynamic model predictions indicate that surface water chemistry will continue to improve in the future.
Soils at several ICP Integrated Monitoring sites in Europe are recovering from high sulphur deposition in the past by currently releasing more sulphate than they receive. The trends of sulphate concentrations over 1993-2003 showed decreasing trends in deposition for more than half of the studied sites; the generally decreasing trends in runoff and soil water were a response to decreasing deposition. Similar correlations were not observed for nitrogen, probably due to catchment-specifi c nitrogen retention processes. However, the ICP has found that nitrogen leaching into the groundwater or surface waters is strongly related to atmospheric nitrogen inputs, in particular at nitrogen-enriched sites. At sites with low
S T R A T E G I E S A N D P O L I C I E S F O R A I R P O L L U T I O N A B A T E M E N T
2 0
nitrogen status, the mean annual temperature mainly determined the amount of leaching and this may be aff ected by a changing climate.
Since 1994, ICP has monitored ozone damage to sensitive plant species at its vegetation at sites across Europe and the United States. Studies on damage to the foliage of agricultural and horticultural crops, and on biomass reductions in white clover showed no trends, possibly refl ecting the large year-to-year variation in ozone concentrations.
The ICP Vegetation survey on concentrations of nitrogen and selected metals in naturally growing mosses throughout Europe shows an east-to-west decrease in metal concentrations in mosses, related in particular to industrial emissions. Long-range transboundary transport appears to account for elevated concentrations in areas without local emission sources. A general temporal decline was found for arsenic, cadmium, lead and vanadium. Nitrogen concentration in mosses in Switzerland has shown a clear increase in recent decades.
Critical loads maps can be used with deposition estimates to identify areas of potential damage in the past, present and future. The recently updated critical loads data collated by ICP Modelling and Mapping comprises 1.4 million data points that can be gridded to match the resolution of deposition maps to give exceedance maps that provide a Europe-wide perspective of potential damage from acidifi cation and eutrophication. The new ecosystem-specifi c deposition values of EMEP are mapped on a 50 km “50 km grid. Using the earlier critical load data and the previous 150 km” 150 km grid cell average deposition, the calculated area in Europe where ecosystem critical loads for acidity were exceeded was 3.9% and 2.3%, for 2000 and 2010 respectively. With the new data, the areas exceeded are estimated to be 11.0% and 8.2% (see fi gure 31: Ecosystem area protected from acidifi cation). For eutrophication, the earlier values were calculated to be 26.0% and 24.6% for 2000 and 2010 and the current calculations show an increase to 35.1% and 44% (see fi gure 32: Ecosystem area protected from eutrophication). The new calculations highlight that we are still far from the goal of achieving critical loads.
T R E N D S I N A I R P O L L U T I O N E M I S S I O N S A N D E F F E C T S
2 1
ST
RA
TE
GI
ES
A
ND
P
OL
IC
IE
S
FO
R
AI
R
PO
LL
UT
IO
N
AB
AT
EM
EN
T S T R A T E G I E S A N D P O L I C I E S F O R A I R P O L L U T I O N A B A T E M E N T
This section summarizes the extent of implementation and progress for national strategies and policies for the seven
substantive protocols to the Convention based on information provided by the Parties, in particular their responses to the 2006 questionnaire.
Parties to the Convention have generally developed action plans or long-term programmes to implement their national strategies. These programmes can be made up of a host of regulations, decrees or directives. Some Parties have constitutional laws in place and many (in particular European Community (EC) Member States and applicant countries) refer to EC directives. EC directives are a set of provisions set out by the Economic Council of the European Union. Parties meeting these provisions often draw attention to this rather than provide detailed information. Some Parties set emission reduction targets based on Protocol obligations or domestic policy, whilst others set goals and requirements for achieving national air quality standards. Air quality standards or target levels are regulatory measures that frequently serve as a reference for other standards (e.g. fuel quality, control technology) designed to achieve a desired level of air quality. Target loads or deposition standards, often established after consideration of critical loads, play a similar role by providing a basis for other
policy measures. A mix of instruments is used in most cases, though the di� erent types of measures should be complementary. Parties’ responses generally referred to their framework for regulation and cited the appropriate directives, policies and/or regulations. (See website for complete replies.)
There is a series of requirements to apply the best available techniques, which are economically feasible, through national emission standards to new mobile and certain stationary sources, and to apply pollution control measures to certain existing sources. The best available techniques, and the extent to which they are economically feasible, are a matter of judgement. In some countries, these concepts are explicitly stated in environmental legislation, whereas others stipulate their use in the permits and licences for undertaking potentially polluting activities. Emission standards for the control of air pollutants either set maximum permissible quantities for speci� c sources and for speci� ed pollutants, or require speci� c technological controls to be applied. Emission standards can be set industry by industry, plant by plant or on the basis of national emission standards for speci� c pollutants. These requirements are discussed below. More detailed de� nitions are provided in the protocols to the Convention and their annexes.
2 3
IMPLEMENTATION OFAND PROGRESS IN NATIONAL STRATEGIES AND POLICIES
3

A. The 1985 Protocol on the Reduction of Sulphur Emissions or Their Transboundary Fluxes by At Least 30 Per Cent
Twenty-two Parties (as of 22 June 2006)
Austria, Belarus, Belgium, Bulgaria, Canada, the Czech Republic, Denmark, Estonia, Finland, France, Germany, Hungary, Italy, Liechtenstein, Luxembourg, the Netherlands, Norway, the Russian Federation, Slovakia, Sweden, Switzerland, Ukraine
Overview
This fi rst pollutant-related protocol to the Convention entered into force in 1987 and contains a clear target for Parties to reduce by the year 1993 (at the latest) their sulphur emissions or their transboundary fl uxes by at least 30% from their 1980 levels.
This Protocol has been successfully implemented, with its 21 Parties exceeding the 30% reduction fi gure. All Parties have achieved reductions in sulphur emissions of over 50%, and 11 Parties have exceeded 60%.
Progress in implementing the � rst Protocol on Sulphur
While the 1994 Oslo Protocol on Further Reductions in Sulphur emissions in many ways supersedes the 1985 Helsinki Protocol, some Parties to the Helsinki protocol have not yet ratifi ed the Oslo Protocol (Belarus, Estonia, Russian Federation, and Ukraine).
Parties to both the Helsinki and the Oslo Protocol reported in more detail their current and future sulphur reduction strategies under the Oslo Protocol. Nonetheless, a number of Parties did report briefl y on their achievements in complying with the Helsinki Protocol.
Canada’s approach to tackling sulphur emissions has been, and continues to be, both at the federal level and at the level of provinces/territories. Its fi rst comprehensive acid deposition programme, the 1985 Eastern Canada Acid Rain Programme, was in eff ect from 1985 through 1999 and required emission reductions in
the seven eastern provinces and in the Sulphur Oxide Management Area (SOMA). The Czech Republic reported a drop in SO2 levels of 87.9% between 1990 and 2004. Denmark reported the following four measures to reduce SO2 emissions: levying a sulphur tax, limit values for the sulphur content of fossil fuels, limit values for emissions from large combustion plants and a quota system for large combustion plants. Sulphur emissions fell 80% from 1980 to 1994 in Finland, due largely to the implementation of its Air Pollution Control Act, targeting the sulphur content of oil products, SO2 emissions from new and major old coal-fi red power plants and sulphur emissions from major industrial installations. Germany reported a drop in sulphur emissions between 1980 and 1990 of 70% in the old West Germany, while, since reunifi cation, the emissions of the entire country have decreased from 7,514 kilotonnes in 1980 to 2,945 kilotonnes in 1993 (a 60% drop) and further decreased to 638 kilotonnes in 2000. This reduction was achieved by fi tting all large combustion plants with fl ue gas desulphurization technology and reducing the sulphur content of fuels or, in the cases where fl ue gas treatment technology was not appropriate, using low-sulphur fuels. Hungary reported a 53% reduction in sulphur emissions between 1980 and 1993.
The Netherlands reported a drop in sulphur emissions of 65% between the years 1980 and 1993, and a continued downward trend thereafter. It attributed this trend to the adoption, in 1979, of a comprehensive strategy with national emission ceilings, followed by the setting of air quality standards in 1986, passing of legislation for combustion plants in 1987 and the defi nition of critical deposition loads in 1989/90 in environmental policy plans and its Acidifi cation Abatement Plan. The Russian Federation reported that sulphur dioxide emissions in the European Territory of Russia (ETR) decreased by 73.1% in 2004 compared to 1980 levels. The United Kingdom reduced its emissions by 36% between 1980 and 1999. Emissions in 2004 totalled 833 kilotonnes, signifying a further 73% drop from 1999 levels (3,117 kilotonnes). In 2004, Ukraine began implementing a programme aimed at improving thermal power stations by 2010 in order to reduce both sulphur and nitrogen emissions.
S T R A T E G I E S A N D P O L I C I E S F O R A I R P O L L U T I O N A B A T E M E N T
2 4
B. The 1988 Protocol Concerning the Control of Emissions of Nitrogen Oxides or Their Transboundary Fluxes
Twenty-one Parties (as of 22 June 2006):
Austria, Belgium, Bulgaria, the Czech Republic, Denmark, Estonia, Finland, France, Germany, Hungary, Italy, Liechtenstein, Luxembourg, Monaco, the Netherlands, Norway, Slovakia, Spain, Sweden, Switzerland and the United Kingdom
Overview
The 1988 Sofi a Protocol, which entered into force in 1991, requires that Parties should, as soon as possible and as a fi rst step, take eff ective measures to control and/or reduce their national annual emissions of nitrogen oxides (NOx) or their transboundary fl uxes. The target set by the Protocol is for national annual emissions not to exceed by 31 December 1994 their 1987 level (with the exception of the United States that chose 1978 as its base year). Parties also agreed to introduce emissions standards and control measures to reduce NOx emissions from both stationary and mobile sources no later than two years after the Protocol’s entry into force.
The Protocol also requires Parties to, as soon as possible and no later than two years after the date of its entry into force, make unleaded fuel suffi ciently available to facilitate the circulation of vehicles equipped with catalytic converters.
In order to support a scientifi cally approved method to reduce NOx emissions, high priority is given to research and monitoring. An annex to the Protocol provides guidance to the Parties in identifying NOx control options and techniques in the implementation of the obligations under the Protocol.
Progress in implementation ofthe Protocol
Offi cially reported emission data for 2004 indicated that 23 Parties to the Protocol had achieved their emission reduction obligations, while two Parties had failed to meet their targets. Four Parties had not provided 2004
data but previously reported data from them indicated that they had met their emission reduction obligations.
Austria reported that its NOx emissions from stationary sources dropped by almost one third between 1987 and 2004 (though total emissions in 2004 remained the same as in 1997 due to an increase in emissions from mobile sources). Cyprus’s emissions fell from 21.65 kilotonnes in 2000 to 18.36 kilotonnes in 2004 (a 15% drop). Finland reported a 30% drop in NOx emissionsfrom stationary sources since 1980. France reported a drop in emissions of 37% between 1980 and 2004 (33% between 1990 and 2004); it had planned a reduction of 30% between 1980 and 1998, although this target was only achieved in 2001. In Germany, NOx emissions decreased from 3,350 kilotonnes in 1987 to 2,055 kilotonnes (a 38% drop) in 1994, the target year of the Protocol; this was more than that required by the Protocol and emissions have continued to decrease (e.g. to 1,584 kilo tonnes in 2000). Hungary reported that it had met its basic target under the Protocol, while the Netherlands indicated it had achieved a reduction in NOx emissions of more than 35% over the period 1980 to 2004. In the European Territory of Russia (ETR) NOx emissions dropped by 17.3% between 1987 and 2004, while they increased slightly (by 0.2%) between 2003 and 2004. The United Kingdom reduced emissions of nitrogen dioxide from 2,737 kilo tonnes in 1980 to 1,621 kilo tonnes in 2004, indicating a reduction of 41%. The United States’ described its Acid Rain Programme that had a NOx component with a target to achieve and maintain a 2 million tonne reduction from coal-fi red electric utility units relative to the NOx emission levels projected for 2000. This target was achieved in 2000 with the total NOx emissions from those units reduced to 4.5 million tonnes.
Measures to reduce NOx emissions from mobile sources
The transport sector was identifi ed as a main source of NOx emissions in most countries. It accounted for up to 46% of national NOx emissions in Cyprus in 2004 (with a total of 18.36 kilo tonnes) and the United Kingdom reported that road transport represented 40% of NOx emissions, with this fi gure reaching 55% in urban areas like London.
Measures promoted in Cyprus to address road transport NOx emissions included enforcement of speed limits and effi cient traffi c management. The Czech Republic was subsidising improvements to the public transport system. Denmark and Finland both reported the importance of catalytic converters for passenger cars.
2 5
I M P L E M E N T A T I O N O F A N D P R O G R E S S I N N A T I O N A L S T R A T E G I E S A N D P O L I C I E S
Italy emphasized a modal shift, from road to rail transport and the improvement in vehicle fuel effi ciency. Spain introduced, in 2005, “The Strategic Infrastructure And Transport Plan (PEIT)”. This plan promoted intermodality, improved accessibility and an open public transport system. One specifi c measure was promoting, through fi scal incentives, the substitution of older, more polluting vehicles, with newer, cleaner ones (both private cars and heavy duty vehicles).
In the United States, new tailpipe emissions and low-sulphur fuel standards for light duty vehicles took eff ect in 2004. These new standards required passenger vehicles to be 77 to 95% cleaner. The programme was expected to reduce annual emissions of NOx by 2.6 kilotonnes and non-methane hydrocarbons by 115,000 tonnes by 2030 (95% below current levels).
Since 2000 Norway has introduced a diff erentiated annual tax for heavy road vehicles according to emission levels (including NOx). Nonetheless, it identifi ed ship and boat traffi c, including fi shing vessels, as the largest mobile source category, with emissions from coastal traffi c and fi shing vessels totalling 40% of national NOx emissions in 2004. Consequently, Norway ratifi ed Annex VI on air pollution from ships to the MARPOL Convention of the International Maritime Organisation.
The European Union Directive 1999/96/EC introduced diff erent stages of emission standards that are applicable to new types of heavy-duty vehicles and engines. These are commonly known as EURO 1, 2, 3, 4 and 5 and are applicable from 1994, 1997, 2001, 2006 and 2009 respectively. Since 2004, the Russian Federation follows the EURO 2 and EURO 3 norms while it is planning to implement EURO 4 norms from 2008. Spain also reported changing its limit values for both cars and heavy-duty vehicles based on the EURO standards; over the last decades it moved to EURO 3 for heavy-duty vehicles and EURO 4 for cars and other light vehicles. In addition, Spain reported that it had identifi ed steps to improve its standards to EURO 4 and 5. Switzerland noted that it had adopted a series of Ordinances relating to the Laws on Road Transport, Navigation and Aviation that set emission standards similar to EURO norms 2, 3, 4 and 5.
Abatement measures for NOx from stationary sources
Technical measures used by Parties to reduce NOx emissions from stationary sources include: selective catalytic reduction units retrofi tted on existing coal- and gas-fi red electric utility boilers in Canada; low NOx
burners retrofi tted to a large number of combustion units in Canada, France, the Netherlands, Norway, Slovenia and Spain; and, a cap-and-trade programme for large electric generating units and large industrial boilers and turbines adopted by some States in the United States. Emissions from large stationary sources were controlled through permits and licences in Norway and Germany.
Several initiatives align Canada’s smog-forming emission standards with those of the United States Environmental Protection Agency. In 2005, the Canadian provinces of Nova Scotia, Quebec and Ontario promulgated emissions standards and caps for diff erent sectors and monitoring measures to prevent, eliminate or reduce the release of NOx and other contaminants into the atmosphere. Canada and the United States signed the Ozone Annex (2000) to the Canada-United States Air Quality Agreement. The measures in the Annex were estimated to reduce annual NOx emissions in the region of Canada defi ned in the Annex as the Pollutant Emission Management Area (PEMA) by 39% from 1990 to 2010. As part of the Canada-Wide Acid Rain Strategy for Post-2000, Canada recently developed critical loads for nitrogen to protect forest soils; this will serve to guide development of further measures to limit and reduce national NOx emissions.
The United States noted its Clean Air Act was the main measure for controlling and reducing NOx emissions. Specifi c programmes were implemented which achieved emission reductions from mobile sources and fuels, and required the installation of best available control technologies on new and existing major stationary sources of NOx. Its Environmental Protection Agency fi nalized a rule in 1998 that, upon implementation, would reduce summertime NOx emissions by 23% (900,000 tonnes) from 1996 levels in the east of the country.
Some Parties reported economic measures to encourage a reduction in high NOx emitting fuels or to promote a switch to cleaner technologies. For instance, Italy noted that it levied a specifi c tax on large combustion plants producing NOx emissions. The Netherlands promoted renewable energy use by, for example, implementing fi scal incentives and subsidies. It had also set up, since 2005, a NOx emission trading system.
S T R A T E G I E S A N D P O L I C I E S F O R A I R P O L L U T I O N A B A T E M E N T
2 6
C. The 1991 Protocol Concerning the Control of Emissions of Volatile Organic Compounds or Their Transboundary Fluxes
Twenty-one Parties (as of 22 June 2006):
Austria, Belgium, Bulgaria, the Czech Republic, Denmark, Estonia, Finland, France, Germany, Hungary, Italy, Liechtenstein, Luxembourg, Monaco, the Netherlands, Norway, Slovakia, Spain, Sweden, Switzerland and the United Kingdom
Overview
The Protocol on the Control of Emissions of Volatile Organic Compounds or Their Transboundary Fluxes entered into force on in 29 September 1997. It states that Parties shall control and reduce their emissions of non-methane volatile organic compounds (NMVOCs) in order to reduce their transboundary fl uxes, and the fl uxes of the resulting secondary photochemical oxidant products, so as to protect human health and the environment from adverse eff ects. The Protocol identifi es three ways to do this:
(a) Take measures to reduce national annual emissions of VOCs by at least 30 per cent by the year 1999, using 1988 levels (or other specifi ed year levels between 1984 and 1990) levels as a basis). This option was chosen by Austria, Belgium, Estonia, Finland, France, Germany, the Netherlands, Portugal, Spain, Sweden and the United Kingdom with 1988 as a base year, by Denmark with 1985, by Liechtenstein, Switzerland and the United States with 1984, and by the Czech Republic, Italy, Luxembourg, Monaco and Slovakia with 1990 as a base year;
(b) The same reduction as above within a Tropospheric Ozone Management Area (TOMA) and ensuring that by 1999 total national emissions did not exceed 1988 levels. Annex I of the Protocol specifi es TOMAs in Norway (base year 1989) and Canada (base year 1988);
(c) Countries where national annual emissions of VOCs in 1988 were lower than 500,000 tonnes and
20 kg/inhabitant and 5 tonnes/km2, shall, as soon as possible and as a fi rst step, take eff ective measures to ensure at least that, at the latest by the year 1999, their national annual emissions of VOCs did not exceed the 1988 levels. This option was chosen by Bulgaria, Greece, and Hungary.
The major sources of VOCs from stationary sources identifi ed in the Protocol in order of importance are: use of solvents, petroleum industry including petroleum-product handling, organic chemical industry, small-scale combustion sources (e.g. domestic heating and small industrial boilers), food industry, iron and steel industry, handling and treatment of wastes and agriculture.
Progress in implementation of the Protocol
By 2004, 16 Parties had met the emission levels required by the Protocol. Two Parties had failed to achieve their targets. While no 2004 data were available for the other three Parties, previously data reported by them suggested they had met their emission reduction obligations.
Austria’s NMVOCs dropped by more than 50% between 1988 and 2004. In Cyprus, VOC emissions fell from 15.94 kilotonnes in 2000 to 12.31 kilotonnes in 2004, through implementing successful mitigation measures. In Denmark, a voluntary agreement with the Confederation of Danish Industries in 1995 helped reduce VOC emissions by 40% in 1999 compared to 1988. In Finland, total NMVOC emissions fell from 225,000 tonnes in 1988 to 166,000 tonnes in 1999. NMVOC emissions in Germany have decreased from 3,256 kilotonnes in 1988 to 1,663 kilotonnes in 1999, the target year of the Protocol, which is more than the 30% required; they continued to fall to 1,605 kilotonnes in 2000. In Hungary, total national emissions fell from 205 kilotonnes in 1988 to 170 kilotonnes in 1999. The Netherlands reported a 50% reduction in emissions from stationary sources between 1981 and 2000. Norway achieved reductions of 64 kilotonnes in 2004 and about 73 kilotonnes in 2005 by installing NMVOC reduction units in 15 shuttle tankers and fi ve storage facilities. Slovakia reporteda 30% reduction of total VOC emissions in the fi rst reporting phase of the Protocol. The United Kingdom reported a 39% drop in VOC emissions between 1988 (2,439 kilotonnes) and 1999 (1,480 kilotonnes).
Strategies and policies for reducing VOCs
Information on VOC emissions was given for a number of sectors. For instance, Finland identifi ed its main
I M P L E M E N T A T I O N O F A N D P R O G R E S S I N N A T I O N A L S T R A T E G I E S A N D P O L I C I E S
2 7
sources of VOCs as solvents, the transport sector and residential combustion, while Norway noted that the largest quantities of VOCs (nearly 50%) resulted from the loading and storage of crude oil. With VOC emissions cutting across many sectors, Parties have tackled implementation of this Protocol through a number of strategies.
Austria has a specifi c Ozone Law, passed in 1992, which targets reductions in VOC emissions. Cyprus highlighted the transport sector as the highest emitter of VOCs, with 45% of the national total in 2004; it had introduced legislation in 2004 to equip all imported vehicles with catalytic converters. The Czech Republic addressed VOC emissions in its 2005-2013 Transport Policy and in its 2004 State Environmental Policy. In Finland the Environmental Permit Act required installations using more than 10 tonnes organic solvents per year to apply for a special permit.
While Canada did not have regulations at the federal level concerning VOC emissions from stationary sources, a number of guidelines had been developed and these were used as a basis for control measures at the provincial levels. Canada’s third largest VOC source, solvent emissions, was being tackled by a “Federal Agenda for the Reduction of VOC Emissions from Consumer and Commercial Products”; this detailed actions to be undertaken by the Federal Government over the period 2004 to 2010.
EU Directive 99/13/EC on the limitation of emissions of VOCs due to the use of organic solvents in certain activities and installations was applied at the national level in Cyprus, Denmark, Estonia, Germany, Hungary, Norway, Slovakia, Spain, and the United Kingdom. A complementary EU directive (2004/42/EC) on the limitation of emissions of VOCs due to the use of organic solvents in certain paints and varnishes and vehicle refi nishing products and amending directive 1999/13/EC, required additional labelling on products to show the sub-categories and the relevant limit values. It also required labelling of the maximum VOC content in products. Depending on the type of coating material, EU directive 2004/42/EC set diff erent limit values for the content of VOCs, taking eff ect in two steps in 2007 and 2010. Austria, Cyprus, the Czech Republic, Finland, Germany, Hungary, Italy, the Netherlands, Norway, Slovakia, Spain and the UK indicated that they were implementing this directive.
Best available techniques for reducing VOCs
According to article 2, paragraph 3 (b) (i), of the Protocol, Parties have to adopt best available techniques (BAT) to control and reduce VOC emissions from existing stationary sources in major source categories. Parties have made use of the following techniques: leak repairs, operating and performance standards, biofi ltration, vapour processing at tank loading, end-of-pipe technology, low-solvent alternatives, new drying technology, less volatile cleaning agents, incineration and closed moulding in polyester processing and recycling.
Canada was developing three specifi c VOC content regulations for consumer products, architectural industrial maintenance coatings, and automotive refi nishing products. The Czech Republic required that all products containing VOCs be clearly labelled; in addition, in order to encourage the further reductions, grants could be provided for activities and facilities employing organic solvents. Spain noted its application of the European Ecolabel, a voluntary instrument to encourage the development of greener products, which includes VOC criteria for certain products. Switzerland introduced, in January 2000, a VOC incentive tax on products containing solvents.
Measures to reduce VOC emissions from the use of petrol
In accordance with article 2, paragraph 3 (b)(ii), Parties need to undertake measures to reduce VOC emissions from petrol distribution and motor vehicle refuelling operations and to reduce the volatility of petrol. Canada reported that federal regulations from 1997 ensured that new light-duty vehicles and light-duty trucks were designed to limit hydrocarbon emissions during refuelling. A national regulation was adopted in 2000 to limit the dispensing fl ow rate of petrol and petrol blends to a maximum of 38 litres per minute. Regulations also eff ectively limited benzene in gasoline to 1% volume since 1999.
Vapour recovery systems were reported in place at nearly all petrol stations in Cyprus and at all terminals in Finland (since 2001), Italy (since July 2000) and the Netherlands. Cyprus also reported a range of measures, notably that, since 1999, all new stations and also existing stations that are renovated must install underground pipes for future recovery of vapours generated during vehicle refueling; so far about 30% of service stations have complied with this requirement.
S T R A T E G I E S A N D P O L I C I E S F O R A I R P O L L U T I O N A B A T E M E N T
2 8
In the Czech Republic, approximately 98% of public petrol stations are already equipped with stage I and stage II vapour recovery systems. In Denmark, stations with throughput of more than 500 m3/year have vapour recovery systems and fi scal incentives have been in force since 1995 to promote the installation of such systems. The Netherlands highlighted a number of measures employed such as: internal fl oating roofs and effi cient seals for tanks, vapour return systems for loading, checks/maintenance on diff use process sources, vapour return systems at petrol distribution and fi lling station. As of January 2006, the Netherlands prohibits degassing of petrol vapours into the open air by inland vessels. Estonia, Italy, the Netherlands, Norway, Slovakia, Spain and the United Kingdom referred to the European Parliament and Council Directive 94/63/EC of 20 December 1994 on the control of volatile organic compound (VOC) emissions resulting from the storage of petrol and its distribution from terminals to service stations. They noted this directive was particularly relevant to article 2, paragraph 3 (b) (ii) of the Protocol in which Parties commit to apply techniques to reduce VOC emissions from petrol distribution and motor vehicle refuelling operations, and to reduce volatility of petrol.
D. The 1994 Oslo Protocol on Further Reductions of Sulphur Emissions
Twenty-seven Parties (as of 22 June 2006):
Austria, Belgium, Bulgaria, Canada, Croatia, Cyprus, the Czech Republic, Denmark, Finland, France, Germany, Greece, Hungary, Ireland, Italy, Liechtenstein, Luxembourg, Monaco, the Netherlands, Norway, Slovakia, Slovenia, Spain, Sweden, Switzerland, the United Kingdom and the European Community.
Overview
Concerned that emissions of sulphur continued to be transported across international boundaries in parts of Europe and North America, and that they were causing widespread damage to forests, soils and waters, as well as to historic monuments, and had harmful eff ects on human health, 28 Parties to the Convention signed the Oslo Protocol in 1994. The Protocol, which entered into force on 5 August 1998, currently has 27 Parties.
The Protocol was the fi rst eff ects-based instrument under the Convention and used critical loads and integrated assessment models to set country-specifi c emission ceilings based upon the eff ects of emissions and the costs for their abatement. The ceilings are listed in an annex to the Protocol.
The Protocol requires Parties to take the most eff ective measures to reduce emissions. It cites controlling the sulphur content of fuel, energy effi ciency measures, the promotion of renewable energy and the application of BAT. This Protocol is the fi rst requiring the mandatory application of emission limits, specifi ed in the Protocol itself. There are mandatory limits on the sulphur content of gas oil. There is also a provision encouraging economic instruments for reducing SO2 emissions cost-eff ectively and guidance for controlling sulphur emissions from stationary sources, particularly from fossil fuel combustion processes.
Progress in implementation of the Second Protocol on Sulphur
Offi cially submitted emission data for 2004 suggest that 20 of the 25 Parties, to which the obligation to reduce emissions applied, had met their national emission reduction obligations. No data for 2004 were available for fi ve Parties, although data previously reported by them suggested they had met their emission reduction obligations.
Austria reported a drop of about 60% in sulphur emissions between 1990 and 2004. Cyprus, that only acceded to the Protocol in 2006, has eff ectively implemented sulphur reduction strategies and policies to enable it to reduce SO2 emissions from 53.02 kilo tonnes in 2000 to 45.37 kilo tonnes in 2004. It reduced the sulphur content of diesel fuel used in the road transport sector from 1% to 0.035% in 2004 and to 0.005% in 2005; in 2009, will be brought down to 0.001%. For petrol in the road transport sector in Cyprus, the sulphur content of leaded petrol was 0.2% in 2004, for unleaded petrol it was 0.005% in 2004, with plans for further cuts to 0.001% by 2009. Hungary, with SO2 emissions of 486 kilotonnes in 2000 is already close to 50% below its agreed emissions’ ceiling as specifi ed in the Protocol. Slovenia reduced sulphur dioxide emissions by 72% between 1990 and 2004. The United Kingdom has already achieved the interim ceilings for 2000 and 2005 as required under the Protocol and is committed to an 87% reduction of SO2 by 2010, compared to 1980 levels, under the Gothenburg Protocol and the European Union National Emission Ceilings (NEC) Directive.
I M P L E M E N T A T I O N O F A N D P R O G R E S S I N N A T I O N A L S T R A T E G I E S A N D P O L I C I E S
2 9
Strategies and policies for reducing sulphur emissions
A number of national programmes, policies and strategies have been adopted by Parties to implement obligations under article 2 of the Oslo Protocol. These include: Canada’s “Sulphur in Diesel Fuel Regulation” which has reduced the level of sulphur in on-road diesel to 15mg/kg as of June 2006; Finland’s Air Pollution Control Act which has enabled the country to reach already in 1994 its sulphur emission ceiling for 2000 and Norway’s Air Pollution Control Act which required specifi c emission permits. In Germany a number of ordinances specify SO2 emission control requirements.The Canada-Wide Acid Rain Strategy adopted in 1998 by the State, provinces and territories, for the period after 2000, aimed to ensure that critical loads for acid deposition were achieved across Canada. The Strategy encouraged innovation, new technology development and demonstration projects as well as collaboration between provincial and territorial governments and industry. Canada’s sulphur in diesel fuel regulations would reduce the level of sulphur in on-road diesel to 15mg/kg, eff ective in 2006 and the regulations amending this would reduce the level of sulphur in off -road, rail and marine diesel fuel to 500 mg/kg commencing in 2007, down to 15mg/kg commencing 2010 for off -road and 2012 for rail and marine. Spain adopted a Renewable Energy Promotion Plan (2005-2010) in 2005 and a National Energy Effi ciency strategy (2004-2012). In the United Kingdom, an Air Quality Strategy for England, Scotland, Wales and Northern Ireland was published in January 2000; the Strategy and its Addendum of 2003 set objectives for nine main air pollutants, including sulphur dioxide, to protect public health, vegetation and ecosystems.
Sulphur abatement measures
Approaches to reduce sulphur emissions were two-fold: on the one hand Parties sought to encourage alternative energy, while on the other, they were applying technological measures to reduce the amount of emissions. Canada, Cyprus and Denmark reported that they were investing in wind power generation to reduce dependence on sulphur-emitting fossil fuels. Finland was promoting renewable energy sources more broadly, with already 30% of its electricity coming from renewable sources, essentially hydropower and biomass. The latter was also a major source of renewable energy in Hungary while Italy was encouraging the use of natural gas in large industrial plants. Slovenia’s Energy Act promoted
renewable energy and energy effi ciency through a number of market-based incentives such as tax incentives, subsidies and eco-labelling. Spain reported that, through investments and support for renewable energy, 17% of electricity generated in 2000 came from renewable sources.
In order to limit sulphur emissions, Denmark had established a quota system for large combustion plants. Both Germany and Italy promoted the use of a combination of sulphur and sulphur-free (or low sulphur) fuels in its combustion plants. Hungary, the Netherlands and Slovenia on the other hand, promoted fl ue gas desulphurisation installations. Slovenia also applied additive injection and wet scrubbing desulphurization on major sources.
Emission limit values (ELVs) for sulphur
For existing major stationary combustion sources with a thermal input above 500 MW, annex V of the Protocol sets an emissions limit value of 400mg SO2/Nm3. To this eff ect Cyprus and Norway reported that they did not have major stationary combustion sources of such a capacity. Finland, Germany, Hungary, Italy and Slovakia met the emissions’ limit value or were below it. The Netherlands reported limit values that complied with the Protocol except for those of refi neries, which were of 600 mg SO2/Nm3 as of 2002 (down from 1000 mg SO2/Nm3). Slovenia reported values over 400 but did not specify by how much. Lithuania reported much higher limit values (between 1,700 and 2,000 mg SO2/Nm3) but noted that these were expected to fall to 400mg SO2/Nm3 by 2008.
For existing major stationary combustion sources with a thermal input between 50 and 500 MW, annex V of the Protocol provides limits of between 1700 mg SO2/Nm3 and 2000 mg SO2/Nm3 with a linear decrease to 400mg SO2/Nm3. The Czech Republic, Finland, Germany, Hungary, Lithuania, the Netherlands, Norway, Slovakia, Slovenia, and Switzerland all reported values within or below these SO2 emission limits. Cyprus reported values above these limits while Italy reported the application of the limit of 1,700mg/Nm3 taking into account technical feasibility and application of BAT.
Article 2, paragraph 5(c) of the Oslo Protocol stipulates that each Party applies “national standards for the sulphur content of gas oil at least as stringent as those specifi ed in annex V”. Annex V sets the maximum sulphur content of gas oil at 0.05 per cent for diesel for on-road
S T R A T E G I E S A N D P O L I C I E S F O R A I R P O L L U T I O N A B A T E M E N T
3 0
vehicles and 0.2 per cent for other types. With respect to the national standards applied for the sulphur content of gas oil, Austria, Canada, the Czech Republic, Denmark, Finland, Germany, Lithuania, the Netherlands, Norway, Slovakia, Slovenia and Switzerland reported the following information, summarized in table 1 (see annex).
In addition, Germany, Hungary, the Netherlands, Norway, Slovenia, Spain, and the United Kingdom indicated that they applied some or all of the following EU directives: Directive 93/12/EEC relating to the sulphur content of certain liquid fuels, Directive 98/70/EC relating to the quality of petrol and diesel fuels, Directive 99/32/EC on the sulphur content on liquid fuels, Directive 2003/17/EC relating to the quality of petrol and diesel fuels and Directive 2005/33/EC relating to the sulphur content of marine fuels.
E. The 1998 Protocol on Heavy Metals
Twenty-eight Parties (as of 22 June 2006):
Austria, Belgium, Bulgaria, Canada, Cyprus, the Czech Republic, Denmark, Estonia, Finland, France, Germany, Hungary, Latvia, Liechtenstein, Lithuania, Luxembourg, Monaco, the Netherlands, Norway, the Republic of Moldova, Romania, Slovakia, Slovenia, Sweden, Switzerland, the United Kingdom, the United States and the European Community.
Overview
The 1998 Protocol on Heavy Metals entered into force on 29 December 2003. It targets three particularly harmful metals that are listed in an annex to the Protocol: cadmium, lead and mercury. Parties to the Protocol agree to reduce their total annual emissions to the atmosphere for these three metals below their 1990 levels (or an alternative year between 1985 and 1995). The Protocol provides detailed guidance based on BAT including dust-cleaning devices, “bio-treatment”, fabric fi lters and scrubbers to reduce emissions, particularly focusing on the iron and steel industry, the non-ferrous metal industry, power generation, road transport and waste incineration.
The Protocol also provides specifi c targets for reducing the use of leaded petrol, and introduces measures to lower the mercury content in batteries, thermostats,
switches, thermometers, fl uorescent lamps, dental amalgam, pesticides and paint.
Progress in implementing the Protocol on Heavy Metals
Austria used 1985 as its reference year for this Protocol and reported reductions for cadmium, lead and mercury of 65%, 96% and 75% respectively. In Finland, lead emissions decreased rapidly in the 1990s from the level of 326,000 tonnes in 1990 to 35,000 tonnes in 1996, an 89% reduction. Between 1985 and 2004, Hungary reported a 61% drop in cadmium emissions, a 55% drop in mercury emissions and a 95% drop in lead emissions. In Norway between 1995 and 2003 lead emissions were cut by approximately 24%, while cadmium and mercury were reduced by about 70% and 60% respectively. By implementing tough measures in line with the Protocol, by 1994 Slovenia had reduced emissions of lead by 96.9%, cadmium by 6.2% and mercury by 15.6% compared with 1990 levels. The United Kingdom reported that it has already met the main requirement of the Protocol to reduce annual emissions of cadmium, lead and mercury to below 1990 levels; emissions of cadmium to air in 1990 were 25.9 tonnes and 5.4 tonnes in 2002, a fall of 79%, for lead, emissions fell by 95% by 2004, while for mercury emissions fell by 73% to 10.3 tonnes in 2004.
Emission limit values for heavy metals
Annex V of the Protocol on Heavy Metals sets specifi c emission limit values (ELVs) for major stationary sources. These apply to the solid and gaseous forms of the metals and their compounds. The annex also contains detailed guidance on how to measure the limit values, including, for instance, the fact that measurements should be taken regularly over a 24-hour period.
A number of Parties reported values well below the limits set in the Protocol. For example, in Slovakia, limit values for particular matter emissions from hazardous and medical waste are 10 mg/m3. In the Czech Republic, Denmark and the Netherlands, limits for mercury emissions from new waste management plants (municipal, medical and hazardous) were 0.05mg/m3 and Norway reported an even lower fi gure, 0.03 mg/m3.
The limit value specifi ed in annex V for all particulate matter from fossil fuel combustion plants is 50mg/m3. Most Parties showed that they applied this fi gure, or a lower one. In addition, some Parties provided more specifi c values for individual heavy metals. For instance,
I M P L E M E N T A T I O N O F A N D P R O G R E S S I N N A T I O N A L S T R A T E G I E S A N D P O L I C I E S
3 1
the Czech Republic, Slovakia and Switzerland reported complying with the 50mg/m3 for combustion plants (of between 50 and 100 MW), while Denmark specifi ed a limit value for cadmium and mercury emissions at 0.1 mg/m3 for its heavy oil combustion plants.
The United States reported a national programme that established emission standards for over 170 stationary source categories, including all the categories identifi ed in annex II of the Protocol. These standards applied to “major” sources and some “area” sources. The United States reported that this programme has already achieved signifi cant cuts in the overall emission of heavy metals since the reference year and further reductions were expected in the future.
Lead
Leaded petrol was no longer used in on-road vehicles in Canada since 1990 and in the United States since 1996. It had been phased out in Finland since 1993, Germany and the Netherlands since 1997, France, Switzerland and the United Kingdom since 2000, Armenia, the Czech Republic and Slovenia since 2001, Ukraine since 2003, Cyprus since 2004 and Austria since 1993. The Russian Federation reported plans to phase out leaded petrol by 2005. Some Parties noted that the phasing out of leaded petrol demonstrated alignment with EU directive 98/70/EC on the quality of petrol and diesel fuels, which set a date of January 2000 for EC Member States to stop marketing leaded petrol. In Hungary, lead content in petrol had been decreased and was now below 0.013 g/litre of petrol, while in Lithuania this limit was between 0.005 and 0.15 g/litre; in Slovakia, the lead content of marketed petrol intended for on-road vehicles was lower than 0.013 g/litre, and since 1998 only unleaded petrol was produced, imported and marketed.
The Netherlands reported it had been implementing a subsidy scheme since 2003 to accelerate the replacement of lead in water pipes.
Mercury
Austria reported that mercury content was limited to 0.0005% in batteries and to 2% in button cells. Furthermore, capture of wastewater from dental surgeries was compulsory. In the Netherlands, the production and import of goods containing mercury had been banned since 2000. The use of products containing mercury was banned three years later (2003), except for fl uorescent lamps, fi lms and some specifi c professional products for which specifi c limits applied.
In the Czech Republic, the Ministry of the Environment and Czech Dental Chamber signed a voluntary agreement in 2001 (the Czech association of drinking water and waste water companies joined in 2004) to facilitate the removal of mercury from their clinics. By the end of 2004, more than half of the 6,500 dental clinics had installed mercury separators with above 95% effi ciency rates for mercury removal. In 2002, 1.1 tonnes of dental amalgam waste containing mercury was collected and by 2003 this fi gure had risen to more than 34 tonnes.
In the United Kingdom, a burden-sharing scheme had been implemented by the crematoria industry to achieve a 50% reduction in mercury from gas emissions by 2012 as per the UK Pollution Prevention and Control Act (1999). This scheme will allow greater choice to the industry in deciding how to meet the national 50% mercury emission reduction target. Operators will be able to meet the industry’s target by either fi tting abatement mechanisms, sharing the cost of abatement fi tted by other crematoria (whether or not owned by the same operator) or a combination of both.
Cadmium and other metals
The Protocol specifi cally covers the metals lead, mercury and cadmium as listed in annex I to the Protocol. However, Parties reported less information on cadmium than on lead and mercury. Some Parties mentioned the European Directive on Cadmium (91/338/EC) and indicated it was being implemented. The directive prohibited the sale, import, production or stocking of products containing cadmium. Through this legislation, pigments, colours, stabilisers and surface treatments containing cadmium were all banned.
In addition to the three metals listed in the Protocol, some countries reported on other heavy metals. For instance, the Netherlands noted it had been operating a national emissions registration offi ce since 1974 which made annual emission inventories for up to 170 substances, including lead, mercury and cadmium but also arsenic, copper, chromium, nickel, selenium and zinc. The United Kingdom indicated that it reported annually on 10 heavy metals and was carrying out an extensive research programme on heavy metals. The European Community was looking into controlling emissions of arsenic, cadmium and nickel through a Daughter Directive on Heavy Metals.
For selected measures for reducing lead, mercury and cadmium emissions, by sector, see table 2 (in annex).
S T R A T E G I E S A N D P O L I C I E S F O R A I R P O L L U T I O N A B A T E M E N T
3 2
F. The 1998 Protocol on Persistent Organic Pollutants
Twenty-eight Parties (as of 22 June 2006): Austria, Belgium, Bulgaria, Canada, Cyprus, the Czech Republic, Denmark, Estonia, Finland, France, Germany, Hungary, Iceland, Italy, Latvia, Liechtenstein, Lithuania, Luxembourg, the Netherlands, Norway, the Republic of Moldova, Romania, Slovakia, Slovenia, Sweden, Switzerland, the United Kingdom and the European Community.
Overview
The objective of the 1998 Protocol on Persistent Organic Pollutants (POPs), which entered into force on 23 October 2003, is to control, reduce or eliminate discharges, emissions and losses of POPs. It currently recognizes a list of 16 POPs, listed in the annexes to the Protocol, that resist degradation under natural conditions and that have been associated with adverse eff ects on human health and the environment, particularly, though not exclusively, in the Arctic where they accumulate in Arctic fi sh and mammals which indigenous people depend upon. The substances in the annexes comprise eleven pesticides, two industrial chemicals and three by-products/contaminants.
The 1998 Protocol on Persistent Organic Pollutants controls emissions of 16 POPs: aldrin, chlordane, chlordecone, DDT, dieldrin, dioxins and furans, endrin, heptachlor, hexachlorobenzene, hexachlorocyclohexane (HCH), hexabromobiphenyl, mirex, polyaromatic hydro-carbons (PAHs), polychlorinated biphenyls (PCBs) and toxaphene.
Progress in implementing the Protocol on POPs
Under the Protocol, Parties are to eliminate the production and use of the substances listed in annex I. The substances listed in annex II are those that Parties are committed to restricting.
The production and use of all annex I substances are now banned in Cyprus, the Czech Republic (since 1989), Denmark (since 1995), Germany, Hungary (since 1996), the Netherlands, Norway (since 2002), Slovakia, Slovenia (since 1988), Switzerland (since 1986) and Ukraine. Austria
reported that all substances in annexes I and II had been virtually completely eliminated. Canada reported not producing any of the 12 substances listed in annex I and that none were registered for pesticide use. There was no intentional production or sale of the substances listed in annexes I and II in Canada, Cyprus, Denmark, Estonia, Finland, Germany, Hungary, the Netherlands, Norway, Slovakia, and Slovenia. Switzerland reported no intentional production or sale of substances in annexes I and II with the exception of lindane, which was used in some pharmaceuticals. The United Kingdom indicated that it had implemented EC regulation 850/2004 on POPs.
Concerning the transboundary movement of substances listed in annex I, most Parties follow requirements under the Basel Convention on the Control of Transboundary Movements of Hazardous Wastes and their Disposal (Canada, Cyprus, Finland, Germany, Norway, Slovenia, Switzerland and the United Kingdom). Canada also specifi ed that it had an agreement with the United States on the Transboundary Movement of Hazardous Waste across their common border. Germany, Slovenia and Switzerland specifi ed that the export of waste for fi nal disposal in non-EU and non- EFTA countries was banned and that export for recovery/ recycling to non-OECD countries was also banned. Under article 4, paragraph 2 of the Protocol, a Party may grant an exemption on the elimination of the production and use of substances listed in annex I and also on the restriction of substances listed in annex II. However, all 15 respondents to the questionnaire reported that they did not apply any such exemptions.
Strategies and policies for reducing or eliminating POPs
Given that the Protocol entered into force relatively recently, a number of Parties, such as Estonia, reported that they had only just begun to develop relevant legislation. Equally, Finland had prepared a national POPs background document in 2005 covering all 16 POPs. Hungary was preparing a detailed POPs emission inventory for stationary source categories. Slovakia had a new Act on POPs since April 2006. Slovenia was preparing a National Implementation Plan for the management of POPs and an Operational Programme on reducing PAH, PCDD/F and HCB. Ukraine, while not a party, had made initial assessments of POPs and concluded that PCBs would need to be phased out by 2015. The Russian Federation reported a number of preliminary actions to address
I M P L E M E N T A T I O N O F A N D P R O G R E S S I N N A T I O N A L S T R A T E G I E S A N D P O L I C I E S
3 3
POPs including: the development of a legal basis for dealing with POPs, a survey of POP sources, monitoring of POPs in the most polluted areas and scientifi c studies to better understand the impact of POPs pollution.
Other Parties already had some plans and policies in place targeting POPs. In Canada, for instance, legislation dealing with POPs was split between the federal, provincial/territorial and regional/ecosystem levels. The Federal Government had the authority to set requirements for transboundary movements of hazardous waste, including hazardous recyclable material, and hazardous waste management on federal land. Legislation at the federal level included the Toxic Substances Management Policy and the Canadian Council of Ministers of the Environment Policy for the Management of Toxic Substances, which required the virtual elimination from the environment of toxic substances that were persistent, bioaccumulative and predominantly anthropogenic. The provincial/territorial governments had established requirements and authorized waste management facilities within their jurisdictions. Regional and ecosystem strategies included the Northern Contaminants Programme, the North American Regional Action Plans, the Great Lakes Water Quality Agreement, and the Great Lakes Binational Toxics Strategy targeting persistent, bioaccumulative and toxic substances.
Measures to reduce POPs
Cyprus reported it used fi nancial incentives such as grants to encourage industrial sources to implement Best Available Technology (BAT) to minimize POPs emissions. The Czech Republic had prioritized the need to address high emissions of benzene and PAHs, as well as to manage better toxic waste; it was implementing a national emissions reduction programme. Denmark regulated emissions from waste incineration plants through its Air Pollution Control Guidelines for waste incineration plants. In Germany, POP emissions were regulated through a system of ordinances and technical instructions under the Federal Emission Control Act while in the Netherlands measures were embedded in the Environmental Protection Act (1993) and the Hazardous Substances Act (1985). Switzerland’s Ordinance of 1986 on Environmentally Hazardous Substances regulated the import, production, supply, use and export of substances that might present a hazard to the environment.
Most Parties reported that the elimination of hazardous waste containing POPs was done at specially licensed waste management facilities. Austria reported that
since it did not have any special landfi lls to deal with hazardous waste, it was all either burnt in special incineration plants fi tted with BAT and operated under strict licences, or it was exported to countries that had the capacity to eliminate it in a suitable manner. In the latter case, special export permits were required. Cyprus was currently building sanitary landfi lls to address the problem of uncontrolled combustion of waste at open landfi lls as well as a waste management centre, which would be ready by 2007 and would be able to deal notably with PCBs. In the Czech Republic disposal of hazardous waste was possible only in facilities that had special authorization from the competent local authorities. In Switzerland, annex I POPs were classifi ed as special wastes that could only be eliminated in plants specially licensed to deal with them. Licences were valid for a maximum of 5 years, after which the facility must re-apply for a permit.
Estonia, which did not currently have the capacity to deal with annex I POPs, collected them in special storage facilities and then periodically shipped them to be destroyed in Finland (at the Ekokhem plant which is fully equipped to deal with biological, physical and chemical hazardous waste). In the Netherlands a permit was needed for the collection and transport of waste oil and small hazardous wastes; these were registered on a special list (“VIHB list”).
Some waste could be recycled: for instance, the Netherlands had identifi ed that fl y-ashes containing low concentration of dioxins and furans could be partly reused as fi ller material in asphalt without any negative consequences.
Emission limit values for POPs
Article 3, paragraph 5 (b)(ii) and annex IV specify the ELVs applied to each new stationary source within a category. Since 2000, Denmark has implemented the following limits: for waste oil with more than 50ppm: PCB should not be burnt and waste oil with more than 10 ppm PCB/PCT should be burnt for at least 2 seconds at a temperature above 1,200 degrees Celsius; PCBs must be removed from electrical and electronic equipment before scrapping. Finland reported that limit values for hazardous waste, including PCBs, was 50ppm. Austria, the Czech Republic, Denmark, Finland, the Netherlands, Slovakia and Slovenia all reported values of 0.1 ng TE/m3 for emissions of dioxins/furans (PCDD/F) from the three main stationary sources: municipal solid waste, medical waste and hazardous waste. Canada reported slightly
S T R A T E G I E S A N D P O L I C I E S F O R A I R P O L L U T I O N A B A T E M E N T
3 4
lower values at 0.08 ng I-TE/m3. For all the countries mentioned here, values are equivalent or lower than those specifi ed in annex IV of the Protocol.
PCBs
Most Parties responding to the questionnaire, while no longer producing goods with PCBs, still had to deal with old electronic and electrical equipment containing PCBs. For instance, in Austria, a ban on PCBs has been in place since the 1990s, although old products already containing PCBs might still be in use. In Canada, the manufacturing, processing, sale and import of PCBs was prohibited in 1992, under the Canadian Environmental Protection Act. Furthermore, current proposed legislation foresaw the destruction, by end 2009, of all PCBs material that were in storage. Specifi cally, the use of PCBs in concentrations of 500 ppm or more would end no later than 31 December 2009, and in concentrations of 50 ppm or more (but less than 500 ppm) no later than 31 December 2014.
In Denmark the sale and import of PCBs have been banned since October 1986, and since December 1998 the prohibition also included instruments containing the substances. The Netherlands noted that it had removed PCBs from electrical and electronic equipment by 2004; it had a special PCB cleaning facility that imported and dismantled transformers containing PCBs from developing countries.
Given that most wastes with PCBs in Norway emanated from reconstruction and demolition of buildings, a new law would be introduced in 2007 that would require the building and construction industry to give local authorities a waste management plan before starting any new construction. Wastes were considered hazardous in Norway when they contained more than 50 mg/kg of PCBs. Already in 1986 Norway had developed a strategy and an action plan for phasing out large capacitors containing PCBs; all PCB-containing large capacitors and transformers were collected and incinerated before 1995. A plan for identifying and collecting other products containing PCBs was developed during 1996 to 2000. A ban on use of small capacitors containing PCB in lighting fi xtures was introduced in 2005 and these would be phased out by 1 January 2008 while the use of electrical bushings containing PCBs was prohibited from 2010.
In 1999 Slovenia undertook a study “A Concept for Handling PCB/PCT in Slovenia” and defi ned measures to eliminate electrical equipment contaminated with PCB
from 2003 to 2006 with the aim to dispose of all material containing PCB/PCT by 2010. Ukraine reported that it intends to phase out PCBs by 2015.
Best available techniques for removal of POPs
The Protocol off ers guidance on BAT to address POPs, which is contained in annex V. Many Parties do not specifi cally require the use of a given technology but rather set limits for emissions that can be reached using available technology. For instance, Canada’s approach to the reduction of emissions from major stationary sources is to set an emission limit based on consideration of BAT, but not to specifi cally require the use of a given technology. It is the responsibility of facilities to meet these emission limits using any appropriate means at their disposal.
To optimize the combustion process in waste incineration, the Czech Republic reported the use of an approach that fi rst reduces the amount of waste through recycling and suitable pre-treatment followed by optimal combustion to ensure that the resulting matter contains less than 3% total organic carbon. In order to eff ectively treat waste gas, incinerators are generally equipped with three-stage waste-gas treatment, including particulate matter separation (fabric fi lters), absorption of acidic pollutants (semi-dry or wet scrubbers) and dioxin fi lters.
Denmark noted it promotes fl ue gas cleaning. Estonia, Finland, Germany, the Netherlands, Slovakia and Slovenia placed a signifi cant emphasis on permits as a means of controlling waste management facilities. Permits in Finland, the Netherlands, Slovakia and Slovenia indicated ELVs and standards rather than specifi c technology, while in Germany legal ordinances covered the diff erent emission sources, such as crematoria and hazardous waste incinerators. Switzerland noted it had ELVs as well as control measures for benzo(a)pyrene, dibenzo(a,h)-anthracene, diesel soots, PCDD and PCDF. These ELVs were established on the basis of BAT but the control technology was not specifi ed.
Wood-burning stoves have been identifi ed as a main source of PAH emissions in Norway and Denmark and both are currently developing new requirements for such stoves.
I M P L E M E N T A T I O N O F A N D P R O G R E S S I N N A T I O N A L S T R A T E G I E S A N D P O L I C I E S
3 5
G. The 1999 Gothenburg Protocol to Abate Acidi� cation, Eutrophication and Ground-level Ozone
Twenty Parties (as of 22 June 2006):
Bulgaria, the Czech Republic, Denmark, Finland, Germany, Latvia, Lithuania, Luxembourg, the Netherlands, Norway, Portugal, Romania, Slovakia, Slovenia, Spain, Sweden, Switzerland, the United Kingdom, the United States and the European Community.
Overview
The 1999 Gothenburg Protocol to Abate Acidifi cation, Eutrophication and Ground-level Ozone is an innovative multi-eff ect, multi-pollutant protocol that aims to simultaneously address the three eff ects it describes through controlling the pollutants causing them. It promotes action within the UNECE region and sets an example for action worldwide.
The Protocol entered into force in May 2005 and sets out to abate acidifi cation, eutrophication and ground-level ozone by controlling and reducing emissions of sulphur, NOx, ammonia and VOCs from anthropogenic sources. It is the fi rst Protocol under the Convention to tackle more than one pollutant.
The Protocol sets emission ceilings for 2010 for the four pollutants, the ceilings being negotiated on the basis of scientifi c assessments of pollution eff ects and abatement options. Parties whose emissions have a more severe environmental or health impact and whose emission reductions are relatively inexpensive would have to make the biggest cuts. Once the Protocol is fully implemented, Europe’s emissions should be cut signifi cantly for sulphur (63%), NOx (41%), VOCs (40%) and ammonia (17%), compared to 1990. By 2010, Canadian emissions of NOx and VOCs in the Pollutant Emission Management Area (PEMA), as defi ned in the Ozone Annex (2000) to the Canada-United States Air Quality Agreement, are expected to decrease from 1990 levels by 34% and 29%, respectively, and the United States NOx and VOC emissions are expected to decrease in the PEMA by 51% and 49% from 1990 levels. (Figures 12 a-d show United States and Canadian PEMA levels as of
2004). As of 2004, the total United States emissions of sulphur have decreased 36% from 1990 levels and total Canadian emissions of sulphur have decreased by 27% from 1990 levels (See Figure 12 e).
The Protocol also sets stringent limits for specifi c emission sources (e.g. combustion plant, electricity production, dry cleaning, cars and lorries) and requires BAT to keep emissions down. VOC emissions from products such as paints or aerosols will have to be cut and farmers will have to take specifi c measures to control ammonia emissions. Parties are obligated to either apply the ELVs or to apply alternative reduction strategies that achieve equivalent emission levels. Guidance documents, adopted at the time of adoption of the Protocol, provide a wide range of abatement techniques and economic instruments for the reduction of emissions in the relevant sectors.
At the time of adoption of the Protocol, it was anticipated that the area in Europe with excessive levels of acidifi cation would shrink from 93 million hectares in 1990 to 15 million hectares. Excessive levels of eutrophication were expected to fall from 165 million hectares in 1990 to 108 million hectares. The number of days with excessive ozone levels would be halved, thereby reducing life-years lost as a result of the chronic eff ects of ozone exposure by 2,300,000 in 2010 from 1990. By 2010, it was predicted that there would be approximately 47,500 fewer premature deaths resulting from ozone and particulate matter in the air. Finally, the exposure of vegetation to excessive ozone levels would be 44% less than in 1990.
At this early stage in the implementation of the Protocol, Parties should be in a position to provide information on ELVs for SO2, NOx and VOCs applied to new stationary and mobile sources, as well as information on measures used to reduce ammonia emissions from agriculture.
Progress in reducing emissions from new stationary sources
For new stationary sources, Parties are committed to applying the ELVs set in annexes IV, V and VI of the Protocol, within the timeframe specifi ed in annex VII. Parties that also ratifi ed the 1994 Protocol on Further Reduction of Sulphur Emissions, such as Germany and Slovenia, referred to their progress in meeting the ELVs in that Protocol.
The following countries reported ELVs of 0.2% for sulphur content in gas oil from stationary sources before
S T R A T E G I E S A N D P O L I C I E S F O R A I R P O L L U T I O N A B A T E M E N T
3 6
January 2008 and of 0.1% thereafter: the Czech Republic, Denmark, Finland (which was already at 0.1% since 2004), Germany, Italy, Lithuania, the Netherlands, Norway, Slovakia, Slovenia, and Switzerland. Some Parties noted that these fi gures were consistent with the EU Council Directive 1999/32/EC on the sulphur content of certain liquid fuels, which both Spain and the United Kingdom indicated they were implementing.
For NOx emissions, Parties that had ratifi ed the Protocol on Nitrogen Oxides, such as Denmark, Germany and Slovenia referred back to their implementation of that Protocol. The emission ceilings set in the Gothenburg Protocol built on the implementation of the Protocol on Nitrogen Oxides. For instance, while in Germany, emissions of NO2 decreased from 3,350 kilotonnes in 1987 to 2,055 kilotonnes in 1994, the target year of the Protocol, its new ceiling under the Gothenburg Protocol was 1,081 kilotonnes of NO2 by 2010.
For VOC emissions, the Gothenburg Protocol sets ELVs for several sources, such as solvents used in the car, the printing and the dry cleaning industries. In the United States, top coat operations in the automobile and light duty truck sector set the VOC discharge limit at 1.47kg/litre of applied coating solids for those vehicles which construction, reconstruction, or modifi cation commenced after 5 October 1979. In the Netherlands and Slovakia, this value was 45 g NMVOC/m2 or 1.3 kg/item.
Cyprus, Denmark, Slovakia, Slovenia and Spain referred to the Council Directive 1999/13/EC of 11 March 1999 on the limitation of emissions of VOCs due to the use of organic solvents in certain activities and installations. They indicated they had used this Directive as a basis to obtain ELVs of 50mg carbon/m3 for adhesive coating. These same countries together with Norway have transposed into their respective national legislation EC Directive 94/63/EC on the control of VOC emissions resulting from the storage of petrol and its distribution from terminals to service stations.
Some Parties indicated that the EC Directive on national emission ceilings for certain atmospheric pollutants (2001/81/EC) and the Directive on the limitation of emissions of certain pollutants into the air from large combustion plants (2001/80/EC) are both relevant to the Gothenburg Protocol. Cyprus, Denmark, Finland, Norway and Spain all indicated that they had implemented the EC directive 2001/80/EC on Large Combustion Plants while the United Kingdom noted that it was
implementing the National Emission Ceilings Directive 2001/81/EC.
Progress in reducing emissions from mobile sources
Annex VIII of the Protocol describes ELVs for passenger cars and light duty vehicles, heavy duty-vehicles, motorcycles and mopeds and non-road vehicles and machines. Concerning the quality of diesel fuel used in vehicles, the annex indicates maximum limits of 300 mg/kg by 2000 and 50 mg/kg by 2005. In complying with these limits, the Czech Republic, Finland, Slovenia and Switzerland reported a maximum sulphur content of 50 mg/kg, while Slovakia reported a maximum sulphur content of 300 mg/kg.
Some Parties drew attention to the following EC Directives, which refer to emission limits from vehicles or machinery: 98/69/EC, 97/68/EC, 2002/88/EC, 2004/26/EC, 70/220/EC and 1999/102/EC. Several Parties, such as Denmark, Finland, Norway, Slovenia, Spain and Switzerland indicated that they followed one or more of these directives.
Alternative emission reduction strategies
As noted above, the Protocol specifi es that Parties that do not wish to apply the ELVs for new stationary sources specifi ed in annexes IV, V and VI may, as an alternative, apply diff erent emission reduction strategies that achieve equivalent overall emission levels for all source categories together (article 3, paragraph 2). The Netherlands noted it had developed a NOx emission trading scheme that was applied to all relevant sectors and set a ceiling of 55 kilotonnes by 2010. This scheme set performance standard rates (PSRs) for certain specifi ed processes, by sector (in g/tonne of product), annually decreasing until 2010. For combustion processes the Netherlands planned to reduce the PSR from 68 g/GJ in 2005 to 40 g/GJ in 2010. Norway also reported it would apply emissions permits to its new stationary sources.
Finland noted that it would use alternative emission reduction strategies for NOx emissions released from new stationary engines rather than introduce into national legislation the ELVs in annex V of the Protocol.
3 73 73 7
Strategies for reducing ammonia emissions from agriculture
While emissions of NOx, SO2 and VOCs were addressed in previous protocols to the Convention, the Gothenburg Protocol was the fi rst Protocol to address ammonia emissions.The Czech Republic, Denmark, Finland, Germany, Lithuania, the Netherlands, Slovenia, Spain, and the United Kingdom noted that they had established codes of agricultural practice aimed at reducing ammonia emissions, while national codes were currently being prepared by Cyprus, Norway, Switzerland and Ukraine. A system of air emission permits was used in Cyprus to help control ammonia emissions from pig and poultry installations.
Denmark published an Action Plan for Reducing Ammonia Volatilization from Agriculture in 2001 that was expected to cut ammonia emissions by approximately 9500 tonnes per year. Measures included: covers on stores of solid manure that were not in daily use, covers on slurry containers on livestock holdings, a ban on surface spreading, a reduction in the time that applied manure was allowed to remain on the ground surface, a ban on ammonia treatment of straw and limiting local ammonia volatilization from livestock in the vicinity of vulnerable natural habitat types.
Two of the most important measures applied in Finland under its 1993 code of good agricultural production were that manure or other organic fertilizers spread in autumn must be incorporated within 24 hours after spreading and that manure stored in heaps on fi elds must be covered with, for example, a tight cover or a 10 cm layer of peat. Finland also included a range of voluntary measures including covering manure stores, incorporating manure within 4 hours after spreading, using injection techniques for slurry and urine spreading or using band spreaders.
Lithuania’s advisory code of good agricultural practice, published in 2000, included specifi c measures to
minimize ammonia emissions, such as: livestock density corresponding to manure application, regulated use of organic fertilisers (organic fertilisers must not be spread from 1 December to 1 April on soils that were frozen, water logged or covered with snow); solid and liquid manure shall be incorporated into the soil within 12 hours after application; and urine and slurry stores shall be covered or handled by a method that effi ciently reduced ammonia emissions.
In order to inform target audiences better and disseminate guidance and best practices on reducing ammonia emissions, Parties reported on their public information materials. For instance, Slovenia published and disseminated 65,000 copies of its advisory code on good agricultural practice in manure management, which included provisions on nitrogen, low emission manure-spreading techniques and possibilities for limiting ammonia emissions from mineral fertilizers. Spain’s guidelines on BAT for intensive pig rearing and poultry, covered improvements in liquid manure management and slurry storage. The United Kingdom published guidance on “Managing Livestock Manures, booklets 1 to 4” and “Ammonia emissions in the United Kingdom (2003)” which summarized research on ammonia emissions, their eff ects and means to reduce them.
Finland, the Netherlands and Slovenia indicated that they had transposed into their respective legislations EC Directive 91/676/EEC of 12 December 1991 concerning the protection of waters against pollution caused by nitrates from agricultural sources.
Finland, the Netherlands, Norway, Slovenia, Switzerland and the United Kingdom noted that the use of solid fertilisers based on urea was limited. Ammonium carbonate fertilisers were either banned or not employed in Cyprus, the Czech Republic, Finland, Germany, Lithuania, Netherlands, Norway, Slovenia, Spain, Switzerland and the United Kingdom.
S T R A T E G I E S A N D P O L I C I E S F O R A I R P O L L U T I O N A B A T E M E N T
ST
RA
TE
GI
ES
A
ND
P
OL
IC
IE
S
FO
R
AI
R
PO
LL
UT
IO
N
AB
AT
EM
EN
T
STRATEGIES AND POLICIES FOR CONTROLLING LONG-RANGE TRANSBOUNDARY AIR POLLUTION IN THE UNECE REGION
4
A. General trends and priorities in combating air pollution
The translation of the Convention and its protocols into practice is demonstrating that air pollution in the UNECE region is being
tackled across a number of sectors, particularly the agricultural, energy and transport sectors. In many cases, abatement measures have been targeted at more than one pollutant. Such measures as a consequence often have an impact on the reduction of greenhouse gases, including those covered under the Kyoto Protocol to the United Nations Framework Convention on Climate Change (UNFCCC) and re� ect synergies between reduction in emissions causing air pollution and climate change.
Many Parties noted they had long-term strategies and targets in place for addressing long-range air pollution at the national level. For example: the Netherlands noted it expected its measures on particulates to result in a decrease of 15% dust emissions (PM10) by 2010 and 20% by 2020. In 2020, harmful soot particles from diesel engines
should be reduced by 50%. It also noted that its NO2 emissions at congestion points should go down by 90% by 2020. The Russian Federation noted it had devised a strategy in 2001 to reduce the negative impact of vehicle emissions, with a target for 90% of vehicles to meet technical emission standards by 2005 and 95% by 2010. Slovenia had set a target to increase the share of renewable energy up to 12% of total primary energy supply and up to 33.6% of � nal electricity consumption. Spain’s Renewable Energies Plan 2005-2010 had set a target for biofuels to increase by 2010, from 500 to almost 2000 millions of tons equivalent of petroleum.
Increasingly, the public was being asked to contribute actively to issues of air quality both through public information campaigns and through voluntary schemes. For example, Canada’s voluntary accelerated on-road vehicle scrappage programmes were designed to improve air quality and help reduce smog-forming and greenhouse gas emissions by permanently removing older vehicles from the roads. The Czech Republic promoted voluntary agreements with operators that extended beyond the requirements of current legislation on air protection.
3 9
While dissuasive taxes and fi nes were widespread, many positive incentives were applied to encourage the use of renewable energy and cleaner vehicles. In the Czech Republic, in order to encourage the public contribution to the supply of green electricity, producers of electricity from renewable sources could choose between support through a minimum purchase price for electricity or a “green bonus” on the market price of electricity. Denmark subsidised wind turbines while Slovenia had a favourable taxation policy for the use of biofuels in transport. A number of Funds supported air quality projects, such as Canada’s Green Municipal Fund, the Lithuanian Environmental Investment Fund and Slovenia’s Environmental Fund.
The promotion of alternative fuels was evident across the region. Armenia reported that it gave priority to renewable energies as indicated by its law on energy saving and renewable energy (2004) as well as a fund for renewable energy (2005). Under Canada’s Wind Power Production Incentive, companies were eligible for payments of up to 1.2 cents/kilowatt-hour produced. Cyprus, which had identifi ed electricity production as the main source of SO2 emissions (69% of national total) intended to secure liquefi ed natural gas from neighbouring countries by 2009. The Czech Republic aimed to have 8% of its electricity needs covered by renewable sources by 2010. Lithuania set a goal to ensure that biofuels (biodiesel, bioethanol) comprised at least 15% of fuel used in road transport by 2020.
There were clear trends in all responding countries to retrofi t old vehicles (e.g. Canada, the Netherlands, Switzerland, Ukraine and the United Kingdom). This generally involved retrofi tting soot fi lters on all categories of vehicles and mobile machinery. Canada had provided funding to retrofi t approximately 350 pre-1994 buses nation-wide, nearly 500 school buses in British Columbia and 70 municipal vehicles in the Vancouver area. Ukraine had developed an action plan (2004-2010) targeting the road transport sector, which included retrofi tting old vehicles as well as improving fuel quality and expanded the use of alternative fuels.
Environmental impact assessments (EIAs) were increasingly required for major new projects in an attempt to reduce their negative environmental impact. In the Netherlands, EIAs were mandatory for the construction of new oil refi neries, nuclear power stations, chemical installations, motorways, railways, airports, oil and gas pipelines and dams. In Slovenia, EIAs were required for certain programmes in the fi elds of, inter alia, spatial planning, agriculture, energy, industry, transport, waste and waste water management.
Several directives that make up EU legislation cover air pollution and many European Parties, including EU accession countries, reported that they were incorporating these into their own legal frameworks. Some of the most relevant directives included: the National Emission Ceilings (NEC) Directive (2001/81/EC), the Large Combustion Plants (LCP) Directive (2001/80/EC), the Integrated Pollution and Prevention Control (IPPC) Directive (96/61/EC) as well as more specifi c directives, such as those covering sulphur content of gas oils (93/12/EC), fuel standards (98/70/EC) and waste incineration (2000/76/EC).
The Convention has emphasized the need for focused scientifi c research since its adoption. To study eff ects of pollution, six International Cooperative Programmes (ICPs) as well as a Task Force on Health were established to develop research in key areas on the impacts of air pollution as well as on monitoring and modelling eff ects across the region (please refer to ECE/EB.AIR/2006/4, section II.B.2, Activities of the Working Group on Eff ects). Research has continued at the national level in an eff ort to reduce the impact of energy use and to reduce emissions and depositions of pollutants covered by the Convention. Canada noted it had researched the relationship between air pollution sources and the resulting ambient levels to better defi ne the environmental benefi ts of emission reductions. Health Canada was conducting scientifi c research on acute and chronic health eff ects of ambient and indoor air pollution, focused particularly on vulnerable groups such as the elderly, children and those with respiratory and cardiovascular disorders. The Russian Federation had increased the eff ectiveness of power production by either reconstructing or re-equipping power plants and by developing non-traditional power engineering. Switzerland was researching the eff ects of ozone on vegetation and of eutrophication in surface waters.
B. Innovative approaches and emerging technologies
Many Parties reported they were investing in new technologies to reduce air pollution or to mitigate its impact. Canada, Cyprus, the Czech Republic, Denmark, Finland, Germany, Hungary, Italy, Lithuania, the Netherlands, Slovenia, Spain, Switzerland and the United Kingdom reported that they were investing in alternative and renewable energy sources such as biofuels, wind and solar power. The Netherlands’ “MEP” scheme (Environmental Quality of Power Production), had allocated 3.9 billion for renewable power
S T R A T E G I E S A N D P O L I C I E S F O R A I R P O L L U T I O N A B A T E M E N T
4 0
production for the years 2005-2010. Many Parties were identifying ways to reduce overall fuel consumption. A number of Parties, such as Switzerland, promoted low consumption vehicles, while others, such as the Netherlands encouraged a modal shift from road to rail for both passenger and goods transport.
New technologies were being developed and tested in diff erent countries, notably through grants such as those awarded by Norway’s Research Council and Innovation Norway to support the development of new environmental technologies. In Cyprus, a Research Promotion Foundation (RPF) supported and funded environmental projects. Energy effi ciency was promoted through a grants scheme, which subsidized energy savings in existing industrial installations, heat insulation of houses as well as co-production of electricity for heating/cooling systems. The grants scheme also covered the promotion of renewable energy sources such as wind parks, solar energy, biomass, photovoltaic systems and desalination plants operating with renewable energy sources.
Estonia used computer modelling to develop interactive air quality management systems where all signifi cant stationary sources were mapped and models could predict dispersion from each source. The Environmental Technology Programme of the Netherlands was set up with a budget of 5 million euros for 2006 to promote innovative sustainable technologies in the environmental fi eld with a specifi c focus in the areas of sustainable energy, agriculture and mobility. Twenty million euros were allocated up to 2008 for the Air Quality Innovation Programme, which is aiming to identify “smart” solutions for improving air quality around highways. It was also seeking to reduce truck-based pollution in cities through zoning.
Since 2002, in an eff ort to support consumers and companies making optimal decisions concerning their choice of energy, all of Sweden’s 290 municipalities have set up some form of energy advisory service. To stimulate innovation, Sweden has been promoting technology for energy effi cient products and services in the fi elds of heating and control systems, domestic hot water and sanitary systems, ventilation, white goods, lighting and industry.
Switzerland reported it was developing a new device to reduce particle emissions for small-scale wood burning based on an electrofi lter system; the device would be tested in 2006. It had also invested in developing particle fi lter traps combined with a de-NOx system, which it was planning to fi t to buses.
Ukraine reported that it had identifi ed a sulphur removal technique that used chemical binding, which it would implement over the period 2011-2020 during the renovation of its thermal power plants.
The Netherlands noted it had promoted green investment since 1995, as another innovative approach to deal with air quality and environmental problems. Since the interest on these funds was not always as attractive as that for traditional funds, the Government provided a tax compensation that would improve the rate of return. Environmentally friendly projects that qualifi ed for green fi nancing included, sustainably built apartments, windmills and bio-agricultural companies, as well as nature and forest projects.
C. Cross-sectoral and multi-pollutant approaches
For most Parties, air quality control extended to other media such as soil and water. These were often addressed within national environmental action plans and policies that reached across sectors, as in the case of the Czech Republic, Estonia and Slovenia. In Cyprus, decisions on important environmental issues were taken by the Council of Ministers, not by the competent Ministry alone. In the Netherlands, many measures were also part of the integrated responsibilities of other ministries. At a European level, the 1998 EU Cardiff process encouraged the integration of environmental protection into sectoral policies, particularly energy, transport and agricultural policy.
Transport planning and tra� c management
Parties’ replies showed that signifi cant eff orts were directed toward the transport sector to reduce emissions, as it was generally recognised as the sector accounting for a signifi cant proportion of air emissions.
Measures to reduce transport-related air pollution included retrofi tting of old vehicles or encouraging their scrappage. These approaches were generally promoted through voluntary schemes and tax reductions. Moreover, incentives were often off ered to promote the adoption of better and more environmentally friendly transport (e.g. walking, cycling, car-pooling, public transport etc.) or in the case of private vehicles, to encourage the use of smaller engines, hybrid engines, or electric vehicles. These changes were promoted through grants, tax breaks and public awareness campaigns. For
4 14 14 1
STRATEGIES AND POLICIES FOR CONTROLLING LONG-RANGE TRANSBOUNDARY AIR POLLUTION IN THE UNECE REGION
instance the Cyprus Institute of Energy operated a grant scheme, providing fi nancial support for the purchase of electric or hybrid vehicles. The United Kingdom, “The Future of Transport White Paper”, (July 2004) encouraged the development, introduction and uptake of new vehicle technologies and fuels and investment in public transport. Planning authorities emphasized accessibility for public transport, park-and-ride schemes and walking and cycling paths. For example, the Czech Republic had adopted a National Cycling Strategy.
Traffi c management measures were used by several Parties to reduce urban air pollution. These measures included reducing speed limits, alternating traffi c and closing off certain areas to traffi c. The United Kingdom promoted schemes that restricted or excluded less clean vehicles from certain roads or areas, such as low emission zones, and land-use and transport planning that helped reduce road congestion.
Emission-related taxes and fees were another way that Parties discouraged the use of larger or less fuel-effi cient vehicles. Germany introduced emission-related landing fees at its airports and imposed a road toll on heavy goods transported by truck. In Slovenia, a voluntary agreement aimed to encourage European, Japanese and Korean car producers to increase their energy effi ciency. The majority of cars sold in Slovenia came from producers that were taking part in this scheme.
In the Netherlands, a Decree on Petrol stations prescribed measures to prevent evaporation to the air (e.g. vapour return systems) and also measures to prevent leakages of fuels to groundwater and soil (e.g. using liquid tight fl oors and leak proof underground storage). Cyprus, Finland and Italy had similar measures.
Health policies to mitigate the e� ects of air pollution
Air pollution aff ects not only our ecosystems, but also human health. Canada, Finland, Lithuania, the Russian Federation and Slovakia indicated that their Environment and Health Ministries work closely together to assess whether substances in commerce posed a risk to either the environment or the population. In Canada, for example, all chemical, polymer and biotechnology substances new to Canadian commerce must undergo environmental and health risk assessments prior to manufacture, importation or sale.
Energy policy
Many Parties indicated they were exploring and applying alternatives to fossil fuels with an emphasis on renewable energy sources, such as biofuels, solar energy and wind generators.
Lithuania’s energy strategy was focused on energy saving and effi ciency and the expansion and promotion of alternative energy sources. The aim was to ensure that up to 12% of its total primary energy was obtained from renewable sources by 2010 (including 10.5% derived from biofuel produced from raw material originating within the country). Slovenia’s energy policy promoted renewable energy and energy effi ciency. In Switzerland, a programme called SwissEnergy was launched in 2000, aimed to improve energy effi ciency, to promote the use of renewable energy and biomass and to facilitate compliance with the Kyoto protocol.
Agricultural policy and organic farming
Many Parties were promoting organic farming as part of their agricultural policy. This is important for air pollution abatement, both because of the limited use of pesticides, like DDT and other POPs, as well as through the benefi t of more energy effi cient agricultural practices. Canada had developed a set of agri-environmental indicators (AEIs) specifi c to the agriculture and agri-food sectors to assess how well agriculture and agri-food systems managed to conserve natural resources. In Cyprus, a grant scheme supported organic agriculture, leading, in 2005, to the proportion of organically produced goods reaching 1% of agricultural production. In the Czech Republic subsidies supported organic agriculture. Germany promoted organic farming through public information and education campaigns, fi nancial assistance for investment costs and facilitated credit. In Lithuania, fi nancial assistance for organic farming was foreseen in its rural development plan for 2003-2006. The Netherlands aimed to have 10% of its agriculture converted to organic production by 2010, while Norway aimed to ensure that 15% of agricultural production and consumption came from organic sources by 2015. Slovenia, through its rural development funds, allocated signifi cant resources to support organic farming.
Multi-pollutant strategies
Pollution abatement measures and monitoring programmes were often applied to more than one
S T R A T E G I E S A N D P O L I C I E S F O R A I R P O L L U T I O N A B A T E M E N T
4 2
STRATEGIES AND POLICIES FOR CONTROLLING LONG-RANGE TRANSBOUNDARY AIR POLLUTION IN THE UNECE REGION
pollutant For example, where air emission permits were used, Parties set values across a number of pollutants, such as SO2, NOx, particulate matter, heavy metals and POPs. In Canada a multi-pollutant approach was taken where fuel quality and all conventional pollutants from internal combustion engines for vehicles, engines and fuels were covered by regulations. Canada also developed multimedia Environmental Codes of Practice for selected sectors (e.g. iron and steel manufacturing, base metal smelting). Legislation in the Netherlands set ELVs for multiple pollutants per category of stationary source, e.g. for waste incinerators ELVs were set for NOx, SO2, VOC, fi ne dust, heavy metals and POPs.
D. Market-oriented policies and economic instruments
Market-based policies and economic instruments include negative incentives such as the levying of taxes, and positive incentives such as tax breaks and subsidies. Most Parties reported using a combination of both. In some cases, for example, tax breaks were applied to new, cleaner vehicles that functioned on a hybrid engine or with green electricity, such as in Cyprus. In other cases, higher taxes were levied on vehicles with bigger engines and higher emissions, as in Germany.
Positive incentives
Positive incentives include: grants, subsidies, tax rebates, tax incentives, credit guarantees, soft loans and tradable permits. All of these aim to have an impact on individual patterns of consumption and to minimize air pollution and its eff ects. In Canada, under the Wind Power Production Incentive, companies opting for wind generators were eligible for payments of up to 1.2 cents/kilowatt-hour produced. In Cyprus, since 2004, the owners of vehicles equipped with catalytic converters paid less tax than owners of non-catalytic vehicles. Additionally, the following tax incentives were introduced in November 2003: a 15% discount on the excise duty for cars with CO2 emissions of 150g/km or less and a 10% penalty on cars with CO2 emissions of 275g/km or more. From January 2006 the purchase of a hybrid car was subsidised by the Government by an amount of £800 CYP (about Euro 1,350) and incentives were off ered for scrappage of vehicles over 15 years old. In Lithuania the Environmental Protection Investment Fund provided subsidies for environmental protection projects of up to 350,000 litas (approximately 101,000 euros) over a three-year period. The Fund fi nanced
26 environmental protection projects, 18 of which (70%) were related to pollution reduction, conversion to cleaner fuels, renovation of home boilers, installation of air-treatment fi lters or other energy-saving measures.
Many Parties used subsidies and other fi nancial incentives to promote the use of renewable energy such as solar power or wind turbines, including in Austria, Canada, the Czech Republic, Germany, Italy and the Netherlands. The Czech Republic reported that it off ered fi nancial support for pilot projects for the supply of alternative energy, especially thermal energy. Subsidies could be obtained for the preparation of project documents and for the implementation of projects with a maximum of 100,000 euros over three years. Since July 2005, the Netherlands has stimulated the use of sulphur-free diesel by reducing the tax charged; since June 2005, the purchase of new diesel-powered cars equipped with soot fi lters was encouraged through a 600-euro discount on the tax for personal motor vehicles. Starting in mid-2006, a subsidy for retrofi tting a soot fi lter into existing, trucks, vans, buses, personal cars, diesel powered locomotives and inland ships would come into force. A subsidy scheme was also in force since 2006 for catalytic converters for inland shipping. More than 100 techniques for the reduction of air pollution (e.g. wet scrubbers, desulphurisation processes, low NOx burners, catalytic reduction system, low emission animal housing systems, etc.) were eligible for fi scal benefi ts intended to stimulate environmentally friendly technologies.
In Slovenia, subsidies and soft loans were available for energy effi ciency measures and for the use of renewable energy sources for households (e.g. solar heating technologies, energy effi cient windows, biomass heating, heat pumps) and for companies (e.g. biomass technologies). The United Kingdom has allocated over £500 million (approximately 740 million euros) between 2002 and 2008 to support the development of renewable and low-carbon technologies.
Austria noted it off ered subsidies for the rehabilitation of old residential buildings in order to reduce their impact on air pollution. Positive incentives in Germany included tax incentives for the use of low sulphur fuels and for renewable energies and federal grants to promote public transport in municipalities.
Tradable permits were also being increasingly utilized to minimise emissions. Canada reported it had implemented tradable unit systems to reduce two toxic substances, tetrachloroethylene and trichloroethylene. At the provincial level, Ontario’s cap and trade system
4 3
for NO and SO2 emissions from power plants and British Columbia’s diff erentiated fees for industrial polluters were noteworthy. At the federal level, a cap and trade system to phase out methyl bromide and HCFCs had been introduced. In the Netherlands, a NOx emission trading system, started in July 2005, was based on performance standard rates. It focused on extra overall reductions in addition to those resulting from the ELVs set forth in national legislation. Slovakia also had an emissions trading act for SO2 and CO2.
Negative incentives
Negative incentives include taxes, fees, and various charges. In the Czech Republic, the Air Protection Act imposed fees for air pollution for the operators of very large, large and medium-sized sources and small stationary sources. For large sources fees were paid into the State Environmental Fund, which then promoted projects intended primarily to reduce emissions. For small sources, the fees went directly to the municipality and were earmarked for environmental protection. Germany applied a range of dissuasive market measures including road user charges for heavy goods transport and emission-based vehicle taxes. Further planned measures included the reduction of the distance-related tax refund for commuters and the equalisation of fuel tax on petrol and diesel. In Estonia, a plant that emitted more than was stipulated in its permit was subject to higher taxes.
In Lithuania, charges on pollutants discharged to the atmosphere from stationary and mobile pollution sources were introduced through the 1991 Law on Pollution Charge. Energy plants with a capacity exceeding 1MW (0.5 MW if solid fuel was used) must possess an environmental permit. Charges on pollution from stationary sources were paid according to the amount of pollutants actually emitted during a reporting period. If the polluter implemented measures to reduce pollutant emissions by at least 5 per cent from the maximum allowable, it would be exempted from the charge on the pollutants. Exemptions were valid for the period of implementation of the air pollution abatement measures, but not more than 3 years.
In Switzerland, two taxes were introduced in 2000. One was applied to VOCs whereby CHF 3 (approximately 2 euros) per kg of VOC was to be paid on imports of solvents. The second was on fuel with a sulphur content higher than 0.1%. Another dissuasive economic tool applied in Switzerland was the distance-related heavy-duty fee introduced in 2000. This followed the European
norms (EURO 1, 2 or 3) according to the emission category. In Slovenia, taxes were applied to waste, depending on the level of methane emissions.
Public awareness and engagement
National campaigns and programmes to raise public awareness on energy effi ciency and the need to reduce air pollution were an important component of air pollution abatement strategies for many Parties. Parties were also increasingly seeking civil society’s active engagement. In Armenia, representatives of non-governmental organizations (NGOs) were asked to participate in impact assessments for new infrastructure projects. The Czech Republic reported that it had established regional energy information centres that aimed to increase consumers’ confi dence in alternative forms of energy. Germany noted it was stepping up its campaign “New Ways of Driving” to reduce pollution exacerbated by unsuitable driving practices. The Netherlands had a similar scheme called “The New Driving Force” which targeted car drivers, as well as driving schools and lorry drivers and aimed to improve both purchasing behaviour and driving styles with the intention to reduce fuel consumption, emissions and traffi c accidents.
The Netherlands reported it was implementing a plan that foresaw fi nancial assistance to stimulate consumer demand and spread information on organic farming and products. The Ministry of Agriculture, Nature and Food Quality gave fi nancial support for such publicity campaigns.
In Canada, public outreach and education programmes targeted residential wood combustion. These programmes focused on describing good burning practices, including the need to use clean wood fuel only and advocated the use of wood burning appliances, which had lower emissions of particulate matter. It also used a national health-based Air Quality Index (AQI) as a tool to help citizens understand the links between human health and air quality, and to empower them to take individual action to protect their health and that of their children. Having identifi ed uncontrolled burning of waste as the main source of dioxin emissions, Cyprus was preparing an action plan to raise public awareness regarding emissions from uncontrolled combustion.
In Switzerland, information campaigns targeted the general public and consumers to promote products containing low VOC levels and alkylate fuel for small engines and machinery. Campaigns were organised to
S T R A T E G I E S A N D P O L I C I E S F O R A I R P O L L U T I O N A B A T E M E N T
4 4
ensure the proper collection of waste that contained mercury or cadmium.
In an eff ort to engage the public in improving the use of better quality fuel, the Russian Federation noted it had conducting advertising campaigns, including information materials concerning diff erent suppliers and sellers of fuel. The scheme also awarded petrol stations off ering good quality fuels with a “quality sign” that buyers could recognize.
Eco-labelling and promotion of environmentally friendly consumption
Eco-labelling “clean” products provides a stamp or seal of approval to products guaranteeing that their production has minimized impacts on air pollution or on the environment more broadly. These schemes draw on the power of consumers to choose products that are considered relatively eco-friendly. Such schemes are becoming more widespread across the UNECE region. Canada reported it had a scheme EcoLogo that provided consumers with information on the impact that products had on the environment, including air quality.
The EU ECO-labelling launched in 2004 in Cyprus awarded a recognisable fl ower logo to goods or services that met tough environmental standards.
In the Czech Republic, an Eco-label scheme was managed by the Agency for Environmentally Sound Products, which received and processed applications
for use of an “Environmentally Sound Product” label. The Agency also controlled compliance with the criteria and conditions for holders of these labels, in accordance with EU ecolabelling regulations.
Germany used the eco-label “Blue Angel” which specifi ed the VOC content for a number of products, such as: low-pollutant paints and varnishes, low-emission wall paints, low-emission wood products and wood-base products.
In the Netherlands, products could be assigned a “Netherlands Environmental Hallmark” which covered, amongst others, the VOC content of the product.
A voluntary Nordic environmental labelling system for products was introduced in 1989. The label helps consumers to identify the products that cause the least damage to the environment.
Slovenia noted that energy labels for household appliances (wet appliances, light bulbs, electric ovens, air-conditioners) were in force. Also minimum standards for energy effi ciency of household freezers and refrigerators were introduced. Slovenia also had a Renewable Energy Certifi cate System that labelled the origin of electricity (the certifying agency was the Energy Agency of the Republic of Slovenia).
The United Kingdom reported it had implemented the EU Energy Labelling Scheme, which made it mandatory for manufactures to provide information on the energy effi ciency of their products.
STRATEGIES AND POLICIES FOR CONTROLLING LONG-RANGE TRANSBOUNDARY AIR POLLUTION IN THE UNECE REGION
4 5
S T R A T E G I E S A N D P O L I C I E S F O R A I R P O L L U T I O N A B A T E M E N T
ST
RA
TE
GI
ES
A
ND
P
OL
IC
IE
S
FO
R
AI
R
PO
LL
UT
IO
N
AB
AT
EM
EN
T
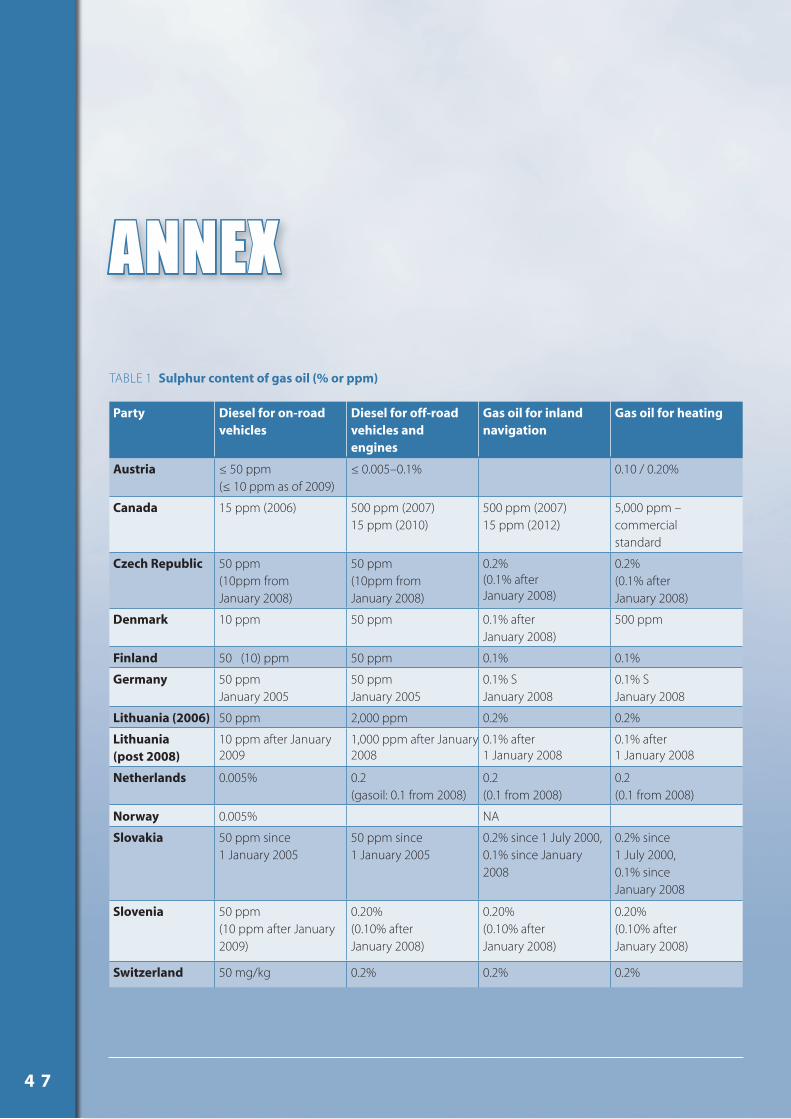
4 7
ANNEXTABLE 1 Sulphur content of gas oil (% or ppm)
Party Diesel for on-road vehicles
Diesel for off-road vehicles andengines
Gas oil for inland navigation
Gas oil for heating
Austria ≤ 50 ppm (≤ 10 ppm as of 2009)
≤ 0.005–0.1% 0.10 / 0.20%
Canada 15 ppm (2006) 500 ppm (2007) 15 ppm (2010)
500 ppm (2007) 15 ppm (2012)
5,000 ppm – commercial standard
Czech Republic 50 ppm(10ppm from January 2008)
50 ppm(10ppm from January 2008)
0.2% (0.1% after January 2008)
0.2%(0.1% after January 2008)
Denmark 10 ppm 50 ppm 0.1% after January 2008)
500 ppm
Finland 50 (10) ppm 50 ppm 0.1% 0.1%
Germany 50 ppm January 2005
50 ppmJanuary 2005
0.1% S January 2008
0.1% S January 2008
Lithuania (2006) 50 ppm 2,000 ppm 0.2% 0.2%
Lithuania (post 2008)
10 ppm after January 2009
1,000 ppm after January 2008
0.1% after 1 January 2008
0.1% after 1 January 2008
Netherlands 0.005% 0.2 (gasoil: 0.1 from 2008)
0.2 (0.1 from 2008)
0.2 (0.1 from 2008)
Norway 0.005% NA
Slovakia 50 ppm since 1 January 2005
50 ppm since 1 January 2005
0.2% since 1 July 2000, 0.1% since January 2008
0.2% since 1 July 2000, 0.1% since January 2008
Slovenia 50 ppm(10 ppm after January 2009)
0.20% (0.10% after January 2008)
0.20% (0.10% after January 2008)
0.20%(0.10% after January 2008)
Switzerland 50 mg/kg 0.2% 0.2% 0.2%
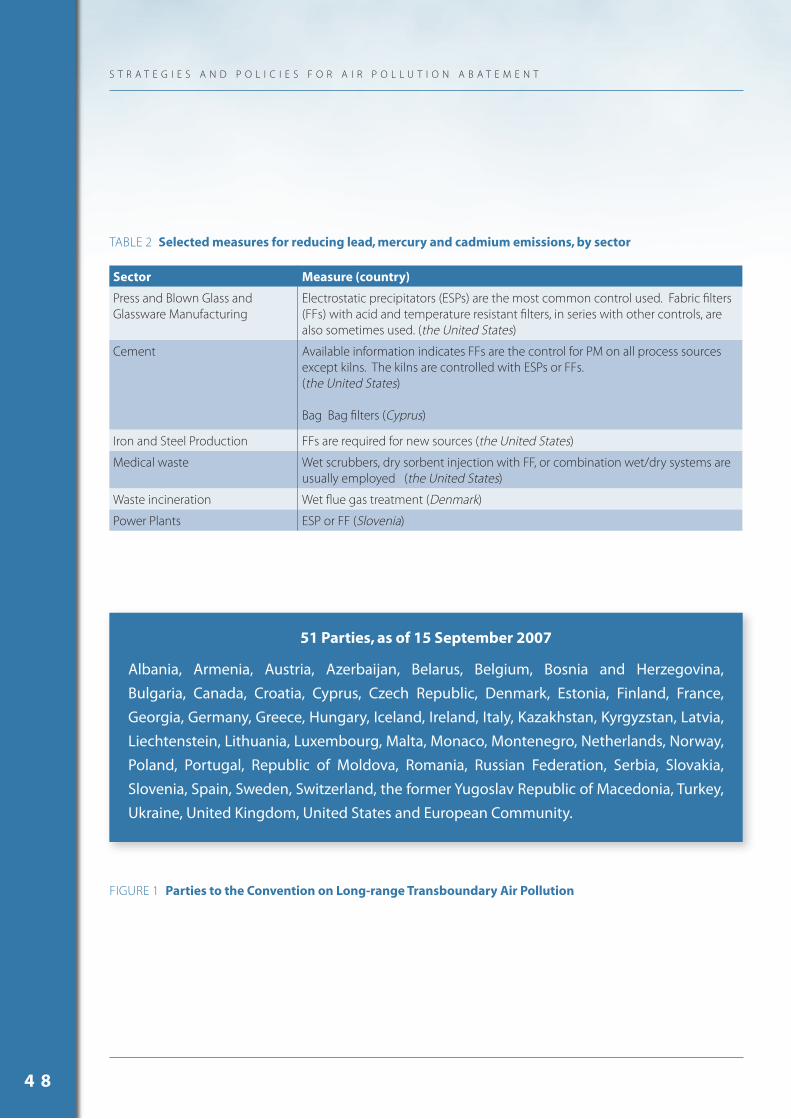
TABLE 2 Selected measures for reducing lead, mercury and cadmium emissions, by sector
Sector Measure (country)
Press and Blown Glass and Glassware Manufacturing
Electrostatic precipitators (ESPs) are the most common control used. Fabric fi lters (FFs) with acid and temperature resistant fi lters, in series with other controls, are also sometimes used. (the United States)
Cement Available information indicates FFs are the control for PM on all process sources except kilns. The kilns are controlled with ESPs or FFs. (the United States)
Bag Bag fi lters (Cyprus)
Iron and Steel Production FFs are required for new sources (the United States)
Medical waste Wet scrubbers, dry sorbent injection with FF, or combination wet/dry systems are usually employed (the United States)
Waste incineration Wet fl ue gas treatment (Denmark)
Power Plants ESP or FF (Slovenia)
51 Parties, as of 15 September 2007
Albania, Armenia, Austria, Azerbaijan, Belarus, Belgium, Bosnia and Herzegovina, Bulgaria, Canada, Croatia, Cyprus, Czech Republic, Denmark, Estonia, Finland, France, Georgia, Germany, Greece, Hungary, Iceland, Ireland, Italy, Kazakhstan, Kyrgyzstan, Latvia, Liechtenstein, Lithuania, Luxembourg, Malta, Monaco, Montenegro, Netherlands, Norway, Poland, Portugal, Republic of Moldova, Romania, Russian Federation, Serbia, Slovakia, Slovenia, Spain, Sweden, Switzerland, the former Yugoslav Republic of Macedonia, Turkey, Ukraine, United Kingdom, United States and European Community.
FIGURE 1 Parties to the Convention on Long-range Transboundary Air Pollution
S T R A T E G I E S A N D P O L I C I E S F O R A I R P O L L U T I O N A B A T E M E N T
4 8
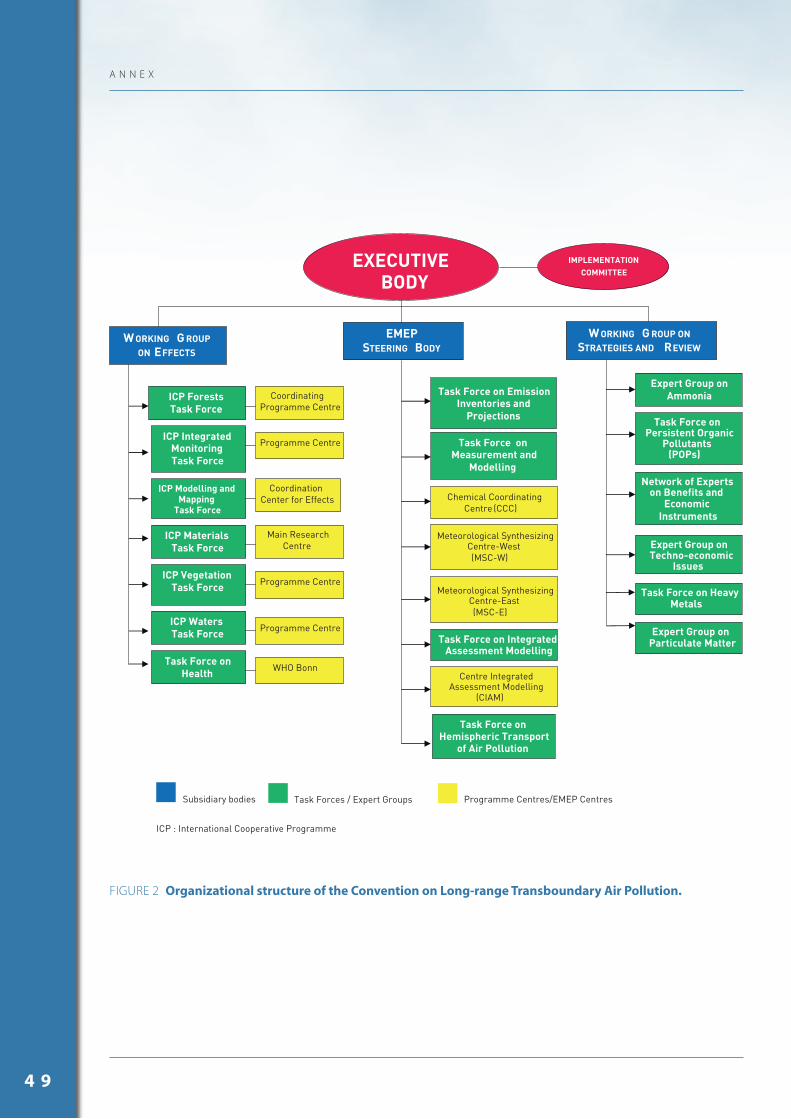
FIGURE 2 Organizational structure of the Convention on Long-range Transboundary Air Pollution.
EXECUTIVEBODY
IMPLEMENTATION COMMITTEE
W ORKING G ROUPON EFFECTS
EMEPSTEERING BODY
ICP ForestsTask Force
ICP IntegratedMonitoringTask Force
ICP Modelling and Mapping
Task Force
ICP MaterialsTask Force
ICP VegetationTask Force
ICP WatersTask Force
Task Force onHealth
CoordinatingProgramme Centre
Programme Centre
CoordinationCenter for Effects
Main Research Centre
Programme Centre
Task Force on Emission Inventories and
Projections
Task Force on Measurement and
Modelling
Chemical Coordinating Centre (CCC)
Meteorological SynthesizingCentre-West (MSC-W)
Meteorological Synthesizing Centre-East (MSC-E)
Task Force on Integrated Assessment Modelling
Task Force on Persistent Organic
Pollutants(POPs)
Network of Experts on Benefits and
Economic Instruments
Centre Integrated Assessment Modelling
(CIAM)
Expert Group on Techno-economic
Issues
Expert Group on Ammonia
Task Force on Heavy Metals
Programme Centre
WHO Bonn
Subsidiary bodies Task Forces / Expert Groups Programme Centres/EMEP Centres
ICP : International Cooperative Programme
W ORKING G ROUP ON STRATEGIES AND REVIEW
Task Force on Hemispheric Transport
of Air Pollution
Expert Group on Particulate Matter
A N N E X
4 9
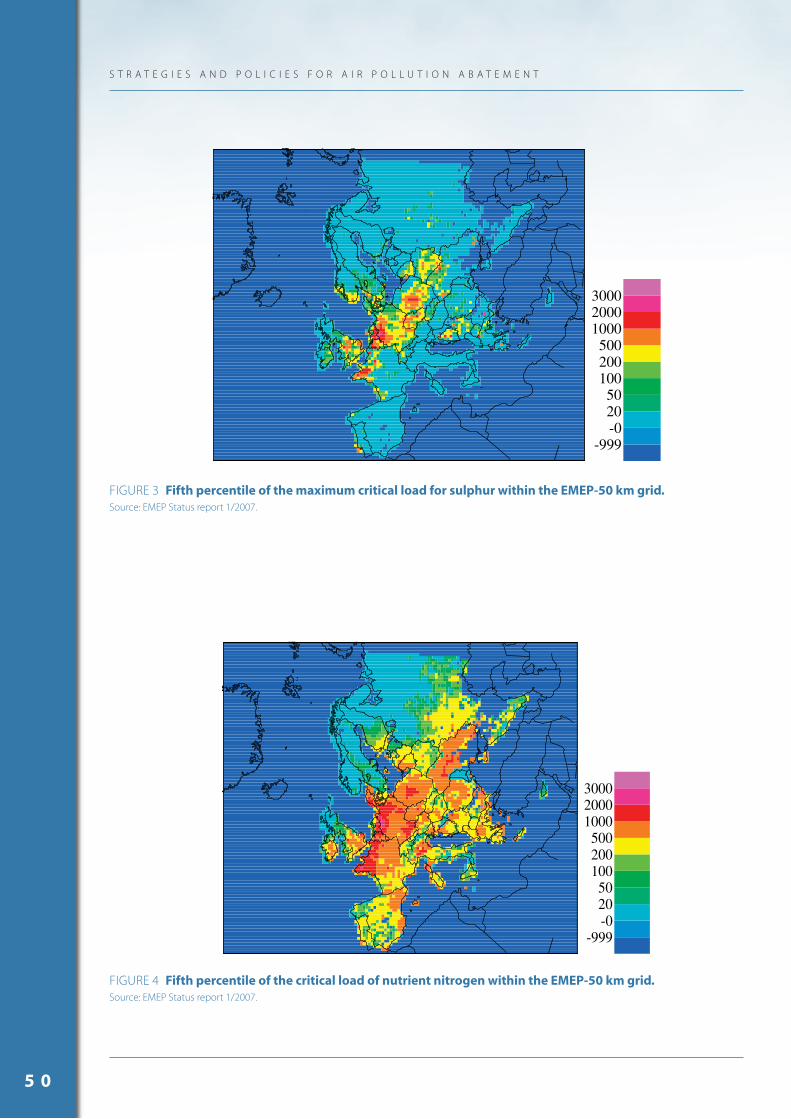
FIGURE 3 Fifth percentile of the maximum critical load for sulphur within the EMEP-50 km grid. Source: EMEP Status report 1/2007.
FIGURE 4 Fifth percentile of the critical load of nutrient nitrogen within the EMEP-50 km grid. Source: EMEP Status report 1/2007.
-999-02050
100200500
100020003000
-999-02050
100200500
100020003000
S T R A T E G I E S A N D P O L I C I E S F O R A I R P O L L U T I O N A B A T E M E N T
5 0
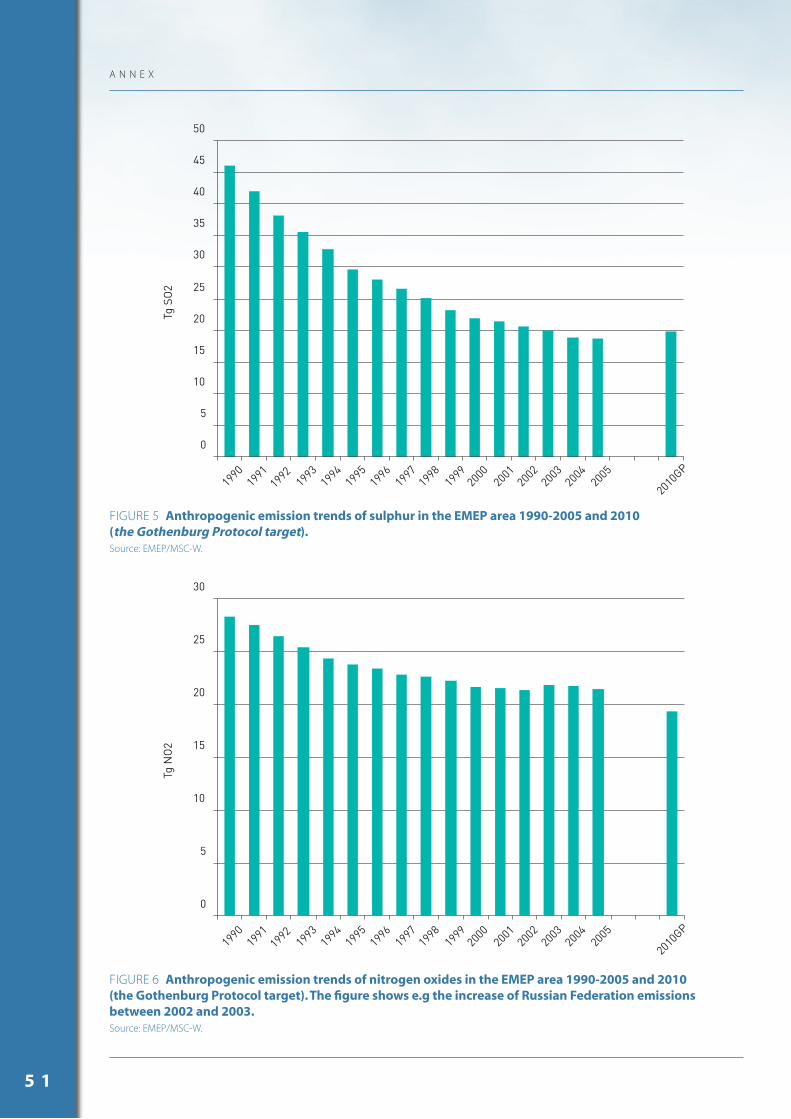
FIGURE 6 Anthropogenic emission trends of nitrogen oxides in the EMEP area 1990-2005 and 2010 (the Gothenburg Protocol target). The fi gure shows e.g the increase of Russian Federation emissions between 2002 and 2003. Source: EMEP/MSC-W.
0
5
10
15
20
25
30
35
40
45
50
Tg S
O2
1990
1991
1992
1993
1994
1995
1996
1997
1998
1999
2000
2001
2002
2003
2004
2005
2010
GP
0
5
10
15
20
25
30
Tg N
O2
1990
1991
1992
1993
1994
1995
1996
1997
1998
1999
2000
2001
2002
2003
2004
2005
2010
GP
FIGURE 5 Anthropogenic emission trends of sulphur in the EMEP area 1990-2005 and 2010 (the Gothenburg Protocol target). Source: EMEP/MSC-W.
A N N E X
5 1
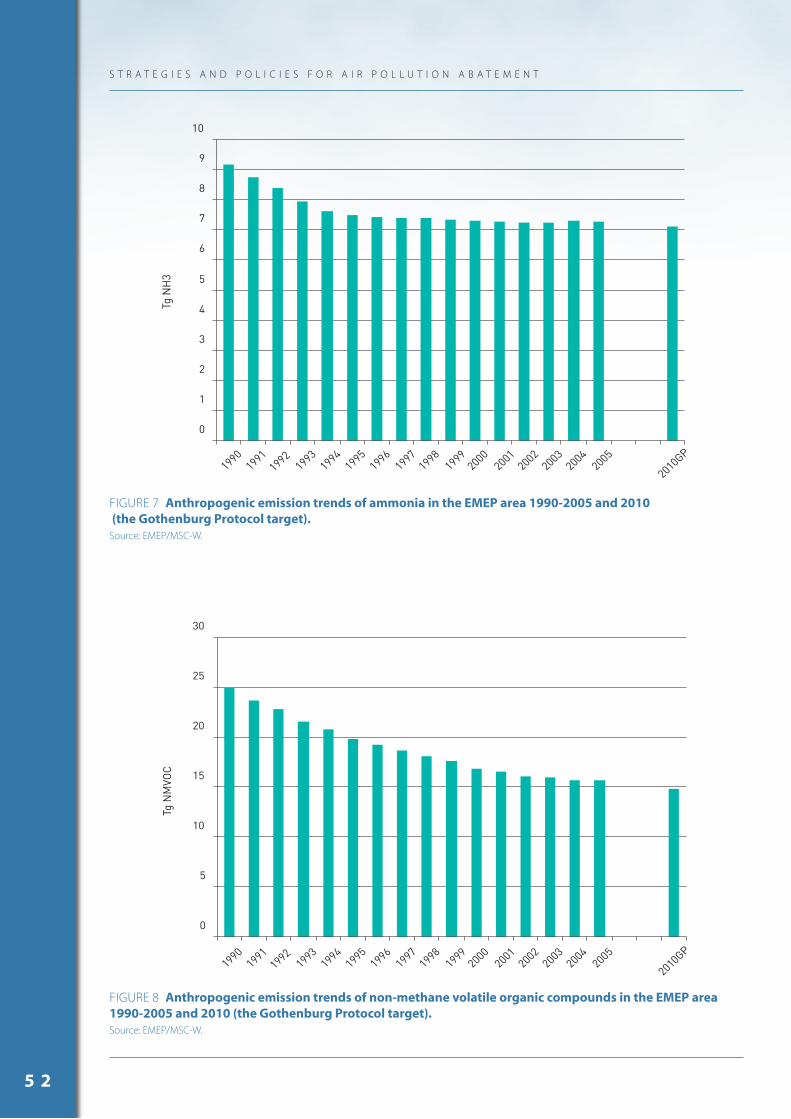
FIGURE 7 Anthropogenic emission trends of ammonia in the EMEP area 1990-2005 and 2010 (the Gothenburg Protocol target).Source: EMEP/MSC-W.
FIGURE 8 Anthropogenic emission trends of non-methane volatile organic compounds in the EMEP area 1990-2005 and 2010 (the Gothenburg Protocol target). Source: EMEP/MSC-W.
0
5
10
15
20
25
30
Tg N
MVO
C
19901991
19921993
19941995
19961997
19981999
20002001
20022003
20042005
2010GP
0
1
2
3
4
5
6
7
8
9
10
Tg N
H3
19901991
19921993
19941995
19961997
19981999
20002001
20022003
20042005
2010GP
S T R A T E G I E S A N D P O L I C I E S F O R A I R P O L L U T I O N A B A T E M E N T
5 2
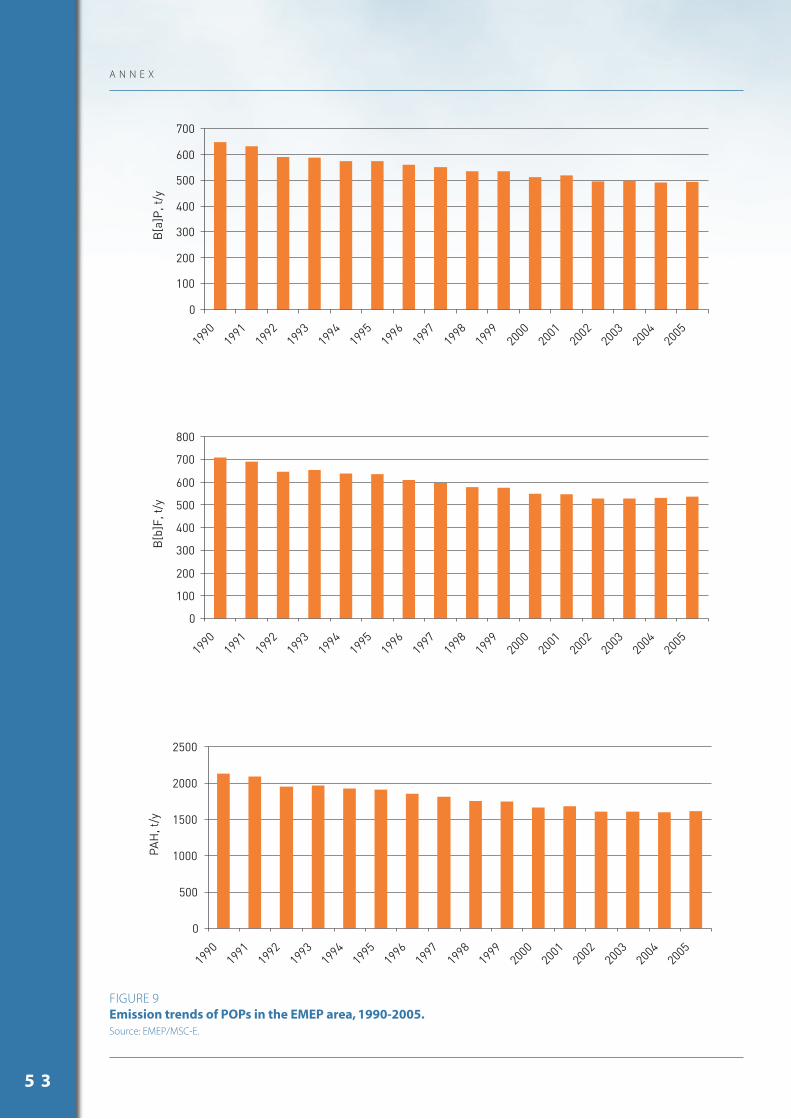
A N N E X
FIGURE 9Emission trends of POPs in the EMEP area, 1990-2005. Source: EMEP/MSC-E.
0
100
200
300
400
500
600
700
1990
1991
1992
1993
1994
1995
1996
1997
1998
1999
2000
2001
2002
2003
2004
2005
B[a
]P, t
/y
0
100
200
300
400
500
600
700
800
1990
1991
1992
1993
1994
1995
1996
1997
1998
1999
2000
2001
2002
2003
2004
2005
B[b
]F, t
/y
0
500
1000
1500
2000
2500
1990
1991
1992
1993
1994
1995
1996
1997
1998
1999
2000
2001
2002
2003
2004
2005
PAH
, t/y
5 3
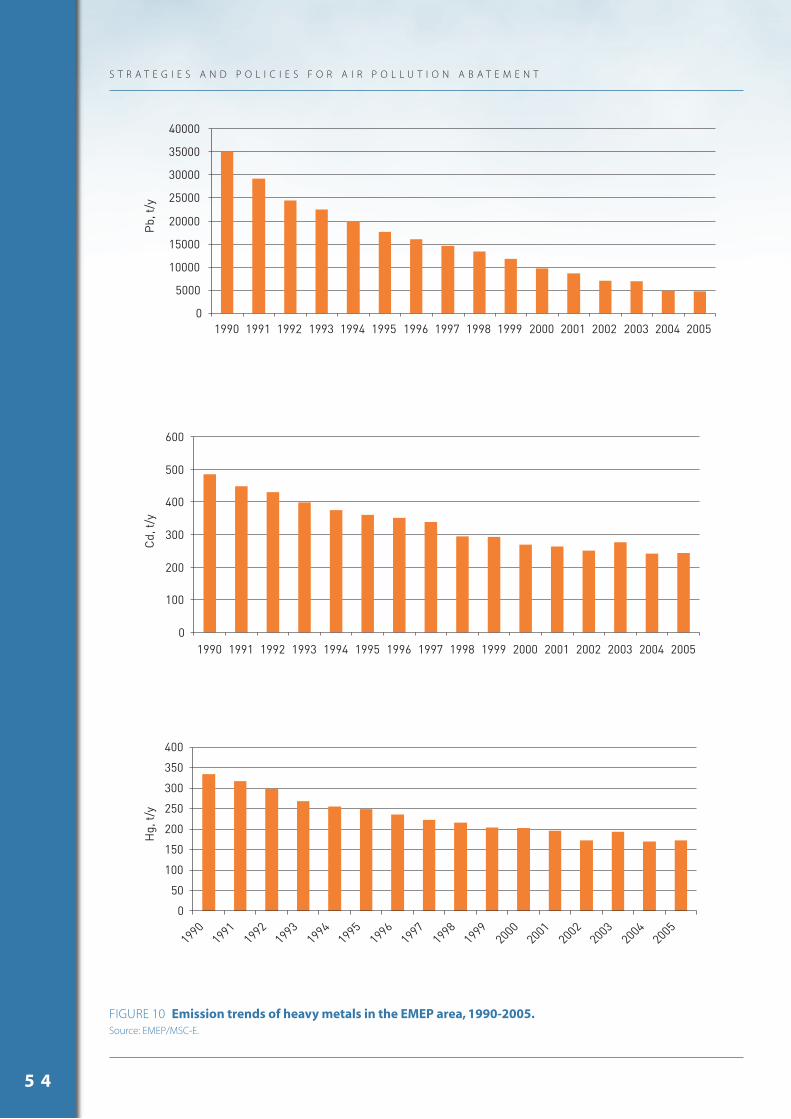
FIGURE 10 Emission trends of heavy metals in the EMEP area, 1990-2005. Source: EMEP/MSC-E.
0
5000
10000
15000
20000
25000
30000
35000
40000
1990 1991 1992 1993 1994 1995 1996 1997 1998 1999 2000 2001 2002 2003 2004 2005
Pb,
t/y
0
100
200
300
400
500
600
1990 1991 1992 1993 1994 1995 1996 1997 1998 1999 2000 2001 2002 2003 2004 2005
Cd,
t/y
0
50
100
150
200
250
300
350
400
19901991
19921993
19941995
19961997
19981999
20002001
20022003
20042005
Hg,
t/y
S T R A T E G I E S A N D P O L I C I E S F O R A I R P O L L U T I O N A B A T E M E N T
5 4
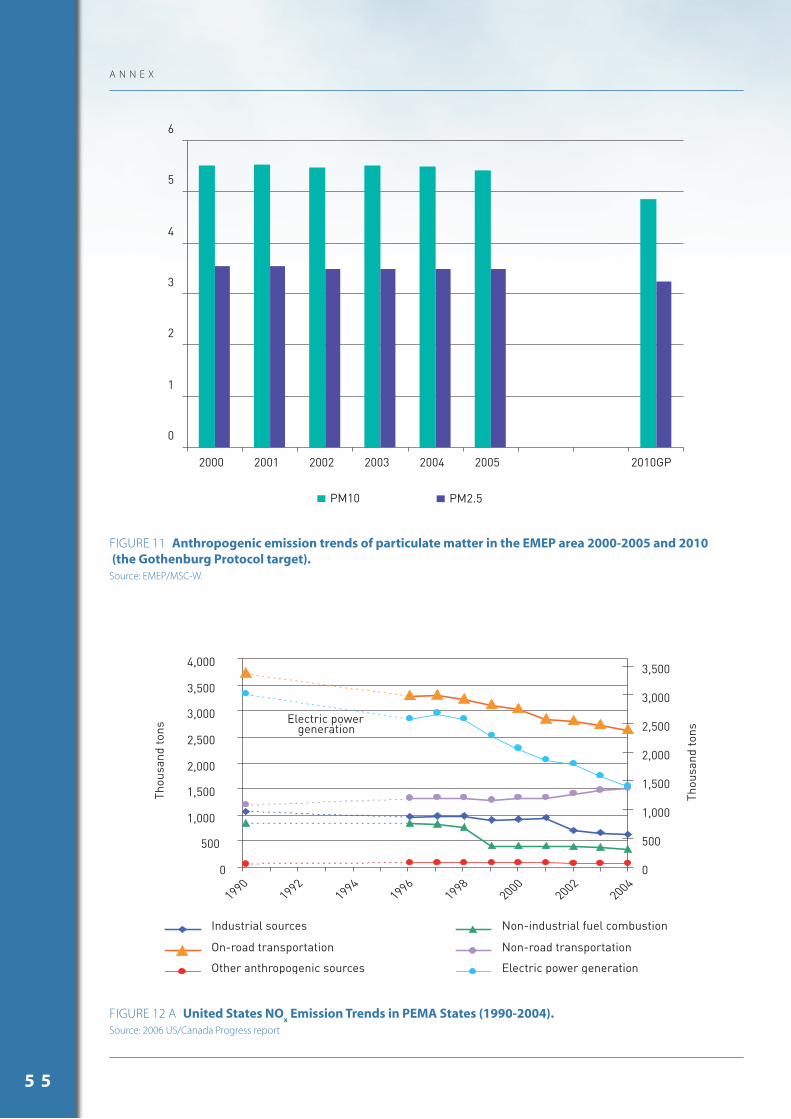
FIGURE 11 Anthropogenic emission trends of particulate matter in the EMEP area 2000-2005 and 2010 (the Gothenburg Protocol target). Source: EMEP/MSC-W.
FIGURE 12 A United States NOx Emission Trends in PEMA States (1990-2004).
Source: 2006 US/Canada Progress report
0
1
2
3
4
5
6
2000 2001 2002 2003 2004 2005 2010GP
PM10 PM2.5
Electric power generation
0
500
1,000
1,500
2,000
2,500
3,000
3,500
4,000
19901992
19941996
19982000
20022004
0
500
1,000
1,500
2,000
2,500
3,000
3,500
Industrial sources Non-industrial fuel combustion
On-road transportation Non-road transportation
Other anthropogenic sources Electric power generation
Thou
sand
tons
Thou
sand
tons
A N N E X
5 5
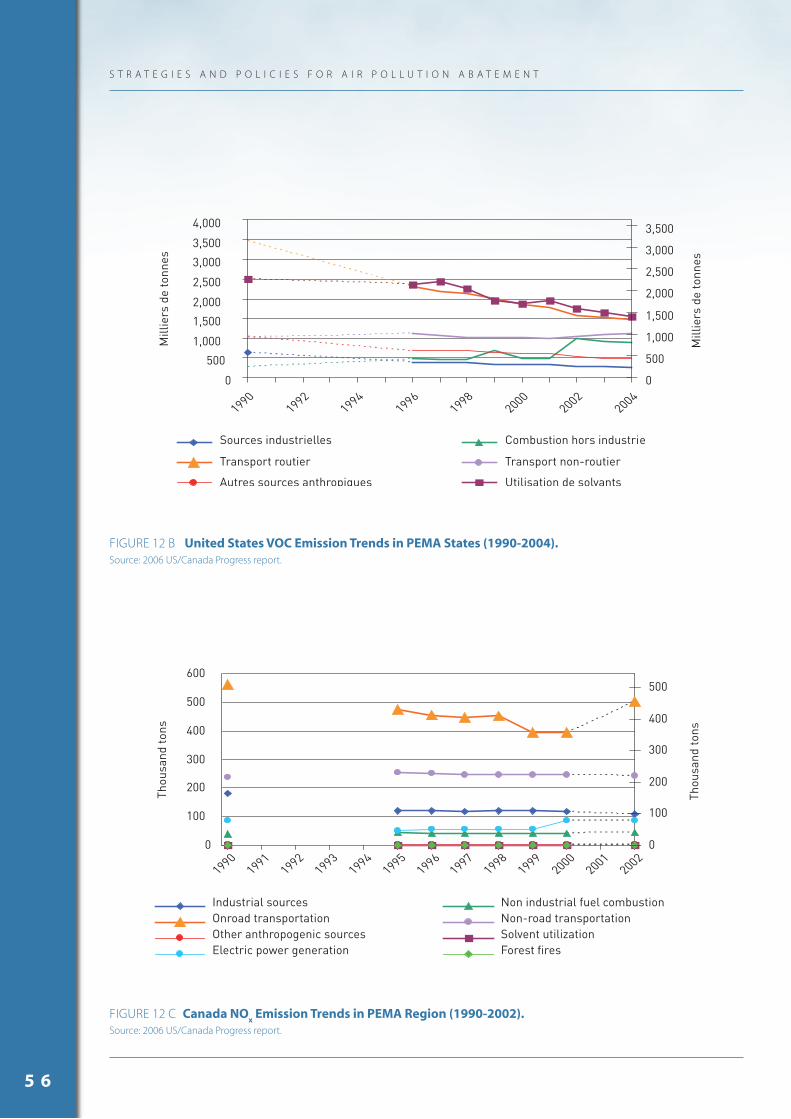
FIGURE 12 B United States VOC Emission Trends in PEMA States (1990-2004). Source: 2006 US/Canada Progress report.
FIGURE 12 C Canada NOx Emission Trends in PEMA Region (1990-2002).
Source: 2006 US/Canada Progress report.
0
500
1,000
1,500
2,000
2,500
3,000
3,500
4,000
19901992
19941996
19982000
20022004
0
500
1,000
1,500
2,000
2,500
3,000
3,500
Mill
iers
de
tonn
es
Mill
iers
de
tonn
es
Sources industrielles Combustion hors industrie
Transport routier Transport non-routier
Autres sources anthropiques Utilisation de solvants
0
100
200
300
400
500
600
19901991
19921993
19941995
19961997
19981999
20002001
20020
100
200
300
400
500
Industrial sources Non industrial fuel combustionOnroad transportation Non-road transportationOther anthropogenic sources Solvent utilizationElectric power generation Forest fires
Thou
sand
tons
Thou
sand
tons
S T R A T E G I E S A N D P O L I C I E S F O R A I R P O L L U T I O N A B A T E M E N T
5 6
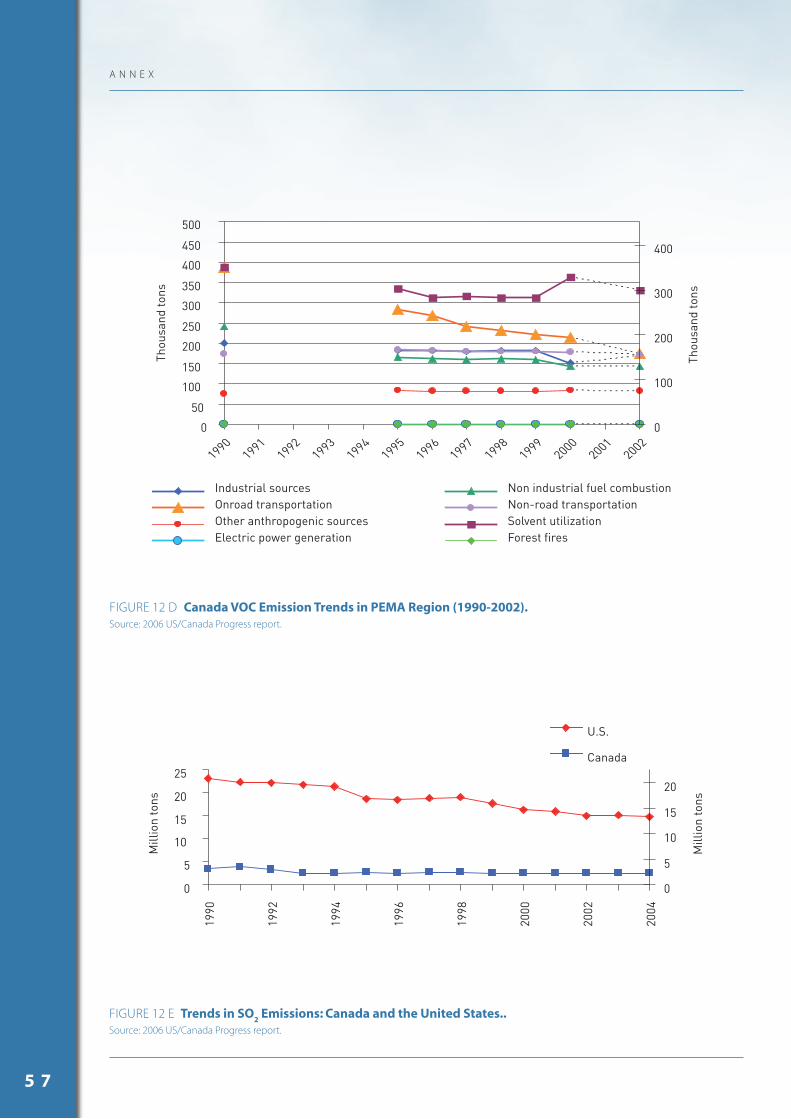
FIGURE 12 D Canada VOC Emission Trends in PEMA Region (1990-2002). Source: 2006 US/Canada Progress report.
FIGURE 12 E Trends in SO2 Emissions: Canada and the United States..
Source: 2006 US/Canada Progress report.
0
50
100
150
200
250
300
350
400
450
500
19901991
19921993
19941995
19961997
19981999
20002001
2002
Thou
sand
tons
0
100
200
300
400
Thou
sand
tons
Industrial sources Non industrial fuel combustionOnroad transportation Non-road transportationOther anthropogenic sources Solvent utilizationElectric power generation Forest fires
0
5
10
15
20
25
1990
1992
1994
1996
1998
2000
2002
2004
Mill
ion
tons
0
5
10
15
20
Mill
ion
tons
U.S.
Canada
A N N E X
5 7
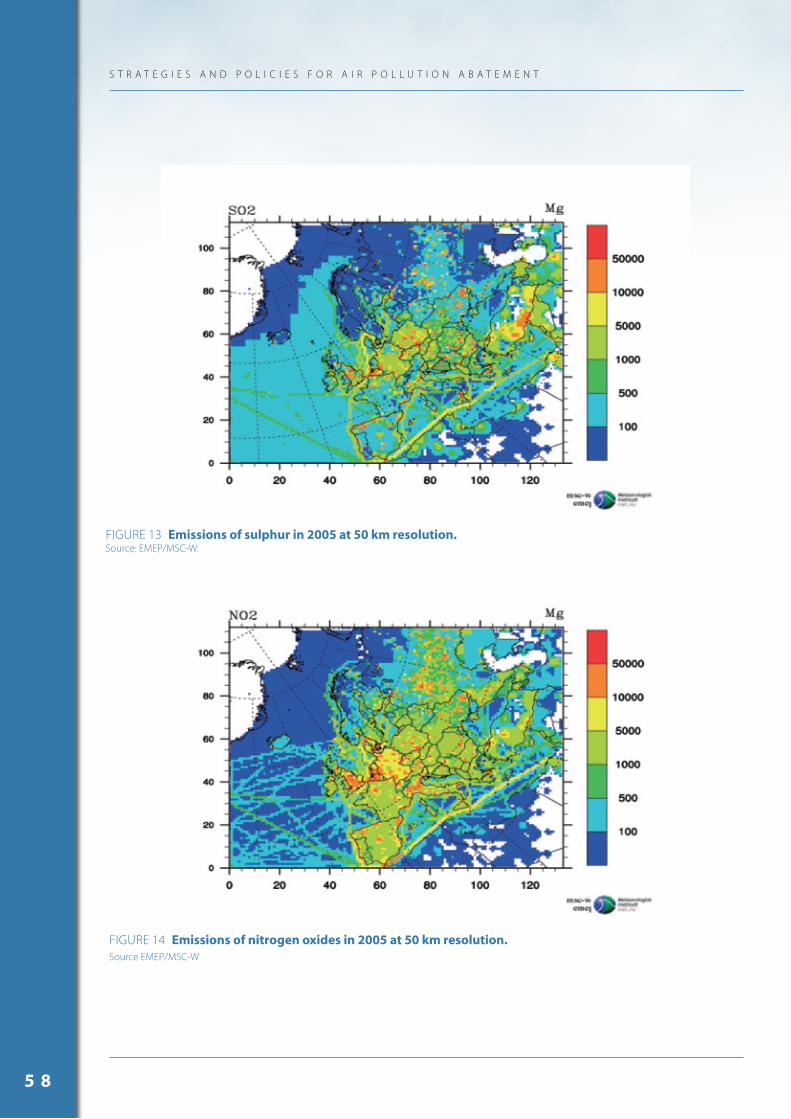
FIGURE 13 Emissions of sulphur in 2005 at 50 km resolution. Source: EMEP/MSC-W.
FIGURE 14 Emissions of nitrogen oxides in 2005 at 50 km resolution. Source EMEP/MSC-W
S T R A T E G I E S A N D P O L I C I E S F O R A I R P O L L U T I O N A B A T E M E N T
5 8
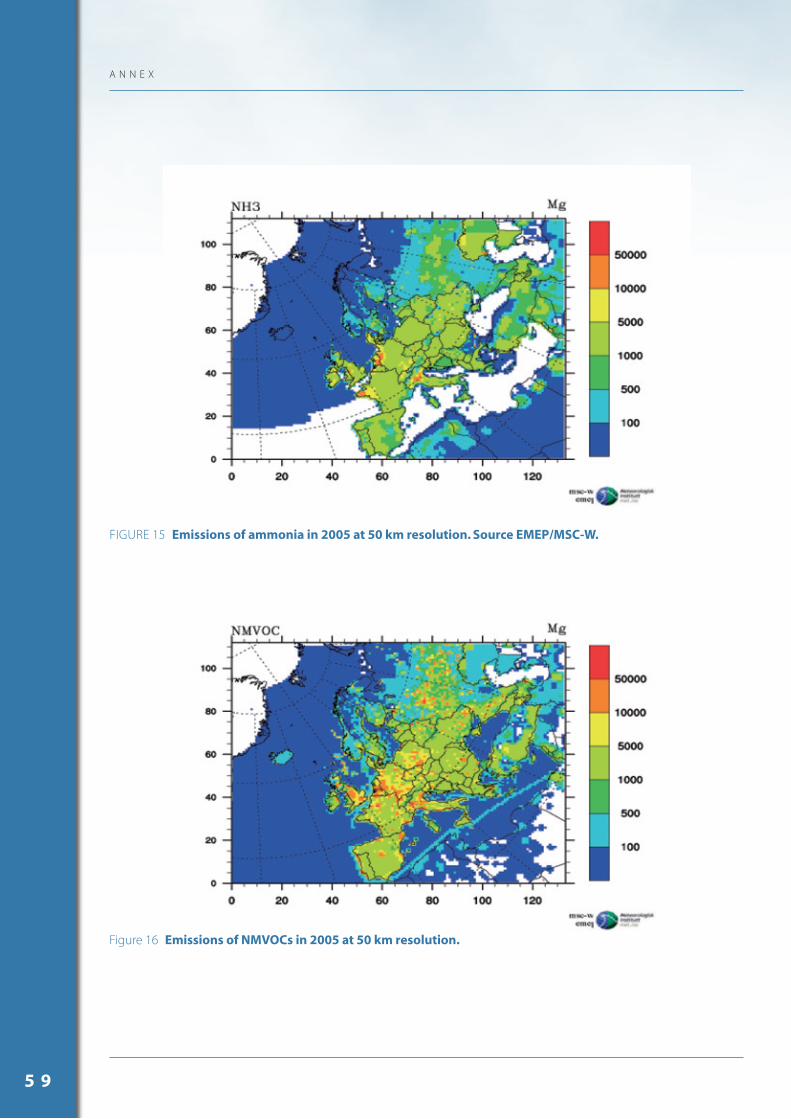
A N N E X
FIGURE 15 Emissions of ammonia in 2005 at 50 km resolution. Source EMEP/MSC-W.
Figure 16 Emissions of NMVOCs in 2005 at 50 km resolution.
5 9
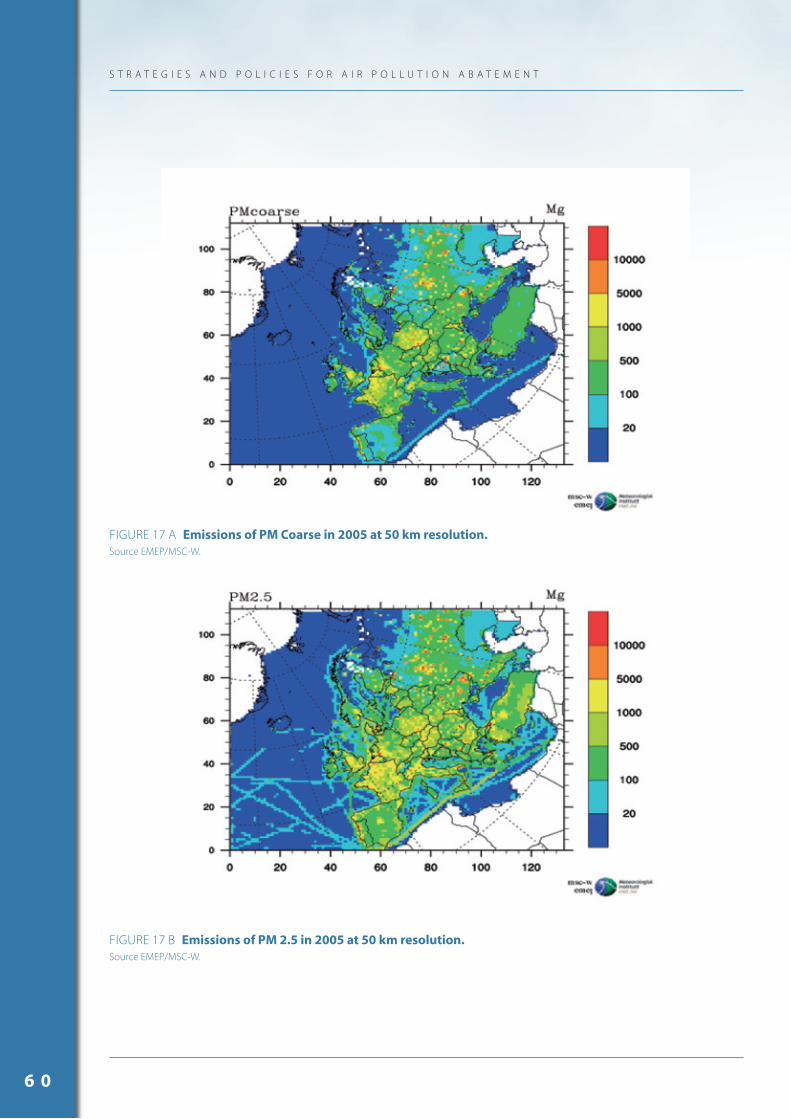
FIGURE 17 A Emissions of PM Coarse in 2005 at 50 km resolution. Source EMEP/MSC-W.
FIGURE 17 B Emissions of PM 2.5 in 2005 at 50 km resolution. Source EMEP/MSC-W.
S T R A T E G I E S A N D P O L I C I E S F O R A I R P O L L U T I O N A B A T E M E N T
6 0
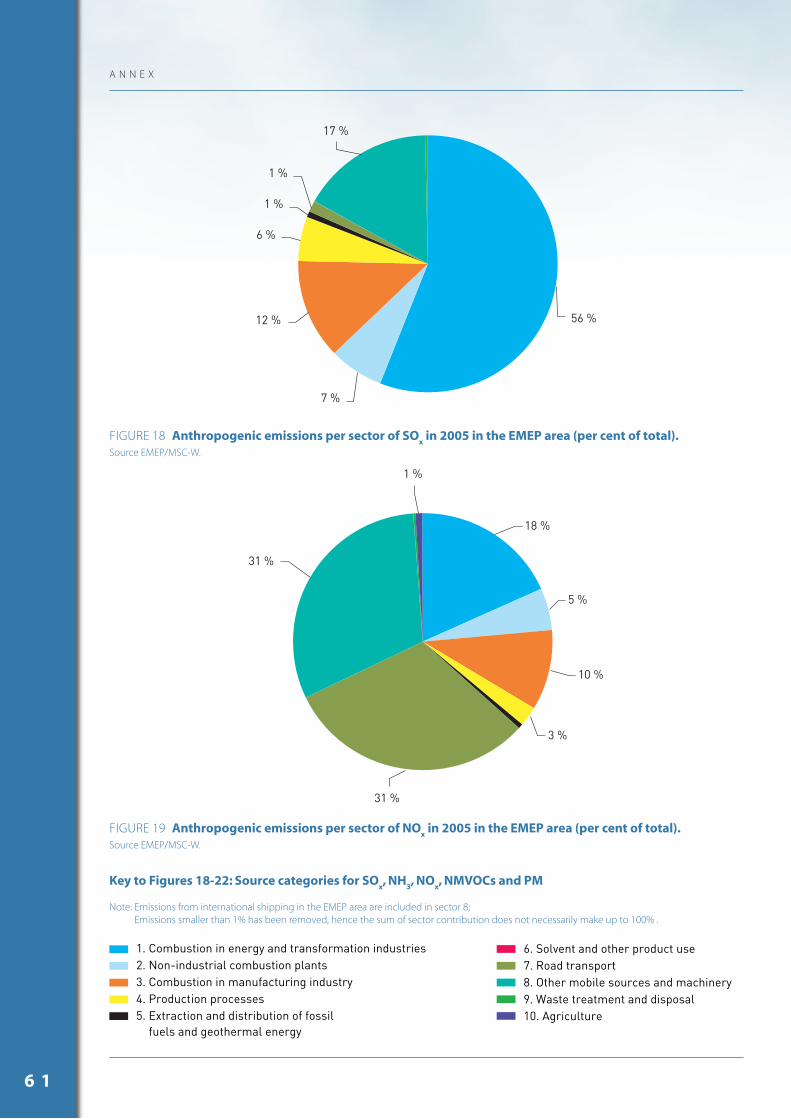
A N N E X
6 %
1 %
1 %
12 %
7 %
56 %
17 %
31 %
31 %
3 %
10 %
5 %
1 %
18 %
FIGURE 18 Anthropogenic emissions per sector of SOx in 2005 in the EMEP area (per cent of total).
Source EMEP/MSC-W.
FIGURE 19 Anthropogenic emissions per sector of NOx in 2005 in the EMEP area (per cent of total).
Source EMEP/MSC-W.
Key to Figures 18-22: Source categories for SOx, NH
3, NO
x, NMVOCs and PM
Note: Emissions from international shipping in the EMEP area are included in sector 8;Emissions smaller than 1% has been removed, hence the sum of sector contribution does not necessarily make up to 100% .
6 1
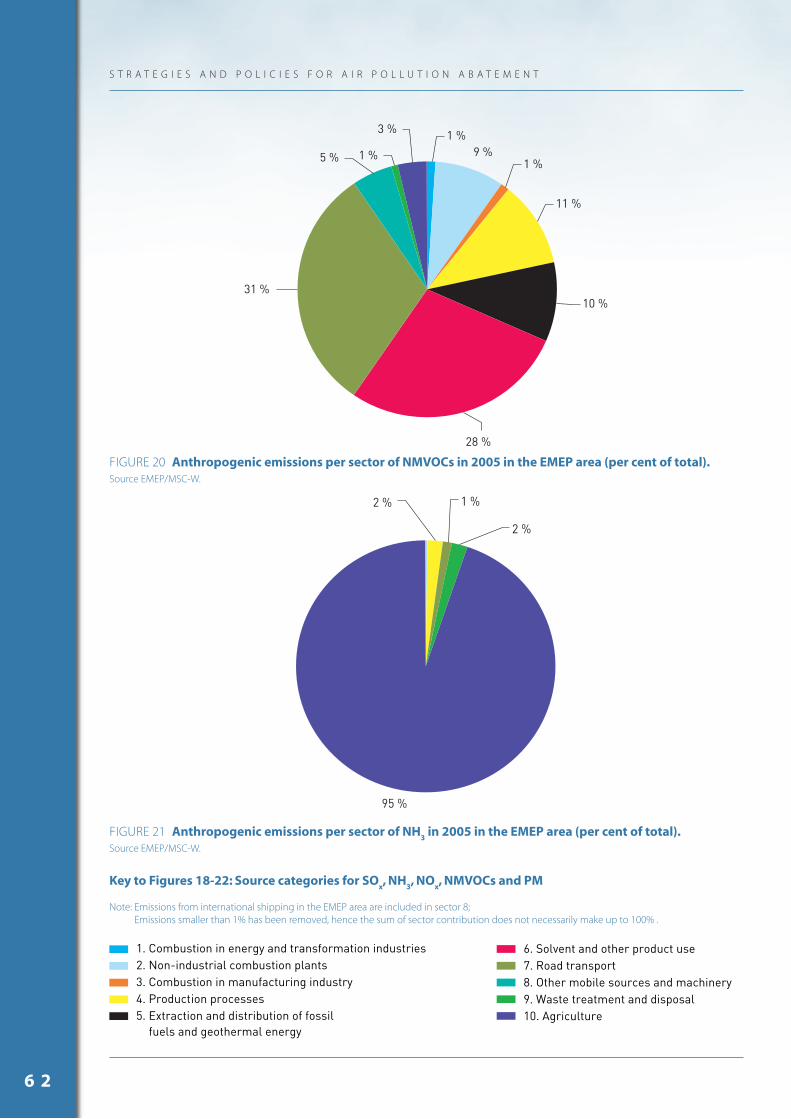
9 %1 %
3 %
5 %
31 %
28 %
10 %
11 %
1 %
1 %
95 %
2 %
2 %
1 %
Key to Figures 18-22: Source categories for SOx, NH
3, NO
x, NMVOCs and PM
Note: Emissions from international shipping in the EMEP area are included in sector 8;Emissions smaller than 1% has been removed, hence the sum of sector contribution does not necessarily make up to 100% .
Key to Figures 18-22: Source categories for SOx, NH
3, NO
x, NMVOCs and PM
Note: Emissions from international shipping in the EMEP area are included in sector 8;Emissions smaller than 1% has been removed, hence the sum of sector contribution does not necessarily make up to 100% .
FIGURE 20 Anthropogenic emissions per sector of NMVOCs in 2005 in the EMEP area (per cent of total). Source EMEP/MSC-W.
FIGURE 21 Anthropogenic emissions per sector of NH3 in 2005 in the EMEP area (per cent of total).
Source EMEP/MSC-W.
S T R A T E G I E S A N D P O L I C I E S F O R A I R P O L L U T I O N A B A T E M E N T
6 2
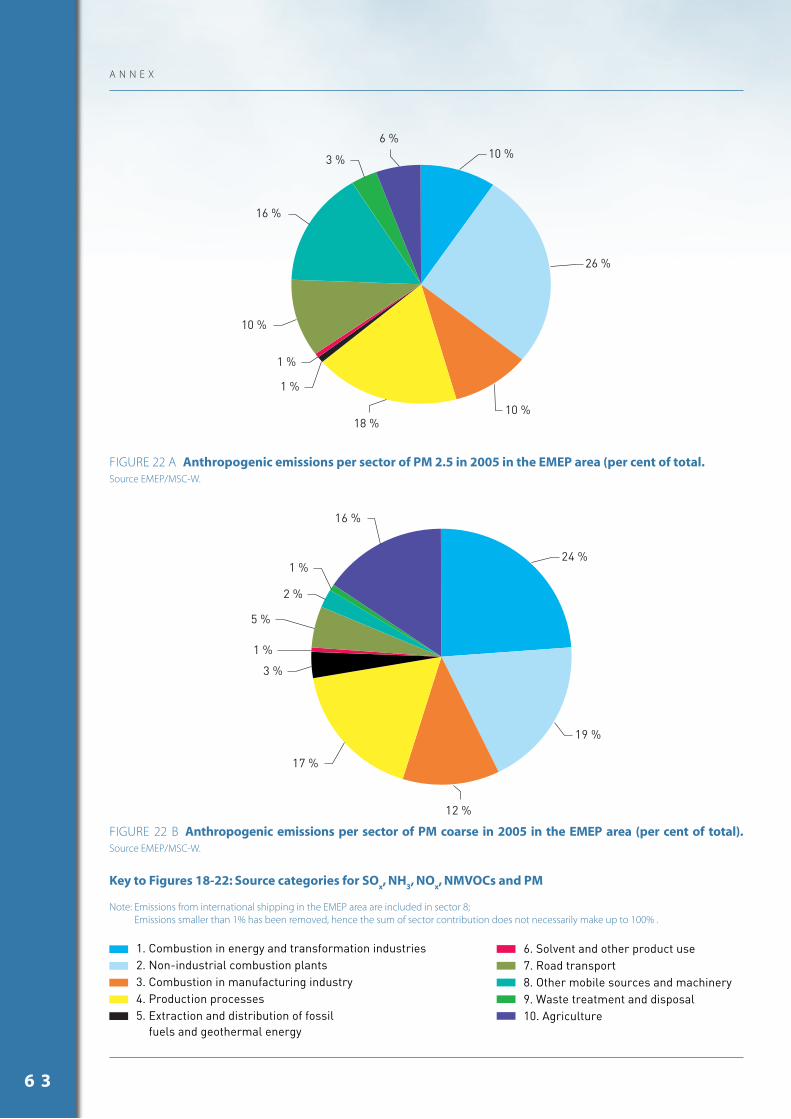
A N N E X
1 %
1 %
26 %
10 %18 %
10 %
16 %
3 %
6 %10 %
2 %
1 %
5 %
1 %
3 %
12 %
17 %
16 %
19 %
24 %
Key to Figures 18-22: Source categories for SOx, NH
3, NO
x, NMVOCs and PM
Note: Emissions from international shipping in the EMEP area are included in sector 8;Emissions smaller than 1% has been removed, hence the sum of sector contribution does not necessarily make up to 100% .
Key to Figures 18-22: Source categories for SOx, NH
3, NO
x, NMVOCs and PM
Note: Emissions from international shipping in the EMEP area are included in sector 8;Emissions smaller than 1% has been removed, hence the sum of sector contribution does not necessarily make up to 100% .
FIGURE 22 A Anthropogenic emissions per sector of PM 2.5 in 2005 in the EMEP area (per cent of total. Source EMEP/MSC-W.
FIGURE 22 B Anthropogenic emissions per sector of PM coarse in 2005 in the EMEP area (per cent of total). Source EMEP/MSC-W.
6 3
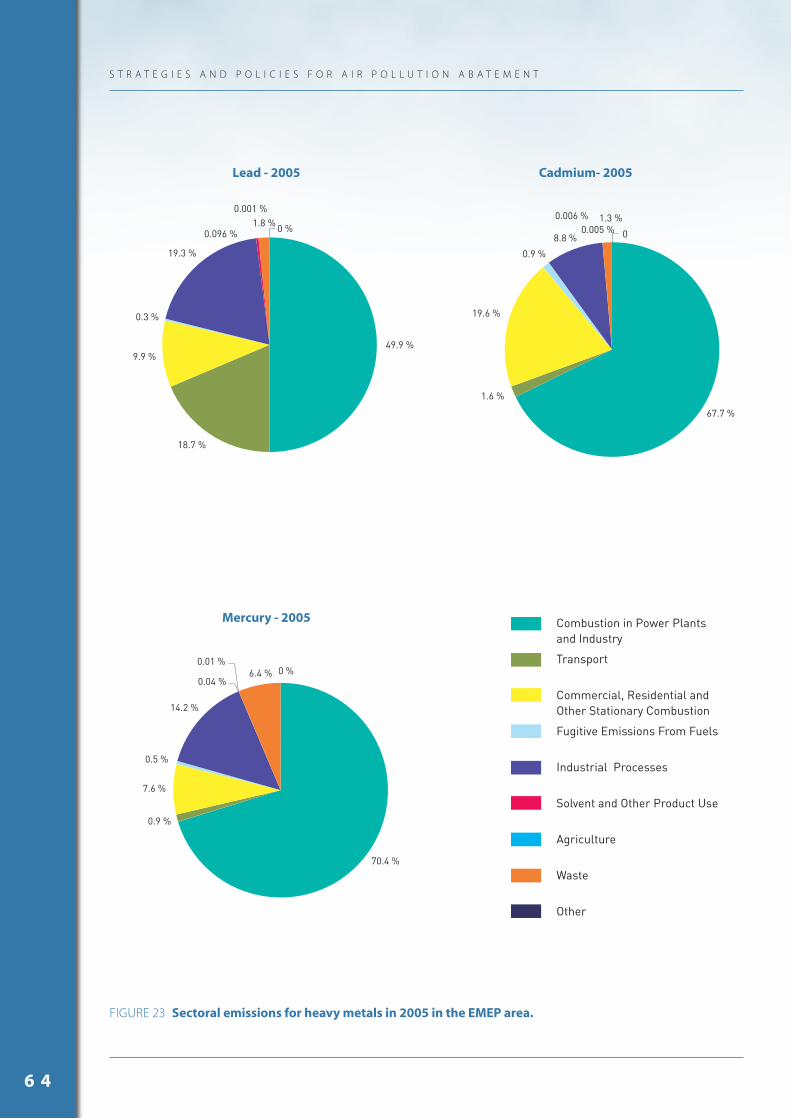
FIGURE 23 Sectoral emissions for heavy metals in 2005 in the EMEP area.
49.9 %
18.7 %
9.9 %
0.3 %
19.3 %
0.096 %
0.001 %1.8 % 0 %
67.7 %
1.6 %
19.6 %
0.9 %
8.8 %0.005 %
0.006 % 1.3 %
0
70.4 %
0.9 %
7.6 %
0.5 %
14.2 %
0.04 %
0.01 %6.4 % 0 %
Lead - 2005 Cadmium- 2005
Mercury - 2005 Combustion in Power Plantsand Industry
Transport
Commercial, Residential andOther Stationary Combustion
Fugitive Emissions From Fuels
Industrial Processes
Solvent and Other Product Use
Agriculture
Waste
Other
S T R A T E G I E S A N D P O L I C I E S F O R A I R P O L L U T I O N A B A T E M E N T
6 4
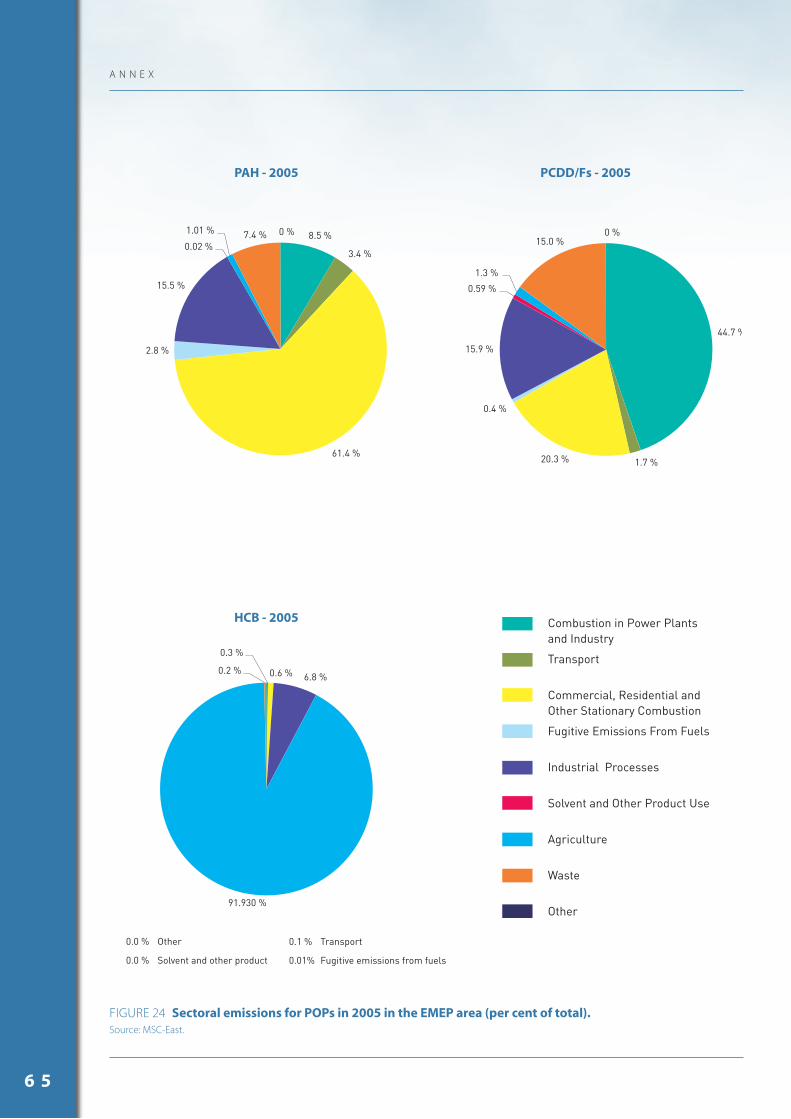
A N N E X
FIGURE 24 Sectoral emissions for POPs in 2005 in the EMEP area (per cent of total). Source: MSC-East.
8.5 %
3.4 %
61.4 %
2.8 %
15.5 %
0.02 %
1.01 % 7.4 % 0 %
44.7 %
1.7 %20.3 %
0.4 %
15.9 %
0.59 %
1.3 %
15.0 %0 %
0.0 %
0.0 %
0.1 %
0.01%
Other
Solvent and other product
Transport
Fugitive emissions from fuels
0.6 % 6.8 %
0.3 %
91.930 %
0.2 %
PAH - 2005 PCDD/Fs - 2005
HCB - 2005 Combustion in Power Plantsand Industry
Transport
Commercial, Residential andOther Stationary Combustion
Fugitive Emissions From Fuels
Industrial Processes
Solvent and Other Product Use
Agriculture
Waste
Other
6 5
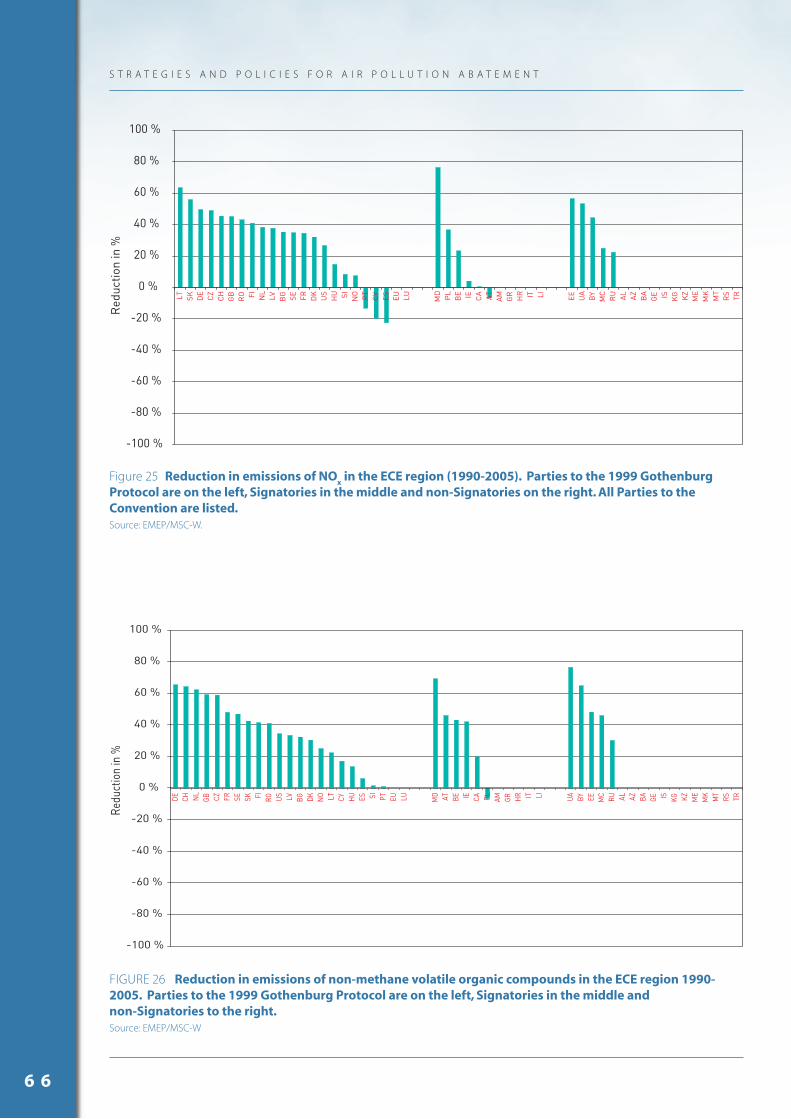
Figure 25 Reduction in emissions of NOx in the ECE region (1990-2005). Parties to the 1999 Gothenburg
Protocol are on the left, Signatories in the middle and non-Signatories on the right. All Parties to the Convention are listed. Source: EMEP/MSC-W.
FIGURE 26 Reduction in emissions of non-methane volatile organic compounds in the ECE region 1990-2005. Parties to the 1999 Gothenburg Protocol are on the left, Signatories in the middle and non-Signatories to the right.Source: EMEP/MSC-W
-100 %
-80 %
-60 %
-40 %
-20 %
0 %
20 %
40 %
60 %
80 %
100 %
DE CH NL
GB CZ FR SE SK FI RO US LV BG DK NO LT CY HU ES SI PT EU LU MD AT BE IE CA PL AM GR HR IT LI UA BY EE MC RU AL AZ BA GE IS KG KZ ME
MK
MT
RS TR
Redu
ctio
n in
%
-100 %
-80 %
-60 %
-40 %
-20 %
0 %
20 %
40 %
60 %
80 %
100 %
LT SK DE
CZ
CH
GB
RO FI NL
LV BG SE FR DK
US
HU SI NO PT
CY ES EU LU MD PL
BE IE CA AT AM GR HR IT LI EE UA
BY
MC
RU AL AZ BA
GE IS KG KZ
ME
MK
MT
RS TR
Red
uctio
n in
%
S T R A T E G I E S A N D P O L I C I E S F O R A I R P O L L U T I O N A B A T E M E N T
6 6
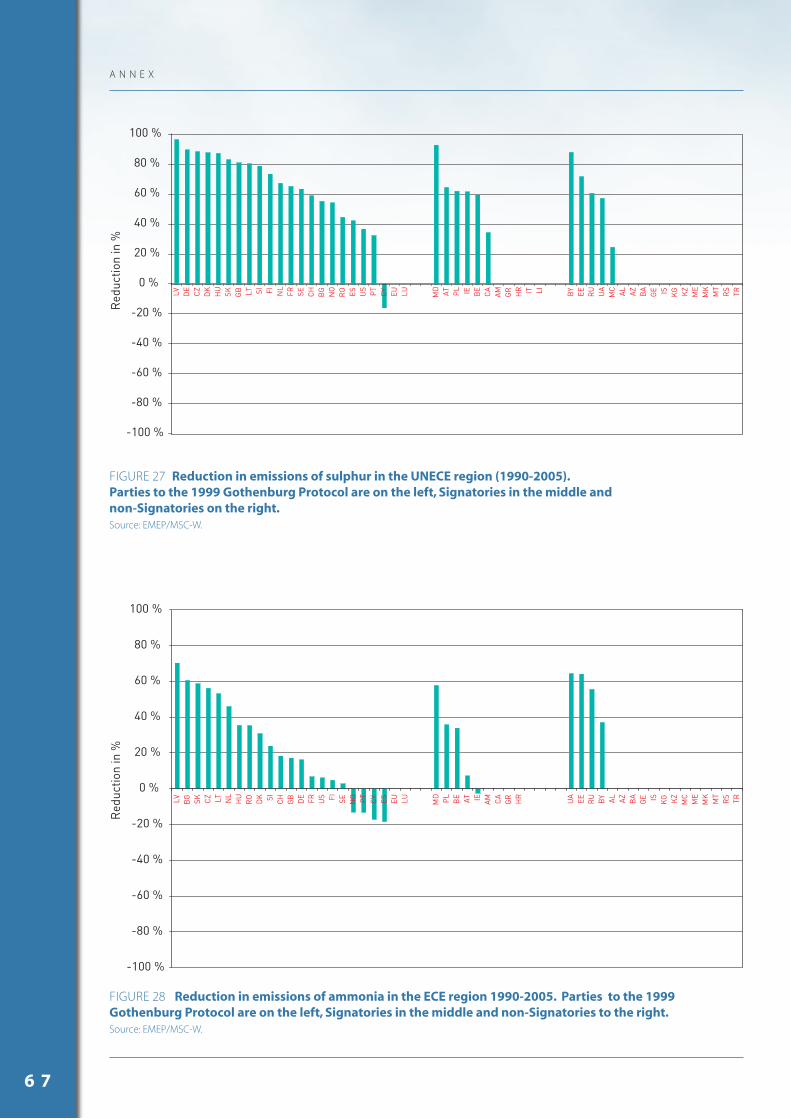
A N N E X
FIGURE 27 Reduction in emissions of sulphur in the UNECE region (1990-2005).Parties to the 1999 Gothenburg Protocol are on the left, Signatories in the middle and non-Signatories on the right. Source: EMEP/MSC-W.
FIGURE 28 Reduction in emissions of ammonia in the ECE region 1990-2005. Parties to the 1999 Gothenburg Protocol are on the left, Signatories in the middle and non-Signatories to the right. Source: EMEP/MSC-W.
-100 %
-80 %
-60 %
-40 %
-20 %
0 %
20 %
40 %
60 %
80 %
100 %
LV DE
CZ
DK
HU
SK GB LT SI FI NL
FR SE CH
BG
NO
RO ES US PT
CY
EU LU MD AT PL IE BE
CA
AM GR HR IT LI BY
EE RU UA
MC AL AZ BA
GE IS KG KZ
ME
MK
MT
RS TR
Red
uctio
n in
%
-100 %
-80 %
-60 %
-40 %
-20 %
0 %
20 %
40 %
60 %
80 %
100 %
LV BG SK CZ LT NL
HU
RO DK SI CH
GB DE FR US FI SE NO PT
CY ES EU LU MD PL
BE AT IE AM CA
GR HR IT LI UA
EE RU BY AL AZ BA
GE IS KG KZ
MC
ME
MK
MT
RS TR
Red
uctio
n in
%
6 7
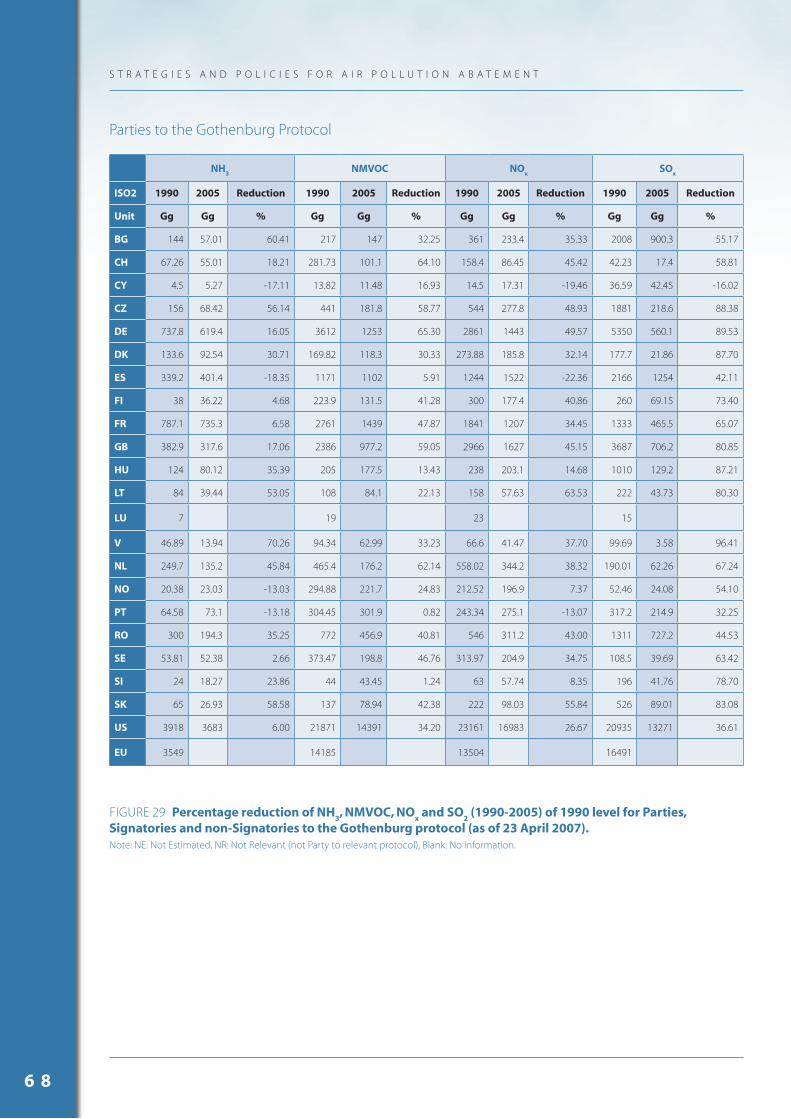
Parties to the Gothenburg Protocol
NH3
NMVOC NOx
SOx
ISO2 1990 2005 Reduction 1990 2005 Reduction 1990 2005 Reduction 1990 2005 Reduction
Unit Gg Gg % Gg Gg % Gg Gg % Gg Gg %
BG 144 57.01 60.41 217 147 32.25 361 233.4 35.33 2008 900.3 55.17
CH 67.26 55.01 18.21 281.73 101.1 64.10 158.4 86.45 45.42 42.23 17.4 58.81
CY 4.5 5.27 -17.11 13.82 11.48 16.93 14.5 17.31 -19.46 36.59 42.45 -16.02
CZ 156 68.42 56.14 441 181.8 58.77 544 277.8 48.93 1881 218.6 88.38
DE 737.8 619.4 16.05 3612 1253 65.30 2861 1443 49.57 5350 560.1 89.53
DK 133.6 92.54 30.71 169.82 118.3 30.33 273.88 185.8 32.14 177.7 21.86 87.70
ES 339.2 401.4 -18.35 1171 1102 5.91 1244 1522 -22.36 2166 1254 42.11
FI 38 36.22 4.68 223.9 131.5 41.28 300 177.4 40.86 260 69.15 73.40
FR 787.1 735.3 6.58 2761 1439 47.87 1841 1207 34.45 1333 465.5 65.07
GB 382.9 317.6 17.06 2386 977.2 59.05 2966 1627 45.15 3687 706.2 80.85
HU 124 80.12 35.39 205 177.5 13.43 238 203.1 14.68 1010 129.2 87.21
LT 84 39.44 53.05 108 84.1 22.13 158 57.63 63.53 222 43.73 80.30
LU 7 19 23 15
V 46.89 13.94 70.26 94.34 62.99 33.23 66.6 41.47 37.70 99.69 3.58 96.41
NL 249.7 135.2 45.84 465.4 176.2 62.14 558.02 344.2 38.32 190.01 62.26 67.24
NO 20.38 23.03 -13.03 294.88 221.7 24.83 212.52 196.9 7.37 52.46 24.08 54.10
PT 64.58 73.1 -13.18 304.45 301.9 0.82 243.34 275.1 -13.07 317.2 214.9 32.25
RO 300 194.3 35.25 772 456.9 40.81 546 311.2 43.00 1311 727.2 44.53
SE 53.81 52.38 2.66 373.47 198.8 46.76 313.97 204.9 34.75 108.5 39.69 63.42
SI 24 18.27 23.86 44 43.45 1.24 63 57.74 8.35 196 41.76 78.70
SK 65 26.93 58.58 137 78.94 42.38 222 98.03 55.84 526 89.01 83.08
US 3918 3683 6.00 21871 14391 34.20 23161 16983 26.67 20935 13271 36.61
EU 3549 14185 13504 16491
FIGURE 29 Percentage reduction of NH3, NMVOC, NO
x and SO
2 (1990-2005) of 1990 level for Parties,
Signatories and non-Signatories to the Gothenburg protocol (as of 23 April 2007). Note: NE: Not Estimated, NR: Not Relevant (not Party to relevant protocol), Blank: No information.
S T R A T E G I E S A N D P O L I C I E S F O R A I R P O L L U T I O N A B A T E M E N T
6 8
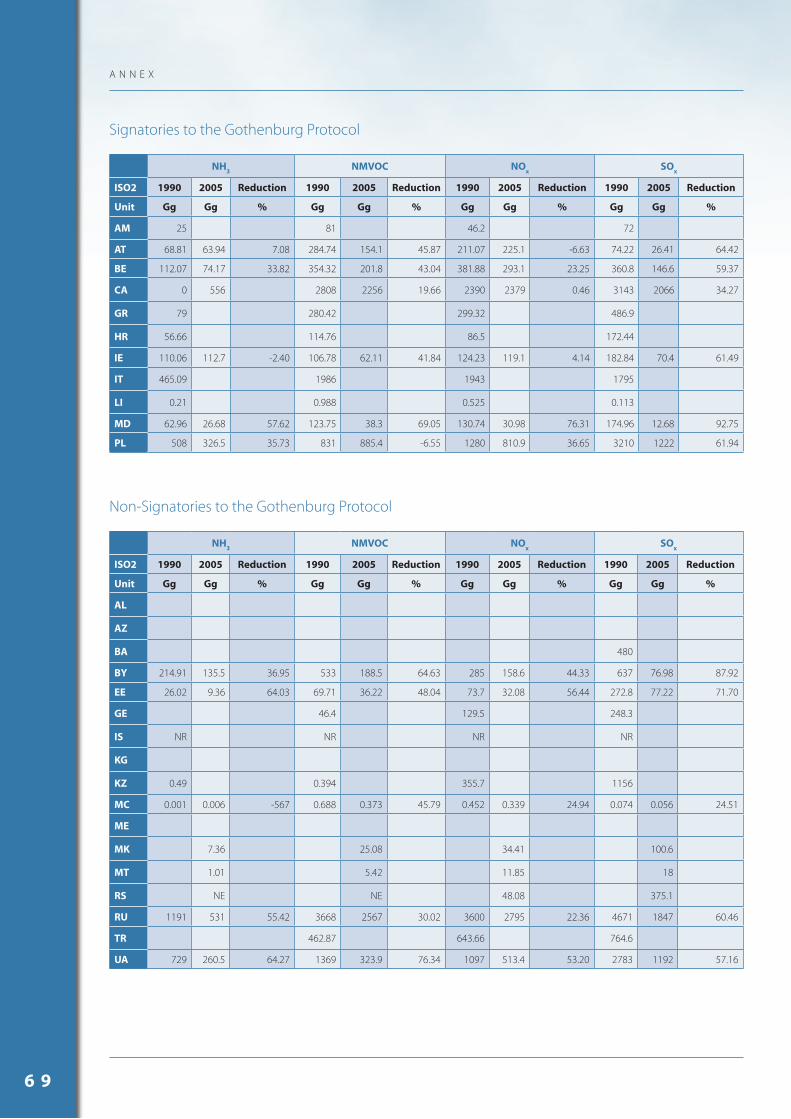
A N N E X
Signatories to the Gothenburg Protocol
NH3
NMVOC NOx
SOx
ISO2 1990 2005 Reduction 1990 2005 Reduction 1990 2005 Reduction 1990 2005 Reduction
Unit Gg Gg % Gg Gg % Gg Gg % Gg Gg %
AM 25 81 46.2 72
AT 68.81 63.94 7.08 284.74 154.1 45.87 211.07 225.1 -6.63 74.22 26.41 64.42
BE 112.07 74.17 33.82 354.32 201.8 43.04 381.88 293.1 23.25 360.8 146.6 59.37
CA 0 556 2808 2256 19.66 2390 2379 0.46 3143 2066 34.27
GR 79 280.42 299.32 486.9
HR 56.66 114.76 86.5 172.44
IE 110.06 112.7 -2.40 106.78 62.11 41.84 124.23 119.1 4.14 182.84 70.4 61.49
IT 465.09 1986 1943 1795
LI 0.21 0.988 0.525 0.113
MD 62.96 26.68 57.62 123.75 38.3 69.05 130.74 30.98 76.31 174.96 12.68 92.75
PL 508 326.5 35.73 831 885.4 -6.55 1280 810.9 36.65 3210 1222 61.94
Non-Signatories to the Gothenburg Protocol
NH3
NMVOC NOx
SOx
ISO2 1990 2005 Reduction 1990 2005 Reduction 1990 2005 Reduction 1990 2005 Reduction
Unit Gg Gg % Gg Gg % Gg Gg % Gg Gg %
AL
AZ
BA 480
BY 214.91 135.5 36.95 533 188.5 64.63 285 158.6 44.33 637 76.98 87.92
EE 26.02 9.36 64.03 69.71 36.22 48.04 73.7 32.08 56.44 272.8 77.22 71.70
GE 46.4 129.5 248.3
IS NR NR NR NR
KG
KZ 0.49 0.394 355.7 1156
MC 0.001 0.006 -567 0.688 0.373 45.79 0.452 0.339 24.94 0.074 0.056 24.51
ME
MK 7.36 25.08 34.41 100.6
MT 1.01 5.42 11.85 18
RS NE NE 48.08 375.1
RU 1191 531 55.42 3668 2567 30.02 3600 2795 22.36 4671 1847 60.46
TR 462.87 643.66 764.6
UA 729 260.5 64.27 1369 323.9 76.34 1097 513.4 53.20 2783 1192 57.16
6 9
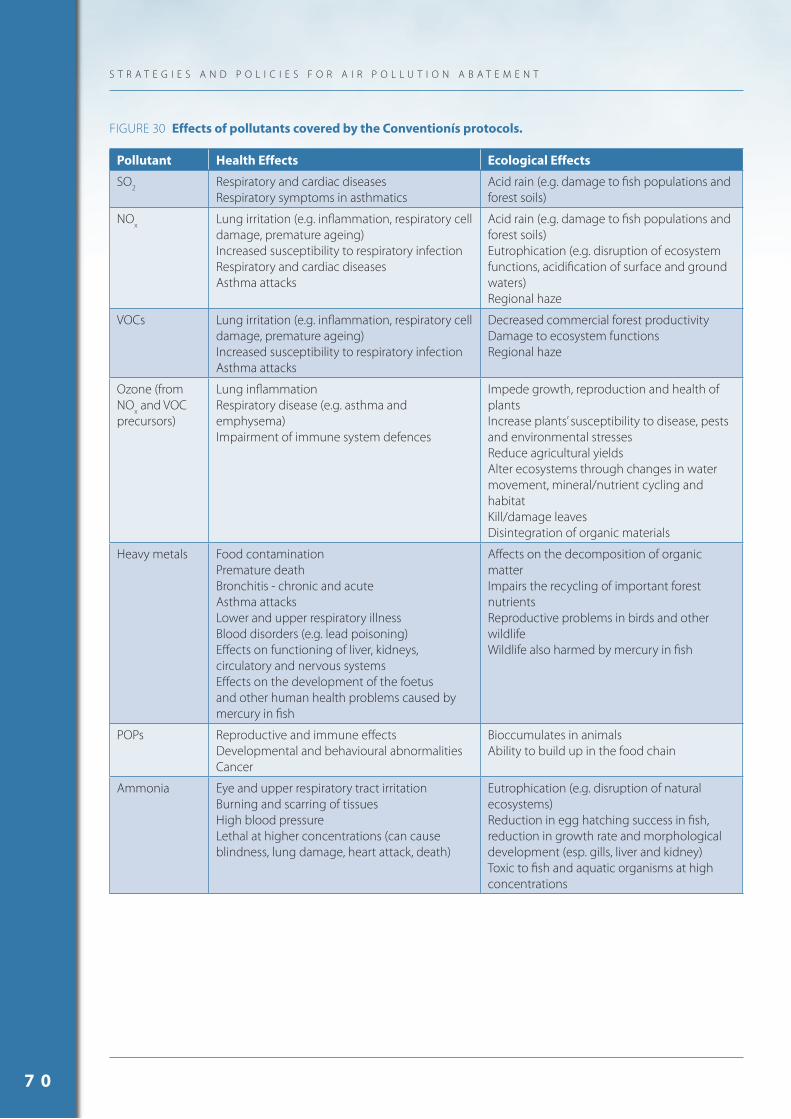
FIGURE 30 Effects of pollutants covered by the Conventionís protocols.
Pollutant Health Effects Ecological Effects
SO2 Respiratory and cardiac diseasesRespiratory symptoms in asthmatics
Acid rain (e.g. damage to fi sh populations and forest soils)
NOx Lung irritation (e.g. infl ammation, respiratory cell damage, premature ageing)Increased susceptibility to respiratory infectionRespiratory and cardiac diseasesAsthma attacks
Acid rain (e.g. damage to fi sh populations and forest soils)Eutrophication (e.g. disruption of ecosystem functions, acidifi cation of surface and ground waters)Regional haze
VOCs Lung irritation (e.g. infl ammation, respiratory cell damage, premature ageing)Increased susceptibility to respiratory infectionAsthma attacks
Decreased commercial forest productivityDamage to ecosystem functionsRegional haze
Ozone (from NOx and VOC precursors)
Lung infl ammation Respiratory disease (e.g. asthma and emphysema)Impairment of immune system defences
Impede growth, reproduction and health of plantsIncrease plants’ susceptibility to disease, pests and environmental stressesReduce agricultural yieldsAlter ecosystems through changes in water movement, mineral/nutrient cycling and habitatKill/damage leavesDisintegration of organic materials
Heavy metals Food contamination Premature deathBronchitis - chronic and acute Asthma attacksLower and upper respiratory illnessBlood disorders (e.g. lead poisoning)Eff ects on functioning of liver, kidneys, circulatory and nervous systemsEff ects on the development of the foetus and other human health problems caused by mercury in fi sh
Aff ects on the decomposition of organic matterImpairs the recycling of important forest nutrientsReproductive problems in birds and other wildlifeWildlife also harmed by mercury in fi sh
POPs Reproductive and immune eff ectsDevelopmental and behavioural abnormalitiesCancer
Bioccumulates in animals Ability to build up in the food chain
Ammonia Eye and upper respiratory tract irritation Burning and scarring of tissuesHigh blood pressureLethal at higher concentrations (can cause blindness, lung damage, heart attack, death)
Eutrophication (e.g. disruption of natural ecosystems)Reduction in egg hatching success in fi sh, reduction in growth rate and morphological development (esp. gills, liver and kidney)Toxic to fi sh and aquatic organisms at high concentrations
S T R A T E G I E S A N D P O L I C I E S F O R A I R P O L L U T I O N A B A T E M E N T
7 0
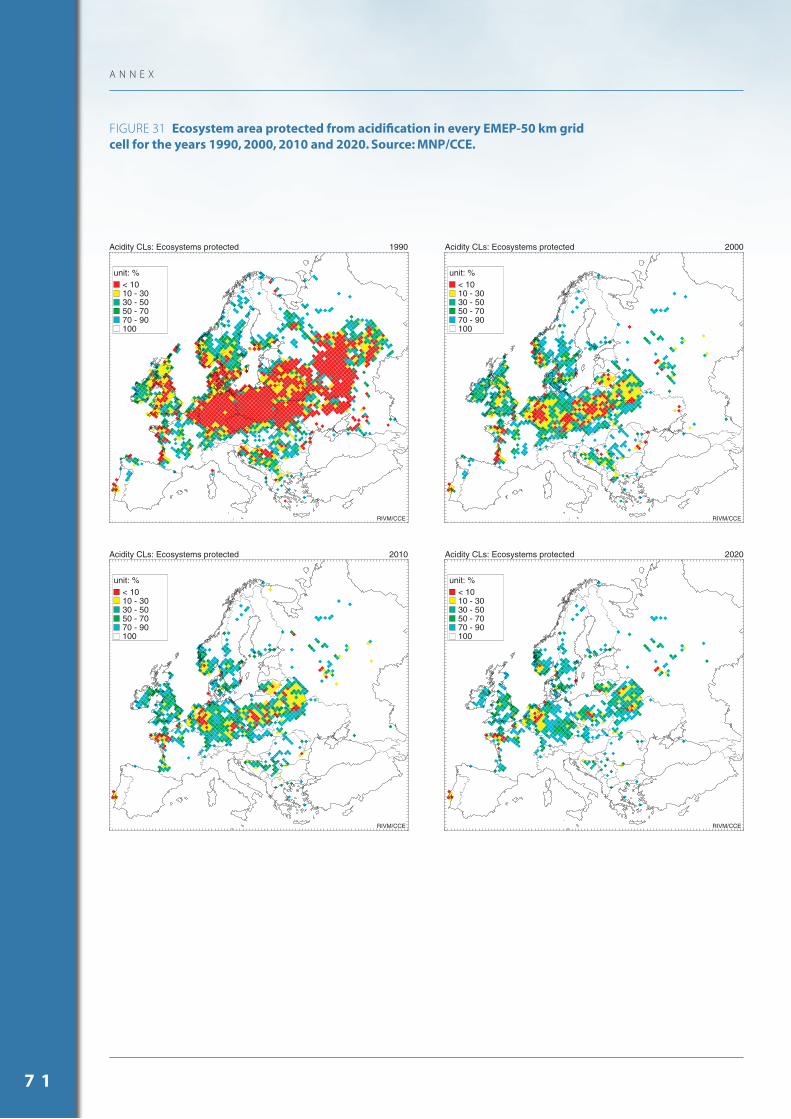
unit: %< 1010 - 3030 - 5050 - 7070 - 90100
Acidity CLs: Ecosystems protected 1990
RIVM/CCE
unit: %< 1010 - 3030 - 5050 - 7070 - 90100
Acidity CLs: Ecosystems protected 2000
RIVM/CCE
unit: %< 1010 - 3030 - 5050 - 7070 - 90100
Acidity CLs: Ecosystems protected 2010
RIVM/CCE
unit: %< 1010 - 3030 - 5050 - 7070 - 90100
Acidity CLs: Ecosystems protected 2020
RIVM/CCE
FIGURE 31 Ecosystem area protected from acidifi cation in every EMEP-50 km grid cell for the years 1990, 2000, 2010 and 2020. Source: MNP/CCE.
A N N E X
7 1
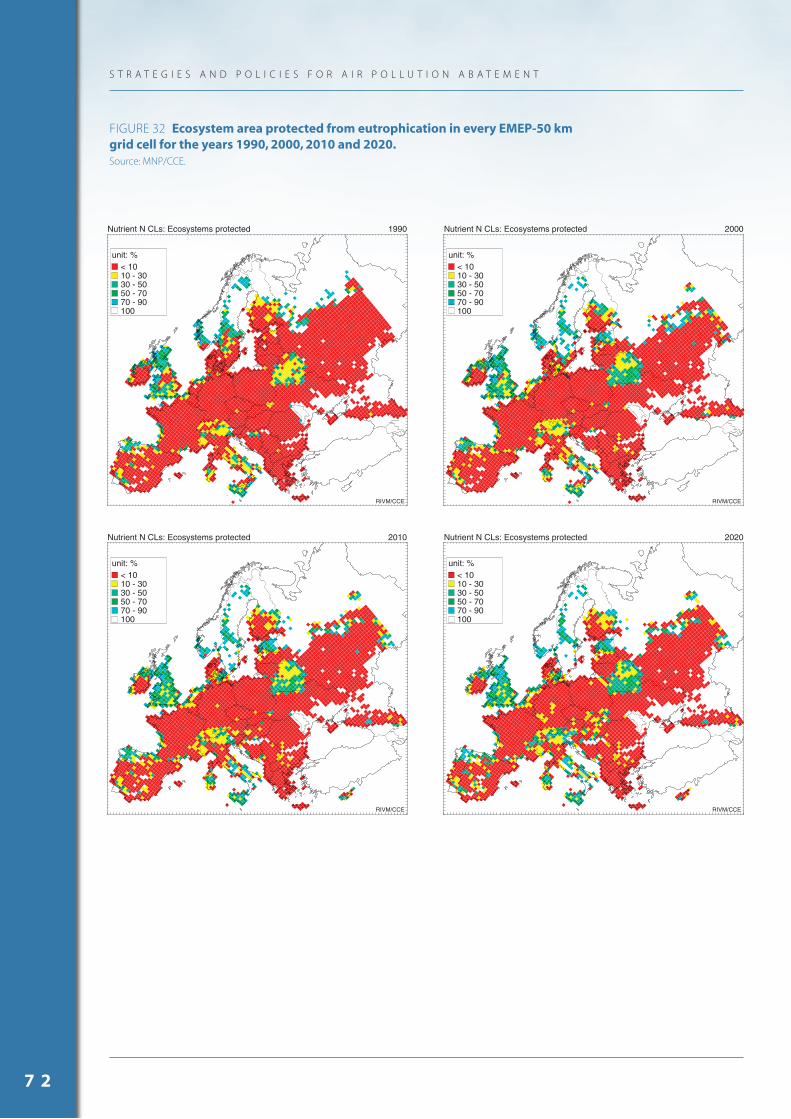
FIGURE 32 Ecosystem area protected from eutrophication in every EMEP-50 km grid cell for the years 1990, 2000, 2010 and 2020. Source: MNP/CCE.
unit: %< 1010 - 3030 - 5050 - 7070 - 90100
Nutrient N CLs: Ecosystems protected 1990
RIVM/CCE
unit: %< 1010 - 3030 - 5050 - 7070 - 90100
Nutrient N CLs: Ecosystems protected 2000
RIVM/CCE
unit: %< 1010 - 3030 - 5050 - 7070 - 90100
Nutrient N CLs: Ecosystems protected 2010
RIVM/CCE
unit: %< 1010 - 3030 - 5050 - 7070 - 90100
Nutrient N CLs: Ecosystems protected 2020
RIVM/CCE
S T R A T E G I E S A N D P O L I C I E S F O R A I R P O L L U T I O N A B A T E M E N T
7 2
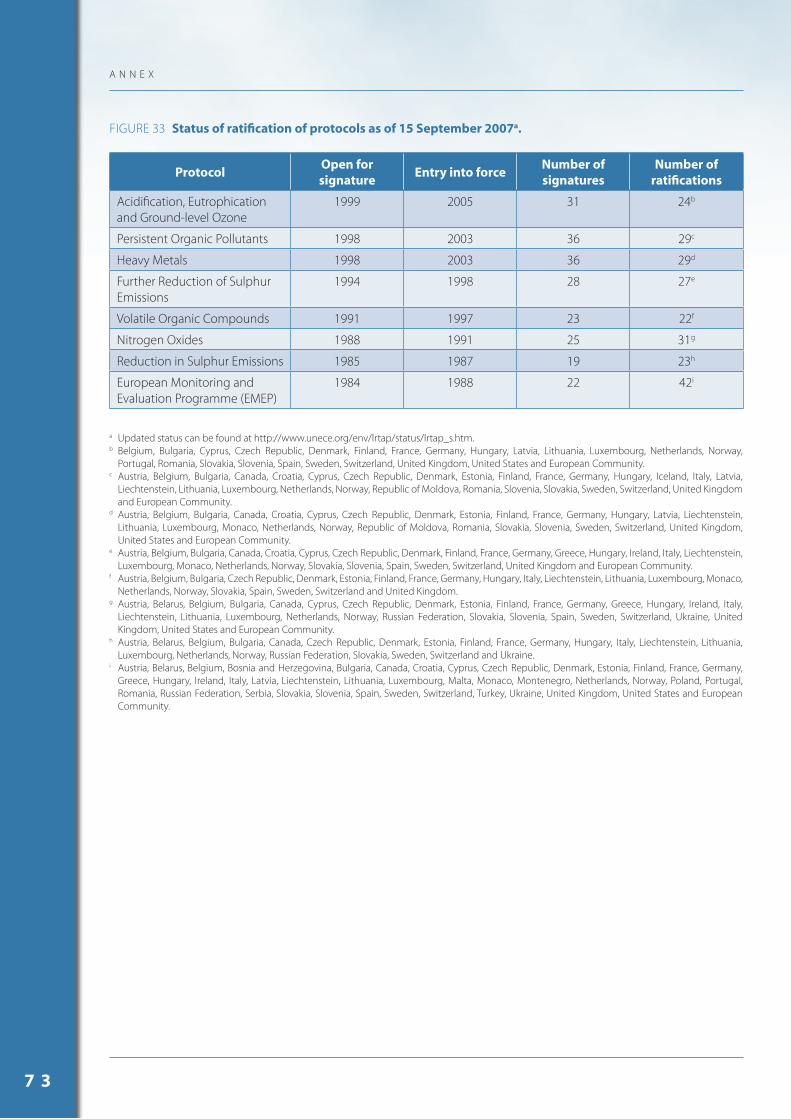
FIGURE 33 Status of ratifi cation of protocols as of 15 September 2007a.
ProtocolOpen for signature
Entry into force Number of signatures
Number of ratifi cations
Acidifi cation, Eutrophication and Ground-level Ozone
1999 2005 31 24b
Persistent Organic Pollutants 1998 2003 36 29c
Heavy Metals 1998 2003 36 29d
Further Reduction of Sulphur Emissions
1994 1998 28 27e
Volatile Organic Compounds 1991 1997 23 22f
Nitrogen Oxides 1988 1991 25 31g
Reduction in Sulphur Emissions 1985 1987 19 23h
European Monitoring and Evaluation Programme (EMEP)
1984 1988 22 42i
a Updated status can be found at http://www.unece.org/env/lrtap/status/lrtap_s.htm.b Belgium, Bulgaria, Cyprus, Czech Republic, Denmark, Finland, France, Germany, Hungary, Latvia, Lithuania, Luxembourg, Netherlands, Norway,
Portugal, Romania, Slovakia, Slovenia, Spain, Sweden, Switzerland, United Kingdom, United States and European Community.c Austria, Belgium, Bulgaria, Canada, Croatia, Cyprus, Czech Republic, Denmark, Estonia, Finland, France, Germany, Hungary, Iceland, Italy, Latvia,
Liechtenstein, Lithuania, Luxembourg, Netherlands, Norway, Republic of Moldova, Romania, Slovenia, Slovakia, Sweden, Switzerland, United Kingdom and European Community.
d Austria, Belgium, Bulgaria, Canada, Croatia, Cyprus, Czech Republic, Denmark, Estonia, Finland, France, Germany, Hungary, Latvia, Liechtenstein, Lithuania, Luxembourg, Monaco, Netherlands, Norway, Republic of Moldova, Romania, Slovakia, Slovenia, Sweden, Switzerland, United Kingdom, United States and European Community.
e Austria, Belgium, Bulgaria, Canada, Croatia, Cyprus, Czech Republic, Denmark, Finland, France, Germany, Greece, Hungary, Ireland, Italy, Liechtenstein, Luxembourg, Monaco, Netherlands, Norway, Slovakia, Slovenia, Spain, Sweden, Switzerland, United Kingdom and European Community.
f Austria, Belgium, Bulgaria, Czech Republic, Denmark, Estonia, Finland, France, Germany, Hungary, Italy, Liechtenstein, Lithuania, Luxembourg, Monaco, Netherlands, Norway, Slovakia, Spain, Sweden, Switzerland and United Kingdom.
g Austria, Belarus, Belgium, Bulgaria, Canada, Cyprus, Czech Republic, Denmark, Estonia, Finland, France, Germany, Greece, Hungary, Ireland, Italy, Liechtenstein, Lithuania, Luxembourg, Netherlands, Norway, Russian Federation, Slovakia, Slovenia, Spain, Sweden, Switzerland, Ukraine, United Kingdom, United States and European Community.
h Austria, Belarus, Belgium, Bulgaria, Canada, Czech Republic, Denmark, Estonia, Finland, France, Germany, Hungary, Italy, Liechtenstein, Lithuania, Luxembourg, Netherlands, Norway, Russian Federation, Slovakia, Sweden, Switzerland and Ukraine.
i Austria, Belarus, Belgium, Bosnia and Herzegovina, Bulgaria, Canada, Croatia, Cyprus, Czech Republic, Denmark, Estonia, Finland, France, Germany, Greece, Hungary, Ireland, Italy, Latvia, Liechtenstein, Lithuania, Luxembourg, Malta, Monaco, Montenegro, Netherlands, Norway, Poland, Portugal, Romania, Russian Federation, Serbia, Slovakia, Slovenia, Spain, Sweden, Switzerland, Turkey, Ukraine, United Kingdom, United States and European Community.
A N N E X
7 3

Printed at United Nations, GenevaGE.07-26022–November 2007–2,120
ECE/EB.AIR/93
United Nations publicationSales No E.07.II.E.24
ISBN 978-92-1-116977-5

RE
VI
EW
20
06
E C O N O M I C C O M M I S S I O N F O R E U R O P E
C o n v e n t i o n o n L o n g - r a n g e T r a n s b o u n d a r y A i r P o l l u t i o n
STRATEGIES AND POLICIES FOR
AIR POLLUTION ABATEMENT
For more information, consult the Convention’s web site, or contact: Keith Bull, Secretary, Executive Body of the Convention, Palais des Nations, CH-1211 Geneva 10, Switzerland (Tel. +41-22-917-2354 / Fax: +41-22-917-0621).
UNECE Information Service Phone: +41 (0) 22 917 44 44Palais des Nations Fax: +41 (0) 22 917 05 05CH-1211 Geneva 10 E-mail: [email protected] Web site: www.unece.org
EC
E STR
ATEGIES A
ND
PO
LICIES FO
R A
IR P
OLLU
TION
AB
ATEMEN
T U
NITED
NATIO
NS