Embed Size (px)
Citation preview
6/10/2014
1
• Quiz #3 • Review Break Even Homework • Chapters 9 & (10 – maybe) • Last Homework Assignment
Chapter 9 •Operating Budgets
Upon completion of this unit, each student will be able to:
Understand how operational budgets are to be managed.
Understand the various types of operational budgets.
Forecast foodservice revenues and guest counts. Forecast foodservice operating expenses. Prepare an operating budget utilizing historical
data. Calculate food cost, food cost percentage and
inventory turn over.
6/10/2014
2
Determine a capital budget based on operational needs and prioritization.
Perform various cost benefit analysis methods for fixed assets.
Budgets will help you better manage your restaurant.
They are a valuable tool used to help forecast/predict your revenues, estimate your expenses and insure that your profits meet your expectations.
Remember Profit is not just what is left over, you must plan ahead and treat profit as an “expense” in order to keep your restaurant a viable operation.
The primary need is for a 1 year Operating Budget that is detailed on a monthly basis and addresses items on the Income Statement.
This is a detailed plan that outlines estimated revenues, expenses and profits – rolled up for each department.
Accountability and responsibility can be assigned to managers for each department to achieve the budgeted revenue, expense and profit goals.
The operating budget can be short range (1 year) or long range (2-5 years)
6/10/2014
3
Capital Budget- A budget that relates to the acquisition of equipment, land, property improvements and other fixed assets.
Cash Budget- A budget that estimates cash receipts and disbursements during a specified time period.
Departmental Budget- A budget that estimates revenue and allocated expenses for a specific department within the restaurant
Master Budget- A budget that combines operating, capital, and cash budgets for each specific department within the restaurant
Control- As managers our job is to organize, direct and manage all financial aspects of our business to assure we are meeting the overall profit goals of the business and to do this we use the budget as our plan or “blueprint”.
5 Step Management Process:
6/10/2014
4
1) Establish Standards 2) Assess Actual Operating Results 3) Compare Standard Revenues and Expenses
with Actual Revenues and Expenses to determine causes of differences.
4) Take Corrective Action if needed. 5) Evaluate the Results of the Corrective
Action Process.
Usually the Owner or Manager in a smaller operation has the responsibility of setting the budget.
In Large operations it is usually a collaborative effort amongst the various departments.
Can also be dictated to you from a headquarters with targets pre-determined.
STEP 1 – Gather Prior Period Budget Information
STEP 2 – Determine the New Budget Period STEP 3 – Gather Needed Operating
Information STEP 4 – Determine the Budget Format STEP 5 – Analyze the Budget’s Impact STEP 6 – Present the Budget
6/10/2014
5
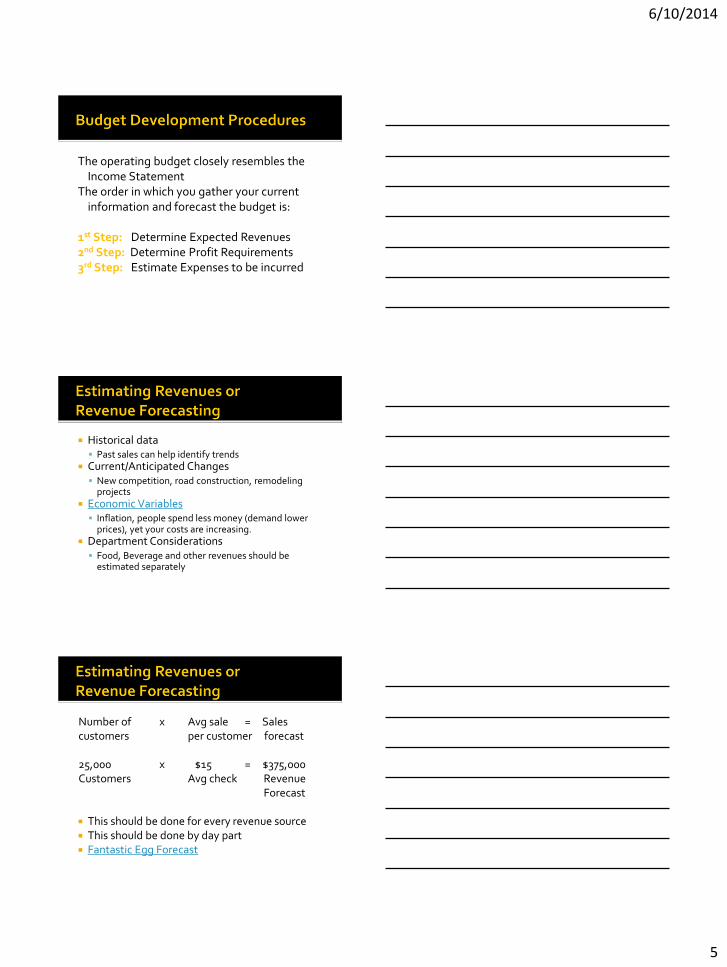
The operating budget closely resembles the Income Statement
The order in which you gather your current information and forecast the budget is:
1st Step: Determine Expected Revenues 2nd Step: Determine Profit Requirements 3rd Step: Estimate Expenses to be incurred
Historical data Past sales can help identify trends
Current/Anticipated Changes New competition, road construction, remodeling
projects Economic Variables Inflation, people spend less money (demand lower
prices), yet your costs are increasing. Department Considerations Food, Beverage and other revenues should be
estimated separately
Number of x Avg sale = Sales customers per customer forecast 25,000 x $15 = $375,000 Customers Avg check Revenue Forecast This should be done for every revenue source This should be done by day part Fantastic Egg Forecast
6/10/2014
6
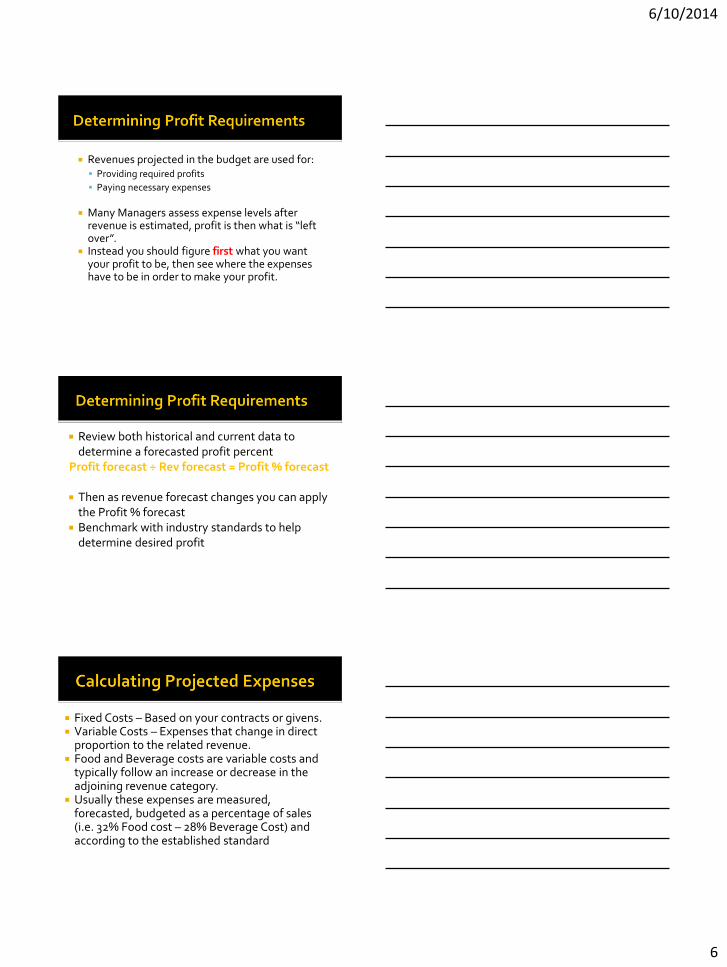
Revenues projected in the budget are used for: Providing required profits
Paying necessary expenses
Many Managers assess expense levels after
revenue is estimated, profit is then what is “left over”.
Instead you should figure first what you want your profit to be, then see where the expenses have to be in order to make your profit.
Review both historical and current data to determine a forecasted profit percent
Profit forecast ÷ Rev forecast = Profit % forecast Then as revenue forecast changes you can apply
the Profit % forecast Benchmark with industry standards to help
determine desired profit
Fixed Costs – Based on your contracts or givens. Variable Costs – Expenses that change in direct
proportion to the related revenue. Food and Beverage costs are variable costs and
typically follow an increase or decrease in the adjoining revenue category.
Usually these expenses are measured, forecasted, budgeted as a percentage of sales (i.e. 32% Food cost – 28% Beverage Cost) and according to the established standard
6/10/2014
7
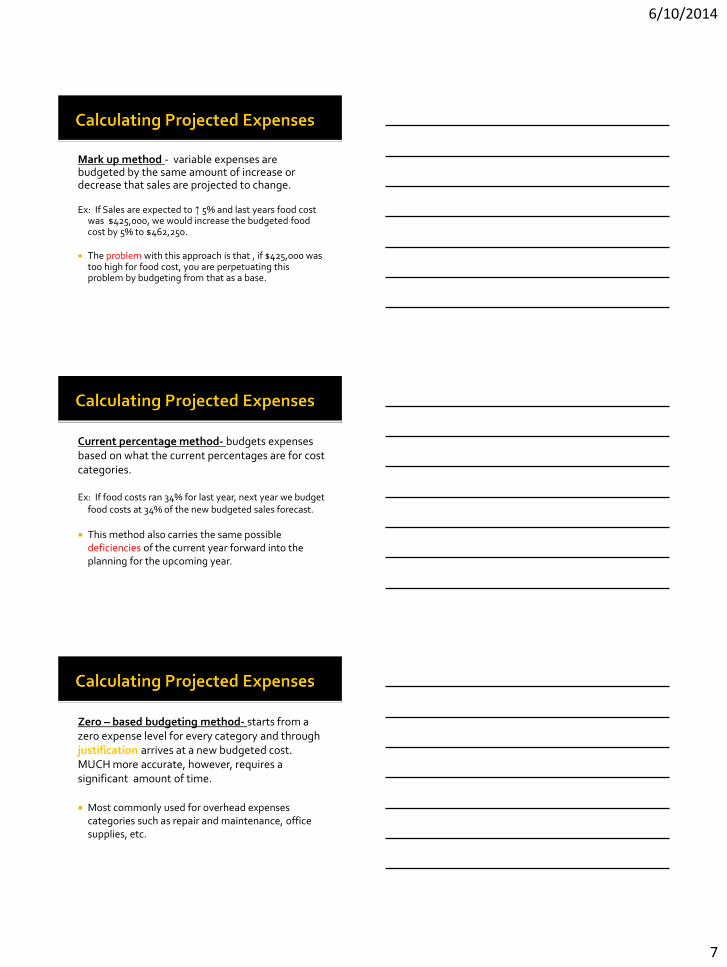
Mark up method - variable expenses are budgeted by the same amount of increase or decrease that sales are projected to change. Ex: If Sales are expected to ↑ 5% and last years food cost
was $425,000, we would increase the budgeted food cost by 5% to $462,250.
The problem with this approach is that , if $425,000 was
too high for food cost, you are perpetuating this problem by budgeting from that as a base.
Current percentage method- budgets expenses based on what the current percentages are for cost categories. Ex: If food costs ran 34% for last year, next year we budget
food costs at 34% of the new budgeted sales forecast.
This method also carries the same possible deficiencies of the current year forward into the planning for the upcoming year.
Zero – based budgeting method- starts from a zero expense level for every category and through justification arrives at a new budgeted cost. MUCH more accurate, however, requires a significant amount of time.
Most commonly used for overhead expenses
categories such as repair and maintenance, office supplies, etc.
6/10/2014
8
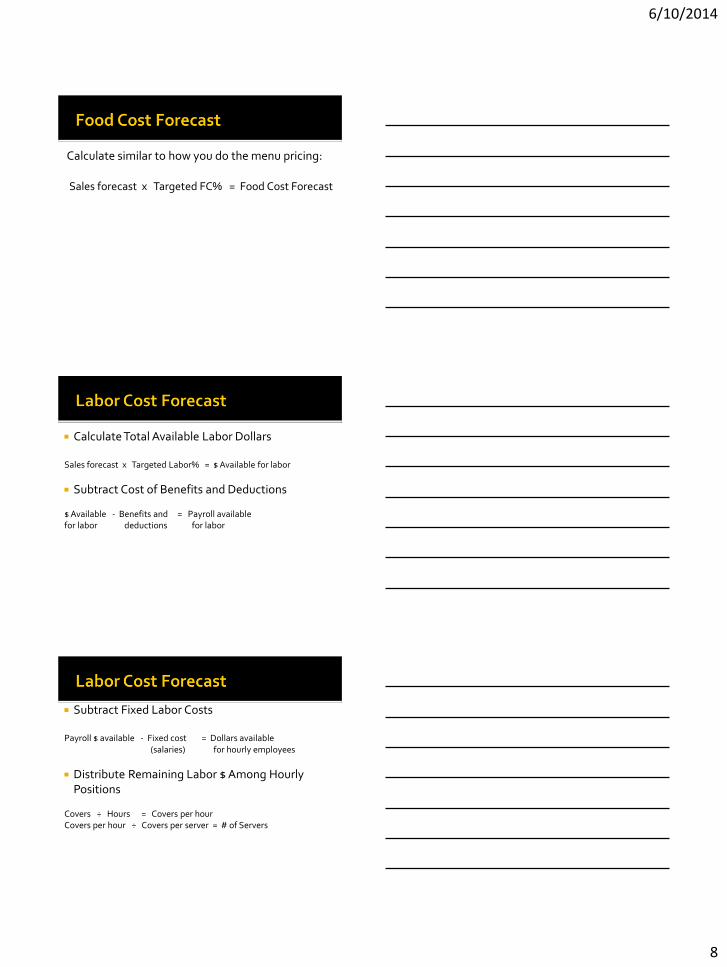
Calculate similar to how you do the menu pricing: Sales forecast x Targeted FC% = Food Cost Forecast
Calculate Total Available Labor Dollars Sales forecast x Targeted Labor% = $ Available for labor
Subtract Cost of Benefits and Deductions $ Available - Benefits and = Payroll available for labor deductions for labor
Subtract Fixed Labor Costs Payroll $ available - Fixed cost = Dollars available (salaries) for hourly employees
Distribute Remaining Labor $ Among Hourly Positions
Covers ÷ Hours = Covers per hour Covers per hour ÷ Covers per server = # of Servers
6/10/2014
9
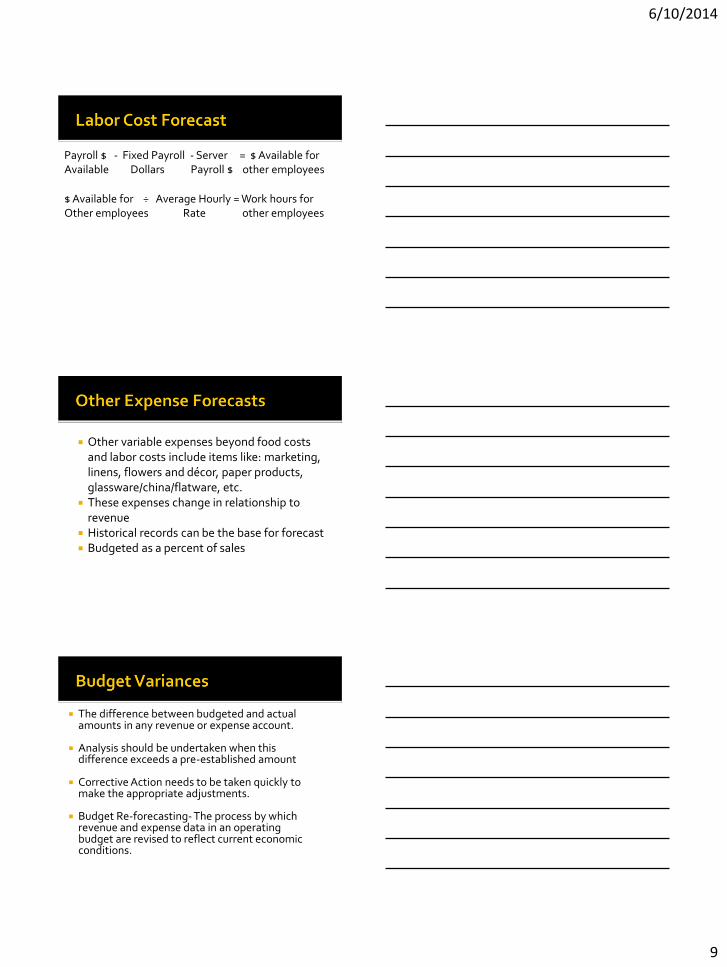
Payroll $ - Fixed Payroll - Server = $ Available for Available Dollars Payroll $ other employees
$ Available for ÷ Average Hourly = Work hours for Other employees Rate other employees
Other variable expenses beyond food costs and labor costs include items like: marketing, linens, flowers and décor, paper products, glassware/china/flatware, etc.
These expenses change in relationship to revenue
Historical records can be the base for forecast Budgeted as a percent of sales
The difference between budgeted and actual amounts in any revenue or expense account.
Analysis should be undertaken when this difference exceeds a pre-established amount
Corrective Action needs to be taken quickly to make the appropriate adjustments.
Budget Re-forecasting- The process by which revenue and expense data in an operating budget are revised to reflect current economic conditions.
6/10/2014
10
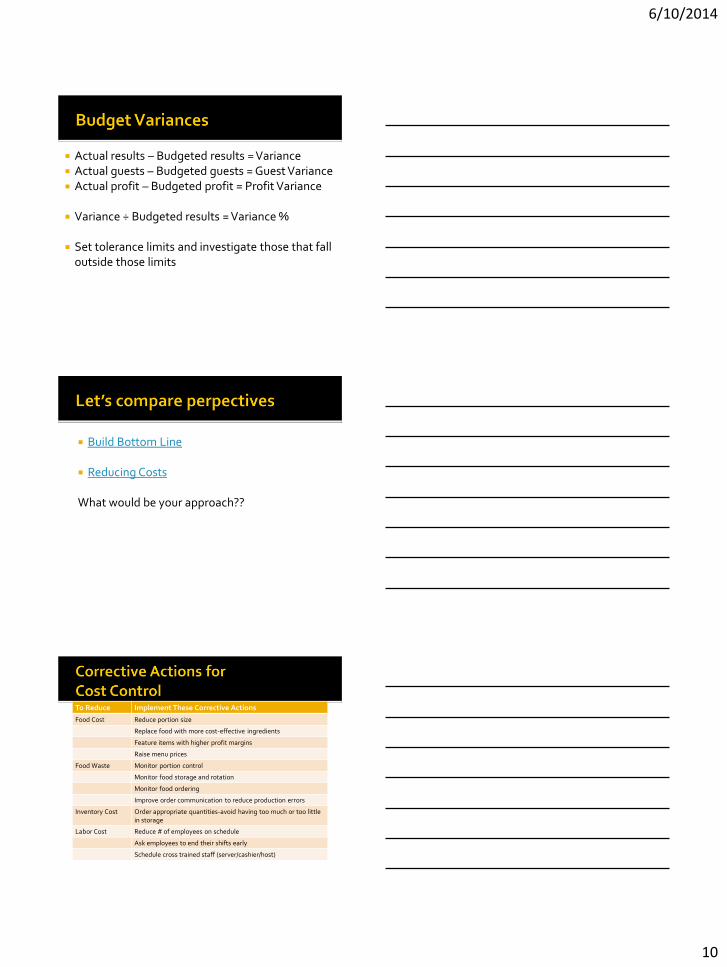
Actual results – Budgeted results = Variance Actual guests – Budgeted guests = Guest Variance Actual profit – Budgeted profit = Profit Variance
Variance ÷ Budgeted results = Variance %
Set tolerance limits and investigate those that fall
outside those limits
Build Bottom Line
Reducing Costs
What would be your approach??
To Reduce Implement These Corrective Actions
Food Cost Reduce portion size
Replace food with more cost-effective ingredients
Feature items with higher profit margins
Raise menu prices
Food Waste Monitor portion control
Monitor food storage and rotation
Monitor food ordering
Improve order communication to reduce production errors
Inventory Cost Order appropriate quantities-avoid having too much or too little in storage
Labor Cost Reduce # of employees on schedule
Ask employees to end their shifts early
Schedule cross trained staff (server/cashier/host)
6/10/2014
11
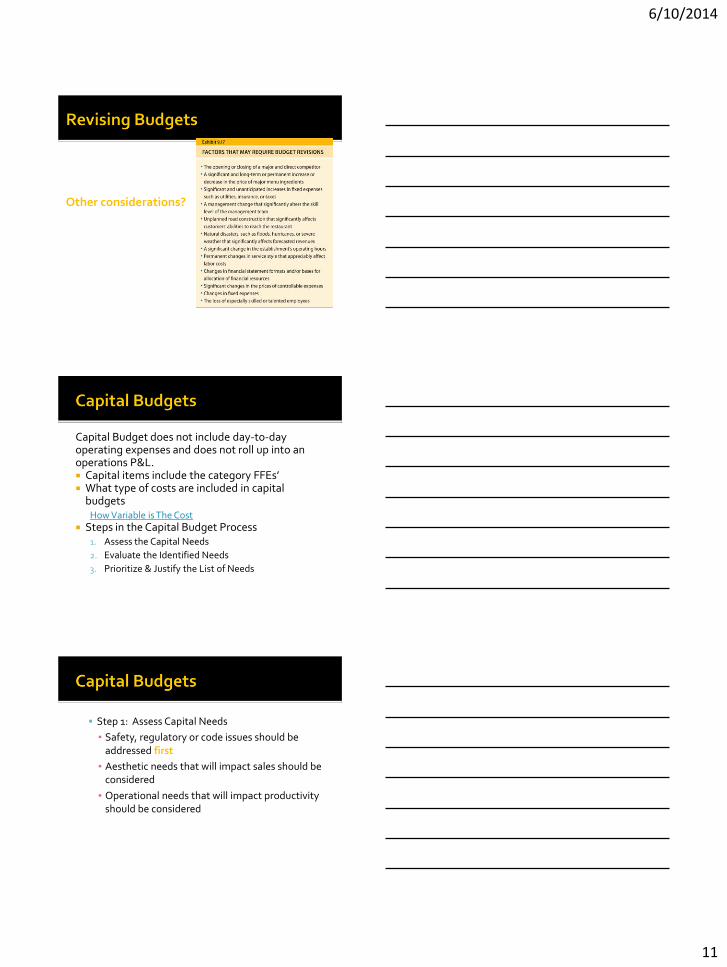
Other considerations?
Capital Budget does not include day-to-day operating expenses and does not roll up into an operations P&L. Capital items include the category FFEs’ What type of costs are included in capital
budgets How Variable is The Cost
Steps in the Capital Budget Process 1. Assess the Capital Needs
2. Evaluate the Identified Needs
3. Prioritize & Justify the List of Needs
Step 1: Assess Capital Needs
▪ Safety, regulatory or code issues should be addressed first
▪ Aesthetic needs that will impact sales should be considered
▪ Operational needs that will impact productivity should be considered
6/10/2014
12
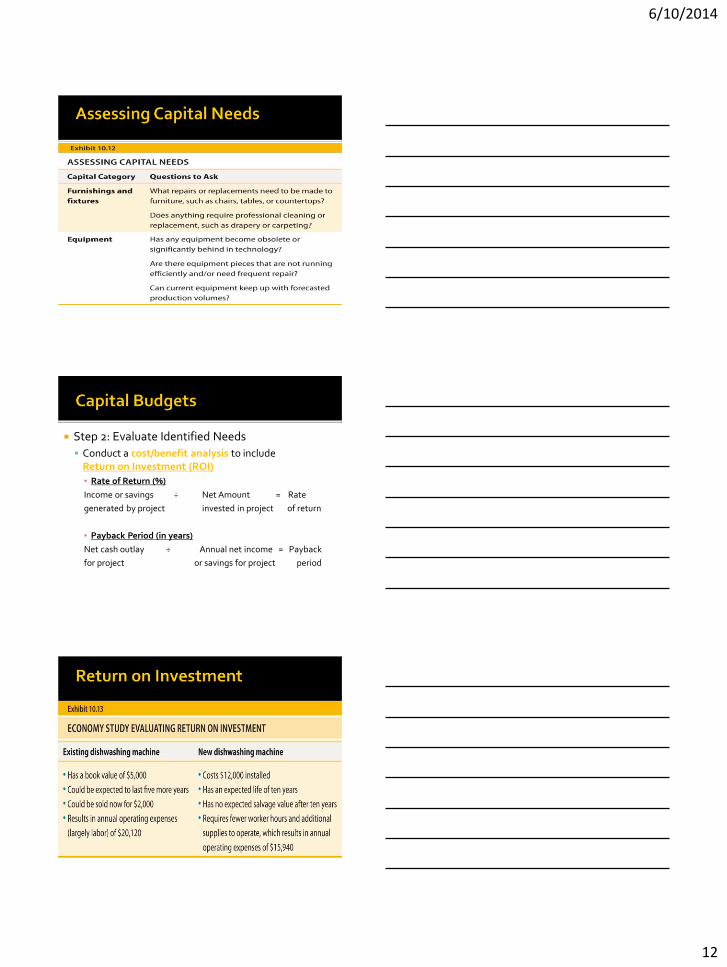
Step 2: Evaluate Identified Needs
Conduct a cost/benefit analysis to include Return on Investment (ROI)
▪ Rate of Return (%)
Income or savings ÷ Net Amount = Rate
generated by project invested in project of return
▪ Payback Period (in years)
Net cash outlay ÷ Annual net income = Payback
for project or savings for project period
6/10/2014
13
Step 3: Prioritize and Justify the List of Items Highest priority must be given to the following: Items that pose a safety risk either to customers or
employees, i.e. broken equipment, frayed carpet, etc.
Items that cause the operation to fall beneath local codes (fire, health, etc.)
Items that improve the operations efficiency or visual appearance
Final review and approval of Capital Budgets
usually falls to the owners, CEO, COO, etc.
Happy Trails Budget Alex’s Ale and Grill Review Questions from this week
Chapters 10 – 11 – 12
Accounting Aspects of Food and Beverage Control
Payroll Accounting
Accounting for Fixed and Other Assets
Homework
6/10/2014
14
Chapters 10 •Accounting Aspects of Food & Beverage Control
As managers our prime costs are the most controllable: food (beverage) and labor
Food costs must be understood and managed and we have multiple tools to help us accomplish this task
Must understand how we get our food cost
Must understand how we get our food cost percent
Must understand what is our standard
Opening Inventory + Purchases for the period Cost of Food Available for Sale - Closing Inventory
Food Cost
6/10/2014
15
Opening Inventory + Purchases for the period + Transfers in Cost of Food Available for Sale - Transfers out - Steward Sales - Promotional/Complimentary Meal - Employee Meals - Closing Inventory Cost of Food used this period to generate sales Code the Invoice
Figuring food cost percentage
Food cost ÷ Sales = Food cost percentage Let’s practice: Calculating Food Cost Percentage
Sunshine Hospital Cafeteria
Set Standards Measure Performance Determine Whether Standards Were Met
6/10/2014
16
Product costs increase Changes in government regulations Changes in local market conditions National, regional and local economic
conditions
Is staff using standardized recipes? Does staff lack training in procedures? Is staff serving correct portion sizes? Are proper receiving, storing and issuing
practices in place and being followed? Are products (or cash) being stolen? Is our spoilage/waste being tracked and is it
reasonable?
Are there math errors or incorrect inventory counts?
Are requisitions/transfers being made without proper paperwork?
Are all invoices being recorded on the Invoice Payment Schedule?
Are employee meals, promotional meals, steward sales being tracked and properly recorded?
Is my Menu Mix out of line?
6/10/2014
17
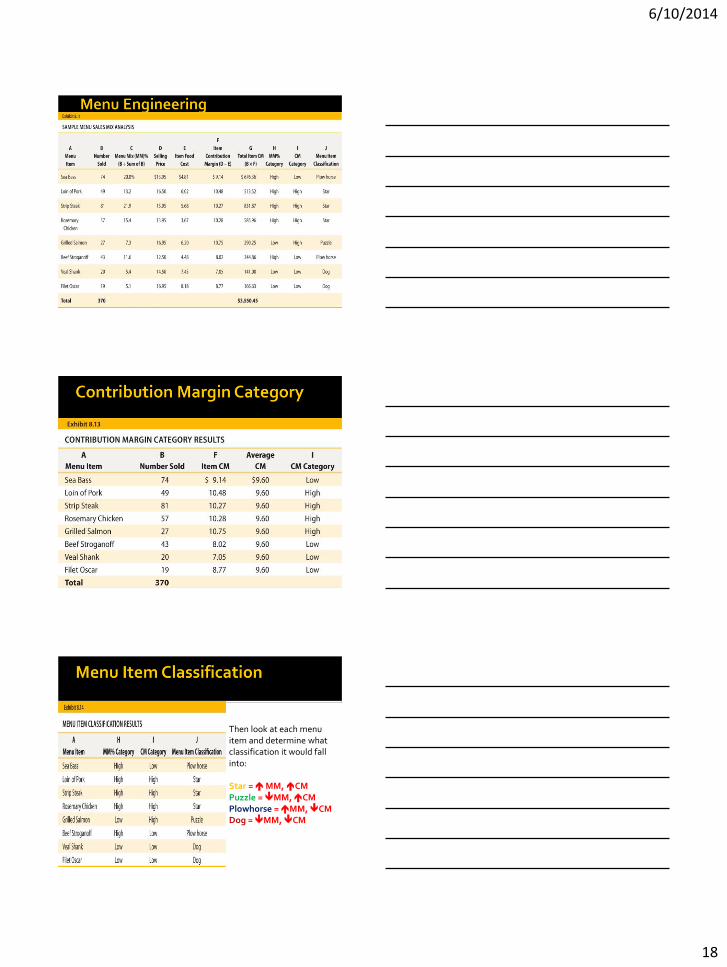
A process that provides the Manager with information about a menu item’s profitability and popularity to aid menu planning, design and pricing decisions.
The menu is not just a piece of paper in the restaurant. It is THE most important piece of paper in the restaurant. It not only tells your guests what you have to offer, it sets the tone for your profitability.
Three Critical Tools to begin the Menu Engineering Analysis Standardized Recipes
Recipe Pre-Costing ▪ Determining the current market cost for the quantity of
ingredients needed to produce one portion of a menu item.
Consistent Recipe Use ▪ If your staff isn’t trained how to use and follow the
recipes, then having recipes or pre-costing will do you no good!
Menu Engineering emphasizes the “Contribution Margin”, in other words what does each item contribute to pay for fixed costs and the bottom line?
Formula: food item sales – food item cost Takes into account the “Menu Sales Mix”
(what percentage of sales each item represents)
It separates menu items into categories based on popularity and profitability.
6/10/2014
18
Then look at each menu item and determine what classification it would fall into: Star = MM, CM Puzzle = MM, CM Plowhorse = MM, CM Dog = MM, CM
6/10/2014
19
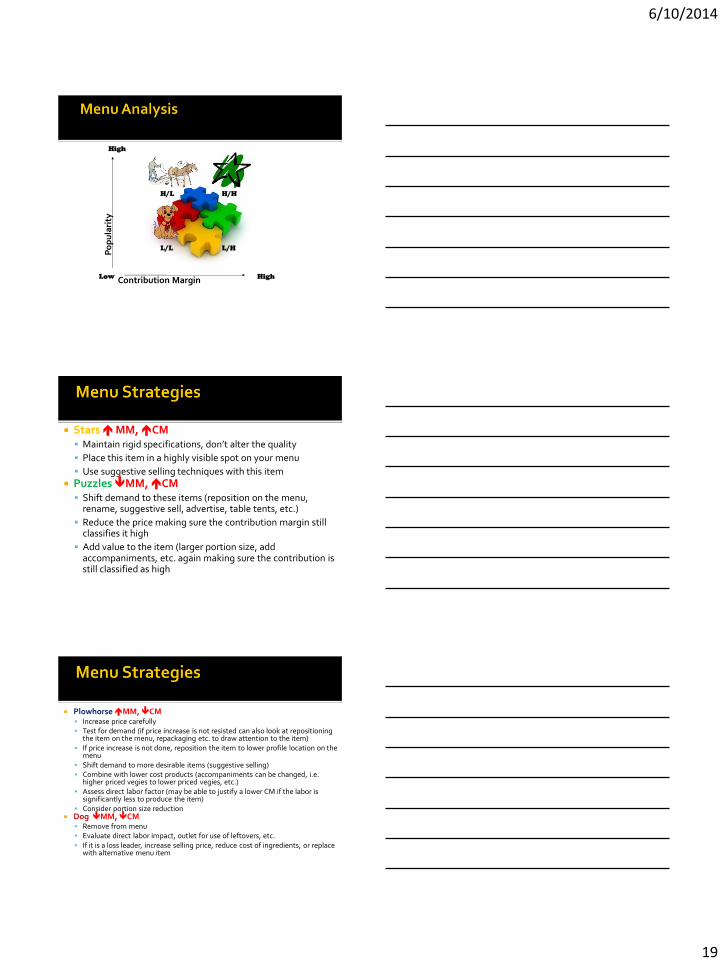
Contribution Margin
Po
pu
lari
ty
High
High Low
H/L H/H
L/L L/H
Stars MM, CM Maintain rigid specifications, don’t alter the quality
Place this item in a highly visible spot on your menu
Use suggestive selling techniques with this item Puzzles MM, CM Shift demand to these items (reposition on the menu,
rename, suggestive sell, advertise, table tents, etc.)
Reduce the price making sure the contribution margin still classifies it high
Add value to the item (larger portion size, add accompaniments, etc. again making sure the contribution is still classified as high
Plowhorse MM, CM Increase price carefully Test for demand (if price increase is not resisted can also look at repositioning
the item on the menu, repackaging etc. to draw attention to the item) If price increase is not done, reposition the item to lower profile location on the
menu Shift demand to more desirable items (suggestive selling) Combine with lower cost products (accompaniments can be changed, i.e.
higher priced vegies to lower priced vegies, etc.) Assess direct labor factor (may be able to justify a lower CM if the labor is
significantly less to produce the item) Consider portion size reduction
Dog MM, CM Remove from menu Evaluate direct labor impact, outlet for use of leftovers, etc. If it is a loss leader, increase selling price, reduce cost of ingredients, or replace
with alternative menu item
6/10/2014
20
In large operations there is often a purchasing department. This is where all ordering and receiving is handled.
Various departments request (requisition) items
needed, and requisitions are given to the Accounting dept. to make sure everything is accurately billed and accounted for.
Collusion- A secret agreement between two or
more persons to defraud the restaurant.
Food cost is typically calculated on a monthly basis.
However if it can be calculated daily for even tighter controls. This is especially necessary if there is a problem.
Inventory- Too high of inventory opens you up to more theft and waste. Too low, obviously you are not able to serve your customers what they want.
Accurate inventory is necessary to calculate an accurate food cost.
If the inventory isn’t counted correctly, costed correctly, or calculated correctly you will not have a true picture of how well your restaurant is doing.
Consistency in the month to month inventory is important. Consistent counting, rounding, estimates, etc…
6/10/2014
21
Physical Inventory- taking an actual physical count and valuation on hand at the close of the accounting period.
Inventories should not be completed by the person responsible for ordering, because the purpose of the inventory is to confirm the quantity of product that should be in inventory.
Perpetual Inventory- Allows a running balance
to be kept of the quantity of items in stock at any point in time.
FIFO- First in, First Out- The most common method of accounting for inventory.
This method assumes that products are withdrawn from inventory in the order in which they were received and entered into storage. Value of inventory is based on the most recent price of product.
LIFO is the opposite. Last in, First out. This way the value of the inventory is represented by the unit cost of items in inventory the longest (oldest price first).
Actual Cost- Considers the actual price paid for each product in inventory.
Weighted Average- Considers the quantity of each product purchased and then the inventory value is based on the average price weighted by the quantity purchased.
6/10/2014
22
Inventory Turnover Rate- the number of times in a given accounting period that inventory is converted into revenue. This “inventory turnover rate” measures the rate at which inventory is turned into food or beverage costs required to generate food or beverage revenue.
Avg. Inventory ÷ Cost of Goods Sold = Turnover
Issuing- The process of removing food or beverage from inventory and moving them into production cycles.
Only employees authorized to purchase may do so Purchases are made only from pre-designated and
approved vendors A PO is initiated for all major purchases PO is matched to the delivery invoice Discrepancies are noted on credit memos Invoices are authorized by managers for payment Systems are in place to ensure invoices are only paid
once
Short weights Assorted contents Missing items Store all foods at correct temperatures
Dry storage (50°-70°F)
Refrigerated storage (below 41°F)
Frozen storage (varies)
Proper stock rotation Security measures
6/10/2014
23
Products costs (Food and Beverage) and labor costs, which represents the two LARGEST expenses of almost every restaurant.
Prime cost is often used to weigh the option of making an item from scratch or purchasing it ready to use.
Homework:
Happy Trails Budget
Alex’s Ale & Grill Capital Budget
Read Chapter 11 & 12