Embed Size (px)
Citation preview

Food Waste Produced through End-Users
–
A Communication Strategy to reduce Household
Bakery Waste
Bachelor Thesis:
Klara M. Brüggemann
Supervisors: Dr. M. W. M. Kuttschreuter & Dr. M. van Bommel
Section: Behavioural Sciences
Department: Psychology of Conflict, Risk and Safety
Date: 18th of January 2016

Reducing household bakery waste in Germany: A Communication Strategy
2
Abstract
There is an enormous amount of food waste that is thrown away each day. Mainly the
end-consumer plays a large factor in this wasting behaviour. Evidence shows that there is a
lack of knowledge over the consequences and that lifestyle is another reason for wasting food.
The purpose of this study was to examine the effect of an information strategy on consumers
attitude, subjective norm, perceived behavioural control and intention to reduce bakery waste.
Furthermore, the moderating effect of past attention towards reducing bakery waste was
examined. This was done within an in-between group experiment that was spread via the
online platform ‘Qualtric’. In November 2015, 162 participants attended the treatment group,
which saw an information sheet as manipulation, and a further 179 participants attended the
control group. Results indicated that there was no effect on the participants attitude,
subjective norm, perceived behavioural control and intention to reduce bakery waste.
Furthermore, no moderator effect of past attention towards reducing bakery waste was found.
But correlations confirmed a positive relation between all measured variables. The result
shows that a single measure does not work to make consumers change their food wasting
behaviour. This study can help to get insights in the strategies to design information in a more
effective way.
Reducing household bakery waste in Germany: A Communication Strategy
3
Samenvatting
Er is een enorme hoeveelheid voedselafval dat elke dag wordt weggegooid. Vooral de
consument speelt een grote rol bij deze verspilling. Een van de redenen is het gebrek aan
kennis over de gevolgen, een andere reden betreft de levensstijl. Het doel van deze studie is
om het effect van een informatie strategie op de houding, de subjectieve norm, de
waargenomen gedragscontrole en de intentie van consumenten in betrekking tot bakkerij afval
te onderzoeken. Verder is er het moderatie effect onderzocht van de factor ‘’eerdere aandacht
om bakkerij afval te verminderen’’. Dit is gedaan door middel van een in-between groep
experiment dat werd verspreid via het online forum 'Qualtrics'. In november 2015 vormden
162 deelnemers de treatment groep. Als manipulatie kregen zij een informatieblad te zien. De
overige 179 deelnemers vormen de controlegroep. Resultaten tonen aan dat er geen effect op
de houding, subjectieve norm, waargenomen gedragscontrole en intentie van de deelnemers is
om de bakkerij afval te verminderen is. Verder is er geen moderatie effect van eerdere
aandacht om bakkerij afval te verminderen gevonden. Echter zijn er wel positieve correlaties
tussen alle variabelen gevonden. Het resultaat van dit onderzoek toont aan dat een enkele
maatregel niet genoeg is om het verspillende gedrag van consumenten in betrekking tot
voedsel te veranderen. Dit onderzoek kan helpen bij het inzicht verkrijgen om informatie
strategieën op een meer effectieve manier te ontwerpen.

Reducing household bakery waste in Germany: A Communication Strategy
4
Content Abstract ................................................................................................................................................... 2
Samenvatting ........................................................................................................................................... 3
Introduction ............................................................................................................................................. 5
The Problem of Food Waste ................................................................................................................ 5
Describing the Problem ................................................................................................................... 5
Political Position.............................................................................................................................. 6
Reasons for Food Waste .................................................................................................................. 6
Consequences of Food Waste .......................................................................................................... 7
Factors that have an Influence on Food Waste ................................................................................ 8
Strategy of Intervention to Reduce Food Waste .................................................................................. 9
Theory of Planned Behaviour .......................................................................................................... 9
Communicating the Problem of Food Waste ................................................................................ 10
Existing Campaigns ....................................................................................................................... 11
The Present Study .......................................................................................................................... 12
Hypotheses .................................................................................................................................... 14
Methodology ......................................................................................................................................... 15
Participants ........................................................................................................................................ 15
Experimental Design ......................................................................................................................... 16
Measuring Instrument........................................................................................................................ 16
Past Behaviour towards Baking Products...................................................................................... 17
Evaluation Items ............................................................................................................................ 17
Attitude .......................................................................................................................................... 17
Subjective Norm ............................................................................................................................ 18
Perceived Behavioural Control...................................................................................................... 18
Intention ........................................................................................................................................ 18
Demographic Variables ................................................................................................................. 18
Manipulation ..................................................................................................................................... 19
Procedure ........................................................................................................................................... 19
Analysis Procedure ............................................................................................................................ 20
Results ................................................................................................................................................... 21
Descriptive Statistics ......................................................................................................................... 21
Hypotheses Testing ........................................................................................................................... 22
Main Effects .................................................................................................................................. 22
Moderator Analysis ....................................................................................................................... 23
Discussion ............................................................................................................................................. 26
References ............................................................................................................................................. 29
Appendix A: Questionnaire ................................................................................................................... 32
Reducing household bakery waste in Germany: A Communication Strategy
5
Introduction
The Problem of Food Waste
Describing the Problem
During the last years, the conservation of our environment and the consequences from
polluting behaviour increasingly became the focus of attention. One important factor, which
has an influence on the deterioration of our environment, is food waste. Food losses and food
waste are important problems in today’s society. In Germany, it is estimated that
approximately 18 Million tonnes of food is thrown away each year. With the help of an
experiment, we examine to what extent this can be influences with an information sheet.
Before describing the problem of food waste, a distinction needs to be made between
food losses and food waste. Food losses mainly occur within the harvest and production chain
and have their origin in technological and infrastructural conditions. Whereas food waste is
defined as food that is qualitatively good and ready for consumption, but not consumed
(Noleppa & Cartsburg, 2015). Food waste includes food scraps from agricultural production
and food processing from large-scale consumers and private households and raw and
processed food, which would still be for human consumption (Kranert et al., 2012). In
addition, the term ‘consumer’ needs to be defined precisely. A consumer can be an individual-
end user, but the term also contains large-scale consumers as is meant by restaurants,
canteens, hospitals and retirement homes. Often food is thrown away because especially the
individual-end consumers lack knowledge about how to store the different food articles, how
much to cook for how many persons or just do not plan in an adequate way (Selzer, 2010).
There are different stages along the value chain where food is thrown away. It starts
with the production and ends with the large-scale consumer or in households. In German
households 39% of the 18 m tonnes, that are thrown away along the whole value chain, are
done through the end consumer. Converted into tonnes these 39% are 7.2 m tonnes of food,
which are in the end user’s trash can. A further differentiation is necessary between food
waste that can be avoided because it is still edible and food waste, which cannot be avoided;
like peels, cores and bones. About 70% of the 7.2 m tonnes of food that is thrown away in
German households, thus 5 m tonnes could be avoided through the end-user (Noleppa &
Cartsburg, 2015). When the amount above is distributed to the German population of 81 m
habitants, it becomes visible that each person could avoid throwing away 62 kg per year. This
Reducing household bakery waste in Germany: A Communication Strategy
6
amount is the largest one compared to the possible avoided food waste in the other stages of
the value chain (Noleppa & Cartsburg, 2015).
Political Position
Although this topic is an important one, already a few years on the political agenda,
with the aim to reduce food waste to 50% by 2020, until now there are no precise,
scientifically based data about the food, which is thrown away. The numbers given above are
only estimated numbers. It becomes clear that different sources use slightly varying numbers.
Kranert et al. (2012) gives an estimated value between 71.0 kg and 92.2 kg of food waste per
person, drinks included and states that 65% of it, thus 46.2 kg to 59.9 kg could be avoided
from being thrown away by the consumer. These numbers are similar to the values of the
study by Cofresco Frischhalteprodukte GmbH & Co. KG (Cofresco Frischhalteprodukte
Europa, 2011) which gives a value of 80kg wasted food per person, but drinks excluded. In
that study, it is stated that consumers estimate themselves to throw away 6% of their
purchased groceries. According to their diary, they throw away 21% of their foods, thus an
underestimation of 15%. All these different studies have in common that they see a big
potential to reduce food waste at the household level.
Throwing away 39% of the food that is thrown away in total, end-consumers can have
an impact on food availability and the environment through changing their behaviour.
Already existing campaigns therefore mostly concentrate on end-consumer’s behaviour and
less on other steps in the value chain.
In 2012 after the German Bundestag, the federal diet, decided that the amount of food
losses and food waste should be diminished by 50% by 2020, the Bundesministerium für
Ernährung, Landwirtschaft und Verbraucherschutz (BMELV) commissioned the University
of Stuttgart to do research on the topic of food waste. Kranert et al. (2012) estimated the
German food waste with the help of statistics, literature, surveys, expert conversations and
random sampling research on the individual household sector. Nevertheless, until now the
German government has not developed cornet policy proposals as to how to reach the aim of
a reduction of 50% by 2020.
Reasons for Food Waste
To be able to do something against food waste, it is first important to better understand
the reasons for food waste. Influenced by the surplus supply people in industrialized countries
consume a lot more than necessary (WRAP 2006). In Germany, there is always a surplus of

Reducing household bakery waste in Germany: A Communication Strategy
7
edibles available. The supermarkets are usually full, even a few hours before public holidays
the consumers expect full shelves. The reasons for the large amount of food waste are
multifaceted and numerous. Within the Waste & Resources Action Programme (WRAP) a
qualitative consumer research was done. In that study four main causes for wasting food are
given: supermarkets, poor planning/food management, personal choice & lifestyle and lack of
skill (WRAP, 2007). Other important reasons found in the literature are health concerns,
inconvenience and loss of economic and personal value of food, over shopping (WRAP,
2006), preparing too much food in general (WRAP, 2008), the expiry date (Food Standards
Agency, 2008) which is according to Selzer (2008) mostly only a decision criterion but not
the reason, cooking skills and improper storage (Pfau & Piekarski, 2003). Kranert et al.
(2012) conclude that the alienation from our food makes it easier to dispose it. This is thus a
problem that exists in todays industrialized society. It becomes more and more normal that
machines produce our food. Food is less and less produced by our own hands. Through this
process, we forget the origins of food, we do not know how it is produced and what it
contains (Glanz, 2009). However, there are differences between the amounts of waste from
person to person. Some produce less food waste, others more. Now, we have it about
differences on the individual level. Different studies come to slightly different results in the
amount of waste that is produced and they also give different explanations for these variations
in food waste. A study from Lea and Worsley (2008) states, that older people produce less
food waste. Older people have a more conscious handling with food. The war generation and
their children mostly know more about the right storage, learnt how to cook with leftovers
better and are still influenced by the 1940’s when food was scarce. It further seems that
families with small children throw more food away. Children often cause parents to buy more
and at home, they change their eating appetite and want something different or do not finish
their meals (Glanz, 2009).
Consequences of Food Waste
Looking at the continuing population grow, scarcity of natural resources and the
climate change, indicates that a rethink in respect to the discarding of food articles is
necessary. The large amount of food waste does not only have an influence on our
environment but its consequences are especially influencing the food prices in developing
countries. Food waste is next to climate change, droughts and distribution problems one part
of the problem, which leads to hunger in the world. A product group where the scarcity and

Reducing household bakery waste in Germany: A Communication Strategy
8
the high prices are visible is grain. The flour prices are jointly responsible for the food crises
in African countries (Thurn, 2011). In Europe, people expect that the food supply is always
good. A bakery produces about 20% more than they will sell, just to present always a full
shelf to their customers.
Industrialized countries have the resources to buy up surplus grain for their
overestimated needs, therefore creating a scarcity on the market and hence the stock market
prices rise. We can afford this, but in underdeveloped countries, the proportion of scarcity
grain is great, whereby prices dramatically rise so that poor people are not able to buy bread.
According to the film: Taste the Waste, “our trashing indirectly leads to hunger in the world”.
The FAO informs that about 925 million people are suffering from hunger and malnutrition.
This is twelve percent of the 7.3 billion people living on our planet (PRB, 2015) and the gap
between surplus on the one hand and malnutrition on the other side is still growing (Lipinski
et al., 2013). However, there are not only ethical and social reasons to do something against
food waste. There are also economic and environmental disadvantages produced through the
waste. The public waste disposal system has become more expensive for the household
during the last decades (Wille et al., 2002). So food does not only cost the consumer
something when he/she buys it (approximately 235, - euros per person, per year), but also
when he/she throws it away. Further, the discards have different impacts on our environment
along the whole value chain, during production, harvest and transportation. Many resources
are used so that the end product stays in the consumer’s kitchen. When we throw away a
product all the resources like water, petrol for transportation and agricultural land is wasted
(WWF, 2015). All these consequences show that food waste is a problem that is worth it, to
work on it. There is a need for behaviour change.
Factors that have an Influence on Food Waste
It is necessary to have a closer look at the factors that play a role in wasting food.
Many different factors are said to have a role on consumer’s behaviour. First demographical
variables like gender, age, work, living alone, having children and socio economic status are
said to have an influence on food waste (Miafodzyeva & Brandt, 2013). These are proximal
determinants, that mean that they are close to the individual and mostly not changeable or
difficult to change. Glanz (2009) mentions the “personal attitudes towards edibles, cooking
and eating habits, shopping behaviour and storage of edibles” (Glanz, 2009, p. 33) of
consumers to play an important role on the intention to reduce food waste. These are

Reducing household bakery waste in Germany: A Communication Strategy
9
individual differences in behaviour; so-called distal determinants can be changed through life
experience or manipulated through an intervention campaign.
Strategy of Intervention to Reduce Food Waste
Theory of Planned Behaviour
To work on the distal determinants, the theory of planned behaviour will be used. The
theory of planned behaviour is a model developed by Ajzen (1991) to better understand
factors that play on human behaviour. According to Ajzen (1991), three factors: attitude,
subjective norm and perceived behavioural control are able to produce an intention, which is
necessary to make people behave in a certain way. This theory is according to Janssen et al.,
(2010) able to explain intrapersonal factors that motivate environmentally relevant behaviour
and thus food waste behaviour to a certain degree. Ajzen (1991) specifies that the intention
and human behaviour itself can be predicted by analysing the three independent factors (see
Figure 1). Attitude is the person’s relation towards the behaviour of interest. Subjective norm
refers to the belief about what others think about the behaviour in question. Subjective norm
is said to be important especially in peer groups since it is quite important for most people to
act according to other people’s ideas. Perceived behavioural control is the perception of
having the control over ones behaviour in a certain situation. If the perceived control is high,
attitude is positive and your surrounding supports the person in question, the probably that the
behaviour is executed is high.
Figure 1. Theory of planned behaviour (Ajzen, 1991)
Attitude
Perceived
Behavioural
Control
Subjective
Norm
Intention Behaviour
Reducing household bakery waste in Germany: A Communication Strategy
10
Communicating the Problem of Food Waste
To work on behaviour change, a better impression of how to communicate the food
waste problem and to learn how to make people reduce their food waste is important. The
communication strategy is restricted to the aspect that our discards have on social factors.
However, environmental factors also play a major role, only the social disadvantages are
addressed in this study. These social factors affect the feelings of readers and also try to
change their attitude on the emotional level by creating a bad conscience. According to
Domasio (1994), emotions are able to shape attitudes and behaviours and increase accuracy
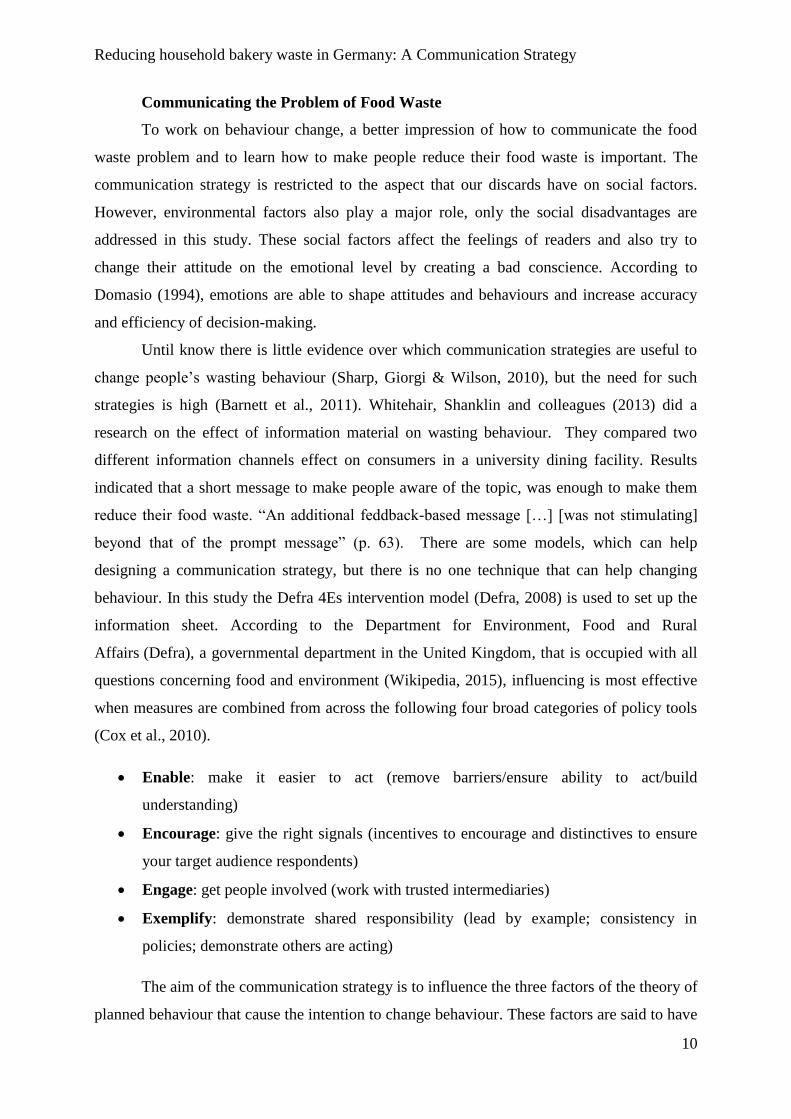
and efficiency of decision-making.
Until know there is little evidence over which communication strategies are useful to
change people’s wasting behaviour (Sharp, Giorgi & Wilson, 2010), but the need for such
strategies is high (Barnett et al., 2011). Whitehair, Shanklin and colleagues (2013) did a
research on the effect of information material on wasting behaviour. They compared two
different information channels effect on consumers in a university dining facility. Results
indicated that a short message to make people aware of the topic, was enough to make them
reduce their food waste. “An additional feddback-based message […] [was not stimulating]
beyond that of the prompt message” (p. 63). There are some models, which can help
designing a communication strategy, but there is no one technique that can help changing
behaviour. In this study the Defra 4Es intervention model (Defra, 2008) is used to set up the
information sheet. According to the Department for Environment, Food and Rural
Affairs (Defra), a governmental department in the United Kingdom, that is occupied with all
questions concerning food and environment (Wikipedia, 2015), influencing is most effective
when measures are combined from across the following four broad categories of policy tools
(Cox et al., 2010).
Enable: make it easier to act (remove barriers/ensure ability to act/build
understanding)
Encourage: give the right signals (incentives to encourage and distinctives to ensure
your target audience respondents)
Engage: get people involved (work with trusted intermediaries)
Exemplify: demonstrate shared responsibility (lead by example; consistency in
policies; demonstrate others are acting)
The aim of the communication strategy is to influence the three factors of the theory of
planned behaviour that cause the intention to change behaviour. These factors are said to have

Reducing household bakery waste in Germany: A Communication Strategy
11
an influence on the intention to change behaviour. To change the attitude of the German
adults, it is first necessary to inform participants about the existing problem, next they should
receive information about why this is a problem. Increased knowledge can be able to change
someone’s attitude concerning food waste reduction. Therefore, the consequences of the
problem need to be explained. This is done with the example of starving people in Africa, to
reach people on the emotional level. The information sheet therefore will explain the problem,
its consequences on the social level and then give suggestions about how consumers can
afford to diminish their own bakery waste. This is done with action proposals and the
explanation of their practicality.
Existing Campaigns
In this paragraph, already existing campaigns which try to change consumers
awareness and behaviour are described. The BMELV developed an initiative called ‘Zu gut
für die Tonne’, translated too good for the bin, which is an information campaign against
throwing away valuable food. The motto of the campaign is „Jedes achte Lebensmittel, das
wir kaufen, werfen wir weg. Du kannst das ändern”. Which means: Every eighth food article
that we buy is disposed. You can change this! (BMELV, 2012, p. 4). The website of the
campaign offers different information about the topic food waste. It comprises of recipes for
cooking with leftovers so that they are used again and don’t end up in the trash can. To
motivate others taking part in their initiative, the BMELV developed the ‘Bundespreis’, a
prize from the government for ideas concerning the topic of food waste. They further inform
people about the right storage of the food articles, about the difference between best-before
date and date of expiry and they developed an app so that all these information’s are also
available on smartphones. There are other initiatives to reduce food waste, which are
developed by some non-governmental organizations (NGO’s). An example is the World
Wildlife Fund (WWF), which developed the ‘WWF-Verbraucherkampagne #iamnature’, a
consumer campaign, which aims to make people rethink and reverse their everyday life
(WWF, 2015). It is an interactive website, where people can get personalized tips about how
to reduce food waste. Another method to do something against food waste is dumpster diving.
The people who are dumpster diving save discarded foods, thrown away by supermarkets or
enterprises, from the waste. Since dumpster diving, also called skip diving is illegal in
Germany the initiative ‘Foodsharing’ was founded. Foodsharing.de is a platform where
consumers can share their food articles, which they cannot or will not use anymore. There are

Reducing household bakery waste in Germany: A Communication Strategy
12
so called “foodsavers”, which are in contact with supermarkets and go there in the evening to
collect the food, which cannot be sold anymore during the next day. ‘Slow food Deutschland
e.V’. another enterprise that is concerned with the topic of food. This NGO works together
with the ‘Zu gut für die Tonne’ initiative; but they also developed their own motto called
‘Teller statt Tonne’ which means plate instead of rubbish bin (Slow Food Deutschland e.V.,
2015). Ursula Hudson from Slow food Deutschland criticises the concept of the BMELV. She
writes that the core problem is ignored. The value we have in our German society for our food
is not high enough. At the moment quantity seems to be more important than quality. They
further state that a fundamental reform on all stages of the food system is necessary to change
the ‘prevailing nutritional and production model’ (Slow Food Deutschland e.V., 2012). She
writes that “more than a treatment of symptoms” needs to be done. There is a growing interest
in the topic of food waste. It is important to find solutions so that we can feed the people of
our planet.
The Present Study
The current study only concentrates on the individual-end user because the most food
waste can be avoided in the households, through the consumer. It intents on the preventable
bakery waste produced by German end-consumers. It is the aim to test whether a
communication strategy is effective to make consumers develop the intention to reduce their
bakery waste.
Bakery products quickly change their consistency. As soon as the consistency
changes, it is not seen as fresh anymore. Nowadays old bread is hardly used in recipes. Since
every product group needs to be stored in different ways, some in the freezer, some in the
fridge and others at room temperature, this study concentrates on bakery products. The
intervention will give suggestions about how to deal with bakery products. Bakery products
are made out of grain such as wheat, spelt, rye, barley and many others. Next to vegetable and
fruits, grain is the most wasted product group. Kranert et al. (2012) gives an amount of 20%
from the overall wasted food; whereas WWF (2015) estimate the percentage of grain products
at 16% of the total food waste.
The changeable factors that is concentrated on, are distal determinants that can be
influenced through an intervention campaign. The theory of planned behaviour deals with
some of this changeable determinants. Based on this theory, used to test the communication
strategy about bakery waste, the following research model (see figure 2) is explored. A further

Reducing household bakery waste in Germany: A Communication Strategy
13
variable, Past attention towards reducing bakery waste, is added to the theory, hereby the
research model of this study is constructed. The additional factor is added, because it is
expected that the influence of the information sheet is stronger on people that did not pay
attention to reducing their own bakery waste so far.
Figure 2. Research model
For a communication strategy, it is first necessary to inform the people about the
problem. When having a look at the reasons why people waste food, it becomes clear that
many people lack knowledge (Miafodzyev & Brand, 2013) about the problem of food waste
and about the right handling with all the different food articles. Some food articles need to be
stored dark, others need to be stored cold, some have to be thrown away after the date of
expiry, and others can still be used years after the expiration date without someone getting
sick after eating it. It always depends on the food category. For changing people’s behaviour,
they need the motivation to do so. A motivational change can be reached through giving
information and thus changing the knowledge people have. However, knowledge alone is
often not enough to make people behave in a different way. Emotional involvement is as
important as knowledge about the problem (Kollmus & Agyemann, 2002).
To follow the aim of the study a communication strategy in form of a digital
information sheet that influences consumer’s behaviour towards reducing bakery waste will
be created. Consumers should not only understand the problem, but also develop the intention
to save grain products and then act according to this intention. Therefore, they will receive a
message with information on bakery waste, where some advice is given about how to reduce
Perceived
Behavioural
Control
Subjective
Norm
Intention to Reduce Bakery
Waste
Digital Info
Sheet about
Bakery
Waste
Past Attention
towards Bakery
Waste
Attitude H1
H2
H4
H3
H5: a b c d

Reducing household bakery waste in Germany: A Communication Strategy
14
bakery waste. The emotional message of this information sheet is that children in
underdeveloped countries are starving.
Hypotheses
According to the research model and the research question, the following hypotheses
are formulated:
H1: After reading the information sheet about bakery product waste with explanations of the
consequences and activity suggestions, respondents have a stronger attitude towards
reducing bakery waste than participants who did not see the information sheet (main effect).
H2: After reading the information sheet about bakery product waste with explanations of the
consequences and activity suggestions, respondents have a more positive subjective norm
towards reducing bakery waste than participants who did not see the information sheet (main
effect).
H3: After reading the information sheet about bakery product waste with explanations of the
consequences and activity suggestions, respondents have a more positive perceived
behavioural control to decimate their bakery waste than participants who did not see the
information sheet (main effect).
H4: After reading the information sheet about bakery product waste with explanations of its
consequences and activity suggestions, respondents have a stronger intention to decimate
their bakery waste than participants who did not see the information sheet (main effect).
What might also be interesting is whether people that are already interested in the
topic of bakery waste and are attentive to reduce their food waste or don’t produce any food
waste, are less influenced by the manipulation than people who do not care for bakery waste
so far. To test this, the following interaction effect will be tested:
H5: The expected effects (on attitude (a), subjective norm (b), perceived behavioural
control(c) and intention (d)) will be more pronounced for participants, that were not attentive
in the topic of bakery product waste so far (interaction effect).

Reducing household bakery waste in Germany: A Communication Strategy
15
Methodology
Participants
Respondents of this study were adult people, living in Germany or having German as
their first language (exclusion criteria, one of these criteria had to be fulfilled). Approximately
550 participants were approached via Facebook and a few via email. Three hundred forty two
of them participated in the study. Most filled in all the questions of the online experiment, but
34 of them stopped just before the last question, which was a voluntary question for those
who wanted to give their opinion, remarks or suggestions (response rate 62% = number of
sent links/number responses). One person had to be excluded because of the exclusion criteria
described above. Of those 341 participants left, 162 participants were randomly assigned to
the info group and 179 to the control group.
The sample of participants is a convenience sample mainly consisting of young people
(M = 27 years old SD = 7.86, minimum = 18, maximum = 91). The sample consists of 289
women and 52 men (15%). Most of them visited a secondary school and 130 had had higher
education. Three hundred twenty six participants are actually living in Germany and twelve
people in the Netherlands. Most of the respondents were living in a shared apartment, namely
33%, whereas 27% was living with a partner. Fourteen percent of the respondents were living
with family and 20% was living alone. Since it was an online questionnaire, via the online
platform “Qualtrics”, only participants who had a computer or a smartphone available could
fill in the questions.
Randomization Check
Participants were randomly assigned to one of the two conditions. To test whether the
two groups of participants were significantly different from each other, a randomization check
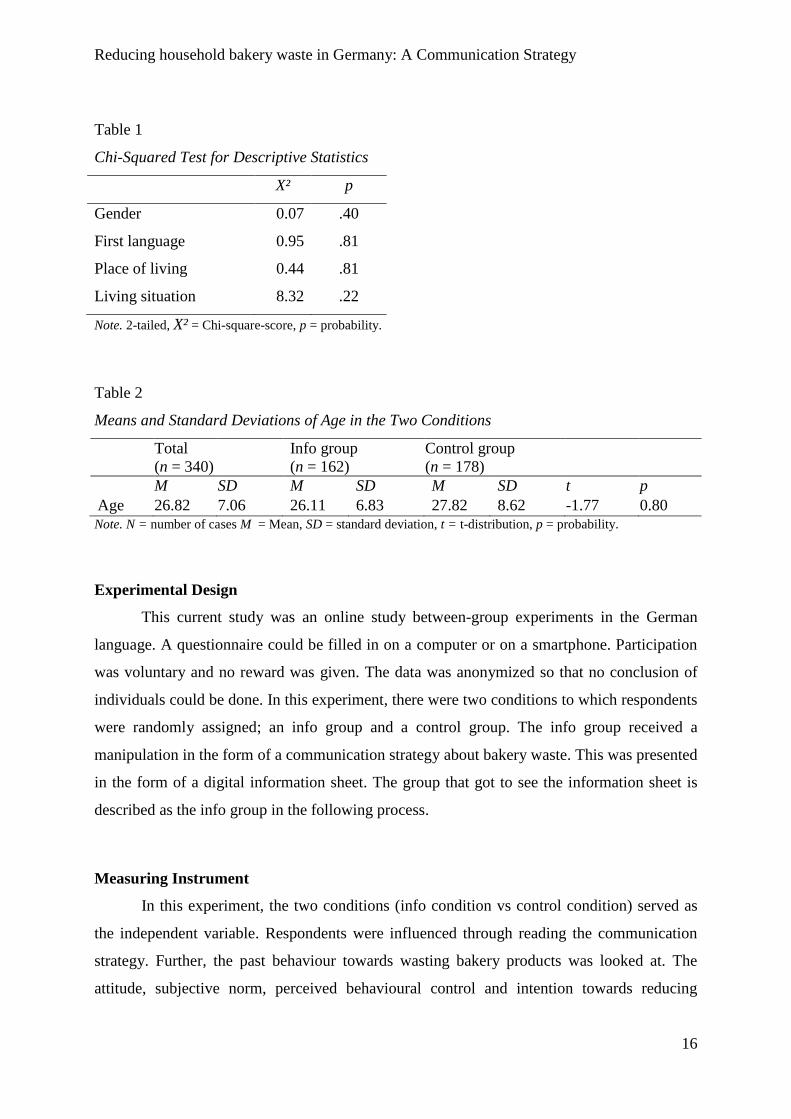
was executed. A chi-squared test showed that the determinants gender X²(6, N=340) = 0.70, p
= .40, first language X²(3, N=340) = 0.95, p = .81, place of living X²(2, N=340) = 0.44, p = .81
and living situation X²(6, N=340) = 8.32, p = .22, were equally distributed over the two groups
(see Table 1) also highest graduation, for which a Mann-Whitney U test was used was equally
distributed Z = -0.81, p = .41. There was no significant difference between the two groups.
Nevertheless, with an alpha of five percent there was a difference in the t- test between
the two groups with reference to age t(1,339) = -2.01, p = .04. When the outliers (persons
older than 60) are kept of (only one person), it can be seen (Table 2), that the two groups do
not significantly differ from each other concerning age t(1,338) = -1.77, p = .80).
Reducing household bakery waste in Germany: A Communication Strategy
16
Table 1
Chi-Squared Test for Descriptive Statistics
X² p
Gender 0.07 .40
First language 0.95 .81
Place of living 0.44 .81
Living situation 8.32 .22
Note. 2-tailed, X² = Chi-square-score, p = probability.
Table 2
Means and Standard Deviations of Age in the Two Conditions
Total
(n = 340)
Info group
(n = 162)
Control group
(n = 178)
M SD M SD M SD t p
Age 26.82 7.06 26.11 6.83 27.82 8.62 -1.77 0.80 Note. N = number of cases M = Mean, SD = standard deviation, t = t-distribution, p = probability.
Experimental Design
This current study was an online study between-group experiments in the German
language. A questionnaire could be filled in on a computer or on a smartphone. Participation
was voluntary and no reward was given. The data was anonymized so that no conclusion of
individuals could be done. In this experiment, there were two conditions to which respondents
were randomly assigned; an info group and a control group. The info group received a
manipulation in the form of a communication strategy about bakery waste. This was presented
in the form of a digital information sheet. The group that got to see the information sheet is
described as the info group in the following process.
Measuring Instrument
In this experiment, the two conditions (info condition vs control condition) served as
the independent variable. Respondents were influenced through reading the communication
strategy. Further, the past behaviour towards wasting bakery products was looked at. The
attitude, subjective norm, perceived behavioural control and intention towards reducing
Reducing household bakery waste in Germany: A Communication Strategy
17
bakery waste served as dependent variables. The questionnaire (see Appendix A) was
developed to measure people’s intention to reduce baking waste after reading a
communication strategy about the problem.
Past Behaviour towards Baking Products
The first questions of the questionnaire were about the past behaviour towards baking
products. It was asked how many baking products the respondent consumes, how often the
person buys baking products and then it was asked whether the person was already attentive
to the topic of reducing baking waste.
Evaluation Items
To evaluate the communication strategy six items were given. Those six items asked
for the participant’s opinion about the information sheet. The first thesis asks whether the
information sheet was stimulating the subject or not, the second thesis asks whether it was
able to change the thoughts about bakery products, the third was a thesis that said that the
topic on the information sheet is relevant, then a thesis that asks whether the poser made
thinking followed, next a thesis that asks whether the information sheet was able to make the
topic important was given and as last participants had to evaluate on the negative formulated
thesis “The topic of bakery product waste is not interesting for me”.
Attitude
The attitude scale was meant to measure people’s relation and opinion about the
reduction of bakery waste. The attitude towards baking waste was measured with ten items on
a Seven-Point-Likert scale that runs from I do not agree at all to I totally agree. This scale
was intended to measure how participants perceived the problem of bakery waste. Example:
“It is personally important to me to avoid bakery waste”. Cronbach’s alpha was sufficiently
reliable (α = .82, N of items = 7). Of the seven items, two were formulated in a negative way,
so that respondents had to read attentively every single statement. There was one single factor
within the attitude scale. It explained 50 % of the variance, with an eigenvalue greater than
one.

Reducing household bakery waste in Germany: A Communication Strategy
18
Subjective Norm
The subjective norm scale was intended to measure the participants perceived social
pressure to reduce bakery waste. The subjective norm towards reducing baking waste was
measured with seven items. Participants had to choose on a Seven-Point-Likert scale from I
do not agree at all to I totally agree how much they agreed with each of the seven statements.
This was measured with items like: “People that are important to me have a negative attitude
towards bakery waste”. Cronbach’s alpha was sufficiently reliable, (α =.75, N of items = 5).
Factor analysis showed that there was one factor, which could explain 52 % of the variance of
this scale; eigenvalue greater than one.
Perceived Behavioural Control
The perceived behavioural control scale was intended to measure the participants’
perceived ability to reduce bakery waste. Perceived behavioural control towards reducing
baking waste was measured by means of seven items on a Seven-Point-Likert scale from I do
not agree at all to I totally agree. It was measured with items like: “I feel able to reduce my
bakery waste during the next weeks”. Reliability of the scale was sufficiently (α = .71, N of
items = 5). Factor analysis indicated that there was one factor which was able to explain 48 %
of the variance; eigenvalue greater than one.
Intention
The intention scale was intended to measure participants tendency to really execute the
desired behaviour. The dependent variable, the intention towards reducing baking waste was
measured with ten items on a Seven-Point-Likert scale from I do not agree at all to I totally
agree. Example: “In the future I’ll freeze my bread if it is too much for my use”. Cronbach’s
alpha was sufficiently reliable, (α =.76, N of items = 7). Factor analysis showed that there was
one factor, which could explain 43 % of the variance of this scale; eigenvalue greater than
one.
Demographic Variables
At the end of the survey, participants were asked to fill in some questions about their
socio economic background. They were asked their age, their gender, their education, their
first language, their place of living and their living situation. Except age, all these questions
Reducing household bakery waste in Germany: A Communication Strategy
19
were nominal questions. As a last step, participants could give their opinion, feedback or
suggestions about the survey.
Manipulation
To make the manipulation work, the introduction/briefing of the questionnaire was as
neutral as possible, trying to give all necessary information without influencing the
participant. Next, the participants received three questions concerning their actual behaviour
towards their present behaviour with baking products. They were asked how many baking
products they consumed, how often they bought them and if they were already concerned
with diminishing food waste. Depending on the group, participants were assigned to, some of
them next viewed the communication strategy with hard facts about the problem of food
waste, the consequences our discard has on poverty in African countries and on the grain
prices and suggestions about how to reduce bakery waste during planning, shopping, cooking,
storing and keeping leftovers. The behaviour suggestions were tips for each step in which
consumers could reduce wasting food. It was concerned with planning, buying, storing,
cooking and dealing with leftovers. The digital information sheet was a vertical DIN A4 Page
with a headline, with general information about the problem on the left side and with
suggestions about what each consumer can do, on the right side. Above the two texts, there
were two pictures. One of them shows a garbage can full with baking waste and the other
picture shows a thin African child with an empty bowl that sits in front of a trashcan from
Europe full of food waste.
Procedure
Starting the 29 October 2015 participants filled in the online experiment via
“Qualtrics”. Completing the questionnaire took about twelve minutes, depending on whether
people saw the information sheet or not. First for both conditions an introduction text with all
relevant information was given. Next participants had to agree with the informed consent and
then start with questions concerning their past behaviour. It was asked how often they
consume baking products, how often they buy them and if they already paid attention to their
bakery waste. Then the info group saw the information sheet with the hint to read it carefully
because of the following questions concerning the content. Next, the info group had to
evaluate the information sheet by answering 6 items on a Seven-Point-Likert scale from “I do
not agree at all” to “I totally agree”. Participants in the control group directly got to see the
Reducing household bakery waste in Germany: A Communication Strategy
20
items about attitude, subjective norm, perceived behavioural control and intention without
having seen the information sheet. The info group saw the questions after having seen the
information sheet and evaluating it. These questions had to be filled in by the info group and
by the control group. Then demographic variables (age, gender, education, language, place of
residence and living situation) had to be answered by both groups. All those questions were
obligatory to finish the questionnaire. Only the last question, where participants could give
suggestions and remarks was optional. At the end of the questionnaire, participants were
thanked, informed about the aim of the study and debriefed.
Analysis Procedure
The website “Qualtrics” gathered the results of the questionnaire. The results then
could be analysed via the statistical program IBM SPSS. Before starting the analysis of the
data, the data had to be checked to avoid mistakes and biases. It was checked that all
participants were indeed living in Germany or had German as their first language. Next, all
negative items had to be transcoded and then the reliabilities of the subscales were checked
and new variables with the total mean per subscale were created. After that, it was looked at
the distribution of the data. The means of all scales were normal distributed, so that the
analysis could start.
Reducing household bakery waste in Germany: A Communication Strategy
21
Results
Descriptive Statistics
The aim of this study was to test a communication strategy’s effect on the attitude,
subjective norm, perceived behavioural control and intention to produce less baking waste.
Before presenting the results of the hypotheses, some general information about the data is
given. The means and standard deviations of the different subscales can be found in Table 3.
Participants have a positive attitude about reducing their bakery waste (M = 5.84, SD = 0.92) ;
they think that others in their surrounding expected them to reduce their bakery waste
eventually (M = 4.84, SD = 0.98); they feel that they can reduce their bakery waste (M = 5.69,
SD = 0.90) and they have the intention to reduce their bakery waste(M = 5.65, SD = 0.87).
Having a closer look at the past behaviour of participants, it can be observed that 79% of the
participants indicated that they were already engaged with reducing bakery waste during the
last month (M = 5.09, SD = 1.35). Only 17% indicated that they were not yet busy with
avoiding bakery waste.
Table 3
Means and Standard Deviations of Attitude, Subjective Norm, Perceived Behavioural
Control, Intention and Past Attention to Reduce Bakery Waste
Total
(N = 340)
Info group
(n = 162)
Control group
(n = 178)
M SD M SD M SD F p
Attitude 5.84 0.92 5.82 0.96 5.85 0.89 0.09 .77
Subjective Norm 4.84 0.98 4.90 0.96 4.80 0.99 0.85 .36
Perceived Behavioural Control 5.69 0.80 5.75 0.85 5.63 0.95 1.64 .20
Intention 5.65 0.87 5.62 0.85 5.67 0.89 0.25 .62
Attention 5.09 1.35 5.09 1.35 5.09 1.35 0.00 .98
Note. n= number of cases M = Mean, SD = standard deviation, F = Fisher’s F ratio, p = probability.
To check whether the manipulation was really looked at through the info group, the
time that both groups spend on the questionnaire was looked at. This between-subject test was
done with the 309 respondents that completely filled in the survey. Six outliers were ignored,
because they spend more than 60 minutes on the questionnaire. The result showed that the
info group (M = 10.94, SD = 6.43) spend averaged 1.7 minutes on the information sheet.

Reducing household bakery waste in Germany: A Communication Strategy
22
To test whether the research model (see Figure 2) makes sense, correlations
between the different factors were tested (see Table 4). Correlations confirmed the
relationship between the dependent variables. As expected, attitude, subjective norm
and perceived behavioural control were positively correlated to the intention reducing
bakery waste. Furthermore, those factors also correlated positively with each other.
Especially the relationship between attitude and intention (r = .65) and between
perceived behavioural control and intention (r = .66) was strong. The past attention
towards reducing bakery waste also correlated positively with the dependent variables
of the model.
Table 4
Correlations of Attitude, Subjective Norm, Perceived Behavioural Control and Intention to
Reduce Bakery Waste
N
Attitude
Subjective
norm
Perceived
behavioural
control
Intention Attention
Attitude 340 - - - - -
Subjective norm 340 .38* - - - -
Perceived Behavioural
control 340 .46* .28* - - -
Intention 340 .65* .36* .66* - -
Attention 340 .56* .20* .36* .44* -
Note. *p < .001, 2-tailed, N= number of responses.
The evaluation of the information sheet made visible that people find the topic of the
information sheet relevant (M = 6.26, SD = 1.13) and that the topic of the information sheet
made people think, but participants don not indicate that the information sheet changed their
way of thinking (M = 3.32, SD = 1.64).
Hypotheses Testing
Main Effects
Beforehand it was predicted that participants who read the digital information sheet
about bakery waste have a more positive attitude towards reducing their bakery waste than
Reducing household bakery waste in Germany: A Communication Strategy
23
participants that did not read the information sheet. It was also expected that the group of
participants that read the information sheet, has a stronger subjective norm, a better perceived
behavioural control and a higher intention towards reducing bakery waste. Results do not
confirm these hypotheses. One-way ANOVA do not show any significant results concerning
hypotheses 1-4. On the mean level per subscales are no differences between the two
conditions (see Table 3). Participant’s attitude (Hypothesis 1) is not more positive after
reading the information sheet than participant’s attitude that did not read the information sheet
F(1,338) = 0.14, p = .70. Furthermore the information sheet has no significant effect on
participant’s subjective norm (Hypothesis 2) F(1,338) = 0.86, p = .35 nor on participants
perceived behavioural control (Hypothesis 3) F(1,338) = 1.41, p = .24 nor on their intention
(Hypothesis 4) to reduce bakery waste F(1,338) = 0.34, p = .56. This means that there is no
evidence that the information sheet had effect on the person’s attitude towards bakery waste,
the subjective norm, perceived behavioural control and intention to minimize bakery waste.
Moderator Analysis
Although no significant causation was found between the information sheet and the
dependent variables: attitude, subjective norm, perceived behavioural control and intention a
moderator analysis was executed. This was done because it was expected that the
communication strategy is not working for people that already payed attention to reducing
their bakery waste. It was expected that it could still work for people who did not know
anything about reducing food waste and was not occupied with avoiding food waste so far.
Further correlations between independent and dependent variables were tested. There was a
predictive connection found between all variables (see Table 4). That is why an interaction
effect is possible. It was expected that the main effects described above are more pronounced
for participants that were not attentive to reducing bakery waste in the past (interaction
effect). Even there are no significant main effect hypotheses 5 is tested. It was expected that
the effect is not significant because people already had knowledge about avoiding food waste.
It was expected that the effect of the information sheet on attitude (H5a) is stronger for people
that did not pay attention to avoiding bakery waste so far. Moderator analysis with the centred
independent variables (see Table 5) did not show the expected effect (β = .02, p = .61).
Reducing household bakery waste in Germany: A Communication Strategy
24
Table 5
The Interaction Effect from Information and Past Attention on Attitude
Model 1 Model 2 Model 3
B SE β p B SE β p B SE β p
Information .03 .10 .02 .77 .03 .08 .02 .71 .03 .08 .02 .71
Attention .38 .03 .56 .00 .38 .03 .56 .00
Information*Attention .03 .06 .02 .61
R² .00 .31 .31
R² Change .00 .31 .00
Note. B = regression coefficient, SE(B) = standard error, β = regression coefficient, p = significance,
R² = coefficient of determination.
In addition, the effect on subjective norm (H5b) was expected to be stronger for people
that did not pay attention to avoiding bakery waste so far. Moderator analysis (see Table 6)
did not show significant results concerning subjective norm (β = -.05, p = .34).
Table 6
The Interaction Effect from Information and Past Attention on Subjective Norm
Model 1 Model 2 Model 3
B SE β p B SE β p B SE β p
Information -.10 .11 -.05 .36 -.10 .10 -.05 .35 -.10 .10 -.05 .35
Attention .14 .04 .20 .00 .12 .04 .20 .00
Information*Attention -.07 .08 -.05 .34
R² .00 .04 .05
R² Change .00 .04 .00
Note. B = regression coefficient, SE(B) = standard error, β = regression coefficient, p = significance,
R² = coefficient of determination.
Next, the moderator effect of past attention and condition on perceived behavioural
control (H5c) was tested within a moderator analysis (see Table 7). There are no significant
results found (β = .06, p = .24).

Reducing household bakery waste in Germany: A Communication Strategy
25
Table 7
The Interaction Effect from Information and Past Attention on Perceived Behavioural Control
Model 1 Model 2 Model 3
B SE β p B SE β p B SE β p
Information -.23 .10 -.07 .20 -.12 .09 -.07 .18 -.12 .09 -.07 .18
Attention .24 .03 .36 .00 .24 .03 .36 .00
Information*Attention .08 .07 .06 .24
R² .01 .13 .14
R² Change .00 .13 .00
Note. B = regression coefficient, SE(B) = standard error, β = regression coefficient, p = significance,
R² = coefficient of determination.
The last part of hypothesis H5 is the interaction effect of condition and past attention
on the intention to reduce bakery waste (H5d). Also within this moderator analysis (see Table
8), no significant results are found (β = .01, p = .91).
Table 8
The Interaction Effect from Information and Past Attention on Intention
Model 1 Model 2 Model 3
B SE β p B SE β p B SE β p
Information .05 .10 .03 .62 .05 .09 .03 .57 .05 .09 .03 .57
Attention .29 .03 .44 .00 .29 .03 .44 .00
Information*Attention .01 .06 .01 .91
R² .00 .20 .20
R² Change .00 .20 .00
Note. B = regression coefficient, SE(B) = standard error, β = regression coefficient, p = significance,
R² = coefficient of determination.
With respect to the moderator analysis, it is concluded that there is no interaction
effect of the variable past attention on the dependent variables. This means that the
information sheet does not influence peoples attitude, subjective norm, perceived behavioural
control nor intention, even not when people did not pay attention to avoiding bakery waste in
the paste.

Reducing household bakery waste in Germany: A Communication Strategy
26
Discussion
Each year an enormous amount of food is thrown away, this amount urgently needs to
be diminished because it effects our environment and it has influence on poverty in
underdeveloped countries. There is a need for a change in behaviour in our developed society.
The main concern is the large amounts of food waste, produced by German consumers is
worth reducing. Such a behaviour change can be reached through intervention campaigns, but
until know there is little evidence over which communication strategies are useful to change
people’s wasting behaviours (Sharp, Giorgi & Wilson, 2010). Barnett and others (2011) claim
that “The need for improved strategies and tools for communication about food risks and
benefits is […] paramount” (Barnett et al., 2011, p. 1).
This study was conducted to examine the effect of a communication strategy of
German consumers on their intention to reduce bakery waste. An attempt was made to change
participant’s attitude, subjective norm, perceived behavioural control and intention to reduce
bakery waste with the help of an online information sheet. To test whether the developed
information sheet is able to change the four factors described above, a between group
experiment was done. There was no difference between the two groups found. This means
that the information sheet has no influence on attitude, subjective norm, perceived
behavioural control and intention to reduce bakery waste.
As it can be seen from the results section, no hypothesis is confirmed. There is no
effect of the developed information sheet on attitude, subjective norm, perceived behavioural
control and intention. There is also no interaction effect with past attention. This means that
the digital information sheet is not able to change either people’s attitude, nor subjective
norm, perceived behavioural control and intention. There is also no effect on people that were
not attentive to avoiding bakery waste in the past. The theory of planned behaviour states that
attitude, subjective norm and perceived behavioural control are able to change someone’s
intention. In this current study, there are positive correlations between all these factors, which
show, that there is indeed a relationship, but there is no causation on those factors through the
information sheet.
To the researchers knowledge there are no studies, which examine the effect of an
information sheet on consumers reducing bakery waste. For this reason and for the reason that
the manipulation and the questionnaire are developed by the researcher and never used before,
it is difficult to compare the results with those of other studies. However, there is one study
from Whitehair and others (2013) who found that, a short message is enough to make people
Reducing household bakery waste in Germany: A Communication Strategy
27
reduce their wasting behaviour and that a more personalized feedback-based message is not
able to make people further reduce their food waste. They concluded that making people
aware of the topic is useful improving people’s behaviour. Their result can give a further
explanation why the manipulation of this study was not working as expected. It is possible
that the briefing (introduction) of the questionnaire was already enough to make participants
aware of the food waste problem and that there was no additional effect of the information
sheet on participants that saw it.
In the period of this bachelor thesis there was not the possibility to invest more time in
creating a pilot test in order to get a more reliable and valid scale. The main emphasis was not
the development of the questionnaire, but to test whether the information sheet has an effect
on the intentions of German consumers to reduce their bakery waste.
In the literature it is said that it is important to enable, engage and encourage (Sharp,
Giorgi & Wilson, 2010) people within an intervention campaign to change their behaviour.
This was done with the information sheet as good as possible with a single digital information
sheet. Sharp, Giorgi and Wilson (2010) also states that a collection “of measures that will
have impact” (p. 256). The information sheet alone was not able to change people’s intention
towards reducing bakery waste. Until now, there is little evidence about what kind of
intervention works to make people reduce their bakery waste. The study of Sharp, Giorgi and
Wilson (2010) examines different interventions that are intended to change people’s wasting
behaviour. Within the construction of the digital information sheet, the Defra 4Es behaviour
change framework (enable, engage, encourage, exemplify) (Cox, et al., 2010) was looked at to
develop an instrument that is as effective as possible. However, within an information sheet it
is difficult to enable people’s behaviour. To really implement such a model, an intervention
that goes deeper is necessary. According to the literature (Sharp, Giorgi and Wilson, 2010)
feedback, helplines, guidance and support projects are useful. Evidence shows, that user-
centered design techniques as individual interviews and usability testing, are most successful
in successfully communicate risks (Fischhoff, 2012). Also Festinger (1957) claims that a
unique information strategy is not enough to create permanent change. These sources give the
indication that the information sheet alone was not convincing. According to Festinger (1957)
other simple campaigns, like a film would not be able to change human behaviour
permanently. In the framework of this bachelor thesis, a more pronounced information
strategy would have cost too much time and was therefore not implemented.
Reducing household bakery waste in Germany: A Communication Strategy
28
As it can be seen in the result section, respondents looked at the information sheet for
an average of 1.7 minutes. It is possible to read the information sheet during this time, if you
are quick reader, but it is almost impossible to internalize its content in less than two minutes.
This indicates, that another reason that the information sheet had no effect on its readers,
could be that is was not read carefully. An explanation for this could be the length of the text,
which was one page, or the message, which was not able to make people feel personally
involved. It is possible to do further research with a more personalized story of a family living
with hunger.
Further points regarding the validity of the study have to be addressed. First, it should
be mentioned that no specific target group was chosen. The respondents of this sample were
mostly highly educated women between 20 and 30 years old. This means, that the respondents
are not representing the average consumer. There were more women; they were educated to a
higher level and younger than the average consumer was. Young adults between 18 and 25
years are still forming their attitude towards many issues. In contrast to older people, they are
easier to influence, especially by using the affective level to persuade them (Fischhoff,
2012). Older people are already shaped by more years of experience and they are already used
to a certain way of dealing with food, which is more difficult to change than the attitude or
behaviour of young people, which are living alone, without parents for the first time in their
life. Therefore, this sample is not very representative for the German consumer population.
External validity would have been increased with a random chosen sample of German
consumers. For further research, it is recommended to choose a specific target group, so that
the group and their wasting habits can be studied and then to choose the sample randomly
from the German population. However, the three strong points of this study are, the good
reliability of the developed test, the good randomization between the two groups and the large
number of participants that were approached.
Although results were not confirmed, this study has useful implications for designing
information strategies and interventions about food waste. It shows that, in the case of food
waste, one single measure, like an information sheet, is not sufficient to produce a
behavioural change among consumers.
Reducing household bakery waste in Germany: A Communication Strategy
29
References
Ajzen, I. (1991). The theory of planned behavior. Organizational behavior and human
decision processes, 50(2), 179-211. University of Massachusetts, Amherst.
Barnett, J., McConnon, A., Kennedy, J., Raats, M., Shepherd, R., Verbeke, W.,
.Kuttschreuter, M.. & Wall, P. (2011). Development of strategies for effective
communication of food risks and benefits across Europe: Design and conceptual
framework of the FoodRisC project. BMC public health, 11(1), 308.
Bundesministerium Ernährung Landwirtschaft und Verbraucherschutz. (2012).
Partnerbookled - Zu gut für die Tonne. Berlin: Bundesministerium Ernährung,
Landwirtschaft und Verbraucherschutz. Retrieved 11 October 2015 from
https://www.zugutfuerdietonne.de/.
Cofresco Frischehalteprodukte GmbH &Co. KG. (2011). Das Wegwerfen von Lebensmitteln-
Einstellungen und Verhaltensmuster. Ergebnisse Deutschland. Save Food Studie.
Retrieved 18 November, from www.cofresco.de/pdf/
Results_Save_Food_Study_Germany.pdf.
Cox, J., Giorgi, S., Sharp, V., Strange, K., Wilson, D. C., & Blakey, N. (2010). Household
waste prevention - a review of evidence. Waste Management & Research, 28(3), 193-
219.
Damasio, A. (1994). Descartes' error and the future of human life. Scientific
American, 271(4), 144.
Defra (2008). A Framework for pro-environmental behaviour. Retrieved 4 December 2015
from https://www.gov.uk/government/uploads/system/uploads/
attachment_data/file/69277/ pb13574-behaviours-report-080110.pdf.
Festinger, L. (1957). A Theory of cognitive dissonance. Stanford, CA: Stanford University
Press.
Fischhoff, B. (2012). Communicating Risks and Benefits: An Evidence Based User's Guide.
Government Printing Office.
Food Standards Agency (2008). Consumer attitudes to food standards. Retrieved 2 October
2015 from www.food.gov.uk/multimedia/pdfs/cas2007ukreport.pdf.
Foodsharing. (2015). Retrieved 24 September 2015 from www.foodsharing.de.
Glanz, R. (2009). Causes of food waste generation in households - an empirical analysis
Master thesis Universität für Bodenkultur Wien, Diplomarbeit. Retrieved 22
September from www. wau. boku. ac. at/11754.

Reducing household bakery waste in Germany: A Communication Strategy
30
Janssen, E., Van der Sluis, M., Jonkers, R., De Haan, C., 2010.
Voedselverspilling in huishoudens: determinantenonderzoek. ResCon Research &
Consultancy, Amsterdam.
Kollmuss, A., & Agyeman, J. (2002). Mind the gap: why do people act environmentally and
what are the barriers to pro-environmental behavior? Environmental education
research, 8(3), 239-260.
Kranert, M., Hafner, G., Barabosz, J., Schuller, H., Leverenz, D., Kölbig, A., ... &
Scherhaufer, S. (2012). Ermittlung der weggeworfenen Lebensmittelmengen und
Vorschläge zur Verminderung der Wegwerfrate bei Lebensmitteln in
Deutschland. Studie der Universität Stuttgart. Retrieved 21 November 2015 from
www. bmelv.de/SharedDocs/Downloads/Ernaehrung/WvL/
Studie_Lebensmittelabfaelle_Langfassung.Pdf.
Lea, E., & Worsley, A. (2008). Australian consumers’ food-related environmental beliefs and
behaviours. Appetite, 50(2), 207-214.
Lipinski, B., Hanson, C., Lomax, J., Kitinoja, L., Waite, R., & Searchinger, T. (2013).
Reducing food loss and waste. World Resources Institute Working Paper.
Miafodzyeva, S., & Brandt, N. (2013). Recycling behaviour among householders:
synthesizing determinants via a meta-analysis. Waste and Biomass Valorization,4(2),
221-235.
Noleppa, S. & Cartsburg, M. (2015). Das grosse Wegschmeissen – Vom Acker bis zum
Verbraucher: Außmaß und Umwelteffekte der Lebensmittelverschwendung in
Deutschland. WWF Deutschland.
Pfau C. & Piekarski J. (2003). Consumers’ competence in handling food. Journal of Food
Engineering, 56(2-3), 295-297.
PRB. (2015). World population datasheet. Population Reference Bureau, Washington.
Selzer, M. (2010). Die Entsorgung von Lebensmitteln in Haushalten: Ursachen-Flüsse-
Zusammenhänge. na. Wien: Universität für Bodenkultur Wien, Diplomarbeit.
Slow Food Deutschland e. V. (2012). BMELV Kampagne gegen Lebensmittelverschwendung
ignoriert Kernproblem. Retrieved 25 September 2015, from
www.slowfood.de/presse/pressemitteilungen/pressemitteilungen_2012/bmelv_kampag
ne_gegen_lebensmittelverschwendung_ignoriert_kernproblem/.
Slow Food Deutschland e. V. (2015). Slow Food Deutschland. URL: Retrieved 30 September
2015, from www.slowfood.de/.
Thurn, V. (2011). Taste the Waste [Film]. Thurn, Deutschland.

Reducing household bakery waste in Germany: A Communication Strategy
31
Whitehair, K. J., Shanklin, C. W., & Brannon, L. A. (2013). Written messages improve edible
food waste behaviours in a university dining facility. Journal of the Academy of
Nutrition and Dietetics, 113(1), 63-69.
Wikipedia. (2015). Department for Environment, Food and Rural Affairs. Retrieved 2
October 2015, from www.en.wikipedia.org/wiki/
Department_for_Environment,_Food_and_Rural_Affair s#Defra_in_the_English_regions.
Wille, G., Junge, B., Bischofberger, C., Lohmann, D., & Bradel, I. (2002). Speiseabfallströme
als Aufgabe für die Entsorgungswirtschaft. Probleme der Mengenermittlung. Müll und
Abfall, 34(6), 318-321.
WRAP. (2006). Understanding Consumer Food Management Behaviour. Retrieved 13
October 2015, from www.wrap.org.uk/downloads/
FoodWasteResearchSummaryFINALADP29_3_07.c21ef22b.pdf.
WRAP. (2007). WRAP Food Behaviour Consumer Research. Unpublished report.
WRAP. (2008). The food we waste. Retrieved 4 October 2015, from
www.wrap.org.uk/downloads/The_Food_We_Waste_v2__2_.7080d4a3.pdf.
WWF (2015). WWF-Verbraucherkampagne #iamnature. Retrieved 6 October 2015, from
www.iamnature.wwf.de/.

Reducing household bakery waste in Germany: A Communication Strategy
32
Appendix A: Questionnaire
Backwarenverschwendung in deutschen Haushalten - Klara Brüggemann
Part: Welcome
Q1
Sehr geehrte Teilnehmerinnen und Teilnehmer,
herzlichen Dank für Ihr Interesse an meiner Befragung.
Schön, dass Sie sich die Zeit nehmen, diesen Fragebogen auszufüllen!
Dieser Fragebogen ist Teil meiner Bachelorarbeit im Fachbereich Psychologie an der Universität
Twente, in Enschede. Durch das Ausfüllen des Fragebogens leisten Sie einen wertvollen Beitrag zum
wissenschaftlichen Vorankommen beim Thema Lebensmittelverschwendung und helfen mir zudem
sehr weiter! In der Studie geht es um die Verschwendung von Backwaren (Brot, Brötchen, Kuchen
etc.) in Haushalten.
Die einzigen Teilnahmebedingungen sind ein Bezug zu Deutschland und Volljährigkeit. Die
Befragung wird circa 15 Minuten in Anspruch nehmen. Die Daten werden anonym erfasst, so dass
keine Rückschlüsse auf einzelne Personen möglich sind. Sie können die Umfrage jederzeit stoppen
oder abbrechen. In diesem Fall werden Ihre Daten nicht weiterverarbeitet.
Bitte beantworten Sie alle Antworten stets entsprechend Ihrer ehrlichen Meinung und ohne viel
nachzudenken - es gibt keine "richtigen" oder "falschen" Antworten.
Vielen Dank im Voraus und viel Spaß beim Ausfüllen!
Bei Fragen oder Anmerkungen können Sie sich gerne melden unter:
Liebe Grüße
Klara Brüggemann
Q2
Ich habe den obenstehenden Text gelesen und bin einverstanden mit der Teilnahme an dieser Studie.
Einverstanden (1)
Reducing household bakery waste in Germany: A Communication Strategy
33
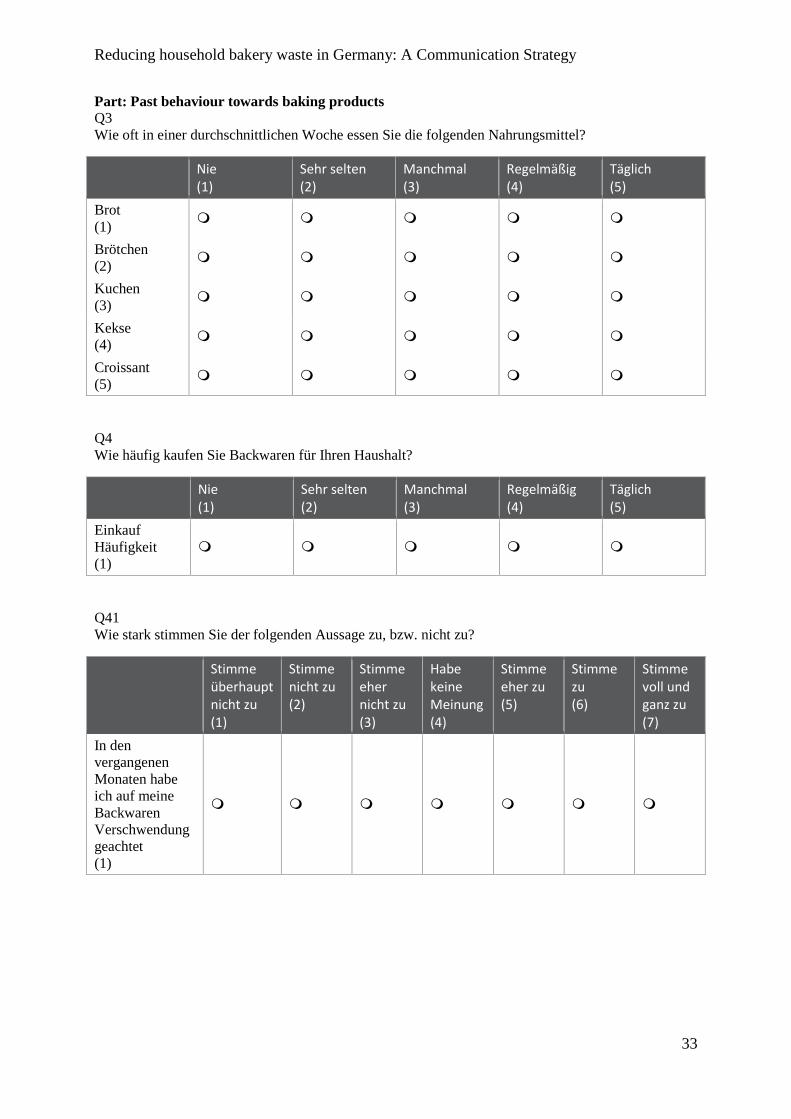
Part: Past behaviour towards baking products Q3
Wie oft in einer durchschnittlichen Woche essen Sie die folgenden Nahrungsmittel?
Nie (1)
Sehr selten (2)
Manchmal (3)
Regelmäßig (4)
Täglich (5)
Brot
(1)
Brötchen
(2)
Kuchen
(3)
Kekse
(4)
Croissant
(5)
Q4
Wie häufig kaufen Sie Backwaren für Ihren Haushalt?
Nie (1)
Sehr selten (2)
Manchmal (3)
Regelmäßig (4)
Täglich (5)
Einkauf
Häufigkeit
(1)
Q41
Wie stark stimmen Sie der folgenden Aussage zu, bzw. nicht zu?
Stimme überhaupt nicht zu (1)
Stimme nicht zu (2)
Stimme eher nicht zu (3)
Habe keine Meinung (4)
Stimme eher zu (5)
Stimme zu (6)
Stimme voll und ganz zu (7)
In den
vergangenen
Monaten habe
ich auf meine
Backwaren
Verschwendung
geachtet
(1)

Reducing household bakery waste in Germany: A Communication Strategy
34
Part: Manipulation Q5
Bitte lesen Sie sich das folgende Poster gut durch. Im Anschluss werden ein paar Fragen zum Inhalt
gestellt.
Q37

Reducing household bakery waste in Germany: A Communication Strategy
35
Part: Evaluation of the manipulation Q37
An dieser Stelle würde ich mich freuen, Ihre Meinung über das Poster zu hören.
Inwiefern stimmen Sie mit den folgenden Aussagen überein?
Stimme überhaupt nicht überein (1)
Stimme nicht zu (2)
Stimme eher nicht zu (3)
Habe keine Meinung (4)
Stimme eher zu (5)
Stimme zu (6)
Stimme voll und ganz zu (7)
Das Poster spricht mich
an
(7)
Meine Art über
Backwaren zu denken hat
sich verändert
(8)
Das Thema des Posters ist
relevant
(10)
Das Poster regt zum
Nachdenken an
(11)
Das Poster war im Stande,
das Thema für mich
wichtiger zu machen
(12)
Das Thema
Backwarenverschwendun
g interessiert mich nicht
(13)

Reducing household bakery waste in Germany: A Communication Strategy
36
Part: Attitude Q7
Nun werden Ihnen ein paar Aussagen präsentiert. Geben Sie bitte jeweils an, inwieweit Sie zustimmen
bzw. nicht zustimmen. Hierbei geht es um Ihre subjektive Meinung zum Thema
Lebensmittelverschwendung, es gibt also keine richtigen oder falschen Antworten!
Stimme üerhaupt nicht überein (1)
Stimme nicht zu (2)
Stimme eher nicht zu (3)
Habe keine Meinung (4)
Stimme eher zu (5)
Stimme zu (6)
Stimme voll und ganz zu (7)
Es ist mir persönlich
wichtig
Backwarenverschwendung
zu vermeiden
(8)
Ich mache mir Sorgen über
die große Mengen an
Backwarenverschwendung
(7)
Ich denke an die Armut in
der Welt, wenn ich
Backwaren in den Müll
schmeiße
(12)
Ich bin interessiert am
Thema
Lebensmittelverschwendun
g
(15)
Wenn Backwaren zu
schnell trocken oder
schimmelig werden, ist es
gerechtfertigt sie einfach
weg zu werfen
(16)
Ob ich Backwaren weg
werfe oder nicht, spielt
keine Rolle, da ohnehin
viele Backwaren
weggeschmissen werden
(17)
Wenn jemand Backwaren
weg wirft, schadet dies den
Armen der Welt kaum
(18)
Das Thema
Lebensmittelverschwendun
g interessiert mich nicht
genug um mein Verhalten
zu ändern
(19)

Reducing household bakery waste in Germany: A Communication Strategy
37
Ich habe ein schlechtes
Gewissen, wenn ich
Backwaren entsorge
(20)
Ich als Konsument spiele
nur eine kleine Rolle bei
der Entstehung von
Backwarenverschwendung
(21)

Reducing household bakery waste in Germany: A Communication Strategy
38
Part: Subjective Norm Q8
Was könnten Menschen, die Ihnen wichtig sind über das Thema Lebensmittelverschwendung denken?
Geben Sie bitte jeweils an, inwieweit Sie zustimmen bzw. nicht zustimmen.
Stimme überhaupt nicht überein (1)
Stimme nicht zu (2)
Stimme eher nicht zu (3)
Habe keine Meinung (4)
Stimme eher zu (5)
Stimme zu (6)
Stimme voll und ganz zu (7)
Wichtige Menschen in
meinem Leben stehen
Lebensmittelverschwendun
g negativ gegenüber
(8)
Wichtige Menschen in
meinem Leben fänden es
gut, wenn ich trockene
Backwaren schneller mal
wegschmeißen würde
(7)
Ich würde stark verurteilt
werden, wenn ich mehr
Backwaren wegschmeiße
als nötig?
(10)
Menschen in meiner
Umgeben finden es gut
wenn ich auf die
Reduzierung von
Verschwendung bei
Backwaren achte
(11)
Menschen in meiner
Umgebung achten selbst
auf die Reduzierung von
Backwarenverschwendung
(12)
Menschen die mir wichtig
sind, finden es gut wenn
ich eine Einkaufsliste mit
zum Einkauf nehme
(13)
Menschen die mir wichtig
sind, sind sich des
Problems von
Backwarenverschwendung
bewusst.
(14)
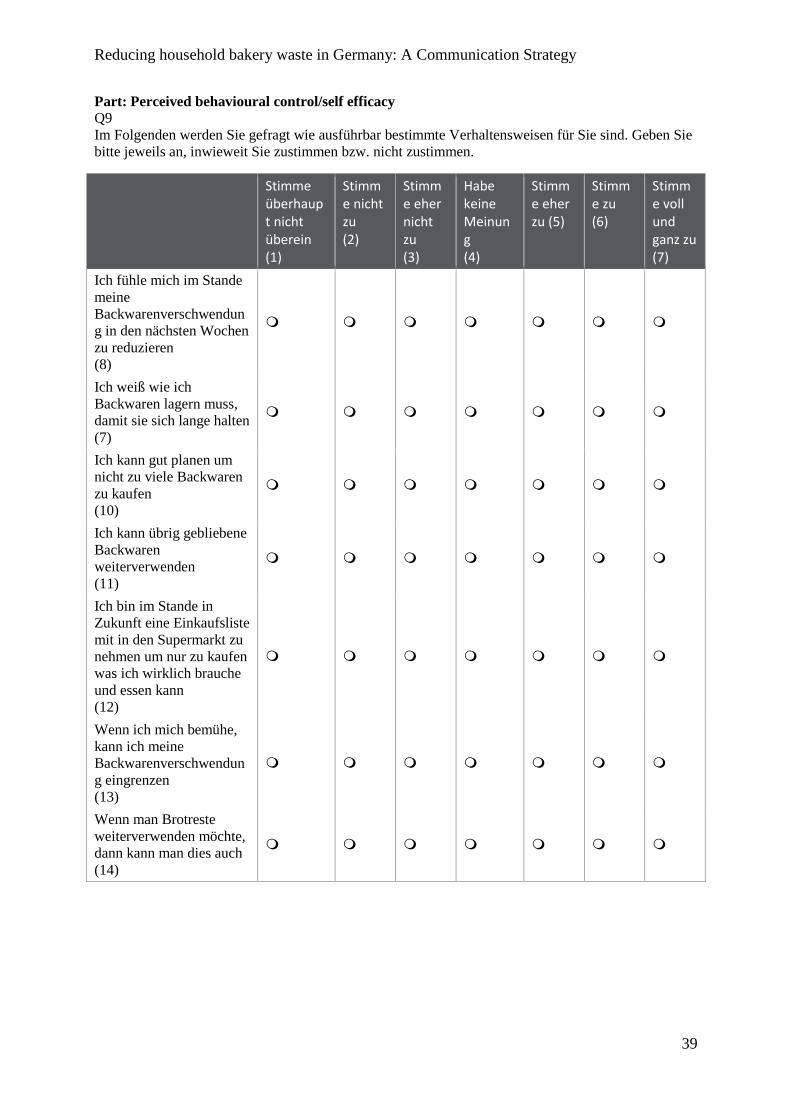
Reducing household bakery waste in Germany: A Communication Strategy
39
Part: Perceived behavioural control/self efficacy Q9
Im Folgenden werden Sie gefragt wie ausführbar bestimmte Verhaltensweisen für Sie sind. Geben Sie
bitte jeweils an, inwieweit Sie zustimmen bzw. nicht zustimmen.
Stimme überhaupt nicht überein (1)
Stimme nicht zu (2)
Stimme eher nicht zu (3)
Habe keine Meinung (4)
Stimme eher zu (5)
Stimme zu (6)
Stimme voll und ganz zu (7)
Ich fühle mich im Stande
meine
Backwarenverschwendun
g in den nächsten Wochen
zu reduzieren
(8)
Ich weiß wie ich
Backwaren lagern muss,
damit sie sich lange halten
(7)
Ich kann gut planen um
nicht zu viele Backwaren
zu kaufen
(10)
Ich kann übrig gebliebene
Backwaren
weiterverwenden
(11)
Ich bin im Stande in
Zukunft eine Einkaufsliste
mit in den Supermarkt zu
nehmen um nur zu kaufen
was ich wirklich brauche
und essen kann
(12)
Wenn ich mich bemühe,
kann ich meine
Backwarenverschwendun
g eingrenzen
(13)
Wenn man Brotreste
weiterverwenden möchte,
dann kann man dies auch
(14)

Reducing household bakery waste in Germany: A Communication Strategy
40
Part: Intention to change behaviour Q10
Welche der folgenden Handlungen können Sie sich in Zukunft vorstellen aus zu führen? Geben Sie
bitte jeweils an, inwieweit Sie zustimmen bzw. nicht zustimmen.
Stimme überhaupt nicht überein (1)
Stimme nicht zu (2)
Stimme eher nicht zu (3)
Habe keine Meinung (4)
Stimme eher zu (5)
Stimme zu (6)
Stimme voll und ganz zu (7)
Ich werde in Zukunft eine
Einkaufsliste mit in den
Supermarkt nehmen
(8)
In Zukunft werde ich
Backwaren wie gehabt
einfach entsorgen
(10)
Ich werde Brot in Zukunft
einfrieren wenn es zu viel
für meinen Gebrauch ist
(11)
Ich werde in Zukunft auf
die Verschwendung von
Backwaren achten
(12)
Die Größe des verkauften
Brotes ist zu groß, ich
werde selbst in Zukunft
nichts ändern
(13)
Ich werde in Zukunft die
Menge an zu
verzehrenden
Lebensmitteln beim
Kochen probieren durch
wiegen oder messen ab zu
schätzen
(14)
Für eine Vermeidung von
Backwarenverschwendun
g habe ich auch in
Zukunft keine Lust
Mühen auf mich zu
nehmen
(15)
Ich werde in Zukunft
nicht mehr Backwaren
einkaufen als ich brauche
(16)
Ich werde mein Verhalten
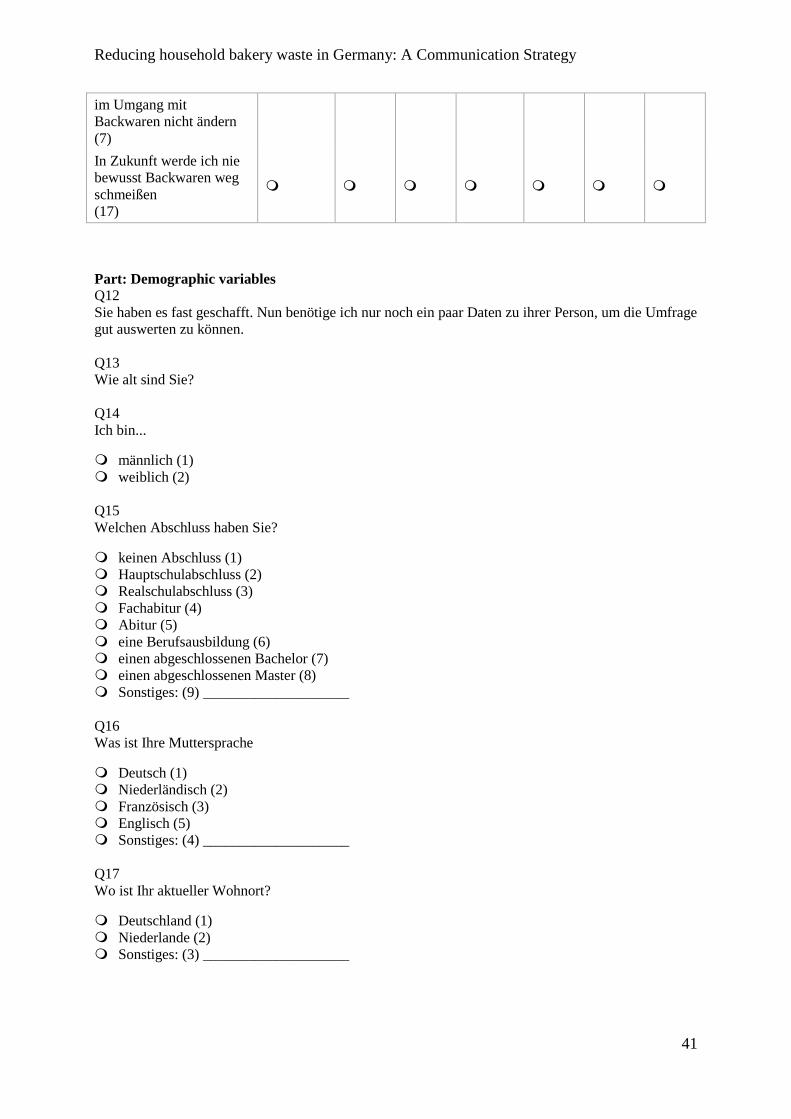
Reducing household bakery waste in Germany: A Communication Strategy
41
im Umgang mit
Backwaren nicht ändern
(7)
In Zukunft werde ich nie
bewusst Backwaren weg
schmeißen
(17)
Part: Demographic variables Q12
Sie haben es fast geschafft. Nun benötige ich nur noch ein paar Daten zu ihrer Person, um die Umfrage
gut auswerten zu können.
Q13
Wie alt sind Sie?
Q14
Ich bin...
männlich (1)
weiblich (2)
Q15
Welchen Abschluss haben Sie?
keinen Abschluss (1)
Hauptschulabschluss (2)
Realschulabschluss (3)
Fachabitur (4)
Abitur (5)
eine Berufsausbildung (6)
einen abgeschlossenen Bachelor (7)
einen abgeschlossenen Master (8)
Sonstiges: (9) ____________________
Q16
Was ist Ihre Muttersprache
Deutsch (1)
Niederländisch (2)
Französisch (3)
Englisch (5)
Sonstiges: (4) ____________________
Q17
Wo ist Ihr aktueller Wohnort?
Deutschland (1)
Niederlande (2)
Sonstiges: (3) ____________________
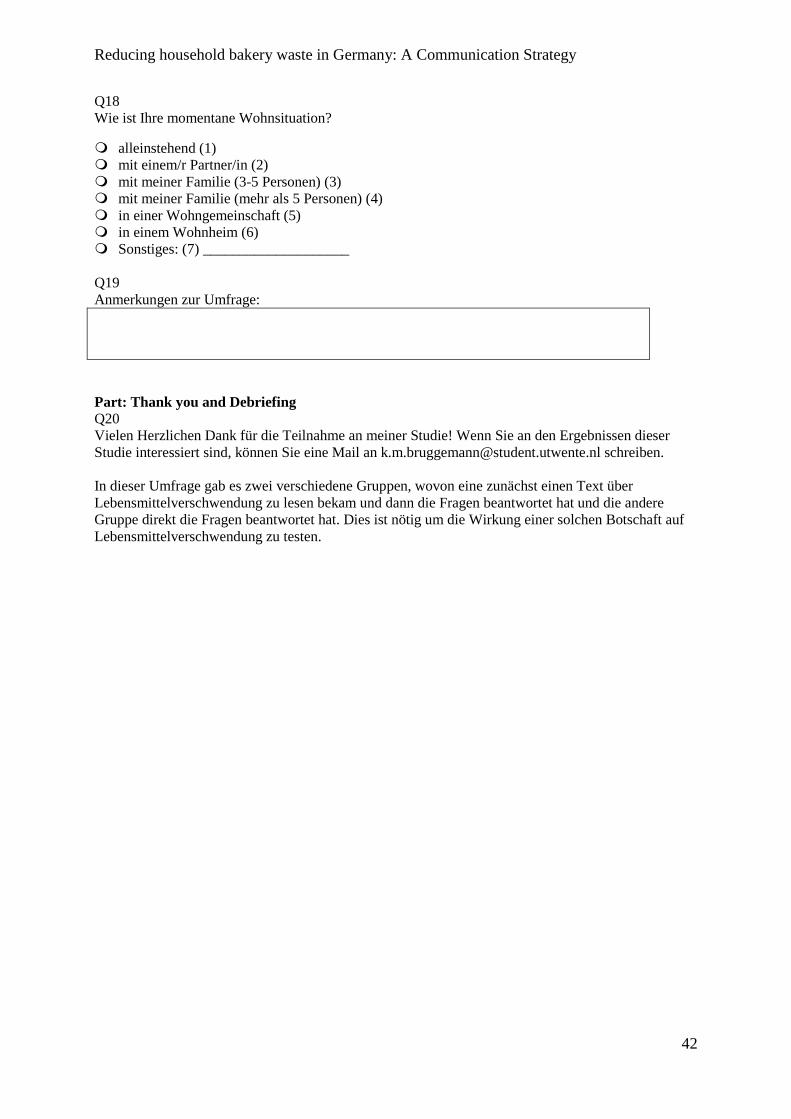
Reducing household bakery waste in Germany: A Communication Strategy
42
Q18
Wie ist Ihre momentane Wohnsituation?
alleinstehend (1)
mit einem/r Partner/in (2)
mit meiner Familie (3-5 Personen) (3)
mit meiner Familie (mehr als 5 Personen) (4)
in einer Wohngemeinschaft (5)
in einem Wohnheim (6)
Sonstiges: (7) ____________________
Q19
Anmerkungen zur Umfrage:
Part: Thank you and Debriefing Q20
Vielen Herzlichen Dank für die Teilnahme an meiner Studie! Wenn Sie an den Ergebnissen dieser
Studie interessiert sind, können Sie eine Mail an [email protected] schreiben.
In dieser Umfrage gab es zwei verschiedene Gruppen, wovon eine zunächst einen Text über
Lebensmittelverschwendung zu lesen bekam und dann die Fragen beantwortet hat und die andere
Gruppe direkt die Fragen beantwortet hat. Dies ist nötig um die Wirkung einer solchen Botschaft auf
Lebensmittelverschwendung zu testen.