Embed Size (px)
Citation preview
Food Security Cluster
V4, June 2016
Core Indicator Handbook
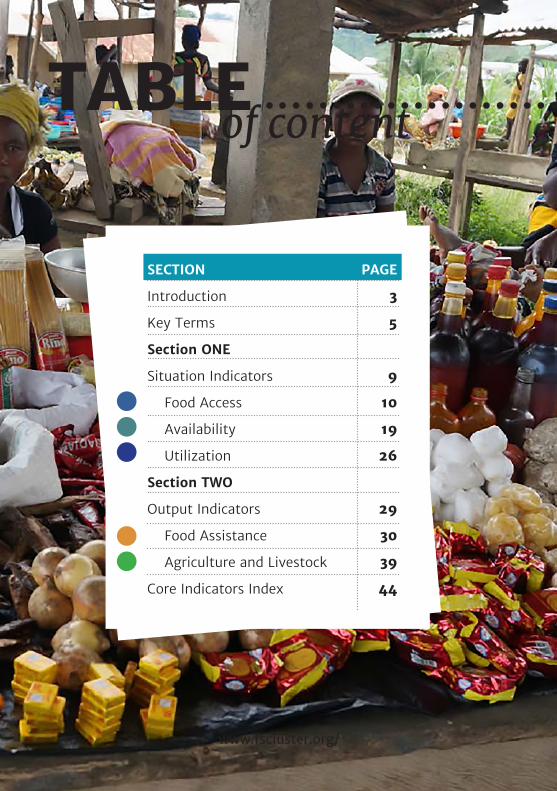
TABLE
SECTION PAGE
Introduction 3
Key Terms 5
Section ONE
Situation Indicators 9
Food Access 10
Availability 19
Utilization 26
Section TWO
Output Indicators 29
Food Assistance 30
Agriculture and Livestock 39
Core Indicators Index 44
of content
www.fscluster.org/
3FSC
IntroductionThis Food Security Cluster Core Indicator Handbook was produced through the cluster’s Programme Quality Working Group as part of an overall effort to improve the effectiveness and efficiency of the cluster activities. The indicators included here were developed as part of coordinated efforts by the Inter-Agency Standing Committee’s Needs Assessment Task Force in 2013, which sought to compile an online registry of key indicators for all IASC clusters and sectors, available via the Humanitarian Response website. The second version of this handbook was published in July 2015.By facilitating the collection, management and dissemination of key data through better use of indicators, the guidelines support the Food Security Cluster to identify sector-level priorities and monitor the cluster’s progress against them.The Food Security Cluster Core Indicator Handbook provides guidance on the selection and use of each indicator, during the various phases of the Humanitarian Programme Cycle (HPC). Based on wide consultation with global and country level clusters, these guidelines include an explanation of the way in which the indicators can and should be operationalized, including guidance on reporting purposes, data collection methodology and calculation instructions.
4 FSC
Target Audience
The guidelines are intended to serve as a practical reference tool to support Food Security practitioners in the selection and use of indicators. Following an overview of key terms, each of the agreed Food Security indicators is presented together with a definition, an explanation of the rationale behind it, the reporting purpose, IASC response phase, and guidance on methodology for measurement. Indicators are grouped under several sub-domains: Food Access; Availability; Utilization; Food Assistance; and Agriculture & Livestock.
These guidelines are intended for Food Security Cluster team members (cluster/sector coordinators, information managers, and assessment and database focal points) as well as other field practitioners involved in a food security cluster or in-country coordination mechanism, with the objective of ensuring an effective and coordinated food security response.This document aims to provide the user with operational flexibility in the choice and management of indicators, which can be adapted to context-specific needs and objectives. These guidelines do not provide exhaustive recommendations on the setup of data collection and data management tools and users of these guidelines should therefore be well versed in setting up and managing information management mechanisms and in creating the framework for the reporting and analysis of any data collected.
Indicators are key to provide evidence-based data to inform the decision-making of cluster members and to improve accountability. The use of indicators also allows data collection to be conducted in a systematic manner, in accordance with recognised standards. Indicators are also necessary to enable reliable and consistent reporting of quantifiable data that inform food security actions and measure output, outcome and impact along the HPC.Standardized indicators enable data reported by country-level clusters to be both comparable and informative to the reporting objectives of the global-level cluster. The ability to utilize indicators according to the various stages of the HPC gives the Food Security Cluster the potential to tailor its information management to the changing requirements as the emergency situation evolves.
Document Structure
The role of indicators
5FSC
Percentage ChangeComparison between pre and post crisis situation. For each indicator the word “change” was introduced to clarify that to measure the impact of a shock it is always useful to compare with pre-crisis data and therefore, as a data preparedness measure, whenever possible these indicators should be collected on a regular basis. In any case, in the absence of pre-crisis data these indicators can still be collected as a way to define the current food security situation of a given population.
Note on DisaggregationDisaggregation of data will be especially helpful for determining which groups are most at risk and affected by a crisis. As appropriate, each indicator should be disaggregated by sex (male/female), age, beneficiary category, pregnant and lactating women, people living with HIV, disability, traders, market actors, producers, activity, food assistance (fortified blended foods, ready to use foods, special nutritional products), non-food item, agricultural item, urban/rural areas, head of household (female headed HH, child (male/female) headed HH [under 18], person with disability headed HH, elderly (male/female) headed HH [over 60]), religious, ethnic or political identities, community and household. The effectiveness of different indicators by different disaggregation can change with location and time; the factors by which data can be stratified should be selected on the basis of the situation analysis.The tables on the following pages explain how each Food Security Cluster indicator should be disaggregated.
GroupingsThroughout this handbook, indicators are grouped under the following headings:
• Access: these indicators provide an understanding about whether people are able to access sufficient, safe and nutritious food, and whether they have the resources to produce food.• Availability: these indicators allow us to identify whether sufficient food is available, either through self-production or in markets.• Utilisation: these indicators are related to people’s ability to safely store and prepare food.• Agriculture & Livestock: these indicators measure agricultural inputs and assistance which affect peoples’ ability to produce food.• Assistance: these indicators measure whether aid, in the form of food, cash and other non-food assistance has been received
Key Terms/Notes
6 FSC
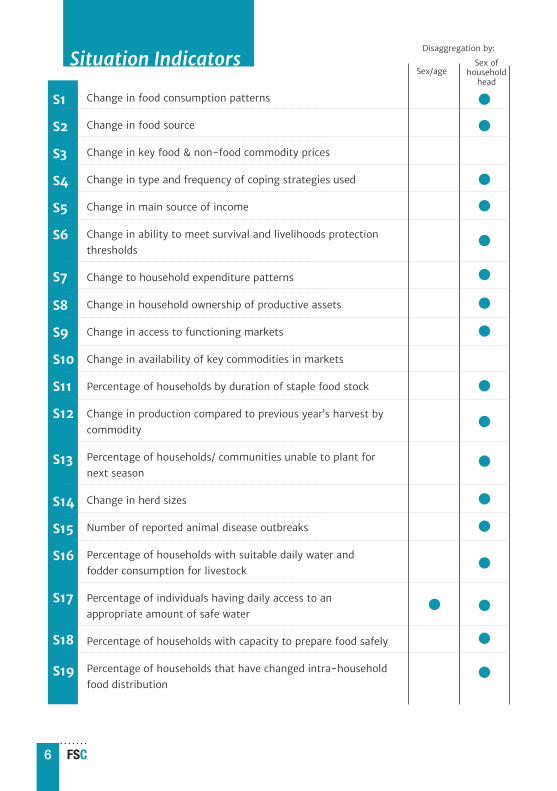
Change in food consumption patterns
Change in food source
Change in key food & non-food commodity prices
Change in type and frequency of coping strategies used
Change in main source of income
Change in ability to meet survival and livelihoods protection
thresholds
Change to household expenditure patterns
Change in household ownership of productive assets
Change in access to functioning markets
Change in availability of key commodities in markets
Percentage of households by duration of staple food stock
Change in production compared to previous year’s harvest by
commodity
Percentage of households/ communities unable to plant for
next season
Change in herd sizes
Number of reported animal disease outbreaks
Percentage of households with suitable daily water and
fodder consumption for livestock
Percentage of individuals having daily access to an
appropriate amount of safe water
Percentage of households with capacity to prepare food safely
Percentage of households that have changed intra-household
food distribution
Situation IndicatorsDisaggregation by:
S1
S2
S3
S4
S5
S6
S7
S8
S9
S10
S11
S12
S13
S14
S15
S16
S17
S18
S19
Sex of household
headSex/age
7FSC
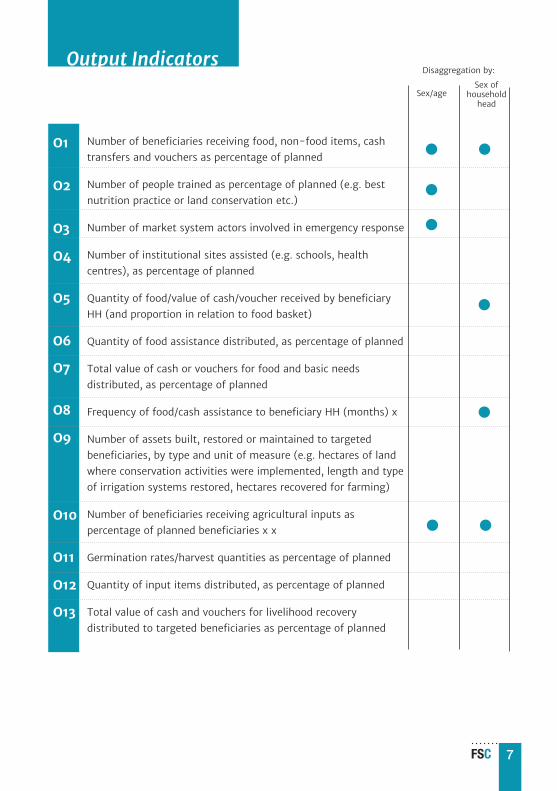
Number of beneficiaries receiving food, non-food items, cash
transfers and vouchers as percentage of planned
Number of people trained as percentage of planned (e.g. best
nutrition practice or land conservation etc.)
Number of market system actors involved in emergency response
Number of institutional sites assisted (e.g. schools, health
centres), as percentage of planned
Quantity of food/value of cash/voucher received by beneficiary
HH (and proportion in relation to food basket)
Quantity of food assistance distributed, as percentage of planned
Total value of cash or vouchers for food and basic needs
distributed, as percentage of planned
Frequency of food/cash assistance to beneficiary HH (months) x
Number of assets built, restored or maintained to targeted
beneficiaries, by type and unit of measure (e.g. hectares of land
where conservation activities were implemented, length and type
of irrigation systems restored, hectares recovered for farming)
Number of beneficiaries receiving agricultural inputs as
percentage of planned beneficiaries x x
Germination rates/harvest quantities as percentage of planned
Quantity of input items distributed, as percentage of planned
Total value of cash and vouchers for livelihood recovery
distributed to targeted beneficiaries as percentage of planned
O1
O2
O3
O4
O5
O6
O7
O8
O9
O10
O11
O12
O13
Output IndicatorsDisaggregation by:
Sex of household
headSex/age
8 FSC
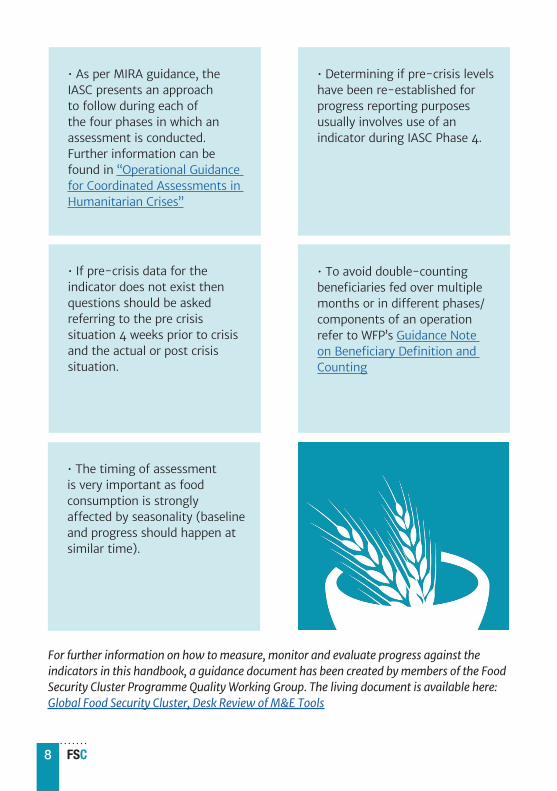
For further information on how to measure, monitor and evaluate progress against the indicators in this handbook, a guidance document has been created by members of the Food Security Cluster Programme Quality Working Group. The living document is available here: Global Food Security Cluster, Desk Review of M&E Tools
• As per MIRA guidance, the IASC presents an approach to follow during each of the four phases in which an assessment is conducted. Further information can be found in “Operational Guidance for Coordinated Assessments in Humanitarian Crises”
• The timing of assessment is very important as food consumption is strongly affected by seasonality (baseline and progress should happen at similar time).
• To avoid double-counting beneficiaries fed over multiple months or in different phases/components of an operation refer to WFP’s Guidance Note on Beneficiary Definition and Counting
• If pre-crisis data for the indicator does not exist then questions should be asked referring to the pre crisis situation 4 weeks prior to crisis and the actual or post crisis situation.
• Determining if pre-crisis levels have been re-established for progress reporting purposes usually involves use of an indicator during IASC Phase 4.
9FSCFSC
1
SECTION ONE
Situation Indicators
10 FSC
DefinitionChange in food consumption patterns is generally measured by two indicators: the Food Consumption Score (FCS) and Household Dietary Diversity Score [HDDS] (either one of them or the two together). Frequency of meals can also be used as proxy for food consumption patterns. The FCS is a composite indicator that measures dietary diversity, food frequency and the relative nutritional importance of food groups based on a seven day recall of food consumed at household level. The HDDS is the simple sum of the number of food groups consumed at HH level based on a 24h recall (from 0 to 12).
RationaleBoth the FCS and HDDS are used as proxy indicators of household access to food as studies have shown that an increase in dietary diversity is associated with socio-economic status and household food security.The FCS is used to classify the observed population into three groups (with poor, borderline and acceptable consumption).
Reporting Purpose Baseline Progress EvaluationBaseline: How have food consumption patterns changed as a result of the crisis? Progress: Measuring results attributable to projects that aim to improve access to food?
ExamplesPercentage of HH in poor, borderline or acceptable categories as a proxy of food insecurity (using FSC). Percentage of HH by number of food groups they consume (HDDS).
Targeted IASC Phase Phase 1 Phase 2 Phase 3 Phase 4
Guidelines for measuring household and individual dietary diversity
Food consumption analysis:
Calculation and use of the food consumption score in food security analysis
• Both FCS and HDDS are designed to
reflect household dietary diversity,
on average, among all members. It is
possible that certain groups (i.e. people
working far from home and eating
outside) can have a different dietary
pattern compared to the rest of the family
members.
• In a large assessment it would be
important to have disaggregation by
urban and rural data as these indicators
behave differently in those settings.
Change in food consumption patternsS1
!
?
SITUATION INDICATORS FOOD ACCESS
11FSC
DefinitionChange in the percentage share of sources of food, which could include food purchase, food production, borrowed food, food aid, gifts, barter or wild foods.
RationaleFood sources are very useful to define livelihood profiles and also to establish which HHs are more/how affected by a given shock. (i.e. if food prices increase HHs depending on food purchases are likely to be more affected than those reliant on self-production).
Reporting Purpose Baseline Progress Evaluation
BaselineHow food sources have changed as a result of the crisis? Progress: Have pre-crises levels been re-established?
ExamplesProportion of household food consumption, by source.
Targeted IASC Phase Phase 1 Phase 2 Phase 3 Phase 4
Change in food sourceS2
WFP, Comprehensive Food Security & Vulnerability Analysis
(CFSVA) Guidelines - First Edition, 2009
• Reliability and sustainability of food
sources should be always considered. HHs
relying on food aid or gift could have a
good food security profile at the time of the
assessment but their food sources are not
sustainable.!?
SITUATION INDICATORS FOOD ACCESS
12 FSC
DefinitionComparison between pre-crisis and actual prices of the main food and non-food commodities in the market. Commodity prices should be recorded at the appropriate trade level (e.g. retail level) and/or for relevant quantities and product qualities.
RationaleAn increase or reduction in prices has a direct effect on the purchasing power of the population and, consequently on their ability to consume or use commodities in their daily activities. Price changes can influence both the quality and/or quantity of commodities procured.
Reporting Purpose Baseline Progress EvaluationBaseline: Impact of the crisis on food and non-food commodity prices. Progress: Have pre-crises prices been re-established?
Targeted IASC Phase Phase 1 Phase 2 Phase 3 Phase 4
% change in key food & non-food commodity pricesS3
Global Information and Early Warning System on food and agriculture
VAM Food and Commodity Prices Data Store
• Prices normally vary throughout a year
due to seasonal patterns of the production
cycle. Accounting for seasonality helps
differentiating between normal seasonal
price variations and additional changes
which can be considered abnormal,
depending on the magnitude of those
changes
• Price changes often reflect changes in
the availability of the commodities in the
market. For example, increasing prices can
indicate a shortage or anticipated shortage
(e.g. when harvest prospects are low).
• Price changes can have opposite effects
for different parts of the population. A
price increase of rice, for instance, can be
detrimental for net buyers (e.g. people
who rely mostly on labour to procure
food), but beneficial for net sellers (i.e. rice
producers).
• Food prices are monitored by several
institutions at different levels (FAO, WFP,
FEWSNET etc). It is important to check for
longer term series in order to understand
the impact (and magnitude) of a crisis on
prices.
!
?
SITUATION INDICATORS FOOD ACCESS
13FSC
Change in type and frequency of coping strategies used
S4
DefinitionThe use of coping strategies provides an indication of household food security through measuring what households do when insufficient food (or insufficient money to by food) is available. It provides a quick, current status indicator of the extent of food insecurity and can be measured in several ways, including the reduced Coping Strategy Index, the Household Hunger Scale or similar hunger experience indicator. Data can be collected on both consumption-based coping strategies and livelihood-based coping strategies.
RationaleAffected households may use coping strategies to deal with a reduced ability to access food. Understanding the extent to which coping strategies are used can provide a quick, current status indicator of the extent of food insecurity that is immediately useful for programmatic decision making. Coping strategies can also be used the measure the impact of humanitarian assistance.
Reporting Purpose Baseline Progress Evaluation
BaselineTypes and frequency of coping strategies used following the crisis when food, or money to buy food, was unavailable. Progress: Has the usage of coping strategies returned to pre-crisis levels?
ExamplesAverage coping strategy index by administrative area, by livelihood, or overall. Percentage of HHs by each type of coping strategy used in the past week.
Coping Strategies Index Field Methods Manual
Household Hunger Scale Indicator Definition and Measurement Guide
!
?
• Coping strategies may vary between
cultural contexts and should be verified
and adapted where necessary.
• Coping strategies vary in terms of
severity. Accordingly, the use of coping
strategies over a long period will have a
different effect on a household’s ability to
recover.
• The use of consumption-related coping
strategies is usually measured over a 7 day
period, while livelihood coping strategies
are measured over a 30-day period.
SITUATION INDICATORS FOOD ACCESS
14 FSC
Change in main source of incomeS5
DefinitionThese are the changes occurred to the income derived from any given sources. It is imperative to have pre-crisis information to be able to value it. Example of sources of income can include crop production, wage labour, trading, livestock, fishery, exploitation of natural resources, salary and remittances.
RationaleAny change related to the main source of income can imply that a household is no longer able to implement usual livelihoods activities as before the crises. This can include change in the income deriving from a given source, change in type of income, diversification of resources by starting new activities and dependency on non-sustainable activities. This could be due to the fact that mainly some assets (animals, tools machinery, seeds, etc.) or human power were lost, or that access to specific areas (field, rivers for fishing, forest for collecting wood, etc.) were denied or interrupted.
Reporting Purpose Baseline Progress Evaluation
BaselineWhat is the impact of the crisis on main sources of income? Progress: Has the pre-crises level been re-established?
ExamplesPercentage of HHs by income type before and after the shocks, disaggregated by gepgraphical areas.
Targeted IASC Phase Phase 1 Phase 2 Phase 3 Phase 4
WFP, Emergency Food Security Assessment Handbook
(EFSA) - Second Edition, 2009
• Data from Focus Group discussions only
can be indicative, and is not necessarily
adequate to determine by how much a
given income source was affected. It is
important to collect HH data to assess
income losses. If only qualitative data
was collected it has to be clear in the
reporting.
SITUATION INDICATORS FOOD ACCESS
!?
15FSC
Change in ability to meet survival and livelihoods protection thresholds
S6
DefinitionThis indicator uses the Household Economy Approach (HEA) to determine households’ survival and livelihoods protection thresholds. It evaluates their ability to meet their needs using coping strategies when faced with shocks.
RationalePeople’s ability to gain access to enough food, rather than only their ability to produce it themselves, determines their level of food security. The Household Economy Approach is a livelihoods-based framework for analysing the way people obtain access to the things they need to survive and prosper.
Reporting Purpose Baseline Progress Evaluation
BaselineHow did people meet their needs prior to the crisis? Progress: Have pre-crisis levels been re-established?
Targeted IASC Phase Phase 1 Phase 2 Phase 3 Phase 4
EFD: The Household Ecomomy Approach (HEA)
Save the Children: The Household Economy Approach A
guide for programme planners and policy-makers
• HEA is an analytical framework, not a
method of information collection. It defines
the information that needs to be gathered
and the way it should be analysed in order
to answer a particular set of questions.
• Understanding change using the HEA
framework relies on comparison with
baseline data. As a result, HEA tools are not
ideal for rapid-onset situations in which the
HEA approach has not been previously used.
SITUATION INDICATORS FOOD ACCESS
!
?

16 FSC
Change in expenditure patternsS7
DefinitionChange in expenditure patterns in % terms, especially on items such as food, health, education, housing, transportation, clothing fuel and water among others.
RationaleChange in % share of expenditure devoted to food is a proxy of food insecurity. When a household spend more than 75% of its resources on food, other essential expenses have to be cut thus undermining the welfare of its individuals.
Reporting Purpose Baseline Progress Evaluation
BaselineWhat is the impact of the crisis on expenditure patterns? Progress: Has the pre-crises level been re-established?
Examples% of HHs by food expenditure share categories, for example % of HHs that spend more than 75% of resources on food. Breakdown of household expenditure on essential needs (eg. food, water, rent, education, healthcare, communications, travel, others).
Targeted IASC Phase Phase 1 Phase 2 Phase 3 Phase 4
IFPRI, Measuring food security using household expenditure surveys
SITUATION INDICATORS FOOD ACCESS
• Expenditure should include also non
cash values for a better assessment.
Especially for food what is actually
consumed should be considered and not
only what is purchased. The value of non-
purchased goods is also a proxy indicator
of social capital.!?
17FSC
Change in household ownership of productive assetsS8
DefinitionRecording of the pre- and post-crisis ownership of specific assets. Assets are generally classified as productive assets (if linked to a livelihood and income generating activities) and household assets.
RationaleLoss of assets may imply a deterioration of the households’ possibility to face a future shock and an increase their level of vulnerability. Total of assets owned by a household are also a proxy for its level of wealth.
Reporting Purpose Baseline Progress Evaluation
BaselineLevel of asset losses endured by households as a result of the crisis Progress: Has ownership of productive assets returned to pre-crisis levels?
ExamplesNumber of productive assets owned by HHs before and after the shock. Proportion of HHs reporting a decrease in ownership of productive assets.
WFP, Emergency Food Security Assessment Handbook (EFSA) - Second Edition,
2009
SITUATION INDICATORS FOOD ACCESS
• Ownership of specific livelihood assets
(i.e. an animal, a tractor, even a bike)
should be used only to compare among
them HHs with the same livelihood profile.
Indeed the loss of a goat for a pastoralist
can be relevant while not so important for
a farmer.!?
18 FSC
Change in access to functioning marketsS9
DefinitionA market is here understood as a place where people are able to buy and sell products, including food, agricultural inputs and other consumable goods. Functioning markets are characterised by the existence of competition (between sellers as well as buyers), and availability of information.
RationalePhysical access to functioning markets allows people to satisfy some of their basic needs through trade, thereby improving their living standards and food security.
Reporting Purpose Baseline Progress Evaluation
BaselineImpact of the criseis on physical access to functioning market Progress: Have pre-crisis levels of access been re-established.
Targeted IASC Phase Phase 1 Phase 2 Phase 3 Phase 4
Sphere Handbook: Food security - livelihoods standard 3: Access to markets
SITUATION INDICATORS FOOD ACCESS
• Important to distinguish between
structural issues and problems originated
by the crisis. Lack of physical access to a
functioning market could include lack of
appropriate transport means or prohibitive
transport costs, barriers or blockages to
extort fees in conflict zones, lack of road
network or terrain damage due to crisis.!?
19FSC
Change in availability of key commodities in marketsS10
DefinitionMeasuring the difference between the availability of key commodities directly after and following a crisis will indicate if markets have been affected and are under stress. Key commodities can include key food and non-food items.
RationaleChanges in the availability of key commodities in markets will affect both prices of such commodities, and the ability of households to access them. Availability of items can be affected by both seasonal variations, changes to the supply chain, and availability of currency.
Reporting Purpose Baseline Progress Evaluation
BaselineImpact of the crisis on availability of food and non-food items.
Targeted IASC Phase Phase 1 Phase 2 Phase 3 Phase 4
FAO, Global Information and Early Warning System on food and agriculture
IFRC, Rapid Assessments for Markets
SITUATION INDICATORS AVAILABILITY
• Availability of items will normally vary
throughout a year due to seasonal patterns
of the production cycle. Accounting for
seasonality helps differentiating between
normal seasonal variations in availability
and price, and additional changes which
can be considered abnormal, depending on
the magnitude of those changes
• Price changes often reflect changes in
the availability of the commodities in the
market. For example, increasing prices
can indicate a shortage or anticipated
shortage (e.g. when harvest prospects are
low).
!
?
20 FSC
Percentage of Households by duration of staple food stockS11
DefinitionPercentage of households that have stocks of staple food to feed their family or have the capacity to access food stocks for a given duration of time.
RationaleLow levels of food stock could indicate that households are facing food access constraints. This indicator may be particularly relevant for food producers.
Reporting Purpose Baseline Progress Evaluation
BaselineAvailability of staple food stock or access to staple food stock at the household level in a specified period.
ExamplesPercentage of households with year-round access to food. Number of months that average stocks last before and after the shock, by HH or by livelihood.
Targeted IASC Phase Phase 1 Phase 2 Phase 3 Phase 4
• Duration of stock is self-reported so under
and overestimation can be an issue.
• Timing is very relevant when collecting
this indicator. If the data collection took
place be-fore or after the harvest, if the
shock destroyed crops and food stocks are
still from previous harvest etc., these are all
variables to be considered in the analysis.
• Households facing shortages of staple
food stock and lack of access to farming
land will need to obtain food through the
market. There could be then an issue of
product availability on the market to be
checked.
• This is a livelihood specific indicator it
may not apply to ALL households.
SITUATION INDICATORS AVAILABILITY
!
21FSC
Change in production compared to previous year’s harvest, by commodityS12
DefinitionA comparison between last year’s production and post crisis crop production can provide important information about a household’s access to income.
RationaleDepending on the type and timing of the crisis, the upcoming harvest can be severely affected. Natural disasters like floods and droughts can have huge impacts. Change in crop production has an impact on the households’ levels of food self-sufficiency and security. This is also true at the community level: considering that some households are not self-sufficient even in normal years, the overall percentage change in production gives an indication of the amount of food available locally and how much will be needed to fill the gap.
Reporting Purpose Baseline Progress Evaluation
BaselineLevel of losses of crop production due to the crisis.
Targeted IASC Phase Phase 1 Phase 2 Phase 3 Phase 4
SITUATION INDICATORS AVAILABILITY
• A reduction in yields obtained by the
households of the standing crops means
on one hand a loss of food production for
the cultivating households; but also a loss
of income source for the daily labourers
who engage in harvesting and post-harvest
activities (threshing, cleaning, etc.).
• At later stages reduced production affects
the share that is normally sold by the
households
!
22 FSC
For an example of a Seasonal Calendar, please see ACF, Food Security and
Livelihoods Assess-ment Manual p75.
Percentage of households/ communities unable to plant for next seasonS13
DefinitionShare of households that are unable to restart their agricultural activities in the upcoming cropping season. To be able to farm, HHs need access to arable land, seeds, tools and other agricultural inputs. Depending on the type of crisis, one or more of these can become unavailable.
RationaleNot having the ability to cultivate fields has an impact on the households’ future level of food self-sufficiency/security, cash income and as a consequence indebtedness or higher dependency on food aid, but it also has a more immediate impact on households that are relying significantly on labour as a source of income.
Reporting Purpose Baseline Progress Evaluation
BaselinePossibility that households are able to restart agricultural activities on time.
Targeted IASC Phase Phase 1 Phase 2 Phase 3 Phase 4
• A reduction in the percentage of
households able to cultivate their fields or
area means both a loss of food production
for cultivating households, and also a
potential loss of income for the daily
labourers.
• At later stages, reduced availability of food
affects the availability of surplus production
to sell in markets.
• Planning an agriculture intervention
requires careful planning and timing. In
some cases, delays in the implementation
of the project may result in missing the
beginning of the planting season, and
therefore jeopardize the whole operation.
Agriculture interventions can take several
months to bear fruit. Depending on the
circumstances, it may be necessary to jointly
organise food distributions in order to avoid
people consuming grain intended as seed.
SITUATION INDICATORS AVAILABILITY
!
?
23FSC
SITUATION INDICATORS AVAILABILITY
Change in herd sizesS14
DefinitionReporting on the percentage of change to overall herd sizes (households that either lost animals because of the crisis or had to sell or slaughter their animals as an emergency measure).
RationaleThis indicator is relevant to those HHs that are getting some or all of their income from livestock. (i.e. herders). Some HHs rely on their livestock as a regular source of income to purchase the bulk of their diet (grain, vegetables, etc.) from the market. Furthermore, a loss of animals has an influence on household resilience, especially in the case of future shocks and stresses. Loss of animals may also affect a households’ ability to generate income through the transport of goods to market, or to perform some farming activities such as ploughing.
Reporting Purpose Baseline Progress Evaluation
BaselineLoss of animals directly due to the crisis and thereafter due to selling, slaughtering or destocking as an emergency measure. Progress: Have pre-crisis levels been re-established?
Targeted IASC Phase Phase 1 Phase 2 Phase 3 Phase 4
• Reasons for the emergency destocking
could include lack of fodder or feed, lack
of time to care, lack of water, sick animal,
old/aged animal, lack of shelter, need of
cash, or need of food.
• Loss of animals could even affect a
household’s social status, especially in
nomadic or pastoral societies, where
the size of their herd is a status symbol
of a household; which per consequence
could have an influence on their credit
worthiness.
• In some cultures, estimating herd sizes
can be difficult, as responses may be
affected by an unwillingness to discuss
such sensitive topics as assets and wealth.
!
FAO: World livestock in food security?
24 FSC
SITUATION INDICATORS AVAILABILITY
Number of reported animal disease outbreaksS15
DefinitionNumber of animal disease outbreaks in a community or in any given geographical area, in a specified time period.
RationaleAnimal disease outbreaks increase the likelihood for animals to die, affecting the household’s assets, food security and level of vulnerability.
Reporting Purpose Baseline Progress Evaluation
BaselineAnimal disease outbreaks mainly linked directly to the crisis or as a consequence of the crisis. Progress: Verifying the efficiency of a vaccination campaign.
Targeted IASC Phase Phase 1 Phase 2 Phase 3 Phase 4
• High numbers of sick animals may indicate the need for
vaccination campaigns in order to save and strengthen
the remaining healthy animals.!
25FSC
SITUATION INDICATORS AVAILABILITY
Percentage of households with suitable daily water and fodder consumption for livestock
S16
DefinitionPercentage of households that have enough suitable water and fodder available for their animals. To better link with programming, it is helpful to measure access to water access to fodder separately. In many contexts in may be relevant to collect the data by community.
RationaleLack of suitable water and fodder for animals has a direct influence on the health status and survival rate of the remaining animals, and by consequence on the HH’s assets, income, food security and vulnerability.
Reporting Purpose Baseline Progress Evaluation
BaselineAvailability of suitable water and fodder / feed for animal at community or household level.
Targeted IASC Phase Phase 1 Phase 2 Phase 3 Phase 4
• If this indicator is relevant only to a
particular livelihood group, it has to be clear
that for some other livelihoods it is not
important.
• In many cases, herders don’t own the
necessary water and fodder stocks at HH
level. Rather, they share wells and/or
pasture land with the whole community,
and local conflicts with other community
members (esp. farmers) to access them can
be a recurrent issue. There may be different
access rights according to social status,
wealth, etc. Lack of water or fodder for
animal consumption could be the result of
restricted or no access to pasture land.
• Lack of water or fodder also influences the
animal’s productivity (including milk, eggs,
wool, meat, etc.) or their capacity of work
(for draught animals) and their ability to
reproduce.
!
26 FSC
SITUATION INDICATORS UTILIZATION
% of individuals having daily access to an appropriate amount of safe waterS17
DefinitionPercentage of individuals/HHs that have daily access to an appropriate quantity (a minimum of 15 litres per person per day of water) and quality of water, coming from an improved water source.1
RationaleIndividuals in the community with daily access to an appropriate amount of safe water can use this for drinking, cooking and personal hygiene. Unsafe water can have a negative impact on the individual health status and consequently on the food security status.
Reporting Purpose Baseline Progress Evaluation
BaselineIndividual daily access to an appropriate quantity and quality of water from an improved water source.
Examples% of HH or individuals that have access to adequate amount of water: or average quantity of water (litres) available by HH.
Targeted IASC Phase Phase 1 Phase 2 Phase 3 Phase 4
• Improved drinking water sources include piped water into dwelling, plot or yard, public tap/standpipe, tube well/borehole, protected dug well, protected spring and rainwater collection. Unimproved drinking water sources include unprotected dug well, unprotected spring, cart with small tank/drum, tanker trunk, surface water (river, dam, lake, pond, stream, canal, or
irrigation channel) and bottled water.• Bottled water is considered unimproved drinking water by default as it is not a sustainable source. However, it can be considered an improved drinking water source if it is of reliable quality and household members use bottled water for all drinking, cooking, and personal hygiene.
!
The Sphere Handbook: Humanitarian Charter and Minimum Standards in Humanitarian Response
Guide to WASH Cluster Strategy and Standards: Also known as Strategic Operational
1. An improved water source is an infrastructure improvement to a water source, a distribution system, or a delivery point, which by the nature of its design and construction is likely to protect the water source from external contamination, in particular from fecal matter. Examples of improved water sources include: Piped water in dwelling, plot, or yard; public tap/standpipe; tube well/borehole; protected dug well; protected spring; rainwater collection.
?
27FSC
SITUATION INDICATORS UTILIZATION
Percentage of HHs with capacity to prepare food safelyS18
DefinitionProportion of households with capacity to prepare food safely (able to access fuel, water, cooking utensils, food)
RationaleThe ability to safely store and prepare food, using suitable equipment and hygienic practices has an impact on health, and therefore food security. Unsafe food preparation can have a negative impact on individual health status and consequently on the food security status.
Reporting Purpose Baseline Progress Evaluation
Baseline% households able to prepare food safely Progress: Has the pre-crises level been re-established.
Targeted IASC Phase Phase 1 Phase 2 Phase 3 Phase 4
• This indicator combines information on
several aspects of safe food preparation,
including food hygiene, access to fuel
and household items, access to food
processing facilities (such as grinding
mills).
• Individuals with specific needs may
require specific assistance to prepare food,
such as young children, older people or
people with disabilities.
!
?The Sphere handbook contains guidance on indicators used for measuring the different types
of information included in this indicator.
28 FSC
SITUATION INDICATORS UTILIZATION
Percentage of households that have changed intra-household food distributionS19
DefinitionThis indicator examines change to food distribution patterns inside their household as a coping strategy to deal with shortfalls as a result of the crisis. The change can occur in several ways and have several degrees of severity: i.e. adults restrict consumption for children to eat, women do not eat to give food only to men (as they work) etc.
RationaleThis indicator can show an increased stress of the HHs due to the crisis and could be a proxy for a deterioration of food insecurity at HH level.
Reporting Purpose Baseline Progress Evaluation
BaselineHas intra-household food distribution changed as a result of the crisis. Progress: Has the pre-crises level been re-established.
Targeted IASC Phase Phase 1 Phase 2 Phase 3 Phase 4
• It is important to know the context and
the pre-crisis pattern. Cases in which one
household member is receiving a greater
percentage of the household’s overall
food could indicate intra household food
allocation patterns that are not taking
place as a result of food insecurity,
but rather are a result of gender
discrimination or abuse of power in the
household.
!Reduced Coping Strategy Indicator, Emergency Food Security Assessment
Handbook (EFSA) - Second Edition, 2009?
29FSC
SECT
ION
ONE2
SECTION TWO
Output Indicators
30 FSC
OUTPUT INDICATORS FOOD ASSISTANCE
Number of beneficiaries receiving food, non-food items, cash transfers and vouchers as % of plannedO1
DefinitionNumber of beneficiaries receiving food, non-food items, cash transfers and vouchers as % of planned. Receipt of each type of assistance should be monitored separately.
RationaleThis indicator is designed to verify whether planned assistance reached intended beneficiaries.
Reporting Purpose Baseline Progress Evaluation
Targeted IASC Phase Phase 1 Phase 2 Phase 3 Phase 4
• There is nothing specific to watch out for with this
indicator. Contributions are welcomed to inform
future editions of this handbook.!WFP Emergency Food Security Assessment Handbook (EFSA)
- Second Edition, 2009?
31FSC
Number of people trained as % of planned (e.g. in best nutrition practice or land conservation etc.)O2
DefinitionNumber of people trained as % of planned (e.g. best nutrition practice or land conservation etc.) since the start of the intervention.
RationaleThis indicator is designed to verify whether planned assistance, in the form of training, reached intended beneficiaries.
Reporting Purpose Baseline Progress Evaluation
Targeted IASC Phase Phase 1 Phase 2 Phase 3 Phase 4
OUTPUT INDICATORS FOOD ASSISTANCE
• There is nothing specific to watch out for with this
indicator. Contributions are welcomed to inform
future editions of this handbook.!WFP Emergency Food Security Assessment Handbook (EFSA)
- Second Edition, 2009?
32 FSC
• The number of actors involved is not
necessary proportional to the effectiveness
of the response.
• Market system actors can be both new
and existing users of the system as well as
new entries initiated by the humanitarian
intervention.!
Number of market system actors involved in emergency responseO3
DefinitionMarket system actors include public and private companies and traders involved at any stage of the market value chain. The involvement of a range of actors at different levels provides an indication of how an emergency response interacts with the market system as a whole.
RationaleThis indicator is a proxy of engagement in the response by market system actors.
Reporting Purpose Baseline Progress Evaluation
Targeted IASC Phase Phase 1 Phase 2 Phase 3 Phase 4
OUTPUT INDICATORS FOOD ASSISTANCE
33FSC
? WFP Emergency Food Security Assessment Handbook (EFSA) -
Second Edition, 2009
Number of institutional sites assisted (e.g. schools, health centres), as % of plannedO4
DefinitionNumber of institutional sites assisted (e.g. schools, health centres), to which assistance has been provided, as % of planned.
RationaleThis indicator is designed to verify whether planned assistance reached intended beneficiaries. In this case, beneficiaries are users of the targeted institutional sites.
Reporting Purpose Baseline Progress Evaluation
Targeted IASC Phase Phase 1 Phase 2 Phase 3 Phase 4
• There is nothing specific to watch out for with this
indicator. Contributions are welcomed to inform
future editions of this handbook.!
OUTPUT INDICATORS FOOD ASSISTANCE
34 FSC
OUTPUT INDICATORS FOOD ASSISTANCE
Quantity of food/value of cash/voucher received by beneficiary HH (and proportion in relation to food basket)
O5
DefinitionThis indicator should express the percentage of the food needs that are covered by the ration distributed
RationaleUnderstanding the quantity of assistance delivered per beneficiary household can help determine the extent to which assistance received contributed to overall food needs.
Reporting Purpose Baseline Progress Evaluation
Targeted IASC Phase Phase 1 Phase 2 Phase 3 Phase 4
• A proxy for the nutritional value of cash or vouchers should
be calculated in order to compare this type of assistance
with in-kind food transfers.!Nutval.net provides an online calculator of
nutritional values for food security?
35FSC
SECT
ION
TWO
Quantity of food assistance distributed, as % of plannedO6
DefinitionQuantity of food assistance distributed, as % of planned.
RationaleThis indicator is designed to verify whether planned assistance reached intended beneficiaries.
Reporting Purpose Baseline Progress Evaluation
Targeted IASC Phase Phase 1 Phase 2 Phase 3 Phase 4
OUTPUT INDICATORS FOOD ASSISTANCE
• There is nothing specific to watch out for with this
indicator. Contributions are welcomed to inform
future editions of this handbook.!WFP Emergency Food Security Assessment Handbook (EFSA)
- Second Edition, 2009?
36 FSC
• A proxy for the nutritional value of cash
or vouchers can be calculated in order to
compare this type of assistance with in-
kind food transfers
• Fluctuating exchange rates and food prices
can affect the ability of cash assistance to
support food and basic needs.!
Total value of cash or vouchers for food and basic needs distributed, as % of plannedO7
DefinitionThis indicator presents the total value of cash or vouchers for food and basic needs that were distributed, as a percentage of planned assistance.
RationaleThis indicator is designed to verify whether planned assistance reached intended beneficiaries.
Reporting Purpose Baseline Progress Evaluation
Targeted IASC Phase Phase 1 Phase 2 Phase 3 Phase 4
Nutval.net provides an online calculator of
nutritional values for food security?
OUTPUT INDICATORS FOOD ASSISTANCE
37FSC
Frequency of food/cash assistance to beneficiary household (months)O8
DefinitionFrequency of food/cash assistance to beneficiary household (months)
RationaleUnderstanding the frequency and amount of food or cash assistance delivered can determine whether assistance is sufficient to meet identified needs.
Reporting Purpose Baseline Progress Evaluation
Targeted IASC Phase Phase 1 Phase 2 Phase 3 Phase 4
• There is nothing specific to watch out for with this
indicator. Contributions are welcomed to inform
future editions of this handbook.!WFP Emergency Food Security Assessment Handbook (EFSA)
- Second Edition, 2009?
OUTPUT INDICATORS FOOD ASSISTANCE
38 FSC
OUTPUT INDICATORS FOOD ASSISTANCE
Number of assets built, restored or maintained to targeted beneficiaries, by type and unit of measure (e.g. hectares of land where conservation activities were implemented, length and type of irrigation systems restored, hectares recovered for farming)
O9
DefinitionNumber of assets built, restored or maintained to targeted beneficiaries, by type and unit of measure (e.g. hectares of land where conservation activities were implemented, length and type of irrigation systems restored, hectares recovered for farming)
RationaleThis indicator is designed to verify whether planned assistance reached intended beneficiaries, through the construction, restoration or maintenance of assets.
Reporting Purpose Baseline Progress Evaluation
Targeted IASC Phase Phase 1 Phase 2 Phase 3 Phase 4
• There is nothing specific to watch out for with this
indicator. Contributions are welcomed to inform
future editions of this handbook.!WFP Emergency Food Security Assessment Handbook (EFSA)
- Second Edition, 2009?
39FSC
If this indicator is relevant only to a particular
livelihood group, it has to be clear that for some
other livelihoods it is not important.!
OUTPUT INDICATORS AGRICULTURE & LIVESTOCK
Number of beneficiaries receiving agricultural inputs, as % of planned beneficiariesO10
DefinitionThe number of beneficiaries receiving agricultural inputs, as % of planned beneficiaries. This measure includes animals.
RationaleAssistance in the form of agricultural inputs can help restore the livelihoods of affected populations and protect them against further shocks. Assistance provided to animals, such as vaccinations, can be included under this indicator.
Reporting Purpose Baseline Progress Evaluation
Targeted IASC Phase Phase 1 Phase 2 Phase 3 Phase 4
40 FSC
Germination rates/harvest quantities as % of plannedO11
DefinitionGermination rates/harvest quantities as percentage of planned.
RationaleUnderstanding harvest quantity, can help to verify whether planned agricultural assistance has reached intended beneficiaries. A germination test indicates the quality of the seeds and gives a rough idea of the expected yield.
Reporting Purpose Baseline Progress Evaluation
Targeted IASC Phase Phase 1 Phase 2 Phase 3 Phase 4
Germination tests can also be used to compare the
performance potential of different seed lots.!Somalia Food Security Cluster: Guidance note on agricultural input
distribution activities in humanitarian context:
“Checking Germination Rate and Moisture Content”?
OUTPUT INDICATORS AGRICULTURE & LIVESTOCK
41FSC
Quantity of input items distributed, as a percentage of plannedO12
DefinitionQuantity of input items (such as seeds, tools, machinery etc.) distributed, as a per-centage of planned. This measure also includes animals.
RationaleAssistance in the form of agricultural inputs can help restore the livelihoods of af-fected populations and protect them against further shocks. Assistance provided to animals, such as vaccinations, can be included under this indicator.
Reporting Purpose Baseline Progress Evaluation
Targeted IASC Phase Phase 1 Phase 2 Phase 3 Phase 4
• The timing of the delivery of agricultural
input items can have a significant effect
on their ability to be used. While this
indicator measures quantity of input
items distributed, questions about timing
can provide additional information about
timing and usefulness.!Foodsecure, Food Security and Agriculture in Developing Countries:
Measurement and hypotheses for impact evaluations?
OUTPUT INDICATORS AGRICULTURE & LIVESTOCK
42 FSC
Total value of cash and vouchers for livelihood recovery distributed to targeted beneficiaries as % of planned
O13
DefinitionTotal value of cash and vouchers for livelihood recovery distributed to targeted beneficiaries as % of planned
RationaleThis indicator is designed to verify whether planned livelihood assistance, in the form of cash and vouchers, reached intended beneficiaries.
Reporting Purpose Baseline Progress Evaluation
Targeted IASC Phase Phase 1 Phase 2 Phase 3 Phase 4
• There is nothing specific to watch out for with this
indicator. Contributions are welcomed to inform
future editions of this handbook.!WFP Emergency Food Security Assessment Handbook (EFSA)
- Second Edition, 2009?
43FSC
FOOD SECURITY CLUSTER
Core Indicators Index
44 FSC
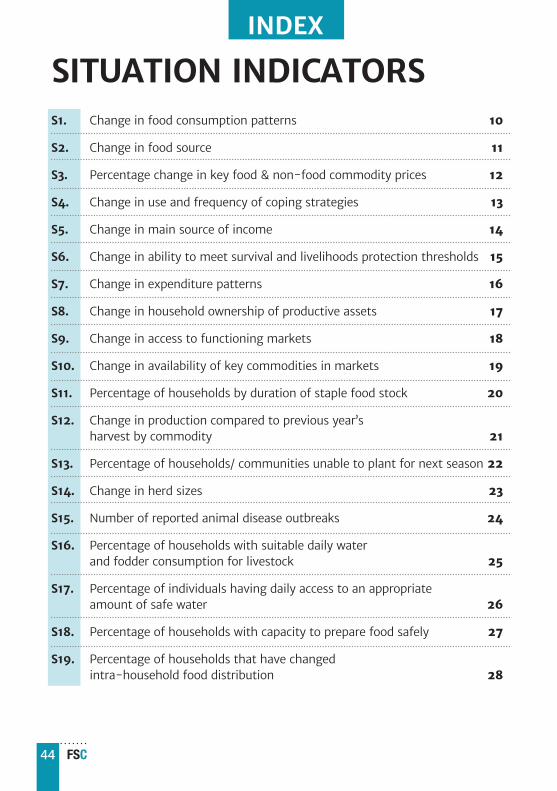
S1. Change in food consumption patterns 10
S2. Change in food source 11
S3. Percentage change in key food & non-food commodity prices 12
S4. Change in use and frequency of coping strategies 13
S5. Change in main source of income 14
S6. Change in ability to meet survival and livelihoods protection thresholds 15
S7. Change in expenditure patterns 16
S8. Change in household ownership of productive assets 17
S9. Change in access to functioning markets 18
S10. Change in availability of key commodities in markets 19
S11. Percentage of households by duration of staple food stock 20
S12. Change in production compared to previous year’s harvest by commodity 21
S13. Percentage of households/ communities unable to plant for next season 22
S14. Change in herd sizes 23
S15. Number of reported animal disease outbreaks 24
S16. Percentage of households with suitable daily water and fodder consumption for livestock 25
S17. Percentage of individuals having daily access to an appropriate amount of safe water 26
S18. Percentage of households with capacity to prepare food safely 27
S19. Percentage of households that have changed intra-household food distribution 28
SITUATION INDICATORSINDEX
45FSC
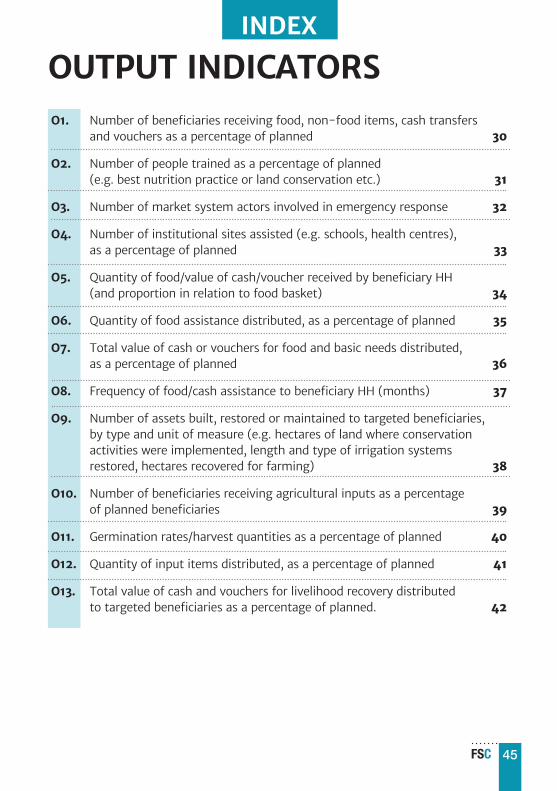
OUTPUT INDICATORSO1. Number of beneficiaries receiving food, non-food items, cash transfers and vouchers as a percentage of planned 30
O2. Number of people trained as a percentage of planned (e.g. best nutrition practice or land conservation etc.) 31
O3. Number of market system actors involved in emergency response 32
O4. Number of institutional sites assisted (e.g. schools, health centres), as a percentage of planned 33
O5. Quantity of food/value of cash/voucher received by beneficiary HH (and proportion in relation to food basket) 34
O6. Quantity of food assistance distributed, as a percentage of planned 35
O7. Total value of cash or vouchers for food and basic needs distributed, as a percentage of planned 36
O8. Frequency of food/cash assistance to beneficiary HH (months) 37
O9. Number of assets built, restored or maintained to targeted beneficiaries, by type and unit of measure (e.g. hectares of land where conservation activities were implemented, length and type of irrigation systems restored, hectares recovered for farming) 38
O10. Number of beneficiaries receiving agricultural inputs as a percentage of planned beneficiaries 39
O11. Germination rates/harvest quantities as a percentage of planned 40
O12. Quantity of input items distributed, as a percentage of planned 41
O13. Total value of cash and vouchers for livelihood recovery distributed to targeted beneficiaries as a percentage of planned. 42
INDEX
46 FSC
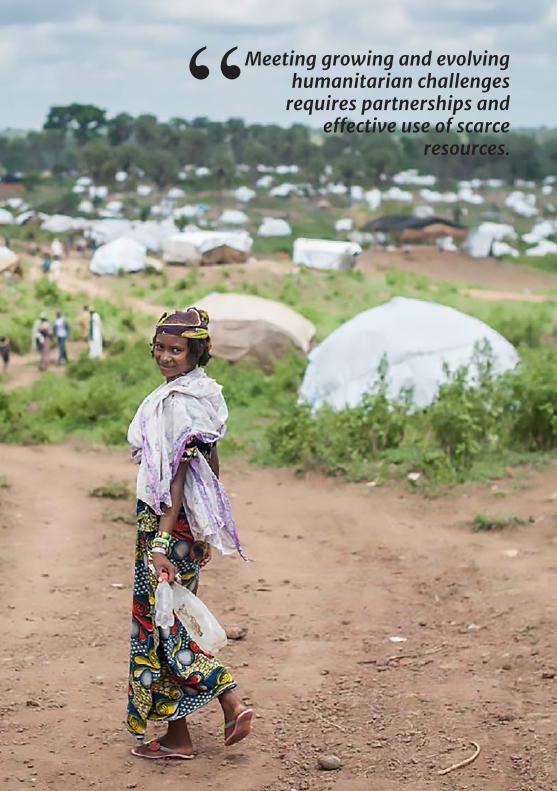
Meeting growing and evolving humanitarian challenges
requires partnerships and effective use of scarce
resources.“

E-mail: [email protected]
Web: www.fscluster.org
Twitter: twitter.com/FSCluster
Mail: Food Security Cluster Support Team,
WFP Headquarters, Via Cesare Giulio
Viola, 68, 00148 Roma, Italy
Contacts