Embed Size (px)
Citation preview
Food Security Assessment at WFP: Report on Continued Development and
Testing of a Standardized Approach
Diego Rose, Amit Wadhwa, Rossella Bottone, Darryl Miller,
Lisa Hjelm, Astrid Mathiassen, Peter Horjus
Food Security, Markets, and Vulnerability Analysis World Food Programme
December 2013
ii
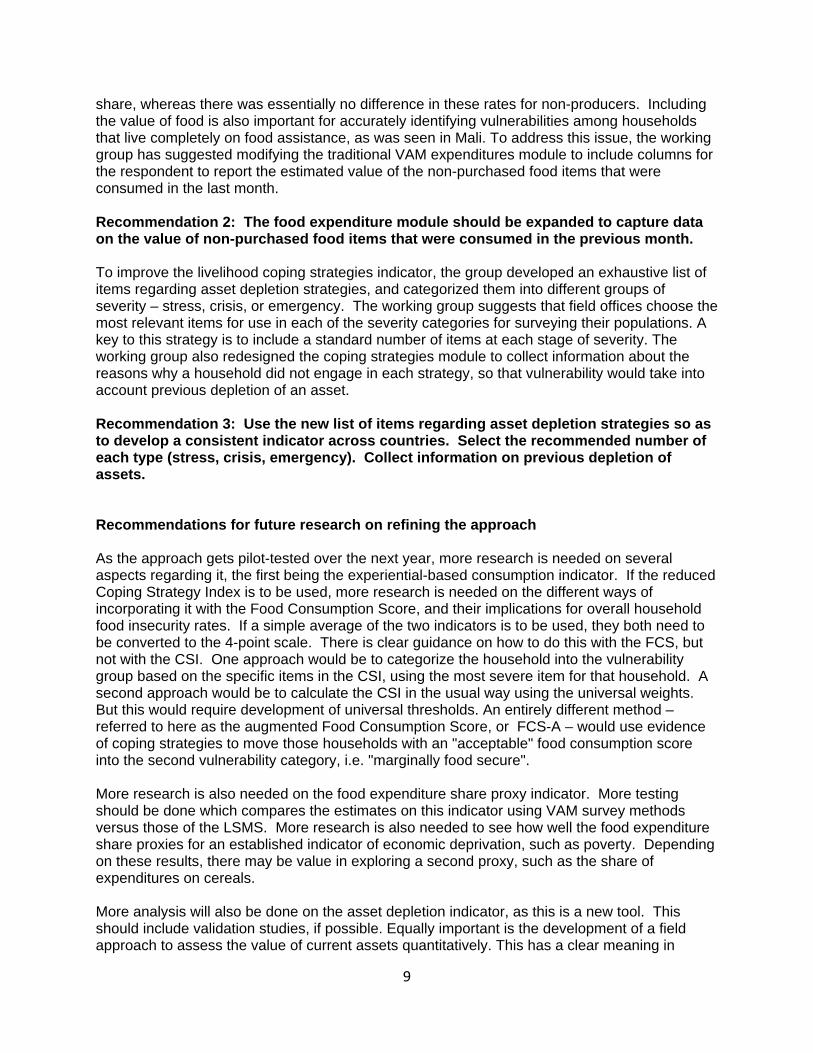
Executive Summary The World Food Programme's VAM unit began a new project in 2012 to develop a standardized approach to assessing and reporting household food insecurity in its country-level reports. The project was initiated in response to the wide diversity of methods that had been used previously. The outcome of this design phase was a proposed framework for reporting and combining food security indicators in a systematic and transparent way, using information collected in a typical VAM survey. Central to the approach is an explicit classification of households into four groups: food secure, marginally food secure, and moderately and severely food insecure. Classifying households into one of these groups is done with survey data using an algorithm that combines information about current consumption, using the Food Consumption Score, with a household's potential for sustaining that consumption into the future, based on indicators of income status and asset depletion. A household's food expenditure share can provide a proxy for its income status, and livelihood coping strategy questions can be combined to provide a proxy for asset depletion. The design phase report signaled certain limitations to the approach, and called for continued analysis and pilot-testing to address them. Over the past year, a working group at VAM, seeking to improve the approach, has experimented with a number of aspects of this framework. This report is a summary of the progress that has been made to address some of the concerns and limitations raised. Three main issues are covered here and address: (1) incorporation of an experiential-based consumption indicator; (2) improvements to the food expenditure measure; and (3) standardization of the livelihood coping strategies indicator. Experiential-based indicators, such as the consumption-based reduced Coping Strategies Index, can complement information contained in diet diversity indicators like the Food Consumption Score. But, given the uncertainty about which thresholds should be used with this indicator, and given the extensive international experimentation with other experiential indicators, the working group decided it was prudent to not include a specific experiential indicator at this time for calculation of the standardized household food insecurity rate. However, the group did consider it to be very important that the WFP field offices continue to collect data on the items that make up the reduced Coping Strategies Index, so that additional testing could be done in the coming year. Since a typical VAM survey collects information on cash expenditures, but not on the value of food produced at home, the food expenditure share is likely to be underestimated. The working group compared food expenditure shares calculated in two different ways, i.e. inclusion or not of the value of food consumed from home production. The issue was studied in several countries (Nepal, Tanzania, Yemen, Malawi, Tajikistan, Benin, and El Salvador) using various data products. Results in El Salvador shed light on the basic pattern seen across these countries. For home producers, the prevalence of households in the highest vulnerability group increased from 8% to 25%, when the value of food consumed from home production was included in the food expenditure share, whereas there was essentially no difference in these rates for non-producers. To address this issue, the working group has suggested modifying the traditional VAM expenditures module to include columns for the respondent to report the estimated value of the non-purchased food items that were consumed in the last month. To improve the livelihood coping strategies indicator, the group developed an exhaustive list of items regarding asset depletion strategies, categorized them into different groups of severity, and suggests that field offices choose the most relevant items for use in each of the severity categories for surveying their populations. A key to this strategy is to include a standard number
iii
of items at each stage of severity. The working group also redesigned the coping strategies module to collect information about the reasons why a household did not engage in each strategy, so that vulnerability would take into account previous depletion of an asset. As the pilot test proceeds over the next year, more research is needed on the standardized food security indicator, both for making refinements to it, and for understanding its properties. This includes analysis on the different options for including an experiential-based indicator. It also includes more testing and validation work on both the food expenditure share proxy indicator and the asset depletion indicator. Development of a quantitative measure of the value of household assets is also a desirable and achievable goal. A vanguard field office could take the lead in making this happen. Finally, as to communications around this new approach, the working group endorses naming it the Consolidated Approach to Reporting Indicators of Food Security, or CARI. This name is favored because one of the main goals of this project is to promote transparent and systematic reporting of a suite of indicators. The standardized food security console, which consolidates all of these indicators into a one-page table, is central to this approach. The overall household food security measure discussed in this report is an index derived from combining several food security indicators. The group recommends naming this World Food Programme's Food Security Index, or FSI.
iv
Table of Contents Executive Summary ...................................................................................................................... ii
Introduction ................................................................................................................................... 1
An experiential-based consumption indicator ............................................................................... 1
Development and testing of the food expenditure module ............................................................ 3
Including the value of non-purchased food ............................................................................... 4
A revised food expenditure module ........................................................................................... 5
Comparisons to LSMS food expenditure modules .................................................................... 5
The links between food expenditure share and measures of poverty ....................................... 6
Summary and recommendations for the next phase of in-country pilot testing ............................ 8
Recommendations for future research on refining the approach .................................................. 9
Communicating about the standardized approach ..................................................................... 10
References .................................................................................................................................. 11
Figure 1. Household conditions of proposed WFP food security groups .................................... 12
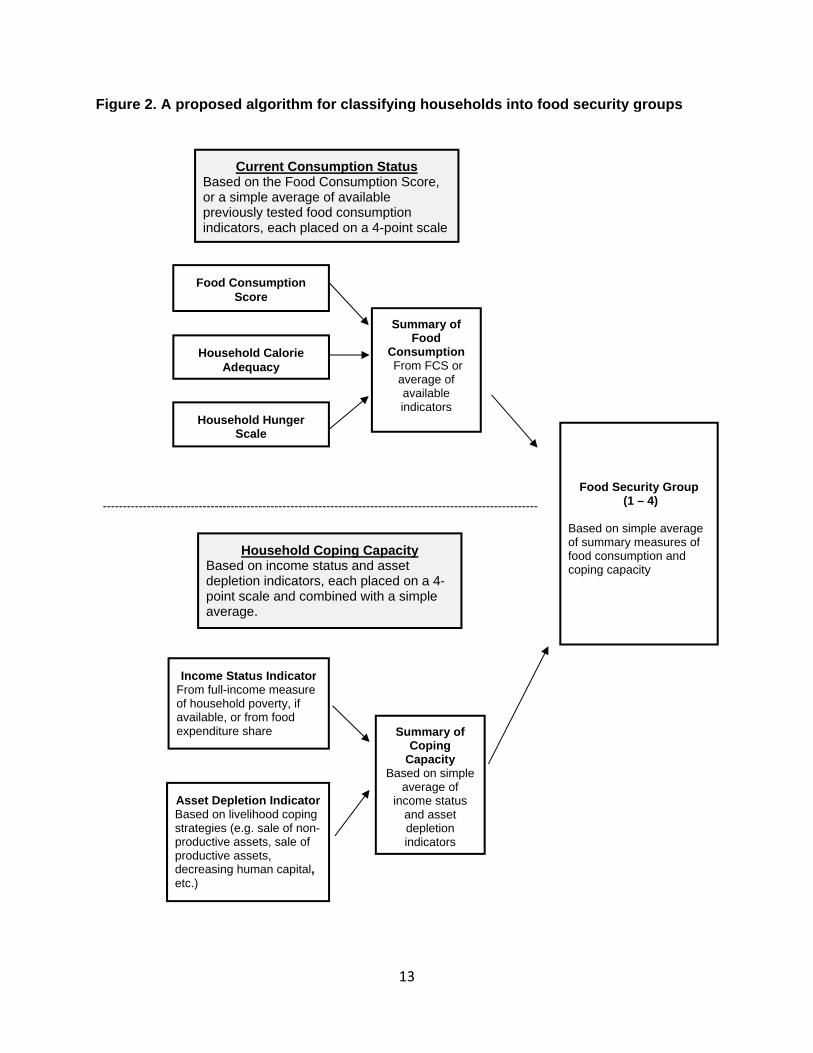
Figure 2. A proposed algorithm for classifying households into food security groups ................ 13
Table 1. Frequency of selected consumption coping strategies by FCS group .......................... 14
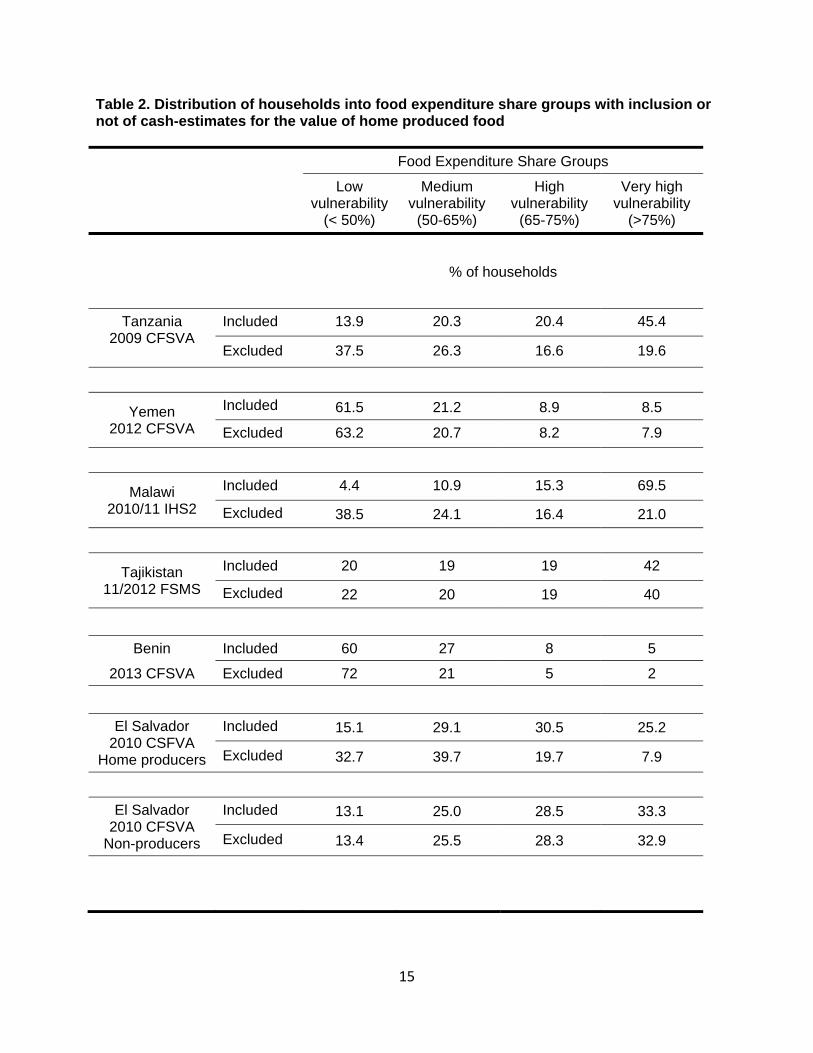
Table 2. Distribution of households into food expenditure share groups .................................... 15
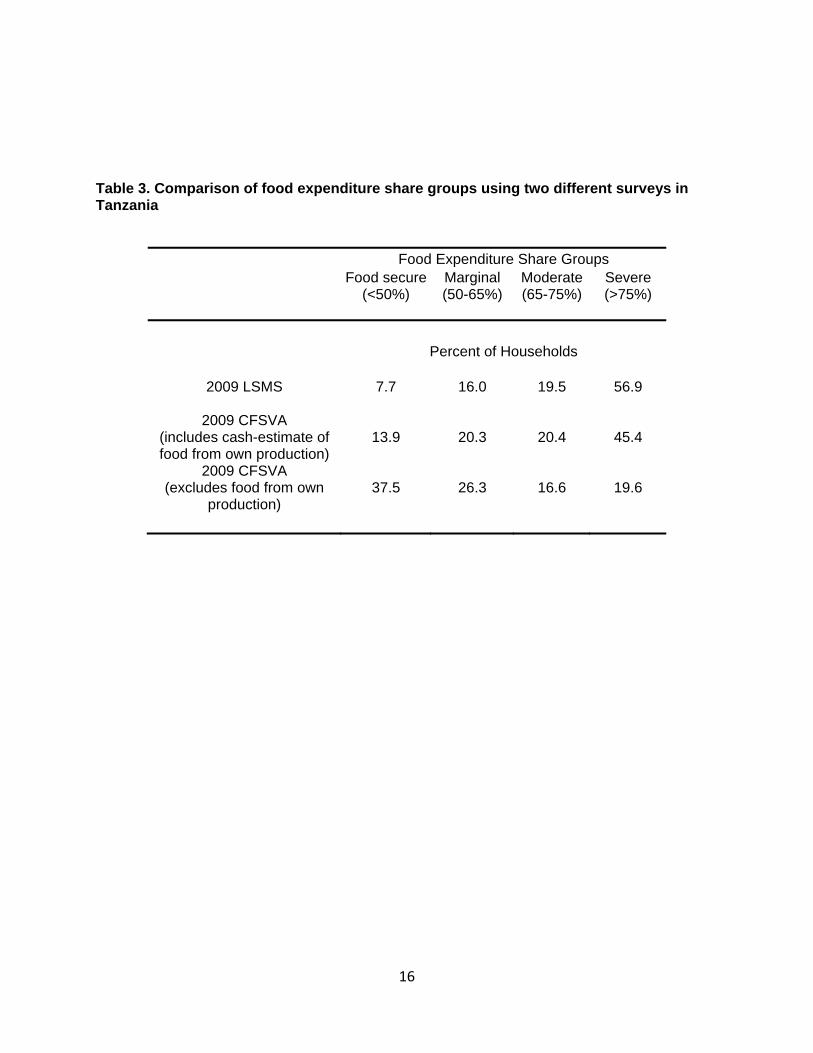
Table 3. Comparison of food expenditure share groups using two different surveys ................. 16
Table 4. Correlation1 of food expenditure share with total per capita expenditures .................... 17
Table 5. Food expenditure thresholds as an indicator of poverty ............................................... 18
Table 6. Livelihood coping strategies to be used in the asset depletion indicator ...................... 19
Table 7. Example questions for livelihood coping strategies module ......................................... 20
1
Food Security Assessment at WFP:
Report on Continued Development and Testing of a Standardized Approach Introduction The World Food Programme's VAM unit began a new project in 2012 to develop a standardized approach to assessing and reporting household food insecurity in its country-level reports. The project was initiated in response to the wide diversity of methods that had been used previously. For example, one review of comprehensive food security reports from 2009 to 2011 found nine different ways in which the household food security indicator was calculated. A mixed-methods approach was used to carry out the standardization project. This included a desk review of existing publications from international agencies and the scientific literature. It also included key stakeholder input from a working group of VAM field officers in 17 countries, as well as from all WFP headquarters VAM teams. A third part of the methodology was to test a proposed approach on VAM datasets from six different countries. The outcome of this design phase was a proposed framework for reporting and combining food security indicators in a systematic and transparent way, using information collected in a typical VAM survey (Rose, 2012). Central to the approach is an explicit classification of households into four groups: food secure, marginally food secure, and moderately and severely food insecure (see Figure 1). Classifying households into one of these groups is done with survey data using an algorithm that combines information about current consumption with a household's potential for sustaining that consumption into the future (see Figure 2). For current consumption, the approach suggests using the Food Consumption Score. Assessing capacity to sustain consumption into the future is based on indicators of income status and asset depletion. A household's food expenditure share can provide a proxy for its income status, and livelihood coping strategy questions can be combined to provide a proxy for asset depletion. The design phase report signaled certain limitations to the approach, and called for continued analysis and pilot-testing to address them. Over the past year, a working group at VAM, seeking to improve the approach, has experimented with a number of aspects of this framework. This report is a summary of the progress that has been made to address some of the concerns and limitations raised. Three main issues are covered in this report and address: (1) incorporation of an experiential-based consumption indicator; (2) improvements to the food expenditure measure; and (3) standardization of the livelihood coping strategies indicator. The report is organized around these three issues, with sections describing the progress made on each of them. Then, two more sections describe recommendations for the next phase of in-country pilot testing, as well as for future research to refine the approach. An experiential-based consumption indicator The initial design phase report focused on the Food Consumption Score as the main indicator for current consumption. This indicator is well established in WFP guidance and field practice, there has been significant research on it, and it does a relatively good job of categorizing
2
households into groups (poor, borderline, acceptable) based on the quality and quantity of their food consumption over the past week (WFP, 2009). The report also left room for additional indicators to be used in the calculation of consumption groups, such as one based on food energy shortfall from a full household expenditure survey (Hoddinott, 2002) or the household hunger scale (Ballard, 2011). The latter is one of a series of experiential-based indicators that allow the respondent to report on specific experiences of deprivation (e.g. such as going a whole day without eating). It was included as one of the suite of indicators in the food security console, because it had been tested and validated internationally (Deitchler, 2010), it added a different aspect to food consumption than the FCS, and had also been suggested for use in the IPC approach. Despite inclusion in the framework, it was not emphasized. It was not present in any of the food security summary calculations of the original 6 country case studies. It had been used only rarely in VAM surveys.1 Despite this lack of emphasis, it was left in the console, as a place holder for countries wishing to use it, or for another experiential-type indicator with suitable research support, and universally-accepted thresholds. Since the Design Phase Report came out, research by the working group and by others has suggested that experiential indicators are not perfectly correlated with diet diversity indicators, and may add information to the overall picture of consumption. For example, the 2012 Djibouti EFSA used the consumption-based reduced Coping Strategies Indicator, in addition to the Food Consumption Score, in its survey of households. Results from that survey indicate that the group of households with a borderline Food Consumption Score used coping strategies – such as reducing portion sizes or reducing the number of meals eaten – more frequently than those with a poor FCS (Table 1). Moreover, a non-trivial percentage of households whose consumption was rated as acceptable exhibited some of these behaviors. For example, 13% of households with acceptable consumption reduced portions for adults in the household. Similar findings were seen in the Tajikistan FSMS, where 22% of households with an acceptable FCS reduced the portion size of meals, 14% reduced the number of meals, and 10% restricted consumption by adults (Table 1). It certainly makes sense conceptually that experiential-based indicators could complement the information in the Food Consumption Score. The FCS is a proxy indicator, collecting information on the frequency of consumption of various foods in the past week, i.e. on how many days, but does not collect information on the quantities eaten each day. So questions on the Coping Strategies Index that address the size or number of meals consumed, or restrictions by certain members, would seem to complement the frequency information collected by the FCS. In a recent detailed study in the Tigray area of Ethiopia, Maxwell and colleagues tested various food consumption indicators over several periods from 2011 to 2013 (Maxwell, 2013). In general, they found that experiential-based indicators, such as the Coping Strategies Index or the household food insecurity access scale (HFIAS), provided additional information to diversity indicators such as the FCS or FAO's household diet diversity indicators. They recommended including both types of indicators to enhance the picture of consumption.
1 Some field officers find the Household Hunger Scale useful only as a severe measure of food insecurity. Note that the least severe item on the scale asks about if there was no food to eat of any kind in the household. Moreover, one of the field offices that tested it reported that it was not well accepted by the national government.
3
Despite the clear indications that an experiential-based indicator could add important information to the assessment of consumption, it is less clear which of the many indicators should be added. There are good arguments for including the reduced coping consumption strategies indicator. It has been part of WFP guidance for a number of years, and most field officers have experience including it in surveys and analyzing the results of data collection (Maxwell, 2003). However, to include it in the standardized food security console would require universal thresholds, and the empirical work to develop specific thresholds and validate them has not yet been done. An alternative approach is to use data from the reduced Coping Strategies Index to augment the Food Consumption Score. Specifically, households with an acceptable Food Consumption Score (i.e. food secure on this indicator) are reclassified to marginally food secure, if they adopted a consumption-based coping strategy, other than "relying on less preferred foods". This approach can enrich the analysis of current consumption by identifying households that are under stress, despite their otherwise acceptable FCS. It also preserves the FCS as the main indicator of consumption, while incorporating additional complementary information from an experiential-based indicator. The working group has experimented with this augmented food consumption score (FCS-A) in several countries, including Djibouti, Madagascar, and Mali. The net result is that classification of the moderate or severe categories (based on a "borderline" or "poor" FCS) remain the same, and the prevalence of households with "acceptable" consumption is divided into food secure and marginally food secure. Other regions and agencies have developed other experiential-based indicators. In Latin America, both the Food Security Scale for Latin America and the Caribbean (ELCSA) and the Brazilian Food Insecurity Scale (EBIA) have been developed (Perez-Escamilla, 2004; Perez-Escamilla, 2009). However, despite substantial localized testing and support among certain constituencies, neither has been subject to cross-regional validation as has the Household Hunger Scale. The U.N. Food and Agriculture Organization, a partner of WFP in the Food Security Information Network, has undertaken a big initiative to develop the Food Insecurity Experience Scale, which it is currently piloting. The Food and Nutrition Technical Assistance project, supported through USAID funds, has also begun a multi-country data analysis project to assess the strength of various food security indicators. In short, there is substantial current research and development on these experiential indicators. It is not yet clear which would be the best one to include in WFP's food standardization approach. Given all these developments, the Working Group decided it would be best not to include the reduced Coping Strategies Index in the current guidance for calculating the WFP food security indicator. However, the Working Group did feel that it was very important that the WFP field offices continue to collect data on the items that make up the reduced Coping Strategies Index, so that additional testing and research could be done in the coming year. Development and testing of the food expenditure module It is well established that the share of income spent on food decreases as household income increases. The International Food Policy Research Institute has used this basic of law economics, known as Engel's law, to develop a proxy measure of a household's food insecurity. A categorical variable is created that equates ranges of the food expenditure share to levels of food insecurity, with the most food insecure spending greater than 75% of their income on food,
4
and the food secure spending less than 50%.2 Lacking full information on a household's income, this proxy approach to assessing economic deprivation was suggested for use in the design phase report (Rose, 2012). In a full expenditure survey, like the LSMS, the food expenditure share is the ratio of the value of food from all sources to total expenditures, where total expenditures includes the value of all food and non-food items, the consumption flow from durable goods3, and housing expenses, either real or imputed rent. In the brief consumption module typically used in VAM surveys, this sort of detail on total expenditures is not possible. More importantly, we are particularly concerned about households living at the margin, who have very little possibilities of making adaptations should there be another shock. A household cannot convert imputed rent into food, nor can it convert into food the value from a durable good, such as the use value on a car, as easily as non-durables, like alcohol or tobacco.4 Our suggested Food Expenditure Share Proxy Indicator (FESPI) seeks to capture the urgency of this reality, and can be defined simply as the share of total immediate expenditures going to food. Conceptually, immediate expenditures are those that can be easily reallocated in the short-run, i.e. days or weeks. Unlike the LSMS definition, the denominator for this proxy would include the value of food and non-food items, as well as cash expenditures on housing, including utilities. This would include real rent, or payments on a mortgage, but not imputed rent on a house that is fully owned.5 Nor would it include calculations of use value of durable goods. Below we discuss more details on the numerator of the food expenditure share, i.e. the value of food consumed. Including the value of non-purchased food Much of WFP's humanitarian response is directed at poor rural households, and most of these households produce at least some, if not most, of their own food. Since a typical VAM survey only queries about cash expenditures, and does not collect information on the value of food produced at home, the food expenditure share is likely to be underestimated. This issue was raised in the initial VAM officer stakeholder meetings on this new approach, and was discussed in detail in an appendix in the design phase report (Rose, 2012). Since that time, the technical working group has further studied this issue. In particular, analyses have attempted to compare food expenditure shares calculated in two different ways, i.e. inclusion or not of the value of food consumed from home production. The issue has been studied in a range of countries (Tanzania, Yemen, Malawi, Tajikistan, Benin, and El Salvador) using various data products. In Tanzania, the 2009 CFSVA asked household respondents to estimate the value of their consumption from own production. Results from this survey showed that the estimate for the size of the most vulnerable group of households (i.e. those spending greater than 75% of their income on food) increased dramatically from 20% to 45% when the value of home produced food was included in the food expenditure share (Table 2). There is an
2 The new approach puts a number of different food security indicators on a 4-point scale to correspond to the groups shown in Figure 1. For the food expenditure share proxy of economic deprivation, the four groups in increasing order of severity are those households with <50%, 50-65%, 65-75%, or > 75% of their total expenditures allocated to food. 3 Using a durable good, like a car or refrigerator, can be thought of as an 'expense' in that one would have to rent it if one did not own it, and can be valued as a depreciation cost. 4 Households could sell a car or house, and we deal with this asset-based liquidation in our proxy for asset depletion – the livelihood coping indicator. 5 If you own a house, you cannot convert the rent you do not pay into food. If you pay rent on a house, you could conceivably miss a rent payment. Note that WFP VAM guidance on a food expenditure module has typically included costs of construction or repairs for owner-occupied housing,
5
even larger difference in Malawi, where data from the 2010-11 IHS2 show close to a 50 percentage point increase in the size of this most vulnerable group. This dramatic effect of including the value of own production in the food expenditure share was not observed in all the countries studied. For example, in Yemen and in Tajikistan, recent surveys showed only a 1 to 2 percentage point difference in the prevalence rates of this most vulnerable group based on whether the value of own consumption was included or not. Yemen in not a country of smallholder farmers, and, similarly to Tajikistan, it shows a much lower propensity to produce its own food for direct consumption than does either Tanzania or Malawi. In Benin, there was only a 3 percentage point difference in the prevalence rate of the most vulnerable group. The importance of home production for accurately estimating the food expenditure share can be seen most clearly in data from the El Salvador 2010 CFSVA. The sample was divided into 'home producers' and 'non-producers' based on questions regarding the source of staple food consumption in the previous week. For home producers, the high vulnerability rate increased from 8% to 25%, when the value of food consumed from home production was included in the food expenditure share, whereas there was essentially no difference in these rates for non-producers. A related issue concerns those in the emergency context who are fully dependent on food aid. The traditional food expenditure module would only collect information on cash food expenditures, so these households would appear to have a food expenditure share of zero. This means they would be counted in the least vulnerable category on this indicator. In a recent Emergency Food Security Assessment conducted in Northern Mali, fully 15% of households received food from host families or were living on food aid, so the little cash they had could be used on other necessities, such as soap or clothes. But their food expenditure share was zero, so they were excluded from this analysis. The follow up assessment in June 2013, collected data on the value of food consumed and indeed the analysis showed the extreme vulnerabilities of such households. A revised food expenditure module To address these issues, the working group has suggested modifying the traditional VAM expenditures module to include columns for the respondent to report the estimated value of the non-purchased food items that were consumed in the last month. Previous guidance documents suggested collecting information on how much money was spent on a series of items or services (WFP, 2009). The survey form for this previous expenditure module listed a number of food items, and enabled collection of data on estimated expenditure in cash, or in credit, for each of these items. Now the working group suggests modifying the survey module so that data on the estimated money value for each of the non-purchased food items is collected. See the technical guidance document for a detailed example of this new expenditure module (WFP, 2013). Comparisons to LSMS food expenditure modules The Living Standards Measurement Study, sponsored by the World Bank, is a survey conducted in many countries to assess poverty, and relies on a comprehensive household expenditure module to make these assessments. These surveys represent the best of available
6
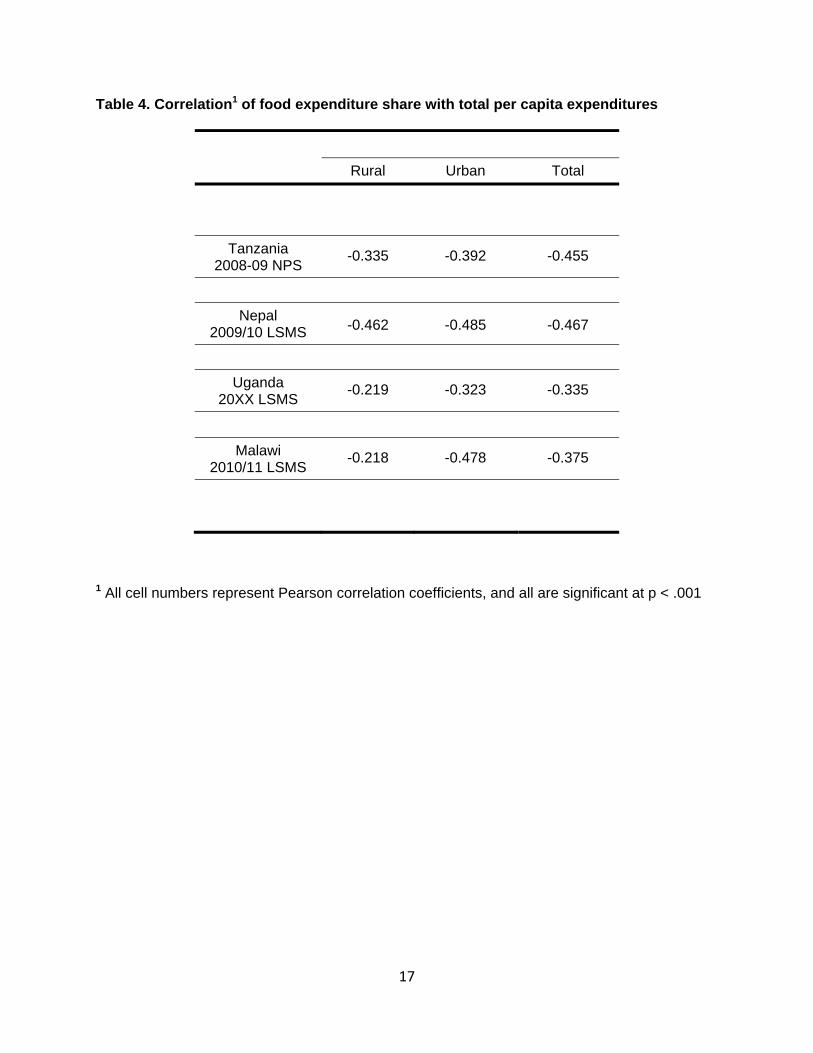
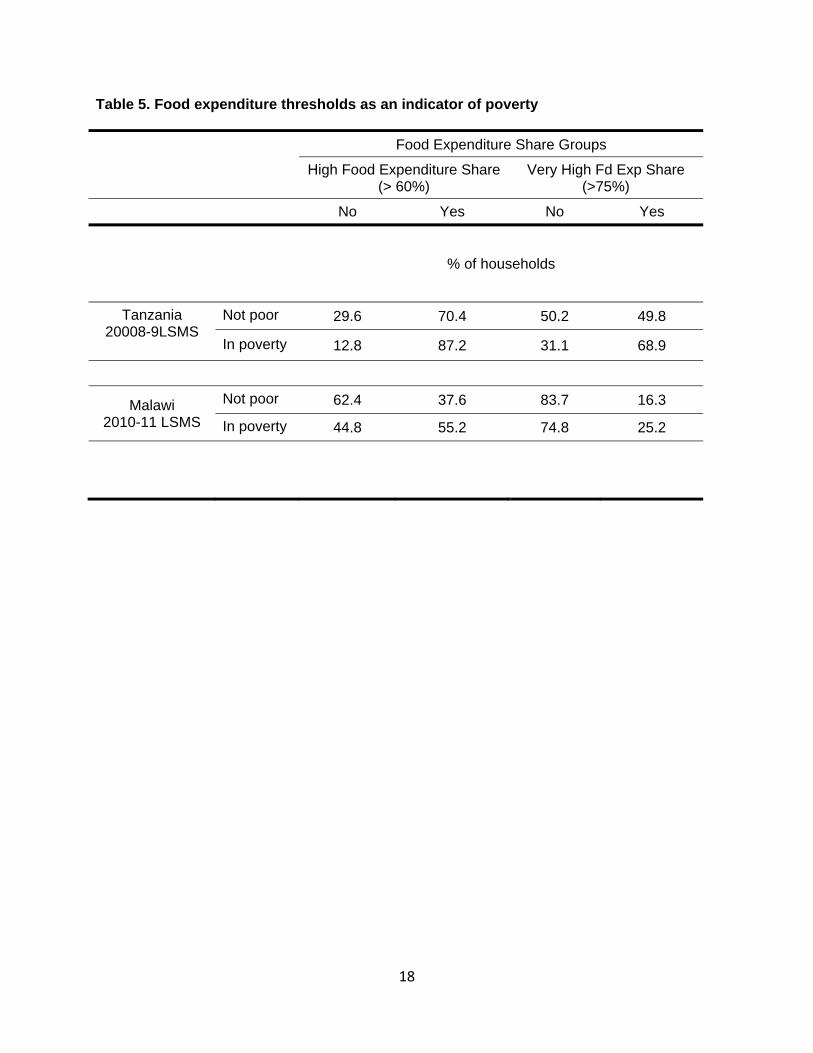
technology for assessing expenditures. How would a rapid approach to assessing expenditures, like those in the VAM surveys, compare to this gold standard? We explored this question in Tanzania using the CFSVA and the LSMS. Both had national coverage and were fielded in 2009. We calculated food expenditure shares in the usual way, i.e. adding up all spending on food and dividing this by total household expenditures on all goods. Then we grouped households into the four groups based on increasing share of food expenditures, as discussed previously (i.e. food expenditure share < 50%, 50-65%, 65-75%, or > 75%). Table 3 displays the results from the two surveys. The results from the CFSVA are dramatically different when not including the value of food consumed from own production. But the gap is sizably narrowed when this is added to the calculations. For moderate food insecurity (food expenditures = 65-75%), the two surveys produce the same prevalence rate – about 20% of the population. However, the CFSVA underestimates the percentage of those in the most vulnerable group (food expenditure share > 75%) 45% versus 57%, and overestimates those in the least vulnerable groups. Combining the two most vulnerable groups, the CFSVA underestimates this prevalence by about 10 percentage points – 66% versus 76%. Although the CFSVA food expenditure indicator underestimates the prevalence of households in this highest vulnerability group, it could be seen as a conservative estimate for the magnitude of the problem, setting a lower bound on the true rate. More research is needed on other comparable datasets to get a better idea how this indicator behaves across different countries. The links between food expenditure share and measures of poverty To what extent can we rely on the food expenditure share as an income-based measure of economic deprivation? Although it is well established that the share on food expenditures decreases as income increases, there is some concern as to whether our cut-off points are useful empirically for developing proxies for deprivation. We examined food expenditure shares in Tanzania, Nepal, Uganda, and Malawi using data from the LSMS surveys. In each case, we looked at the correlation between the food expenditure share and total expenditures.6 Table 4 displays these results, and, as expected, in all cases the food expenditure shares were significantly and negatively correlated with total expenditures. Correlations were stronger in urban rather than rural areas. This may be an survey artifact since valuing consumption is probably better accomplished when most of it is purchased in market places, rather than home produced. We also investigated the ability of our food expenditure share indicator to assess economic deprivation. We used the poverty indicator, as developed in a full household expenditure survey like the LSMS, as the best measure of economic deprivation. In Tanzania, the high food expenditure share indicator (> 60%) was quite sensitive in assessing deprivation, identifying 87% of households in poverty (Table 5). Indicators are also commonly judged on specificity, i.e. how well they identify individuals or households who do not have a given condition. Here, the high food expenditure share does poorly – capturing only 30% of households in Tanzania who are not poor. As expected, using an indicator with a higher threshold for food expenditure share, such as 75%, improves specificity (only up to 50%), and sensitivity is not as good, falling to 69%. In Malawi, this indicator shows much better specificity than sensitivity. The lack of
6 Total current expenditures is often used as a proxy for long-run income, since it is easier to collect and there is relatively little savings among households in low-income countries.
7
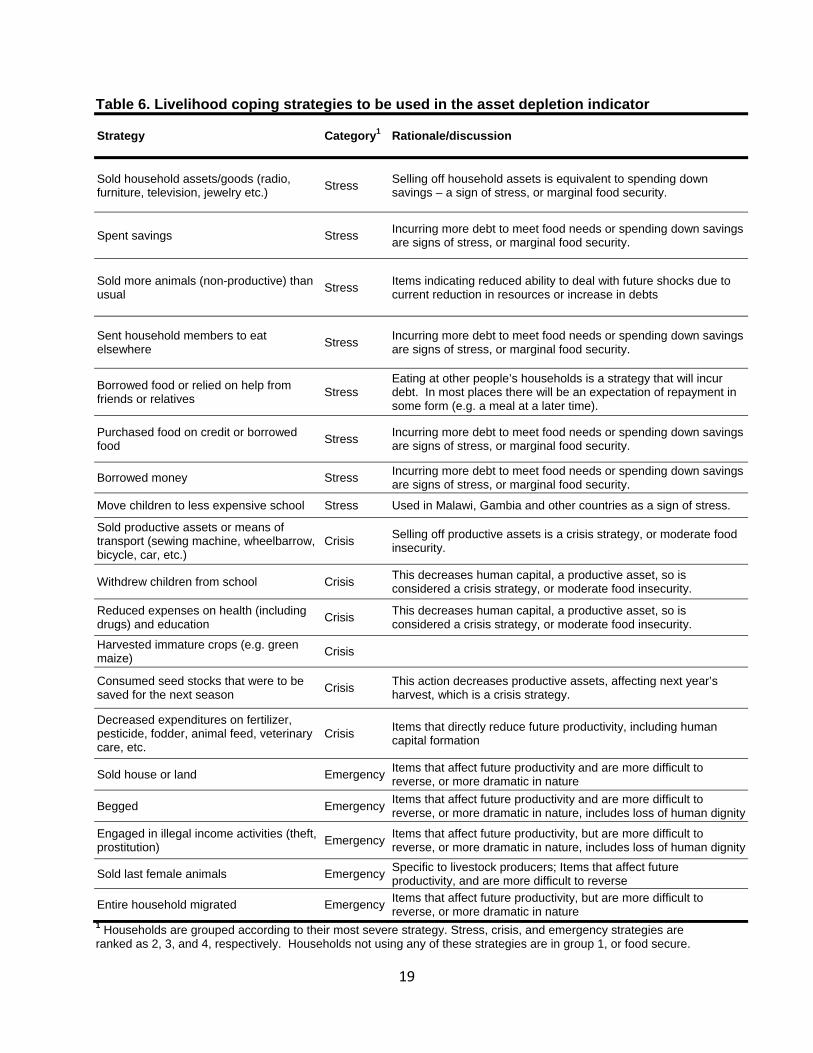
predictive power may in part be due to conceptual differences, as the LSMS poverty classification uses total consumption expenditures, and we are using 'total immediate expenditures', which excludes imputed values for rent and durables. More research is clearly needed on this topic to see how well the food expenditure share indicator is predictive of economic deprivation. Refinements to the Livelihood Coping Strategies Indicator In broad terms, household economic status is determined by income and assets. In the development of this food security standardization approach, we suggested using an indicator of asset depletion, such as a livelihood coping strategies indicator. By understanding the behaviors households have taken to adapt to recent crises, such as selling productive assets, we would get a rough sense for how difficult their current situation is, and how likely they would be able to meet challenges in the future. Most of the items for this type of indicator were already being collected in VAM surveys, so the transition to its use here as an indicator of asset depletion was considered to be the easiest. Questionnaire items for this asset depletion indicator were classified into three broad groups, including stress, crisis, and emergency strategies, corresponding to increasing levels of economic vulnerability and food insecurity. Stress strategies, such as borrowing money or spending savings, are those which indicate a reduced ability to deal with future shocks due to a current reduction in resources or increase in debts. Crisis strategies, such as selling productive assets, directly reduce future productivity, including human capital formation. Emergency strategies, such as selling one's land, affect future productivity, but are more difficult to reverse or more dramatic in nature. Households are assigned a ranking based on the most severe behaviors noted. Households engaging in routine economic activities that did not involve any of these strategies would be considered equivalent to food secure on this indicator. Several problems were noted with this indicator in the design phase report. In the past year, the technical working group has been addressing these and some newly identified issues with this approach. First, the list of strategies presented in the report was neither exhaustive nor universal, and there was relatively little guidance on how to group some items into different categories. The working group was concerned that this would allow room for interpretation and decisions at the local level, and, therefore, would not facilitate a standardized approach. Another problem is that some households may have depleted assets in the period prior to the reference period for a given questionnaire. Thus, these households might not be identified by the instrument as being as vulnerable they really are. To address the first problem, the group decided on an approach that would provide for as much flexibility as possible at the local level, and yet still lead to a standardized indicator with a common meaning across locations. Specifically, the approach was to develop an exhaustive list of items regarding asset depletion strategies, categorize them into different groups of severity, and allow field offices to choose the most relevant items for use in surveying their populations. A key to this strategy is to include in survey questionnaires a standard number of items at each stage of severity, so the likelihood of classifying households into one group or another is not dependent on some countries having a greater number of items in the severe category than other countries, for example. The master list of items to be used in this module, and their classification into groups of severity is displayed in Table 6. To address the second issue, the working group redesigned the coping strategies module to collect information about the reasons why a household did not engage in each strategy (See
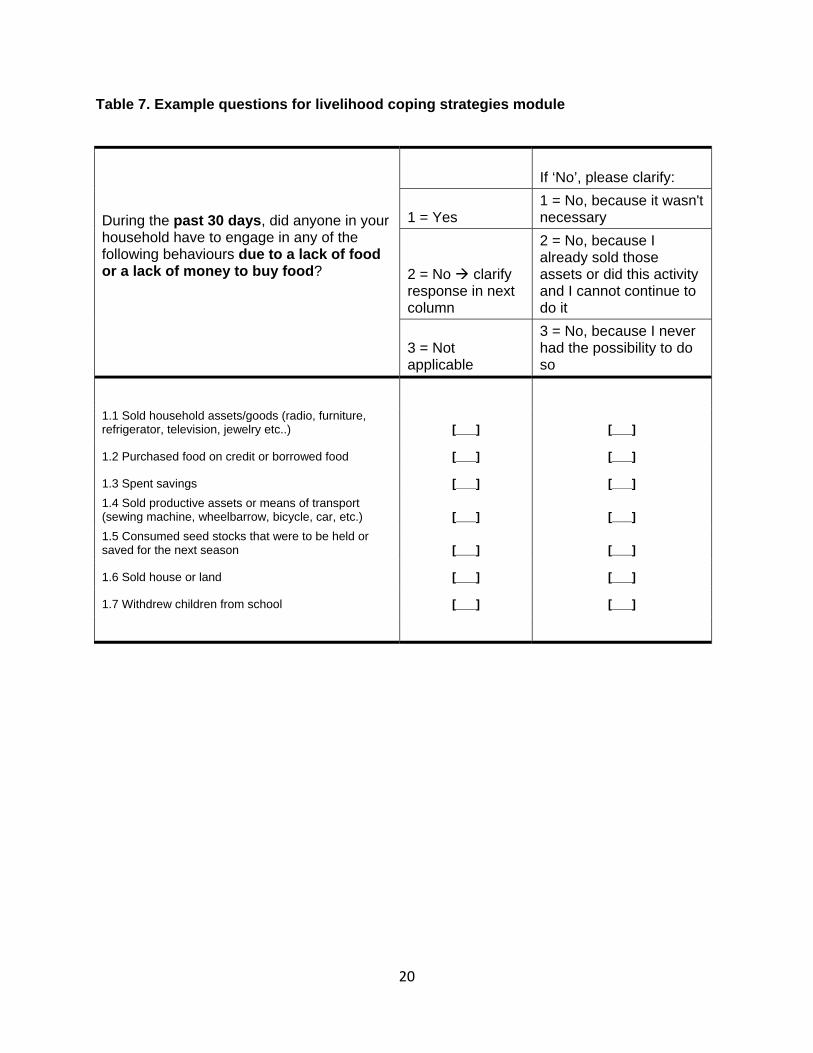
8
example wording in Table 7). Specifically, a household could answer that it wasn't necessary to engage in a given strategy, or it already engaged a given strategy (e.g. sold land), and could not continue to do this activity, or it was never possible to employ this strategy. Those households that had engaged in a particular strategy previously, and could therefore no longer continue to engage in it, would be scored the equivalent of having used that strategy. In effect, this approach extends the reference period of the questionnaire to enable understanding of cumulative damage to assets from repeated shocks.7 Summary and recommendations for the next phase of in-country pilot testing This report summarizes the progress that has been made over the past year by a VAM working group in developing a standardized WFP household food security measure. The measure was originally laid out in a Design Phase Report that was published in late 2012. Several concerns were raised about specific methods used in the initial approach outlined in that report. Three main issues were addressed here: (1) the potential for incorporation of an experiential-based consumption indicator; (2) improvements to the food expenditure measure; and (3) standardization of the livelihood coping strategies indicator. Each of these is discussed below with specific recommendations for the coming year of pilot testing of the standardized measure. Experiential-based indicators, such as the consumption Coping Strategies Index, can complement information contained in diet diversity indicators like the Food Consumption Score. But, given the uncertainty about which thresholds should be used with this indicator, and given the extensive international experimentation with other experiential indicators, the working group decided it was prudent to not include a specific experiential indicator at this time for calculation of the standardized household food insecurity rate. However, the group did consider it to be very important that the WFP field offices continue to collect data on the items that make up the reduced Coping Strategies Index, so that additional testing could be done in the coming year. Recommendation 1a: At this time, do not include an experiential-based consumption indicator in the calculation of the new standardized household food security measure. Recommendation 1b: Field offices should continue to collect data on the reduced Coping Strategies Index during the pilot phase of testing. Since a typical VAM survey collects information on cash expenditures, but not on the value of food produced at home, the food expenditure share is likely to be underestimated. The working group compared food expenditure shares calculated in two different ways, i.e. inclusion or not of the value of food consumed from home production. The issue was studied in several countries (Nepal, Tanzania, Yemen, Malawi, Tajikistan, and El Salvador) using various data products. Results in El Salvador shed light on the basic pattern seen across these countries. For home producers, the rate of households in the highest vulnerability group increased from 8% to 25%, when the value of food consumed from home production was included in the food expenditure
7 Note that those households who did not engage in an asset depletion strategy because they never had the possibility of using that strategy were not changed. The asset depletion indicator clearly measures the change in assets, as opposed to a fixed level. To be consistent with this construct, we have not assumed that because a household could not engage in a strategy, it was at risk. For example, teachers or government workers who are landless never had the possibility of selling land, but that does not mean they are economically deprived. There are, however, shortcomings to this approach of not assessing the asset level itself. For example, sharecroppers, who never owned land, are not in a particularly strong position, but in terms of asset depletion, land tenure would not enter into this calculation.
9
share, whereas there was essentially no difference in these rates for non-producers. Including the value of food is also important for accurately identifying vulnerabilities among households that live completely on food assistance, as was seen in Mali. To address this issue, the working group has suggested modifying the traditional VAM expenditures module to include columns for the respondent to report the estimated value of the non-purchased food items that were consumed in the last month. Recommendation 2: The food expenditure module should be expanded to capture data on the value of non-purchased food items that were consumed in the previous month. To improve the livelihood coping strategies indicator, the group developed an exhaustive list of items regarding asset depletion strategies, and categorized them into different groups of severity – stress, crisis, or emergency. The working group suggests that field offices choose the most relevant items for use in each of the severity categories for surveying their populations. A key to this strategy is to include a standard number of items at each stage of severity. The working group also redesigned the coping strategies module to collect information about the reasons why a household did not engage in each strategy, so that vulnerability would take into account previous depletion of an asset. Recommendation 3: Use the new list of items regarding asset depletion strategies so as to develop a consistent indicator across countries. Select the recommended number of each type (stress, crisis, emergency). Collect information on previous depletion of assets. Recommendations for future research on refining the approach As the approach gets pilot-tested over the next year, more research is needed on several aspects regarding it, the first being the experiential-based consumption indicator. If the reduced Coping Strategy Index is to be used, more research is needed on the different ways of incorporating it with the Food Consumption Score, and their implications for overall household food insecurity rates. If a simple average of the two indicators is to be used, they both need to be converted to the 4-point scale. There is clear guidance on how to do this with the FCS, but not with the CSI. One approach would be to categorize the household into the vulnerability group based on the specific items in the CSI, using the most severe item for that household. A second approach would be to calculate the CSI in the usual way using the universal weights. But this would require development of universal thresholds. An entirely different method – referred to here as the augmented Food Consumption Score, or FCS-A – would use evidence of coping strategies to move those households with an "acceptable" food consumption score into the second vulnerability category, i.e. "marginally food secure". More research is also needed on the food expenditure share proxy indicator. More testing should be done which compares the estimates on this indicator using VAM survey methods versus those of the LSMS. More research is also needed to see how well the food expenditure share proxies for an established indicator of economic deprivation, such as poverty. Depending on these results, there may be value in exploring a second proxy, such as the share of expenditures on cereals. More analysis will also be done on the asset depletion indicator, as this is a new tool. This should include validation studies, if possible. Equally important is the development of a field approach to assess the value of current assets quantitatively. This has a clear meaning in
10
economic terms and can be understood universally. Methods currently exist to implement this with relatively simple survey techniques, and a vanguard field office could take the lead on this. For example, modules exist for collecting information on household possessions, such as those used in the context of a wealth index. Simple market surveys could also be conducted at the community or regional level to collect data on the monetary value of the household possessions that make up the wealth index. Combining the two would enable calculation of total the value of household assets. In sum, more research over the following year will be helpful in improving the performance of this new standardized food security indicator. Communicating about the standardized approach Several aspects related to communicating about this standardized approach were discussed by the working group and others at HQ. These include the naming of the overall approach, the naming of the food security measure itself, how to report on different categories of food insecurity, and the link between this new measure and the IPC approach. The team endorses naming the overall approach as the Consolidated Approach to Reporting Indicators of Food Security, or CARI. This name is favored since one of the main goals of this project is to promote transparent and systematic reporting of a suite of indicators. The standardized food security console, which consolidates all of these indicators into a one-page table, is central to this approach. The overall household food security measure discussed in this report is an index derived from combining several food security indicators. We recommend naming this the Food Security Index, or FSI. This may also be referred to as WFP's Food Security Index. There are four categories of food security identified by this index. In keeping with WFP practice, the working group refers to the overall prevalence of food insecurity as a combination of the moderately and severely food insecure categories. It is important in developing this standardized approach that the food insecurity prevalence rates are not artificially inflated due to categorization, that is, in moving from an indicator with 3 categories to one with 4 categories. The marginally food secure category is new to this approach, and allows us to distinguish households that are not fully food secure, and may be at risk for more serious problems. But they should not be classified as food insecure for purposes of emergency relief operations. Distinguishing the marginally food secure is important, however, for WFP programs in the areas of asset-building and nutrition that are more focused on development to prevent tomorrow's emergencies rather than dealing with today's crises. Finally, WFP field officers may become involved in their countries with other activities related to food security assessment, such as the International Food Security Phase Classification (IPC) system. The approach described in these standardization reports was explicitly designed to facilitate such an IPC approach. It is clear that WFP needs to standardize its own assessment approach, but by moving to four categories, by relating the conditions to those of the IPC approach, and by developing a systematic reporting framework, an important objective of this process has been to facilitate the participation of VAM officers in local IPC activities.
11
References Ballard T, Coates J, Swindale A, Deitchler M, 2011. Household Hunger Scale: Indicator Definition and Measurement Guide. Food and Nutrition Technical Assistance-2 Bridge, FHI 360, Washington, DC. Deitchler M, Ballard T, Swindale A, Coates J, 2010. Validation of a Measure of Household Hunger for Cross-Cultural Use. Food and Nutrition Technical Assistance II, Academy for Educational Development, Washington, DC. Hoddinott, J. and Yohannes, Y. (2002). Dietary Diversity as a Food Security Indicator. Washington, D.C., Food and Nutrition Technical Assistance Project, Academy for Educational Development. Maxwell D, Watkins B, Wheeler R, Collins G, 2003. The Coping Strategies Index: Field Methods Manual. CARE and World Food Programme, Nairobi. Maxwell, D., Coates, J. and Vaitla, B. (2013). How do different indicators of household food security compare? Empirical evidence from Tigray. Medford, USA, Feinstein International Center, Tufts University. Perez-Escamilla, R., Segall-Correa, A. M., Kurdian Maranha, L., Sampaio Md Mde, F., et al. (2004). "An adapted version of the U.S. Department of Agriculture Food Insecurity module is a valid tool for assessing household food insecurity in Campinas, Brazil." J Nutr 134(8): 1923-1928. Perez-Escamilla, R. (2009). The Latin American Household Food Security Measurement Scale (ELCSA). International Congress of Nutrition, Bangkok, Thailand. Rose D. Assessing Food Security at the UN World Food Programme: Towards a Unified Approach. Design Phase Report. Food Security Analysis Service, UN World Food Programme, 2012. World Food Programme, 2009. Comprehensive Food Security & Vulnerability Analysis Guidelines, first edition. World Food Programme, Rome. World Food Programme, 2013. Technical Guidance for WFP's Consolidated Approach to Reporting Indicators of Food Security. World Food Programme, Rome.
12
Figure 1. Household conditions of proposed WFP food security groups
Food Security Group Household Group Condition8
Food Secure Able to meet essential food and non-food needs without depletion of assets
Marginally Food Insecure
Has minimally adequate food consumption, but unable to afford some essential non-food expenditures without depletion of assets
Moderately Food Insecure
Has food consumption gaps, OR, Marginally able to meet minimum food needs only with accelerated depletion of livelihood assets
Severely Food Insecure
Has large food consumption gaps, OR, Has extreme loss of livelihood assets that will lead to large food consumption gaps, OR worse.
8 Household group conditions are adapted from the International Food Security Phase Classification (IPC) Version 2.0 (IPC Global Support Unit, 2012). See Annex A1 of Design Phase Report for a 'crosswalk' comparison to household conditions in the IPC.
13
Figure 2. A proposed algorithm for classifying households into food security groups
Current Consumption Status Based on the Food Consumption Score, or a simple average of available previously tested food consumption indicators, each placed on a 4-point scale
Income Status Indicator From full-income measure of household poverty, if available, or from food expenditure share
Asset Depletion Indicator Based on livelihood coping strategies (e.g. sale of non-productive assets, sale of productive assets, decreasing human capital, etc.)
Summary of Coping
Capacity Based on simple
average of income status
and asset depletion indicators
Food Security Group (1 – 4)
Based on simple average of summary measures of food consumption and coping capacity
Food Consumption Score
Household Calorie Adequacy
Household Hunger Scale
Summary of Food
Consumption From FCS or
average of available indicators
Household Coping Capacity Based on income status and asset depletion indicators, each placed on a 4-point scale and combined with a simple average.
14
Table 1. Frequency of selected consumption coping strategies by FCS group, Djibouti, 2012 and Tajikistan, 2012
Food Consumption Score Group
Poor Borderline Acceptable
Percent of Households
Djibouti 2012 EFSA
Reduce portion size 32 38 17
Reduce number of meals 37 50 12
Reduce consumption of adults 36 33 13
Tajikistan 11/2012 FSMS
Reduce portion size 61 41 22
Reduce number of meals 57 31 14
Reduce consumption of adults 29 21 10
15
Table 2. Distribution of households into food expenditure share groups with inclusion or not of cash-estimates for the value of home produced food
Food Expenditure Share Groups
Low vulnerability
(< 50%)
Medium vulnerability
(50-65%)
High vulnerability
(65-75%)
Very high vulnerability
(>75%)
% of households
Tanzania 2009 CFSVA
Included 13.9 20.3 20.4 45.4
Excluded 37.5 26.3 16.6 19.6
Yemen 2012 CFSVA
Included 61.5 21.2 8.9 8.5
Excluded 63.2 20.7 8.2 7.9
Malawi 2010/11 IHS2
Included 4.4 10.9 15.3 69.5
Excluded 38.5 24.1 16.4 21.0
Tajikistan 11/2012 FSMS
Included 20 19 19 42
Excluded 22 20 19 40
Benin Included 60 27 8 5
2013 CFSVA Excluded 72 21 5 2
El Salvador 2010 CSFVA
Home producers
Included 15.1 29.1 30.5 25.2
Excluded 32.7 39.7 19.7 7.9
El Salvador 2010 CFSVA
Non-producers
Included 13.1 25.0 28.5 33.3
Excluded 13.4 25.5 28.3 32.9
16
Table 3. Comparison of food expenditure share groups using two different surveys in Tanzania
Food Expenditure Share Groups
Food secure (<50%)
Marginal (50-65%)
Moderate (65-75%)
Severe (>75%)
Percent of Households
2009 LSMS
7.7 16.0 19.5 56.9
2009 CFSVA (includes cash-estimate of food from own production)
13.9 20.3 20.4 45.4
2009 CFSVA (excludes food from own
production) 37.5 26.3 16.6 19.6
17
Table 4. Correlation1 of food expenditure share with total per capita expenditures
Rural Urban Total
Tanzania 2008-09 NPS
-0.335 -0.392 -0.455
Nepal 2009/10 LSMS -0.462 -0.485 -0.467
Uganda 20XX LSMS
-0.219 -0.323 -0.335
Malawi 2010/11 LSMS
-0.218 -0.478 -0.375
1 All cell numbers represent Pearson correlation coefficients, and all are significant at p < .001
18
Table 5. Food expenditure thresholds as an indicator of poverty
Food Expenditure Share Groups
High Food Expenditure Share (> 60%)
Very High Fd Exp Share (>75%)
No Yes No Yes
% of households
Tanzania 20008-9LSMS
Not poor 29.6 70.4 50.2 49.8
In poverty 12.8 87.2 31.1 68.9
Malawi 2010-11 LSMS
Not poor 62.4 37.6 83.7 16.3
In poverty 44.8 55.2 74.8 25.2
19
Table 6. Livelihood coping strategies to be used in the asset depletion indicator
Strategy Category1 Rationale/discussion
Sold household assets/goods (radio, furniture, television, jewelry etc.)
Stress Selling off household assets is equivalent to spending down savings – a sign of stress, or marginal food security.
Spent savings Stress Incurring more debt to meet food needs or spending down savings are signs of stress, or marginal food security.
Sold more animals (non-productive) than usual
Stress Items indicating reduced ability to deal with future shocks due to current reduction in resources or increase in debts
Sent household members to eat elsewhere
Stress Incurring more debt to meet food needs or spending down savings are signs of stress, or marginal food security.
Borrowed food or relied on help from friends or relatives
Stress Eating at other people’s households is a strategy that will incur debt. In most places there will be an expectation of repayment in some form (e.g. a meal at a later time).
Purchased food on credit or borrowed food
Stress Incurring more debt to meet food needs or spending down savings are signs of stress, or marginal food security.
Borrowed money Stress Incurring more debt to meet food needs or spending down savings are signs of stress, or marginal food security.
Move children to less expensive school Stress Used in Malawi, Gambia and other countries as a sign of stress.
Sold productive assets or means of transport (sewing machine, wheelbarrow, bicycle, car, etc.)
Crisis Selling off productive assets is a crisis strategy, or moderate food insecurity.
Withdrew children from school Crisis This decreases human capital, a productive asset, so is considered a crisis strategy, or moderate food insecurity.
Reduced expenses on health (including drugs) and education
Crisis This decreases human capital, a productive asset, so is considered a crisis strategy, or moderate food insecurity.
Harvested immature crops (e.g. green maize)
Crisis
Consumed seed stocks that were to be saved for the next season
Crisis This action decreases productive assets, affecting next year’s harvest, which is a crisis strategy.
Decreased expenditures on fertilizer, pesticide, fodder, animal feed, veterinary care, etc.
Crisis Items that directly reduce future productivity, including human capital formation
Sold house or land EmergencyItems that affect future productivity and are more difficult to reverse, or more dramatic in nature
Begged EmergencyItems that affect future productivity and are more difficult to reverse, or more dramatic in nature, includes loss of human dignity
Engaged in illegal income activities (theft, prostitution)
EmergencyItems that affect future productivity, but are more difficult to reverse, or more dramatic in nature, includes loss of human dignity
Sold last female animals EmergencySpecific to livestock producers; Items that affect future productivity, and are more difficult to reverse
Entire household migrated EmergencyItems that affect future productivity, but are more difficult to reverse, or more dramatic in nature
1 Households are grouped according to their most severe strategy. Stress, crisis, and emergency strategies are ranked as 2, 3, and 4, respectively. Households not using any of these strategies are in group 1, or food secure.
20
Table 7. Example questions for livelihood coping strategies module
During the past 30 days, did anyone in your household have to engage in any of the following behaviours due to a lack of food or a lack of money to buy food?
If ‘No’, please clarify:
1 = Yes 1 = No, because it wasn't necessary
2 = No clarify response in next column
2 = No, because I already sold those assets or did this activity and I cannot continue to do it
3 = Not applicable
3 = No, because I never had the possibility to do so
1.1 Sold household assets/goods (radio, furniture, refrigerator, television, jewelry etc..) [___] [___]
1.2 Purchased food on credit or borrowed food [___] [___]
1.3 Spent savings [___] [___]
1.4 Sold productive assets or means of transport (sewing machine, wheelbarrow, bicycle, car, etc.) [___] [___]
1.5 Consumed seed stocks that were to be held or saved for the next season [___] [___]
1.6 Sold house or land [___] [___]
1.7 Withdrew children from school [___] [___]


![United Nations World Food Program (WFP) · WORLD FOOD PROGRAMME The World Food Programme[a] (WFP) is the food-assistance branch of the United Nations and the world's largest humanitarian](https://img.pdfslide.us/doc/110x75/5ff94d74123fcc5e865ee5ba/united-nations-world-food-program-wfp-world-food-programme-the-world-food-programmea.jpg)