Embed Size (px)
Citation preview

Abstract
The gross-output multifactor productivity index for U.S. food manufacturing grew 0.19percent per year between 1975 and 1997. This productivity growth is low when comparedwith an estimate of 1.25 percent per year for the whole manufacturing sector. Low invest-ment in research and development (R&D) could be one reason. Although productivity hasbeen relatively low, food manufacturing output has grown significantly at 1.88 percentover the last two decades. Indeed, the expansion of combined factor inputs provided signif-icant impetus to food manufacturing output. Food manufacturing is materials-intensive,and declining real producer prices of crude food and feedstuffs fueled the expansion ofinput utilization and drove down prices of processed foods paid by consumers.
Keywords: Food manufacturing, multifactor productivity, labor productivity.
Acknowledgments
The author thanks Mark Denbaly, Nicole Ballenger, David Davis, Paul Heisey, and Mike Ollinger of the Economic Research Service, Bob Chambers of the University ofMaryland, and Tom Lutton of the Office of Federal Housing Enterprise Oversight forhelpful review of the earlier drafts of this report; John Connor of Purdue University andGerry Schluter of the Economic Research Service for their suggestions in compiling theCensus of Manufacturing data; Lou King for editorial advice and Wynnice Pointer-Napper for the final document layout and charts.
United StatesDepartmentof Agriculture
www.ers.usda.gov
Electronic Report from the Economic Research Service
October 2003
TechnicalBulletinNumber 1905
Food Manufacturing Productivityand Its Economic Implications
Kuo S. Huang

Contents
Summary . . . . . . . . . . . . . . . . . . . . . . . . . . . . . . . . . . . . . . . . . . . . . . . . . . . . . . . .iii
Introduction . . . . . . . . . . . . . . . . . . . . . . . . . . . . . . . . . . . . . . . . . . . . . . . . . . . . . .1
Production and Factor Inputs . . . . . . . . . . . . . . . . . . . . . . . . . . . . . . . . . . . . . . . .2Gross and Net Outputs . . . . . . . . . . . . . . . . . . . . . . . . . . . . . . . . . . . . . . . . . . . . .2Labor Input . . . . . . . . . . . . . . . . . . . . . . . . . . . . . . . . . . . . . . . . . . . . . . . . . . . . . .4Capital Input . . . . . . . . . . . . . . . . . . . . . . . . . . . . . . . . . . . . . . . . . . . . . . . . . . . . .6Material and Energy Inputs . . . . . . . . . . . . . . . . . . . . . . . . . . . . . . . . . . . . . . . . .6
Methodology of Measuring Productivity . . . . . . . . . . . . . . . . . . . . . . . . . . . . . .10Derivation of Productivity Measures . . . . . . . . . . . . . . . . . . . . . . . . . . . . . . . . .10The Törnqvist Index Approximation . . . . . . . . . . . . . . . . . . . . . . . . . . . . . . . . .11Empirical Modeling . . . . . . . . . . . . . . . . . . . . . . . . . . . . . . . . . . . . . . . . . . . . . .11
Empirical Productivity Measures . . . . . . . . . . . . . . . . . . . . . . . . . . . . . . . . . . . .13Gross-Output Productivity Measures . . . . . . . . . . . . . . . . . . . . . . . . . . . . . . . . .13Net-Output Productivity Measures . . . . . . . . . . . . . . . . . . . . . . . . . . . . . . . . . . .18
Concluding Remarks . . . . . . . . . . . . . . . . . . . . . . . . . . . . . . . . . . . . . . . . . . . . . .26
References . . . . . . . . . . . . . . . . . . . . . . . . . . . . . . . . . . . . . . . . . . . . . . . . . . . . . . .27
Appendix A: Data Compilations . . . . . . . . . . . . . . . . . . . . . . . . . . . . . . . . . . . . .28
Appendix B: Estimated Capital Depreciation Equations . . . . . . . . . . . . . . . . .31
Appendix C: Yearly Productivity Measures . . . . . . . . . . . . . . . . . . . . . . . . . . .32
ii ✺ Food Manufacturing Productivity and Its Economic Implications / TB-1905 Economic Research Service/USDA
Summary
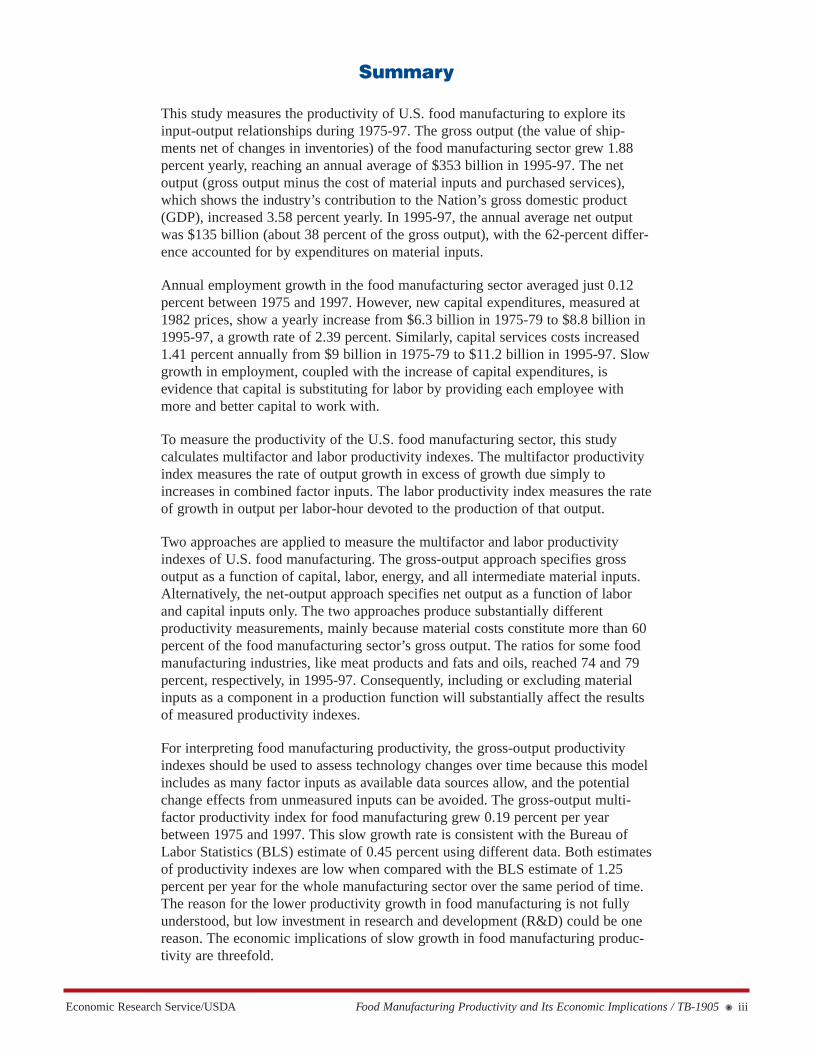
This study measures the productivity of U.S. food manufacturing to explore itsinput-output relationships during 1975-97. The gross output (the value of ship-ments net of changes in inventories) of the food manufacturing sector grew 1.88percent yearly, reaching an annual average of $353 billion in 1995-97. The netoutput (gross output minus the cost of material inputs and purchased services),which shows the industry’s contribution to the Nation’s gross domestic product(GDP), increased 3.58 percent yearly. In 1995-97, the annual average net outputwas $135 billion (about 38 percent of the gross output), with the 62-percent differ-ence accounted for by expenditures on material inputs.
Annual employment growth in the food manufacturing sector averaged just 0.12percent between 1975 and 1997. However, new capital expenditures, measured at1982 prices, show a yearly increase from $6.3 billion in 1975-79 to $8.8 billion in1995-97, a growth rate of 2.39 percent. Similarly, capital services costs increased1.41 percent annually from $9 billion in 1975-79 to $11.2 billion in 1995-97. Slowgrowth in employment, coupled with the increase of capital expenditures, isevidence that capital is substituting for labor by providing each employee withmore and better capital to work with.
To measure the productivity of the U.S. food manufacturing sector, this studycalculates multifactor and labor productivity indexes. The multifactor productivityindex measures the rate of output growth in excess of growth due simply toincreases in combined factor inputs. The labor productivity index measures the rateof growth in output per labor-hour devoted to the production of that output.
Two approaches are applied to measure the multifactor and labor productivityindexes of U.S. food manufacturing. The gross-output approach specifies grossoutput as a function of capital, labor, energy, and all intermediate material inputs.Alternatively, the net-output approach specifies net output as a function of laborand capital inputs only. The two approaches produce substantially differentproductivity measurements, mainly because material costs constitute more than 60percent of the food manufacturing sector’s gross output. The ratios for some foodmanufacturing industries, like meat products and fats and oils, reached 74 and 79percent, respectively, in 1995-97. Consequently, including or excluding materialinputs as a component in a production function will substantially affect the resultsof measured productivity indexes.
For interpreting food manufacturing productivity, the gross-output productivityindexes should be used to assess technology changes over time because this modelincludes as many factor inputs as available data sources allow, and the potentialchange effects from unmeasured inputs can be avoided. The gross-output multi-factor productivity index for food manufacturing grew 0.19 percent per yearbetween 1975 and 1997. This slow growth rate is consistent with the Bureau ofLabor Statistics (BLS) estimate of 0.45 percent using different data. Both estimatesof productivity indexes are low when compared with the BLS estimate of 1.25percent per year for the whole manufacturing sector over the same period of time.The reason for the lower productivity growth in food manufacturing is not fullyunderstood, but low investment in research and development (R&D) could be onereason. The economic implications of slow growth in food manufacturing produc-tivity are threefold.
Economic Research Service/USDA Food Manufacturing Productivity and Its Economic Implications / TB-1905 ✺ iii

First, instead of productivity growth, the expansion of combined factor inputsprovided significant impetus to food manufacturing output. U.S. food manufac-turing gross output grew 1.88 percent yearly during 1975-97. During this period,the combined capital, labor, energy, and material inputs grew at an average rate of1.69 percent yearly, with material inputs growing fastest at 2.25 percent. Foodmanufacturing is materials-intensive, and a 3.6-percent decline in real producerprices of crude food and feedstuffs fueled the expansion of input utilization.
Second, the productivity growth of food manufacturing contributed little to pricedeclines in recent years. The real producer price of processed foods declined anaverage 2.13 percent per year over the period 1975-97. Researchers have hypothe-sized that advances in food manufacturing productivity would explain the declinein real prices of processed foods. According to this study, however, it was adecrease in the prices of crude food and feedstuffs that drove down the prices ofprocessed foods paid by consumers.
Third, heightened merger and acquisition activity in recent years has had littleeffect on changes in food manufacturing productivity. According to MergerstatReview, which tracked purchases valued at $1 million or higher and transfers ofownership involving at least 10 percent of a company’s equity, the pace of mergerand acquisition activity in food processing increased steadily from 60 transactionsin 1991 to 157 in 1998. On the basis of slow growth in the multifactor productivityindex, it appears that recent heightened merger and acquisition activity has hadlittle effect on food manufacturing productivity.
In evaluating the contribution of food manufacturing to the growth of the Nation’sGDP, productivity indexes from the net-output approach should be used, becausenet output is defined the same as gross-product-originating (value-added) GDP.Both the net output and labor productivity indexes exhibit a steady increase,implying that the contribution of food manufacturing to the Nation’s GDP hasincreased over time. This study also evaluates the effects of a 10-percent increasein both capital and labor inputs and finds that food manufacturing’s net outputwould increase by $4.3 billion. In addition, a 10-percent increase in capital inputalone would increase the sector’s capital intensity, and consequently its laborproductivity, by $1.43 per worker-hour. A 10-percent increase in labor input alonewould reduce the sector’s capital intensity and reduce its labor productivity by$1.58 per worker-hour.
iv ✺ Food Manufacturing Productivity and Its Economic Implications / TB-1905 Economic Research Service/USDA

Introduction
Advances in industrial productivity—measured as therate of output growth in excess of growth due toincreases in factor inputs—are a significant source ofincrease in national income and improvements in thestandard of living and global competitiveness. Mostagricultural productivity studies in the United Stateshave focused on productivity changes and the relation-ship between inputs and outputs at the farm level.Considerably less attention has been devoted toresearch on productivity beyond the farmgate, such asfood manufacturing. Only a few studies (e.g., Ball andChambers; Heien; MacDonald and Ollinger) addressedthe productivity of U.S. food manufacturing industries.This study contributes to the gap in food manufactur-ing research with a focus on measuring the productivi-ty of U.S. food manufacturing.
U.S. food manufacturing plays an important role in theU.S. food system, stretching from farms and ranches toretail food markets, and has contributed significantly tothe Nation’s economic growth. According to theAnnual Survey of Manufactures, the U.S. food manu-facturing sector accounted for 10.3 percent of the valueof shipments and 9 percent of employment from allU.S. manufacturing sectors in 2000. This study meas-ures the productivity growth of the food manufacturingsector and provides information pertaining to the fol-lowing questions: What are the productivity trends offood manufacturing? What are the sources of growth infood manufacturing outputs? Does productivity explaina decline in real prices of processed foods in recentyears? How does food manufacturing contribute to theNation’s gross domestic product (GDP)?
In addition, the food manufacturing industries haveundergone substantial structural changes in recentyears because of mergers and acquisitions and a trendtoward substituting computers and automatedmachines for human operations. To better understandthe effects of this evolution on the performance of
food manufacturing industries, this study analyzesindustry production structure and answers the follow-ing questions: What are the input-output relationshipsof food manufacturing? Is there any evidence showingthat capital is substituting for labor? Have the recentmergers and acquisitions affected food manufacturingproductivity?
Although Bureau of Labor Statistics (BLS) productivi-ty indicators are available for all U.S. manufacturingsectors, this study uses different data and focuses onmeasuring productivity changes in food manufacturingspecifically for the following reasons. First, this studyprovides net-output (value-added) productivity meas-ures as a linkage to the gross-product-originating GDPto meet the gap caused by the elimination of produc-tivity indexes from BLS news releases of productivitytrends for all manufacturing sectors since 1994.Second, the food manufacturing industries are funda-mentally different from other manufacturing industriesin the sense that food processing is quite materials-intensive. Instead of using the BLS productivity indexalone, it is necessary to explore the detailed input-output relationships of food manufacturing. Third, it isuseful for this study to compile data and establish adata bank for food manufacturing suitable for onlineanalysis, estimation of productivity changes, and someother productivity-related issues.
This study begins by focusing on the input-output rela-tionships of U.S. food manufacturing with respect tothe growth of production and the utilization of labor,capital, and material inputs. Particular attention isgiven to identify some data sources for factor inputsand outputs that can be used for measuring productivi-ty. The second part of this study discusses the method-ology for measuring productivity and its application toU.S. food manufacturing. Since productivity growth ismost closely identified with technological gains, thegoal of the methodology is to measure these gains asthe rate of output growth in excess of growth due sim-ply to increases in combined factor inputs.
Economic Research Service/USDA Food Manufacturing Productivity and Its Economic Implications / TB-1905 ✺ 1
Food Manufacturing Productivityand Its Economic Implications
Kuo S. Huang

Before measuring productivity, it is necessary tounderstand the input-output relationships of U.S. foodmanufacturing with respect to the growth of produc-tion and the utilization of labor, capital, and materialinputs. For easy presentation of a sample period cover-ing 1975-97, each table throughout this study summa-rizes economic information by dividing the wholesample period into five subperiods with a 5-year inter-val for most periods and showing the average of annu-al data in each period. All values are measured at 1982constant prices.
The data used in this study were compiled mainlyfrom the Bureau of the Census in its Census ofManufactures and the Annual Survey of Manufactures(ASM), and from the Bureau of Labor Statistics forvarious producer price indexes including the price ofprocessed foods and feeds. The data refer to an aggre-gate food manufacturing sector by the StandardIndustrial Classification (SIC) System code 20 (Foodand Kindred Products) and its nine three-digit codedindustries for 1975-97. Those food industries are (201)meat products, (202) dairy products, (203) preservedfruits and vegetables, (204) grain mill products, (205)bakery products, (206) sugar and confectionery prod-ucts, (207) fats and oils, (208) beverages, and (209)miscellaneous food and kindred products.
The data in the 1997 Census of Manufactures werepublished for the first time on the basis of the NorthAmerican Industry Classification System (NAICS).This system is different from the SIC classificationsystem used in previous censuses. To construct consis-tent time-series data dating back to 1975, this studycompiles the 1997 data into a framework along withthe SIC classification system. A comparability of prod-uct codes and the compiling procedure used for con-verting NAICS data into SIC data are listed inAppendix A.
Gross and Net Outputs
According to the Census of Manufactures, two com-monly used output indicators are the value of ship-ments and the value added. The value of shipmentscovers the received or receivable net selling values ofall products shipped at the plants excluding freight andtaxes. The value added is derived by subtracting thecost of materials, supplies, containers, fuel, and elec-
tricity from the value of shipments, but it still containsthe cost of purchased services. Thus, the cost of pur-chased services must be subtracted from the valueadded to obtain a consistent measurement of the gross-product-originating (value-added) GDP without double-counting the value of sales.
For productivity analysis, gross output is calculated asthe adjusted value of shipments by the net change ofinventories and then deflated by the producer priceindex of processed foods and feeds. Similarly, net out-put is calculated as the “net value added” by subtract-ing the cost of purchased services from the valueadded and then deflated by the producer price index ofprocessed foods and feeds. Both gross output and netoutput are used as output indicators for measuring pro-ductivity. In particular, net output may be used as anindicator to show the contribution of an industry to theNation’s GDP.
The costs of purchased services for each food manu-facturing industry are available only in the 1992 and1997 Censuses but not in the ASM. To determine thecost of purchased services for other years, this studyfirst calculates the average ratios of the cost of pur-chased services to the value of shipments for eachfood industry in the two Censuses. Then, these ratiosare used to determine the approximate cost of pur-chased services in each industry for the missing years.The ratios in terms of percentage are food sector (1.35percent), meats (1.3), dairy (1.17), preserved fruits andvegetables (1.5), grain mill products (1.4), bakeryproducts (1.65), sugar and confections (1.62), fats andoils (1.08), beverages (1.3), and miscellaneous foods(1.3). These ratios are less than 2 percent of the valueof shipments across food industries, and the errors ofapproximation for measuring the net value addedshould be small.
In table 1, the yearly value of U.S. food manufacturinggross output measured at 1982 prices increased from$258 billion in 1975-79 to $353 billion in 1995-97, anaverage annual growth rate of 1.9 percent. Most foodindustries tended to grow at 2-3 percent except for fatsand oils, which showed virtually no growth. In 1995-97, the meat product industry was dominant in grossoutput valued at $79.8 billion, followed by beveragesat $51.5 billion. For net output, food manufacturing asa whole increased from a yearly average of $72 billion
2 ✺ Food Manufacturing Productivity and Its Economic Implications / TB-1905 Economic Research Service/USDA
Production and Factor Inputs

in 1975-79 to $135 billion in 1995-97, with an averageannual growth rate of 3.7 percent. For most individualindustries, average yearly growth rates ranged fromabout 3-4 percent. The beverages industry was domi-nant at $25.4 billion in 1995-97, followed by the meatproducts industry at $19 billion.
Table 1 shows that the ratio of net output to gross out-put increased from 27.7 percent in 1975-79 to 38.3percent in 1995-97 for the food sector as a whole. Thisincrease reflects a decrease in the share of materialcosts relative to the value of output over time. Forindividual industries, the meat industry significantly
increased this ratio from 14.6 percent in 1975-79 to23.9 percent in 1995-97, probably because of cheapermeat materials available for processing, especially forsausage and poultry meat products. On the other hand,highly processed, differentiated, and convenient con-sumer goods are high value-added products. Thus, theratio increased from 55 percent in 1975-79 to 61.6 per-cent in 1995-97 for the bakery products industry.
Figure 1 shows the different ratios of net output togross output across the food manufacturing industriesand the whole food sector in 1995-97. In general, thefood manufacturing sector is materials-intensive with a
Economic Research Service/USDA Food Manufacturing Productivity and Its Economic Implications / TB-1905 ✺ 3
Table 1—Outputs of food manufacturing, 1975-1997
1975-79 1980-84 1985-89 1990-94 1995-97 Averageannual growth
Gross output (million $ at 1982 prices) Percent
Food sector 258,325 278,389 302,510 330,374 352,926 1.88Meat products 65,326 66,045 69,177 76,712 79,799 1.45Dairy products 34,126 37,919 40,780 42,650 43,904 1.52Preserved fruits & vegetables 26,703 29,824 34,246 38,495 39,402 2.31Grain mill products 29,389 31,876 34,718 40,662 44,927 2.13Bakery products 16,510 17,532 21,021 23,175 25,241 2.11Sugar and confections 14,688 16,358 17,110 18,409 19,847 1.23Fats and oils 19,061 17,849 16,356 15,910 17,992 0.49Beverages 31,185 37,724 43,139 46,242 51,500 2.77Miscellaneous foods 21,317 23,263 25,962 28,119 30,313 2.77
Net output (million $ at 1982 prices)
Food sector 71,653 83,420 105,245 122,668 135,166 3.58Meat products 9,553 9,891 12,243 14,995 19,045 3.86Dairy products 7,043 7,973 10,098 11,634 11,838 2.99Preserved fruits & vegetables 9,817 11,611 15,316 17,979 18,503 3.88Grain mill products 8,264 10,012 13,502 16,865 17,473 3.78Bakery products 9,090 10,111 12,878 14,094 15,556 2.98Sugar and confections 5,056 6,122 7,321 8,327 9,174 3.41Fats and oils 2,635 2,698 2,860 3,155 3,267 1.90Beverages 12,621 15,729 19,617 22,463 25,432 3.83Miscellaneous foods 7,574 9,273 11,411 13,154 14,878 3.98
Ratio of net output to gross output (percent)
Food sector 27.74 29.97 34.79 37.13 38.30Meat products 14.62 14.98 17.70 19.55 23.87Dairy products 20.64 21.03 24.76 27.28 26.96Preserved fruits & vegetables 36.76 38.93 44.72 46.70 46.96Grain mill products 28.12 31.41 38.89 41.48 38.89Bakery products 55.06 57.67 61.26 60.82 61.63Sugar and confections 34.42 37.42 42.79 45.24 46.22Fats and oils 13.83 15.12 17.48 19.83 18.16Beverages 40.47 41.70 45.47 48.58 49.38Miscellaneous foods 35.53 39.86 43.95 46.78 49.08
Note: All values are deflated by the producer price index of processed foods and feeds.
Source: USDA/Economic Research Service.

ratio of 38.3 percent, meaning a cost of about $62 onmaterials consumed for producing $100 of gross out-put. The ratio for fats and oils was relatively small,only 18 percent. Other low-ratio industries are meats(23.9 percent) and dairy products (27 percent). This isbecause farm commodities as food materials for pro-cessing constitute a major share of processing costs forthese products. On the other hand, bakery products arerelatively value-intensive products with a ratio of 61.6percent, because the bakery industry has high laborcosts for processing and direct store delivery.Beverages are also value-intensive, with a ratio of 49.4percent due to low material costs, high advertisingexpenditures, and the value added to shipments byhigh-profit soft-drink syrup makers.
Labor Input
The employment data in the census consist of two cat-egories of workers: production and nonproduction.Production workers, including those engaged in fabri-cating, processing, assembling, packing, and otherservices, are closely associated with the productionoperations at food manufacturing plants. All otheremployees, such as those engaged in factory supervi-sion above the working foreman level and those insales, credit, and clerical positions at manufacturingplants, are classified as nonproduction workers.
The U.S. food manufacturing sector employed a yearlyaverage of 1.5 million employees in 1975-79, graduallydecreasing to 1.4 million in 1985-89, and then increas-ing back to 1.5 million employees in 1995-97 (table 2).These total employment numbers are important indica-tors commonly used to observe whether there is a
recession in general economic activities. Meat productsand miscellaneous foods were the only industries thatincreased employment over the sample period, withaverage yearly growth rates of 1.9 and 1.4 percent,respectively. The number of employees in other indus-tries showed yearly decreases, especially in fats andoils (-1.8 percent) and beverages (-1.4 percent). Figure2 shows the distribution of employees across differentfood manufacturing industries using the 1995-97 aver-age. Significant shares are found in the meat products(29 percent), bakery products (14 percent), and pre-served fruits and vegetables (13 percent) industries.
For measuring productivity, production worker-hours(hours worked or paid for at the plant, including actualovertime hours) are used as an indicator of labor input
4 ✺ Food Manufacturing Productivity and Its Economic Implications / TB-1905 Economic Research Service/USDA
Figure 1
Ratio of net output to gross output, 1995-97 average
Percent
Food sector Meatproducts
Dairyproducts
Preservedfruits &
vegetables
Grain millproducts
Bakeryproducts
Sugarand
confections
Fats andoils
Beverages Miscellaneousfoods
0
10
20
30
40
50
60
70
Source: USDA/Economic Research Service.
Figure 2
Composition of employment, 1995-97 average
Meat products29%
Dairy products9%
Preserved fruits & vegetables--13%
Grain mill products--7%
Bakery products--14%
Sugar and confections--6%
Fats and oils--2%
Beverages--9%
Miscellaneous foods--11%
Source: USDA/Economic Research Service.

for production workers. As shown in table 2, the meatproducts industry increased production worker-hourssubstantially from 506 million hours in 1975-79 to 774million hours in 1995-97, an average yearly growth rateof 2.3 percent. Similarly, there is a significant increaseof worker-hours in the miscellaneous foods industryfrom 198 million hours to 248 million hours over thesample period with a yearly growth rate of 1.9 percent.The fats and oils and beverages industries decreased by2 and 1 percent, respectively. All other food industriesshowed no significant change in worker-hours.
The number of nonproduction employees, constitutingabout one-third of total employees, is used to representthe labor input for nonproduction workers. Similar toproduction workers, the number of nonproductionemployees for most industries decreased, especiallyfor the dairy industry, with a 2-percent average annualrate of decrease over the sample period. In 1995-97,the bakery products and beverage industries employedthe most nonproduction workers, 85,000 and 70,000persons, respectively.
Economic Research Service/USDA Food Manufacturing Productivity and Its Economic Implications / TB-1905 ✺ 5
Table 2—Labor inputs of food manufacturing, 1975-1997
1975-79 1980-84 1985-89 1990-94 1995-97 Averageannual growth
All employees number (1,000) Percent
Food sector 1,536 1,484 1,441 1,496 1,533 0.12Meat products 312 314 336 401 441 1.89Dairy products 159 143 140 136 132 -1.10Preserved fruits & vegetables 233 223 214 215 207 -0.34Grain mill products 114 108 101 105 103 -0.43Bakery products 232 217 212 214 222 -0.15Sugar and confections 103 96 90 91 89 -0.56Fats and oils 42 39 31 28 26 -1.83Beverages 201 193 165 144 145 -1.37Miscellaneous foods 141 151 152 162 168 1.36
Number of nonproduction employees (1,000)
Food sector 458 438 419 404 405 -0.59Meat products 56 52 54 58 64 0.92Dairy products 72 60 54 51 48 -2.23Preserved fruits & vegetables 35 37 37 36 35 0.46Grain mill products 34 33 32 33 31 -0.45Bakery products 94 90 89 83 85 -0.18Sugar and confections 21 19 18 19 20 -0.15Fats and oils 12 11 10 9 8 -1.16Beverages 99 98 85 71 70 -1.59Miscellaneous foods 35 38 40 44 43 0.60
Production worker-hours (million)
Food sector 2,125 2,054 2,007 2,223 2,317 0.57Meat products 506 515 564 708 774 2.28Dairy products 180 170 174 179 179 -0.06Preserved fruits & vegetables 374 354 334 351 347 -0.29Grain mill products 169 155 145 157 159 -0.37Bakery products 269 251 241 262 272 -0.05Sugar and confections 160 151 141 145 145 -0.25Fats and oils 65 58 43 41 40 -2.02Beverages 203 190 160 148 152 -0.96Miscellaneous foods 198 210 206 232 248 1.86Source: USDA/Economic Research Service.

Capital Input
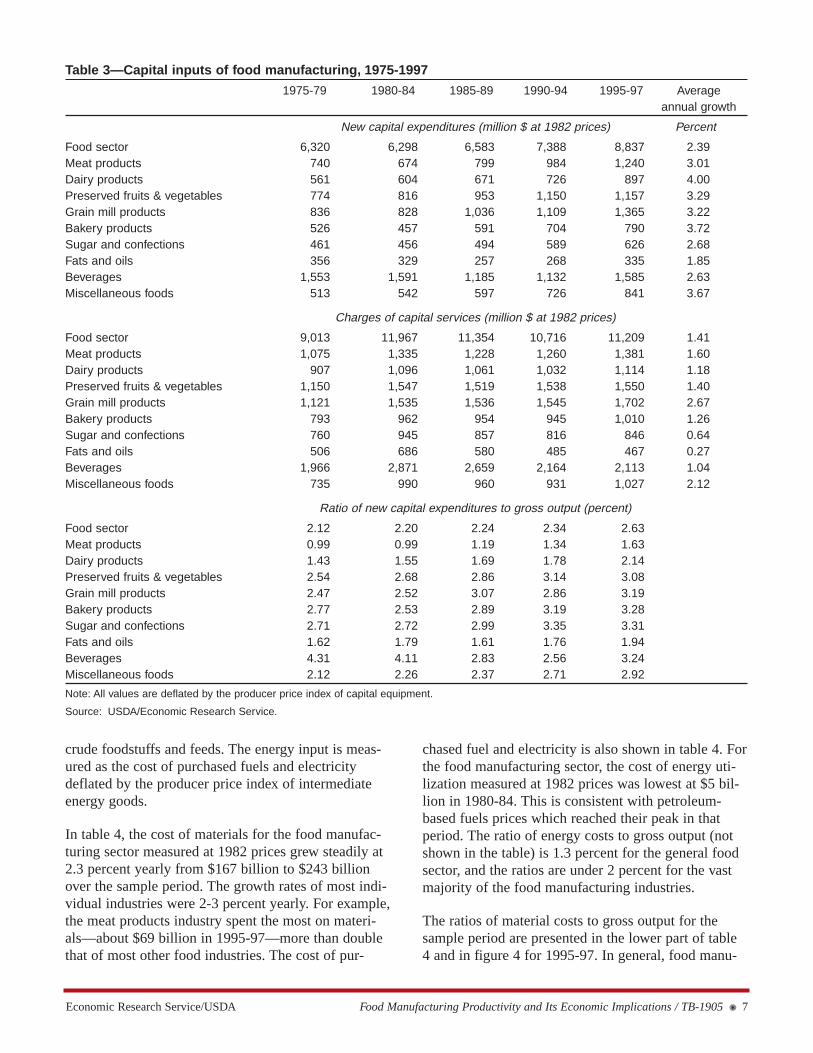
In measuring the gross book value of depreciableassets, the assets at the beginning of the year, plus newcapital expenditures, less capital retirements, equalsassets at the end of the year. Therefore, annual newcapital expenditures are a major component in theaccumulation of assets over time. In table 3, the newcapital expenditures in the food manufacturing sectormeasured at 1982 prices show an average annualgrowth rate of 2.4 percent from $6.3 billion in 1975-79to $8.8 billion in 1995-97. For individual industries,new capital expenditures also increased over the sam-ple period. The growth rates are high for dairy prod-ucts, bakery products, and miscellaneous foods, eachbetween 3.7-4 percent. Meat products, preserved fruitsand vegetables, and grain mill products are next, eachabout 3 percent. The meat products, preserved fruitsand vegetables, grain mill products, and beveragesindustries had annual capital expenditures of morethan $1 billion in 1995-97.
The flow of capital services derived from the stock ofcapital assets for equipment and structures in an indus-try is commonly considered as capital input in measur-ing productivity. In this study, considering the limita-tion of data, the annual cost of capital services isapproximated as the sum of depreciation charges forfixed assets and interest costs on the average value offixed assets at the beginning and ending of that year.The cost of capital services is then deflated by the pro-ducer price index of capital equipment for use as capi-tal input in measuring productivity.
To measure depreciation charges, data are availableand reported only for 1977-85. Depreciation chargesfor the remaining period are projected on the basis of alog-linear regression by fitting the depreciationcharges (D) as a function of beginning-of-year struc-ture and equipment assets (K) for 1977-85. A completelisting of fitted depreciation equations for all individ-ual food manufacturing industries is listed in AppendixB. For example, the following is a fitted depreciationequation for the food manufacturing sector:
ln D = -3.3203 + 1.0630 ln K R2 = 0.99(0.0292)
The figure in parenthesis is the standard error. Theestimated coefficient is statistically significant with a1-percent increase in fixed assets causing a 1.06-per-cent increase in the depreciation charge.
The cost of interest on fixed assets is calculated bymultiplying the average yearly value of fixed assets bythe interest rates. These interest rates are obtainedfrom the Survey of Current Business (SCB) with theMoody’s Corporate Industrial Bond Rate from SCBprior to 1994. Yields on new high-grade corporatebonds are used for 1994 and thereafter, becauseMoody’s rates are not available in the latter period.
In table 3, the charges of capital services in the foodmanufacturing sector increased by 1.41 percent annu-ally from $9 billion in 1975-79 to $11.2 billion in1995-97. In contrast with a declining employmenttrend, the increase of capital services is evidence thatcapital is substituting for labor by providing eachemployee with more and better capital to work with.The charges of capital services varied across the foodmanufacturing industries depending on their capitalintensity in the production process. Taking 1995-97 asan example, the cost of capital services is highest forthe beverage industry, at $2.1 billion, followed bygrain mill products at $1.7 billion, and preserved fruitsand vegetables at $1.6 billion. In terms of annualgrowth rate, the grain mill products industry wasranked highest at 2.7 percent, followed by miscella-neous foods at 2.1 percent.
Finally, the ratio of the new capital expenditures to thegross output of an industry can be viewed as an indica-tor to reflect the rate of investment of the industry.This average annual rate of investment for the foodmanufacturing sector was 2.6 percent in 1995-97. Forindividual industries, figure 3 shows that the annualrates of investment in 1995-97 were high (at 3 percentor more) for the sugar and confections, bakery prod-ucts, grain mill products, preserved fruits and vegeta-bles, and beverages industries. The high investmentrate is probably related to new product introductionand rapid technological changes in these industriesthat require new equipment.
Material and Energy Inputs
In addition to payments for labor input and capitalservices, the cost of production in food manufacturingincludes materials and purchased fuel and electricity.In this study, materials (including raw materials, semi-finished goods, and containers) and fuel and electricityare considered as separate inputs in measuring produc-tivity. The quantity of material inputs is determined asthe cost of materials adjusted by a net change in inven-tories and then deflated by the producer price index of
6 ✺ Food Manufacturing Productivity and Its Economic Implications / TB-1905 Economic Research Service/USDA
crude foodstuffs and feeds. The energy input is meas-ured as the cost of purchased fuels and electricitydeflated by the producer price index of intermediateenergy goods.
In table 4, the cost of materials for the food manufac-turing sector measured at 1982 prices grew steadily at2.3 percent yearly from $167 billion to $243 billionover the sample period. The growth rates of most indi-vidual industries were 2-3 percent yearly. For example,the meat products industry spent the most on materi-als—about $69 billion in 1995-97—more than doublethat of most other food industries. The cost of pur-
chased fuel and electricity is also shown in table 4. Forthe food manufacturing sector, the cost of energy uti-lization measured at 1982 prices was lowest at $5 bil-lion in 1980-84. This is consistent with petroleum-based fuels prices which reached their peak in thatperiod. The ratio of energy costs to gross output (notshown in the table) is 1.3 percent for the general foodsector, and the ratios are under 2 percent for the vastmajority of the food manufacturing industries.
The ratios of material costs to gross output for thesample period are presented in the lower part of table4 and in figure 4 for 1995-97. In general, food manu-
Economic Research Service/USDA Food Manufacturing Productivity and Its Economic Implications / TB-1905 ✺ 7
Table 3—Capital inputs of food manufacturing, 1975-1997
1975-79 1980-84 1985-89 1990-94 1995-97 Averageannual growth
New capital expenditures (million $ at 1982 prices) Percent
Food sector 6,320 6,298 6,583 7,388 8,837 2.39Meat products 740 674 799 984 1,240 3.01Dairy products 561 604 671 726 897 4.00Preserved fruits & vegetables 774 816 953 1,150 1,157 3.29Grain mill products 836 828 1,036 1,109 1,365 3.22Bakery products 526 457 591 704 790 3.72Sugar and confections 461 456 494 589 626 2.68Fats and oils 356 329 257 268 335 1.85Beverages 1,553 1,591 1,185 1,132 1,585 2.63Miscellaneous foods 513 542 597 726 841 3.67
Charges of capital services (million $ at 1982 prices)
Food sector 9,013 11,967 11,354 10,716 11,209 1.41Meat products 1,075 1,335 1,228 1,260 1,381 1.60Dairy products 907 1,096 1,061 1,032 1,114 1.18Preserved fruits & vegetables 1,150 1,547 1,519 1,538 1,550 1.40Grain mill products 1,121 1,535 1,536 1,545 1,702 2.67Bakery products 793 962 954 945 1,010 1.26Sugar and confections 760 945 857 816 846 0.64Fats and oils 506 686 580 485 467 0.27Beverages 1,966 2,871 2,659 2,164 2,113 1.04Miscellaneous foods 735 990 960 931 1,027 2.12
Ratio of new capital expenditures to gross output (percent)
Food sector 2.12 2.20 2.24 2.34 2.63Meat products 0.99 0.99 1.19 1.34 1.63Dairy products 1.43 1.55 1.69 1.78 2.14Preserved fruits & vegetables 2.54 2.68 2.86 3.14 3.08Grain mill products 2.47 2.52 3.07 2.86 3.19Bakery products 2.77 2.53 2.89 3.19 3.28Sugar and confections 2.71 2.72 2.99 3.35 3.31Fats and oils 1.62 1.79 1.61 1.76 1.94Beverages 4.31 4.11 2.83 2.56 3.24Miscellaneous foods 2.12 2.26 2.37 2.71 2.92
Note: All values are deflated by the producer price index of capital equipment.
Source: USDA/Economic Research Service.

facturing is materials-intensive, with material costsconstituting about 60 percent or more of the value ofgross output in the food manufacturing sector. Theratios of material costs to gross output vary widelyamong the food manufacturing industries. Taking1995-97, for example, the ratio is highest for the fatsand oils industry, at 79 percent, reflecting the indus-try’s heavy dependence on materials like soybeans forcrushing or semi-refined soybean oil for refining. Also,
the ratio is high for the meat and dairy industries—slightly more than 70 percent—because these indus-tries have little value added using relatively expensivemeats and milk as raw materials for processing highlystandardized products. On the other hand, the ratio forthe bakery industry is the lowest (35.4 percent)because the industry uses more production workersand adds more value to flour and other ingredientsfrom other processors.
8 ✺ Food Manufacturing Productivity and Its Economic Implications / TB-1905 Economic Research Service/USDA
Figure 3
Ratio of new capital expenditures to gross output, 1995-97 average
Percent
Food sector Meatproducts
Dairyproducts
Preservedfruits &
vegetables
Grain millproducts
Bakeryproducts
Sugarand
confections
Fats andoils
Beverages Miscellaneousfoods
0
0.5
1.0
1.5
2.0
2.5
3.0
3.5
Source: USDA/Economic Research Service.
Figure 4
Ratio of material cost to gross output, 1995-97 average
Percent
Food sector Meatproducts
Dairyproducts
Preservedfruits &
vegetables
Grain millproducts
Bakeryproducts
Sugarand
confections
Fats andoils
Beverages Miscellaneousfoods
0
20
40
60
80
100
Source: USDA/Economic Research Service.

Economic Research Service/USDA Food Manufacturing Productivity and Its Economic Implications / TB-1905 ✺ 9
Table 4—Material and energy inputs of food manufacturing, 1975-97
1975-79 1980-84 1985-89 1990-94 1995-97 Averageannual growth
Cost of materials (million $ at 1982 prices) Percent
Food sector 167,032 182,239 206,508 228,299 243,087 2.25Meat products 50,415 53,307 60,576 68,764 68,841 2.06Dairy products 24,407 28,299 32,515 34,366 36,114 2.29Preserved fruits & vegetables 14,976 16,762 19,522 22,170 22,927 2.53Grain mill products 18,848 20,219 21,815 25,847 30,247 2.57Bakery products 6,433 6,692 8,208 9,625 10,406 2.22Sugar and confections 8,355 9,373 10,075 10,916 11,692 1.54Fats and oils 14,783 13,991 14,037 14,110 16,572 1.55Beverages 16,570 20,521 24,545 26,147 29,043 3.23Miscellaneous foods 12,377 13,075 15,216 16,354 17,245 3.52
Cost of fuels and electricity energy (million $ at 1982 prices)
Food sector 5,297 5,015 6,372 6,237 6,649 0.20Meat products 674 688 944 937 1,015 0.41Dairy products 614 573 762 704 709 0.10Preserved fruits & vegetables 740 715 879 894 929 0.24Grain mill products 779 732 1,082 1,116 1,291 0.45Bakery products 343 319 467 470 495 0.37Sugar and confections 583 466 478 466 479 -0.12Fats and oils 572 538 563 482 516 0.14Beverages 618 598 717 638 684 0.23Miscellaneous foods 375 386 482 529 533 0.44
Ratio of material cost to gross output (percent)
Food sector 70.0 67.2 62.5 60.5 59.2Meat products 83.5 82.8 80.1 78.4 74.1Dairy products 77.3 76.5 73.0 70.5 70.7Preserved fruits & vegetables 60.7 57.7 52.2 50.4 50.0Grain mill products 69.4 65.1 57.6 55.6 57.9Bakery products 42.1 39.2 35.8 36.3 35.4Sugar and confections 61.4 58.9 53.9 51.9 50.6Fats and oils 84.0 80.5 78.6 77.6 79.1Beverages 57.5 55.8 52.0 49.5 48.4Miscellaneous foods 62.6 57.7 53.6 50.9 48.8
Note: The value of materials is deflated by the producer price index of crude foodstuffs and feedstuffs.The value of fuels and electricity is deflated by the producer price index of intermediate energy goods.
Source: USDA/Economic Research Service.

In productivity studies, the rates of technologicalchange, which reflect changes in an industrial outputfor a given input bundle, may be measured by using aproduction function similar to that developed bySolow. Alternatively, rates of technological changewhich reflect changes in the cost of obtaining a givenoutput may be measured by using a cost function suchas that used in Ball and Chambers. This study appliesa production function approach because it providesuseful information for a direct explanation about thesource of output growth.
The data used in this study are mainly compiled fromthe Bureau of the Census’s Annual Survey ofManufactures and Census of Manufacturing. Twocommon production indicators, the value of shipmentsand the value added, are available in the data sources.This study uses both indicators as the output of a pro-duction function for measuring productivity indexes.The potential difference in productivity measurementsfrom these production indicators is an issue addressedin this study. Following is a brief explanation of themethodology used to measure the multifactor andlabor productivity indexes, and a method to modify themodel for application to U.S. food manufacturing.
Derivation of Productivity Measures
In productivity studies, multifactor productivity isderived by taking account of various inputs into theproductivity measurement. To measure the multifactorproductivity index, the underlying production functionis assumed to be Hicks’ neutral technical change. Thegeneral form of the production function with n-factorinputs at time t can be written as:
Qt = At f(X1t, X2t, . . , Xnt), (1)
where variables are Qt (real output), Xit (input of theith factor, i = 1, 2,..,n), and At (index of Hicks’ neutraltechnical change or multifactor productivity).Although the assumption of neutral technical changemay be rigid, this production function provides aframework for easy interpretation of the causes of pro-ductivity changes.
Differentiating equation (1) with respect to time t, thederived output growth equation becomes
(dQt/dt) / Qt = (dAt/dt) / At + Σi (∂Qt/∂Xit) (Xit /Qt) (dXit/dt) / Xit (2)
Equation (2) shows the rate of change in output as thesum of the rate of change in multifactor productivity,(dAt/dt) / At , and a weighted average of the rates ofchange in various inputs (dXit/dt) / Xit. The weight isexpressed by (∂Qt/∂Xit) (Xit /Qt), which is the elastici-ty of output with respect to the ith input, showing thepercentage change in output per 1-percent change inthe ith input.
In addition, under the assumption that a competitiveeconomy is operating at longrun equilibrium, the mar-ginal products of all inputs are equal to their respectivereal market prices as ∂Qt / ∂Xit = Wit / Pt, with newvariables Wit (price of the ith input) and Pt (price ofoutput). Substituting this expression for the elasticityof output in equation (2), and then using Sit (cost shareof the ith input) to represent Wit Xit / Pt Qt, the multi-factor productivity index can be shown as:
(dAt/dt ) / At = (dQt/dt) / Qt - Σi [Sit (dXit /dt) / Xit ] (3)
The competition in output markets indicates that thecapital price reflects a competitive rate of return ensur-ing that all revenues are spent on inputs. In otherwords, the summation of all input cost shares equals 1(Σi Sit = 1). Thus, the multifactor productivity index,showing the ability to produce more output from thesame input, is calculated by subtracting an index seriesfor the combined changes of various inputs from theindex series for output changes. Different inputs areaggregated into one input measure by weighting (mul-tiplying) the index series of each input by its share inthe total cost of output.
Furthermore, the productivity index of the jth inputcan be shown as:
(dQt/dt) / Qt - (dXjt/dt) / Xjt = (dAt/dt) / At + Σi, i≠j Sit [(dXit/dt) / Xit - (dXjt/dt) / Xjt ] (4)
In particular, if the jth input is regarded as labor, thenthis equation represents labor productivity.Accordingly, labor productivity, showing the rate ofchange in output per worker on the left-hand side ofequation, is determined by two components: techno-
10 ✺ Food Manufacturing Productivity and Its Economic Implications / TB-1905 Economic Research Service/USDA
Methodology of Measuring Productivity

logical progress and the quantities of capital goods andother inputs available to each worker.
The Törnqvist Index Approximation
The rates of change in equations (3) and (4) areexpressed in the Divisia index such as (dQt/dt) / Qt forthe change of output and require using continuous datafor the presentation. For empirical application, howev-er, the Törnqvist index is commonly used as a discreteapproximation of the Divisia index. More specifically,for example, the rate of change of output (dQt/dt) / Qt= (dlnQt/dt) can be approximated by ln(Qt/Qt-1).Similarly, the rate of change of the ith input (dXit/dt) /Xit = (dlnXit/dt) can be approximated by ln(Xit/Xit-1).In addition, since the variables are expressed in con-secutive change of observed data, an ideal weight Sitin the brackets of equations (3) and (4) should be theaverage shares of Sit and Sit-1; that is, 1/2(Sit + Sit-1).
Therefore, by applying the Törnqvist index as a dis-crete approximation of the Divisia index, the multifac-tor productivity in equation (3) can be expressed as:
ln(At/At-1) = ln(Qt/Qt-1) - Σi [1/2(Sit + Sit-1) ln(Xit/Xit-1)] (5)
This expression shows that the rate of change of multi-factor productivity ln(At/At-1) is the differencebetween the rate of change in output ln(Qt/Qt-1) and aweighted average of the rates of change of all factorinputs in the bracket. This methodology was used bythe Bureau of Labor Statistics, and a discussion of themodel for two factors (labor and capital) in a produc-tion function was documented in Mark and Waldorf.
Similarly, the Törnqvist index approximation of theproductivity index of the jth input in equation (4)becomes:
ln(Qt/Qt-1) - ln(Xjt/Xjt-1) =ln(At/At-1) + Σi, i≠j 1/2(Sit + Sit-1) [ln(Xit/Xit-1) - ln(Xjt/Xjt-1)] (6)
Again, if the jth input is regarded as labor, then thisequation represents labor productivity. The aboveexpression in natural logarithmic form shows that therate of change of labor productivity is equal to the sumof the rate of change of multifactor productivity andthe contribution of the changes in all other inputs perunit of labor to output.
While the above procedures for measuring productivi-ty can be easily implemented, one might question thatthe underlying assumption of perfect competition maynot be appropriate to the food manufacturing sector,which may be characterized by oligopoly. Ideally, weneed to perform some tests on the potential oligopolystructure of the food manufacturing sector, but thesetests are beyond the scope of this study. A noted paperby Azzam et al. incorporated information aboutmarkups, demand, and cost parameters into the meas-urement of productivity. This set of extraneous infor-mation, however, is obtained from different sources,and may introduce errors in the productivity measure-ment because the extraneous information is notobtained within the same framework as the measure-ment of productivity changes.
Empirical Modeling
In applying the methodology of measuring productivi-ty for the U.S. food manufacturing industries, twocommonly used output indicators (the value of ship-ments and the value added) are available in the Censusof Manufactures and Annual Survey of Manufactures.By using these output indicators, this study appliestwo approaches to specify a production function formeasuring the multifactor and labor productivityindexes.
One is the gross-output approach, such that the adjust-ed value of shipments is a function of capital, labor,energy, and material inputs as follows:
Qt = At f(Kt, Lat, Lbt, Et, Mt), (7)
where Qt is the gross output defined as the value ofshipments adjusted by the net change in inventoriesmeasured at 1982 prices, with the producer price indexof processed foods and feeds as a deflator. Kt repre-sents capital services charges measured at 1982 prices,with the producer price index of capital equipment as adeflator. Capital services charges are approximated asthe sum of depreciation charges for fixed assets andinterest costs on the average value of fixed assets atthe beginning and ending of that year. The labor inputsare divided into two components: production and non-production workers. Lat represents production worker-hours, and Lbt is the number of nonproductionemployees. Et represents purchased fuels and electrici-ty at 1982 prices, with the producer price index forintermediate energy goods as a deflator. Mt is the cost
Economic Research Service/USDA Food Manufacturing Productivity and Its Economic Implications / TB-1905 ✺ 11

of materials at 1982 prices, with the producer priceindex of crude foodstuffs and feedstuffs as a deflator.At is the index of multifactor productivity for the valueof shipments. This gross-output production functionrepresents a production structure that includes the con-tribution of all factor inputs that are available in thedata sources.
The net-output approach uses net output or the netvalue added as an output in a production function. Netoutput is calculated by subtracting the cost of materi-als, supplies, containers, fuel, electricity, and pur-chased services from the value of shipments and thendeflating by the producer price index of processedfoods and feeds. The net output represents the valuethat is added, by the application of capital and labor, tointermediate inputs in converting those inputs to fin-ished products. Therefore, capital and labor are the rel-evant inputs in generating the net output of an indus-try, and a production function for the net output isspecified as follows:
Qt* = At* f(Kt, Lat, Lbt ), (8)
where Qt* is the quantity of net output or net valueadded, and Kt, Lat, and Lbt are defined the same as inequation 7. At* is the index of multifactor productivityfor the net value added.
The existence of this net-output production function, asdiscussed in Gullickson, requires that the production ofgross output (as shown in equation 7) be characterizedby value-added separability, in which intermediateinputs cannot be the source of productivity growth. Inother words, intermediate inputs are excluded from con-sideration in the net-output model on the assumptionthat they are insignificant to the analysis of productivitygrowth. With this restrictive assumption, the purpose ofmeasuring net-output productivity from equation 8 is tocalculate an industry’s contribution to the Nation’s GDPin a simple and straightforward way. For interpretingindustry productivity, however, the gross-output modelspecification is generally preferred.
12 ✺ Food Manufacturing Productivity and Its Economic Implications / TB-1905 Economic Research Service/USDA

Both the gross-output and net-output approaches areapplied to measure the multifactor and labor produc-tivity indexes of the food manufacturing sector and itsassociated nine industries. The gross-output approachrelates the adjusted value of shipments as a function ofcapital, labor, energy, and all intermediate materials asshown in equation 7, while the net-output approachrelates the net value added as a function of labor andcapital as shown in equation 8. The detailed empiricalresults of yearly productivity indexes and relatedmeasures obtained from both approaches are reportedin Appendix C. This section focuses mainly on theproductivity results compiled in tables 5-10, in whichaverage figures for each of 5 subperiods (four 5-yearperiods and one final 3-year period) are presented.
Gross-Output Productivity Measures
Table 5 presents the gross-output productivity resultsof the food manufacturing sector. As indicated in thetable, the annual rate of change in multifactor produc-tivity (4) is obtained by subtracting the combinedinputs (2) from the gross output (1). The annual rate ofchange in labor productivity (5) is a summation of thecapital and other input intensity per unit of labor (3)and multifactor productivity (4).
In table 5, the gross-output multifactor productivityindex for food manufacturing grew 0.19 percent a yearbetween 1975 and 1997. The productivity growth offood manufacturing shows a gain of 1.7 percent in1975-79, then a loss of 1.38 percent in 1980-84,rebounding to 1.08 percent in 1985-89, before decreas-ing to a negative rate of -0.63 percent in 1995-97. Theslow growth rate found in this study is consistent withthe Bureau of Labor Statistics (BLS) estimate of 0.45percent using different data. As shown in figure 5a,both the study’s and BLS’ productivity indexes show atrend of slow growth, moving up and down within 10percent along a level slightly above the base year 1975.
Both the study’s and BLS’ estimates of productivityindexes are low when compared with the BLS estimateof 1.25 percent a year for the whole manufacturingsector over the same period of time. The reason for thelower productivity growth in food manufacturing is notfully understood, but low investment in research anddevelopment (R&D) could be one reason. This studyfound that real private sector R&D expenditures forfood manufacturing in the period 1975-97 grew 2.22percent a year on average (table 6). These R&Dexpenditures represent only 0.23 percent of sales. Overthe same period, the R&D expenditures for food man-ufacturing even grew slower than similar expenditures
Economic Research Service/USDA Food Manufacturing Productivity and Its Economic Implications / TB-1905 ✺ 13
Empirical Productivity Measures
Table 5—Gross-output productivity and price of the food manufacturing sector, 1975-97
1975-79 1980-84 1985-89 1990-94 1995-97 Averageannual growth
Calculated annual change rate (percent)
Gross output (1) 2.96 1.27 1.68 2.04 1.51 1.88Inputs:
Combined inputs (2) 1.26 2.65 0.60 1.88 2.14 1.69Nonlabor/labor intensity (3) 0.00 4.58 -0.41 -0.13 1.62 1.14
Productivity:Multifactor productivity (4)=(1)-(2) 1.70 -1.38 1.08 0.16 -0.63 0.19Labor productivity (5)=(3)+(4) 1.70 3.21 0.67 0.03 0.99 1.33
BLS multifactor productivity:Food and kindred products 1.12 1.43 -0.18 -0.35 0.29 0.45Whole manufacturing 1.20 1.22 1.26 0.87 1.98 1.25
Real processed food price -2.45 -3.58 -1.28 -2.27 -0.46 -2.13
Notes: Gross output = real adjusted value of shipments; Combined inputs = weighted average of all inputs;Nonlabor/labor input = nonlabor intensity or combined nonlabor inputs per worker-hour;Real processed food price is deflated by the consumer price index.BLS Multifactor productivity is compiled from the BLS website (http://stats.bls.gov/mfp/mprdload.html).
Source: USDA/Economic Research Service.

for agricultural input industries such as agriculturalchemicals and plant breeding. Also, the NationalScience Foundation estimated that the real privateR&D expenditures of all industries grew at muchfaster rates of 5.78 percent yearly in the same period.
Although productivity has been relatively low, foodmanufacturing output has grown significantly over thelast two decades. According to this study, it was theexpansion of combined factor inputs that provided themajor impetus to the sector’s output. Gross outputmeasured at 1982 prices grew 1.88 percent a year dur-ing 1975-97. During this period the combined capital,labor, energy, and material inputs grew at an averageannual rate of 1.69 percent. Material inputs grew thefastest at 2.25 percent a year. Food manufacturing is
materials-intensive with material costs constitutingabout 60 percent or more of the value of gross output.A 3.06-percent annual decline in real producer pricesof crude food and feedstuffs in the period 1975-97fueled the expansion of input utilization.
This expansion of food manufacturing output benefitedU.S. and global consumers. The real producer price ofprocessed foods declined on average 2.13 percent ayear between 1975 and 1997 (table 5 and fig. 5a).Researchers have hypothesized that advances in foodmanufacturing productivity would explain the declinein real prices of processed foods. To explain the causeof decline, this study estimates a log-linear regressionby expressing the real producer price of processedfoods (Pt) at time t as a function of the multifactor pro-ductivity index (At) and the real price index of crudefood and feedstuffs (Ft) represented for material cost.The empirical results of the fitted price equation cov-ering 1975-97 for the food manufacturing sector areshown below:
ln Pt = 2.5593 – 0.1381 ln At + 0.5854 ln Ft R2 = 0.99(0.1280) (0.0173) (9)
The figures in parentheses are the standard errors. Theestimated coefficient implies that a 1-percent decreasein the price index of crude food and feedstuffs (Ft)would reduce the real price of processed foods by 0.59percent, and is statistically significant. The effect of a1-percent increase in multifactor productivity (At),however, would reduce the real price of processedfood by only 0.14 percent, but would not be statistical-ly significant. The results found in this study indicatethat a decrease in the prices of crude food and feed-
14 ✺ Food Manufacturing Productivity and Its Economic Implications / TB-1905 Economic Research Service/USDA
Figure 5a
The food sector: Gross-output multifactor productivity and real output price
75 77 79 81 83 85 87 89 91 93 95 9760
80
100
120
140
160
Index (1975=100)
Multifactor productivity-BLS
Real output price
Combined input
Gross output
Multifactor productivity
Source: USDA/Economic Research Service.
Table 6—Private research and development (R&D) expenditures, 1975-97
1975-79 1980-84 1985-89 1990-94 1995-97 Averageannual growth
Million $ at 1982 prices
Total agricultural inputs 865 1,091 1,163 1,396 1,548 4.04Plant breeding 89 123 173 237 288 6.31Agricultural chemicals 346 522 606 754 804 5.60Farm machinery 304 312 234 231 271 1.95Veterinary pharmaceuticals 125 134 151 174 185 2.56
Food manufacturing products 497 604 687 609 644 2.22
Total agricultural R&D 1,362 1,695 1,850 2,005 2,192 3.34
All U.S. industries 28,721 40,692 54,000 66,419 80,499 5.78
Source: USDA/Economic Research Service; Data for all U.S.industries are compiled from National Science Foundation.

stuffs drove down the prices of processed foods paidby consumers. Productivity growth apparently con-tributed little to the price decline.
Another issue of much public interest has been theeffect of many mergers and acquisitions in recentyears on food manufacturing productivity. Accordingto Mergerstat Review, which tracked purchases valuedat $1 million or higher and transfers of ownershipinvolving at least 10 percent of a company’s equity,the pace of merger and acquisition activity in foodprocessing increased steadily from 60 transactions in1991 to 157 in 1998 (table 7). Annually, there was anaverage of 97 transactions involving 12 foreign buyersand 24 foreign sellers. Meanwhile, the number oftransactions valued at $100 million or more increasedfrom 10 in 1991 to 23 in 1998, with an annual averageof 17. On the basis of the measured multifactor pro-ductivity index, it appears that heightened merger andacquisition activity had little effect on productivity.Some argued that R&D labs were consolidated andtotal resources reduced in association with a highnumber of mergers and acquisitions (Connor andSchiek, p. 385).
In measuring labor productivity, the major focus wason the productivity of production workers, who consti-tute more than 70 percent of the total labor force. Asshown in table 5, the average annual rate of change inlabor productivity was 1.33 percent. Labor productivi-ty increased over all subperiods, with a peak at 3.21percent in 1980-84, mainly because of the high growthof nonlabor input intensity, at an annual rate of 4.58percent. Multifactor productivity, however, showed anegative growth rate of -1.38 percent in 1980-84. Thelabor productivity index (fig. 5b) moved steadilyupward until leveling off somewhat after 1985, while
the nonlabor intensity index closely mirrored thismovement. Evidently, a yearly 1.33-percent growth inlabor productivity was closely related to improvementsin nonlabor intensity per production worker, especiallywith workers having more and better machinery.
Table 8 presents the gross-output productivity resultsof each food manufacturing industry. In the table, theaverage rates of change in multifactor productivityrange from -0.42 for meat products to 1.12 percent forbeverages. Many food industries stay roughly evenwith the level in the base year 1975 with small gainsand losses over the subperiods. In 1980-84, the multi-factor productivity index sharply decreased for mostfood industries. For example, multifactor productivityof the dairy industry was estimated at -1.92 percent,because the growth rate of output was only 2.25 per-
Economic Research Service/USDA Food Manufacturing Productivity and Its Economic Implications / TB-1905 ✺ 15
Figure 5b
The food sector: Gross-output labor productivity
Index (1975=100)
Nonlabor intensity
Labor productivity
Multifactor productivity
75 77 79 81 83 85 87 89 91 93 95 9790
100
110
120
130
140
Source: USDA/Economic Research Service.
Table 7—U.S. food processing merger and acquisition activity, 1990-1998
1991 1992 1993 1994 1995 1996 1997 1998 Annualaverage
Number of transactions1 60 75 74 84 86 111 130 157 97Number transactions of
$100 million more 10 8 11 17 20 19 26 23 17Foreign buyers 8 8 6 13 13 12 15 23 12Foreign sellers 14 26 30 20 17 24 32 31 24
Value offered, million $ 3,101 4,328 3,525 11,061 10,833 8,287 10,856 11,450 7,930Foreign buyers value, million $ 543 446 930 4,248 6,187 425 3,041 1,382 2,150Foreign sellers value, million $ 721 2,976 1,705 381 1,844 2,812 3,435 6,170 2,5051 Mergers are included only if the purchase price was at least $1 million and transfers of ownership involved at least 10 percent of a company's equity.
Source: Mergerstat Review. Selected issues.

16 ✺ Food Manufacturing Productivity and Its Economic Implications / TB-1905 Economic Research Service/USDA
Table 8—Gross-output productivity of the food manufacturing industries, 1975-97
1975-79 1980-84 1985-89 1990-94 1995-97 Averageannual growth
Calculated annual change rate (percent)
Meat productsGross output (1) 3.56 -1.37 1.93 1.74 2.03 1.45Inputs:
Combined inputs (2) 2.11 0.75 2.17 2.80 1.38 1.87Nonlabor/labor intensity (3) 0.89 1.55 -2.29 -1.35 -0.24 -0.34
Productivity:Multifactor productivity (4)=(1)-(2) 1.46 -2.12 -0.24 -1.06 0.65 -0.42Labor productivity (5)=(3)+(4) 2.35 -0.57 -2.53 -2.41 0.41 -0.77
Dairy productsGross output (1) 2.18 2.25 1.29 0.95 0.76 1.52Inputs:
Combined inputs (2) -0.20 4.17 1.11 1.60 1.41 1.72Nonlabor/labor intensity (3) 0.20 5.64 0.05 1.69 0.74 1.82
Productivity:Multifactor productivity (4)=(1)-(2) 2.38 -1.92 0.18 -0.65 -0.65 -0.20Labor productivity (5)=(3)+(4) 2.58 3.72 0.23 1.04 0.09 1.62
Preserved fruits and vegetablesGross output (1) 4.68 2.87 1.89 2.24 -0.95 2.31Inputs:
Combined inputs (2) 2.61 3.27 0.38 2.16 -1.11 1.64Nonlabor/labor intensity (3) 0.72 5.67 0.87 1.51 0.10 1.97
Productivity:Multifactor productivity (4)=(1)-(2) 2.08 -0.40 1.51 0.08 0.16 0.67Labor productivity (5)=(3)+(4) 2.79 5.27 2.38 1.59 0.26 2.64
Grain mill productsGross output (1) 0.69 2.18 3.11 2.51 1.70 2.13Inputs:
Combined inputs (2) -0.51 3.49 1.29 1.98 4.90 2.11Nonlabor/labor intensity (3) -0.25 6.92 0.19 0.97 5.45 2.53
Productivity:Multifactor productivity (4)=(1)-(2) 1.21 -1.31 1.82 0.53 -3.20 0.02Labor productivity (5)=(3)+(4) 0.96 5.61 2.01 1.50 2.25 2.55
Bakery productsGross output (1) 0.29 2.38 2.88 3.35 0.79 2.11Inputs:
Combined inputs (2) -1.80 2.50 1.14 1.90 1.46 1.13Nonlabor/labor intensity (3) -1.84 5.34 0.25 -0.43 3.13 1.27
Productivity:Multifactor productivity (4)=(1)-(2) 2.09 -0.12 1.74 1.45 -0.67 0.99Labor productivity (5)=(3)+(4) 0.25 5.22 1.99 1.03 2.46 2.25
Continued--

cent, far less than the 4.17-percent growth of the com-bined inputs. Some significant decreases in multifactorproductivity in 1980-84 occurred in fats and oils (-2.34percent) and meats (-2.12 percent). In 1995-97, themultifactor productivity indexes of most food indus-tries showed little change or were negative for indus-tries like grain mill products (-3.2 percent) and miscel-laneous foods (-2.33 percent).
The labor productivity index increased steadily formost food industries and was closely related to
increased use of inputs other than labor. Table 8 showsthat the average annual rates of change in labor pro-ductivity range from -0.77 for meat products to 3.8percent for beverages. In contrast to low multifactorproductivity in 1980-84, the annual rate of change inlabor productivity of the dairy industry was 3.72 per-cent because of a high growth rate (5.64 percent) ofnonlabor intensity. In 1980-84, the labor productivityindexes showed significant increases in preservedfruits and vegetables (5.27 percent), grain mill prod-ucts (5.61 percent), bakery products (5.22 percent),
Economic Research Service/USDA Food Manufacturing Productivity and Its Economic Implications / TB-1905 ✺ 17
Table 8—Gross-output productivity of the food manufacturing industries, 1975-97--Continued
1975-79 1980-84 1985-89 1990-94 1995-97 Averageannual growth
Calculated annual change rate (percent)
Sugar and confectionsGross output (1) -2.46 3.19 0.66 1.98 2.61 1.23Inputs:
Combined inputs (2) -3.26 3.49 -0.79 2.04 1.70 0.72Nonlabor/labor intensity (3) -3.87 4.51 0.30 1.25 2.36 1.00
Productivity:Multifactor productivity (4)=(1)-(2) 0.80 -0.30 1.44 -0.06 0.92 0.51Labor productivity (5)=(3)+(4) -3.08 4.21 1.75 1.18 3.27 1.51
Fats and oilsGross output (1) 3.55 -1.82 -1.55 -0.54 5.35 0.49Inputs:
Combined inputs (2) 1.69 0.53 -2.46 1.06 5.62 0.87Nonlabor/labor intensity (3) -0.59 6.06 1.06 2.11 7.42 3.00
Productivity:Multifactor productivity (4)=(1)-(2) 1.86 -2.34 0.91 -1.59 -0.27 -0.38Labor productivity (5)=(3)+(4) 1.28 3.72 1.98 0.51 7.15 2.62
BeveragesGross output (1) 3.96 3.32 1.72 2.70 2.15 2.77Inputs:
Combined inputs (2) 2.31 4.41 -1.14 0.56 2.69 1.65Nonlabor/labor intensity (3) 1.82 7.35 2.74 0.49 -0.39 2.68
Productivity:Multifactor productivity (4)=(1)-(2) 1.65 -1.09 2.87 2.15 -0.54 1.12Labor productivity (5)=(3)+(4) 3.48 6.26 5.61 2.64 -0.92 3.80
Miscellaneous foodsGross output (1) 7.61 1.40 1.32 3.01 0.63 2.77Inputs:
Combined inputs (2) 5.35 2.29 0.75 1.93 2.95 2.50Nonlabor/labor intensity (3) -0.39 3.09 0.11 -0.22 1.09 0.75
Productivity:Multifactor productivity (4)=(1)-(2) 2.27 -0.89 0.56 1.08 -2.33 0.27Labor productivity (5)=(3)+(4) 1.87 2.20 0.68 0.86 -1.24 1.02
Notes: Gross output = real adjusted value of shipments; Combined inputs = weighted average of all inputs;Nonlabor/labor input = nonlabor intensity or combined nonlabor inputs per worker-hour.
Source: USDA/Economic Research Service.
sugar and confections (4.21 percent), fats and oils(3.72 percent), and beverages (6.26 percent).
In 1995-97, fats and oils as a capital-intensive industryregistered remarkably high labor productivity with anannual rate of 7.15 percent, which was related to the7.42-percent increase in nonlabor intensity. For otherindustries, some high labor productivity growth rateswere found in sugar and confections (3.27 percent),grain mill products (2.25 percent), and bakery products(2.46 percent), but others showed only a small increase.
Figures 6a to 6i show the movements of gross output,multifactor productivity, and labor productivity fornine food industries in 1975-97. The general pattern ofvariations for most industries was similar to variationsin the overall food manufacturing sector, characterizedby a steady upward movement of the gross output andlabor productivity. On the other hand, the multifactorproductivity indexes moved downward or were slightlyabove the base year level.
Net-Output Productivity Measures
The main purpose of measuring net-output productivityis to show the industry’s contribution to the Nation’sgross domestic product (GDP). Given the measuredinput-output relationships, a change in the quantity ofinputs will affect the amount of combined inputs andcapital intensity per production worker so that the quan-tity of net value added and labor productivity will beaffected simultaneously. Therefore, net-output produc-tivity results are useful indicators for showing the con-tribution of food manufacturing to the Nation’s GDP.
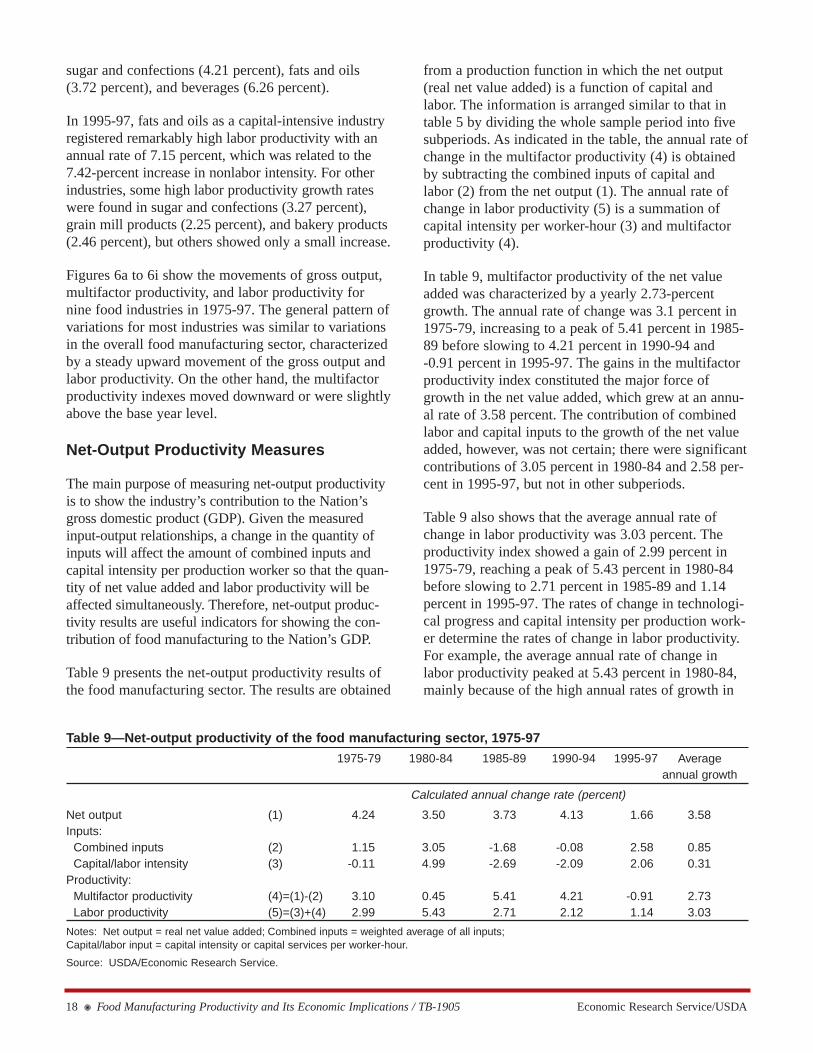
Table 9 presents the net-output productivity results ofthe food manufacturing sector. The results are obtained
from a production function in which the net output(real net value added) is a function of capital andlabor. The information is arranged similar to that intable 5 by dividing the whole sample period into fivesubperiods. As indicated in the table, the annual rate ofchange in the multifactor productivity (4) is obtainedby subtracting the combined inputs of capital andlabor (2) from the net output (1). The annual rate ofchange in labor productivity (5) is a summation ofcapital intensity per worker-hour (3) and multifactorproductivity (4).
In table 9, multifactor productivity of the net valueadded was characterized by a yearly 2.73-percentgrowth. The annual rate of change was 3.1 percent in1975-79, increasing to a peak of 5.41 percent in 1985-89 before slowing to 4.21 percent in 1990-94 and -0.91 percent in 1995-97. The gains in the multifactorproductivity index constituted the major force ofgrowth in the net value added, which grew at an annu-al rate of 3.58 percent. The contribution of combinedlabor and capital inputs to the growth of the net valueadded, however, was not certain; there were significantcontributions of 3.05 percent in 1980-84 and 2.58 per-cent in 1995-97, but not in other subperiods.
Table 9 also shows that the average annual rate ofchange in labor productivity was 3.03 percent. Theproductivity index showed a gain of 2.99 percent in1975-79, reaching a peak of 5.43 percent in 1980-84before slowing to 2.71 percent in 1985-89 and 1.14percent in 1995-97. The rates of change in technologi-cal progress and capital intensity per production work-er determine the rates of change in labor productivity.For example, the average annual rate of change inlabor productivity peaked at 5.43 percent in 1980-84,mainly because of the high annual rates of growth in
18 ✺ Food Manufacturing Productivity and Its Economic Implications / TB-1905 Economic Research Service/USDA
Table 9—Net-output productivity of the food manufacturing sector, 1975-97
1975-79 1980-84 1985-89 1990-94 1995-97 Averageannual growth
Calculated annual change rate (percent)
Net output (1) 4.24 3.50 3.73 4.13 1.66 3.58Inputs:
Combined inputs (2) 1.15 3.05 -1.68 -0.08 2.58 0.85Capital/labor intensity (3) -0.11 4.99 -2.69 -2.09 2.06 0.31
Productivity:Multifactor productivity (4)=(1)-(2) 3.10 0.45 5.41 4.21 -0.91 2.73Labor productivity (5)=(3)+(4) 2.99 5.43 2.71 2.12 1.14 3.03
Notes: Net output = real net value added; Combined inputs = weighted average of all inputs;Capital/labor input = capital intensity or capital services per worker-hour.
Source: USDA/Economic Research Service.

Economic Research Service/USDA Food Manufacturing Productivity and Its Economic Implications / TB-1905 ✺ 19
Figure 6a
Gross-output productivity: Meat products
75 77 79 81 83 85 87 89 91 93 95 9780
90
100
110
120
130
140
Index (1975=100)
Gross output
Multifactor productivity
Labor productivity
Figure 6c
Gross-output productivity: Preserved fruits and vegetables
Index (1975=100)
Gross output
Multifactor productivity
Labor productivity
75 77 79 81 83 85 87 89 91 93 95 9790
100
110
120
130
140
150
160
170
180
Figure 6e
Gross-output productivity: Bakery products
Index (1975=100)
Gross output
Multifactor productivity
Labor productivity
75 77 79 81 83 85 87 89 91 93 95 9790
100
110
120
130
140
150
160
170
Figure 6b
Gross-output productivity: Dairy products
Index (1975=100)
Gross output
Multifactor productivity
Labor productivity
75 77 79 81 83 85 87 89 91 93 95 9790
100
110
120
130
140
150
Figure 6d
Gross-output productivity: Grain mill products
Index (1975=100)
Gross output
Multifactor productivity
Labor productivity
75 77 79 81 83 85 87 89 91 93 95 9790
100
110
120
130
140
150
160
170
180
Figure 6f
Gross-output productivity: Sugar and confections
Index (1975=100)
Gross output
Multifactor productivity
Labor productivity
75 77 79 81 83 85 87 89 91 93 95 9780
90
100
110
120
130
140
Source: USDA/Economic Research Service.
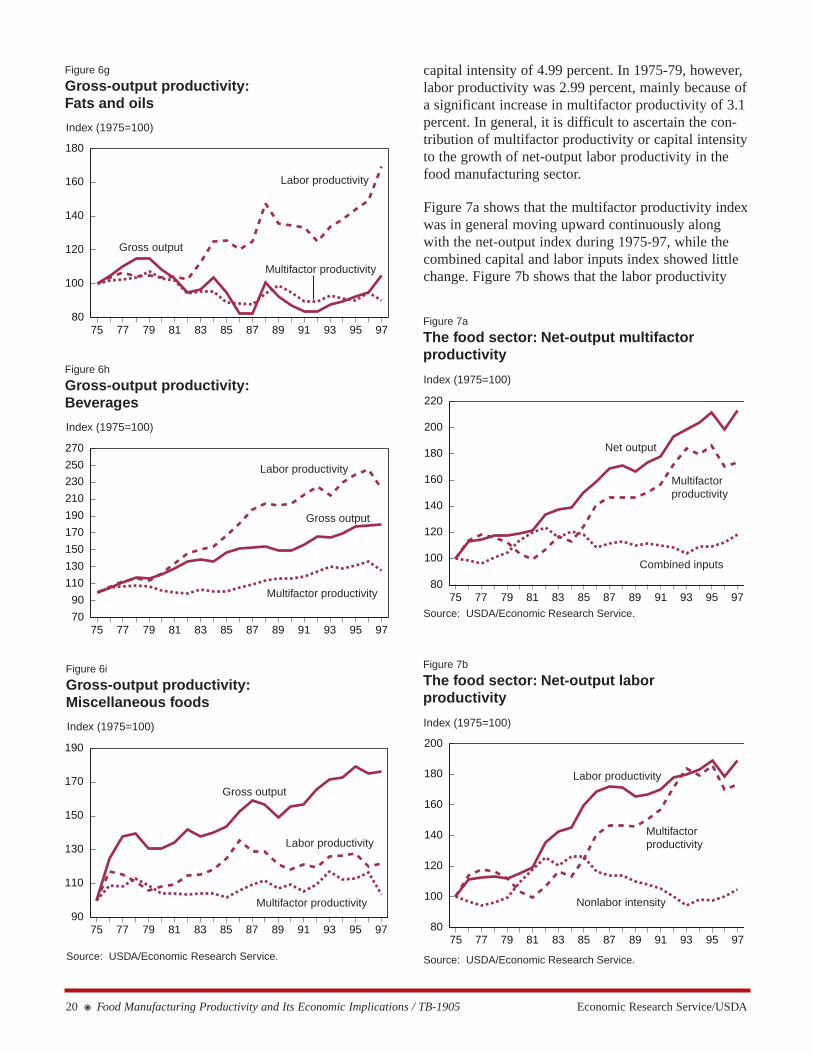
capital intensity of 4.99 percent. In 1975-79, however,labor productivity was 2.99 percent, mainly because ofa significant increase in multifactor productivity of 3.1percent. In general, it is difficult to ascertain the con-tribution of multifactor productivity or capital intensityto the growth of net-output labor productivity in thefood manufacturing sector.
Figure 7a shows that the multifactor productivity indexwas in general moving upward continuously alongwith the net-output index during 1975-97, while thecombined capital and labor inputs index showed littlechange. Figure 7b shows that the labor productivity
20 ✺ Food Manufacturing Productivity and Its Economic Implications / TB-1905 Economic Research Service/USDA
Figure 6g
Gross-output productivity: Fats and oils
Index (1975=100)
Gross output
Multifactor productivity
Labor productivity
75 77 79 81 83 85 87 89 91 93 95 9780
100
120
140
160
180
Figure 6h
Gross-output productivity: Beverages
Index (1975=100)
Gross output
Multifactor productivity
Labor productivity
75 77 79 81 83 85 87 89 91 93 95 9770
90
110
130
150
170
190
210
230
250
270
Figure 6i
Gross-output productivity: Miscellaneous foods
Index (1975=100)
Gross output
Multifactor productivity
Labor productivity
75 77 79 81 83 85 87 89 91 93 95 9790
110
130
150
170
190
Figure 7a
The food sector: Net-output multifactor productivity
Index (1975=100)
Combined inputs
Multifactor productivity
Net output
75 77 79 81 83 85 87 89 91 93 95 9780
100
120
140
160
180
200
220
Source: USDA/Economic Research Service.
Figure 7b
The food sector: Net-output laborproductivity
Index (1975=100)
Nonlabor intensity
Multifactor productivity
Labor productivity
75 77 79 81 83 85 87 89 91 93 95 9780
100
120
140
160
180
200
Source: USDA/Economic Research Service.Source: USDA/Economic Research Service.

index is moving upward continuously along with thenet-output index during 1975-97, while the multifactorproductivity index decreases slightly before 1981 andthen increases steadily over most years. The combinedcapital and nonproduction worker intensity indextrended upward before 1985 and declined thereafter.
Table 10 presents the net-output productivity results ofeach food manufacturing industry. The average growthrates of the multifactor productivity indexes vary wide-ly across industries ranging from grain mill products(1.99 percent) to beverages (3.66 percent). Multifactorproductivity accounted for the major growth of netvalue added in some subperiods, but in other subperi-ods the combined labor and capital inputs contributedsignificantly to changes in net value added. In the meatindustry, for example, the average growth rate of netvalue added in 1995-97 was 7.92 percent because of a4.16-percent increase in multifactor productivity and a3.76-percent increase in combined inputs. In 1980-84,the annual increase of net value added was 1.18 per-cent, mainly spurred by a 1.3-percent increase in com-bined inputs. In 1985-89, however, the annual increaseof net value added was 4.4 percent, mainly due to a3.7-percent increase in multifactor productivity.
Regarding net-output labor productivity, table 10 showsthat most of the average annual changes in labor pro-ductivity are positive ranging from meat products (1.64percent) to beverages (4.85 percent), implying that theproductivity index increased over time. In 1980-84, theincrease of capital intensity was vital to the growth oflabor productivity for most industries. For example, inthe grain mill products, a 7.89-percent increase in capi-tal intensity during that period caused a 7.59-percentincrease in labor productivity. On the other hand, theaverage annual rates of change in capital intensity formost food industries was negative in 1985-89 and1990-94, which affected labor productivity duringthose subperiods. For example, the average growth rateof capital intensity for meat products was -3.76 percentin 1985-89, causing labor productivity to drop by 0.06percent, substantially lower than the 3.7-percentincrease in multifactor productivity.
Figures 8a to 8i show the movements of net output,multifactor productivity, and labor productivity for thenine food industries in 1975-97. These indexes movedupward continuously over time, but their growth ratesvaried among industries. For dairy products, bakeryproducts, and sugar and confections, all three indexeswere closely correlated. For grain mill products and
Economic Research Service/USDA Food Manufacturing Productivity and Its Economic Implications / TB-1905 ✺ 21
Figure 8a
Net-output productivity: Meat products
Index (1975=100)
Net output
Multifactor productivity
Labor productivity
75 77 79 81 83 85 87 89 91 93 95 9780
100
120
140
160
180
200
220
240
Figure 8b
Net-output productivity: Dairy products
Index (1975=100)
Net output
Multifactor productivity
Labor productivity
75 77 79 81 83 85 87 89 91 93 95 9780
100
120
140
160
180
200
Figure 8c
Net-output productivity: Preserved fruits and vegetables
Index (1975=100)
Net output
Multifactor productivity
Labor productivity
75 77 79 81 83 85 87 89 91 93 95 9780
100
120
140
160
180
200
220
240
260
Source: USDA/Economic Research Service.
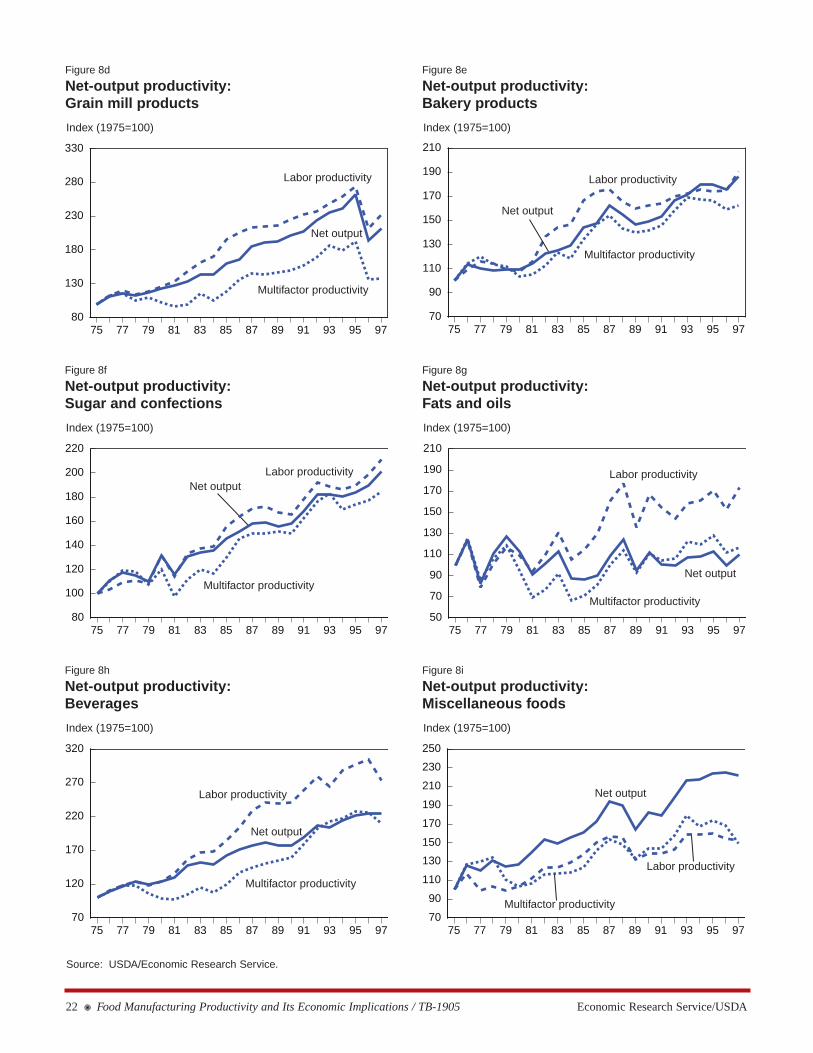
22 ✺ Food Manufacturing Productivity and Its Economic Implications / TB-1905 Economic Research Service/USDA
Figure 8d
Net-output productivity: Grain mill products
Index (1975=100)
Net output
Multifactor productivity
Labor productivity
75 77 79 81 83 85 87 89 91 93 95 9780
130
180
230
280
330
Figure 8f
Net-output productivity: Sugar and confections
Index (1975=100)
Net output
Multifactor productivity
Labor productivity
75 77 79 81 83 85 87 89 91 93 95 9780
100
120
140
160
180
200
220
Figure 8h
Net-output productivity: Beverages
Index (1975=100)
Net output
Multifactor productivity
Labor productivity
75 77 79 81 83 85 87 89 91 93 95 9770
120
170
220
270
320
Figure 8e
Net-output productivity: Bakery products
Index (1975=100)
Net output
Multifactor productivity
Labor productivity
75 77 79 81 83 85 87 89 91 93 95 9770
90
110
130
150
170
190
210
Figure 8g
Net-output productivity: Fats and oils
Index (1975=100)
Net output
Multifactor productivity
Labor productivity
75 77 79 81 83 85 87 89 91 93 95 9750
70
90
110
130
150
170
190
210
Figure 8i
Net-output productivity: Miscellaneous foods
Index (1975=100)
Net output
Multifactor productivity
Labor productivity
75 77 79 81 83 85 87 89 91 93 95 9770
90
110
130
150
170
190
210
230
250
Source: USDA/Economic Research Service.

Economic Research Service/USDA Food Manufacturing Productivity and Its Economic Implications / TB-1905 ✺ 23
Table 10—Net-output productivity of the food manufacturing industries, 1975-97
1975-79 1980-84 1985-89 1990-94 1995-97 Averageannual growth
Calculated annual change rate (percent)
Meat productsNet output (1) 1.62 1.18 4.40 5.34 7.92 3.86Inputs:
Combined inputs (2) 0.30 1.30 0.70 2.07 3.76 1.49Capital/labor intensity (3) -0.91 2.10 -3.76 -2.08 2.14 -0.72
Productivity:Multifactor productivity (4)=(1)-(2) 1.32 -0.11 3.70 3.27 4.16 2.37Labor productivity (5)=(3)+(4) 0.41 1.99 -0.06 1.19 6.30 1.64
Dairy productsNet output (1) 3.54 2.65 3.73 2.93 1.71 2.99Inputs:
Combined inputs (2) -2.52 2.74 -1.07 -0.30 3.80 0.37Capital/labor intensity (3) -2.12 4.21 -2.13 -0.21 3.12 0.47
Productivity:Multifactor productivity (4)=(1)-(2) 6.06 -0.10 4.80 3.23 -2.09 2.62Labor productivity (5)=(3)+(4) 3.94 4.12 2.68 3.02 1.03 3.09
Preserved fruits and vegetablesNet output (1) 6.03 5.04 4.28 2.94 -0.04 3.88Inputs:
Combined inputs (2) 1.96 2.93 -1.06 0.72 -0.98 0.81Capital/labor intensity (3) 0.07 5.33 -0.57 0.07 0.23 1.14
Productivity:Multifactor productivity (4)=(1)-(2) 4.07 2.11 5.33 2.22 0.95 3.06Labor productivity (5)=(3)+(4) 4.14 7.44 4.77 2.29 1.17 4.21
Grain mill productsNet output (1) 4.28 4.16 6.05 4.64 -2.74 3.78Inputs:
Combined inputs (2) 1.71 4.46 -0.85 0.42 4.14 1.79Capital/labor intensity (3) 1.98 7.89 -1.95 -0.59 4.68 2.21
Productivity:Multifactor productivity (4)=(1)-(2) 2.57 -0.30 6.91 4.22 -6.87 1.99Labor productivity (5)=(3)+(4) 4.54 7.59 4.96 3.64 -2.19 4.20
Bakery productsNet output (1) 2.44 3.39 2.91 4.15 1.21 2.98Inputs:
Combined inputs (2) -0.74 2.03 -0.69 0.51 2.15 0.58Capital/labor intensity (3) -0.77 4.87 -1.58 -1.82 3.83 0.72
Productivity:Multifactor productivity (4)=(1)-(2) 3.17 1.37 3.60 3.65 -0.95 2.40Labor productivity (5)=(3)+(4) 2.40 6.24 2.02 1.83 2.88 3.12
Continued--

preserved fruits and vegetables, there was a close cor-relation between the output and labor productivityindexes. For beverages and fats and oils, there was aclose correlation between the output and multifactorproductivity indexes.
The net-output productivity results are useful indica-tors for showing the contribution of food manufactur-ing to the Nation’s GDP. This report concludes byassessing the effects of an increase in capital, labor
(including production and nonproduction workers), orboth by 10 percent on the rates of change in net valueadded and labor productivity. The upper part of table11 presents the simulated results, showing the increas-es in net value added compared with the yearly aver-age for 1995-97. These base values, for example, are$135 billion for the food sector and $19 billion formeat products. The simulated results indicate that anincrease in capital input by 10 percent would increasethe net value added of the food sector by $3.3 billion,
24 ✺ Food Manufacturing Productivity and Its Economic Implications / TB-1905 Economic Research Service/USDA
Table 10—Net-output productivity of the food manufacturing industries, 1975-97--Continued
1975-79 1980-84 1985-89 1990-94 1995-97 Averageannual growth
Calculated annual change rate (percent)
Sugar and confectionsNet output (1) 2.60 4.89 2.85 3.05 3.58 3.41Inputs:
Combined inputs (2) 0.44 2.59 -2.62 0.51 0.69 0.28Capital/labor intensity (3) -0.17 3.61 -1.54 -0.28 1.35 0.56
Productivity:Multifactor productivity (4)=(1)-(2) 2.16 2.29 5.48 2.54 2.88 3.13Labor productivity (5)=(3)+(4) 1.99 5.91 3.94 2.26 4.24 3.69
Fats and oilsNet output (1) 9.77 -6.14 3.00 2.93 1.25 1.90Inputs:
Combined inputs (2) 2.57 2.59 -4.99 -2.69 1.56 -0.47Capital/labor intensity (3) 0.29 8.13 -1.46 -1.64 3.36 1.65
Productivity:Multifactor productivity (4)=(1)-(2) 7.20 -8.74 7.99 5.62 -0.31 2.37Labor productivity (5)=(3)+(4) 7.50 -0.60 6.52 3.98 3.05 4.03
BeveragesNet output (1) 4.84 4.54 3.47 4.01 1.55 3.83Inputs:
Combined inputs (2) 2.89 4.10 -4.17 -3.05 2.57 0.17Capital/labor intensity (3) 2.40 7.04 -0.28 -3.11 -0.50 1.19
Productivity:Multifactor productivity (4)=(1)-(2) 1.95 0.45 7.64 7.06 -1.02 3.66Labor productivity (5)=(3)+(4) 4.36 7.48 7.36 3.95 -1.52 4.85
Miscellaneous foodsNet output (1) 6.34 4.66 1.50 5.93 0.55 3.98Inputs:
Combined inputs (2) 2.51 3.29 -1.22 0.88 4.30 1.71Capital/labor intensity (3) -3.23 4.09 -1.86 -1.27 2.44 -0.04
Productivity:Multifactor productivity (4)=(1)-(2) 3.83 1.37 2.72 5.05 -3.75 2.26Labor productivity (5)=(3)+(4) 0.60 5.46 0.86 3.78 -1.32 2.23
Notes: Net output = real net value added; Combined inputs = weighted average of all inputs;Capital/labor input = capital intensity or capital services per worker-hours.
Source: USDA/Economic Research Service.

mainly from capital-intensive industries: beverages($681 million), grain mill products ($476 million), andpreserved fruits and vegetables ($463 million). A 10-percent increase in labor would increase the net valueadded of the food sector by $995 million, with themeat industry contributing the most among industries($227 million) because of its labor-intensive meat-packing operations. The increase of both capital andlabor would increase the value added of the food sec-tor by $4.3 billion, with beverages contributing themost among all industries ($808 million).
The lower part of table 11 presents the simulatedresults, showing the increases in labor productivitycompared with the yearly average in 1995-97. Thebase value of the food sector was $58.34 for the netvalue added per production worker-hour. Beveragesand grain mill products, heavily capital-intensiveindustries, ranked high in labor productivity ($167.1
and $109.73 per worker-hour, respectively). On theother hand, labor productivity of the labor-intensivemeat products industry ranked the lowest among thefood industries—only $24.61 per worker-hour. A 10-percent increase in capital input alone would increasethe food manufacturing sector’s capital intensity, andconsequently its labor productivity, by $1.43 per work-er-hour. Most of the increases in labor productivitywere realized by capital-intensive industries: $4.47 perworker-hour for beverages and $2.99 per worker-hourfor grain mill products. A 10-percent increase in laborinput alone would reduce the entire food manufactur-ing sector’s capital intensity and cause a decrease inlabor productivity of $1.58 per worker-hour. Finally,an increase of both capital and employees would yielda small increase in labor productivity of the food sec-tor (15 cents per worker-hour), because of the counter-effects of changes between capital and labor.
Economic Research Service/USDA Food Manufacturing Productivity and Its Economic Implications / TB-1905 ✺ 25
Table 11—Effects of increases in inputs on net value added and labor productivity
Base Changes in value added as a 10-percent increase of:value Capital Labor Both capital and labor
Million $ at 1982 prices
Food sector 135,166 3,299 995 4,294Meat products 19,045 378 227 605Dairy products 11,838 278 98 376Preserved fruits & vegetables 18,503 463 125 588Grain mill products 17,473 476 79 555Bakery products 15,556 342 152 494Sugar and confections 9,174 224 67 291Fats and oils 3,267 84 20 104Beverages 25,432 681 127 808Miscellaneous foods 14,878 372 100 473
Changes in net value added per worker-hour (dollars)
Food sector 58.34 1.43 -1.58 0.15Meat products 24.61 0.49 -0.55 0.07Dairy products 65.99 1.55 -1.79 0.24Preserved fruits & vegetables 53.29 1.33 -1.43 0.10Grain mill products 109.73 2.99 -3.17 0.18Bakery products 57.30 1.26 -1.51 0.25Sugar and confections 63.22 1.55 -1.69 0.15Fats and oils 82.19 2.12 -2.31 0.19Beverages 167.14 4.47 -4.90 0.42Miscellaneous foods 59.93 1.50 -1.66 0.16
Note: All values are measured at 1982 prices deflated by producer price of processed foods and feeds.Base value = yearly ave rage value in 1995-97. Labor = production and nonproduction workers.
Source: USDA/Economic Research Service.
This report uses gross-output and net-output approach-es to measure multifactor and labor productivity index-es of the U.S. food manufacturing sector. The gross-output approach relates the adjusted value of ship-ments as a function of capital, labor, energy, and allintermediate materials, while the net-output approachrelates the net value added as a function of labor andcapital. This study finds a striking difference in themultifactor productivity indexes obtained through dif-ferent approaches. The gross-output approach yieldsno significant changes in multifactor productivity overthe sample period, while the net-output approach indi-cates a steady increase in the productivity index.
The cause for different multifactor productivity resultsmay be explained below. The productivity index is cal-culated by subtracting the rates of change in the com-bined input index from the output index. In the gross-output model, materials are considered both as inputand output of a production function. If the cost ofmaterials constitutes a large portion of the value ofshipments, the rate of change in the output indexwould be close to the combined input index, causingthe measured multifactor productivity index to besmall. In the net-output model, materials are notincluded in output or considered as input in a produc-tion function. The difference in the rates of changebetween the net value added and the combined capitaland labor inputs—that is, the net-output multifactorproductivity index—shows more degrees of freedom tovary than under the gross-output model.
In fact, the food manufacturing sector is materials-intensive, with material costs constituting about 60percent or more of the value of gross output. Theratios for some food manufacturing industries, such asmeat products and fats and oils, even reach 75 percentor higher. These two industries depend on either rela-tively expensive meats as raw materials for processingor heavy use of soybeans for crushing or semi-refinedsoybean oil for refining. Consequently, including orexcluding materials as a component in a productionfunction will substantially affect the results of meas-ured productivity indexes. Basically, the economicmeaning of the productivity measurements from thetwo approaches is different, and they represent differ-ent applications. There are certain advantages forapplying either the gross-output or net-output
approach to measure the productivity indexes of theU.S. food manufacturing sector.
Results obtained from the gross-output approachshould be used for interpreting food manufacturingproductivity trends. The gross-output approach meas-ures the ability to produce higher gross output fromthe same level of all inputs because of technologicalchange. Under this approach, the production functionis a comprehensive representation of a productionstructure that includes the contribution of all factorinputs available from the data sources. Therefore, themeasured gross-output productivity index may closelyrepresent technology changes over time, while thepotential change effects from unmeasured inputs canbe avoided. On the other hand, a distinct drawback ofapplying the net-output approach is the assumptionthat materials inputs are separable from other inputsand cannot be the source of productivity growth. TheBureau of Labor Statistics (BLS) apparently supportsusing the gross-output results to explain productivitytrends. Gullickson indicated that the BLS has notincluded net-output productivity indexes in its newsrelease of productivity trends for all manufacturingindustries since 1994.
Productivity indexes obtained from the net-outputapproach should be used for evaluating the contribu-tion of food manufacturing to the growth of theNation’s GDP, mainly because the definition of netoutput is the same as for gross-product-originating(value-added) GDP. As a common practice to evaluatethe Nation’s GDP in any year, the level of GDP is fre-quently regarded as dependent on the input of labormeasured in worker-hours multiplied by the labor pro-ductivity measure as real value added per worker-hour.Therefore, the net-output labor productivity indexusing the net value added as output in a productionfunction may directly show the contribution of thefood manufacturing industries to the Nation’s GDP. Inaddition, net-output labor productivity, which dependssolely on capital and labor inputs, can be easily inter-preted as dependent on technological progress and thequantity of capital goods available to workers. Thisprovides a framework for easy interpretation of thesubstitution relationships between capital and laborinputs. These advantages in application, however, arenot available in the gross-output labor productivitymeasure.
26 ✺ Food Manufacturing Productivity and Its Economic Implications / TB-1905 Economic Research Service/USDA
Concluding Remarks

Applied Financial Information LP. Mergerstat Review.Various issues.
Azzam, A.M., E. Lopez, and R. Lopez (2001).“Imperfect Competition and Total FactorProductivity Growth,” University of Connecticut,Storrs Agr. Exper. Station: Scientific ContributionNo. 2041.
Ball, V.E. and R.G. Chambers (1982). “An EconomicAnalysis of Technology in the Meat ProductsIndustry,” American Journal of AgriculturalEconomics 64:699-709.
Connor, J.M. and W.A. Schiek (1997). FoodProcessing: An Industrial Powerhouse in Transition,2nd edition, New York: John Wiley & Sons.
Gullickson, W. (1995). “Measurement of ProductivityGrowth in U.S. Manufacturing,” Monthly LaborReview: 13-35.
Heien, D.M. (1983). “Productivity in U.S. FoodProcessing and Distribution,” American Journal ofAgricultural Economics 65: 297-302.
MacDonald, J.M. and M.E. Ollinger (2000). “ScaleEconomies and Consolidation in Hog Slaughter,”American Journal of Agricultural Economics 82:334-346.
Mark, J.A.and W.H. Waldorf (1983). “MultifactorProductivity: A New BLS Measure,” Monthly LaborReview: 3-15
Solow, R.M. (1957). “Technical Change and theAggregate Production Function,” Review ofEconomics and Statistics 39: 312-320.
U.S. Department of Commerce. Survey of CurrentBusiness. Various issues.
U.S. Department of Commerce, the Bureau of theCensus. Census of Manufactures. Various issues.
U.S. Department of Commerce, the Bureau of theCensus. Annual Survey of Manufactures. Variousissues.
U.S. Department of Commerce, the Bureau of theCensus. 1997 Economic Census: Bridge betweenSIC and NAICS: Food and Kindred products.Website (http://www.census.gov/epcd/ec97brdg/e97b2_20.htm)
U.S. Department of Labor, the Bureau of LaborStatistics (BLS). Producer Price Indexes. Website(http://stats.bls.gov/blshome.html.)
U.S. Department of Labor, the Bureau of LaborStatistics (BLS). Multifactor Productivity. Website(http://stats.bls.gov/mfp/mprdload.html.)
Economic Research Service/USDA Food Manufacturing Productivity and Its Economic Implications / TB-1905 ✺ 27
References
The data used in this study were compiled mainlyfrom the Census of Manufactures and the AnnualSurvey of Manufactures SIC code 20 (Food andKindred Products) and its nine three-digit industriesfor 1975-97 published by the Census Bureau of theU.S. Department of Commerce. The Census Bureauconducts the economic census (including food manu-facturing) every 5 years, covering years ending in 2and 7, (e.g., 1992 and 1997). In addition, the CensusBureau conducts the Annual Survey of Manufactures(ASM) in each of the 4 years between the economiccensuses. The ASM is a probability-based sample ofapproximately 58,000 establishments and collectsmany of the same industry statistics as the economiccensus including employment, payroll, value of ship-ments, etc. However, there are some selected statisticsnot included in the ASM. Among these are the numberof companies and establishments, detailed product andmaterials data, and sub-State geographic data.
The data in the 1997 Census of Manufactures werepublished for the first time on the basis of the NorthAmerican Industry Classification System (NAICS),which is different from the Standard Industrial
Classification System (SIC) used in previous censuses.For food manufacturing industries, there is substantialdifference in product classification between theNAICS and the SIC systems. For example, dog and catfood and other animal foods are included in animalfood (code 3111) in the NAICS, but they are includedin grain mill products (code 204) in the SIC. In theNAICS, seafood product preparation and packaging(code 3117) is added as a product category, but isincluded in miscellaneous food (code 209) under theSIC system.
To construct consistent time-series data dating back to1975, this study converts the 1997 data under theNAICS classification system into a framework alongwith the SIC classification system. The converting pro-cedure follows the Census Bureau’s classification codespublished on the web site “1997 Economic Census:Bridge Between SIC and NAICS.” A list of the compa-rability of product codes used for converting the NAICSdata into SIC data is presented in Appendix table A. Forexample, in the meat products, SIC code 2011 (meat-packing plants) is nearly equivalent to NAICS code311611 (animal, except poultry, slaughtering).
28 ✺ Food Manufacturing Productivity and Its Economic Implications / TB-1905 Economic Research Service/USDA
Appendix A: Data Compilations

Economic Research Service/USDA Food Manufacturing Productivity and Its Economic Implications / TB-1905 ✺ 29
Appendix table A—Comparability of product codes between SIC and NAICS for food and kindred products
SIC code NAICS code *Meat products 201Fresh frozen meat 2011 Meatpacking plants 311611 Animal (except poultry) slaughtering (99.9%)Sausage 2013 Sausages and other prepared meats 311612 Meat processed from carcasses (93%)Poultry 2015 Poultry slaughtering and processing 311615 Poultry processing
311999 All other miscellaneous food (21%)Dairy products 202Creamery butter 2021 Creamery butter 311512 Creamery butterCheese 2022 Cheese, natural and processed 311513 CheeseDry condensed milk 2023 Dry, condensed and evaporated dairy products 311514 Dry, condensed and evaporated dairy productsIce cream 2024 Ice cream and frozen desserts 311520 Ice cream and frozen dessertFluid milk 2026 Fluid milk 311511 Fluid milk
Preserved fruits and vegetables 203
Canned specialty 2032 Canned specialties 311422 Speciality canning311999 All other miscellaneous food (2%)
Canned fruits and vegetables 2033 Canned fruits and vegetables 311421 Fruit and vegetable canning (91%)Dried fruits and vegetables 2034 Dehydrated fruits, vegetables, and soups 311423 Dried and dehydrated food (94%)Pickles 2035 Pickles, sauces, and salad dressings 311941 Pickles, sauces, and salad dressings (96%)
311421 Fruit and vegetable canning (9%)Frozen fruits and vegetables 2037 Frozen fruits and vegetables 311411 Frozen fruit, juice, and vegetableFrozen specialties 2038 Frozen specialties 311412 Frozen specialty food
Grain mill products 204Flour and gain mill products 2041 Flour and other grain mill products 311211 Flour millingBreakfast cereals 2043 Cereal breakfast foods 311230 Breakfast cerealRice 2044 Rice milling 311212 Rice millingPrepared flour mixes 2045 Prepared flour mixes and doughs 311822 Flour mixes and dough from flourWet corn 2046 Wet corn milling 311221 Wet corn millingDog and cat food 2047 Dog and cat food 311111 Dog and cat foodPrepared feeds 2048 Prepared feeds 311119 Other animal food
311611 Animal (except poultry) slaughtering (0.1%)Bakery products 205Cookies and crackers 2052 Cookies and crackers 311821 Cookies and crackers
311919 Potato chips and other snack food (6%)311812 Commercial bakeries (0.2%)
Frozen bakery 2053 Frozen bakery products, except bread 311813 Frozen cake, pie, and other pastry
Sugar and confections 206Raw cane sugar 2061 Raw cane sugar 311311 Sugarcane millsCane sugar 2062 Cane sugar refining 311312 Cane sugar refiningBeet sugar 2063 Beet sugar 311313 Beet sugarCandy 2064 Candy and other confectionery 3113302 Confectionery products from chocolate
products and chewing gum (commercial)Nonchocolate confectionery manufacturing 3113402 Nonchocolate confectionery (commercial)
Chocolate 2066 Chocolate and cocoa products 311320 Chocolate and confectionery fromcacao beans
Nuts and peanuts 2068 Salted and roasted nuts and seeds 311911 Roasted nuts and peanut butter (80%)
Continued--

30 ✺ Food Manufacturing Productivity and Its Economic Implications / TB-1905 Economic Research Service/USDA
Appendix table A—Comparability of product codes between SIC and NAICS for food and kindred products--Continued
Fats and oils 207Soybean oil 2075 Soybean oil mills 311222 Soybean processing
311225 Fats and oils refining and blending (12%)Other oilseed 2076 Vegetable and cotton oil mills 311223 Other oilseed processing
311225 Fats and oils refining and blending (2%)Animal fats and oils 2077 Animal and marine fats and oils 311613 Rendering and meat byproduct processing
311711 Seafood canning (1%) Edible fats and oils 2079 Edible fats and oils 311225 Fats and oils refining and blending (86%)
Beverages 208Malt beverages 2082 Malt beverages 312120 BreweriesMalt 2083 Malt 311213 MaltWines 2084 Wines, brandy, and brandy spirits 312130 Wineries Distillery 2085 Distilled and blended liquors 312140 DistilleriesSoft drink 2086 Soft drink 312111 Soft drink
2086 Bottled water 312112 Bottled waterFlavoring syrups 2087 Flavoring syrup and concentrate 311930 Flavoring syrup and concentrate
311942 Spice and extract (20%)311999 All other miscellaneous food (8%)
Miscellaneous foods 209Seafood canned 2091 Canned and cured fish and seafoods 311711 Seafood canning (99%)Seafood fresh 2092 Fresh or frozen prepared fish 311712 Fresh and frozen seafood processingRoasted coffee 2095 Roasted coffee 311920 Coffee and tea (90%)Potato chips 2096 Potato chips and similar snacks 311919 Potato chips and other snack food (94%)Manufactured ice 2097 Manufactured ice 312113 Manufactured iceMacaroni and spaghetti 2098 Macaroni and spaghetti 311823 Dry pastaFood preparation 2099 Food preparations 311830 Tortilla
311942 Spice and extract (80%)311991 Perishable prepared food311999 All other miscellaneous food (69%) 311423 Dried and dehydrated food (6%)311911 Roasted nuts and peanut butter (20%)311920 Coffee and tea (10%)311941 Mayonnaise, dressing & sauce (4%)
* The percent in parentheses indicates that the percentage of a NAICS code is allocated to a corresponding SIC code.
Source: U.S. Census Bureau. 1997 Economic Census: Bridge Between SIC and NAICS: Food and kindred products. (http://www.Census.gov/epcd/ec97brdg)

To measure depreciation charges for capital, data areavailable and reported only for 1977-85. Depreciationcharges for the remaining period 1986-97 are projectedon the basis of a log-linear regression by fitting thedepreciation charges (Dt) at time t as a function ofbeginning-of-year structure and equipment assets (Kt)for 1977-85. That is,
ln Dt = α + β ln Kt.
A complete listing of fitted depreciation equations forthe food manufacturing sector and all individual foodmanufacturing industries is listed in the following table:
Economic Research Service/USDA Food Manufacturing Productivity and Its Economic Implications / TB-1905 ✺ 31
Appendix B: Estimated Capital Depreciation Equations
Appendix table B—Estimation results of capital depreciation equations
Estimated constant Estimated slope R-square D.W.
Food sector -3.3203 1.0630 0.99 2.60(0.3156) (0.0292)
Meat products -2.5058 1.0028 0.87 2.61(1.2503) (0.1460)
Dairy products -2.9143 1.0412 2.61 1.68(0.7790) (0.0927)
Preserved fruits and vegetables -3.2090 1.0591 0.98 1.86(0.4354) (0.0497)
Grain mill products -3.8491 1.1222 0.94 1.70(0.9448) (0.1076)
Bakery products -3.4243 1.1039 0.96 2.18(0.7369) (0.0891)
Sugar and confections -2.8632 1.0051 0.96 1.92(0.6141) (0.0737)
Fats and oils -4.0580 1.1716 0.99 3.16(0.3755) (0.0473)
Beverages -3.7038 1.1149 0.99 1.84(0.4264) (0.0457)
Miscellaneous foods -1.1906 0.8327 0.89 1.34(0.9152) (0.1108)
Notes: The depreciation equation is a log-linear form by fitting the depreciation charges as a function of the assets at the beginning-of-year.For each pair of estimates, the upper part is the estimated coefficient, and the lower part in parentheses is the standard error. D.W. = Durbin-Watson statistic.
Source: USDA/Economic Research Service.

For applying the methodology of measuring productiv-ity to U.S. food manufacturing, two commonly usedoutput indicators, the value of shipments and valueadded, are available in the Census of Manufacturesand the Annual Survey of Manufactures. Therefore,two alternative approaches in specifying a productionfunction for measuring multifactor and labor produc-tivity indexes are applied in this study. One approachis specifying the “gross” output or real adjusted valueof shipments as a function of capital, labor, and inter-mediate materials inputs. The results from the gross-output approach are presented in appendix tables C1 toC10. Another approach is specifying the “net” outputor real net value-added as a function of capital and
labor inputs. The results from the net-output approachare presented in appendix tables C11 to C20.
Each table contains the detailed results of yearly pro-ductivity indexes and related measures. The upper partof each table shows the calculated annual rates ofchanges in output, inputs, and multifactor and laborproductivity indexes. The lower part of each tableshows and the generated index values using 1975 asthe base year. These index series showing the move-ments of the generated index numbers for output, mul-tifactor, and labor productivity are the input informa-tion for use in the figures appearing in the text.
32 ✺ Food Manufacturing Productivity and Its Economic Implications / TB-1905 Economic Research Service/USDA
Appendix C: Yearly Productivity Measures

Economic Research Service/USDA Food Manufacturing Productivity and Its Economic Implications / TB-1905 ✺ 33
Appendix table C-1—Gross-output productivity of the food manufacturing sector
Year Output Inputs Productivity
Combined Nonlabor/labor Multifactor Labor
(1) (2) (3) (4)=(1)-(2) (5)=(3)+(4)
Calculated annual change rate (percent) 1976 7.49 3.30 1.78 4.19 5.971977 2.01 2.85 2.41 -0.83 1.581978 3.02 0.96 -1.17 2.06 0.891979 -0.70 -2.08 -3.01 1.39 -1.621980 0.24 4.40 5.48 -4.16 1.321981 2.74 5.17 7.03 -2.43 4.601982 2.06 4.01 7.94 -1.94 6.001983 0.31 -2.44 -0.31 2.75 2.441984 0.99 2.09 2.79 -1.10 1.681985 2.21 4.39 6.21 -2.18 4.031986 0.44 -1.60 -1.14 2.04 0.901987 4.45 2.94 -1.47 1.51 0.041988 2.21 -0.96 -3.06 3.18 0.121989 -0.89 -1.75 -2.60 0.86 -1.731990 1.83 2.38 -0.46 -0.54 -1.001991 0.73 3.36 2.62 -2.63 -0.021992 4.92 2.07 -2.02 2.85 0.831993 1.95 -2.04 -3.43 3.99 0.561994 0.78 3.62 2.64 -2.85 -0.211995 2.75 2.31 1.67 0.44 2.111996 -1.78 -4.08 -3.51 2.29 -1.211997 3.56 8.18 6.70 -4.63 2.07
Generated index number (1975=100)
1975 100.0 100.0 100.0 100.0 100.01976 107.5 103.3 101.8 104.2 106.01977 109.7 106.2 104.2 103.3 107.61978 113.0 107.3 103.0 105.5 108.61979 112.2 105.0 99.9 106.9 106.81980 112.5 109.7 105.4 102.5 108.21981 115.5 115.3 112.8 100.0 113.21982 117.9 119.9 121.8 98.0 120.01983 118.3 117.0 121.4 100.7 122.91984 119.5 119.5 124.8 99.6 125.01985 122.1 124.7 132.5 97.4 130.01986 122.6 122.7 131.0 99.4 131.21987 128.1 126.3 129.1 100.9 131.31988 130.9 125.1 125.1 104.1 131.41989 129.8 122.9 121.9 105.0 129.21990 132.1 125.8 121.3 104.5 127.91991 133.1 130.1 124.5 101.7 127.81992 139.7 132.8 122.0 104.6 128.91993 142.4 130.1 117.8 108.8 129.61994 143.5 134.8 120.9 105.7 129.41995 147.4 137.9 122.9 106.2 132.11996 144.8 132.2 118.6 108.6 130.51997 150.0 143.1 126.5 103.6 133.2
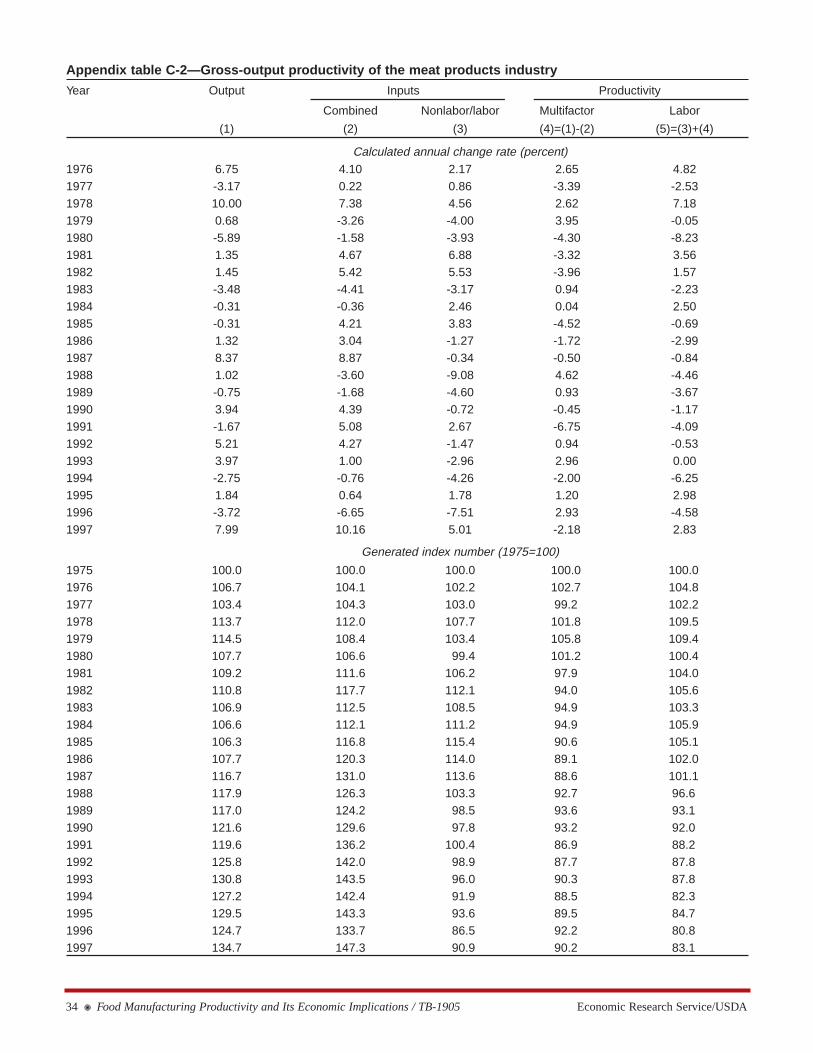
34 ✺ Food Manufacturing Productivity and Its Economic Implications / TB-1905 Economic Research Service/USDA
Appendix table C-2—Gross-output productivity of the meat products industry
Year Output Inputs Productivity
Combined Nonlabor/labor Multifactor Labor
(1) (2) (3) (4)=(1)-(2) (5)=(3)+(4)
Calculated annual change rate (percent) 1976 6.75 4.10 2.17 2.65 4.821977 -3.17 0.22 0.86 -3.39 -2.531978 10.00 7.38 4.56 2.62 7.181979 0.68 -3.26 -4.00 3.95 -0.051980 -5.89 -1.58 -3.93 -4.30 -8.231981 1.35 4.67 6.88 -3.32 3.561982 1.45 5.42 5.53 -3.96 1.571983 -3.48 -4.41 -3.17 0.94 -2.231984 -0.31 -0.36 2.46 0.04 2.501985 -0.31 4.21 3.83 -4.52 -0.691986 1.32 3.04 -1.27 -1.72 -2.991987 8.37 8.87 -0.34 -0.50 -0.841988 1.02 -3.60 -9.08 4.62 -4.461989 -0.75 -1.68 -4.60 0.93 -3.671990 3.94 4.39 -0.72 -0.45 -1.171991 -1.67 5.08 2.67 -6.75 -4.091992 5.21 4.27 -1.47 0.94 -0.531993 3.97 1.00 -2.96 2.96 0.001994 -2.75 -0.76 -4.26 -2.00 -6.251995 1.84 0.64 1.78 1.20 2.981996 -3.72 -6.65 -7.51 2.93 -4.581997 7.99 10.16 5.01 -2.18 2.83
Generated index number (1975=100)
1975 100.0 100.0 100.0 100.0 100.01976 106.7 104.1 102.2 102.7 104.81977 103.4 104.3 103.0 99.2 102.21978 113.7 112.0 107.7 101.8 109.51979 114.5 108.4 103.4 105.8 109.41980 107.7 106.6 99.4 101.2 100.41981 109.2 111.6 106.2 97.9 104.01982 110.8 117.7 112.1 94.0 105.61983 106.9 112.5 108.5 94.9 103.31984 106.6 112.1 111.2 94.9 105.91985 106.3 116.8 115.4 90.6 105.11986 107.7 120.3 114.0 89.1 102.01987 116.7 131.0 113.6 88.6 101.11988 117.9 126.3 103.3 92.7 96.61989 117.0 124.2 98.5 93.6 93.11990 121.6 129.6 97.8 93.2 92.01991 119.6 136.2 100.4 86.9 88.21992 125.8 142.0 98.9 87.7 87.81993 130.8 143.5 96.0 90.3 87.81994 127.2 142.4 91.9 88.5 82.31995 129.5 143.3 93.6 89.5 84.71996 124.7 133.7 86.5 92.2 80.81997 134.7 147.3 90.9 90.2 83.1

Economic Research Service/USDA Food Manufacturing Productivity and Its Economic Implications / TB-1905 ✺ 35
Appendix table C-3—Gross-output productivity of the dairy products industry
Year Output Inputs Productivity
Combined Nonlabor/labor Multifactor Labor
(1) (2) (3) (4)=(1)-(2) (5)=(3)+(4)
Calculated annual change rate (percent) 1976 11.45 7.44 7.87 4.02 11.891977 -0.03 1.47 5.49 -1.50 3.991978 -1.42 -3.93 -4.50 2.51 -1.991979 -1.27 -5.78 -8.07 4.51 -3.561980 3.49 7.61 10.70 -4.12 6.581981 5.58 8.75 9.09 -3.16 5.931982 3.47 6.65 11.16 -3.18 7.981983 1.85 0.12 1.94 1.73 3.671984 -3.15 -2.26 -4.68 -0.89 -5.561985 3.71 8.47 9.07 -4.76 4.311986 0.58 -0.64 -1.00 1.22 0.221987 4.02 2.51 -1.58 1.51 -0.071988 0.09 -3.48 -8.24 3.57 -4.671989 -1.97 -1.33 2.01 -0.65 1.361990 2.62 3.62 3.73 -1.00 2.731991 -2.64 0.58 1.03 -3.21 -2.181992 8.40 4.39 -0.54 4.01 3.461993 -2.81 -4.73 -3.92 1.92 -2.001994 -0.80 4.15 8.16 -4.95 3.211995 2.63 4.30 2.16 -1.67 0.501996 -0.25 -5.32 -4.42 5.07 0.641997 -0.10 5.25 4.47 -5.35 -0.88
Generated index number (1975=100)
1975 100.0 100.0 100.0 100.0 100.01976 111.5 107.4 107.9 104.0 111.91977 111.4 109.0 113.8 102.5 116.41978 109.8 104.7 108.7 105.0 114.01979 108.4 98.7 99.9 109.8 110.01980 112.2 106.2 110.6 105.2 117.21981 118.5 115.5 120.6 101.9 124.21982 122.6 123.2 134.1 98.7 134.11983 124.9 123.3 136.7 100.4 139.01984 120.9 120.5 130.3 99.5 131.21985 125.4 130.7 142.1 94.8 136.91986 126.2 129.9 140.7 95.9 137.21987 131.2 133.1 138.5 97.4 137.11988 131.3 128.5 127.1 100.8 130.71989 128.8 126.8 129.6 100.2 132.51990 132.1 131.4 134.5 99.2 136.11991 128.6 132.2 135.8 96.0 133.11992 139.4 138.0 135.1 99.8 137.71993 135.5 131.4 129.8 101.8 135.01994 134.4 136.9 140.4 96.7 139.31995 138.0 142.8 143.4 95.1 140.01996 137.6 135.2 137.1 99.9 140.91997 137.5 142.3 143.2 94.6 139.7

36 ✺ Food Manufacturing Productivity and Its Economic Implications / TB-1905 Economic Research Service/USDA
Appendix table C-4—Gross-output productivity of the preserved fruits and vegetables industry
Year Output Inputs Productivity
Combined Nonlabor/labor Multifactor Labor
(1) (2) (3) (4)=(1)-(2) (5)=(3)+(4)
Calculated annual change rate (percent) 1976 7.26 0.37 2.97 6.89 9.861977 10.16 9.39 2.85 0.77 3.611978 2.49 1.07 -1.80 1.42 -0.391979 -1.18 -0.41 -1.15 -0.77 -1.921980 -2.53 3.22 6.81 -5.74 1.061981 1.75 3.96 6.64 -2.21 4.431982 6.89 4.62 11.40 2.28 13.681983 2.20 -1.46 0.39 3.67 4.061984 6.03 6.02 3.09 0.01 3.101985 3.67 5.63 7.58 -1.96 5.621986 -0.18 -5.02 -3.24 4.85 1.601987 -0.85 -0.88 1.20 0.04 1.241988 1.80 0.16 -0.36 1.64 1.281989 5.01 2.05 -0.80 2.96 2.161990 2.81 4.22 1.11 -1.41 -0.301991 4.25 5.21 3.59 -0.96 2.631992 -1.42 -3.16 -2.26 1.74 -0.521993 2.53 -1.36 -0.44 3.88 3.441994 3.01 5.88 5.57 -2.87 2.701995 0.33 1.55 -0.35 -1.22 -1.571996 -3.37 -5.41 -3.14 2.05 -1.101997 0.19 0.54 3.80 -0.35 3.45
Generated index number (1975=100)
1975 100.0 100.0 100.0 100.0 100.01976 106.7 104.1 102.2 102.7 104.81977 103.4 104.3 103.0 99.2 102.21978 113.7 112.0 107.7 101.8 109.51979 114.5 108.4 103.4 105.8 109.41980 107.7 106.6 99.4 101.2 100.41981 109.2 111.6 106.2 97.9 104.01982 110.8 117.7 112.1 94.0 105.61983 106.9 112.5 108.5 94.9 103.31984 106.6 112.1 111.2 94.9 105.91985 106.3 116.8 115.4 90.6 105.11986 107.7 120.3 114.0 89.1 102.01987 116.7 131.0 113.6 88.6 101.11988 117.9 126.3 103.3 92.7 96.61989 117.0 124.2 98.5 93.6 93.11990 121.6 129.6 97.8 93.2 92.01991 119.6 136.2 100.4 86.9 88.21992 125.8 142.0 98.9 87.7 87.81993 130.8 143.5 96.0 90.3 87.81994 127.2 142.4 91.9 88.5 82.31995 129.5 143.3 93.6 89.5 84.71996 124.7 133.7 86.5 92.2 80.81997 134.7 147.3 90.9 90.2 83.1

Economic Research Service/USDA Food Manufacturing Productivity and Its Economic Implications / TB-1905 ✺ 37
Appendix table C-5—Gross-output productivity of the grain mill products industry
Year Output Inputs Productivity
Combined Nonlabor/labor Multifactor Labor
(1) (2) (3) (4)=(1)-(2) (5)=(3)+(4)
Calculated annual change rate (percent) 1976 5.14 1.46 2.45 3.68 6.131977 0.86 2.09 4.95 -1.24 3.721978 -4.16 -4.18 -6.10 0.02 -6.071979 0.93 -1.43 -2.31 2.36 0.051980 3.96 6.71 8.55 -2.74 5.801981 5.70 8.60 11.33 -2.90 8.431982 -2.64 -0.20 6.14 -2.43 3.711983 3.87 -0.56 0.49 4.43 4.931984 0.00 2.93 8.10 -2.93 5.161985 0.75 1.14 5.05 -0.38 4.661986 -2.68 -5.74 -5.16 3.06 -2.101987 6.29 4.55 -2.96 1.74 -1.221988 6.69 3.82 1.55 2.87 4.421989 4.49 2.67 2.48 1.82 4.291990 0.18 0.39 0.06 -0.22 -0.151991 1.09 3.30 3.50 -2.21 1.291992 6.01 4.05 -1.84 1.96 0.131993 2.99 -2.78 -3.21 5.77 2.561994 2.26 4.91 6.35 -2.66 3.691995 4.75 3.21 0.97 1.54 2.511996 -3.02 2.47 5.46 -5.49 -0.031997 3.37 9.03 9.91 -5.65 4.26
Generated index number (1975=100)
1975 100.0 100.0 100.0 100.0 100.01976 105.1 101.5 102.5 103.7 106.11977 106.0 103.6 107.5 102.4 110.11978 101.6 99.3 101.0 102.4 103.41979 102.6 97.8 98.6 104.8 103.41980 106.6 104.4 107.1 102.0 109.41981 112.7 113.4 119.2 99.0 118.71982 109.7 113.1 126.5 96.6 123.11983 114.0 112.5 127.1 100.9 129.11984 114.0 115.8 137.4 97.9 135.81985 114.9 117.1 144.4 97.5 142.11986 111.8 110.4 136.9 100.5 139.11987 118.8 115.4 132.9 102.3 137.41988 126.8 119.8 134.9 105.2 143.51989 132.5 123.0 138.3 107.1 149.71990 132.7 123.5 138.3 106.9 149.41991 134.1 127.6 143.2 104.5 151.41992 142.2 132.8 140.6 106.6 151.61993 146.5 129.1 136.0 112.7 155.41994 149.8 135.4 144.7 109.7 161.21995 156.9 139.8 146.1 111.4 165.21996 152.1 143.2 154.1 105.3 165.21997 157.3 156.2 169.3 99.4 172.2

38 ✺ Food Manufacturing Productivity and Its Economic Implications / TB-1905 Economic Research Service/USDA
Appendix table C-6—Gross-output productivity of the bakery products industry
Year Output Inputs Productivity
Combined Nonlabor/labor Multifactor Labor
(1) (2) (3) (4)=(1)-(2) (5)=(3)+(4)
Calculated annual change rate (percent) 1976 6.74 -0.59 -4.45 7.33 2.881977 -4.41 -6.12 2.71 1.71 4.421978 -1.85 -0.01 -0.36 -1.83 -2.191979 0.67 -0.49 -5.26 1.16 -4.111980 0.53 5.93 5.08 -5.39 -0.311981 4.05 4.25 6.79 -0.20 6.601982 4.14 1.90 12.28 2.24 14.521983 0.31 -5.10 -1.60 5.40 3.811984 2.84 5.51 4.15 -2.67 1.481985 9.02 3.98 5.99 5.04 11.031986 0.49 -3.75 -1.56 4.24 2.681987 8.44 5.50 -3.93 2.94 -0.991988 -2.60 0.13 -0.63 -2.73 -3.361989 -0.98 -0.17 1.40 -0.81 0.591990 1.08 0.71 0.27 0.36 0.631991 1.37 2.19 0.63 -0.82 -0.191992 7.05 2.16 -2.69 4.89 2.211993 3.24 -1.13 -2.63 4.37 1.741994 4.01 5.56 2.29 -1.55 0.751995 1.24 2.25 1.28 -1.01 0.271996 -3.49 -4.60 -1.26 1.11 -0.151997 4.62 6.72 9.37 -2.10 7.27
Generated index number (1975=100)
1975 100.0 100.0 100.0 100.0 100.01976 106.7 99.4 95.6 107.3 102.91977 102.0 93.3 98.1 109.2 107.41978 100.1 93.3 97.8 107.2 105.11979 100.8 92.9 92.6 108.4 100.81980 101.3 98.4 97.4 102.6 100.41981 105.5 102.5 104.0 102.4 107.11982 109.8 104.5 116.7 104.6 122.61983 110.2 99.2 114.9 110.3 127.31984 113.3 104.6 119.6 107.4 129.21985 123.5 108.8 126.8 112.8 143.41986 124.1 104.7 124.8 117.5 147.31987 134.6 110.5 119.9 121.0 145.81988 131.1 110.6 119.2 117.7 140.91989 129.8 110.4 120.8 116.7 141.71990 131.2 111.2 121.2 117.2 142.61991 133.0 113.7 121.9 116.2 142.41992 142.4 116.1 118.6 121.9 145.51993 147.0 114.8 115.5 127.2 148.01994 152.9 121.2 118.2 125.3 149.11995 154.8 123.9 119.7 124.0 149.51996 149.4 118.2 118.2 125.4 149.31997 156.3 126.1 129.2 122.7 160.2

Economic Research Service/USDA Food Manufacturing Productivity and Its Economic Implications / TB-1905 ✺ 39
Appendix table C-7—Gross-output productivity of the sugar and confections industry
Year Output Inputs Productivity
Combined Nonlabor/labor Multifactor Labor
(1) (2) (3) (4)=(1)-(2) (5)=(3)+(4)
Calculated annual change rate (percent) 1976 -6.18 -5.97 -13.40 -0.20 -13.601977 0.04 -2.46 -2.40 2.50 0.101978 -2.37 -4.79 -1.78 2.43 0.651979 -1.35 0.19 2.09 -1.54 0.541980 17.16 16.74 18.80 0.42 19.221981 -1.43 3.59 2.30 -5.02 -2.721982 -5.19 -4.99 -1.39 -0.20 -1.591983 2.66 -2.43 -1.42 5.09 3.661984 2.77 4.56 4.30 -1.79 2.501985 -0.48 0.26 5.07 -0.74 4.331986 1.28 -0.35 1.50 1.63 3.131987 5.59 1.05 0.41 4.54 4.951988 -1.22 -2.21 -1.92 0.98 -0.941989 -1.89 -2.68 -3.54 0.79 -2.751990 0.83 2.94 0.01 -2.11 -2.101991 4.14 3.49 5.09 0.64 5.731992 4.01 0.32 0.04 3.69 3.731993 1.55 -1.90 -3.83 3.45 -0.381994 -0.66 5.35 4.94 -6.00 -1.071995 2.36 0.77 0.84 1.58 2.421996 1.63 -3.38 -1.81 5.01 3.211997 3.85 7.70 8.03 -3.84 4.19
Generated index number (1975=100)
1975 100.0 100.0 100.0 100.0 100.01976 93.8 94.0 86.6 99.8 86.41977 93.9 91.7 84.5 102.3 86.51978 91.6 87.3 83.0 104.8 87.11979 90.4 87.5 84.8 103.2 87.51980 105.9 102.1 100.7 103.6 104.31981 104.4 105.8 103.0 98.4 101.51982 99.0 100.5 101.6 98.2 99.91983 101.6 98.1 100.1 103.2 103.51984 104.4 102.6 104.4 101.3 106.11985 103.9 102.8 109.7 100.6 110.71986 105.3 102.5 111.4 102.2 114.21987 111.2 103.5 111.8 106.9 119.91988 109.8 101.3 109.7 107.9 118.71989 107.7 98.5 105.8 108.8 115.51990 108.6 101.4 105.8 106.5 113.01991 113.1 105.0 111.2 107.2 119.51992 117.6 105.3 111.2 111.1 124.01993 119.5 103.3 107.0 115.0 123.51994 118.7 108.8 112.2 108.1 122.21995 121.5 109.7 113.2 109.8 125.21996 123.5 106.0 111.1 115.3 129.21997 128.2 114.1 120.1 110.8 134.6

40 ✺ Food Manufacturing Productivity and Its Economic Implications / TB-1905 Economic Research Service/USDA
Appendix table C-8—Gross-output productivity of the fats and oils industry
Year Output Inputs Productivity
Combined Nonlabor/labor Multifactor Labor
(1) (2) (3) (4)=(1)-(2) (5)=(3)+(4)
Calculated annual change rate (percent) 1976 5.05 2.99 1.55 2.06 3.601977 5.15 4.78 2.42 0.37 2.791978 3.97 2.87 -3.17 1.10 -2.071979 0.05 -3.88 -3.14 3.92 0.781980 -5.65 -1.34 3.34 -4.31 -0.971981 -4.70 -3.58 1.49 -1.11 0.381982 -7.82 -0.51 5.35 -7.32 -1.961983 1.34 0.28 8.92 1.05 9.981984 7.74 7.77 11.22 -0.03 11.181985 -8.57 -2.24 6.92 -6.32 0.601986 -13.12 -11.86 -3.18 -1.26 -4.441987 -0.31 0.42 4.45 -0.73 3.721988 22.35 14.55 10.29 7.79 18.081989 -8.08 -13.18 -13.18 5.10 -8.081990 -5.73 -1.58 3.42 -4.15 -0.731991 -4.21 1.31 4.53 -5.52 -0.991992 -0.06 -0.08 -5.95 0.03 -5.931993 5.22 1.96 3.88 3.26 7.141994 2.10 3.68 4.65 -1.58 3.071995 2.79 4.14 5.37 -1.35 4.021996 3.07 -2.62 -1.88 5.69 3.811997 10.19 15.34 18.76 -5.15 13.61
Generated index number (1975=100)
1975 100.0 100.0 100.0 100.0 100.01976 105.0 103.0 101.5 102.1 103.61977 110.5 107.9 104.0 102.4 106.51978 114.8 111.0 100.7 103.6 104.31979 114.9 106.7 97.5 107.6 105.11980 108.4 105.3 100.8 103.0 104.11981 103.3 101.5 102.3 101.8 104.51982 95.2 101.0 107.8 94.4 102.41983 96.5 101.3 117.4 95.4 112.61984 104.0 109.1 130.6 95.4 125.21985 95.1 106.7 139.6 89.3 126.01986 82.6 94.0 135.1 88.2 120.41987 82.3 94.4 141.2 87.6 124.91988 100.7 108.2 155.7 94.4 147.51989 92.6 93.9 135.2 99.2 135.51990 87.3 92.4 139.8 95.1 134.51991 83.6 93.7 146.1 89.8 133.21992 83.6 93.6 137.4 89.8 125.31993 87.9 95.4 142.8 92.8 134.31994 89.8 98.9 149.4 91.3 138.41995 92.3 103.0 157.4 90.1 144.01996 95.1 100.3 154.5 95.2 149.41997 104.8 115.7 183.5 90.3 169.8

Economic Research Service/USDA Food Manufacturing Productivity and Its Economic Implications / TB-1905 ✺ 41
Appendix table C-9—Gross-output productivity of the beverages industry
Year Output Inputs Productivity
Combined Nonlabor/labor Multifactor Labor
(1) (2) (3) (4)=(1)-(2) (5)=(3)+(4)
Calculated annual change rate (percent) 1976 4.96 -0.07 1.56 5.04 6.601977 5.93 4.61 4.51 1.32 5.831978 5.80 4.34 1.72 1.47 3.191979 -0.84 0.36 -0.51 -1.20 -1.711980 3.97 8.74 11.43 -4.77 6.661981 5.98 7.84 11.32 -1.86 9.461982 6.49 6.92 9.68 -0.43 9.241983 1.26 -3.32 -1.13 4.58 3.451984 -1.09 1.88 5.45 -2.97 2.481985 7.11 7.14 8.20 -0.03 8.181986 3.09 -1.48 3.74 4.57 8.311987 0.75 -2.55 5.96 3.30 9.261988 1.47 -3.03 -1.13 4.50 3.361989 -3.81 -5.80 -3.06 2.00 -1.061990 0.44 0.55 1.50 -0.11 1.401991 4.69 2.46 3.01 2.23 5.241992 5.99 0.55 -1.43 5.44 4.021993 -0.87 -5.39 -8.84 4.53 -4.321994 3.26 4.60 8.19 -1.35 6.851995 4.81 2.89 2.35 1.92 4.271996 0.30 -3.85 -1.95 4.15 2.201997 1.35 9.02 -1.56 -7.67 -9.23
Generated index number (1975=100)
1975 100.0 100.0 100.0 100.0 100.01976 105.0 99.9 101.6 105.0 106.61977 111.2 104.5 106.1 106.4 112.81978 117.6 109.1 108.0 108.0 116.41979 116.7 109.5 107.4 106.7 114.41980 121.3 119.0 119.7 101.6 122.01981 128.5 128.4 133.2 99.7 133.61982 136.9 137.2 146.1 99.3 145.91983 138.6 132.7 144.5 103.8 151.01984 137.1 135.2 152.4 100.7 154.71985 146.8 144.8 164.9 100.7 167.41986 151.4 142.7 171.0 105.3 181.31987 152.5 139.0 181.2 108.8 198.01988 154.7 134.8 179.2 113.7 204.71989 148.9 127.0 173.7 116.0 202.51990 149.5 127.7 176.3 115.8 205.41991 156.5 130.9 181.6 118.4 216.11992 165.9 131.6 179.0 124.8 224.81993 164.5 124.5 163.2 130.5 215.11994 169.8 130.2 176.6 128.7 229.81995 178.0 134.0 180.7 131.2 239.61996 178.5 128.8 177.2 136.7 244.91997 180.9 140.4 174.4 126.2 222.3

42 ✺ Food Manufacturing Productivity and Its Economic Implications / TB-1905 Economic Research Service/USDA
Appendix table C-10—Gross-output productivity of the miscellaneous foods industry
Year Output Inputs Productivity
Combined Nonlabor/labor Multifactor Labor
(1) (2) (3) (4)=(1)-(2) (5)=(3)+(4)
Calculated annual change rate (percent) 1976 25.00 16.14 8.44 8.86 17.301977 10.08 10.62 -1.03 -0.54 -1.571978 1.45 -2.95 -8.05 4.41 -3.651979 -6.07 -2.41 -0.93 -3.66 -4.591980 -0.14 4.33 6.17 -4.47 1.701981 2.51 2.41 1.42 0.10 1.521982 5.60 5.85 5.10 -0.25 4.851983 -2.75 -3.06 0.27 0.31 0.581984 1.80 1.92 2.50 -0.12 2.381985 2.59 4.88 7.89 -2.28 5.611986 6.14 2.10 4.28 4.04 8.321987 4.18 1.00 -7.73 3.18 -4.551988 -1.64 -3.93 -2.32 2.30 -0.031989 -4.69 -0.27 -1.55 -4.41 -5.971990 4.12 1.77 -4.75 2.35 -2.401991 0.72 4.17 5.95 -3.44 2.501992 5.85 1.96 -5.49 3.89 -1.601993 3.48 -3.52 -1.71 7.00 5.291994 0.88 5.27 4.89 -4.39 0.501995 3.65 2.74 0.07 0.91 0.981996 -2.19 -5.03 -8.74 2.84 -5.911997 0.42 11.15 11.94 -10.72 1.21
Generated index number (1975=100)
1975 100.0 100.0 100.0 100.0 100.01976 125.0 116.1 108.4 108.9 117.31977 137.6 128.5 107.3 108.3 115.51978 139.6 124.7 98.7 113.0 111.21979 131.1 121.7 97.8 108.9 106.11980 130.9 126.9 103.8 104.0 107.91981 134.2 130.0 105.3 104.1 109.61982 141.7 137.6 110.6 103.9 114.91983 137.8 133.4 110.9 104.2 115.61984 140.3 135.9 113.7 104.1 118.31985 144.0 142.6 122.7 101.7 124.91986 152.8 145.6 127.9 105.8 135.31987 159.2 147.0 118.0 109.2 129.21988 156.6 141.2 115.3 111.7 129.21989 149.2 140.9 113.5 106.8 121.41990 155.4 143.3 108.1 109.3 118.51991 156.5 149.3 114.5 105.5 121.51992 165.7 152.2 108.3 109.6 119.61993 171.4 146.9 106.4 117.3 125.91994 172.9 154.6 111.6 112.1 126.51995 179.3 158.9 111.7 113.2 127.81996 175.3 150.9 101.9 116.4 120.21997 176.1 167.7 114.1 103.9 121.7

Economic Research Service/USDA Food Manufacturing Productivity and Its Economic Implications / TB-1905 ✺ 43
Appendix table C-11—Net-output productivity of the food manufacturing sector
Year Output Inputs Productivity
Combined Nonlabor/labor Multifactor Labor
(1) (2) (3) (4)=(1)-(2) (5)=(3)+(4)
Calculated annual change rate (percent) 1976 12.82 -1.39 -2.92 14.21 11.301977 1.40 -2.10 -2.54 3.50 0.961978 2.83 4.28 2.15 -1.45 0.701979 -0.08 3.80 2.87 -3.87 -1.001980 1.67 8.94 10.02 -7.27 2.751981 1.56 5.77 7.63 -4.21 3.421982 10.08 2.60 6.53 7.48 14.011983 3.09 -6.18 -4.05 9.27 5.221984 1.08 4.12 4.82 -3.05 1.771985 8.03 -1.78 0.04 9.82 9.851986 5.43 -8.09 -7.62 13.52 5.891987 6.32 2.29 -2.12 4.03 1.921988 1.72 1.91 -0.19 -0.19 -0.371989 -2.88 -2.73 -3.58 -0.14 -3.721990 3.93 1.28 -1.56 2.65 1.101991 2.71 -1.69 -2.43 4.40 1.961992 8.61 -0.85 -4.94 9.46 4.521993 2.69 -4.46 -5.86 7.16 1.301994 2.70 5.31 4.32 -2.61 1.711995 3.73 -0.16 -0.79 3.89 3.101996 -6.16 2.25 2.82 -8.41 -5.591997 7.41 5.64 4.15 1.77 5.92
Generated index number (1975=100)
1975 100.0 100.0 100.0 100.0 100.01976 112.8 98.6 97.1 114.2 111.31977 114.4 96.5 94.6 118.2 112.41978 117.6 100.7 96.6 116.5 113.11979 117.5 104.5 99.4 112.0 112.01980 119.5 113.8 109.4 103.8 115.11981 121.4 120.4 117.7 99.5 119.01982 133.6 123.5 125.4 106.9 135.71983 137.7 115.9 120.3 116.8 142.81984 139.2 120.7 126.1 113.3 145.31985 150.4 118.5 126.2 124.4 159.61986 158.6 108.9 116.6 141.2 169.01987 168.6 111.4 114.1 146.9 172.31988 171.5 113.5 113.9 146.6 171.61989 166.6 110.4 109.8 146.4 165.31990 173.1 111.9 108.1 150.3 167.11991 177.8 110.0 105.5 156.9 170.31992 193.1 109.0 100.3 171.7 178.01993 198.3 104.2 94.4 184.0 180.41994 203.7 109.7 98.5 179.2 183.51995 211.3 109.5 97.7 186.2 189.11996 198.3 112.0 100.4 170.6 178.61997 212.9 118.3 104.6 173.6 189.1

44 ✺ Food Manufacturing Productivity and Its Economic Implications / TB-1905 Economic Research Service/USDA
Appendix table C-12—Net-output productivity of the meat products industry
Year Output Inputs Productivity
Combined Nonlabor/labor Multifactor Labor
(1) (2) (3) (4)=(1)-(2) (5)=(3)+(4)
Calculated annual change rate (percent) 1976 6.65 -0.86 -2.79 7.51 4.731977 -4.93 -2.24 -1.60 -2.69 -4.291978 3.52 4.58 1.76 -1.06 0.701979 1.23 -0.27 -1.01 1.51 0.501980 -2.17 7.84 5.49 -10.01 -4.521981 -2.34 1.10 3.31 -3.44 -0.131982 8.24 5.26 5.37 2.99 8.361983 -1.75 -6.90 -5.66 5.15 -0.501984 3.93 -0.82 2.00 4.75 6.741985 12.20 -0.74 -1.12 12.93 11.821986 1.54 -4.22 -8.53 5.76 -2.771987 0.93 5.15 -4.06 -4.22 -8.281988 4.83 3.50 -1.98 1.33 -0.661989 2.50 -0.20 -3.12 2.70 -0.421990 8.90 4.23 -0.88 4.66 3.781991 -5.16 1.23 -1.19 -6.39 -7.581992 9.64 1.14 -4.60 8.50 3.901993 6.14 -1.89 -5.85 8.02 2.171994 7.18 5.62 2.12 1.56 3.681995 11.86 0.23 1.37 11.63 13.001996 -13.10 3.95 3.09 -17.04 -13.951997 25.00 7.10 1.95 17.89 19.84
Generated index number (1975=100)
1975 100.0 100.0 100.0 100.0 100.01976 106.7 99.1 97.2 107.5 104.71977 101.4 96.9 95.7 104.6 100.21978 105.0 101.4 97.3 103.5 100.91979 106.3 101.1 96.4 105.1 101.41980 104.0 109.0 101.6 94.6 96.91981 101.5 110.2 105.0 91.3 96.71982 109.9 116.0 110.7 94.0 104.81983 108.0 108.0 104.4 98.9 104.31984 112.2 107.1 106.5 103.6 111.31985 125.9 106.3 105.3 117.0 124.51986 127.8 101.8 96.3 123.7 121.01987 129.0 107.1 92.4 118.5 111.01988 135.2 110.8 90.6 120.0 110.31989 138.6 110.6 87.7 123.3 109.81990 151.0 115.3 87.0 129.0 114.01991 143.2 116.7 85.9 120.8 105.31992 157.0 118.0 82.0 131.1 109.41993 166.6 115.8 77.2 141.6 111.81994 178.6 122.3 78.8 143.8 115.91995 199.7 122.6 79.9 160.5 131.01996 173.6 127.4 82.4 133.2 112.71997 217.0 136.5 84.0 157.0 135.1

Economic Research Service/USDA Food Manufacturing Productivity and Its Economic Implications / TB-1905 ✺ 45
Appendix table C-13—Net-output productivity of the dairy products industry
Year Output Inputs Productivity
Combined Nonlabor/labor Multifactor Labor
(1) (2) (3) (4)=(1)-(2) (5)=(3)+(4)
Calculated annual change rate (percent) 1976 9.17 -4.94 -4.50 14.10 9.601977 2.61 -3.39 0.63 6.01 6.631978 -3.26 -1.93 -2.50 -1.33 -3.831979 5.65 0.20 -2.09 5.45 3.351980 1.02 6.93 10.02 -5.91 4.111981 0.78 7.21 7.55 -6.43 1.121982 3.56 0.36 4.87 3.20 8.081983 7.88 -2.72 -0.91 10.60 9.701984 -0.01 1.93 -0.49 -1.93 -2.421985 4.31 -1.32 -0.73 5.64 4.911986 11.55 -7.17 -7.53 18.72 11.191987 7.39 2.65 -1.44 4.74 3.301988 0.74 2.65 -2.11 -1.91 -4.021989 -5.34 -2.16 1.17 -3.18 -2.001990 1.77 1.71 1.82 0.06 1.881991 4.25 -2.19 -1.74 6.44 4.701992 16.10 -0.97 -5.90 17.07 11.161993 -3.23 -4.62 -3.81 1.39 -2.411994 -4.25 4.58 8.59 -8.83 -0.241995 -0.38 0.72 -1.41 -1.10 -2.521996 -4.39 1.94 2.84 -6.33 -3.501997 9.89 8.72 7.95 1.17 9.12
Generated index number (1975=100)
1975 100.0 100.0 100.0 100.0 100.01976 109.2 95.1 95.5 114.1 109.61977 112.0 91.8 96.1 121.0 116.91978 108.4 90.1 93.7 119.4 112.41979 114.5 90.2 91.7 125.9 116.21980 115.7 96.5 100.9 118.4 120.91981 116.5 103.4 108.5 110.8 122.31982 120.7 103.8 113.8 114.3 132.21983 130.2 101.0 112.8 126.5 145.01984 130.2 102.9 112.3 124.0 141.51985 135.8 101.6 111.4 131.0 148.41986 151.5 94.3 103.0 155.5 165.01987 162.7 96.8 101.6 162.9 170.51988 163.9 99.4 99.4 159.8 163.61989 155.2 97.2 100.6 154.7 160.31990 157.9 98.9 102.4 154.8 163.41991 164.6 96.7 100.6 164.8 171.01992 191.1 95.8 94.7 192.9 190.11993 184.9 91.3 91.1 195.6 185.51994 177.1 95.5 98.9 178.3 185.11995 176.4 96.2 97.5 176.4 180.41996 168.7 98.1 100.3 165.2 174.11997 185.4 106.6 108.3 167.1 190.0

46 ✺ Food Manufacturing Productivity and Its Economic Implications / TB-1905 Economic Research Service/USDA
Appendix table C-14—Net-output productivity of the preserved fruits and vegetables industry
Year Output Inputs Productivity
Combined Nonlabor/labor Multifactor Labor
(1) (2) (3) (4)=(1)-(2) (5)=(3)+(4)
Calculated annual change rate (percent) 1976 15.86 -3.52 -0.92 19.38 18.451977 11.11 1.44 -5.11 9.67 4.571978 0.67 3.30 0.43 -2.63 -2.211979 -3.51 6.61 5.87 -10.13 -4.261980 -3.12 8.65 12.24 -11.77 0.481981 2.28 5.14 7.83 -2.86 4.971982 17.00 1.89 8.68 15.11 23.791983 3.68 -5.42 -3.57 9.10 5.531984 5.35 4.41 1.48 0.94 2.421985 6.47 -0.41 1.54 6.87 8.421986 7.33 -7.50 -5.72 14.83 9.111987 0.07 1.58 3.66 -1.51 2.151988 2.97 2.44 1.92 0.53 2.451989 4.56 -1.39 -4.24 5.95 1.711990 0.49 3.12 0.01 -2.63 -2.621991 6.82 0.20 -1.42 6.62 5.211992 2.98 -0.42 0.49 3.40 3.881993 2.48 -4.53 -3.62 7.01 3.391994 1.91 5.23 4.91 -3.31 1.601995 -2.15 -0.66 -2.56 -1.49 -4.041996 -3.40 0.90 3.17 -4.30 -1.131997 5.44 -3.19 0.07 8.63 8.70
Generated index number (1975=100)
1975 100.0 100.0 100.0 100.0 100.01976 115.9 96.5 99.1 119.4 118.51977 128.7 97.9 94.0 130.9 123.91978 129.6 101.1 94.4 127.5 121.11979 125.0 107.8 100.0 114.6 116.01980 121.1 117.1 112.2 101.1 116.51981 123.9 123.1 121.0 98.2 122.31982 145.0 125.5 131.5 113.0 151.41983 150.3 118.7 126.8 123.3 159.81984 158.3 123.9 128.7 124.5 163.71985 168.6 123.4 130.7 133.0 177.41986 180.9 114.1 123.2 152.8 193.61987 181.1 115.9 127.7 150.5 197.81988 186.4 118.8 130.1 151.3 202.61989 194.9 117.1 124.6 160.3 206.11990 195.9 120.8 124.6 156.0 200.71991 209.3 121.0 122.9 166.4 211.11992 215.5 120.5 123.5 172.0 219.31993 220.8 115.0 119.0 184.1 226.81994 225.1 121.0 124.8 178.0 230.41995 220.2 120.3 121.7 175.3 221.11996 212.7 121.3 125.5 167.8 218.61997 224.3 117.5 125.6 182.3 237.6

Economic Research Service/USDA Food Manufacturing Productivity and Its Economic Implications / TB-1905 ✺ 47
Appendix table C-15—Net-output productivity of the grain mill products industry
Year Output Inputs Productivity
Combined Nonlabor/labor Multifactor Labor
(1) (2) (3) (4)=(1)-(2) (5)=(3)+(4)
Calculated annual change rate (percent) 1976 11.74 -1.33 -0.33 13.07 12.731977 3.69 0.63 3.49 3.06 6.551978 -2.92 6.19 4.27 -9.11 -4.841979 4.60 1.35 0.47 3.25 3.721980 5.06 11.20 13.04 -6.14 6.901981 2.82 8.99 11.72 -6.17 5.551982 4.94 1.79 8.13 3.15 11.291983 7.62 -9.16 -8.11 16.78 8.671984 0.36 9.49 14.66 -9.14 5.521985 10.91 -1.42 2.49 12.33 14.831986 4.34 -10.56 -9.97 14.90 4.921987 10.98 4.33 -3.19 6.65 3.461988 3.13 4.02 1.74 -0.88 0.861989 0.91 -0.64 -0.83 1.55 0.711990 4.79 2.10 1.77 2.69 4.461991 3.06 -1.86 -1.66 4.92 3.261992 7.58 -0.07 -5.96 7.65 1.691993 5.41 -4.55 -4.98 9.96 4.981994 2.37 6.48 7.91 -4.11 3.801995 8.59 0.90 -1.33 7.69 6.361996 -25.64 3.22 6.21 -28.87 -22.651997 8.83 8.28 9.16 0.55 9.72
Generated index number (1975=100)
1975 100.0 100.0 100.0 100.0 100.01976 111.7 98.7 99.7 113.1 112.71977 115.9 99.3 103.1 116.5 120.11978 112.5 105.4 107.6 105.9 114.31979 117.7 106.9 108.1 109.3 118.61980 123.6 118.8 122.2 102.6 126.71981 127.1 129.5 136.5 96.3 133.81982 133.4 131.8 147.6 99.3 148.91983 143.5 119.8 135.6 116.0 161.81984 144.1 131.1 155.5 105.4 170.71985 159.8 129.3 159.4 118.4 196.01986 166.7 115.6 143.5 136.1 205.71987 185.0 120.6 138.9 145.1 212.81988 190.8 125.5 141.3 143.8 214.61989 192.5 124.7 140.1 146.0 216.21990 201.8 127.3 142.6 150.0 225.81991 207.9 124.9 140.2 157.3 233.11992 223.7 124.8 131.9 169.4 237.11993 235.8 119.2 125.3 186.3 248.91994 241.4 126.9 135.2 178.6 258.41995 262.1 128.0 133.4 192.3 274.81996 194.9 132.1 141.7 136.8 212.51997 212.1 143.1 154.7 137.6 233.2

48 ✺ Food Manufacturing Productivity and Its Economic Implications / TB-1905 Economic Research Service/USDA
Appendix table C-16—Net-output productivity of the bakery products industry
Year Output Inputs Productivity
Combined Nonlabor/labor Multifactor Labor
(1) (2) (3) (4)=(1)-(2) (5)=(3)+(4)
Calculated annual change rate (percent) 1976 13.17 -0.89 -4.75 14.06 9.311977 -2.30 -7.30 1.54 4.99 6.531978 -1.64 3.45 3.10 -5.10 -1.991979 0.52 1.79 -2.98 -1.27 -4.251980 -0.18 7.43 6.59 -7.61 -1.021981 4.59 3.13 5.67 1.46 7.131982 7.68 0.74 11.12 6.95 18.071983 1.67 -8.26 -4.76 9.93 5.171984 3.20 7.11 5.74 -3.91 1.841985 11.49 -1.34 0.67 12.83 13.501986 2.55 -6.81 -4.63 9.36 4.731987 10.06 4.70 -4.73 5.36 0.631988 -4.59 2.84 2.08 -7.43 -5.351989 -4.96 -2.85 -1.29 -2.11 -3.401990 1.55 0.13 -0.31 1.42 1.101991 2.64 -0.20 -1.76 2.84 1.071992 8.82 0.10 -4.74 8.72 3.981993 2.78 -3.41 -4.91 6.19 1.281994 4.98 5.92 2.66 -0.94 1.721995 0.08 0.51 -0.46 -0.42 -0.891996 -2.63 1.63 4.98 -4.26 0.711997 6.17 4.32 6.97 1.85 8.82
Generated index number (1975=100)
1975 100.0 100.0 100.0 100.0 100.01976 113.2 99.1 95.2 114.1 109.31977 110.6 91.9 96.7 119.8 116.41978 108.7 95.0 99.7 113.7 114.11979 109.3 96.8 96.7 112.2 109.31980 109.1 103.9 103.1 103.7 108.21981 114.1 107.2 109.0 105.2 115.91982 122.9 108.0 121.1 112.5 136.81983 124.9 99.1 115.3 123.7 143.91984 128.9 106.1 121.9 118.8 146.51985 143.8 104.7 122.8 134.1 166.31986 147.4 97.5 117.1 146.6 174.21987 162.2 102.1 111.5 154.5 175.31988 154.8 105.0 113.9 143.0 165.91989 147.1 102.0 112.4 140.0 160.31990 149.4 102.2 112.0 142.0 162.01991 153.3 102.0 110.1 146.0 163.81992 166.9 102.1 104.8 158.7 170.31993 171.5 98.6 99.7 168.6 172.51994 180.0 104.4 102.3 167.0 175.41995 180.2 104.9 101.9 166.3 173.91996 175.4 106.7 106.9 159.2 175.11997 186.3 111.3 114.4 162.1 190.5

Economic Research Service/USDA Food Manufacturing Productivity and Its Economic Implications / TB-1905 ✺ 49
Appendix table C-17—Net-output productivity of the sugar and confections industry
Year Output Inputs Productivity
Combined Nonlabor/labor Multifactor Labor
(1) (2) (3) (4)=(1)-(2) (5)=(3)+(4)
Calculated annual change rate (percent) 1976 10.76 0.42 -7.01 10.34 3.341977 5.78 -2.09 -2.02 7.86 5.841978 -1.54 -0.84 2.17 -0.69 1.481979 -4.58 4.28 6.17 -8.86 -2.691980 19.86 8.74 10.80 11.12 21.921981 -12.22 5.80 4.51 -18.02 -13.511982 13.24 -0.54 3.06 13.78 16.841983 2.44 -5.10 -4.09 7.54 3.441984 1.11 4.06 3.79 -2.95 0.841985 7.21 -4.14 0.67 11.35 12.021986 3.71 -8.69 -6.84 12.40 5.561987 4.48 1.52 0.87 2.96 3.841988 0.83 1.01 1.30 -0.18 1.121989 -1.97 -2.82 -3.67 0.85 -2.821990 1.66 2.43 -0.50 -0.77 -1.271991 6.03 -2.29 -0.69 8.32 7.631992 8.22 -0.42 -0.70 8.64 7.941993 0.12 -3.45 -5.38 3.57 -1.811994 -0.77 6.26 5.85 -7.04 -1.181995 1.89 -0.55 -0.48 2.44 1.961996 2.99 1.37 2.95 1.62 4.571997 5.85 1.27 1.60 4.59 6.19
Generated index number (1975=100)
1975 100.0 100.0 100.0 100.0 100.01976 110.8 100.4 93.0 110.3 103.31977 117.2 98.3 91.1 119.0 109.41978 115.4 97.5 93.1 118.2 111.01979 110.1 101.7 98.8 107.7 108.01980 131.9 110.5 109.5 119.7 131.71981 115.8 117.0 114.4 98.1 113.91982 131.2 116.3 117.9 111.7 133.11983 134.4 110.4 113.1 120.1 137.71984 135.8 114.9 117.4 116.5 138.81985 145.6 110.1 118.2 129.8 155.51986 151.1 100.6 110.1 145.9 164.11987 157.8 102.1 111.1 150.2 170.41988 159.1 103.1 112.5 149.9 172.41989 156.0 100.2 108.4 151.2 167.51990 158.6 102.7 107.8 150.0 165.41991 168.2 100.3 107.1 162.5 178.01992 182.0 99.9 106.3 176.5 192.11993 182.2 96.4 100.6 182.8 188.61994 180.8 102.5 106.5 170.0 186.41995 184.2 101.9 106.0 174.1 190.01996 189.7 103.3 109.1 176.9 198.71997 200.8 104.6 110.9 185.1 211.0

50 ✺ Food Manufacturing Productivity and Its Economic Implications / TB-1905 Economic Research Service/USDA
Appendix table C-18—Net-output productivity of the fats and oils industry
Year Output Inputs Productivity
Combined Nonlabor/labor Multifactor Labor
(1) (2) (3) (4)=(1)-(2) (5)=(3)+(4)
Calculated annual change rate (percent) 1976 24.39 -0.38 -1.82 24.77 22.941977 -33.32 -1.52 -3.88 -31.79 -35.681978 33.69 8.67 2.64 25.02 27.661979 14.32 3.51 4.24 10.82 15.061980 -11.19 8.20 12.88 -19.40 -6.511981 -18.90 7.87 12.95 -26.77 -13.831982 11.18 1.30 7.15 9.88 17.041983 10.98 -9.47 -0.83 20.45 19.621984 -22.78 5.06 8.50 -27.83 -19.341985 -0.30 -7.07 2.09 6.76 8.861986 4.12 -10.85 -2.17 14.97 12.811987 20.34 -3.17 0.86 23.50 24.371988 14.15 0.90 -3.36 13.24 9.881989 -23.30 -4.75 -4.75 -18.55 -23.301990 17.56 -1.93 3.06 19.50 22.561991 -10.54 -4.08 -0.85 -6.47 -7.321992 -0.74 -3.44 -9.31 2.70 -6.611993 7.71 -7.20 -5.28 14.91 9.631994 0.67 3.21 4.19 -2.54 1.641995 5.01 -2.43 -1.20 7.43 6.241996 -11.61 0.78 1.52 -12.39 -10.861997 10.34 6.33 9.75 4.01 13.76
Generated index number (1975=100)
1975 100.0 100.0 100.0 100.0 100.01976 124.4 99.6 98.2 124.8 122.91977 82.9 98.1 94.4 85.1 79.11978 110.9 106.6 96.9 106.4 101.01979 126.8 110.4 101.0 117.9 116.21980 112.6 119.4 114.0 95.0 108.61981 91.3 128.8 128.7 69.6 93.61982 101.5 130.5 137.9 76.5 109.51983 112.7 118.1 136.8 92.1 131.01984 87.0 124.1 148.4 66.5 105.71985 86.7 115.3 151.5 71.0 115.01986 90.3 102.8 148.3 81.6 129.81987 108.7 99.6 149.5 100.8 161.41988 124.1 100.5 144.5 114.1 177.31989 95.2 95.7 137.6 92.9 136.01990 111.9 93.8 141.9 111.1 166.71991 100.1 90.0 140.6 103.9 154.51992 99.3 86.9 127.6 106.7 144.31993 107.0 80.7 120.8 122.6 158.21994 107.7 83.3 125.9 119.5 160.81995 113.1 81.2 124.4 128.3 170.81996 100.0 81.9 126.3 112.4 152.31997 110.3 87.0 138.6 116.9 173.2

Economic Research Service/USDA Food Manufacturing Productivity and Its Economic Implications / TB-1905 ✺ 51
Appendix table C-19—Net-output productivity of the beverages industry
Year Output Inputs Productivity
Combined Nonlabor/labor Multifactor Labor
(1) (2) (3) (4)=(1)-(2) (5)=(3)+(4)
Calculated annual change rate (percent) 1976 8.92 -0.01 1.62 8.94 10.561977 7.08 -1.65 -1.75 8.74 6.981978 6.75 6.93 4.31 -0.18 4.131979 -3.38 6.30 5.42 -9.67 -4.251980 2.77 10.78 13.47 -8.01 5.461981 5.68 6.70 10.19 -1.03 9.161982 12.62 4.82 7.58 7.80 15.381983 3.90 -5.42 -3.23 9.32 6.091984 -2.26 3.60 7.17 -5.86 1.311985 8.53 -1.98 -0.91 10.51 9.601986 5.72 -9.82 -4.60 15.54 10.941987 3.22 -2.09 6.42 5.31 11.731988 3.21 -0.76 1.13 3.97 5.111989 -3.34 -6.20 -3.45 2.86 -0.601990 0.16 -2.74 -1.79 2.90 1.111991 6.74 -4.96 -4.41 11.70 7.291992 9.71 -3.96 -5.94 13.67 7.731993 -1.87 -6.74 -10.20 4.87 -5.331994 5.33 3.18 6.77 2.15 8.921995 3.64 -1.09 -1.63 4.73 3.101996 0.93 1.64 3.54 -0.71 2.831997 0.08 7.16 -3.42 -7.07 -10.50
Generated index number (1975=100)
1975 100.0 100.0 100.0 100.0 100.01976 108.9 100.0 101.6 108.9 110.61977 116.6 98.3 99.8 118.5 118.31978 124.5 105.1 104.1 118.2 123.21979 120.3 111.8 109.8 106.8 117.91980 123.6 123.8 124.6 98.2 124.41981 130.7 132.1 137.3 97.2 135.81982 147.2 138.5 147.7 104.8 156.71983 152.9 131.0 142.9 114.6 166.21984 149.4 135.7 153.2 107.9 168.41985 162.2 133.0 151.8 119.2 184.51986 171.5 120.0 144.8 137.8 204.71987 177.0 117.4 154.1 145.1 228.71988 182.7 116.5 155.8 150.8 240.41989 176.6 109.3 150.4 155.1 239.01990 176.8 106.3 147.7 159.6 241.61991 188.8 101.0 141.2 178.3 259.21992 207.1 97.0 132.8 202.7 279.31993 203.2 90.5 119.3 212.6 264.41994 214.1 93.4 127.4 217.2 288.01995 221.9 92.4 125.3 227.4 297.01996 223.9 93.9 129.7 225.8 305.41997 224.1 100.6 125.3 209.8 273.3

52 ✺ Food Manufacturing Productivity and Its Economic Implications / TB-1905 Economic Research Service/USDA
Appendix table C-20—Net-output productivity of the miscellaneous foods industry
Year Output Inputs Productivity
Combined Nonlabor/labor Multifactor Labor
(1) (2) (3) (4)=(1)-(2) (5)=(3)+(4)
Calculated annual change rate (percent) 1976 25.42 -1.24 -8.93 26.66 17.721977 -3.81 -6.43 -18.08 2.62 -15.461978 8.70 5.73 0.63 2.97 3.601979 -4.95 11.97 13.45 -16.92 -3.471980 1.78 8.03 9.87 -6.25 3.621981 10.01 7.69 6.69 2.32 9.011982 10.51 1.19 0.44 9.32 9.761983 -3.22 -3.96 -0.63 0.74 0.111984 4.24 3.50 4.08 0.75 4.831985 3.29 -1.33 1.68 4.62 6.301986 7.25 -7.60 -5.42 14.85 9.431987 12.53 4.80 -3.93 7.73 3.811988 -2.00 1.50 3.11 -3.49 -0.391989 -13.57 -3.48 -4.76 -10.09 -14.851990 10.95 2.58 -3.93 8.37 4.441991 -1.45 -1.56 0.22 0.11 0.331992 10.16 0.76 -6.68 9.40 2.721993 9.26 -4.12 -2.31 13.38 11.071994 0.74 6.75 6.37 -6.01 0.361995 3.12 0.04 -2.63 3.08 0.451996 0.37 2.91 -0.81 -2.54 -3.351997 -1.84 9.96 10.75 -11.79 -1.05
Generated index number (1975=100)
1975 100.0 100.0 100.0 100.0 100.01976 125.4 98.8 91.1 126.7 117.71977 120.6 92.4 74.6 130.0 99.51978 131.1 97.7 75.1 133.8 103.11979 124.6 109.4 85.2 111.2 99.51980 126.9 118.2 93.6 104.2 103.11981 139.6 127.3 99.8 106.7 112.41982 154.2 128.8 100.3 116.6 123.41983 149.3 123.7 99.6 117.5 123.51984 155.6 128.0 103.7 118.3 129.51985 160.7 126.3 105.5 123.8 137.71986 172.4 116.7 99.7 142.2 150.61987 194.0 122.3 95.8 153.2 156.41988 190.1 124.1 98.8 147.8 155.81989 164.3 119.8 94.1 132.9 132.61990 182.3 122.9 90.4 144.0 138.51991 179.6 121.0 90.6 144.2 139.01992 197.9 121.9 84.5 157.7 142.71993 216.2 116.9 82.6 178.9 158.51994 217.8 124.8 87.8 168.1 159.11995 224.6 124.8 85.5 173.3 159.81996 225.4 128.5 84.8 168.9 154.51997 221.3 141.3 94.0 149.0 152.9