Embed Size (px)
Citation preview
i
DEPARTMENT OF HEALTH AND HUMAN SERVICES Food and Drug Administration
Food Labeling:
Calorie Labeling of Articles of Food in Vending Machines
Regulatory Impact Analysis Docket No. FDA-2011-F-0171
Office of Regulations, Policy and Social Science Center for Food Safety and Applied Nutrition
NOVEMBER 2014
ii
SUMMARY: The Food and Drug Administration is finalizing requirements for providing
calorie information for certain articles of food sold from vending machines to implement the
vending machine labeling provisions of the Patient Protection and Affordable Care Act of 2010
(Affordable Care Act). The Affordable Care Act, in part, amended the Federal Food, Drug and
Cosmetic Act (FD&C Act) to, among other things, require that for an article of food sold from a
vending machine that does not permit a prospective purchaser to examine the Nutrition Facts
Panel before purchasing the article, or does not otherwise provide visible nutrition information at
the point of purchase, and is operated by a person engaged in the business of owning or operating
20 or more vending machines, the vending machine operator must declare the number of calories
for the article of food. Vending machine operators not subject to the requirements of the
Affordable Care Act may elect to be subject to the Federal requirements by registering with FDA.
This document analyzes the benefits and costs of the Final Rule: Food Labeling; Calorie Labeling
of Articles of Food in Vending Machines [Docket No. FDA-2011-F-0171].
iii
TABLE OF CONTENTS I. Introduction .....................................................................................................................................1
A. Summary of Costs and Benefits of the Final Requirements and Regulatory Options .............3 Summary of Costs .............................................................................................................3 Summary of Benefits ........................................................................................................4 Summary of Costs and Benefits of Menu Labeling and Vending Machine Rules .................................................................................................................................7
B. Need for This Regulation .........................................................................................................8 C. Comments on the Preliminary Regulatory Impact Analysis in the Proposed Rule
and Our Responses ................................................................................................................10 Comments and Responses...............................................................................................11
D. Coverage of the final rule and industry overview. .................................................................17 II. Costs and Benefits of Regulatory Options: Detailed Analysis ....................................................19
A. Baseline: No New Regulatory Action ....................................................................................19 B. Option 1: Final Rule ..............................................................................................................20
Costs ................................................................................................................................22 Benefits ...........................................................................................................................40 Uncertainty of Costs and Benefits ..................................................................................44
C. Option 2: Similar to the Final Rule, But With an Additional Year of Compliance Time Only for Vending Machine Operators with Less Than $500,000 in Annual Revenue.................................................................................................................................44
Costs ................................................................................................................................44 Benefits ...........................................................................................................................45
D. Option 3: Similar to the Final Rule, But Estimating the Cost of Allowing Machine Signage to Display All Products Vended by the Operator, Instead of Machine-Specific Signage....................................................................................................................45
Costs ................................................................................................................................45 Benefits ...........................................................................................................................48
III. Regulatory Flexibility Analysis ..................................................................................................48 A. Introduction ............................................................................................................................48 B. Economic Effects on Small Entities .......................................................................................49 C. Costs to small entities .............................................................................................................49 D. Regulatory Options ................................................................................................................50 E. Summary.................................................................................................................................50
IV. Unfunded Mandates ....................................................................................................................50 V. Technical Appendix .....................................................................................................................52 VI. References...................................................................................................................................63
1
I. INTRODUCTION
We have examined the impacts of the final rule under Executive Orders 13563 and
12866, the Regulatory Flexibility Act (5 U.S.C. 601-612), and the Unfunded Mandates Reform
Act of 1995 (Public Law 104-4). Executive Orders 13563 and 12866 direct agencies to assess
all costs and benefits of available regulatory alternatives and, if regulation is necessary, to select
regulatory approaches that maximize net benefits (including potential economic, environmental,
public health and safety effects, distributive impacts, and equity). Executive Order 13563
emphasizes the importance of quantifying both costs and benefits, of reducing costs, of
harmonizing rules, and of promoting flexibility. The Office of Management and Budget (OMB)
has designated this final rule as an “economically significant regulatory action” under section
3(f) of Executive Order 12866, and accordingly OMB has reviewed this rule.
In particular, Executive Order 12866 directs each agency engaged in rulemaking to
"identify the problem that it intends to address"-- that is, the essential purpose of the rule. As a
separate step in its rulemaking, Executive Order 12866 directs the agency to "assess both the
costs and the benefits of the intended regulation ... , recognizing that some costs and benefits are
difficult to quantify." Executive Order 13563 confirms that "each agency is directed to use the
best available techniques to quantify anticipated present and future benefits and costs as
accurately as possible. Where appropriate and permitted by law, each agency may consider (and
discuss qualitatively) values that are difficult or impossible to quantify.” Here, the essential
purpose of the rule is to make calorie information for covered vending machine foods available
to consumers in a direct, accessible, and consistent manner to enable consumers to make
informed and healthful dietary choices. The following analysis of anticipated costs and benefits
from the promulgation of the rule does not alter this fundamental purpose.
2
The Regulatory Flexibility Act requires agencies to analyze regulatory options that
would minimize any significant impact of a rule on small entities. Using the Small Business
Administration (SBA) definition of small vending machine operators as classified by the North
American Industry Classification System (NAICS 45421), we estimate that the final rule will
affect a significant number of vending machine operators who are small businesses. As directed
by section 4205 of the Affordable Care Act, the final rule applies to vending machine operators
that own or operate 20 or more vending machines and vending machine operators that voluntarily
register with FDA to become subject to the Federal requirements. However, according to data
from the Vending Times Census and from the National Automatic Merchandising Association
(NAMA), the average annual revenue per machine is less than $8,000 (Refs. 1;2;3). A vending
machine operator with only 20 machines may have annual vending machine revenue of less than
$160,000. To exceed the SBA’s definition of a small vending machine operator, an operator
would need at least $10 million in annual revenue (Ref. 4). This suggests that an operator with
revenue exclusively from vending machine sales would need more than 1,250 machines to
exceed the definition of small business. Based on the latest available U.S. Economic Census
data that breaks down operators by revenue, we project that 97 percent of operators selling
covered vending machine food that identify primarily as vending machine operators engaged in
the business of owning or operating 20 or more vending machines would qualify as small
businesses as defined by SBA (Ref. 4). Therefore, we believe that the final rule will have a
significant economic impact on a substantial number of small entities, and we have accordingly
analyzed regulatory options to minimize the impact. We have crafted the final rule to provide
flexibility for compliance.

3
Section 202(a) of the Unfunded Mandates Reform Act of 1995 requires that agencies
prepare a written statement, which includes an assessment of anticipated costs and benefits,
before finalizing “any rule that includes any Federal mandate that may result in the expenditure
by State, local, and tribal governments, in the aggregate, or by the private sector, of
$100,000,000 or more (adjusted annually for inflation) in any one year.” The current threshold
after adjustment for inflation is $141 million, using the most current (2013) Implicit Price
Deflator for the Gross Domestic Product. We do not expect this final rule to result in any 1-
year expenditure that would meet or exceed this amount.
A. SUMMARY OF COSTS AND BENEFITS OF THE FINAL REQUIREMENTS AND REGULATORY OPTIONS
Summary of Costs
Costs of complying with the final rule include calorie analysis for some foods and calorie
declaration signage in, on, or adjacent to each vending machine operated by an operator with 20
or more machines. Costs values are estimated with the use of publicly available data tracking
total operators, machines, product types, and revenue counts in the vending industry. Estimated
costs are organized accordingly: cost of calorie analysis for foods in need of such analysis;
initial costs of calorie declaration signage for non-bulk machines, which include that of sign
template design, sign creation, and installation; recurring costs of calorie declaration signage for
non-bulk machines, which include that of updating sign information and physical replacement;
costs for legal review and consultation; and the cost of declaring calories using stickers on bulk
machines1.
1 We expect that applying a sticker to each individual bulk machine in order to declare calorie content is more cost effective, and will consequently be the method of choice for bulk machine operators. The low cost is driven by the small number of bulk machines at any given location, the lack of a space constraint for a sticker to be applied to the faces of bulk machines, and the low rate of change in product mix of bulk machines. Thus, the use of stickers will likely be the method of choice for bulk machine operators.
4
Summary of Primary Cost Estimate
Calorie analysis will most likely only be needed for certain vending machine foods (e.g.
refrigerated, frozen, can/bowl, or other shelf-stable main meal items, hot cup beverages, and
cold cup beverages). We estimate the mean total cost of calorie analysis to be $0.54 million,
with a range of $0.27 million to $0.81 million. We estimate the mean initial cost of calorie
declaration signage to be $40.1 million, with a range of $33.6 million to $46.9 million.
Recurring updates to signage will only likely be required for non-bulk, non-beverage machines
since the product mixes of these machines are changed regularly. We estimate the mean annual
cost of sign updates and replacement to be $32.6 million, with a range of $14.5 million to $72.4
million. We estimate the mean cost of legal review of the rule by vending machine operators to
be $7.0 million, with a range of $5.2 million to $9.2 million. Therefore, we estimate the mean
total first-year costs (which include all initial costs plus the costs of all additional sign
updates/replacement within the first year) to be $63.6 million, with a range of $38.9 million to
$110.8 million. Annualization of all costs over 20 years at discount rates of 3 percent and 7
percent, yields mean estimates of $34.7 million and $35.4 million, respectively per year. These
estimates are summarized in Table 11.
Summary of Benefits
Considerations in Estimating Benefits
In this analysis, we provide a qualitative exposition of benefits from the vending machine
labeling final rule, which provides calorie information to consumers in a direct and accessible
manner to enable consumers to make informed and healthful dietary decisions. The literature is
rich with studies measuring the potential economic and behavioral effects of calorie labeling
within the context of restaurant menus/menu boards as well as packaged foods that can be

5
examined in detail at the point of purchase. In identifying the potential association between
calorie labeling of vending machines and measurable health outcomes, three issues present a
significant challenge to measuring this potential association quantitatively: 1) There is a lack of
comparable literature evaluating the potential association between calorie labeling of vending
machines and health outcomes,2 2) food purchased from vending machines only makes up 0.33
percent of average total calorie intake, and 3) many vended food products already have front-of-
package calorie labeling and we do not have sufficient data to accurately control for the presence
of such labeling.
The growth in the prevalence of obesity and diabetes and the high rates of chronic
diseases such as heart disease and stroke in the United States has elevated the treatment and
prevention of these diseases to a top public health concern and a national priority. The
availability of calorie content information can enable people to follow healthful dietary practices
and may ultimately help mitigate these health issues. Accordingly, the final rule provides
consumers with calorie information in a direct and accessible manner at the point of purchase to
enable consumers to make informed and healthful food choices (Refs. 5;6;7;8).
Obesity is a major public health concern in the United States and one of the top leading
health indicators addressed by the United States Healthy People 2020 goals. Nationally
representative data reveal that the prevalence of obesity has increased significantly over the past
three decades (Ref. 9). According to the 2007-2008 National Health and Nutrition Examination
2 We note that in the technical appendix, we discuss a study conducted by Abaluck (2011) to provide an illustrative exposition of quantified benefits by extrapolating from consumer willingness to pay for nutrition facts labeling of packaged foods to estimate consumer willingness to pay for vending machine labeling. However, due to the nature of the assumptions that we need to make to extrapolate estimates of willingness to pay for NLEA nutrition information to that of vending machine labeling, we consider that such an extrapolation is better presented as an illustrative example of potential benefits.

6
Survey (NHANES), the prevalence of obesity (BMI ≥ 30) and overweight (25 ≤ BMI < 30)
among the adult U.S. population both equal 34 percent (Ref. 10).
Excess body weight has many health (Ref. 11), social (Refs. 12;13), psychological (Refs.
14;15), and economic consequences (Ref. 14) for overweight and obese individuals. Research
suggests that obese individuals have a lower life expectancy, and an elevated risk of diabetes,
hypertension, stroke, and other cardiovascular diseases (Ref. 10). The primary economic impact
stems from increased health-care costs in terms of greater health-care utilization and higher
medical expenditures (Ref. 16). More specifically, in 2008 annual medical expenditures
attributable to overweight and obesity accounted for more than 9 percent of the total U.S.
medical expenditures, or between $85.7 billion and $147 billion (Ref. 16). Researchers have
proposed various factors to explain this dramatic rise in obesity including declining food prices
and physical requirements of labor (Refs. 17;18), declining time costs of food preparation (Ref.
19), increased fast-food restaurant density (Ref. 20) and changes in social interactions (Ref. 21).
Although the relationship between obesity and poor dietary choices is complex, the
medical literature generally agrees that overconsumption of calories is one of the primary risk
factors for overweight and obesity (Ref. 22), and a reduction in excess calories can help prevent
or delay the onset of excess weight gain (Ref. 23). Vending machines represent a likely source
of high-calorie snacks, or discretionary foods, as well as some high-calorie meal items. Industry
data indicate that there is approximately one vending machine for every 40 adults in the United
States, and that consumers spend approximately five percent of their total food away from home
expenditures on food from vending machines, bars, and stores (Ref. 24). By providing calorie
information for covered vending machine food in a direct and accessible manner to consumers

7
before selection, the final rule will enable consumers to make informed and healthful dietary
choices.
To the extent that the final rule mitigates the increase in the prevalence of obesity and the
prevalence of these costly co-morbidities such as hypertension and diabetes, society gains the
opportunity cost of the averted medical expenditures and an increase in productivity from
averted debilitation and death. In addition to informing consumers about the calorie content of
covered vending machine food, major predicted elements of the consumer and industry response
to this rule include:
1. Increased awareness regarding the caloric content of vending machine foods, which
may help reduce the present-bias in preferences, and thus encourage the consumption of lower
calorie options.
2. Increased consumer interest in lower calorie options, and greater transparency in the
caloric content of foods sold in vending machines, which may:
a. Give manufacturers an incentive to reduce the calorie content of foods sold in
vending machines through reformulation or by decreasing portion size.
b. Give vending machine operators the incentive to provide items with lower
calorie formulations.
These changes may reduce consumers’ caloric intake from food sold in vending machines.3
Summary of Costs and Benefits of Menu Labeling and Vending Machine Rules
The Affordable Care Act requires nutrition labeling for standard menu items sold from
certain restaurants and similar retail food establishments, as well as calorie labeling for food sold
from certain vending machines. FDA is issuing two separate final rules (one for menu labeling 3 Note that any reduction in calorie intake in these settings may be at least partially offset by increases in calorie intake during other meals or snacks.
8
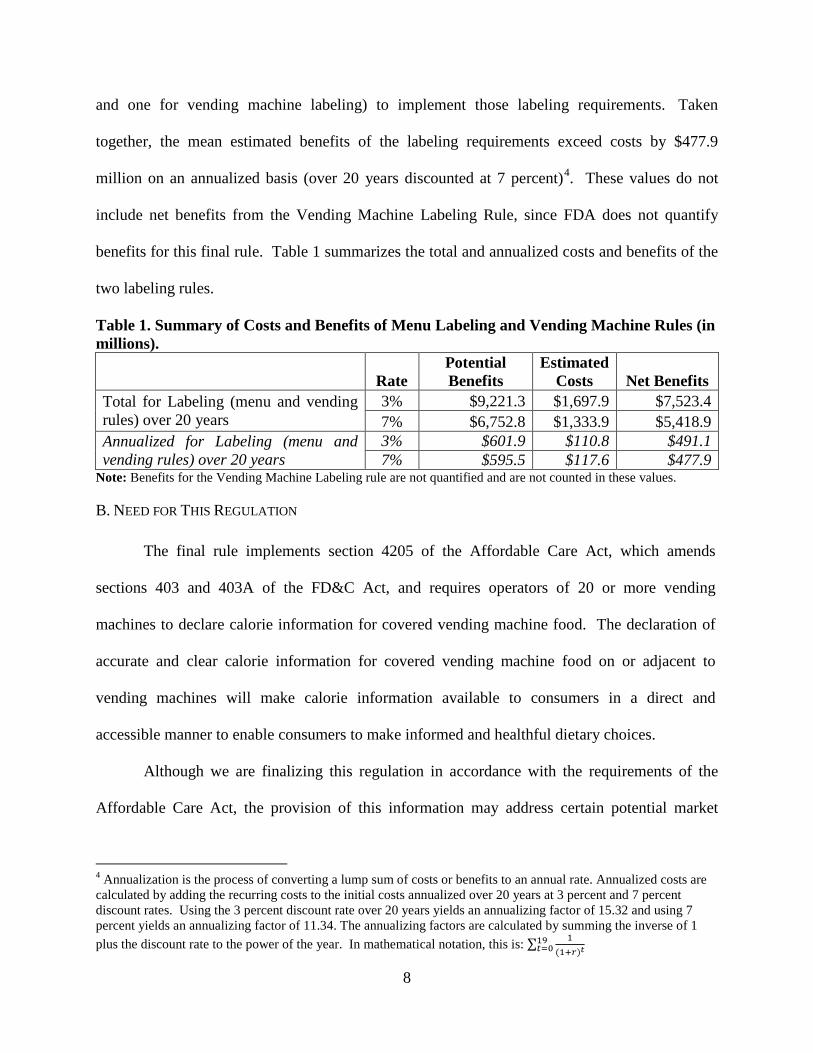
and one for vending machine labeling) to implement those labeling requirements. Taken
together, the mean estimated benefits of the labeling requirements exceed costs by $477.9
million on an annualized basis (over 20 years discounted at 7 percent)4. These values do not
include net benefits from the Vending Machine Labeling Rule, since FDA does not quantify
benefits for this final rule. Table 1 summarizes the total and annualized costs and benefits of the
two labeling rules.
Table 1. Summary of Costs and Benefits of Menu Labeling and Vending Machine Rules (in millions).
Rate Potential Benefits
Estimated Costs Net Benefits
Total for Labeling (menu and vending rules) over 20 years
3% $9,221.3 $1,697.9 $7,523.4 7% $6,752.8 $1,333.9 $5,418.9
Annualized for Labeling (menu and vending rules) over 20 years
3% $601.9 $110.8 $491.1 7% $595.5 $117.6 $477.9
Note: Benefits for the Vending Machine Labeling rule are not quantified and are not counted in these values.
B. NEED FOR THIS REGULATION
The final rule implements section 4205 of the Affordable Care Act, which amends
sections 403 and 403A of the FD&C Act, and requires operators of 20 or more vending
machines to declare calorie information for covered vending machine food. The declaration of
accurate and clear calorie information for covered vending machine food on or adjacent to
vending machines will make calorie information available to consumers in a direct and
accessible manner to enable consumers to make informed and healthful dietary choices.
Although we are finalizing this regulation in accordance with the requirements of the
Affordable Care Act, the provision of this information may address certain potential market
4 Annualization is the process of converting a lump sum of costs or benefits to an annual rate. Annualized costs are calculated by adding the recurring costs to the initial costs annualized over 20 years at 3 percent and 7 percent discount rates. Using the 3 percent discount rate over 20 years yields an annualizing factor of 15.32 and using 7 percent yields an annualizing factor of 11.34. The annualizing factors are calculated by summing the inverse of 1 plus the discount rate to the power of the year. In mathematical notation, this is: ∑ 1
(1+𝑟)𝑡19𝑡=0
9
failures. Studies show that there are systematic biases in how consumers process information and
weigh current benefits (from consuming higher calorie foods) against future costs (higher
probability of obesity and its co-morbidities) (Refs. 25;26). The behavioral economics literature
suggests that distortions internal to consumers (or internalities) due to time-inconsistent
preferences, present-biased preferences, visceral factors (e.g., hunger), or lack of self-control,
can also create the potential for policy intervention to improve consumer welfare (Refs.
27;28;29;30;31). Consistent with predictions based on models of bounded rationality, consumers
can systematically make suboptimal dietary choices because they discount future health
consequences relative to immediate benefits more than they would if they chose according to
their underlying or true preferences, leading them to regret their decisions at a later date5 To the
extent that some form of intrapersonal market failure characterizes diet-related decisions,
changes in labeling may increase internalization of future costs into current decision-making by
making the long-term health consequences of consumer food choices more salient and by
providing contextual cues of food consumption.
Market failure arising from inadequate information can provide an economic rationale
for the mandatory disclosure of nutrition information. The government does not necessarily have
to intervene to address a market failure from a lack of information. However, when individuals
find collecting information costly, time-consuming, or both, the revealed private demand for
information may differ from the socially optimal level of information. Mandatory nutrition
information disclosure is a tool that can address information asymmetries regarding the
nutritional content of vending machine foods. Given that consumers have limited time, attention,
5 Bounded rationality refers to models of decision making that take the cognitive constraints of the decision maker, e.g., present biased preferences, into account. Individuals use heuristics or rules of thumb to simplify the decision making process, but they often sacrifice judgment accuracy for the reduction in cognitive effort in systematic ways (Ref. 32).
10
and resources for seeking out new information, the final rule provides calorie information for
covered vending machine food to better inform choices at the point of purchase. The final rule
enables consumers to make informed food choices by reducing uncertainty about the underlying
calorie content of covered vending machine foods.
Specifically, for a covered vending machine food, the final rule requires that the vending
machine operator provide the calorie declaration on a sign in close proximity to the food or the
selection button (i.e. in, on, or adjacent to the vending machine, but not necessarily attached to
the vending machine), so long as the sign is visible at the same time as the food, its name, price,
or selection number is visible. The final rule also requires that the calorie declaration be “clear
and conspicuous” and “placed prominently,” and gives requirements for type size, color, and
contrast to ensure that the information is “clear and conspicuous” and “placed prominently.”
These requirements are designed so that the calorie information is made available to consumers
before they purchase such food. Providing the information may increase consumer awareness
regarding the calorie content in covered vending machine food and may increase the perceived
relevance of that information to their decision making. Furthermore, providing the information
may highlight the potential future costs of additional calorie consumption. It is also possible that
the disclosure of this information might lead vending machine operators to voluntarily provide
consumers with healthier options.
C. COMMENTS ON THE PRELIMINARY REGULATORY IMPACT ANALYSIS IN THE PROPOSED RULE AND OUR RESPONSES
FDA’s proposed rule “Food Labeling: Calorie Labeling of Articles of Food in Vending
Machines” (76 FR 19238) was published on April 6, 2011 and its comment period ended July 5,
2011. We had prepared a full “Preliminary Regulatory Impact Analysis” in connection with the
proposed rule. We also included sections titled “Summary Preliminary Regulatory Impact
11
Analysis” and “Initial Regulatory Flexibility Analysis” in the preamble to the proposed rule (76
FR 19238 at 19245-19249). In the following paragraphs, we describe and respond to the
comments we received on our analysis of the impacts presented in those sections. We have
numbered each comment to help distinguish between different comments. The number assigned
to each comment is purely for organizational purposes and does not signify the comment’s value,
importance, or the order in which it was received.
Comments and Responses
The following comments addressed FDA’s preliminary regulatory impact analysis.
(Comment 1) One comment stated that the RIA does not calculate the burdens to the suppliers
of vending machine food. The comment stated that these suppliers will bear the larger
burden from the requirements of the final rule.
(Response 1) Neither section 403(q)(5)(H)(viii) of the FD&C Act nor the final rule applies to
suppliers of vending machine food; instead, section 403(q)(5)(H)(viii) of the FD&C Act
and the final rule establish requirements for certain vending machine operators. We
recognize that a supplier of covered vending machine food may provide calorie
information on front-of-package labeling and such calorie information may constitute
visible nutrition information in accordance with section 403(q)(5)(H)(viii)(I)(aa) of the
FD&C Act provided that the applicable requirements of § 101.8(b) are satisfied.
However, neither section 403(q)(5)(H)(viii) of the FD&C Act nor the final rule requires
suppliers to provide such information. As such, the final rule does not impose burdens on
suppliers of vending machine food.
(Comment 2) One comment stated that posting calories would not be burdensome, as most foods
sold in vending machines already provide calorie information on their Nutrition Facts
12
labels, and for foods that do not already have calorie information, labeling to disclose
calories can be accomplished easily by using stickers. Another comment stated that, in
light of the major beverage companies’ prior commitment to putting calorie information
on selection buttons, we should reduce our burden estimate.
(Response 2) To the extent that foods sold from covered vending machines permit a prospective
purchaser to examine the Nutrition Facts label before purchasing the food or otherwise
provide visible nutrition information at the point of purchase in accordance with section
403(q)(5)(H)(viii) of the FD&C Act and § 101.8(b), the vending machine operator would
not be required to provide calorie declarations for such foods. In addition, we recognize
that the “Clear on Calories” commitment by the American Beverage Association, which
includes a pledge that calories will be displayed on selection buttons of “company-
controlled vending machines,” may be consistent with the calorie declaration
requirements of section 403(q)(5)(H)(viii) of the FD&C Act. Our estimates of the cost of
nutrition analysis already account for the fact that many vending machine foods will not
require additional nutrition analysis under this final rule. Indeed, we estimate that only
723 to 963 covered vending machine operators will need to acquire nutrition information
for at least some of their vending machine food.
Our estimate of the cost of nutrition analysis also takes into consideration that
vending machine operators can comply with the requirements of the final rule by
providing calorie declarations through inexpensive means (e.g., a poster affixed to the
front of the machine could cost, on average, $20 per machine per year). The final rule
does not prescribe the types of materials through which calories must be declared, and a
13
sticker, for example, could be an appropriate medium to convey a required calorie
declaration.
(Comment 3) One comment pointed out that section 403(q)(5)(H)(viii) of the FD&C Act
explicitly excludes vending machine operators who operate fewer than 20 vending
machines from the calorie labeling requirements. The comment characterized the
exclusion of such vending machine operators as a type of “small business exemption,”
stating further that FDA is correct to not use the Small Business Administration’s (SBA)
definition of “small business” to exempt additional vending machine operators.
Likewise, the comment said the small business exemption provided under the Nutrition
Labeling and Education Act (NLEA) would be irrelevant to this rule.
(Response 3) – Section 403(q)(5)(H)(viii) of the FD&C Act explicitly applies to covered vending
machine food that “is operated by a person who is engaged in the business of owning or
operating 20 or more vending machines” (21 U.S.C. 343(q)(5)(H)(viii)(I)(bb)). We
therefore agree with the comment pointing out that section 403(q)(5)(H)(viii) of the
FD&C Act is explicit as to which vending machine operators are covered. As we
discussed in the preliminary RIA, if we were to exclude vending machine operators from
the requirements of section 403(q)(5)(H)(viii) of the FD&C Act based on the SBA
definition of a small vending machine operator, an estimated 97 percent of vending
machine operators would be excluded, since a vending machine operator would need at
least $10 million to exceed the SBA’s definition of a small vending machine operator.
We are using the SBA’s definition of small business only for our Regulatory Flexibility
Analysis.
14
We also agree with the comment that “the small business exemption” under the
NLEA at section 403(q)(5)(D) of the FD&C Act (21 U.S.C. 343(q)(5)(D)) would not
apply to the final rule. Section 403(q)(5)(D) of the FD&C Act generally provides that if
a person offers food for sale and has annual gross sales made (or business done in sales)
to consumers which is not more than $500,000 or has annual gross sales made (or
business done in sales) of food to consumers which is not more than $50,000, the
requirements of sections 403(q)(1) to (4) do not apply with respect to food sold by such
person subject to certain exceptions. The calorie labeling requirements for covered
vending machine operators are included in section 403(q)(5)(H)(viii) of the FD&C Act,
and not the sections of the FD&C Act specified in the small business exemption in
section 403(q)(5)(D). Accordingly, the exemption at section 403(q)(5)(D) does not apply
to the requirements of section 403(q)(5)(H)(viii).
(Comment 4) - One comment stated that the final rule should apply the calorie labeling
requirements of section 403(q)(5)(H)(viii) of the FD&C Act to bulk vending machines in
part because the compliance costs for bulk vending machines would be insignificant. The
comment cited our mean preliminary estimate of $4.8 million for sign costs for bulk
vending machines, and stated that our low sign cost estimate of $4 million is more
appropriate, given the possibility of using stickers as an inexpensive method for the
calorie declaration.
(Response 4) - The final rule applies the calorie labeling requirements of section
403(q)(5)(H)(viii) of the FD&C Act to bulk vending machines. The cost estimates for
signs, including the low, medium, and high estimates, account for the possibility of
15
covered vending machine operators using stickers to satisfy the requirements of the final
rule.
(Comment 5) - One comment stated that our estimate on how frequently labeling would need to
change is too low. The comment stated that in almost all cases, machines are restocked
and serviced every 5 weeks, with busier locations stocked once or more per week. The
comment stated that the restocking will require labeling changes because restocking may
result in the substitution of certain products for other products or the addition of new
products. The comment stated that relabeling would need to occur between 10 and 17
times per year for each machine, with some machines requiring partial relabeling at least
50 times per year.
(Response 5) - In the preliminary RIA, we estimated an average recurring burden of between 5
and 15 minutes per vending machine per year to install or refresh the calorie displays.
We said that signs would not always need to be updated every time a machine’s product
mix (i.e., the assortment of vending machine foods offered for sale in a vending machine
at a particular time) changed.
We recognize that the product mix in a particular vending machine may change
with each restocking. For each machine, the rule requires operators to declare the calorie
information for those articles of food that are sold from that particular vending machine.
However, we would not object to a vending machine operator providing calorie
declarations for articles of food that are typically offered for sale in the specific vending
machine but may not be offered for sale at all times (for example, in cases where the
article sells out, or is temporarily replaced by another item), provided that the calorie
declarations are clear and conspicuous and placed prominently. Thus, signs would not
16
always need to be updated every time a machine’s product mix changed, so long as the
sign declares the calories for each article of food sold from the covered vending machine.
For example, if a particular article of food is sold out, the vending machine operator
would not need to design and print a new sign to remove the calorie declaration for such
food. In addition, to the extent that foods sold from covered vending machines permit a
prospective purchaser to examine the Nutrition Facts label before purchasing the food or
otherwise provide visible nutrition information at the point of purchase in accordance
with section 403(q)(5)(H)(viii)(I)(aa) of the FD&C Act and § 101.8(b), the vending
machine operator would not be required to provide calorie declarations for such foods.
Therefore, restocking of covered vending machines that sell such foods would not require
the vending machine operator to update signs. Furthermore, in order to accommodate the
occasional trial or experimental product, the sign template could, for example, be
designed with blank space, on which the operator could hand-write the experimental
product’s name and caloric value, or place a declarative sticker next to the new product
within the machine (should it have a glass/Plexiglas front). The comment provided an
estimate of the number of times a vending machine’s sign would likely need to be
replaced, or 10-17 times. We estimate that in accordance to the factors described in the
earlier paragraphs of this response, calorie declaration signs would only need to be
replaced between 1 and 4 times per year (or even zero for some products). This estimate
also takes into consideration that vending machine operators have the flexibility to
choose a medium (e.g., stickers, posters) and a format (e.g., individual signs per covered
vending machine food; sign(s) in, on, or adjacent to the vending machine) for the calorie
declaration that will make the most sense for a particular vending machine operator

17
depending on the variability of products that the operator carries and the frequency of
restocking.
D. COVERAGE OF THE FINAL RULE AND INDUSTRY OVERVIEW.
The final rule covers vending machine operators that are engaged in the business of
owning or operating 20 or more vending machines and those vending machine operators that
voluntarily register with FDA to become subject to the Federal requirements. Vending machines
are operated both by food service operators and by operators in other businesses that do not
identify themselves as vending machine operators, but that operate vending machines for the
benefit of their customers or employees. Because this latter group cannot be accurately counted
at this time, published estimates of the number of vending machine operators will generally
undercount the number of covered operators under the final rule. For the purposes of this
regulatory impact analysis, we will use the term “covered operators” or “covered vending
machines” to refer to vending machine operators or vending machines that sell covered vending
machine foods.
According to NAMA, approximately 13,500 companies operate vending machines in the
United States (Ref. 3). Other estimates put the total closer to 10,000 (Ref. 2). This total
includes 5,000 operators who have the primary business identification “vending machine
operator” (NAICS 4542), plus a variety of other operators that operate vending machines, but do
not primarily identify as such. These other companies include, for example, beverage
manufacturers and food service contractors. Because of the difficulty in determining which
operators are covered, and because we have no data on the potentially significant number of

18
covered vending machine operators that self-identify as businesses outside the food industry, we
take NAMA’s higher estimate of 13,500 operators as the number of covered operators.
We estimate that 97 percent of operators selling covered vending machine food that
identify primarily as vending machine operators engaging in the business of owning or operating
20 or more vending machines qualify as small businesses as defined by the SBA. Other
estimates indicate that more than 90 percent of the operators covered by the final rule meet the
requirements for a small business (Ref. 2). This percentage may be lower for operators that have
primary business identification other than as vending machine operators, but the majority of
covered businesses will likely still qualify as small businesses. Because very small, informal
businesses not captured by economic census data might operate 20 or more machines, these
figures may underestimate the number of affected small businesses. Conversely, approximately
72 percent of industry revenue—and thus a comparably large fraction of consumption—comes
from operators with more than $10 million in annual sales, and 85 percent comes from operators
with more than $5 million in revenue (Ref. 2).
Vending machine operators together operate an estimated 4.7 to 7.0 million food vending
machines in at least 1.5 million locations (Refs. 1;2;3). Approximately 85 percent of these
machines sell packaged food and beverages that bear nutrition labeling in accordance with
section 403(q)(1) of the FD&C Act and FDA regulations at § 101.9, and thus have Nutrition
Facts labels. Another 9 percent sell a variety of hot and cold cup beverages, frozen or fresh food
products and miscellaneous other food products. The final 6 percent sell bulk candy, nuts or
gum (Ref. 1).
19
II. COSTS AND BENEFITS OF REGULATORY OPTIONS: DETAILED ANALYSIS This section describes the final rule’s costs and benefits and other regulatory options that
we considered.
A. BASELINE: NO NEW REGULATORY ACTION
Imposing no new nutrition labeling requirements for vending machine food is the
baseline for our analysis. Section 4205 of the Affordable Care Act requires that we issue
regulations to carry out section 403(q)(5)(H) of the FD&C Act, which includes calorie labeling
requirements for covered vending machine food. Therefore, this option is not legally viable.
Section 4205 of the ACA added section 403(q)(5)(H)(viii) to the FD&C Act to require
that if an article of food is sold from a vending machine that: (1) “does not permit a prospective
purchaser to examine the Nutrition Facts Panel before purchasing the article or does not
otherwise provide visible nutrition information at the point of purchase;” and (2) “is operated by
a person who is engaged in the business of owning or operating 20 or more vending machines,”
then the vending machine operator must “provide a sign in close proximity to each article of food
or the selection button that includes a clear and conspicuous statement disclosing the number of
calories contained in the article.” We are not aware of any state or local nutrition labeling
requirements related to vending machines. Because there is increasing attention on and concern
for the role that foods from vending machines play in the obesity epidemic, some vending
machine operators have voluntarily provided more healthful options and additional information
on the outside of machines (Refs. 3;33).
Because efforts to reduce the prevalence of obesity in the United States will likely
continue to grow, we expect some state and local jurisdictions would begin requiring nutrition
information on vending machines in absence of a federal rule. If states and local jurisdictions
20
began to require nutrition information on vending machines, in the absence of the enactment of
section 4205 of the Affordable Care Act, costs to industry could be several times the cost of this
final rule, depending on the number of jurisdictions adopting such regulations, as well as the
complexity of the regulations and the variability between them. Furthermore, the benefit to
consumers at a national level would likely be lower because of incomplete coverage and
fragmented presentation of calorie information.
B. OPTION 1: FINAL RULE
Under the final rule, we require that covered operators make calorie declarations for
covered vending machine food two years after the date of publication of the final rule. The final
rule requires the calorie declarations to be placed as follows:
(A) This calorie declaration may be placed on a sign in close proximity to the article of
food or selection button, i.e., in, on, or adjacent to the vending machine, but not necessarily
attached to the vending machine, so long as the calorie declaration is visible at the same time as
the food, its name, price, selection button, or selection number is visible. The sign must give
calorie declarations for those articles of food that are sold from that particular vending machine.
(B) When the calorie declaration is in or on the vending machine, the calorie declaration
must be in a type size no smaller than the name of the food on the machine (not the label),
selection number, or price of the food as displayed on the vending machine, whichever is
smallest, with the same prominence, i.e., the same color, or in a color at least as conspicuous as
the color of the name, if applicable, or the price of the food or selection number, and the same
contrasting background, or a background at least as contrasting as the background used for the
item it is in closest proximity to, i.e., name, selection number, or price of the food item as
displayed on the machine.
21
(C) When the calorie declaration is on a sign adjacent to the vending machine, the calorie
declaration must be in a type size large enough to render it likely to be read and understood by
the ordinary individual under customary conditions of purchase and use, and in a type that is all
black or one color printed on a white or other neutral background that contrasts with the type
color.
(D) Where the vending machine only displays a picture or other representation or name
of the food item, the calorie declaration must be in close proximity to the picture or other
representation or name, or in close proximity to the selection button.
(E) For electronic vending machines (e.g., machines with digital or electronic or liquid
crystal display (LCD) displays), the calorie declaration must be displayed before the prospective
purchaser makes his or her purchase.
(F) For vending machines with few choices, e.g., popcorn, the calorie declaration may
appear on the face of the machine so long as the declaration is prominent, not crowded by other
labeling on the machine, and the type size is no smaller than the name of the food on the machine
(not the label), selection number, or price of the food as displayed on the vending machine,
whichever is smallest.
For vending machine operators not subject to the requirements of section 403(q)(5)(H) of
the FD&C Act, the final rule specifies the terms and conditions for how these operators can
voluntarily become subject to the requirements by registering with FDA. Because this
registration is voluntary, only operators that see a positive net benefit to themselves will choose
to register; therefore, we estimate that the registration provision by itself will have no net cost.
As of the conducting of this analysis, no vending machine operators have voluntarily registered
to become subject to the requirements of the rule, and we do not expect the benefits for a non-
22
covered operator of voluntarily registering to exceed the burden associated with conducting
calorie analysis and creating calorie declaration signage.
Costs
In order to comply with the final rule, each affected vending machine operator will need
to have or acquire calorie content data for its covered vending machine food, in addition to
affixing and maintaining calorie declarations for the covered food on, in or adjacent to vending
machines. The Vending Times Census of the Industry 2012 (Ref. 1) estimates that there are
10,140 total operators operating approximately 4.98 million machines with exclusively food
items. The National Automated Merchandising Association (NAMA) estimates these values to
be higher with 13,500 vending operators operating approximately 6.3 million machines (Ref. 3).
Furthermore, since all but one of these estimates include operators that exclusively operate
machines with non-food items, we make a downward adjustment of 5 percent to the estimated
number of operators and the estimated number of machines provided by NAMA (Refs. 3;34).
Excluding non-food vending machines brings the estimated range of operators to 9,633–12,825
and the range of machines to 4.98 million to 5.99 million.
The Economic Census 2007 reports operator counts and annual revenue for a large
sample of the vending industry, particularly operators whose primary business is the operation of
vending machines (Ref. 35). These values are stratified by revenue class, providing a
distribution of operators and machines under different ranges of revenue. Since the Vending
Times Census only provides aggregate operator and machine counts, we apply the Economic
Census distribution to the Vending Times Census counts to estimate the current number of
operators and machines, stratified by total annually earned revenue. We report these estimates
in Table 2.
23
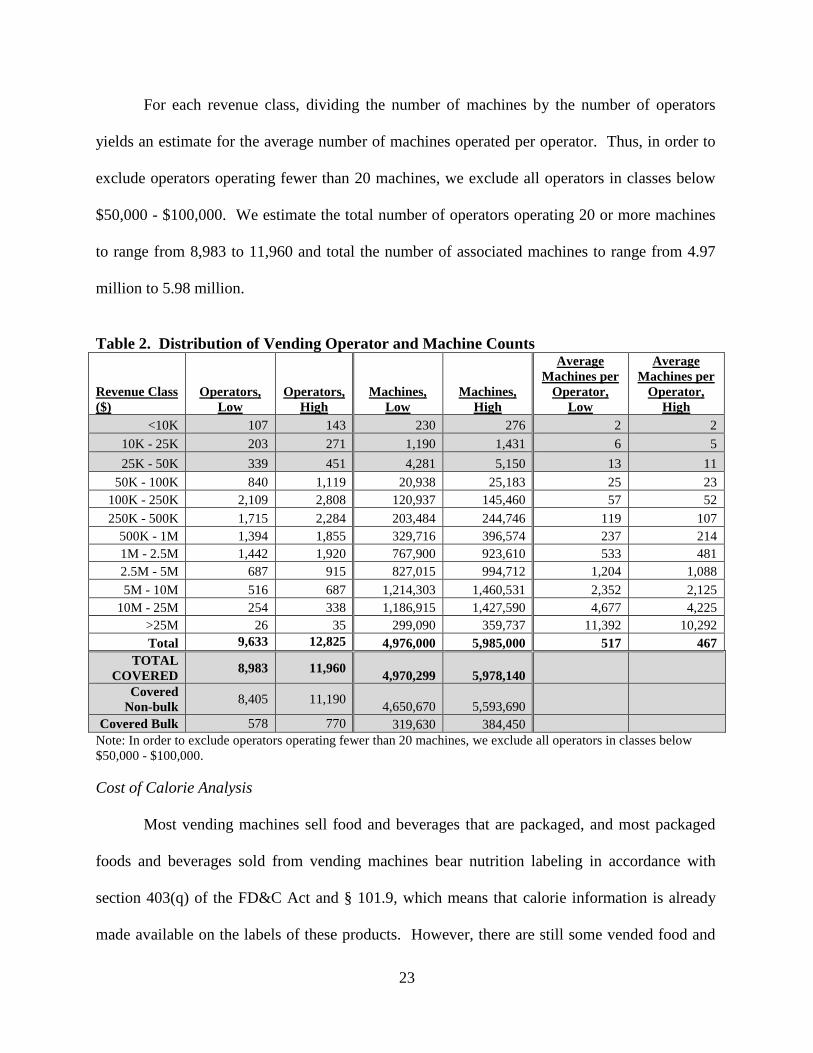
For each revenue class, dividing the number of machines by the number of operators
yields an estimate for the average number of machines operated per operator. Thus, in order to
exclude operators operating fewer than 20 machines, we exclude all operators in classes below
$50,000 - $100,000. We estimate the total number of operators operating 20 or more machines
to range from 8,983 to 11,960 and total the number of associated machines to range from 4.97
million to 5.98 million.
Table 2. Distribution of Vending Operator and Machine Counts
Revenue Class ($)
Operators, Low
Operators, High
Machines, Low
Machines, High
Average Machines per
Operator, Low
Average Machines per
Operator, High
<10K 107 143 230 276 2 2 10K - 25K 203 271 1,190 1,431 6 5 25K - 50K 339 451 4,281 5,150 13 11
50K - 100K 840 1,119 20,938 25,183 25 23 100K - 250K 2,109 2,808 120,937 145,460 57 52 250K - 500K 1,715 2,284 203,484 244,746 119 107
500K - 1M 1,394 1,855 329,716 396,574 237 214 1M - 2.5M 1,442 1,920 767,900 923,610 533 481 2.5M - 5M 687 915 827,015 994,712 1,204 1,088 5M - 10M 516 687 1,214,303 1,460,531 2,352 2,125
10M - 25M 254 338 1,186,915 1,427,590 4,677 4,225 >25M 26 35 299,090 359,737 11,392 10,292 Total 9,633 12,825 4,976,000 5,985,000 517 467
TOTAL COVERED 8,983 11,960 4,970,299 5,978,140
Covered Non-bulk 8,405 11,190 4,650,670 5,593,690
Covered Bulk 578 770 319,630 384,450 Note: In order to exclude operators operating fewer than 20 machines, we exclude all operators in classes below $50,000 - $100,000. Cost of Calorie Analysis
Most vending machines sell food and beverages that are packaged, and most packaged
foods and beverages sold from vending machines bear nutrition labeling in accordance with
section 403(q) of the FD&C Act and § 101.9, which means that calorie information is already
made available on the labels of these products. However, there are still some vended food and
24
beverage products that do not have this information readily available to venders. The Vending
Times Census of the Industry 2012 (Ref. 1) provides estimates of total machine counts for
several general categories of vended items. The categories that would most likely not have
nutrition information on the package include prepared foods (refrigerated meals, frozen meals,
canned items6, bowl items, and other shelf stable main meal items), hot cup beverages, and cold
cup beverages. We do not expect that bulk items will need to undergo calorie analysis, since
they will most likely have nutrition information on the wholesale packaging7. We report
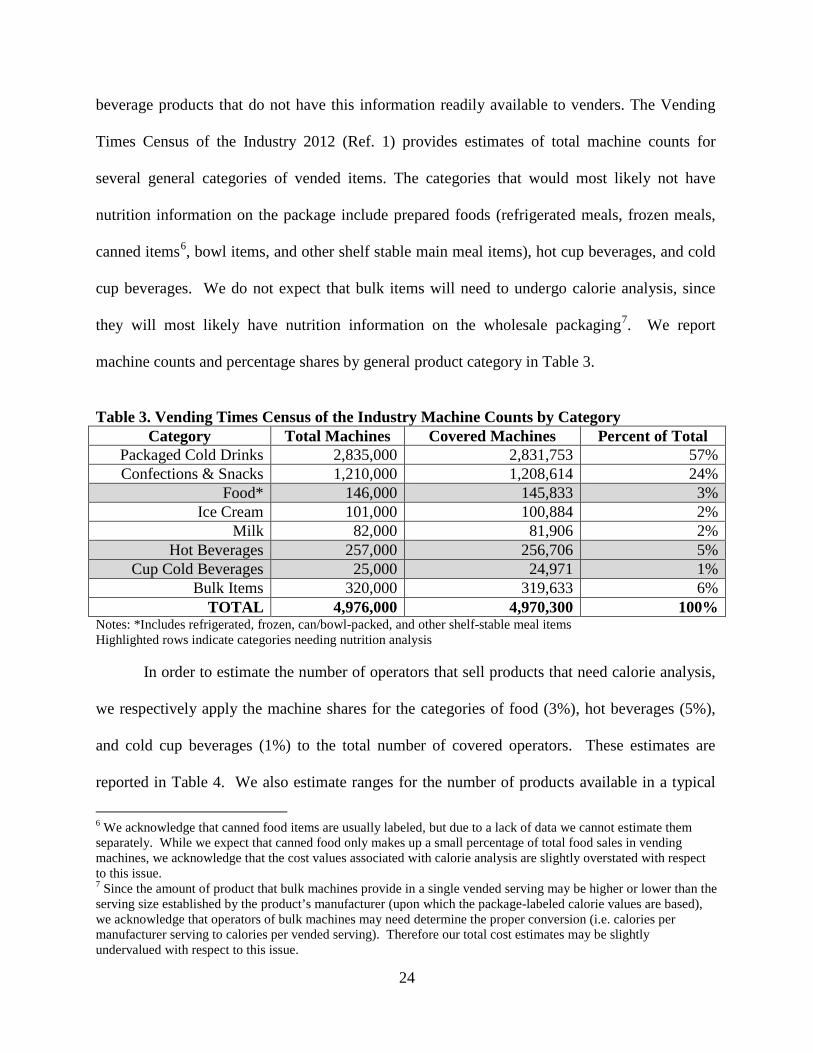
machine counts and percentage shares by general product category in Table 3.
Table 3. Vending Times Census of the Industry Machine Counts by Category
Notes: *Includes refrigerated, frozen, can/bowl-packed, and other shelf-stable meal items Highlighted rows indicate categories needing nutrition analysis
In order to estimate the number of operators that sell products that need calorie analysis,
we respectively apply the machine shares for the categories of food (3%), hot beverages (5%),
and cold cup beverages (1%) to the total number of covered operators. These estimates are
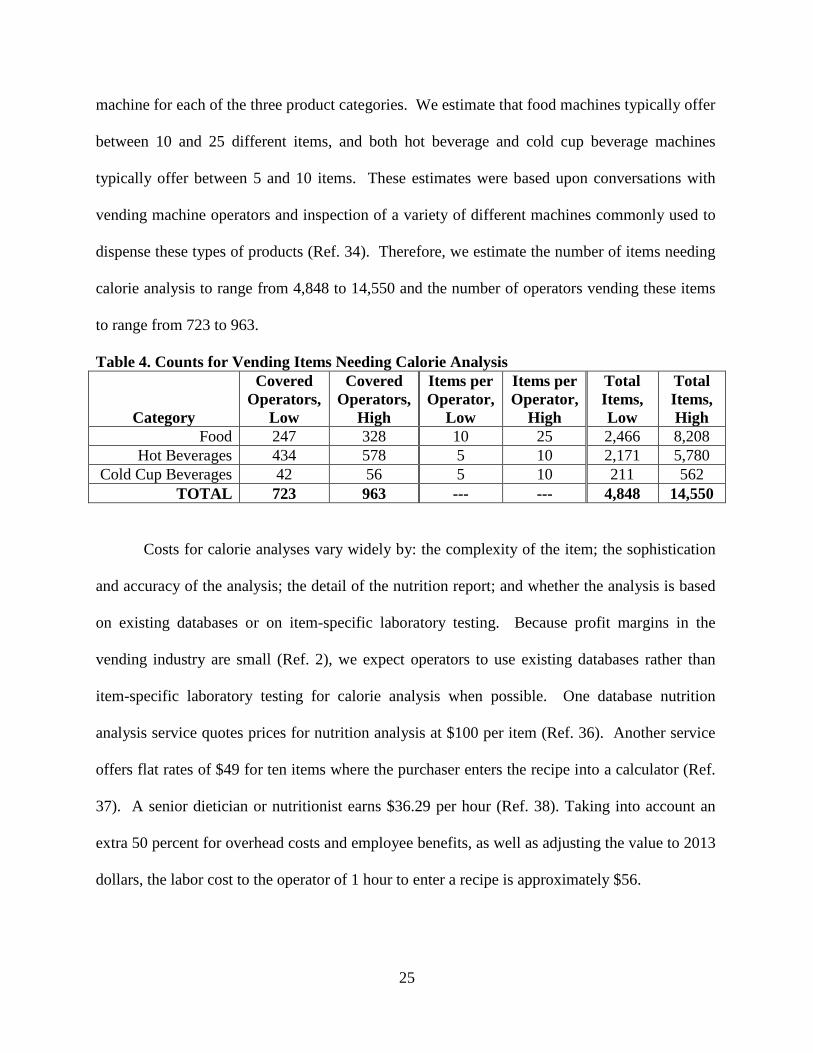
reported in Table 4. We also estimate ranges for the number of products available in a typical
6 We acknowledge that canned food items are usually labeled, but due to a lack of data we cannot estimate them separately. While we expect that canned food only makes up a small percentage of total food sales in vending machines, we acknowledge that the cost values associated with calorie analysis are slightly overstated with respect to this issue. 7 Since the amount of product that bulk machines provide in a single vended serving may be higher or lower than the serving size established by the product’s manufacturer (upon which the package-labeled calorie values are based), we acknowledge that operators of bulk machines may need determine the proper conversion (i.e. calories per manufacturer serving to calories per vended serving). Therefore our total cost estimates may be slightly undervalued with respect to this issue.
Category Total Machines Covered Machines Percent of Total Packaged Cold Drinks 2,835,000 2,831,753 57% Confections & Snacks 1,210,000 1,208,614 24%
Food* 146,000 145,833 3% Ice Cream 101,000 100,884 2%
Milk 82,000 81,906 2% Hot Beverages 257,000 256,706 5%
Cup Cold Beverages 25,000 24,971 1% Bulk Items 320,000 319,633 6%
TOTAL 4,976,000 4,970,300 100%
25
machine for each of the three product categories. We estimate that food machines typically offer
between 10 and 25 different items, and both hot beverage and cold cup beverage machines
typically offer between 5 and 10 items. These estimates were based upon conversations with
vending machine operators and inspection of a variety of different machines commonly used to
dispense these types of products (Ref. 34). Therefore, we estimate the number of items needing
calorie analysis to range from 4,848 to 14,550 and the number of operators vending these items
to range from 723 to 963.
Table 4. Counts for Vending Items Needing Calorie Analysis
Category
Covered Operators,
Low
Covered Operators,
High
Items per Operator,
Low
Items per Operator,
High
Total Items, Low
Total Items, High
Food 247 328 10 25 2,466 8,208 Hot Beverages 434 578 5 10 2,171 5,780
Cold Cup Beverages 42 56 5 10 211 562 TOTAL 723 963 --- --- 4,848 14,550
Costs for calorie analyses vary widely by: the complexity of the item; the sophistication
and accuracy of the analysis; the detail of the nutrition report; and whether the analysis is based
on existing databases or on item-specific laboratory testing. Because profit margins in the
vending industry are small (Ref. 2), we expect operators to use existing databases rather than
item-specific laboratory testing for calorie analysis when possible. One database nutrition
analysis service quotes prices for nutrition analysis at $100 per item (Ref. 36). Another service
offers flat rates of $49 for ten items where the purchaser enters the recipe into a calculator (Ref.
37). A senior dietician or nutritionist earns $36.29 per hour (Ref. 38). Taking into account an
extra 50 percent for overhead costs and employee benefits, as well as adjusting the value to 2013
dollars, the labor cost to the operator of 1 hour to enter a recipe is approximately $56.
26
Based on data from FDA’s Recordkeeping Cost Model (Ref. 39), we estimate it would
take a nutritionist one hour to calculate the total caloric value for each item needing analysis.
Using the hourly wage plus overhead for dietitians and nutritionists of $56 per hour, we estimate
the costs for calorie analysis using a nutrition database to be $56 per item (1 hour/item x
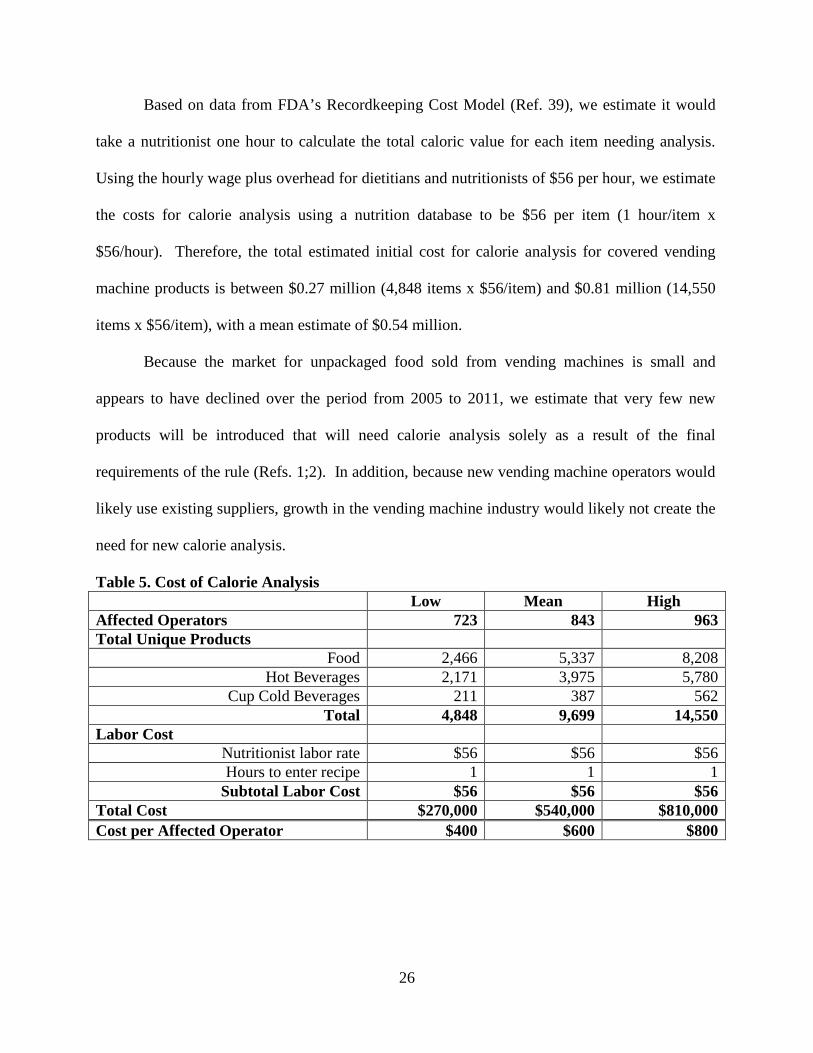
$56/hour). Therefore, the total estimated initial cost for calorie analysis for covered vending
machine products is between $0.27 million (4,848 items x $56/item) and $0.81 million (14,550
items x $56/item), with a mean estimate of $0.54 million.
Because the market for unpackaged food sold from vending machines is small and
appears to have declined over the period from 2005 to 2011, we estimate that very few new
products will be introduced that will need calorie analysis solely as a result of the final
requirements of the rule (Refs. 1;2). In addition, because new vending machine operators would
likely use existing suppliers, growth in the vending machine industry would likely not create the
need for new calorie analysis.
Table 5. Cost of Calorie Analysis Low Mean High Affected Operators 723 843 963 Total Unique Products
Food 2,466 5,337 8,208 Hot Beverages 2,171 3,975 5,780
Cup Cold Beverages 211 387 562 Total 4,848 9,699 14,550
Labor Cost Nutritionist labor rate $56 $56 $56 Hours to enter recipe 1 1 1
Subtotal Labor Cost $56 $56 $56 Total Cost $270,000 $540,000 $810,000 Cost per Affected Operator $400 $600 $800
27
Cost of Signage
The final rule will require vending machine operators to affix and maintain calorie
declarations for covered vending machine products in, on, or adjacent to vending machines. We
anticipate variation in the kinds of materials, display, and methods used to comply with the rule.
Since the majority of covered vending machine operators are small businesses and maintaining
calorie declarations on every machine is a highly labor-intensive activity, we anticipate that
almost all operators will, at least initially, include calorie information on signs/posters on or
adjacent to vending machines8.
In the long run, vending machine manufacturers and the larger vending machine
operators, such as the soft drink companies, will likely adopt the use of electronic displays of
calorie information as part of regular updates and replacement of old or aging machines.
Similarly, to the extent that a food sold from a vending machine permits a prospective purchaser
to examine the Nutrition Facts label before purchasing the food or otherwise provides visible
nutrition information at the point of purchase in accordance with section
403(q)(5)(H)(viii)(I)(aa) of the FD&C Act and § 101.8(b), the vending machine operator would
not be required to provide calorie declarations for such foods. Therefore, vending machine
operators that operate glass front machines, or other kinds of vending machines that display the
Nutrition Facts labels or other visible nutrition information in accordance with section
403(q)(5)(H)(viii)(I)(aa) of the FD&C Act and § 101.8(b) of this rule for the food sold from
8 We are aware, through programs like the “Nutrition Keys” (also referred to as “Facts Up Front”) initiative, that some food manufacturers are placing calorie information on the labels of their products. We are also aware of the “Clear on Calories” commitment by the American Beverage Association, which includes a pledge that calories will be displayed on selection buttons of “company-controlled vending machines.” However, we lack the data that would allow us to incorporate these efforts into the cost analysis. For example, we do not know the extent of the implementation of the American Beverage Association’s “Clear on Calories” commitment. Furthermore, even for those vending machines that might already have calorie information displayed on selection buttons, we do not have sufficient information to determine whether such a display would comply with the requirements in the final rule.
28
such vending machines would not have to declare the calories for those particular foods on a
sign as described in section 403(q)(5)(H)(viii) of the FD&C Act and § 101.8(c)(2) of this rule.
Based upon data obtained from the Vending Times Survey, NAMA, and the Economic
Census (Refs. 1;3;4), we estimate that there are between 4.97 million and 5.98 million covered
machines (see Table 2). In this analysis, the costs of signage for non-bulk and bulk vending
machines are estimated separately. Since the Vending Times survey reports that bulk machines
make up approximately 6 percent of all machines, we estimate that there are between 4.65
million and 5.59 million covered non-bulk machines. Since some vending machines may sell
foods that permit prospective purchasers to examine Nutrition Facts labels before purchase or
otherwise provide visible nutrition information at the point of purchase in accordance with
section 403(q)(5)(H)(viii)(I)(aa) of the FD&C Act and § 101.8(b), the vending machine operator
would not be required to provide calorie declarations for such foods, and such foods would
likely not contribute to the costs analyzed for this final rule. However, we do not have detailed
information regarding the number of these machines in use. Therefore, to the extent that
vending machines sell foods that permit prospective purchasers to examine the Nutrition Facts
labels for the food sold in the machines before purchasing the food or otherwise provide visible
nutrition information for the food sold in the machines, at the point of purchase in accordance
with section 403(q)(5)(H)(viii)(I)(aa) of the FD&C Act and § 101.11(B), this analysis may
overestimate the costs of the final rule. However, it is important to note that while such
packaged foods may be exempt, managing calorie declarations on a package-by-package basis
(i.e. ensuring the calorie label on each individual package will be clear and conspicuous or
otherwise unobstructed from view at the point of purchase) may be less cost effective than
managing all items together in a single sign. With regard to digital signage, according to
29
NAMA (Ref. 40) approximately 0.1% of all machines in operation, currently have electronic
video displays capable of providing calorie information. This value translates to a range of
4,651 to 5,594 machines. Subtracting these values from the total machine count yields a range
of 4.65 million to 5.59 million machines that will need signage. However, we expect this
amount to fall to some degree over time as manufacturers continue to add the required calorie
information to the principal display panel of the package as part of “front of package labeling,”
as well as increased use of electronic displays on vending machines.
According to the rule, a machine’s sign must provide calorie declarations for those
articles of food that are sold from that particular vending machine. However, we would not
object to a vending machine operator providing calorie declarations for articles of food that are
typically offered for sale in the specific vending machine but may not be offered for sale at all
times (for example, in cases where the article sells out, or is temporarily replaced by another
item), provided that the calorie declarations are clear and conspicuous and placed prominently.
Thus, signs would not always need to be updated every time a machine’s product mix changed,
so long as the sign declares the calories for each article of food sold from the covered vending
machine. For example, if a particular article of food is sold out, the vending machine operator
would not need to design and print a new sign to remove the calorie declaration for such food.
In addition, to the extent that foods sold from covered vending machines permit a prospective
purchaser to examine the Nutrition Facts label before purchasing the food or otherwise provide
visible nutrition information at the point of purchase in accordance with section
403(q)(5)(H)(viii)(I)(aa) of the FD&C Act and § 101.8(b), the vending machine operator would
not be required to provide calorie declarations for such foods. Therefore, restocking of covered
vending machines that sell such foods would not require the vending machine operator to update
30
signs. Furthermore, in order to accommodate the occasional trial/experimental product, the sign
template could, for example, be designed with blank space, on which the operator could hand-
write the experimental product’s name and caloric value, or place a declarative sticker next to
the new product within the machine (should it have a glass/plexiglass front). As a result, we
estimate that the number of times that a sign for a particular machine must be changed from zero
to four times per year. According to NAMA, the product mix of beverage machines do not
change often, while machines with snacks and food experience frequent changes to their product
mix.
The initial costs of installing a sign to disclose calorie information on non-bulk machines
are made up of labor and overhead costs of designing sign templates, using the templates to
create signs that are tailored to each machine configuration, the costs of materials/printing, and
labor costs of physical installation.
Template Design (non-bulk machines only). We estimate the costs of designing a calorie
declaration sign template to be equivalent to two hours plus 50% overhead of a vending
operation employee’s time. The Current Employment Statistics (CES) Database (National)
maintained by the U.S. Bureau of Labor Statistics gives the average hourly wage of a non-
supervisory employee of a vending machine operation as $16 per hour. Including a 50 percent
increase for overhead costs and employee benefits, the average hourly cost of an employee in
this sector is approximately $24 per hour. The number of templates a given operator would need
to design to produce signs that would comply with the rule may vary based upon the number of
different types of products the operator purveys. We estimate a range of 1 to 10 templates
would be necessary. We base this range on the eight general food & beverage vending
categories monitored by the Vending Times Census (Ref. 1), plus two additional templates to
31
account for the existence of combination machines, which vend more than one general product
type (e.g. snacks and cold canned beverages) – see Table 4. Since not all operators will sell
items from each of the general food categories, we use a uniform distribution with a range of 1
to 10 to estimate the number of templates operators will need to develop. Thus, the cost per
operator for sign template design ranges from $48 (1 template x 2 hours x $24/hour) to $480 (10
templates x 2 hours x $24/hour), with a midrange estimate of $288 (6 templates x 2 hours x
$24/hour). Multiplying the cost per operator by the total number of operators yields total
estimated template design costs, which ranges from a low of $400,000 (8,405 operators x
$48/operator) to a high of $5.4 million (11,190 operators x $480/operator), with a midrange
estimate of $2.8 million (9,800 operators x $288/operator).
Initial Sign Creation (non-bulk machines only). In order to determine the number of
different signs that would need to be created we estimate a range in the number of potential
machine configurations under a vending operator’s control. Operators might have one type of
product mix (give or take a couple of items) for an office, another in a hotel, or even a hotel in a
different part of town. The point of measuring machine configurations is to quantify how many
different sign types (all created under one to 10 over-arching templates) will need to be printed.
To further illustrate, operators would use one template to design the signs for all their snack
machines, but then they’ll need further detail on each individual sign because they sell one set of
snacks in offices in one county, a different set of snacks in hotels in another county, each driven
by different locational demand. In this analysis, we define a machine configuration to represent
a coupling of location type and machine type that would lead an operator to create a unique mix
of products and thereby require a unique calorie sign. To estimate the first dimension of a
machine configuration, or location type, we rely upon the 2012 State of the Vending Industry
32
(Ref. 2), which provides a list of the 11 most common locations that house vending machines,
namely manufacturing facilities, offices, hospitals/nursing homes, universities, hotels/motels,
retail sites, restaurants/bars/clubs, correctional facilities, military bases, and other. Each location
category services a different consumer demand base, leading operators to stock machines to suit
respective tastes and preferences.
The second dimension of a machine configuration is the machine type. Each general
food category is potentially comprised of different sets of machines with their own mechanical
characteristics. Vending machines are extremely durable and can remain in perfect working
order for decades. Over the last 30 or more years, new models are brought to market each year
while older ones still remain in operation. As a result, the market has a wide variety of models
that can display anywhere from 1 to 50 or more products at a time. While it is impossible to
determine the precise number of models, we aggregate the total number of possible machine
models down to 24 general machine types ordered by range of item count and the type of item
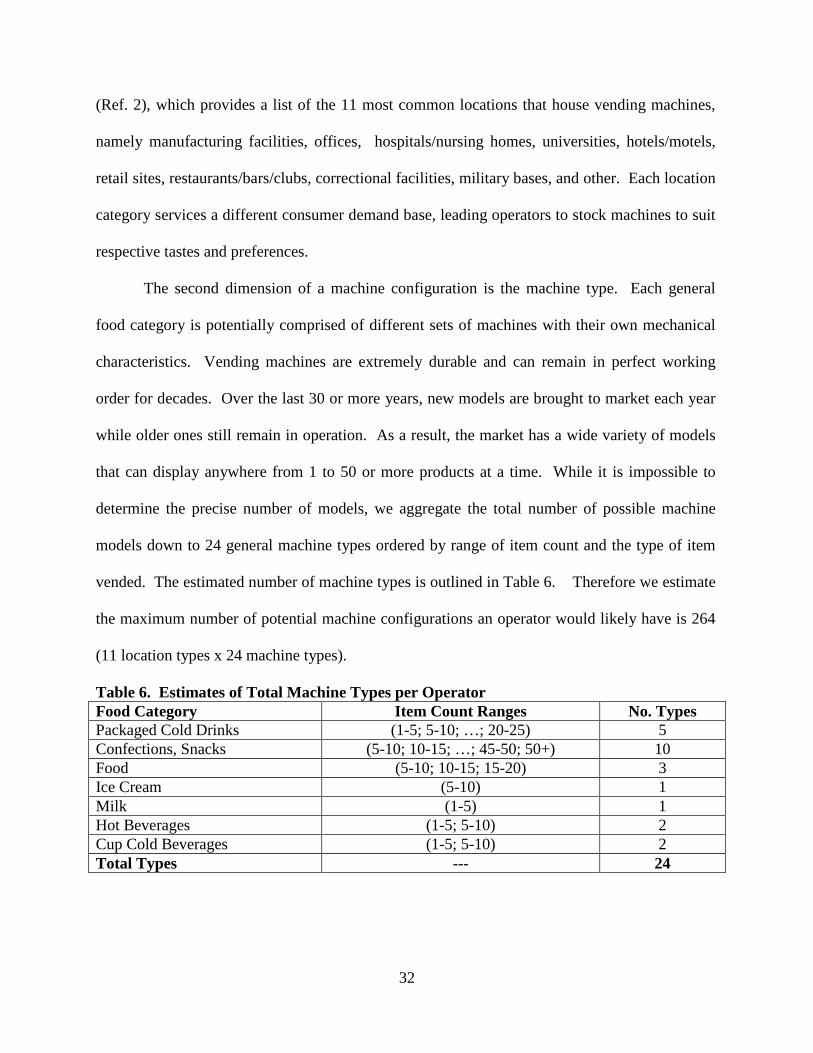
vended. The estimated number of machine types is outlined in Table 6. Therefore we estimate
the maximum number of potential machine configurations an operator would likely have is 264
(11 location types x 24 machine types).
Table 6. Estimates of Total Machine Types per Operator Food Category Item Count Ranges No. Types Packaged Cold Drinks (1-5; 5-10; …; 20-25) 5 Confections, Snacks (5-10; 10-15; …; 45-50; 50+) 10 Food (5-10; 10-15; 15-20) 3 Ice Cream (5-10) 1 Milk (1-5) 1 Hot Beverages (1-5; 5-10) 2 Cup Cold Beverages (1-5; 5-10) 2 Total Types --- 24
33
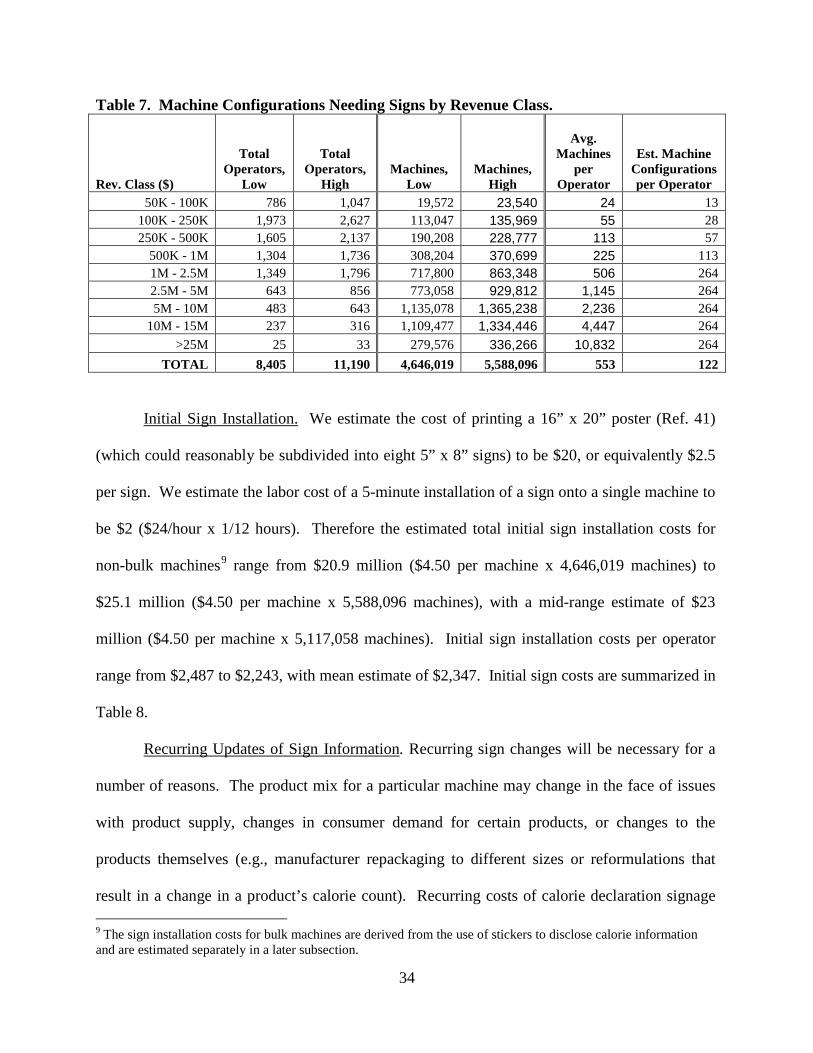
Counts for the total number of operators and non-bulk machines needing signs are used
to estimate the number of machine configurations within each revenue class. As reported in
Table 7, we estimate that the expected number of machine configurations an operator faces
within each revenue class is one of the following, whichever is less:
1) the midpoint of the range between 2 (the minimum identified number of
configurations) and the estimated average number of machines per operator; or
2) 264 (the maximum identified number of configurations).
To illustrate, consider the $50K - $100K revenue class (first row of Table 7). The average
number of machines per operator for that revenue class is 24. The midpoint of the range [2 - 24]
is 13, which is less than 264. Thus the estimated number of machine configurations for this
revenue class is 13. Similarly, consider the $5M - $10M revenue class. The average number of
machines per operator is 2,236. The midpoint of the range [2 – 2,236] is 1,119, which is greater
than 264. Thus the estimated number of machine configurations for this revenue class is 264.
Taking a weighted average of the per-operator machine configuration counts across all revenue
classes (with the share of total operators per revenue class serving as weights) yields an
industry-weighted average estimate of the number of machine configurations of 122.
We estimate the time it takes to enter calorie information into a single sign template and
prepare it for printing to be 0.5 hours. At a vending employee labor cost of $24/hour, the
average cost per operator to create all necessary signs is $1,464 (122 configurations x 0.5 hours
x $24/hour). Therefore the total cost of initial sign creation across all operators ranges from
$12.3 million (8,405 operators x $1,464/operator) to $16.4 million (11,190 operators x
$1,464/operator), with a mid-range estimate of $14.3 million (9,800 operators x
$1,464/operator).
34
Table 7. Machine Configurations Needing Signs by Revenue Class.
Rev. Class ($)
Total Operators,
Low
Total Operators,
High Machines,
Low Machines,
High
Avg. Machines
per Operator
Est. Machine Configurations per Operator
50K - 100K 786 1,047 19,572 23,540 24 13 100K - 250K 1,973 2,627 113,047 135,969 55 28 250K - 500K 1,605 2,137 190,208 228,777 113 57
500K - 1M 1,304 1,736 308,204 370,699 225 113 1M - 2.5M 1,349 1,796 717,800 863,348 506 264 2.5M - 5M 643 856 773,058 929,812 1,145 264 5M - 10M 483 643 1,135,078 1,365,238 2,236 264
10M - 15M 237 316 1,109,477 1,334,446 4,447 264 >25M 25 33 279,576 336,266 10,832 264
TOTAL 8,405 11,190 4,646,019 5,588,096 553 122
Initial Sign Installation. We estimate the cost of printing a 16” x 20” poster (Ref. 41)
(which could reasonably be subdivided into eight 5” x 8” signs) to be $20, or equivalently $2.5
per sign. We estimate the labor cost of a 5-minute installation of a sign onto a single machine to
be $2 ($24/hour x 1/12 hours). Therefore the estimated total initial sign installation costs for
non-bulk machines9 range from $20.9 million ($4.50 per machine x 4,646,019 machines) to
$25.1 million ($4.50 per machine x 5,588,096 machines), with a mid-range estimate of $23
million ($4.50 per machine x 5,117,058 machines). Initial sign installation costs per operator
range from $2,487 to $2,243, with mean estimate of $2,347. Initial sign costs are summarized in
Table 8.
Recurring Updates of Sign Information. Recurring sign changes will be necessary for a
number of reasons. The product mix for a particular machine may change in the face of issues
with product supply, changes in consumer demand for certain products, or changes to the
products themselves (e.g., manufacturer repackaging to different sizes or reformulations that
result in a change in a product’s calorie count). Recurring costs of calorie declaration signage 9 The sign installation costs for bulk machines are derived from the use of stickers to disclose calorie information and are estimated separately in a later subsection.
35
are made up of labor and overhead costs of updating signs to reflect changes made to machines’
product mixes, costs of materials/printing, and labor costs of physical installation.
We estimate the range of machines that will need to have recurring sign changes to be
1.46 million to 1.75 million, with a midpoint estimate of 1.60 million. This range includes only
non-bulk machines that vend confections, snacks, and food (i.e., refrigerated, frozen, can/bowl-
packed, and other shelf-stable meal items). The product mix of beverage machines does not
change on a regular basis; therefore we have excluded beverage machines from the count. With
beverage machines excluded, we estimate the range of machine configurations that face
recurring sign changes to be from 2 to 154 (11 location types x 14 machine types). Using the
same methodology as before (now excluding beverage machines), we estimate an industry-
weighted average of the number of machine configurations of 50. The cost of updating signs is
equivalent to 0.5 hours plus 50% overhead of a vending operation employee’s time, or $12 per
sign. Since there is limited data to indicate precisely how often the information contained on
calorie declaration signs will need to be updated over the course of a year, we estimate a range
from once per year to four times per year (i.e. once per quarter). Therefore, the average annual
cost to update sign content per operator ranges from $600 (50 configurations x 0.5 hours x $24
per hour x 1 updates per year) to $2,400, (50 configurations x 0.5 hours x $24 per hour x 4
updates per year), with a mid-range estimate of $1,200 (50 configurations x 0.5 hours x $24 per
hour x 2 updates per year). The total annual cost for updating information for calorie declaration
signage for all operators ranges from $5.0 million ($600 x 8,405 operators) to $26.9 million
($2,400 x 11,190 operators), with a mid-range estimate of $11.8 million ($1,200 x 9,800
operators).
36
Recurring Sign Replacement. We estimate the time it takes to remove an old sign and
replace it with a new one to be 10 minutes (or 5 minutes for each step). At a labor/overhead rate
for a vending employee of $24, we estimate the cost to physically replace a sign on a single
machine to be $4. Therefore the estimated total recurring sign installation costs for non-bulk
machines range from $9.5 million ($6.5 per machine x 1 replacement per year x 1,455,481
machines) to $45.5 million ($6.5 per machine x 4 replacements per year x 1,750,610 machines),
with a mid-range estimate of $20.8 million ($6.5 per machine x 2 replacements per year x
1,603,046 machines). Recurring sign costs are also summarized in Table 8. It is important to
note that the subtotal for initial sign costs only reflects the cost of the first sign change of the
first year following the effective date of the rule, and does not include the cost of subsequent
sign changes within the first year. The remaining first-year sign change costs are added into the
calculation of total first-year cost in Table 8.
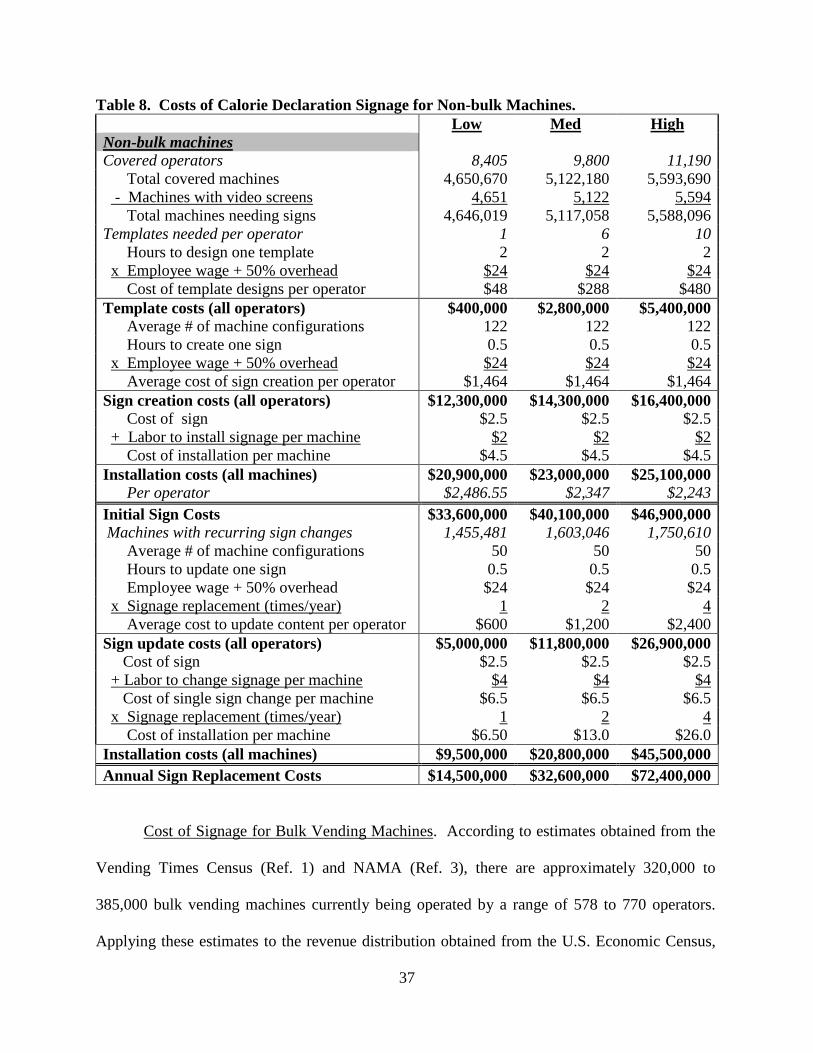
37
Table 8. Costs of Calorie Declaration Signage for Non-bulk Machines. Low Med High Non-bulk machines Covered operators 8,405 9,800 11,190 Total covered machines 4,650,670 5,122,180 5,593,690 - Machines with video screens 4,651 5,122 5,594 Total machines needing signs 4,646,019 5,117,058 5,588,096 Templates needed per operator 1 6 10 Hours to design one template 2 2 2 x Employee wage + 50% overhead $24 $24 $24 Cost of template designs per operator $48 $288 $480 Template costs (all operators) $400,000 $2,800,000 $5,400,000 Average # of machine configurations 122 122 122 Hours to create one sign 0.5 0.5 0.5 x Employee wage + 50% overhead $24 $24 $24 Average cost of sign creation per operator $1,464 $1,464 $1,464 Sign creation costs (all operators) $12,300,000 $14,300,000 $16,400,000 Cost of sign $2.5 $2.5 $2.5 + Labor to install signage per machine $2 $2 $2 Cost of installation per machine $4.5 $4.5 $4.5 Installation costs (all machines) $20,900,000 $23,000,000 $25,100,000 Per operator $2,486.55 $2,347 $2,243 Initial Sign Costs $33,600,000 $40,100,000 $46,900,000 Machines with recurring sign changes 1,455,481 1,603,046 1,750,610 Average # of machine configurations 50 50 50 Hours to update one sign 0.5 0.5 0.5 Employee wage + 50% overhead $24 $24 $24 x Signage replacement (times/year) 1 2 4 Average cost to update content per operator $600 $1,200 $2,400 Sign update costs (all operators) $5,000,000 $11,800,000 $26,900,000 Cost of sign $2.5 $2.5 $2.5 + Labor to change signage per machine $4 $4 $4 Cost of single sign change per machine $6.5 $6.5 $6.5 x Signage replacement (times/year) 1 2 4 Cost of installation per machine $6.50 $13.0 $26.0 Installation costs (all machines) $9,500,000 $20,800,000 $45,500,000 Annual Sign Replacement Costs $14,500,000 $32,600,000 $72,400,000
Cost of Signage for Bulk Vending Machines. According to estimates obtained from the
Vending Times Census (Ref. 1) and NAMA (Ref. 3), there are approximately 320,000 to
385,000 bulk vending machines currently being operated by a range of 578 to 770 operators.
Applying these estimates to the revenue distribution obtained from the U.S. Economic Census,
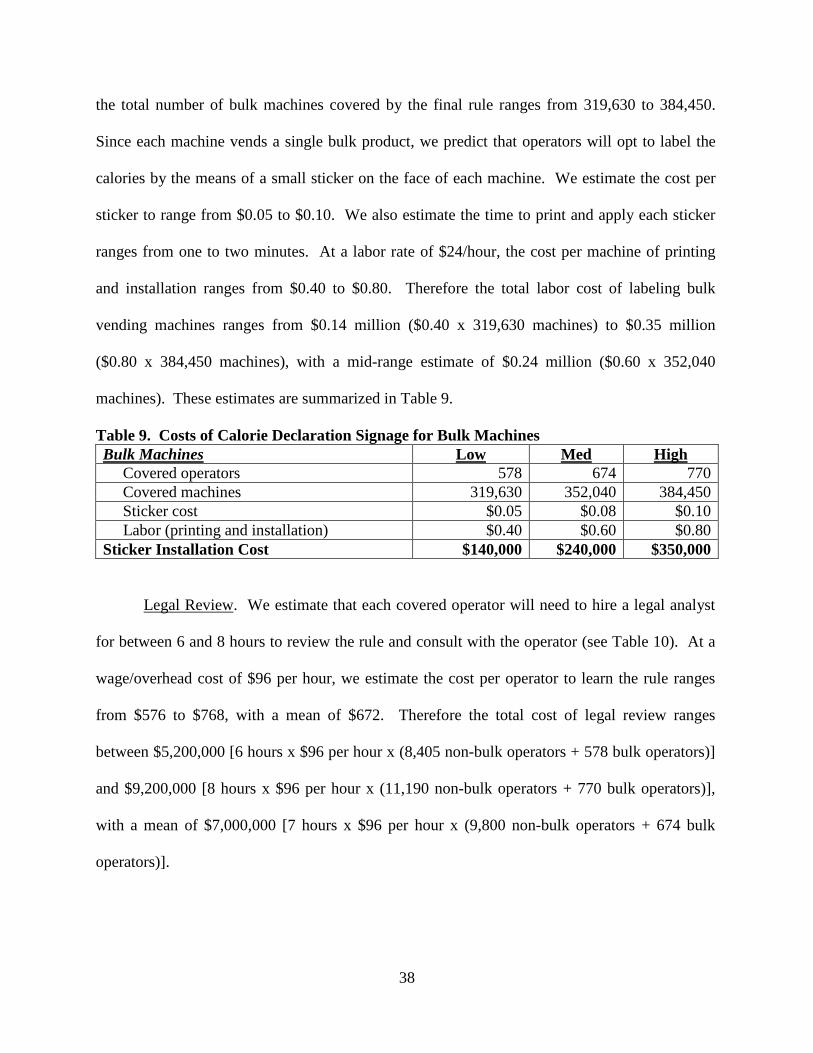
38
the total number of bulk machines covered by the final rule ranges from 319,630 to 384,450.
Since each machine vends a single bulk product, we predict that operators will opt to label the
calories by the means of a small sticker on the face of each machine. We estimate the cost per
sticker to range from $0.05 to $0.10. We also estimate the time to print and apply each sticker
ranges from one to two minutes. At a labor rate of $24/hour, the cost per machine of printing
and installation ranges from $0.40 to $0.80. Therefore the total labor cost of labeling bulk
vending machines ranges from $0.14 million ($0.40 x 319,630 machines) to $0.35 million
($0.80 x 384,450 machines), with a mid-range estimate of $0.24 million ($0.60 x 352,040
machines). These estimates are summarized in Table 9.
Table 9. Costs of Calorie Declaration Signage for Bulk Machines Bulk Machines Low Med High Covered operators 578 674 770 Covered machines 319,630 352,040 384,450 Sticker cost $0.05 $0.08 $0.10 Labor (printing and installation) $0.40 $0.60 $0.80 Sticker Installation Cost $140,000 $240,000 $350,000
Legal Review. We estimate that each covered operator will need to hire a legal analyst
for between 6 and 8 hours to review the rule and consult with the operator (see Table 10). At a
wage/overhead cost of $96 per hour, we estimate the cost per operator to learn the rule ranges
from $576 to $768, with a mean of $672. Therefore the total cost of legal review ranges
between $5,200,000 [6 hours x $96 per hour x (8,405 non-bulk operators + 578 bulk operators)]
and $9,200,000 [8 hours x $96 per hour x (11,190 non-bulk operators + 770 bulk operators)],
with a mean of $7,000,000 [7 hours x $96 per hour x (9,800 non-bulk operators + 674 bulk
operators)].

39
Table 10. Cost of Legal Review Low Med High Hours to review rule 6 7 8 x Labor cost of legal analyst $96 $96 $96 Cost of Legal Review (per operator) $576 $672 $768 Legal Review Costs (all operators, incl. bulk) $5,200,000 $7,000,000 $9,200,000
Vender Contact Information. According to the rule, vending machine operators must
provide their contact information as required by § 101.8(e)(1) (i.e., the vending machine
operator’s name, telephone number, and either mailing or email address) on each vending
machine selling covered vending machine food. The rule will allow vending machine operators
to include their contact information on the face of the vending machine or directly on the calorie
declaration signs. Some states have licensing requirements for vending machine operators, and
some of these licensing requirements already require the vending machine operator’s license or
contact information to be available on the vending machine. If the contact information
displayed due to state or local requirements does not include all of the information required by
§ 101.8(e)(1), the vending machine operator must add the missing pieces of contact information.
Thus, for vending machine operators that do not already have a sign or label with contact
information, any additional cost making contact information available will be absorbed into the
initial sign design costs10.
The total estimated costs of calorie declarations are given in Table 11. Annualized costs
are calculated by dividing the total 20-year present discounted value of costs by the appropriate
10 With regard to electronic vending machines with the capability of displaying contact information or machines with glass fronts with products that all have compliant front-of-package labeling, we acknowledge that there may be some small additional cost burden associated with having to print an extra sticker to display contact information for some machines. Due to the lack of data required to precisely estimate this cost, we acknowledge that our estimates may slightly underestimate the true cost.
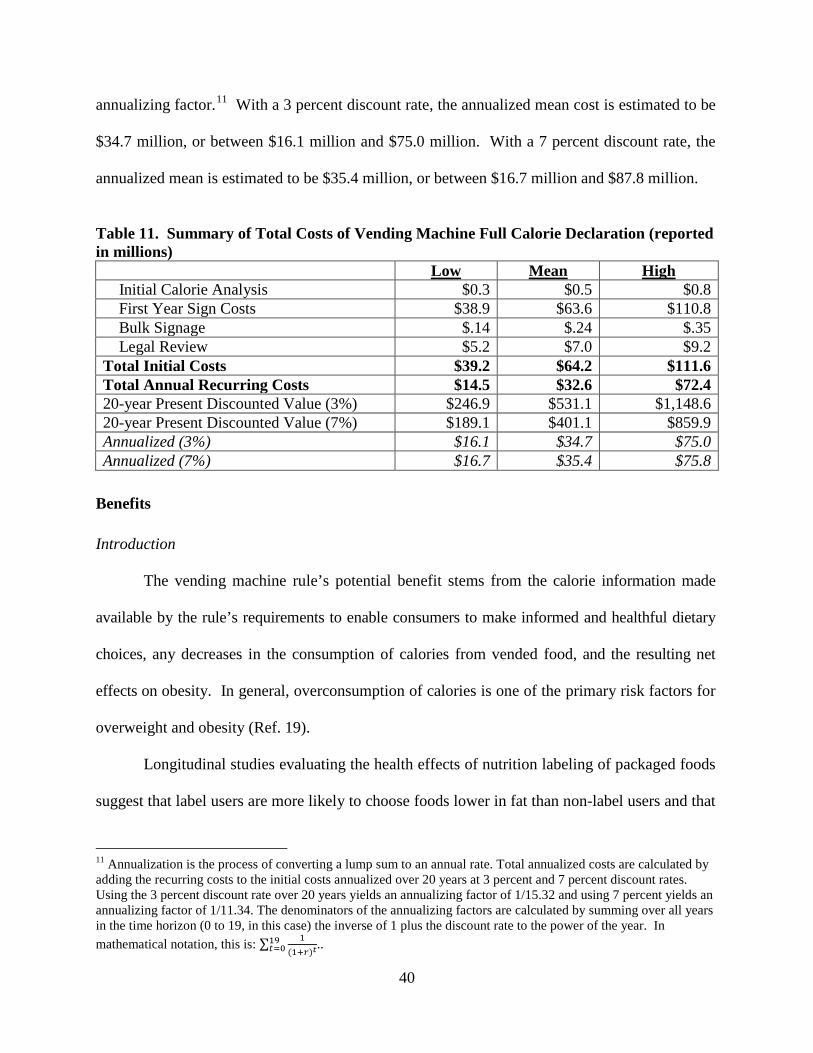
40
annualizing factor.11 With a 3 percent discount rate, the annualized mean cost is estimated to be
$34.7 million, or between $16.1 million and $75.0 million. With a 7 percent discount rate, the
annualized mean is estimated to be $35.4 million, or between $16.7 million and $87.8 million.
Table 11. Summary of Total Costs of Vending Machine Full Calorie Declaration (reported in millions) Low Mean High Initial Calorie Analysis $0.3 $0.5 $0.8 First Year Sign Costs $38.9 $63.6 $110.8 Bulk Signage $.14 $.24 $.35 Legal Review $5.2 $7.0 $9.2 Total Initial Costs $39.2 $64.2 $111.6 Total Annual Recurring Costs $14.5 $32.6 $72.4 20-year Present Discounted Value (3%) $246.9 $531.1 $1,148.6 20-year Present Discounted Value (7%) $189.1 $401.1 $859.9 Annualized (3%) $16.1 $34.7 $75.0 Annualized (7%) $16.7 $35.4 $75.8
Benefits
Introduction
The vending machine rule’s potential benefit stems from the calorie information made
available by the rule’s requirements to enable consumers to make informed and healthful dietary
choices, any decreases in the consumption of calories from vended food, and the resulting net
effects on obesity. In general, overconsumption of calories is one of the primary risk factors for
overweight and obesity (Ref. 19).
Longitudinal studies evaluating the health effects of nutrition labeling of packaged foods
suggest that label users are more likely to choose foods lower in fat than non-label users and that
11 Annualization is the process of converting a lump sum to an annual rate. Total annualized costs are calculated by adding the recurring costs to the initial costs annualized over 20 years at 3 percent and 7 percent discount rates. Using the 3 percent discount rate over 20 years yields an annualizing factor of 1/15.32 and using 7 percent yields an annualizing factor of 1/11.34. The denominators of the annualizing factors are calculated by summing over all years in the time horizon (0 to 19, in this case) the inverse of 1 plus the discount rate to the power of the year. In mathematical notation, this is: ∑ 1
(1+𝑟)𝑡19𝑡=0 ..
41
nutrition labels are associated with a reduction in body weight (Refs. 42;43;44). The literature
on access to vending machines and its relation to body weight is very limited and has focused
mostly on soft drink consumption, with a particular emphasis on how soda taxes reduce the
demand for such beverages. However, this literature provides evidence that consumption of
sugar-sweetened beverages and other common types of vended foods, such as candies, cookies,
and chips results in higher energy intake, lower nutrient intake, and increased weight gain and
risk for obesity among the U.S. population (Refs. 45;46;47;48;49).
Kakarala and colleagues (2010) estimated that the consumption of sugar-sweetened
beverages and snack items contributes about an additional 250 calories per day among the
overweight and obese population, and Krebs-Smith (2001) estimated that we can attribute about
20 percent of that extra calorie intake to items purchased from vending machines (Refs. 50;51).
Twenty percent of 250 calories amounts to 50 calories per day from items purchased from
vending machines. Another study found that 71 percent of middle school students who used
vending machines at school purchased sugar-sweetened beverages (Ref. 52). We note that these
studies do not use a sample representative of the United States population and, thus, they may
over- or under-estimate calorie intake from foods sold from vending machines. In addition,
many potential substitutes to sugar-sweetened beverages and snack items typically have a
similar number of calories per serving. For example, 12 ounces (oz.) of fruit juice or reduced-fat
2-percent milk contain a similar number of calories as 12 oz. of sugar-sweetened beverage (140
calories). In other words, calorie labeling may not necessarily drive substitution toward lower
calorie items.
Nutrition labeling provides consumers with information they can use to compare food
products, make informed dietary choices, and ultimately build a healthy diet that conforms to
42
federal dietary recommendations, their nutritional preferences, or both. The costs of consuming
a poor diet include the value of the quality of life lost to illness and other sources of disutility,
such as taking medications every day, as well as the value of years-of-life-lost (YLL) from
premature death. The costs of consuming a poor diet also include the net lifetime cost of
treating the diseases caused or exacerbated by poor diet. We expect that the final rule’s purpose
to provide consumers with calorie information in a direct and accessible manner to enable
consumers to make informed and healthful dietary choices may lead to changes in food choice,
which would result in changes in calorie intake and possibly health. The benefits of the final
rule would come from consumer welfare gains primarily due to increases in health and longevity
generated by improvements in overall diet.
We currently lack the data to accurately quantify the benefits for the vending machine
labeling final rule. First, there is limited literature evaluating the potential association between
calorie labeling of vending machines and health outcomes. Second, it is unclear what proportion
of current foods in vending machines already have “clear and conspicuous” calorie labeling as
required by the final rule. Thus, it is difficult to estimate what effect the vending machine
labeling final rule may have. In addition, food purchased from vending machines only makes up
0.3 percent of average total calorie intake. Therefore, any benefit accrued to an individual
consumer would necessarily be mathematically very small. Without more information, it is best
to look at benefits qualitatively. In this section we present a qualitative discussion of potential
benefits of the rule. We provide an illustrative exposition of quantified benefits in Section VI:
Technical Appendix by extrapolating from consumer willingness to pay for nutrition facts
labeling of packaged foods to estimate the consumer willingness to pay for vending machine
labeling.
43
Sources of Benefits
Effects on Health. Calorie information for covered vending machine food and potential
changes in nutrient intake could reduce the risk of mortality or death and prolong life by
reducing the incidence and severity of chronic diseases associated with consuming a poor diet
(Refs. 53;54;55). Decreases in the prevalence and severity of diet-related morbidities such as
diabetes and CVD will improve the quality of life and increase the productivity of individuals
who use food labeling to choose healthier food products and construct a better diet.
Reformulation. To the extent that the final rule increases consumer interest in lower
calorie options and the transparency about the caloric content of vended food items,
manufacturers may have an incentive to reformulate products sold in vending machines to reduce
calorie content or decrease portion sizes and vending machine operators may have an incentive
to stock machines with lower calorie items.12 If as a result of reformulation in response to the
final rule, consumers reduce their intake of calories from vended food, then the overall health of
consumers could increase.
Medical costs. We have not quantified the effects of the final rule on medical spending
in this analysis because we have not attempted to estimate the effect of the final rule on the
incidence of diet-related disease. If the requirements of the final rule improve diet quality and
reduce the prevalence of chronic diet-related diseases, then consumers would spend less on
medical treatment of these diseases.
Individuals with diet-related diseases incur considerable monetary costs for prescription
drugs, medical treatments, exams, consultations, lab work, and so on. The estimated medical
cost associated with diet-related chronic conditions (CHD, stroke, type 2 diabetes, obesity, and
12 In this analysis we use reformulation to mean both the changes in product recipes made by manufacturers and the changes in the mix of products stocked by vending machine operators.
44
hypertension) ranges from $19 billion to $190 billion, with the medical costs associated with
CHD and obesity being considerably higher than those of stroke or hypertension (Refs.
56;57;58). Given that over the next 20 to 40 years the prevalence of type 2 diabetes and
cardiovascular disease will likely continue to increase, the costs of treating these diseases will
also likely increase (Refs. 59;60;61).
Uncertainty of Costs and Benefits
The primary source of variation in the costs presented in this analysis stems from the
uncertainty surrounding the frequency that signs will need to be replaced. Different operators
will have different strategies to minimize the costs of sign replacement. Snack, confection, and
food machines will experience the most variability in the products they vend. We model this
uncertainty using a range for the duration of a product mix cycle.
C. OPTION 2: SIMILAR TO THE FINAL RULE, BUT WITH AN ADDITIONAL YEAR OF COMPLIANCE TIME ONLY FOR VENDING MACHINE OPERATORS WITH LESS THAN $500,000 IN ANNUAL REVENUE
Costs
We have chosen to make the final rule effective two years after publication for all
covered vending machine operators. Option 2, which was not adopted, would give only smaller
operators the additional year to comply with the final requirements. Given the recurring nature
of the costs, giving smaller operators more time to come into compliance would, in effect,
relieve these operators from the costs of compliance for an additional year. From the 2007
Economic Census, 52 percent of covered vending machine operators with 20 or more machines
had sales less than $500,000, which implies that at least 4,700 to 6,200 covered operators would
have extra time to comply. Based on the share of sales, we estimate that the vending machine
operators with sales below $500,000 account for approximately 7 percent of vending machines.
45
Delaying the 20-year cost stream for these operators by one year would result in a mean cost
reduction of $3.6 million under a 3 percent discount rate, with a range of $1.7 million to $7.6
million. Under a 7 percent discount rate, the mean cost reduction would be $6.3 million, ranging
from $3.0 million to $12.8 million.
Benefits
Delaying the compliance time for a subset of vending machine operators will delay the
benefits to consumers of vended food items from a small subset (7 percent) of covered
machines.
D. OPTION 3: SIMILAR TO THE FINAL RULE, BUT ESTIMATING THE COST OF ALLOWING MACHINE SIGNAGE TO DISPLAY ALL PRODUCTS VENDED BY THE OPERATOR, INSTEAD OF MACHINE-SPECIFIC SIGNAGE
Costs
Operators with a large number of machines typically design different products mixes to
suit the tastes and preferences of consumers in different locations. We now consider the costs of
an option to allow vending machine operators to create more general signs that are tailored to the
operator’s portfolio of available products within each general food category, rather than being
tailored to suit a specific product mix within each individual machine. For example, a vending
machine operator could create a single sign that lists the calorie information of all snack
products the company sells in all locations, which could be installed ubiquitously on all snack
machines the vending machine operator operates. This would significantly reduce the costs of
sign creation in terms of labor hours expended to update information content. This option would
only affect the cost of signage for non-bulk machines. This option could have the potential
downside of causing the calorie declarations for food vended from a particular machine,
depending on the number of products on the “long list” and other factors, to no longer be clear
46
and conspicuous, prominently placed, and likely to be read and understood by the ordinary
individual under customary conditions of purchase and use. As such, the calorie declarations for
food vended from a particular machine would not meet the requirements of the Act and this final
rule. We report updated estimates for this option in Table 12.
Under the “long list” option for calorie declaration signage, the estimated number of
machine configurations would be reduced to the number of general product categories of an
operator’s available products for sale. This number is equivalent to the number of sign
templates the average operator would need to create estimated in Section B. Thus we estimate
the average number of machine configurations under Option 3 to be 5 per operator. A longer list
would require more labor time to update, so we estimate the time it takes for a vending
employee to update one sign to be 1 hour. This reduces the average cost of sign creation per
operator to be $120 (5 machine configurations x 1 hour x $24/hour). Therefore we estimate the
total sign creation costs for all operators to range from $1.0 million ($120 x 8,405 operators) to
$1.3 million ($120 x 11,190 operators), with a mean estimate of $1.2 million ($120 x 9,800
operators).
Similarly, recurring sign creation costs would be reduced. Considering only snack,
confection, and food machines, we estimate the average number of machine configurations
under Option 3 to be 3 per operator. This reduces the average recurring cost of sign creation per
operator to a range of $72 (3 machine configurations x 1 hour x $24/hour x 1 update/year) to
$288 (3 machine configurations x 1 hour x $24/hour x 4 updates/year), with a mean of $144 (3
machine configurations x 1 hour x $24/hour x 2 updates/year). Therefore we estimate the total
recurring sign creation costs for all operators under Option 3 to range from $0.6 million ($72 x
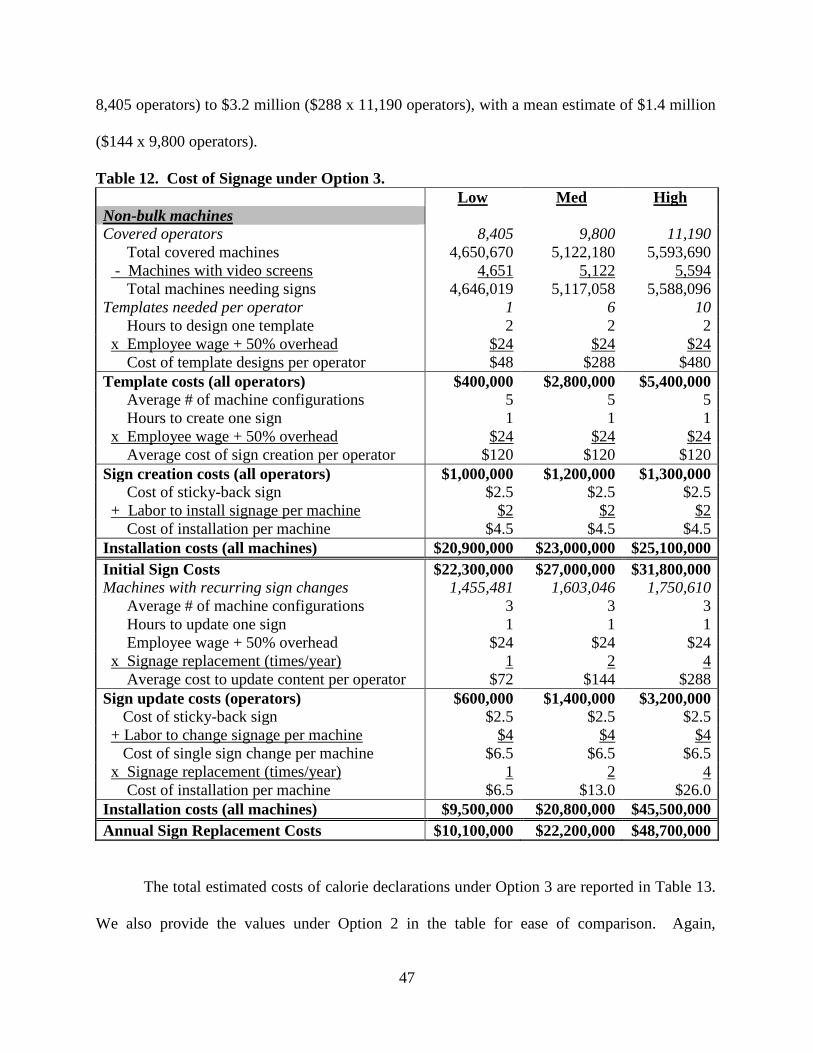
47
8,405 operators) to $3.2 million ($288 x 11,190 operators), with a mean estimate of $1.4 million
($144 x 9,800 operators).
Table 12. Cost of Signage under Option 3. Low Med High Non-bulk machines Covered operators 8,405 9,800 11,190 Total covered machines 4,650,670 5,122,180 5,593,690 - Machines with video screens 4,651 5,122 5,594 Total machines needing signs 4,646,019 5,117,058 5,588,096 Templates needed per operator 1 6 10 Hours to design one template 2 2 2 x Employee wage + 50% overhead $24 $24 $24 Cost of template designs per operator $48 $288 $480 Template costs (all operators) $400,000 $2,800,000 $5,400,000 Average # of machine configurations 5 5 5 Hours to create one sign 1 1 1 x Employee wage + 50% overhead $24 $24 $24 Average cost of sign creation per operator $120 $120 $120 Sign creation costs (all operators) $1,000,000 $1,200,000 $1,300,000 Cost of sticky-back sign $2.5 $2.5 $2.5 + Labor to install signage per machine $2 $2 $2 Cost of installation per machine $4.5 $4.5 $4.5 Installation costs (all machines) $20,900,000 $23,000,000 $25,100,000 Initial Sign Costs $22,300,000 $27,000,000 $31,800,000 Machines with recurring sign changes 1,455,481 1,603,046 1,750,610 Average # of machine configurations 3 3 3 Hours to update one sign 1 1 1 Employee wage + 50% overhead $24 $24 $24 x Signage replacement (times/year) 1 2 4 Average cost to update content per operator $72 $144 $288 Sign update costs (operators) $600,000 $1,400,000 $3,200,000 Cost of sticky-back sign $2.5 $2.5 $2.5 + Labor to change signage per machine $4 $4 $4 Cost of single sign change per machine $6.5 $6.5 $6.5 x Signage replacement (times/year) 1 2 4 Cost of installation per machine $6.5 $13.0 $26.0 Installation costs (all machines) $9,500,000 $20,800,000 $45,500,000 Annual Sign Replacement Costs $10,100,000 $22,200,000 $48,700,000
The total estimated costs of calorie declarations under Option 3 are reported in Table 13.
We also provide the values under Option 2 in the table for ease of comparison. Again,

48
annualized costs are calculated by dividing the 20-year present value by the associated
annualization factor at 3 percent and 7 percent discount rates. With a 3 percent discount rate
over 20 years, the annualized mean cost is estimated to be $23.7 million, or between $11.3
million and $50.7 million. With a 7 percent discount rate over 20 years, the annualized mean is
estimated to be $24.3 million, or between $11.7 million and $51.3 million.
Table 13. Cost Comparison Option 3 vs. Final Rule (reported in millions). Option 3 – “Long List” Final Rule – “Short List” Low Mean High Low Mean High Initial Calorie Analysis $0.3 $0.5 $0.8 $0.3 $0.5 $0.8 First Year Sign Costs $27.6 $45.3 $77.9 $38.9 $63.6 $110.8 Total Initial Costs $27.9 $45.8 $78.7 $39.2 $64.2 $111.6 Total Annual Recurring Costs $10.1 $22.2 $48.7 $14.5 $32.6 $72.4 20-year Present Value (3%) $172.6 $363.8 $776.2 $246.9 $531.1 $1,148.6 20-year Present Value (7%) $132.3 $275.3 $582.0 $189.1 $401.1 $859.9 Annualized (3%) $11.3 $23.7 $50.7 $16.1 $34.7 $75.0 Annualized (7%) $11.7 $24.3 $51.3 $16.7 $35.4 $75.8
Benefits
Under the “long list” option consumers could have a larger set of food items to search
through when they use the calorie information on the sign. To the extent that the additional
search time and effort decrease the willingness of consumers to seek and use calorie information,
the benefits under Option 3 will be lower than the benefits of the final rule.
III. REGULATORY FLEXIBILITY ANALYSIS
A. INTRODUCTION
FDA has examined the economic implications of the final vending machine labeling rule as
required by the Regulatory Flexibility Act (5 U.S.C. §§ 601-612). If a rule has a significant
economic impact on a substantial number of small entities, the Regulatory Flexibility Act
requires agencies to analyze regulatory options that would lessen the economic effect of the rule
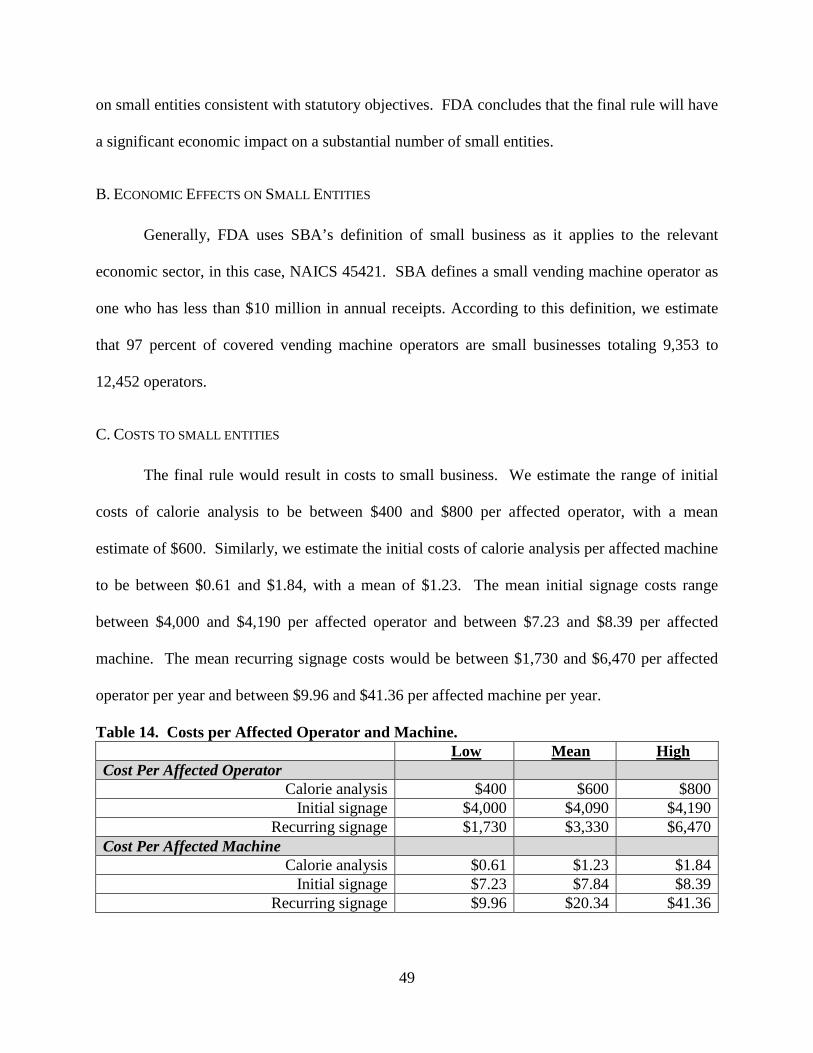
49
on small entities consistent with statutory objectives. FDA concludes that the final rule will have
a significant economic impact on a substantial number of small entities.
B. ECONOMIC EFFECTS ON SMALL ENTITIES
Generally, FDA uses SBA’s definition of small business as it applies to the relevant
economic sector, in this case, NAICS 45421. SBA defines a small vending machine operator as
one who has less than $10 million in annual receipts. According to this definition, we estimate
that 97 percent of covered vending machine operators are small businesses totaling 9,353 to
12,452 operators.
C. COSTS TO SMALL ENTITIES
The final rule would result in costs to small business. We estimate the range of initial
costs of calorie analysis to be between $400 and $800 per affected operator, with a mean
estimate of $600. Similarly, we estimate the initial costs of calorie analysis per affected machine
to be between $0.61 and $1.84, with a mean of $1.23. The mean initial signage costs range
between $4,000 and $4,190 per affected operator and between $7.23 and $8.39 per affected
machine. The mean recurring signage costs would be between $1,730 and $6,470 per affected
operator per year and between $9.96 and $41.36 per affected machine per year.
Table 14. Costs per Affected Operator and Machine. Low Mean High Cost Per Affected Operator
Calorie analysis $400 $600 $800 Initial signage $4,000 $4,090 $4,190
Recurring signage $1,730 $3,330 $6,470 Cost Per Affected Machine
Calorie analysis $0.61 $1.23 $1.84 Initial signage $7.23 $7.84 $8.39
Recurring signage $9.96 $20.34 $41.36
50
D. REGULATORY OPTIONS
Allowing Small Entities to List All Relevant Products on Declaration Signage
We recognize that it may be more difficult for some small entities to regularly update
calorie declaration signage in the face of regular changes to machines’ product mixes. Allowing
operators to include all calorie information for all products sold in machines of similar type (i.e.
machines that vend items within the same general category), as opposed to requiring signs
specifically tailored to the product mix found within each individual machine, would
substantially reduce the cost to small entities.
It is also important to note that there is some flexibility in how entities must comply with
the regulation. The wide range in cost estimates is a function of the variety of approaches
(printing methods, sign design, etc.) that businesses may choose to take to comply with the final
requirements. Therefore, businesses may choose from among a wide variety of less or more
expensive avenues of calorie declaration for compliance, depending on their situation.
E. SUMMARY
Under the Regulatory Flexibility Act (5 U.S.C. 606(b)), we conclude that the final rule
will have a significant economic impact on a substantial number of small entities.
IV. UNFUNDED MANDATES
Section 202(a) of the Unfunded Mandates Reform Act of 1995 requires that agencies
prepare a written statement, which includes an assessment of anticipated costs and benefits,
before proposing “any rule that includes any Federal mandate that may result in the expenditure
by State, local, and tribal governments, in the aggregate, or by the private sector, of
$100,000,000 or more (adjusted annually for inflation) in any one year.” The current threshold
51
after adjustment for inflation is $141 million, using the most current (2013) Implicit Price
Deflator for the Gross Domestic Product. FDA has determined that the final vending machine
labeling rule will not meet the threshold under the Unfunded Mandates Reform Act.
52
V. TECHNICAL APPENDIX
In this section, we present a quantitative estimation of the potential benefits of the
vending machine labeling final rule. This estimation is based upon results from a model
formulated by Abaluck (2011) that measures the effect of NLEA and consumer willingness to
pay (WTP) for such nutrition information (Ref. 62). In our model, we adjust the base WTP
estimates for NLEA nutrition labeling within the context of vending machine labeling.
Furthermore, we present estimates of the potential health effects of an improvement in diet as a
result of the final rule. Related benefits modeling has been applied in the PRIA of the proposed
rulemakings on nutrition facts labels and serving sizes for packaged foods (79 FR 11879 and 79
FR 11989, March 3, 2014; joint PRIA available at
http://www.fda.gov/downloads/food/guidanceregulation/guidancedocumentsregulatoryinformati
on/labelingnutrition/ucm385669.pdf) and may also be applied to future nutrition information-
related rulemakings. As such, we will continue to review and evaluate our approach to modeling
benefits from this type of intervention.
Welfare estimates
Using the parameters and assumptions discussed in the following sections, we estimate the
welfare gain (benefit) from the final vending machine labeling rule, ,tB using the formula
Bt = s1 × ΔW × POPt (0)
Here ΔW represents Abaluck’s (2011) estimate of the annual welfare gain per label user
from “additional labeling”, which includes certain categories of food labeling not covered by this
rule;13 s1 represents the scale factor to adjust for differences between Abaluck’s (2011) estimate
13 These estimates do not account for any diminishing returns to information that may be experienced by consumers. That is, these estimates were generated around the implementation of NLEA, when there was little to no standard
53
of the welfare gains from “additional labeling” relative to the gains attributable to the vending
machine labeling final rule, including differences in the types of foods covered, baseline
assumptions on the prevalence of vending machine labeling in the absence of the final rule, and
prevalence of menu labeling use based on the share of individuals in the NHANES 2007-2008
survey who indicated they would use restaurant menu labels14; and POPt is the (adult or child
and adolescent) population of the United States in period t.15
Calibrating Abaluck’s Estimates for Additional Labeling to Effects of the Final Rule.
To obtain estimates of the effect of the final rule on consumer welfare, we extrapolate from
the welfare effects estimated in a retrospective study conducted by Abaluck on the impact
brought about by NLEA (Ref. 65). Abaluck measured the consumer welfare gains as the
willingness to pay for nutrient content based on revealed preference data, i.e., food consumption
and prices. He estimated that extending nutrition labeling to restaurant foods, meats, vegetables,
and fruits that do not already have labeling could lead to an average increase in consumer
welfare of $116 (converted to 2011 dollars) per label user per year (i.e. ΔW in equation 1).
It is important to note that some vending machine foods may already provide calorie
information in accordance with section 403(q)(5)(H)(viii) of the FD&C Act and § 101.8(b) (e.g.,
nutritional information provided on any foods. Now, most packaged foods are required to carry the standard Nutrition Facts Label. Thus, consumers may be more aware of what is in all foods, including restaurant foods, than they previously were. We do not adjust these estimates because there is little information to quantify such a diminishing returns effect, and, in fact, there are studies which suggest consumers are still unable to accurately quantify the calories in a prepared meal, post NLEA (Refs. 63;64). 14 NHANES does not explicitly survey calorie labeling for vending machines. In our analysis we use data on the usage of calorie labeling on menus as a proxy. 15 We assume that parents purchase food with their children’s health in mind. However, we do not know how often children (under 18 years of age) purchase foods at covered establishments without their parents present. In the absence of better data, we assume that children and adolescents (under 18 years of age) value nutritional information provided by menu labeling equally with or without a parent or guardian present. It is possible that adolescents in particular have a different willingness to pay for nutrition labeling, possibly due to peer influences or self-perception of body weight (Refs. 11;12). If children and adolescents (or parents purchasing on their behalf) have a smaller willingness to pay than adult females purchasing for themselves, the presented benefits may be somewhat overstated. If children and adolescents have a larger willingness to pay, the presented benefits may be somewhat understated.
54
foods that carry front-of-package calorie information) and therefore a vending machine operator
would not be required to provide calorie declarations for such foods under the final rule.
Therefore, we model the welfare gains of increased information of vending machine labeling to
be proportional to those derived by Abaluck, since the increase in information used by Abaluck
to derive his total welfare gains is also not based on a 100 percent increase in new information.
We use several factors to determine a reasonable range for the relative effect of the final vending
machine rule requirements as compared to no labeling requirements. We estimate that the share
of the benefits from more labeling attributable to vending machine labeling varies in proportion
to: (i) the share of energy consumption from food away from home, (ii) the share of food
consumption from vending machines covered by the final rule, (iii) the share of vended food
items that have yet to meet the requirements of the vending machine labeling rule, and (iv) the
prevalence of use of calorie information provided in menu labeling16.
In the analysis of the costs of the final rule, we estimate that 1–5 percent of vended items
will need calorie analysis and that 5–10 percent of vended products already provide calorie
information in accordance with section 403(q)(5)(H)(viii) of the FD&C Act and § 101.8(b) (e.g.,
foods that carry front-of-package calorie information) and therefore would not be subject to the
requirements of the final rule.
Using data from the 2007-2008 National Health and Nutrition Examination Survey
(NHANES), Parks (2012) estimated that approximately 53 percent of American adults would use
calorie information provided in menu labeling (Ref. 65). Of those individuals with children, 57
percent indicated that they would use calorie information provided in menu labeling (Ref. 65).
We expect that consumers are equally willing to use calorie labeling on vending machines. To
the extent that consumers are less (or more) likely to use nutrition information for vended food 16 See footnote 18.
55
items than they are for restaurant food items, our estimates will overstate (or understate) the
benefits of the final rule. Given this uncertainty, we use a range between 45 and 60 percent as
our estimate of the proportion of adults that would use calorie labeling on vending machines. The
upper bound of 60 percent is used to approximate a symmetric range around 53 percent.
Similarly, we use a range between 50 and 65 percent as our estimate of the proportion of adults
with children that would use calorie labeling on vending machines.
To adjust for Abaluck’s inclusion of calories consumed in his willingness-to-pay
estimates that would not be affected by this final rule, we estimate the ratio of the share of
calories consumed that will be affected by the vending machine labeling final rule to the share of
calories considered in Abaluck’s welfare gains from “additional labeling”. Adults in the United
States consume 31 percent of daily total energy or kilocalorie intake from food consumed away
from home (FAFH), and 69 percent of calories from food consumed at home (FAH) (Ref. 66).
We estimate that up to 8.1 percent of the average American’s daily calories come from the
consumption of fresh fruits and vegetables.17 The USDA FSIS regulates labeling of certain
meat, certain poultry, and certain egg products (Ref. 67). Using Table 2-2 (p. 12) of the Dietary
Guidelines for Americans, 2010 (Ref. 22), we estimate that approximately 353 of the 2,157
calories (16.4 percent) an average American consumes daily come from foods that may be
regulated by the USDA if they are purchased for consumption at home. Given that some of these
foods may come from restaurants or similar retail food service establishments, and that
approximately 69 percent of average total daily calories come from food at home (i.e., store
bought food), we estimate that 11.3 percent (= 0.69 × 0.164) of daily calories come from USDA
labeled food at home. Thus, up to 50.8 percent (= 31.4% FAFH + 11.3% USDA + 8.1% Fruits &
17 U.S. Department of Agriculture, Economic Research Service. Food Availability (Per Capita) Data System. Last updated: 11-7-2012. Available at: http://www.ers.usda.gov/data-products/food-availability-%28per-capita%29-data-system.aspx#.UXq6CYaUNhE
56
Veg.) of daily calories come from foods evaluated in the estimate of welfare gains for “additional
labeling".
We estimate that 0.33 percent of the average adult’s (ages 15 and up) total daily calorie
intake comes from vended food items, which likely would be covered to the extent that such
foods are sold in covered vending machines. Similarly, we estimate that 0.09 percent of the
average child’s (ages 14 and younger) total daily calorie intake comes from vended food items.
Thus, less than 1 percent (= 0.33/50.8 for adults and =0.09/50.8 for children) of calories from
foods evaluated in the welfare gains for “additional labeling” come from vended food.18
Another consideration in extrapolating from Abaluck’s willingness-to-pay estimates for
“additional labeling” is that his estimates are based on labeling containing the nutrition
information provided on the Nutrition Facts label, which is more than the amount of information
that will be provided for foods from vending machines by this final rule. A product’s calorie
content is one of 13 principal pieces of nutrition information that manufacturers must declare in
the Nutrition Facts label.19 Thus the final rule requires that vending machine operators provide
approximately 7.7 percent of the information at the point of purchase that manufacturers must
list in the Nutrition Facts label. If, as is likely, consumers focus on calorie content of nutrition
labels more than the other nutrients or serving size information then the final rule would
represent a larger increase in the amount of nutrition information available to consumers at the
point of purchase. For other reasons (e.g. characteristics in the context in which decisions are
made), it is also possible that the final rule would represent a smaller increase in the effective 18 This calorie adjustment may produce overestimates of rule-induced benefits if the high-calorie content of vending machine food is correlated with low consumer inclination to care about health and thus use labels (relative to the population that tends to eat more grocery store food). 19 Under NLEA, manufacturers are required to declare serving size, calories, total fat, saturated fat, trans fat, cholesterol, sodium, protein, carbohydrates, sugars, dietary fiber, iron, vitamin A, vitamin C, and Calcium in the Nutrition Facts label. Manufacturers are also required to state “* Percent Daily Values are based on a 2,000 calorie diet. Your daily values may be higher or lower depending on your calorie needs” in the footnote section of the Nutrition Facts label. (21 CFR 101.9)
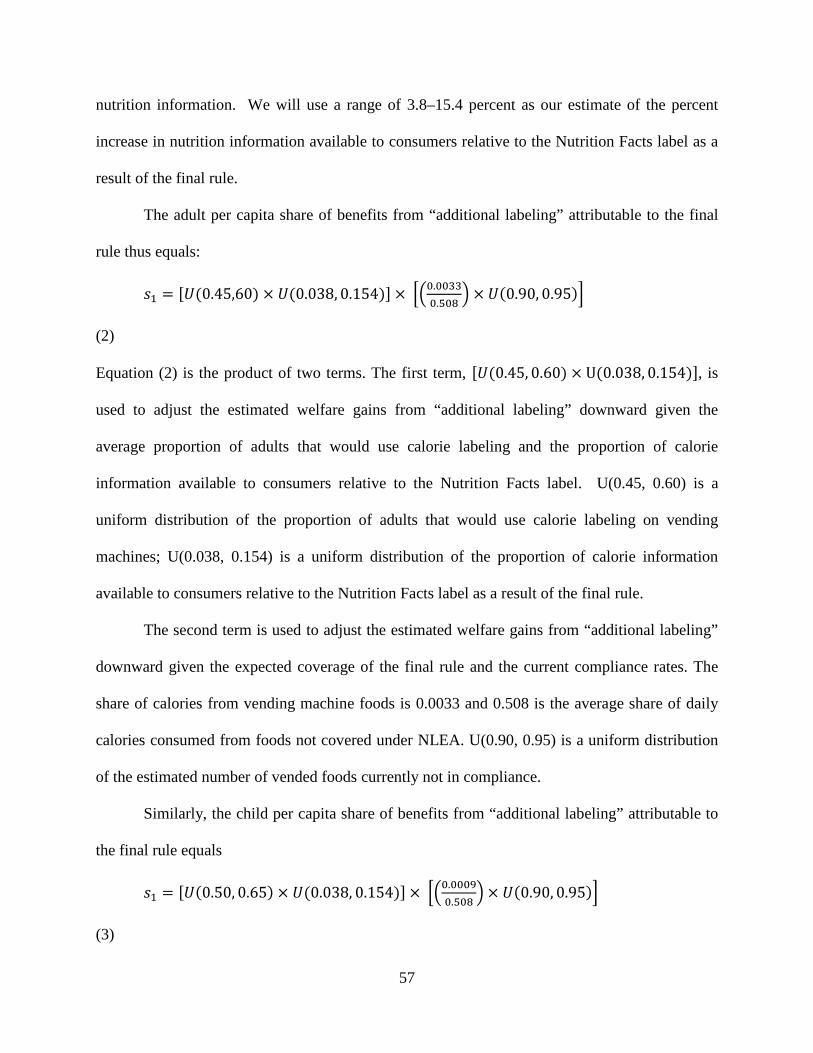
57
nutrition information. We will use a range of 3.8–15.4 percent as our estimate of the percent
increase in nutrition information available to consumers relative to the Nutrition Facts label as a
result of the final rule.
The adult per capita share of benefits from “additional labeling” attributable to the final
rule thus equals:
𝑠1 0.508 = [𝑈(0.45,60) × 𝑈(0.038, 0.154)] × ��0.0033� × 𝑈(0.90, 0.95)�
(2)
Equation (2) is the product of two terms. The first term, , is
used to adjust the estimated welfare gains from “additional labeling” downward given the
average proportion of adults that would use calorie labeling and the proportion of calorie
information available to consumers relative to the Nutrition Facts label. U(0.45, 0.60) is a
uniform distribution of the proportion of adults that would use calorie labeling on vending
machines; U(0.038, 0.154) is a uniform distribution of the proportion of calorie information
available to consumers relative to the Nutrition Facts label as a result of the final rule.
The second term is used to adjust the estimated welfare gains from “additional labeling”
downward given the expected coverage of the final rule and the current compliance rates. The
share of calories from vending machine foods is 0.0033 and 0.508 is the average share of daily
calories consumed from foods not covered under NLEA. U(0.90, 0.95) is a uniform distribution
of the estimated number of vended foods currently not in compliance.
Similarly, the child per capita share of benefits from “additional labeling” attributable to
the final rule equals
[𝑈(0.45, 0.60) × U(0.038, 0.154)]
𝑠1 0.508
(3)
= [𝑈(0.50, 0.65) × 𝑈(0.038, 0.154)] × ��0.0009�× 𝑈(0.90, 0.95)�
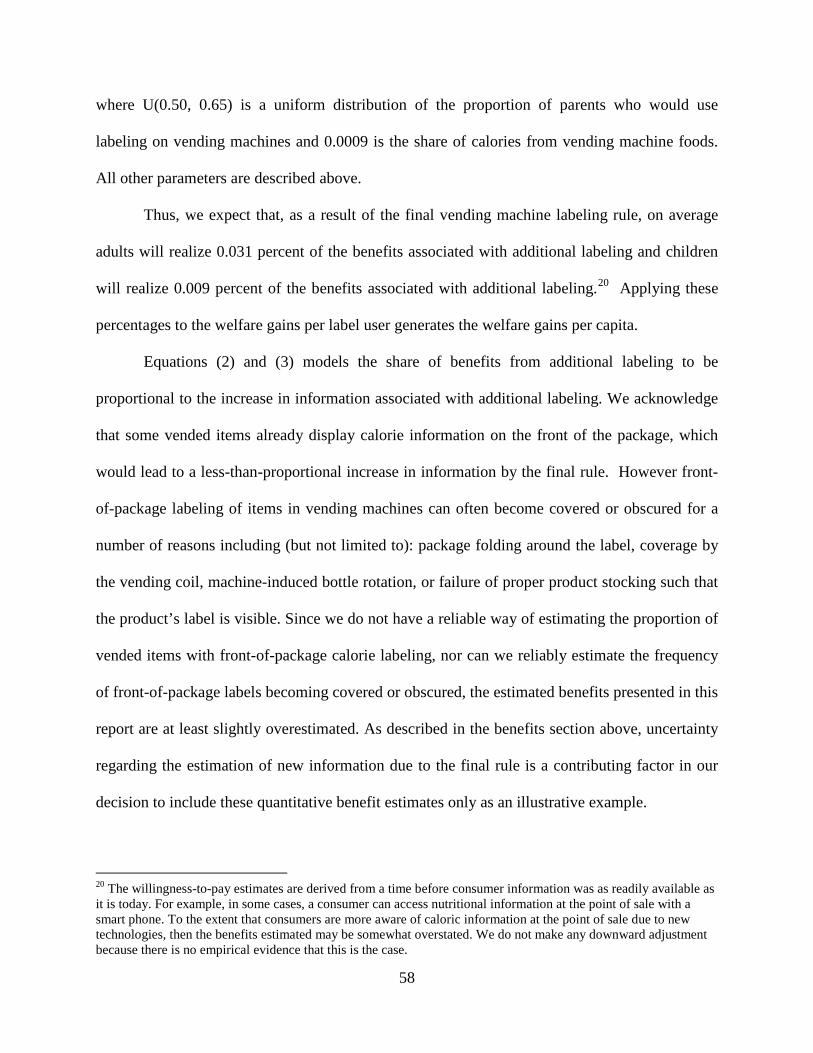
58
where U(0.50, 0.65) is a uniform distribution of the proportion of parents who would use
labeling on vending machines and 0.0009 is the share of calories from vending machine foods.
All other parameters are described above.
Thus, we expect that, as a result of the final vending machine labeling rule, on average
adults will realize 0.031 percent of the benefits associated with additional labeling and children
will realize 0.009 percent of the benefits associated with additional labeling.20 Applying these
percentages to the welfare gains per label user generates the welfare gains per capita.
Equations (2) and (3) models the share of benefits from additional labeling to be
proportional to the increase in information associated with additional labeling. We acknowledge
that some vended items already display calorie information on the front of the package, which
would lead to a less-than-proportional increase in information by the final rule. However front-
of-package labeling of items in vending machines can often become covered or obscured for a
number of reasons including (but not limited to): package folding around the label, coverage by
the vending coil, machine-induced bottle rotation, or failure of proper product stocking such that
the product’s label is visible. Since we do not have a reliable way of estimating the proportion of
vended items with front-of-package calorie labeling, nor can we reliably estimate the frequency
of front-of-package labels becoming covered or obscured, the estimated benefits presented in this
report are at least slightly overestimated. As described in the benefits section above, uncertainty
regarding the estimation of new information due to the final rule is a contributing factor in our
decision to include these quantitative benefit estimates only as an illustrative example.
20 The willingness-to-pay estimates are derived from a time before consumer information was as readily available as it is today. For example, in some cases, a consumer can access nutritional information at the point of sale with a smart phone. To the extent that consumers are more aware of caloric information at the point of sale due to new technologies, then the benefits estimated may be somewhat overstated. We do not make any downward adjustment because there is no empirical evidence that this is the case.
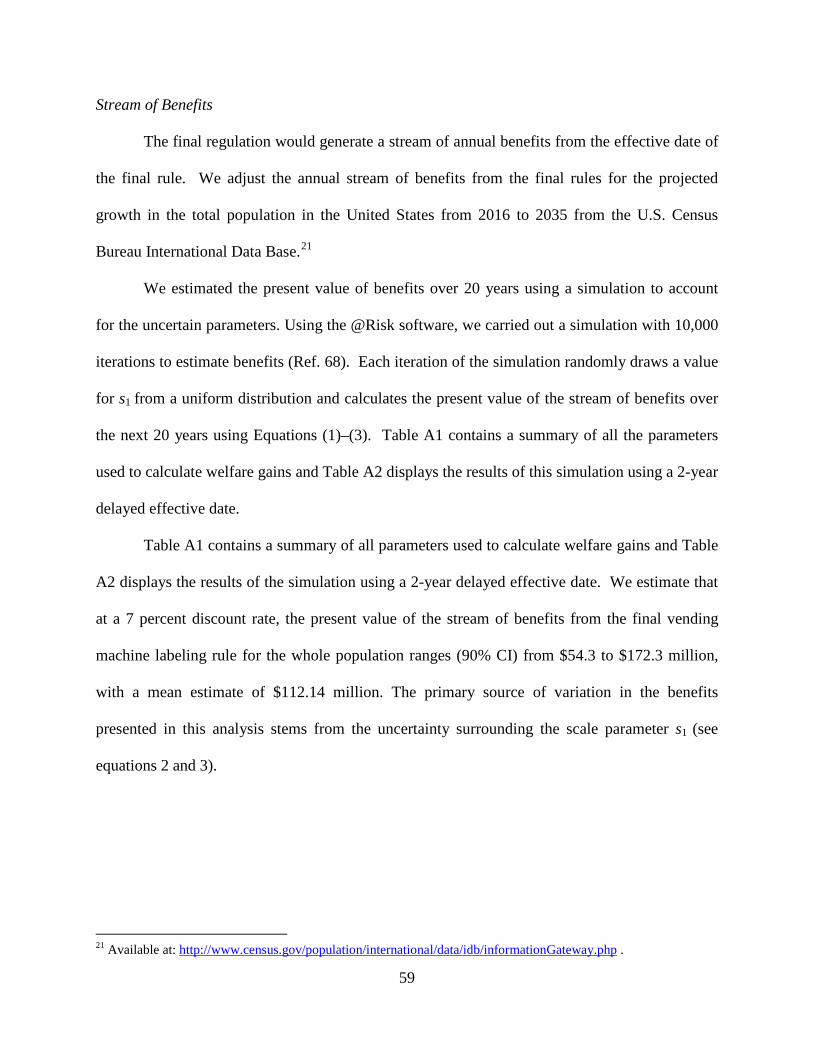
59
Stream of Benefits
The final regulation would generate a stream of annual benefits from the effective date of
the final rule. We adjust the annual stream of benefits from the final rules for the projected
growth in the total population in the United States from 2016 to 2035 from the U.S. Census
Bureau International Data Base.21
We estimated the present value of benefits over 20 years using a simulation to account
for the uncertain parameters. Using the @Risk software, we carried out a simulation with 10,000
iterations to estimate benefits (Ref. 68). Each iteration of the simulation randomly draws a value
for s1 from a uniform distribution and calculates the present value of the stream of benefits over
the next 20 years using Equations (1)–(3). Table A1 contains a summary of all the parameters
used to calculate welfare gains and Table A2 displays the results of this simulation using a 2-year
delayed effective date.
Table A1 contains a summary of all parameters used to calculate welfare gains and Table
A2 displays the results of the simulation using a 2-year delayed effective date. We estimate that
at a 7 percent discount rate, the present value of the stream of benefits from the final vending
machine labeling rule for the whole population ranges (90% CI) from $54.3 to $172.3 million,
with a mean estimate of $112.14 million. The primary source of variation in the benefits
presented in this analysis stems from the uncertainty surrounding the scale parameter s1 (see
equations 2 and 3).
21 Available at: http://www.census.gov/population/international/data/idb/informationGateway.php .
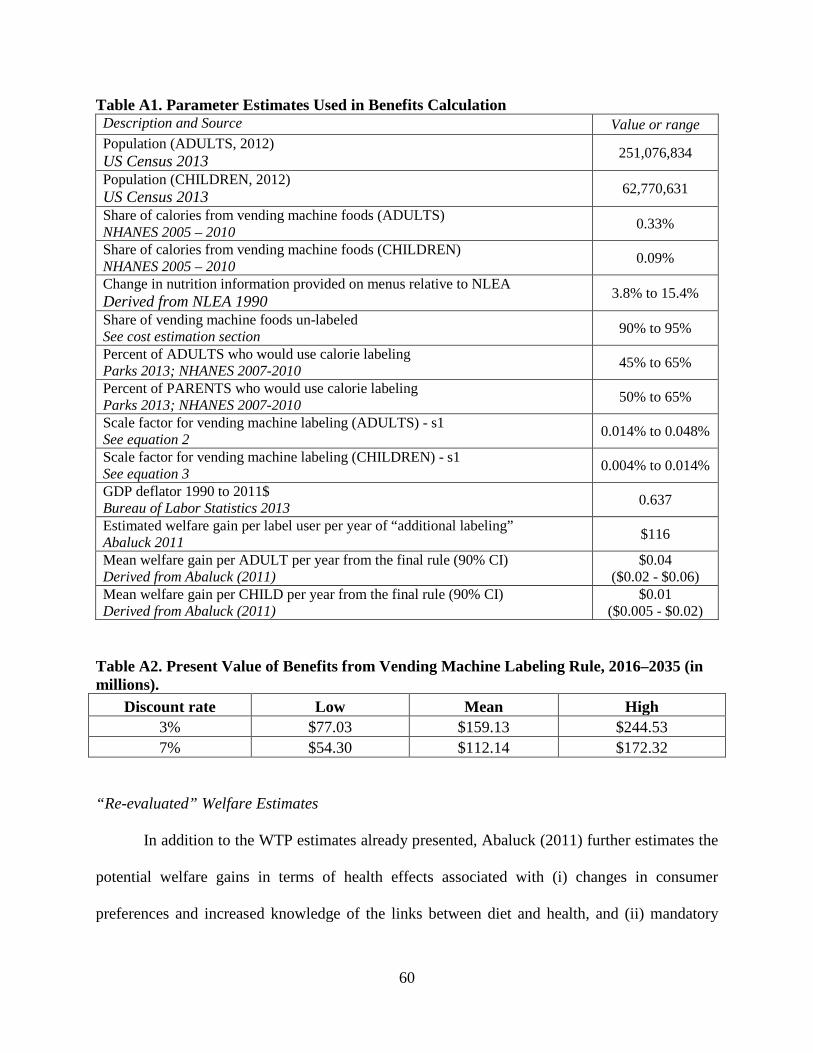
60
Table A1. Parameter Estimates Used in Benefits Calculation Description and Source Value or range Population (ADULTS, 2012) US Census 2013 251,076,834
Population (CHILDREN, 2012) US Census 2013 62,770,631
Share of calories from vending machine foods (ADULTS) NHANES 2005 – 2010 0.33% Share of calories from vending machine foods (CHILDREN) NHANES 2005 – 2010 0.09% Change in nutrition information provided on menus relative to NLEA Derived from NLEA 1990 3.8% to 15.4%
Share of vending machine foods un-labeled See cost estimation section 90% to 95% Percent of ADULTS who would use calorie labeling Parks 2013; NHANES 2007-2010 45% to 65% Percent of PARENTS who would use calorie labeling Parks 2013; NHANES 2007-2010 50% to 65% Scale factor for vending machine labeling (ADULTS) - s1 See equation 2 0.014% to 0.048% Scale factor for vending machine labeling (CHILDREN) - s1 See equation 3 0.004% to 0.014% GDP deflator 1990 to 2011$ Bureau of Labor Statistics 2013 0.637 Estimated welfare gain per label user per year of “additional labeling” Abaluck 2011 $116 Mean welfare gain per ADULT per year from the final rule (90% CI) Derived from Abaluck (2011)
$0.04 ($0.02 - $0.06)
Mean welfare gain per CHILD per year from the final rule (90% CI) Derived from Abaluck (2011)
$0.01 ($0.005 - $0.02)
Table A2. Present Value of Benefits from Vending Machine Labeling Rule, 2016–2035 (in millions).
Discount rate Low Mean High 3% $77.03 $159.13 $244.53 7% $54.30 $112.14 $172.32
“Re-evaluated” Welfare Estimates
In addition to the WTP estimates already presented, Abaluck (2011) further estimates the
potential welfare gains in terms of health effects associated with (i) changes in consumer
preferences and increased knowledge of the links between diet and health, and (ii) mandatory
61
labeling of all foods. Assuming that eating the optimally healthy diet would result in a gain of
0.04 life years per year, and a VSL of $6.4 million, Abaluck (2011) estimated (at a 4 percent
discount rate) that the average individual would gain about $3,000 worth of life-years each year
if they ate the healthiest diet possible and if the elasticity of nutrient demand with respect to
information were perfectly inelastic. While the actual value would vary across consumers by
age, the weighted average gain would be comparable to the annual gain for an individual with a
life expectancy of 37 remaining years. Using these benchmark parameters, Abaluck (2011) re-
calculated the welfare gains from the 1993 rules that implemented the NLEA and “additional
labeling” resulting in the “re-evaluated” welfare gain estimates that could be realized if the
consumer’s perceived marginal cost of consumption matched benchmark preferences. For the
purpose of this illustrative example of quantifying benefits of the final rule, we provide a detailed
estimate of these “re-evaluated” welfare gains (which are not directly accounted for by the main
WTP estimates) based upon the limited data available.
Measurement of these “re-evaluated” welfare gains depends on the choice of value of a
statistical life year (VSLY) and discount rate, to conform to the FDA’s standard practice in
regulatory impact analyses (Refs. 69;70;71). In other words, we report Abaluck’s estimates as if
they were derived from FDA’s standard measures for VSLY.22 The re-evaluated estimates
implicitly add the additional health effects that consumers fail to internalize because they do not
have full information about long term effects of nutrient intake. If there are internal effects not
accounted for by the WTP estimates, then the re-evaluated estimates would more closely reflect
the true relationship between diet, health, and welfare.
22 For additional details on the estimation techniques used, see Appendix B of the Final Regulatory Impact Analysis for Food Labeling: Nutrition Labeling of Standard Menu Items in Restaurants and Similar Retail Food Establishments.
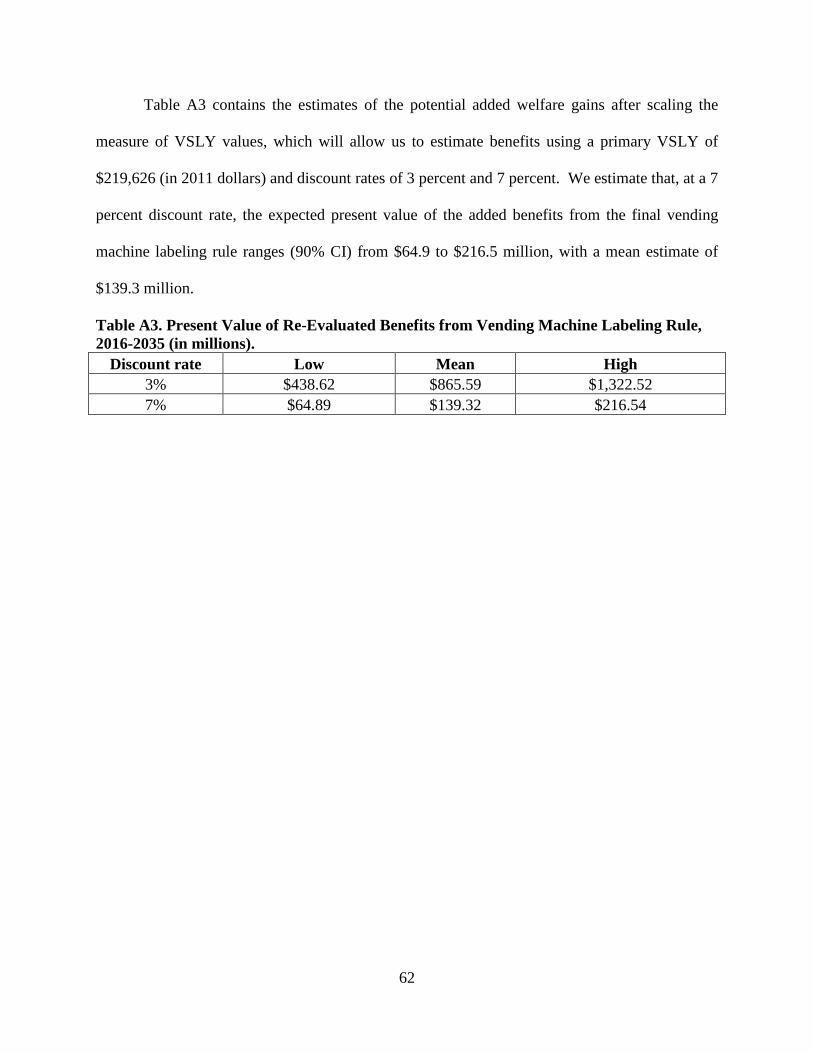
62
Table A3 contains the estimates of the potential added welfare gains after scaling the
measure of VSLY values, which will allow us to estimate benefits using a primary VSLY of
$219,626 (in 2011 dollars) and discount rates of 3 percent and 7 percent. We estimate that, at a 7
percent discount rate, the expected present value of the added benefits from the final vending
machine labeling rule ranges (90% CI) from $64.9 to $216.5 million, with a mean estimate of
$139.3 million.
Table A3. Present Value of Re-Evaluated Benefits from Vending Machine Labeling Rule, 2016-2035 (in millions).
Discount rate Low Mean High 3% $438.62 $865.59 $1,322.52 7% $64.89 $139.32 $216.54
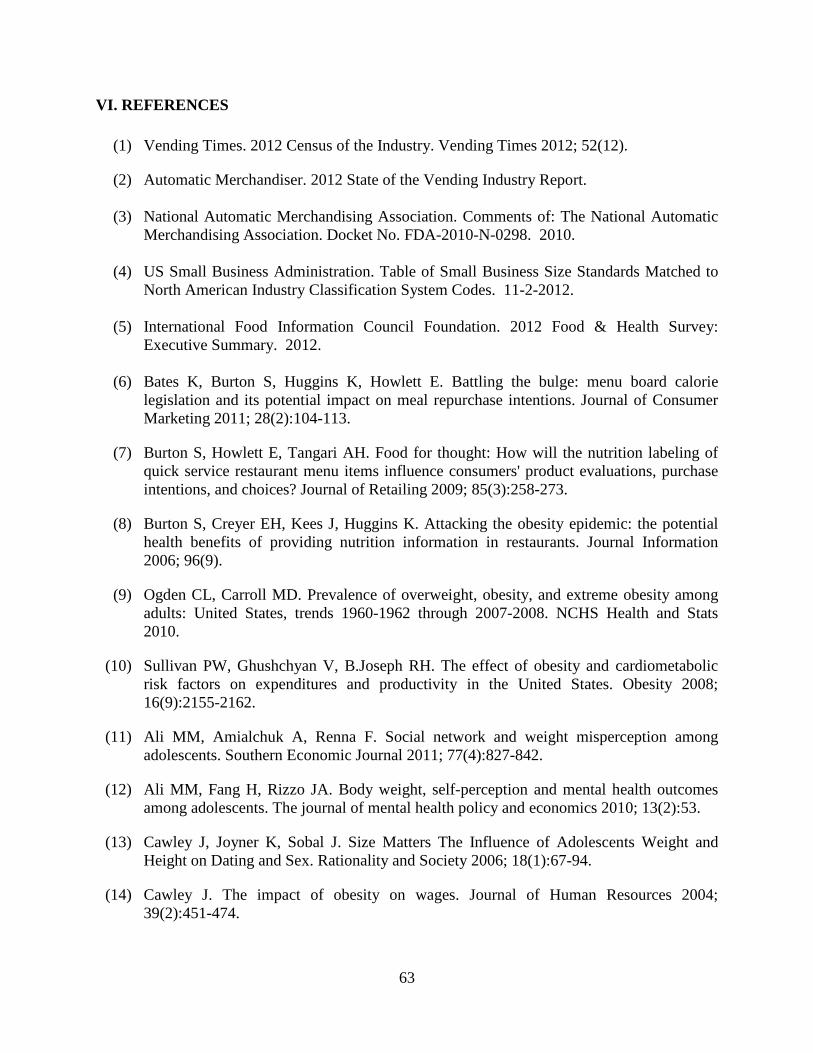
63
VI. REFERENCES
(1) Vending Times. 2012 Census of the Industry. Vending Times 2012; 52(12).
(2) Automatic Merchandiser. 2012 State of the Vending Industry Report. (3) National Automatic Merchandising Association. Comments of: The National Automatic
Merchandising Association. Docket No. FDA-2010-N-0298. 2010. (4) US Small Business Administration. Table of Small Business Size Standards Matched to
North American Industry Classification System Codes. 11-2-2012. (5) International Food Information Council Foundation. 2012 Food & Health Survey:
Executive Summary. 2012. (6) Bates K, Burton S, Huggins K, Howlett E. Battling the bulge: menu board calorie
legislation and its potential impact on meal repurchase intentions. Journal of Consumer Marketing 2011; 28(2):104-113.
(7) Burton S, Howlett E, Tangari AH. Food for thought: How will the nutrition labeling of quick service restaurant menu items influence consumers' product evaluations, purchase intentions, and choices? Journal of Retailing 2009; 85(3):258-273.
(8) Burton S, Creyer EH, Kees J, Huggins K. Attacking the obesity epidemic: the potential health benefits of providing nutrition information in restaurants. Journal Information 2006; 96(9).
(9) Ogden CL, Carroll MD. Prevalence of overweight, obesity, and extreme obesity among adults: United States, trends 1960-1962 through 2007-2008. NCHS Health and Stats 2010.
(10) Sullivan PW, Ghushchyan V, B.Joseph RH. The effect of obesity and cardiometabolic risk factors on expenditures and productivity in the United States. Obesity 2008; 16(9):2155-2162.
(11) Ali MM, Amialchuk A, Renna F. Social network and weight misperception among adolescents. Southern Economic Journal 2011; 77(4):827-842.
(12) Ali MM, Fang H, Rizzo JA. Body weight, self-perception and mental health outcomes among adolescents. The journal of mental health policy and economics 2010; 13(2):53.
(13) Cawley J, Joyner K, Sobal J. Size Matters The Influence of Adolescents Weight and Height on Dating and Sex. Rationality and Society 2006; 18(1):67-94.
(14) Cawley J. The impact of obesity on wages. Journal of Human Resources 2004; 39(2):451-474.
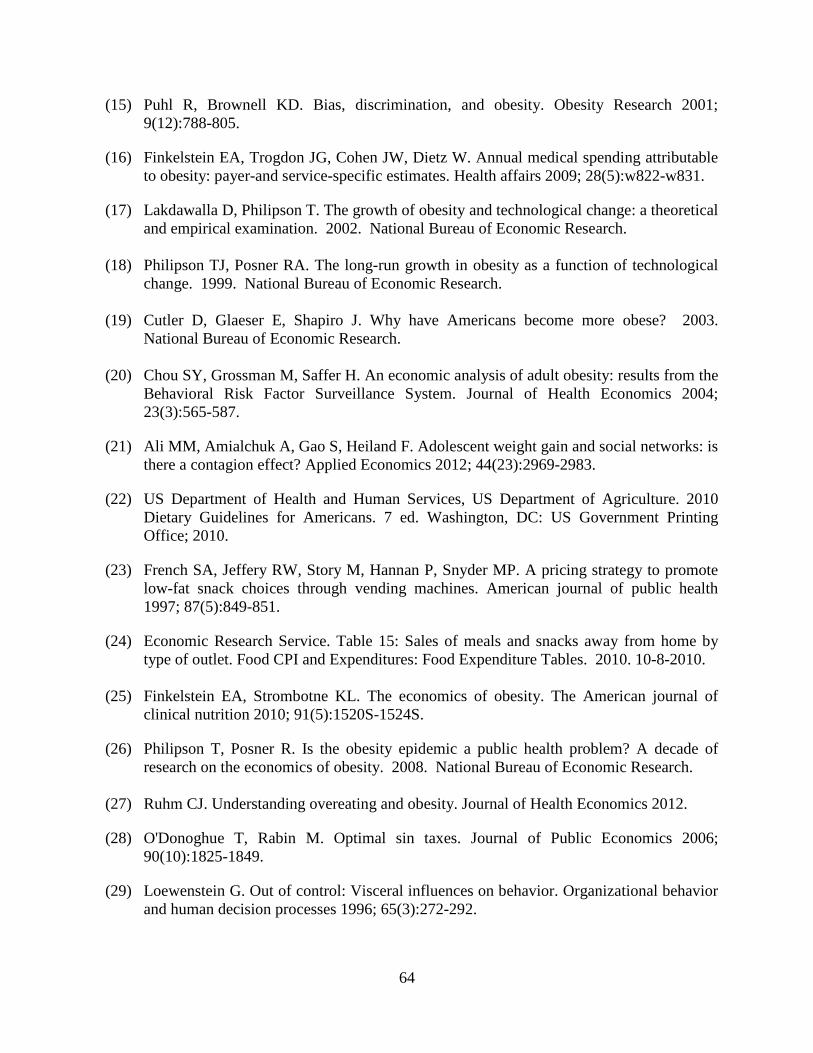
64
(15) Puhl R, Brownell KD. Bias, discrimination, and obesity. Obesity Research 2001; 9(12):788-805.
(16) Finkelstein EA, Trogdon JG, Cohen JW, Dietz W. Annual medical spending attributable to obesity: payer-and service-specific estimates. Health affairs 2009; 28(5):w822-w831.
(17) Lakdawalla D, Philipson T. The growth of obesity and technological change: a theoretical and empirical examination. 2002. National Bureau of Economic Research.
(18) Philipson TJ, Posner RA. The long-run growth in obesity as a function of technological
change. 1999. National Bureau of Economic Research. (19) Cutler D, Glaeser E, Shapiro J. Why have Americans become more obese? 2003.
National Bureau of Economic Research. (20) Chou SY, Grossman M, Saffer H. An economic analysis of adult obesity: results from the
Behavioral Risk Factor Surveillance System. Journal of Health Economics 2004; 23(3):565-587.
(21) Ali MM, Amialchuk A, Gao S, Heiland F. Adolescent weight gain and social networks: is there a contagion effect? Applied Economics 2012; 44(23):2969-2983.
(22) US Department of Health and Human Services, US Department of Agriculture. 2010 Dietary Guidelines for Americans. 7 ed. Washington, DC: US Government Printing Office; 2010.
(23) French SA, Jeffery RW, Story M, Hannan P, Snyder MP. A pricing strategy to promote low-fat snack choices through vending machines. American journal of public health 1997; 87(5):849-851.
(24) Economic Research Service. Table 15: Sales of meals and snacks away from home by type of outlet. Food CPI and Expenditures: Food Expenditure Tables. 2010. 10-8-2010.
(25) Finkelstein EA, Strombotne KL. The economics of obesity. The American journal of
clinical nutrition 2010; 91(5):1520S-1524S.
(26) Philipson T, Posner R. Is the obesity epidemic a public health problem? A decade of research on the economics of obesity. 2008. National Bureau of Economic Research.
(27) Ruhm CJ. Understanding overeating and obesity. Journal of Health Economics 2012.
(28) O'Donoghue T, Rabin M. Optimal sin taxes. Journal of Public Economics 2006; 90(10):1825-1849.
(29) Loewenstein G. Out of control: Visceral influences on behavior. Organizational behavior and human decision processes 1996; 65(3):272-292.
65
(30) O'Donoghue T, Rabin M. Doing it now or later. American Economic Review 1999;103-124.
(31) Akerlof GA. Procrastination and obedience. The American Economic Review 1991; 81(2):1-19.
(32) Conlisk J. Why bounded rationality? Journal of economic literature 1996; 34(2):669-700.
(33) Jed E. Operators Find Today's Patrons Favor 'Better-For-You' Food Selections In Vending. Vending Times 2001; 41(8).
(34) Memo to File. Correspondence with Eric Dell of the National Automatic Merchandising Association. 4-13-2013.
(35) US Census Bureau. County Business Patterns, United States NAICS 2000-2008. 2010.
10-18-2010. (36) RL Food Testing Laboratory. Quality Nutrition Analysis. 2014. 9-23-2010. (37) FoodCalc LLC. Menucalc Plans. 2014. 9-23-2010. (38) Bureau of Labor Statistics. Occupational Employment Statistics. 2011. 10-17-2011. (39) Eastern Research Group I. Evaluation of Recordkeeping Costs for Food Manufacturers,
Final Report. Sertkaya A, Berlind A, Erdem S, editors. Contract No. 223-01-2461, Task Order Number 5. 2007.
(40) Memo to File. Correspondence with Eric Dell of the National Automatic Merchandising
Association. 4-10-2013. (41) Price survey from 3 websites. 2013. 3-13-2013.
(42) Campos S, Doxey J, Hammond D. Nutrition labels on pre-packaged foods: a systematic review. Public health nutrition 2011; 14(08):1496-1506.
(43) Variyam JN, Cawley J. Nutrition labels and obesity. 2006. National Bureau of Economic Research.
(44) Finke MS. Did the nutrition labeling and education act affect food choice in the United States. American Consumer and the Changing Structure of the Food SystemGÇÖ, Economic Research Service, USDA 2000.
(45) Cutler DM, Richardson E, Keeler TE, Staiger D. Measuring the health of the US population. Brookings papers on economic activity Microeconomics 1997; 1997:217-282.
66
(46) Fletcher JM, Frisvold D, Tefft N. Taxing soft drinks and restricting access to vending machines to curb child obesity. Health affairs 2010; 29(5):1059-1066.
(47) Brownell KD, Frieden TR. Ounces of prevention: the public policy case for taxes on sugared beverages. New England Journal of Medicine 2009; 360(18):1805-1808.
(48) Caraher M, Cowburn G. Taxing food: implications for public health nutrition. Public health nutrition 2005; 8(08):1242-1249.
(49) Fletcher JM, Frisvold DE, Tefft N. The effects of soft drink taxes on child and adolescent consumption and weight outcomes. Journal of Public Economics 2010; 94(11):967-974.
(50) Kakarala M, Keast DR, Hoerr S. Schoolchildren's Consumption of Competitive Foods and Beverages, Excluding +á la Carte*. Journal of School Health 2010; 80(9):429-435.
(51) Krebs-Smith SM. Choose beverages and foods to moderate your intake of sugars: measurement requires quantification. The Journal of nutrition 2001; 131(2):527S-535S.
(52) Wiecha JL, Finkelstein D, Troped PJ, Fragala M, Peterson KE. School vending machine use and fast-food restaurant use are associated with sugar-sweetened beverage intake in youth. Journal of the American Dietetic Association 2006; 106(10):1624-1630.
(53) Knopman D, Boland LL, Mosley T, Howard G, Liao D, Szklo M et al. Cardiovascular risk factors and cognitive decline in middle-aged adults. Neurology 2001; 56(1):42-48.
(54) A healthy body, a healthy mind: long-term impact of diet on mood and cognitive function. Cambridge Univ Press; 2001.
(55) Who J, Consultation FE. Diet, nutrition and the prevention of chronic diseases. WHO technical report series 2003; 916.
(56) DeVol R. An Unhealthy America: The Economic Burden of Chronic Disease--Charting a New Course to Save Lives and Increase Productivity and Economic Growth. Milken Institute; 2007.
(57) Cawley J, Meyerhoefer C. The medical care costs of obesity: an instrumental variables approach. Journal of Health Economics 2012; 31(1):219-230.
(58) American Diabetes Association. Economic costs of diabetes in the US in 2007. Diabetes care 2008; 31(3):596-615.
(59) Wild S, Roglic G, Green A, Sicree R, King H. Global prevalence of diabetes estimates for the year 2000 and projections for 2030. Diabetes care 2004; 27(5):1047-1053.
(60) Mensah GA, Brown DW. An overview of cardiovascular disease burden in the United States. Health affairs 2007; 26(1):38-48.
67
(61) Boyle JP, Thompson TJ, Gregg EW, Barker LE, Williamson DF. Projection of the year 2050 burden of diabetes in the US adult population: dynamic modeling of incidence, mortality, and prediabetes prevalence. Popul Health Metr 2010; 8(1):29.
(62) Abaluck J. What Would We Eat if We Knew More: The Implications of a Large-Scale Change in Nutrition Labeling. Working Paper 2011.
(63) Wansink B, Painter JE, North J. Bottomless Bowls: Why Visual Cues of Portion Size May Influence Intake**. Obesity Research 2005; 13(1):93-100.
(64) Wansink B. Environmental Factors That Increase the Food Intake and Consumption Volume of Unknowing Consumers*. Annu Rev Nutr 2004; 24:455-479.
(65) Parks J. The Effects of Food Labeling and Dietary Guidance on Nutrition in the United States. AAEA Annual Meeting [ 2013 Available from: URL:http://ageconsearch.umn.edu/bitstream/150583/2/AAEA%20Nut-Label-DRAFT-IV-5-23-13.pdf
(66) Economic Research Service. Food Consumption and Nutrient Intakes. 7-5-2012. 10-8-2012.
(67) Post R, Budak C, Canavan J, Duncan-Harrington T, Jones BJ, Jenkins R et al. A Guide to
Federal Food Labeling Requirements for Meat, Poultry, and Egg Products. US Department of Agriculture 2007.
(68) @Risk Computer Program 2011.
(69) Aldy JE, Viscusi WK. Age differences in the value of statistical life: revealed preference evidence. Review of Environmental Economics and Policy 2007; 1(2):241-260.
(70) Braithwaite RS, Meltzer DO, King Jr JT, Leslie D, Roberts MS. What does the value of modern medicine say about the $50,000 per quality-adjusted life-year decision rule? Medical care 2008; 46(4):349-356.
(71) Cutler DM. Are we finally winning the war on cancer? The Journal of Economic Perspectives 2008; 22(4):3-26.