Embed Size (px)
Citation preview

169
11.1 INTRODUCTION
The food and drink sector of Greece has a very important role in the Greek economy and the Greek manufacturing industry generally. This sector represents about 21% of Greek manufacturing industry, includes more than 1,300 enterprises and creates 70,000 jobs. In particular, according to the national accounts, this sector has high potential for improvement provided that it can be reorganised soon.
Greek industry is composed of 23 sectors and the most important of them is the food and drink sector. During the period 1995-2003, industrial production showed an average annual growth rate of 2.1% while in the period January-November 2004, it grew by 2.8%. The added value of the food and drink sector has drastically increased, during the period 1994-2001, at an average rate of 7,9%. Employment in the sector is decreasing, in the period 1994-2001, at an average annual rate of 0.2%.
The primary sector of the Greek Economy represents 16.6% of total employment (16.3% agriculture, 0.3% fishing). The secondary sector represents 22.4% (13.2% manufacturing) and the services sector 61%. However, average
11Food Industry in Greece
N. Demiris, B. Giannoulidou, A. Kourbeli, F. Kouvara, F. GallantAgricultural University of Athens

11 Food Industry in Greece
170
remuneration of employees has annually increased by 6.4%. The investment activity of the food and beverage sector is also important, as gross investments during the period 1994-2001 have reached 8.8%. The largest companies of the food and drink industry are presented in the following table:
Table 11.1 The 20 largest companies of Greek food & drink industry, in terms of sales
COMPANY SALES (thousand euros) 2003
COCA-COLA 3E 629,046
HELLENIC BREWERY 367,726
NESTLE HELLAS 359,109
FAGE 335,849
DELTA 304,769
GREEK SUGAR INDUSTRY 263,168
ELAIS 204,540
MEVGAL 164,275
THRAKI 130,026
PEPSICO IVI 106,189
HELLENIC QUALITY FOODS 99,335
TYRAS 94,878
EVGA 91,877
MYTHOS BREWERY 45,053
TSANTALIS 42,859
PINDOS 41,737
BOUTARIS 31,387
METAXA 30,886
HELLENIC WINE CELLARS 29,894
ACHAIA CLAUSS 21,315
In 2002, Greece was second in the European Union (out of 15 countries),
in terms of growth, reaching a growth rate of 3.3% (Spain holds the first place).

Food Industry in Greece 11
171
The Greek economy is divided into the following sectors:1) Primary: includes 7% of the Greek economy, of which agriculture and
livestock represent 6.4%, and fishing 0.6%.2) Secondary: includes 22.4% of the Greek economy. Includes manufacturing
(11.8%), energy, construction, and mining.3) Tertiary: represents 71.1% of the Greek economy. Includes trade (12.6%),
and services.
Figure 11.1 Sectors of Greek economy and contribution to Activities and employement
The primary sector decreased by 1.3%, secondary increased by 2.8%, and tertiary by 4.1%. In the next year, fishing is expected to increase by 2.5%, agriculture to decrease by 1.5%, and manufacturing will increase by 3%.
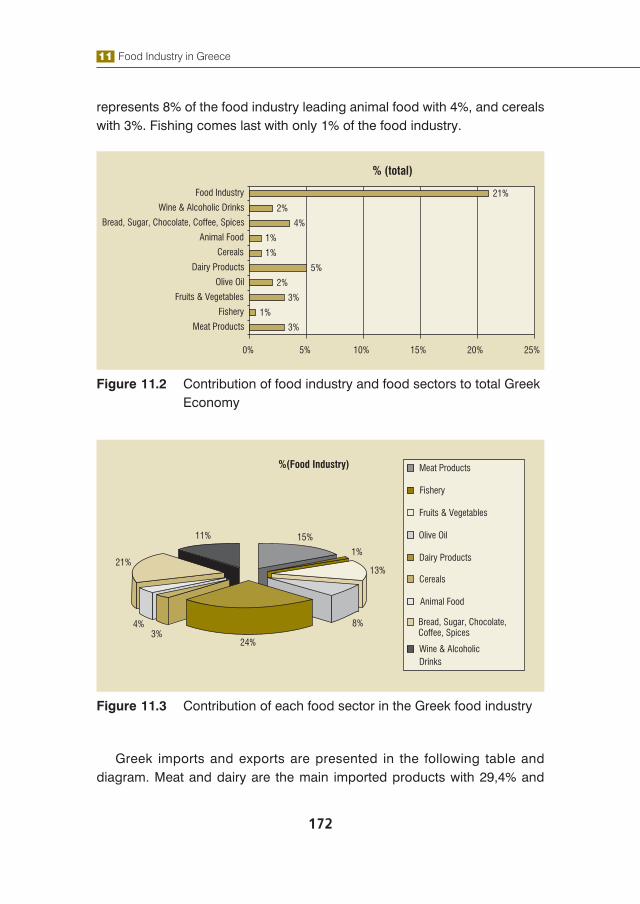
The food industry covers 21% of the total production of Greece and in particular dairy products hold 5%, and meat products, fruits & vegetables and bread, sugar, chocolate, coffee, spices cover 3%. Furthermore, olive oil and alcoholic drinks & wine hold 2% and in the last place in the total production are cereals and animal food with only 1%. The first place in the food sector is taken by dairy products, which hold 23%. Bread, sugar, chocolate, coffee, spices rank second with 21% and in third place are meat products that represent 15% of the food industry. The sector of fruits & vegetables and that of wine & alcoholic drinks hold 13% and 11% in the food industry respectively. Olive oil
11 Food Industry in Greece
172
represents 8% of the food industry leading animal food with 4%, and cereals with 3%. Fishing comes last with only 1% of the food industry.
Figure 11.2 Contribution of food industry and food sectors to total Greek Economy
Figure 11.3 Contribution of each food sector in the Greek food industry
Greek imports and exports are presented in the following table and diagram. Meat and dairy are the main imported products with 29,4% and

Food Industry in Greece 11
173
17% respectively. The main importing countries are in the European Union. Meat imports are necessary because of the limited cattle in Greece, especially beef. In the dairy sector, Greece has high productivity, however there are many multinational companies (leaders in that sector), which import large quantities, such as Algida and Friesland. Vegetable fats hold the lowest percentage (4.9%), considering the fact that Greece has high olive oil production and consumption. In addition to this, Greeks do not prefer olive oil substitutes, because of the low price of olive oil. Moreover, olive oil is a basic ingredient of the Mediterranean diet and of Greek nutritional habits.
Table 11.2 Imports of the Greek food industry as a percentage of total imports
Imports %
Meat Products 29.4
Dairy Products 17.0
Cereals & Animal Food 8.4
Vegetables Fats 4.9
Rest 40.3
Total 100
Figure 11.4 Imports of the Greek food industry
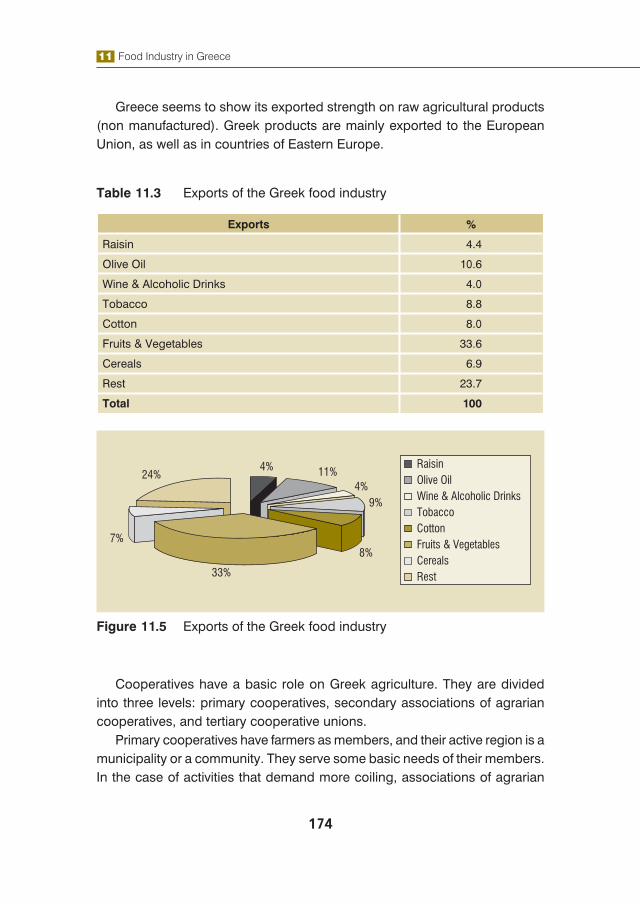
Greek exports mainly consist of fruits & vegetables (33.6%). Other important exported products are olive oil (10.6%), tobacco (8.8%) and cotton (8%).
11 Food Industry in Greece
174
Greece seems to show its exported strength on raw agricultural products (non manufactured). Greek products are mainly exported to the European Union, as well as in countries of Eastern Europe.
Table 11.3 Exports of the Greek food industry
Exports %
Raisin 4.4
Olive Oil 10.6
Wine & Alcoholic Drinks 4.0
Tobacco 8.8
Cotton 8.0
Fruits & Vegetables 33.6
Cereals 6.9
Rest 23.7
Total 100
Figure 11.5 Exports of the Greek food industry
Cooperatives have a basic role on Greek agriculture. They are divided into three levels: primary cooperatives, secondary associations of agrarian cooperatives, and tertiary cooperative unions.
Primary cooperatives have farmers as members, and their active region is a municipality or a community. They serve some basic needs of their members. In the case of activities that demand more coiling, associations of agrarian
Food Industry in Greece 11
175
cooperatives have been formed, which are active in larger county (regions). Representatives of primary cooperatives constitute the general assembly of these associations. The majority of the associations are occupied with many products, however some are focused on certain product groups. The coiling of the associations in a national level forms tertiary cooperative unions, which are specialized on certain products or services. National level organizations have the pattern of Central Unions. In Greece, 6,873 primary cooperatives are operating, 122 associations of cooperatives, seven Central Unions, four joint ventures, 88 cooperative businesses, and 1 top organization. Cooperatives produce a respectable percentage of the total volume production of some key products: 41.5% of tomato juice, 38.3% of peaches, 36.8% of oranges, 34.1% of poultry meat, 32.3% of must-wine, 27.5% of olives, 23.2% of table grapes, 19.3% of cow milk, 14.1% of cucumbers, 12.5% of canned tomatoes, and 6.4% of sheep and goat milk. Cooperatives should manage some basic goals such as:• Reduction of production costs of agrarian products• Ensuring better sales prices for the members’ products• Enhancing the quality of members’ products• Use of logistic methods in the production chain, so that costs can be
reduced and products become more competitive• Use of professional management in cooperatives specialized in serious
business actions• Creation of strong financial status, and promotion of collective negotiation
on loan rules
The direction of the food and drink industry should be towards more exports and in particular growth of production from enterprises in this sector and also the improvement of competitiveness in foreign markets. Today the export activity of this sector has great potential since exports account for only 64% of imports.
The challenges that food and drink industry has to face are:1) The demand for more quality and safety. This demand leads to investment
for research, scientists and equipment and so the cost increases. It is necessary through constant information to consumers and the co-operation with inspectors.
2) The development of a balanced relationship between agricultural producers and retailers.
11 Food Industry in Greece
176
3) The growth of the business and the procedures of integration with exports, absorptions, incorporation with the lowest cost.
The main resources for the Greek food sector are bottled water, fishing, olive oil, alcoholic drinks, wine, beer, meat and dairy products.
The following section describes the workings of the Greek food industry.
11.2 FOOD PRODUCTS
11.2.1 Dairy products
11.2.1.1 Introduction
The 5 main sectors of the Greek dairy industry are: milk, yogurt, cheese, ice cream, cream and butter. Despite the problems of the dairy industry (lack of professional training among cattle-breeders, no full sanitation of the cattle, need for update in cattle-breeding units, high cost of production), this sector shows great signs of improvement, mainly because of the high nutritional value of dairy products and their close relationship with the Greek diet. A great strength of the Greek dairy industry are the high quality traditional cheeses. Among 126 cheeses with protected title of provenance in Europe, Greece possesses 20 (Feta, Kaseri, Kefalograviera, Manouri, Galotyri, Kopanisti, Graviera of Crete, Graviera of Naxos, Graviera of Agrafa, Sfela, Anevato, Kalathaki of Limnos, Katiki of Domoko, Ladotyri of Mytilini, Metsovone, Mpatzos, Ksinomyzithra of Crete, Pichtogalo of Chania, San Michali and Formaella of Arachova-Parnassos), obtaining the third place in Europe.
11.2.1.2 Description of production
The production of dairy products in Greece is an important part of the food industry.
Food Industry in Greece 11
177
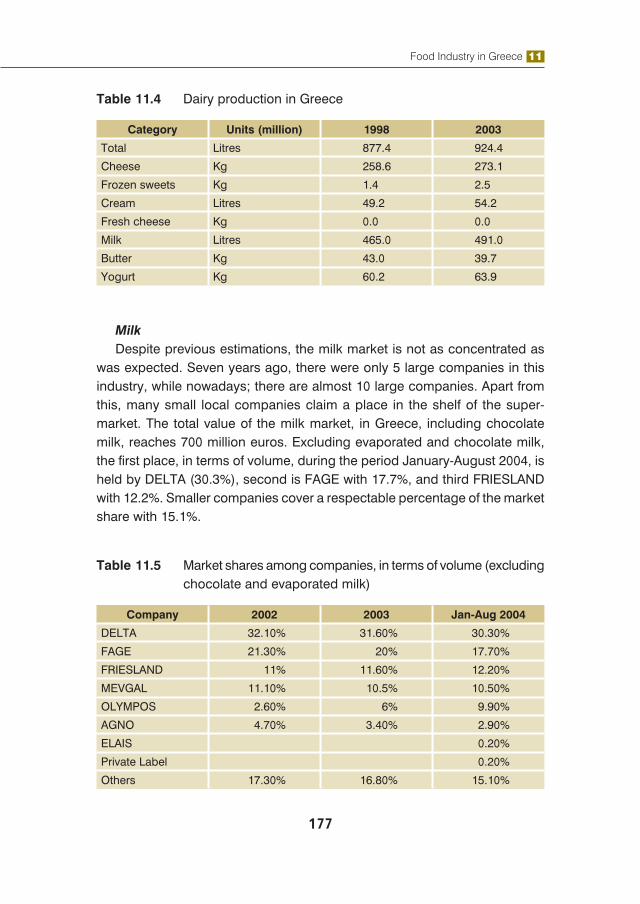
Table 11.4 Dairy production in Greece
Category Units (million) 1998 2003
Total Litres 877.4 924.4
Cheese Kg 258.6 273.1
Frozen sweets Kg 1.4 2.5
Cream Litres 49.2 54.2
Fresh cheese Kg 0.0 0.0
Milk Litres 465.0 491.0
Butter Kg 43.0 39.7
Yogurt Kg 60.2 63.9
MilkDespite previous estimations, the milk market is not as concentrated as
was expected. Seven years ago, there were only 5 large companies in this industry, while nowadays; there are almost 10 large companies. Apart from this, many small local companies claim a place in the shelf of the super-market. The total value of the milk market, in Greece, including chocolate milk, reaches 700 million euros. Excluding evaporated and chocolate milk, the first place, in terms of volume, during the period January-August 2004, is held by DELTA (30.3%), second is FAGE with 17.7%, and third FRIESLAND with 12.2%. Smaller companies cover a respectable percentage of the market share with 15.1%.
Table 11.5 Market shares among companies, in terms of volume (excluding chocolate and evaporated milk)
Company 2002 2003 Jan-Aug 2004
DELTA 32.10% 31.60% 30.30%
FAGE 21.30% 20% 17.70%
FRIESLAND 11% 11.60% 12.20%
MEVGAL 11.10% 10.5% 10.50%
OLYMPOS 2.60% 6% 9.90%
AGNO 4.70% 3.40% 2.90%
ELAIS 0.20%
Private Label 0.20%
Others 17.30% 16.80% 15.10%
11 Food Industry in Greece
178
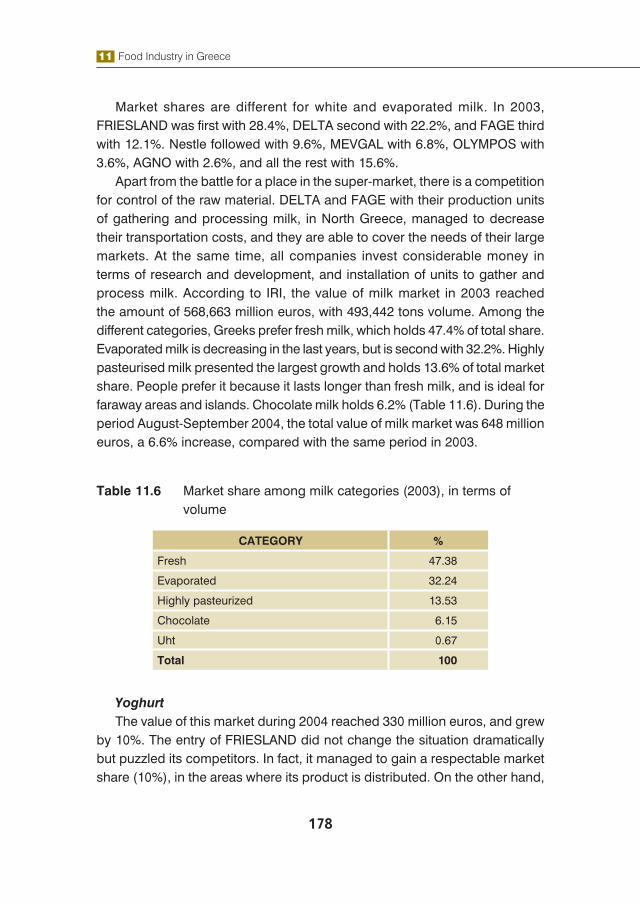
Market shares are different for white and evaporated milk. In 2003, FRIESLAND was first with 28.4%, DELTA second with 22.2%, and FAGE third with 12.1%. Nestle followed with 9.6%, MEVGAL with 6.8%, OLYMPOS with 3.6%, AGNO with 2.6%, and all the rest with 15.6%.
Apart from the battle for a place in the super-market, there is a competition for control of the raw material. DELTA and FAGE with their production units of gathering and processing milk, in North Greece, managed to decrease their transportation costs, and they are able to cover the needs of their large markets. At the same time, all companies invest considerable money in terms of research and development, and installation of units to gather and process milk. According to IRI, the value of milk market in 2003 reached the amount of 568,663 million euros, with 493,442 tons volume. Among the different categories, Greeks prefer fresh milk, which holds 47.4% of total share. Evaporated milk is decreasing in the last years, but is second with 32.2%. Highly pasteurised milk presented the largest growth and holds 13.6% of total market share. People prefer it because it lasts longer than fresh milk, and is ideal for faraway areas and islands. Chocolate milk holds 6.2% (Table 11.6). During the period August-September 2004, the total value of milk market was 648 million euros, a 6.6% increase, compared with the same period in 2003.
Table 11.6 Market share among milk categories (2003), in terms of volume
CATEGORY %
Fresh 47.38
Evaporated 32.24
Highly pasteurized 13.53
Chocolate 6.15
Uht 0.67
Total 100
YoghurtThe value of this market during 2004 reached 330 million euros, and grew
by 10%. The entry of FRIESLAND did not change the situation dramatically but puzzled its competitors. In fact, it managed to gain a respectable market share (10%), in the areas where its product is distributed. On the other hand,

Food Industry in Greece 11
179
FAGE, which is the leader, lost some of its market share of standardized yoghurt during 2003 (50.8%), compared to 2002 (54.3%). Furthermore, during the period January-August 2004 its market share dropped to 45.8%. In the same period, DELTA held 27.3%, 24.2% in 2003, and 24.9% in 2002. MEVGAL seems to grow, reaching 15.8% of the market share, compared with 13.2% in 2002. KRI-KRI and OLYMPOS also show a respectable growth.
Table 11.7 Market shares of companies for standardized yoghurt
COMPANY 2002 2003 Jan-Aug 2004
FAGE 54.30% 50.80% 45.80%
DELTA 24.90% 24.20% 27.30%
MEVGAL 13.20% 14.70% 15.80%
KRI-KRI 2.30% 3.50%
OLYMPOS 0.90% 2.60%
Rest 7.60% 7.10% 5%
Things are different if we examine the whole yoghurt market. FAGE remains first with 33.6%, and second is DELTA with 24%. MEVGAL follows with 13.2%, FRIESLAND with 9.6%, and all the rest with 20%.
Yoghurt remains a respectable product in the dairy industry, with major exports. Demand for yoghurts with fruits and for children is growing, while consumers also show their preference in functional yoghurts. Traditional yoghurt still holds a respectable place in this industry.
CheeseAccording to Eurostat, the total cheese market is valued at about 1.8 billion
euros. Apart from this, the consumption per capita is high (more than 25 kilos), and there is stable increase in the share of standardized cheese. Under these circumstances, many large companies have the ambition to enter this market. In this sector, DELTA, FAGE, MEVGAL, TYRAS, DODONI, KOLIOS, and NIKAS Group are already active. In the future, many mergers are about to happen, in order to increase the market share, as well as international development, through exports and production activity. MEVGAL, DODONI, TYRAS, DELTA, KOLIOS, and FAGE have already managed to enter foreign super-markets, whereas some of these companies have built production units abroad.

11 Food Industry in Greece
180
However, we should not forget, that many local and small companies also participate in the cheese sector.
The majority of the companies have turned their interest to standardized-packed cheese, in order to meet their consumers’ needs. Packed cheeses in super-markets do not exceed 10% of total market share, but their share is about to grow substantially, as consumers do not have the time to wait in a queue to buy cheese. According to IRI, in 2003, the value of packed cheeses increased by 15.56%, exceeding 112.726 million euros, against 2002 with 97.542 million euros. The main kinds of cheese that are packed, are the semi-hard cheeses and feta cheese, which are the main products of this type.
Table 11.8 Packed cheese market
Volume (tons) Value (euros)
2002 2003 2002 2003
Packed cheese 11672 12982 97,542,554 112,726,989
Fresh 9169 10373 76,514,227 89,335,883
Cream cheese 2502 2609 21,028,327 23,391,106
The total domestic production of cheese products (in terms of quantity), during the period 1993-2002, grew at an average annual rate of 3%, while during 2003-2004, the growth is 3-4%.
During the period 2001-2002, goat and sheep cheeses covered 77-79% of manufacturing production, and the main product was feta. Cheeses from cow milk gained 12-13% and whey cheeses gained 9%, in the same period.
Domestic products cover 74-75% of total cheese consumption in Greece. In more details, feta, telemes and other soft cheeses covered about 51% of total consumption in 2002, semi-hard and hard cheeses covered 17%, and whey cheeses covered 7%.

Food Industry in Greece 11
181
Figure 11.6 Structure of cheese consumption in Greece (2002)
Ice creamThe consumption per capita in Greece reaches 4-5 litres, while the European
average is 9 litres. The main consumption takes place in the period May-September, which represents 70% of the total annual production. Packed production represents 80% of total production.
The main problems of this market are the low per capita consumption, the marginal growth of the market volume and the seasonal character of the product. As a result, companies try to attract consumers with new products, advertising, early opening of the market, and investments on production. DELTA ice cream, EVGA, Algida, KRI-KRI, and Nestle hold 87% of total packed ice cream market in Greece. In recent years, private label products of super-markets have built a market share, of 7% of the total market.
However, it seems that the market cannot support hold so many competitors, so in the future many joint ventures or mergers are likely.
According to ICAP, during the period 1998-2001, the average annual rate of growth was 4%, while in 2002 it decreased by 2%, compared to 2001. Individual ice creams gained 54% of the market in 2002, family ice creams 26%, and bulk ice creams 20%.
According to IRI, which examined sales in super-markets during 2003, the total market value was 180 million euros, increased by 18.44%, compared to 2002. The value of family ice cream increased by 20.89%, and individual by 17.21%.

11 Food Industry in Greece
182
In the following tables, analytical information is given for the Greek ice cream market.
Table 11.9 Ice cream market (2003)
Ice cream Volume (thousand litres) Value (euros)
Total market 23704 180,393,637
Individual 11625 118,467,697
Family 12079 61,925,657
Table 11.10 Market share of companies, interns of sales value
Company 2002 2003 Nov 2003-Oct 2004
DELTA 35.10% 37.10% 36.80%
EVGA 33.30% 30.90% 31.10%
Algida 22.00% 21.40% 19.10%
KRI-KRI 3.10% 4.10% 5.10%
Private Label 1.10% 1.40% 2.00%
Haagen Dazs 1.80% 1.60% 1.80%
Nestle 0.60% 0.80% 1.40%
Mars 1.80% 1.60% 1.30%
AGNO 0.20% 0.20% 0.10%
Others 1.10% 1.00% 1.20%
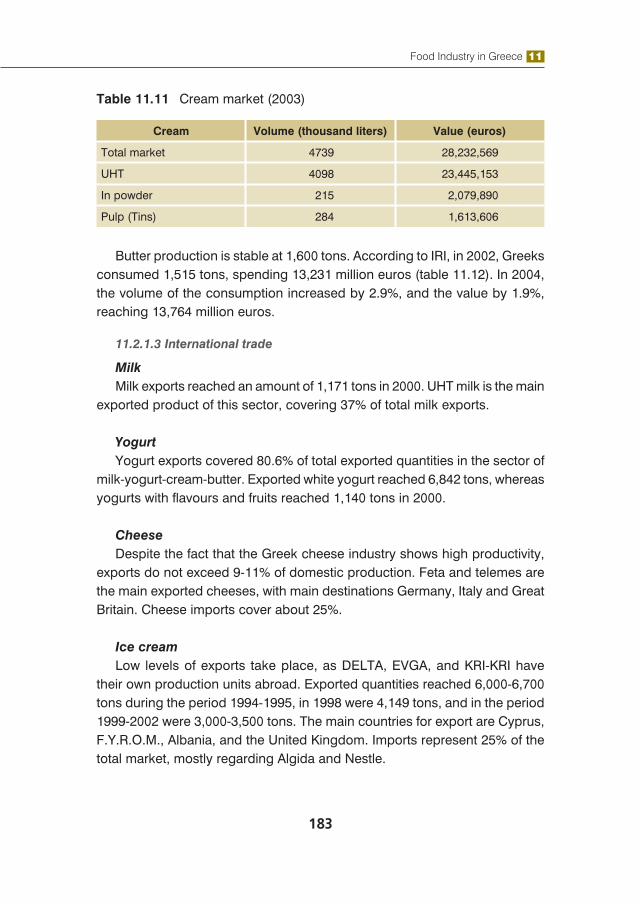
Cream of milk and butterConsumers spent 28,232 million euros for 4,739,000 liters of cream, in
2003, while in 2002; they spent 28,140 million euros for a similar quantity. It is estimated that the growth rate of this market will not exceed 3% annually. However, companies inside this market believe that there is margin for profits. This is why they offer new products, make easy to use packages, and products with low fat. However, they have to challenge the cheaper products of super-markets. We have to mention that the majority of cream sales are directed to professional use, for the production of premium ice creams. In the same way, most of the volume in the butter market is sold to industry, catering and patisserie.
Food Industry in Greece 11
183
Table 11.11 Cream market (2003)
Cream Volume (thousand liters) Value (euros)
Total market 4739 28,232,569
UHT 4098 23,445,153
In powder 215 2,079,890
Pulp (Tins) 284 1,613,606
Butter production is stable at 1,600 tons. According to IRI, in 2002, Greeks consumed 1,515 tons, spending 13,231 million euros (table 11.12). In 2004, the volume of the consumption increased by 2.9%, and the value by 1.9%, reaching 13,764 million euros.
11.2.1.3 International trade
MilkMilk exports reached an amount of 1,171 tons in 2000. UHT milk is the main
exported product of this sector, covering 37% of total milk exports.
YogurtYogurt exports covered 80.6% of total exported quantities in the sector of
milk-yogurt-cream-butter. Exported white yogurt reached 6,842 tons, whereas yogurts with flavours and fruits reached 1,140 tons in 2000.
CheeseDespite the fact that the Greek cheese industry shows high productivity,
exports do not exceed 9-11% of domestic production. Feta and telemes are the main exported cheeses, with main destinations Germany, Italy and Great Britain. Cheese imports cover about 25%.
Ice creamLow levels of exports take place, as DELTA, EVGA, and KRI-KRI have
their own production units abroad. Exported quantities reached 6,000-6,700 tons during the period 1994-1995, in 1998 were 4,149 tons, and in the period 1999-2002 were 3,000-3,500 tons. The main countries for export are Cyprus, F.Y.R.O.M., Albania, and the United Kingdom. Imports represent 25% of the total market, mostly regarding Algida and Nestle.

11 Food Industry in Greece
184
Cream and butterImports cover most of our needs in cream and butter. This market shows
great value, despite its low volume. In the butter market, imports are able to cover the majority of the consumption.
Table 11.12 Butter market (2003)
Butter Sales volume (tons) Sales value (euros)
Total 1514 13,231,587
Domestic bovine 375 3,022,460
Domestic sheep 473 3,918,520
Imported 661 6,247,771
Domestic soft 5 42,386
11.2.1.4 Conclusion
The dairy industry is about to increase its growth at an annual rate of 4.6% during the period 2003-2008, compared to 3.4% in the period 1998-2003, according to Datamonitor. During the period 1998-2003, the dairy industry developed by 18% in sales, reaching the total of 2.5 billion euros in 2003 (Table 11.14).
The cheese sector represents 47% of sales, but is not growing quickly. The fastest growth was shown by frozen sweets, which doubled their sales in 1998-2003. It is estimated that during the period 2003-2008 it will still be the fastest growing sector with an annual growth of 10%.
The second faster sector in growth is yogurt, with an estimation that it will grow 35% until 2008. Creams are expected to double their growth rate from 17% to 30%.
It is interesting that production, during the period 1998-2003, increased by 5%, while sales increased by 18%. This shows, that the main reason for the development of the market is the added value of the products. In the following tables, we present the analytical estimations.

Food Industry in Greece 11
185
Table 11.13 Production of Greek dairy market
CategoryUnits
(million)1998 2003 % 2008 %
Total Litres 877,4 924,4 5 1012,6 10
Cheese Kg 258,6 273,1 6 290,4 6
Frozen sweets Kg 1,4 2,5 77 3,6 42
Cream Litres 49,2 54,2 10 66,3 22
Fresh cheese Kg 0,0 0,0 0,1
Milk Litres 465,0 491,0 6 535,5 9
Butter Kg 43,0 39,7 -8 42,5 7
Yogurt Kg 60,2 63,9 6 74,2 16
Table 11.14 Sales of Greek dairy market (million euros)
Category 1998 2003 % 2008 %
Total 2162,7 2550,5 18 3141,4 23
Cheese 1027,6 1192,0 16 1429,1 20
Frozen sweets 7,1 13,4 88 20,6 53
Cream 199 233,1 17 304,1 30
Fresh cheese 0,2 0,4 111 0,9 129
Milk 578,8 662,5 14 798,8 21
Butter 144,3 178,9 24 222 24
Yogurt 205,6 270,2 31 366 35
11.2.2 Meat and processed meat
11.2.2.1 Introduction
After confronting nutritional crises in previous years, the market of processed meat has to deal with new challenges. The major problem of this market is the low processed meat per capita consumption in Greece (8.3 kilos), compared with the average of the European Union (19 kilos). Companies try to broaden the variety of their products, adding processed meat with high nutritional value and light products. In the same time, they expand their production to the international market, through exports, especially in the Balkans.

11 Food Industry in Greece
186
11.2.2.2 Description of production
During recent years, there has been a major redistribution in market share. Smaller companies faced serious financial problems, and retired from the market or were taken over by larger companies. In the last 5 years, the 5 largest companies raised their market share by 10%. In the next tables, the concentration of the meat market is presented.
Table 11.15 Meat production companies
Company Sales (€) Share (%)
THRAKI 137,188,369 17.62%
PINDOS 96,409,616 12.38%
NITSIAKOS 72,788,608 9.35%
HELLENIC QUALITY FOODS 70,132,793 9%
CR4 48.35%
Level of concentration in the meat sector (CR4)
Table 11.16 Importing companies
Company Share (%)
VOUDOURIS-KONSTAS 7.54%
FLORIDIS 7.31%
ALPHA MEAT 5.32%
ERMIS 4.76%
CR4 24.93%
On the other hand, meat companies have no problem with meat per capita consumption in Greece (83 kilos), which is much larger than the European average. However, they have to deal with the fact that processed meat companies and super-markets (through imports) enter their market. There is a higher level of competition and higher standards of safety rules that seem to be an obstacle for small companies. Furthermore, consumers
Food Industry in Greece 11
187
seem to prefer buying meat in portions, as the super-markets offer it, so meat companies should challenge this fact.
The value of processed meat market, in 2003, came 370 million euros, whereas that of meat products was 140 million euros. That year, there was potential for the development of those markets, estimating a growth of 4-5% in 2004 and 3-4% in 2005 for processed meat, whereas for meat products the estimated growth reached 7% in 2004 and 5% in 2005. The production of processed meat showed an annual increase by 3% during the period 1990-2003. It reached 82,500 tons in 2003, against 56,000 in 1990. A similar increase (2.9%) was obvious in the processed meat market. In 2003 it reached 91,800 tons, against 67,300 in 1992. Domestic products mainly cover the Greek market, so imports are limited.
Between the several categories of products in this market, pariza-mortadella earned 26-27% of the market share, and sausages followed with 21.5-22.5%. Çam earned 18-19% during the period 2000-2002, whereas salami earned 11.5-12.5%. A growth presented in the demand for chicken processed meat, which covered 7.5-8.5% in 2002.
Sales of the 10 largest companies represent more than 70% of total sales. The rest, 30%, is divided among 190 companies. In the following years, the market will become more concentrated, because of the high hygiene standards and the demand for more quality products (consumers trust a famous brand). These steps are already obvious. The main companies that dominate the processed meat industry, according to their market shares are:1) NIKAS: 14.5-15% 2) THRAKI: 13.5-14.5% 3) IFANTIS: 12-12.5%4) CRETA PHARM: 8.5-9%5) VEKKA: 7-7.5%6) BIKH: 6.5-7%7) EDESMA: 2.5-3%8) PASSIAS: 2.5-3%9) KARNIKA: 2-3%10) PRIMO: 2-2.5%
The market of meat products showed higher level of development, compared with processed meat. During the period 1996-2003, it grew 4.7% annually, reaching 40,000 tons in 2003, against 29,000 in 1996. Products of pig and

11 Food Industry in Greece
188
bovine meat cover 70% of the market, whereas poultry meat products cover the rest. In recent years, consumers prefer white to red meat, due to their need for healthy nutrition, increasing the demand for poultry meat products.
Meat consumption seems stable with annual growth of 1%. In the following table, domestic production and consumption is presented.
Table 11.17 Domestic meat production and consumption
YEAR PRODUCTION (tons) ANNUAL VARIATION (%)
2002 487,479 -8.1
2001 530,161 -1.4
2000 537,631
CONSUMPTION
2002 930,679 -3.9
2001 967,961 0.1
2000 966,748
Pork holds the first place among consumers’ preferences, covering 35.6% of total consumption, poultry covers 21.7%, bovine meat covers 20.3%, and goat and sheep meat cover 14.8%.
Figure 11.7 Meat consumption (2002)

Food Industry in Greece 11
189
11.2.2.3 International trade
The total Greek meat market is partly covered by domestic products, so imports are increasing in the last few years. During the period 1992-2003, quantities of imported meat increased by 5.6% annually. In 2002, they reached 4,585 thousand tons, increased by 1.4% compared with 2001. Greece imports substantial quantities of meat from France, Germany and Holland. Some quantities of meat, especially turkey, are imported from Italy. According to French SOPEXA, domestic products cover 35% of bovine meat consumption; the rest is covered by imports. In general, the meat industry comes first in the imports of food and drink, holding 21.2% of the total.
Meat exports in 2001, reached 12,607 tons (12,612,661 euros), compared to 12,404 tons (18,352,901 euros) in 2000. Poultry meat is the main exported product of this sector, covering 46-62% of total meat exports during the period 1996-2001. Bovine meat covered 21-26% during the period 1996-1999, 34.9% in 2000, and 4.6% in 2001. Pork meat gained 1.5-5.5% during the period 1996-2001. Goat and sheep meat, despite its low exports during the period 1996-2000, reached 20.8% of total meat exports, in 2001.
Exports of processed meat are declining recently, reaching 1,289 tons in 2000. Processed meat is mainly exported to third Countries (Albania, Bulgaria, Bahamas, Romania) and less to the European Union (Germany, Portugal, United Kingdom, Denmark).
In order to acquire a full picture of the Greek meat market, two tables and diagrams follow to compare it with the European market.
11 Food Industry in Greece
190
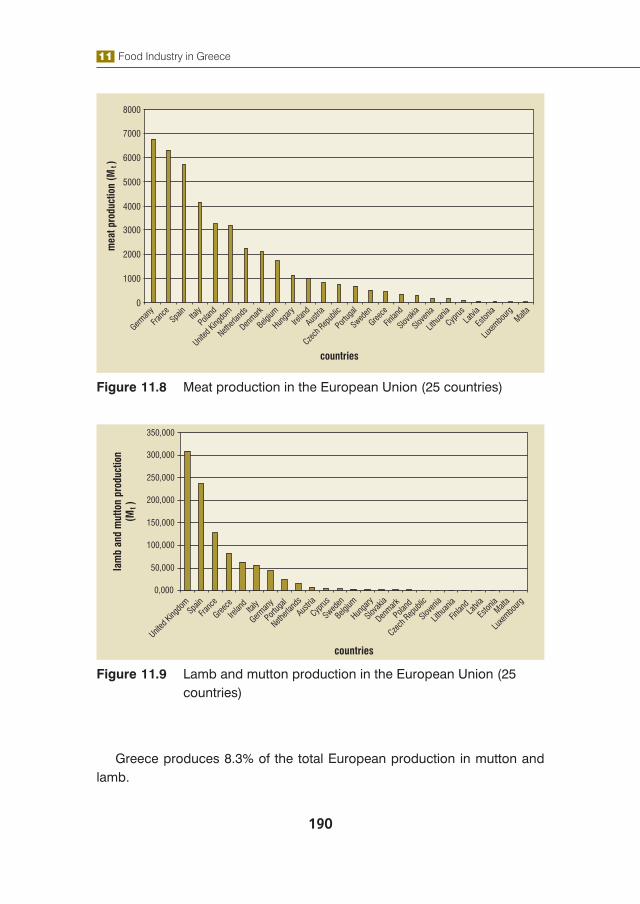
Figure 11.8 Meat production in the European Union (25 countries)
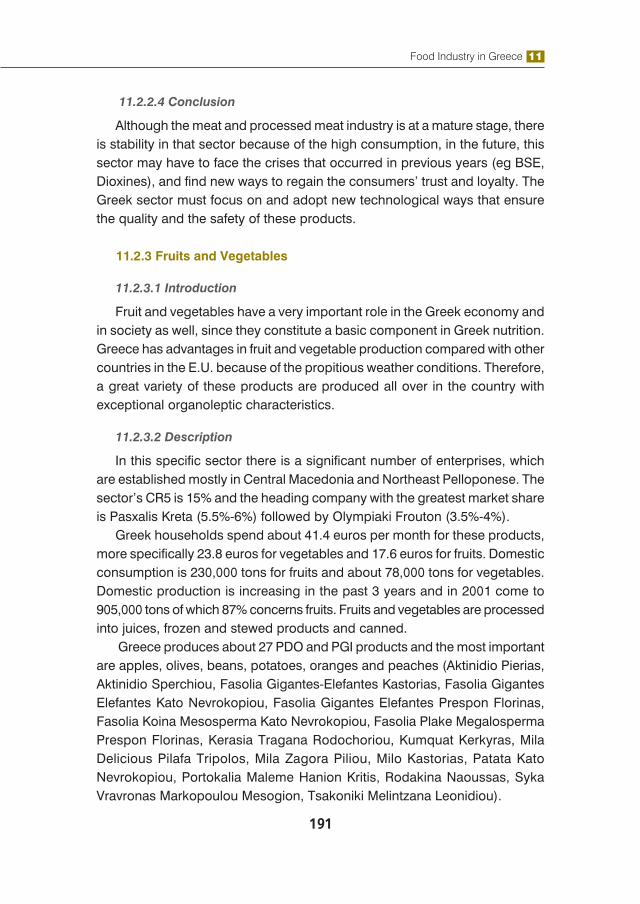
Figure 11.9 Lamb and mutton production in the European Union (25 countries)
Greece produces 8.3% of the total European production in mutton and lamb.
Food Industry in Greece 11
191
11.2.2.4 Conclusion
Although the meat and processed meat industry is at a mature stage, there is stability in that sector because of the high consumption, in the future, this sector may have to face the crises that occurred in previous years (eg BSE, Dioxines), and find new ways to regain the consumers’ trust and loyalty. The Greek sector must focus on and adopt new technological ways that ensure the quality and the safety of these products.
11.2.3 Fruits and Vegetables
11.2.3.1 Introduction
Fruit and vegetables have a very important role in the Greek economy and in society as well, since they constitute a basic component in Greek nutrition. Greece has advantages in fruit and vegetable production compared with other countries in the E.U. because of the propitious weather conditions. Therefore, a great variety of these products are produced all over in the country with exceptional organoleptic characteristics.
11.2.3.2 Description
In this specific sector there is a significant number of enterprises, which are established mostly in Central Macedonia and Northeast Pelloponese. The sector’s CR5 is 15% and the heading company with the greatest market share is Pasxalis Kreta (5.5%-6%) followed by Olympiaki Frouton (3.5%-4%).
Greek households spend about 41.4 euros per month for these products, more specifically 23.8 euros for vegetables and 17.6 euros for fruits. Domestic consumption is 230,000 tons for fruits and about 78,000 tons for vegetables. Domestic production is increasing in the past 3 years and in 2001 come to 905,000 tons of which 87% concerns fruits. Fruits and vegetables are processed into juices, frozen and stewed products and canned.
Greece produces about 27 PDO and PGI products and the most important are apples, olives, beans, potatoes, oranges and peaches (Aktinidio Pierias, Aktinidio Sperchiou, Fasolia Gigantes-Elefantes Kastorias, Fasolia Gigantes Elefantes Kato Nevrokopiou, Fasolia Gigantes Elefantes Prespon Florinas, Fasolia Koina Mesosperma Kato Nevrokopiou, Fasolia Plake Megalosperma Prespon Florinas, Kerasia Tragana Rodochoriou, Kumquat Kerkyras, Mila Delicious Pilafa Tripolos, Mila Zagora Piliou, Milo Kastorias, Patata Kato Nevrokopiou, Portokalia Maleme Hanion Kritis, Rodakina Naoussas, Syka Vravronas Markopoulou Mesogion, Tsakoniki Melintzana Leonidiou).
11 Food Industry in Greece
192
11.2.3.3 International Trade
The centres for the primary production in these products are the Mediterranean countries and the leading two are Italy and Spain.
Greece exports a large part of its domestic production (about 80%) mainly to the Europenean countries and the countries of East Europe. Vegetables have a small share in exports (8.6%), and are declining in recent years. The main category in exporting vegetables are “other vegetables” that includes aubergines, artichokes, peppers, spinach and asparagus (the most important exporting product).
Of the exports made, the largest percentage is destined for Germany and Italy followed by Poland, Bulgaria and Romania. It is estimated that in 2000 34.6 thousand tons were exported As far as fruit is concerned it is estimated that in 2000 7,749 thousand tons were exported with main products oranges (to Romania, Bulgaria, Russia, Germany and Netherlands), melons and watermelons (mostly to Poland, Germany and Italy) and finally peaches (to FYROM, Albania, Germany and Russia).
Greece also imports vegetables in quantities corresponding to 29% of domestic production (in 2000) with the largest quantities coming from Netherlands (potatoes) which accounted for 70.8% of imports and Turkey (onions, garlic at about 13.3% of imports).
Turkey and the Netherlands are the main importers in the fruit market for Greece with the main imported product bananas (62.3% of the imports) and lemons, who are basically imported from Italy and Spain.
11.2.3.4 Conclusion
In the future many opportunities appear for the expansion of Greek fruit and vegetable production. Greece should take advantage of the ongoing promotion and tendency of the healthy Mediterranean diet to increase the cultivation and the exports of quality products.
11.2.4 Wine
11.2.4.1 Introduction
Since ancient times, Greece played a crucial role in the development of the wine culture of Europe. During the last forty years the Greek wine industry has struggled to regain its name. Now, armed with an ocean of indigenous cultivars, a superior climate for grape growing and an abundance of brainpower and
Food Industry in Greece 11
193
technological resources, Greek wine now presents exciting new possibilities for wine consumers around the world.
11.2.4.2 Description of production
Greece now has 129,000 hectares of vines and in 2000 produced 3,558,000 hls (hls=100 litres). This puts it in 14th place in the world, just behind Brazil but ahead of Hungary.
Greece is ranked fifth in Europe for vineyard area, and sixth for the production of wine.
The production of Greek wine is about 4,300 thousand hls, which represent 2.5% of the whole European production (173,776 thousand hls).
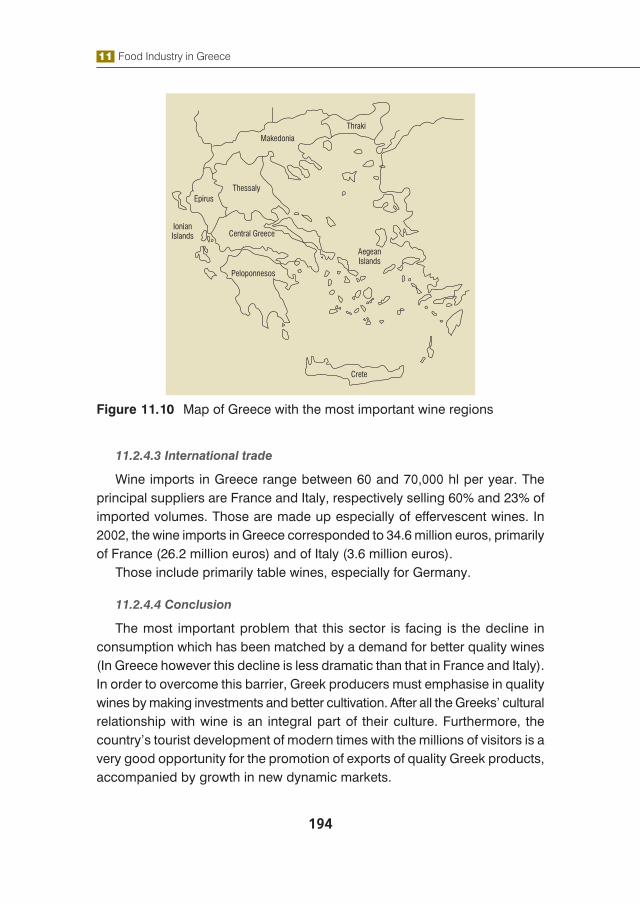
The production is divided in two main categories: VQPRD (Vin de qualité produit dans une région determinée) and Vin de pays. There are many different wines in Greece (for example: Agchialos, Amynteo, Archanes, Goumenissa, Dafnes e.t.c.). There are about 27 kinds of VQPRD wines in Greece and the main regions who produce these kinds of wine are Macedonia, Peloponnese Islands (especially Crete and Santorini) The most popular white wine is Retsina, a wine flavored with pine-resin, often not appreciated by foreigners.
The largest share in the domestic wine production has to do with table wines at 85.8% and with the named location wines (VQPRD) following at a great distance with 14.2%. White wines cover about 70.5% of the total production, while the reds have a 29.5% share.
As regards the per capita consumption of wine, the average in Greece for the last five years has been around 26.2 litres. The difference is notable with other wine producing countries of the E. U. where the consumption has been 60.1 lt. per capita in France, 58.5 in Italy, 53 in Portugal and 36.9 litres in Spain.
The local production largely exceeds the domestic demand. Greece has exported more than 28 million litres abroad.
11 Food Industry in Greece
194
Figure 11.10 Map of Greece with the most important wine regions
11.2.4.3 International trade
Wine imports in Greece range between 60 and 70,000 hl per year. The principal suppliers are France and Italy, respectively selling 60% and 23% of imported volumes. Those are made up especially of effervescent wines. In 2002, the wine imports in Greece corresponded to 34.6 million euros, primarily of France (26.2 million euros) and of Italy (3.6 million euros).
Those include primarily table wines, especially for Germany.
11.2.4.4 Conclusion
The most important problem that this sector is facing is the decline in consumption which has been matched by a demand for better quality wines (In Greece however this decline is less dramatic than that in France and Italy). In order to overcome this barrier, Greek producers must emphasise in quality wines by making investments and better cultivation. After all the Greeks’ cultural relationship with wine is an integral part of their culture. Furthermore, the country’s tourist development of modern times with the millions of visitors is a very good opportunity for the promotion of exports of quality Greek products, accompanied by growth in new dynamic markets.
Food Industry in Greece 11
195
11.2.5 Olive oil
11.2.5.1 Introduction
Greece has a great tradition in the production of olive oil. The competitive advantage of Greek olive oil in relation to that of other countries is its fine quality. The Greek market of olive oil is important for the high level of production, but also for the national consumption and for international trade.
One of the sector’s characteristics is the existence of a large number of business units, which vary both as to their sizes as well as activity. Olive oil is primarily produced at the olive presses. These are small sized, family run businesses, which are set up in oil producing areas.
11.2.5.2 Description of production
Greece produces 17 P.D.O and P.G.I. olive oil products :• Agios Mathaios Kerkyras • Apokoronas Hanion Kritis • Archanes Iraklio Kritis • Exeretiko partheno eleolado: “Thrapsano” • Finiki Lakonias• Kalamata • Kefalonia • Kolymvari Hanion Kritis • Kranidi Argolidas • Krokees Lakonias • Hania Kritis • Lakonia • Lesbos • Lygourgio Asklipiou • Olympia • Petrina Lakonias • Peza Iraklio Kritis • Preveza • Rhodos • Samos • Sitia Lasithi Kritis • Thassos • Viannos Iraklio Kritis
11 Food Industry in Greece
196
• Vorios Mylopotamos Rethymnis Kritis • Zakynthos
More than 750 million olive trees are cultivated world wide, the greatest number (c. 95%) being planted in the regions around the Mediterranean.
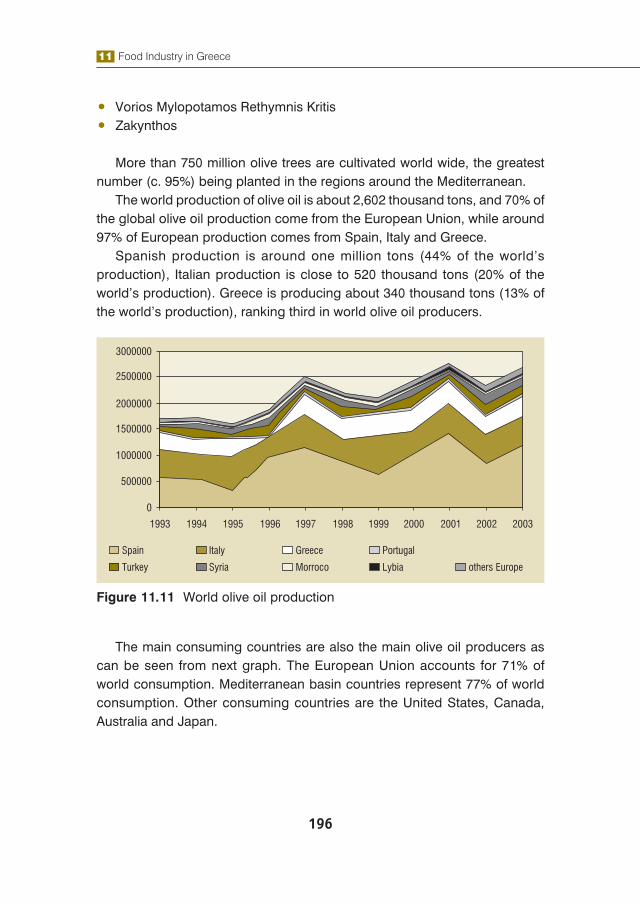
The world production of olive oil is about 2,602 thousand tons, and 70% of the global olive oil production come from the European Union, while around 97% of European production comes from Spain, Italy and Greece.
Spanish production is around one million tons (44% of the world’s production), Italian production is close to 520 thousand tons (20% of the world’s production). Greece is producing about 340 thousand tons (13% of the world’s production), ranking third in world olive oil producers.
Figure 11.11 World olive oil production
The main consuming countries are also the main olive oil producers as can be seen from next graph. The European Union accounts for 71% of world consumption. Mediterranean basin countries represent 77% of world consumption. Other consuming countries are the United States, Canada, Australia and Japan.

Food Industry in Greece 11
197
Figure 11.12 World olive oil consumption
11.2.5.3 International trade
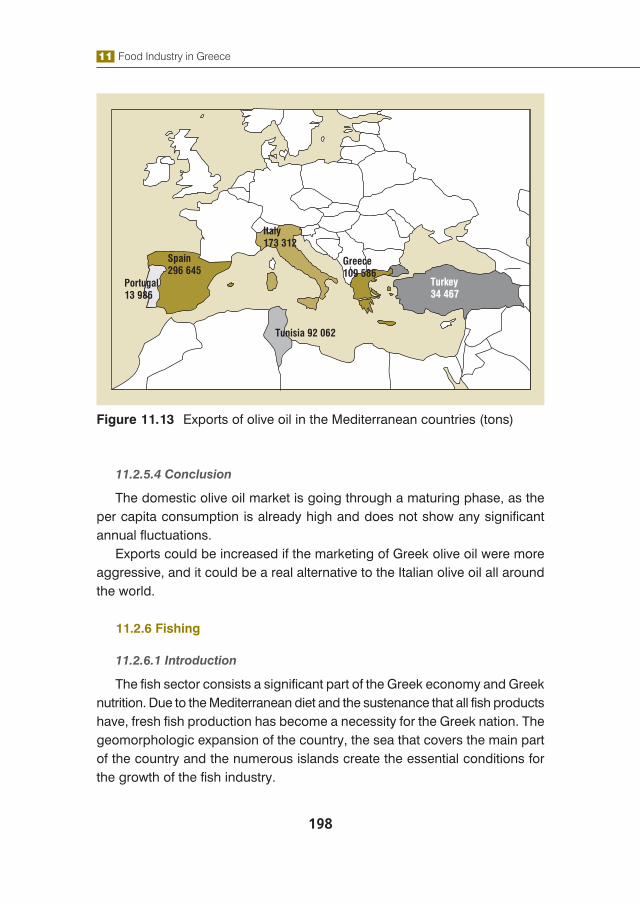
Greece is exporting about 109 thousand tons of olive oil annually in the world. It is also ranked third in world exports. In 2003 Greek exports to Italy increased by 8.9% compared with those of 2002. Greek exports grew due to the increase by 57% of the oil exports. Oil represents 23% of Greece total exports. In Italy it is the major export product.
11 Food Industry in Greece
198
Figure 11.13 Exports of olive oil in the Mediterranean countries (tons)
11.2.5.4 Conclusion
The domestic olive oil market is going through a maturing phase, as the per capita consumption is already high and does not show any significant annual fluctuations.
Exports could be increased if the marketing of Greek olive oil were more aggressive, and it could be a real alternative to the Italian olive oil all around the world.
11.2.6 Fishing
11.2.6.1 Introduction
The fish sector consists a significant part of the Greek economy and Greek nutrition. Due to the Mediterranean diet and the sustenance that all fish products have, fresh fish production has become a necessity for the Greek nation. The geomorphologic expansion of the country, the sea that covers the main part of the country and the numerous islands create the essential conditions for the growth of the fish industry.
Food Industry in Greece 11
199
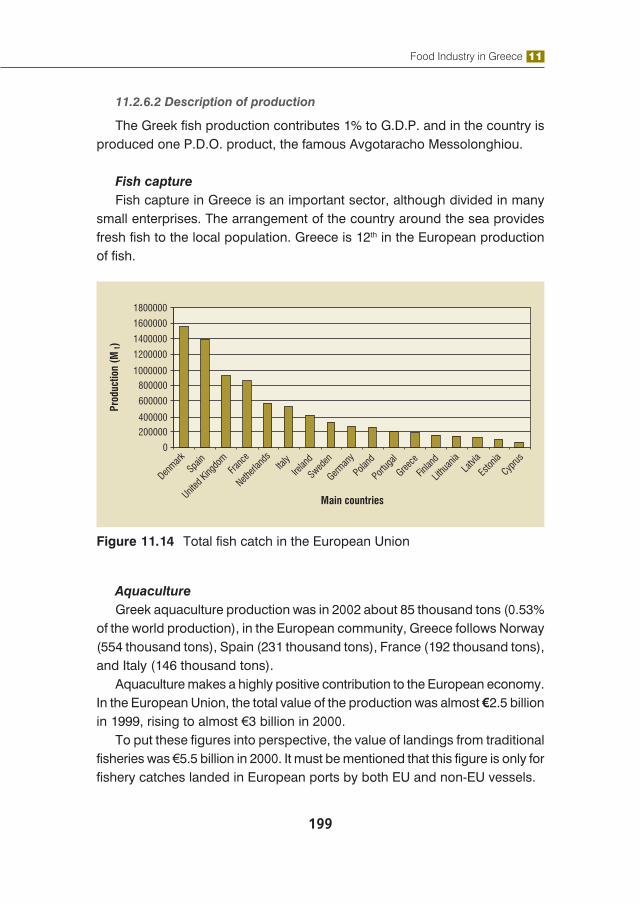
11.2.6.2 Description of production
The Greek fish production contributes 1% to G.D.P. and in the country is produced one P.D.O. product, the famous Avgotaracho Messolonghiou.
Fish captureFish capture in Greece is an important sector, although divided in many
small enterprises. The arrangement of the country around the sea provides fresh fish to the local population. Greece is 12th in the European production of fish.
Figure 11.14 Total fish catch in the European Union
AquacultureGreek aquaculture production was in 2002 about 85 thousand tons (0.53%
of the world production), in the European community, Greece follows Norway (554 thousand tons), Spain (231 thousand tons), France (192 thousand tons), and Italy (146 thousand tons).
Aquaculture makes a highly positive contribution to the European economy. In the European Union, the total value of the production was almost €2.5 billion in 1999, rising to almost €3 billion in 2000.
To put these figures into perspective, the value of landings from traditional fisheries was €5.5 billion in 2000. It must be mentioned that this figure is only for fishery catches landed in European ports by both EU and non-EU vessels.
11 Food Industry in Greece
200
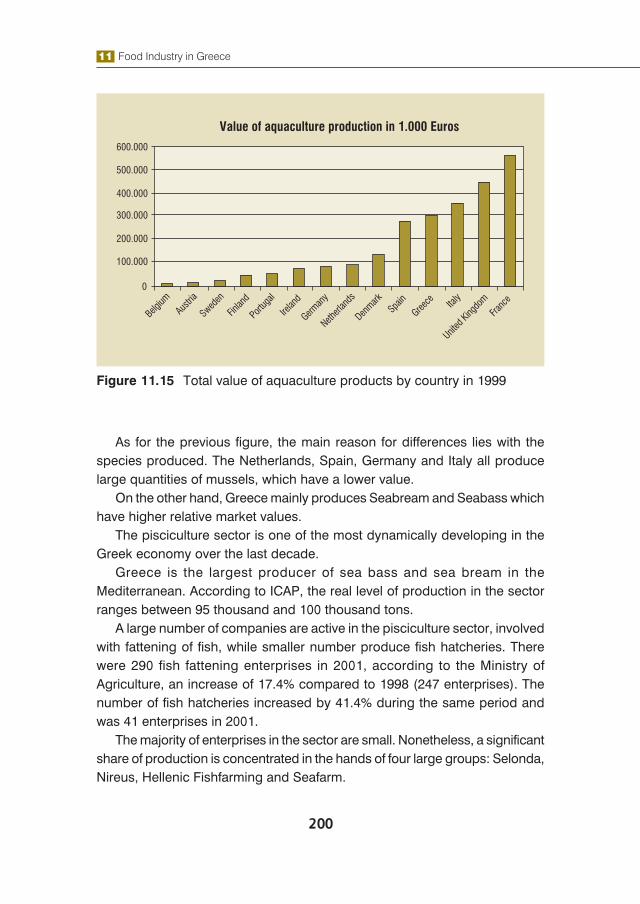
Figure 11.15 Total value of aquaculture products by country in 1999
As for the previous figure, the main reason for differences lies with the species produced. The Netherlands, Spain, Germany and Italy all produce large quantities of mussels, which have a lower value.
On the other hand, Greece mainly produces Seabream and Seabass which have higher relative market values.
The pisciculture sector is one of the most dynamically developing in the Greek economy over the last decade.
Greece is the largest producer of sea bass and sea bream in the Mediterranean. According to ICAP, the real level of production in the sector ranges between 95 thousand and 100 thousand tons.
A large number of companies are active in the pisciculture sector, involved with fattening of fish, while smaller number produce fish hatcheries. There were 290 fish fattening enterprises in 2001, according to the Ministry of Agriculture, an increase of 17.4% compared to 1998 (247 enterprises). The number of fish hatcheries increased by 41.4% during the same period and was 41 enterprises in 2001.
The majority of enterprises in the sector are small. Nonetheless, a significant share of production is concentrated in the hands of four large groups: Selonda, Nireus, Hellenic Fishfarming and Seafarm.
Food Industry in Greece 11
201
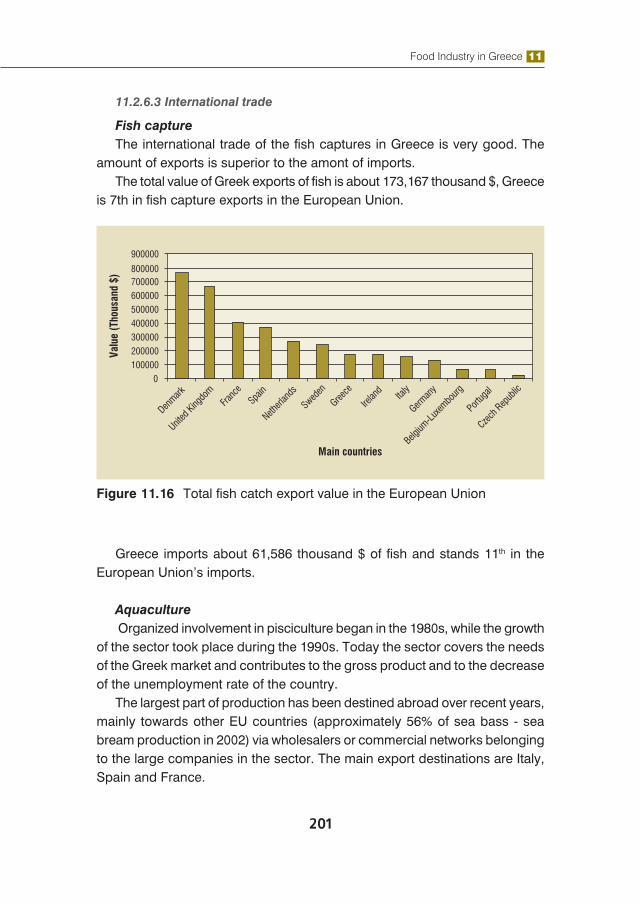
11.2.6.3 International trade
Fish captureThe international trade of the fish captures in Greece is very good. The
amount of exports is superior to the amont of imports.The total value of Greek exports of fish is about 173,167 thousand $, Greece
is 7th in fish capture exports in the European Union.
Figure 11.16 Total fish catch export value in the European Union
Greece imports about 61,586 thousand $ of fish and stands 11th in the European Union’s imports.
Aquaculture Organized involvement in pisciculture began in the 1980s, while the growth
of the sector took place during the 1990s. Today the sector covers the needs of the Greek market and contributes to the gross product and to the decrease of the unemployment rate of the country.
The largest part of production has been destined abroad over recent years, mainly towards other EU countries (approximately 56% of sea bass - sea bream production in 2002) via wholesalers or commercial networks belonging to the large companies in the sector. The main export destinations are Italy, Spain and France.
11 Food Industry in Greece
202
11.2.6.4 Conclusion
The favorable conditions prevailing over the previous decade led to a rapid increase in the number of businesses in the sector and the quantity of the produced fish, without appropriate planning. These facts generated several problems and especially the reduction in sale price.
On the other hand the trend prevailing over recent years for a healthier form of living has positively affected demand for fish from pisciculture and boosted the production of the Greek companies.
11.3 DRINK PRODUCTS
11.3.1 Alcoholic drinks
11.3.1.1 Introduction
The sector of alcoholic drinks can be characterized by high concentration and intense competitiveness as it is controlled by a small number of companies, which belong to multinational companies that provide products with strong brands. In this sector there are some companies, which have been activated in the production of ouzo, in particular, and some other drinks.
11.3.1.2 Description of production and consumption habits
The market share of alcoholic drinks, in Greece, shows a slight increase during the last 2 years of 1-2%. Companies are trying to offer more attractive products, like Ursus Roter, special whisky, and alcoholic beverages called “ready to drink”. Those offers were necessary because of the minor decrease of this market, and the low alcohol consumption per capita in Greece (7.9 litres). Apart from these, low financial status of Greeks has decreased their entertainment outside home. As a result, there has been an increase in the sales of alcohol drinks in super-markets, where companies of this industry should focus.
In 2003, 6,310 million boxes of 9 litres were sold in Greece, against 6,450 million boxes of 9 litres in 1992. Whisky covered 37-43% of total consumption during the period 1992-2003. Ouzo follows with 25-31% and it is not produced in any other part of the world except for Greece as a result it is 100% Greek product and the country´s national drink. The best Ouzo it is considered that of the island of Lesvos and the producers probably carry one of the most

Food Industry in Greece 11
203
popular Lesvos brands. There has been an increase in the consumption of liquor. The last years covered 7.7-10.3% of the market share, against 5-7.8% in the past. Brandy share reduced in the period 1992-2003, covering 8-12.5%. Vodka covered 7-8.5%, showing an increase, and rum covered 3.5-5%.
According to World Trend Links, the highest per capita alcohol consumption, among 20 European countries, in 2001, belongs to Luxemburg with 12.4 litres. Czech follows with 10.9 litres, and Ireland with 10.8 litres. Greece is in 19th place with 7.9 litres.
Figure 11.17 Per capita alcohol consumption (litres) in 2001
11.3.1.3 International trade
The sales level of productive and import companies has increased significantly. In 2002, the total sales of the 31 largest productive companies were worth 213.5 million euros, compared with 184 million euros in 2001 (16% increase). During the period 2002-2003, sales increased by 3.4%. Companies that import alcoholic drinks presented similar development. The sales level of the 19 largest import companies increased in 2002 by 13.9%, compared with 2001. In the period 2002-2003, the growth was 7.2%.
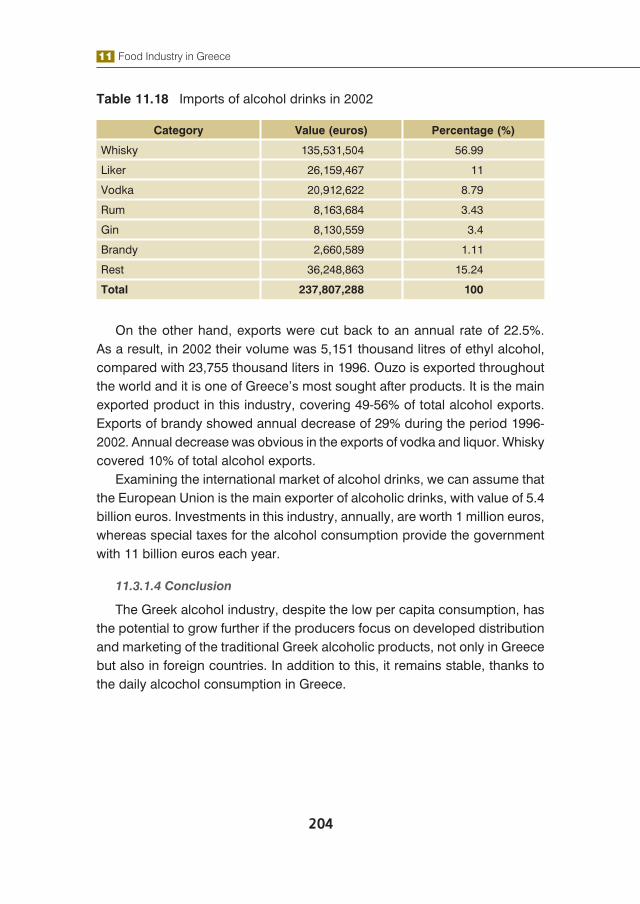
Imports in the period 1996-2002 were annually increased by 5.9%, so in 2002 their volume was 26,216 thousand litres of ethyl alcohol. The main product that Greece imported was whisky, covering 46-67% of total imports. Vodka covered 7.5-14.5% of total imports, liquor 7-12%, rum 2.5-8% and brandy 5.5% (Table 11.18).
11 Food Industry in Greece
204
Table 11.18 Imports of alcohol drinks in 2002
Category Value (euros) Percentage (%)
Whisky 135,531,504 56.99
Liker 26,159,467 11
Vodka 20,912,622 8.79
Rum 8,163,684 3.43
Gin 8,130,559 3.4
Brandy 2,660,589 1.11
Rest 36,248,863 15.24
Total 237,807,288 100
On the other hand, exports were cut back to an annual rate of 22.5%. As a result, in 2002 their volume was 5,151 thousand litres of ethyl alcohol, compared with 23,755 thousand liters in 1996. Ouzo is exported throughout the world and it is one of Greece’s most sought after products. It is the main exported product in this industry, covering 49-56% of total alcohol exports. Exports of brandy showed annual decrease of 29% during the period 1996-2002. Annual decrease was obvious in the exports of vodka and liquor. Whisky covered 10% of total alcohol exports.
Examining the international market of alcohol drinks, we can assume that the European Union is the main exporter of alcoholic drinks, with value of 5.4 billion euros. Investments in this industry, annually, are worth 1 million euros, whereas special taxes for the alcohol consumption provide the government with 11 billion euros each year.
11.3.1.4 Conclusion
The Greek alcohol industry, despite the low per capita consumption, has the potential to grow further if the producers focus on developed distribution and marketing of the traditional Greek alcoholic products, not only in Greece but also in foreign countries. In addition to this, it remains stable, thanks to the daily alcochol consumption in Greece.
Food Industry in Greece 11
205
11.3.2 Beer
11.3.2.1 Introduction
Although it has a long history, beer remains one of the most popular alcoholic drinks all over the world. People consume more than 120 billion litres worldwide and the Greek people consume 460 million litres of beer every year.
11.3.2.2 Description of production and consumption habits
The total turn-over is about 450 million euros and the local production and commercial companies are in competition. Athenian Brewing holds the first place in the market with the brand “Amstel” and “Heineken” over 70% of the total market and the Scottish & Newcastle with the brand “Mythos”, “Henniger”, “Foster´s” and “Guinness” follows. Although the consumption of beer in Greece steadily increased over the last years, and presently the situation is still changing, the consumption of beer remains unchanged. During the period 1996-2001, the local consumption of beer from 384 million litres increased to 438 million litres and the total turnover reached 424 million euro.
Beer consumption in the Greek market is seasonally increased. According to research, 60% of the total sales of the beer industry was accomplished during the period March-September. One of the most important factors, which influence the local beer market, is the weather condition during the summer. However, a great number of Greek beer consumers appear to enjoy beer even in the winter months. Apart from this, tourism is also another factor that increases the consumption of beer. During the Olympic year 2004-beer consumption increased not only for commercial reasons but also due to the increase of tourism in Greece during the summer period.
Last but not least, it has been noticed that most of the Greeks consume beer at bars or restaurants while only the 35% of the Greek population consumes beer from supermarkets. On the other hand, according to recent research, the change in the way of life, the in-house entertainment and the extremely high prices are the factors that lead consumers to in-house beer consumption.
11.3.2.3 International trade
According to recent research in the market, the total beer produced in Greece reaches 94% to 95% of the total local consumption while the only 5% to 6% is imported. Although the turnover of the imported beer is higher this does not really effect the domination of local beer production.

11 Food Industry in Greece
206
11.3.2.4 Conclusion
The Greek beer industry is taking some positive steps with the launching of Greek brands (Mythos, Alfa). However, these products face the challenge of imported beers, considering the brand loyalty of the consumers at this market.
11.3.3 Bottled water
11.3.3.1 Introduction
The industry of bottled water has been developing in Greece due to the current trend towards a healthy and balanced diet. More and more Greek consumers prefer bottled water to any other drink (alcoholic or not), especially during the summer months, and it is a fact that it holds a large market share. In addition the insufficiency of water supplies as well as the doubtful quality of water in some regions, favour the demand for bottled water even more. Nowadays, Greek bottled water is considered quite competitive to the rest of European brands and this is due to the fact that it has high-standard physiochemical parameters and excellent organoleptic characteristics because of the morphology of the ground. The quality of Greek bottled water has improved since 2002, when EFET (national institution of control of foods) imposed rules of hygiene for bottling companies.
11.3.3.2 Description of production
The consumption of bottled water during the 90’s was fluctuating at about 210 million litres per year, whereas in the middle of that decade it increased, reaching the level of 460 million liters. In addition to this, the exports of this product are rising, representing 5-7% of the annual production.
Figure 11.18 Consumption of bottled water
Food Industry in Greece 11
207
The overall consumption of bottled water in Greece is still less than the average in Europe. The annual consumption per capita in Greece is 50 litres, whereas in Europe is 95 litres. Bottled water has the potential to increase its market share, taking advantage of the changing habits. People consider going to a restaurant as a special way of amusement, paying less attention to what they eat. They mostly care about the environment of the restaurant. Under these circumstances, they do not ask for a jug of water but for bottled water, which has an identity and meets their status needs. The financial status of Greeks is an obstacle in the increase of bottled water consumption. Apart from this, consumption is strongly related to physical needs, which are higher in the summer when tourism is also higher so consumption increases. Therefore, the problem focuses during the winter period; industries should try to change people’s preferences from refreshments to bottled water. Furthermore, bottled water should be served more frequently in bars and cafeterias, which is the case during the last 3 years.
In general, the market of bottled water is divided in:• Home consumption: products are sold in super-markets and local
shops. • Out of home consumption: products are sold in cafeterias, bars, restaurants,
hotels etc. Home consumption represents 45% of total consumption and shows the
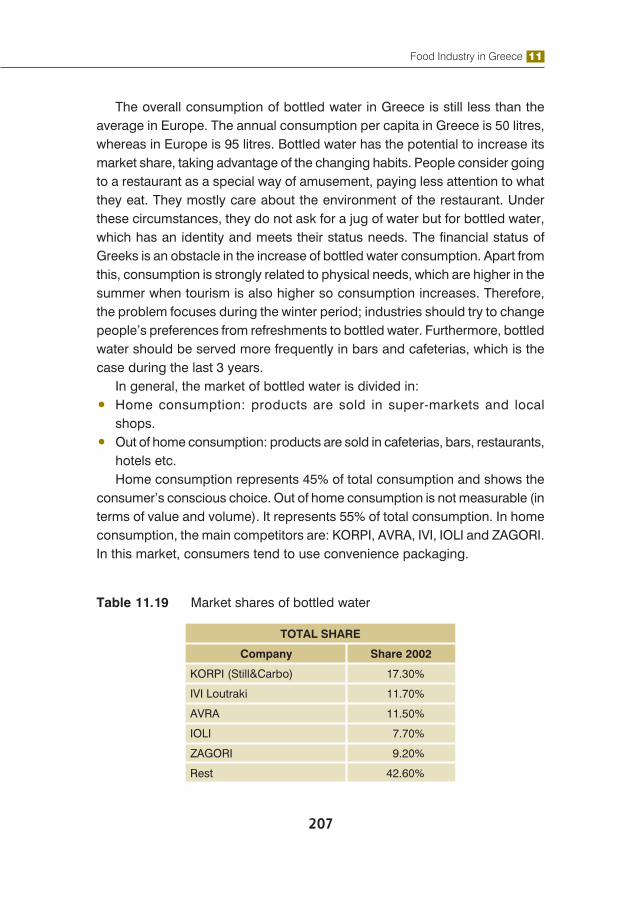
consumer’s conscious choice. Out of home consumption is not measurable (in terms of value and volume). It represents 55% of total consumption. In home consumption, the main competitors are: KORPI, AVRA, IVI, IOLI and ZAGORI. In this market, consumers tend to use convenience packaging.
Table 11.19 Market shares of bottled water
TOTAL SHARE
Company Share 2002
KORPI (Still&Carbo) 17.30%
IVI Loutraki 11.70%
AVRA 11.50%
IOLI 7.70%
ZAGORI 9.20%
Rest 42.60%

11 Food Industry in Greece
208
STILL WATER
Company Share 2002
KORPI (Still) 17.80%
IVI Loutraki 12.30%
AVRA 12.00%
IOLI 8.00%
ZAGORI 9.60%
Rest 40.30%
CARBO WATER
Company Share 2002
KORPI (Carbo) 9.20%
Perrier 13.40%
Souroti 43.50%
Doumbia 5.20%
Dorna 12.50%
Rest 16.20%
11.3.3.3 Conclusion
As a conclusion, Greek bottled water could be considered the “goose that lays the golden egg” in our country and it has potential to be exported all over the world because it is one of the most quality products worldwide. Consequently, producers and goverment must protect, advertise and upgrade the bottled water not only in our country but also in the abroad market.
11.4 NON-FOOD PRODUCTS
11.4.1 Cotton
11.4.1.1 Introduction
Cotton cultivation has a very important role in theGreek economy. Greece is one of the top ten cotton producing countries in the world. With the exception of Spain, which produces only small quantities, it is the only country of the European Union to produce cotton. In spite of the fact that cotton production in Greece has increased substantially over the past years, it represents only a small part of total European consumption.

Food Industry in Greece 11
209
11.4.1.2 Description of production
It is estimated than more than 90,000 farmers have cotton as main cultivation and more than 170,000 urban families are occupied with its remaking. Cotton compared with other similar crops provides sufficient income to the farmers. The enterprises with cotton gins are placed mostly in Macedonia (34.6%), in Thessalia (29.6%) and in Main Greece (25.9%), places where weather conditions are suitable for this production.
Table 11.20 The main producers in cotton worldwide. (1,000 tons)
The main producers in cotton worldwide (1,000 tons)
1. China 4,000 6. Turkey 850
2. U.S.A. 3,700 7. Australia 680
3. India 2,800 8. Greece 420
4. Pakistan 1,700 9. Brazil 400
5. Uzbekistan 1,150 10. Syria 300
11.4.1.3 International trade
Greece holds sixth position in cotton exports worldwide with 250 thousand tons. Even countries that produce and export cotton, like the U.S.A. and Turkey, import cotton from Greece, something that indicates the high quality of the Greek cotton. Greece imports limited quantities of cotton, particularly varieties that cannot be produce domestically.

11 Food Industry in Greece
210
Figure 11.19 Cotton exports in the world
11.4.1.4 Conclusion
The Greek cotton industry is powerful but the new orientation of the C.A.P will probably endanger the local production. With the new regulations many limitations restrict cotton mass production and development. Penalties are enforced by the E.U. when the producers disobey these regulations. In the future this sector has to face all these challenges and to find new strategic alternatives.
11.4.2 Tobacco
11.4.2.1 Introduction
The economic and social importance of tobacco cultivation is particularly significant for Greece. Especially in the north areas of the country 70,000 families are occupied with tobacco crops and more than 750,000,000 sq. meters of land are cultivated. The number of tobacco processing & trading enterprises today in Greece is approximately 25. Of these enterprises the

Food Industry in Greece 11
211
number of well - organized units which stand out in terms of the size of their facilities and the quantities of tobacco processed and transported, is limited to certain groups or single enterprises whose number does not exceed 6 - 7 in total. Among them stand out Papastratos Inc, Karelia Inc, Keranis Inc, SECAP and the Tobacco Industry of Xanthi.
11.4.2.2 Description of production
Greece is the leading country in the production of tobacco in the European Union. In relation to the country’s position of the international market, Greece holds the 7th place.
Figure 11.20 Tobacco production in the European Union
Domestic production of tobacco leaves over the last two years has been around 120,000 tons. The main varieties are Virginia (33.7%), Basmas (23.4%) and Katerini(14.4%). Basmas and Katerini are considered to be of a higher quality and are well known for the fine taste they give to American cigarettes. The average price of tobacco was 4.58 Euro /kg in 2001, a price that provided the producers with a high income.
11.4.2.3 International trade
Exports during the last two years were around 85 thousand tons and imports were close to 20 thousand tons. It is worth mentioning that tobacco exports represent the 4.5% of the total Greek exports.
11 Food Industry in Greece
212
Greece holds the 6th place in terms of exports. The largest part (90 - 95%) of tobacco leaves processed and transported by most of the tobacco trading enterprises is sold abroad and primarily to well-known multinational companies producing cigarettes. The rest is sold to Greek cigarette manufacturers.
Of these exports, the largest percentage (approximately 80%) is destined for third countries, such as Russia, USA and Germany.The main customers of tobacco trading companies abroad are multinational tobacco companies (Philip Morris Inc., Rothmans, Reemtsma, House of Prince, British American, Orlik Tobacco Company).
Greece also imports tobacco in quantities corresponding to 17.5% of domestic production (in 2001) with the largest quantities coming from non-EU countries (Zimbabwe), which accounted for 57% of imports, compared to 43% for the EU countries (Holland).
First place in terms of global tobacco production is held by China and the country with the highest export activity is Brazil.
In the EU, cultivation and processing of leaf tobacco is carried out in 9 out of the 15 countries and contributes just 20% to the amount of tobacco consumed in Europe, while the remaining percentage is covered by imports.
Greece is the main country producing leaf tobacco in the EU with a share of approximately 39% of overall production, followed by Italy with 36%. The European Union is the largest leaf tobacco importer in the entire world.
At global level, the tobacco trade is controlled by 3 multinational companies (Universal, Dimon and Standard Commercial), which have tobacco-processing factories in many countries around the world, including Greece.
11.4.2.4 Conclusion
To conclude, tobacco is a very important product for Greece, due to the high income that it gives to village families. Also the cultivation reduces the unemployment rate drastically, particularly in upland areas. Moreover it is a high value product. On the other hand Greece is going to face many problems with the implementation of the new Common Agricultural Policy and the decrease of the subsidization. Considering the antismoking campaigns that take place in Europe, the production should be turned towards exports to developing countries and especially the Balkans.
Food Industry in Greece 11
213
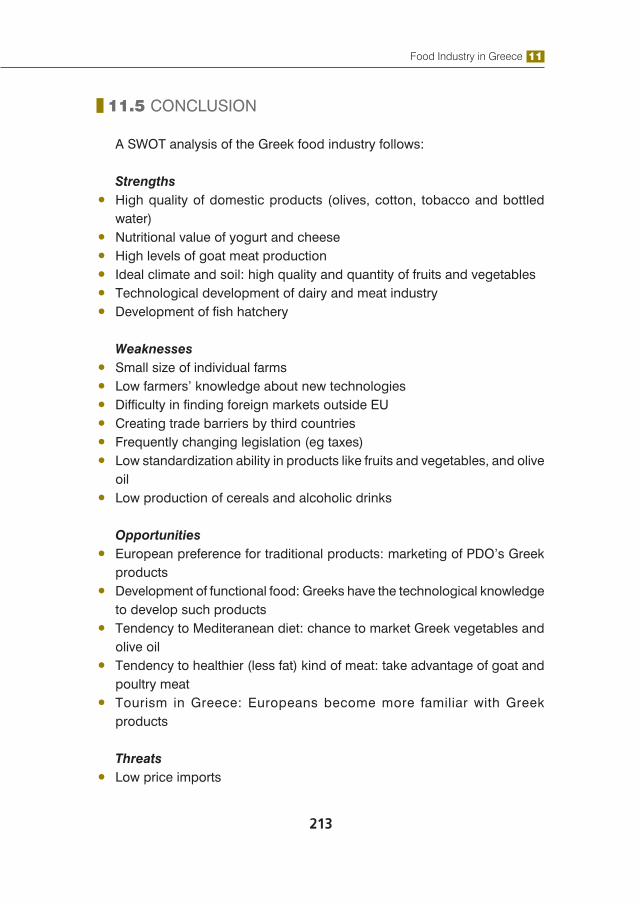
11.5 CONCLUSION
A SWOT analysis of the Greek food industry follows:
Strengths• High quality of domestic products (olives, cotton, tobacco and bottled
water)• Nutritional value of yogurt and cheese• High levels of goat meat production• Ideal climate and soil: high quality and quantity of fruits and vegetables• Technological development of dairy and meat industry• Development of fish hatchery
Weaknesses• Small size of individual farms • Low farmers’ knowledge about new technologies• Difficulty in finding foreign markets outside EU• Creating trade barriers by third countries• Frequently changing legislation (eg taxes)• Low standardization ability in products like fruits and vegetables, and olive
oil• Low production of cereals and alcoholic drinks
Opportunities• European preference for traditional products: marketing of PDO’s Greek
products• Development of functional food: Greeks have the technological knowledge
to develop such products• Tendency to Mediteranean diet: chance to market Greek vegetables and
olive oil• Tendency to healthier (less fat) kind of meat: take advantage of goat and
poultry meat • Tourism in Greece: Europeans become more familiar with Greek
products
Threats• Low price imports
11 Food Industry in Greece
214
• Reorganisation of CAP: negative consequences on tobacco and cotton• New entrance in international trade by third world countries (with low
manufacturing costs)
The food and drink sector is one of the most important and developing sectors in the Greek industry, in terms of value and employment. It is a dynamic sector with significant perspectives, and high potential of growth, since it consists of numerous forceful enterprises that activate out of the boarders.
At the same time, they are emphasizing on producing high quality products, by adopting new technologies, aiming on the consumers’ satisfaction.
Food Industry in Greece 11
215
Food Industry in GreeceFood Industry in Greece 1111
215215
11.6 REFERENCES
1. Ã. ÌÝñãïò, Ê. Ðáðáãåùñãßïõ, «Åîåëßîåéò êáé ÐñïïðôéêÝò ôïõ ÁãñïôéêïýÔïìÝá», Áè. Óôáìïýëçò, 1997.
2. Essays in Agricultural Economy, Fishery and pisciculture, Th. Papailias, Agricultural Bank of Greece, Athens, 1996.
3. ÔÑÏÖÉÌÁ ÊÁÉ ÐÏÔÁ, ÍÏÅÌÂÑÉÏÓ 2004, ÔÅÕ×ÏÓ 282. «ÁãïñÜ ÊñÝáôïò êáé Áëëáíôéêþí. Êáéíïôïìßá Þ óôáóéìüôçôá». ÁëåîÜíäñá Ãêßôóç, óåë. 36-40.
4. ÔÑÏÖÉÌÁ ÊÁÉ ÐÏÔÁ, ÍÏÅÌÂÑÉÏÓ 2004, ÔÅÕ×ÏÓ 282. «Áëêïïëïý÷á ÐïôÜ. Êåñäßæïõí Ýäáöïò íÝá ðñïúüíôá êáé ïéêéáêÞ êáôáíÜëùóç». ÁëåîÜíäñá Ãêßôóç, óåë. 42-43.
5. ÔÑÏÖÉÌÁ ÊÁÉ ÐÏÔÁ, ÌÁÑÔÉÏÓ 2003, ÔÅÕ×ÏÓ 265. «ÕøçëÞò ðïéüôçôáò ôï åëëçíéêü åìöéáëùìÝíï íåñü». Êùíóôáíôßíïò Áíáóôáóüðïõëïò, Âáóßëçò ×áñßôóçò, Êþóôáò Æá÷áñïýäçò, ÄçìÞôñçò Êïíôüò, Âáóßëçò Ëþëáò, ÌçíÜò ÌáêñéêÜêçò, ÁíäñÝáò Ôñéáíôáöõëëßäçò, ÃéÜííçò ×Þôïò, óåë. 38-44.
6. ÔÑÏÖÉÌÁ ÊÁÉ ÐÏÔÁ, ÉÏÕÍÉÏÓ 2005, ÔÅÕ×ÏÓ 289. «ÐÜìå ãéá ìðßñåò». ÄçìÞôñçò ÐåöÜíçò, óåë. 38-41.
7. ÃÁËÁÊÔÏÊÏÌÉÁ, ÄÅÊÅÌÂÑÉÏÓ 2004, ÔÅÕ×ÏÓ 14. «23% ç áíáìåíüìåíç áíÜðôõîç ôçí åðüìåíç ðåíôáåôßá óôçí ÅëëÜäá». ¸ñåõíá Datamonitor, óåë. 6.
8. E.S.Y.E., Greek Statistics.
9. 1st Scientific Congress on Tobacco, Geothechnical chamber of Greece, Agrinio 1994.
10. Cultivation of Tobacco, National Organisation of Tobacco, Tobacco Institute of Greece, Drama, 1996.
11. http://news.reseau-concept.net/images/oiv/Client/Note_Conjoncture_mars_2005_FR.pdf
12. http://w4u.eexi.gr/~oinos/FRLOI.HTM
13. http://www.vinimarket.com/fiche_pays_49332_fr.htm#49999 (4)
14. http://www.olivierdeprovence.com/infos_huile_olives.htm
15. http://www.icap.gr

11 Food Industry in Greece
216
1111 Food Industry in GreeceFood Industry in Greece
216216
16. http://www.greekproducts.com
17. http://ourworld.compuserve.com/homepages/thraekk/cap.htm
18. http://greekproducts.com/b2b/tobacco.html
19. http://r0.unctad.org/infocomm/francais/olive/marche.htm#prod
20. http://greekproducts.com/b2b/oliveoil.html
21. http://faostat.fao.org/