Embed Size (px)
Citation preview
• Country file
• Market Size
• Consumption Trends
• Distribution Channels
FOOD AND DRINKS MARKET
IN FRANCE
SUTRALIS
COUNTRY FILE
SUTRALIS
SUTRALIS
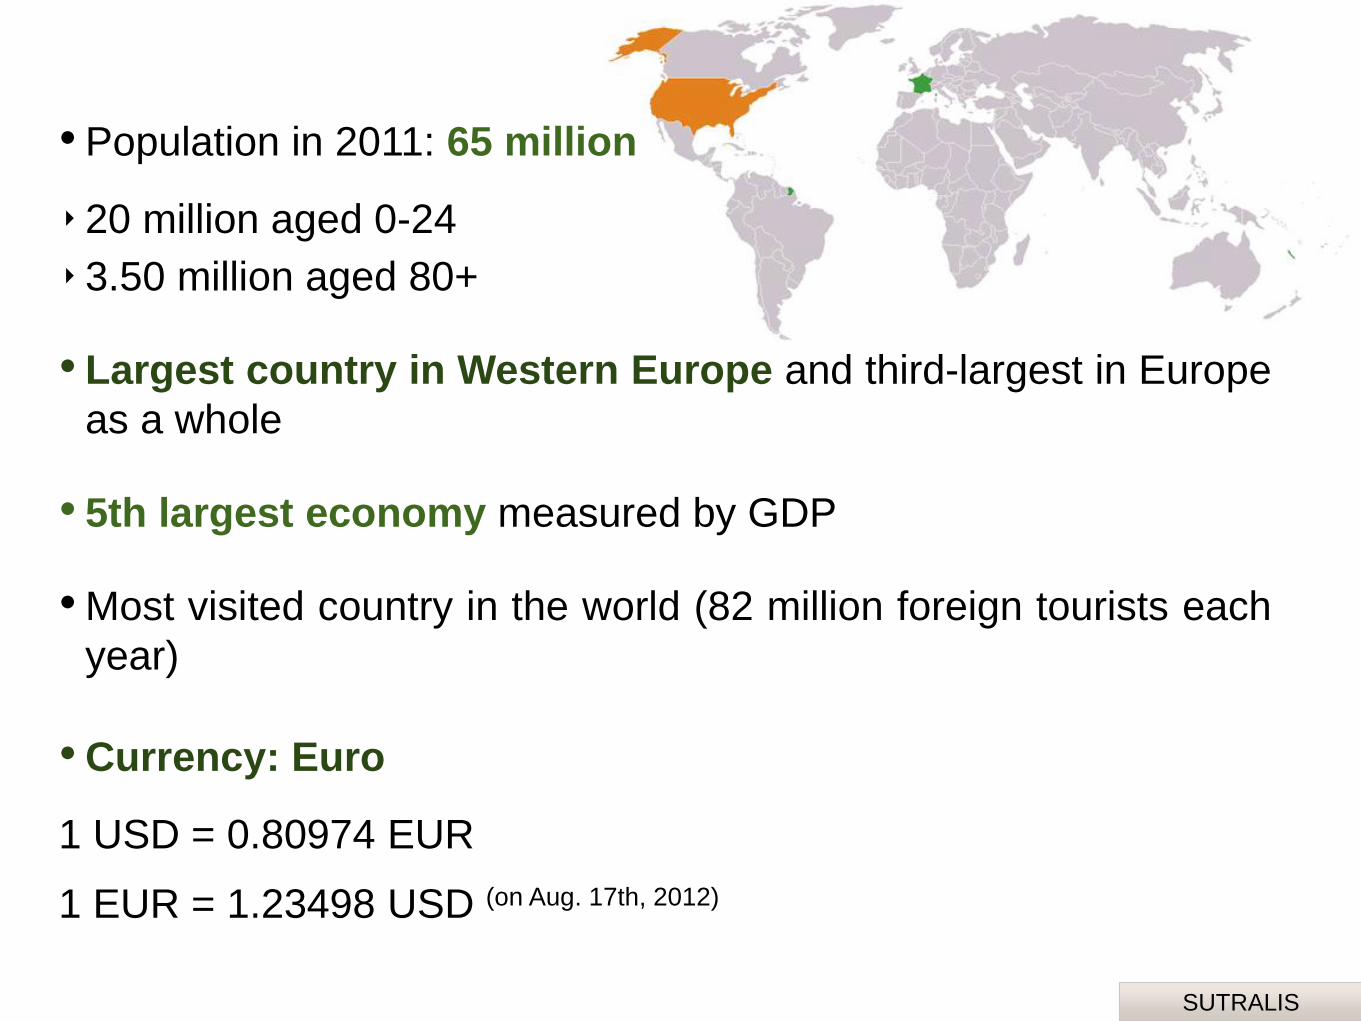
• Population in 2011: 65 million
‣20 million aged 0-24
‣3.50 million aged 80+
• Largest country in Western Europe and third-largest in Europe
as a whole
• 5th largest economy measured by GDP
• Most visited country in the world (82 million foreign tourists each
year)
• Currency: Euro
1 USD = 0.80974 EUR
1 EUR = 1.23498 USD (on Aug. 17th, 2012)
SUTRALIS
MARKET SIZE
SUTRALIS
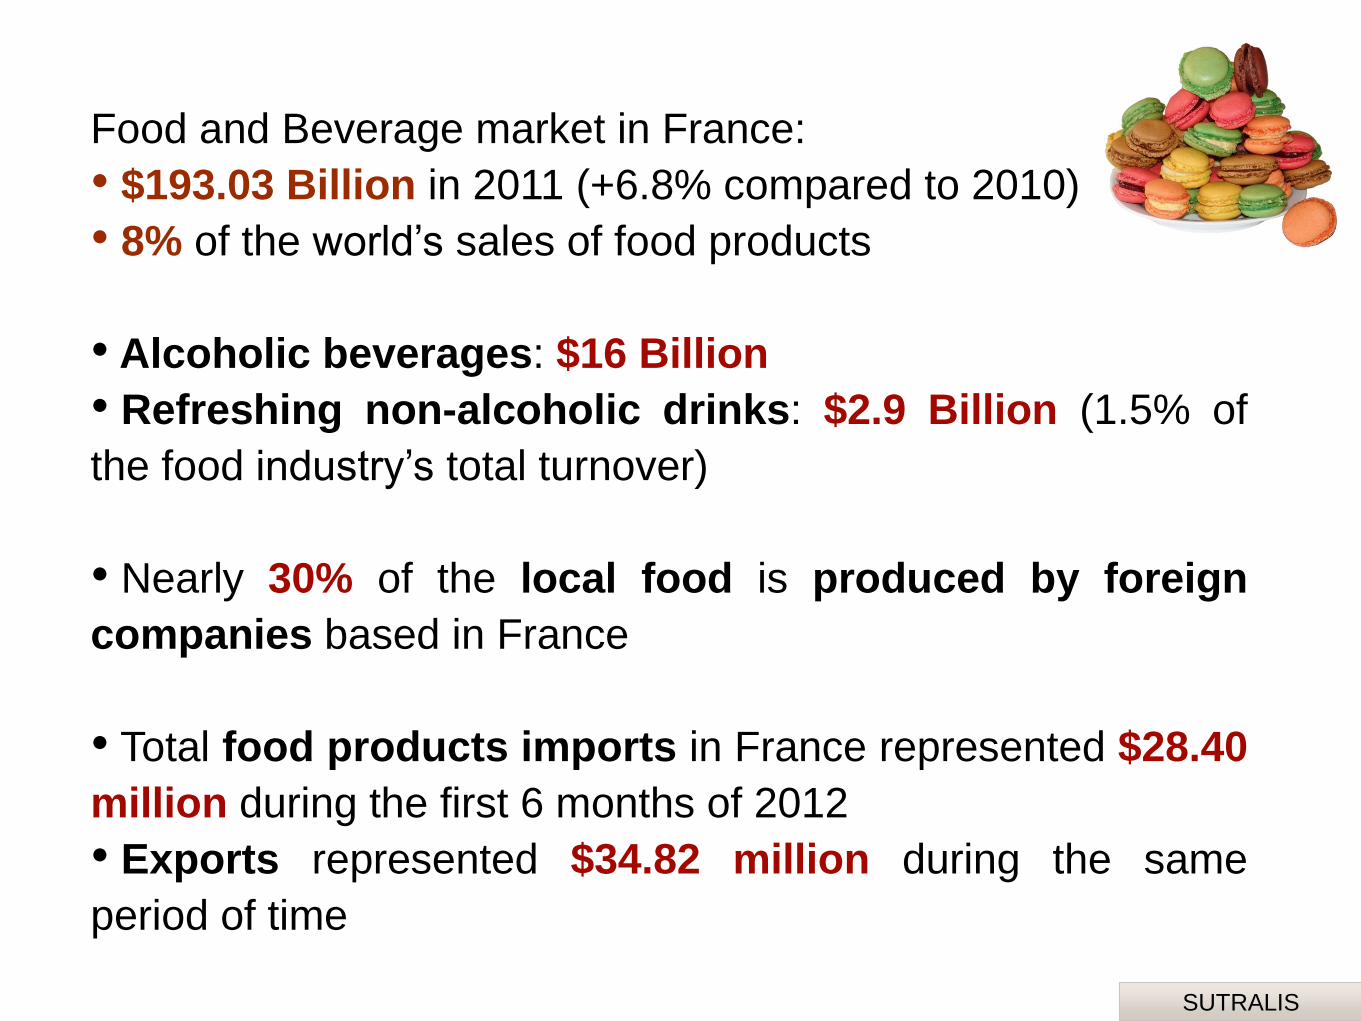
Food and Beverage market in France:
• $193.03 Billion in 2011 (+6.8% compared to 2010)
• 8% of the world’s sales of food products
• Alcoholic beverages: $16 Billion
• Refreshing non-alcoholic drinks: $2.9 Billion (1.5% of
the food industry’s total turnover)
• Nearly 30% of the local food is produced by foreign
companies based in France
• Total food products imports in France represented $28.40
million during the first 6 months of 2012
• Exports represented $34.82 million during the same
period of time
SUTRALIS
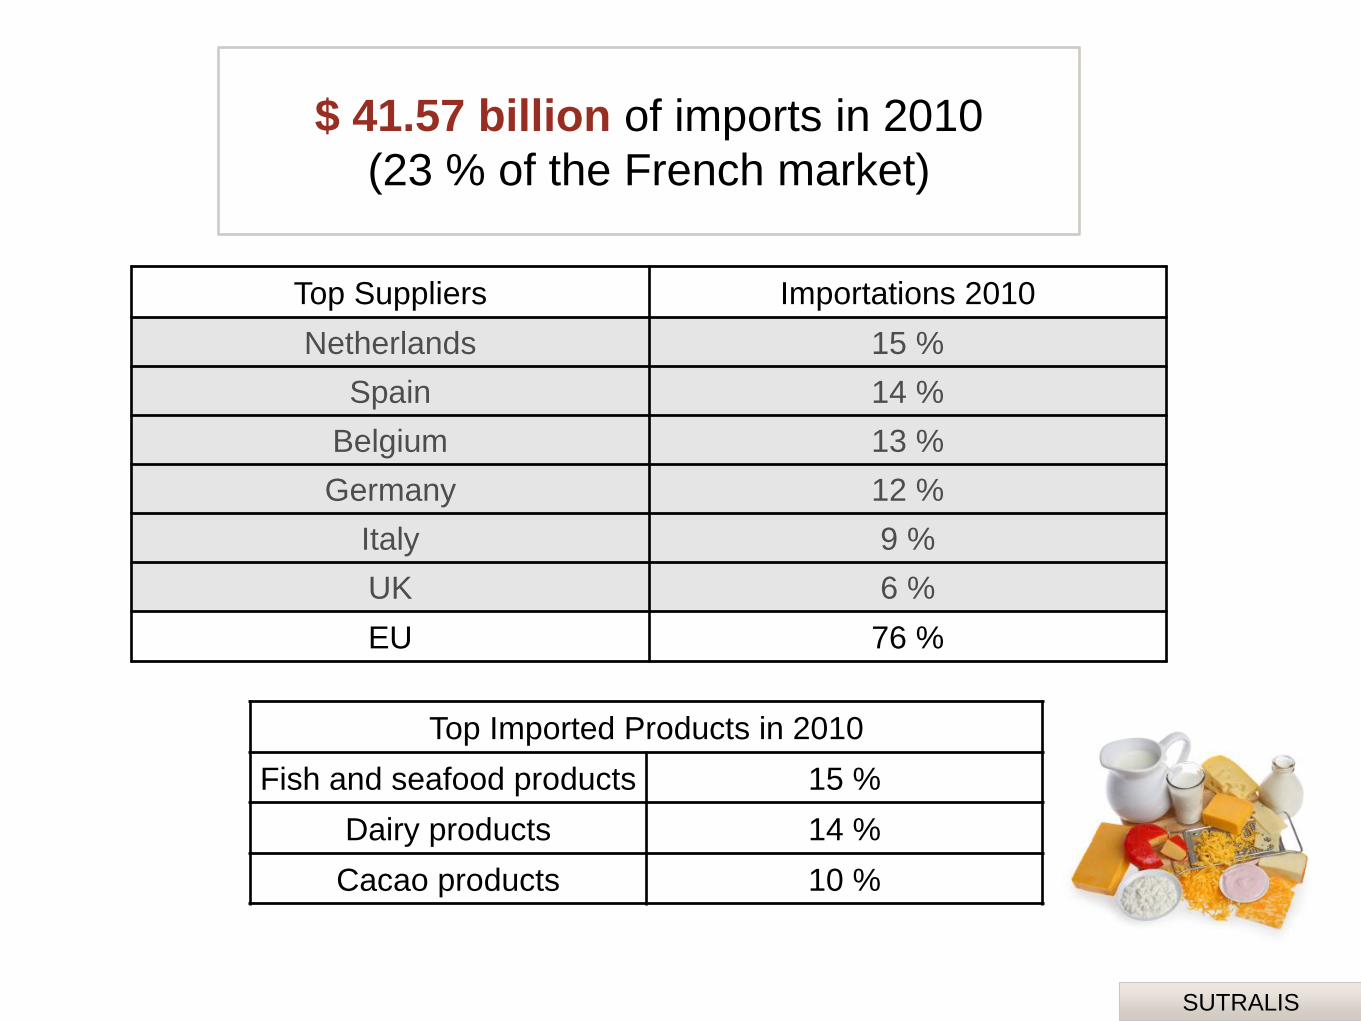
$ 41.57 billion of imports in 2010
(23 % of the French market)
Top Imported Products in 2010
Fish and seafood products 15 %
Dairy products 14 %
Cacao products 10 %
Top Suppliers Importations 2010
Netherlands 15 %
Spain 14 %
Belgium 13 %
Germany 12 %
Italy 9 %
UK 6 %
EU 76 %
SUTRALIS
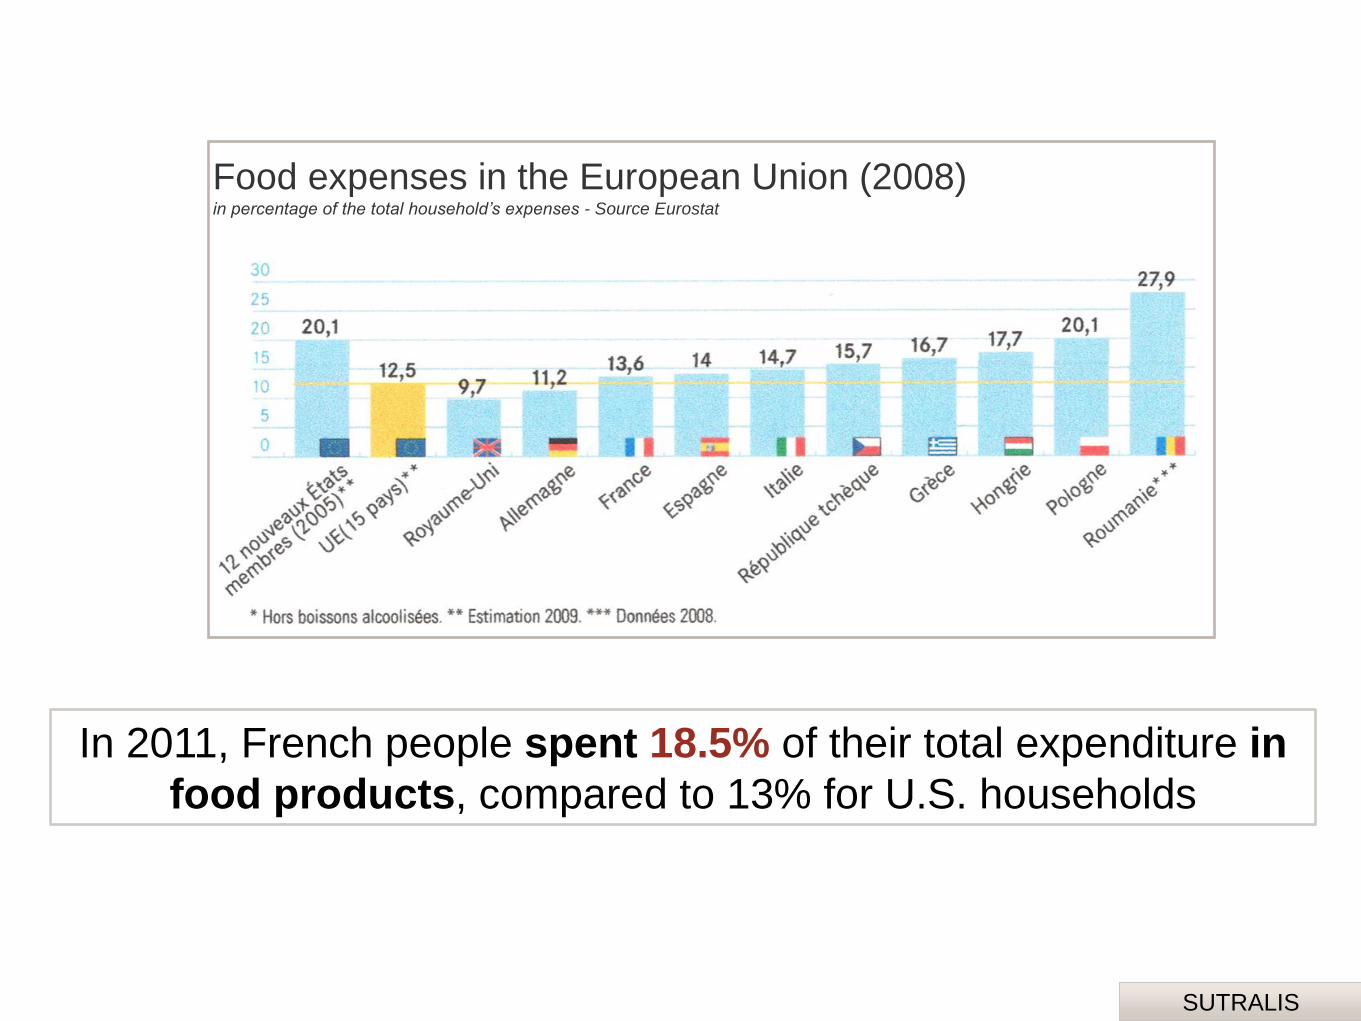
In 2011, French people spent 18.5% of their total expenditure in
food products, compared to 13% for U.S. households
Food expenses in the European Union (2008) in percentage of the total household’s expenses - Source Eurostat
SUTRALIS
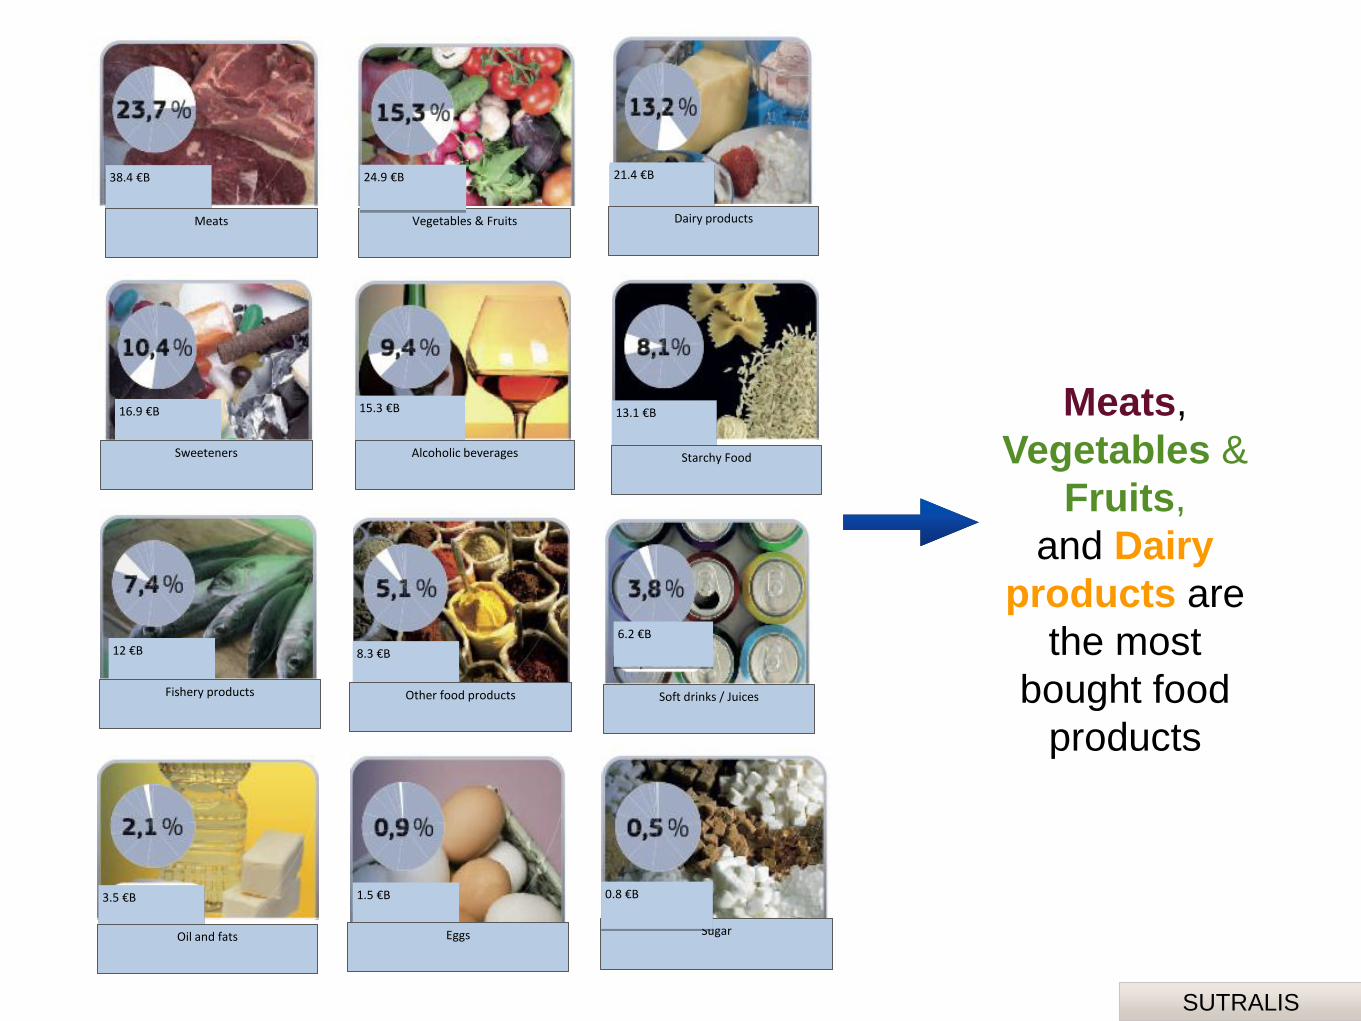
38.4 €B
Meats Vegetables & Fruits
24.9 €B 21.4 €B
Dairy products
16.9 €B
Sweeteners
15.3 €B
Alcoholic beverages
13.1 €B
Starchy Food
12 €B
Fishery products
8.3 €B
Other food products
6.2 €B
Soft drinks / Juices
3.5 €B
Oil and fats
1.5 €B
Eggs Sugar
0.8 €B
Meats,
Vegetables &
Fruits,
and Dairy
products are
the most
bought food
products
SUTRALIS
CONSUMPTION TRENDS
SUTRALIS
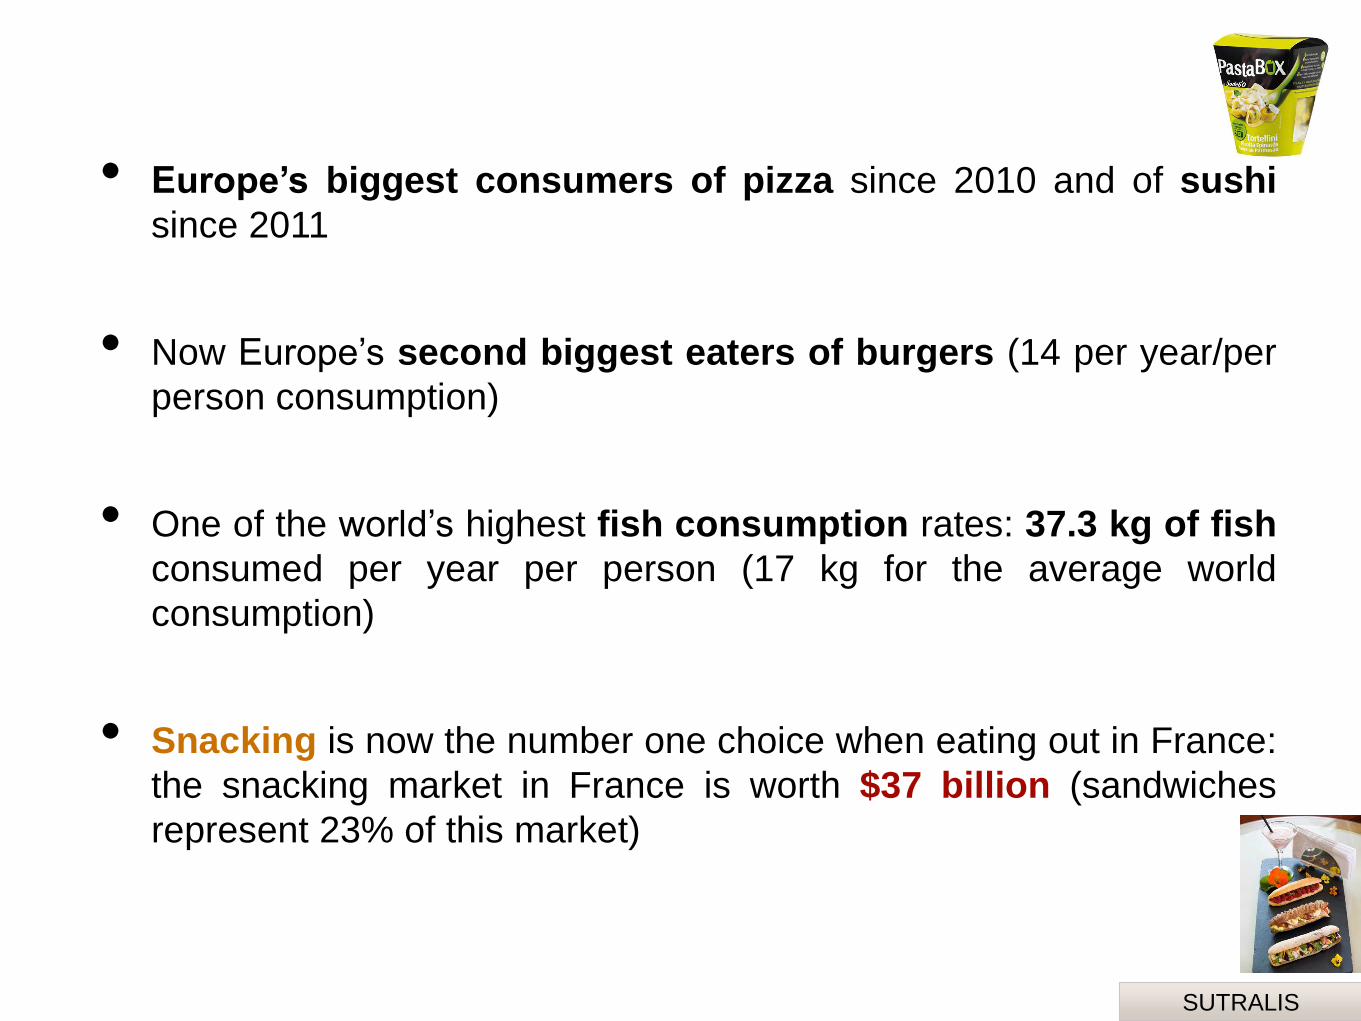
• Europe’s biggest consumers of pizza since 2010 and of sushi
since 2011
• Now Europe’s second biggest eaters of burgers (14 per year/per
person consumption)
• One of the world’s highest fish consumption rates: 37.3 kg of fish
consumed per year per person (17 kg for the average world
consumption)
• Snacking is now the number one choice when eating out in France:
the snacking market in France is worth $37 billion (sandwiches
represent 23% of this market)
SUTRALIS
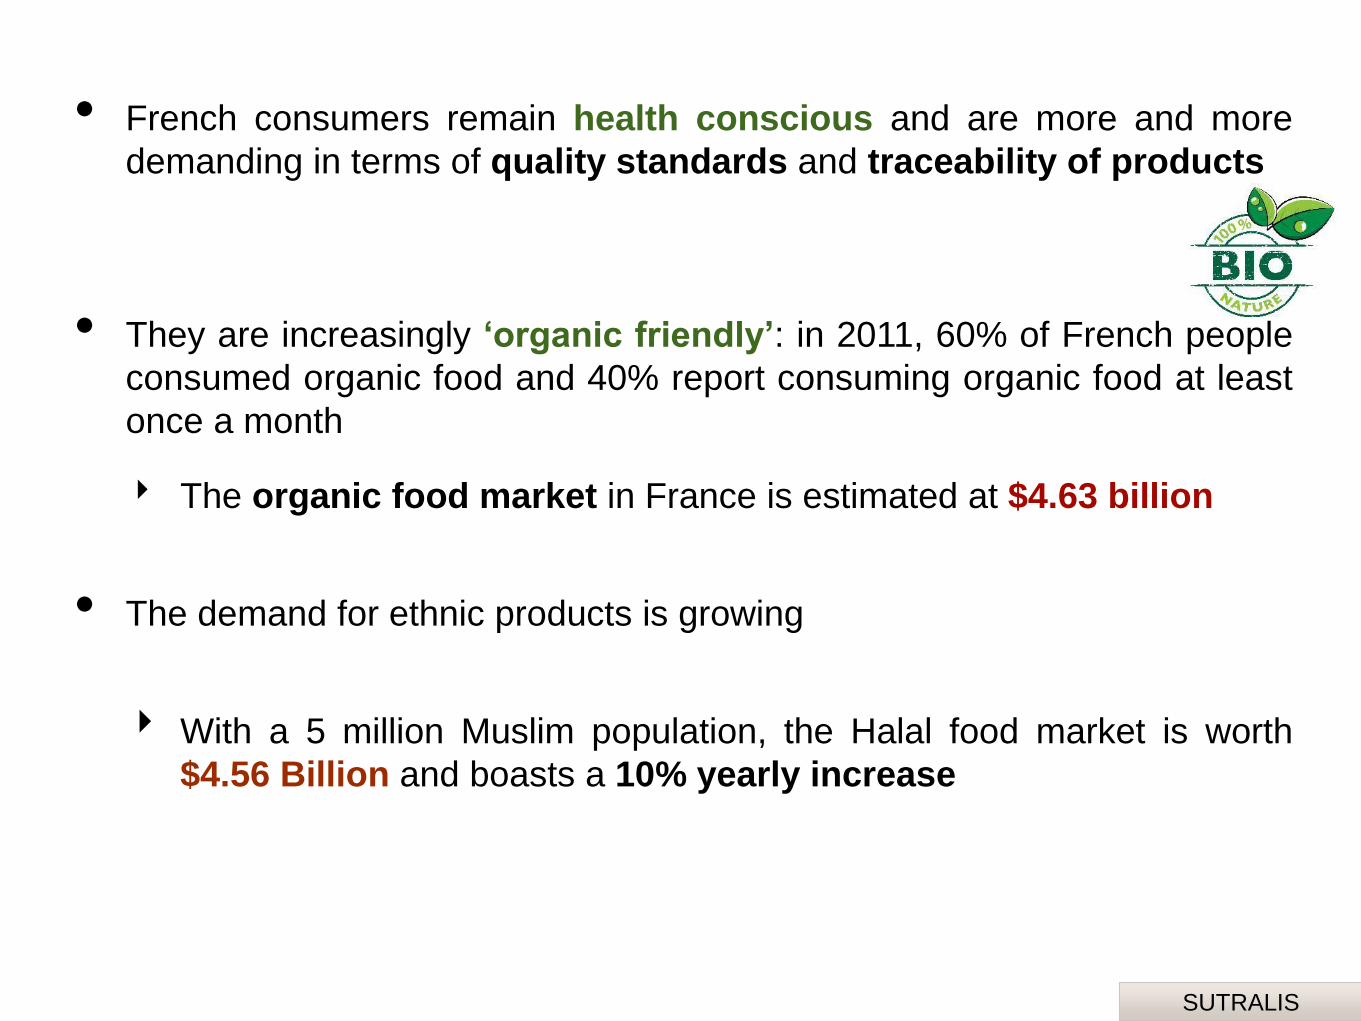
• French consumers remain health conscious and are more and more
demanding in terms of quality standards and traceability of products
• They are increasingly ‘organic friendly’: in 2011, 60% of French people
consumed organic food and 40% report consuming organic food at least
once a month
‣ The organic food market in France is estimated at $4.63 billion
• The demand for ethnic products is growing
‣ With a 5 million Muslim population, the Halal food market is worth
$4.56 Billion and boasts a 10% yearly increase
SUTRALIS
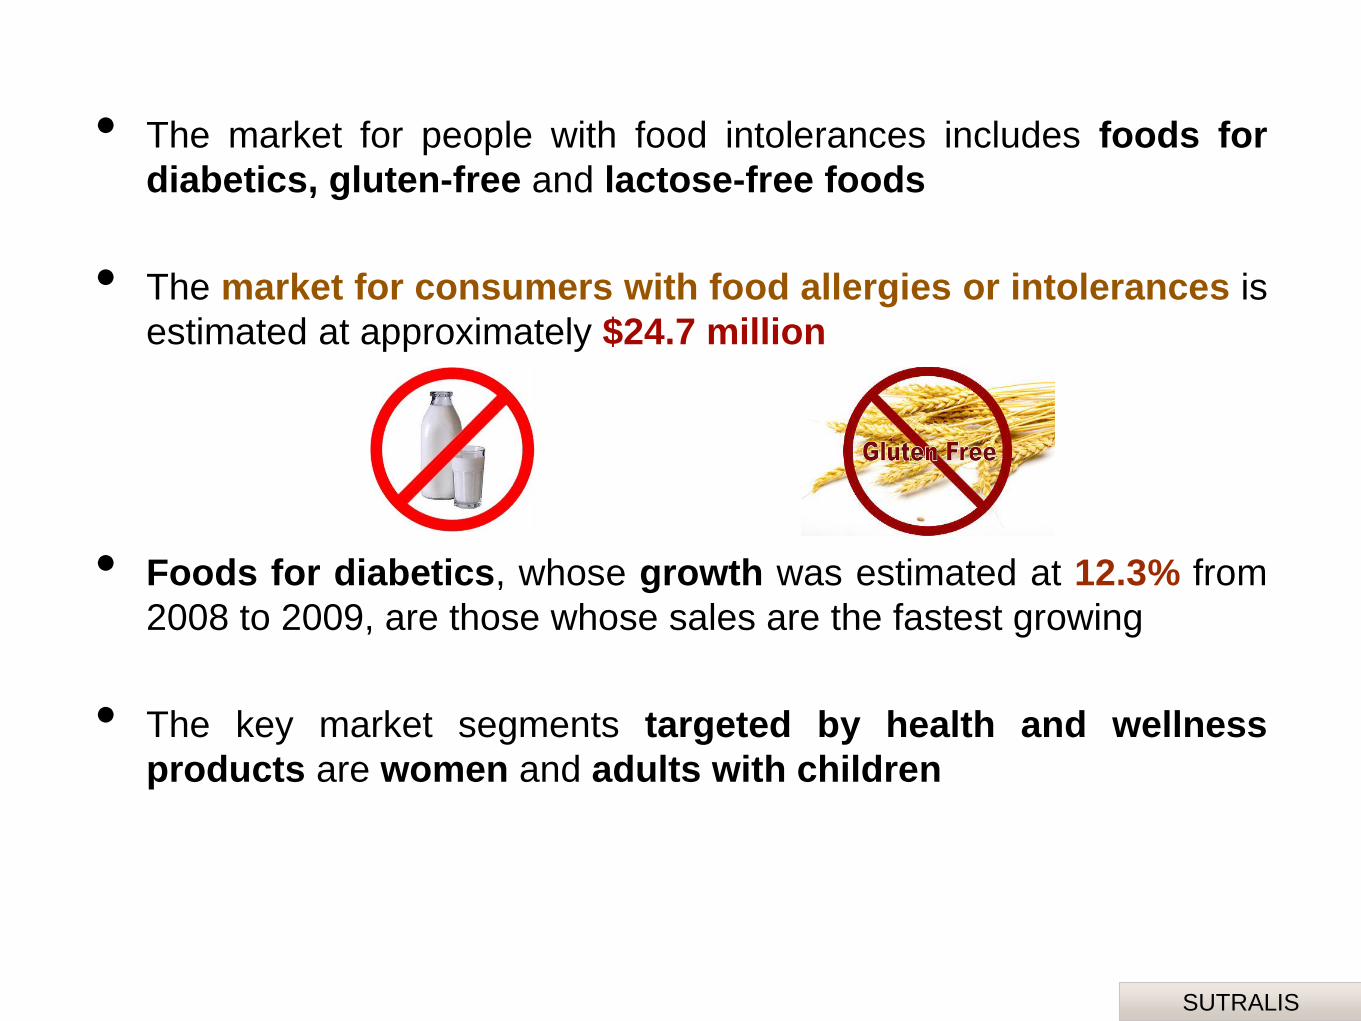
• The market for people with food intolerances includes foods for
diabetics, gluten-free and lactose-free foods
• The market for consumers with food allergies or intolerances is
estimated at approximately $24.7 million
• Foods for diabetics, whose growth was estimated at 12.3% from
2008 to 2009, are those whose sales are the fastest growing
• The key market segments targeted by health and wellness
products are women and adults with children
SUTRALIS
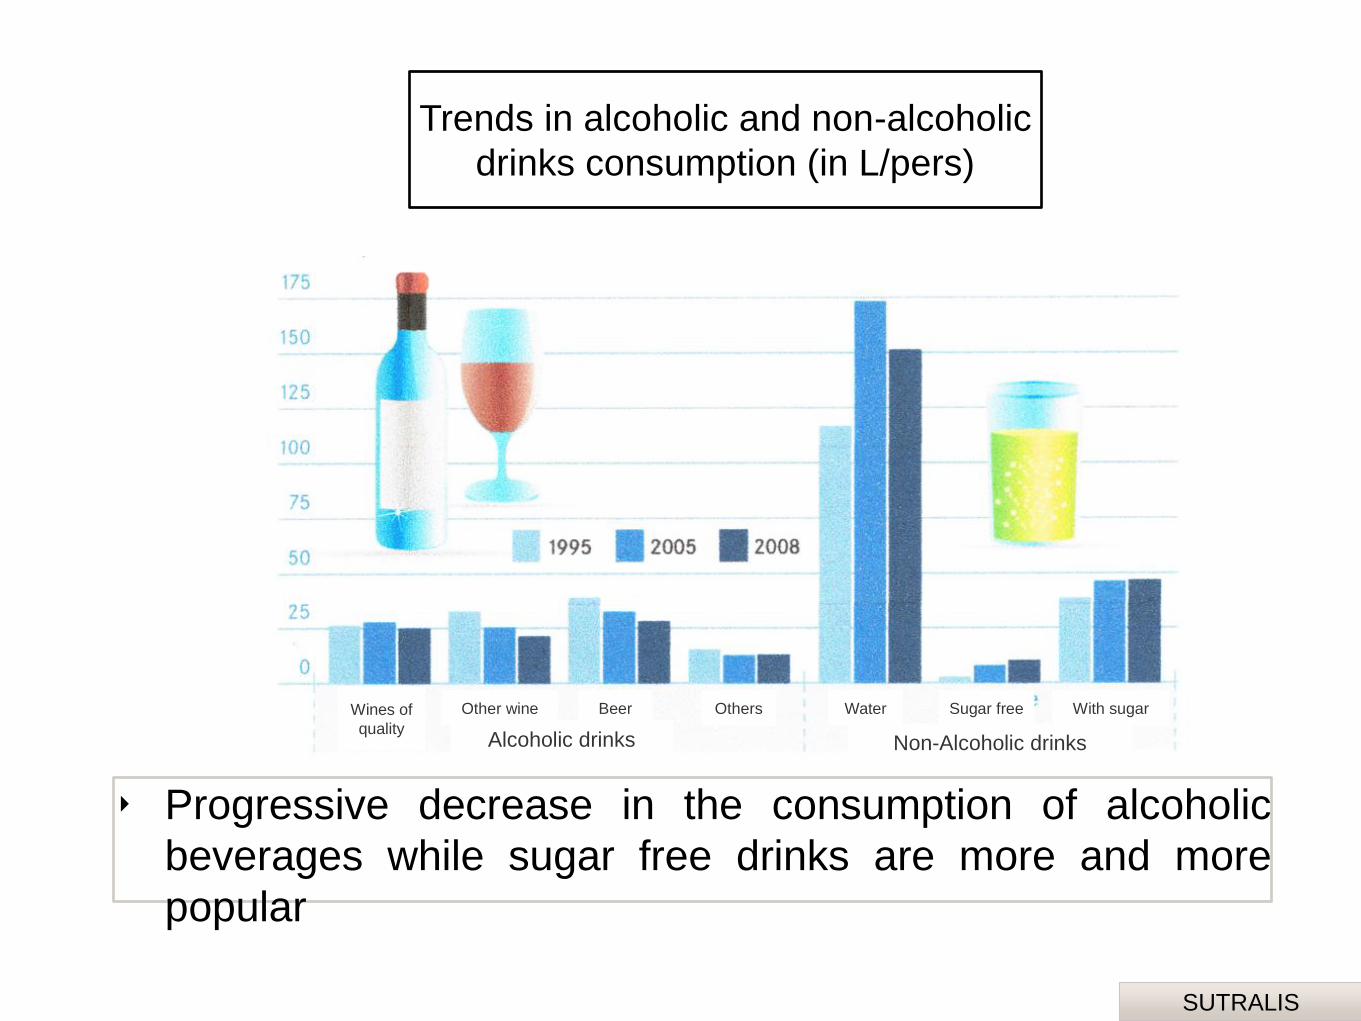
‣ Progressive decrease in the consumption of alcoholic
beverages while sugar free drinks are more and more
popular
Alcoholic drinks Non-Alcoholic drinks
Wines of
quality
Other wine Beer Others Water Sugar free With sugar
Trends in alcoholic and non-alcoholic
drinks consumption (in L/pers)
SUTRALIS
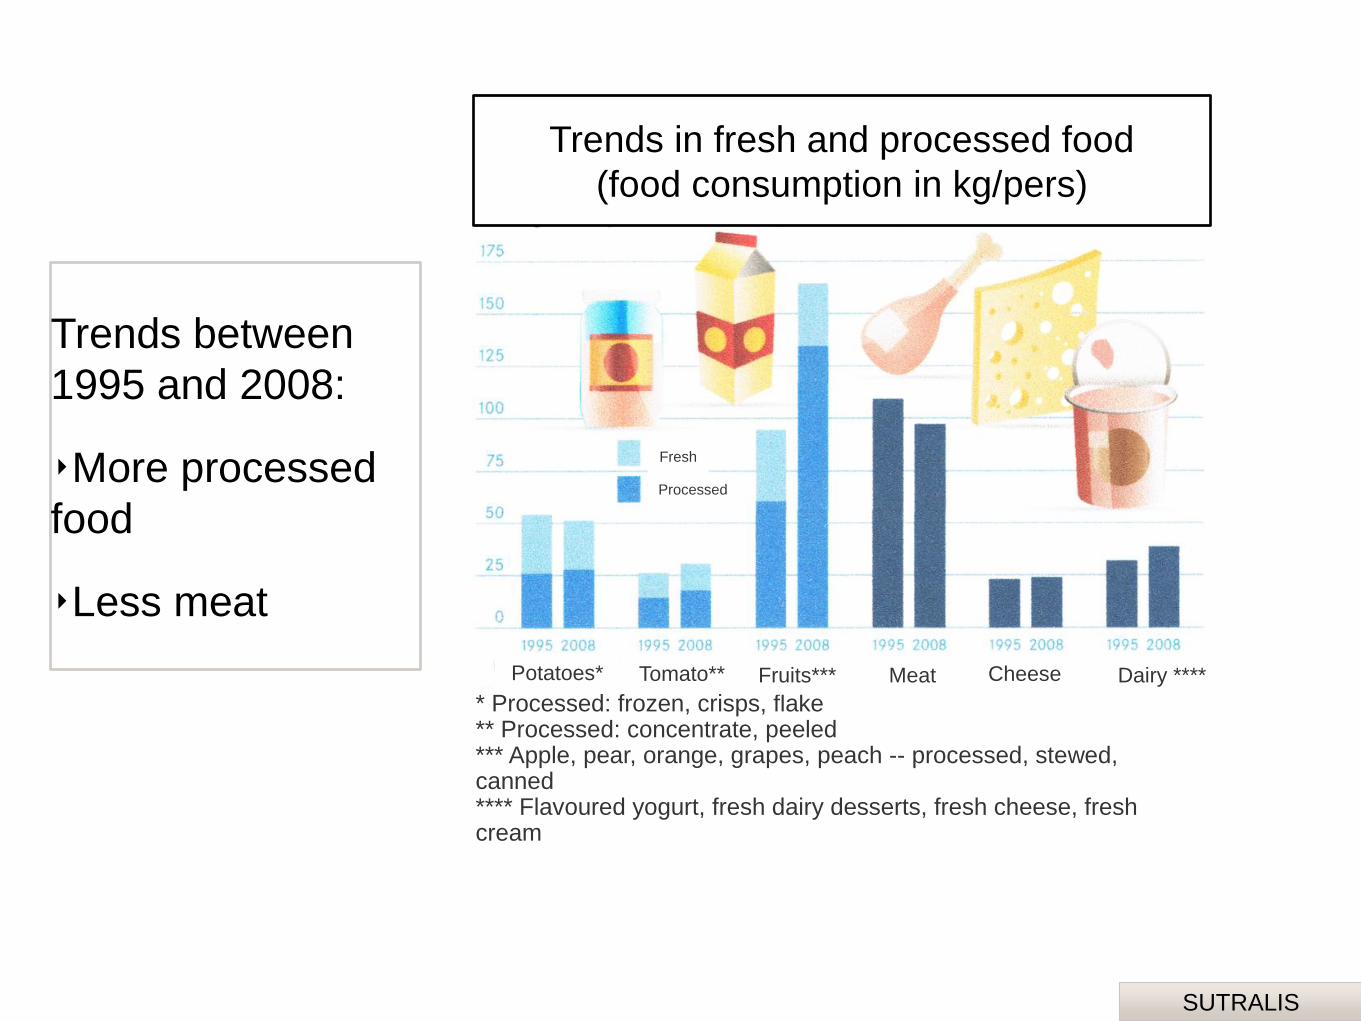
Trends between
1995 and 2008:
‣More processed
food
‣Less meat
Potatoes* * Processed: frozen, crisps, flake ** Processed: concentrate, peeled *** Apple, pear, orange, grapes, peach -- processed, stewed, canned **** Flavoured yogurt, fresh dairy desserts, fresh cheese, fresh cream
Tomato** Fruits*** Meat Cheese Dairy ****
Fresh
Processed
Trends in fresh and processed food
(food consumption in kg/pers)
SUTRALIS
DISTRIBUTION CHANNELS
SUTRALIS
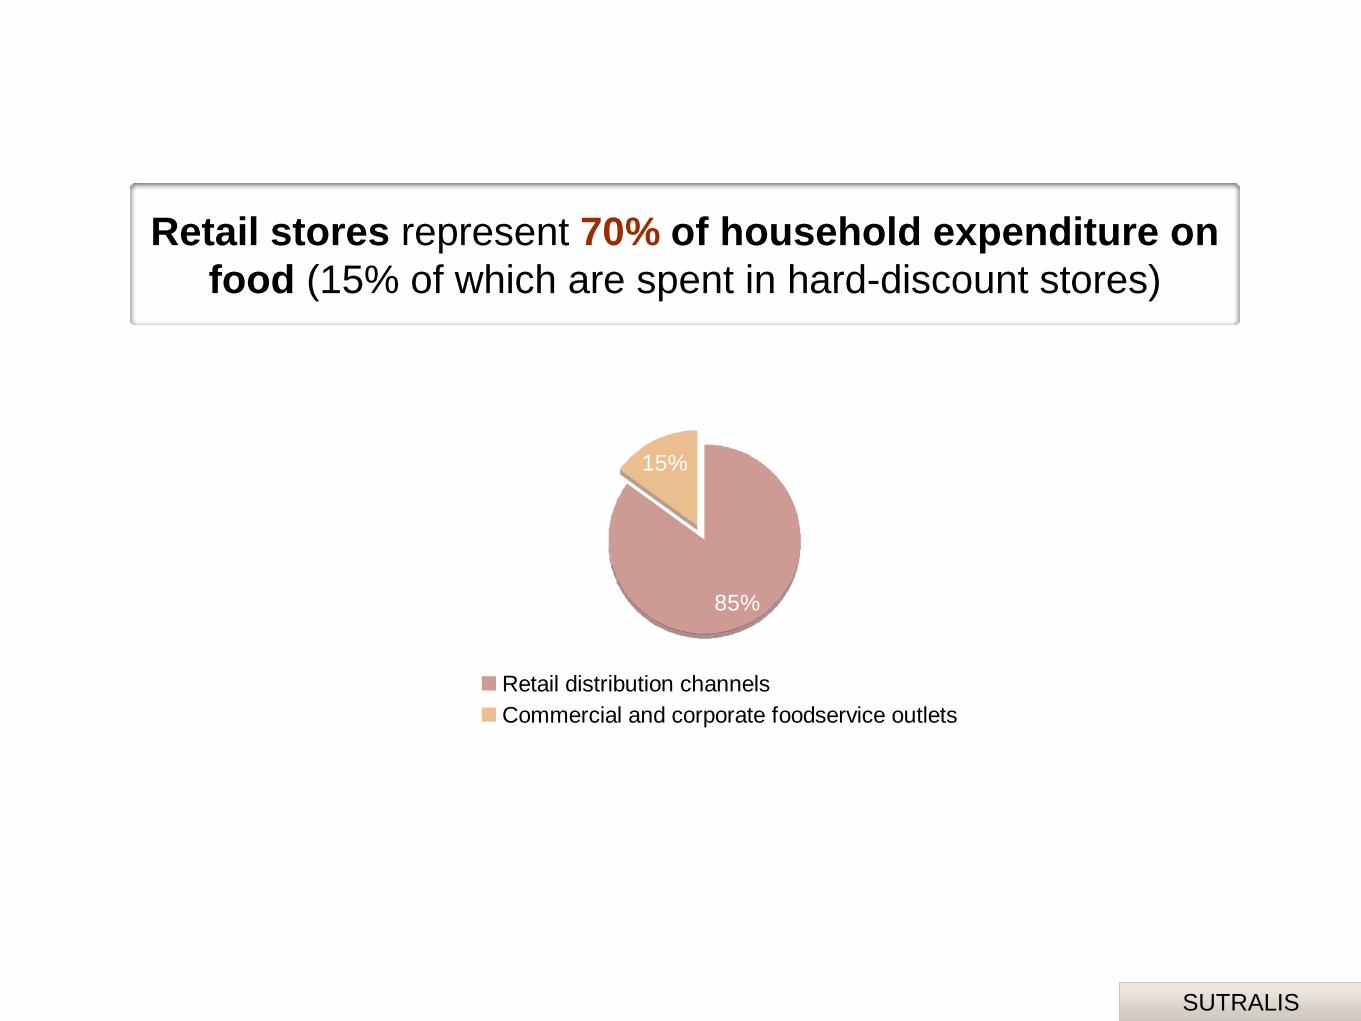
85%
15%
Retail distribution channels
Commercial and corporate foodservice outlets
Retail stores represent 70% of household expenditure on
food (15% of which are spent in hard-discount stores)
SUTRALIS
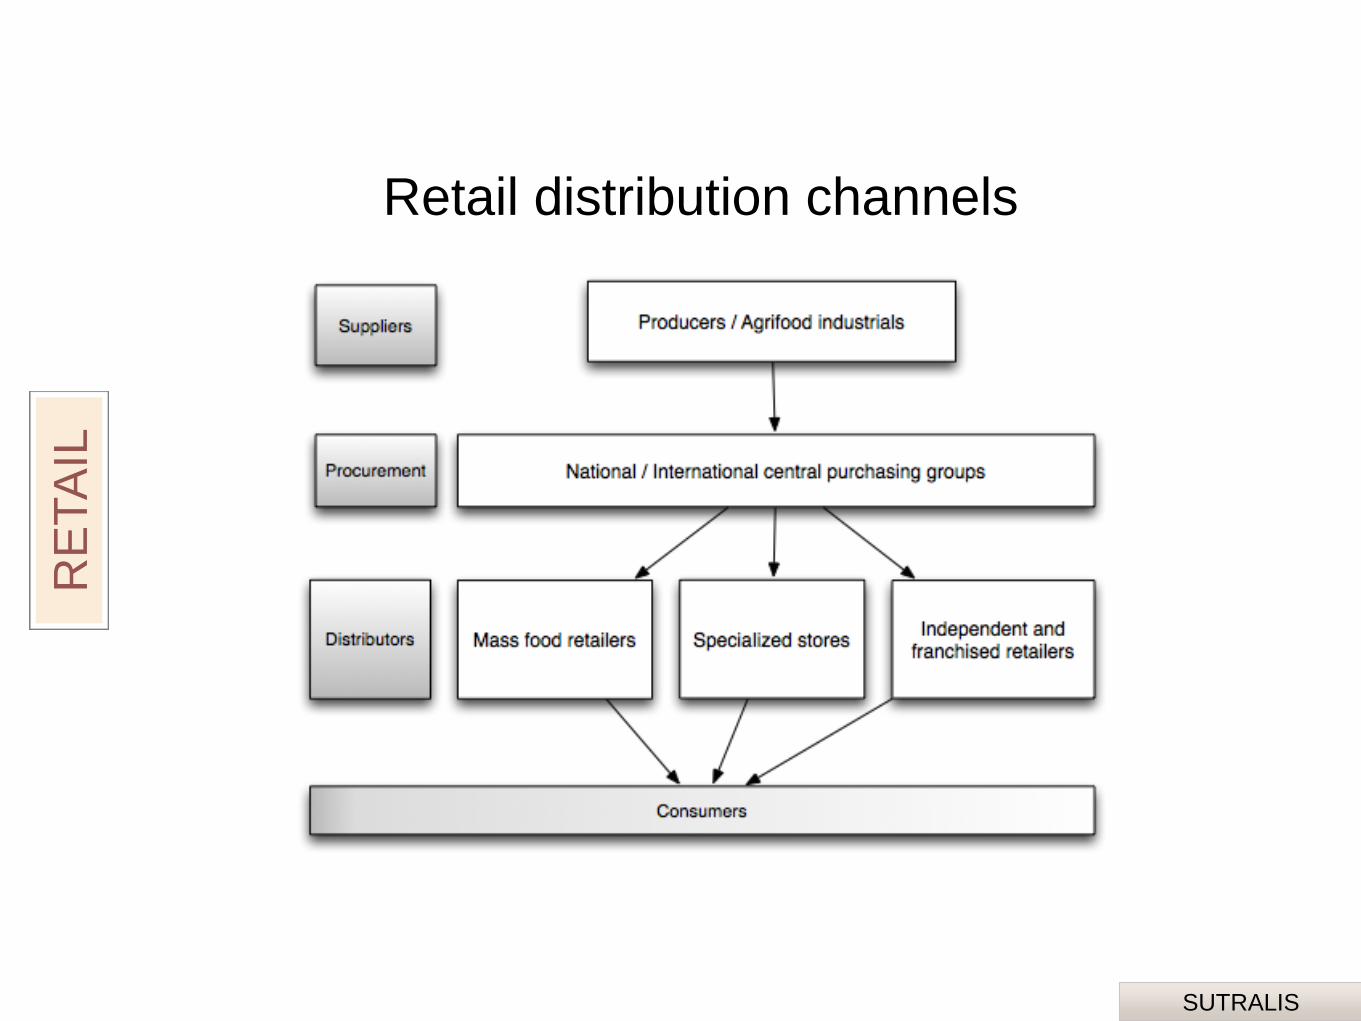
Retail distribution channels
RE
TA
IL
SUTRALIS
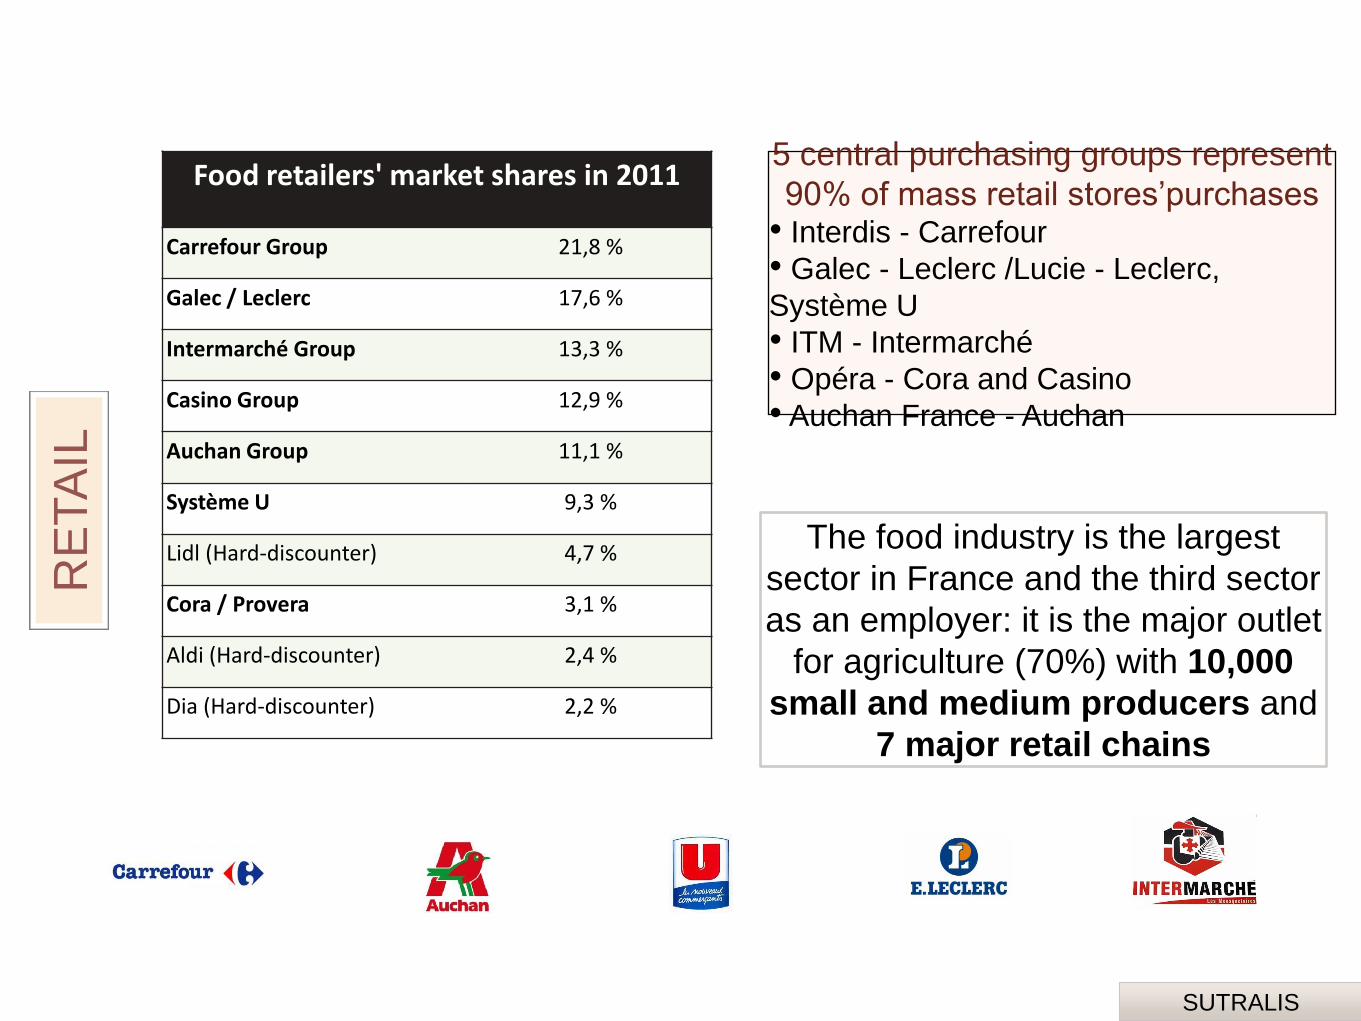
Food retailers' market shares in 2011
Carrefour Group 21,8 %
Galec / Leclerc 17,6 %
Intermarché Group 13,3 %
Casino Group 12,9 %
Auchan Group 11,1 %
Système U 9,3 %
Lidl (Hard-discounter) 4,7 %
Cora / Provera 3,1 %
Aldi (Hard-discounter) 2,4 %
Dia (Hard-discounter) 2,2 %
5 central purchasing groups represent
90% of mass retail stores’purchases • Interdis - Carrefour
• Galec - Leclerc /Lucie - Leclerc,
Système U
• ITM - Intermarché
• Opéra - Cora and Casino
• Auchan France - Auchan
The food industry is the largest
sector in France and the third sector
as an employer: it is the major outlet
for agriculture (70%) with 10,000
small and medium producers and
7 major retail chains
RE
TA
IL
SUTRALIS
• The weight of private labels - 34% - is within the European
average (30%)
• Hard discounters are gaining sales
• Traditionnal supermarkets continue to dominate the mass
grocery retail sector
• Local supermarkets still buy directly a large percentage of
their products
RE
TA
IL

SUTRALIS
Fine Food outlets:
Major Fine Food
outlets Sales $ (million)
Number of shops
(France)
Lafayette Gourmet 182,5 14
LeNôtre 130,5 50
Fauchon 91,4 1
La Grande Epicerie 83 1
Hediard 52,2 20
The Fine Food retail market in 2011 = $6,7
Billion
RE
TA
IL
SUTRALIS
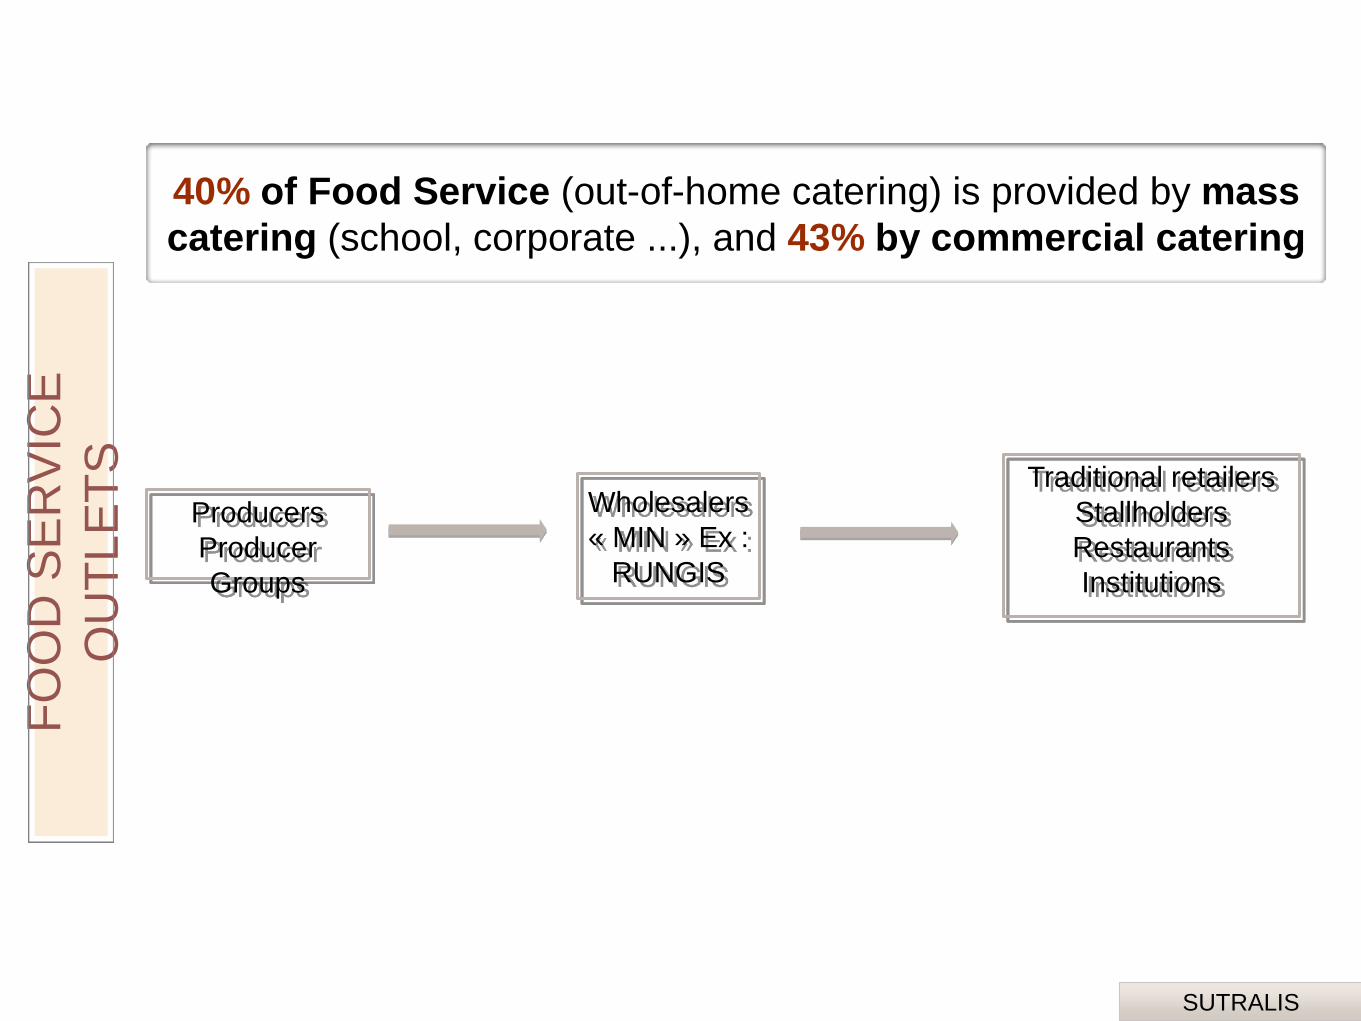
Producers
Producer
Groups
Wholesalers
« MIN » Ex :
RUNGIS
Traditional retailers
Stallholders
Restaurants
Institutions
40% of Food Service (out-of-home catering) is provided by mass
catering (school, corporate ...), and 43% by commercial catering
FO
OD
SE
RV
ICE
OU
TL
ET
S
SUTRALIS
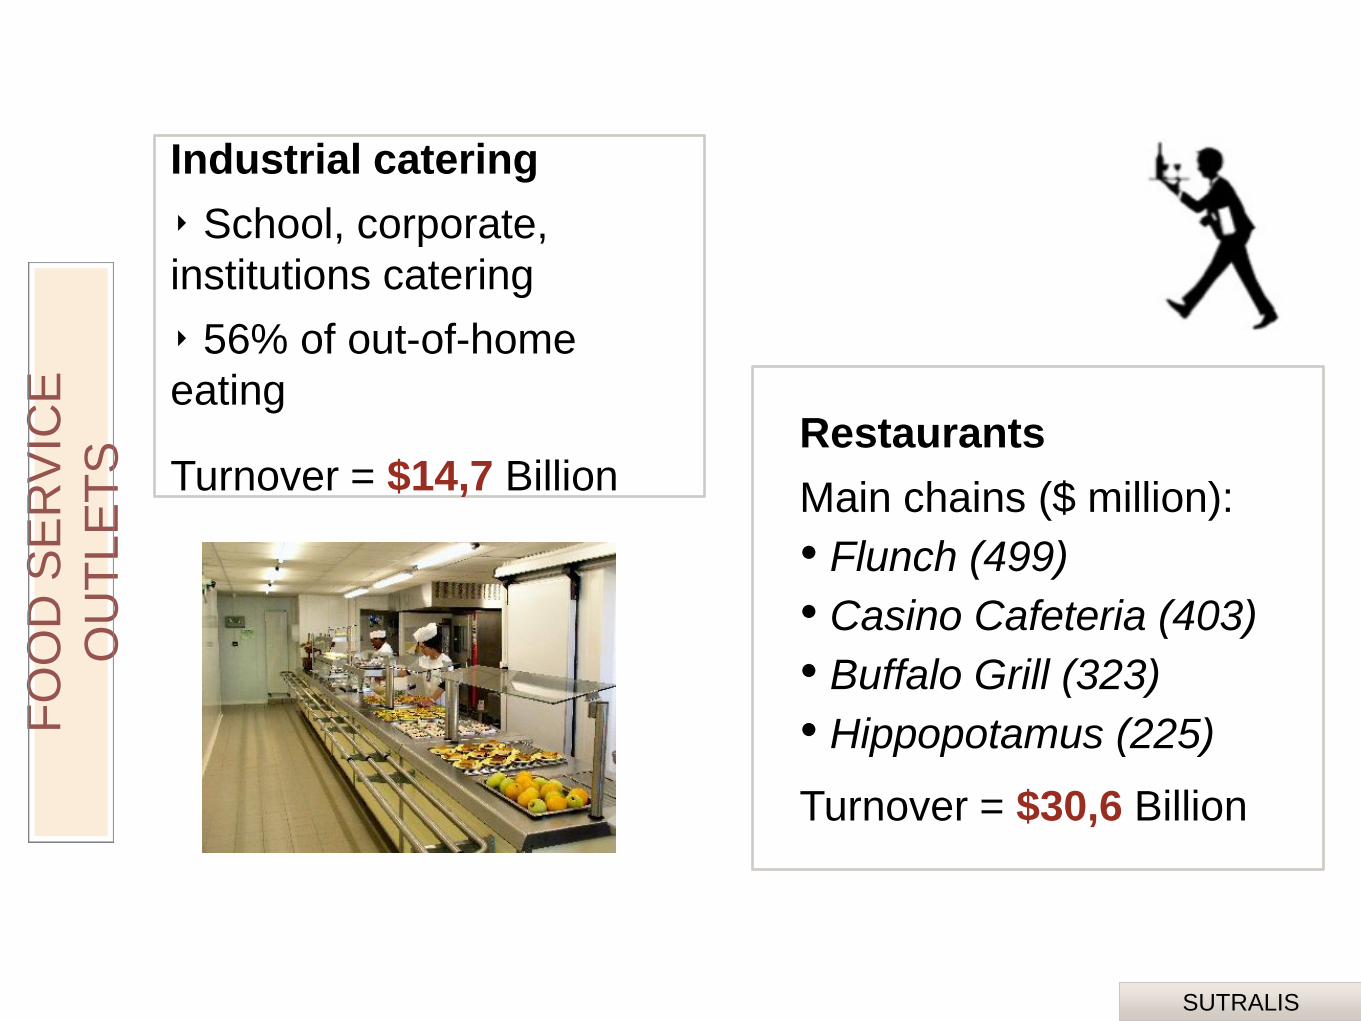
Restaurants
Main chains ($ million):
• Flunch (499)
• Casino Cafeteria (403)
• Buffalo Grill (323)
• Hippopotamus (225)
Turnover = $30,6 Billion
Industrial catering
‣ School, corporate,
institutions catering
‣ 56% of out-of-home
eating
Turnover = $14,7 Billion
FO
OD
SE
RV
ICE
OU
TL
ET
S
SUTRALIS
52-54 Rue de Roubaix
59200 Tourcoing - France
Tel: +33 (0) 3 20 27 26 99
www.sutralis.com
Follow us on twitter @Sutralis
Contact SUTRALIS for more information on the
Food and Beverage market in France
North America office
128 Grant Ave, Suite 108
Santa Fe, 87501
Office: +1(505) 989- 8500
Mob: +1(505) 695-8932
Skype ID: marie.tumoine.1