Embed Size (px)
Citation preview
Prefatory Note
The attached document represents the most complete and accurate version available based on original copies culled from the files of the FOMC Secretariat at the Board of Governors of the Federal Reserve System. This electronic document was created through a comprehensive digitization process which included identifying the best-preserved paper copies, scanning those copies,1 and then making the scanned versions text-searchable.2 Though a stringent quality assurance process was employed, some imperfections may remain.
Please note that this document may contain occasional gaps in the text. These gaps are the result of a redaction process that removed information obtained on a confidential basis. All redacted passages are exempt from disclosure under applicable provisions of the Freedom of Information Act.
1 In some cases, original copies needed to be photocopied before being scanned into electronic format. All scanned images were deskewed (to remove the effects of printer- and scanner-introduced tilting) and lightly cleaned (to remove dark spots caused by staple holes, hole punches, and other blemishes caused after initial printing). 2 A two-step process was used. An advanced optimal character recognition computer program (OCR) first created electronic text from the document image. Where the OCR results were inconclusive, staff checked and corrected the text as necessary. Please note that the numbers and text in charts and tables were not reliably recognized by the OCR process and were not checked or corrected by staff.
Confidential (FR) Class III FOMC
Part 2 January 25, 2001
CURRENT ECONOMICAND FINANCIAL CONDITIONS
Recent Developments
Prepared for the Federal Open Market Committeeby the staff of the Board of Governors of the Federal Reserve System
Confidential (FR) Class III FOMC
January 25, 2001
Recent Developments
Prepared for the Federal Open Market Committeeby the staff of the Board of Governors of the Federal Reserve System

Domestic NonfinancialDevelopments
Domestic Nonfinancial Developments
OverviewEconomic activity looks to have risen slowly again in the fourth quarter.Consumer and business spending decelerated further, with outlays for motorvehicles and other household goods particularly weak. As a result of theslowing in final sales, inventory overhangs appear to have surfaced in a numberof industries and have set in play sizable production adjustments inmanufacturing that appear to have intensified at the turn of the year. Althoughthe pace of hiring slackened at the end of 2000, labor markets remained quitetight, and labor costs were running above the pace of a year ago. At the sametime, price inflation remained quiescent.
Production and Inventories
Industrial production. The contraction in the manufacturing sector, which firstemerged in October, deepened and broadened during November and December.The December decline was nearly twice that in November, with factoryproduction falling 1.1 percent last month. As the quarter began, the weakness inproduction was largely the result of cutbacks in the motor vehicle industry.However, in December, the diffusion index of three-month changes in industrialproduction fell to its lowest level since 1991, a decline indicating that weaknessextended well beyond the effects of lower motor vehicle assemblies. TheNovember and December declines in total IP were less steep than inmanufacturing, as the unseasonably cold weather contributed to large gains inthe output of utilities. The plunge in factory production during December doesnot appear to have been weather related: The anecdotal information that wehave accumulated suggests that the stormy weather at mid-month had only asmall effect on production, and given the overall weakening in the sector, weestimate that the weather-related losses that did occur were not made up later inthe month. With cutbacks having occurred in many industries, the factoryoperating rate sank to just over 79 percent last month-the lowest level since thespring of 1992.1
Manufacturing production declined 1.9 percent (not an annual rate) betweenSeptember and December. More than two-thirds of that contraction was directlyor indirectly related to the slowing in the motor vehicles sector: The decline in
1. A preliminary estimate of capacity growth in 2001 will be issued with the release of thereport on January industrial activity on February 16. Data from the NAPM Semiannual Surveyof Capacity and other currently available indicators suggest that manufacturing capacity willincrease 3-1/2 percent this year-about 1-1/2 percentage points less than in 2000. This would bethe slowest rate of capacity expansion since 1993.

II-2
SELECTED COMPONENTS OF INDUSTRIAL PRODUCTION(Percent change from preceding comparable period)
2000 2000Proportion
2000 HI1 Q3 Q4 Oct. Nov. Dec.
---- Annual rate----- --Monthly rate---
Total 100.0 7.3 3.5 -1.1 -.3 -.3 -.6Previous 7.3 1.6 .0 -.2
Manufacturing 87.8 7.6 3.7 -2.1 -.2 -.6 -1.1Excluding:High technology industries 78.4 1.9 -1.4 -5.2 -.4 -.9 -1.4Motor vehicles and parts 82.1 7.6 4.9 .1 .2 -.1 -.9
Mining 6.4 2.1 2.8 -.9 .0 -.1 .3Utilities 5.9 8.1 1.0 14.3 -1.9 3.8 6.5
Selected industries:
High technology 9.4 72.0 56.9 26.4 1.6 2.2 1.3Computers 2.7 46.5 51.9 30.4 2.4 1.5 .4Communication equipment 2.0 35.3 41.6 32.3 3.0 3.0 .2Semiconductors2 4.7 109.8 66.4 21.7 .6 2.3 2.3
Motor vehicles and parts 5.7 6.4 -11.2 -30.2 -5.6 -6.7 -4.1
Aircraft and parts 2.2 -7.7 11.6 4.2 .4 1.6 -.5
Market groups, excluding energyand selected industries:
Consumer goods 22.5 1.7 -.3 -1.9 -.1 -.2 -.1Durables 3.5 -.7 -9.5 -6.0 -1.5 -.7 -.1Nondurables 19.0 2.2 1.6 -1.1 .2 -.2 -.1
Business equipment 8.4 7.9 4.6 3.4 .7 -.5 -.5
Construction supplies 6.1 3.6 -1.1 -8.2 -.7 -1.1 -2.1
Materials 24.2 .8 -3.1 -7.0 -.3 -1.2 -2.2Durables 15.9 2.6 -.6 -8.1 -.9 -.8 -2.5Nondurables 8.3 -2.6 -7.6 -5.0 .8 -1.9 -1.6
1. From the final quarter of the previous period to the final quarter of theperiod indicated.
2. Includes related electronic components.
CAPACITY UTILIZATION(Percent of capacity)
1988-89 1959-2000 2000 2000
High Avg. Q2 Q3 Q4 Oct. Nov. Dec.
Manufacturing 85.7 81.6 81.9 81.7 80.2 81.2 80.4 79.1Primary processing 88.3 82.6 86.4 85.4 82.3 84.3 82.5 80.1Advanced processing 84.2 81.1 79.8 80.1 79.7 80.0 79.8 79.2
II-3
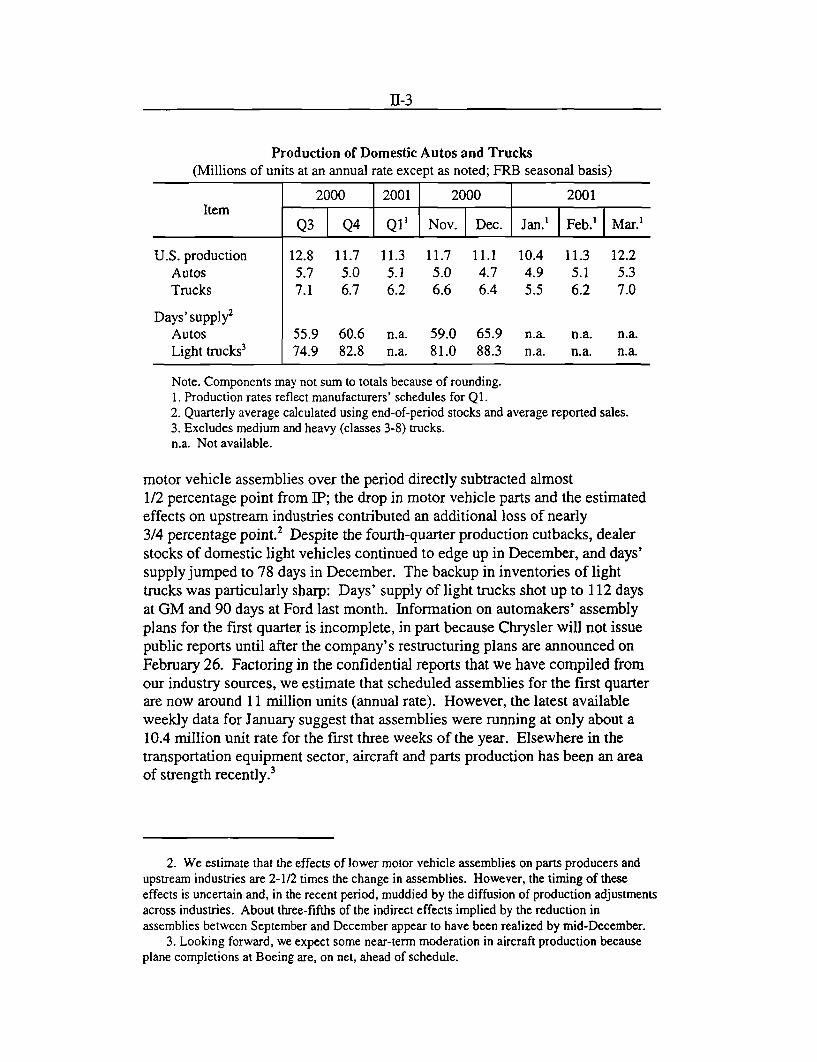
Production of Domestic Autos and Trucks(Millions of units at an annual rate except as noted; FRB seasonal basis)
2000 2001 2000 2001Item
Q3 Q4 Q1 1 Nov. Dec. Jan.' Feb.' Mar.'
U.S. production 12.8 11.7 11.3 11.7 11.1 10.4 11.3 12.2Autos 5.7 5.0 5.1 5.0 4.7 4.9 5.1 5.3Trucks 7.1 6.7 6.2 6.6 6.4 5.5 6.2 7.0
Days' supply2
Autos 55.9 60.6 n.a. 59.0 65.9 n.a. n.a. n.a.Light trucks3 74.9 82.8 n.a. 81.0 88.3 n.a. n.a. n.a.
Note. Components may not sum to totals because of rounding.1. Production rates reflect manufacturers' schedules for Q1.2. Quarterly average calculated using end-of-period stocks and average reported sales.3. Excludes medium and heavy (classes 3-8) trucks.n.a. Not available.
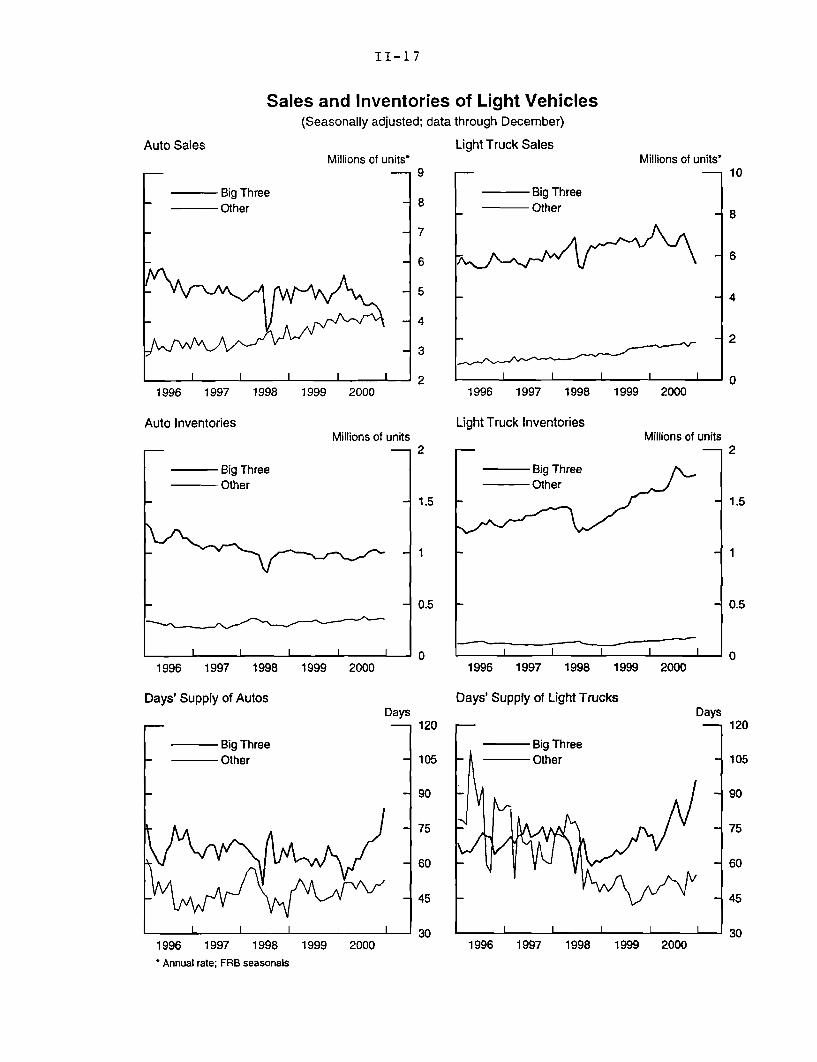
motor vehicle assemblies over the period directly subtracted almost1/2 percentage point from IP; the drop in motor vehicle parts and the estimatedeffects on upstream industries contributed an additional loss of nearly3/4 percentage point. 2 Despite the fourth-quarter production cutbacks, dealerstocks of domestic light vehicles continued to edge up in December, and days'supply jumped to 78 days in December. The backup in inventories of lighttrucks was particularly sharp: Days' supply of light trucks shot up to 112 daysat GM and 90 days at Ford last month. Information on automakers' assemblyplans for the first quarter is incomplete, in part because Chrysler will not issuepublic reports until after the company's restructuring plans are announced onFebruary 26. Factoring in the confidential reports that we have compiled fromour industry sources, we estimate that scheduled assemblies for the first quarterare now around 11 million units (annual rate). However, the latest availableweekly data for January suggest that assemblies were running at only about a10.4 million unit rate for the first three weeks of the year. Elsewhere in thetransportation equipment sector, aircraft and parts production has been an areaof strength recently.3
2. We estimate that the effects of lower motor vehicle assemblies on parts producers andupstream industries are 2-1/2 times the change in assemblies. However, the timing of theseeffects is uncertain and, in the recent period, muddied by the diffusion of production adjustmentsacross industries. About three-fifths of the indirect effects implied by the reduction inassemblies between September and December appear to have been realized by mid-December.
3. Looking forward, we expect some near-term moderation in aircraft production becauseplane completions at Boeing are, on net, ahead of schedule.

II-4
Contributions to Industrial Production(Change from three months earlier)
High-Tech IndustriesPercentage points
-__ I n r _ _
EnergyPercentage points
Dec.
^A^v VI
, , , I I I I
1999 2000
Motor Vehicles and PartsPercentage points
1999 2000
Note. Computers, semiconductors, and communicationsequipment.
Industrial Materials and Business Equipment *Percentage points
1999 2000 1999 2000
Construction Supplies
KPercentage points
SDec.
SDec., . . I i p p I
1999 2000
Consumer Durables*
0.09
0.06
0.03
0
0.03
0.06
0.09
Percentage points
1999 2000
* FYr'lhrtinn onarn hinh-torh inrlctrie mrtnr v nhirloc anrd nrt annr aircraft anr nnrtc
0.09
0.06
0.03
+0
0.03
0.06
0.09
-/\", 1,
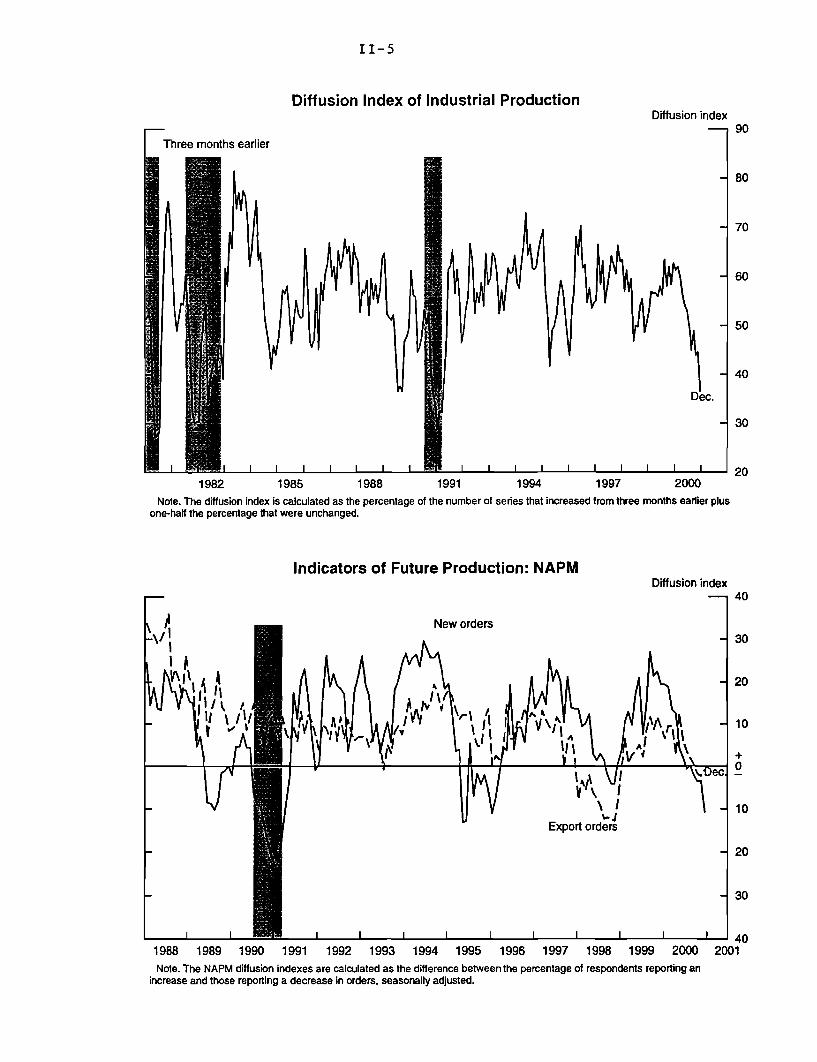
Diffusion Index of Industrial ProductionDiffusion index
1982 1985 1988 1991 1994 1997 2000
Note. The diffusion index is calculated as the percentage of the number of series that increased from three months earlier plusone-half the percentage that were unchanged.
Indicators of Future Production: NAPMDiffusion index
I I = 21 , II I I I I I I I I 401988 1989 1990 1991 1992 1993 1994 1995 1996 1997 1998 1999 2000 2001Note. The NAPM diffusion indexes are calculated as the difference between the percentage of respondents reporting an
increase and those reporting a decrease in orders, seasonally adjusted.
11-5
Production gains in the high-tech sector slowed at the end of last year, andcurrent indicators suggest near-term weakness. Although gains insemiconductor production remained fairly steady through December, the pacewas more moderate than earlier in the year. Similarly, this week's Dataquestsurvey of semiconductor purchasers suggested that activity levels were littlechanged between November and December.4 However, both Dataquest and theSemiconductor Industry Association project that the rise in chip-industry outputwill be restrained in the first half of this year as downstream producers ofcomputers and communications equipment work off inventories of parts thathave accumulated in the wake of slower demand for their products. Indeed, thethree-month moving average of orders for these goods moved down inNovember.
Elsewhere in manufacturing, weakness was widespread at year-end. Excludingmotor vehicles and parts, aircraft and parts, and high-tech goods, production felloff sharply in each of the major market groups, with particularly steep plungesin the production of construction supplies and industrial materials. Moreover,indicators that we have found to be useful predictors of near-term manufacturingactivity outside of motor vehicles and parts production point to further declinesin coming months. Adjusted orders for durable goods, which are only availablethrough November, were down on a three-month moving-average basis. Boththe NAPM new orders and export orders indexes fell during the fourth quarter,with the December index for new orders, based on data collected in the middleof the month, dropping relatively steeply to its lowest level in five years. And,as previously mentioned, the IP diffusion index, which has predictive value forthe one-month-ahead forecast, fell to its lowest level in 10 years. Finally, basedon reports running through the first week of January, the diffusion index for neworders in the Philadelphia FRB's Survey of Business plunged; this series, whichwas first collected in 1989, is also a statistically significant indicator ofmanufacturing activity.
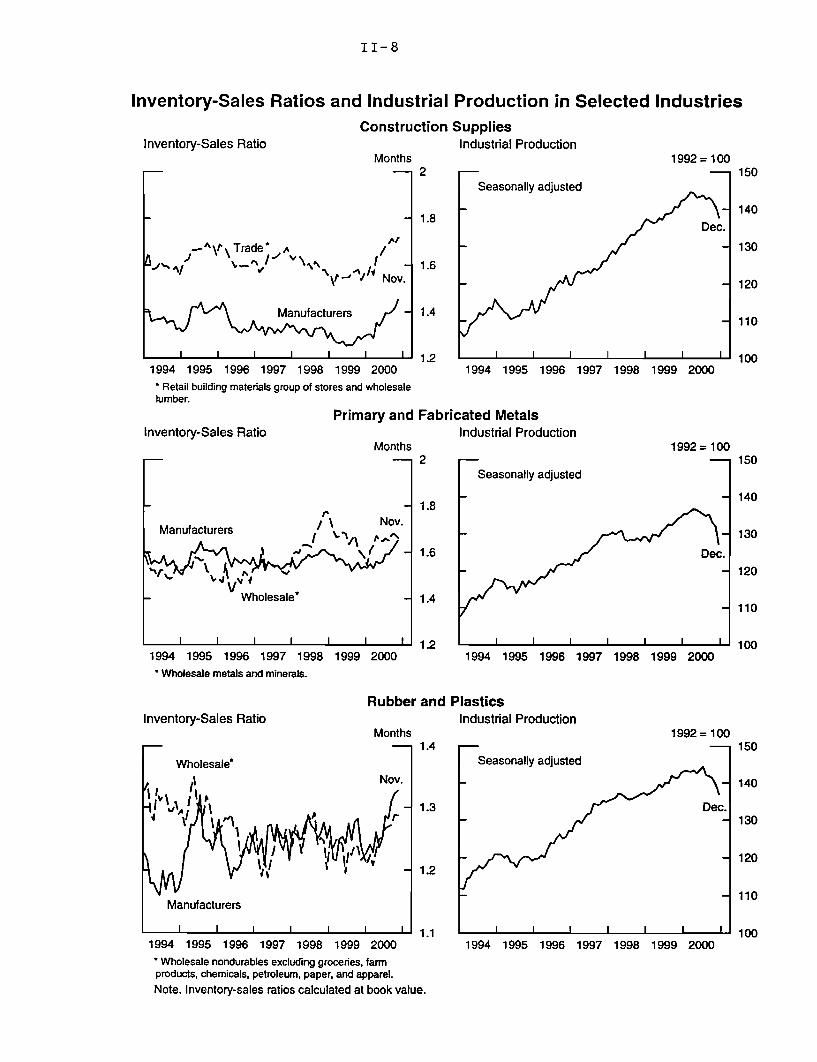
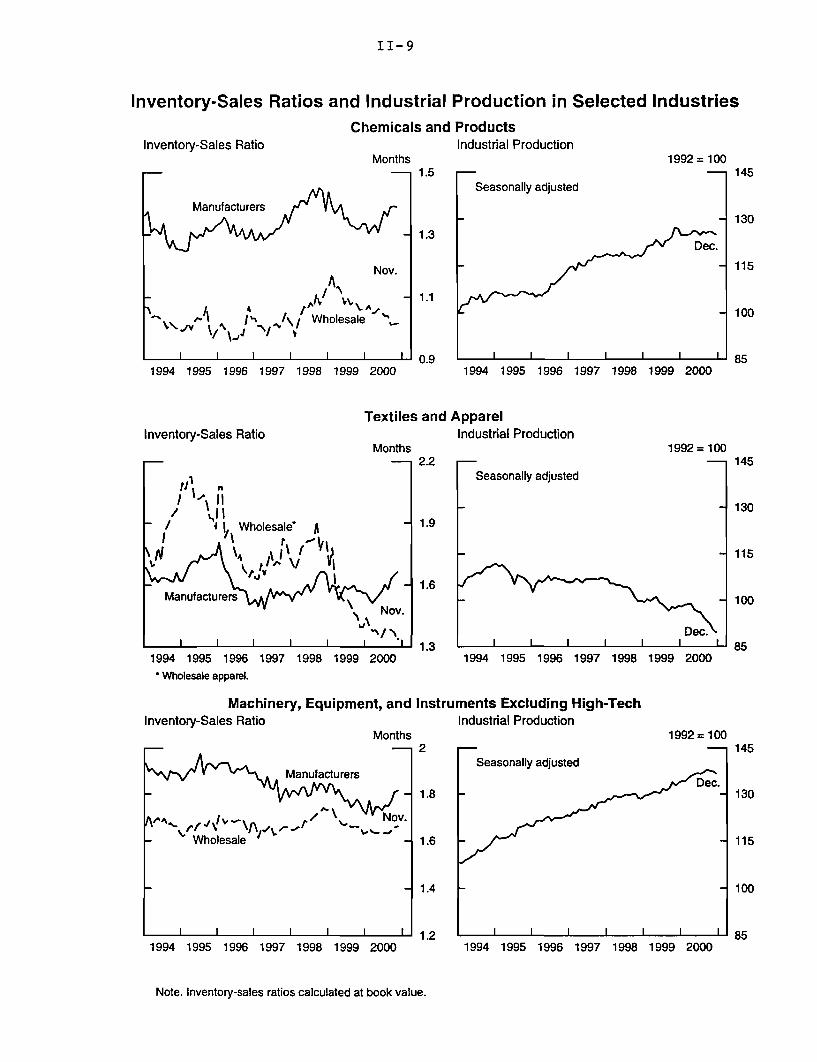
Inventory adjustments. Manufacturers that accumulated outsized inventoriesin recent months also slashed production in December and, to a lesser extent,November. The rapid rise in inventories at producers of construction supplies ismirrored by the fall-off in production; industry contacts attributed the weaknessto the large inventory overhang. The drop in the output of industrial materialslast quarter was also likely a response to soaring inventory-shipments ratios inthe primary and fabricated metals, rubber and plastics, chemicals, and textilesand apparel industries; many of these products are inputs to the auto industry.Inventory accumulation for producers of business equipment other than
4. Target inventories, after some swings in recent months, are now at August levels; neworders, after rising steeply earlier last year, were flat in November and December, and lead timescontinued to fall.

computers has also picked up over the past few quarters, and production hasdipped recently in that sector as well.
In some sectors, such as textiles, chemicals, and industrial machinery, inventoryimbalances as of November were apparent only in manufacturing. However, inother sectors, the production adjustments under way in manufacturing alsolikely represent a response to a bloating of stocks at other distributors. Notably,inventory-sales ratios at wholesalers of lumber and at retail building materialand hardware supply stores had been trending up sharply since early last year.And, overhangs were becoming increasingly apparent at wholesale distributorsof electrical machinery, primary and fabricated metals, and paper products.Stock-sales ratios for wholesalers of professional equipment (which includescomputers) and at manufacturers of computing equipment (which tend to havejust-in-time inventory adjustments) also had edged up as of November, althoughthey were still low by historical standards.
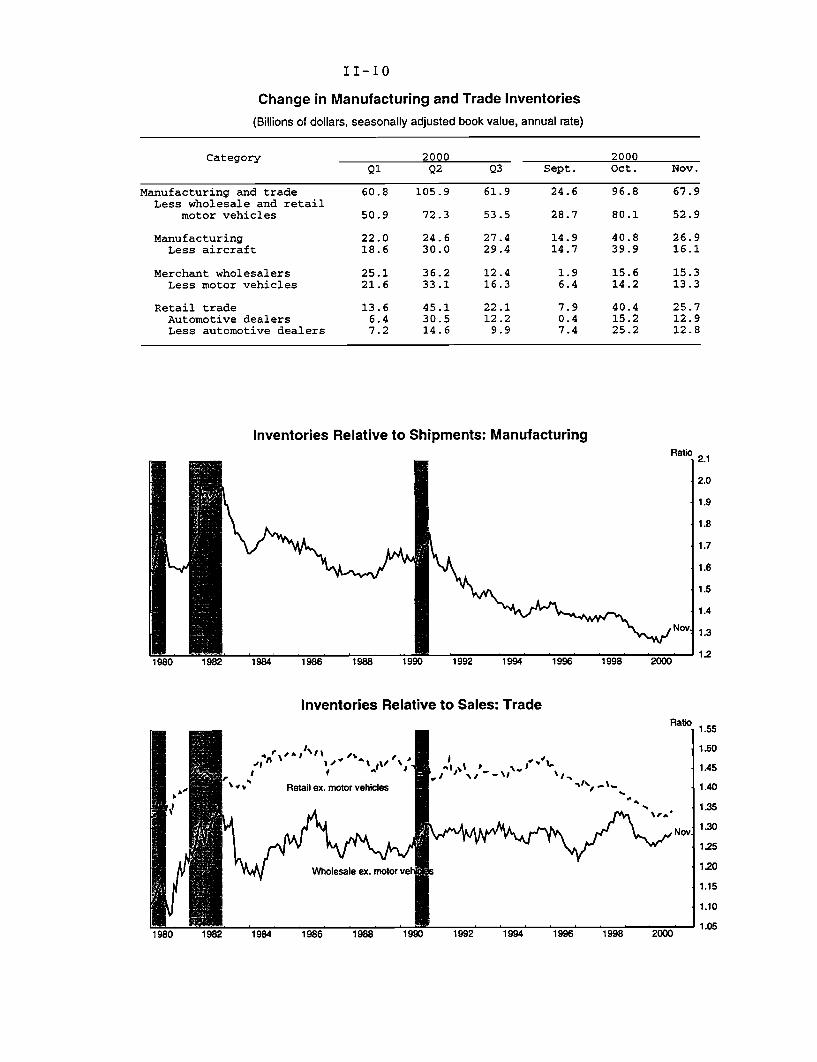
Aggregate business inventory investment. Overall, the book value ofmanufacturing and trade inventories (excluding motor vehicles) rose at anannual rate of $53 billion in November, following an $80 billion buildup inOctober; the average for the two months was $13 billion higher than the paceof stockbuilding during the third quarter. Relative to the third quarter,inventory accumulation picked up in manufacturing-where stocks rose at arelatively hefty $34 billion average annual rate in October and November-andin non-auto retailing, where stockbuilding averaged a $19 billion rate.Accumulations were more moderate in the wholesale sector, where book valueinventories (excluding motor vehicles) rose at an annual rate of about$14 billion in October and November, $2.5 billion lower than during the thirdquarter.
The aggregate inventory-sales ratio for manufacturing and trade (excludingmotor vehicles) was 1.32 months in November, up from the 1.29-month levelseen in August and September. More generally, the downtrends in themanufacturing, wholesale, and retail inventory-sales ratios outside of motorvehicles that had been evident during the latter part of the 1990s clearly hadstalled out by last spring. Since then, aggregate stock-sales ratios in themanufacturing and wholesale sectors have been on a gradual updrift. Theoverall inventory-sales ratio at non-auto retailers has been fairly flat for sometime-in November, the ratio was at the top end of the narrow range that hasprevailed since late in 1999.
Labor Market Developments
Labor demand continued to soften in December, as private nonfarm payrollemployment increased only slowly and average workweeks declined. Despite
II-8
Inventory-Sales Ratios and Industrial Production in Selected Industries
Inventory-Sales RatioConstruction Supplies
Industrial ProductionMonths
- \t Trade* /
N-' Y Nov.
Manufacturers
1994 1995 1996 1997 1998 1999 2000
*Retail building materials group of stores and wholesalelumber.
Inventory-Sales Ratio
1994 1995 1996 1997 1998 1999 2000
Primary and Fabricated MetalsIndustrial Production
Months-2 r-
/ \ Nov.Manufacturers Nov.
- Wholesale'
1994 1995 1996 1997 1998 1999 2000
* Wholesale metals and minerals.
Inventory-Sales Ratio
1994 1995 1996 1997 1998 1999 2000
Rubber and PlasticsIndustrial Production
Months
1994 1995 1996 1997 1998 1999 2000
1992 = 100
1992 = 100
1994 1995 1996 1997 1998 1999 2000* Wholesale nondurables excluding groceries, farmproducts, chemicals, petroleum, paper, and apparel.Note. Inventory-sales ratios calculated at book value.
1992 = 100
II-9
Inventory-Sales Ratios and Industrial Production in Selected IndustriesChemicals and Products
Inventory-Sales Ratio Industrial ProductionMonths 1992= 100
1.5 -- 1Seasonally adjusted
Manufacturers
S- 1.3 s 1
Dec.
Sh/N \ - 1.1
S/ Wholesale
SI 1 I I I 0.91994 1995 1996 1997 1998 1999 2000
Textiles andInventory-Sales Ratio
Months--- 2.2
1994 1995 1996 1997 1998 1999 2000*Wholesale apparel.
Machinery, Equipment, andInventory-Sales Ratio
Months
Manufacturers
SNov.
- Wholesale -
1994 1995 1996 1997 1998 1999 2000
Note. Inventory-sales ratios calculated at book valu
1994 1995 1996 1997 1998 1999 2000
ApparelIndustrial Production
1992 = 100
Seasonally adjusted
Dec.I I I I I I
1994 1995 1996 1997 1998 1999 2000
Instruments Excluding High-TechIndustrial Production
1992 = 1002
Seasonally adjusted
Dec.1.8 -
1.6
1.4
1.2 I l II I I1994 1995 1996 1997 1998 1999 2000
e.
II-10
Change in Manufacturing and Trade Inventories
(Billions of dollars, seasonally adjusted book value, annual rate)
Category 2000 2000Q1 Q2 Q3 Sept. Oct. Nov.
Manufacturing and trade 60.8 105.9 61.9 24.6 96.8 67.9Less wholesale and retail
motor vehicles 50.9 72.3 53.5 28.7 80.1 52.9
Manufacturing 22.0 24.6 27.4 14.9 40.8 26.9Less aircraft 18.6 30.0 29.4 14.7 39.9 16.1
Merchant wholesalers 25.1 36.2 12.4 1.9 15.6 15.3Less motor vehicles 21.6 33.1 16.3 6.4 14.2 13.3
Retail trade 13.6 45.1 22.1 7.9 40.4 25.7Automotive dealers 6.4 30.5 12.2 0.4 15.2 12.9Less automotive dealers 7.2 14.6 9.9 7.4 25.2 12.8
Inventories Relative to Shipments: Manufacturing
1984 1986 1988 19!
Ratio
Nov.
1992 1994 1996 1998 2000
Inventories Relative to Sales: Trade
I if% " Retail ex. motor vehicles
2.1
2.0
1.9
1.8
1.7
1.6
1.5
1.4
1.3
1.2
1980
1980
' ~
II-11
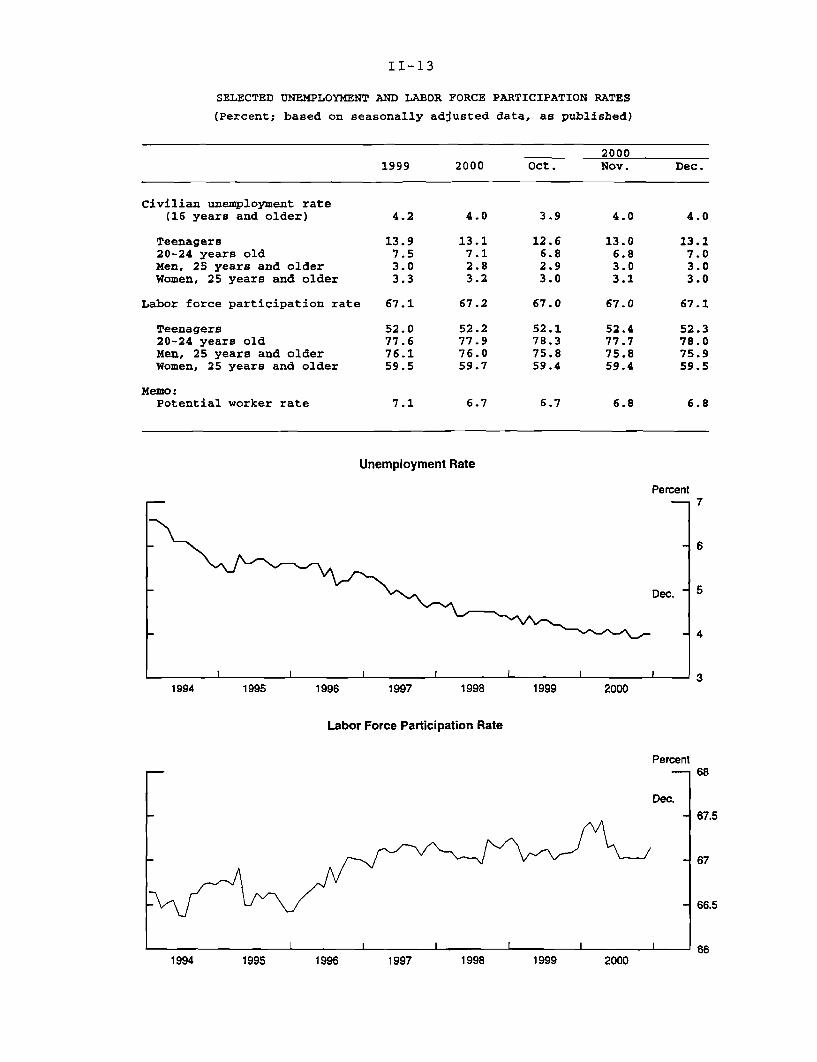
weaker demand overall, the labor market remained very tight, with theunemployment rate holding at 4.0 percent in December.
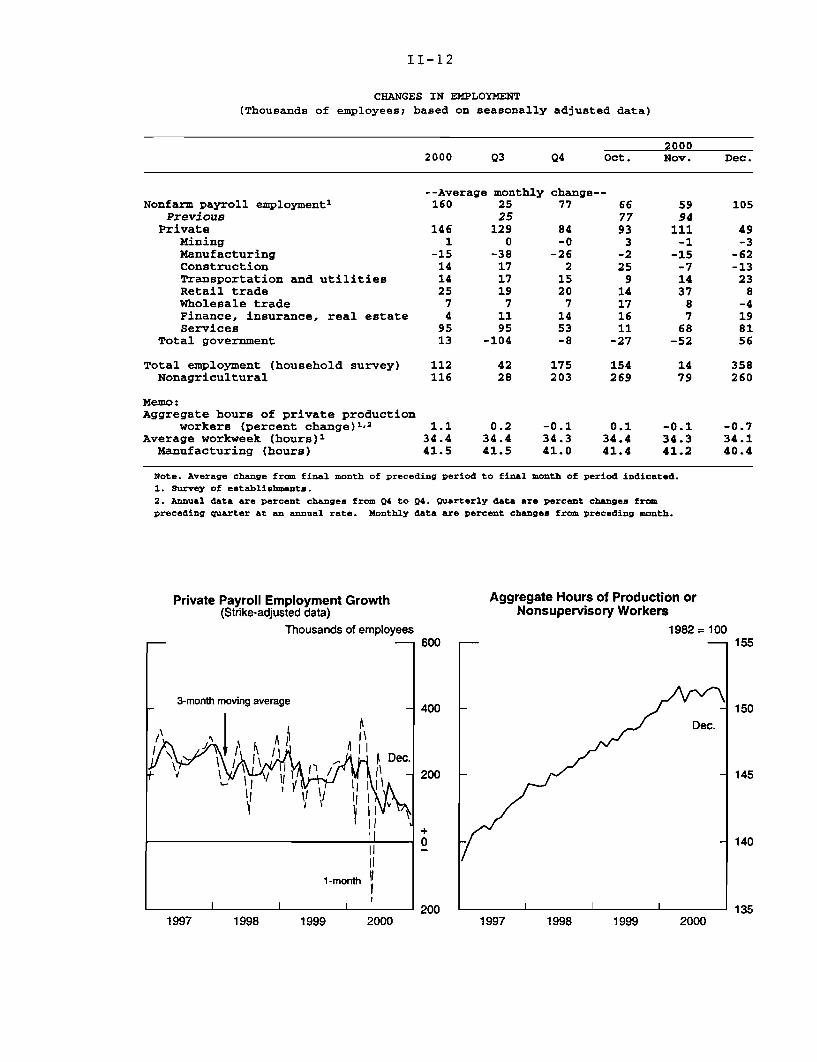
Private nonfarm payrolls rose 49,000 in December to finish a quarter in whichemployment gains averaged just 84,000 per month, a substantial decelerationfrom earlier last year and the weakest quarter since 1992. Much of the recentslowdown in aggregate job creation reflects contracting labor demand inmanufacturing. In December, factory payrolls dropped 62,000, bringing thefourth-quarter average decline to 26,000 per month. Employment in the helpsupply industry, which provides many workers to manufacturing but isclassified as part of the services industry, fell an average of 33,000 per monthlast quarter, compared with an average monthly increase of 12,000 during thefirst nine months of the year. Elsewhere, construction employment in Decemberdeclined for a second month; however, analysts at the BLS believe thatunusually cold and stormy weather during the midmonth reference periods forNovember and December may have more than accounted for these recent joblosses.
In the private service-producing sector, employment gains slowed to an averageof 109,000 per month in the fourth quarter from a third-quarter pace of 149,000.However, excluding the declines registered in the help supply component notedabove, the average monthly increase in service-producing jobs was essentiallythe same in the third and fourth quarters.
Although private employment, as published, clearly decelerated during the latterhalf of 2000, the use of "bias-adjustment factors" to account for increases injobs at very young firms could mean that the payroll estimates understate thedegree to which labor demand weakened. In advance of the annual benchmark,the BLS gets a relatively accurate count of jobs at established firms from theresponses to the payroll survey; however, little contemporaneous information isavailable on employment growth at very young firms. Estimates for thesefirms-the bias-adjustment factors-are added to the survey-based employmentestimates to produce the published figures. Because these factors are basedpredominantly on information from the previous benchmark-which providesemployment counts at essentially all firms-they may not incorporate shifts inlabor market trends in a timely fashion. Indeed, although the recent slowdownin hiring at established firms likely implies a similar slowdown at very youngfirms, the current bias-adjustment factors assumed that hiring at those firmsaccelerated in the fourth quarter.
Aggregate hours of production or nonsupervisory workers on private nonfarmpayrolls fell 0.7 percent in December, with the decline largely concentrated inthe goods-producing sector. Aggregate production-worker hours were littlechanged, on balance, during the second half of 2000, edging down at an annual
II-12
CHANGES IN EMPLOYMENT(Thousands of employees; based on seasonally adjusted data)
20002000 Q3 Q4 Oct. Nov. Dec.
--Average monthly change--Nonfarm payroll employment1 160 25 77 66 59 105
Previous 25 77 94Private 146 129 84 93 111 49
Mining 1 0 -0 3 -1 -3Manufacturing -15 -38 -26 -2 -15 -62Construction 14 17 2 25 -7 -13Transportation and utilities 14 17 15 9 14 23Retail trade 25 19 20 14 37 8Wholesale trade 7 7 7 17 8 -4Finance, insurance, real estate 4 11 14 16 7 19Services 95 95 53 11 68 81
Total government 13 -104 -8 -27 -52 56
Total employment (household survey) 112 42 175 154 14 358Nonagricultural 116 28 203 269 79 260
Memo:Aggregate hours of private production
workers (percent change)1'2 1.1 0.2 -0.1 0.1 -0.1 -0.7Average workweek (hours)' 34.4 34.4 34.3 34.4 34.3 34.1Manufacturing (hours) 41.5 41.5 41.0 41.4 41.2 40.4
Note. Average change from final month of preceding period to final month of period indicated.1. Survey of establishments.2. Annual data are percent changes from Q4 to 04. Quarterly data are percent changes frompreceding quarter at an annual rate. Monthly data are percent changes from preceding month.
Private Payroll Employment Growth(Strike-adjusted data)
Thousands of employees
Aggregate Hours of Production orNonsupervisory Workers
1982 = 100
1997 1998 1999 2000 1997 1998 2000
II-13
SELECTED UNEMPLOYMENT AND LABOR FORCE PARTICIPATION RATES
(Percent; based on seasonally adjusted data, as published)
20001999 2000 Oct. Nov. Dec.
Civilian unemployment rate(16 years and older) 4.2 4.0 3.9 4.0 4.0
Teenagers 13.9 13.1 12.6 13.0 13.120-24 years old 7.5 7.1 6.8 6.8 7.0Men, 25 years and older 3.0 2.8 2.9 3.0 3.0Women, 25 years and older 3.3 3.2 3.0 3.1 3.0
Labor force participation rate 67.1 67.2 67.0 67.0 67.1
Teenagers 52.0 52.2 52.1 52.4 52.320-24 years old 77.6 77.9 78.3 77.7 78.0Men, 25 years and older 76.1 76.0 75.8 75.8 75.9Women, 25 years and older 59.5 59.7 59.4 59.4 59.5
Memo:Potential worker rate 7.1 6.7 6.7 6.8 6.8
Unemployment Rate
Percent
6
Dec. 5
4
1995 1997 1998 2000
Labor Force Participation Rate
Percent
Dec.
I II I I I
1994 1995 1997 1998 2000
II-14
Labor Market Indicators
Initial Claims for Unemployment InsuranceThousands
4800 - 4-week moving average- Claims (right scale)
-- Insured unemployment (left scale)
4000
3200
2400
1600 II II I1990 1992
Reporting Positions Hard to Fill
National Federation of IndependentBusinesses
I I I I I I I1996 1998 2000
Conference Board: Employment ConditionsPercent
Jobs presently plentiful
Dec.
1996
1994 1996 1998 2000
Help Wanted IndexPercent 1990=100
40C] onference Board
Dec. Dec..,. - RR - . /.^
2000
1996 1998 2000
Expected Labor Market ConditionsIndex Index
Michigan Survey D .- Conference Board
Jan.(p)
1996 1998 2000
Note. Each expected conditions index is the proportion ofhouseholds expecting employment to rise, minus the proportionexpecting employment to fall, plus 100.
Thousands
Jan. 20
I I I I I I

II-15
rate of 0.1 percent last quarter after a tepid 0.2 percent rise in the third quarter. 5
At least some of December's sharp drop in aggregate hours resulted from thesevere winter storms in the Midwest during the reference period. These stormskept some workers home for part of the week, shortening the workweek to34.1 hours in December, its lowest level since the blizzard of January 1996. 6
However, December's shorter workweek also reflected weaker labor demand inmanufacturing, where the workweek had already fallen to 41.2 hours inNovember, 1/2 hour below its first-half average.
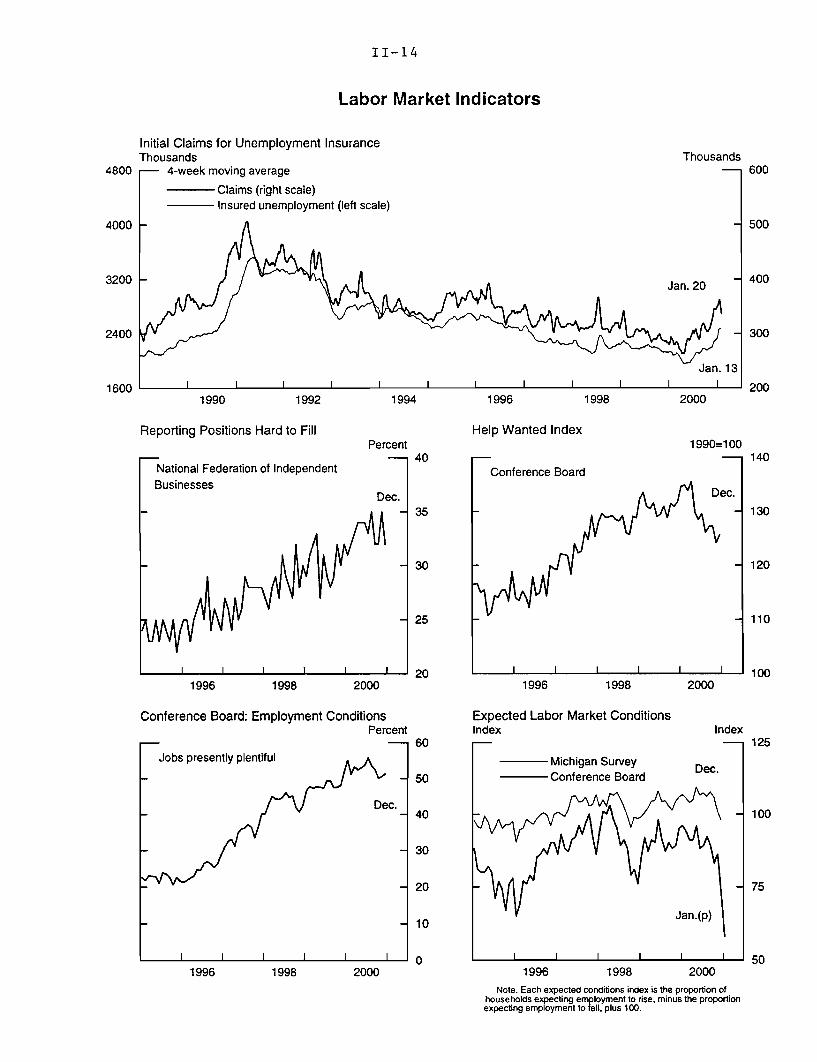
Other available indicators also suggest an easing of labor demand pressures atthe end of last year, albeit in a still-tight labor market overall. The four-weekmoving average of unemployment insurance claims climbed steeply into earlyJanuary and, although it has moved off its high, remained elevated at midmonth.Firms surveyed by the National Federation of Independent Businesses reportedsome leveling off in the number of positions that they consider hard to fill. TheConference Board reported that its help-wanted index remained nearNovember's low level and that the percentage of households viewing jobs asplentiful fell during the second half of last year. Looking forward, householdsresponding to both the Conference Board and Michigan consumer surveysexpect that weaker economic activity will lead to rising unemployment incoming months.
Consumer SpendingReal consumer spending slowed in the fourth quarter as sales of motor vehiclesretreated and outlays for other goods increased only slowly.
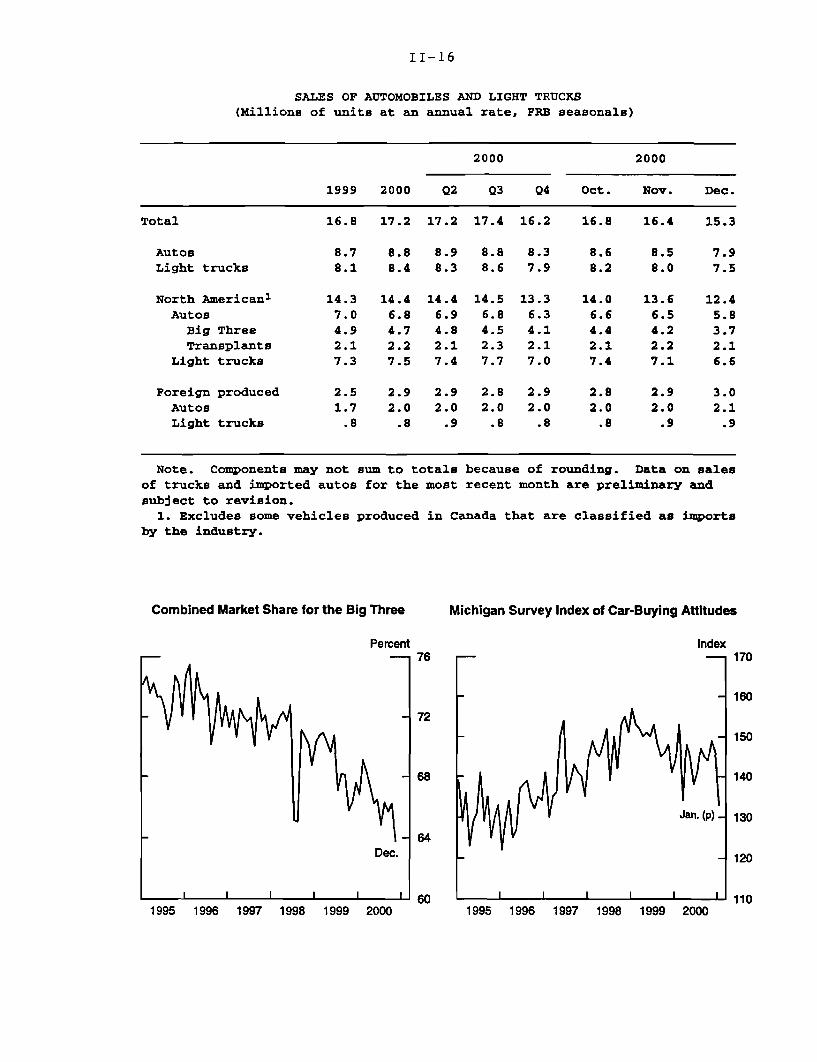
Motor vehicles. Sales of light vehicles plunged to an annual rate of15.3 million units in December. In the fourth quarter, sales averaged16.2 million units, a sharp deceleration from the 17.6 million-unit paceregistered over the first three quarters of the year.7 The sales slump wasespecially hard on the Big Three automakers, whose combined market share fellto a record low of 64 percent last quarter-about 5 percentage points lower thantheir overall share in 1999. About half of this decline can be attributed to a
5. We now estimate that hours of all persons, as calculated for the Productivity and Costfigures, fell at an annual rate of 0.6 percent in the third quarter and 0.9 percent in the fourthquarter. This series incorporates estimates of hours worked by production and nonproductionworkers, the self-employed, and unpaid family workers.
6. To avoid conflicting with households' holiday plans in December, the reference periodfor the household survey is shifted one week, to the week including the 5 th, while the referenceperiod for the payroll survey remains the pay period that includes the 12th. Therefore, the usualinformation on the number of individuals at work part-time due to bad weather collected in thehousehold survey cannot be used to estimate the effect of bad weather on the Decemberworkweek derived from the payroll survey.
7. Most of the decline in the fourth quarter was due to a step-down in consumer demand,although fleet sales also fell off from unusually high third-quarter levels.
II-16
SALES OF AUTOMOBILES AND LIGHT TRUCKS(Millions of units at an annual rate, FRB seasonals)
2000 2000
1999 2000 Q2 Q3 Q4 Oct. Nov. Dec.
Total 16.8 17.2 17.2 17.4 16.2 16.8 16.4 15.3
Autos 8.7 8.8 8.9 8.8 8.3 8.6 8.5 7.9Light trucks 8.1 8.4 8.3 8.6 7.9 8.2 8.0 7.5
North American1 14.3 14.4 14.4 14.5 13.3 14.0 13.6 12.4Autos 7.0 6.8 6.9 6.8 6.3 6.6 6.5 5.8
Big Three 4.9 4.7 4.8 4.5 4.1 4.4 4.2 3.7Transplants 2.1 2.2 2.1 2.3 2.1 2.1 2.2 2.1
Light trucks 7.3 7.5 7.4 7.7 7.0 7.4 7.1 6.6
Foreign produced 2.5 2.9 2.9 2.8 2.9 2.8 2.9 3.0Autos 1.7 2.0 2.0 2.0 2.0 2.0 2.0 2.1Light trucks .8 .8 .9 .8 .8 .8 .9 .9
Note. Components may not sum to totalsof trucks and imported autos for the mostsubject to revision.
because of rounding. Data on salesrecent month are preliminary and
1. Excludes some vehicles produced in Canada that are classified as importsby the industry.
Combined Market Share for the Big Three Michigan Survey Index of Car-Buying Attitudes
Percent Index
1995 1996 1997 1998 1999 2000 1995 1996 1997 1998 1999 2000
Auto Sales
--- Big Thre- Other
11-17
Sales and Inventories of Light Vehicles(Seasonally adjusted; data through December)
Light Truck SalesMillions of units' Millions of units'
9
e - Big ThreeS8 - Other
7
6
5
4
3
I I 2 I
1996 1997 1998 1999 2000
Auto InventoriesMillions of units
Big ThreeOther
1996 1997 1998 1999 2000
Days' Supply of Autos
--- Big Three- Other
Days
I
1996 1997 1998 1999 2000
Light Truck InventoriesMillions of units
- Big Three--- Other
1996 1997 1998 1999 2000
Days' Supply of Light Trucks
-- Big Three-- Other
Days
1996 1997 1998 1999 2000
I I I
1996 1997 1998 1999 2000
* Annual rate; FRB seasonals

II-18
RETAIL SALES(Percent change; seasonally adjusted)
2000 2000
H1 Q3 Q4 Oct. Nov. Dec.
Total sales 1.8 1.4 .1 -.1 -.5 .1Previous estimate 1.4 .0 -.4
Retail control1 2.1 1.6 .5 .0 -.1 .0Previous estimate 1.6 .2 .2
GAF2 1.9 1.5 .3 .2 -.4 -.4Previous estimate 1.5 .4 .4
1. Total retail sales less sales at building material and supplystores and automotive dealers, except auto and home supply stores.
2. General merchandise, apparel, furniture, and appliance stores.
REAL PCE SERVICES(Percent change from the preceding period)
2000 2000
1999 H1 Q3 Sept. Oct. Nov.
Q4/Q4 -- Annual rate -- --- Monthly rate ---
PCE Services 4.2 4.9 3.7 .5 .3 .6Electricity .9 14.6 -5.4 .3 -.9 2.1Natural Gas 3.6 12.8 -12.5 .7 -4.6 10.8Nonenergy services 4.3 4.6 4.2 .5 .4 .4Estimated with trends 3.3 3.8 3.7 .3 .3 .3Estimated with indicators 5.0 4.7 3.8 .5 .5 .5
Note. Derived from billions of chained (1996) dollars.
Real PCE for Brokerage Services12-month percent change
'' Stock market volume*
' ," Dec.
Real PCE forbrokerage services Nov.
2000*Sum of the trading volumes of the American StockExchange, Nasdaq, and New York Stock Exchangedivided by 1000.
Real PCE for Electricity and Natural Gas*Level
0 200
Monthly percent change
Real PCE for electricityand natural gas Dec. ,(right scale) ,
Nov.
-- NOV. ,, *
% ' Heating degree days(left scale)
2000
*Seasonally adjusted.
300
II-19
higher market share for foreign-produced vehicles and half to a higher share fordomestic transplants; these producers have been introducing new models of carsand light trucks that have proven to be attractive competitors to the Big Three'smodels.
Confidential reports from industry analysts suggest that retail demand for lightvehicles has stabilized so far in January. 8 Nonetheless, the preliminary readingfrom the University of Michigan index of car-buying conditions indicated thatconsumer attitudes plummeted in mid-January. In addition to greater pessimismabout the economy, anecdotal reports suggest that consumers, having becomeaccustomed to sizable rebates and offers of low financing, now feel that currentprices are too high. Indeed, after having dropped for several months, the CPIfor new vehicles moved up 0.1 percent in November and 0.4 percent inDecember. These price increases are consistent with the quarterly data onincentives, which suggest that average incentives per vehicle shrank 9 percent inthe fourth quarter. To date, manufacturers appear to be resisting the temptationto sweeten incentives to boost sales, although they have extended some offersthat were scheduled to expire at midmonth.
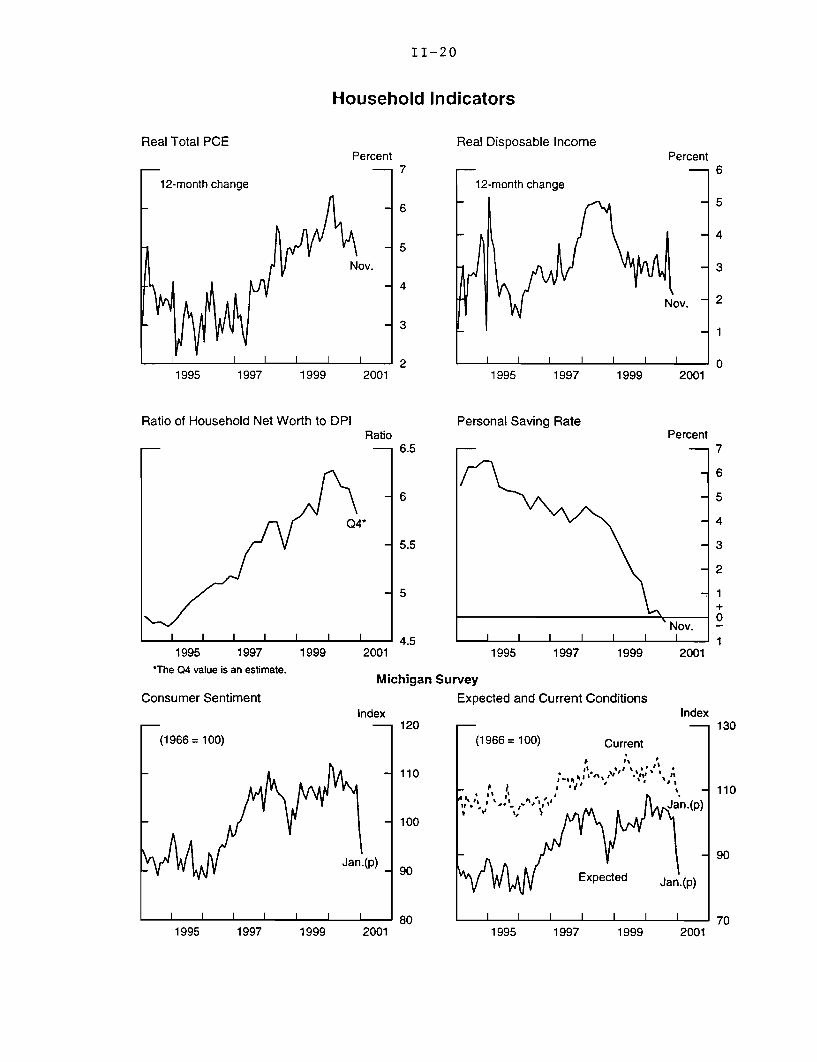
Other consumer spending and income. Nominal outlays in the retail controlgroup of stores were unchanged in December and, given revised data, littlechanged in October and November. Nominal outlays in the GAF group (generalmerchandise, apparel, and furniture and appliance stores) declined in Novemberand December-readings that are consistent with anecdotal reports of relativelyweak holiday spending. Real purchases of goods, excluding motor vehicles,increased a mere 3/4 percent (annual rate) in the fourth quarter. Includingreduced outlays for motor vehicles, we estimate that real expenditures for allgoods declined at an annual rate of about 1 percent last quarter, which wouldmark the largest decline in this spending category since the fourth quarter of1991.9
The most recent information on service expenditures is for November, when realservice outlays are estimated to have risen 0.6 percent. The gain reflected inpart higher consumption of electricity and natural gas that was due tounseasonably cold weather. However, spending on non-energy services-which include recreational services and air travel, for which the BEA uses
8. The anecdotal reports also suggest that several firms are boosting fleet sales in January.9. The only other quarter since 1991:Q4 during which real PCE for goods declined was
1997:Q2, when goods expenditures declined at an annual rate of 0.4 percent.
Real Total PCE
12-month change
1995 1997 1999
Ratio of Household Net Worth to D
I I I I I I
1995 1997*The 04 value is an estimate.
Consumer Sentiment
(1966 = 100)
1999
11-20
Household Indicators
Real Disposable IncomePercent
2001
PIRatio
6.5
- 6
Q4*
-5.5
5
S 4.52001
Michigan
Index120
110
S 100
Jan.(p) 90- 890
I 80I I I I I I
1995 1997
Personal Saving Rate
W Expected
1 I I I
Percent
1999 2001
Percent
!001
ndex
Jan.(p)
I I
1999 2001 1995
1995 1997 1999 2
SurveyExpected and Current Conditions
II
(1966 =100) Current
I I-"h' . A Sv
I I I I I I I
1997 1999 20011995 1997
II-21
timely indicators to estimate monthly movements-also posted noticeable gainsin November.10
For December, below-average temperatures are again expected to have provideda boost to outlays for electricity and natural gas. But we have little informationon purchases of services other than energy. The lone exception is real PCE forbrokerage services, which is estimated by the BEA using stock market volume.We anticipate that this component of spending will be reported to have posted amoderate gain in December, reflecting the pickup in trading volume last month.
Income growth has slowed further in recent months. Real disposable personalincome rose about 2-1/4 percent over the twelve months ended in November,down from a range of year-over-year increases of 2-3/4 to 3-1/4 percentrecorded over much of last year. In addition, the ratio of household net worth todisposable personal income likely fell again in the fourth quarter to its lowestlevel since 1999:Q3. Looking ahead, labor market data for December suggestonly a moderate gain in wage and salary income for the month.
According to the preliminary report on consumer sentiment from the MichiganSurvey, household pessimism about the economic outlook increased at theoutset of this year. The index of consumer sentiment fell almost 5 percentagepoints in early January, after a decline of more than 9 percentage points inDecember." The index has not had back-to-back monthly declines of thismagnitude since late 1991. As in December, all of the major components of theaggregate index moved lower. However, the decline was particularly dramaticfor the index of expected business conditions over the next twelve months,which fell to its lowest level in more than seven years. As noted earlier, theindex of expected unemployment change-which is not included in the overallmeasure, but has proven to be a useful indicator of consumer spending-shot up15 percentage points in early January. This comes on the heels of a13 percentage point increase in December. Although this index has recordedlarger run-ups than this in a single month, it has not had back-to-back months ofdouble-digit increases since the middle of 1979.12
10. Spending estimates for categories such as recreational services and air travel, whichcomprise about 60 percent of nominal non-energy services, are likely to be better indicators ofcurrent spending activity than are estimates for the remaining 40 percent of non-energy services.The BEA estimates monthly movements for the remaining services using trend growth rates thatvary little from one month to another. The trends are not fully re-evaluated until the annualNIPA revision.
11. The final estimate of the index for January will be released on February 2.12. The largest single-month increase in the expected unemployment index was
28 percentage points in June 1978.
II-22
Private Housing Activity(Millions of units; seasonally adjusted annual rate)
20002000P 02 03 Q4P Oct.' Nov. r Dec.P
All unitsStarts 1.59 1.61 1.53 1.56 1.53 1.57 1.58Permits 1.57 1.53 1.51 1.55 1.55 1.60 1.49
Single-family unitsStarts 1.26 1.27 1.22 1.26 1.23 1.24 1.31Permits 1.18 1.15 1.14 1.17 1.19 1.18 1.14Adjusted permits' 1.26 1.24 1.22 1.25 1.26 1.25 1.23
New home sales n.a. .86 .90 n.a. .93 .91 n.a.Existing home sales 5.03 5.09 5.09 5.04 5.00 5.26 4.87
Multifamily unitsStarts .33 .34 .31 .30 .30 .33 .26Permits .39 .39 .37 .37 .36 .42 .35
Mobile homesShipments n.a. .27 .24 n.a. .21 .20 n.a.
Note. p Preliminary. r Revised. n.a. Not available.1. Adjusted permits equals permit issuance plus total starts outside of permit-issuing areas, minus a correction for
those starts in permit-issuing places that lack a permit.
Total Private Building(Seasonally adjusted annual rate)
Millions of units
,2.5
Dec.
Dec.
SDec.
1976 1978 1980 1982 1984 1986 1988 1990 1992 1994 1996 1998 2000

II-23
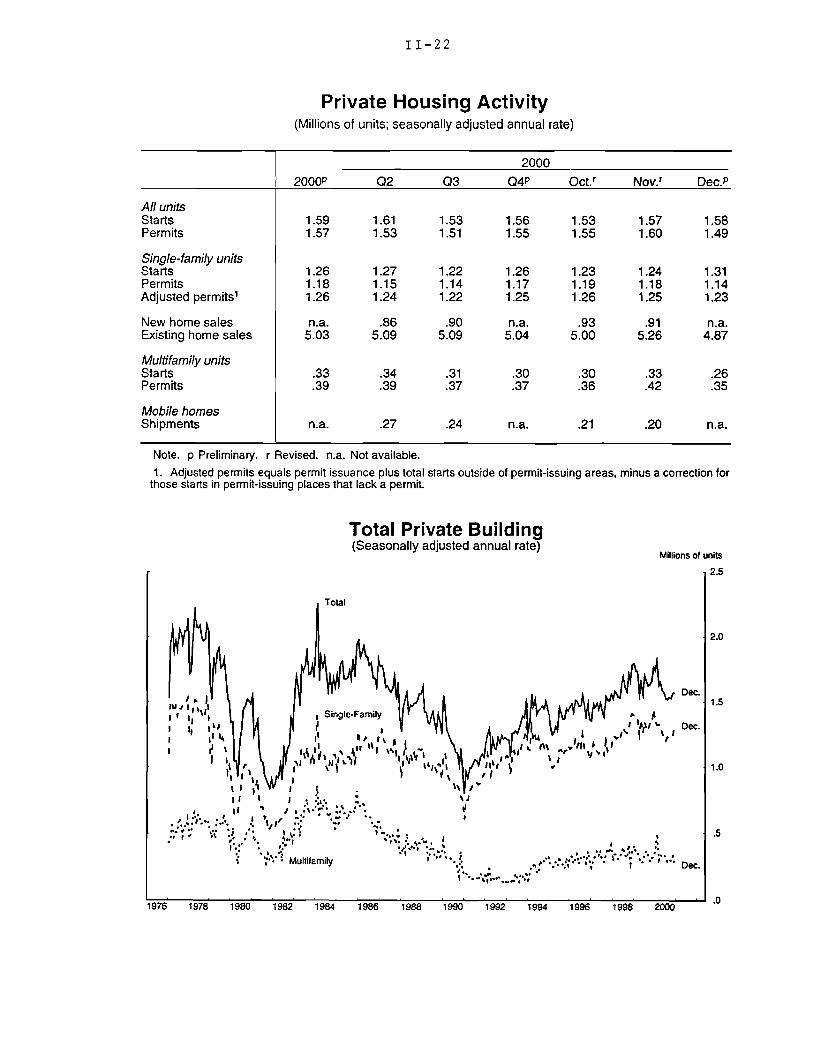
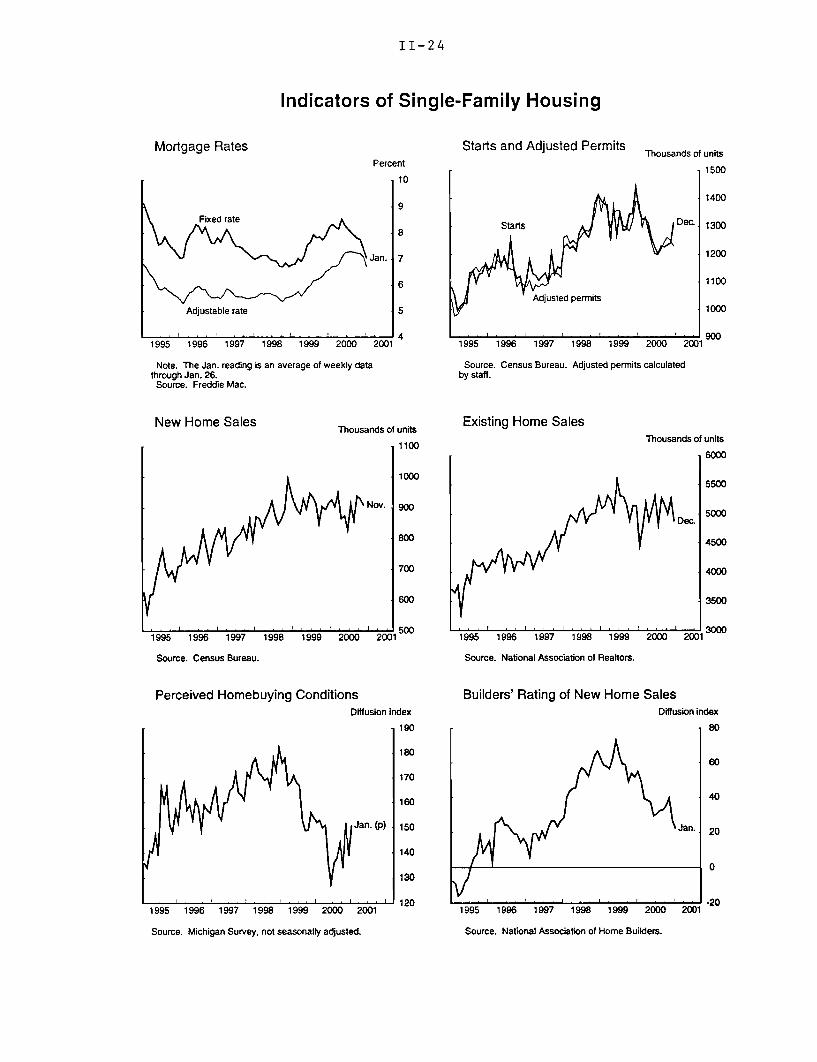
HousingConstruction of single-family housing picked up noticeably in December, likelyboosted by further reductions in mortgage rates, while multifamily constructioncontinued to decline. Although more timely readings on housing activity weremixed in January, they appear, on balance, to be consistent with a stabilizationof demand.
Single-family starts jumped 6 percent in December to an annual rate of1.31 million units, the highest level since last March. However, adjustedpermits for single-family units decreased 1.7 percent in December, to1.23 million units. These data suggest that the underlying pace of new single-family construction in December probably remained close to the Novemberpace, when starts were 1.24 million units. Starts were up 3.4 percent in thefourth quarter as a whole, marking the first quarterly increase of the year. Therise in the fourth quarter occurred despite unusually cold weather in Novemberand December. However, on a construction-weighted basis for the month as awhole, December also was atypically dry, which likely helped offset some of theeffects of the cold weather on construction. More important, rates on fixed-ratecontracts averaged nearly 7-1/2 percent in December and about 7 percent in thefirst three weeks of January. The January reading is 150 basis points below thepeak last May and the lowest monthly average since April 1999. January'sreading for ARM rates is down 35 basis points from May.
Over the past several months, trends in housing starts varied by region. Forexample, in the second half of last year-a period in which mortgage ratesdeclined-starts of single-family homes picked up in the Northeast andespecially in the West; but starts in the South and in the Midwest continued totrend down. The relatively large decline in the Midwest likely reflects thegreater concentration in that region of manufacturing employment. The regionalpattern in the second half of 2000 for multifamily starts was different, withstarts essentially flat, on balance, in the Northeast and the Midwest, and lower inthe South and especially in the West.
Sales of new homes declined in October and November after a strong showingin September. Despite these declines, the two-month average annual rate of919,000 units was 1-3/4 percent above the third-quarter pace. Sales of existinghomes fell about 7-1/2 percent in December to an annual rate of 4.87 millionunits, bringing the average for the fourth quarter about 1 percent below that forthe third quarter.
Despite the ongoing declines in mortgage rates, builders' ratings of new-homesales have declined noticeably since November, and in January ratings reachedtheir lowest level since mid-1997. However, the Michigan Survey's measure ofhousehold perceptions of homebuying conditions turned up again in January,
II-24
Indicators of Single-Family Housing
Mortgage RatesPercent
Starts and Adjusted Permits TThousands of units
1500
1400
Starts Dec. 1300
1200
1100
Adjusted permits1000
9001995 1996 1997 1998 1999 2000 2001 1995 1996 1997 1998 1999 2000 2
Note. The Jan. reading is an average of weekly data Source. Census Bureau. Adjusted permits calculatedthrough Jan. 26. by staff.
Source. Freddie Mac.
New Home Sales
1995 1996 1997 1998 1999
Source. Census Bureau.
Perceived Homebuying Conditi
Thousands of units
1100
1000
Nov. 900
800
700
600
i - -i I i 5002000 2001
onsDiffusion index
Existing Home SalesThousands of units
1 60 0 0
1995 1996 1997 1998 1999
Source. National Association of Realtors.
Builders' Rating of New Home SalesDiffusion index
80
60
40
Jan. 20
0
-20
Source. National Association of Home Builders.
1995 1996 1997 1998 1999 2000 2001
Source. Michigan Survey, not seasonally adjusted.
1
II-25
mainly because of a rise in the share of respondents who thought that mortgagerates were relatively low.
In the multifamily sector, housing starts dropped more than 20 percent inDecember to an annual rate of 262,000 units, more than offsetting a sharpincrease in November. For the fourth quarter as a whole, multifamily starts fell3.9 percent. Multifamily permits decreased nearly 16 percent in December.However, the ratio of starts to permits was below normal, a sign that starts arelikely to pick up in coming months.
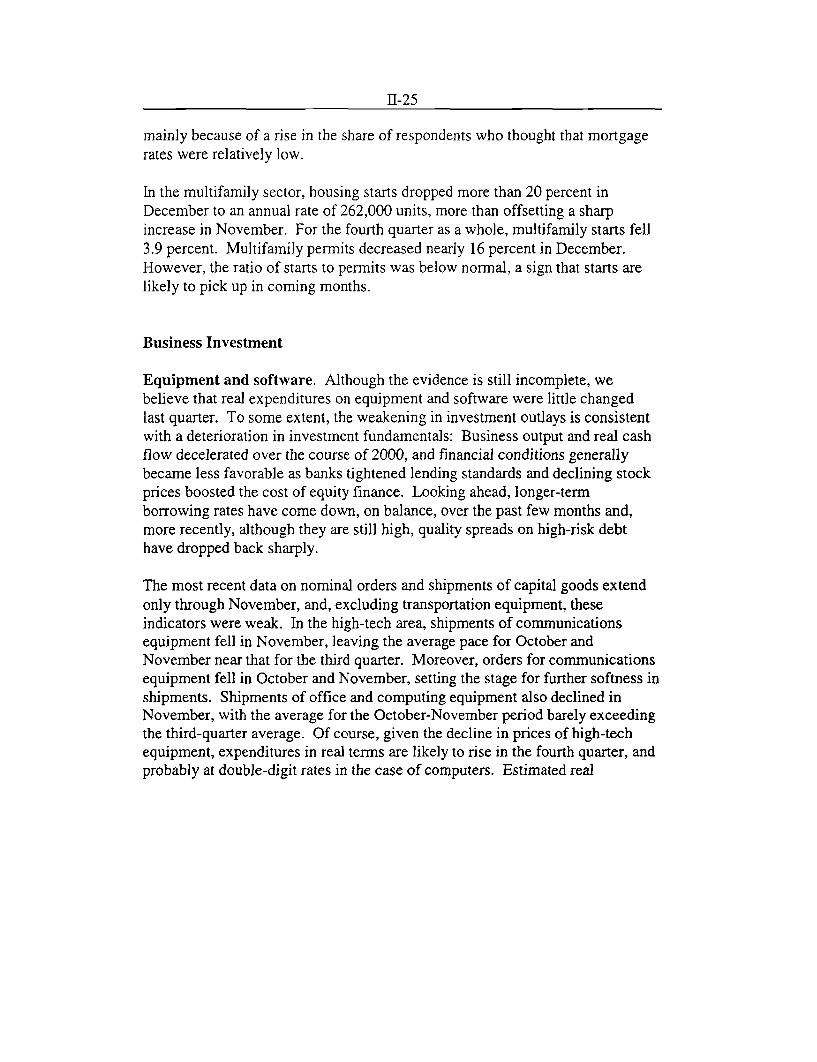
Business Investment
Equipment and software. Although the evidence is still incomplete, webelieve that real expenditures on equipment and software were little changedlast quarter. To some extent, the weakening in investment outlays is consistentwith a deterioration in investment fundamentals: Business output and real cashflow decelerated over the course of 2000, and financial conditions generallybecame less favorable as banks tightened lending standards and declining stockprices boosted the cost of equity finance. Looking ahead, longer-termborrowing rates have come down, on balance, over the past few months and,more recently, although they are still high, quality spreads on high-risk debthave dropped back sharply.
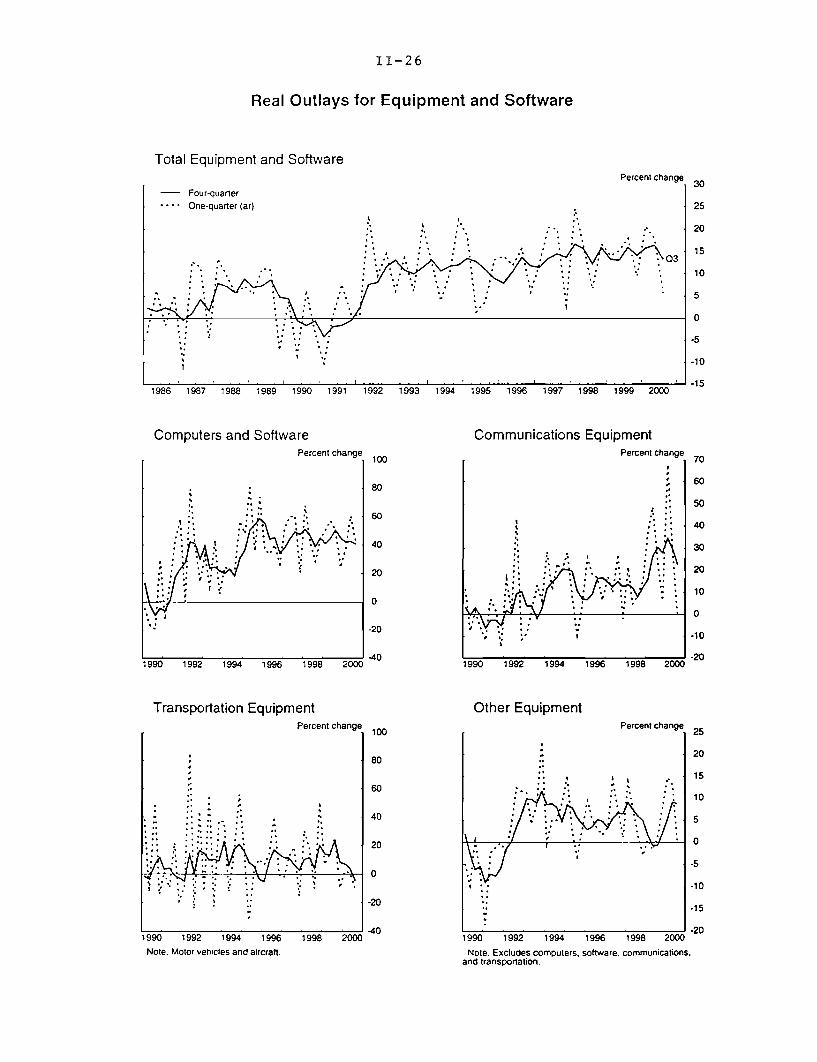
The most recent data on nominal orders and shipments of capital goods extendonly through November, and, excluding transportation equipment, theseindicators were weak. In the high-tech area, shipments of communicationsequipment fell in November, leaving the average pace for October andNovember near that for the third quarter. Moreover, orders for communicationsequipment fell in October and November, setting the stage for further softness inshipments. Shipments of office and computing equipment also declined inNovember, with the average for the October-November period barely exceedingthe third-quarter average. Of course, given the decline in prices of high-techequipment, expenditures in real terms are likely to rise in the fourth quarter, andprobably at double-digit rates in the case of computers. Estimated real
II-26
Real Outlays for Equipment and Software
Total Equipment and Software
Computers and Software
Transportation Equipment
Note. Motor vehicles and aircraft.
Communications EquipmentPercent change
Other EquipmentPercent change
,•
'* ' ' i;r ;* *
- .*
1990 1992 1994 1996 1998 2000
Note. Excludes computers, software, communications.and transportation.

II-27
expenditures on software likely also posted a solid advance in the fourthquarter.13
Outside the high-tech area, shipments of equipment declined in November forthe third straight month, and the October-November average was more than1 percent below the third-quarter average. Given the low but positive rate ofprice inflation for such traditional equipment, the drop in nominal outlaystranslates into an even larger decline in real terms. In addition, orders fornon-high-tech equipment fell in October and November.
With more complete data available, we estimate that real expenditures fortransportation equipment decelerated markedly in the fourth quarter. Inparticular, we think that real spending on motor vehicles fell at an annual rate ofnearly 40 percent last quarter, the third consecutive quarterly decline. Althoughunit sales of medium and heavy trucks, which constitute the bulk of motorvehicle equipment investment, posted a strong gain in December, sales weredown about 40 percent (annual rate) for the fourth quarter as a whole. 14
Elsewhere in the transportation category, spending on civilian aircraft bydomestic businesses-a volatile series owing to the lumpy nature of aircraftdeliveries-likely declined a bit last quarter. The nominal value of shipments ofdomestically produced civilian aircraft declined in October and November(based on Census data), and deliveries by Boeing to U.S. carriers were offsharply, after seasonal adjustment, in December.
Nonresidential construction. Nominal spending on nonresidentialconstruction continued to increase robustly in October and November, averaging15-1/2 percent (annual rate) more than in the third quarter.
13. Monthly shipments data are a key element in the BEA's quarterly NIPA estimates ofspending for most categories of equipment expenditures. However, comparable shipments datafor software do not exist. Instead, about one-third of total software spending (the so-called"own-account" piece) is assumed to increase at the same rate as nominal computer hardware.The remaining two-thirds (the so-called "prepackaged" and "custom" software pieces) arebenchmarked each summer to annual data from the Census Service Annual Survey; the latestavailable data from this survey are from 1998. Subsequent quarterly estimates are based on aneight-quarter moving average of the rate of increase of unpublished unemployment insurancewage data for the prepackaged and custom software industries. The UI data are available onlywith a two-quarter lag. In the interim, the BEA assumes these wages rise at the rate theyaveraged during several previous quarters. This procedure has produced strong gains in nominalsoftware spending over the past few quarters, and because the long averages of wage data changeslowly over time, the NIPA estimates of software spending in the fourth quarter and subsequentfew quarters will increase substantially-even if actual software spending were to be subdued.
14. Spending for motor vehicles has been the most consistently cyclical category ofequipment and software spending over the past thirty years, generally declining in the quarterbefore a business cycle peak and in the peak quarter itself.

II-28
BUSINESS CAPITAL SPENDING INDICATORS(Percent change from preceding comparable period;
based on seasonally adjusted data, in current dollars)
2000 2000
Q3 Q4 Sept. Oct. Nov.
Equipment and software
Shipments of nondefense capital goods .8 n.a. .0 -2.3 .7Excluding aircraft and parts 1.8 n.a. .5 -.3 -1.6Office and computing equipment 5.6 n.a. 1.5 1.3 -2.1Communications equipment 1.2 n.a. 3.6 -1.8 -2.4All other categories .1 n.a. -1.0 -.5 -1.0
Shipments of complete aircraft -5.9 n.a. -10.4 -10.6 -2.1
Medium & heavy truck sales (units) -11.4 -11.3 -7.9 -5.8 -2.7
Orders for nondefense capital goods 1.3 n.a. 5.4 -13.4 5.9Excluding aircraft and parts .1 n.a. 1.5 -2.9 -1.0Office and computing equipment 6.8 n.a. -7.9 7.4 -1.0Communications equipment -7.9 n.a. 20.5 -8.8 -3.5All other categories .0 n.a. .5 -5.7 -.2
Nonresidential structures
Construction put in place, buildings 2.2 n.a. 1.4 .9 1.2Office 4.2 n.a. 5.5 -4.1 .6Other commercial -1.1 n.a. .3 3.0 -4.4Institutional 4.2 n.a. 1.3 2.9 -2.1Industrial 5.1 n.a. -1.6 4.1 13.7Lodging and miscellaneous -. 8 n.a. .7 -.6 .5
Rotary drilling rigs in usel 10.3 8.9 .4 4.7 2.9
1. Percent change of number of rigs inn.a. Not available.
use, seasonally adjusted.
II-29
Orders and Shipments for Nondefense Equipment(Billions of dollars; not at annual rate)
Office and Computing Equipment
16 11.0- Orders Unfilled orders
- Shipments Nov. Nov.
15 10.5
10.014
9.5
139.0
128.5
S11 8.0
10 ' ' 7.51999 2000 1999 2000
Communications Equipment
13 26- Orders Unfilled orders- -Shipments
12 Nov. 24
11 22
/ Nov. 10 20
S9 18
A 8 16
9 7 ' 141999 2000 1999 2000
Non-High-Tech Equipment Excluding Aircraft
32 98- Orders Unfilled orders-- Shipments 31 Nov.
l - 92
t Nov. 28
9027
26 18826
25 86
24 1 9 ' 841999 2000 1999 2000
II-30
Commercial Mortgage Markets
CMBS Gross IssuanceBillions of dollars
125
H1996 1997 1998 1999
Note. Excludes all CMBS backed by mortgages on foreign properties, and Fannie Mae and Freddie Mac securities.Source. Commercial Mortgage Alert.
2000
- 15
CMBS YieldsPercent
Jan. 18
1998 1999 2000 20
Source. Morgan Stanley.
CMBS Spreads Basis Points
600
BB 500
400
300
200
AAA 100-Jan. 18
1998 1999 2000
Note. Rate on CMBS minus 10-year swap rate.Source. Morgan Stanley.
Banks Tightening Standards on Commercial Real Estate Credit
200
Net percent
S80Tighter
I Easier
1990 1991 1992 1993 1994
Source. Senior Loan Officer Opinion Survey.
1995 1 96- 197 1998 1i [ 999 --- 20 201995 1996 1997 1998 1999 2000 2001
nnn H11 I. . I lI II . .I .. I I I I II I.. .
k--

II-31
After having increased rapidly earlier last year, spending for office constructionsettled back to an annual rate of increase of 3-1/2 percent in October andNovember from the third-quarter level. Construction spending for othercommercial structures (which include retail space and warehouses) picked up inOctober and November to an annual rate of increase of 8-1/4 percent, whichpartly reversed their decline over the second and third quarters of last year.Outlays for industrial buildings continued to increase rapidly in October andNovember, jumping at an annual rate of 55-1/2 percent, on average, from thethird-quarter level. Strong gains in industrial building throughout last year morethan reversed a string of declines from late 1998 through the end of 1999 thatreflected lower demand for U.S. exports owing to the Asian financial crisis.
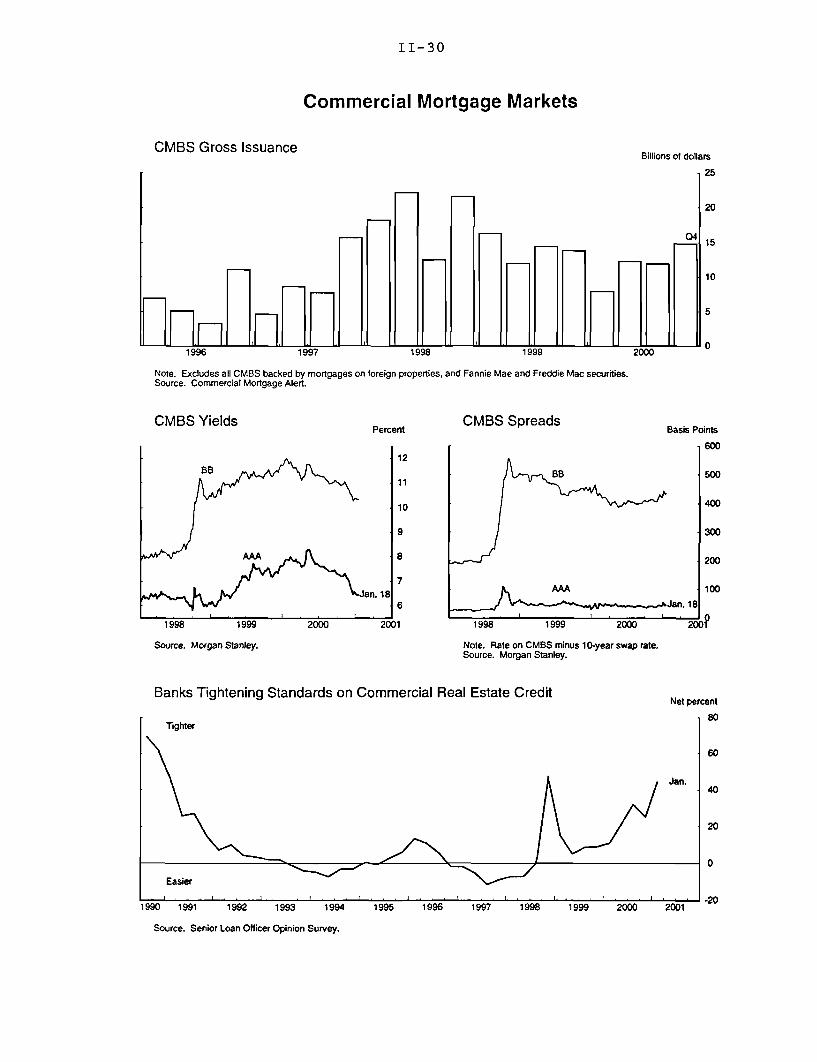
Conditions in financial markets have remained generally favorable fornonresidential construction. Issuance of commercial-mortgage-backedsecurities (CMBS) was well maintained in the fourth quarter. Furthermore, overthe second half of last year, yields on AAA-rated CMBS fell to the lowest levelsince mid-1999, and their spread relative to the ten-year swap rate was about flatlast year. The spread for below-investment-grade (BB rated) CMBS edged up inthe latter part of 2000 from its low last June, but it still was below its level at theend of 1999. Delinquency rates on CMBS remained low through November.15
Nonetheless, commercial banks have taken a more cautious approach tocommercial real estate lending in recent months. In the senior loan officeropinion survey for the three months ended in mid-January, the net proportion oflarge domestic banks that reported having tightened their credit standards forcommercial mortgage loans was 45 percent, compared with 26 percent in theNovember sampling. This finding is consistent with an early January survey ofcommercial mortgage lenders and borrowers that found that commercial bankshave been requiring substantial pre-leasing of space and more equity investmentas a condition for approving construction loans in recent months. In addition,over the past year, three-fourths of the large domestic banks in the surveyreported having tightened their terms on commercial real estate loans. 16
Almost all of these banks cited a less favorable economic outlook as one ofthe reasons; in contrast, only three-fourths of them mentioned a worseningoutlook for commercial real estate within their market area as a reason fortightening.
15. We do not have any timely information for delinquencies on commercial mortgages heldby life insurance companies or commercial banks; these rates stayed low through the thirdquarter (latest data).
16. About half of them reported requiring a wider spread of loan rates relative to the cost offunds, 40 percent required higher debt coverage ratios, and 30 percent reported reducing themaximum loan size or the maximum maturity.

II-32
FEDERAL GOVERNMENT OUTLAYS AND RECEIPTS(Unified basis; billions of dollars)
October-December 12 months ending in Dec.
Percent Percent1999 2000 change 1999 2000 change
OutlaysDeposit insuranceSpectrum auctionSale of major assetsOther
463.9 463.60.8 -0.60.00.0
463.1
0.00.0
464.2
-0.1
0.2
443.6 461.3Receipts
Surplus -20.3 -2.3
1699.7 1787.9-2.4 -4.5-1.5 -0.20.0 0.0
1703.6 1792.5
1858.3 2042.7
158.6 254.8
Outlays excluding deposit insurance, spectrumauction, and sale of major assets are adjusted
for payment timing shifts1
OutlaysNational defenseNet interestSocial securityMedicareMedicaidOther healthIncome securityAgricultureOther
ReceiptsIndividual income and
payroll taxesWithheld + FICANonwithheld + SECARefunds (-)
CorporateGrossRefunds (-)
Other
Surplus
452.075.957.698.147.029.28.7
57.218.559.8
459.675.154.4
103.849.031.09.9
59.312.264.8
443.6 461.3
350.3341.216.0
6.948.857.18.3
44.5
365.6355.4
17.16.9
55.164.6
9.540.6
1.7-1.0-5.55.84.36.4
13.93.7
-34.28.3
4.0
4.44.27.00.9
12.913.114.3-8.8
-8.4
1731.6283.5229.1393.0191.7110.8
33.0240.030.7
219.8
1792.2291.1220.2415.2199.1119.8
37.5247.132.1
230.1
1858.3 2042.7
1489.21272.2341.3124.3185.9217.0
31.1183.3
1635.41375.7393.8134.1213.6243.1
29.6193.7
126.7 250.5
Note. Components may not sum to totals because of rounding.1. A shift in payment timing occurs when the first of the month falls on
a weekend or holiday, or when the first three days of a month are nonworkingdays. Outlays for defense, social security, Medicare, income security, and"other" have been adjusted to account for these shifts.
... Not applicable.
9.9
60.7
3.52.7
-3.95.63.88.1
13.73.04.74.7
9.88.1
15.47.9
14.912.1-4.9
5.7
97.7

II-33
Government Expenditures
Federal government. According to the Monthly Treasury Statement, thefederal budget surplus for the October-December period totaled $2 billion, afteradjustment for shifts in payment timing. The federal government recorded an$8-1/2 billion deficit, after such adjustments, during the same period last year.
After adjustment for routine shifts in the timing of payments, outlays in theOctober-December period rose only 2 percent relative to last year. Spending onagriculture programs was $6 billion lower than 1999 levels, which were elevatedby emergency payments; in 2000, these payments were disbursed in August andSeptember. Defense spending was also down slightly from its 1999 level, whichhad been boosted by outlays for Y2K preparations. Spending on healthprograms was pushed up significantly by recent cost increases.
Total receipts rose 4 percent during the October-December period. Even thoughwithheld income and payroll taxes in calendar year 2000 were up 8 percent from1999, comparable tax withholdings from October through December were4 percent higher than in the same months of 1999. This deceleration reflects notonly slower wage gains but also shifts in income and tax payments from January2000 to December 1999 owing to Y2K concerns, and from December 2000 toJanuary 2001, because of an anticipation of reductions in tax rates that may bemade retroactive to the beginning of the year. Other receipts fell 9 percent,owing to the Federal Reserve's decision to withhold earnings deposits in orderto rebuild its surplus. According to the Daily Treasury Statement, non-withheldincome tax receipts for January 2001 are expected to increase roughly10 percent over last January.
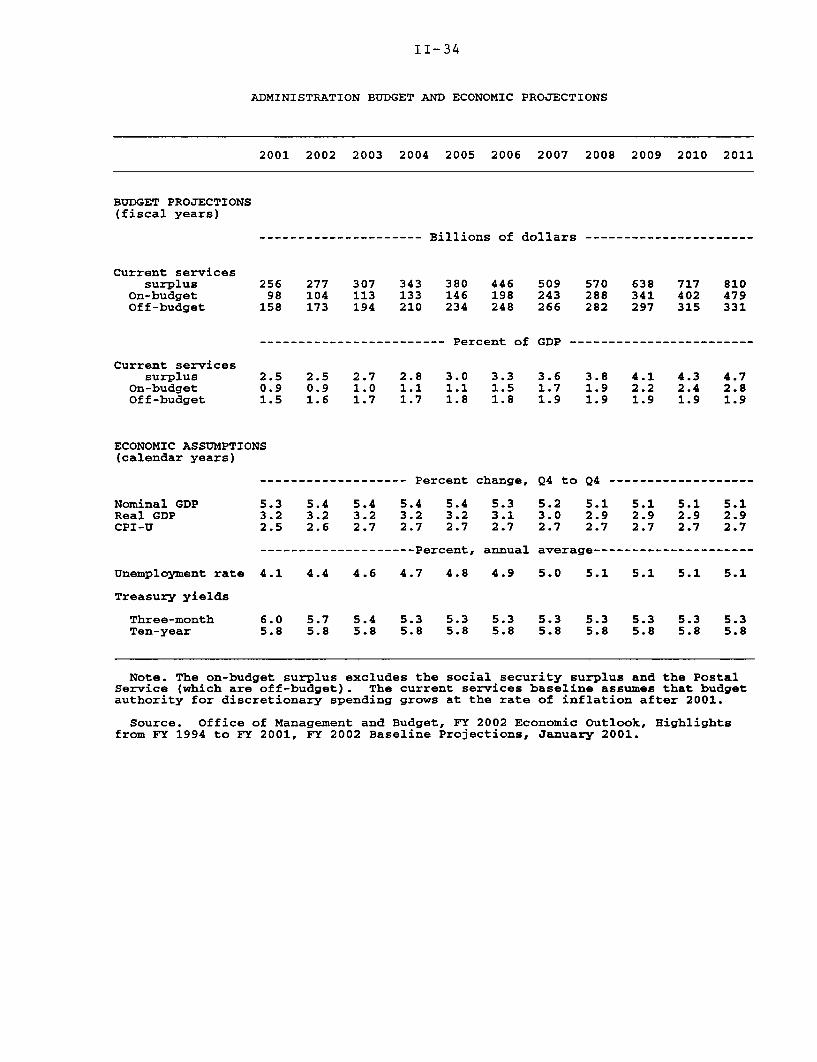
The outgoing Administration released new baseline budget projections onJanuary 16. The federal unified budget surplus was projected to rise slowly,from $236 billion recorded in fiscal 2000 to $256 billion in fiscal 2001. The on-budget surplus, which excludes social security and the Postal Service, wasforecast to expand from $86 billion to $98 billion. In fiscal 2002, the on-budgetsurplus is expected to edge up, to $104 billion, if the annual appropriations fordiscretionary spending rise with inflation.
For the fiscal 2002 to 2011 period, the OMB projected the total budget surplusto be $5 trillion, with a cumulative on-budget surplus of $2.4 trillion and net
II-34
ADMINISTRATION BUDGET AND ECONOMIC PROJECTIONS
2001 2002 2003 2004 2005 2006 2007 2008 2009 2010 2011
BUDGET PROJECTIONS(fiscal years)
Current servicessurplus
On-budgetOff-budget
Current servicessurplus
On-budgetOff-budget
--------------------- Billions of dollars ----------------------
256 277 307 343 380 446 509 570 638 717 81098 104 113 133 146 198 243 288 341 402 479158 173 194 210 234 248 266 282 297 315 331
------------------------ Percent of GDP ------------------------
2.5 2.5 2.7 2.8 3.0 3.3 3.6 3.8 4.1 4.3 4.70.9 0.9 1.0 1.1 1.1 1.5 1.7 1.9 2.2 2.4 2.81.5 1.6 1.7 1.7 1.8 1.8 1.9 1.9 1.9 1.9 1.9
ECONOMIC ASSUMPTIONS(calendar years)
------------------- Percent change, Q4 to Q4 -------------------
Nominal GDPReal GDPCPI-U
5.3 5.4 5.4 5.4 5.4 5.3 5.2 5.1 5.1 5.1 5.13.2 3.2 3.2 3.2 3.2 3.1 3.0 2.9 2.9 2.9 2.92.5 2.6 2.7 2.7 2.7 2.7 2.7 2.7 2.7 2.7 2.7
-------------------- Percent, annual average---------------------
Unemployment rate 4.1 4.4 4.6 4.7 4.8 4.9 5.0 5.1 5.1 5.1 5.1
Treasury yields
Three-monthTen-year
6.0 5.7 5.4 5.3 5.3 5.3 5.3 5.3 5.3 5.3 5.35.8 5.8 5.8 5.8 5.8 5.8 5.8 5.8 5.8 5.8 5.8
Note. The on-budget surplus excludes the social security surplus and the PostalService (which are off-budget). The current services baseline assumes that budgetauthority for discretionary spending grows at the rate of inflation after 2001.
Source. Office of Management and Budget, FY 2002 Economic Outlook, Highlightsfrom FY 1994 to FY 2001, FY 2002 Baseline Projections, January 2001.
II-35
debt held by the public eliminated during fiscal 2009.17 Budget surpluses wererevised up a relatively small amount since last summer. At that time, the on-budget surplus over the 2001 to 2010 period-which has been the basis ofpolicy discussions-was projected to total $1.9 trillion. The most recentestimates call for it to reach $2.1 trillion, as upward revisions to receiptsreflecting higher estimates for potential GDP growth have been partially offsetby upward revisions to outlays owing in part to last fall's budget legislation.
State and local governments. Indicators of state and local activity suggest thatreal purchases increased moderately again in the fourth quarter. The level ofemployment was, on balance, unchanged during the quarter. Although realconstruction spending fell in both October and November, average spendingduring the two months was still above the third-quarter level. However,December's unusually severe weather makes it unlikely that constructionspending rebounded that month.
On the fiscal side, recent surveys indicate that budgetary conditions for statesappear to be generally less rosy than in recent years, and analysts areincreasingly calling attention to signs of impending fiscal difficulties for somestates. Most of the problems appear to be related to slower revenue flows andrising health-care costs. Among the states experiencing slower increases inrevenues, some blame recent tax reductions while others point to sluggish stateeconomies. Notably, fewer states than in recent years are expected to considertax cuts during their upcoming legislative sessions. In addition, 23 statesreported cost overruns for Medicaid owing to rising prescription drug costs,increased caseloads, higher enrollment because of outreach projects under theState Children's Health Insurance Program, and higher medical service costs,especially for long-term care.
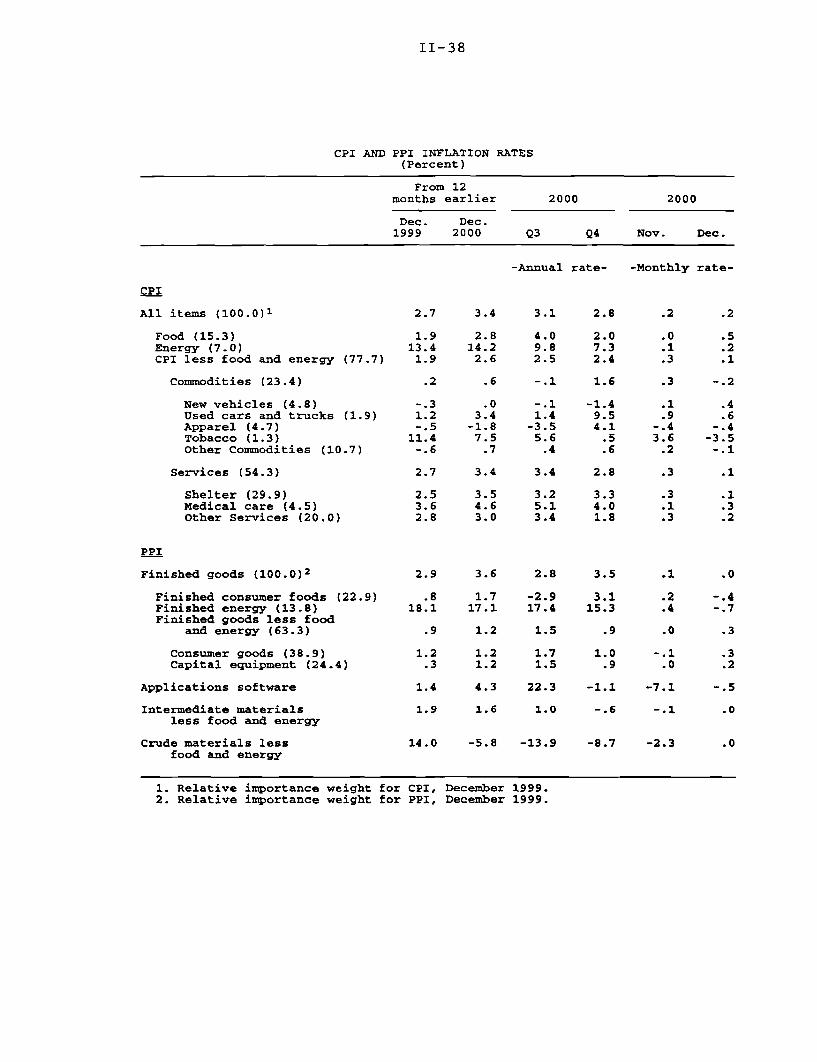
PricesThe consumer price index rose 0.2 percent in December, the same as in theprevious month. Over 2000 as a whole, the CPI was up 3.4 percent, about3/4 percentage point more than in the preceding year, with core pricesaccounting for more than half of this acceleration. 18 That said, the CPIexcluding food and energy rose just 0.1 percent in December, and the
17. The projections are based on the OMB's economic assumptions that during the next tenyears, real GDP will increase at an average rate of about 3.0 percent per year, the unemploymentrate will move up slowly to about 5 percent, and CPI inflation will move up to about2-3/4 percent per year. The CBO projections are expected to be released around January 31.According to the Senate Budget Committee, these projections will increase the cumulativeten-year total budget surplus to $5.7 trillion, up from $4.6 trillion forecast last July.
18. As we have noted previously, the December 1998 run-up in tobacco prices no longeraffects comparisons of the most recent twelve-month change with that of the year-earlier period.Thus, the pickup in the twelve-month changes ending in December in the core index and the coreexcluding tobacco are similar.
II-36
Gasoline and Heating
Retail Gasoline Prices
Average all grades1
Cents per gallon
1999 2000
1. Prices adjusted using CPI seasonal factors.
Oil Developments
Gasoline Price Margins
SPrice spread of retail gasolineover WTI crude
Cents per gallon
(jn uJan. 220
5-year average margin
1999 20001999 2000
Gasoline Inventories Millions of barrels Heating Oil Inventories Millions of barrels
1999 2000 1999 2000
Source. U.S. Department of Energy.
100
90
80
70
60
II-37
Natural Gas Developments
Natural Gas Prices
Spot price, Henry hub
^~ _ ^"
Dollars per million BTUs-- 12
December
leek ending Jan. 19
I I I I I I I I I I . I I I I I I I I I I I I I I
1999 2000
Natural Gas Supply and Consumption
2001
Billions of cubic feet--1 3500
Consumption
Inventory build
-'1
Inventory build
Production andimports
NovemberI I I I a I a I a I a I I I a I 2
1999 2000
Natural Gas Inventories
3000
2500
2000
1500
1000
Days of consumption-1 50
5-year average for\ January 12
January 12
L j a j I I I I a a a AI I I a a a I S I a a
1999 20001. Working gas in storage divided by U.S. D.O.E. projection of 2000/2001 average daily winter consumption.
Source. U.S. Department of Energy.
I I I
II-38
CPI AND PPI INFLATION RATES(Percent)
From 12months earlier 2000 2000
Dec. Dec.1999 2000 Q3 Q4 Nov. Dec.
-Annual rate- -Monthly rate-
CPI
All items (100.0)1
Food (15.3)Energy (7.0)CPI less food and energy (77.7)
Commodities (23.4)
New vehicles (4.8)Used cars and trucks (1.9)Apparel (4.7)Tobacco (1.3)Other Commodities (10.7)
Services (54.3)
Shelter (29.9)Medical care (4.5)Other Services (20.0)
PPI
Finished goods (100.0)2
Finished consumer foods (22.9)Finished energy (13.8)Finished goods less food
and energy (63.3)
Consumer goods (38.9)Capital equipment (24.4)
Applications software
Intermediate materialsless food and energy
Crude materials lessfood and energy
2.7
1.913.41.9
.2
-. 31.2-.5
11.4-.6
2.7
2.53.62.8
2.9
.818.1
.9
1.2.3
1.4
1.9
14.0
3.4
2.814.22.6
.6
.03.4-1.87.5.7
3.4
3.54.63.0
3.6
1.717.1
1.2
1.21.2
4.3
1.6
3.1
4.09.82.5
-.1
-.11.4-3.55.6.4
3.4
3.25.13.4
2.8
-2.917.4
1.5
1.71.5
22.3
1.0
2.8
2.07.32.4
1.6
-1.49.54.1.5.6
2.8
3.34.01.8
3.5
3.115.3
.9
1.0.9
-1.1
-.6
-5.8 -13.9 -8.7
1. Relative importance weight for CPI, December 1999.
2. Relative importance weight for PPI, December 1999.
.2
.5
.2
.1
-.2
.4
.6-.4-3.5-.1
.1
.1
.3
.2
.1
.2
.4
.0
-.1.0
-7.1
-.1
-2.3
CPI, December 1999.PPI, December 1999.
II-39
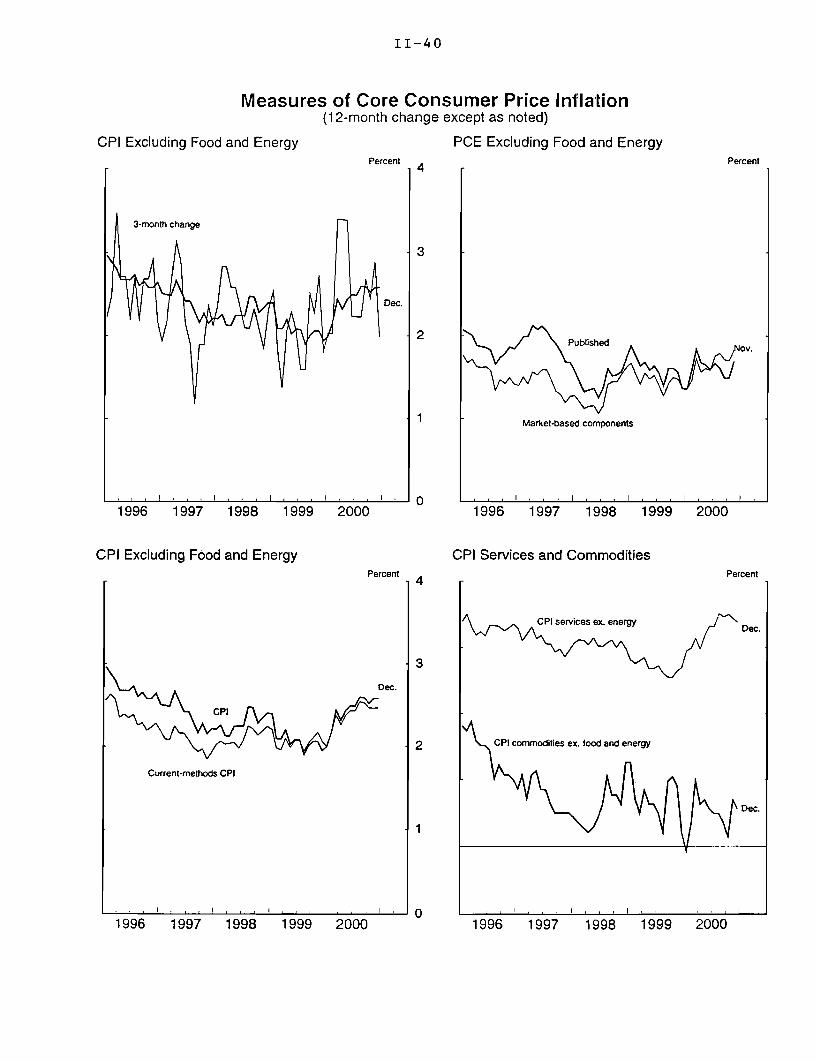
underlying rate of change in this index appears to have stabilized in recentmonths. On a current-methods basis, the twelve-month change in the core CPIwas 2.5 percent in each month from August through December; this pace is0.4 percentage point above that registered in 1999.
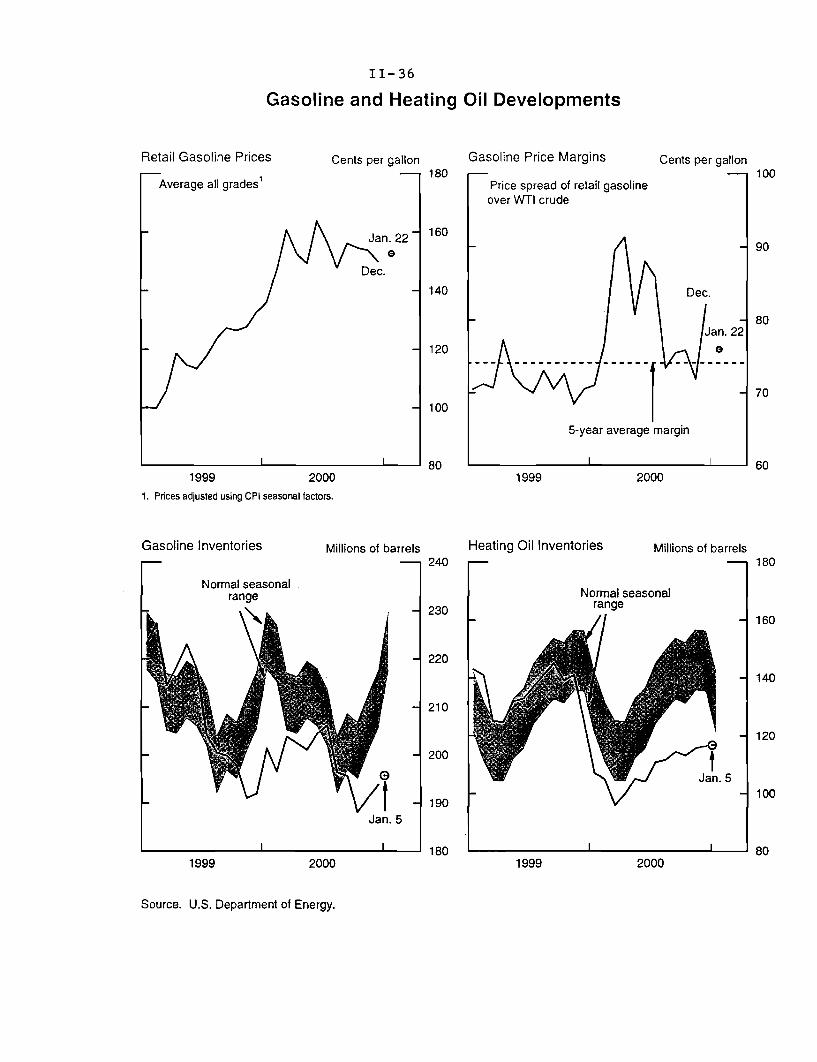
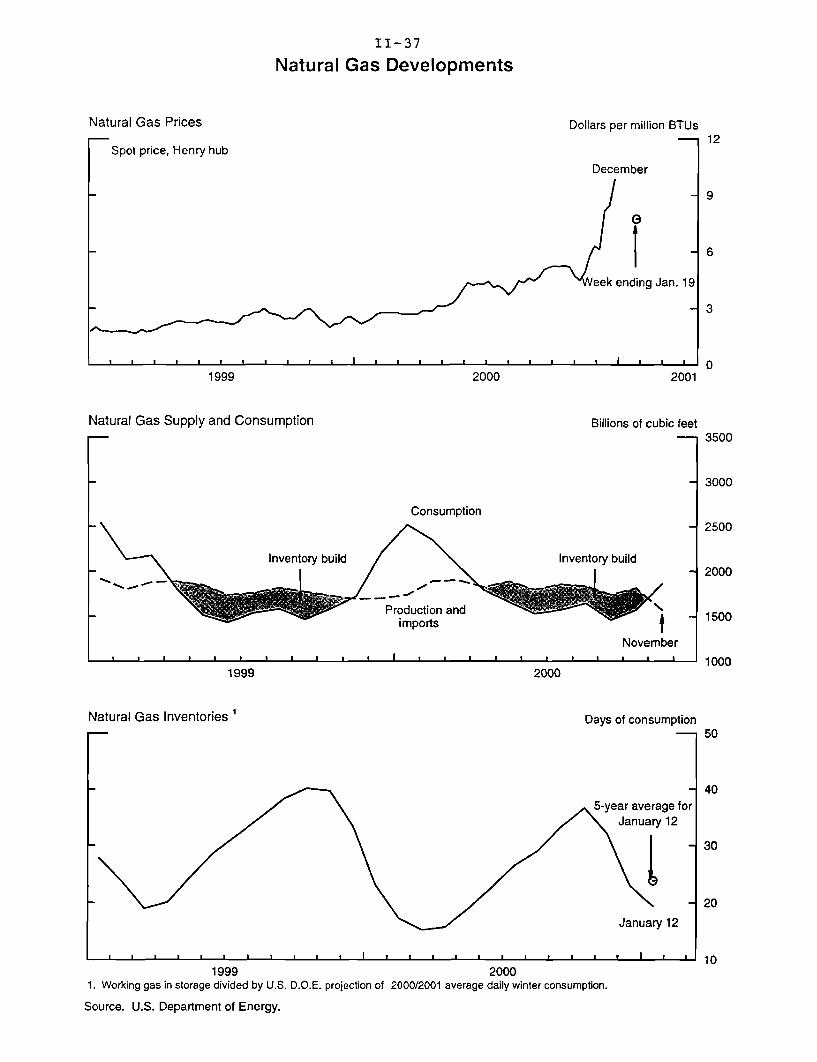
Retail energy price inflation was mild in November and December-maskingsizable swings within the components of the energy category. Crude oil prices,although volatile from week to week, have fallen, on balance, from theirNovember highs, contributing to a corresponding decline in the price of gasolinelast month. Although wholesale prices for heating oil have likewise declined inrecent months, retail prices have moved up somewhat, sharply boostingretailers' margins.
Supply-demand balances in natural gas markets have been tightening for thepast year, but dangerously so over the past two months. Spot prices of gas atHenry Hub rose from $2.50 per million Btu in December 1999 to about $5 permillion Btu by October of last year, and prices surged to more than $9 permillion Btu through the first half of January, before falling to about $7 over thepast week or so. The CPI for natural gas rose 4.4 percent in December and wasup nearly 37 percent over the past twelve months. Thus far, only about half ofthe increase in the cost of natural gas appears to have been passed through to theconsumer level; indeed, spot and futures quotes for gas suggest another surge inthe CPI for natural gas in January.
Higher prices of natural gas have raised the cost of generating electricitynationwide-the primary reason for December's 0.5 percent increase in retailelectricity prices.19 Further increases in the electricity CPI are likely in January,for the same reason. In addition, the spectacular problems of California's"deregulated" electricity market are expected to boost the nationwide CPI forelectricity this month; residential rates in California rose between 7 and10 percent in early January.20 Although costs of electricity generation therehave increased markedly with higher natural gas prices, the broader underlyingproblem is insufficient generating capacity to meet the rising demand.
Retail food prices bulged 0.5 percent in December-boosted by sizableincreases in many categories-after having posted no change in November.
19. Both the CPI and the PPI for electricity are calculated from typical residential electriccharges. However, the two indexes differ in timing and coverage. In particular, the PPI reflectsprices early in the month, rather than the full month, and uses a smaller sample of distributingutilities. In addition, there are two intermediate-goods PPIs for electricity-one for thecommercial sector and one for the industrial sector. These indexes also are end-user pricemeasures, capturing prices paid by commercial and industrial users of electricity.
20. California has a weight of roughly 8 percent in the nationwide electricity index, and thussuch an increase would boost the CPI for electricity by about 3/4 percentage point.
II-40
Measures of Core Consumer Price Inflation(12-month change except as noted)
CPI Excluding Food and Energy PCE Excluding Food and Energy
Percent 4r , 4 rPercent
Market-based components
1996 1997 1998 1999 2000 1996 1997 1998 1999 2000
CPI Excluding Food and Energy CPI Services and CommoditiesPercent 4S4
1996 1997 1998 1999 2000
Percent
CPI services ex. energy De.Dec.
CPI commodities ex. food and energy
Dec.
1996 1997 1998 1999 2000
II-41
Over the past twelve months, the CPI for food has risen 2.8 percent, about1 percentage point more than in the year-earlier period; however, the increaseover the past year is only a little above the pace in the core CPI.
The CPI for core commodities declined 0.2 percent in December, pulled downby a decrease in tobacco prices.21 Over the past twelve months, prices of corecommodities have risen 0.6 percent-about 1/2 percentage point more than inthe year-earlier period-reflecting faster inflation rates for durable goods.Computer prices fell a little less rapidly in 2000 than in 1999, and prices ofmotor vehicles accelerated. Most of the acceleration in prices for vehicles wasthe result of more rapid rates of increase for used cars, although new vehicleprices were flat in 2000 after having declined slightly in 1999.
The CPI for non-energy services increased 0.1 percent last month, held down bya drop in the volatile index for lodging-away-from-home. 22 In contrast to thedecline in that component of shelter, owners' equivalent rent and tenants' rentwere up 0.3 percent and 0.4 percent in December respectively. During 2000,prices of non-energy services climbed 3.4 percent, noticeably above their paceof 2.7 percent in the previous year.23 Faster rates of increase in medicalservices, shelter, and a variety of other items contributed to this pickup.
PCE prices are available only through November, and in that month, core PCEprices rose 0.2 percent.24 In November, the twelve-month change in the corewas 1.7 percent, just 0.1 percentage point above its rate in the preceding year.That slight pickup in core PCE inflation is less than that in the core CPI (on acurrent-methods basis) over the comparable period. As we have mentioned inprevious Greenbooks, this pattern largely reflects two factors. First, the non-market components of PCE-which are not included in the CPI-deceleratedover the past year. Second, differences in the source data used to measure
21. According to the BLS, the 3.5 percent decrease in tobacco prices last month reflecteddiscounting on major brands of cigarettes. The dropback in December was somewhat surprisingbecause wholesale prices for cigarettes increased 14 cents per pack in mid-December, in time tohave a partial effect on the CPI for that month. Although the wholesale price rise was offset lastmonth, that increase is likely to pass through to the retail level in the coming months.
22. The U.S. Postal Service increased rates on January 7. Given the small weight of postagein the CPI, the increase in rates will have a minimal effect on the CPI for non-energy services.
23. As we have reported previously, last year the BLS corrected a programming error thataffected owners' equivalent rent and tenants' rent. Although numbers for both 1999 and 2000were affected by the error, the BLS corrected figures only for 2000. Because of thisdiscontinuity, the amount of acceleration in non-energy service prices over the past year isoverstated in the published figures by about 1/4 percentage point.
24. In its final GDP release for the third quarter, BEA revised down core PCE prices to anannual rate of increase of 1.1 percent, compared with a previously reported increase of1.5 percent. Much of that revision was concentrated in the erratic index for bank imputedservice charges, reflecting Call Report data from the FDIC that the BEA receives only in time forthe final GDP release.

II-42
BROAD MEASURES OF INFLATION(4-quarter percent change)
1997 1998 1999 2000Q3 Q3 Q3 Q3
Product prices
GDP chain price index 1.9 1.3 1.4 2.2Less food and energy 2.0 1.4 1.5 2.1
Nonfarm business chain price index 1 2.1 0.8 1.2 1.9
Expenditure prices
Gross domestic purchases chain price index 1.6 0.8 1.7 2.5Less food and energy 1.6 1.1 1.4 1.9
PCE chain price index 1.9 1.1 1.8 2.4Less food and energy 2.0 1.5 1.5 1.6
PCE chain price index - market-based components 1.5 0.9 1.8 2.6Less food and energy 1.5 1.3 1.4 1.8
CPI 2.2 1.6 2.3 3.5Less food and energy 2.3 2.4 2.0 2.5
Current-methods CPI 1.9 1.4 2.3 3.4Less food and energy 2.0 2.2 2.0 2.5
Median CPI 2.9 2.9 2.3 2.9Trimmed mean CPI 2.4 2.0 1.8 2.6
1. Excluding housing.
SURVEYS OF (CPI) INFLATION EXPECTATIONS(Percent)
University of Michigan
1 year 5 to 10 years ProfessionalActual forecasters
inflation1 Mean 2 Median 2 Mean 3 Median3 (10-year)4
1999-Q1 1.7 3.0 2.6 3.3 2.8 2.3Q2 2.1 3.1 2.7 3.3 2.8 2.5Q3 2.3 3.1 2.7 3.4 2.9 2.5Q4 2.6 3.5 2.9 3.3 2.9 2.5
2000-Q1 3.2 3.6 3.0 3.5 3.0 2.5Q2 3.3 3.5 3.0 3.3 2.8 2.5Q3 3.5 3.6 2.9 3.4 2.9 2.5Q4 3.4 3.8 3.0 3.7 3.0 2.5
July 3.7 3.7 3.0 3.2 2.8Aug. 3.4 3.5 2.7 3.5 2.9Sept. 3.5 3.7 2.9 3.6 3.0 2.5
Oct. 3.4 4.1 3.2 3.7 3.0Nov. 3.4 3.8 2.9 3.6 2.9Dec. 3.4 3.4 2.8 3.7 3.0 2.5
2001-Jan. 4.0 3.0 4.1 3.0
1. CPI; percent change from the same period in the preceding year.2. Responses to the question: By about what percent do you
expect prices to go up, on the average, during the next 12 months?3. Responses to the question: By about what percent per year do you
expect prices to go up, on the average, during the next 5 to 10 years?4. Compiled by the Federal Reserve Bank of Philadelphia.
II-43
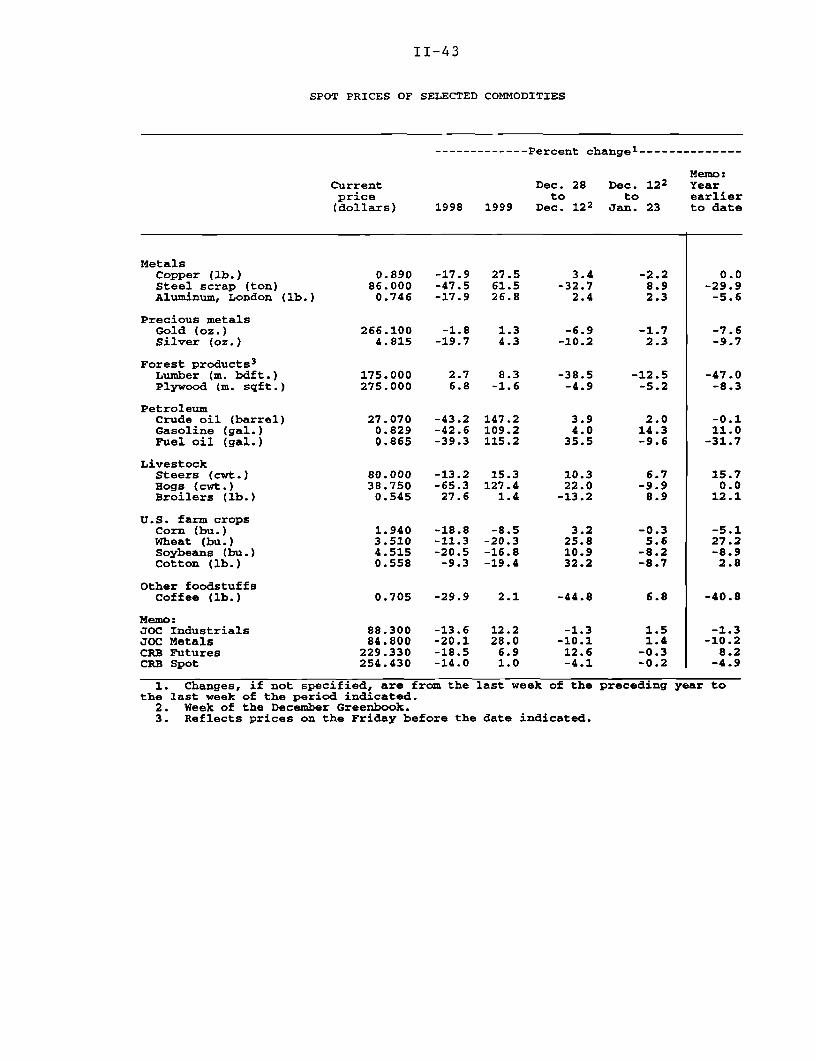
SPOT PRICES OF SELECTED COMMODITIES
------------- Percent change --------------
Memo:Current Dec. 28 Dec. 122 Yearprice to to earlier(dollars) 1998 1999 Dec. 122 Jan. 23 to date
MetalsCopper (lb.) 0.890 -17.9 27.5 3.4 -2.2 0.0Steel scrap (ton) 86.000 -47.5 61.5 -32.7 8.9 -29.9Aluminum, London (lb.) 0.746 -17.9 26.8 2.4 2.3 -5.6
Precious metalsGold (oz.) 266.100 -1.8 1.3 -6.9 -1.7 -7.6Silver (oz.) 4.815 -19.7 4.3 -10.2 2.3 -9.7
Forest products 3
Lumber (m. bdft.) 175.000 2.7 8.3 -38.5 -12.5 -47.0Plywood (m. sqft.) 275.000 6.8 -1.6 -4.9 -5.2 -8.3
PetroleumCrude oil (barrel) 27.070 -43.2 147.2 3.9 2.0 -0.1Gasoline (gal.) 0.829 -42.6 109.2 4.0 14.3 11.0Fuel oil (gal.) 0.865 -39.3 115.2 35.5 -9.6 -31.7
LivestockSteers (cwt.) 80.000 -13.2 15.3 10.3 6.7 15.7Hogs (cwt.) 38.750 -65.3 127.4 22.0 -9.9 0.0Broilers (lb.) 0.545 27.6 1.4 -13.2 8.9 12.1
U.S. farm cropsCorn (bu.) 1.940 -18.8 -8.5 3.2 -0.3 -5.1Wheat (bu.) 3.510 -11.3 -20.3 25.8 5.6 27.2Soybeans (bu.) 4.515 -20.5 -16.8 10.9 -8.2 -8.9Cotton (lb.) 0.558 -9.3 -19.4 32.2 -8.7 2.8
Other foodstuffsCoffee (lb.) 0.705 -29.9 2.1 -44.8 6.8 -40.8
Memo:JOC Industrials 88.300 -13.6 12.2 -1.3 1.5 -1.3JOC Metals 84.800 -20.1 28.0 -10.1 1.4 -10.2CRB Futures 229.330 -18.5 6.9 12.6 -0.3 8.2CRB Spot 254.430 -14.0 1.0 -4.1 -0.2 -4.9
1. Changes, if not specified, are from the last week of the preceding year tothe last week of the period indicated.
2. Week of the December Greenbook.3. Reflects prices on the Friday before the date indicated.

II-44
Commodity Price Measures
Journal of Commerce IndexRatio scale, 1996=100
Total
Metals7 - 92
75- - 90
65 - 86
82
55 78Nov. Dec. Jan.2000 2001
CRB Spot IndustrialsRatio scale, 1967=100
CRB FuturesRatio scale, 1967=100
S 1 1 1 1 1 Ja n
.2 3
1986 1988 1990 1992 1994 1996 1998 2000
S - 263260
244Nov. Dec. Jan.2000 2001
CRB Futures
I -, I I 210210 Nov. Dec. Jan.2000 2001
190
170
Note. Weekly data, Tuesdays. Vertical lines on small panels indicate week of last Greenbook. The Journal of Commerce index is based almostentirely on industrial commodities, with a small weight given to energy commodities, and the CRB spot price index consists entirely of industrialcommodities, excluding energy. The CRB futures index gives about a 60 percent weight to food commodities and splits the remaining weight roughlyequally among energy commodities, industrial commodities, and precious metals. Copyright for Joumal of Commerce data is held by CIBCR, 1994.
S91
88
-L- 841.2001
II-45
certain prices-particularly for medical care services-held down theacceleration in core PCE prices relative to that in the CPI.
In terms of capital goods, the PPI for that category increased 0.2 percent inDecember following no change in November. Over the past year, the rate ofincrease in capital goods prices has picked up about 1 percentage point, owingto faster rates of increase for a range of items, including light trucks, civilianaircraft, oil and gas field equipment, and machine tools. In addition, computerprices did not fall as rapidly during 2000 as they did in 1999. However, with thesoftening in demand for computers and other high-tech products at the end oflast year, prices appear poised to decline more rapidly; indeed, the PPI forcomputers posted a substantial 2 percent decline in December. The PPI forapplications software-which is used as source data for estimating real pre-packaged software spending in the NIPAs-has been erratic recently.Following a sharp rise in early 2000, prices have dropped back considerably inthe past two months, suggesting a flattening of the trend.25
At earlier stages of processing, prices have been mixed since the time of the lastGreenbook. Although the Journal of Commerce index of industrial materialsprices was up 1.5 percent-with higher prices registered for steel scrap andsome petroleum products-prices of some other metals, textiles, and some forestproducts have moved lower.
Inflation expectations have remained subdued. The median response to theMichigan survey of one-year-ahead inflation expectations was 3.0 percent inearly January, about the same as the rate that prevailed last year. Longer-termexpectations-as measured by the five- to ten-year median expectations-were3.0 percent in this month's preliminary survey, similar to the pace registered inrecent quarters.
Labor CostsCompensation per hour, as measured by the ECI, rose at an annual rate of3.0 percent in the fourth quarter. Although this series can be volatile on aquarterly basis, the increase last quarter was noticeably below the paceregistered earlier last year. Wages and salaries were also up at a 3.0 percent rate
25. Interpreting the recent movements in the PPI for applications software is complicated bythe somewhat bizarre four-month lagged revision procedure used by the BLS for the PPI.Consider the revisions last month. With the release of the December figures, the BLS revisedthe level of the PPI down in August (four months earlier) to reflect late reports from companies.In addition, the December PPI was set at its best level, reflecting the new informationincorporated for August. However, because the BLS does not adjust the levels of theintervening months-September, October, and November-the pattern of monthly percentchanges for recent months is confounded. Although this revision procedure is used for everycomponent of the PPI, its effects are particularly acute for software prices because revisions tendto be large in that component.
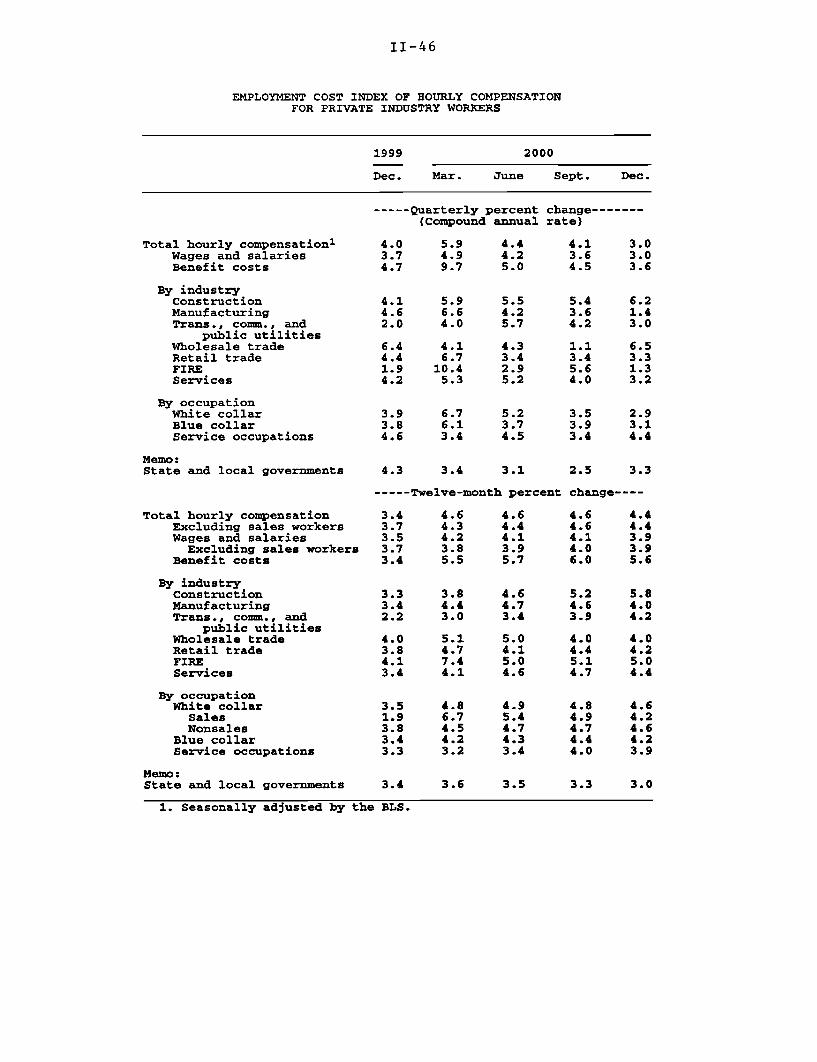
II-46
EMPLOYMENT COST INDEX OF HOURLY COMPENSATIONFOR PRIVATE INDUSTRY WORKERS
1999 2000
Dec. Mar. June Sept. Dec.
----- Quarterly percent change-------(Compound annual rate)
Total hourly compensation1Wages and salariesBenefit costs
By industryConstructionManufacturingTrans., comm., and
public utilitiesWholesale tradeRetail tradeFIREServices
By occupationWhite collarBlue collarService occupations
Memo:State and local governments
Total hourly compensationExcluding sales workersWages and salaries
Excluding sales workersBenefit costs
By industryConstructionManufacturingTrans., comm., and
public utilitiesWholesale tradeRetail tradeFIREServices
By occupationWhite collar
SalesNonsales
Blue collarService occupations
Memo:State and local governments
4.0 5.93.7 4.94.7 9.7
5.9 5.56.6 4.24.0 5.7
4.16.7
10.45.3
6.7 5.26.1 3.73.4 4.5
3.4 3.1
4.1 3.03.6 3.04.5 3.6
5.4 6.23.6 1.44.2 3.0
1.1 6.53.4 3.35.6 1.34.0 3.2
3.5 2.93.9 3.13.4 4.4
2.5 3.3
----- Twelve-month percent change----
4.64.34.23.85.5
4.64.44.13.95.7
3.3 3.8 4.63.4 4.4 4.72.2 3.0 3.4
4.0 5.1 5.03.8 4.7 4.14.1 7.4 5.03.4 4.1 4.6
5.2 5.84.6 4.03.9 4.2
4.0 4.04.4 4.25.1 5.04.7 4.4
4.95.44.74.33.4
3.5
4.64.24.64.23.9
3.0
1. Seasonally adjusted by the BLS.
II-47
last quarter, held down by small increases in manufacturing and in finance,insurance, and real estate (FIRE), where commissions can swing widely. Inboth of these areas, weakness in activity likely contributed to the step-down inwage gains. Benefits rose at a 3.6 percent rate last quarter following largerincreases in the past several quarters. 26 Health insurance costs rose at a6 percent rate, and nonproduction bonuses were up at a 3-3/4 percent rate.
Over the twelve months ending in December, the ECI for hourly compensationincreased 4.4 percent, up 1 percentage point from a year ago. For wages andsalaries, last year's increase was 3.9 percent, about 1/2 percentage point abovethat in 1999. In recent years, changes in overall wages and salaries have beenheavily influenced by swings in the FIRE component that were related to thewave of mortgage refinancings in 1998. Excluding FIRE, the trends in wagesand salaries are somewhat smoother in recent years, and twelve-month changesin this category appear to have moderated in the past couple of quarters.Benefits were up 5.6 percent in 2000, pushed up by faster rates of increase formost major components of benefits than in 1999. Given cost pressures on healthcare, available evidence suggests further sizable increases in this category ofbenefits in 2001.27
Although other compensation measures accelerated more in the fourth quarterthan did the ECI, the various measures of compensation all showed a similarpattern of acceleration between 1999 and 2000. Average hourly earnings ofproduction or nonsupervisory workers-which increased 0.4 percent inDecember and 0.6 percent in November-were up 4.2 percent over the twelvemonths ending in December, about 3/4 percentage point above their pace in1999. Although fourth-quarter data for the Productivity and Cost measure ofcompensation per hour are not yet available, we estimate that P&C hourlycompensation rose at an annual rate of 6-1/2 percent in the fourth quarter and5-1/2 percent over the past year, compared with an increase of 4-3/4 percent in1999.28
26. With the exception of health insurance, benefits detail is unpublished and is provided tous by the BLS on a confidential basis.
27. A recent survey by Mercer/Foster-Higgins points to faster rates of increase inhealth-benefits costs this year than seen last year. Towers-Perrin expects to release its survey ofhealth-benefits costs next week.
28. Our projection for fourth-quarter P&C hourly compensation reflects information onaverage hourly earnings through December and the monthly readings on wage and salary incomefrom the NIPAs through November.

II-48
Employment Cost Index
12-month percent change
1989 1990 1991 1992 1993 1994 1995 1996 1997 1998 1999 2000
Wages and Salaries Compensation Per Hour12-month percent change 12-month percent change
r 78 7
Total
SE. F ec.
.. , Ex. FIRE *'
P&C
I *
L' /r;
I I I I I I
2000 1996
Private Industry Workers
I I I I I I
1996 1998 1998 2000
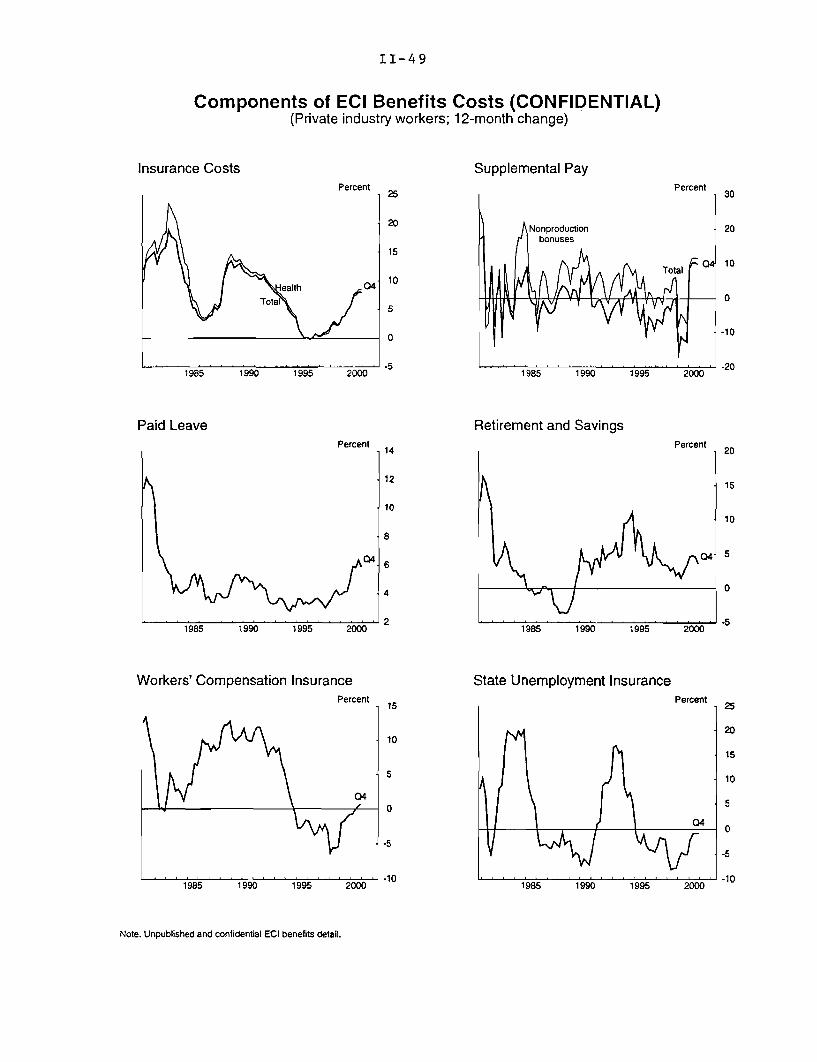
II-49
Components of ECI Benefits Costs (CONFIDENTIAL)(Private industry workers; 12-month change)
Insurance Costs Supplemental PayPercent
Paid LeavePercent
Percent
Retirement and SavingsPercent
Workers' Compensation InsurancePercent
04
1985 1990 1995 2000
Note. Unpublished and confidential ECI benefits detail.
1985 1990
State Unemployment
1995
InsurancePercent
J ____ 19 \ 04
1985 1990 1995 2000
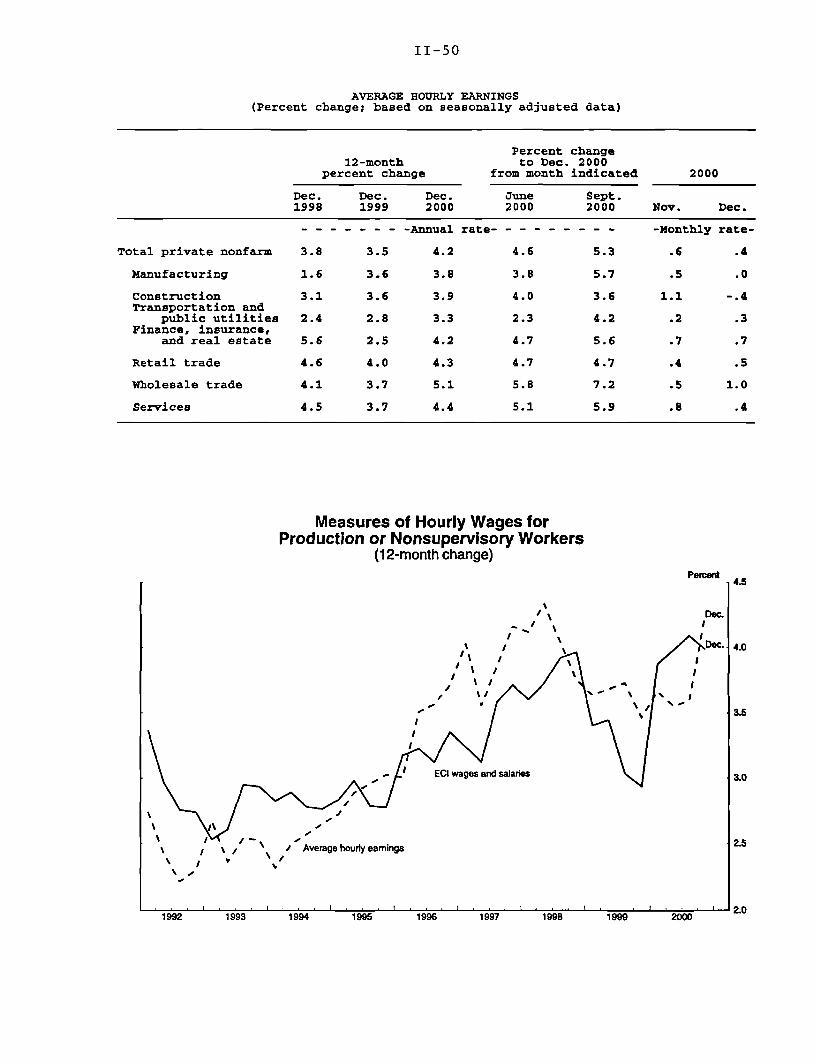
II-50
AVERAGE HOURLY EARNINGS(Percent change; based on seasonally adjusted data)
Percent change12-month to Dec. 2000
percent change from month indicated 2000
Dec. Dec. Dec. June Sept.1998 1999 2000 2000 2000 Nov. Dec.
-- - - - - - -Annual rate- - - - - - - - - -Monthly rate-
Total private nonfarm 3.8 3.5 4.2 4.6 5.3 .6 .4
Manufacturing 1.6 3.6 3.8 3.8 5.7 .5 .0
Construction 3.1 3.6 3.9 4.0 3.6 1.1 -.4Transportation and
public utilities 2.4 2.8 3.3 2.3 4.2 .2 .3Finance, insurance,
and real estate 5.6 2.5 4.2 4.7 5.6 .7 .7
Retail trade 4.6 4.0 4.3 4.7 4.7 .4 .5
Wholesale trade 4.1 3.7 5.1 5.8 7.2 .5 1.0
Services 4.5 3.7 4.4 5.1 5.9 .8 .4
Measures of Hourly Wages forProduction or Nonsupervisory Workers
(12-month change)
I'/
~- '
/ l II I
/
Percent45
Dec. 4
I
I
35
3.0
2.5
ECI wages and salaries
I \, / / Average hourly earnings\ I /
1992''~ " ' '' ' 199 194 195 196 197 998199 001992 1993 1994 1995 1996 1997 1998 1999 2000

Domestic FinancialDevelopments
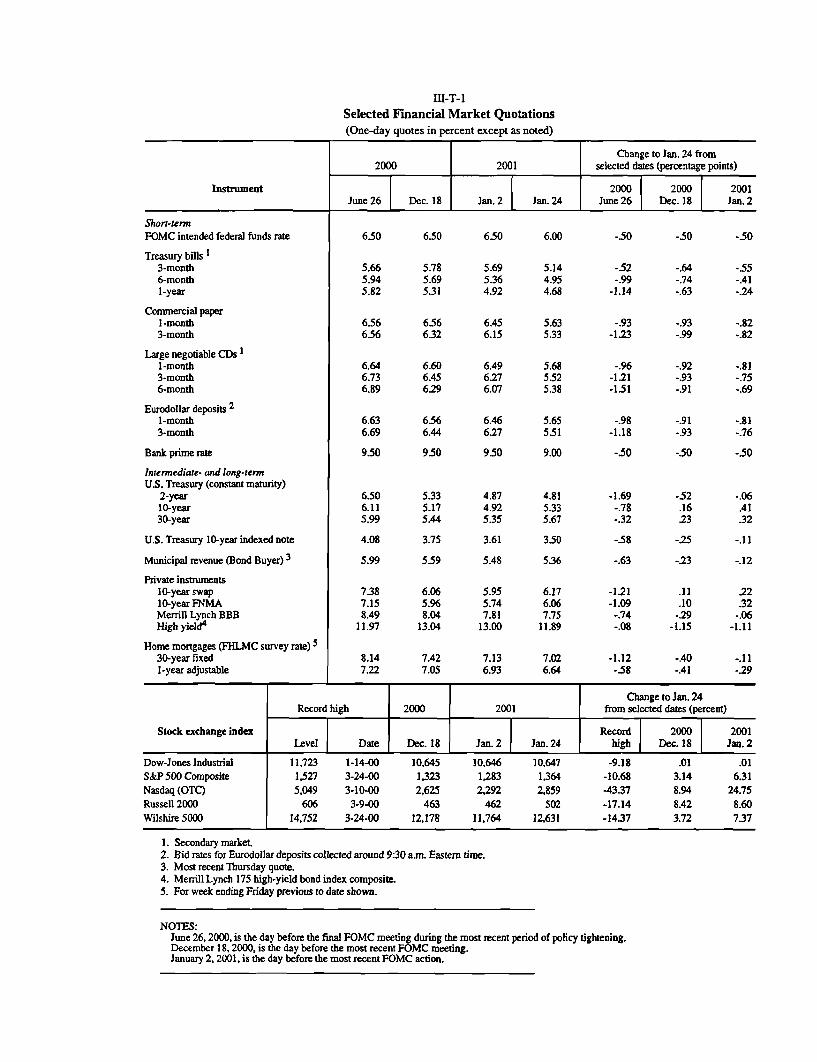
III-T-1Selected Financial Market Quotations(One-day quotes in percent except as noted)
Change to Jan. 24 from2000 2001 selected dates (percentage points)
Instrument 2000 2000 2001June 26 Dec. 18 Jan. 2 Jan. 24 June 26 Dec. 18 Jan. 2
Short-termFOMC intended federal funds rate
Treasury bills 13-month6-month1-year
Commercial paper1-month3-month
Large negotiable CDs1-month3-month6-month
Eurodollar deposits 21-month3-month
Bank prime rate
Intermediate- and long-termU.S. Treasury (constant maturity)
2-year10-year30-year
U.S. Treasury 10-year indexed note
Municipal revenue (Bond Buyer) 3
Private instruments10-year swap10-year FNMAMerrill Lynch BBBHigh yield4
Home mortgages (FHLMC survey rate) 5
30-year fixed1-year adjustable
6.50
5.665.945.82
6.566.56
6.646.736.89
6.636.69
9.50
6.506.115.99
4.08
5.99
7.387.158.49
11.97
8.147.22
6.50
5.785.695.31
6.566.32
6.606.456.29
6.566.44
9.50
5335.175.44
3.75
5.59
6.065.968.04
13.04
7.427.05
6.50
5.695.364.92
6.456.15
6.496.276.07
6.466.27
9.50
4.874.925.35
3.61
5.48
5.955.747.81
13.00
7.136.93
-50 -.50 -.50
-.52-.99
-1.14
5.63 -.935.33 -1.23
-.96-1.21-1.51
-.98-1.18
-.50
-.93 -.82-.99 -.82
-.91 -.81-.93 -.76
-.50 -.50
-1.69 -52 -.06-.78 .16 .41-.32 23 .32
-.58 -.25 -.11
-.63 -.23 -.12
-.40 -.11-.41 -.29
Change to Jan. 24Record high 2000 2001 from selected dates (percent)
Stock exchange index Record 2000 2001Level Date Dec. 18 Jan. 2 Jan. 24 high Dec. 18 Jan. 2
Dow-Jones Industrial 11,723 1-14-00 10,645 10,646 10,647 -9.18 .01 .01S&P 500 Composite 1,527 3-24-00 1,323 1,283 1,364 -10.68 3.14 6.31Nasdaq (OTC) 5,049 3-10-00 2,625 2,292 2,859 -43.37 8.94 24.75Russell 2000 606 3-9-00 463 462 502 -17.14 8.42 8.60Wilshire 5000 14,752 3-24-00 12,178 11,764 12,631 -14.37 3.72 7.37
1. Secondary market2. Bid rates for Eurodollar deposits collected around 9:30 a.m. Eastern time.3. Most recent Thursday quote.4. Merrill Lynch 175 high-yield bond index composite.5. For week ending Friday previous to date shown.
NOTES:June 26, 2000, is the day before the final FOMC meeting during the most recent period of policy tightening.December 18, 2000, is the day before the most recent FOMC meeting.January 2, 2001, is the day before the most recent FOMC action.
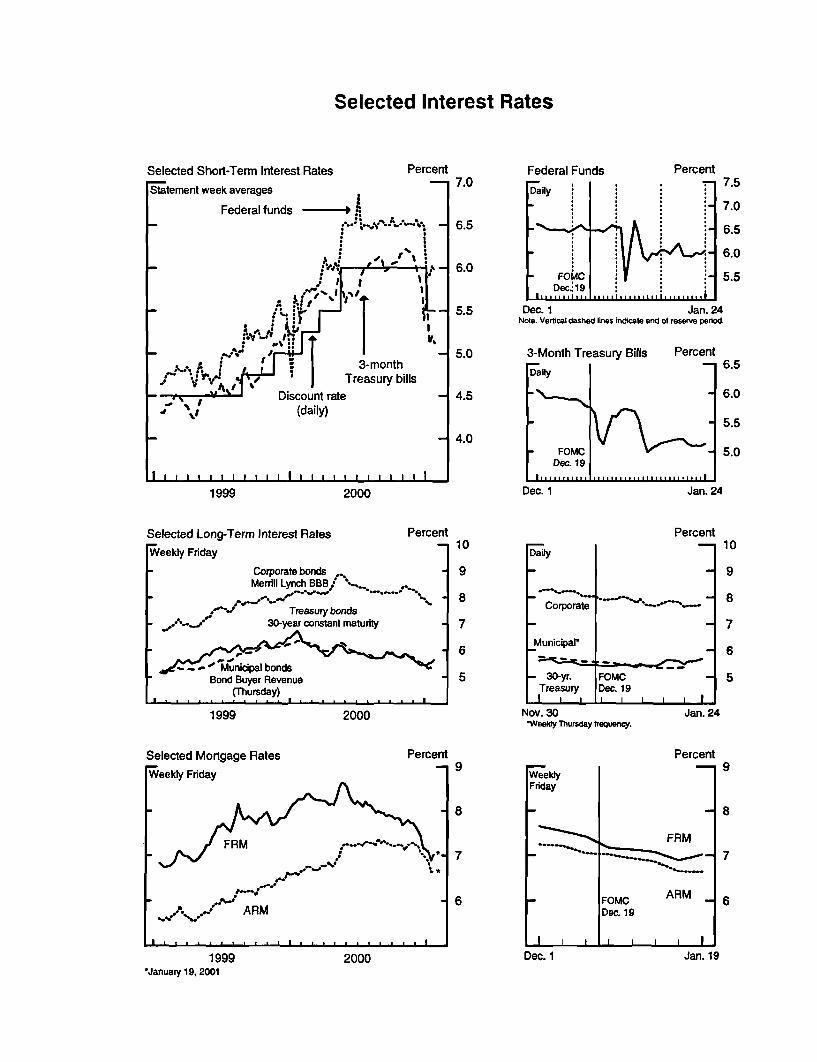
Selected Interest Rates
Selected Short-Term Interest RatesStatement week averages
Federal funds -
*.
FI wek avrAgL
3-monthTreasury bills
(daily)
I I 11 ,11,111I
1999
I l 6 I tI i i III
2000
Selected Long-Term Interest RatesFWeekly Friday
Percent Federal FundsDaily
FOMCDec 19
.o ....... ...
Percent
...... ...... . .........
5.5 Dec. 1 Jan. 24Note. Vertical dashed lines indicate end of reserve period.
-I 5.0
Percent-1 10
Corporate bondsMerrill Lynch BBB *...
'-/ Treasury bonds- *'.../' 30-year constant maturity
- =- '- / Municipal bondsBond Buyer Revenue
(Thursday)I .• , , , i I , , , I l . . I
1999 2000
Selected Mortgage Rates
1999"January 19, 2001
Percent
2000
3-Month Treasury BillsDaily
- FOMCDec. 19
I , . ,,... ..
Dec. 1
Daily
Corporate
Municipar
- 30-yr.TreasuryI . .
WeeklyFriday
Percent
, °,, :..... + , , ,, , I.. W . .... ..........Jan. 24
Percent-i
FOMCDec. 19I I I I l I
Nov. 30"Weekly Thursday frequency.
Dec. 1
Jan. 24
Percent-1 9
FRM
FOMCDec. 19
ARM
I I
Jan. 19
................................... iii
I I
I I
.
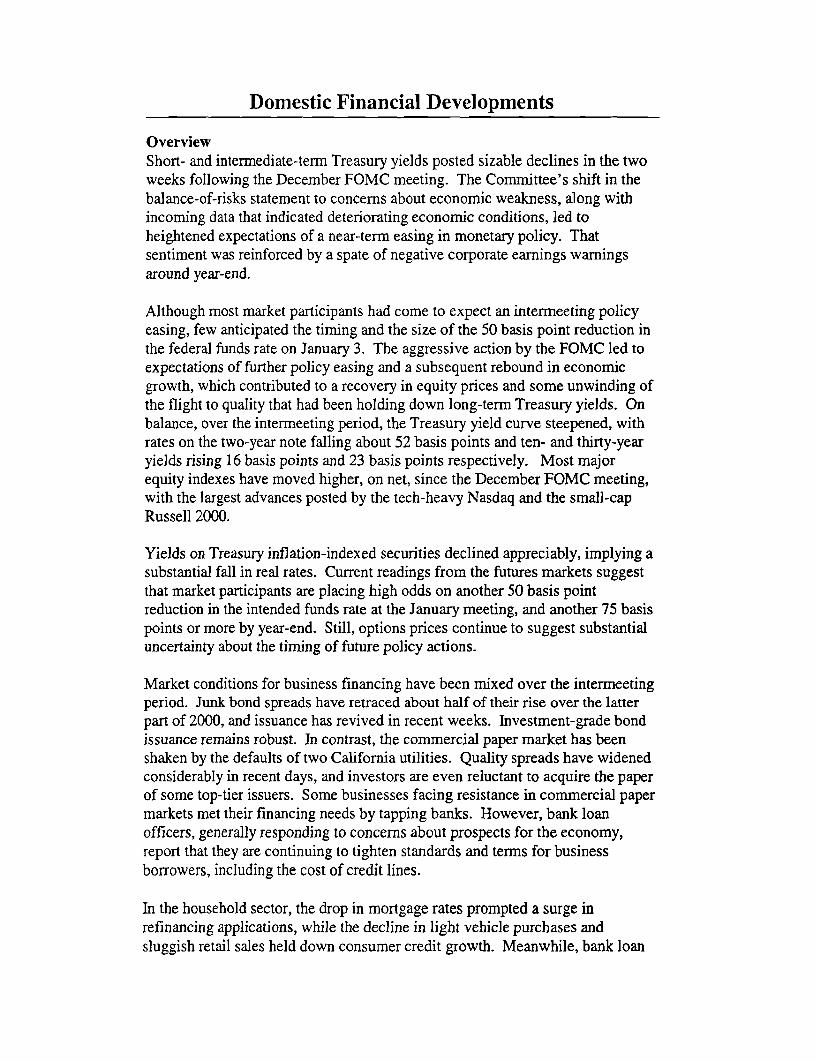
Domestic Financial Developments
OverviewShort- and intermediate-term Treasury yields posted sizable declines in the twoweeks following the December FOMC meeting. The Committee's shift in thebalance-of-risks statement to concerns about economic weakness, along withincoming data that indicated deteriorating economic conditions, led toheightened expectations of a near-term easing in monetary policy. Thatsentiment was reinforced by a spate of negative corporate earnings warningsaround year-end.
Although most market participants had come to expect an intermeeting policyeasing, few anticipated the timing and the size of the 50 basis point reduction inthe federal funds rate on January 3. The aggressive action by the FOMC led toexpectations of further policy easing and a subsequent rebound in economicgrowth, which contributed to a recovery in equity prices and some unwinding ofthe flight to quality that had been holding down long-term Treasury yields. Onbalance, over the intermeeting period, the Treasury yield curve steepened, withrates on the two-year note falling about 52 basis points and ten- and thirty-yearyields rising 16 basis points and 23 basis points respectively. Most majorequity indexes have moved higher, on net, since the December FOMC meeting,with the largest advances posted by the tech-heavy Nasdaq and the small-capRussell 2000.
Yields on Treasury inflation-indexed securities declined appreciably, implying asubstantial fall in real rates. Current readings from the futures markets suggestthat market participants are placing high odds on another 50 basis pointreduction in the intended funds rate at the January meeting, and another 75 basispoints or more by year-end. Still, options prices continue to suggest substantialuncertainty about the timing of future policy actions.
Market conditions for business financing have been mixed over the intermeetingperiod. Junk bond spreads have retraced about half of their rise over the latterpart of 2000, and issuance has revived in recent weeks. Investment-grade bondissuance remains robust. In contrast, the commercial paper market has beenshaken by the defaults of two California utilities. Quality spreads have widenedconsiderably in recent days, and investors are even reluctant to acquire the paperof some top-tier issuers. Some businesses facing resistance in commercial papermarkets met their financing needs by tapping banks. However, bank loanofficers, generally responding to concerns about prospects for the economy,report that they are continuing to tighten standards and terms for businessborrowers, including the cost of credit lines.
In the household sector, the drop in mortgage rates prompted a surge inrefinancing applications, while the decline in light vehicle purchases andsluggish retail sales held down consumer credit growth. Meanwhile, bank loan
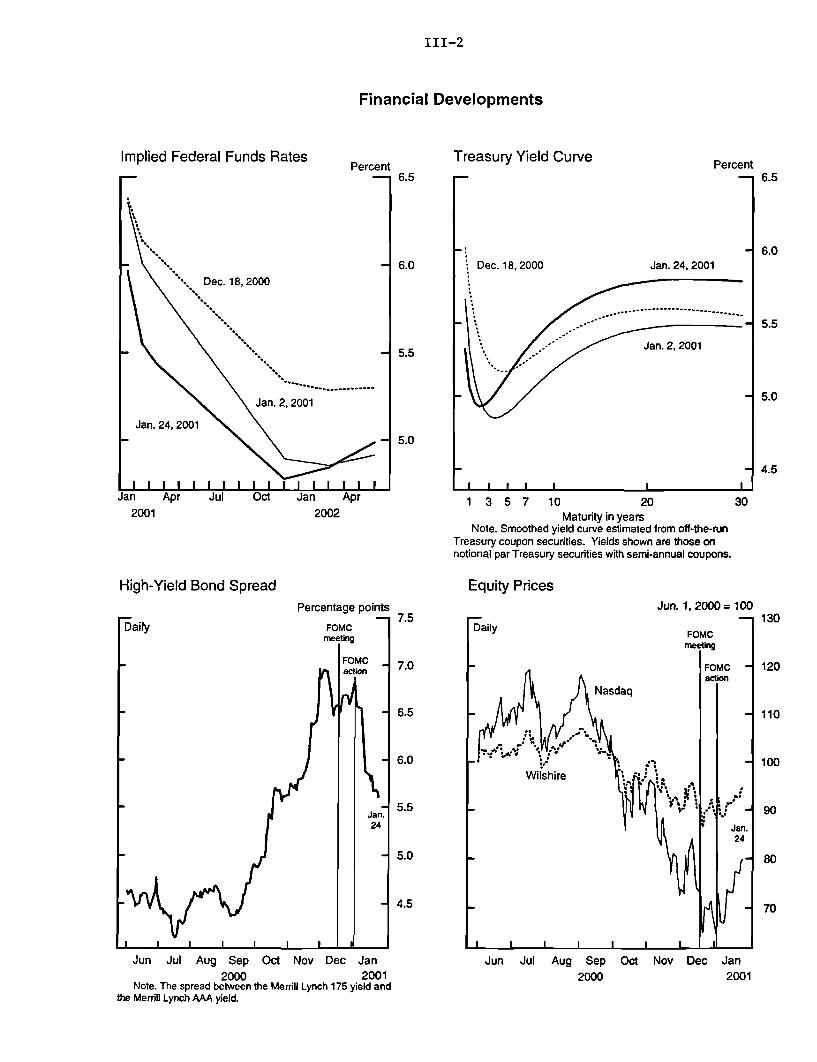
III-2
Financial Developments
Implied Federal Funds RatesPercent
Treasury Yield Curve Percent
2001 2002
High-Yield Bond SpreadPercentage points
FOMC
Dec. 18,2000 Jan. 24,2001
Jan. 2, 2001
I I I I I1 3 5 7 10 20
Maturity in yearsNote. Smoothed yield curve estimated from off-the-run
Treasury coupon securities. Yields shown are those onnotional par Treasury securities with semi-annual coupons.
Equity PricesJun. 1, 2000 = 100
Jun Jul Aug Sep Oct Nov Dec Jan2000 2001
Jun Jul Aug Sep Oct Nov Dec Jan2000 2001
Note. The spread between the Merrill Lynch 175 yield andthe Merrill Lynch AAA yield.

III-3
officers reported that they have begun to tighten standards for consumer loans,though there is little evidence that households are experiencing greater problemsservicing their debt.
The federal government continued to outpace its own expectations for thepaydown of Treasury debt. In contrast, a steady pace of tax-exempt bonds tofinance new capital buoyed offerings in the state and local sector.
Business Finance
Equity analysts made hefty cuts to their estimates of fourth-quarter corporateprofits in response to the continued stream of earnings warnings announced inDecember and early January. However, it appears that much of the bad earningsnews came out early, and most nonfinancial firms are now reporting earningsthat meet or exceed beaten-down forecasts, though by a smaller margin than hasbecome customary in recent years. Based on reports for about half of S&P 500firms, we estimate that earnings per share in the fourth quarter fell about2 percent for the S&P 500 as a whole from its year-earlier level.
Analysts have lowered their estimates of earnings for 2001 as well. Over thepast four weeks, year-ahead earnings for S&P 500 firms were reduced by morethan 2-1/2 percentage points, to roughly 6 percent. Cuts to year-ahead earningsin the past two months have been the largest such monthly adjustments since the1990-91 recession.
With stock prices reacting to mostly negative earnings reports, gross publicequity issuance was a paltry $2 billion in December and dried up completely inearly January as a number of firms cancelled planned offerings. More recently,issuance has shown signs of picking up; about $2 billion of stocks weremarketed after mid-January, with another $2 billion slated for issue by month-end, including some IPOs. Venture capital, which grew rapidly through muchof last year, is estimated to have slowed in December, and anecdotal reportssuggest that private equity investors remain cautious.
Equity retirements from mergers of domestic firms spiked to about $50 billionin December, boosting the fourth-quarter total, as a backlog of previouslyannounced deals was completed. Announcements of new mergers havecontinued at an elevated pace, suggesting that merger-related retirements willremain sizable. In contrast, announcements of share repurchases in the fourthquarter remained well below the average pace of recent years, which might beexpected with the slump in corporate profits.
Weaker earnings prospects and rising debt contributed to further deterioration incredit quality measures for nonfinancial corporations in December. Moody'sdowngraded $140 billion of bonds (thirty-nine issues) in December and
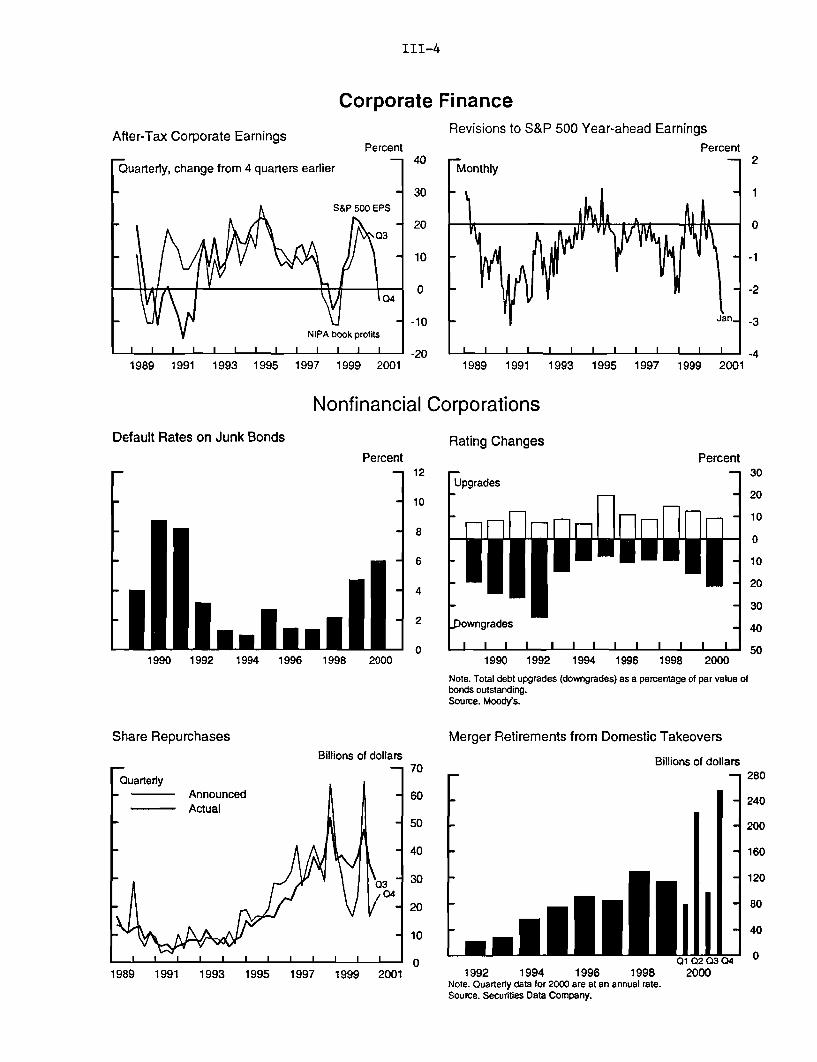
III-4
After-Tax Corporate Earnings
Corporate FinanceRevisions to S&P 500 Year-ahead Earnings
Percent Percent
1989 1991 1993 1995 1997 1999 2001 1989 1991 1993 1995 1997 1999 2001
Nonfinancial CorporationsDefault Rates on Junk Bonds Rating Changes
Percent
1990 1992 1994 1996 1998 2000
Share Repurchases
Quarterly-------- Announced
Actual
Billions of dollars
PercentS- 30
Upgrades-20
.Downgrades 4050
1990 1992 1994 1996 1998 2000
Note. Total debt upgrades (downgrades) as a percentage of par value ofbonds outstanding.Source. Moody's.
Merger Retirements from Domestic Takeovers
Billions of dollars- - 280
S240
200
S160
120
80
40
Q1Q2 Q3041992 1994 1996 1998 2000
Note. Quarterly data for 2000 are at an annual rate.Source. Securities Data Company.
198I I I I I I I I I I I21989 1991 1993 1995 1997 1999 2001
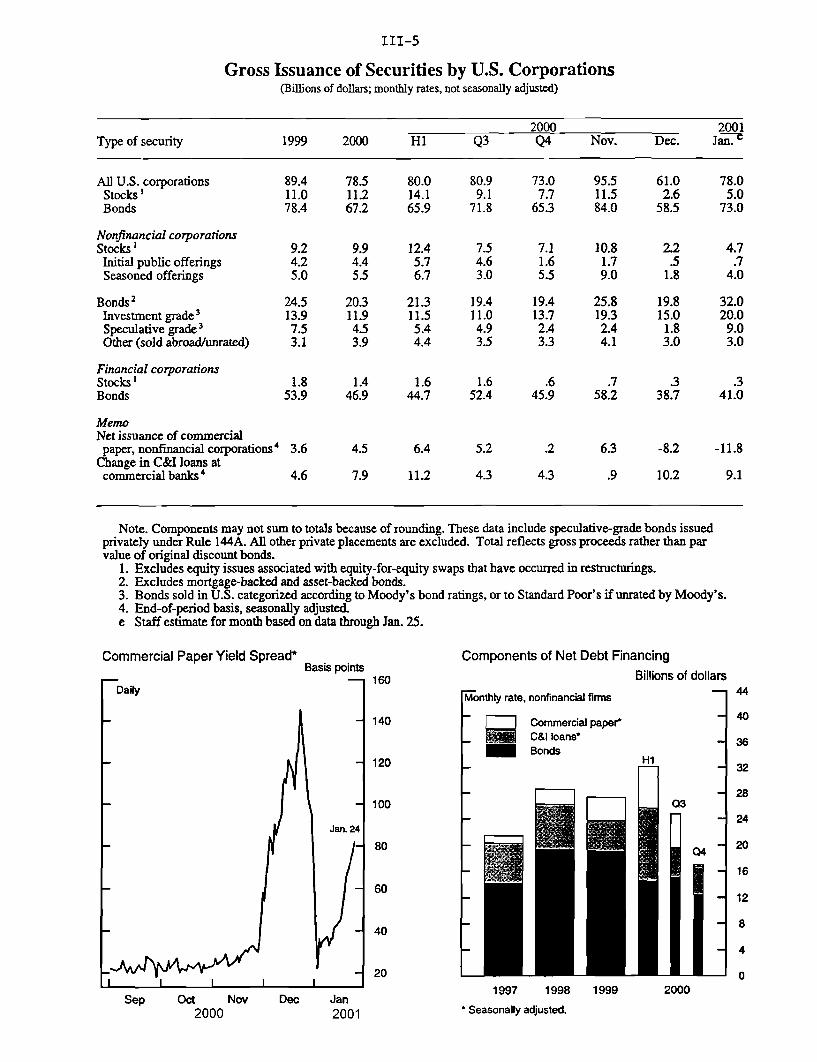
III-5
Gross Issuance of Securities by U.S. Corporations(Billions of dollars; monthly rates, not seasonally adjusted)
2000 2001Type of security 1999 2000 H1 Q3 Q4 Nov. Dec. Jan.e
All U.S. corporations 89.4 78.5 80.0 80.9 73.0 95.5 61.0 78.0Stocks' 11.0 11.2 14.1 9.1 7.7 11.5 2.6 5.0Bonds 78.4 67.2 65.9 71.8 65.3 84.0 58.5 73.0
Nonfinancial corporationsStocks1 9.2 9.9 12.4 7.5 7.1 10.8 2.2 4.7
Initial public offerings 4.2 4.4 5.7 4.6 1.6 1.7 .5 .7Seasoned offerings 5.0 5.5 6.7 3.0 5.5 9.0 1.8 4.0
Bonds 2 24.5 20.3 21.3 19.4 19.4 25.8 19.8 32.0Investment grade 3 13.9 11.9 11.5 11.0 13.7 19.3 15.0 20.0Speculative grade3 7.5 4.5 5.4 4.9 2.4 2.4 1.8 9.0Other (sold abroad/unrated) 3.1 3.9 4.4 3.5 3.3 4.1 3.0 3.0
Financial corporationsStocks1 1.8 1.4 1.6 1.6 .6 .7 .3 .3Bonds 53.9 46.9 44.7 52.4 45.9 58.2 38.7 41.0
MemoNet issuance of commercial
paper, nonfinancial corporations 4 3.6 4.5 6.4 5.2 .2 6.3 -8.2 -11.8Change in C&I loans at
commercial banks 4 4.6 7.9 11.2 4.3 4.3 .9 10.2 9.1
Note. Components may not sum to totals because of rounding. These data include speculative-grade bonds issuedprivately under Rule 144A. All other private placements are excluded. Total reflects gross proceeds rather than parvalue of original discount bonds.
1. Excludes equity issues associated with equity-for-equity swaps that have occurred in restructurings.2. Excludes mortgage-backed and asset-backed bonds.3. Bonds sold in U.S. categorized according to Moody's bond ratings, or to Standard Poor's if unrated by Moody's.4. End-of-period basis, seasonally adjusted.e Staff estimate for month based on data through Jan. 25.
Commercial Paper Yield Spread*
Daily
Sep Oct2000
Basis pointsComponents of Net Debt Financing
Billions of dollars
Monthly rate, nonfinancial firms
Commercial paper*C&I loansBonds
I-I
1997 1998 1999Nov Dec Jan
2001 Seasonally adjusted.
2000
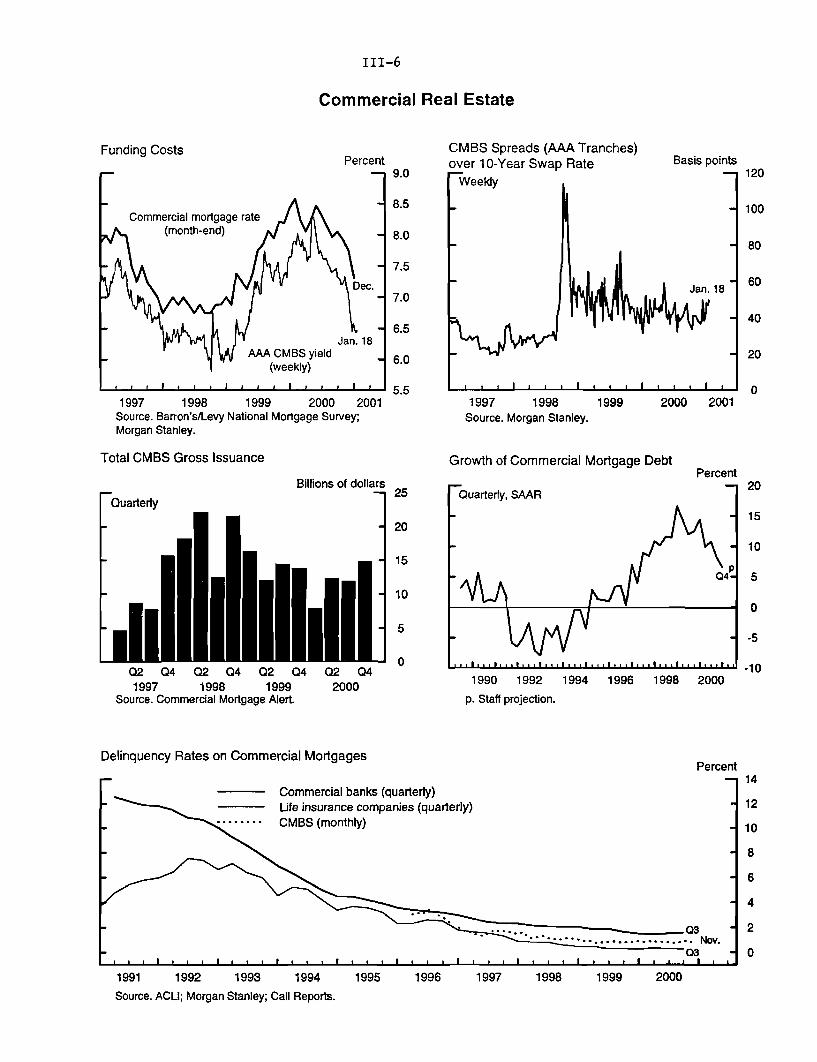
III-6
Commercial Real Estate
Funding CostsPercent
1997 1998 1999 2000 2001Source. Barron's/Levy National Mortgage Survey;Morgan Stanley.
Total CMBS Gross Issuance
Billions of dollars
Quarterly
Q2 Q4 Q2 Q4 Q2 Q4 Q2 Q41997 1998 1999 2000
Source. Commercial Mortgage Alert.
Delinquency Rates on Commercial Mortgages
1997 1998 1999 2000 2001Source. Morgan Stanley.
Growth of Commercial Mortgage DebtPercent
1990 1992 1994 1996 1998 2000
p. Staff projection.
Percent
Commercial banks (quarterly)Life insurance companies (quarterly)CMBS (monthly)
1991 1992 1993 1994 1995 1996 1997 1998 1999 2000
Source. ACLI; Morgan Stanley; Call Reports.
III-7
upgraded $20 billion (eleven issues). Daimler-Chrysler and Xerox accountedfor about $100 billion of the downgrades. For 2000 as a whole, the debt ofdowngraded firms exceeded that of upgraded firms by a margin of two to one.The rate of junk bond defaults was about 6 percent in 2000, up substantiallyfrom 1999 but below the levels recorded during the early 1990s.
In mid-January, the debt of the California utilities, PG&E and SouthernCalifornia Edison, was downgraded to junk status. These firms defaulted onsome of their bonds and commercial paper after midmonth because revenuesfrom regulated retail rates have not been sufficient to meet higher wholesaleenergy prices. The defaults have had few spillover effects in the bond market,but they have contributed to skittishness among commercial paper investors.Spreads of thirty-day A2/P2 paper over A1/P1 paper have ballooned to morethan 80 basis points in recent days. Commercial paper outstanding contractedsharply in January, and new issues were concentrated at shorter maturities asinvestors remain extremely reluctant to buy longer-term issues of even top tierfirms.
Gross bond offerings in December totaled nearly $20 billion, in line with themonthly average in 2000. Issuance picked up smartly in January and is on trackto post the highest monthly total since May 1999. Although all offerings inDecember were from investment-grade companies, the junk bond market hasshown renewed vigor since the intermeeting rate cut. So far in January, ahandful of junk-rated telecom and high-tech companies have issued more than$6-1/2 billion dollars, eclipsing the total amount issued in November andDecember combined.
In the commercial mortgage market, yields on AAA-rated commercial-mortgage-backed securities (CMBS) declined over the intermeeting period instep with rates on comparable ten-year swaps, leaving spreads in line with thoseof the past two years. CMBS issuance in the fourth quarter was above theaverage pace of the first three quarters of last year, but issuance for 2000 as awhole was about 20 percent below that of 1999. Growth of commercialmortgage debt from all sources is estimated to have slowed further to an annualrate of about 6-1/2 percent in the fourth quarter. While available data show thatdelinquency rates on commercial mortgages remain at historically low levels,bank loan officers report that they continue to tighten standards for such loans.
Household FinanceThe value of household assets relative to disposable income continued to declinein the fourth quarter, owing to the drop in equity prices, and has now retracedabout a quarter of the run-up since 1995. Available data indicate that householddebt growth remained brisk in the fourth quarter, with the 8-1/4 percent pacejust under the 8-3/4 percent registered for the year as a whole. Strong demandfor home mortgages, at least partially attributable to earlier declines in mortgage
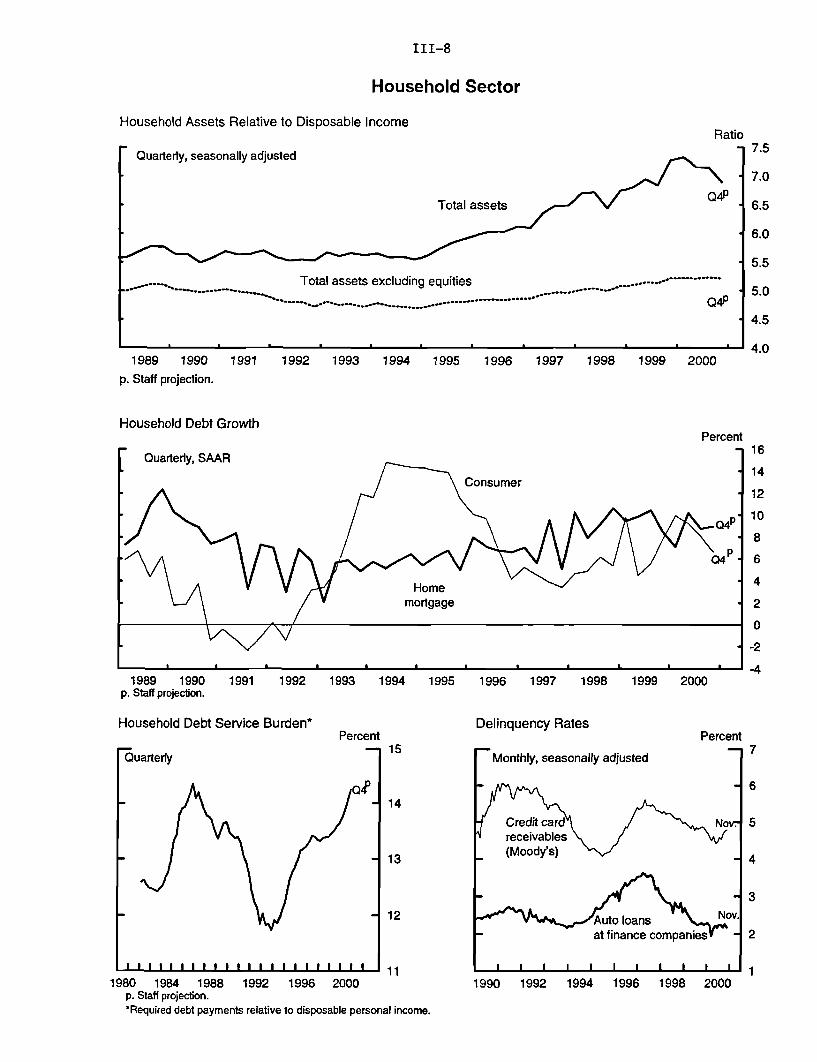
III-8
Household Sector
Household Assets Relative to Disposable IncomeRatio
Quarterly, seasonally adjusted
Total assets
....._.. . .Total assets excluding equities ......---- ".." - -- --. . ---.. . . . .. . . . . .... ................. .... . . . . . . . . . . . Q 4 P
1989 1990 1991 1992 1993 1994 1995 1996 1997 1998 1999 2000
p. Staff projection.
Household Debt GrowthPercent
1989 1990 1991 1992 1993 1994 1995 1996 1997 1998 1999 2000p. Staff projection.
Household Debt Service Burden* Delinauencv RatesPercent
Quarterly 15
- 14
- 13
- 12
I a I I I * eI I I I I I I I I I I 111980 1984 1988 1992 1996 2000
p. Staff projection."Required debt payments relative to disposable personal income.
Percent
1990 1992 1994 1996 1998 2000
I f
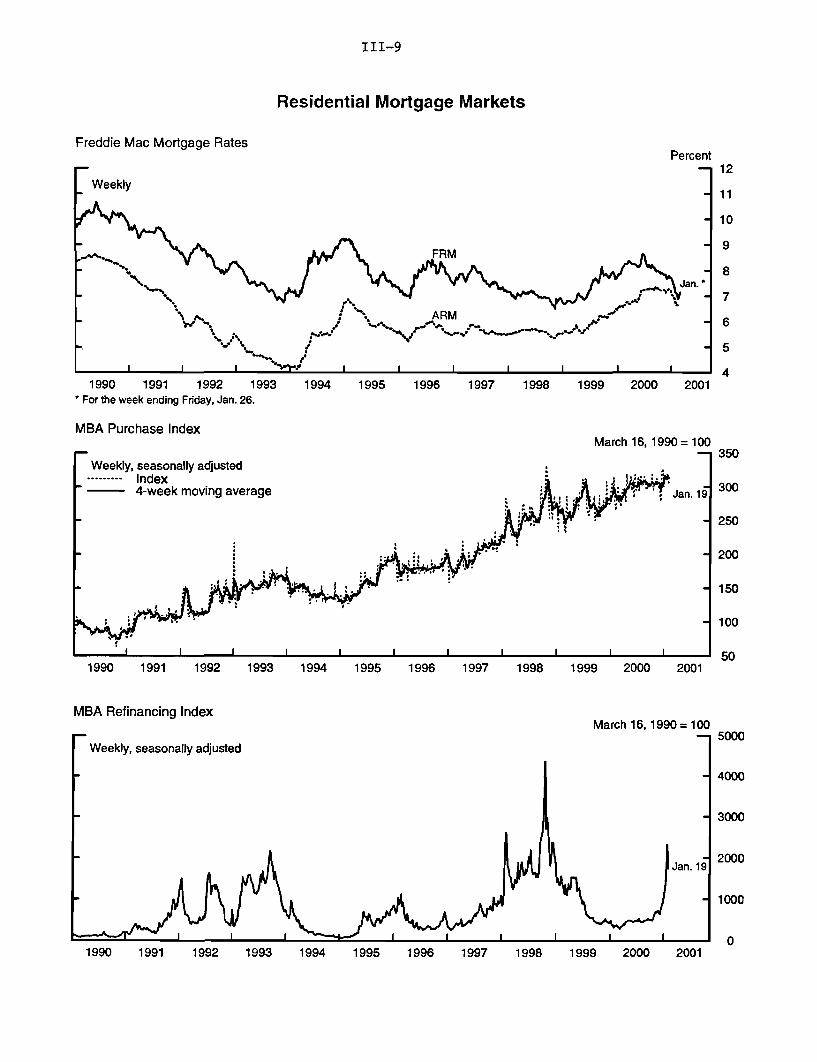
III-9
Residential Mortgage Markets
Freddie Mac Mortgage RatesPercent
1990 1991 1992 1993 1994 1995 1996 1997 1998 1999 2000 2001* For the week ending Friday, Jan. 26.
MBA Purchase IndexMarch 16, 1990 = 100
Weekly, seasonally adjusted.... Indexk m g a e4-week moving average I, . A,. -i. Jan. 19
1990 1991 1992 1993 1994 1995 1996 1997 1998 1999 2000 2001
MBA Refinancing Index
F Weekly, seasonally adjusted
March 16, 1990 = 100- 5000
S4000
-3000
I Jan.19 2000
- 1000
1990 1991 1992 1993 1994 1995 1996 1997 1998 1999 2000 2001

III-10
Treasury and Agency Finance
Treasury Financing(Billions of dollars)
2000Item
Q2 Q3 Q4 Oct. Nov. Dec.
Total surplus, deficit (-) 211.8 60.4 -2.3 -11.3 -23.7 32.7
Means of financing deficitNet borrowing -189.6 -53.6 -25.1 -29.7 41.3 -36.7
Nonmarketable 5.1 -5.5 1.5 0.9 -0.5 1.1Marketable -194.7 -48.1 -26.6 -30.6 41.8 -37.8
Bills -126.6 -14.1 30.4 2.3 63.4 -35.3Coupons' -57.1 -25.7 -48.2 -28.9 -19.4 0.0Debt buybacks -11.0 -8.2 -8.7 -4.0 -2.2 -2.5
Decrease in cash balance -12.7 4.8 31.6 42.7 -1.4 -9.6
Other2 -9.6 -11.5 -4.2 -1.6 -16.2 13.7
MEMOCash balance, end of period 57.4 52.7 21.1 10.0 11.4 21.1
NOTE. Components may not sum to totals because of rounding.1. Does not include Treasury debt buybacks.2. Direct loan financing, accrued items, checks issued less checks paid, and other transactions.e. Estimated.n.a. Not available.
Net Borrowing of Government-Sponsored Enterprises(Billions of dollars)
2000 2001AgencyAgency Q2 Q3 Q4 Nov. Dec. Jan.*
FHLBs 33.2 12.1 13.8 4.3 13.4 n.a.Freddie Mac 6.3 22.7 n.a. 6.7 n.a. n.a.Fannie Mae 21.0 28.5 35.7 17.6 9.6 n.a.Farm Credit Banks 2.4 1.5 3.1 0.3 2.5 n.a.Sallie Mae -0.8 5.2 3.0 1.0 -4.6 n.a.
MEMOOutstanding noncallablereference and benchmarksecuritiesNotes and bonds 238.6 274.1 313.1 303.1 313.1 322.1Bills 200.0 222.5 235.0 228.0 235.0 249.0
Total 438.6 496.6 548.1 531.1 548.1 571.1
NOTE. Excludes mortgage pass-through securities issued by Fannie Mae and Freddie Mac.* As of January 25, 2001n.a. Not available.

III-11
rates, offset a further decline in the growth of consumer credit, which isestimated to have slowed to a 6-1/2 percent rate-down from 8 percent in thethird quarter.
Measures of household credit quality have been mixed, but they do not suggestsignificant deterioration. Credit card delinquency rates have edged up a bitrecently, while delinquency rates on auto loans at finance companies are aboutunchanged at low levels. Preliminary calculations suggest that the householddebt service burden continued to increase in the fourth quarter and was quiteclose to its twenty-year high of 14-1/2 percent in 1986.
Meanwhile, the lower level of mortgage rates led to a spike in home mortgagerefinancing. The MBA refinancing index more than doubled in the first half ofJanuary but dropped back some last week. As refinancing applications worktheir way through the pipeline, reduced interest rates and longer maturities onthe new mortgages are expected to contribute to a flattening out of the debtservice burden.
Treasury and Agency FinanceThe Treasury paid down about $27 billion in publicly held debt in the fourthquarter, nearly $4 billion more than had been projected at the midquarterrefunding announcement. Buybacks thus far in January are about on pace tomeet the $9 billion total the Treasury targeted for the first quarter.
Measures of market liquidity provided mixed signals during the intermeetingperiod. Bid-ask spreads on ten-, five-, and two-year notes spiked at the end ofthe year but have since returned to levels that are only somewhat elevated.Spreads between on- and off-the-run ten- and thirty-year Treasuries were stableat levels that would not indicate unusually strong demand for liquidity, but thespread for the five-year note was somewhat elevated.
Growth of agency debt remained robust over the intermeeting period. FreddieMac and the Federal Home Loan Banking System issued a combined $10 billionin early January, and Fannie Mae priced about $3 billion in ten- and thirty-yearbonds on January 18. Freddie Mac projected that issuance of domesticReference notes and bonds in 2001 would total $90 billion, up from $58 billionin 2000, and Fannie Mae estimated that 2001 Benchmark coupon issuancewould be at least $75 billion, compared with $77 billion last year.
State and Local Government Finance
Gross offerings of long-term debt by state and local governments totaledroughly $15 billion in December, bringing the fourth-quarter pace to about$17 billion per month, somewhat above the average for the previous threequarters. As was the case for much of the year, issuance in December was
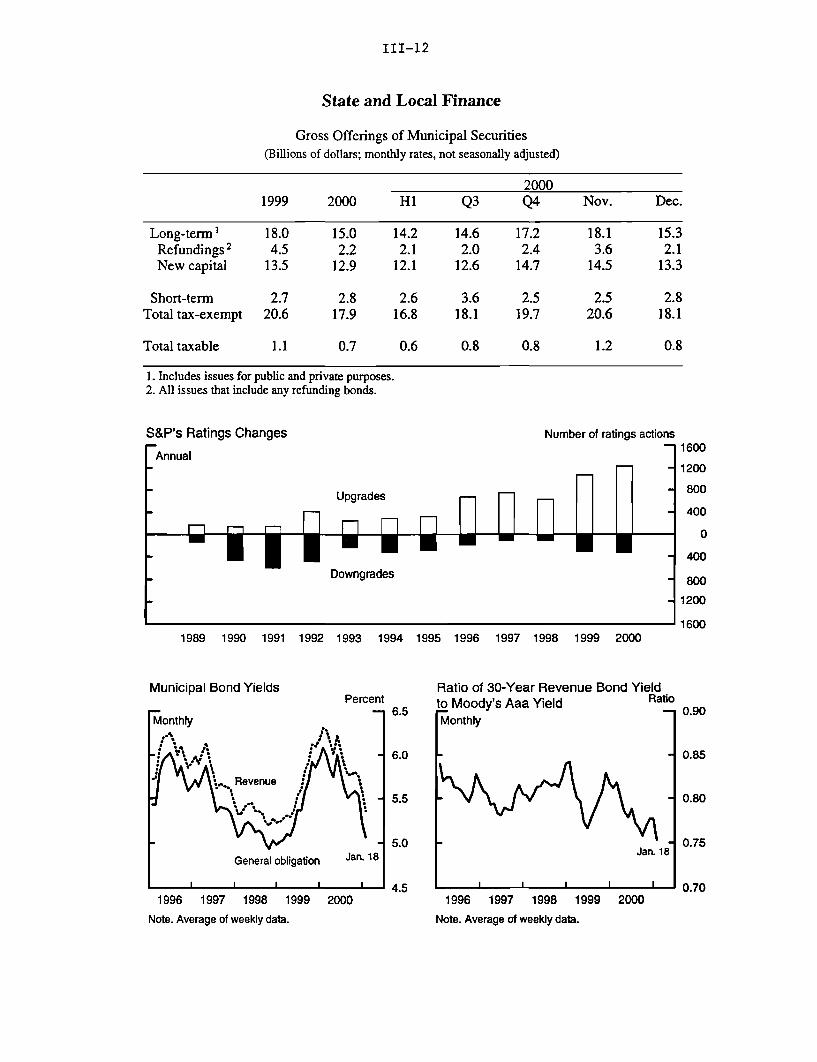
III-12
State and Local Finance
Gross Offerings of Municipal Securities(Billions of dollars; monthly rates, not seasonally adjusted)
20001999 2000 H1 Q3 Q4 Nov. Dec.
Long-term1 18.0 15.0 14.2 14.6 17.2 18.1 15.3Refundings 2 4.5 2.2 2.1 2.0 2.4 3.6 2.1New capital 13.5 12.9 12.1 12.6 14.7 14.5 13.3
Short-term 2.7 2.8 2.6 3.6 2.5 2.5 2.8Total tax-exempt 20.6 17.9 16.8 18.1 19.7 20.6 18.1
Total taxable 1.1 0.7 0.6 0.8 0.8 1.2 0.8
1. Includes issues for public and private purposes.2. All issues that include any refunding bonds.
S&P's Ratings Changes Number of ratings actions
Upgrades
nH n P n
1989 1990 1991 1992 1993 1994 1995 1996 1997 1998 1999 2000
Municipal Bond YieldsPercent
MonthlyAA
:A .- f\ *, .,R vn
-, Revenue \// SS • *e
General obligation Jan. 18
Ratio of 30-Year Revenue Bond Yieldto Moody's Aaa Yield Ratio
Monthly
Jan. 18
1996 1997 1998 1999 2000
Note. Average of weekly data.
1600
1200
800
400
0
400
800
1200
1600
I I I I I I
1996 1997 1998 1999 2000
Note. Average of weekly data.
0.90
0.85
0.80
0.75
0.70

III-13
mainly for new capital. Yields on long-term municipal bonds have fallen about15 to 25 basis points over the intermeeting period, slightly outperformingcorporate bonds of similar maturity, reflecting limited supply as well as thestrong credit quality of state and local governments. As a result, ratios ofmunicipal bond yields to AAA corporate bonds continued to move lower.
While the financial problems at PG&E and Southern California Edison,investor-owned utilities in California, have had little impact on municipal utilitydebt yields, California's general obligation bonds have been put on watch for apossible downgrade. There is considerable uncertainty about how the situationin California will be resolved, but most proposals under consideration involvethe state's issuing debt. The latest proposal receiving attention would allow theutilities limited ability to raise rates to pay off outstanding obligations. A stateagency would be established that would issue revenue bonds and use theproceeds to purchase power under long-term contracts. The utilities would actas agents, distributing electricity and collecting monthly payments for the state.
Bank Credit and MoneyGrowth in bank credit bounced back in December. The advance, in part, owedto a jump in holdings of securities, which rose at a 17 percent annual rate, thefirst increase in five months. Business lending also perked up, following threemonths of little or no growth. Most of the rise in business loans occurred atlarge domestic banks and foreign institutions during the week of December 20and coincided with a large decline in outstanding nonfinancial commercialpaper, suggesting that lower-rated commercial paper issuers may have beendrawing down bank lines. Growth in business loans has remained strong inJanuary, perhaps owing in part to instability in the commercial paper market.
Growth of consumer loans originated by banks also rose last month. A pickupin credit card loans accounted for the increase and was offset in part by a declinein the growth of other consumer loans, likely reflecting slowing motor vehiclesales. Growth of real estate loans at banks slipped some in December andremained well below the increase for the year as a whole. The decelerationowed partly to increased securitization of loans for one- to four-familyproperties by large banks. In the January Senior Loan Officer Survey, a numberof domestic commercial banks reported tightening terms and standards onconsumer loans, but there was no reported change in standards on residentialmortgage loans.
The broad monetary aggregates surged in December and January after weakgrowth in October and November.1 M3 growth was boosted by brisk issuance
1. Data on the monetary aggregates incorporate the annual benchmark and seasonalrevisions. These data are strictly confidential until their release on February 1.
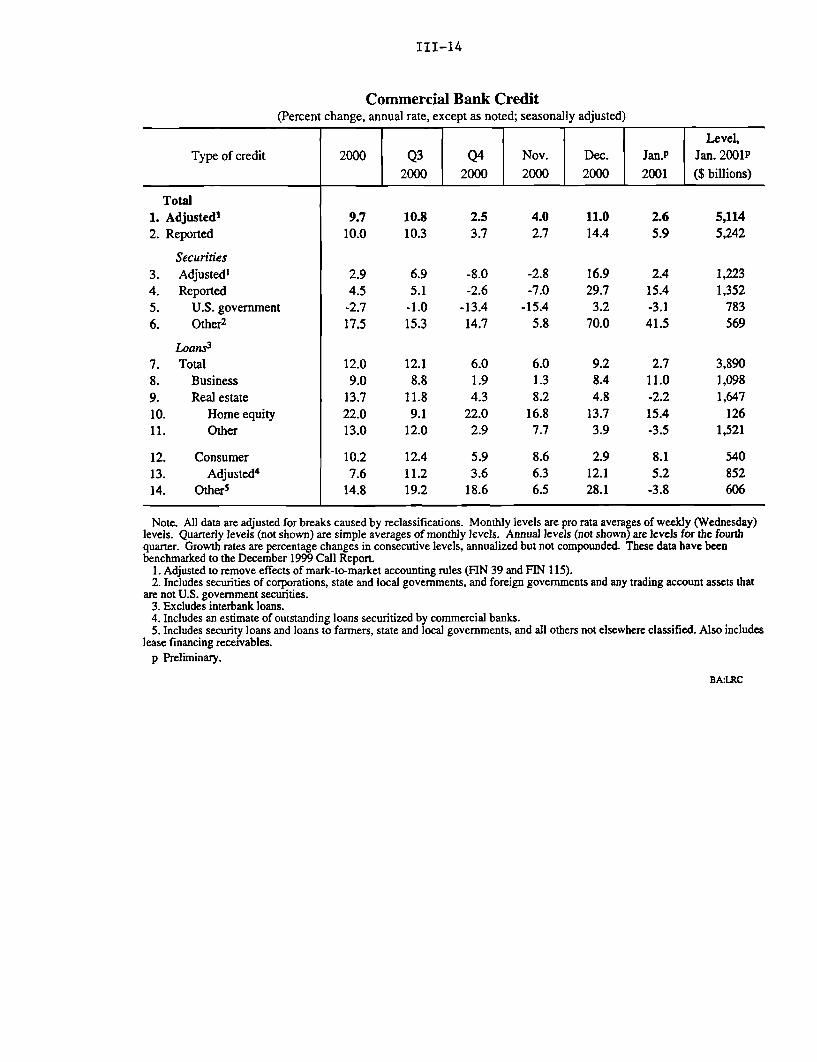
III-14
Commercial Bank Credit(Percent change, annual rate, except as noted; seasonally adjusted)
Level,Type of credit 2000 Q3 Q4 Nov. Dec. Jan.P Jan. 2001P
2000 2000 2000 2000 2001 ($ billions)
Total1. Adjusted1 9.7 10.8 2.5 4.0 11.0 2.6 5,1142. Reported 10.0 10.3 3.7 2.7 14.4 5.9 5,242
Securities3. Adjusted' 2.9 6.9 -8.0 -2.8 16.9 2.4 1,2234. Reported 4.5 5.1 -2.6 -7.0 29.7 15.4 1,3525. U.S. government -2.7 -1.0 -13.4 -15.4 3.2 -3.1 7836. Other2 17.5 15.3 14.7 5.8 70.0 41.5 569
Loans3
7. Total 12.0 12.1 6.0 6.0 9.2 2.7 3,8908. Business 9.0 8.8 1.9 1.3 8.4 11.0 1,0989. Real estate 13.7 11.8 4.3 8.2 4.8 -2.2 1,64710. Home equity 22.0 9.1 22.0 16.8 13.7 15.4 12611. Other 13.0 12.0 2.9 7.7 3.9 -3.5 1,521
12. Consumer 10.2 12.4 5.9 8.6 2.9 8.1 54013. Adjusted4 7.6 11.2 3.6 6.3 12.1 5.2 85214. Other5 14.8 19.2 18.6 6.5 28.1 -3.8 606
Note. All data are adjusted for breaks caused by reclassifications. Monthly levels are pro rata averages of weekly (Wednesday)levels. Quarterly levels (not shown) are simple averages of monthly levels. Annual levels (not shown) are levels for the fourthquarter. Growth rates are percentage changes in consecutive levels, annualized but not compounded. These data have beenbenchmarked to the December 1999 Call Report.
1. Adjusted to remove effects of mark-to-market accounting rules (FIN 39 and FIN 115).2. Includes securities of corporations, state and local governments, and foreign governments and any trading account assets that
are not U.S. government securities.3. Excludes interbank loans.4. Includes an estimate of outstanding loans securitized by commercial banks.5. Includes security loans and loans to farmers, state and local governments, and all others not elsewhere classified. Also includes
lease financing receivables.p Preliminary.
BA:LRC
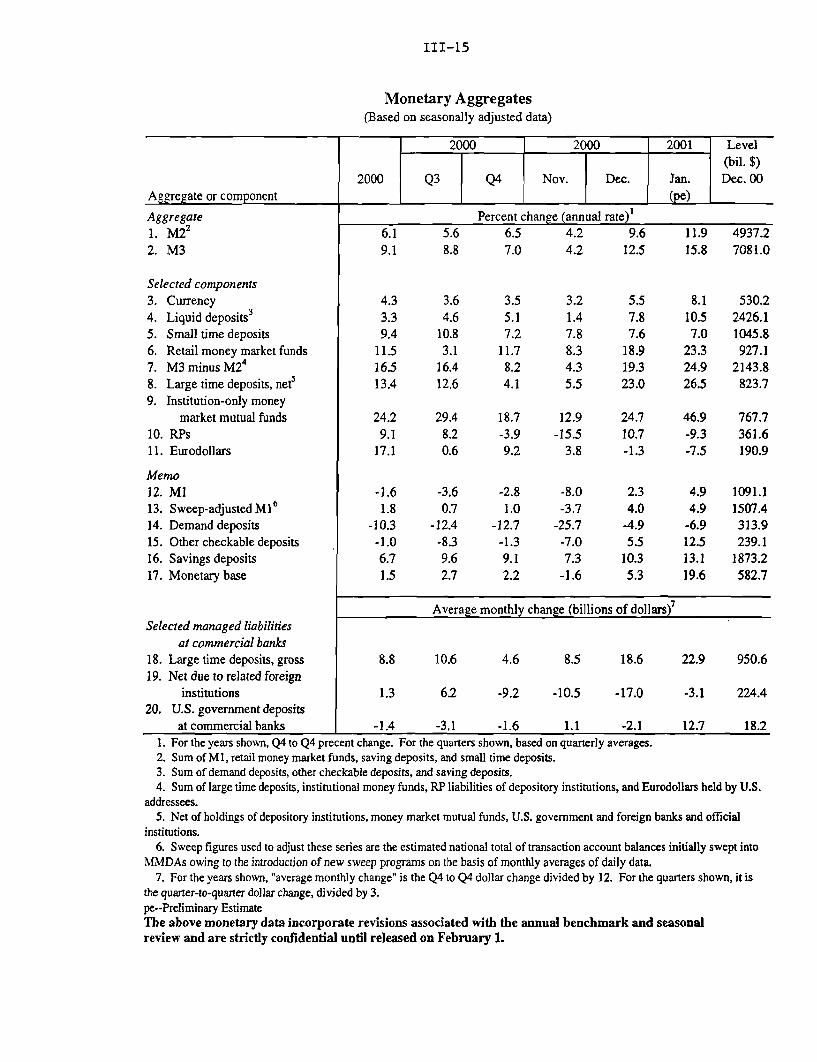
III-15
Monetary Aggregates(Based on seasonally adjusted data)
2000 2000 2001 Level(bil. $)
2000 Q3 Q4 Nov. Dec. Jan. Dec. 00Aggregate or component (pe)
Aggregate1. M22
2. M3
Selected components3. Currency4. Liquid deposits3
5. Small time deposits6. Retail money market funds7. M3 minus M24
8. Large time deposits, net5
9. Institution-only moneymarket mutual funds
10. RPs11. Eurodollars
Memo12. Ml13. Sweep-adjusted M1614. Demand deposits15. Other checkable deposits16. Savings deposits17. Monetary base
Selected managed liabilitiesat commercial banks
18. Large time deposits, gross19. Net due to related foreign
institutions20. U.S. government deposits
at commercial banks
Percent change (annual rate) 1
6.19.1
4.33.39.4
11.516.513.4
24.29.1
17.1
-1.61.8
-10.3-1.06.71.5
5.68.8
3.64.6
10.83.1
16.412.6
29.48.20.6
-3.60.7
-12.4-8.39.62.7
11.9 4937.215.8 7081.0
18.7 12.9-3.9 -15.59.2 3.8
-2.81.0
-12.7-1.39.12.2
-8.0-3.7
-25.7-7.07.3
-1.6
5.57.87.6
18.919.323.0
24.710.7-1.3
2.34.0
-4.95.5
10.35.3
8.110.57.0
23.324.926.5
530.22426.11045.8927.1
2143.8823.7
46.9 767.7-9.3 361.6-7.5 190.9
4.94.9
-6.912.513.119.6
1091.11507.4313.9239.1
1873.2582.7
Average monthly change (billions of dollars)7
8.8 10.6 8.5 18.6
1.3 6.2 -9.2 -10.5 -17.0
22.9 950.6
-3.1 224.4
1.1 -2.1 18.21. For the years shown, Q4 to Q4 precent change. For the quarters shown, based on quarterly averages.2. Sum of Ml, retail money market funds, saving deposits, and small time deposits.3. Sum of demand deposits, other checkable deposits, and saving deposits.4. Sum of large time deposits, institutional money funds, RP liabilities of depository institutions, and Eurodollars held by U.S.
addressees.5. Net of holdings of depository institutions, money market mutual funds, U.S. government and foreign banks and official
institutions.6. Sweep figures used to adjust these series are the estimated national total of transaction account balances initially swept into
MMDAs owing to the introduction of new sweep programs on the basis of monthly averages of daily data.7. For the years shown, "average monthly change" is the Q4 to Q4 dollar change divided by 12. For the quarters shown, it is
the quarter-to-quarter dollar change, divided by 3.pe--Preliminary EstimateThe above monetary data incorporate revisions associated with the annual benchmark and seasonalreview and are strictly confidential until released on February 1.
III-16
of the managed liabilities in this aggregate-especially large time deposits-tofund the expansion of bank credit and to replace their reduced borrowing fromoverseas affiliates. Institutional money funds grew rapidly as well. The declinein short-term market interest rates enhanced the attractiveness of these funds,whose rates lag movements in market rates.
M2 was lifted in part by the narrowing of its opportunity cost. Higher demandsfor liquidity in the face of elevated volatility in equity markets likely alsoboosted this aggregate. Retail money funds and liquid deposits (the sum ofchecking and savings accounts) both picked up substantially. Small timedeposits continued to expand at a fairly rapid clip. Currency growth increasednotably but is still subdued by the standards of the 1990s.
The financial position of banks showed some noticeable deterioration in thefourth quarter. Published reports for twenty-one large bank holding companiesindicate that their net income fell about 17 percent on average relative to thefourth quarter of 1999, reflecting depressed earnings from equity investmentsand substantial loss provisioning against nonperforming assets. Overall, lossprovisions and net charge-offs rose 70 and 30 percent, respectively, from theyear-earlier level, and nonperforming loans as a percentage of total loans andleases rose 20 percent.

Appendix
Senior Loan Officer Opinion Survey on Bank Lending Practices
The January 2001 Senior Loan Officer Opinion Survey on Bank Lending Practicesfocused on changes in the supply of and demand for bank loans to businesses andhouseholds over the past three months. Supplementary questions addressed the effecton borrowers of the reported tightening of lending standards and terms on C&I loansover the past year or so, changes in terms on commercial real estate loans over the pasttwelve months, banks' expectations about changes in standards on consumer loans overthe next year, and banks' leasing operations. Loan officers from fifty-seven largedomestic banks and twenty-four U.S. branches and agencies of foreign banksparticipated in the survey.
The number of domestic and foreign banking institutions that reported tighteningstandards and terms on C&I loans over the past three months remained large.Significant fractions of both domestic and foreign banks also tightened standards forcommercial real estate loans. In general, banks indicated that the most importantreasons for tightening standards and terms were a worsening economic outlook and areduced tolerance for risk. On net, a substantial fraction of respondents reportedweaker demand over the past three months for both C&I loans and commercial realestate loans.
On the consumer side, lending conditions also firmed noticeably. A much largerfraction of domestic banks than in the November survey reported tightening standardsand terms on non-credit-card consumer loans. On net, about 15 percent of the banksindicated that they anticipate some tightening in their standards and terms on all typesof consumer loans before the end of 2001. In addition, 35 percent, on net, indicatedthat demand for all types of consumer loans had weakened somewhat in the last threemonths. However, almost all domestic banks reported no change in standards forresidential mortgage loans and, on net, demand for residential mortgages was alsounchanged.
Lending to BusinessesThe net percentage of domestic and foreign respondents that tightened standards duringthe last quarter was even higher than the elevated level in the November survey.Almost 60 percent of domestic banks reported tightening their standards on C&I loansto large and middle-market firms over the past three months, and 45 percent reportedtightening standards to small firms over the same period. As in the November survey,about 80 percent of branches and agencies of foreign banks reported tighteningstandards for customers seeking C&I loans.
Large fractions of domestic banks reported tightening each of the loan terms listed inthe survey. Almost three-quarters of domestic respondents reported charging higherpremiums on riskier loans to large and middle-market firms, including 21 percent thatclaimed to have increased these premiums considerably. No banks reported loweringpremiums. About half of the domestic banks, on net, indicated that they had tightenedloan covenants and raised the cost of credit lines for large and middle-market firms overthe past three months. Nearly 60 percent of domestic banks, on net, increased thespreads of loan rates over their cost of funds for these borrowers. Overall, somewhat

III-A-2
smaller fractions of domestic banks tightened terms on C&I loans to small firms. Still,premiums on riskier loans to small firms increased at almost 60 percent of domesticbanks, and 42 percent of the respondents tightened covenants on loans to small firms.
Two-thirds of the branches and agencies of foreign banks reported charging somewhathigher premiums on riskier loans, and an additional 17 percent increased thesepremiums considerably. Three-fourths of foreign institutions increased spreads of loanrates over their cost of funds, and 58 percent indicated a general strengthening of loancovenants. No foreign bank reported easing any of the terms listed in the survey.
Most of the domestic and foreign respondents that had tightened standards or terms onC&I loans cited a less favorable or more uncertain economic outlook, a worsening ofindustry-specific problems, and a reduced tolerance for risk as reasons for changingtheir lending policies. About three-fourths of domestic and foreign banks that hadtightened standards and terms on commercial credits over the past three months alsomentioned an increase in defaults by below-investment-grade borrowers as important,and many cited decreased liquidity in the secondary market for C&I loans as well.
The January survey included a special question to determine how banks' businesscustomers responded to the general tightening of lending standards and terms that hasbeen reported over the past year. Domestic banks indicated that about two-thirds oftheir customers borrowed as planned despite the stricter lending policies; for foreigninstitutions that share was about 50 percent. Of those customers that did not borrow asmuch as planned, both domestic and foreign banks reported that more than half wereable to finance their spending plans either by borrowing elsewhere or by using liquidassets. Well under one-fifth of customers reduced spending plans, and only a handfulcanceled their plans altogether.
On net, about half of domestic banks reported decreased demand for C&I loans fromlarge and middle-market firms, and 30 percent, on net, reported moderately weakerdemand from small firms over the same period. Most of the domestic banks thatreported weaker loan demand cited a decline in customer demand for credit to financecapital expenditures and reduced demand for financing mergers and acquisitions. Ashortage of internally generated funds and increased need for inventory financing werecited as important reasons by the few domestic banks that experienced increaseddemand. Two large banks noted that they received increased demand from customersthat had switched to bank loans from the commercial paper market.
On net, about 20 percent of foreign branches and agencies saw weaker demand over thepast three months. A decline in customers' need for merger and acquisition financingwas cited as an important reason by most of the banks that saw demand decrease, and amajority also mentioned that their customers had reduced spending on plant andequipment. Each of the four foreign banks that saw increased demand for C&I loansreported that customers shifted to bank loans because either the commercial papermarket or other credit sources became less attractive.
More than 40 percent of domestic banks tightened standards on commercial real estateloans over the past three months, up from 26 percent in the November survey. Thefraction of branches and agencies that tightened standards on these loans in the current

III-A-3
survey, about 30 percent, was little changed from November. On net, almost 30 percentof domestic banks and 15 percent of foreign banks reported at least somewhat weakerdemand for commercial real estate loans.
In response to a special question, significant fractions of both foreign and domesticbanks indicated that they had tightened terms on commercial real estate loans over thepast year. Most strikingly, about half of the domestic banks increased spreads of loanrates over their cost of funds, and about 40 percent demanded higher debt-servicecoverage ratios. More than 50 percent of the foreign institutions increased spreads overtheir cost of funds. Significant fractions of foreign banks also tightened theirrequirements for take-out financing, demanded higher loan-to-value ratios, and raiseddebt-service coverage ratios.
A less favorable economic outlook was the most important reason for tightening termson commercial real estate loans at both domestic and foreign banks. Foreign banks alsoexpressed significant concern about the availability of take-out financing, followedclosely by a reduced tolerance for risk. The latter was the second most importantreason in the minds of domestic banks that tightened terms. Interestingly, for bothdomestic and foreign banks, the number of respondents mentioning as an importantfactor a worsening of the outlook for commercial real estate in the market where theyoperate was slightly smaller than the number mentioning general economic weakness.
Lending to HouseholdsOver the past three months, banks' credit standards for approving residential mortgageloans were largely unchanged. Changes in demand for residential mortgages werehighly variable across respondents, with 30 percent reporting stronger demand and anequal fraction reporting weakness. In the November survey, about 33 percent of banks,on net, reported weaker demand for home mortgages.
A few banks indicated that they were less willing to make consumer installment loansthan they were three months ago, and more than 10 percent of banks tightenedstandards on credit card loans. For other types of consumer loans, almost 20 percent ofdomestic banks reported tighter standards, and about 25 percent increased spreads.Relative to recent surveys, this represents a significant increase in the number of bankstightening standards and terms for non-credit-card consumer loans. About 15 percentof banks, on net, expect to tighten their standards and terms on all types of consumerloans before the end of 2001, even if the economy expands at a sustainable rate. Inaddition, almost 35 percent of domestic banks, on net, reported that demand for alltypes of consumer loans had weakened over the past three months, compared with only13 percent that observed weaker demand in the November survey.
Bank Leasing OperationsLease financing has been expanding rapidly at domestic commercial banks since thelate 1990s. The January survey asked three special questions designed to elicitinformation on the composition of leases at banks and on the reasons that leases havegrown over that period. Banks reported that more than 60 percent of their leases aremade to nonfinancial corporations and also indicated that this category was the primaryarea of growth in lease financing over the past several years. The rise in lease financing

III-A-4
has accompanied rapid expansion in the types of capital investment for which leasefinancing is commonly used. Acquisitions of leases from third parties and a morecompetitive leasing market were also mentioned as important factors in the growth ofthese assets at domestic banks. Almost a third of the leases held by banks are consumerleases, which several banks noted are primarily auto leases. However, two banksindicated that they are exiting consumer leasing.

III-A-5
Measures of Supply and Demand for C&I Loans,by Size of Firm Seeking Loan
Net Percentage of Domestic Respondents Tightening Standards for C&I LoansPercent
1990 1991 1992 1993 1994 1995 1996 1997 1998 1999 2000 2001
Net Percentage of Domestic Respondents Increasing Spreads of Loan Rates over Banks' Costs of FundsPercent
1990 1991 1992 1993 1994 1995 1996 1997 1998 1999 2000 2001
Net Percentage of Domestic Respondents Reporting Stronger Demand for C&I LoansPercent
- Large and medium........ sma
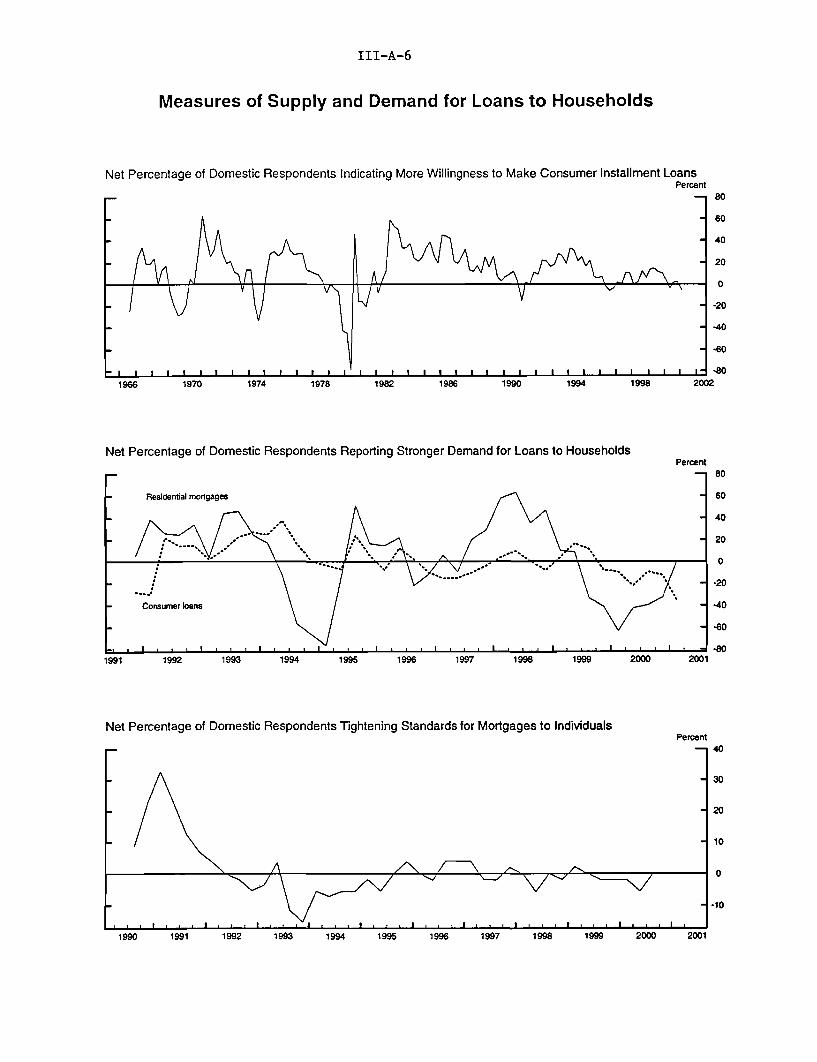
III-A-6
Measures of Supply and Demand for Loans to Households
Net Percentage of Domestic Respondents Indicating More Willingness to Make Consumer Installment LoansPercent
KR I I^^M rV *
- I m I I I I I I I I I I I I I I I I I | I a I I |
1966 1970 1974 1978 1982 1986 1990 1994 1998
Net Percentage of Domestic Respondents Reporting Stronger Demand for Loans to Households
Net Percentage of Domestic Respondents Tightening Standards for Mortgages to Individuals
20
Percent
Percent
~N-I
80
60
40
20
0
-20
-40
-60
-8002
"'' "' ' ~' '~rl\-- N

International Developments_ _
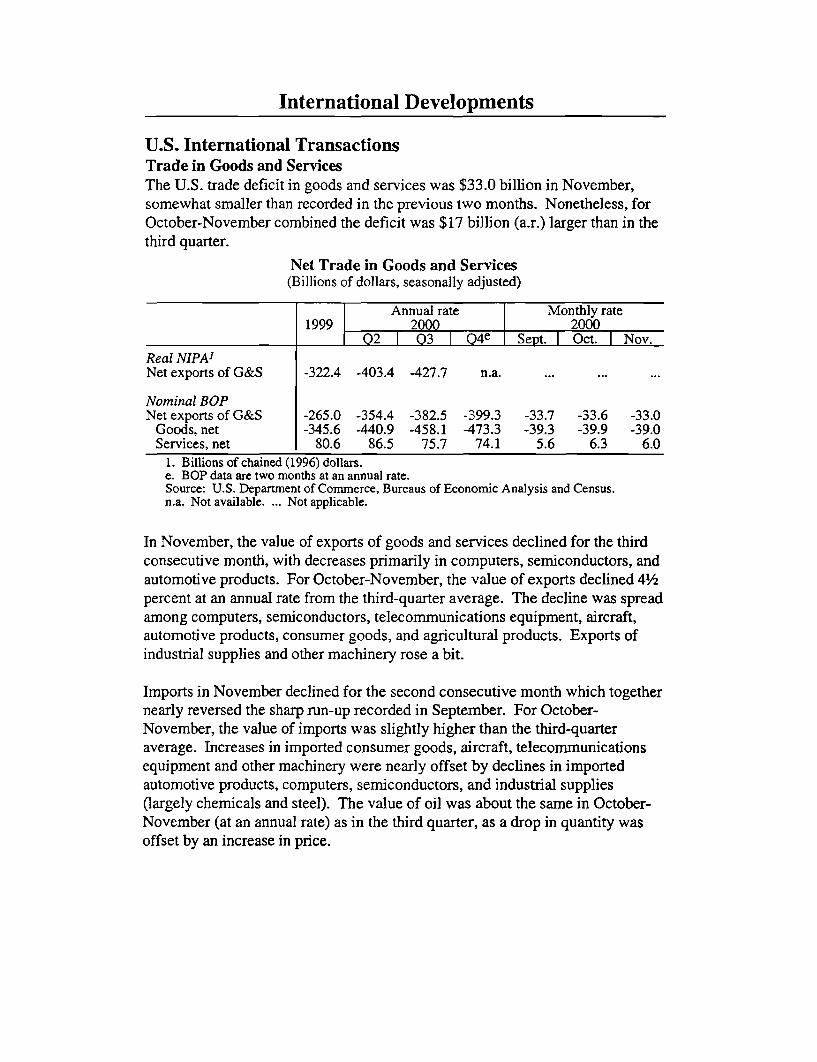
International Developments
U.S. International TransactionsTrade in Goods and ServicesThe U.S. trade deficit in goods and services was $33.0 billion in November,somewhat smaller than recorded in the previous two months. Nonetheless, forOctober-November combined the deficit was $17 billion (a.r.) larger than in thethird quarter.
Net Trade in Goods and Services(Billions of dollars, seasonally adjusted)
Annual rate Monthly rate1999 2000 2000
02 03 I Q4e Sept. Oct. I Nov.Real NIPA1
Net exports of G&S -322.4 -403.4 -427.7 n.a. ... ...
Nominal BOPNet exports of G&S -265.0 -354.4 -382.5 -399.3 -33.7 -33.6 -33.0
Goods, net -345.6 -440.9 -458.1 -473.3 -39.3 -39.9 -39.0Services, net 80.6 86.5 75.7 74.1 5.6 6.3 6.0
1. Billions of chained (1996) dollars.e. BOP data are two months at an annual rate.Source: U.S. Department of Commerce, Bureaus of Economic Analysis and Census.n.a. Not available. ... Not applicable.
In November, the value of exports of goods and services declined for the thirdconsecutive month, with decreases primarily in computers, semiconductors, andautomotive products. For October-November, the value of exports declined 4-1/2percent at an annual rate from the third-quarter average. The decline was spreadamong computers, semiconductors, telecommunications equipment, aircraft,automotive products, consumer goods, and agricultural products. Exports ofindustrial supplies and other machinery rose a bit.
Imports in November declined for the second consecutive month which togethernearly reversed the sharp run-up recorded in September. For October-November, the value of imports was slightly higher than the third-quarteraverage. Increases in imported consumer goods, aircraft, telecommunicationsequipment and other machinery were nearly offset by declines in importedautomotive products, computers, semiconductors, and industrial supplies(largely chemicals and steel). The value of oil was about the same in October-November (at an annual rate) as in the third quarter, as a drop in quantity wasoffset by an increase in price.

IV-2
U.S. International Trade in Goods and Services
Contribution of Net Exports to Real GDP GrowthExports Bil$, s.a.a.r. 0 Percentage points, s.a.a.r. 3
2
-- 50 1
Nominal 0BOP basis -1
- -100 --2-3
-150 1 I I I I I,,,1 ,,, -41992 1994 1996 1998 2000
-200 Bil$, s.a.a.r.Real / 20
NIPA basis Net trade in computers(1996$) and semiconductors- -250 0
-300 -20
Net automotive trade-350 with Canada and Mexico -
S-350I I I I I I I.. I.. -60
1992 1994 1996 1998 2000
1. Excludes oil and gold.2. Excludes computers and semiconductors.3. Excludes Canada and Mexico.
1. Excludes agriculture and gold.2. Excludes computers and semiconductors.
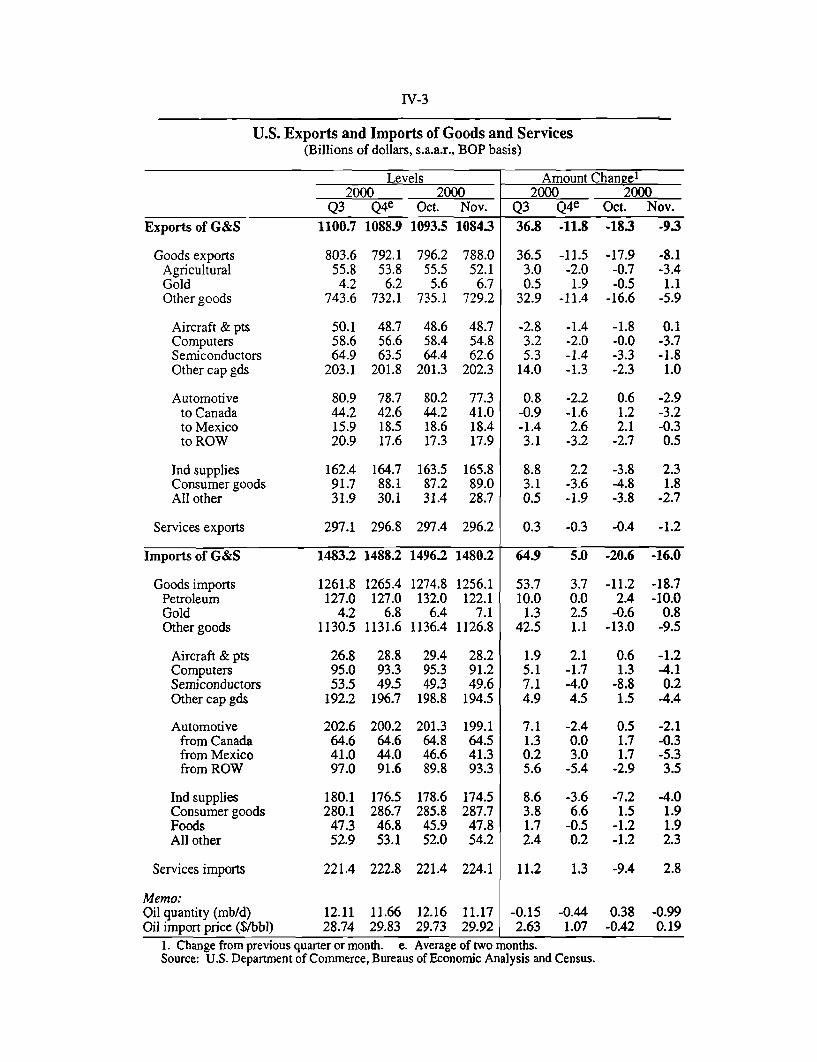
IV-3
U.S. Exports and Imports of Goods and Services(Billions of dollars, s.a.a.r., BOP basis)
Levels Amount Change12000 2000 2000 2000
Q3 Q4 e Oct. Nov. Q3 Q4e Oct. Nov.Exports of G&S 1100.7 1088.9 1093.5 1084.3 36.8 -11.8 -18.3 -93
Goods exports 803.6 792.1 796.2 788.0 36.5 -11.5 -17.9 -8.1Agricultural 55.8 53.8 55.5 52.1 3.0 -2.0 -0.7 -3.4Gold 4.2 6.2 5.6 6.7 0.5 1.9 -0.5 1.1Other goods 743.6 732.1 735.1 729.2 32.9 -11.4 -16.6 -5.9
Aircraft & pts 50.1 48.7 48.6 48.7 -2.8 -1.4 -1.8 0.1Computers 58.6 56.6 58.4 54.8 3.2 -2.0 -0.0 -3.7Semiconductors 64.9 63.5 64.4 62.6 5.3 -1.4 -3.3 -1.8Other cap gds 203.1 201.8 201.3 202.3 14.0 -1.3 -2.3 1.0
Automotive 80.9 78.7 80.2 77.3 0.8 -2.2 0.6 -2.9to Canada 44.2 42.6 44.2 41.0 -0.9 -1.6 1.2 -3.2to Mexico 15.9 18.5 18.6 18.4 -1.4 2.6 2.1 -0.3to ROW 20.9 17.6 17.3 17.9 3.1 -3.2 -2.7 0.5
Ind supplies 162.4 164.7 163.5 165.8 8.8 2.2 -3.8 2.3Consumer goods 91.7 88.1 87.2 89.0 3.1 -3.6 -4.8 1.8All other 31.9 30.1 31.4 28.7 0.5 -1.9 -3.8 -2.7
Services exports 297.1 296.8 297.4 296.2 0.3 -0.3 -0.4 -1.2
Imports of G&S 1483.2 1488.2 1496.2 1480.2 64.9 5.0 -20.6 -16.0
Goods imports 1261.8 1265.4 1274.8 1256.1 53.7 3.7 -11.2 -18.7Petroleum 127.0 127.0 132.0 122.1 10.0 0.0 2.4 -10.0Gold 4.2 6.8 6.4 7.1 1.3 2.5 -0.6 0.8Other goods 1130.5 1131.6 1136.4 1126.8 42.5 1.1 -13.0 -9.5
Aircraft & pts 26.8 28.8 29.4 28.2 1.9 2.1 0.6 -1.2Computers 95.0 93.3 95.3 91.2 5.1 -1.7 1.3 -4.1Semiconductors 53.5 49.5 49.3 49.6 7.1 -4.0 -8.8 0.2Other cap gds 192.2 196.7 198.8 194.5 4.9 4.5 1.5 -4.4
Automotive 202.6 200.2 201.3 199.1 7.1 -2.4 0.5 -2.1from Canada 64.6 64.6 64.8 64.5 1.3 0.0 1.7 -0.3from Mexico 41.0 44.0 46.6 41.3 0.2 3.0 1.7 -5.3from ROW 97.0 91.6 89.8 93.3 5.6 -5.4 -2.9 3.5
Ind supplies 180.1 176.5 178.6 174.5 8.6 -3.6 -7.2 -4.0Consumer goods 280.1 286.7 285.8 287.7 3.8 6.6 1.5 1.9Foods 47.3 46.8 45.9 47.8 1.7 -0.5 -1.2 1.9All other 52.9 53.1 52.0 54.2 2.4 0.2 -1.2 2.3
Services imports 221.4 222.8 221.4 224.1 11.2 1.3 -9.4 2.8
Memo:Oil quantity (mb/d) 12.11 11.66 12.16 11.17 -0.15 -0.44 0.38 -0.99Oil import price ($/bbl) 28.74 29.83 29.73 29.92 2.63 1.07 -0.42 0.19
1. Change from previous quarter or month. e. Average of two months.Source: U.S. Department of Commerce, Bureaus of Economic Analysis and Census.
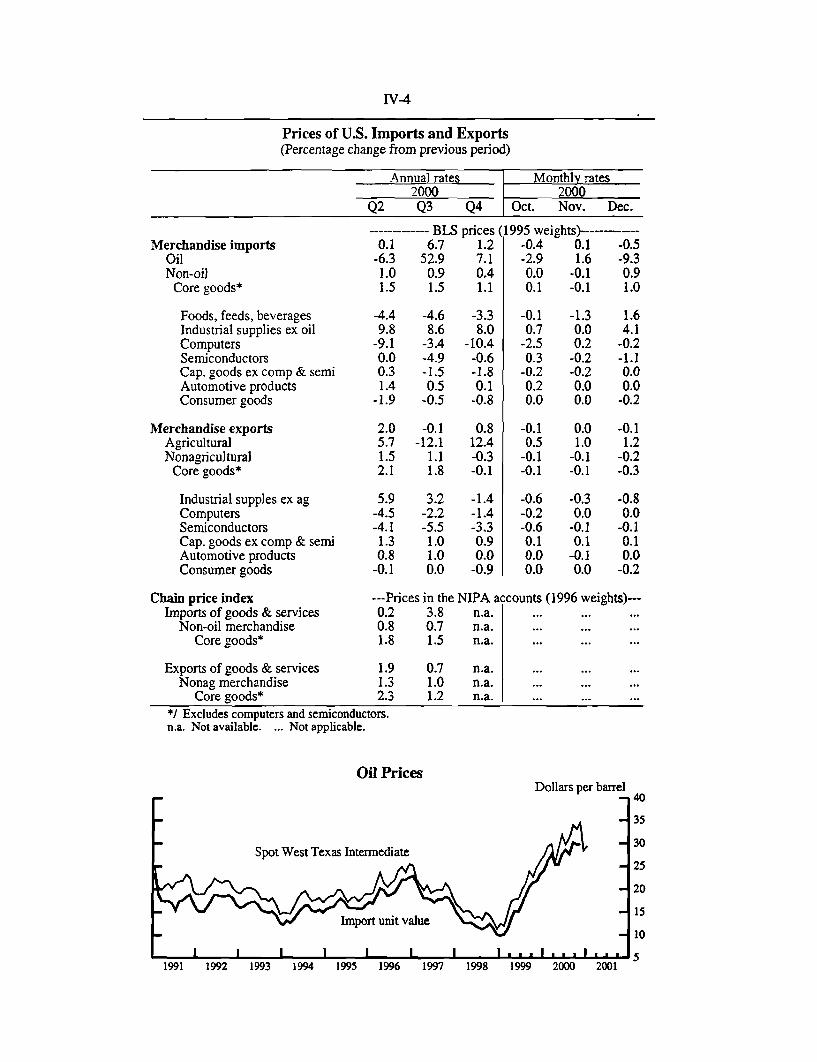
IV-4
Prices of U.S. Imports and Exports(Percentage change from previous period)
Annual rates Monthly rates2000 2000
Q2 Q3 Q4 Oct. Nov. Dec.
Merchandise importsOilNon-oil
Core goods*
Foods, feeds, beveragesIndustrial supplies ex oilComputersSemiconductorsCap. goods ex comp & semiAutomotive productsConsumer goods
Merchandise exportsAgriculturalNonagricultural
Core goods*
Industrial supples ex agComputersSemiconductorsCap. goods ex comp & semiAutomotive productsConsumer goods
Chain price indexImports of goods & services
Non-oil merchandiseCore goods*
Exports of goods & servicesNonag merchandise
Core goods*
---------- BLS prices (1995 weights)-------0.1 6.7 1.2 -0.4 0.1 -0.5
-6.3 52.9 7.1 -2.9 1.6 -9.31.0 0.9 0.4 0.0 -0.1 0.91.5 1.5 1.1 0.1 -0.1 1.0
-4.4 -4.6 -3.39.8 8.6 8.0
-9.1 -3.4 -10.40.0 -4.9 -0.60.3 -1.5 -1.81.4 0.5 0.1
-1.9 -0.5 -0.8
2.0 -0.1 0.85.7 -12.1 12.41.5 1.1 -0.32.1 1.8 -0.1
5.9 3.2 -1.4-4.5 -2.2 -1.4-4.1 -5.5 -3.31.3 1.0 0.90.8 1.0 0.0
-0.1 0.0 -0.9
---Prices in the NIPA a0.2 3.8 n.a.0.8 0.7 n.a.1.8 1.5 n.a.
1.9 0.7 n.a.1.3 1.0 n.a.2.3 1.2 n.a.
-0.1 -1.3 1.60.7 0.0 4.1
-2.5 0.2 -0.20.3 -0.2 -1.1
-0.2 -0.2 0.00.2 0.0 0.00.0 0.0 -0.2
-0.1 0.0 -0.10.5 1.0 1.2
-0.1 -0.1 -0.2-0.1 -0.1 -0.3
-0.6 -0.3 -0.8-0.2 0.0 0.0-0.6 -0.1 -0.10.1 0.1 0.10.0 -0.1 0.00.0 0.0 -0.2
ccounts (1996 weights)---
*/ Excludes computers and semiconductors.n.a. Not available. ... Not applicable.
Oil PricesDollars per barrel
Spot West Texas Intermediate
IV-5
Prices of Internationally Traded GoodsOil. The price of imported oil (BLS) declined over 9 percent in Decemberfollowing two months of smaller changes. In spite of intermittent disruptions toIraqi oil exports, the spot price of West Texas Intermediate fell nearly $6 perbarrel during December in the wake of moderating concerns about lowinventories and high demand. Through mid-January, however, oil pricesgenerally moved higher in advance of OPEC's decision to cut oil productiontargets 1.5 million barrels per day. Spot WTI is currently trading near $31 perbarrel.
Non-oil imports. Prices of imported non-oil goods rose 0.9 percent inDecember, following a small decline in November. The monthly increase (thelargest recorded since these data began in 1989) was driven by a 4.1 percent risein the prices of imported industrial supplies, reflecting primarily a surge in theprice of natural gas. Prices of most other imported core goods (which excludeoil, computers, and semiconductors) either declined in December (consumergoods) or were unchanged (automotive products and machinery). For the fourthquarter, prices of both non-oil and core goods imports rose, but at a somewhatslower pace than recorded over the past four quarters -- core goods by 1/2 percentat an annual rate and non-oil imports by 1 percent (a.r.) Most major tradecategories registered price declines in the fourth quarter, with the notableexception of industrial supplies.
Exports. Prices of total U.S. goods exports declined slightly in December asincreases in the prices of exported agricultural products (for the fourthconsecutive month) were more than offset by declines in the prices of most otherexported goods. For the fourth quarter, the prices of exported core goods (whichexclude computers, semiconductors, and agricultural products) fell slightly--thefirst decline since the fourth quarter of 1998--as decreases in the prices ofexported consumer goods and industrial supplies outweighed increases prices ofexported machinery. Prices of exported computers and semiconductors bothdeclined in the fourth quarter.
U.S. International Financial TransactionsForeign private-sector demand for U.S. securities remained strong in November(line 4 of the Summary of U.S. International Transactions table), as foreignpurchases of corporate and agency securities far outpaced net sales of Treasurysecurities. Through November, year-to-date net foreign purchases of agencybonds, corporate bonds, and corporate stocks were all at record annual levels.Demand for agency bonds has been noteworthy. November marked the fourthstraight month of record net purchases of agency bonds, with demand fromJapan being particularly strong.

IV-6
The sustained demand for agency and corporate securities contrasts with netsales of Treasury securities, related in part to the ongoing paydown of securitiesissued by the Treasury given the federal budget surplus. In 1999, private-sectorforeigners were net sellers of Treasuries for the first year since 1990. The sellingcontinued in 2000 and, barring substantial net purchases in December, the fourthquarter will be the fifth straight quarter of net sales of Treasuries by privateforeigners. Despite the net sales during 1999 and 2000, private foreigners'holdings of Treasuries as a share of total outstanding has changed little over theperiod, indicating that they appear to have responded to the changing yielddifferential between Treasuries and alternative debt instruments in a mannersimilar to the market as a whole.
In November, net sales of foreign stocks and bonds by U.S. residents (lines 5aand 5b) more than offset the acquisition of foreign stocks through stock swaps(line 5c). The net sales of foreign bonds were mostly through Europe, whereU.S. residents have been acquiring bonds. The net sales of foreign stocks weremostly through Hong Kong and Japan.
Although our measures of the sources and destinations of capital flows areimperfect, the November data are consistent with an apparent shift in portfoliosaway from Japan and towards Europe. Through November, U.S. residentsacquired on net about $65 billion in European securities, mostly through bondpurchases and acquisitions of stocks through merger-related swaps. In contrast,on net U.S. residents sold $20 billion in Japanese securities, following large netpurchases of Japanese stocks in 1999.
Foreign official assets held in the United States fell slightly in November after asmall increase in October (line 1). The largest decline was recorded for Turkey($4 billion), in conjunction with its banking crisis; FRBNY data for Decembersuggest that Turkey's reserves have since stabilized. A large decrease was alsorecorded for Germany ($3 billion), almost offsetting a large increase in October.Sizable declines were also recorded for Hong Kong and Taiwan. Russia'sreserves increased substantially ($3 billion) in November and have increased $15billion for the year. A sizable increase was also recorded for China. As hasbeen the case all year, reported increases in reserve assets held in the UnitedStates by OPEC countries were modest in November. Partial data from FRBNYindicate that in December foreign official reserves held in the United Statesincreased $12 billion.
Modest inflows through banking offices in the United States were reported inNovember (line 3), following large inflows in October.
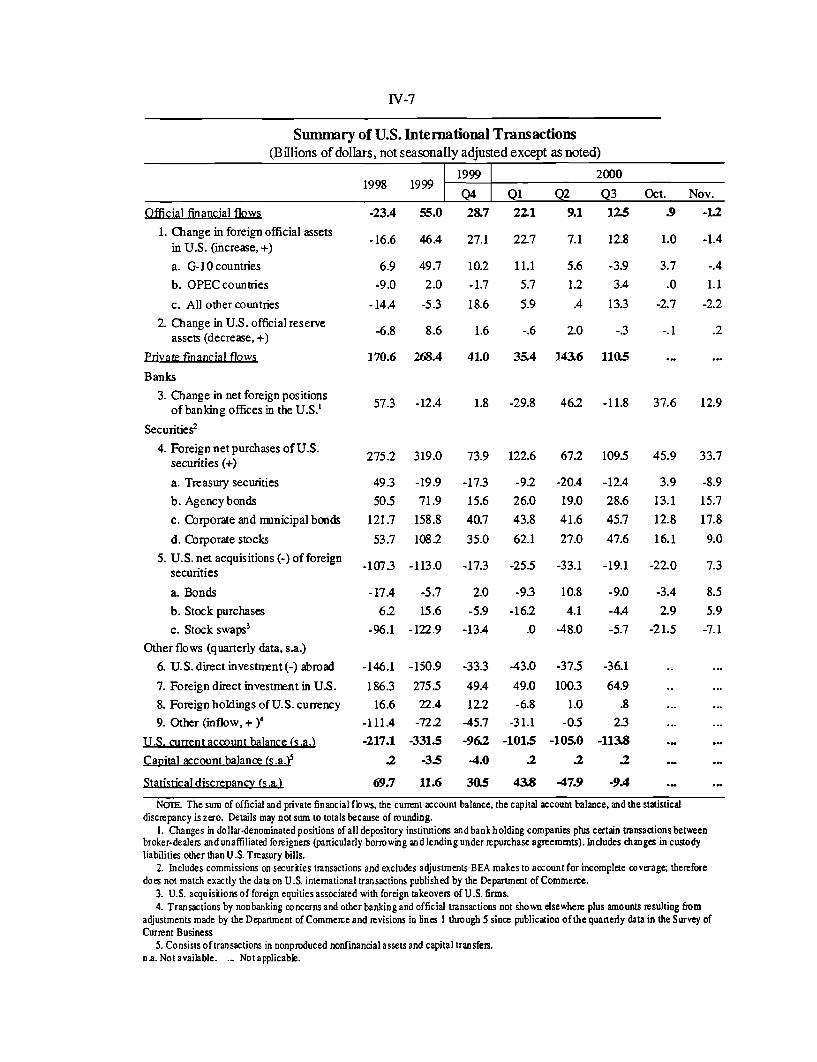
IV-7
Summary of U.S. International Transactions(Billions of dollars, not seasonally adjusted except as noted)
1999 20001998 1999
1Q4 I Q1 Q2 Q3 Oct. Nov.
Official financial flows -23.4 55.0 287 22.1 9.1 125 .9 -1.2
1. Change in foreign official assetsin U.S. (increase, +)a. G-10 countries
b. OPEC countries
c. All other countries
2. Change in U.S. official reserveassets (decrease, +)
Private financial flows
Banks
3. Change in net foreign positionsof banking offices in the U.S.'
Securities2
4. Foreign net purchases of U.S.securities (+)
a. Treasury securities
b. Agency bonds
c. Corporate and municipal bonds
d. Corporate stocks
5. U.S. net acquisitions (-) of foreignsecurities
a. Bonds
b. Stock purchases
c. Stock swaps 3
Other flows (quarterly data, s.a.)
6. U.S. direct investment(-) abroad
7. Foreign direct investment in U.S.
8. Foreign holdings of U.S. currency
9. Other (inflow, + )
U.S. current account balance (s.a.)
Capital account balance (s.a.'
-16.6 46.4 27.1 22.7
6.9 49.7 10.2 11.1
-9.0 2.0 -1.7 5.7
-14.4 -5.3 18.6 5.9
7.1 12.8 1.0 -1.4
5.6 -3.91.2 3.4
.4 13.3
-6.8 8.6 1.6 -.6 2.0 -.3 -. 1 .2
170.6 268.4 41.0 35.4 143.6 110.5 .
57.3 -12.4 1.8 -29.8 46.2 -11.8 37.6
275.2 319.0 73.9 122.6 67.2 109.5 45.9
49.3 -19.9 -17.3 -9.2 -20.4 -12.4 3.9
50.5 71.9 15.6 26.0 19.0 28.6 13.1
121.7 158.8 40.7 43.8 41.6 45.7 12.8
53.7 108.2 35.0 62.1 27.0 47.6 16.1
-1073 -113.0 -17.3 -25.5 -33.1 -19.1 -22.0
-17.4 -5.7 2.0 -9.3 10.8 -9.0 -3.4
6.2 15.6 -5.9 -16.2 4.1 -4.4 2.9
-96.1 -122.9 -13.4 .0 -48.0 -5.7 -21.5
-146.1 -150.9 -33.3 -43.0 -37.5 -36.1
186.3 275.5 49.4 49.0 100.3 64.9
16.6 22.4 12.2 -6.8 1.0 .8
-111.4 -72.2 -45.7 -31.1 -0.5 2.3
-217.1 -331.5 -96.2 -1015 -105.0 -113.8
.2 -3.5 -4.0 .2 .2 .2
Statistical discrepancy (s.a) 69.7 11.6 30.5 43.8 -47.9 -9.4
NOTE. The sum of official and private financial flows, the current account balance, the capital account balance, and the statisticaldiscrepancy is zero. Details may not sum to totals because of rounding.
1. Changes in dollar-denominated positions of all depository institutions and bank holding companies plus certain transactions betweenbroker-dealers and unaffiliated foreigners (particularly borrowing and lending under repurchase agreements). Includes changes in custodyliabilities other than U.S. Treasury bills.
2. Includes commissions on securities transactions and excludes adjustments BEA makes to account for incomplete coverage; thereforedoes not match exactly the data on U.S. international transactions published by the Department of Commerce.
3. U.S. acquisitions of foreign equities associated with foreign takeovers of U.S. firms.4. Transactions by nonbanking concerns and other banking and official transactions not shown elsewhere plus amounts resulting from
adjustments made by the Department of Commerce and revisions in lines 1 through 5 since publication of the quartedy data in the Survey ofCurrent Business
5. Consists of transactions in nonproduced nonfinancial assets and capital transfers.n.a. Not available. .. Not applicable.
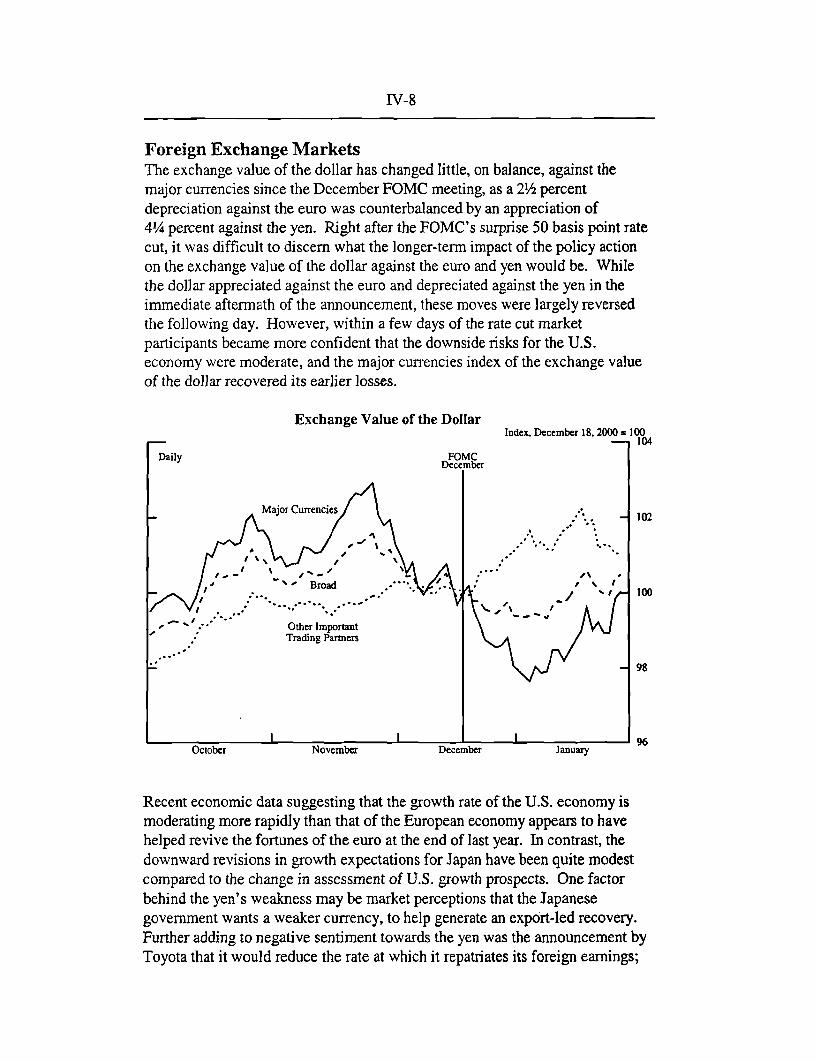
IV-8
Foreign Exchange MarketsThe exchange value of the dollar has changed little, on balance, against themajor currencies since the December FOMC meeting, as a 2 1/2 percentdepreciation against the euro was counterbalanced by an appreciation of4 1/4 percent against the yen. Right after the FOMC's surprise 50 basis point ratecut, it was difficult to discern what the longer-term impact of the policy actionon the exchange value of the dollar against the euro and yen would be. Whilethe dollar appreciated against the euro and depreciated against the yen in theimmediate aftermath of the announcement, these moves were largely reversedthe following day. However, within a few days of the rate cut marketparticipants became more confident that the downside risks for the U.S.economy were moderate, and the major currencies index of the exchange valueof the dollar recovered its earlier losses.
Exchange Value of the DollarIndex, December 18, 2000 = 100
- - 104
Daily FOMCDecember
Major Currencies 102SMaj Currencies
- 102
B ro a d
o
" .."" Other Important* Trading Partners
- 98
I I 96October November December January
Recent economic data suggesting that the growth rate of the U.S. economy ismoderating more rapidly than that of the European economy appears to havehelped revive the fortunes of the euro at the end of last year. In contrast, thedownward revisions in growth expectations for Japan have been quite modestcompared to the change in assessment of U.S. growth prospects. One factorbehind the yen's weakness may be market perceptions that the Japanesegovernment wants a weaker currency, to help generate an export-led recovery.Further adding to negative sentiment towards the yen was the announcement byToyota that it would reduce the rate at which it repatriates its foreign earnings;
IV-9
market participants opined that other large Japanese exporters were likely tofollow suit.
In comparison to the dollar's sharp fluctuations against the euro and yen, thedollar's movements against other major currencies were moderate. On net, theU.S. dollar depreciated 3/4 percent against the Canadian dollar and 1/4 percentversus the Australian dollar over the intermeeting period. From the DecemberFOMC meeting to January 3, the U.S. dollar had depreciated by much largeramounts against the Canadian and Australian currencies, but in the periodfollowing the FOMC policy action, the U.S. dollar recovered most of its losses.Over the intermeeting period the dollar appreciated 1 percent, on balance,against sterling. With recent economic data suggesting the rate of growth mayalso be slowing more rapidly in the United Kingdom than in the euro area,sterling has moved more in line with the dollar than the euro since the DecemberFOMC meeting.
The exchange value of the dollar rose 1 percent versus the currencies of ourother important trading partners over the intermeeting period, owing primarily toa 3-1/4 percent appreciation against the Mexican peso and a 5 percentappreciation versus the Korean won. Market participants expressed concern thatMexico and the emerging Asian economies would be hardest hit by a slowing ofthe U.S. economy, as they export heavily to the United States. The Philippinespeso was extremely volatile over the intermeeting period, as the twists and turnsin the fate of President Estrada were reflected in the Philippines currency. Onbalance, the dollar depreciated 3-1/4 percent against the Philippines peso, asmarket participants appeared relieved by the change in regime.
Canadian three-month interest rates moved lower after the FOMC's January 3policy action, as the market brought forward its expected time frame for theBank of Canada to begin easing. These expectations were realized onJanuary 23, when the Bank of Canada cut its key policy rate 25 basis points.Since the December FOMC meeting, Canadian three-month rates have declined32 basis points, but the yield on the Canadian ten-year bond has risen 17 basispoints. Share prices in Canada rose over 6 percent. Short-term rates in the euroarea declined 15 basis points, while rates in Japan have slipped even furtherfrom their already low level. Yields on other major industrial country ten-yearsovereign bonds have changed relatively little since the December FOMC, withthe exception of the yield on the ten-year Japanese government bond, which fell25 basis points. Share prices in Japan declined almost 5 percent on net;discussions by Japanese government officials on undertaking "price-keepingoperations" seemed to help reverse initially larger losses.
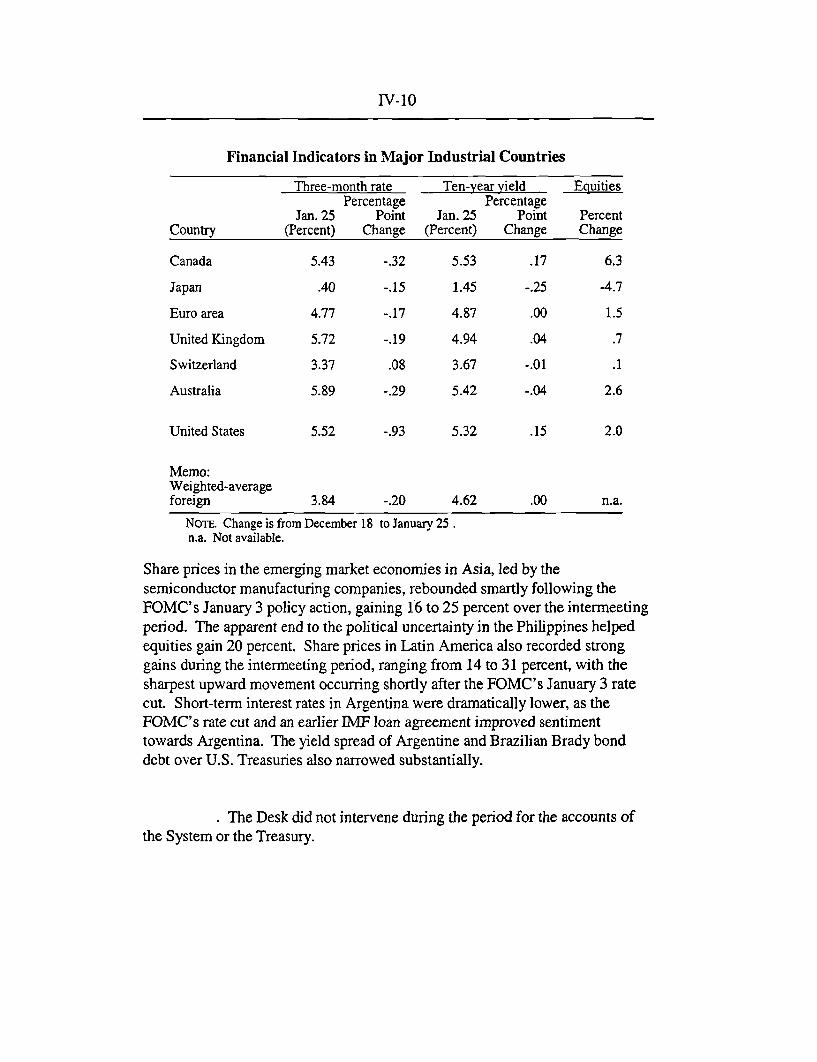
IV-10
Financial Indicators in Major Industrial Countries
Three-month rate Ten-year yield EquitiesPercentage Percentage
Jan. 25 Point Jan. 25 Point PercentCountry (Percent) Change (Percent) Change Change
Canada 5.43 -.32 5.53 .17 6.3
Japan .40 -.15 1.45 -.25 -4.7
Euro area 4.77 -.17 4.87 .00 1.5
United Kingdom 5.72 -.19 4.94 .04 .7
Switzerland 3.37 .08 3.67 -.01 .1
Australia 5.89 -.29 5.42 -.04 2.6
United States 5.52 -.93 5.32 .15 2.0
Memo:Weighted-averageforeign 3.84 -.20 4.62 .00 n.a.
NOTE. Change is from December 18n.a. Not available.
to January 25 .
Share prices in the emerging market economies in Asia, led by thesemiconductor manufacturing companies, rebounded smartly following theFOMC's January 3 policy action, gaining 16 to 25 percent over the intermeetingperiod. The apparent end to the political uncertainty in the Philippines helpedequities gain 20 percent. Share prices in Latin America also recorded stronggains during the intermeeting period, ranging from 14 to 31 percent, with thesharpest upward movement occurring shortly after the FOMC's January 3 ratecut. Short-term interest rates in Argentina were dramatically lower, as theFOMC's rate cut and an earlier IMF loan agreement improved sentimenttowards Argentina. The yield spread of Argentine and Brazilian Brady bonddebt over U.S. Treasuries also narrowed substantially.
.The Desk did not intervene during the period for the accounts ofthe System or the Treasury.
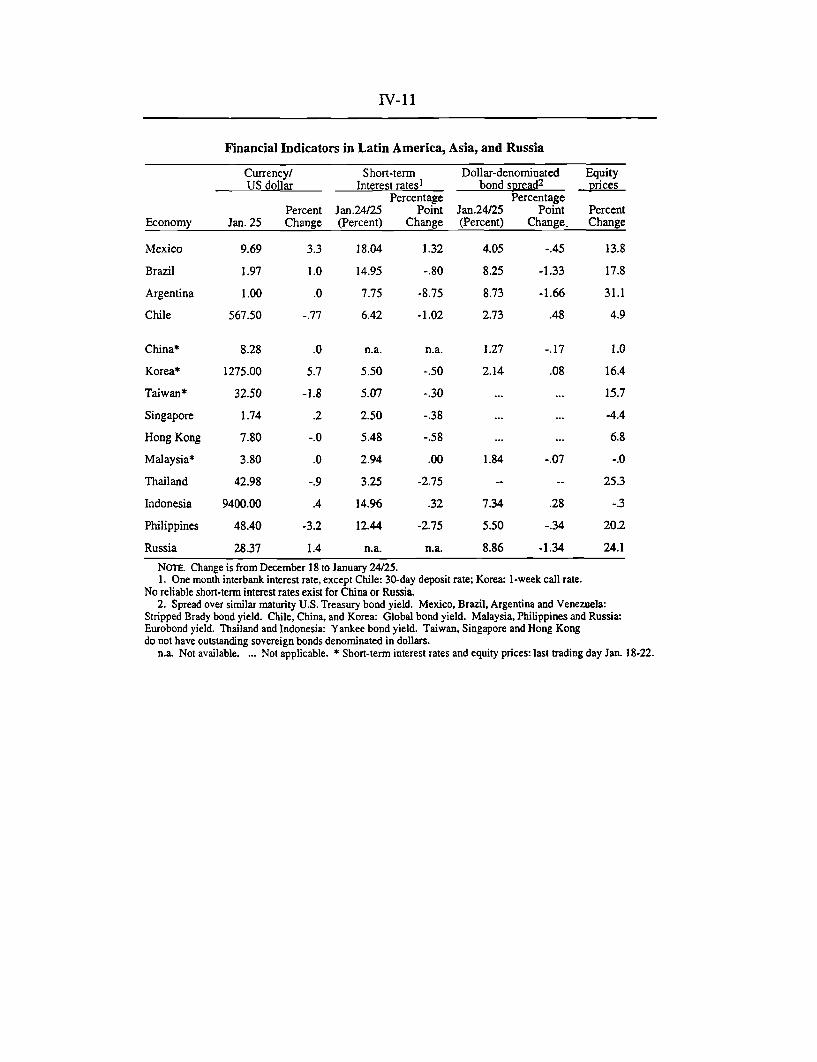
IV-11
Financial Indicators in Latin America, Asia, and Russia
Currency/ Short-term Dollar-denominated EquityUS dollar Interest rates1 bond spread2 prices
Percentage PercentagePercent Jan.24/25 Point Jan.24/25 Point Percent
Economy Jan. 25 Change (Percent) Change (Percent) Change. Change
Mexico 9.69 3.3 18.04 1.32 4.05 -.45 13.8
Brazil 1.97 1.0 14.95 -.80 8.25 -1.33 17.8
Argentina 1.00 .0 7.75 -8.75 8.73 -1.66 31.1
Chile 567.50 -.77 6.42 -1.02 2.73 .48 4.9
China* 8.28 .0 n.a. n.a. 1.27 -.17 1.0
Korea* 1275.00 5.7 5.50 -.50 2.14 .08 16.4
Taiwan* 32.50 -1.8 5.07 -.30 ... ... 15.7
Singapore 1.74 .2 2.50 -.38 ... ... -4.4
Hong Kong 7.80 -.0 5.48 -.58 ... ... 6.8
Malaysia* 3.80 .0 2.94 .00 1.84 -.07 -.0
Thailand 42.98 -.9 3.25 -2.75 - -- 25.3
Indonesia 9400.00 .4 14.96 .32 7.34 .28 -.3
Philippines 48.40 -3.2 12.44 -2.75 5.50 -.34 20.2
Russia 28.37 1.4 n.a. n.a. 8.86 -1.34 24.1
NOTE. Change is from December 18 to January 24/25.1. One month interbank interest rate, except Chile: 30-day deposit rate; Korea: 1-week call rate.
No reliable short-term interest rates exist for China or Russia.2. Spread over similar maturity U.S. Treasury bond yield. Mexico, Brazil, Argentina and Venezuela:
Stripped Brady bond yield. Chile, China, and Korea: Global bond yield. Malaysia, Philippines and Russia:Eurobond yield. Thailand and Indonesia: Yankee bond yield. Taiwan, Singapore and Hong Kongdo not have outstanding sovereign bonds denominated in dollars.
n.a. Not available. ... Not applicable. * Short-term interest rates and equity prices: last trading day Jan. 18-22.
IV-12
Developments in Foreign Industrial Countries
Recent information suggests the rate of expansion of activity moderated in majorforeign industrial countries in the fourth quarter. Euro-area data, although mixedacross economies, indicate growth continued to slow. The pace of the Canadianexpansion is estimated to have moderated, largely due to weaker exports to theUnited States. Growth in the United Kingdom seems to have declined to a ratecloser to trend, while the Japanese economy seems to have stagnated.
Continued high oil prices kept broad measures of inflation near their recentpeaks in December, but core inflation remained relatively subdued. Twelve-month consumer price inflation in the euro area was 2.6 percent, well above theEuropean Central Bank's 2 percent target ceiling, although core inflation(excluding food and energy prices) remained below 1-1/2 percent. Canadianconsumer price inflation breached the ceiling of the Bank of Canada's 1 percentto 3 percent inflation target band, while core inflation was 1.9 percent. In theUnited Kingdom, retail price inflation excluding mortgage interest paymentsremained below the 2-1/2 percent target rate. Japanese consumer price deflationpersisted at 1 percent.
In Japan, economic activity appears to have stagnated once again. The all-industry index of output, which includes both industrial production andindicators of activity in the service, construction, and public sectors was downabout 1/2 percent on average in October and November relative to the thirdquarter. Industrial production and service sector output were little changed fromtheir third-quarter levels, but weakness was evident in the construction industrywhere output was down about 3 percent. On the demand side, the householdsector remains sluggish; partial fourth-quarter data on real householdexpenditures and car registrations suggest that consumer spending may havefallen in the fourth quarter after having been little changed over the precedinghalf-year. Housing starts were also below their third-quarter level on average inOctober and November following two quarters of decline. Even privatenonresidential investment, which has been the strongest component in thetentative expansion so far, appears to be losing steam, as growth of both ordersand shipments of machinery slowed sharply in the fall following robust increasesearlier in the year.
Signals from the labor market are mixed. The unemployment rate rose by one-tenth of a percentage point to 4.8 percent in November, just below the recordhigh of 4.9 percent reached early last year. However, employment expanded fora second consecutive month, while an increase in job seekers boosted the ranksof the unemployed. Meanwhile, the job-offers-to-applicants ratio continued toedge up, to 0.65 percent, the highest level in almost three years. The high
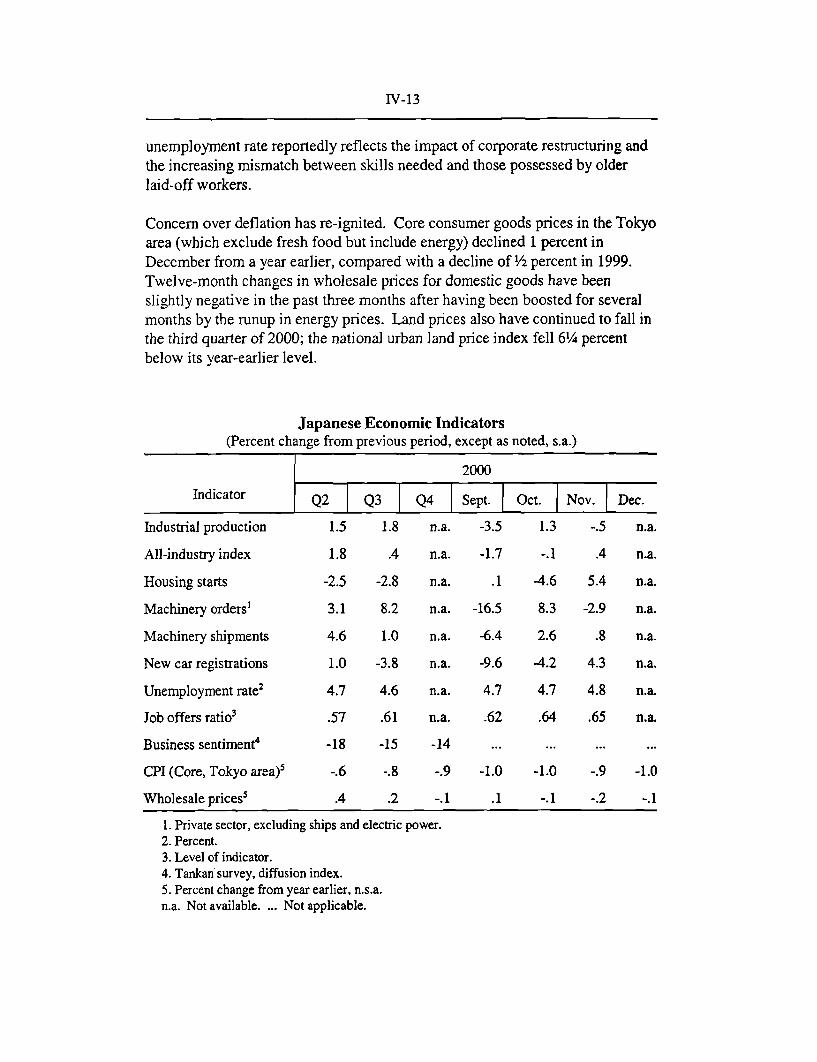
IV-13
unemployment rate reportedly reflects the impact of corporate restructuring andthe increasing mismatch between skills needed and those possessed by olderlaid-off workers.
Concern over deflation has re-ignited. Core consumer goods prices in the Tokyoarea (which exclude fresh food but include energy) declined 1 percent inDecember from a year earlier, compared with a decline of 1/2 percent in 1999.Twelve-month changes in wholesale prices for domestic goods have beenslightly negative in the past three months after having been boosted for severalmonths by the runup in energy prices. Land prices also have continued to fall inthe third quarter of 2000; the national urban land price index fell 6-1/4 percentbelow its year-earlier level.
Japanese Economic Indicators(Percent change from previous period, except as noted, s.a.)
2000
Indicator Q2 Q3 Q4 Sept. Oct. Nov. Dec.
Industrial production 1.5 1.8 n.a. -3.5 1.3 -.5 n.a.
All-industry index 1.8 .4 n.a. -1.7 -.1 .4 n.a.
Housing starts -2.5 -2.8 n.a. .1 -4.6 5.4 n.a.
Machinery orders1 3.1 8.2 n.a. -16.5 8.3 -2.9 n.a.
Machinery shipments 4.6 1.0 n.a. -6.4 2.6 .8 n.a.
New car registrations 1.0 -3.8 n.a. -9.6 -4.2 4.3 n.a.
Unemployment rate2 4.7 4.6 n.a. 4.7 4.7 4.8 n.a.
Job offers ratio3 .57 .61 n.a. .62 .64 .65 n.a.
Business sentiment4 -18 -15 -14 ... ......
CPI (Core, Tokyo area)5 -.6 -.8 -.9 -1.0 -1.0 -.9 -1.0
Wholesale prices 5 .4 .2 -.1 .1 -.1 -.2 -.1
1. Private sector, excluding ships and electric power.2. Percent.3. Level of indicator.4. Tankan survey, diffusion index.5. Percent change from year earlier, n.s.a.n.a. Not available. ... Not applicable.
IV-14
The merchandise trade surplus (customs clearance basis) for the first elevenmonths of 2000 was $104 billion (s.a.a.r.), down from $109 billion in the sameperiod last year, with exports up 16 percent and imports up 23 percent. Thedeveloping Asian countries have continued to account for most of the exportgain, although demand from those countries softened in the latter part of theyear, while higher oil prices have contributed significantly to the increase indollar-denominated imports.
Despite the weakness in the economy, the substantial government debt burden isbecoming an increasingly important constraint on fiscal policy. The Japanesecabinet has approved a draft budget for FY2001 which is contractionary evencompared with last year's initial budget. When last year's supplemental budgetis included, the year-over-year decline in fiscal spending, in the absence of afurther supplemental budget, would be about 8 percent (nearly 1-1/2 percent ofGDP), including a substantial decline in public works spending.
The rate of economic growth in the euro area continued to slow in the fourthquarter. Most of the slowdown is apparent in Germany, where industrialproduction was down 0.9 percent in October/November from the third quarteraverage owing to weak manufacturing activity. However, for the euro areaoverall, industrial production rose 0.8 percent in October/November from thethird quarter average. Additionally, the euro-area purchasing managers' surveycontinued to indicate an overall expansion in manufacturing activity, but moveddown for the eighth consecutive month in December, dropping to its lowest levelsince June 1999. Retail sales declined in the euro area overall in October;German sales recorded their third monthly decline in November. However, inFrance, consumption of manufactured goods rebounded in the fourth quarter tobe up 1/2 percent over the third quarter.
Business confidence in the euro area appears to have stabilized in recent months,while consumer confidence improved in December, bolstered by receding oilprices. Continued improvements in labor market conditions have also helpedraise consumer confidence. In Germany, the December unemployment ratedeclined for the ninth consecutive month to 9.2 percent, while in Italy theunemployment rate in the fourth quarter fell to 10 percent from 10-1/2 percent inthe third quarter.
Declining oil prices in December also helped contain consumer price inflation.Euro area consumer prices were unchanged (s.a.) in December from the previousmonth, and the 12-month rate of inflation fell to 2.6 percent (n.s.a.) but stillremained above the European Central Bank's 2 percent target ceiling. Coreconsumer prices (which exclude food and energy prices) rose a modest 0.1percent in December, leaving the 12-month rate of core inflation unchanged at
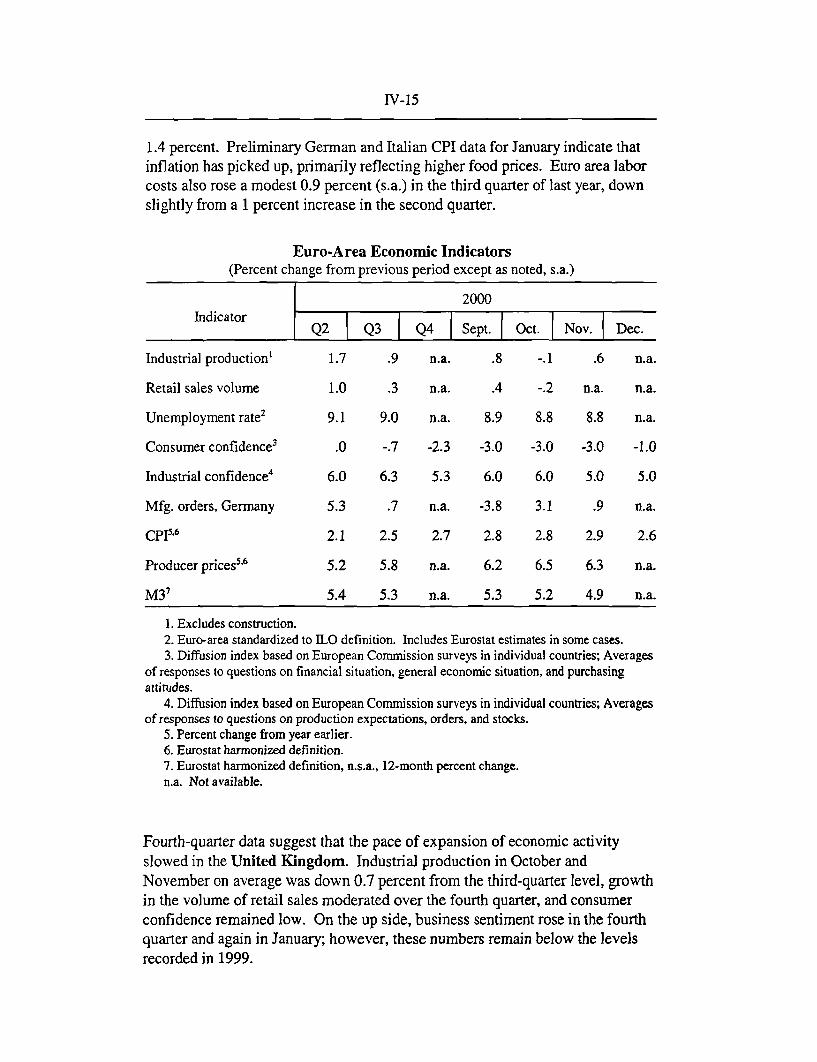
IV-15
1.4 percent. Preliminary German and Italian CPI data for January indicate thatinflation has picked up, primarily reflecting higher food prices. Euro area laborcosts also rose a modest 0.9 percent (s.a.) in the third quarter of last year, downslightly from a 1 percent increase in the second quarter.
Euro-Area Economic Indicators(Percent change from previous period except as noted, s.a.)
2000IndicatorIndicator Q2 Q3 Q4 Sept. Oct. Nov. Dec.
Industrial production' 1.7 .9 n.a. .8 -.1 .6 n.a.
Retail sales volume 1.0 .3 n.a. .4 -.2 n.a. n.a.
Unemployment rate2 9.1 9.0 n.a. 8.9 8.8 8.8 n.a.
Consumer confidence 3 .0 -.7 -2.3 -3.0 -3.0 -3.0 -1.0
Industrial confidence 4 6.0 6.3 5.3 6.0 6.0 5.0 5.0
Mfg. orders, Germany 5.3 .7 n.a. -3.8 3.1 .9 n.a.
CP' 6 2.1 2.5 2.7 2.8 2.8 2.9 2.6
Producer prices 5'6 5.2 5.8 n.a. 6.2 6.5 6.3 n.a.
M3' 5.4 5.3 n.a. 5.3 5.2 4.9 n.a.
1. Excludes construction.2. Euro-area standardized to ILO definition. Includes Eurostat estimates in some cases.3. Diffusion index based on European Commission surveys in individual countries; Averages
of responses to questions on financial situation, general economic situation, and purchasingattitudes.
4. Diffusion index based on European Commission surveys in individual countries; Averagesof responses to questions on production expectations, orders, and stocks.
5. Percent change from year earlier.6. Eurostat harmonized definition.7. Eurostat harmonized definition, n.s.a., 12-month percent change.n.a. Not available.
Fourth-quarter data suggest that the pace of expansion of economic activityslowed in the United Kingdom. Industrial production in October andNovember on average was down 0.7 percent from the third-quarter level, growthin the volume of retail sales moderated over the fourth quarter, and consumerconfidence remained low. On the up side, business sentiment rose in the fourthquarter and again in January; however, these numbers remain below the levelsrecorded in 1999.

IV-16
U.K. Economic Indicators(Percent change from previous period except as noted, s.a.)
2000IndicatorIndicator Q2 Q3 Q4 Oct. Nov. Dec. Jan.
Industrial production 1.3 .7 n.a. -.2 .1 n.a. n.a.
Retail sales .3 1.3 1.2 .0 .7 .1 n.a.
Unemployment rate'
Claims-based 3.8 3.6 3.6 3.6 3.6 3.6 n.a.
Labor force survey2 5.5 5.4 n.a 5.3 n.a. n.a. n.a.
Business confidence 3 -4.0 3.3 5.3 3.0 1.0 12.0 14.0
Retail prices4 2.1 2.1 2.1 2.0 2.2 2.0 n.a.
Producer input prices 5 11.4 12.1 n.a 13.0 10.8 n.a. n.a.
Average earnings 5 4.1 4.1 n.a 4.1 4.4 n.a. n.a.
1. Percent.2. Three-month average centered on month shown.3. Percentage of firms expecting output to increase in the next four months less percentage
expecting output to decrease.4. Excluding mortgage interest payments. Percent change from year earlier.5. Percent change from year earlier.n.a. Not available.
Labor market conditions remain tight. The official claims-based unemploymentrate remained at 3.6 percent in December, the lowest rate in 25 years. However,average annual earnings growth in November remained below the 4/2 percentrate that the Bank of England believes to be compatible with the inflation target.Producer input prices have been rising sharply, in part reflecting higher oilprices. Nevertheless, the twelve-month rate of retail price inflation (excludingmortgage interest payments) remains below the 2/2 percent target, as pricediscounting has continued in the goods sector.
In Canada, indicators available for the fourth quarter suggest that economicactivity continued to expand at a solid pace, although weak external demand andsoftening consumption slowed growth from earlier in the year. Real GDP,measured at factor cost, rose 6.2 percent (s.a.a.r.) in October. A broad-basedadvance in manufacturing production, particularly in the electronics sector, andcontinued gains in business services drove the strong growth. However, data onmerchandise trade and manufacturing shipments suggest that, outside of theenergy sector, manufacturing activity failed to expand in November. In addition,new orders for manufactured goods fell in November, while inventories

IV-17
expanded rapidly. Consumption activity also showed signs of slowing, asNovember retail sales were unchanged from October in real terms and housingstarts contracted in the fourth quarter.
Labor markets displayed continued strength, with employment rising a stronger-than-expected 3.2 percent (s.a.a.r.) in the fourth quarter. For the year,employment increased 2.6 percent, slightly below the pace of the previous twoyears. The unemployment rate was 6.8 percent in December, unchanged fromthe beginning of the year, as labor force participation rates rose along withemployment.
Canadian Economic Indicators(Percent change from previous period except as noted, s.a.)
2000
Indicator Q2 Q3 Q4 Sept. Oct. Nov. Dec.
GDP at factor cost 1.1 .9 n.a. .0 .5 n.a. n.a.
Industrial production 1.5 .6 n.a. -.6 1.0 n.a. n.a.
New mfg. orders 1.8 2.8 n.a. -3.4 4.6 -.1 n.a.
Retail sales 1.1 2.6 n.a. .4 -.7 .4 n.a.
Employment .4 .2 .8 .4 .1 .4 .2
Unemployment rate' 6.7 6.9 6.9 6.8 6.9 6.9 6.8
Consumer prices2 2.4 2.7 3.1 2.7 2.8 3.2 3.2
Consumer attitudes3 117.0 119.8 n.a. ... ...
Business confidence4 154.3 149.4 n.a. ... ... ...
1. Percent.2. Percent change from year earlier, n.s.a.n.a. Not available. ... Not applicable.
3. Level of index, 1991 = 100.4. Level of index, 1977 = 100.
The twelve-month rate of consumer price inflation remained steady at 3.2percent in December, above the ceiling of the Bank of Canada's 1 percent to3 percent target range. Higher energy prices continued to account for much ofthe increase in consumer prices, as the twelve-month core rate of inflation(which excludes food and energy prices) was a more moderate 1.9 percent inDecember. However, core inflation is now markedly higher than the I/2 percentrate recorded throughout much of 2000. On the other hand, wage increases havemoderated, with average hourly earnings rising 3.2 percent in the twelve monthsending in December, down from growth close to 4 percent earlier in the year.
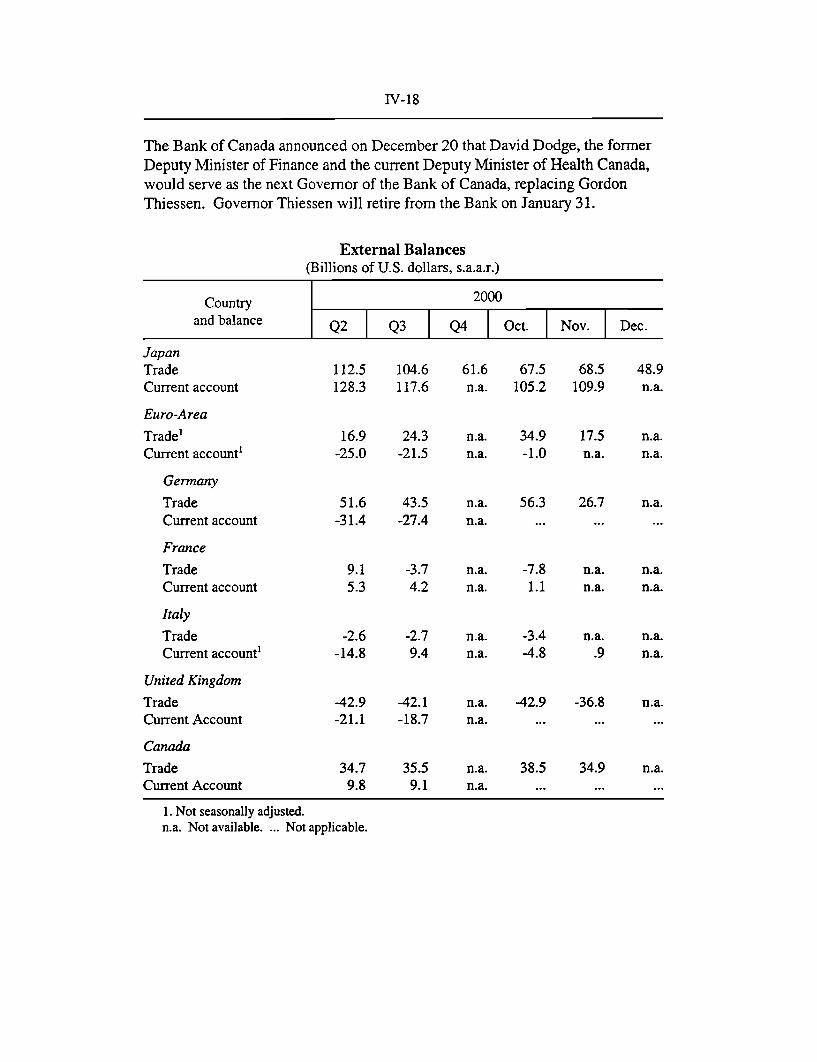
IV-18
The Bank of Canada announced on December 20 that David Dodge, the formerDeputy Minister of Finance and the current Deputy Minister of Health Canada,would serve as the next Governor of the Bank of Canada, replacing GordonThiessen. Governor Thiessen will retire from the Bank on January 31.
External Balances(Billions of U.S. dollars, s.a.a.r.)
JapanTradeCurrent account
Euro-Area
Trade'Current account'
Germany
TradeCurrent account
France
TradeCurrent account
Italy
TradeCurrent account'
United Kingdom
TradeCurrent Account
Canada
TradeCurrent Account
112.5 104.6 61.6 67.5 68.5 48.9128.3 117.6 n.a. 105.2 109.9 n.a.
16.9 24.3 n.a. 34.9 17.5 n.a.-25.0 -21.5 n.a. -1.0 n.a. n.a.
51.6 43.5 n.a. 56.3 26.7 n.a.-31.4 -27.4 n.a. ......
-3.7 n.a.4.2 n.a.
-2.6 -2.7 n.a. -3.4-14.8 9.4 n.a. -4.8
-7.8 n.a. n.a.1.1 n.a. n.a.
n.a. n.a..9 n.a.
-42.9 -42.1 n.a. -42.9 -36.8-21.1 -18.7 n.a.......
34.79.8
35.5 n.a. 38.5 34.99.1 n.a....
1. Not seasonally adjusted.n.a. Not available. ... Not applicable.
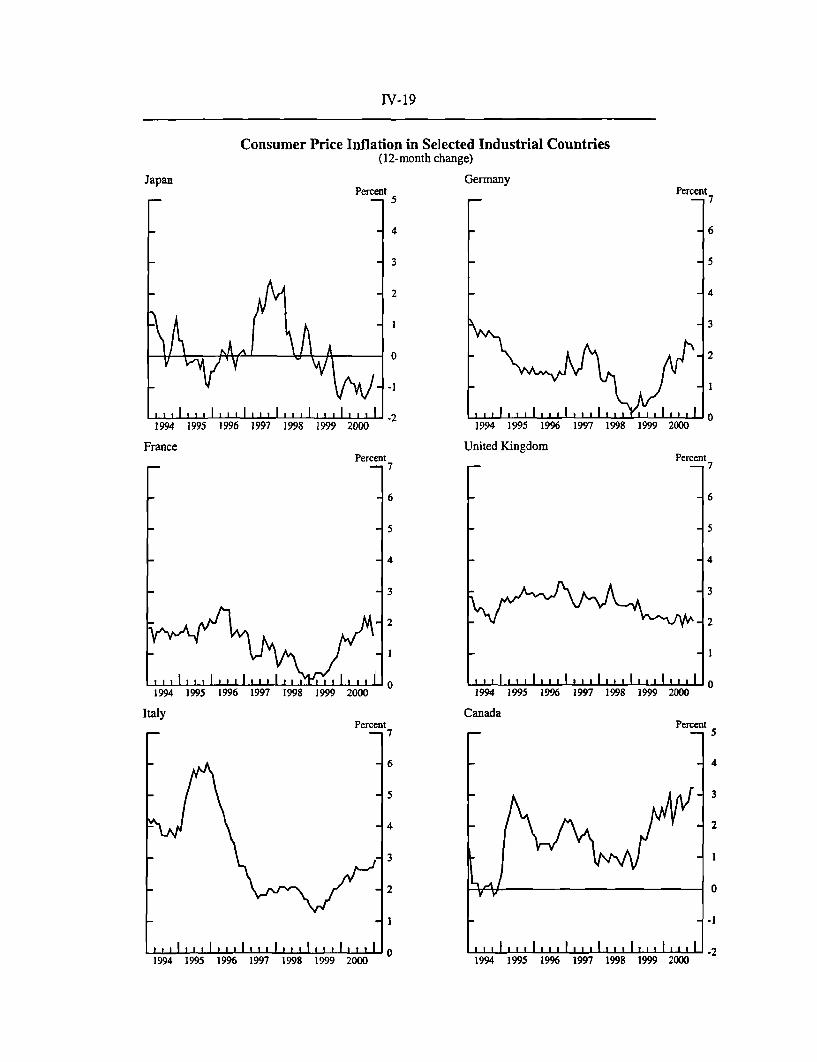
IV-19
Consumer Price Inflation in Selected Industrial Countries(12-month change)
Japan GermanyPercent Percent
- 5 - 7
4 -6
3 -5
2 4
S-1 -3
S- - 21
-2 01994 1995 1996 1997 1998 1999 2000 1994 1995 1996 1997 1998 1999 2000
France United KingdomPercent Percent
7 -- 7
6 -6
5 -5
4 - - 4
3 3
2 2v V -
o 0 .I I I.. , I I,, 01994 1995 1996 1997 1998 1999 2000 1994 1995 1996 1997 1998 1999 2000
Italy CanadaPercent Percent
- -7 -- 5
6 4
5 3
4 2
3 1
2 0
1 - -1
1994 1995 1996 1997 1998 1999 2000II l I, 1 ,1 ,. 1,, 11 . 1 ,, I , I 11994 1995 1996 1997 1998 1999 2000

IV-20
Industrial Production in Selected Industrial Countries1994=100 Germany
c
lit 7 IllIIIII.l tils IlI
1994 1995 1996 1997 1998 1999 2000
France
1 1 , I , , , 1 1 I, , I I I , I I , I , , I ,I1994 1995 1996 1997 1998 1999 2000
United Kingdom
1
1994 1995 1996 1997 1998 1999 2000
Japan 1994=100
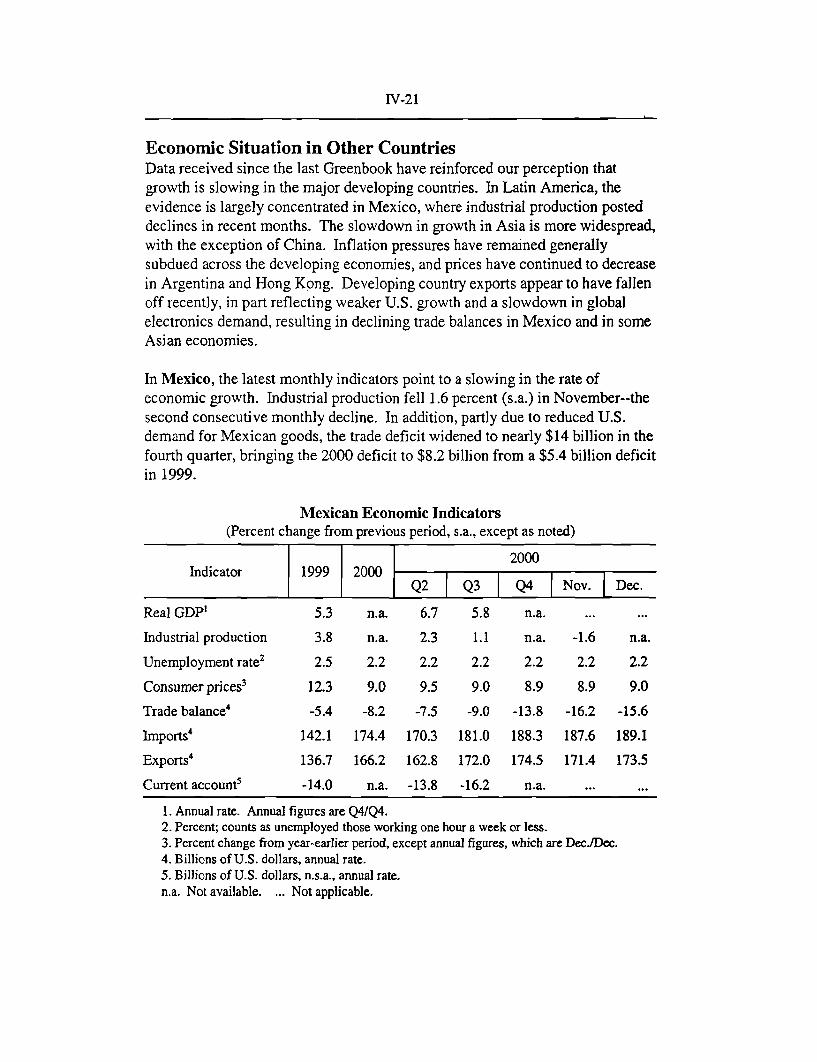
IV-21
Economic Situation in Other CountriesData received since the last Greenbook have reinforced our perception thatgrowth is slowing in the major developing countries. In Latin America, theevidence is largely concentrated in Mexico, where industrial production posteddeclines in recent months. The slowdown in growth in Asia is more widespread,with the exception of China. Inflation pressures have remained generallysubdued across the developing economies, and prices have continued to decreasein Argentina and Hong Kong. Developing country exports appear to have fallenoff recently, in part reflecting weaker U.S. growth and a slowdown in globalelectronics demand, resulting in declining trade balances in Mexico and in someAsian economies.
In Mexico, the latest monthly indicators point to a slowing in the rate ofeconomic growth. Industrial production fell 1.6 percent (s.a.) in November--thesecond consecutive monthly decline. In addition, partly due to reduced U.S.demand for Mexican goods, the trade deficit widened to nearly $14 billion in thefourth quarter, bringing the 2000 deficit to $8.2 billion from a $5.4 billion deficitin 1999.
Mexican Economic Indicators(Percent change from previous period, s.a., except as noted)
2000Indicator 1999 2000 Q2 QNov.
Q2 Q3 Q4 Nov. Dec.
Real GDP' 5.3 n.a. 6.7 5.8 n.a. ...
Industrial production 3.8 n.a. 2.3 1.1 n.a. -1.6 n.a.
Unemployment rate2 2.5 2.2 2.2 2.2 2.2 2.2 2.2
Consumer prices3 12.3 9.0 9.5 9.0 8.9 8.9 9.0
Trade balance4 -5.4 -8.2 -7.5 -9.0 -13.8 -16.2 -15.6
Imports4 142.1 174.4 170.3 181.0 188.3 187.6 189.1
Exports4 136.7 166.2 162.8 172.0 174.5 171.4 173.5
Current account5 -14.0 n.a. -13.8 -16.2 n.a. .
1. Annual rate. Annual figures are Q4/Q4.2. Percent; counts as unemployed those working one hour a week or less.3. Percent change from year-earlier period, except annual figures, which are Dec/Dec.4. Billions of U.S. dollars, annual rate.5. Billions of U.S. dollars, n.s.a., annual rate.n.a. Not available. ... Not applicable.
IV-22
Inflation in 2000 came in at 9.0 percent, well below the Bank of Mexico's(BOM) 10 percent target. However, BOM's target of 6.5 percent inflation for2001 is generally considered to be ambitious. Already this year, the BOM hastightened monetary policy, responding to survey expectations of 2001 inflationthat were running over a percentage point higher than the target.
In late December, the Mexican congress approved the 2001 fiscal budget. Thepassage of the budget, by near consensus, before the year-end deadline, andthrough the politically divided Congress, represents a victory for the Foxgovernment. In order to persuade lawmakers to pass the budget before thedeadline, the government agreed to widen the budget deficit to 0.65 percent ofGDP from the original proposal of 0.5 percent of GDP. Nevertheless, theapproved budget should narrow the deficit relative to the estimated 2000 deficitof 1.1 percent of GDP and represents significant fiscal tightening, especiallygiven expectations of lower output growth and a sizable decline in oil prices. Inaddition, if government revenues fall between one and five percent belowbudgeted revenues, the government is authorized to cut expenditures withoutprior approval from Congress in order to achieve the budget deficit target.
In Argentina, economic data since the last Greenbook were mixed, whilefinancial market conditions improved markedly after the FOMC's policy easingon January 3. GDP fell 6 percent (s.a.a.r.) in the third quarter, reflecting a largedecline in investment. For the fourth quarter, however, industrial productionshowed signs of improvement--rising 1-1/2 percent. Nevertheless, the level ofprices was about percent below its year-earlier level. Export growth remainedrobust through November while imports fell more than 5 percent from a yearago, with notable declines in capital goods imports. Early indicators for Januaryare more encouraging. January consumer confidence rebounded to levels notseen since mid-2000, although still well below the end-1999 level. In addition,private sector bank deposits jumped to a three-month high (n.s.a.) in earlyJanuary, making up much of the ground lost in the last quarter of 2000.
In mid-December, the Argentine government formally announced the details ofan IMF-led assistance package. The total amount of the three-year package isnearly $40 billion--about $14 billion from the IMF, $5 billion from the WorldBank and IADB, $1 billion from Spain, and the remaining $20 billion fromprivate sector sources. Before year-end, Argentina drew $2 billion in IMF fundsavailable under its previous stand-by arrangement that was subsumed in the newprogram. Argentina accessed another $3 billion in IMF funds in mid-Januaryfollowing the approval of the new, enlarged stand-by program by the IMFExecutive Board. The announcement of the package, the surprise intermeetingrate cut by the FOMC, and the final IMF approval all contributed to improvingfinancial market conditions in Argentina. Since mid-December, the Argentine

IV-23
stock market has risen about 25 percent, spreads on Argentine sovereign bondshave fallen almost 150 basis points, and domestic interest rates on 30-day pesodeposits have declined around 875 basis points.
Argentine Economic Indicators(Percent change from previous period, s.a., except as noted)
2000Indicator 1999 2000 Q2 Q3 Nov.
Q2 Q3 Q4 Nov. Dec.
Real GDP' -.3 n.a. .6 -6.0 n.a. ... ...
Industrial production -6.0 1.7 -4.2 -2.0 1.5 1.5 4.1
Unemployment rate 2 13.8 15.1 15.4 ... 14.7 ...
Consumer prices3 -1.8 -.8 -1.1 -.9 -.7 -.7 -.8
Trade balance4 -.8 n.a. .8 2.3 n.a. 2.8 n.a.
Current account5 -12.3 n.a. -5.7 -9.7 n.a. ...
1. Annual rate. Annual figures are Q4/Q4.2. Percent, n.s.a. Data are released for May and October only. Figures for Q2 and Q4 reflect
data for May and October, respectively.3. Percent change from year-earlier period, except annual figures, which are Dec./Dec.4. Billions of U.S. dollars, annual rate.5. Billions of U.S. dollars, n.s.a., annual rate.n.a. Not available. ... Not applicable.
In Brazil, recent evidence points to continued strong economic activity, althoughthere are hints of some deceleration in the fourth quarter. Industrial productionedged down in November, after a 1.7 percent (s.a.) increase in October. Theunemployment rate was stable in November and the level of employment hasbeen basically flat since September. Consumer price inflation (as measured bythe IPC-A index) ended the year at 6 percent, down from nearly 9 percent in1999, despite large increases in fuel prices.
On January 17, the Brazilian central bank's monetary policy committee loweredits benchmark Selic rate 50 basis points to 15-1/4 percent and retained its neutralbias on future moves. This action puts the Selic at its lowest level since the realwas created in 1994. It was the second month in a row that the central bankeased rates, taking advantage of falling U.S. interest rates and low domesticinflation.

IV-24
Brazilian Economic Indicators(Percent change from previous period, s.a., except as noted)
2000Indicator 1999 2000 I
Q2 Q3 Q4 Nov. Dec.
Real GDP' 3.5 n.a. 2.1 4.8 n.a. ... ...
Industrial production -.7 n.a. .3 1.2 n.a. -.2 n.a.
Unemployment rate2 7.6 7.1 7.2 7.0 6.7 7.0 5.9
Consumer prices3 8.9 6.0 6.6 7.6 6.2 6.0 6.0
Trade balance4 -1.2 -0.7 -1.2 -1.6 -1.5 -1.4 -2.1
Current account 5 -25.1 n.a. -28.2 -18.0 n.a. 30.7 n.a.
1. Annual rate. Annual figures are Q4/Q4.2. Percent.. "Open" unemployment rate.3. Percent change from year-earlier period, except annual figures, which are Dec./Dec. Price
index is IPC-A.4. Billions of U.S. dollars, annual rate.5. Billions of U.S. dollars, n.s.a., annual rate.n.a. Not available. ... Not applicable.
In late December, Brazil's congress approved the 2001 federal governmentbudget. The budget calls for a primary (non-interest) surplus consistent with aprimary (non-interest) surplus for the entire public sector of 3 percent of GDP,down from about 3% percent of GDP in 2000. In January, S&P raised its creditrating for the Brazilian government's long-term foreign-currency debt from B+to BB-, citing Brazil's improved fiscal and monetary performance, including thecongressional approval of the federal government budget. Also in January, theBrazilian federal government launched five- and ten-year bond issues totaling$2.5 billion.
In Venezuela, output growth rose sharply in the fourth quarter, and upwardrevisions in previous quarterly figures point to a 5.6 percent growth rate over thefour quarters ended 2000Q4. Last year's recovery primarily reflects strength inthe oil-related and public sectors. Inflation over the twelve months endedDecember was 13.3 percent--the lowest annual inflation figure in almost fifteenyears. Strong oil revenues led to a $13.4 billion (1212 percent of GDP) currentaccount balance in 2000.
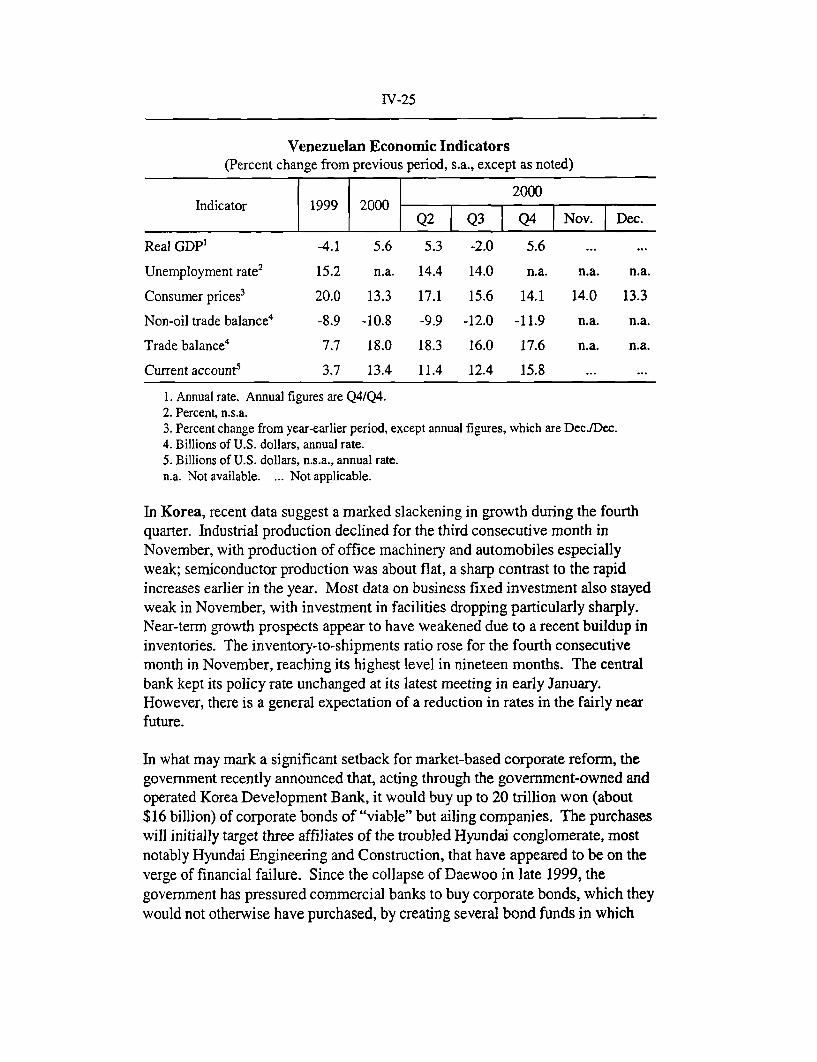
IV-25
Venezuelan Economic Indicators(Percent change from previous period, s.a., except as noted)
2000Indicator 1999 2000 Q2 Q3 Q4
Q2 Q3 Q4 Nov. Dec.
Real GDP' -4.1 5.6 5.3 -2.0 5.6 ...
Unemployment rate2 15.2 n.a. 14.4 14.0 n.a. n.a. n.a.
Consumer prices3 20.0 13.3 17.1 15.6 14.1 14.0 13.3
Non-oil trade balance4 -8.9 -10.8 -9.9 -12.0 -11.9 n.a. n.a.
Trade balance4 7.7 18.0 18.3 16.0 17.6 n.a. n.a.
Current account 5 3.7 13.4 11.4 12.4 15.8 ...
1. Annual rate. Annual figures are Q4/Q4.2. Percent, n.s.a.3. Percent change from year-earlier period, except annual figures, which are Dec./Dec.4. Billions of U.S. dollars, annual rate.5. Billions of U.S. dollars, n.s.a., annual rate.n.a. Not available. ... Not applicable.
In Korea, recent data suggest a marked slackening in growth during the fourthquarter. Industrial production declined for the third consecutive month inNovember, with production of office machinery and automobiles especiallyweak; semiconductor production was about flat, a sharp contrast to the rapidincreases earlier in the year. Most data on business fixed investment also stayedweak in November, with investment in facilities dropping particularly sharply.Near-term growth prospects appear to have weakened due to a recent buildup ininventories. The inventory-to-shipments ratio rose for the fourth consecutivemonth in November, reaching its highest level in nineteen months. The centralbank kept its policy rate unchanged at its latest meeting in early January.However, there is a general expectation of a reduction in rates in the fairly nearfuture.
In what may mark a significant setback for market-based corporate reform, thegovernment recently announced that, acting through the government-owned andoperated Korea Development Bank, it would buy up to 20 trillion won (about$16 billion) of corporate bonds of "viable" but ailing companies. The purchaseswill initially target three affiliates of the troubled Hyundai conglomerate, mostnotably Hyundai Engineering and Construction, that have appeared to be on theverge of financial failure. Since the collapse of Daewoo in late 1999, thegovernment has pressured commercial banks to buy corporate bonds, which theywould not otherwise have purchased, by creating several bond funds in which
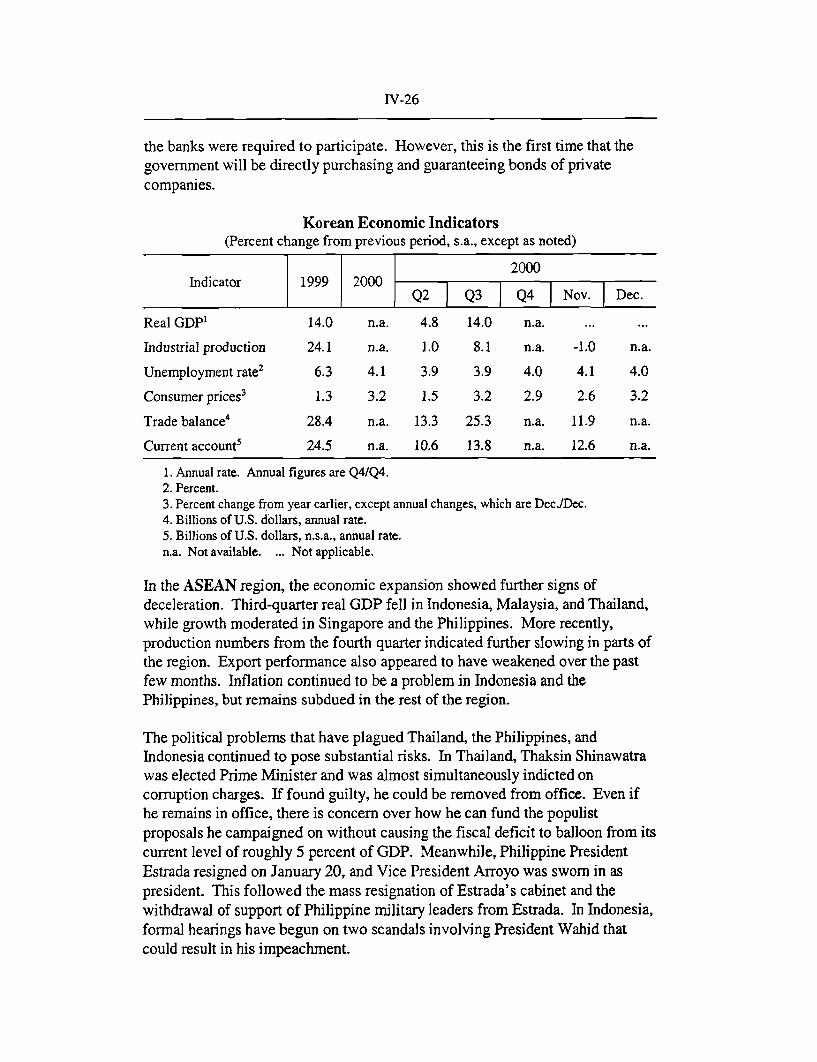
IV-26
the banks were required to participate. However, this is the first time that thegovernment will be directly purchasing and guaranteeing bonds of privatecompanies.
Korean Economic Indicators(Percent change from previous period, s.a., except as noted)
2000Indicator 1999 2000 2
Q2 Q3 Q4 Nov. Dec.
Real GDP' 14.0 n.a. 4.8 14.0 n.a. ... ...
Industrial production 24.1 n.a. 1.0 8.1 n.a. -1.0 n.a.
Unemployment rate 2 6.3 4.1 3.9 3.9 4.0 4.1 4.0
Consumer prices3 1.3 3.2 1.5 3.2 2.9 2.6 3.2
Trade balance4 28.4 n.a. 13.3 25.3 n.a. 11.9 n.a.
Current account 5 24.5 n.a. 10.6 13.8 n.a. 12.6 n.a.
1. Annual rate. Annual figures are Q4/Q4.2. Percent.3. Percent change from year earlier, except annual changes, which are Dec./Dec.4. Billions of U.S. dollars, annual rate.5. Billions of U.S. dollars, n.s.a., annual rate.n.a. Not available, ... Not applicable.
In the ASEAN region, the economic expansion showed further signs ofdeceleration. Third-quarter real GDP fell in Indonesia, Malaysia, and Thailand,while growth moderated in Singapore and the Philippines. More recently,production numbers from the fourth quarter indicated further slowing in parts ofthe region. Export performance also appeared to have weakened over the pastfew months. Inflation continued to be a problem in Indonesia and thePhilippines, but remains subdued in the rest of the region.
The political problems that have plagued Thailand, the Philippines, andIndonesia continued to pose substantial risks. In Thailand, Thaksin Shinawatrawas elected Prime Minister and was almost simultaneously indicted oncorruption charges. If found guilty, he could be removed from office. Even ifhe remains in office, there is concern over how he can fund the populistproposals he campaigned on without causing the fiscal deficit to balloon from itscurrent level of roughly 5 percent of GDP. Meanwhile, Philippine PresidentEstrada resigned on January 20, and Vice President Arroyo was sworn in aspresident. This followed the mass resignation of Estrada's cabinet and thewithdrawal of support of Philippine military leaders from Estrada. In Indonesia,formal hearings have begun on two scandals involving President Wahid thatcould result in his impeachment.
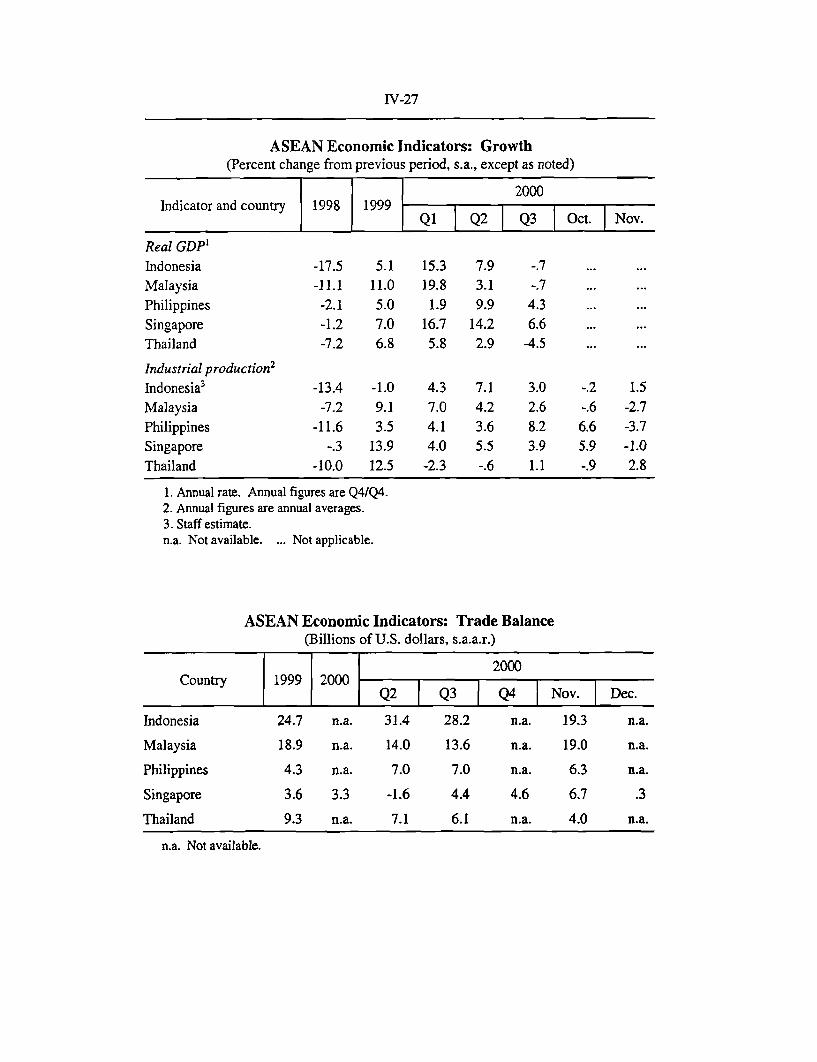
IV-27
ASEAN Economic Indicators: Growth(Percent change from previous period, s.a., except as noted)
2000Indicator and country 1998 1999
Q1 Q2 Q3 Oct. Nov.
Real GDP'IndonesiaMalaysiaPhilippinesSingaporeThailand
Industrial production2
Ind
MaPhSinTh
-17.5 5.1 15.3 7.9-11.1 11.0 19.8 3.1
-2.1 5.0 1.9 9.9-1.2 7.0 16.7 14.2-7.2 6.8 5.8 2.9
lonesia' -13.4 -1.0 4.3 7.1ilaysia -7.2 9.1 7.0 4.2ilippines -11.6 3.5 4.1 3.6igapore -.3 13.9 4.0 5.5ailand -10.0 12.5 -2.3 -.6
1. Annual rate. Annual figures are Q4/Q4.2. Annual figures are annual averages.3. Staff estimate.n.a. Not available. ... Not applicable.
-.2 1.5-.6 -2.7
6.6 -3.75.9 -1.0-.9 2.8
ASEAN Economic Indicators: Trade Balance(Billions of U.S. dollars, s.a.a.r.)
2000Country 1999 2000 Q Q ov Dec.
Q2 Q3 Q4 Nov. Dec.
Indonesia 24.7 n.a. 31.4 28.2 n.a. 19.3 n.a.
Malaysia 18.9 n.a. 14.0 13.6 n.a. 19.0 n.a.
Philippines 4.3 n.a. 7.0 7.0 n.a. 6.3 n.a.
Singapore 3.6 3.3 -1.6 4.4 4.6 6.7 .3
Thailand 9.3 n.a. 7.1 6.1 n.a. 4.0 n.a.
n.a. Not available.

IV-28
ASEAN Economic Indicators: CPI Inflation(Percent change from year earlier, except as noted)
2000Country 19991 20001 Q2Q4 No
Q2 Q3 Q4 Nov. Dec.
Indonesia 2.0 9.3 1.2 5.8 8.8 9.1 9.3
Malaysia 2.5 1.4 1.4 1.5 1.8 1.9 1.4
Philippines 4.3 6.6 3.9 4.5 5.9 6.0 6.6
Singapore .9 n.a. .8 1.4 n.a. 2.0 n.a.
Thailand .7 1.3 1.6 2.2 1.6 1.7 1.3
1. December/December.n.a. Not available.
China continued to register robust economic growth, supported by substantialgovernment spending and rising consumption expenditures. Real GDP rose7-1/2 percent (s.a.a.r.) in the fourth quarter, taking the year-over-year growth ratefor 2000 to 8 percent. Recent statements from various government officialsindicate that the government expects the economy to expand at a similar rate thisyear, despite a projected slowdown in exports. Exports slumped sharply (s.a.) inDecember as global demand softened. However, an even larger decline inimports--particularly intermediate goods imports--resulted in a widening of thetrade surplus. Inflation remained low, although the twelve-month inflation ratecontinued to edge up and hit a three-year high of 1-1/2 percent in December.
According to government figures, China's industrial firms (including state-owned enterprises) recorded profits of $45 billion in the first eleven months oflast year, up 92 percent compared with the same period in 1999. The figuresprompted the government to declare that it had met its 1997 target of turningaround most ailing state-owned enterprises within three years. Analystsgenerally agree that part of the improved performance last year was due tocontinued lay-offs as a result of restructuring and higher revenues reflectingstronger economic activity. Some of the profit increases likely also reflectedreductions in interest payments (for example, because of lower interest rates anddebt-equity swaps).
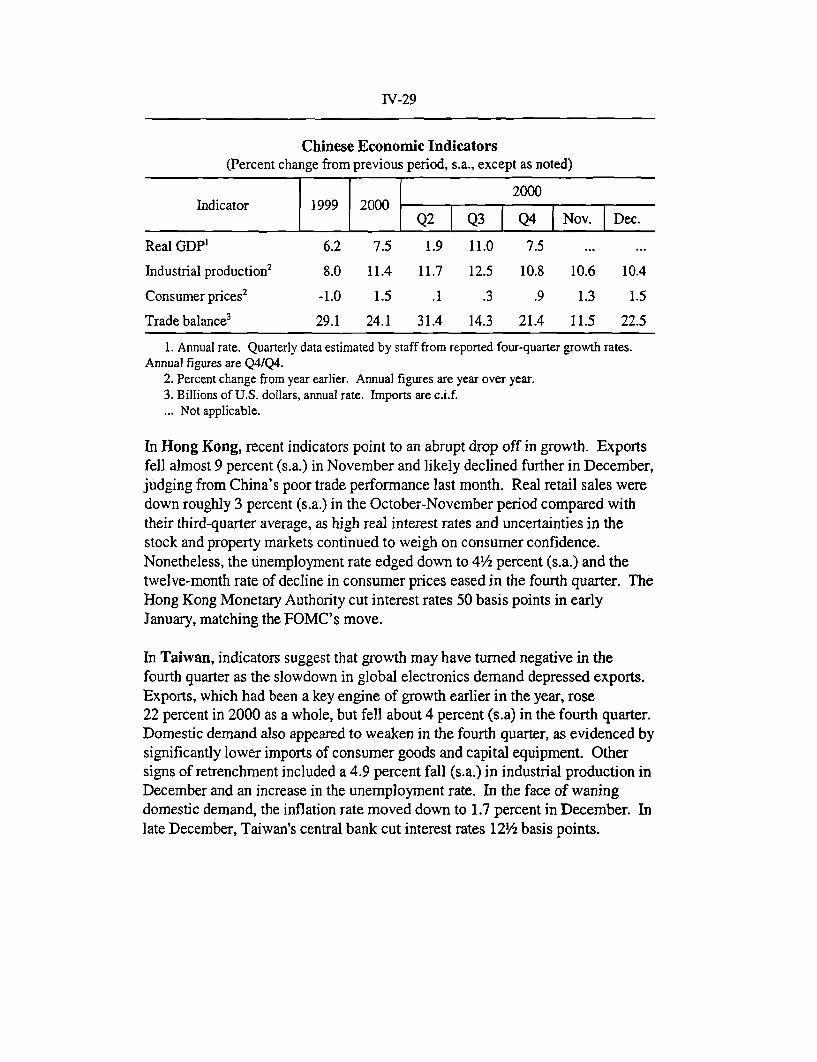
IV-29
Chinese Economic Indicators(Percent change from previous period, s.a., except as noted)
2000Indicator 1999 2000
Q2 Q3 Q4 Nov. Dec.
Real GDP1 6.2 7.5 1.9 11.0 7.5 ...
Industrial production2 8.0 11.4 11.7 12.5 10.8 10.6 10.4
Consumer prices2 -1.0 1.5 .1 .3 .9 1.3 1.5
Trade balance3 29.1 24.1 31.4 14.3 21.4 11.5 22.5
1. Annual rate. Quarterly data estimated by staff from reported four-quarter growth rates.Annual figures are Q4/Q4.
2. Percent change from year earlier. Annual figures are year over year.3. Billions of U.S. dollars, annual rate. Imports are c.i.f.... Not applicable.
In Hong Kong, recent indicators point to an abrupt drop off in growth. Exportsfell almost 9 percent (s.a.) in November and likely declined further in December,judging from China's poor trade performance last month. Real retail sales weredown roughly 3 percent (s.a.) in the October-November period compared withtheir third-quarter average, as high real interest rates and uncertainties in thestock and property markets continued to weigh on consumer confidence.Nonetheless, the unemployment rate edged down to 41/2 percent (s.a.) and thetwelve-month rate of decline in consumer prices eased in the fourth quarter. TheHong Kong Monetary Authority cut interest rates 50 basis points in earlyJanuary, matching the FOMC's move.
In Taiwan, indicators suggest that growth may have turned negative in thefourth quarter as the slowdown in global electronics demand depressed exports.Exports, which had been a key engine of growth earlier in the year, rose22 percent in 2000 as a whole, but fell about 4 percent (s.a) in the fourth quarter.Domestic demand also appeared to weaken in the fourth quarter, as evidenced bysignificantly lower imports of consumer goods and capital equipment. Othersigns of retrenchment included a 4.9 percent fall (s.a.) in industrial production inDecember and an increase in the unemployment rate. In the face of waningdomestic demand, the inflation rate moved down to 1.7 percent in December. Inlate December, Taiwan's central bank cut interest rates 12'/2 basis points.
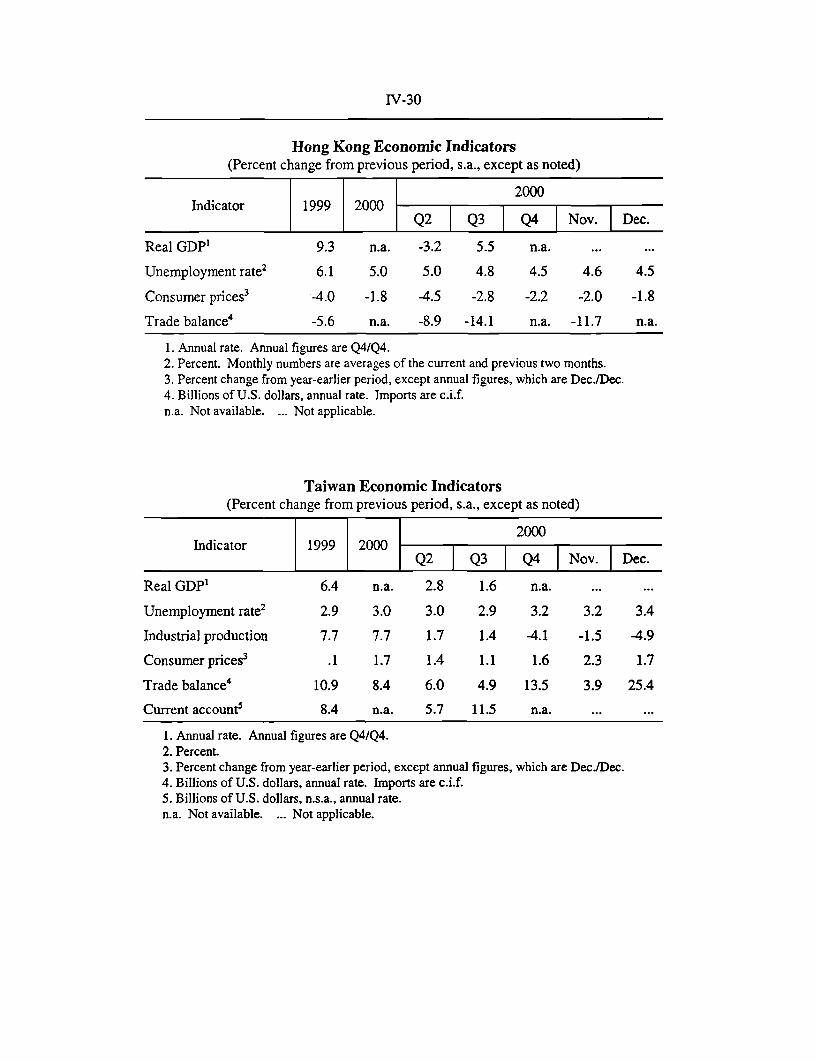
IV-30
Hong Kong Economic Indicators(Percent change from previous period, s.a., except as noted)
2000Indicator 1999 2000 I
Q2 Q3 Q4 Nov. Dec.
Real GDP' 9.3 n.a. -3.2 5.5 n.a. ... ...
Unemployment rate2 6.1 5.0 5.0 4.8 4.5 4.6 4.5
Consumer prices3 -4.0 -1.8 -4.5 -2.8 -2.2 -2.0 -1.8
Trade balance4 -5.6 n.a. -8.9 -14.1 n.a. -11.7 n.a.
1. Annual rate. Annual figures are Q4/Q4.2. Percent. Monthly numbers are averages of the current and previous two months.3. Percent change from year-earlier period, except annual figures, which are Dec.Dec.4. Billions of U.S. dollars, annual rate. Imports are c.i.f.n.a. Not available. ... Not applicable.
Taiwan Economic Indicators(Percent change from previous period, s.a., except as noted)
2000Indicator 1999 2000 Q I -
Q2 Q3 Q4 Nov. Dec.
Real GDP' 6.4 n.a. 2.8 1.6 n.a. ...
Unemployment rate2 2.9 3.0 3.0 2.9 3.2 3.2 3.4
Industrial production 7.7 7.7 1.7 1.4 -4.1 -1.5 -4.9
Consumer prices3 .1 1.7 1.4 1.1 1.6 2.3 1.7
Trade balance4 10.9 8.4 6.0 4.9 13.5 3.9 25.4
Current account5 8.4 n.a. 5.7 11.5 n.a. ...
1. Annual rate. Annual figures are Q4/Q4.2. Percent.3. Percent change from year-earlier period, except annual figures, which are Dec.Dec.4. Billions of U.S. dollars, annual rate. Imports are c.i.f.5. Billions of U.S. dollars, n.s.a., annual rate.n.a. Not available. ... Not applicable.