Embed Size (px)
Citation preview

INFORME
FINANCIERO
Enero - Diciembre
2013
ENERO - DICIEMBRE
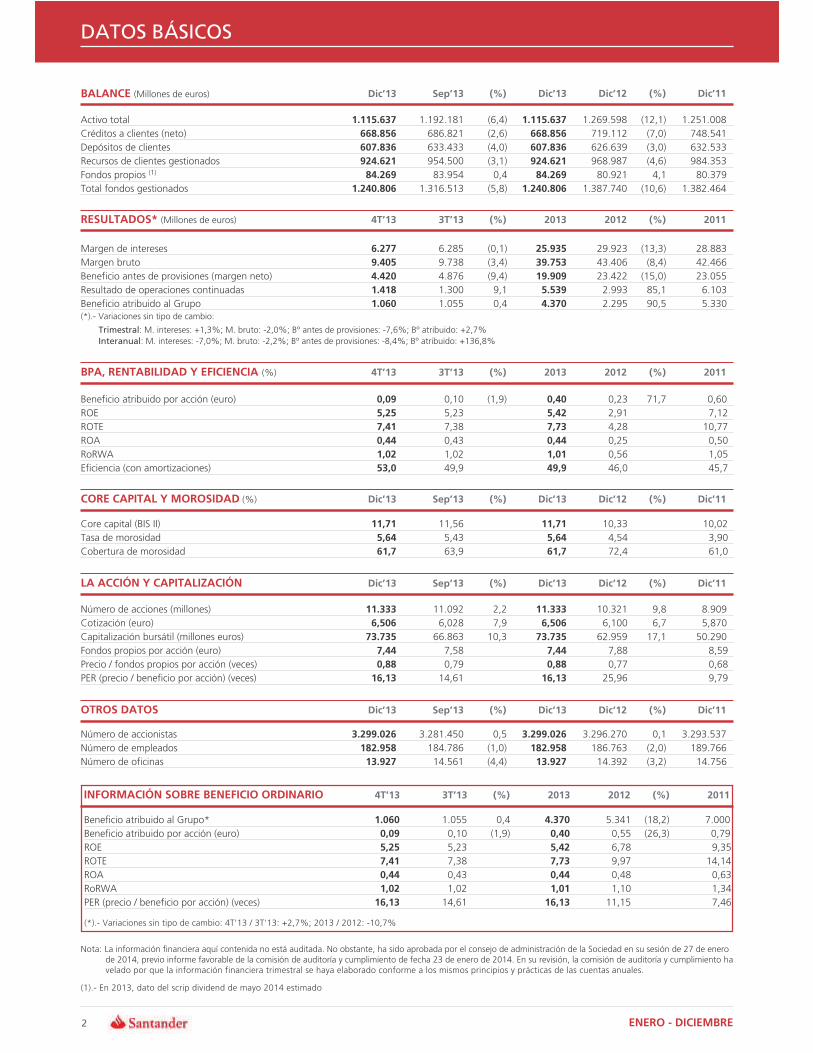
DATOS BŸSICOS
BALANCE (Millones de euros) Dic»13 Sep»13 (%) Dic»13 Dic»12 (%) Dic»11
Activo total 1.115.637 1.192.181 (6,4) 1.115.637 1.269.598 (12,1) 1.251.008
Créditos a clientes (neto) 668.856 686.821 (2,6) 668.856 719.112 (7,0) 748.541
Depósitos de clientes 607.836 633.433 (4,0) 607.836 626.639 (3,0) 632.533
Recursos de clientes gestionados 924.621 954.500 (3,1) 924.621 968.987 (4,6) 984.353
Fondos propios (1) 84.269 83.954 0,4 84.269 80.921 4,1 80.379
Total fondos gestionados 1.240.806 1.316.513 (5,8) 1.240.806 1.387.740 (10,6) 1.382.464
RESULTADOS* (Millones de euros) 4T»13 3T»13 (%) 2013 2012 (%) 2011
Margen de intereses 6.277 6.285 (0,1) 25.935 29.923 (13,3) 28.883
Margen bruto 9.405 9.738 (3,4) 39.753 43.406 (8,4) 42.466
Beneficio antes de provisiones (margen neto) 4.420 4.876 (9,4) 19.909 23.422 (15,0) 23.055
Resultado de operaciones continuadas 1.418 1.300 9,1 5.539 2.993 85,1 6.103
Beneficio atribuido al Grupo 1.060 1.055 0,4 4.370 2.295 90,5 5.330 (*).- Variaciones sin tipo de cambio:
Trimestral: M. intereses: +1,3%; M. bruto: -2,0%; B≥ antes de provisiones: -7,6%; B≥ atribuido: +2,7% Interanual: M. intereses: -7,0%; M. bruto: -2,2%; B≥ antes de provisiones: -8,4%; B≥ atribuido: +136,8%
BPA, RENTABILIDAD Y EFICIENCIA (%) 4T»13 3T»13 (%) 2013 2012 (%) 2011
Beneficio atribuido por acción (euro)
ROE
ROTE
ROA
RoRWA
Eficiencia (con amortizaciones)
0,09 5,25 7,41 0,44 1,02 53,0
0,10
5,23
7,38
0,43
1,02
49,9
(1,9) 0,405,427,730,441,0149,9
0,23
2,91
4,28
0,25
0,56
46,0
71,7 0,60
7,12
10,77
0,50
1,05
45,7
CORE CAPITAL Y MOROSIDAD (%) Dic»13 Sep»13 (%) Dic»13 Dic»12 (%) Dic»11
Core capital (BIS II)
Tasa de morosidad
Cobertura de morosidad
11,71 5,64 61,7
11,56
5,43
63,9
11,715,6461,7
10,33
4,54
72,4
10,02
3,90
61,0
LA ACCI‡N Y CAPITALIZACI‡N Dic»13 Sep»13 (%) Dic»13 Dic»12 (%) Dic»11
Número de acciones (millones)
Cotización (euro)
Capitalización bursátil (millones euros)
Fondos propios por acción (euro)
Precio / fondos propios por acción (veces)
PER (precio / beneficio por acción) (veces)
11.333 6,506
73.735 7,44 0,88
16,13
11.092
6,028
66.863
7,58
0,79
14,61
2,2
7,9
10,3
11.3336,506
73.7357,440,88
16,13
10.321
6,100
62.959
7,88
0,77
25,96
9,8
6,7
17,1
8.909
5,870
50.290
8,59
0,68
9,79
OTROS DATOS Dic»13 Sep»13 (%) Dic»13 Dic»12 (%) Dic»11
Número de accionistas
Número de empleados
Número de oficinas
3.299.026 182.958 13.927
3.281.450
184.786
14.561
0,5
(1,0)
(4,4)
3.299.026182.95813.927
3.296.270
186.763
14.392
0,1
(2,0)
(3,2)
3.293.537
189.766
14.756
INFORMACI‡N SOBRE BENEFICIO ORDINARIO 4T»13 3T»13 (%) 2013 2012 (%) 2011
Beneficio atribuido al Grupo* 1.060 Beneficio atribuido por acción (euro) 0,09 ROE 5,25 ROTE 7,41 ROA 0,44 RoRWA 1,02 PER (precio / beneficio por acción) (veces) 16,13
(*).- Variaciones sin tipo de cambio: 4T'13 / 3T'13: +2,7%; 2013 / 2012: -10,7%
1.055
0,10
5,23
7,38
0,43
1,02
14,61
0,4
(1,9)
4.3700,405,427,730,441,01
16,13
5.341
0,55
6,78
9,97
0,48
1,10
11,15
(18,2)
(26,3)
7.000
0,79
9,35
14,14
0,63
1,34
7,46
Nota: La información financiera aquí contenida no está auditada. No obstante, ha sido aprobada por el consejo de administración de la Sociedad en su sesión de 27 de enero de 2014, previo informe favorable de la comisión de auditoría y cumplimiento de fecha 23 de enero de 2014. En su revisión, la comisión de auditoría y cumplimiento ha velado por que la información financiera trimestral se haya elaborado conforme a los mismos principios y prácticas de las cuentas anuales.
(1).- En 2013, dato del scrip dividend de mayo 2014 estimado
2 ENERO - DICIEMBRE

INFORMACI‡N FINANCIERA DEL GRUPO INFORME FINANCIERO 2013
RESULTADOS (Millones de euros)
Variación Variación
4T»13 3T»13 (%) (%) sin TC 2013 2012 (%) (%) sin TC
Margen de intereses 6.277 6.285 (0,1) 1,3 25.935 29.923 (13,3) (7,0)
Comisiones netas 2.381 2.332 2,1 3,4 9.761 10.259 (4,9) 0,8
Resultados netos de operaciones financieras 630 992 (36,5) (35,0) 3.469 2.698 28,6 35,4
Resto de ingresos 117 129 (8,8) (7,0) 587 525 11,7 12,3
Rendimiento de instrumentos de capital 102 72 42,6 42,6 378 423 (10,5) (9,1)
Resultados por puesta en equivalencia 110 122 (9,6) (6,2) 500 427 17,1 25,9
Otros resultados de explotación (netos) (95) (65) 46,5 47,7 (291) (324) (10,3) 0,4
Margen bruto 9.405 9.738 (3,4) (2,0) 39.753 43.406 (8,4) (2,2)
Costes de explotación (4.985) (4.862) 2,5 3,7 (19.843) (19.983) (0,7) 4,9
Gastos generales de administración (4.322) (4.303) 0,4 1,7 (17.452) (17.801) (2,0) 3,6
De personal (2.509) (2.431) 3,2 4,3 (10.069) (10.307) (2,3) 3,2
Otros gastos generales de administración (1.813) (1.871) (3,1) (1,7) (7.382) (7.494) (1,5) 4,3
Amortización de activos materiales e inmateriales (664) (559) 18,6 19,3 (2.392) (2.182) 9,6 15,3
Margen neto 4.420 4.876 (9,4) (7,6) 19.909 23.422 (15,0) (8,4)
Dotaciones insolvencias (2.279) (2.600) (12,3) (10,8) (10.863) (12.640) (14,1) (7,8)
Deterioro de otros activos (146) (141) 3,4 3,1 (524) (853) (38,6) (38,4)
Otros resultados y dotaciones (215) (369) (41,7) (39,9) (1.261) (1.449) (13,0) (5,1)
Resultado antes de impuestos ordinario 1.779 1.766 0,8 3,0 7.262 8.481 (14,4) (6,7)
Impuesto sobre sociedades (500) (464) 7,8 9,9 (1.853) (2.314) (19,9) (13,3)
Resultado de operaciones continuadas ordinario 1.279 1.302 (1,8) 0,5 5.409 6.167 (12,3) (4,1)
Resultado de operaciones interrumpidas (neto) (1) (0) 71,7 52,7 (15) 70 ƒ ƒ
Resultado consolidado del ejercicio ordinario 1.278 1.302 (1,8) 0,5 5.393 6.236 (13,5) (5,5)
Resultado atribuido a minoritarios 219 246 (11,2) (8,8) 1.023 895 14,3 26,2
Beneficio atribuido al Grupo ordinario 1.060 1.055 0,4 2,7 4.370 5.341 (18,2) (10,7)
Neto de plusvalías y saneamientos ƒ ƒ ƒ ƒ ƒ (3.047) (100,0) (100,0)
Beneficio atribuido al Grupo 1.060 1.055 0,4 2,7 4.370 2.295 90,5 136,8
BPA (euros) 0,09 0,10 (1,9) 0,40 0,23 71,7
BPA diluido (euros) 0,09 0,10 (1,5) 0,40 0,23 72,0
Promemoria:
Activos Totales Medios 1.157.159 1.201.784 (3,7) 1.214.199 1.286.597 (5,6)
Recursos Propios Medios 80.718 80.777 (0,1) 80.598 78.806 2,3
PLUSVAL‹AS Y SANEAMIENTOS TIPOS DE CAMBIO: PARIDAD 1 EURO/MONEDAMillones de euros
Cambio medio Cambio final (resultados) (balance)
2013 2012 31.12.13 31.12.12
Dólar USA 1,327 1,284 1,379 1,319
Libra 0,849 0,811 0,834 0,816
Real brasileño 2,852 2,501 3,258 2,704
Peso mexicano 16,931 16,894 18,073 17,185
Peso chileno 656,524 624,467 724,579 631,729
Peso argentino 7,220 5,830 8,990 6,487
Zloty polaco 4,196 4,182 4,154 4,074
ENERO - DICIEMBRE 3

INFORME FINANCIERO 2013 INFORMACI‡N FINANCIERA DEL GRUPO
RESULTADOS POR TRIMESTRES (Millones de euros)
1T»12 2T»12 3T»12 4T»12 1T»13 2T»13 3T»13 4T»13
Margen de intereses 7.763 7.622 7.438 7.100 6.652 6.722 6.285 6.277
Comisiones netas 2.612 2.556 2.566 2.526 2.516 2.531 2.332 2.381
Resultados netos de operaciones financieras 797 675 643 583 969 879 992 630
Resto de ingresos 114 270 67 75 154 187 129 117
Rendimiento de instrumentos de capital 61 216 66 80 59 145 72 102
Resultados por puesta en equivalencia 136 120 84 87 154 114 122 110
Otros resultados de explotación (netos) (83) (66) (83) (93) (59) (72) (65) (95)
Margen bruto 11.287 11.123 10.713 10.283 10.290 10.320 9.738 9.405
Costes de explotación (5.043) (4.934) (5.067) (4.939) (4.996) (5.000) (4.862) (4.985)
Gastos generales de administración (4.519) (4.422) (4.464) (4.396) (4.428) (4.400) (4.303) (4.322)
De personal (2.634) (2.587) (2.608) (2.478) (2.582) (2.548) (2.431) (2.509)
Otros gastos generales de administración (1.885) (1.835) (1.856) (1.918) (1.846) (1.852) (1.871) (1.813)
Amortización de activos materiales e inmateriales (524) (512) (603) (543) (569) (600) (559) (664)
Margen neto 6.244 6.188 5.646 5.344 5.294 5.320 4.876 4.420
Dotaciones insolvencias (3.118) (3.401) (2.987) (3.134) (2.919) (3.065) (2.600) (2.279)
Deterioro de otros activos (83) (97) (81) (592) (110) (126) (141) (146)
Otros resultados y dotaciones (487) (381) (475) (105) (261) (415) (369) (215)
Resultado antes de impuestos ordinario 2.556 2.309 2.103 1.512 2.003 1.713 1.766 1.779
Impuesto sobre sociedades (720) (657) (662) (275) (496) (393) (464) (500)
Resultado de operaciones continuadas ordinario 1.836 1.652 1.441 1.237 1.508 1.320 1.302 1.279
Resultado de operaciones interrumpidas (neto) 17 11 22 20 ƒ (14) (0) (1)
Resultado consolidado del ejercicio ordinario 1.853 1.663 1.463 1.257 1.508 1.306 1.302 1.278
Resultado atribuido a minoritarios 227 237 198 234 303 256 246 219
Beneficio atribuido al Grupo ordinario 1.627 1.427 1.264 1.024 1.205 1.050 1.055 1.060
Neto de plusvalías y saneamientos ƒ (1.304) (1.142) (601) ƒ ƒ ƒ ƒ
Beneficio atribuido al Grupo 1.627 123 122 423 1.205 1.050 1.055 1.060
BPA (euros) 0,17 0,01 0,01 0,04 0,12 0,10 0,10 0,09
BPA diluido (euros) 0,17 0,01 0,01 0,04 0,11 0,10 0,10 0,09
Distribución del beneficio atribuido ordinario por segmentos geográficos operativos*. Diciembre 2013
Europa continental: 26%
Latinoamérica: 47%
(*) Sin incluir unidad de actividad inmobiliaria discontinuada en España
EE.UU.: 10% España: 7%
Alemania: 6%
Portugal: 2%
Polonia: 6%
Resto Europa: 5%
Reino Unido: 17%
Brasil: 23%
México: 10%
Chile: 6%
Resto Latinoamérica: 8%
Distribución del beneficio atribuido ordinario por segmentos de negocio operativos*. Diciembre 2013
Banca Comercial: 74%
Gestión de Activos y Seguros: 4%
Comercial Europa continental: 18%
Banca Mayorista Global: 22%
Comercial Reino Unido: 14%
Comercial EE.UU.: 9%
Comercial Latinoamérica: 33%
4 ENERO - DICIEMBRE

COMISIONES NETAS (Millones de euros)
4T»13 3T»13 Var (%) 2013 2012 Var (%) Comisiones por servicios 1.379 1.350 2,2 5.677 6.063 (6,4)
Fondos de inversión y pensiones 278 284 (2,3) 1.121 1.178 (4,8)
Valores y custodia 164 162 1,2 678 702 (3,4)
Seguros 559 535 4,6 2.284 2.317 (1,4)
INFORMACI‡N FINANCIERA DEL GRUPO INFORME FINANCIERO 2013
Comisiones netas 2.381 2.332 2,1 9.761 10.259 (4,9)
MARGEN DE INTERESES COMISIONES Millones de euros Millones de euros
COSTES DE EXPLOTACI‡N (Millones de euros)
4T»13 3T»13 Var (%) 2013 2012 Var (%) Gastos de personal 2.509 2.431 3,2 10.069 10.307 (2,3)
Otros gastos generales de administración 1.813 1.871 (3,1) 7.382 7.494 (1,5)
Tecnología y sistemas 244 270 (9,8) 992 889 11,5
Comunicaciones 58 161 (64,1) 519 638 (18,7)
Publicidad 195 148 31,7 630 662 (4,8)
Inmuebles e instalaciones 439 447 (1,7) 1.814 1.749 3,7
Impresos y material de oficina 44 40 10,1 166 166 (0,1)
Tributos 119 108 10,1 445 415 7,2
Otros 714 698 2,4 2.816 2.974 (5,3)
Gastos generales de administración 4.322 4.303 0,4 17.452 17.801 (2,0) Amortizaciones 664 559 18,6 2.392 2.182 9,6
Total costes de explotación 4.985 4.862 2,5 19.843 19.983 (0,7)
MARGEN BRUTO COSTES DE EXPLOTACI‡N Millones de euros Millones de euros
ENERO - DICIEMBRE 5

INFORME FINANCIERO 2013 INFORMACI‡N FINANCIERA DEL GRUPO
EMPLEADOS Y OFICINAS
Empleados Oficinas
31.12.13 31.12.12 Variación 31.12.13 31.12.12 Variación Europa continental 58.383 57.941 442 6.160 6.437 (277) de la que: España 27.406 29.714 (2.308) 4.067 4.611 (544)
Portugal 5.635 5.719 (84) 640 667 (27)
Polonia 12.363 8.852 3.511 830 519 311
Santander Consumer Finance 11.695 12.282 (587) 613 629 (16)
Reino Unido 25.368 26.255 (887) 1.157 1.189 (32) Latinoamérica 87.069 90.649 (3.580) 5.904 6.044 (140) de la que: Brasil 49.459 53.752 (4.293) 3.566 3.788 (222)
México 14.804 13.967 837 1.258 1.170 88
Chile 12.290 12.364 (74) 493 504 (11)
Estados Unidos 9.741 9.544 197 706 722 (16) Areas operativas 180.561 184.389 (3.828) 13.927 14.392 (465) Actividades Corporativas 2.397 2.374 23
Total Grupo 182.958 186.763 (3.805) 13.927 14.392 (465)
MARGEN NETO DESPUÉS DE INSOLVENCIAS Millones de euros
Dotaciones netas insolvencias
Dotaciones netas insolvencias (mill. euros constantes)
Saneamientos inmobiliarios España SANEAMIENTOS Millones de euros
DOTACIONES PARA INSOLVENCIAS (Millones de euros)
4T»13 3T»13 Var (%) 2013 2012 Var (%) Insolvencias 2.582 2.841 (9,1) 11.928 13.950 (14,5)
Riesgo-país 1 (5) ƒ 2 (2) ƒ
Activos en suspenso recuperados (303) (236) 28,4 (1.068) (1.309) (18,4)
Total 2.279 2.600 (12,3) 10.863 12.640 (14,1)
BENEFICIO ATRIBUIDO AL GRUPO BENEFICIO POR ACCI‡N Millones de euros Euros
6 ENERO - DICIEMBRE

INFORMACI‡N FINANCIERA DEL GRUPO INFORME FINANCIERO 2013
BALANCE (Millones de euros)
Variación ACTIVO 31.12.13 31.12.12 Absoluta (%) 31.12.11 Caja y depósitos en bancos centrales 77.103 118.488 (41.385) (34,9) 96.524
Cartera de negociación 115.287 177.917 (62.630) (35,2) 172.637
Valores representativos de deuda 40.841 43.101 (2.261) (5,2) 52.704
Créditos a clientes 5.079 9.162 (4.084) (44,6) 8.056
Instrumentos de capital 4.967 5.492 (525) (9,6) 4.744
Derivados de negociación 58.899 110.319 (51.420) (46,6) 102.498
Depósitos en entidades de crédito 5.503 9.843 (4.341) (44,1) 4.636
Otros activos financieros a valor razonable 31.381 28.356 3.025 10,7 19.563
Créditos a clientes 13.196 13.936 (741) (5,3) 11.748
Otros (depósitos en entidades de crédito, valores representativos
de deuda y otros instrumentos de capital) 18.185 14.420 3.766 26,1 7.815
Activos financieros disponibles para la venta 83.799 92.267 (8.468) (9,2) 86.612
Valores representativos de deuda 79.844 87.724 (7.881) (9,0) 81.589
Instrumentos de capital 3.955 4.542 (587) (12,9) 5.024
Inversiones crediticias 714.484 756.858 (42.373) (5,6) 777.967
Depósitos en entidades de crédito 56.017 53.785 2.232 4,1 42.389
Créditos a clientes 650.581 696.013 (45.432) (6,5) 728.737
Valores representativos de deuda 7.886 7.059 827 11,7 6.840
Participaciones 5.536 4.453 1.083 24,3 4.154
Activos materiales e intangibles 16.613 17.296 (682) (3,9) 16.840
Fondo de comercio 23.281 24.626 (1.344) (5,5) 25.089
Otras cuentas 48.151 49.338 (1.186) (2,4) 51.622
Total activo 1.115.637 1.269.598 (153.962) (12,1) 1.251.008
PASIVO Y PATRIMONIO NETO
Cartera de negociacion 94.672 143.241 (48.568) (33,9) 146.949
Depósitos de clientes 8.500 8.897 (397) (4,5) 16.574
Débitos representados por valores negociables 1 1 (0) (7,9) 77
Derivados de negociación 58.887 109.743 (50.856) (46,3) 103.083
Otros 27.285 24.600 2.685 10,9 27.214
Otros pasivos financieros a valor razonable 42.311 45.418 (3.108) (6,8) 44.908
Depósitos de clientes 26.484 28.638 (2.154) (7,5) 26.982
Débitos representados por valores negociables 4.086 4.904 (818) (16,7) 8.185
Depósitos de bancos centrales y entidades de crédito 11.741 11.876 (135) (1,1) 9.741
Pasivos financieros a coste amortizado 863.115 959.321 (96.206) (10,0) 935.669
Depósitos de bancos centrales y entidades de crédito 86.323 131.670 (45.347) (34,4) 116.368
Depósitos de clientes 572.853 589.104 (16.251) (2,8) 588.977
Débitos representados por valores negociables 171.390 201.064 (29.674) (14,8) 189.110
Pasivos subordinados 16.139 18.238 (2.100) (11,5) 22.992
Otros pasivos financieros 16.410 19.245 (2.835) (14,7) 18.221
Pasivos por contratos de seguros 1.430 1.425 5 0,3 517
Provisiones 14.474 16.148 (1.673) (10,4) 17.308
Otras cuentas de pasivo 19.735 22.771 (3.036) (13,3) 24.844
Total pasivo 1.035.736 1.188.324 (152.587) (12,8) 1.170.195 Fondos propios 84.740 81.333 3.406 4,2 80.874
Capital 5.667 5.161 506 9,8 4.455
Reservas 75.109 74.528 581 0,8 72.660
Resultado atribuído al Grupo 4.370 2.295 2.075 90,5 5.330
Menos: dividendos y retribuciones (406) (650) 244 (37,5) (1.570)
Ajustes al patrimonio por valoración (14.152) (9.474) (4.678) 49,4 (6.415)
Intereses minoritarios 9.313 9.415 (102) (1,1) 6.354
Total patrimonio neto 79.900 81.275 (1.375) (1,7) 80.813 Total pasivo y patrimonio neto 1.115.637 1.269.598 (153.962) (12,1) 1.251.008
ENERO - DICIEMBRE 7

INFORME FINANCIERO 2013 INFORMACI‡N FINANCIERA DEL GRUPO
CRÉDITOS A CLIENTES (Millones de euros)
Variación 31.12.13 31.12.12 Absoluta (%) 31.12.11
Crédito a las Administraciones Públicas Españolas 13.374 16.884 (3.510) (20,8) 12.147
Crédito a otros sectores residentes 160.478 183.130 (22.652) (12,4) 202.411
Cartera comercial 7.301 8.699 (1.399) (16,1) 9.679
Crédito con garantía real 96.420 103.890 (7.470) (7,2) 117.946
Otros créditos 56.757 70.540 (13.783) (19,5) 74.785
Crédito al sector no residente 519.907 544.520 (24.612) (4,5) 552.789
Crédito con garantía real 320.608 339.519 (18.912) (5,6) 342.676
Otros créditos 199.300 205.000 (5.701) (2,8) 210.114
Créditos a clientes (bruto) 693.759 744.534 (50.775) (6,8) 767.347 Fondo de provisión para insolvencias 24.904 25.422 (518) (2,0) 18.806
Créditos a clientes (neto) 668.856 719.112 (50.257) (7,0) 748.541 Promemoria: Activos dudosos 40.320 35.301 5.019 14,2 31.257
Administraciones Públicas 99 121 (22) (18,3) 102
Otros sectores residentes 21.763 16.025 5.739 35,8 14.745
No residentes 18.458 19.156 (697) (3,6) 16.409
DISTRIBUCI‡N DE LOS ACTIVOS TOTALES Diciembre 2013
CRÉDITOS A CLIENTES % sobre áreas operativas. Diciembre 2013
EE.UU.: 5% Resto: 5%
España: 25%
México: 4% Chile: 3%
Resto Latinoamérica: 3%
EE.UU.: 6%
Brasil: 10%
México: 3%
Chile: 4% Resto Latinoamérica: 3%
España: 24%
Alemania: 3%
Portugal: 4%
Polonia: 2%
Activ. inmob. España: 1% Resto Europa: 4%
Brasil: 12%
Alemania: 4%
Portugal: 4%
Polonia: 2%
Activ. inmob. España: 1% Resto Europa: 5%
Reino Unido: 29% Reino Unido: 35%
CRÉDITOS A CLIENTES (BRUTO) Miles de millones de euros
CRÉDITOS A CLIENTES EN ESPAÑA Miles de millones de euros
Total
Hipotecas hogares
Resto crédito particulares
Empresas
Administraciones públicas
Adquisiciones temporales de activos (ATAs)
(*) Sin efecto tipo de cambio : -3,1%
8 ENERO - DICIEMBRE
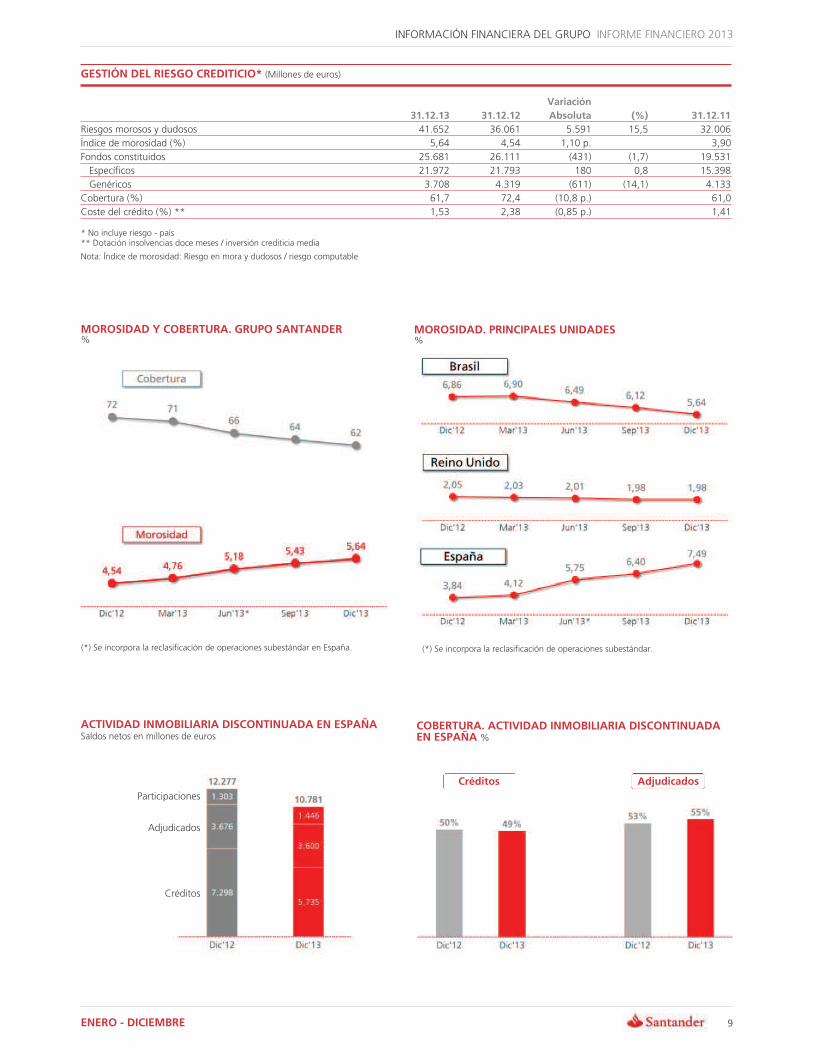
GESTI‡N DEL RIESGO CREDITICIO* (Millones de euros)
Variación 31.12.13 31.12.12 Absoluta (%) 31.12.11
Riesgos morosos y dudosos 41.652 36.061 5.591 15,5 32.006
‹ndice de morosidad (%) 5,64 4,54 1,10 p. 3,90
Fondos constituidos 25.681 26.111 (431) (1,7) 19.531
Específicos 21.972 21.793 180 0,8 15.398
Genéricos 3.708 4.319 (611) (14,1) 4.133
Cobertura (%) 61,7 72,4 (10,8 p.) 61,0
Coste del crédito (%) ** 1,53 2,38 (0,85 p.) 1,41
INFORMACI‡N FINANCIERA DEL GRUPO INFORME FINANCIERO 2013
* No incluye riesgo - país ** Dotación insolvencias doce meses / inversión crediticia media
Nota: ‹ndice de morosidad: Riesgo en mora y dudosos / riesgo computable
MOROSIDAD Y COBERTURA. GRUPO SANTANDER %
MOROSIDAD. PRINCIPALES UNIDADES %
(*) Se incorpora la reclasificación de operaciones subestándar en España.
ACTIVIDAD INMOBILIARIA DISCONTINUADA EN ESPAÑA Saldos netos en millones de euros
Créditos
Adjudicados
Participaciones
(*) Se incorpora la reclasificación de operaciones subestándar.
COBERTURA. ACTIVIDAD INMOBILIARIA DISCONTINUADA EN ESPAÑA %
Créditos Adjudicados
ENERO - DICIEMBRE 9
INFORME FINANCIERO 2013 INFORMACI‡N FINANCIERA DEL GRUPO
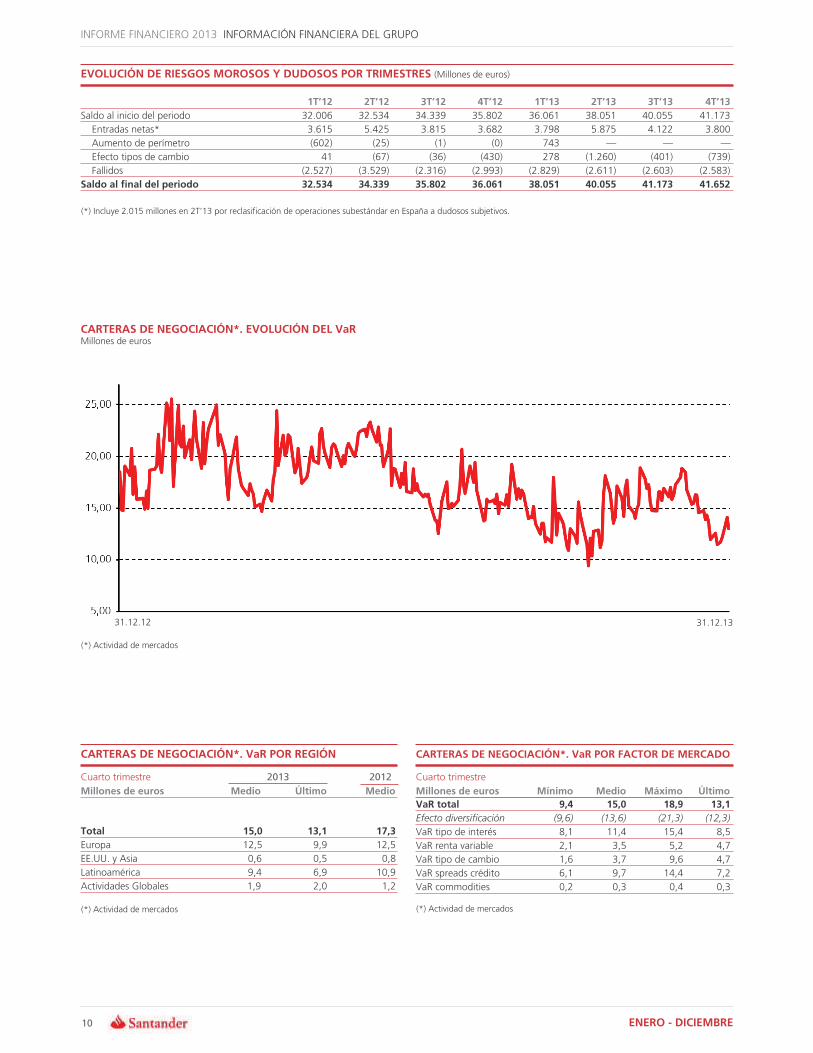
EVOLUCI‡N DE RIESGOS MOROSOS Y DUDOSOS POR TRIMESTRES (Millones de euros)
1T»12 2T»12 3T»12 4T»12 1T»13 2T»13 3T»13 4T»13 Saldo al inicio del periodo 32.006 32.534 34.339 35.802 36.061 38.051 40.055 41.173
Entradas netas* 3.615 5.425 3.815 3.682 3.798 5.875 4.122 3.800
Aumento de perímetro (602) (25) (1) (0) 743 ƒ ƒ ƒ
Efecto tipos de cambio 41 (67) (36) (430) 278 (1.260) (401) (739)
Fallidos (2.527) (3.529) (2.316) (2.993) (2.829) (2.611) (2.603) (2.583)
Saldo al final del periodo 32.534 34.339 35.802 36.061 38.051 40.055 41.173 41.652
(*) Incluye 2.015 millones en 2T»13 por reclasificación de operaciones subestándar en España a dudosos subjetivos.
CARTERAS DE NEGOCIACI‡N*. EVOLUCI‡N DEL VaR Millones de euros
31.12.12 31.12.13
(*) Actividad de mercados
CARTERAS DE NEGOCIACI‡N*. VaR POR REGI‡N CARTERAS DE NEGOCIACI‡N*. VaR POR FACTOR DE MERCADO
Cuarto trimestre 2013 2012 Cuarto trimestre
Millones de euros
TotalEuropa
EE.UU. y Asia
Latinoamérica
Actividades Globales
Medio
15,0 12,5
0,6
9,4
1,9
„ltimo
13,1 9,9
0,5
6,9
2,0
Medio
17,3 12,5
0,8
10,9
1,2
Millones de euros VaR total Efecto diversificación
VaR tipo de interés
VaR renta variable
VaR tipo de cambio
VaR spreads crédito
VaR commodities
Mínimo9,4
(9,6)
8,1
2,1
1,6
6,1
0,2
Medio 15,0
(13,6)
11,4
3,5
3,7
9,7
0,3
Máximo 18,9
(21,3)
15,4
5,2
9,6
14,4
0,4
„ltimo 13,1
(12,3)
8,5
4,7
4,7
7,2
0,3
(*) Actividad de mercados (*) Actividad de mercados
10 ENERO - DICIEMBRE

+5,9%
RECURSOS DE CLIENTES GESTIONADOS (Millones de euros)
Variación 31.12.13 31.12.12 Absoluta (%) 31.12.11
Administraciones Públicas residentes 7.745 8.487 (741) (8,7) 6.528
Otros sectores residentes 161.649 157.011 4.638 3,0 144.131
Vista 74.969 71.526 3.443 4,8 68.389
Plazo 80.146 75.414 4.731 6,3 61.185
Otros 6.535 10.071 (3.536) (35,1) 14.557
Sector no residente 438.442 461.141 (22.699) (4,9) 481.875
Vista 245.582 228.698 16.884 7,4 220.299
Plazo 146.433 179.503 (33.070) (18,4) 197.249
Otros 46.427 52.940 (6.513) (12,3) 64.328
Depósitos de clientes 607.836 626.639 (18.802) (3,0) 632.533 Débitos representados por valores negociables* 175.477 205.969 (30.492) (14,8) 197.372
Pasivos subordinados 16.139 18.238 (2.100) (11,5) 22.992
Recursos de clientes en balance 799.452 850.846 (51.394) (6,0) 852.898 Fondos de inversión 93.304 89.176 4.128 4,6 102.611
Fondos de pensiones 10.879 10.076 803 8,0 9.645
Patrimonios administrados 20.987 18.889 2.098 11,1 19.199
Otros recursos de clientes gestionados 125.169 118.141 7.028 5,9 131.456 Recursos de clientes gestionados** 924.621 968.987 (44.366) (4,6) 984.353
INFORMACI‡N FINANCIERA DEL GRUPO INFORME FINANCIERO 2013
* Incluye Pagarés Retail en España (millones de euros): 3.553 en diciembre 2013, 11.536 en diciembre 2012 y 6.052 en diciembre 2011 ** Incluye fondos de inversión y pensiones comercializados
PATRIMONIO DE FONDOS Y SOCIEDADES DE INVERSI‡N (Millones de euros) RECURSOS DE CLIENTES GESTIONADOS % sobre áreas operativas. Diciembre 2013
España
Portugal
Polonia
Reino Unido
Latinoamérica
Total
31.12.13 29.712
1.050
2.683
9.645
50.214
93.304
31.12.12 23.093
1.544
2.443
13.919
48.178
89.176
Var (%) 28,7
(32,0)
9,8
(30,7)
4,2
4,6
31.12.11 27.425
1.866
1.747
15.744
55.829
102.611
EE.UU.: 4%
México: 5%
Chile: 4%
Resto Latinoamérica: 4%
España: 27%
Brasil: 14%
PATRIMONIO DE FONDOS DE PENSIONES (Millones de euros) Portugal: 3%
Polonia: 3%
España
Portugal
Total
31.12.13 10.030
848
10.879
31.12.12 9.289
787
10.076
Var (%) 8,0
7,8
8,0
31.12.11 8.884
760
9.645 Reino Unido: 31%
Alemania: 3% Resto Europa: 2%
RECURSOS DE CLIENTES GESTIONADOS CRÉDITOS /DEP‡SITOS. TOTAL GRUPO* Miles de millones de euros %
Total -4,6%* Otros
Empréstitos y pasivos
subordinados
Depósitos
-14,5%
-3,0%
(*) Sin efecto tipo de cambio: -0,5% (*) Incluye pagarés retail
ENERO - DICIEMBRE 11
INFORME FINANCIERO 2013 INFORMACI‡N FINANCIERA DEL GRUPO
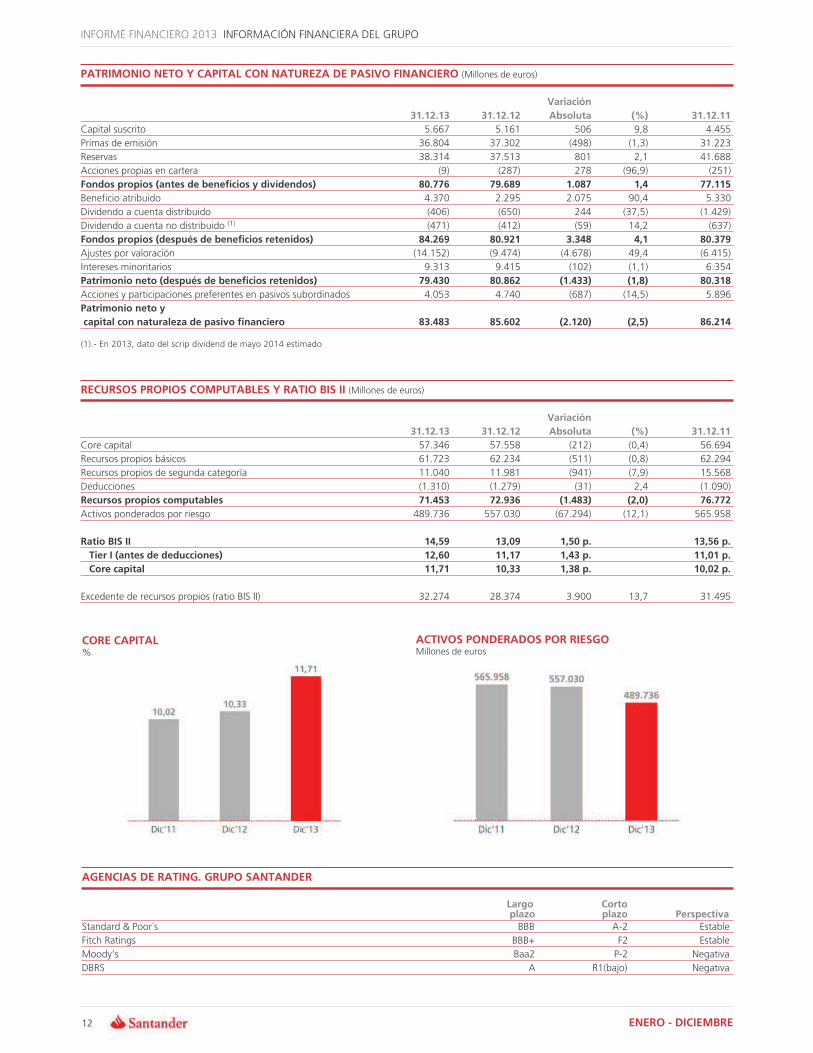
PATRIMONIO NETO Y CAPITAL CON NATUREZA DE PASIVO FINANCIERO (Millones de euros)
Variación 31.12.13 31.12.12 Absoluta (%) 31.12.11
Capital suscrito 5.667 5.161 506 9,8 4.455
Primas de emisión 36.804 37.302 (498) (1,3) 31.223
Reservas 38.314 37.513 801 2,1 41.688
Acciones propias en cartera (9) (287) 278 (96,9) (251)
Fondos propios (antes de beneficios y dividendos) 80.776 79.689 1.087 1,4 77.115 Beneficio atribuido 4.370 2.295 2.075 90,4 5.330
Dividendo a cuenta distribuido (406) (650) 244 (37,5) (1.429)
Dividendo a cuenta no distribuido (1) (471) (412) (59) 14,2 (637)
Fondos propios (después de beneficios retenidos) 84.269 80.921 3.348 4,1 80.379 Ajustes por valoración (14.152) (9.474) (4.678) 49,4 (6.415)
Intereses minoritarios 9.313 9.415 (102) (1,1) 6.354
Patrimonio neto (después de beneficios retenidos) 79.430 80.862 (1.433) (1,8) 80.318 Acciones y participaciones preferentes en pasivos subordinados 4.053 4.740 (687) (14,5) 5.896
Patrimonio neto y capital con naturaleza de pasivo financiero 83.483 85.602 (2.120) (2,5) 86.214
(1).- En 2013, dato del scrip dividend de mayo 2014 estimado
RECURSOS PROPIOS COMPUTABLES Y RATIO BIS II (Millones de euros)
Core capital
Recursos propios básicos
Recursos propios de segunda categoría
Deducciones
Recursos propios computables Activos ponderados por riesgo
31.12.13 57.346
61.723
11.040
(1.310)
71.453 489.736
31.12.12 57.558
62.234
11.981
(1.279)
72.936 557.030
Variación Absoluta
(212)
(511)
(941)
(31)
(1.483) (67.294)
(%)(0,4)
(0,8)
(7,9)
2,4
(2,0)(12,1)
31.12.11 56.694
62.294
15.568
(1.090)
76.772 565.958
Ratio BIS II Tier I (antes de deducciones) Core capital
14,59 12,60 11,71
13,09 11,17 10,33
1,50 p.1,43 p.1,38 p.
13,56 p. 11,01 p. 10,02 p.
Excedente de recursos propios (ratio BIS II) 32.274 28.374 3.900 13,7 31.495
CORE CAPITAL ACTIVOS PONDERADOS POR RIESGO % Millones de euros
AGENCIAS DE RATING. GRUPO SANTANDER
Largo plazo
Corto plazo Perspectiva
Standard & Poor´s BBB A-2 Estable
Fitch Ratings BBB+ F2 Estable
Moody»s Baa2 P-2 Negativa
DBRS A R1(bajo) Negativa
12 ENERO - DICIEMBRE

LA ACCI‡N SANTANDER INFORME FINANCIERO 2013
LA ACCI‡N SANTANDER. DICIEMBRE 2013 CAPITALIZACI‡N BURSŸTIL Millones de euros
Accionistas y contratación Accionistas (número) 3.299.026
Acciones (número) 11.333.420.488
Contratación efectiva media diaria (n≥ de acciones) 85.761.339
Liquidez de la acción (en %) 201
(Número de acciones contratadas en el año / número de acciones)
Retribución por acción euros Santander Dividendo Elección (Ago.13) 0,15
Santander Dividendo Elección (Nov.13) 0,15
Santander Dividendo Elección (Feb.14) 0,15
Santander Dividendo Elección (May.14) 0,15
TOTAL 0,60
Cotización durante 2013 Inicio (31.12.12) 6,100
Máxima 6,777
Mínima 4,791
Cierre (31.12.13) 6,506
Capitalización bursatil (millones) (31.12.13) 73.735
Ratios bursátiles RETRIBUCI‡N NOMINAL POR ACCI‡N Precio / Valor contable por acción (veces) 0,87
Euros
Precio / b≥ atribuido por acción (veces) 16,13
Rentabilidad por dividendo (Yield) (1) (en %) 10,40
(1) Retribución total en relación con 2013 / Cotización media 2013
DISTRIBUCI‡N DEL CAPITAL SOCIAL POR TIPO DE ACCIONISTA
Diciembre 2013 Acciones % Consejo 188.868.624 1,67
Institucionales 5.777.993.335 50,98
Minoristas 5.366.558.529 47,35
Total 11.333.420.488 100,00
EVOLUCI‡N COMPARADA DE COTIZACIONES Datos del 31 de diciembre de 2012 al 31 de diciembre de 2013
31.12.13
SAN* Stoxx Banks EuroStoxx Banks
Base 100: 31.12.12
(*) Evolución ajustada a los scrip dividend realizados en el año.
ENERO - DICIEMBRE 13

INFORME FINANCIERO 2013 INFORMACI‡N POR SEGMENTOS
Descripción de segmentos
En el ejercicio 2013 Grupo Santander mantiene los criterios gene-rales aplicados en 2012, con las siguientes excepciones:
1)En los estados financieros del Grupo: • La modificación de la NIC 19 obliga a que en los ejercicios que comiencen a partir del 1 de enero de 2013 las ganancias y pér-didas actuariales se reconozcan inmediatamente contra patri-monio, sin poder diferirse cierta porción, como se hacía hasta ahora, con registro en resultados.
• Con motivo de la venta del negocio de tarjetas de Santander UK, que previamente perteneció a GE, sus resultados de 2012 se han eliminado de las distintas rúbricas de la cuenta de re-sultados y contabilizado, por neto, en la línea de resultado de operaciones interrumpidas.
2)En los negocios por reordenación: • Incorporación como segmento principal o geográfico de la uni-dad de España, que incluye las antiguas redes comerciales de Santander, Banesto y Banif (fusionadas en 2013), Banca Ma-yorista Global, Gestión de Activos y Seguros y la cartera ALCO en España.
• Se segrega la actividad inmobiliaria discontinuada en España en una unidad dentro de Europa continental, que incluye: los cré-ditos de clientes con actividad mayoritariamente de promoción inmobiliaria, que cuentan con un modelo de gestión especiali-zado; las participaciones relacionadas con el sector inmobiliario; y los adjudicados.
3)Otros ajustes: • Se ha realizado el ajuste anual del Modelo de Relación Global con Clientes, que supone un aumento neto de 60 nuevos clientes.
• Incorporación a Banca Mayorista Global de los negocios mayo-ristas de Polonia y Banesto, anteriormente en Banca Comercial.
• Redefinición de Actividades Corporativas por la asignación de financiación y traspaso de activos inmobiliarios y sus costes (ya mencionado) así como por otras reasignaciones de costes entre unidades.
A efectos comparativos, los datos del año 2012 se han reelaborado incluyendo los cambios en las áreas afectadas.
La elaboración de los estados financieros de cada segmento de ne-gocio se realiza a partir de la agregación de las unidades operativas básicas que existen en el Grupo. La información de base corres-ponde tanto a los datos contables de las unidades jurídicas que se integran en cada segmento como a la disponible de los sistemas de información de gestión. En todos los casos se aplican los mismos principios generales que los utilizados en el Grupo.
La estructura de las áreas de negocio operativas se presenta en dos niveles:
Nivel principal (o geográfico). Segmenta la actividad de las unidades operativas por áreas geográficas. Esta visión coincide con el primer nivel de gestión del Grupo y refleja el posicionamiento de Santander en las tres áreas de influencia monetaria en el mundo (euro, libra y dólar). Los segmentos reportados son los siguientes:
• Europa continental. Incorpora todos los negocios de banca co-mercial, banca mayorista y gestión de activos y seguros, realiza-dos en la región, así como la unidad de actividad inmobiliaria discontinuada en España. Se facilita información financiera deta-llada de España, Portugal, Polonia y Santander Consumer Finance (que incorpora todo el negocio en la región, incluido el de los tres países anteriores).
• Reino Unido. Incluye los negocios de banca comercial, banca mayorista y gestión de activos y seguros desarrollados por las di-ferentes unidades y sucursales del Grupo allí presentes.
• Latinoamérica. Recoge la totalidad de actividades financieras que el Grupo desarrolla a través de sus bancos y sociedades filia-les en Latinoamérica (incluido Puerto Rico). Además, incluye las unidades especializadas de Santander Private Banking, como uni-dad independiente y gestionada globalmente, y el negocio de Nueva York. Se desglosan las cuentas de Brasil, México y Chile.
• EE.UU. Incluye los negocios de Santander Bank (antiguo Sove-reign Bank) y Santander Consumer USA (consolida por puesta en equivalencia).
Nivel secundario (o de negocios). La actividad de las unidades ope-rativas se distribuye por tipo de negocio en los siguientes segmen-tos: banca comercial, banca mayorista, gestión de activos y seguros y la unidad de actividad inmobiliaria discontinuada en España.
• Banca Comercial. Contiene todos los negocios de banca de clien-tes, incluido banca privada (excepto los de Banca Corporativa, ges-tionados a través del Modelo de Relación Global). Por su peso relativo se desglosan las principales áreas geográficas (Europa con-tinental, Reino Unido, Latinoamérica y Estados Unidos), así como los principales países y Santander Consumer Finance. Asimismo se han incluido en este negocio los resultados de las posiciones de cobertura realizadas en cada país, tomadas dentro del ámbito del Comité de Gestión de Activos y Pasivos de cada uno de ellos.
• Banca Mayorista Global (GBM). Refleja los rendimientos deri-vados de los negocios de banca corporativa global, banca de in-versión y mercados en todo el mundo, incluidas las tesorerías con gestión global, tanto en concepto de trading como en distribución a clientes (siempre después del reparto que proceda con clientes de Banca Comercial), así como el negocio de renta variable.
• Gestión de Activos y Seguros. Incluye la aportación al Grupo por el diseño y gestión de los negocios de fondos de inversión, pensiones y seguros que se realiza en unos casos a través de distintas unidades 100% propiedad del Grupo y en otros de unidades donde el Grupo participa a través de joint ventures con especialistas. Tanto unas como otras unidades remuneran a las redes de distribución que uti-lizan para la comercialización de estos productos (básicamente del Grupo, aunque no en exclusividad) a través de acuerdos de reparto de ingresos. Por tanto, el resultado que se recoge en este segmento es, para cada una de las unidades incluidas (de acuerdo a su partici-pación y modo de consolidación), el neto entre el ingreso bruto y el coste de distribución derivado de los acuerdos de reparto.
Adicionalmente a los negocios operativos descritos, tanto por áreas geográficas como por negocios, el Grupo sigue manteniendo el área de Actividades Corporativas. Esta área incorpora los negocios de gestión centralizada relativos a participaciones financieras, la gestión financiera de la posición estructural de cambio y del riesgo de interés estructural de la matriz, así como la gestión de la liquidez y de los recursos propios a través de emisiones y titulizaciones.
Como holding del Grupo, maneja el total de capital y reservas, las asignaciones de capital y la liquidez con el resto de los negocios. Como saneamientos incorpora la amortización de fondos de co-mercio y no recoge los gastos de los servicios centrales del Grupo que se imputan a las áreas, con la excepción de los gastos corpora-tivos e institucionales relativos al funcionamiento del Grupo.
Los datos de las distintas unidades del Grupo que figuran a con-tinuación han sido elaborados de acuerdo con estos criterios, por lo que pueden no coincidir con los publicados de manera indivi-dual por cada entidad.
14 ENERO - DICIEMBRE

INFORMACI‡N POR SEGMENTOS PRINCIPALES INFORME FINANCIERO 2013
MARGEN NETO (Millones de euros)
s/ 3T»13 s/ 2012 4T»13 (%) (%) sin TC 2013 (%) (%) sin TC
Europa continental 1.382 (10,7) (10,7) 6.009 (7,7) (7,5) de la que: España 750 (6,9) (6,9) 3.251 (15,7) (15,7)
Portugal 97 (7,7) (7,7) 421 (20,7) (20,7) Polonia 166 (19,9) (21,0) 731 34,8 35,3 Santander Consumer Finance 405 (11,1) (11,1) 1.720 (2,3) (2,3)
Reino Unido 657 15,9 14,3 2.276 2,7 7,5 Latinoamérica 2.714 (7,0) (4,1) 12.379 (16,4) (6,8) de la que: Brasil 1.732 (6,9) (5,0) 8.219 (22,8) (12,0)
México 391 (12,2) (8,5) 1.804 7,0 7,2 Chile 348 1,7 5,9 1.324 (3,6) 1,4
Estados Unidos 154 (14,7) (11,4) 896 (37,0) (34,8) Areas operativas 4.907 (5,9) (4,3) 21.560 (13,6) (7,4) Actividades Corporativas (488) 44,2 44,2 (1.651) 7,4 7,4
Total Grupo 4.420 (9,4) (7,6) 19.909 (15,0) (8,4)
BENEFICIO ATRIBUIDO (Millones de euros)
Europa continental* 294 6,8 6,5 1.127 (17,4) (17,1) de la que: España 111 50,9 50,9 478 (44,6) (44,6)
Portugal 37 16,9 16,9 114 (6,3) (6,3) Polonia 72 (27,6) (28,6) 334 1,4 1,7 Santander Consumer Finance 209 0,1 0,1 794 9,6 9,6
Reino Unido* 357 16,7 15,2 1.149 11,1 16,4 Latinoamérica 669 (8,7) (5,1) 3.257 (23,6) (16,3) de la que: Brasil 301 (16,1) (13,7) 1.577 (27,9) (17,8)
México 149 20,9 24,2 713 (29,3) (29,2) Chile 119 2,9 7,1 435 (11,2) (6,6)
Estados Unidos 137 (16,5) (13,5) 724 (10,1) (7,1) Areas operativas* 1.456 (1,4) 0,2 6.257 (16,2) (10,9) Actividades Corporativas* (397) (6,0) (6,0) (1.887) (11,2) (11,2) Total Grupo* 1.060 0,4 2,7 4.370 (18,2) (10,7) Neto de plusvalías y saneamientos ƒ ƒ ƒ ƒ (100,0) (100,0) Total Grupo 1.060 0,4 2,7 4.370 90,5 136,8
(*).- Sin incluir neto de plusvalías y saneamientos
CRÉDITOS A CLIENTES (Millones de euros)
Europa continental 266.355 (2,0) (2,1) 266.355 (6,0) (5,7) de la que: España 159.752 (3,1) (3,1) 159.752 (10,5) (10,5)
Portugal 24.482 (0,9) (0,9) 24.482 (5,7) (5,7) Polonia 16.214 (0,5) (2,3) 16.214 66,6 69,9 Santander Consumer Finance 56.024 0,2 0,2 56.024 (1,2) (1,2)
Reino Unido 231.046 (2,6) (2,8) 231.046 (7,3) (5,3) Latinoamérica 132.542 (2,4) 3,2 132.542 (5,4) 10,0 de la que: Brasil 66.446 (4,2) 2,6 66.446 (10,8) 7,4
México 22.269 6,0 7,4 22.269 9,3 14,9 Chile 28.783 (3,1) 2,8 28.783 (3,0) 11,2
Estados Unidos 37.682 (1,3) 0,8 37.682 (8,8) (4,7) Areas operativas 667.625 (2,3) (1,2) 667.625 (6,5) (2,7) Total Grupo 668.856 (2,6) (1,5) 668.856 (7,0) (3,3)
DEP‡SITOS DE CLIENTES (Millones de euros)
Europa continental 256.138 (2,6) (2,7) 256.138 (0,0) 0,1 de la que: España 181.117 (4,1) (4,1) 181.117 (3,3) (3,3)
Portugal 24.191 0,0 0,0 24.191 0,9 0,9 Polonia 18.503 6,3 4,4 18.503 65,0 68,2 Santander Consumer Finance 30.878 0,5 0,5 30.878 (3,2) (3,2)
Reino Unido 187.467 (5,0) (5,2) 187.467 (3,6) (1,5) Latinoamérica 125.844 (4,7) 0,5 125.844 (6,6) 8,3 de la que: Brasil 61.490 (6,6) 0,1 61.490 (12,0) 6,1
México 24.663 (4,3) (3,1) 24.663 (0,3) 4,8 Chile 20.988 (4,9) 0,9 20.988 (6,3) 7,4
Estados Unidos 35.537 (1,8) 0,3 35.537 (6,8) (2,5) Areas operativas 604.986 (3,7) (2,7) 604.986 (3,0) 1,0 Total Grupo 607.836 (4,0) (3,0) 607.836 (3,0) 1,0
ENERO - DICIEMBRE 15

INFORME FINANCIERO 2013 INFORMACI‡N POR SEGMENTOS PRINCIPALES
EUROPA CONTINENTAL (Millones de euros)
Var. s/ 3T»13 Var. s/ 2012
RESULTADOS 4T»13 (%) (%) sin TC 2013 (%) (%) sin TC Margen de intereses 2.038 1,2 1,1 8.123 (8,3) (8,1) Comisiones netas 837 (5,4) (5,6) 3.551 (2,0) (2,0)
Resultados netos por operaciones financieras 110 (59,2) (59,3) 775 153,6 153,7
Resto ingresos (1) 38 374,6 371,7 135 (26,0) (26,0)
Margen bruto 3.023 (4,8) (4,9) 12.585 (2,9) (2,8) Costes de explotación (1.641) 0,7 0,6 (6.576) 1,8 1,9
Gastos generales de administración (1.423) (1,7) (1,8) (5.807) 0,3 0,4
De personal (874) 0,5 0,4 (3.527) 0,8 0,9
Otros gastos generales de administración (549) (5,0) (5,1) (2.280) (0,5) (0,4)
Amortizaciones (218) 19,6 19,5 (769) 15,2 15,3
Margen neto 1.382 (10,7) (10,7) 6.009 (7,7) (7,5) Dotaciones insolvencias (763) (19,3) (19,3) (3.603) (12,2) (12,1)
Otros resultados (186) (1,0) (1,0) (760) 32,3 32,3
Resultado antes de impuestos ordinario 433 4,7 4,4 1.646 (10,2) (9,8) Impuesto sobre sociedades (113) 22,1 21,8 (376) (8,7) (8,2)
Resultado de operaciones continuadas ordinario 320 (0,3) (0,6) 1.270 (10,6) (10,3) Resultado de operaciones interrumpidas (neto) (6) ƒ ƒ (6) (15,0) (12,9)
Resultado consolidado del ejercicio ordinario 314 (1,9) (2,3) 1.264 (10,6) (10,2) Resultado atribuido a minoritarios 20 (55,0) (55,6) 137 182,8 183,7
Beneficio atribuido al Grupo ordinario 294 6,8 6,5 1.127 (17,4) (17,1) Neto de plusvalías y saneamientos ƒ ƒ ƒ ƒ (100,0) (100,0)
Beneficio atribuido al Grupo 294 6,8 6,5 1.127 ƒ ƒ
BALANCE
Créditos a clientes (2) 266.355 (2,0) (2,1) 266.355 (6,0) (5,7)
Cartera de negociación (sin créditos) 50.317 (18,5) (18,5) 50.317 (42,8) (42,8)
Activos financieros disponibles para la venta 37.319 (10,1) (10,3) 37.319 (2,6) (2,4)
Entidades de crédito (2) 38.506 (35,1) (35,1) 38.506 (21,4) (21,3)
Inmovilizado 6.297 1,0 1,0 6.297 10,5 10,7
Otras cuentas de activo 37.847 38,0 37,8 37.847 22,8 23,0
Total activo / pasivo y patrimonio neto 436.641 (6,7) (6,8) 436.641 (11,8) (11,6) Depósitos de clientes (2) 256.138 (2,6) (2,7) 256.138 (0,0) 0,1
Débitos representados por valores negociables (2) 16.781 7,7 8,0 16.781 (20,5) (19,9)
Pasivos subordinados (2) 406 11,1 9,3 406 242,6 248,3
Pasivos por contratos de seguros 1.430 8,0 8,0 1.430 0,3 0,3
Entidades de crédito (2) 59.041 (15,8) (15,7) 59.041 (24,5) (23,8)
Otras cuentas de pasivo 77.194 (13,1) (13,2) 77.194 (28,0) (28,0)
Capital y reservas (3) 25.651 (11,2) (11,3) 25.651 (17,3) (17,0)
Otros recursos de clientes gestionados 50.962 6,3 6,1 50.962 17,4 17,6 Fondos de inversión y pensiones 44.323 7,9 7,8 44.323 19,3 19,4
Patrimonios administrados 6.638 (3,5) (3,5) 6.638 6,5 6,5
Recursos de clientes gestionados 324.286 (0,8) (0,9) 324.286 1,1 1,2
RATIOS (%) Y MEDIOS OPERATIVOS
ROE 4,20 0,42 p. 3,84 (0,53 p.)
Eficiencia (con amortizaciones) 54,3 3,0 p. 52,3 2,5 p.
Tasa de morosidad 9,13 0,65 p. 9,13 2,84 p.
Cobertura 57,3 (3,8 p.) 57,3 (15,7 p.)
Número de empleados 58.383 (2,1) 58.383 0,8
Número de oficinas 6.160 (8,1) 6.160 (4,3)
(1).- Incluye rendimiento de instrumentos de capital, resultados por puesta en equivalencia y otros productos/cargas de explotación (2).- Incluye la totalidad de saldos en balance por este concepto (3).- No incluye beneficio del ejercicio
16 ENERO - DICIEMBRE

INFORMACI‡N POR SEGMENTOS PRINCIPALES INFORME FINANCIERO 2013
ESPAÑA (Millones de euros)
RESULTADOS 4T»13 (%) s/ 3T»13 2013 (%) s/ 2012 Margen de intereses 1.103 3,2 4.371 (15,4) Comisiones netas 440 (4,4) 1.901 (7,2)
Resultados netos por operaciones financieras 91 (58,2) 611 183,5
Resto ingresos (1) 21 153,6 136 (44,9)
Margen bruto 1.656 (5,7) 7.020 (8,6) Costes de explotación (906) (4,7) (3.769) (1,4)
Gastos generales de administración (792) (7,8) (3.377) (2,3)
De personal (516) (1,9) (2.134) (3,3)
Otros gastos generales de administración (276) (17,1) (1.243) (0,5)
Amortizaciones (113) 24,3 (392) 7,2
Margen neto 750 (6,9) 3.251 (15,7) Dotaciones insolvencias (575) (8,7) (2.411) (2,5)
Otros resultados (12) (78,9) (136) 6,3
Resultado antes de impuestos 162 39,7 704 (44,0) Impuesto sobre sociedades (52) 23,3 (225) (42,8)
Resultado de operaciones continuadas 110 49,2 479 (44,6) Resultado de operaciones interrumpidas (neto) 0 ƒ 0 ƒ
Resultado consolidado del ejercicio 110 49,2 479 (44,6) Resultado atribuido a minoritarios (1) ƒ 1 (32,7)
Beneficio atribuido al Grupo 111 50,9 478 (44,6)
BALANCE
Créditos a clientes (2) 159.752 (3,1) 159.752 (10,5)
Cartera de negociación (sin créditos) 47.062 (16,7) 47.062 (40,0)
Activos financieros disponibles para la venta 25.608 (15,5) 25.608 (13,7)
Entidades de crédito (2) 25.050 (32,2) 25.050 1,1
Inmovilizado 4.261 2,2 4.261 2,4
Otras cuentas de activo 19.101 83,4 19.101 44,3
Total activo / pasivo y patrimonio neto 280.834 (7,4) 280.834 (14,6) Depósitos de clientes (2) 181.117 (4,1) 181.117 (3,3)
Débitos representados por valores negociables (2) 3.953 (18,0) 3.953 (65,7)
Pasivos subordinados (2) 8 (62,9) 8 5,3
Pasivos por contratos de seguros 525 (5,2) 525 (45,5)
Entidades de crédito (2) 22.848 (15,2) 22.848 (19,6)
Otras cuentas de pasivo 60.815 (14,0) 60.815 (30,2)
Capital y reservas (3) 11.569 2,4 11.569 (14,3)
Otros recursos de clientes gestionados 44.793 8,7 44.793 24,0 Fondos de inversión y pensiones 39.583 8,7 39.583 22,9
Patrimonios administrados 5.210 8,4 5.210 33,2
Recursos de clientes gestionados 229.870 (2,1) 229.870 (2,2)
RATIOS (%) Y MEDIOS OPERATIVOS
ROE 3,87 1,32 p. 4,03 (2,24 p.)
Eficiencia (con amortizaciones) 54,7 0,6 p. 53,7 3,9 p.
Tasa de morosidad 7,49 1,09 p. 7,49 3,65 p.
Cobertura 44,0 (1,0 p.) 44,0 (6,0 p.)
Número de empleados 27.406 (3,1) 27.406 (7,8)
Número de oficinas 4.067 (11,1) 4.067 (11,8)
(1).- Incluye rendimiento de instrumentos de capital, resultados por puesta en equivalencia y otros productos/cargas de explotación (2).- Incluye la totalidad de saldos en balance por este concepto (3).- No incluye beneficio del ejercicio
ENERO - DICIEMBRE 17
INFORME FINANCIERO 2013 INFORMACI‡N POR SEGMENTOS PRINCIPALES
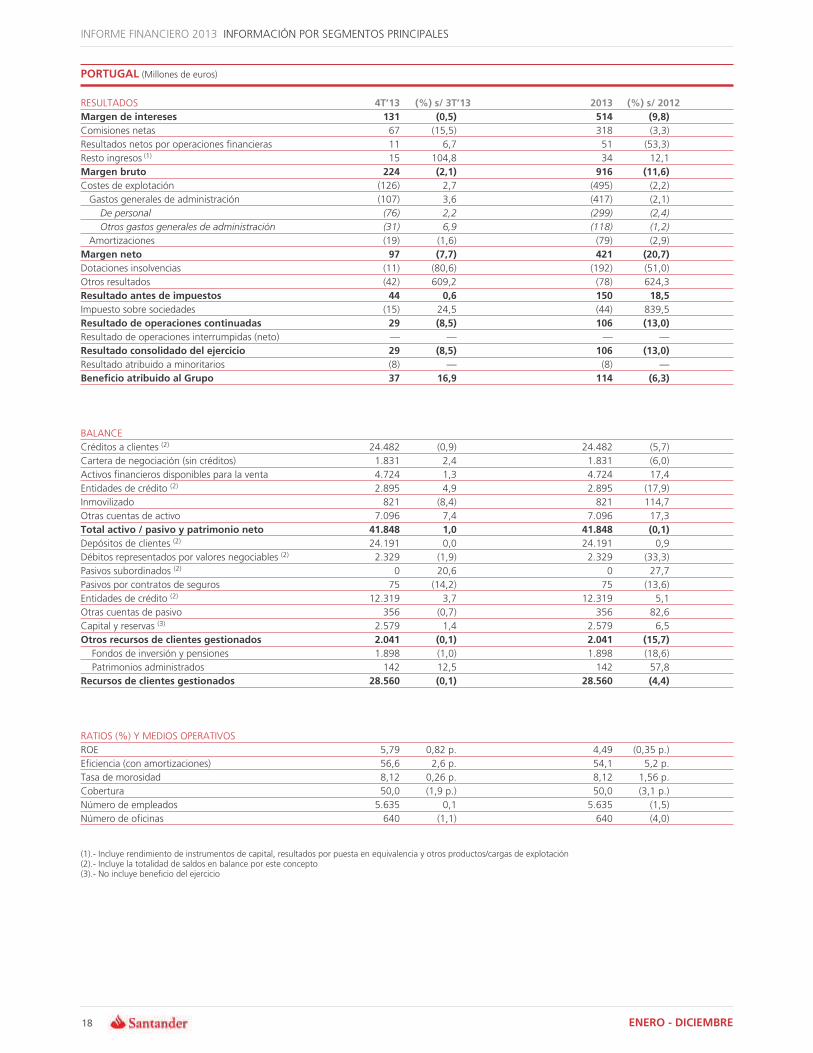
PORTUGAL (Millones de euros)
RESULTADOS 4T»13 (%) s/ 3T»13 2013 (%) s/ 2012 Margen de intereses 131 (0,5) 514 (9,8) Comisiones netas 67 (15,5) 318 (3,3)
Resultados netos por operaciones financieras 11 6,7 51 (53,3)
Resto ingresos (1) 15 104,8 34 12,1
Margen bruto 224 (2,1) 916 (11,6) Costes de explotación (126) 2,7 (495) (2,2)
Gastos generales de administración (107) 3,6 (417) (2,1)
De personal (76) 2,2 (299) (2,4)
Otros gastos generales de administración (31) 6,9 (118) (1,2)
Amortizaciones (19) (1,6) (79) (2,9)
Margen neto 97 (7,7) 421 (20,7) Dotaciones insolvencias (11) (80,6) (192) (51,0)
Otros resultados (42) 609,2 (78) 624,3
Resultado antes de impuestos 44 0,6 150 18,5 Impuesto sobre sociedades (15) 24,5 (44) 839,5
Resultado de operaciones continuadas 29 (8,5) 106 (13,0) Resultado de operaciones interrumpidas (neto) ƒ ƒ ƒ ƒ
Resultado consolidado del ejercicio 29 (8,5) 106 (13,0) Resultado atribuido a minoritarios (8) ƒ (8) ƒ
Beneficio atribuido al Grupo 37 16,9 114 (6,3)
BALANCE
Créditos a clientes (2) 24.482 (0,9) 24.482 (5,7)
Cartera de negociación (sin créditos) 1.831 2,4 1.831 (6,0)
Activos financieros disponibles para la venta 4.724 1,3 4.724 17,4
Entidades de crédito (2) 2.895 4,9 2.895 (17,9)
Inmovilizado 821 (8,4) 821 114,7
Otras cuentas de activo 7.096 7,4 7.096 17,3
Total activo / pasivo y patrimonio neto 41.848 1,0 41.848 (0,1) Depósitos de clientes (2) 24.191 0,0 24.191 0,9
Débitos representados por valores negociables (2) 2.329 (1,9) 2.329 (33,3)
Pasivos subordinados (2) 0 20,6 0 27,7
Pasivos por contratos de seguros 75 (14,2) 75 (13,6)
Entidades de crédito (2) 12.319 3,7 12.319 5,1
Otras cuentas de pasivo 356 (0,7) 356 82,6
Capital y reservas (3) 2.579 1,4 2.579 6,5
Otros recursos de clientes gestionados 2.041 (0,1) 2.041 (15,7) Fondos de inversión y pensiones 1.898 (1,0) 1.898 (18,6)
Patrimonios administrados 142 12,5 142 57,8
Recursos de clientes gestionados 28.560 (0,1) 28.560 (4,4)
RATIOS (%) Y MEDIOS OPERATIVOS
ROE 5,79 0,82 p. 4,49 (0,35 p.)
Eficiencia (con amortizaciones) 56,6 2,6 p. 54,1 5,2 p.
Tasa de morosidad 8,12 0,26 p. 8,12 1,56 p.
Cobertura 50,0 (1,9 p.) 50,0 (3,1 p.)
Número de empleados 5.635 0,1 5.635 (1,5)
Número de oficinas 640 (1,1) 640 (4,0)
(1).- Incluye rendimiento de instrumentos de capital, resultados por puesta en equivalencia y otros productos/cargas de explotación (2).- Incluye la totalidad de saldos en balance por este concepto (3).- No incluye beneficio del ejercicio
18 ENERO - DICIEMBRE

INFORMACI‡N POR SEGMENTOS PRINCIPALES INFORME FINANCIERO 2013
POLONIA (Millones de euros)
Var. s/ 3T»13 Var. s/ 2012
RESULTADOS 4T»13 (%) (%) sin TC 2013 (%) (%) sin TC Margen de intereses 206 1,2 (0,2) 781 44,4 44,9 Comisiones netas 110 5,1 3,6 424 28,2 28,6
Resultados netos por operaciones financieras 15 (62,2) (62,9) 119 49,4 49,9
Resto ingresos (1) (4) 99,6 107,6 7 (55,2) (55,1)
Margen bruto 327 (5,5) (6,8) 1.331 37,6 38,1 Costes de explotación (161) 16,2 14,4 (601) 41,2 41,7
Gastos generales de administración (148) 18,2 16,3 (547) 39,9 40,4
De personal (80) 6,7 5,0 (318) 36,1 36,6
Otros gastos generales de administración (68) 35,5 33,3 (229) 45,4 45,9
Amortizaciones (13) (2,6) (4,1) (54) 56,7 57,2
Margen neto 166 (19,9) (21,0) 731 34,8 35,3 Dotaciones insolvencias (39) 10,8 8,7 (167) 49,0 49,5
Otros resultados (4) 137,3 137,5 (6) 599,2 601,6
Resultado antes de impuestos 123 (28,0) (28,9) 557 30,0 30,5 Impuesto sobre sociedades (26) (24,5) (25,4) (110) 26,8 27,3
Resultado de operaciones continuadas 97 (28,9) (29,8) 447 30,9 31,3 Resultado de operaciones interrumpidas (neto) ƒ ƒ ƒ ƒ ƒ ƒ
Resultado consolidado del ejercicio 97 (28,9) (29,8) 447 30,9 31,3 Resultado atribuido a minoritarios 24 (32,3) (33,2) 113 805,4 808,5
Beneficio atribuido al Grupo 72 (27,6) (28,6) 334 1,4 1,7
BALANCE
Créditos a clientes (2) 16.214 (0,5) (2,3) 16.214 66,6 69,9
Cartera de negociación (sin créditos) 532 (5,1) (6,8) 532 204,7 210,7
Activos financieros disponibles para la venta 5.325 9,6 7,6 5.325 85,2 88,8
Entidades de crédito (2) 667 (18,7) (20,2) 667 69,2 72,5
Inmovilizado 273 24,3 22,1 273 86,6 90,3
Otras cuentas de activo 2.095 2,4 0,6 2.095 37,2 39,9
Total activo / pasivo y patrimonio neto 25.106 1,2 (0,6) 25.106 69,1 72,4 Depósitos de clientes (2) 18.503 6,3 4,4 18.503 65,0 68,2
Débitos representados por valores negociables (2) 121 ƒ ƒ 121 ƒ ƒ
Pasivos subordinados (2) 333 (0,0) (1,8) 333 231,9 238,5
Pasivos por contratos de seguros 84 ƒ ƒ 84 ƒ ƒ
Entidades de crédito (2) 1.206 (53,2) (54,0) 1.206 152,1 157,1
Otras cuentas de pasivo 2.984 12,5 10,5 2.984 137,2 141,9
Capital y reservas (3) 1.875 2,1 0,3 1.875 4,4 6,4
Otros recursos de clientes gestionados 2.789 3,0 1,2 2.789 7,5 9,6 Fondos de inversión y pensiones 2.683 3,2 1,4 2.683 9,8 12,0
Patrimonios administrados 106 (2,3) (4,1) 106 (29,5) (28,1)
Recursos de clientes gestionados 21.745 6,4 4,5 21.745 56,3 59,4
RATIOS (%) Y MEDIOS OPERATIVOS
ROE 15,61 (6,36 p.) 17,68 (1,24 p.)
Eficiencia (con amortizaciones) 49,2 9,2 p. 45,1 1,1 p.
Tasa de morosidad 7,84 0,09 p. 7,84 3,12 p.
Cobertura 61,8 (2,3 p.) 61,8 (6,5 p.)
Número de empleados 12.363 (1,1) 12.363 39,7
Número de oficinas 830 (0,7) 830 59,9
(1).- Incluye rendimiento de instrumentos de capital, resultados por puesta en equivalencia y otros productos/cargas de explotación (2).- Incluye la totalidad de saldos en balance por este concepto (3).- No incluye beneficio del ejercicio
ENERO - DICIEMBRE 19

INFORME FINANCIERO 2013 INFORMACI‡N POR SEGMENTOS PRINCIPALES
SANTANDER CONSUMER FINANCE (Millones de euros)
RESULTADOS 4T»13 (%) s/ 3T»13 2013 (%) s/ 2012 Margen de intereses 573 (3,3) 2.333 (2,3) Comisiones netas 190 (8,6) 787 1,2
Resultados netos por operaciones financieras (8) ƒ (7) (52,2)
Resto ingresos (1) 5 ƒ (2) (82,4)
Margen bruto 759 (5,3) 3.111 (1,0) Costes de explotación (353) 2,4 (1.391) 0,7
Gastos generales de administración (291) (0,6) (1.172) (3,6)
De personal (162) (0,5) (646) 3,5
Otros gastos generales de administración (129) (0,8) (526) (11,1)
Amortizaciones (63) 18,7 (219) 32,5
Margen neto 405 (11,1) 1.720 (2,3) Dotaciones insolvencias (105) (33,6) (565) (25,0)
Otros resultados (5) (64,9) (70) 73,5
Resultado antes de impuestos 295 4,2 1.085 12,3 Impuesto sobre sociedades (76) 15,9 (255) 26,8
Resultado de operaciones continuadas 219 0,7 830 8,5 Resultado de operaciones interrumpidas (neto) (6) ƒ (6) (15,0)
Resultado consolidado del ejercicio 213 (1,8) 824 8,7 Resultado atribuido a minoritarios 5 (46,3) 31 (10,5)
Beneficio atribuido al Grupo 209 0,1 794 9,6
BALANCE
Créditos a clientes (2) 56.024 0,2 56.024 (1,2)
Cartera de negociación (sin créditos) 864 (4,4) 864 (35,5)
Activos financieros disponibles para la venta 705 18,0 705 209,8
Entidades de crédito (2) 8.158 (25,6) 8.158 (29,1)
Inmovilizado 934 (0,6) 934 (6,5)
Otras cuentas de activo 3.723 56,0 3.723 12,1
Total activo / pasivo y patrimonio neto 70.409 (1,8) 70.409 (4,9) Depósitos de clientes (2) 30.878 0,5 30.878 (3,2)
Débitos representados por valores negociables (2) 10.377 23,8 10.377 70,6
Pasivos subordinados (2) 64 536,7 64 526,3
Pasivos por contratos de seguros ƒ ƒ ƒ ƒ
Entidades de crédito (2) 18.060 2,5 18.060 (11,9)
Otras cuentas de pasivo 3.901 1,2 3.901 (13,9)
Capital y reservas (3) 7.128 (35,7) 7.128 (35,5)
Otros recursos de clientes gestionados 6 1,7 6 7,4 Fondos de inversión y pensiones 6 1,7 6 7,4
Patrimonios administrados ƒ ƒ ƒ ƒ
Recursos de clientes gestionados 41.326 5,6 41.326 8,8
RATIOS (%) Y MEDIOS OPERATIVOS
ROE 8,27 0,77 p. 7,29 0,61 p.
Eficiencia (con amortizaciones) 46,6 3,5 p. 44,7 0,7 p.
Tasa de morosidad 4,01 0,05 p. 4,01 0,11 p.
Cobertura 105,3 (3,9 p.) 105,3 (4,2 p.)
Número de empleados 11.695 (1,5) 11.695 (4,8)
Número de oficinas 613 (3,5) 613 (2,5)
(1).- Incluye rendimiento de instrumentos de capital, resultados por puesta en equivalencia y otros productos/cargas de explotación (2).- Incluye la totalidad de saldos en balance por este concepto (3).- No incluye beneficio del ejercicio
20 ENERO - DICIEMBRE
INFORMACI‡N POR SEGMENTOS PRINCIPALES INFORME FINANCIERO 2013
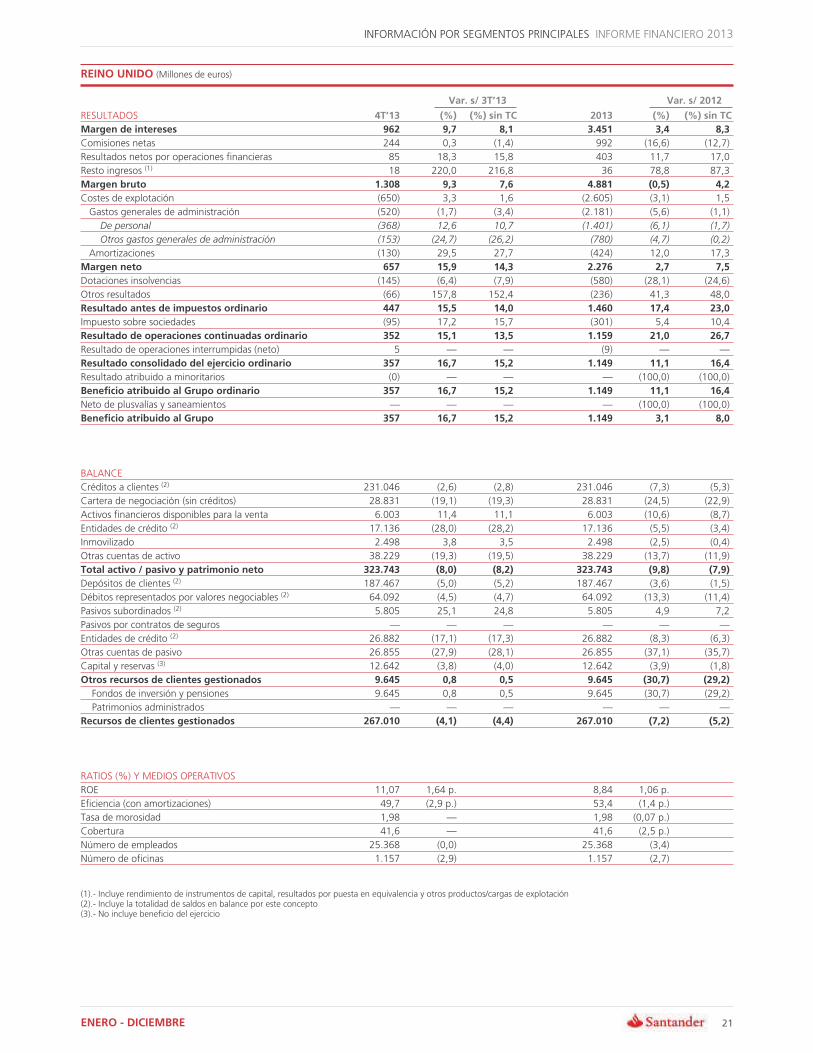
REINO UNIDO (Millones de euros)
Var. s/ 3T»13 Var. s/ 2012
RESULTADOS 4T»13 (%) (%) sin TC 2013 (%) (%) sin TC Margen de intereses 962 9,7 8,1 3.451 3,4 8,3 Comisiones netas 244 0,3 (1,4) 992 (16,6) (12,7)
Resultados netos por operaciones financieras 85 18,3 15,8 403 11,7 17,0
Resto ingresos (1) 18 220,0 216,8 36 78,8 87,3
Margen bruto 1.308 9,3 7,6 4.881 (0,5) 4,2 Costes de explotación (650) 3,3 1,6 (2.605) (3,1) 1,5
Gastos generales de administración (520) (1,7) (3,4) (2.181) (5,6) (1,1)
De personal (368) 12,6 10,7 (1.401) (6,1) (1,7)
Otros gastos generales de administración (153) (24,7) (26,2) (780) (4,7) (0,2)
Amortizaciones (130) 29,5 27,7 (424) 12,0 17,3
Margen neto 657 15,9 14,3 2.276 2,7 7,5 Dotaciones insolvencias (145) (6,4) (7,9) (580) (28,1) (24,6)
Otros resultados (66) 157,8 152,4 (236) 41,3 48,0
Resultado antes de impuestos ordinario 447 15,5 14,0 1.460 17,4 23,0 Impuesto sobre sociedades (95) 17,2 15,7 (301) 5,4 10,4
Resultado de operaciones continuadas ordinario 352 15,1 13,5 1.159 21,0 26,7 Resultado de operaciones interrumpidas (neto) 5 ƒ ƒ (9) ƒ ƒ
Resultado consolidado del ejercicio ordinario 357 16,7 15,2 1.149 11,1 16,4 Resultado atribuido a minoritarios (0) ƒ ƒ ƒ (100,0) (100,0)
Beneficio atribuido al Grupo ordinario 357 16,7 15,2 1.149 11,1 16,4 Neto de plusvalías y saneamientos ƒ ƒ ƒ ƒ (100,0) (100,0)
Beneficio atribuido al Grupo 357 16,7 15,2 1.149 3,1 8,0
BALANCE
Créditos a clientes (2) 231.046 (2,6) (2,8) 231.046 (7,3) (5,3)
Cartera de negociación (sin créditos) 28.831 (19,1) (19,3) 28.831 (24,5) (22,9)
Activos financieros disponibles para la venta 6.003 11,4 11,1 6.003 (10,6) (8,7)
Entidades de crédito (2) 17.136 (28,0) (28,2) 17.136 (5,5) (3,4)
Inmovilizado 2.498 3,8 3,5 2.498 (2,5) (0,4)
Otras cuentas de activo 38.229 (19,3) (19,5) 38.229 (13,7) (11,9)
Total activo / pasivo y patrimonio neto 323.743 (8,0) (8,2) 323.743 (9,8) (7,9) Depósitos de clientes (2) 187.467 (5,0) (5,2) 187.467 (3,6) (1,5)
Débitos representados por valores negociables (2) 64.092 (4,5) (4,7) 64.092 (13,3) (11,4)
Pasivos subordinados (2) 5.805 25,1 24,8 5.805 4,9 7,2
Pasivos por contratos de seguros ƒ ƒ ƒ ƒ ƒ ƒ
Entidades de crédito (2) 26.882 (17,1) (17,3) 26.882 (8,3) (6,3)
Otras cuentas de pasivo 26.855 (27,9) (28,1) 26.855 (37,1) (35,7)
Capital y reservas (3) 12.642 (3,8) (4,0) 12.642 (3,9) (1,8)
Otros recursos de clientes gestionados 9.645 0,8 0,5 9.645 (30,7) (29,2) Fondos de inversión y pensiones 9.645 0,8 0,5 9.645 (30,7) (29,2)
Patrimonios administrados ƒ ƒ ƒ ƒ ƒ ƒ
Recursos de clientes gestionados 267.010 (4,1) (4,4) 267.010 (7,2) (5,2)
RATIOS (%) Y MEDIOS OPERATIVOS
ROE 11,07 1,64 p. 8,84 1,06 p.
Eficiencia (con amortizaciones) 49,7 (2,9 p.) 53,4 (1,4 p.)
Tasa de morosidad 1,98 ƒ 1,98 (0,07 p.)
Cobertura 41,6 ƒ 41,6 (2,5 p.)
Número de empleados 25.368 (0,0) 25.368 (3,4)
Número de oficinas 1.157 (2,9) 1.157 (2,7)
(1).- Incluye rendimiento de instrumentos de capital, resultados por puesta en equivalencia y otros productos/cargas de explotación (2).- Incluye la totalidad de saldos en balance por este concepto (3).- No incluye beneficio del ejercicio
ENERO - DICIEMBRE 21

INFORME FINANCIERO 2013 INFORMACI‡N POR SEGMENTOS PRINCIPALES
LATINOAMÉRICA (Millones de euros)
Var. s/ 3T»13 Var. s/ 2012
RESULTADOS 4T»13 (%) (%) sin TC 2013 (%) (%) sin TC Margen de intereses 3.561 (0,3) 2,2 15.186 (15,1) (5,5) Comisiones netas 1.195 6,1 8,8 4.874 (4,4) 6,2
Resultados netos por operaciones financieras 160 (51,3) (46,0) 1.039 (3,1) 8,0
Resto ingresos (1) (16) 329,9 326,8 (15) (87,0) (86,0)
Margen bruto 4.899 (2,5) 0,4 21.083 (11,9) (2,0) Costes de explotación (2.186) 3,8 6,6 (8.704) (4,6) 5,9
Gastos generales de administración (1.967) 4,2 7,0 (7.800) (5,5) 4,9
De personal (1.064) 2,3 5,1 (4.319) (7,0) 3,2
Otros gastos generales de administración (904) 6,5 9,3 (3.481) (3,6) 7,1
Amortizaciones (218) 0,9 3,6 (904) 3,8 15,2
Margen neto 2.714 (7,0) (4,1) 12.379 (16,4) (6,8) Dotaciones insolvencias (1.398) (8,5) (6,0) (6.483) (12,2) (1,4)
Otros resultados (195) 33,9 36,0 (551) (32,7) (22,3)
Resultado antes de impuestos 1.121 (10,1) (6,4) 5.345 (19,2) (11,0) Impuesto sobre sociedades (265) (14,8) (10,7) (1.208) (18,6) (9,1)
Resultado de operaciones continuadas 856 (8,5) (5,0) 4.137 (19,3) (11,5) Resultado de operaciones interrumpidas (neto) 0 ƒ ƒ 0 ƒ ƒ
Resultado consolidado del ejercicio 856 (8,5) (5,0) 4.137 (19,3) (11,5) Resultado atribuido a minoritarios 188 (7,5) (4,5) 879 1,5 12,4
Beneficio atribuido al Grupo 669 (8,7) (5,1) 3.257 (23,6) (16,3)
BALANCE
Créditos a clientes (2) 132.542 (2,4) 3,2 132.542 (5,4) 10,0
Cartera de negociación (sin créditos) 23.107 (14,0) (10,5) 23.107 (18,6) (8,8)
Activos financieros disponibles para la venta 20.947 10,7 17,2 20.947 (10,9) 4,9
Entidades de crédito (2) 28.213 2,0 6,4 28.213 9,4 23,6
Inmovilizado 3.930 (0,4) 6,3 3.930 (12,5) 4,2
Otras cuentas de activo 41.238 (22,5) (18,2) 41.238 (12,9) 1,8
Total activo / pasivo y patrimonio neto 249.979 (6,2) (1,1) 249.979 (7,3) 7,3 Depósitos de clientes (2) 125.844 (4,7) 0,5 125.844 (6,6) 8,3
Débitos representados por valores negociables (2) 28.987 1,9 8,4 28.987 3,1 21,7
Pasivos subordinados (2) 4.833 22,6 30,9 4.833 (15,7) 0,1
Pasivos por contratos de seguros ƒ ƒ ƒ ƒ ƒ ƒ
Entidades de crédito (2) 24.825 (30,9) (27,8) 24.825 (22,7) (11,4)
Otras cuentas de pasivo 45.252 3,8 9,1 45.252 (6,7) 6,8
Capital y reservas (3) 20.237 (9,5) (4,5) 20.237 (0,8) 14,8
Otros recursos de clientes gestionados 64.563 (3,3) 1,8 64.563 6,1 21,4 Fondos de inversión y pensiones 50.214 (4,9) 0,6 50.214 4,2 20,9
Patrimonios administrados 14.349 2,6 6,3 14.349 13,4 23,0
Recursos de clientes gestionados 224.227 (3,1) 2,4 224.227 (2,3) 13,2
RATIOS (%) Y MEDIOS OPERATIVOS
ROE 12,24 (0,50 p.) 13,84 (5,41 p.)
Eficiencia (con amortizaciones) 44,6 2,7 p. 41,3 3,2 p.
Tasa de morosidad 5,03 (0,29 p.) 5,03 (0,39 p.)
Cobertura 84,6 1,7 p. 84,6 (2,9 p.)
Número de empleados 87.069 (0,7) 87.069 (3,9)
Número de oficinas 5.904 (1,0) 5.904 (2,3)
(1).- Incluye rendimiento de instrumentos de capital, resultados por puesta en equivalencia y otros productos/cargas de explotación (2).- Incluye la totalidad de saldos en balance por este concepto (3).- No incluye beneficio del ejercicio
22 ENERO - DICIEMBRE
INFORMACI‡N POR SEGMENTOS PRINCIPALES INFORME FINANCIERO 2013
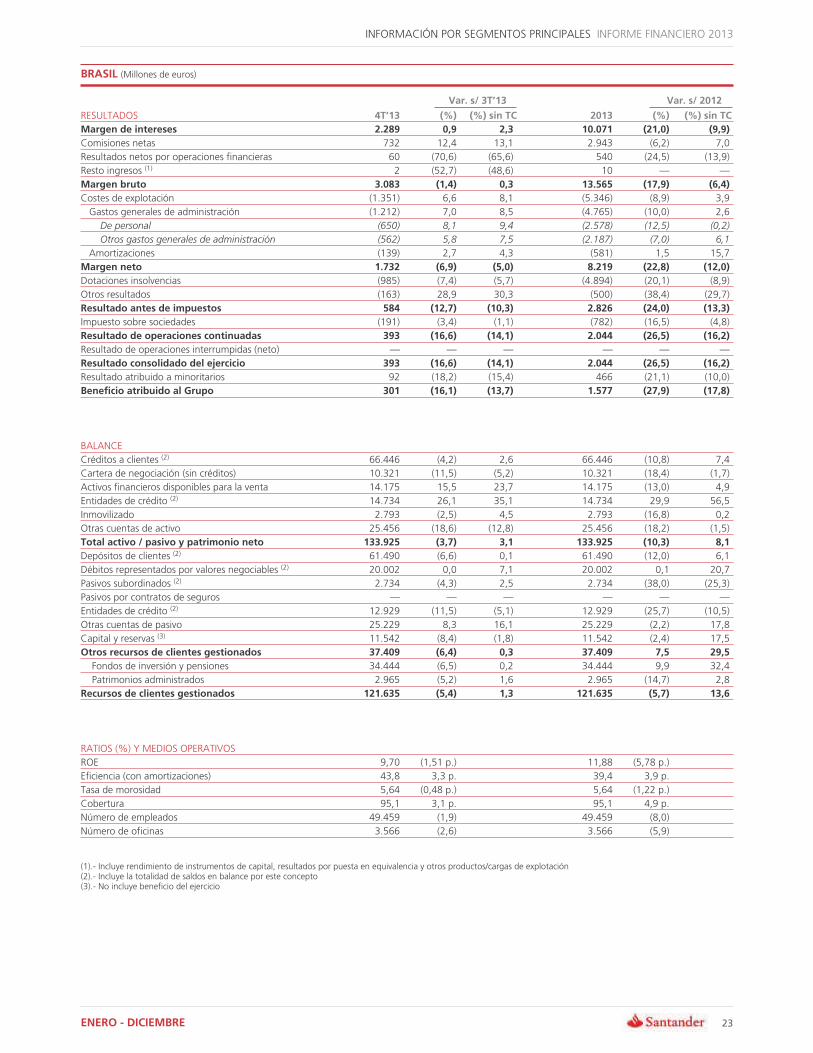
BRASIL (Millones de euros)
Var. s/ 3T»13 Var. s/ 2012
RESULTADOS 4T»13 (%) (%) sin TC 2013 (%) (%) sin TC Margen de intereses 2.289 0,9 2,3 10.071 (21,0) (9,9) Comisiones netas 732 12,4 13,1 2.943 (6,2) 7,0
Resultados netos por operaciones financieras 60 (70,6) (65,6) 540 (24,5) (13,9)
Resto ingresos (1) 2 (52,7) (48,6) 10 ƒ ƒ
Margen bruto 3.083 (1,4) 0,3 13.565 (17,9) (6,4) Costes de explotación (1.351) 6,6 8,1 (5.346) (8,9) 3,9
Gastos generales de administración (1.212) 7,0 8,5 (4.765) (10,0) 2,6
De personal (650) 8,1 9,4 (2.578) (12,5) (0,2)
Otros gastos generales de administración (562) 5,8 7,5 (2.187) (7,0) 6,1
Amortizaciones (139) 2,7 4,3 (581) 1,5 15,7
Margen neto 1.732 (6,9) (5,0) 8.219 (22,8) (12,0) Dotaciones insolvencias (985) (7,4) (5,7) (4.894) (20,1) (8,9)
Otros resultados (163) 28,9 30,3 (500) (38,4) (29,7)
Resultado antes de impuestos 584 (12,7) (10,3) 2.826 (24,0) (13,3) Impuesto sobre sociedades (191) (3,4) (1,1) (782) (16,5) (4,8)
Resultado de operaciones continuadas 393 (16,6) (14,1) 2.044 (26,5) (16,2) Resultado de operaciones interrumpidas (neto) ƒ ƒ ƒ ƒ ƒ ƒ
Resultado consolidado del ejercicio 393 (16,6) (14,1) 2.044 (26,5) (16,2) Resultado atribuido a minoritarios 92 (18,2) (15,4) 466 (21,1) (10,0)
Beneficio atribuido al Grupo 301 (16,1) (13,7) 1.577 (27,9) (17,8)
BALANCE
Créditos a clientes (2) 66.446 (4,2) 2,6 66.446 (10,8) 7,4
Cartera de negociación (sin créditos) 10.321 (11,5) (5,2) 10.321 (18,4) (1,7)
Activos financieros disponibles para la venta 14.175 15,5 23,7 14.175 (13,0) 4,9
Entidades de crédito (2) 14.734 26,1 35,1 14.734 29,9 56,5
Inmovilizado 2.793 (2,5) 4,5 2.793 (16,8) 0,2
Otras cuentas de activo 25.456 (18,6) (12,8) 25.456 (18,2) (1,5)
Total activo / pasivo y patrimonio neto 133.925 (3,7) 3,1 133.925 (10,3) 8,1 Depósitos de clientes (2) 61.490 (6,6) 0,1 61.490 (12,0) 6,1
Débitos representados por valores negociables (2) 20.002 0,0 7,1 20.002 0,1 20,7
Pasivos subordinados (2) 2.734 (4,3) 2,5 2.734 (38,0) (25,3)
Pasivos por contratos de seguros ƒ ƒ ƒ ƒ ƒ ƒ
Entidades de crédito (2) 12.929 (11,5) (5,1) 12.929 (25,7) (10,5)
Otras cuentas de pasivo 25.229 8,3 16,1 25.229 (2,2) 17,8
Capital y reservas (3) 11.542 (8,4) (1,8) 11.542 (2,4) 17,5
Otros recursos de clientes gestionados 37.409 (6,4) 0,3 37.409 7,5 29,5 Fondos de inversión y pensiones 34.444 (6,5) 0,2 34.444 9,9 32,4
Patrimonios administrados 2.965 (5,2) 1,6 2.965 (14,7) 2,8
Recursos de clientes gestionados 121.635 (5,4) 1,3 121.635 (5,7) 13,6
RATIOS (%) Y MEDIOS OPERATIVOS
ROE 9,70 (1,51 p.) 11,88 (5,78 p.)
Eficiencia (con amortizaciones) 43,8 3,3 p. 39,4 3,9 p.
Tasa de morosidad 5,64 (0,48 p.) 5,64 (1,22 p.)
Cobertura 95,1 3,1 p. 95,1 4,9 p.
Número de empleados 49.459 (1,9) 49.459 (8,0)
Número de oficinas 3.566 (2,6) 3.566 (5,9)
(1).- Incluye rendimiento de instrumentos de capital, resultados por puesta en equivalencia y otros productos/cargas de explotación (2).- Incluye la totalidad de saldos en balance por este concepto (3).- No incluye beneficio del ejercicio
ENERO - DICIEMBRE 23
INFORME FINANCIERO 2013 INFORMACI‡N POR SEGMENTOS PRINCIPALES
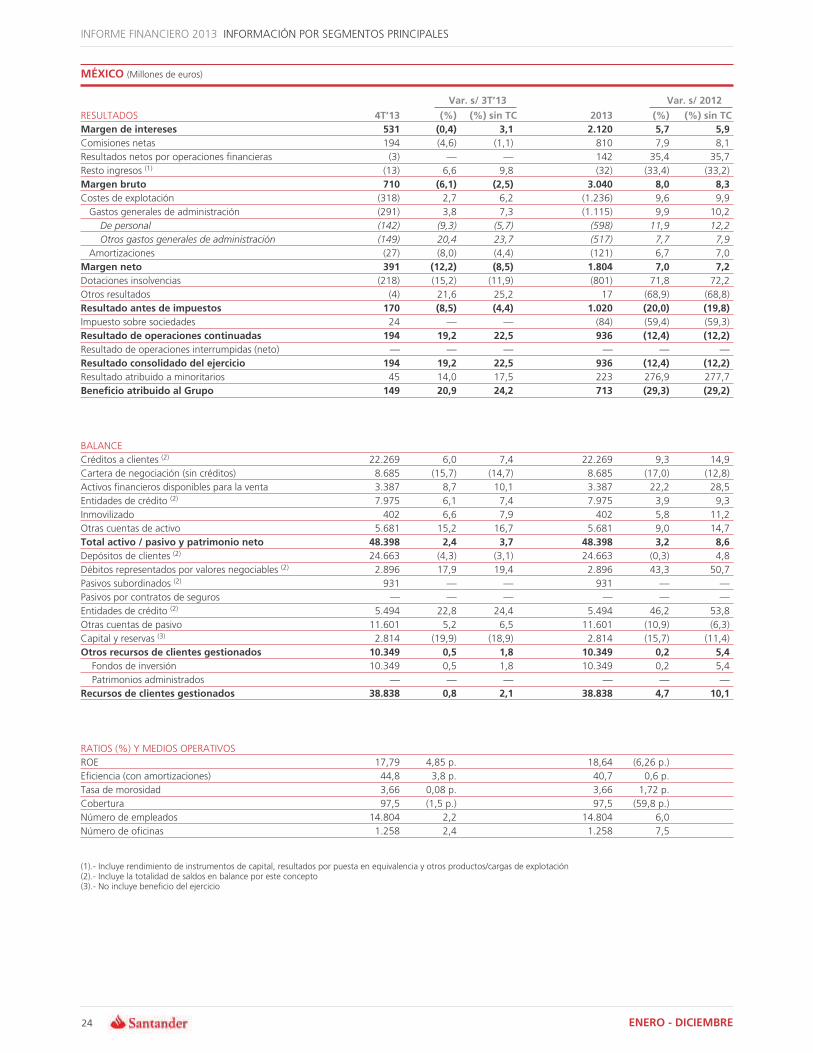
MÉXICO (Millones de euros)
Var. s/ 3T»13 Var. s/ 2012
RESULTADOS 4T»13 (%) (%) sin TC 2013 (%) (%) sin TC Margen de intereses 531 (0,4) 3,1 2.120 5,7 5,9 Comisiones netas 194 (4,6) (1,1) 810 7,9 8,1
Resultados netos por operaciones financieras (3) ƒ ƒ 142 35,4 35,7
Resto ingresos (1) (13) 6,6 9,8 (32) (33,4) (33,2)
Margen bruto 710 (6,1) (2,5) 3.040 8,0 8,3 Costes de explotación (318) 2,7 6,2 (1.236) 9,6 9,9
Gastos generales de administración (291) 3,8 7,3 (1.115) 9,9 10,2
De personal (142) (9,3) (5,7) (598) 11,9 12,2
Otros gastos generales de administración (149) 20,4 23,7 (517) 7,7 7,9
Amortizaciones (27) (8,0) (4,4) (121) 6,7 7,0
Margen neto 391 (12,2) (8,5) 1.804 7,0 7,2 Dotaciones insolvencias (218) (15,2) (11,9) (801) 71,8 72,2
Otros resultados (4) 21,6 25,2 17 (68,9) (68,8)
Resultado antes de impuestos 170 (8,5) (4,4) 1.020 (20,0) (19,8) Impuesto sobre sociedades 24 ƒ ƒ (84) (59,4) (59,3)
Resultado de operaciones continuadas 194 19,2 22,5 936 (12,4) (12,2) Resultado de operaciones interrumpidas (neto) ƒ ƒ ƒ ƒ ƒ ƒ
Resultado consolidado del ejercicio 194 19,2 22,5 936 (12,4) (12,2) Resultado atribuido a minoritarios 45 14,0 17,5 223 276,9 277,7
Beneficio atribuido al Grupo 149 20,9 24,2 713 (29,3) (29,2)
BALANCE
Créditos a clientes (2) 22.269 6,0 7,4 22.269 9,3 14,9
Cartera de negociación (sin créditos) 8.685 (15,7) (14,7) 8.685 (17,0) (12,8)
Activos financieros disponibles para la venta 3.387 8,7 10,1 3.387 22,2 28,5
Entidades de crédito (2) 7.975 6,1 7,4 7.975 3,9 9,3
Inmovilizado 402 6,6 7,9 402 5,8 11,2
Otras cuentas de activo 5.681 15,2 16,7 5.681 9,0 14,7
Total activo / pasivo y patrimonio neto 48.398 2,4 3,7 48.398 3,2 8,6 Depósitos de clientes (2) 24.663 (4,3) (3,1) 24.663 (0,3) 4,8
Débitos representados por valores negociables (2) 2.896 17,9 19,4 2.896 43,3 50,7
Pasivos subordinados (2) 931 ƒ ƒ 931 ƒ ƒ
Pasivos por contratos de seguros ƒ ƒ ƒ ƒ ƒ ƒ
Entidades de crédito (2) 5.494 22,8 24,4 5.494 46,2 53,8
Otras cuentas de pasivo 11.601 5,2 6,5 11.601 (10,9) (6,3)
Capital y reservas (3) 2.814 (19,9) (18,9) 2.814 (15,7) (11,4)
Otros recursos de clientes gestionados 10.349 0,5 1,8 10.349 0,2 5,4 Fondos de inversión 10.349 0,5 1,8 10.349 0,2 5,4
Patrimonios administrados ƒ ƒ ƒ ƒ ƒ ƒ
Recursos de clientes gestionados 38.838 0,8 2,1 38.838 4,7 10,1
RATIOS (%) Y MEDIOS OPERATIVOS
ROE 17,79 4,85 p. 18,64 (6,26 p.)
Eficiencia (con amortizaciones) 44,8 3,8 p. 40,7 0,6 p.
Tasa de morosidad 3,66 0,08 p. 3,66 1,72 p.
Cobertura 97,5 (1,5 p.) 97,5 (59,8 p.)
Número de empleados 14.804 2,2 14.804 6,0
Número de oficinas 1.258 2,4 1.258 7,5
(1).- Incluye rendimiento de instrumentos de capital, resultados por puesta en equivalencia y otros productos/cargas de explotación (2).- Incluye la totalidad de saldos en balance por este concepto (3).- No incluye beneficio del ejercicio
24 ENERO - DICIEMBRE

INFORMACI‡N POR SEGMENTOS PRINCIPALES INFORME FINANCIERO 2013
CHILE (Millones de euros)
Var. s/ 3T»13 Var. s/ 2012
RESULTADOS 4T»13 (%) (%) sin TC 2013 (%) (%) sin TC Margen de intereses 434 (2,7) 1,5 1.698 (1,7) 3,4 Comisiones netas 90 0,1 4,3 383 (14,4) (10,0)
Resultados netos por operaciones financieras 46 20,6 24,2 168 35,8 42,8
Resto ingresos (1) (1) ƒ ƒ 12 35,8 42,8
Margen bruto 569 (1,1) 3,1 2.261 (2,0) 3,0 Costes de explotación (221) (5,3) (1,0) (937) 0,4 5,5
Gastos generales de administración (197) (4,5) (0,2) (829) (0,5) 4,6
De personal (122) (4,0) 0,3 (513) (1,6) 3,4
Otros gastos generales de administración (74) (5,4) (1,1) (315) 1,5 6,7
Amortizaciones (25) (11,0) (6,6) (108) 7,2 12,7
Margen neto 348 1,7 5,9 1.324 (3,6) 1,4 Dotaciones insolvencias (142) (7,8) (3,4) (597) 4,1 9,5
Otros resultados (4) ƒ ƒ 4 (25,2) (21,4)
Resultado antes de impuestos 203 4,4 8,6 731 (9,2) (4,6) Impuesto sobre sociedades (33) 20,3 24,2 (107) 6,1 11,5
Resultado de operaciones continuadas 169 1,8 6,0 624 (11,4) (6,9) Resultado de operaciones interrumpidas (neto) ƒ ƒ ƒ ƒ ƒ ƒ
Resultado consolidado del ejercicio 169 1,8 6,0 624 (11,4) (6,9) Resultado atribuido a minoritarios 50 (0,6) 3,6 188 (12,0) (7,5)
Beneficio atribuido al Grupo 119 2,9 7,1 435 (11,2) (6,6)
BALANCE
Créditos a clientes (2) 28.783 (3,1) 2,8 28.783 (3,0) 11,2
Cartera de negociación (sin créditos) 1.388 27,9 35,7 1.388 (19,5) (7,7)
Activos financieros disponibles para la venta 2.385 (4,0) 1,8 2.385 (19,1) (7,2)
Entidades de crédito (2) 2.599 (10,0) (4,5) 2.599 (17,5) (5,4)
Inmovilizado 327 0,8 7,0 327 (12,3) 0,6
Otras cuentas de activo 3.072 (6,2) (0,4) 3.072 9,8 25,9
Total activo / pasivo y patrimonio neto 38.553 (3,0) 2,9 38.553 (5,2) 8,7 Depósitos de clientes (2) 20.988 (4,9) 0,9 20.988 (6,3) 7,4
Débitos representados por valores negociables (2) 6.022 1,2 7,4 6.022 (1,0) 13,6
Pasivos subordinados (2) 1.147 14,1 21,1 1.147 (0,3) 14,4
Pasivos por contratos de seguros ƒ ƒ ƒ ƒ ƒ ƒ
Entidades de crédito (2) 4.253 (7,8) (2,2) 4.253 (9,0) 4,4
Otras cuentas de pasivo 4.021 3,3 9,6 4.021 (6,2) 7,6
Capital y reservas (3) 2.122 (4,1) 1,7 2.122 2,5 17,5
Otros recursos de clientes gestionados 5.469 (3,5) 2,3 5.469 19,9 37,5 Fondos de inversión y pensiones 4.067 (5,2) 0,6 4.067 (10,9) 2,2
Patrimonios administrados 1.402 1,6 7,8 1.402 ƒ ƒ
Recursos de clientes gestionados 33.626 (3,1) 2,8 33.626 (1,7) 12,8
RATIOS (%) Y MEDIOS OPERATIVOS
ROE 22,11 1,52 p. 18,47 (3,27 p.)
Eficiencia (con amortizaciones) 38,9 (1,7 p.) 41,4 1,0 p.
Tasa de morosidad 5,91 (0,09 p.) 5,91 0,74 p.
Cobertura 51,1 1,4 p. 51,1 (6,6 p.)
Número de empleados 12.290 (0,1) 12.290 (0,6)
Número de oficinas 493 1,0 493 (2,2)
(1).- Incluye rendimiento de instrumentos de capital, resultados por puesta en equivalencia y otros productos/cargas de explotación (2).- Incluye la totalidad de saldos en balance por este concepto (3).- No incluye beneficio del ejercicio
ENERO - DICIEMBRE 25
INFORME FINANCIERO 2013 INFORMACI‡N POR SEGMENTOS PRINCIPALES
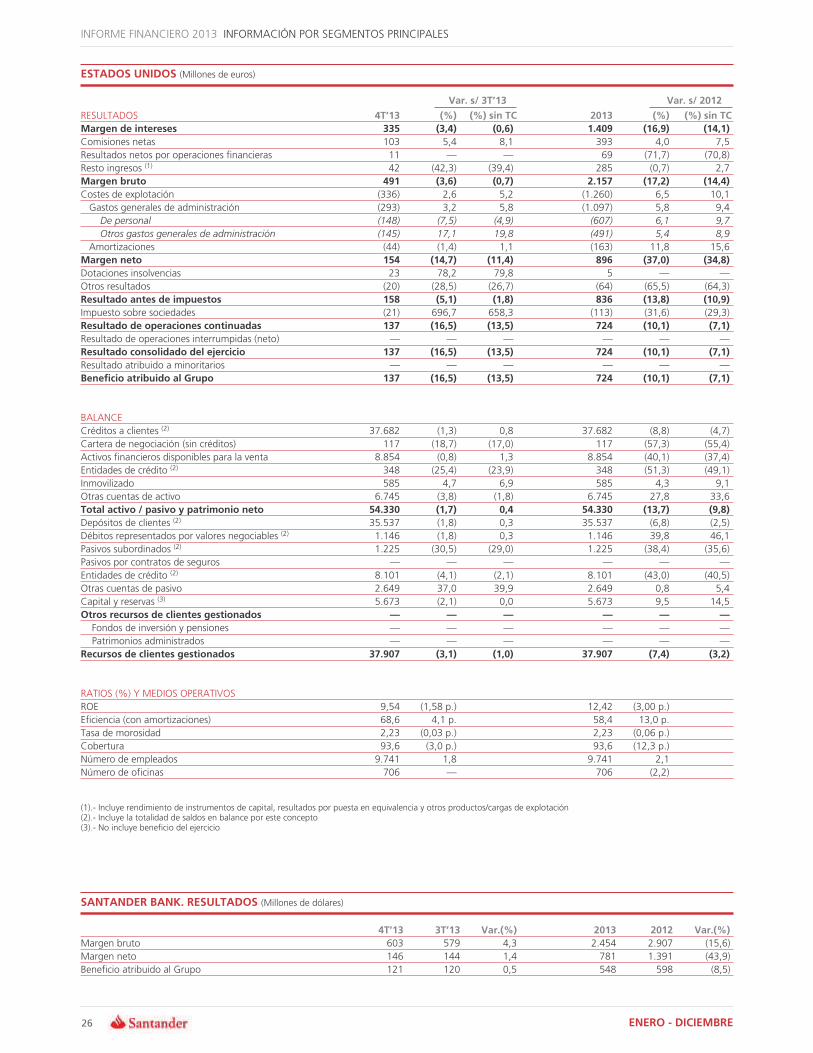
ESTADOS UNIDOS (Millones de euros)
Var. s/ 3T»13 Var. s/ 2012
RESULTADOS 4T»13 (%) (%) sin TC 2013 (%) (%) sin TC Margen de intereses 335 (3,4) (0,6) 1.409 (16,9) (14,1) Comisiones netas 103 5,4 8,1 393 4,0 7,5 Resultados netos por operaciones financieras 11 ƒ ƒ 69 (71,7) (70,8) Resto ingresos (1) 42 (42,3) (39,4) 285 (0,7) 2,7 Margen bruto 491 (3,6) (0,7) 2.157 (17,2) (14,4) Costes de explotación (336) 2,6 5,2 (1.260) 6,5 10,1 Gastos generales de administración (293) 3,2 5,8 (1.097) 5,8 9,4
De personal (148) (7,5) (4,9) (607) 6,1 9,7
Otros gastos generales de administración (145) 17,1 19,8 (491) 5,4 8,9
Amortizaciones (44) (1,4) 1,1 (163) 11,8 15,6 Margen neto 154 (14,7) (11,4) 896 (37,0) (34,8) Dotaciones insolvencias 23 78,2 79,8 5 ƒ ƒ Otros resultados (20) (28,5) (26,7) (64) (65,5) (64,3) Resultado antes de impuestos 158 (5,1) (1,8) 836 (13,8) (10,9) Impuesto sobre sociedades (21) 696,7 658,3 (113) (31,6) (29,3) Resultado de operaciones continuadas 137 (16,5) (13,5) 724 (10,1) (7,1) Resultado de operaciones interrumpidas (neto) ƒ ƒ ƒ ƒ ƒ ƒ Resultado consolidado del ejercicio 137 (16,5) (13,5) 724 (10,1) (7,1) Resultado atribuido a minoritarios ƒ ƒ ƒ ƒ ƒ ƒ Beneficio atribuido al Grupo 137 (16,5) (13,5) 724 (10,1) (7,1)
BALANCE Créditos a clientes (2) 37.682 (1,3) 0,8 37.682 (8,8) (4,7) Cartera de negociación (sin créditos) 117 (18,7) (17,0) 117 (57,3) (55,4) Activos financieros disponibles para la venta 8.854 (0,8) 1,3 8.854 (40,1) (37,4) Entidades de crédito (2) 348 (25,4) (23,9) 348 (51,3) (49,1) Inmovilizado 585 4,7 6,9 585 4,3 9,1 Otras cuentas de activo 6.745 (3,8) (1,8) 6.745 27,8 33,6 Total activo / pasivo y patrimonio neto 54.330 (1,7) 0,4 54.330 (13,7) (9,8) Depósitos de clientes (2) 35.537 (1,8) 0,3 35.537 (6,8) (2,5) Débitos representados por valores negociables (2) 1.146 (1,8) 0,3 1.146 39,8 46,1 Pasivos subordinados (2) 1.225 (30,5) (29,0) 1.225 (38,4) (35,6) Pasivos por contratos de seguros ƒ ƒ ƒ ƒ ƒ ƒ Entidades de crédito (2) 8.101 (4,1) (2,1) 8.101 (43,0) (40,5) Otras cuentas de pasivo 2.649 37,0 39,9 2.649 0,8 5,4 Capital y reservas (3) 5.673 (2,1) 0,0 5.673 9,5 14,5 Otros recursos de clientes gestionados ƒ ƒ ƒ ƒ ƒ ƒ Fondos de inversión y pensiones ƒ ƒ ƒ ƒ ƒ ƒ Patrimonios administrados ƒ ƒ ƒ ƒ ƒ ƒ
Recursos de clientes gestionados 37.907 (3,1) (1,0) 37.907 (7,4) (3,2)
RATIOS (%) Y MEDIOS OPERATIVOS ROE 9,54 (1,58 p.) 12,42 (3,00 p.) Eficiencia (con amortizaciones) 68,6 4,1 p. 58,4 13,0 p. Tasa de morosidad 2,23 (0,03 p.) 2,23 (0,06 p.) Cobertura 93,6 (3,0 p.) 93,6 (12,3 p.) Número de empleados 9.741 1,8 9.741 2,1 Número de oficinas 706 ƒ 706 (2,2)
(1).- Incluye rendimiento de instrumentos de capital, resultados por puesta en equivalencia y otros productos/cargas de explotación (2).- Incluye la totalidad de saldos en balance por este concepto (3).- No incluye beneficio del ejercicio
SANTANDER BANK. RESULTADOS (Millones de dólares)
4T»13 3T»13 Var.(%) 2013 2012 Var.(%) Margen bruto 603 579 4,3 2.454 2.907 (15,6) Margen neto 146 144 1,4 781 1.391 (43,9) Beneficio atribuido al Grupo 121 120 0,5 548 598 (8,5)
26 ENERO - DICIEMBRE

INFORMACI‡N POR SEGMENTOS PRINCIPALES INFORME FINANCIERO 2013
ACTIVIDADES CORPORATIVAS (Millones de euros)
RESULTADOS 4T»13 3T»13 (%) 2013 2012 (%) Margen de intereses (619) (526) 17,7 (2.234) (1.843) 21,2 Comisiones netas 3 (19) ƒ (50) (30) 63,8
Resultados netos por operaciones financieras 264 330 (20,0) 1.184 716 65,4
Resto de ingresos 36 47 (23,0) 146 150 (2,7)
Rendimiento de instrumentos de capital 4 23 (84,2) 35 53 (34,0)
Resultados por puesta en equivalencia 0 (4) ƒ (8) (4) 76,0
Otros resultados de explotación (netos) 33 28 14,6 119 101 17,0
Margen bruto (316) (168) 88,0 (953) (1.007) (5,3) Costes de explotación (172) (170) 1,0 (698) (530) 31,6
Gastos generales de administración (118) (154) (23,2) (566) (411) 37,9
De personal (56) (35) 57,8 (216) (103) 109,9
Otros gastos generales de administración (63) (119) (47,2) (350) (308) 13,8
Amortizaciones (54) (16) 234,2 (132) (120) 10,2
Margen neto (488) (338) 44,2 (1.651) (1.537) 7,4 Dotaciones insolvencias 2 14 (83,5) (201) (85) 136,7
Otros resultados 105 (124) ƒ (173) (555) (68,8)
Resultado antes de impuestos ordinario (380) (447) (15,1) (2.025) (2.177) (7,0) Impuesto sobre sociedades (6) 24 ƒ 145 33 344,6
Resultado de operaciones continuadas ordinario (386) (424) (9,0) (1.880) (2.144) (12,3) Resultado de operaciones interrumpidas (neto) (0) ƒ ƒ (0) 0 ƒ
Resultado consolidado del ejercicio ordinario (386) (424) (9,0) (1.880) (2.144) (12,3) Resultado atribuido a minoritarios 11 (2) ƒ 7 (20) ƒ
Beneficio atribuido al Grupo ordinario (397) (422) (6,0) (1.887) (2.125) (11,2) Neto de plusvalías y saneamientos ƒ ƒ ƒ ƒ 983 (100,0)
Beneficio atribuido al Grupo (397) (422) (6,0) (1.887) (1.142) 65,3
BALANCE
Cartera de negociación (sin créditos) 2.743 4.772 (42,5) 2.743 4.722 (41,9)
Activos financieros disponibles para la venta 10.676 18.590 (42,6) 10.676 8.949 19,3
Participaciones 405 237 70,8 405 88 357,8
Fondo de comercio 23.275 23.729 (1,9) 23.275 24.626 (5,5)
Liquidez prestada al Grupo 17.707 23.862 (25,8) 17.707 18.583 (4,7)
Dotación de capital a otras unidades 64.203 70.193 (8,5) 64.203 69.773 (8,0)
Otras cuentas de activo 62.714 62.816 (0,2) 62.714 116.712 (46,3)
Total activo / pasivo y patrimonio neto 181.722 204.200 (11,0) 181.722 243.453 (25,4) Depósitos de clientes (1) 2.851 4.916 (42,0) 2.851 3.152 (9,5)
Débitos representados por valores negociables (1) 64.470 69.149 (6,8) 64.470 82.002 (21,4)
Pasivos subordinados (1) 3.871 4.593 (15,7) 3.871 4.866 (20,5)
Otras cuentas de pasivo 29.755 44.677 (33,4) 29.755 73.744 (59,7)
Capital y reservas del Grupo (2) 80.776 80.866 (0,1) 80.776 79.689 1,4
Otros recursos de clientes gestionados ƒ ƒ ƒ ƒ ƒ ƒ Fondos de inversión y pensiones ƒ ƒ ƒ ƒ ƒ ƒ
Patrimonios administrados ƒ ƒ ƒ ƒ ƒ ƒ
Recursos de clientes gestionados 71.192 78.657 (9,5) 71.192 90.020 (20,9)
MEDIOS OPERATIVOS
Número de empleados 2.397 2.490 (3,7) 2.397 2.374 1,0
(1).- Incluye la totalidad de saldos en balance por este concepto (2).- No incluye beneficio del ejercicio
ENERO - DICIEMBRE 27

INFORME FINANCIERO 2013 INFORMACI‡N POR SEGMENTOS SECUNDARIOS
BANCA COMERCIAL (Millones de euros)
Var. s/ 3T»13 Var. s/ 2012
RESULTADOS 4T»13 (%) (%) sin TC 2013 (%) (%) sin TC Margen de intereses 6.187 (0,8) 0,5 25.553 (11,5) (5,3) Comisiones netas 1.994 0,8 2,1 8.193 (3,3) 2,7 Resultados netos por operaciones financieras 172 (22,2) (20,1) 1.119 (1,3) 6,4 Resto ingresos (1) (51) 140,1 124,7 (75) (48,0) (42,1) Margen bruto 8.301 (1,4) (0,0) 34.790 (9,2) (3,1) Costes de explotación (4.264) 3,1 4,3 (16.917) (1,6) 4,4 Margen neto 4.037 (5,6) (4,2) 17.873 (15,4) (9,2) Dotaciones insolvencias (2.089) 0,8 2,0 (9.448) (19,7) (13,5) Otros resultados (298) 9,6 11,1 (1.055) (18,6) (10,1) Resultado antes de impuestos ordinario 1.650 (14,7) (13,0) 7.370 (8,7) (2,9) Impuesto sobre sociedades (361) (15,3) (13,4) (1.509) (8,5) (1,6) Resultado de operaciones continuadas ordinario 1.289 (14,5) (12,9) 5.861 (8,8) (3,2) Resultado de operaciones interrumpidas (neto) (1) 71,5 52,5 (15) ƒ ƒ Resultado consolidado del ejercicio ordinario 1.288 (14,5) (12,9) 5.845 (10,0) (4,5) Resultado atribuido a minoritarios 148 (22,4) (19,8) 768 12,0 22,9 Beneficio atribuido al Grupo ordinario 1.140 (13,4) (11,9) 5.077 (12,6) (7,6) Neto de plusvalías y saneamientos ƒ ƒ ƒ ƒ (100,0) (100,0) Beneficio atribuido al Grupo 1.140 (13,4) (11,9) 5.077 (13,8) (8,9)
MAGNITUDES DE NEGOCIO Créditos a clientes 584.137 (1,7) (0,7) 584.137 (5,6) (1,9) Depósitos de clientes 537.408 (2,2) (1,3) 537.408 0,6 4,6
(1).- Incluye rendimiento de instrumentos de capital, resultados por puesta en equivalencia y otros productos/cargas de explotación
BANCA MAYORISTA GLOBAL (Millones de euros)
Var. s/ 3T»13 Var. s/ 2012
RESULTADOS 4T»13 (%) (%) sin TC 2013 (%) (%) sin TC Margen de intereses 665 20,1 21,2 2.464 (9,0) (3,6) Comisiones netas 301 6,2 7,1 1.254 (7,8) (3,4) Resultados netos por operaciones financieras 192 (56,3) (54,3) 1.159 38,0 47,0 Resto ingresos (1) 72 72,0 71,2 271 1,2 1,8 Margen bruto 1.230 (6,8) (5,1) 5.148 (0,6) 4,9 Costes de explotación (421) (3,2) (2,1) (1.736) (1,6) 2,9 Margen neto 809 (8,5) (6,5) 3.412 (0,0) 5,9 Dotaciones insolvencias (161) (66,2) (65,5) (952) 126,7 131,3 Otros resultados (33) 305,9 304,1 (72) 58,7 58,7 Resultado antes de impuestos 615 53,5 54,6 2.388 (19,0) (13,6) Impuesto sobre sociedades (171) 62,5 63,7 (661) (20,1) (14,6) Resultado de operaciones continuadas 444 50,3 51,4 1.727 (18,5) (13,3) Resultado de operaciones interrumpidas (neto) ƒ ƒ ƒ ƒ ƒ ƒ Resultado consolidado del ejercicio 444 50,3 51,4 1.727 (18,5) (13,3) Resultado atribuido a minoritarios 52 1,9 4,7 225 7,2 19,1 Beneficio atribuido al Grupo 393 60,3 61,2 1.503 (21,4) (16,7)
MAGNITUDES DE NEGOCIO Créditos a clientes 77.511 (6,0) (4,2) 77.511 (11,8) (7,7) Depósitos de clientes 58.366 (16,9) (15,1) 58.366 (28,8) (24,9)
(1).- Incluye rendimiento de instrumentos de capital, resultados por puesta en equivalencia y otros productos/cargas de explotación
28 ENERO - DICIEMBRE

INFORMACI‡N POR SEGMENTOS SECUNDARIOS INFORME FINANCIERO 2013
GESTI‡N DE ACTIVOS Y SEGUROS (Millones de euros)
Var. s/ 3T»13 Var. s/ 2012
RESULTADOS 4T»13 (%) (%) sin TC 2013 (%) (%) sin TC Margen de intereses 42 86,2 85,8 115 (2,7) 1,8 Comisiones netas 83 (4,8) (3,7) 348 (16,6) (11,8) Resultados netos por operaciones financieras 2 9,6 12,1 6 109,1 165,6 Resto ingresos (1) 63 (9,5) (7,7) 293 (17,4) (13,6) Margen bruto 189 4,9 6,0 763 (14,6) (10,2) Costes de explotación (85) 7,4 7,8 (318) 3,9 7,5 Margen neto 104 2,9 4,7 444 (24,3) (19,7) Dotaciones insolvencias 0 873,3 873,2 0 ƒ ƒ Otros resultados (7) ƒ ƒ (8) (19,9) (10,2) Resultado antes de impuestos 97 (3,7) (1,8) 437 (24,1) (19,6) Impuesto sobre sociedades (23) 2,1 2,1 (101) (34,6) (31,3) Resultado de operaciones continuadas 74 (5,5) (2,9) 336 (20,3) (15,2) Resultado de operaciones interrumpidas (neto) 0 ƒ ƒ 0 ƒ ƒ Resultado consolidado del ejercicio 74 (5,5) (2,9) 336 (20,3) (15,2) Resultado atribuido a minoritarios 8 27,7 30,1 24 21,0 36,7 Beneficio atribuido al Grupo 66 (8,3) (5,7) 313 (22,3) (17,6)
(1).- Incluye rendimiento de instrumentos de capital, resultados por puesta en equivalencia y otros productos/cargas de explotación
ENERO - DICIEMBRE 29
Relaciones con Inversores y Analistas
Ciudad Grupo Santander Edificio Pereda, 1≤ planta
Avda de Cantabria, s/n
28660 Boadilla del Monte
Madrid (España) Teléfonos: 91 259 65 14 / 91 259 65 20
Fax: 91 257 02 45
e mail: [email protected]
Sede social: Paseo Pereda, 9 12. Santander (España) Teléfono: 942 20 61 00
Sede operativa: Ciudad Grupo Santander. Avda de Cantabria, s/n 28660 Boadilla del Monte. Madrid (España)
www.santander.com

FINANCIAL
REPORT
January - December
2013
ENERO - DECEMBER

KEY CONSOLIDATED DATA
BALANCE SHEET (EUR million) Dec»13 Sep»13 (%) Dec»13 Dec»12 (%) Dec»11
Total assets 1,115,637 1,192,181 (6.4) 1,115,637 1,269,598 (12.1) 1,251,008
Net customer loans 668,856 686,821 (2.6) 668,856 719,112 (7.0) 748,541
Customer deposits 607,836 633,433 (4.0) 607,836 626,639 (3.0) 632,533
Customer funds under management 924,621 954,500 (3.1) 924,621 968,987 (4.6) 984,353
Shareholders' equity (1) 84,269 83,954 0.4 84,269 80,921 4.1 80,379
Total managed funds 1,240,806 1,316,513 (5.8) 1,240,806 1,387,740 (10.6) 1,382,464
INCOME STATEMENT* (EUR million) 4Q»13 3Q»13 (%) 2013 2012 (%) 2011
Net interest income 6,277 6,285 (0.1) 25,935 29,923 (13.3) 28,883
Gross income 9,405 9,738 (3.4) 39,753 43,406 (8.4) 42,466
Pre-provision profit (net operating income) 4,420 4,876 (9.4) 19,909 23,422 (15.0) 23,055
Profit from continuing operations 1,418 1,300 9.1 5,539 2,993 85.1 6,103
Attributable profit to the Group 1,060 1,055 0.4 4,370 2,295 90.5 5,330 (*).- Variations w/o exchange rate:
4Q»13 / 3Q»13: Net interest income: +1.3%; Gross income: -2.0%; Pre-provision profit: -7.6%; Attributable profit: +2.7%
2013 / 2012: Net interest income: -7.0%; Gross income: -2.2%; Pre-provision profit: -8.4%; Attributable profit: +136.8%
EPS, PROFITABILITY AND EFFICIENCY (%) 4Q»13 3Q»13 (%) 2013 2012 (%) 2011
EPS (euro)
ROE
ROTE
ROA
RoRWA
Efficiency ratio (with amortisations)
0.09
5.25
7.41
0.44
1.02
53.0
0.10
5.23
7.38
0.43
1.02
49.9
(1.9) 0.40
5.42
7.73
0.44
1.01
49.9
0.23
2.91
4.28
0.25
0.56
46.0
71.7 0.60
7.12
10.77
0.50
1.05
45.7
BIS II RATIO AND NPL RATIOS (%) Dec»13 Sep»13 (%) Dec»13 Dec»12 (%) Dec»11
Core capital (BIS II)
NPL ratio
NPL coverage
11.71
5.64
61.7
11.56
5.43
63.9
11.71
5.64
61.7
10.33
4.54
72.4
10.02
3.90
61.0
MARKET CAPITALISATION AND SHARES Dec»13 Sep»13 (%) Dec»13 Dec»12 (%) Dec»11
Shares (millions at period-end)
Share price (euros)
Market capitalisation (EUR million)
Book value (euro)
Price / Book value (X)
P/E ratio (X)
11,333
6.506
73,735
7.44
0.88
16.13
11,092
6.028
66,863
7.58
0.79
14.61
2.2
7.9
10.3
11,333
6.506
73,735
7.44
0.88
16.13
10,321
6.100
62,959
7.88
0.77
25.96
9.8
6.7
17.1
8,909
5.870
50,290
8.59
0.68
9.79
OTHER DATA Dec»13 Sep»13 (%) Dec»13 Dec»12 (%) Dec»11
Number of shareholders
Number of employees
Number of branches
3,299,026
182,958
13,927
3,281,450
184,786
14,561
0.5
(1.0)
(4.4)
3,299,026
182,958
13,927
3,296,270
186,763
14,392
0.1
(2.0)
(3.2)
3,293,537
189,766
14,756
INFORMATION ON ORDINARY PROFIT 4Q»13 3Q»13 (%) 2013 2012 (%) 2011
Attributable profit to the Group* 1,060
EPS (euro) 0.09
ROE 5.25
ROTE 7.41
ROA 0.44
RoRWA 1.02
P/E ratio (X) 16.13
(*).- Variations w/o exchange rate: 4Q'13 / 3Q'13: +2.7%; 2013 / 2012: -10.7%
1,055
0.10
5.23
7.38
0.43
1.02
14.61
0.4
(1.9)
4,370
0.40
5.42
7.73
0.44
1.01
16.13
5,341
0.55
6.78
9.97
0.48
1.10
11.15
(18.2)
(26.3)
7,000
0.79
9.35
14.14
0.63
1.34
7.46
Note: The financial information in this report has not been audited, but it was approved by the Board of Directors at its meeting on January, 27 2014, following a favourable report from the Audit and Compliance Committee on January, 23 2014. The Committee verified that the information for the quarter was based on the same principles and practices as those used to draw up the annual financial statements.
(1) In 2013, estimated data of May 2014 scrip dividend
2 JANUARY - DECEMBER
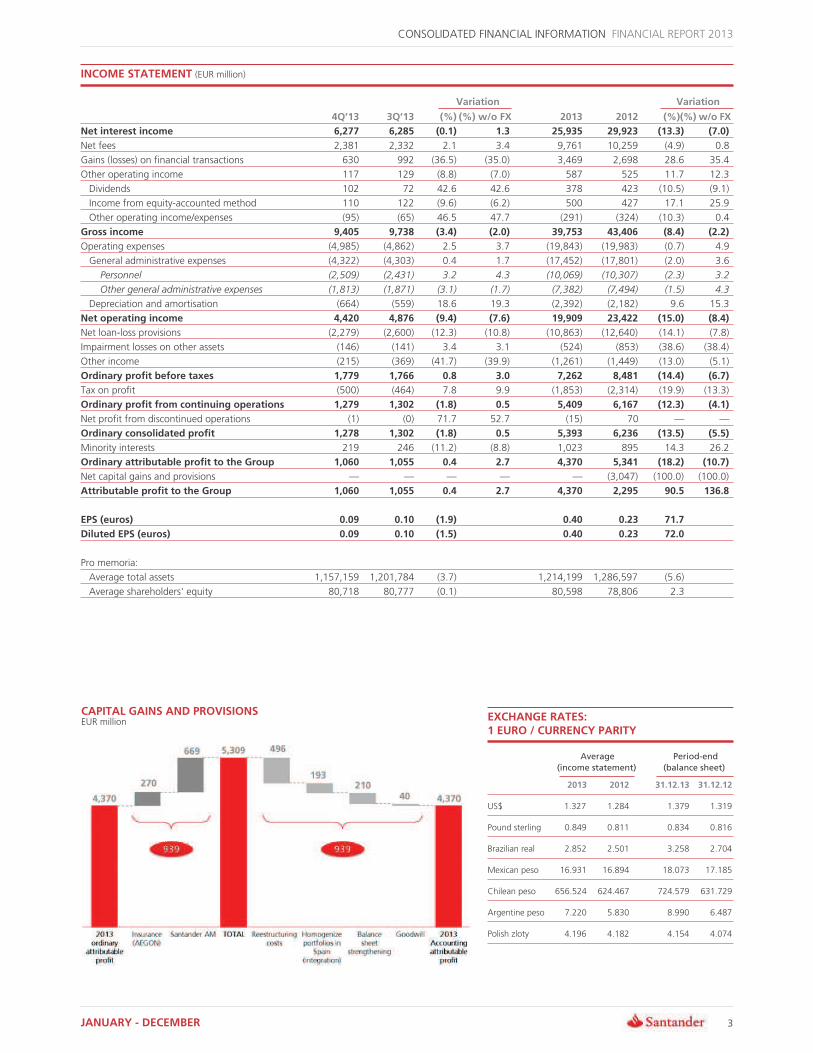
CONSOLIDATED FINANCIAL INFORMATION FINANCIAL REPORT 2013
INCOME STATEMENT (EUR million)
Variation Variation
4Q»13 3Q»13 (%) (%) w/o FX 2013 2012 (%)(%) w/o FX
Net interest income 6,277 6,285 (0.1) 1.3 25,935 29,923 (13.3) (7.0)
Net fees 2,381 2,332 2.1 3.4 9,761 10,259 (4.9) 0.8
Gains (losses) on financial transactions 630 992 (36.5) (35.0) 3,469 2,698 28.6 35.4
Other operating income 117 129 (8.8) (7.0) 587 525 11.7 12.3
Dividends 102 72 42.6 42.6 378 423 (10.5) (9.1)
Income from equity-accounted method 110 122 (9.6) (6.2) 500 427 17.1 25.9
Other operating income/expenses (95) (65) 46.5 47.7 (291) (324) (10.3) 0.4
Gross income 9,405 9,738 (3.4) (2.0) 39,753 43,406 (8.4) (2.2)
Operating expenses (4,985) (4,862) 2.5 3.7 (19,843) (19,983) (0.7) 4.9
General administrative expenses (4,322) (4,303) 0.4 1.7 (17,452) (17,801) (2.0) 3.6
Personnel (2,509) (2,431) 3.2 4.3 (10,069) (10,307) (2.3) 3.2
Other general administrative expenses (1,813) (1,871) (3.1) (1.7) (7,382) (7,494) (1.5) 4.3
Depreciation and amortisation (664) (559) 18.6 19.3 (2,392) (2,182) 9.6 15.3
Net operating income 4,420 4,876 (9.4) (7.6) 19,909 23,422 (15.0) (8.4)
Net loan-loss provisions (2,279) (2,600) (12.3) (10.8) (10,863) (12,640) (14.1) (7.8)
Impairment losses on other assets (146) (141) 3.4 3.1 (524) (853) (38.6) (38.4)
Other income (215) (369) (41.7) (39.9) (1,261) (1,449) (13.0) (5.1)
Ordinary profit before taxes 1,779 1,766 0.8 3.0 7,262 8,481 (14.4) (6.7)
Tax on profit (500) (464) 7.8 9.9 (1,853) (2,314) (19.9) (13.3)
Ordinary profit from continuing operations 1,279 1,302 (1.8) 0.5 5,409 6,167 (12.3) (4.1)
Net profit from discontinued operations (1) (0) 71.7 52.7 (15) 70 ƒ ƒ
Ordinary consolidated profit 1,278 1,302 (1.8) 0.5 5,393 6,236 (13.5) (5.5)
Minority interests 219 246 (11.2) (8.8) 1,023 895 14.3 26.2
Ordinary attributable profit to the Group 1,060 1,055 0.4 2.7 4,370 5,341 (18.2) (10.7)
Net capital gains and provisions ƒ ƒ ƒ ƒ ƒ (3,047) (100.0) (100.0)
Attributable profit to the Group 1,060 1,055 0.4 2.7 4,370 2,295 90.5 136.8
EPS (euros) 0.09 0.10 (1.9) 0.40 0.23 71.7
Diluted EPS (euros) 0.09 0.10 (1.5) 0.40 0.23 72.0
Pro memoria:
Average total assets 1,157,159 1,201,784 (3.7) 1,214,199 1,286,597 (5.6)
Average shareholders' equity 80,718 80,777 (0.1) 80,598 78,806 2.3
CAPITAL GAINS AND PROVISIONS EXCHANGE RATES:EUR million 1 EURO / CURRENCY PARITY
Average Period-end
(income statement) (balance sheet)
2013 2012 31.12.13 31.12.12
US$ 1.327 1.284 1.379 1.319
Pound sterling 0.849 0.811 0.834 0.816
Brazilian real 2.852 2.501 3.258 2.704
Mexican peso 16.931 16.894 18.073 17.185
Chilean peso 656.524 624.467 724.579 631.729
Argentine peso 7.220 5.830 8.990 6.487
Polish zloty 4.196 4.182 4.154 4.074
JANUARY - DECEMBER 3

FINANCIAL REPORT 2013 CONSOLIDATED FINANCIAL INFORMATION
QUARTERLY INCOME STATEMENT (EUR million)
1Q»12 2Q»12 3Q»12 4Q»12 1Q»13 2Q»13 3Q»13 4Q»13
Net interest income 7,763 7,622 7,438 7,100 6,652 6,722 6,285 6,277
Net fees 2,612 2,556 2,566 2,526 2,516 2,531 2,332 2,381
Gains (losses) on financial transactions 797 675 643 583 969 879 992 630
Other operating income 114 270 67 75 154 187 129 117
Dividends 61 216 66 80 59 145 72 102
Income from equity-accounted method 136 120 84 87 154 114 122 110
Other operating income/expenses (83) (66) (83) (93) (59) (72) (65) (95)
Gross income 11,287 11,123 10,713 10,283 10,290 10,320 9,738 9,405
Operating expenses (5,043) (4,934) (5,067) (4,939) (4,996) (5,000) (4,862) (4,985)
General administrative expenses (4,519) (4,422) (4,464) (4,396) (4,428) (4,400) (4,303) (4,322)
Personnel (2,634) (2,587) (2,608) (2,478) (2,582) (2,548) (2,431) (2,509)
Other general administrative expenses (1,885) (1,835) (1,856) (1,918) (1,846) (1,852) (1,871) (1,813)
Depreciation and amortisation (524) (512) (603) (543) (569) (600) (559) (664)
Net operating income 6,244 6,188 5,646 5,344 5,294 5,320 4,876 4,420
Net loan-loss provisions (3,118) (3,401) (2,987) (3,134) (2,919) (3,065) (2,600) (2,279)
Impairment losses on other assets (83) (97) (81) (592) (110) (126) (141) (146)
Other income (487) (381) (475) (105) (261) (415) (369) (215)
Ordinary profit before taxes 2,556 2,309 2,103 1,512 2,003 1,713 1,766 1,779
Tax on profit (720) (657) (662) (275) (496) (393) (464) (500)
Ordinary profit from continuing operations 1,836 1,652 1,441 1,237 1,508 1,320 1,302 1,279
Net profit from discontinued operations 17 11 22 20 ƒ (14) (0) (1)
Ordinary consolidated profit 1,853 1,663 1,463 1,257 1,508 1,306 1,302 1,278
Minority interests 227 237 198 234 303 256 246 219
Ordinary attributable profit to the Group 1,627 1,427 1,264 1,024 1,205 1,050 1,055 1,060
Net capital gains and provisions ƒ (1,304) (1,142) (601) ƒ ƒ ƒ ƒ
Attributable profit to the Group 1,627 123 122 423 1,205 1,050 1,055 1,060
EPS (euros) 0.17 0.01 0.01 0.04 0.12 0.10 0.10 0.09
Diluted EPS (euros) 0.17 0.01 0.01 0.04 0.11 0.10 0.10 0.09
Distribution of ordinary attributable profit by operating geographic segment*. December 2013
Continental Europe: 26%
Latin America: 47%
(*) Excluding Spain run-off real estate
USA: 10% Spain: 7%
Germany: 6%
Portugal: 2%
Poland: 6%
Other Europe: 5%
United Kingdom:17%
Brazil: 23%
Mexico: 10%
Chile: 6%
Other Latin America: 8%
Distribution of ordinary attributable profit by operating business segment*. December 2013
Retail Banking: 74%
Asset Management and Insurance: 4%
Retail Continental Europe: 18%
Global Wholesale Banking: 22%
Retail United Kingdom: 14%
Retail USA: 9%
Retail Latin America: 33%
4 JANUARY - DECEMBER

NET FEES (EUR million)
4Q»13 3Q»13 Var (%) 2013 2012 Var (%)
Fees from services 1,379 1,350 2.2 5,677 6,063 (6.4)
Mutual & pension funds 278 284 (2.3) 1,121 1,178 (4.8)
Securities and custody 164 162 1.2 678 702 (3.4)
Insurance 559 535 4.6 2,284 2,317 (1.4)
CONSOLIDATED FINANCIAL INFORMATION FINANCIAL REPORT 2013
Net fee income 2,381 2,332 2.1 9,761 10,259 (4.9)
NET INTEREST INCOME NET FEES EUR million EUR million
OPERATING EXPENSES (EUR million)
4Q»13 3Q»13 Var (%) 2013 2012 Var (%)
Personnel expenses 2,509 2,431 3.2 10,069 10,307 (2.3)
General expenses 1,813 1,871 (3.1) 7,382 7,494 (1.5)
Information technology 244 270 (9.8) 992 889 11.5
Communications 58 161 (64.1) 519 638 (18.7)
Advertising 195 148 31.7 630 662 (4.8)
Buildings and premises 439 447 (1.7) 1,814 1,749 3.7
Printed and office material 44 40 10.1 166 166 (0.1)
Taxes (other than profit tax) 119 108 10.1 445 415 7.2
Other expenses 714 698 2.4 2,816 2,974 (5.3)
Personnel and general expenses 4,322 4,303 0.4 17,452 17,801 (2.0)
Depreciation and amortisation 664 559 18.6 2,392 2,182 9.6
Total operating expenses 4,985 4,862 2.5 19,843 19,983 (0.7)
GROSS INCOME OPERATING EXPENSES EUR million EUR million
JANUARY - DECEMBER 5

FINANCIAL REPORT 2013 CONSOLIDATED FINANCIAL INFORMATION
EMPLOYEES AND BRANCHES
Employees Branches
31.12.13 31.12.12 Variation 31.12.13 31.12.12 Variation
Continental Europe 58,383 57,941 442 6,160 6,437 (277)
o/w: Spain 27,406 29,714 (2,308) 4,067 4,611 (544)
Portugal 5,635 5,719 (84) 640 667 (27)
Poland 12,363 8,852 3,511 830 519 311
Santander Consumer Finance 11,695 12,282 (587) 613 629 (16)
United Kingdom 25,368 26,255 (887) 1,157 1,189 (32)
Latin America 87,069 90,649 (3,580) 5,904 6,044 (140)
o/w: Brazil 49,459 53,752 (4,293) 3,566 3,788 (222)
Mexico 14,804 13,967 837 1,258 1,170 88
Chile 12,290 12,364 (74) 493 504 (11)
USA 9,741 9,544 197 706 722 (16)
Operating areas 180,561 184,389 (3,828) 13,927 14,392 (465)
Corporate Activities 2,397 2,374 23
Total Group 182,958 186,763 (3,805) 13,927 14,392 (465)
NET OPERATING INCOME AFTER LLPs EUR million
NET LOAN-LOSS PROVISIONS (EUR million)
Loan-loss provisions
Loan-loss provisions (constant EUR million)
Real estate provisions in Spain PROVISIONS EUR million
4Q»13 3Q»13 Var (%) 2013 2012 Var (%)
Non performing loans 2,582 2,841 (9.1) 11,928 13,950 (14.5)
Country-risk 1 (5) ƒ 2 (2) ƒ
Recovery of written-off assets (303) (236) 28.4 (1,068) (1,309) (18.4)
Total 2,279 2,600 (12.3) 10,863 12,640 (14.1)
ATTRIBUTABLE PROFIT TO THE GROUP EARNINGS PER SHARE EUR million Euros
6 JANUARY - DECEMBER

CONSOLIDATED FINANCIAL INFORMATION FINANCIAL REPORT 2013
BALANCE SHEET (EUR million)
Variation
ASSETS 31.12.13 31.12.12 Amount (%) 31.12.11
Cash on hand and deposits at central banks 77,103 118,488 (41,385) (34.9) 96,524
Trading portfolio 115,287 177,917 (62,630) (35.2) 172,637
Debt securities 40,841 43,101 (2,261) (5.2) 52,704
Customer loans 5,079 9,162 (4,084) (44.6) 8,056
Equities 4,967 5,492 (525) (9.6) 4,744
Trading derivatives 58,899 110,319 (51,420) (46.6) 102,498
Deposits from credit institutions 5,503 9,843 (4,341) (44.1) 4,636
Other financial assets at fair value 31,381 28,356 3,025 10.7 19,563
Customer loans 13,196 13,936 (741) (5.3) 11,748
Other (deposits at credit institutions, debt securities
and equities) 18,185 14,420 3,766 26.1 7,815
Available-for-sale financial assets 83,799 92,267 (8,468) (9.2) 86,612
Debt securities 79,844 87,724 (7,881) (9.0) 81,589
Equities 3,955 4,542 (587) (12.9) 5,024
Loans 714,484 756,858 (42,373) (5.6) 777,967
Deposits at credit institutions 56,017 53,785 2,232 4.1 42,389
Customer loans 650,581 696,013 (45,432) (6.5) 728,737
Debt securities 7,886 7,059 827 11.7 6,840
Investments 5,536 4,453 1,083 24.3 4,154
Intangible assets and property and equipment 16,613 17,296 (682) (3.9) 16,840
Goodwill 23,281 24,626 (1,344) (5.5) 25,089
Other 48,151 49,338 (1,186) (2.4) 51,622
Total assets 1,115,637 1,269,598 (153,962) (12.1) 1,251,008
LIABILITIES AND SHAREHOLDERS» EQUITY
Trading portfolio 94,672 143,241 (48,568) (33.9) 146,949
Customer deposits 8,500 8,897 (397) (4.5) 16,574
Marketable debt securities 1 1 (0) (7.9) 77
Trading derivatives 58,887 109,743 (50,856) (46.3) 103,083
Other 27,285 24,600 2,685 10.9 27,214
Other financial liabilities at fair value 42,311 45,418 (3,108) (6.8) 44,908
Customer deposits 26,484 28,638 (2,154) (7.5) 26,982
Marketable debt securities 4,086 4,904 (818) (16.7) 8,185
Due to central banks and credit institutions 11,741 11,876 (135) (1.1) 9,741
Financial liabilities at amortized cost 863,115 959,321 (96,206) (10.0) 935,669
Due to central banks and credit institutions 86,323 131,670 (45,347) (34.4) 116,368
Customer deposits 572,853 589,104 (16,251) (2.8) 588,977
Marketable debt securities 171,390 201,064 (29,674) (14.8) 189,110
Subordinated debt 16,139 18,238 (2,100) (11.5) 22,992
Other financial liabilities 16,410 19,245 (2,835) (14.7) 18,221
Insurance liabilities 1,430 1,425 5 0.3 517
Provisions 14,474 16,148 (1,673) (10.4) 17,308
Other liability accounts 19,735 22,771 (3,036) (13.3) 24,844
Total liabilities 1,035,736 1,188,324 (152,587) (12.8) 1,170,195
Shareholders' equity 84,740 81,333 3,406 4.2 80,874
Capital stock 5,667 5,161 506 9.8 4,455
Reserves 75,109 74,528 581 0.8 72,660
Attributable profit to the Group 4,370 2,295 2,075 90.5 5,330
Less: dividends (406) (650) 244 (37.5) (1,570)
Equity adjustments by valuation (14,152) (9,474) (4,678) 49.4 (6,415)
Minority interests 9,313 9,415 (102) (1.1) 6,354
Total equity 79,900 81,275 (1,375) (1.7) 80,813
Total liabilities and equity 1,115,637 1,269,598 (153,962) (12.1) 1,251,008
JANUARY - DECEMBER 7

FINANCIAL REPORT 2013 CONSOLIDATED FINANCIAL INFORMATION
CUSTOMER LOANS (EUR million)
Variation
31.12.13 31.12.12 Amount (%) 31.12.11
Spanish Public sector 13,374 16,884 (3,510) (20.8) 12,147
Other residents 160,478 183,130 (22,652) (12.4) 202,411
Commercial bills 7,301 8,699 (1,399) (16.1) 9,679
Secured loans 96,420 103,890 (7,470) (7.2) 117,946
Other loans 56,757 70,540 (13,783) (19.5) 74,785
Non-resident sector 519,907 544,520 (24,612) (4.5) 552,789
Secured loans 320,608 339,519 (18,912) (5.6) 342,676
Other loans 199,300 205,000 (5,701) (2.8) 210,114
Gross customer loans 693,759 744,534 (50,775) (6.8) 767,347
Loan-loss allowances 24,904 25,422 (518) (2.0) 18,806
Net customer loans 668,856 719,112 (50,257) (7.0) 748,541
Pro memoria: Doubtful loans 40,320 35,301 5,019 14.2 31,257
Public sector 99 121 (22) (18.3) 102
Other residents 21,763 16,025 5,739 35.8 14,745
Non-resident sector 18,458 19,156 (697) (3.6) 16,409
DISTRIBUTION OF TOTAL ASSETS CUSTOMER LOANS December 2013 % / operating areas. December 2013
Other: 5% USA: 6% USA: 5% Other Latin America: 3%
Other Latin America: 3% Chile: 4%
Chile: 3% Spain: 25% Mexico: 3% Spain: 24%
Mexico: 4%
Brazil: 10%
Brazil: 12% Portugal: 4%
Portugal: 4%
Poland: 2%
Germany: 3% Poland: 2%
Spain run-off real estate: 1% Other Europe: 4%
Germany: 4% Spain run-off real estate: 1%
Other Europe: 5%
United Kingdom: 29% United Kingdom: 35%
GROSS CUSTOMER LOANS LOAN PORTFOLIO IN SPAIN EUR Billion EUR Billion
Total
Household mortgages
Other loans to individuals
Companies
REPOs
Public sector
(*) Excluding exchange rate impact : -3.1%
8 JANUARY - DECEMBER

CREDIT RISK MANAGEMENT* (EUR million)
Non-performing loans
NPL ratio (%)
Loan-loss allowances
Specific
Generic
NPL coverage (%)
Credit cost (%) **
31.12.13
41,652
5.64
25,681
21,972
3,708
61.7
1.53
31.12.12
36,061
4.54
26,111
21,793
4,319
72.4
2.38
Variation
Amount
5,591
1.10 p.
(431)
180
(611)
(10.8 p.)
(0.85 p.)
(%)
15.5
(1.7)
0.8
(14.1)
31.12.11
32,006
3.90
19,531
15,398
4,133
61.0
1.41
* Excluding country-risk
** 12 month net loan-loss provisions / average lending
Note: NPL ratio: Non-performing loans / computable assets
GRUPO SANTANDER. NPL AND COVERAGE RATIOS %
MAIN UNITS. NPL RATIO %
CONSOLIDATED FINANCIAL INFORMATION FINANCIAL REPORT 2013
(*) Incorporating reclassification impact of substandard loans in Spain (*) Incorporating reclassification impact of substandard loans
SPAIN RUN-OFF REAL ESTATE SPAIN RUN-OFF REAL ESTATE. COVERAGE RATIO EUR million net balances %
Loans Foreclosed real estate
Loans
Foreclosed real estate
Equity stakes
JANUARY - DECEMBER 9
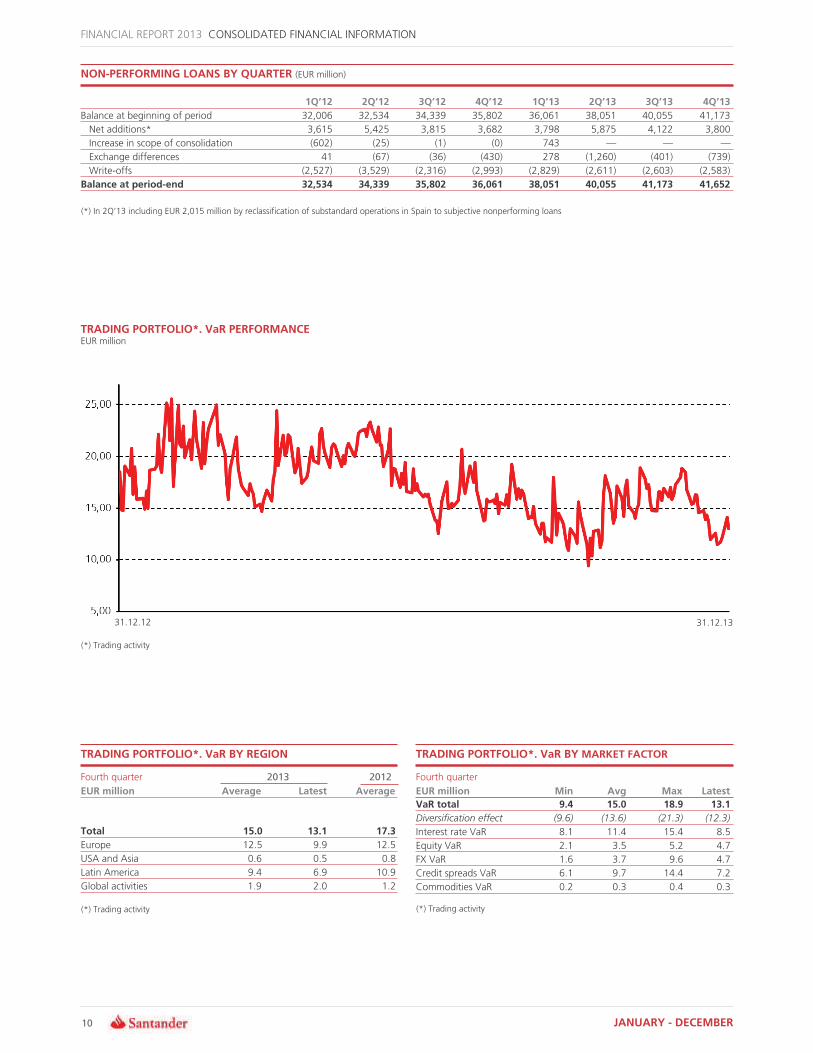
FINANCIAL REPORT 2013 CONSOLIDATED FINANCIAL INFORMATION
NON-PERFORMING LOANS BY QUARTER (EUR million)
1Q»12 2Q»12 3Q»12 4Q»12 1Q»13 2Q»13 3Q»13 4Q»13
Balance at beginning of period 32,006 32,534 34,339 35,802 36,061 38,051 40,055 41,173
Net additions* 3,615 5,425 3,815 3,682 3,798 5,875 4,122 3,800
Increase in scope of consolidation (602) (25) (1) (0) 743 ƒ ƒ ƒ
Exchange differences 41 (67) (36) (430) 278 (1,260) (401) (739)
Write-offs (2,527) (3,529) (2,316) (2,993) (2,829) (2,611) (2,603) (2,583)
Balance at period-end 32,534 34,339 35,802 36,061 38,051 40,055 41,173 41,652
(*) In 2Q»13 including EUR 2,015 million by reclassification of substandard operations in Spain to subjective nonperforming loans
TRADING PORTFOLIO*. VaR PERFORMANCE EUR million
31.12.12 31.12.13
(*) Trading activity
TRADING PORTFOLIO*. VaR BY REGION TRADING PORTFOLIO*. VaR BY MARKET FACTOR
Fourth quarter
EUR million Average
2013
Latest
2012
Average
Fourth quarter
EUR million
VaR total
Min
9.4
Avg
15.0
Max
18.9
Latest
13.1
Total
Europe
USA and Asia
Latin America
Global activities
15.0
12.5
0.6
9.4
1.9
13.1
9.9
0.5
6.9
2.0
17.3
12.5
0.8
10.9
1.2
Diversification effect
Interest rate VaR
Equity VaR
FX VaR
Credit spreads VaR
Commodities VaR
(9.6)
8.1
2.1
1.6
6.1
0.2
(13.6)
11.4
3.5
3.7
9.7
0.3
(21.3)
15.4
5.2
9.6
14.4
0.4
(12.3)
8.5
4.7
4.7
7.2
0.3
(*) Trading activity (*) Trading activity
10 JANUARY - DECEMBER

CUSTOMER FUNDS UNDER MANAGEMENT (EUR million)
Variation
31.12.13 31.12.12 Amount (%) 31.12.11
Resident public sector 7,745 8,487 (741) (8.7) 6,528
Other residents 161,649 157,011 4,638 3.0 144,131
Demand deposits 74,969 71,526 3,443 4.8 68,389
Time deposits 80,146 75,414 4,731 6.3 61,185
Other 6,535 10,071 (3,536) (35.1) 14,557
Non-resident sector 438,442 461,141 (22,699) (4.9) 481,875
Demand deposits 245,582 228,698 16,884 7.4 220,299
Time deposits 146,433 179,503 (33,070) (18.4) 197,249
Other 46,427 52,940 (6,513) (12.3) 64,328
Customer deposits 607,836 626,639 (18,802) (3.0) 632,533
Debt securities* 175,477 205,969 (30,492) (14.8) 197,372
Subordinated debt 16,139 18,238 (2,100) (11.5) 22,992
On-balance sheet customer funds 799,452 850,846 (51,394) (6.0) 852,898
Mutual funds 93,304 89,176 4,128 4.6 102,611
Pension funds 10,879 10,076 803 8.0 9,645
Managed portfolios 20,987 18,889 2,098 11.1 19,199
Other customer funds under management 125,169 118,141 7,028 5.9 131,456
Customer funds under management** 924,621 968,987 (44,366) (4.6) 984,353
CONSOLIDATED FINANCIAL INFORMATION FINANCIAL REPORT 2013
* Including retail commercial paper (EUR million): 3,553 in December 2013, 11,536 in December 2012 and 6,052 in December 2011 ** Including marketed mutual and pension funds
MUTUAL FUNDS (EUR million) CUSTOMER FUNDS UNDER MANAGEMENT % / operating areas. December 2013
Spain
Portugal
Poland
United Kingdom
Latin America
Total
31.12.13
29,712
1,050
2,683
9,645
50,214
93,304
31.12.12
23,093
1,544
2,443
13,919
48,178
89,176
Var (%)
28.7
(32.0)
9.8
(30.7)
4.2
4.6
31.12.11
27,425
1,866
1,747
15,744
55,829
102,611
USA: 4%
Mexico: 5%
Chile: 4%
Other Latin America: 4%
Spain: 27%
Brazil: 14%
PENSION FUNDS (EUR million) Portugal: 3%
Poland: 3%
Spain
Portugal
Total
31.12.13
10,030
848
10,879
31.12.12
9,289
787
10,076
Var (%)
8.0
7.8
8.0
31.12.11
8,884
760
9,645 United Kingdom: 31%
Germany: 3% Other Europe: 2%
CUSTOMER FUNDS UNDER MANAGEMENT LOANS / DEPOSITS. TOTAL GROUP* EUR billion %
Total
Other
Deposits
Debt securities and
subordinated debt
-4.6%*
+5.9%
-14.5%
-3.0%
(*) Excluding exchange rate impact: -0.5% (*) Including retail commercial paper
JANUARY - DECEMBER 11

FINANCIAL REPORT 2013 CONSOLIDATED FINANCIAL INFORMATION
TOTAL EQUITY AND CAPITAL WITH THE NATURE OF FINANCIAL LIABILITIES (EUR million)
Variation
31.12.13 31.12.12 Amount (%) 31.12.11
Capital stock 5,667 5,161 506 9.8 4,455
Additional paid-in surplus 36,804 37,302 (498) (1.3) 31,223
Reserves 38,314 37,513 801 2.1 41,688
Treasury stock (9) (287) 278 (96.9) (251)
Shareholders' equity (before profit and dividends) 80,776 79,689 1,087 1.4 77,115
Attributable profit 4,370 2,295 2,075 90.4 5,330
Interim dividend distributed (406) (650) 244 (37.5) (1,429)
Interim dividend not distributed (1) (471) (412) (59) 14.2 (637)
Shareholders' equity (after retained profit) 84,269 80,921 3,348 4.1 80,379
Valuation adjustments (14,152) (9,474) (4,678) 49.4 (6,415)
Minority interests 9,313 9,415 (102) (1.1) 6,354
Total equity (after retained profit) 79,430 80,862 (1,433) (1.8) 80,318
Preferred shares and securities in subordinated debt 4,053 4,740 (687) (14.5) 5,896
Total equity and capital with the nature
of financial liabilities 83,483 85,602 (2,120) (2.5) 86,214
(1) In 2013, estimated data of May 2014 scrip dividend
COMPUTABLE CAPITAL AND BIS II RATIO (EUR million)
Core capital
Basic capital
Supplementary capital
Deductions
Computable capital
Risk-weighted assets
31.12.13
57,346
61,723
11,040
(1,310)
71,453
489,736
31.12.12
57,558
62,234
11,981
(1,279)
72,936
557,030
Variation
Amount
(212)
(511)
(941)
(31)
(1,483)
(67,294)
(%)
(0.4)
(0.8)
(7.9)
2.4
(2.0)
(12.1)
31.12.11
56,694
62,294
15,568
(1,090)
76,772
565,958
BIS II ratio
Tier I (before deductions)
Core capital
14.59
12.60
11.71
13.09
11.17
10.33
1.50 p.
1.43 p.
1.38 p.
13.56 p.
11.01 p.
10.02 p.
Shareholders' equity surplus (BIS II ratio) 32,274 28,374 3,900 13.7 31,495
CORE CAPITAL RISK-WEIGHTED ASSETS % EUR million
RATING AGENCIES. GRUPO SANTANDER
Long term
Short term Outlook
Standard & Poor´s BBB A-2 Stable
Fitch Ratings BBB+ F2 Stable
Moody»s Baa2 P-2 Negative
DBRS A R1(low) Negative
12 JANUARY - DECEMBER

THE SANTANDER SHARE FINANCIAL REPORT 2013
THE SANTANDER SHARE. DECEMBER 2013 MARKET CAPITALISATION EUR million
Shareholders and trading data
Shareholders (number) 3,299,026
Shares (number) 11,333,420,488
Average daily turnover (no. of shares) 85,761,339
Share liquidity (%) 201
(Number of shares traded during the year / number of shares)
Remuneration per share euros
Santander Dividendo Elección (Aug.13) 0.15
Santander Dividendo Elección (Nov.13) 0.15
Santander Dividendo Elección (Feb.14) 0.15
Santander Dividendo Elección (May.14) 0.15
TOTAL 0.60
Price movements during the year
Beginning (31.12.12) 6.100
Highest 6.777
Lowest 4.791
Last (31.12.13) 6.506
Market capitalisation (million) (31.12.13) 73,735
Stock market indicators REMUNERATION PER SHARE Price / Book value (X) 0.88
Euros
P/E ratio (X) 16.13
Yield (1) (%) 10.40
(1) Total remuneration for 2013 / Average share price in 2013
CAPITAL STOCK OWNERSHIP
December 2013 Shares % The Board of Directors 188,868,624 1.67
Institutional investors 5,777,993,335 50.98
Individuals 5,366,558,529 47.35
Total 11,333,420,488 100.00
COMPARATIVE PERFORMANCE OF SHARE PRICES December 31, 2012 to December 31, 2013
31.12.13
SAN* Stoxx Banks EuroStoxx Banks
31.12.12
(*) Performance adjusted to the scrip dividend for the year.
JANUARY - DECEMBER 13

FINANCIAL REPORT 2013 INFORMATION BY SEGMENTS
Description of the segments
Grupo Santander is maintaining in 2013 the general criteria used in 2012, with the following exceptions:
1) In the Group»s financial statements:
• The change in International Accounting Standards 19 (IAS 19) requires that for periods beginning on or after January 1, 2013 actuarial gains and losses are immediately recognised against shareholders' equity, without the possibility for deferred recognition through the P&L, as it was done until now.
• As a result of the disposal of Santander UK card business formerly owned by GE, its 2012 results have been eliminated from the various lines of the income statement and recorded, net, in profit from discontinued operations.
2) In businesses by restructuring:
• Spain was incorporated as a principal or geographic segment, and includes the former branch networks of Santander, Banesto and Banif (merged in 2013), Global Wholesale Banking, Asset Management and Insurance and the ALCO portfolio in Spain.
• Discontinued real estate activity in Spain is segregated into a unit within Continental Europe (Spain run-off real estate). It includes: loans from customers whose activity is mainly real estate development, which have a specialised management model; equity stakes in real estate companies and foreclosed assets.
3) Other adjustments
• The annual adjustment was made to the Global Customer Relationship Model and resulted in a net increase of 60 new clients.
• The wholesale businesses in Poland and Banesto, previously in
Retail Banking, were incorporated to Global Wholesale Banking.
• Corporate Activities was redefined due to funding allocation and transfer of real estate assets and their costs (already mentioned), as well as other reallocations of costs among units.
For comparison purposes, the figures for 2012 have been restated including the changes in the affected areas.
The financial statements of each business segment have been drawn up by aggregating the Group»s basic operating units. The information relates to both the accounting data of the units in each segment as well as that provided by the management information systems. In all cases, the same general principles as those used in the Group are applied.
The operating business areas are structured into two levels:
Principal level (or geographic). Geographical areas segment the activity of the Group»s operating units. This coincides with the Group»s first level of management and reflects Santander positioning in the world»s three main currency areas (euro, sterling and dollar). The segments reported on are:
• Continental Europe. This covers all retail banking business, wholesale banking and asset management and insurance conducted in this region, as well as the unit of Spain run-off real estate. Detailed financial information is provided on Spain, Portugal, Poland and Santander Consumer Finance (which incorporates all the region's business, including the three countries mentioned herewith).
• United Kingdom. This includes retail and wholesale banking and asset management and insurance conducted by the various units
and branches of the Group in the country.
• Latin America. This embraces all the Group»s financial activities conducted via its subsidiary banks and subsidiaries (including Puerto Rico). It also includes the specialised units of Santander Private Banking, as an independent and globally managed unit, and New York»s business. The financial statements of Brazil, Mexico and Chile are also provided.
• United States. Includes the businesses of Santander Bank (former Sovereign Bank) and Santander Consumer USA (consolidated by the equity accounted method).
Secondary level (or business). This segments the activity of the operating units by type of business. The segments are: retail banking, wholesale banking, asset management and insurance and the unit of Spain run-off real estate.
• Retail Banking. This covers all customer banking businesses, including private banking (except those of Corporate Banking, managed through the Global Customer Relationship Model). Because of their relative importance, details are also provided by the main geographic areas (Continental Europe, United Kingdom, Latin America and the US), as well as the main countries and Santander Consumer Finance. The results of the hedging positions in each country are also included, conducted within the sphere of each one»s Assets and Liabilities Committee.
• Global Wholesale Banking (GBM). This business reflects the revenues from global corporate banking, investment banking and markets worldwide including all treasuries managed globally, both trading and distribution to customers (always after the appropriate distribution with Retail Banking customers), as well as equities business.
• Asset Management and Insurance. This includes the contribution to the Group of the design and management of mutual and pension funds and insurance businesses carried out in some cases by the Group's fully-owned subsidiaries and in other by units where the Group participates via joint ventures with specialists. All units remunerate the distribution networks they use to market these products (mainly the Group's, although not exclusively) via revenue-sharing agreements. This means that the result recorded in this segment for each of the units included (in accordance with their participation and type of consolidation) is the net between the gross income and the distribution cost resulting from sharing agreements).
As well as these operating units, which cover everything by geographic area and by businesses, the Group continues to maintain the area of Corporate Activities. This area incorporates the centralised activities relating to equity stakes in financial companies, financial management of the structural exchange rate position and of the parent bank»s structural interest rate risk, as well as management of liquidity and of shareholders» equity through issues and securitisations.
As the Group»s holding entity, this area manages all capital and reserves and allocations of capital and liquidity. It also incorporates amortisation of goodwill but not the costs related to the Group»s central services (charged to the areas), except for corporate and institutional expenses related to the Group»s functioning.
The figures of the various units of the Group listed below have been prepared in accordance with this criteria, and therefore, may not match those publish by each institution individually.
14 JANUARY - DECEMBER
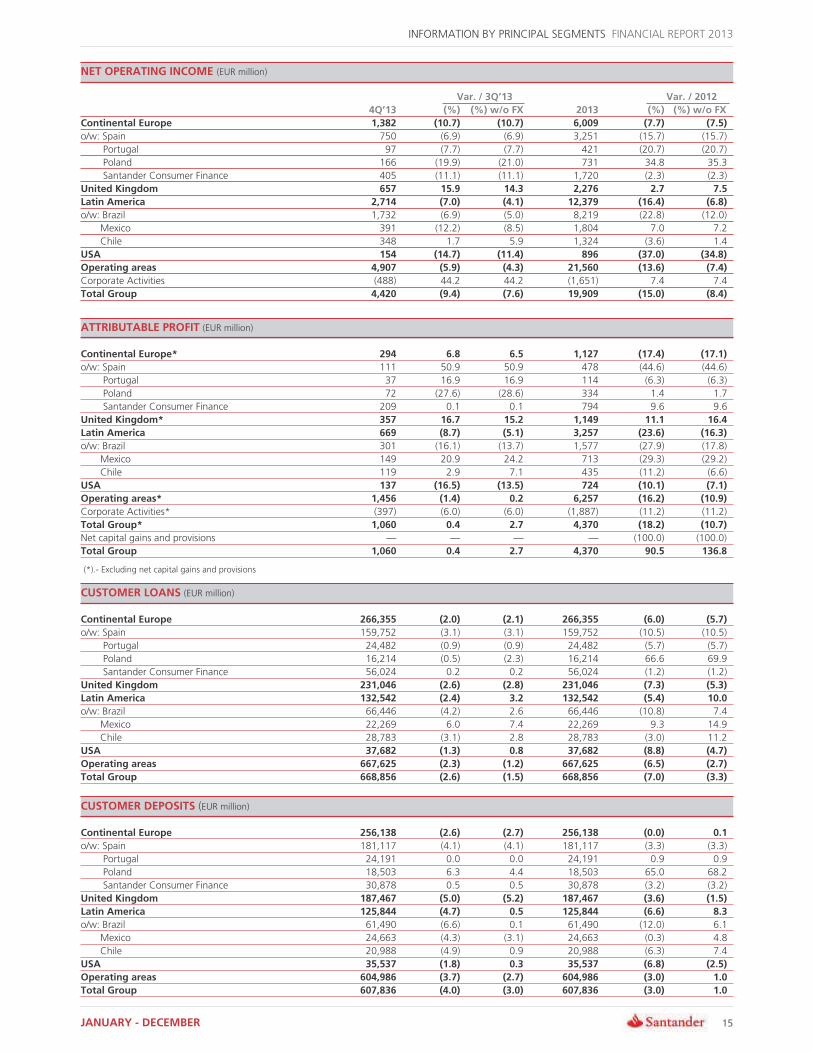
INFORMATION BY PRINCIPAL SEGMENTS FINANCIAL REPORT 2013
NET OPERATING INCOME (EUR million)
Var. / 3Q»13 Var. / 2012
4Q»13 (%) (%) w/o FX 2013 (%) (%) w/o FX
Continental Europe 1,382 (10.7) (10.7) 6,009 (7.7) (7.5)
o/w: Spain 750 (6.9) (6.9) 3,251 (15.7) (15.7)
Portugal 97 (7.7) (7.7) 421 (20.7) (20.7)
Poland 166 (19.9) (21.0) 731 34.8 35.3
Santander Consumer Finance 405 (11.1) (11.1) 1,720 (2.3) (2.3)
United Kingdom 657 15.9 14.3 2,276 2.7 7.5
Latin America 2,714 (7.0) (4.1) 12,379 (16.4) (6.8)
o/w: Brazil 1,732 (6.9) (5.0) 8,219 (22.8) (12.0)
Mexico 391 (12.2) (8.5) 1,804 7.0 7.2
Chile 348 1.7 5.9 1,324 (3.6) 1.4
USA 154 (14.7) (11.4) 896 (37.0) (34.8)
Operating areas 4,907 (5.9) (4.3) 21,560 (13.6) (7.4)
Corporate Activities (488) 44.2 44.2 (1,651) 7.4 7.4
Total Group 4,420 (9.4) (7.6) 19,909 (15.0) (8.4)
ATTRIBUTABLE PROFIT (EUR million)
Continental Europe* 294 6.8 6.5 1,127 (17.4) (17.1)
o/w: Spain 111 50.9 50.9 478 (44.6) (44.6)
Portugal 37 16.9 16.9 114 (6.3) (6.3)
Poland 72 (27.6) (28.6) 334 1.4 1.7
Santander Consumer Finance 209 0.1 0.1 794 9.6 9.6
United Kingdom* 357 16.7 15.2 1,149 11.1 16.4
Latin America 669 (8.7) (5.1) 3,257 (23.6) (16.3)
o/w: Brazil 301 (16.1) (13.7) 1,577 (27.9) (17.8)
Mexico 149 20.9 24.2 713 (29.3) (29.2)
Chile 119 2.9 7.1 435 (11.2) (6.6)
USA 137 (16.5) (13.5) 724 (10.1) (7.1)
Operating areas* 1,456 (1.4) 0.2 6,257 (16.2) (10.9)
Corporate Activities* (397) (6.0) (6.0) (1,887) (11.2) (11.2)
Total Group* 1,060 0.4 2.7 4,370 (18.2) (10.7)
Net capital gains and provisions ƒ ƒ ƒ ƒ (100.0) (100.0)
Total Group 1,060 0.4 2.7 4,370 90.5 136.8
(*).- Excluding net capital gains and provisions
CUSTOMER LOANS (EUR million)
Continental Europe 266,355 (2.0) (2.1) 266,355 (6.0) (5.7)
o/w: Spain 159,752 (3.1) (3.1) 159,752 (10.5) (10.5)
Portugal 24,482 (0.9) (0.9) 24,482 (5.7) (5.7)
Poland 16,214 (0.5) (2.3) 16,214 66.6 69.9
Santander Consumer Finance 56,024 0.2 0.2 56,024 (1.2) (1.2)
United Kingdom 231,046 (2.6) (2.8) 231,046 (7.3) (5.3)
Latin America 132,542 (2.4) 3.2 132,542 (5.4) 10.0
o/w: Brazil 66,446 (4.2) 2.6 66,446 (10.8) 7.4
Mexico 22,269 6.0 7.4 22,269 9.3 14.9
Chile 28,783 (3.1) 2.8 28,783 (3.0) 11.2
USA 37,682 (1.3) 0.8 37,682 (8.8) (4.7)
Operating areas 667,625 (2.3) (1.2) 667,625 (6.5) (2.7)
Total Group 668,856 (2.6) (1.5) 668,856 (7.0) (3.3)
CUSTOMER DEPOSITS (EUR million)
Continental Europe 256,138 (2.6) (2.7) 256,138 (0.0) 0.1
o/w: Spain 181,117 (4.1) (4.1) 181,117 (3.3) (3.3)
Portugal 24,191 0.0 0.0 24,191 0.9 0.9
Poland 18,503 6.3 4.4 18,503 65.0 68.2
Santander Consumer Finance 30,878 0.5 0.5 30,878 (3.2) (3.2)
United Kingdom 187,467 (5.0) (5.2) 187,467 (3.6) (1.5)
Latin America 125,844 (4.7) 0.5 125,844 (6.6) 8.3
o/w: Brazil 61,490 (6.6) 0.1 61,490 (12.0) 6.1
Mexico 24,663 (4.3) (3.1) 24,663 (0.3) 4.8
Chile 20,988 (4.9) 0.9 20,988 (6.3) 7.4
USA 35,537 (1.8) 0.3 35,537 (6.8) (2.5)
Operating areas 604,986 (3.7) (2.7) 604,986 (3.0) 1.0
Total Group 607,836 (4.0) (3.0) 607,836 (3.0) 1.0
JANUARY - DECEMBER 15

FINANCIAL REPORT 2013 INFORMATION BY PRINCIPAL SEGMENTS
CONTINENTAL EUROPE (EUR million)
Var. / 3Q»13 Var. / 2012
INCOME STATEMENT 4Q»13 (%) (%) w/o FX 2013 (%) (%) w/o FX
Net interest income 2,038 1.2 1.1 8,123 (8.3) (8.1)
Net fees 837 (5.4) (5.6) 3,551 (2.0) (2.0)
Gains (losses) on financial transactions 110 (59.2) (59.3) 775 153.6 153.7
Other operating income (1) 38 374.6 371.7 135 (26.0) (26.0)
Gross income 3,023 (4.8) (4.9) 12,585 (2.9) (2.8)
Operating expenses (1,641) 0.7 0.6 (6,576) 1.8 1.9
General administrative expenses (1,423) (1.7) (1.8) (5,807) 0.3 0.4
Personnel (874) 0.5 0.4 (3,527) 0.8 0.9
Other general administrative expenses (549) (5.0) (5.1) (2,280) (0.5) (0.4)
Depreciation and amortisation (218) 19.6 19.5 (769) 15.2 15.3
Net operating income 1,382 (10.7) (10.7) 6,009 (7.7) (7.5)
Net loan-loss provisions (763) (19.3) (19.3) (3,603) (12.2) (12.1)
Other income (186) (1.0) (1.0) (760) 32.3 32.3
Ordinary profit before taxes 433 4.7 4.4 1,646 (10.2) (9.8)
Tax on profit (113) 22.1 21.8 (376) (8.7) (8.2)
Ordinary profit from continuing operations 320 (0.3) (0.6) 1,270 (10.6) (10.3)
Net profit from discontinued operations (6) ƒ ƒ (6) (15.0) (12.9)
Ordinary consolidated profit 314 (1.9) (2.3) 1,264 (10.6) (10.2)
Minority interests 20 (55.0) (55.6) 137 182.8 183.7
Ordinary attributable profit to the Group 294 6.8 6.5 1,127 (17.4) (17.1)
Net capital gains and provisions ƒ ƒ ƒ ƒ (100.0) (100.0)
Attributable profit to the Group 294 6.8 6.5 1,127 ƒ ƒ
BALANCE SHEET
Customer loans (2) 266,355 (2.0) (2.1) 266,355 (6.0) (5.7)
Trading portfolio (w/o loans) 50,317 (18.5) (18.5) 50,317 (42.8) (42.8)
Available-for-sale financial assets 37,319 (10.1) (10.3) 37,319 (2.6) (2.4)
Due from credit institutions (2) 38,506 (35.1) (35.1) 38,506 (21.4) (21.3)
Intangible assets and property and equipment 6,297 1.0 1.0 6,297 10.5 10.7
Other assets 37,847 38.0 37.8 37,847 22.8 23.0
Total assets/liabilities & shareholders' equity 436,641 (6.7) (6.8) 436,641 (11.8) (11.6)
Customer deposits (2) 256,138 (2.6) (2.7) 256,138 (0.0) 0.1
Marketable debt securities (2) 16,781 7.7 8.0 16,781 (20.5) (19.9)
Subordinated debt (2) 406 11.1 9.3 406 242.6 248.3
Insurance liabilities 1,430 8.0 8.0 1,430 0.3 0.3
Due to credit institutions (2) 59,041 (15.8) (15.7) 59,041 (24.5) (23.8)
Other liabilities 77,194 (13.1) (13.2) 77,194 (28.0) (28.0)
Shareholders' equity (3) 25,651 (11.2) (11.3) 25,651 (17.3) (17.0)
Other customer funds under management 50,962 6.3 6.1 50,962 17.4 17.6
Mutual and pension funds 44,323 7.9 7.8 44,323 19.3 19.4
Managed portfolios 6,638 (3.5) (3.5) 6,638 6.5 6.5
Customer funds under management 324,286 (0.8) (0.9) 324,286 1.1 1.2
RATIOS (%) AND OPERATING MEANS
ROE 4.20 0.42 p. 3.84 (0.53 p.)
Efficiency ratio (with amortisations) 54.3 3.0 p. 52.3 2.5 p.
NPL ratio 9.13 0.65 p. 9.13 2.84 p.
NPL coverage 57.3 (3.8 p.) 57.3 (15.7 p.)
Number of employees 58,383 (2.1) 58,383 0.8
Number of branches 6,160 (8.1) 6,160 (4.3)
(1).- Including dividends, income from equity-accounted method and other operating income/expenses (2).- Including all on-balance sheet balances for this item (3).- Not including profit of the year
16 JANUARY - DECEMBER
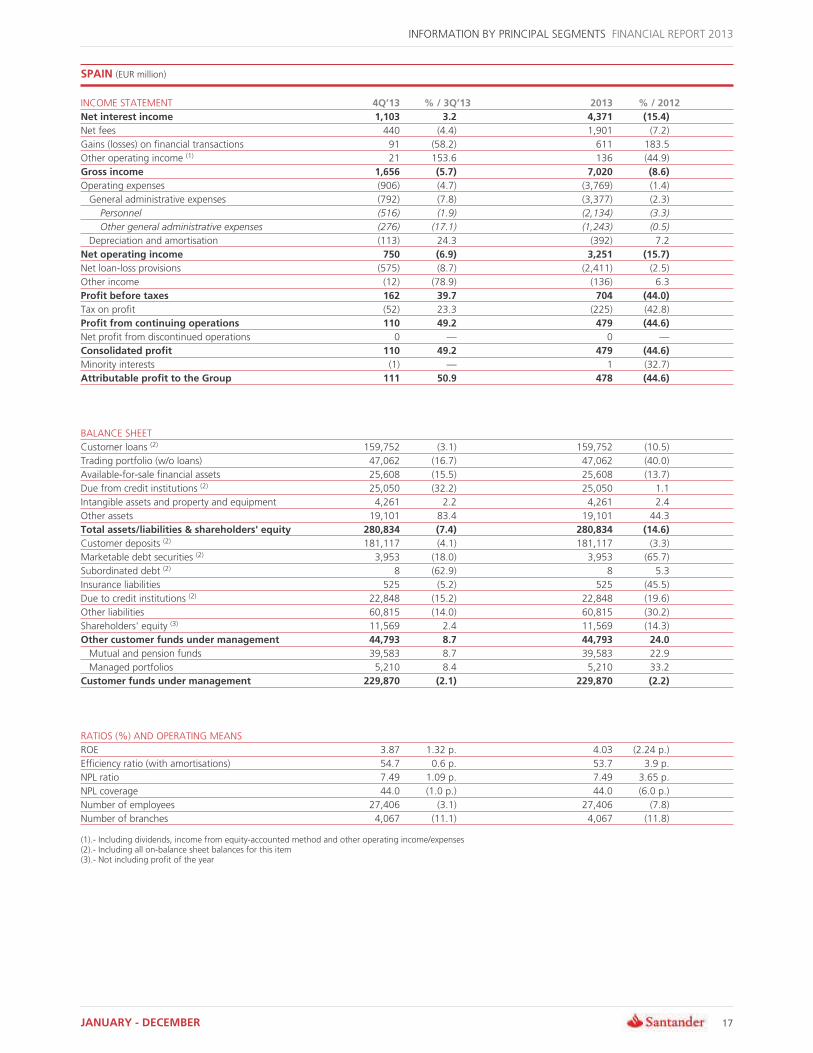
INFORMATION BY PRINCIPAL SEGMENTS FINANCIAL REPORT 2013
SPAIN (EUR million)
INCOME STATEMENT 4Q»13 % / 3Q»13 2013 % / 2012
Net interest income 1,103 3.2 4,371 (15.4)
Net fees 440 (4.4) 1,901 (7.2)
Gains (losses) on financial transactions 91 (58.2) 611 183.5
Other operating income (1) 21 153.6 136 (44.9)
Gross income 1,656 (5.7) 7,020 (8.6)
Operating expenses (906) (4.7) (3,769) (1.4)
General administrative expenses (792) (7.8) (3,377) (2.3)
Personnel (516) (1.9) (2,134) (3.3)
Other general administrative expenses (276) (17.1) (1,243) (0.5)
Depreciation and amortisation (113) 24.3 (392) 7.2
Net operating income 750 (6.9) 3,251 (15.7)
Net loan-loss provisions (575) (8.7) (2,411) (2.5)
Other income (12) (78.9) (136) 6.3
Profit before taxes 162 39.7 704 (44.0)
Tax on profit (52) 23.3 (225) (42.8)
Profit from continuing operations 110 49.2 479 (44.6)
Net profit from discontinued operations 0 ƒ 0 ƒ
Consolidated profit 110 49.2 479 (44.6)
Minority interests (1) ƒ 1 (32.7)
Attributable profit to the Group 111 50.9 478 (44.6)
BALANCE SHEET
Customer loans (2) 159,752 (3.1) 159,752 (10.5)
Trading portfolio (w/o loans) 47,062 (16.7) 47,062 (40.0)
Available-for-sale financial assets 25,608 (15.5) 25,608 (13.7)
Due from credit institutions (2) 25,050 (32.2) 25,050 1.1
Intangible assets and property and equipment 4,261 2.2 4,261 2.4
Other assets 19,101 83.4 19,101 44.3
Total assets/liabilities & shareholders' equity 280,834 (7.4) 280,834 (14.6)
Customer deposits (2) 181,117 (4.1) 181,117 (3.3)
Marketable debt securities (2) 3,953 (18.0) 3,953 (65.7)
Subordinated debt (2) 8 (62.9) 8 5.3
Insurance liabilities 525 (5.2) 525 (45.5)
Due to credit institutions (2) 22,848 (15.2) 22,848 (19.6)
Other liabilities 60,815 (14.0) 60,815 (30.2)
Shareholders' equity (3) 11,569 2.4 11,569 (14.3)
Other customer funds under management 44,793 8.7 44,793 24.0
Mutual and pension funds 39,583 8.7 39,583 22.9
Managed portfolios 5,210 8.4 5,210 33.2
Customer funds under management 229,870 (2.1) 229,870 (2.2)
RATIOS (%) AND OPERATING MEANS
ROE 3.87 1.32 p. 4.03 (2.24 p.)
Efficiency ratio (with amortisations) 54.7 0.6 p. 53.7 3.9 p.
NPL ratio 7.49 1.09 p. 7.49 3.65 p.
NPL coverage 44.0 (1.0 p.) 44.0 (6.0 p.)
Number of employees 27,406 (3.1) 27,406 (7.8)
Number of branches 4,067 (11.1) 4,067 (11.8)
(1).- Including dividends, income from equity-accounted method and other operating income/expenses (2).- Including all on-balance sheet balances for this item (3).- Not including profit of the year
JANUARY - DECEMBER 17

FINANCIAL REPORT 2013 INFORMATION BY PRINCIPAL SEGMENTS
PORTUGAL (EUR million)
INCOME STATEMENT 4Q»13 % / 3Q»13 2013 % / 2012
Net interest income 131 (0.5) 514 (9.8)
Net fees 67 (15.5) 318 (3.3)
Gains (losses) on financial transactions 11 6.7 51 (53.3)
Other operating income (1) 15 104.8 34 12.1
Gross income 224 (2.1) 916 (11.6)
Operating expenses (126) 2.7 (495) (2.2)
General administrative expenses (107) 3.6 (417) (2.1)
Personnel (76) 2.2 (299) (2.4)
Other general administrative expenses (31) 6.9 (118) (1.2)
Depreciation and amortisation (19) (1.6) (79) (2.9)
Net operating income 97 (7.7) 421 (20.7)
Net loan-loss provisions (11) (80.6) (192) (51.0)
Other income (42) 609.2 (78) 624.3
Profit before taxes 44 0.6 150 18.5
Tax on profit (15) 24.5 (44) 839.5
Profit from continuing operations 29 (8.5) 106 (13.0)
Net profit from discontinued operations ƒ ƒ ƒ ƒ
Consolidated profit 29 (8.5) 106 (13.0)
Minority interests (8) ƒ (8) ƒ
Attributable profit to the Group 37 16.9 114 (6.3)
BALANCE SHEET
Customer loans (2) 24,482 (0.9) 24,482 (5.7)
Trading portfolio (w/o loans) 1,831 2.4 1,831 (6.0)
Available-for-sale financial assets 4,724 1.3 4,724 17.4
Due from credit institutions (2) 2,895 4.9 2,895 (17.9)
Intangible assets and property and equipment 821 (8.4) 821 114.7
Other assets 7,096 7.4 7,096 17.3
Total assets/liabilities & shareholders' equity 41,848 1.0 41,848 (0.1)
Customer deposits (2) 24,191 0.0 24,191 0.9
Marketable debt securities (2) 2,329 (1.9) 2,329 (33.3)
Subordinated debt (2) 0 20.6 0 27.7
Insurance liabilities 75 (14.2) 75 (13.6)
Due to credit institutions (2) 12,319 3.7 12,319 5.1
Other liabilities 356 (0.7) 356 82.6
Shareholders' equity (3) 2,579 1.4 2,579 6.5
Other customer funds under management 2,041 (0.1) 2,041 (15.7)
Mutual and pension funds 1,898 (1.0) 1,898 (18.6)
Managed portfolios 142 12.5 142 57.8
Customer funds under management 28,560 (0.1) 28,560 (4.4)
RATIOS (%) AND OPERATING MEANS
ROE 5.79 0.82 p. 4.49 (0.35 p.)
Efficiency ratio (with amortisations) 56.6 2.6 p. 54.1 5.2 p.
NPL ratio 8.12 0.26 p. 8.12 1.56 p.
NPL coverage 50.0 (1.9 p.) 50.0 (3.1 p.)
Number of employees 5,635 0.1 5,635 (1.5)
Number of branches 640 (1.1) 640 (4.0)
(1).- Including dividends, income from equity-accounted method and other operating income/expenses (2).- Including all on-balance sheet balances for this item (3).- Not including profit of the year
18 JANUARY - DECEMBER

INFORMATION BY PRINCIPAL SEGMENTS FINANCIAL REPORT 2013
POLAND (EUR million)
Var. / 3Q»13 Var. / 2012
INCOME STATEMENT 4Q»13 (%) (%) w/o FX 2013 (%) (%) w/o FX
Net interest income 206 1.2 (0.2) 781 44.4 44.9
Net fees 110 5.1 3.6 424 28.2 28.6
Gains (losses) on financial transactions 15 (62.2) (62.9) 119 49.4 49.9
Other operating income (1) (4) 99.6 107.6 7 (55.2) (55.1)
Gross income 327 (5.5) (6.8) 1,331 37.6 38.1
Operating expenses (161) 16.2 14.4 (601) 41.2 41.7
General administrative expenses (148) 18.2 16.3 (547) 39.9 40.4
Personnel (80) 6.7 5.0 (318) 36.1 36.6
Other general administrative expenses (68) 35.5 33.3 (229) 45.4 45.9
Depreciation and amortisation (13) (2.6) (4.1) (54) 56.7 57.2
Net operating income 166 (19.9) (21.0) 731 34.8 35.3
Net loan-loss provisions (39) 10.8 8.7 (167) 49.0 49.5
Other income (4) 137.3 137.5 (6) 599.2 601.6
Profit before taxes 123 (28.0) (28.9) 557 30.0 30.5
Tax on profit (26) (24.5) (25.4) (110) 26.8 27.3
Profit from continuing operations 97 (28.9) (29.8) 447 30.9 31.3
Net profit from discontinued operations ƒ ƒ ƒ ƒ ƒ ƒ
Consolidated profit 97 (28.9) (29.8) 447 30.9 31.3
Minority interests 24 (32.3) (33.2) 113 805.4 808.5
Attributable profit to the Group 72 (27.6) (28.6) 334 1.4 1.7
BALANCE SHEET
Customer loans (2) 16,214 (0.5) (2.3) 16,214 66.6 69.9
Trading portfolio (w/o loans) 532 (5.1) (6.8) 532 204.7 210.7
Available-for-sale financial assets 5,325 9.6 7.6 5,325 85.2 88.8
Due from credit institutions (2) 667 (18.7) (20.2) 667 69.2 72.5
Intangible assets and property and equipment 273 24.3 22.1 273 86.6 90.3
Other assets 2,095 2.4 0.6 2,095 37.2 39.9
Total assets/liabilities & shareholders' equity 25,106 1.2 (0.6) 25,106 69.1 72.4
Customer deposits (2) 18,503 6.3 4.4 18,503 65.0 68.2
Marketable debt securities (2) 121 ƒ ƒ 121 ƒ ƒ
Subordinated debt (2) 333 (0.0) (1.8) 333 231.9 238.5
Insurance liabilities 84 ƒ ƒ 84 ƒ ƒ
Due to credit institutions (2) 1,206 (53.2) (54.0) 1,206 152.1 157.1
Other liabilities 2,984 12.5 10.5 2,984 137.2 141.9
Shareholders' equity (3) 1,875 2.1 0.3 1,875 4.4 6.4
Other customer funds under management 2,789 3.0 1.2 2,789 7.5 9.6
Mutual and pension funds 2,683 3.2 1.4 2,683 9.8 12.0
Managed portfolios 106 (2.3) (4.1) 106 (29.5) (28.1)
Customer funds under management 21,745 6.4 4.5 21,745 56.3 59.4
RATIOS (%) AND OPERATING MEANS
ROE 15.61 (6.36 p.) 17.68 (1.24 p.)
Efficiency ratio (with amortisations) 49.2 9.2 p. 45.1 1.1 p.
NPL ratio 7.84 0.09 p. 7.84 3.12 p.
NPL coverage 61.8 (2.3 p.) 61.8 (6.5 p.)
Number of employees 12,363 (1.1) 12,363 39.7
Number of branches 830 (0.7) 830 59.9
(1).- Including dividends, income from equity-accounted method and other operating income/expenses (2).- Including all on-balance sheet balances for this item (3).- Not including profit of the year
JANUARY - DECEMBER 19

FINANCIAL REPORT 2013 INFORMATION BY PRINCIPAL SEGMENTS
SANTANDER CONSUMER FINANCE (EUR million)
INCOME STATEMENT 4Q»13 % / 3Q»13 2013 % / 2012
Net interest income 573 (3.3) 2,333 (2.3)
Net fees 190 (8.6) 787 1.2
Gains (losses) on financial transactions (8) ƒ (7) (52.2)
Other operating income (1) 5 ƒ (2) (82.4)
Gross income 759 (5.3) 3,111 (1.0)
Operating expenses (353) 2.4 (1,391) 0.7
General administrative expenses (291) (0.6) (1,172) (3.6)
Personnel (162) (0.5) (646) 3.5
Other general administrative expenses (129) (0.8) (526) (11.1)
Depreciation and amortisation (63) 18.7 (219) 32.5
Net operating income 405 (11.1) 1,720 (2.3)
Net loan-loss provisions (105) (33.6) (565) (25.0)
Other income (5) (64.9) (70) 73.5
Profit before taxes 295 4.2 1,085 12.3
Tax on profit (76) 15.9 (255) 26.8
Profit from continuing operations 219 0.7 830 8.5
Net profit from discontinued operations (6) ƒ (6) (15.0)
Consolidated profit 213 (1.8) 824 8.7
Minority interests 5 (46.3) 31 (10.5)
Attributable profit to the Group 209 0.1 794 9.6
BALANCE SHEET
Customer loans (2) 56,024 0.2 56,024 (1.2)
Trading portfolio (w/o loans) 864 (4.4) 864 (35.5)
Available-for-sale financial assets 705 18.0 705 209.8
Due from credit institutions (2) 8,158 (25.6) 8,158 (29.1)
Intangible assets and property and equipment 934 (0.6) 934 (6.5)
Other assets 3,723 56.0 3,723 12.1
Total assets/liabilities & shareholders' equity 70,409 (1.8) 70,409 (4.9)
Customer deposits (2) 30,878 0.5 30,878 (3.2)
Marketable debt securities (2) 10,377 23.8 10,377 70.6
Subordinated debt (2) 64 536.7 64 526.3
Insurance liabilities ƒ ƒ ƒ ƒ
Due to credit institutions (2) 18,060 2.5 18,060 (11.9)
Other liabilities 3,901 1.2 3,901 (13.9)
Shareholders' equity (3) 7,128 (35.7) 7,128 (35.5)
Other customer funds under management 6 1.7 6 7.4
Mutual and pension funds 6 1.7 6 7.4
Managed portfolios ƒ ƒ ƒ ƒ
Customer funds under management 41,326 5.6 41,326 8.8
RATIOS (%) AND OPERATING MEANS
ROE 8.27 0.77 p. 7.29 0.61 p.
Efficiency ratio (with amortisations) 46.6 3.5 p. 44.7 0.7 p.
NPL ratio 4.01 0.05 p. 4.01 0.11 p.
NPL coverage 105.3 (3.9 p.) 105.3 (4.2 p.)
Number of employees 11,695 (1.5) 11,695 (4.8)
Number of branches 613 (3.5) 613 (2.5)
(1).- Including dividends, income from equity-accounted method and other operating income/expenses (2).- Including all on-balance sheet balances for this item (3).- Not including profit of the year
20 JANUARY - DECEMBER

INFORMATION BY PRINCIPAL SEGMENTS FINANCIAL REPORT 2013
UNITED KINGDOM (EUR million)
Var. / 3Q»13 Var. / 2012
INCOME STATEMENT 4Q»13 (%) (%) w/o FX 2013 (%) (%) w/o FX
Net interest income 962 9.7 8.1 3,451 3.4 8.3
Net fees 244 0.3 (1.4) 992 (16.6) (12.7)
Gains (losses) on financial transactions 85 18.3 15.8 403 11.7 17.0
Other operating income (1) 18 220.0 216.8 36 78.8 87.3
Gross income 1,308 9.3 7.6 4,881 (0.5) 4.2
Operating expenses (650) 3.3 1.6 (2,605) (3.1) 1.5
General administrative expenses (520) (1.7) (3.4) (2,181) (5.6) (1.1)
Personnel (368) 12.6 10.7 (1,401) (6.1) (1.7)
Other general administrative expenses (153) (24.7) (26.2) (780) (4.7) (0.2)
Depreciation and amortisation (130) 29.5 27.7 (424) 12.0 17.3
Net operating income 657 15.9 14.3 2,276 2.7 7.5
Net loan-loss provisions (145) (6.4) (7.9) (580) (28.1) (24.6)
Other income (66) 157.8 152.4 (236) 41.3 48.0
Ordinary profit before taxes 447 15.5 14.0 1,460 17.4 23.0
Tax on profit (95) 17.2 15.7 (301) 5.4 10.4
Ordinary profit from continuing operations 352 15.1 13.5 1,159 21.0 26.7
Net profit from discontinued operations 5 ƒ ƒ (9) ƒ ƒ
Ordinary consolidated profit 357 16.7 15.2 1,149 11.1 16.4
Minority interests (0) ƒ ƒ ƒ (100.0) (100.0)
Ordinary attributable profit to the Group 357 16.7 15.2 1,149 11.1 16.4
Net capital gains and provisions ƒ ƒ ƒ ƒ (100.0) (100.0)
Attributable profit to the Group 357 16.7 15.2 1,149 3.1 8.0
BALANCE SHEET
Customer loans (2) 231,046 (2.6) (2.8) 231,046 (7.3) (5.3)
Trading portfolio (w/o loans) 28,831 (19.1) (19.3) 28,831 (24.5) (22.9)
Available-for-sale financial assets 6,003 11.4 11.1 6,003 (10.6) (8.7)
Due from credit institutions (2) 17,136 (28.0) (28.2) 17,136 (5.5) (3.4)
Intangible assets and property and equipment 2,498 3.8 3.5 2,498 (2.5) (0.4)
Other assets 38,229 (19.3) (19.5) 38,229 (13.7) (11.9)
Total assets/liabilities & shareholders' equity 323,743 (8.0) (8.2) 323,743 (9.8) (7.9)
Customer deposits (2) 187,467 (5.0) (5.2) 187,467 (3.6) (1.5)
Marketable debt securities (2) 64,092 (4.5) (4.7) 64,092 (13.3) (11.4)
Subordinated debt (2) 5,805 25.1 24.8 5,805 4.9 7.2
Insurance liabilities ƒ ƒ ƒ ƒ ƒ ƒ
Due to credit institutions (2) 26,882 (17.1) (17.3) 26,882 (8.3) (6.3)
Other liabilities 26,855 (27.9) (28.1) 26,855 (37.1) (35.7)
Shareholders' equity (3) 12,642 (3.8) (4.0) 12,642 (3.9) (1.8)
Other customer funds under management 9,645 0.8 0.5 9,645 (30.7) (29.2)
Mutual and pension funds 9,645 0.8 0.5 9,645 (30.7) (29.2)
Managed portfolios ƒ ƒ ƒ ƒ ƒ ƒ
Customer funds under management 267,010 (4.1) (4.4) 267,010 (7.2) (5.2)
RATIOS (%) AND OPERATING MEANS
ROE 11.07 1.64 p. 8.84 1.06 p.
Efficiency ratio (with amortisations) 49.7 (2.9 p.) 53.4 (1.4 p.)
NPL ratio 1.98 ƒ 1.98 (0.07 p.)
NPL coverage 41.6 ƒ 41.6 (2.5 p.)
Number of employees 25,368 (0.0) 25,368 (3.4)
Number of branches 1,157 (2.9) 1,157 (2.7)
(1).- Including dividends, income from equity-accounted method and other operating income/expenses (2).- Including all on-balance sheet balances for this item (3).- Not including profit of the year
JANUARY - DECEMBER 21

FINANCIAL REPORT 2013 INFORMATION BY PRINCIPAL SEGMENTS
LATIN AMERICA (EUR million)
Var. / 3Q»13 Var. / 2012
INCOME STATEMENT 4Q»13 (%) (%) w/o FX 2013 (%) (%) w/o FX
Net interest income 3,561 (0.3) 2.2 15,186 (15.1) (5.5)
Net fees 1,195 6.1 8.8 4,874 (4.4) 6.2
Gains (losses) on financial transactions 160 (51.3) (46.0) 1,039 (3.1) 8.0
Other operating income (1) (16) 329.9 326.8 (15) (87.0) (86.0)
Gross income 4,899 (2.5) 0.4 21,083 (11.9) (2.0)
Operating expenses (2,186) 3.8 6.6 (8,704) (4.6) 5.9
General administrative expenses (1,967) 4.2 7.0 (7,800) (5.5) 4.9
Personnel (1,064) 2.3 5.1 (4,319) (7.0) 3.2
Other general administrative expenses (904) 6.5 9.3 (3,481) (3.6) 7.1
Depreciation and amortisation (218) 0.9 3.6 (904) 3.8 15.2
Net operating income 2,714 (7.0) (4.1) 12,379 (16.4) (6.8)
Net loan-loss provisions (1,398) (8.5) (6.0) (6,483) (12.2) (1.4)
Other income (195) 33.9 36.0 (551) (32.7) (22.3)
Profit before taxes 1,121 (10.1) (6.4) 5,345 (19.2) (11.0)
Tax on profit (265) (14.8) (10.7) (1,208) (18.6) (9.1)
Profit from continuing operations 856 (8.5) (5.0) 4,137 (19.3) (11.5)
Net profit from discontinued operations 0 ƒ ƒ 0 ƒ ƒ
Consolidated profit 856 (8.5) (5.0) 4,137 (19.3) (11.5)
Minority interests 188 (7.5) (4.5) 879 1.5 12.4
Attributable profit to the Group 669 (8.7) (5.1) 3,257 (23.6) (16.3)
BALANCE SHEET
Customer loans (2) 132,542 (2.4) 3.2 132,542 (5.4) 10.0
Trading portfolio (w/o loans) 23,107 (14.0) (10.5) 23,107 (18.6) (8.8)
Available-for-sale financial assets 20,947 10.7 17.2 20,947 (10.9) 4.9
Due from credit institutions (2) 28,213 2.0 6.4 28,213 9.4 23.6
Intangible assets and property and equipment 3,930 (0.4) 6.3 3,930 (12.5) 4.2
Other assets 41,238 (22.5) (18.2) 41,238 (12.9) 1.8
Total assets/liabilities & shareholders' equity 249,979 (6.2) (1.1) 249,979 (7.3) 7.3
Customer deposits (2) 125,844 (4.7) 0.5 125,844 (6.6) 8.3
Marketable debt securities (2) 28,987 1.9 8.4 28,987 3.1 21.7
Subordinated debt (2) 4,833 22.6 30.9 4,833 (15.7) 0.1
Insurance liabilities ƒ ƒ ƒ ƒ ƒ ƒ
Due to credit institutions (2) 24,825 (30.9) (27.8) 24,825 (22.7) (11.4)
Other liabilities 45,252 3.8 9.1 45,252 (6.7) 6.8
Shareholders' equity (3) 20,237 (9.5) (4.5) 20,237 (0.8) 14.8
Other customer funds under management 64,563 (3.3) 1.8 64,563 6.1 21.4
Mutual and pension funds 50,214 (4.9) 0.6 50,214 4.2 20.9
Managed portfolios 14,349 2.6 6.3 14,349 13.4 23.0
Customer funds under management 224,227 (3.1) 2.4 224,227 (2.3) 13.2
RATIOS (%) AND OPERATING MEANS
ROE 12.24 (0.50 p.) 13.84 (5.41 p.)
Efficiency ratio (with amortisations) 44.6 2.7 p. 41.3 3.2 p.
NPL ratio 5.03 (0.29 p.) 5.03 (0.39 p.)
NPL coverage 84.6 1.7 p. 84.6 (2.9 p.)
Number of employees 87,069 (0.7) 87,069 (3.9)
Number of branches 5,904 (1.0) 5,904 (2.3)
(1).- Including dividends, income from equity-accounted method and other operating income/expenses (2).- Including all on-balance sheet balances for this item (3).- Not including profit of the year
22 JANUARY - DECEMBER

INFORMATION BY PRINCIPAL SEGMENTS FINANCIAL REPORT 2013
BRAZIL (EUR million)
Var. / 3Q»13 Var. / 2012
INCOME STATEMENT 4Q»13 (%) (%) w/o FX 2013 (%) (%) w/o FX
Net interest income 2,289 0.9 2.3 10,071 (21.0) (9.9)
Net fees 732 12.4 13.1 2,943 (6.2) 7.0
Gains (losses) on financial transactions 60 (70.6) (65.6) 540 (24.5) (13.9)
Other operating income (1) 2 (52.7) (48.6) 10 ƒ ƒ
Gross income 3,083 (1.4) 0.3 13,565 (17.9) (6.4)
Operating expenses (1,351) 6.6 8.1 (5,346) (8.9) 3.9
General administrative expenses (1,212) 7.0 8.5 (4,765) (10.0) 2.6
Personnel (650) 8.1 9.4 (2,578) (12.5) (0.2)
Other general administrative expenses (562) 5.8 7.5 (2,187) (7.0) 6.1
Depreciation and amortisation (139) 2.7 4.3 (581) 1.5 15.7
Net operating income 1,732 (6.9) (5.0) 8,219 (22.8) (12.0)
Net loan-loss provisions (985) (7.4) (5.7) (4,894) (20.1) (8.9)
Other income (163) 28.9 30.3 (500) (38.4) (29.7)
Profit before taxes 584 (12.7) (10.3) 2,826 (24.0) (13.3)
Tax on profit (191) (3.4) (1.1) (782) (16.5) (4.8)
Profit from continuing operations 393 (16.6) (14.1) 2,044 (26.5) (16.2)
Net profit from discontinued operations ƒ ƒ ƒ ƒ ƒ ƒ
Consolidated profit 393 (16.6) (14.1) 2,044 (26.5) (16.2)
Minority interests 92 (18.2) (15.4) 466 (21.1) (10.0)
Attributable profit to the Group 301 (16.1) (13.7) 1,577 (27.9) (17.8)
BALANCE SHEET
Customer loans (2) 66,446 (4.2) 2.6 66,446 (10.8) 7.4
Trading portfolio (w/o loans) 10,321 (11.5) (5.2) 10,321 (18.4) (1.7)
Available-for-sale financial assets 14,175 15.5 23.7 14,175 (13.0) 4.9
Due from credit institutions (2) 14,734 26.1 35.1 14,734 29.9 56.5
Intangible assets and property and equipment 2,793 (2.5) 4.5 2,793 (16.8) 0.2
Other assets 25,456 (18.6) (12.8) 25,456 (18.2) (1.5)
Total assets/liabilities & shareholders' equity 133,925 (3.7) 3.1 133,925 (10.3) 8.1
Customer deposits (2) 61,490 (6.6) 0.1 61,490 (12.0) 6.1
Marketable debt securities (2) 20,002 0.0 7.1 20,002 0.1 20.7
Subordinated debt (2) 2,734 (4.3) 2.5 2,734 (38.0) (25.3)
Insurance liabilities ƒ ƒ ƒ ƒ ƒ ƒ
Due to credit institutions (2) 12,929 (11.5) (5.1) 12,929 (25.7) (10.5)
Other liabilities 25,229 8.3 16.1 25,229 (2.2) 17.8
Shareholders' equity (3) 11,542 (8.4) (1.8) 11,542 (2.4) 17.5
Other customer funds under management 37,409 (6.4) 0.3 37,409 7.5 29.5
Mutual and pension funds 34,444 (6.5) 0.2 34,444 9.9 32.4
Managed portfolios 2,965 (5.2) 1.6 2,965 (14.7) 2.8
Customer funds under management 121,635 (5.4) 1.3 121,635 (5.7) 13.6
RATIOS (%) AND OPERATING MEANS
ROE 9.70 (1.51 p.) 11.88 (5.78 p.)
Efficiency ratio (with amortisations) 43.8 3.3 p. 39.4 3.9 p.
NPL ratio 5.64 (0.48 p.) 5.64 (1.22 p.)
NPL coverage 95.1 3.1 p. 95.1 4.9 p.
Number of employees 49,459 (1.9) 49,459 (8.0)
Number of branches 3,566 (2.6) 3,566 (5.9)
(1).- Including dividends, income from equity-accounted method and other operating income/expenses (2).- Including all on-balance sheet balances for this item (3).- Not including profit of the year
JANUARY - DECEMBER 23

FINANCIAL REPORT 2013 INFORMATION BY PRINCIPAL SEGMENTS
MEXICO (EUR million)
Var. / 3Q»13 Var. / 2012
INCOME STATEMENT 4Q»13 (%) (%) w/o FX 2013 (%) (%) w/o FX
Net interest income 531 (0.4) 3.1 2,120 5.7 5.9
Net fees 194 (4.6) (1.1) 810 7.9 8.1
Gains (losses) on financial transactions (3) ƒ ƒ 142 35.4 35.7
Other operating income (1) (13) 6.6 9.8 (32) (33.4) (33.2)
Gross income 710 (6.1) (2.5) 3,040 8.0 8.3
Operating expenses (318) 2.7 6.2 (1,236) 9.6 9.9
General administrative expenses (291) 3.8 7.3 (1,115) 9.9 10.2
Personnel (142) (9.3) (5.7) (598) 11.9 12.2
Other general administrative expenses (149) 20.4 23.7 (517) 7.7 7.9
Depreciation and amortisation (27) (8.0) (4.4) (121) 6.7 7.0
Net operating income 391 (12.2) (8.5) 1,804 7.0 7.2
Net loan-loss provisions (218) (15.2) (11.9) (801) 71.8 72.2
Other income (4) 21.6 25.2 17 (68.9) (68.8)
Profit before taxes 170 (8.5) (4.4) 1,020 (20.0) (19.8)
Tax on profit 24 ƒ ƒ (84) (59.4) (59.3)
Profit from continuing operations 194 19.2 22.5 936 (12.4) (12.2)
Net profit from discontinued operations ƒ ƒ ƒ ƒ ƒ ƒ
Consolidated profit 194 19.2 22.5 936 (12.4) (12.2)
Minority interests 45 14.0 17.5 223 276.9 277.7
Attributable profit to the Group 149 20.9 24.2 713 (29.3) (29.2)
BALANCE SHEET
Customer loans (2) 22,269 6.0 7.4 22,269 9.3 14.9
Trading portfolio (w/o loans) 8,685 (15.7) (14.7) 8,685 (17.0) (12.8)
Available-for-sale financial assets 3,387 8.7 10.1 3,387 22.2 28.5
Due from credit institutions (2) 7,975 6.1 7.4 7,975 3.9 9.3
Intangible assets and property and equipment 402 6.6 7.9 402 5.8 11.2
Other assets 5,681 15.2 16.7 5,681 9.0 14.7
Total assets/liabilities & shareholders' equity 48,398 2.4 3.7 48,398 3.2 8.6
Customer deposits (2) 24,663 (4.3) (3.1) 24,663 (0.3) 4.8
Marketable debt securities (2) 2,896 17.9 19.4 2,896 43.3 50.7
Subordinated debt (2) 931 ƒ ƒ 931 ƒ ƒ
Insurance liabilities ƒ ƒ ƒ ƒ ƒ ƒ
Due to credit institutions (2) 5,494 22.8 24.4 5,494 46.2 53.8
Other liabilities 11,601 5.2 6.5 11,601 (10.9) (6.3)
Shareholders' equity (3) 2,814 (19.9) (18.9) 2,814 (15.7) (11.4)
Other customer funds under management 10,349 0.5 1.8 10,349 0.2 5.4
Mutual funds 10,349 0.5 1.8 10,349 0.2 5.4
Managed portfolios ƒ ƒ ƒ ƒ ƒ ƒ
Customer funds under management 38,838 0.8 2.1 38,838 4.7 10.1
RATIOS (%) AND OPERATING MEANS
ROE 17.79 4.85 p. 18.64 (6.26 p.)
Efficiency ratio (with amortisations) 44.8 3.8 p. 40.7 0.6 p.
NPL ratio 3.66 0.08 p. 3.66 1.72 p.
NPL coverage 97.5 (1.5 p.) 97.5 (59.8 p.)
Number of employees 14,804 2.2 14,804 6.0
Number of branches 1,258 2.4 1,258 7.5
(1).- Including dividends, income from equity-accounted method and other operating income/expenses (2).- Including all on-balance sheet balances for this item (3).- Not including profit of the year
24 JANUARY - DECEMBER

INFORMATION BY PRINCIPAL SEGMENTS FINANCIAL REPORT 2013
CHILE (EUR million)
Var. / 3Q»13 Var. / 2012
INCOME STATEMENT 4Q»13 (%) (%) w/o FX 2013 (%) (%) w/o FX
Net interest income 434 (2.7) 1.5 1,698 (1.7) 3.4
Net fees 90 0.1 4.3 383 (14.4) (10.0)
Gains (losses) on financial transactions 46 20.6 24.2 168 35.8 42.8
Other operating income (1) (1) ƒ ƒ 12 35.8 42.8
Gross income 569 (1.1) 3.1 2,261 (2.0) 3.0
Operating expenses (221) (5.3) (1.0) (937) 0.4 5.5
General administrative expenses (197) (4.5) (0.2) (829) (0.5) 4.6
Personnel (122) (4.0) 0.3 (513) (1.6) 3.4
Other general administrative expenses (74) (5.4) (1.1) (315) 1.5 6.7
Depreciation and amortisation (25) (11.0) (6.6) (108) 7.2 12.7
Net operating income 348 1.7 5.9 1,324 (3.6) 1.4
Net loan-loss provisions (142) (7.8) (3.4) (597) 4.1 9.5
Other income (4) ƒ ƒ 4 (25.2) (21.4)
Profit before taxes 203 4.4 8.6 731 (9.2) (4.6)
Tax on profit (33) 20.3 24.2 (107) 6.1 11.5
Profit from continuing operations 169 1.8 6.0 624 (11.4) (6.9)
Net profit from discontinued operations ƒ ƒ ƒ ƒ ƒ ƒ
Consolidated profit 169 1.8 6.0 624 (11.4) (6.9)
Minority interests 50 (0.6) 3.6 188 (12.0) (7.5)
Attributable profit to the Group 119 2.9 7.1 435 (11.2) (6.6)
BALANCE SHEET
Customer loans (2) 28,783 (3.1) 2.8 28,783 (3.0) 11.2
Trading portfolio (w/o loans) 1,388 27.9 35.7 1,388 (19.5) (7.7)
Available-for-sale financial assets 2,385 (4.0) 1.8 2,385 (19.1) (7.2)
Due from credit institutions (2) 2,599 (10.0) (4.5) 2,599 (17.5) (5.4)
Intangible assets and property and equipment 327 0.8 7.0 327 (12.3) 0.6
Other assets 3,072 (6.2) (0.4) 3,072 9.8 25.9
Total assets/liabilities & shareholders' equity 38,553 (3.0) 2.9 38,553 (5.2) 8.7
Customer deposits (2) 20,988 (4.9) 0.9 20,988 (6.3) 7.4
Marketable debt securities (2) 6,022 1.2 7.4 6,022 (1.0) 13.6
Subordinated debt (2) 1,147 14.1 21.1 1,147 (0.3) 14.4
Insurance liabilities ƒ ƒ ƒ ƒ ƒ ƒ
Due to credit institutions (2) 4,253 (7.8) (2.2) 4,253 (9.0) 4.4
Other liabilities 4,021 3.3 9.6 4,021 (6.2) 7.6
Shareholders' equity (3) 2,122 (4.1) 1.7 2,122 2.5 17.5
Other customer funds under management 5,469 (3.5) 2.3 5,469 19.9 37.5
Mutual and pension funds 4,067 (5.2) 0.6 4,067 (10.9) 2.2
Managed portfolios 1,402 1.6 7.8 1,402 ƒ ƒ
Customer funds under management 33,626 (3.1) 2.8 33,626 (1.7) 12.8
RATIOS (%) AND OPERATING MEANS
ROE 22.11 1.52 p. 18.47 (3.27 p.)
Efficiency ratio (with amortisations) 38.9 (1.7 p.) 41.4 1.0 p.
NPL ratio 5.91 (0.09 p.) 5.91 0.74 p.
NPL coverage 51.1 1.4 p. 51.1 (6.6 p.)
Number of employees 12,290 (0.1) 12,290 (0.6)
Number of branches 493 1.0 493 (2.2)
(1).- Including dividends, income from equity-accounted method and other operating income/expenses (2).- Including all on-balance sheet balances for this item (3).- Not including profit of the year
JANUARY - DECEMBER 25

FINANCIAL REPORT 2013 INFORMATION BY PRINCIPAL SEGMENTS
UNITED STATES (EUR million)
Var. / 3Q»13 Var. / 2012
INCOME STATEMENT 4Q»13 (%) (%) w/o FX 2013 (%) (%) w/o FX
Net interest income 335 (3.4) (0.6) 1,409 (16.9) (14.1)
Net fees 103 5.4 8.1 393 4.0 7.5
Gains (losses) on financial transactions 11 ƒ ƒ 69 (71.7) (70.8)
Other operating income (1) 42 (42.3) (39.4) 285 (0.7) 2.7
Gross income 491 (3.6) (0.7) 2,157 (17.2) (14.4)
Operating expenses (336) 2.6 5.2 (1,260) 6.5 10.1
General administrative expenses (293) 3.2 5.8 (1,097) 5.8 9.4
Personnel (148) (7.5) (4.9) (607) 6.1 9.7
Other general administrative expenses (145) 17.1 19.8 (491) 5.4 8.9
Depreciation and amortisation (44) (1.4) 1.1 (163) 11.8 15.6
Net operating income 154 (14.7) (11.4) 896 (37.0) (34.8)
Net loan-loss provisions 23 78.2 79.8 5 ƒ ƒ
Other income (20) (28.5) (26.7) (64) (65.5) (64.3)
Profit before taxes 158 (5.1) (1.8) 836 (13.8) (10.9)
Tax on profit (21) 696.7 658.3 (113) (31.6) (29.3)
Profit from continuing operations 137 (16.5) (13.5) 724 (10.1) (7.1)
Net profit from discontinued operations ƒ ƒ ƒ ƒ ƒ ƒ
Consolidated profit 137 (16.5) (13.5) 724 (10.1) (7.1)
Minority interests ƒ ƒ ƒ ƒ ƒ ƒ
Attributable profit to the Group 137 (16.5) (13.5) 724 (10.1) (7.1)
BALANCE SHEET
Customer loans (2) 37,682 (1.3) 0.8 37,682 (8.8) (4.7)
Trading portfolio (w/o loans) 117 (18.7) (17.0) 117 (57.3) (55.4)
Available-for-sale financial assets 8,854 (0.8) 1.3 8,854 (40.1) (37.4)
Due from credit institutions (2) 348 (25.4) (23.9) 348 (51.3) (49.1)
Intangible assets and property and equipment 585 4.7 6.9 585 4.3 9.1
Other assets 6,745 (3.8) (1.8) 6,745 27.8 33.6
Total assets/liabilities & shareholders' equity 54,330 (1.7) 0.4 54,330 (13.7) (9.8)
Customer deposits (2) 35,537 (1.8) 0.3 35,537 (6.8) (2.5)
Marketable debt securities (2) 1,146 (1.8) 0.3 1,146 39.8 46.1
Subordinated debt (2) 1,225 (30.5) (29.0) 1,225 (38.4) (35.6)
Insurance liabilities ƒ ƒ ƒ ƒ ƒ ƒ
Due to credit institutions (2) 8,101 (4.1) (2.1) 8,101 (43.0) (40.5)
Other liabilities 2,649 37.0 39.9 2,649 0.8 5.4
Shareholders' equity (3) 5,673 (2.1) 0.0 5,673 9.5 14.5
Other customer funds under management ƒ ƒ ƒ ƒ ƒ ƒ
Mutual and pension funds ƒ ƒ ƒ ƒ ƒ ƒ
Managed portfolios ƒ ƒ ƒ ƒ ƒ ƒ
Customer funds under management 37,907 (3.1) (1.0) 37,907 (7.4) (3.2)
RATIOS (%) AND OPERATING MEANS
ROE 9.54 (1.58 p.) 12.42 (3.00 p.)
Efficiency ratio (with amortisations) 68.6 4.1 p. 58.4 13.0 p.
NPL ratio 2.23 (0.03 p.) 2.23 (0.06 p.)
NPL coverage 93.6 (3.0 p.) 93.6 (12.3 p.)
Number of employees 9,741 1.8 9,741 2.1
Number of branches 706 ƒ 706 (2.2)
(1).- Including dividends, income from equity-accounted method and other operating income/expenses (2).- Including all on-balance sheet balances for this item (3).- Not including profit of the year
SANTANDER BANK. INCOME STATEMENT (US$ million)
4Q»13 3Q»13 Var.(%) 2013 2012 Var.(%)
Gross income 603 579 4.3 2,454 2,907 (15.6)
Net operating income 146 144 1.4 781 1,391 (43.9)
Attributable profit to the Group 121 120 0.5 548 598 (8.5)
26 JANUARY - DECEMBER

INFORMATION BY PRINCIPAL SEGMENTS FINANCIAL REPORT 2013
CORPORATE ACTIVITIES (EUR million)
INCOME STATEMENT 4Q»13 3Q»13 (%) 2013 2012 (%)
Net interest income (619) (526) 17.7 (2,234) (1,843) 21.2
Net fees 3 (19) ƒ (50) (30) 63.8
Gains (losses) on financial transactions 264 330 (20.0) 1,184 716 65.4
Other operating income 36 47 (23.0) 146 150 (2.7)
Dividends 4 23 (84.2) 35 53 (34.0)
Income from equity-accounted method 0 (4) ƒ (8) (4) 76.0
Other operating income/expenses 33 28 14.6 119 101 17.0
Gross income (316) (168) 88.0 (953) (1,007) (5.3)
Operating expenses (172) (170) 1.0 (698) (530) 31.6
General administrative expenses (118) (154) (23.2) (566) (411) 37.9
Personnel (56) (35) 57.8 (216) (103) 109.9
Other general administrative expenses (63) (119) (47.2) (350) (308) 13.8
Depreciation and amortisation (54) (16) 234.2 (132) (120) 10.2
Net operating income (488) (338) 44.2 (1,651) (1,537) 7.4
Net loan-loss provisions 2 14 (83.5) (201) (85) 136.7
Other income 105 (124) ƒ (173) (555) (68.8)
Ordinary profit before taxes (380) (447) (15.1) (2,025) (2,177) (7.0)
Tax on profit (6) 24 ƒ 145 33 344.6
Ordinary profit from continuing operations (386) (424) (9.0) (1,880) (2,144) (12.3)
Net profit from discontinued operations (0) ƒ ƒ (0) 0 ƒ
Ordinary consolidated profit (386) (424) (9.0) (1,880) (2,144) (12.3)
Minority interests 11 (2) ƒ 7 (20) ƒ
Ordinary attributable profit to the Group (397) (422) (6.0) (1,887) (2,125) (11.2)
Net capital gains and provisions ƒ ƒ ƒ ƒ 983 (100.0)
Attributable profit to the Group (397) (422) (6.0) (1,887) (1,142) 65.3
BALANCE SHEET
Trading portfolio (w/o loans) 2,743 4,772 (42.5) 2,743 4,722 (41.9)
Available-for-sale financial assets 10,676 18,590 (42.6) 10,676 8,949 19.3
Investments 405 237 70.8 405 88 357.8
Goodwill 23,275 23,729 (1.9) 23,275 24,626 (5.5)
Liquidity lent to the Group 17,707 23,862 (25.8) 17,707 18,583 (4.7)
Capital assigned to Group areas 64,203 70,193 (8.5) 64,203 69,773 (8.0)
Other assets 62,714 62,816 (0.2) 62,714 116,712 (46.3)
Total assets/liabilities & shareholders' equity 181,722 204,200 (11.0) 181,722 243,453 (25.4)
Customer deposits (1) 2,851 4,916 (42.0) 2,851 3,152 (9.5)
Marketable debt securities (1) 64,470 69,149 (6.8) 64,470 82,002 (21.4)
Subordinated debt (1) 3,871 4,593 (15.7) 3,871 4,866 (20.5)
Other liabilities 29,755 44,677 (33.4) 29,755 73,744 (59.7)
Group capital and reserves (2) 80,776 80,866 (0.1) 80,776 79,689 1.4
Other customer funds under management ƒ ƒ ƒ ƒ ƒ ƒ
Mutual and pension funds ƒ ƒ ƒ ƒ ƒ ƒ
Managed portfolios ƒ ƒ ƒ ƒ ƒ ƒ
Customer funds under management 71,192 78,657 (9.5) 71,192 90,020 (20.9)
OPERATING MEANS
Number of employees 2,397 2,490 (3.7) 2,397 2,374
(1).- Including all on-balance sheet balances for this item (2).- Not including profit of the year
JANUARY - DECEMBER 27
1.0
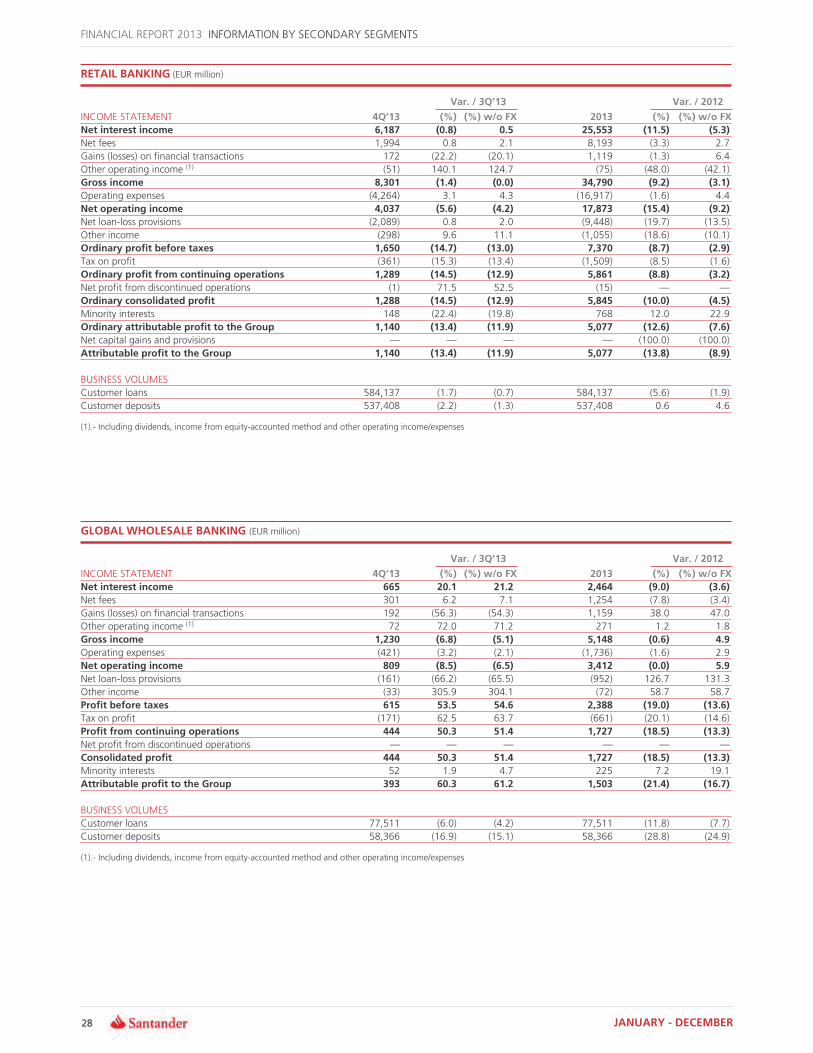
FINANCIAL REPORT 2013 INFORMATION BY SECONDARY SEGMENTS
RETAIL BANKING (EUR million)
Var. / 3Q»13 Var. / 2012
INCOME STATEMENT 4Q»13 (%) (%) w/o FX 2013 (%) (%) w/o FX
Net interest income 6,187 (0.8) 0.5 25,553 (11.5) (5.3)
Net fees 1,994 0.8 2.1 8,193 (3.3) 2.7
Gains (losses) on financial transactions 172 (22.2) (20.1) 1,119 (1.3) 6.4
Other operating income (1) (51) 140.1 124.7 (75) (48.0) (42.1)
Gross income 8,301 (1.4) (0.0) 34,790 (9.2) (3.1)
Operating expenses (4,264) 3.1 4.3 (16,917) (1.6) 4.4
Net operating income 4,037 (5.6) (4.2) 17,873 (15.4) (9.2)
Net loan-loss provisions (2,089) 0.8 2.0 (9,448) (19.7) (13.5)
Other income (298) 9.6 11.1 (1,055) (18.6) (10.1)
Ordinary profit before taxes 1,650 (14.7) (13.0) 7,370 (8.7) (2.9)
Tax on profit (361) (15.3) (13.4) (1,509) (8.5) (1.6)
Ordinary profit from continuing operations 1,289 (14.5) (12.9) 5,861 (8.8) (3.2)
Net profit from discontinued operations (1) 71.5 52.5 (15) ƒ ƒ
Ordinary consolidated profit 1,288 (14.5) (12.9) 5,845 (10.0) (4.5)
Minority interests 148 (22.4) (19.8) 768 12.0 22.9
Ordinary attributable profit to the Group 1,140 (13.4) (11.9) 5,077 (12.6) (7.6)
Net capital gains and provisions ƒ ƒ ƒ ƒ (100.0) (100.0)
Attributable profit to the Group 1,140 (13.4) (11.9) 5,077 (13.8) (8.9)
BUSINESS VOLUMES
Customer loans 584,137 (1.7) (0.7) 584,137 (5.6) (1.9)
Customer deposits 537,408 (2.2) (1.3) 537,408 0.6 4.6
(1).- Including dividends, income from equity-accounted method and other operating income/expenses
GLOBAL WHOLESALE BANKING (EUR million)
Var. / 3Q»13 Var. / 2012
INCOME STATEMENT 4Q»13 (%) (%) w/o FX 2013 (%) (%) w/o FX
Net interest income 665 20.1 21.2 2,464 (9.0) (3.6)
Net fees 301 6.2 7.1 1,254 (7.8) (3.4)
Gains (losses) on financial transactions 192 (56.3) (54.3) 1,159 38.0 47.0
Other operating income (1) 72 72.0 71.2 271 1.2 1.8
Gross income 1,230 (6.8) (5.1) 5,148 (0.6) 4.9
Operating expenses (421) (3.2) (2.1) (1,736) (1.6) 2.9
Net operating income 809 (8.5) (6.5) 3,412 (0.0) 5.9
Net loan-loss provisions (161) (66.2) (65.5) (952) 126.7 131.3
Other income (33) 305.9 304.1 (72) 58.7 58.7
Profit before taxes 615 53.5 54.6 2,388 (19.0) (13.6)
Tax on profit (171) 62.5 63.7 (661) (20.1) (14.6)
Profit from continuing operations 444 50.3 51.4 1,727 (18.5) (13.3)
Net profit from discontinued operations ƒ ƒ ƒ ƒ ƒ ƒ
Consolidated profit 444 50.3 51.4 1,727 (18.5) (13.3)
Minority interests 52 1.9 4.7 225 7.2 19.1
Attributable profit to the Group 393 60.3 61.2 1,503 (21.4) (16.7)
BUSINESS VOLUMES
Customer loans 77,511 (6.0) (4.2) 77,511 (11.8) (7.7)
Customer deposits 58,366 (16.9) (15.1) 58,366 (28.8) (24.9)
(1).- Including dividends, income from equity-accounted method and other operating income/expenses
2828 JANUARY - DECEMBER

INFORMATION BY SECONDARY SEGMENTS FINANCIAL REPORT 2013
ASSET MANAGEMENT AND INSURANCE (EUR million)
Var. / 3Q»13 Var. / 2012
INCOME STATEMENT 4Q»13 (%) (%) w/o FX 2013 (%) (%) w/o FX
Net interest income 42 86.2 85.8 115 (2.7) 1.8
Net fees 83 (4.8) (3.7) 348 (16.6) (11.8)
Gains (losses) on financial transactions 2 9.6 12.1 6 109.1 165.6
Other operating income (1) 63 (9.5) (7.7) 293 (17.4) (13.6)
Gross income 189 4.9 6.0 763 (14.6) (10.2)
Operating expenses (85) 7.4 7.8 (318) 3.9 7.5
Net operating income 104 2.9 4.7 444 (24.3) (19.7)
Net loan-loss provisions 0 873.3 873.2 0 ƒ ƒ
Other income (7) ƒ ƒ (8) (19.9) (10.2)
Profit before taxes 97 (3.7) (1.8) 437 (24.1) (19.6)
Tax on profit (23) 2.1 2.1 (101) (34.6) (31.3)
Profit from continuing operations 74 (5.5) (2.9) 336 (20.3) (15.2)
Net profit from discontinued operations 0 ƒ ƒ 0 ƒ ƒ
Consolidated profit 74 (5.5) (2.9) 336 (20.3) (15.2)
Minority interests 8 27.7 30.1 24 21.0 36.7
Attributable profit to the Group 66 (8.3) (5.7) 313 (22.3) (17.6)
(1).- Including dividends, income from equity-accounted method and other operating income/expenses
JANUARY - DECEMBER 29

Investor RelationsCiudad Grupo Santander Edificio Pereda, 1st floor Avda de Cantabria, o/n
28660 Boadilla del Monte
Madrid (Spain) Tel: 34 (91) 259 65 14 / 34 (91) 259 65 20
Fax: 34 (91) 257 02 45
e mail: investor@gruposantander,com
Legal Head Office: Paseo Pereda, 9 12, Santander (Spain) Tel: 34 (942) 20 61 00
Operational Head Office: Ciudad Grupo Santander Avda. de Cantabria, o/n 28660 Boadilla del Monte, Madrid (Spain)
www.santander.com
JANUARY - DECEMBER