Embed Size (px)
Citation preview
Foglight® Performance Analysis for DB2 LUW Version 7.0User Guide
© 2011 Quest Software, Inc. ALL RIGHTS RESERVED.
This guide contains proprietary information protected by copyright. The software described in this guide is furnished under a software license or nondisclosure agreement. This software may be used or copied only in accordance with the terms of the applicable agreement. No part of this guide may be reproduced or transmitted in any form or by any means, electronic or mechanical, including photocopying and recording for any purpose other than the purchaser’s personal use without the written permission of Quest Software, Inc.
The information in this document is provided in connection with Quest products. No license, express or implied, by estoppel or otherwise, to any intellectual property right is granted by this document or in connection with the sale of Quest products. EXCEPT AS SET FORTH IN QUEST'S TERMS AND CONDITIONS AS SPECIFIED IN THE LICENSE AGREEMENT FOR THIS PRODUCT, QUEST ASSUMES NO LIABILITY WHATSOEVER AND DISCLAIMS ANY EXPRESS, IMPLIED OR STATUTORY WARRANTY RELATING TO ITS PRODUCTS INCLUDING, BUT NOT LIMITED TO, THE IMPLIED WARRANTY OF MERCHANTABILITY, FITNESS FOR A PARTICULAR PURPOSE, OR NON-INFRINGEMENT. IN NO EVENT SHALL QUEST BE LIABLE FOR ANY DIRECT, INDIRECT, CONSEQUENTIAL, PUNITIVE, SPECIAL OR INCIDENTAL DAMAGES (INCLUDING, WITHOUT LIMITATION, DAMAGES FOR LOSS OF PROFITS, BUSINESS INTERRUPTION OR LOSS OF INFORMATION) ARISING OUT OF THE USE OR INABILITY TO USE THIS DOCUMENT, EVEN IF QUEST HAS BEEN ADVISED OF THE POSSIBILITY OF SUCH DAMAGES. Quest makes no representations or warranties with respect to the accuracy or completeness of the contents of this document and reserves the right to make changes to specifications and product descriptions at any time without notice. Quest does not make any commitment to update the information contained in this document.
If you have any questions regarding your potential use of this material, contact:Quest Software World HeadquartersLEGAL Dept5 Polaris WayAliso Viejo, CA 92656www.quest.comemail: [email protected]
Refer to our Web site for regional and international office information.
Trademarks
Quest, Quest Software, the Quest Software logo, Foglight, IntelliProfile, PerformaSure, Spotlight, StealthCollect, TOAD, Tag and Follow, Vintela Single Sign-on for Java, and vFoglight are trademarks and registered trademarks of Quest Software, Inc in the United States of America and other countries. For a complete list of Quest Software’s trademarks, please see http://www.quest.com/legal/trademark-information.aspx. Other trademarks and registered trademarks are property of their respective owners.
Third Party Contributions
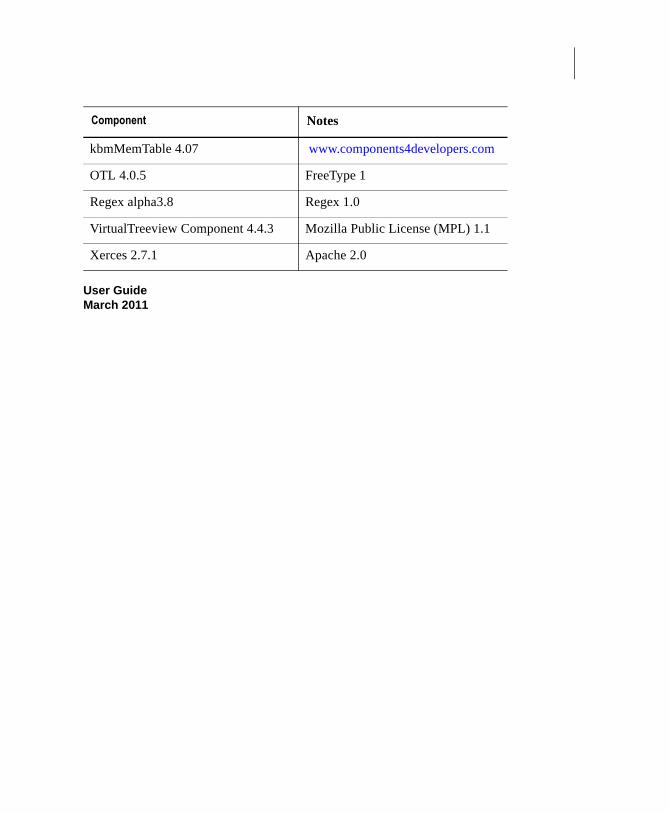
Foglight® Performance Analysis for DB2 LUW 7.0 contains some third party components (listed below). Copies of
their licenses may be found on our website at http://www.quest.com/legal/third-party-licenses.aspx.
Component Notes
CUESoft XmlParser 1.x Mozilla Public License (MPL) 1.1
GigaBASE 3.6.1 MIT License
JEDI JCL/JVCL 1 Mozilla Public License (MPL) 1.1
User GuideMarch 2011
kbmMemTable 4.07 www.components4developers.com
OTL 4.0.5 FreeType 1
Regex alpha3.8 Regex 1.0
VirtualTreeview Component 4.4.3 Mozilla Public License (MPL) 1.1
Xerces 2.7.1 Apache 2.0
Component Notes
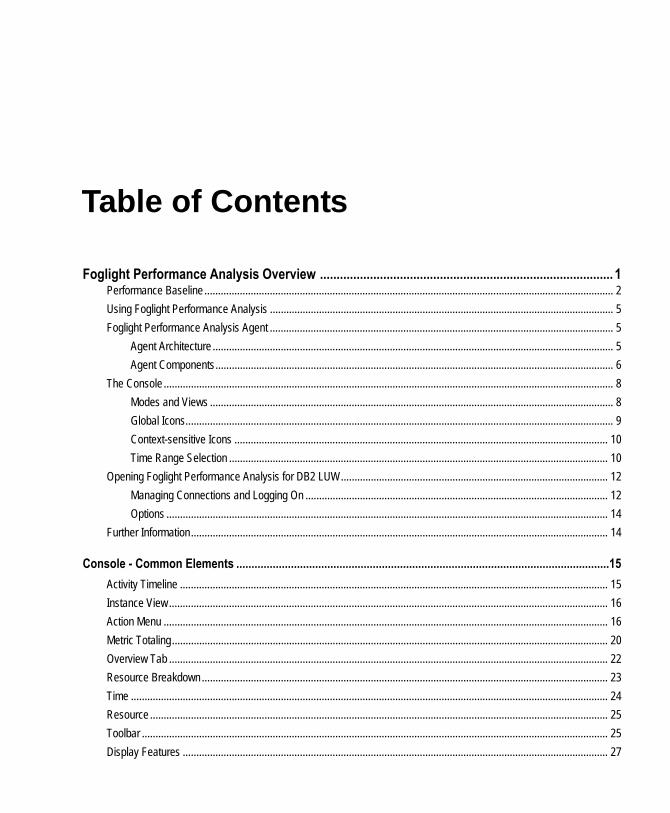
Table of Contents
Foglight Performance Analysis Overview ........................................................................................ 1Performance Baseline ...................................................................................................................................................... 2
Using Foglight Performance Analysis .............................................................................................................................. 5
Foglight Performance Analysis Agent .............................................................................................................................. 5
Agent Architecture ................................................................................................................................................... 5
Agent Components.................................................................................................................................................. 6
The Console ..................................................................................................................................................................... 8
Modes and Views .................................................................................................................................................... 8
Global Icons............................................................................................................................................................. 9
Context-sensitive Icons ......................................................................................................................................... 10
Time Range Selection ........................................................................................................................................... 10
Opening Foglight Performance Analysis for DB2 LUW.................................................................................................. 12
Managing Connections and Logging On ............................................................................................................... 12
Options .................................................................................................................................................................. 14
Further Information......................................................................................................................................................... 14
Console - Common Elements ...........................................................................................................................15
Activity Timeline ............................................................................................................................................................. 15
Instance View ................................................................................................................................................................. 16
Action Menu ................................................................................................................................................................... 16
Metric Totaling................................................................................................................................................................ 20
Overview Tab ................................................................................................................................................................. 22
Resource Breakdown ..................................................................................................................................................... 23
Time ............................................................................................................................................................................... 24
Resource ........................................................................................................................................................................ 25
Toolbar ........................................................................................................................................................................... 25
Display Features ............................................................................................................................................................ 27

Foglight Performance Analysis for DB2 LUWUser Guide
Unit Display............................................................................................................................................................ 27
Splitter/Closer ........................................................................................................................................................ 27
Dimension Filtering ......................................................................................................................................................... 28
Home Page 29Instance Performance Tab ............................................................................................................................................. 32
Measuring System Health...................................................................................................................................... 33
Workload Gauge .................................................................................................................................................... 33
Instance Workload Graph ...................................................................................................................................... 33
DB2 LUW Performance Resource Breakdown Gauge .......................................................................................... 34
System Utilization Gauges..................................................................................................................................... 35
Status Indicators .................................................................................................................................................... 35
Databases Performance Tab.......................................................................................................................................... 36
Database Summary List (left pane) ....................................................................................................................... 36
Database Performance Graph (upper right) .......................................................................................................... 36
DB2 LUW Performance Resource Breakdown Gauge (lower right) ...................................................................... 37
Memory (%) ........................................................................................................................................................... 38
Status Indicators .................................................................................................................................................... 38
Memory Heap Details Dialog .......................................................................................................................................... 38
Color Alerts ..................................................................................................................................................................... 39
Monitor Switches ............................................................................................................................................................ 40
Real-Time Mode 43Report Time Range and Intervals................................................................................................................................... 43
Time Range ........................................................................................................................................................... 43
Data Interval........................................................................................................................................................... 44
Metric Selection Dialog ................................................................................................................................................... 44
Real-time Instance View ................................................................................................................................... 46
Overview Tab.................................................................................................................................................................. 46
Top Sessions Tab........................................................................................................................................................... 47
Blocking Locks Tab......................................................................................................................................................... 49
Current Sessions Node..................................................................................................................................... 51
Individual Session Nodes ............................................................................................................................................... 53
Statement Level Tabs..................................................................................................................................................... 54
History Mode 57Dimension Navigation..................................................................................................................................................... 58
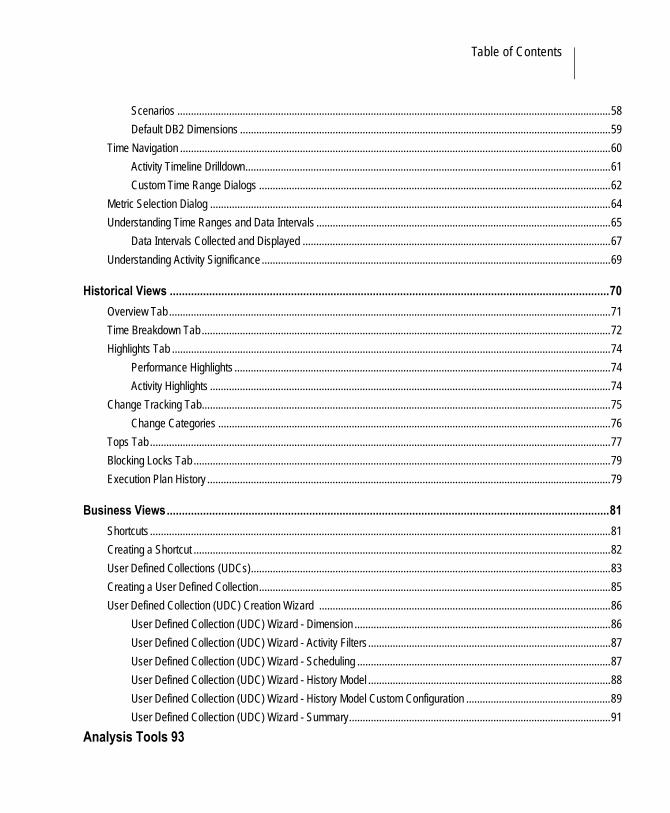
Table of Contents
Scenarios ...............................................................................................................................................................58
Default DB2 Dimensions ........................................................................................................................................59
Time Navigation ..............................................................................................................................................................60
Activity Timeline Drilldown......................................................................................................................................61
Custom Time Range Dialogs .................................................................................................................................62
Metric Selection Dialog ...................................................................................................................................................64
Understanding Time Ranges and Data Intervals ............................................................................................................65
Data Intervals Collected and Displayed .................................................................................................................67
Understanding Activity Significance ................................................................................................................................69
Historical Views .................................................................................................................................................70
Overview Tab ..................................................................................................................................................................71
Time Breakdown Tab ......................................................................................................................................................72
Highlights Tab .................................................................................................................................................................74
Performance Highlights ..........................................................................................................................................74
Activity Highlights ...................................................................................................................................................74
Change Tracking Tab......................................................................................................................................................75
Change Categories ................................................................................................................................................76
Tops Tab .........................................................................................................................................................................77
Blocking Locks Tab .........................................................................................................................................................79
Execution Plan History ....................................................................................................................................................79
Business Views..................................................................................................................................................81
Shortcuts .........................................................................................................................................................................81
Creating a Shortcut .........................................................................................................................................................82
User Defined Collections (UDCs)....................................................................................................................................83
Creating a User Defined Collection.................................................................................................................................85
User Defined Collection (UDC) Creation Wizard ...........................................................................................................86
User Defined Collection (UDC) Wizard - Dimension ..............................................................................................86
User Defined Collection (UDC) Wizard - Activity Filters .........................................................................................87
User Defined Collection (UDC) Wizard - Scheduling .............................................................................................87
User Defined Collection (UDC) Wizard - History Model .........................................................................................88
User Defined Collection (UDC) Wizard - History Model Custom Configuration .....................................................89
User Defined Collection (UDC) Wizard - Summary................................................................................................91
Analysis Tools 93
Foglight Performance Analysis for DB2 LUWUser Guide
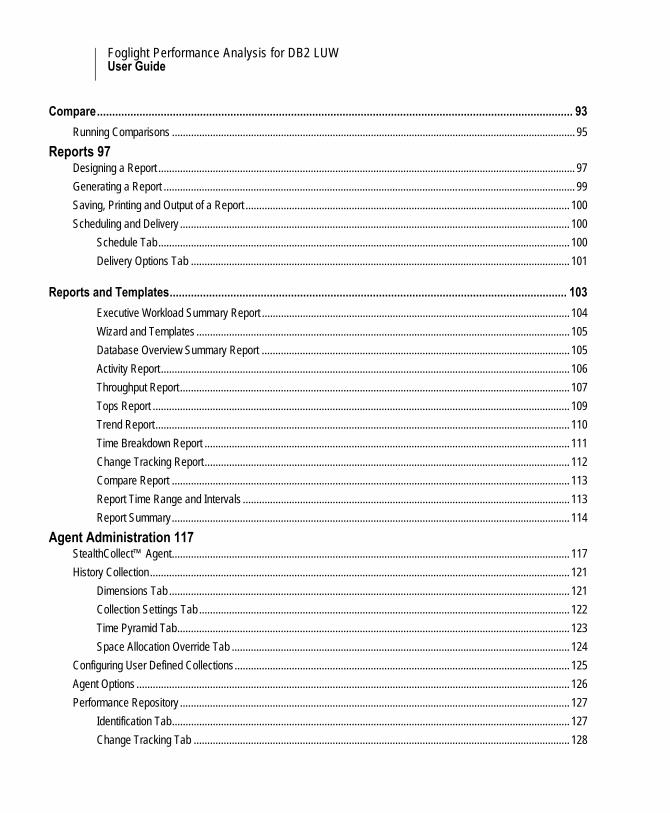
Compare............................................................................................................................................................. 93
Running Comparisons .................................................................................................................................................... 95
Reports 97Designing a Report ......................................................................................................................................................... 97
Generating a Report ....................................................................................................................................................... 99
Saving, Printing and Output of a Report ....................................................................................................................... 100
Scheduling and Delivery ............................................................................................................................................... 100
Schedule Tab....................................................................................................................................................... 100
Delivery Options Tab ........................................................................................................................................... 101
Reports and Templates................................................................................................................................... 103
Executive Workload Summary Report ................................................................................................................. 104
Wizard and Templates ......................................................................................................................................... 105
Database Overview Summary Report ................................................................................................................. 105
Activity Report ...................................................................................................................................................... 106
Throughput Report ............................................................................................................................................... 107
Tops Report ......................................................................................................................................................... 109
Trend Report........................................................................................................................................................ 110
Time Breakdown Report ...................................................................................................................................... 111
Change Tracking Report...................................................................................................................................... 112
Compare Report .................................................................................................................................................. 113
Report Time Range and Intervals ........................................................................................................................ 113
Report Summary.................................................................................................................................................. 114
Agent Administration 117StealthCollect™ Agent.................................................................................................................................................. 117
History Collection.......................................................................................................................................................... 121
Dimensions Tab ................................................................................................................................................... 121
Collection Settings Tab ........................................................................................................................................ 122
Time Pyramid Tab................................................................................................................................................ 123
Space Allocation Override Tab ............................................................................................................................ 124
Configuring User Defined Collections........................................................................................................................... 125
Agent Options ............................................................................................................................................................... 126
Performance Repository ............................................................................................................................................... 127
Identification Tab.................................................................................................................................................. 127
Change Tracking Tab .......................................................................................................................................... 128

Table of Contents
Maintenance Tab..................................................................................................................................................129
Instance List Tab ..................................................................................................................................................129
Home Page ...................................................................................................................................................................130
IntelliProfile™ (Baseline)...............................................................................................................................................130
Support..........................................................................................................................................................................131
Adding the Performance Repository .............................................................................................................................132
Starting and Stopping the Quest Launcher ...................................................................................................................133
On AIX Platforms .................................................................................................................................................133
On Windows Platforms.........................................................................................................................................134
Foglight Performance Analysis Configuration 137Home Configuration Tab ...............................................................................................................................................137
Real-Time......................................................................................................................................................................138
History ...........................................................................................................................................................................138
General .........................................................................................................................................................................139
Change Tracking...........................................................................................................................................................140
Compare .......................................................................................................................................................................141
Performance Highlights.................................................................................................................................................141
Activity Highlights ..........................................................................................................................................................141
Scheduler ......................................................................................................................................................................142
Baseline ........................................................................................................................................................................142
Support..........................................................................................................................................................................143
Metric Listing 145Wait Event Categories 177Glossary 181
Activity Report Templates .............................................................................................................................................181
Collector ........................................................................................................................................................................181
CPU Usage ...................................................................................................................................................................182
CPU Wait ......................................................................................................................................................................182
Resource Usage ...........................................................................................................................................................182
1
Foglight Performance Analysis Overview
Foglight Performance Analysis for DB2 LUW is a database real-time monitoring and historical analysis application.
The Foglight® Performance Analysis for DB2 LUW application uses the StealthCollect™ resource-light high sampling rate technology, with the capacity to bind between the (anonymous) database activities and the real users, programs and DB2 resource consumers (see “Dimension Navigation” on page 58) in an intuitive user-friendly interface. Listings, reports, and graphical flows and charts grant you both a system-wide perspective and the ability to drill-down into any existing or user-defined unit.
DB2 performance monitoring by system and database administrators is immeasurably enhanced by the Foglight Performance Analysis ability to bring together in one screen and report all mission-critical performance data in a customizable manner.
Effective data collection and analysis is essential for identifying and correcting performance problems. Foglight Performance Analysis for DB2 LUW provides the means to comprehensively record DB2 instance activity for an unlimited period for analysis and diagnosis. With Foglight Performance Analysis for DB2 LUW you can:
• Perform root cause analysis: Rapidly identify bottlenecks, anomalies, and application trends to the level of their causal factors. The analysis, supported by a unique graphical interface, reduces data sprawl and adds intelligence to facilitate quick and confident responses.
• Focus on top resource consumers to easily drill down to the specific offending dimension domains (SQL statements, users, programs, machines, and so forth) and files.
2 Foglight Performance Analysis for DB2 LUWUser Guide
The tool uses OLAP concepts to generate customized DB2 views of historical instance activity from the perspective of any of its components or DB2-specific dimensions and from the perspective of both the entire instance or any subset activity.
• Create and schedule historical diagnostic reports on critical aspects of system health, performance, and capacity planning.
• Perform real-time instance monitoring, including session activities, down to the statement level.
• Identify and track system and instance changes that can adversely affect your instance behavior.
• Generate baseline comparisons to identify both differences and causes of system, program, or SQL response.
Foglight Performance Analysis for DB2 LUW thus provides you with several key abilities:
• to monitor current DB2 performance at a glance
• to gather and diagnose historical views
• to identify and anticipate performance issues.
A complete glossary of database monitoring concepts and statistics is provided in the topic: Metrics
Performance BaselineDatabase administrators face the ongoing challenge of effectively planning for the future of their database systems. Foglight Performance Analysis for DB2 LUW's adaptive IntelliProfile™ engine dynamically analyzes time-sensitive operating metrics to produce a baseline (expected) operating range for the instance. A form of quantitative analysis, this process looks at historical performance data to benchmark current performance, and, moreover, to estimate future performance. Good quantitative analysis requires as much data as is available, and IntelliProfile incorporates data on hardware and software configurations, concurrent users, workload size, instance availability, as well as other day-to-day operating specifics.
The baseline algorithm parses sampled data into pre-defined time units (e.g. day of the week) and distinct episodes (for example: systematically recurring spikes in CPU consumption). These episodes form the basis for projecting normative instance behavior, allowing for both exception monitoring and performance diagnostics.
3Performance Baseline
These dynamically-created statistical ranges help administrators configure high and low metric threshold values. The IntelliProfile engine learns the instance's “signature” behavior characteristics via sophisticated algorithms that identify both cyclical and periodic behavior to minimize and/or neutralize random noise distortion (for example, an employee absent due to illness). The engine is adaptive, i.e. it grows “smarter” as the sampling period increases so acceptable/normal activity range projections are more accurate for each point in time.
This time-sensitive baseline analysis:
• is resource-light and runs in the middle tier
• features configurable Color Alerts
• supports full Compare capabilities
• features intelligent calibration of charts and bars display (see “Resource Breakdown” on page 23)
The baseline perspectives are always relative to the latest norms, so if the instance changes, the baseline is re-applied. Thus, behavior which in its original context was reported as within a normative range can subsequently, and even retrospectively, be deemed exceptional.
Note A performance baseline is not a definition of overall system performance; rather a realistic workload baseline gives valuable insight into expected real performance. This insight then allows database and administrative staff to effectively anticipate and plan for future needs.
Use case scenarios — identifying abnormal behavior
A key business problem solved by IntelliProfile™ (Baseline) is that of identifying, diagnosing and characterizing abnormal behavior. Almost all performance indicators are “relative”, but administrators must specify behavioral ranges specific to each of their instances. Are peaks presently encountered in fact exceptional? How exceptional are they? Do they reflect desired or undesired system responses? Are they one-time or cyclical?
Display and usage within Foglight Performance Analysis
The baseline graphic can be toggled on three different timeline views: on both the Real-Time and History modes' Overview tabs in the instance workload view, and within the History mode's overall Resource time-line instance view (see “Activity Timeline” on page 15).
4 Foglight Performance Analysis for DB2 LUWUser Guide
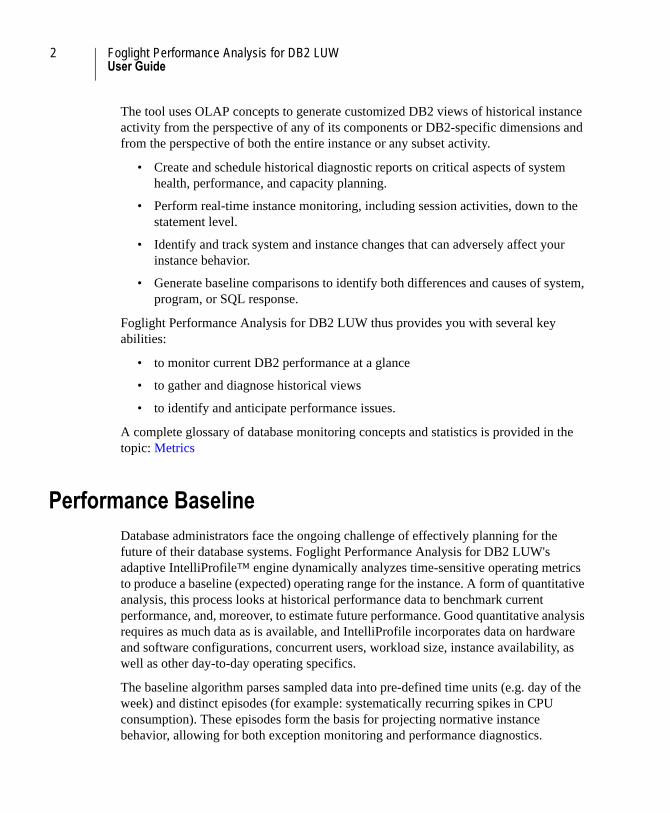
Graphical interface:
The baseline range is displayed as a light blue band in the background of the Home Page > Overview tab's Instance Workload graph and in the History Mode Average Active Sessions timelines, the baseline range is displayed as a background light blue band.
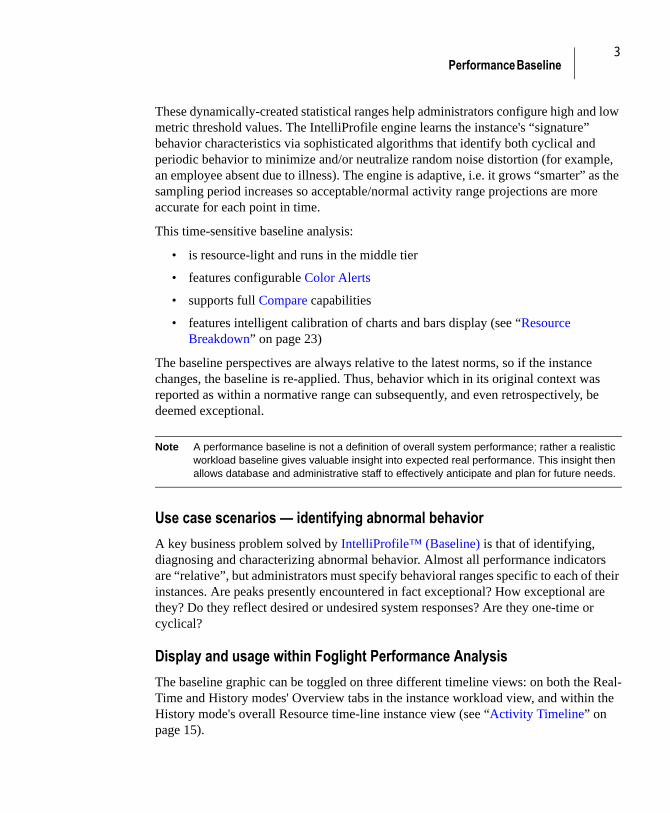
The baseline ranges are depicted as a range-marking vertical element on the Overview Workload, Resource Breakdown and System Utilization bar graphs.
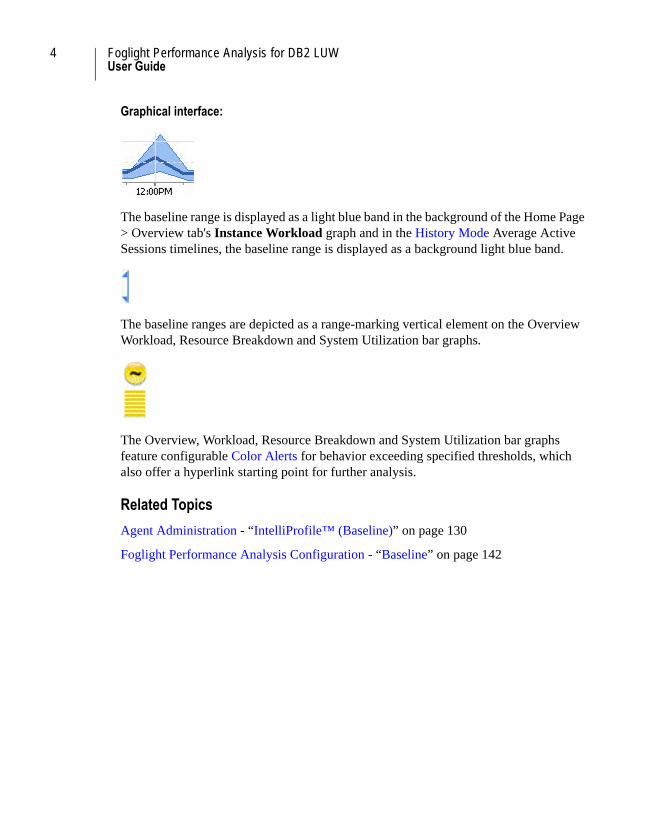
The Overview, Workload, Resource Breakdown and System Utilization bar graphs feature configurable Color Alerts for behavior exceeding specified thresholds, which also offer a hyperlink starting point for further analysis.
Related Topics
Agent Administration - “IntelliProfile™ (Baseline)” on page 130
Foglight Performance Analysis Configuration - “Baseline” on page 142
5Using Foglight Performance Analysis
Using Foglight Performance AnalysisFoglight Performance Analysis for DB2 LUW offers a rich set of sophisticated and user-friendly features that enable Database Administrators (DBAs) to rapidly and effectively focus their attention on application and database related performance issues, solve problems quickly and improve overall application responsiveness throughout the application life cycle.
Foglight Performance Analysis AgentFoglight Performance Analysis for DB2 LUW has a server-based Agent (StealthCollect™) that monitors databases and workloads of all scales: from small environments to intensive databases hosting thousands of concurrent sessions. The Agent samples and collects (multiple times per second) performance data from the DB2 memory and from the operating system APIs. The collected metrics are made available as data, either as a present activity stream or as historical activity.
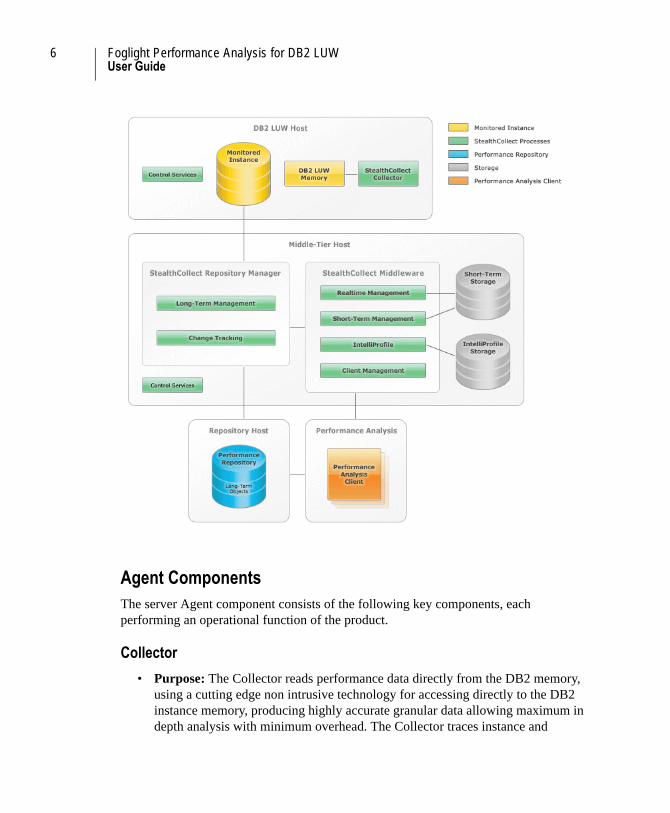
Agent ArchitectureThe architecture of Foglight Performance Analysis for DB2 LUW can be represented as follows:
6 Foglight Performance Analysis for DB2 LUWUser Guide
Figure 1
Agent ComponentsThe server Agent component consists of the following key components, each performing an operational function of the product.
Collector
• Purpose: The Collector reads performance data directly from the DB2 memory, using a cutting edge non intrusive technology for accessing directly to the DB2 instance memory, producing highly accurate granular data allowing maximum in depth analysis with minimum overhead. The Collector traces instance and
7Foglight Performance Analysis Agent
sessions activity by rapidly (up to 20 times per second) sampling the DB2 instance's memory.
• Deployment: The Collector is always deployed on the same host as the monitored DB2 instance.
Middleware
• Purpose: Aggregates and manages storage of performance data to satisfy both short-term and long-term queries. Short-term performance data is stored and managed in an internal database allocated on raw operating system files. The Middleware's key elements are:
• Online Processor - Translates the DB2 memory samples into dynamic instance state snapshots for accumulation and diagnosis.
• Historical Processor - Applies OLAP algorithms to create a short-term database to answer short-term (up to three months) historical queries. The database uses standard operating system files that require disk space according to the volume of the processed data.
• IntelliProfile™ - The Foglight Performance Analysis' artificial intelligence engine that generates normative baseline projections for exception-monitoring evaluation of current and historical behavior.
• Deployment: The Middleware can be deployed on any host but it is highly recommended to use a host other than that of the monitored DB2 instance.
Long-term Performance Repository
• Purpose: A DB2 performance warehouse instance which contains the long-term performance data collected, aggregated and controlled by the Middleware. When the long-term Repository option is enabled, the Repository Manager continually loads, aggregates and transfers the historical data into the long-term Performance Repository. The Performance Repository enables a set of advanced features including:
• Long-term historical data retention (for an indefinite period)
• A powerful Change Tracking mechanism that captures all the database related and execution plan changes
• Deployment: The Repository can be deployed on any network host but it is highly recommended to use a host other than that of the monitored DB2 instance in order to have optimum scalability and performance and reduce overhead on the monitored DB2 instance.
8 Foglight Performance Analysis for DB2 LUWUser Guide
Quest Support is available to customers who have a trial version of a Quest product or who have purchased a commercial version and have a valid maintenance contract. Quest Support provides around the clock coverage with SupportLink, our web self-service. Visit SupportLink at http://support.quest.com
From SupportLink, you can do the following:
• Quickly find thousands of solutions (Knowledgebase articles/documents).
• Download patches and upgrades.
• Seek help from a Support engineer.
• Log and update your case, and check its status.
For additional technical information, see “Further Information” on page 14 or view the Agent Installation User Guide file on the installation CD.
Related Topics
“The Console” on page 8
“History Mode” on page 57
“Real-Time Mode” on page 43
“Reports” on page 97
The Console
Modes and ViewsThe Main screen of Foglight Performance Analysis for DB2 LUW displays overall, recent and longer term data and facilitates generation of activity reports. The following table shows the principal modes (views) accessible by clicking on the button at the top of the main screen.

9The Console
Global IconsA second row of icons appear below the mode buttons. The Global icons on the left end control overall Foglight Performance Analysis for DB2 LUW operations.
Mode Description
Default tab upon opening Foglight Performance Analysis for DB2 LUW. This tab offers at-a-glance monitoring of primary system health measurements, and provides the starting point for drill-down analysis in one easy-to-understand digital dashboard. This view offers user-configurable, alarm-enabled, normative baseline and applied knowledge base tool-sets to optimize user monitoring and tuning efforts; Foglight Performance Analysis's Home mode intuitively focuses users' attention on those instance and system aspects most in need of attention.
Opens the Foglight Performance Analysis for DB2 LUW tool for real-time and recent (up to the last 60 minutes) monitoring of both instance and session activity. Use this tool to trace session activities down to the statement resolution.
Opens the Foglight Performance Analysis for DB2 LUW tool that facilitates problem detection, diagnosis, and resolution by means of baseline and dimensional analysis. Historical performance data can be analyzed down to increasingly refined levels through the instance overview, and users can create and maintain custom shortcuts (cube views) and user defined collections.
Open the Foglight Performance Analysis for DB2 LUW tool to create reports spanning all dimensions and filters in a variety of output formats for further inquiry and analysis. These reports supply supporting evidence of instance activity. The varieties of report types assist the DBA/Manager in understanding the system's behavior. The Foglight Performance Analysis for DB2 LUW ability to create and schedule mission-critical reports allows the DBA to automate key job tasks.

10 Foglight Performance Analysis for DB2 LUWUser Guide
Context-sensitive IconsThe context-sensitive operations to the right of the Global icons launch operations displayed in the following table. The available operations vary by mode.
Time Range SelectionThis link on the far right of the second toolbar selects the time range to be to displaying data in the Home mode.
• Last 5 minutes
• Last 15 minutes
• Last Hour
• Last 6 Hours
• Last 12 Hours
• Last 24 Hours
Icon Description
Queries the Foglight Performance Analysis for DB2 LUW Agent and refreshes the display.
Opens the Foglight Performance Analysis Configuration dialog to configure the display and behavior of Foglight Performance Analysis. These configurations only affect your client computer and not collection of data, which are principally defined in the Foglight Performance Analysis Agent.
Opens the Agent Administration screen utility to influence the collection of data by configuring the behavior of the Foglight Performance Analysis Agent components.
Opens the online help.
Note If you are reading this topic directly from Foglight Performance Analysis help, click on the back button to return to this topic.
11The Console
Related Topics
“Opening Foglight Performance Analysis for DB2 LUW” on page 12
“Console - Common Elements” on page 15
12 Foglight Performance Analysis for DB2 LUWUser Guide
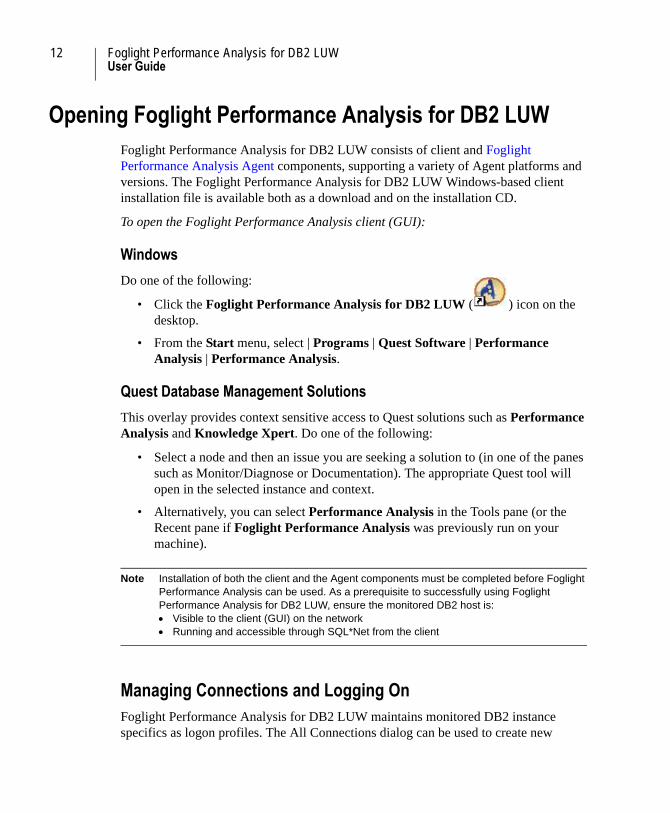
Opening Foglight Performance Analysis for DB2 LUWFoglight Performance Analysis for DB2 LUW consists of client and Foglight Performance Analysis Agent components, supporting a variety of Agent platforms and versions. The Foglight Performance Analysis for DB2 LUW Windows-based client installation file is available both as a download and on the installation CD.
To open the Foglight Performance Analysis client (GUI):
Windows
Do one of the following:
• Click the Foglight Performance Analysis for DB2 LUW ( ) icon on the desktop.
• From the Start menu, select | Programs | Quest Software | Performance Analysis | Performance Analysis.
Quest Database Management Solutions
This overlay provides context sensitive access to Quest solutions such as Performance Analysis and Knowledge Xpert. Do one of the following:
• Select a node and then an issue you are seeking a solution to (in one of the panes such as Monitor/Diagnose or Documentation). The appropriate Quest tool will open in the selected instance and context.
• Alternatively, you can select Performance Analysis in the Tools pane (or the Recent pane if Foglight Performance Analysis was previously run on your machine).
Note Installation of both the client and the Agent components must be completed before Foglight Performance Analysis can be used. As a prerequisite to successfully using Foglight Performance Analysis for DB2 LUW, ensure the monitored DB2 host is: Visible to the client (GUI) on the network Running and accessible through SQL*Net from the client
Managing Connections and Logging OnFoglight Performance Analysis for DB2 LUW maintains monitored DB2 instance specifics as logon profiles. The All Connections dialog can be used to create new
13Opening Foglight Performance Analysis for DB2 LUW
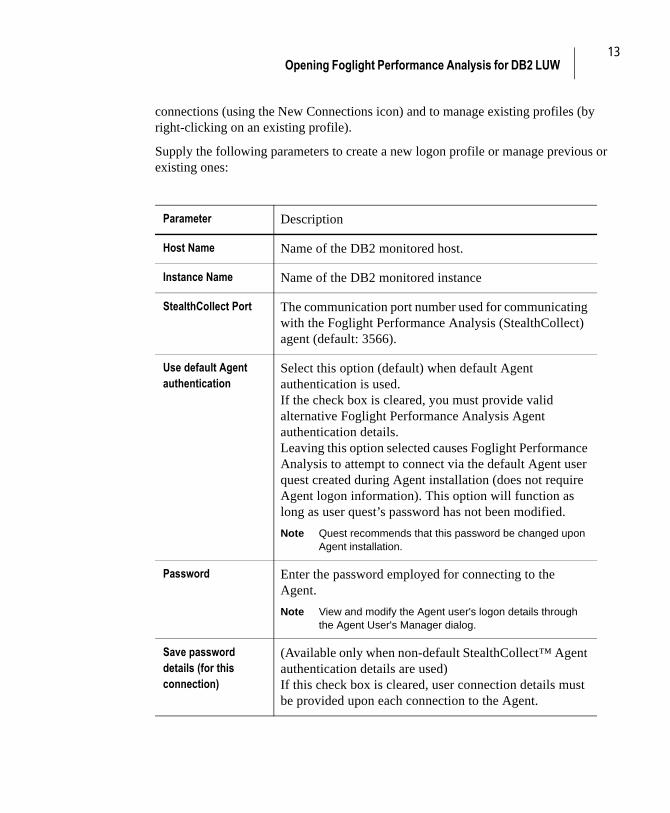
connections (using the New Connections icon) and to manage existing profiles (by right-clicking on an existing profile).
Supply the following parameters to create a new logon profile or manage previous or existing ones:
Parameter Description
Host Name Name of the DB2 monitored host.
Instance Name Name of the DB2 monitored instance
StealthCollect Port The communication port number used for communicating with the Foglight Performance Analysis (StealthCollect) agent (default: 3566).
Use default Agent authentication
Select this option (default) when default Agent authentication is used.If the check box is cleared, you must provide valid alternative Foglight Performance Analysis Agent authentication details.Leaving this option selected causes Foglight Performance Analysis to attempt to connect via the default Agent user quest created during Agent installation (does not require Agent logon information). This option will function as long as user quest’s password has not been modified.
Note Quest recommends that this password be changed upon Agent installation.
Password Enter the password employed for connecting to the Agent.
Note View and modify the Agent user's logon details through the Agent User's Manager dialog.
Save password details (for this connection)
(Available only when non-default StealthCollect™ Agent authentication details are used)If this check box is cleared, user connection details must be provided upon each connection to the Agent.

14 Foglight Performance Analysis for DB2 LUWUser Guide
OptionsClick Tools > Options to display the connection configuration options.
• The Always prompt for Username and Password check box requires users to enter the appropriate username and password each time the client connects to the specified DB2 instance. To allow users to bypass this step, clear this box.
• The Save password default check box sets the StealthCollect™ Agent's logon password to the default value and allows users to monitor the specified DB2 instance without specifying a username and password.
• The Connection Profile Directory field allows users to specify an alternate to the default directory for the Profile.xml files, which define the collection configuration parameters; the default profile directory is:
C:\Documents and Settings\All Users\Application Data\Quest Software\Shared\Profiles\<Instance>
Further InformationThis help system tells you what you how to use the Foglight Performance Analysis for DB2 LUW.
Quest Support is available to customers who have a trial version of a Quest product or who have purchased a commercial version and have a valid maintenance contract. Quest Support provides around the clock coverage with SupportLink, our web self-service. Visit SupportLink at http://support.quest.com
From SupportLink, you can do the following:
• Quickly find thousands of solutions (Knowledgebase articles/documents).
• Download patches and upgrades.
• Seek help from a Support engineer.
• Log and update your case, and check its status.
Console - Common Elements 15Activity Timeline
Console - Common Elements
The Foglight Performance Analysis for DB2 LUW two-pane display features a tree-node drilldown in the left-pane determining the display in the right-pane. The Foglight Performance Analysis window contains some or all the following visual elements:
• “Activity Timeline” on page 15
• “Instance View” on page 16
• “Action Menu” on page 16
• “Metric Totaling” on page 20
• “Overview Tab” on page 22
• “Resource Breakdown” on page 23
• “Time” on page 24
• “Toolbar” on page 25
• “Display Features” on page 27
• “Dimension Filtering” on page 28
Related Topics
“The Console” on page 8
Activity TimelineThe activity timeline is the principal display of DB2 activity over a specific time period. Its vertical calibration is based on an average of recorded baseline peaks of observed behavior. The dynamic representation displays the resource consumption in:
• a Resource View layered manner such that bottleneck occurrences can be readily identified as to their underlying wait event category causes and isolated for analysis. For more information, see “Wait Event Categories” on page 177.
or
• a Baseline Range View manner against the upper and lower boundaries of the Performance Baseline range statistical deviation.

16 Foglight Performance Analysis for DB2 LUWUser Guide
It is the principal Foglight Performance Analysis for DB2 LUW tool for monitoring DB2 instance activity, both current and historical. Use this view to look for trends in your database activity, to identify resource consumption, to trace activity, and to review previous activity.
Related Topics
“Time Navigation” on page 60
“Understanding Activity Significance” on page 69
“Dimension Navigation” on page 58
Instance ViewThe instance view is the default drilldown means of monitoring the entire real-time DB2 instance activity. The window offers both a ready and revealing overview and the ability to focus on critical resource usage as reflected in key metric values. Use the instance view to identify trends, bottlenecks, and anomalous resource usage.
The Foglight Performance Analysis instance view is a multi-faceted snapshot of DB2 activity. The Activity Timeline Drilldown and Resource Breakdown are the initial visual insights into system performance.
Action MenuThe following table lists the commands on the Action menu and their uses. (The commands displayed are determined by context and cursor focus.)
Command Use
Open in New Window Open the New Window creation dialog wizard.
Refresh View List Refreshes the Business Views node for both this client and for system-wide changes.

Console - Common Elements 17Action Menu
New Shortcut Create the mechanism to analyze the performance and resource consumption of specific dimensions of interest (over differing domains and filters across different time periods and granularity), both episodic and non-episodic. For details, see “Shortcuts” on page 81.
New User Defined Collection
Create the mechanism by which DB2 resource consumption can be analyzed over selected domains and filters across different time periods. For more information, see “User Defined Collections (UDCs)” on page 83.
Execute/Edit Display the Summary window of the in-focus report.
Report Open the Report Wizard dialog specification series. For more information, see “Reports and Templates” on page 103.
Schedule Opens the report scheduling properties dialog. For more information, see “Scheduling and Delivery” on page 100.
Remove Schedule Deletes the specific report schedule currently active.
Preview Generate window display of report.
Print Print the in-focus saved report.
Rename Rename an existing customized template or history view.
Delete Delete an existing customized template or history view.
Command Use

18 Foglight Performance Analysis for DB2 LUWUser Guide
Compare An analytic baseline feature that facilitates graphical resource comparison by dimensions between two historical time frames on a relative or absolute basis. Each item activity is broken down into its components and compared with the second time frame. For more information, see “Compare” on page 93.
Save Shortcut Record the specified customized history view to be archived and retrievable.
Roll Up When the History instance view is at a dimension node depth level of four or greater, this function shifts the focus to the top level of this dimension. For more information, see “Dimension Navigation” on page 58.
Show Top 25 Only Limit the display to the 25 most resource-demanding domains (occurrences) of a specific dimension.
View SQL Display the statement syntax in [Quest] SQL View.
Tune SQL Open the SQL statement for SQL tuning (if installed).
Explain Plan History Compare any two forms of execution plan used historically by DB2 for executing a given SQL statement.
Scalability Test Send groups of SQL statement directly to Benchmark Factory (if installed) to create and execute scalability tests for an automated load testing solution.
Copy SQL to Clipboard Make the SQL text available for pasting into a Windows application.
Multi-line SQL Text Expands the SQL display to a multi-line presentation so that the entire SQL is visible.
Summarize SQL Text Shortens the SQL statements by replacing long SELECT and FROM clauses with '...'
Kill Session Launches TOAD to terminate a DB2 reuse session.
Command Use
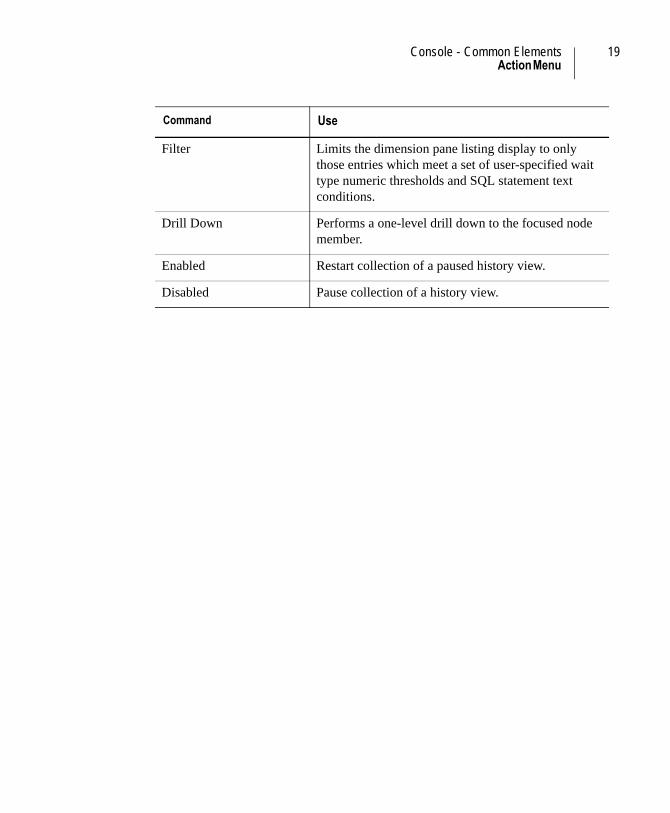
Console - Common Elements 19Action Menu
Filter Limits the dimension pane listing display to only those entries which meet a set of user-specified wait type numeric thresholds and SQL statement text conditions.
Drill Down Performs a one-level drill down to the focused node member.
Enabled Restart collection of a paused history view.
Disabled Pause collection of a history view.
Command Use
20 Foglight Performance Analysis for DB2 LUWUser Guide
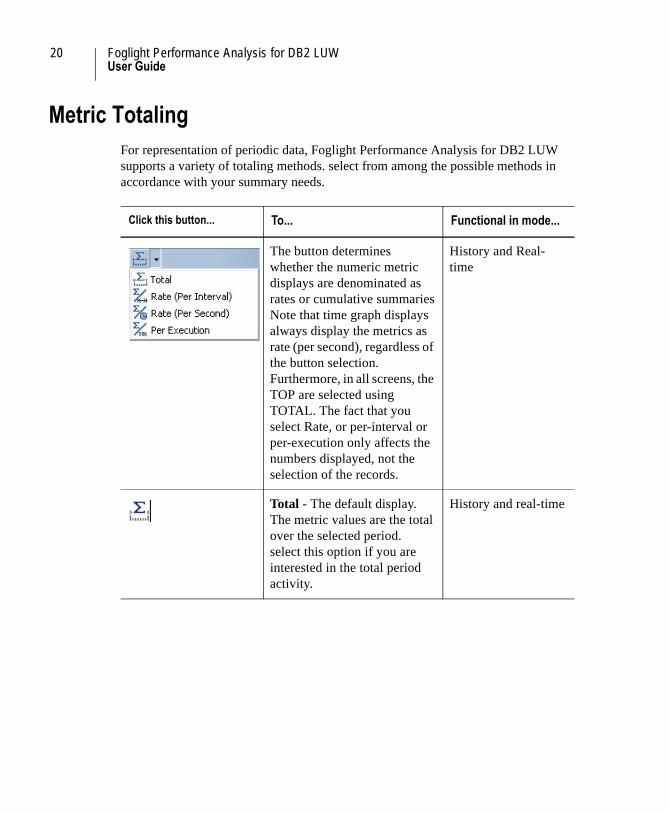
Metric TotalingFor representation of periodic data, Foglight Performance Analysis for DB2 LUW supports a variety of totaling methods. select from among the possible methods in accordance with your summary needs.
Click this button... To... Functional in mode...
The button determines whether the numeric metric displays are denominated as rates or cumulative summariesNote that time graph displays always display the metrics as rate (per second), regardless of the button selection. Furthermore, in all screens, the TOP are selected using TOTAL. The fact that you select Rate, or per-interval or per-execution only affects the numbers displayed, not the selection of the records.
History and Real-time
Total - The default display. The metric values are the total over the selected period.select this option if you are interested in the total period activity.
History and real-time
Console - Common Elements 21Metric Totaling
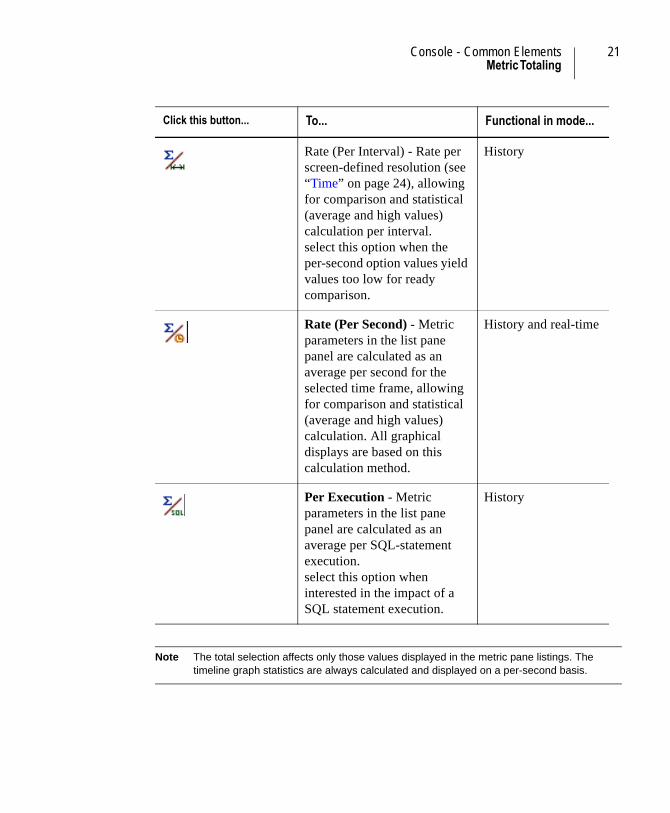
Note The total selection affects only those values displayed in the metric pane listings. The timeline graph statistics are always calculated and displayed on a per-second basis.
Rate (Per Interval) - Rate per screen-defined resolution (see “Time” on page 24), allowing for comparison and statistical (average and high values) calculation per interval.select this option when the per-second option values yield values too low for ready comparison.
History
Rate (Per Second) - Metric parameters in the list pane panel are calculated as anaverage per second for the selected time frame, allowing for comparison and statistical (average and high values) calculation. All graphical displays are based on this calculation method.
History and real-time
Per Execution - Metric parameters in the list pane panel are calculated as an average per SQL-statement execution. select this option when interested in the impact of a SQL statement execution.
History
Click this button... To... Functional in mode...
22 Foglight Performance Analysis for DB2 LUWUser Guide
Overview TabThe Overview tab and mechanism is the primary tool for initial understanding of the system resource use patterns that you see in the activity timeline graph. The tool lets you view the performance-oriented metrics, time correlated with any activity drilldown. The timeline graphical representation and explanation displays respond to the choice of resource focus in the Resource/Metric list pane. ToolTip hints display any additional available information. The display is composed of the resource timeline and expert metrics (in accordance with the selected resource.
The overview tool is a unified view of the entire range of activity projections: full instance, specific session, and any historical activity drilldown (for example, User JOHN executing a program on machine ATLAS).
The pane list metrics displayed in the screen's lower third are determined by the chosen Resource. The Resource chosen displays those metrics that have the greatest relevance and impact on that resource as it may affect throughput and response time. In turn, the chosen metric determines the text displayed in the middle third right side. For those metrics that can be represented as a percentage of a total, a horizontal bar presentation presents both its internal component portions (for example, in the DB2/System CPU Usage, CPU consumption is composed of the instance background and foreground CPU and CPU used by all other processes) and their total.
The overview representation and values are determined by:
• Dimension Navigation parameters
• Metric Totaling—for ease of use and comparability, differing totaling methods can be applied. Note that for methods that entail both averages and totals, the horizontal bar presentation and ToolTip display reflect the column in focus. select from among the possible methods in accordance with your summary needs:
• Period Total (default) metric aggregation within one column for the entire time range
• Rate (Per Interval) summarizes the data for averages and totals with periods defined by the Data Interval
• Rate (Per Second)
• Per Execution of SQL statements
Note For methods that entail both averages and totals, the horizontal bar presentation and ToolTip display reflect the column in focus.
Console - Common Elements 23Resource Breakdown
Resource BreakdownThe Resource Breakdown pie chart and drill-down dialog pane listing display the relative DB2 wait event usage over the accompanying displayed activity timeline. In this manner, you get an overall period measurement of resource usage, abstracting from peak and null periods.
When you drill down into the resource breakdown pie chart, the focus and display are dependant on your access path.
• Clicking on Wait Events... displays the dialog in accordance with the default Resource selection.
• Clicking on a specific slice of the total pie chart (or double-clicking on a resource event category within the entire pane-listed Workload) opens the dialog focused on the chosen resource category.

24 Foglight Performance Analysis for DB2 LUWUser Guide
Figure 2
In either case, specific or other resources can be chosen through the Resource drop-down listing from within the Wait Events... dialog. The two data columns are defined as follows:
• Percent of Total - The portion of the entire wait event activity (as a percentage of the entire activity)
• Duration - Depending on the totaling method in effect, this value represents the time (in seconds) consumed by this event per time unit specified.
TimeActivity in Foglight Performance Analysis historical inquiry is recorded and reported in specific units of time. This mechanism facilitates the focus on data by frames (ranges). Time ranges consist of aggregated Data Intervals. Select and specify time ranges from values in the drop-down listing.

Console - Common Elements 25Resource
Related Topics
Real-time: see “Time” on page 24
History: see “Time Navigation” on page 60
ResourceResource usage is the processing activity measured through the total Wait Event Categories and denominated in time duration and percentage of the total. All displayed metrics are a reflection of the chosen resource.
ToolbarThe Foglight Performance Analysis for DB2 LUW toolbar is located at the top of the main window. The toolbar provides you with quick access to commonly used commands and functions. Click a button on the toolbar to carry out the command. If a button appears dimmed, it is unavailable. To see a description of each button, rest your mouse pointer over the button. Information about the button is displayed in a ToolTip.
The following are common Foglight Performance Analysis for DB2 LUW buttons.
Click this button... To... Functional in mode...
Return to the last view you browsed. (Alt + Left).
History
Advance to the next view. This command is only available if you are browsing a previous view. (Alt + Right).
History
26 Foglight Performance Analysis for DB2 LUWUser Guide
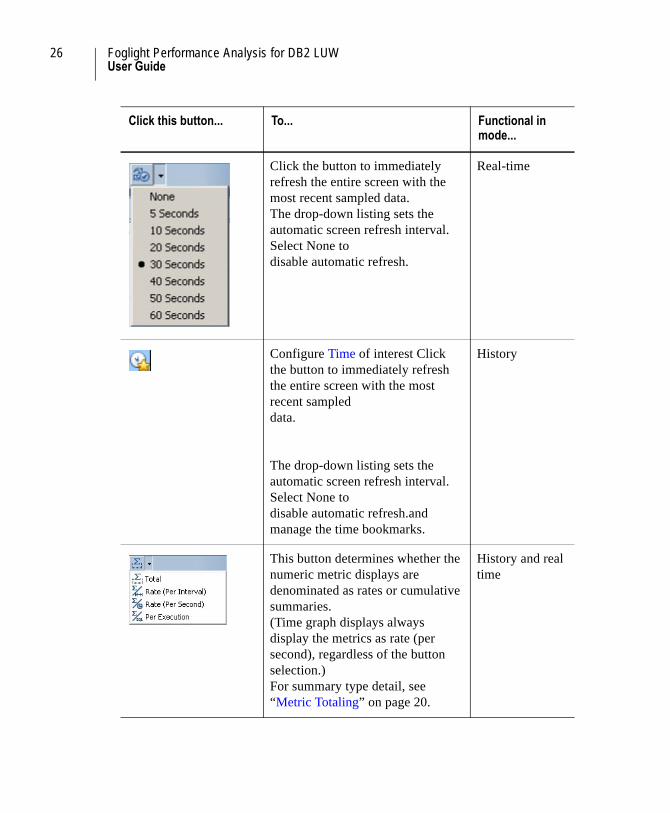
Click the button to immediately refresh the entire screen with the most recent sampled data.The drop-down listing sets the automatic screen refresh interval. Select None todisable automatic refresh.
Real-time
Configure Time of interest Click the button to immediately refresh the entire screen with the most recent sampleddata.
The drop-down listing sets the automatic screen refresh interval. Select None todisable automatic refresh.and manage the time bookmarks.
History
This button determines whether the numeric metric displays are denominated as rates or cumulative summaries.(Time graph displays always display the metrics as rate (per second), regardless of the button selection.)For summary type detail, see “Metric Totaling” on page 20.
History and real time
Click this button... To... Functional in mode...
Console - Common Elements 27Display Features
Display Features
Unit DisplayDisplay the denomination unit of each columnar display of metrics and wait states (except in the Overview Tab) by resting the cursor on the title bar. Units are dependent on the current Metric Totaling method.
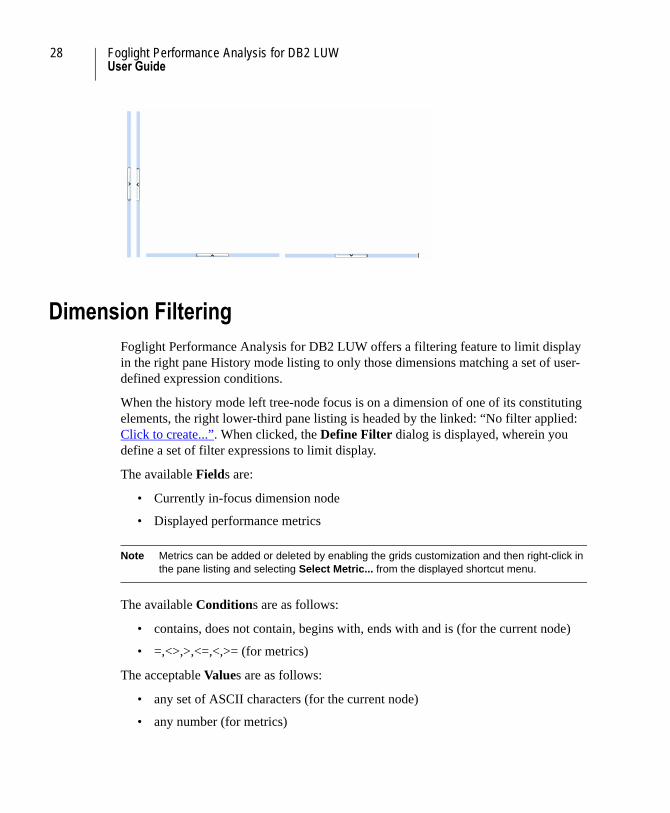
Splitter/CloserDisplay or hide graphic elements and legends by clicking the vertical or horizontal split/close buttons:
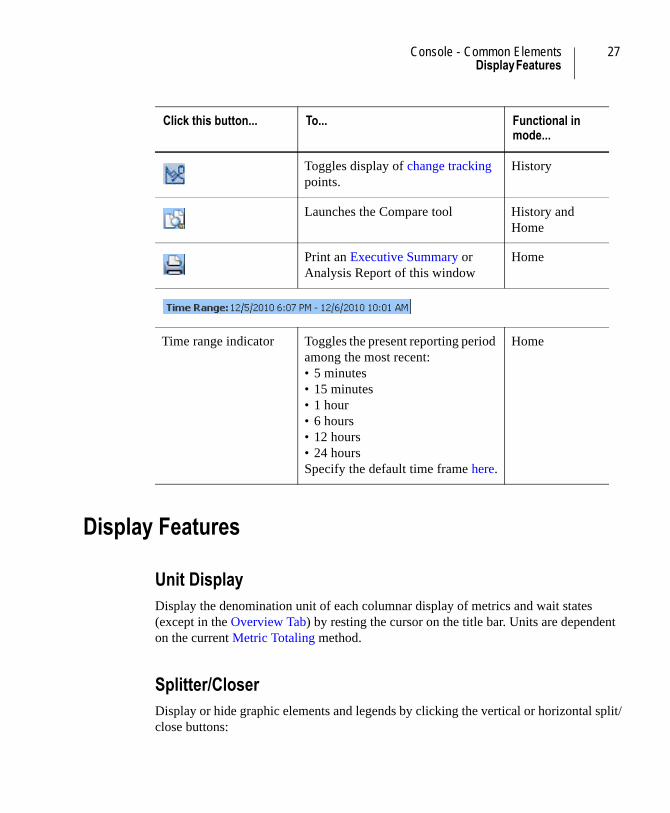
Toggles display of change tracking points.
History
Launches the Compare tool History and Home
Print an Executive Summary or Analysis Report of this window
Home
Time range indicator Toggles the present reporting period among the most recent:• 5 minutes• 15 minutes• 1 hour• 6 hours• 12 hours• 24 hoursSpecify the default time frame here.
Home
Click this button... To... Functional in mode...
28 Foglight Performance Analysis for DB2 LUWUser Guide
Dimension FilteringFoglight Performance Analysis for DB2 LUW offers a filtering feature to limit display in the right pane History mode listing to only those dimensions matching a set of user-defined expression conditions.
When the history mode left tree-node focus is on a dimension of one of its constituting elements, the right lower-third pane listing is headed by the linked: “No filter applied: Click to create...”. When clicked, the Define Filter dialog is displayed, wherein you define a set of filter expressions to limit display.
The available Fields are:
• Currently in-focus dimension node
• Displayed performance metrics
Note Metrics can be added or deleted by enabling the grids customization and then right-click in the pane listing and selecting Select Metric... from the displayed shortcut menu.
The available Conditions are as follows:
• contains, does not contain, begins with, ends with and is (for the current node)
• =,<>,>,<=,<,>= (for metrics)
The acceptable Values are as follows:
• any set of ASCII characters (for the current node)
• any number (for metrics)
2
Home Page
The Foglight Performance Analysis for DB2 LUW Home Page offers at-a-glance monitoring of primary system health measurement, and provides the starting point for drilldown analysis in one easy to understand digital dashboard. This view offers applied knowledge base toolsets to facilitate optimal user monitoring and tuning efforts. Users' attentions are intuitively focused on those instance and system aspects most in need of attention.
Modes and Views
The top toolbar accessed various Modes and Views. For more information, see “The Console” on page 8..
Context-sensitive Icons
A secondary toolbar contains context-sensitive operations as described in the following table.
Icon Description
Opens a Report Generation wizard. View each option:• Executive Workload Summary• Database Overview Summary
30 Foglight Performance Analysis for DB2 LUWUser Guide
Time Range Selection
This link on the far right of the second toolbar selects the time range to be to displaying data in the Home mode. Click this link to view the display options. The default time range viewed can be changed in the Home Configuration Tab.
• Last 5 minutes
• Last 15 minutes
• Last Hour
• Last 6 Hours
• Last 12 Hours
• Last 24 Hours
<Instance> Performance Tab
The upper area's two components display overall activity:
• The Workload bar graph displays the total current instance activity relative to a peak periods and is t a measure of instance resource capacity. Use this bar graph to assess overall database health from the relative value within the Baseline Range, relative to the total workload experienced, and by analyzing any observed performance, indicated by color alerts.
• The Instance Workload timeline representation (in either the Baseline or Workload views) displays instance activity over the most recent time period. Use this timeline to identify the specific period of time when notable behavior occurred, either through the occurrence of specific wait events or by reviewing instance activity relative to the baseline.
The lower area's two components display individual dimension period bar graph measurements:
Opens the Performance Analysis Compare dialog to compare virtually any information available in Foglight Performance Analysis for DB2 LUW (such as points in time or selected dimensional breakdowns) to determine whether performance deviations are isolated or chronic. The results of the Compare procedure can then be printed on the spot.
Icon Description
31
• The Resource Breakdown gauge helps users understand recent workload activity by measuring and evaluating resource consumption based on the performance baseline and individual resource thresholds. This gauge also displays the following related metrics. For more details click on their names below.
Note No resource alarm is generated when the instance or the specified database is experiencing a minimal load on resources. During periods of low activity the following message appears below the Database Resource Breakdown.Minimal load - no resource alarm will be generated.
• The System Utilization CPU, Memory and Disk capacity usage indicators. Use this display of actual resource utilization to understand your system's throughput as a percentage of the actual total available (capacity) through absolute, baseline and anomaly readings.
For more information, see “Instance Performance Tab” on page 32.
Database Performance Tab
The Databases Performance tab displays performance information for individual databases in the monitored instance.
This tab includes:
• Database Summary list (left pane) with overall statistics on databases within the instance
• Database Performance graph (upper right) displaying DB2 instance activity (system workload) over the specified recent time frame, measured by the average number of active sessions. You can toggle between the Performance Baseline and resources views to gain a better understanding of database activity trends and levels, and of resource consumption.
• Database Performance Resource Breakdown gauge (lower right) helps users understand recent database workloads by measuring and evaluating specific database's resource consumption relative to the instance, the performance baseline and individual resource thresholds.
32 Foglight Performance Analysis for DB2 LUWUser Guide
This gauge also displays the following related metrics. For more details click on their names below.
Note No resource alarm is generated when the selected database is experiencing a minimal load on resources. During periods of low activity the following message appears below the DB2 Resource Breakdown: Minimal load - no resource alarm will be generated.
For more information, see “Databases Performance Tab” on page 36.
Status Indicators
Status indicators appear on the bottom of the page indicating:
• Activity Baselines availability - if enabled in Foglight Performance Analysis Configuration - Baseline tab.
• Monitor Switches ON/OFF status - if enabled in Foglight Performance Analysis Configuration - Home Configuration Tab.
Related Topics
“Instance Performance Tab” on page 32
“Databases Performance Tab” on page 36
“Memory Heap Details Dialog” on page 38
“Real-Time Mode” on page 43
“History Mode” on page 57
Instance Performance TabThe <Instance> Performance tab is the Home mode default view and displays overall performance information for the monitored instance.
Prioritized performance alerts, current and Performance Baseline normalized system resource utilization, are presented side-by-side in a clean, intuitive format. Common graphical elements provide a consistent and intuitive representation of performance deviation and degradation in both relative and absolute terms.
This tab is a real-time monitoring, alerting and tuning digital dashboard. Use it as a reference point and springboard to identify and address which outstanding issues the instance currently faces. Because of its rich analysis and alerting features, this tab

33Instance Performance Tab
immediately pinpoints any resource contention or capacity limitations in need of immediate attention. By increasing real-time service delivery, problem-solving time is greatly reduced.
The user-friendly context-sensitive display and navigation tools give a complete performance report for the specified time frame—the time frame can be configured to show any time frame from the last 5 minutes to the last 24 hours. Each indicator relates to the entire specified time frame. This information can be seamlessly incorporated into each user’s work flow and methodology.
Measuring System HealthThis tab provides the following gauges and graphs to monitor performance.
Note This measurement is intended to provide an at-a-glance understanding of instance behavior relative to an observed norm and not a measurement of system capacity.
Current activity can easily be determined to be typical, or relatively high or low by comparing it to the baseline range. The clickable color coded alerting feature both details workload metrics and serves as a launch point for further investigation of database behavior.
Workload GaugeThe Workload gauge is a measurement of total instance activity; the gauge level indicates the proximity of instance activity to that of peak activity. Use it to compare the total session activity during the specified time frame with that during peak periods.
This gauge also displays the following related metrics. For more details click on their names below:
• Session Logons
• Instance Availability
Instance Workload GraphThis graph displays performance data of the Average Active Sessions, which are the average number of database sessions executing during the specified time frame
34 Foglight Performance Analysis for DB2 LUWUser Guide
The Instance Workload activity timeline displays DB2 instance activity (system workload) over the specified recent time frame, measured by the average number of active sessions. You may toggle between Performance Baseline and resources views to gain a better understanding of database activity trends and levels, and of resource consumption.
Click on the Legend to display a list of relevant metrics. Click on the individual metric to display the definition of the relevant metric.
DB2 LUW Performance Resource Breakdown GaugeResource Breakdown displays both the numeric and analogous resource distribution as a percentage of workload activity (displaying the same data as the Real-time Resource Breakdown pie chart). Use the baseline comparison feature to display resource metric usage details and to launch further investigations. Understand the composition of the present instance activity at-a-glance, and determine specifically which, if any, resource is creating a problem based both on the normative baseline and accepted industry standards.
This gauge also displays the following related wait events. For more details click on their names below.
• CPU Usage Wait
• CPU Wait
• I/O Wait
• Transaction
• Lock Wait
• Remote Wait
• Performance Baseline
• UOW Execution
• UOW Queued
• Admin
• Other Wait
35Instance Performance Tab
Minimal Load
No resource alarm is generated when the instance is experiencing a minimal load on resources. During periods of low activity the following message appears below the DB2 Resource Breakdown:
Minimal load - no resource alarm will be generated.
System Utilization GaugesThese gauges display system and host parameter resource itemization. As with Resource Breakdown, both the baseline comparison flags display resource metric usage details and serve as launch points for further investigation. High system utilization values do indicate full capacity has been reached.
CPU (%)
This gauge also displays the following related metrics. For more details click on their names below.
• CPU Usage (Seconds)
• Run Queue Length (Processes/Threads)
Memory (%)
This gauge also displays the following related metrics. For more details click on their names below.
• Paging/Second (Page Operations)
• Cache Hit Ratio (%cache hits)
Disk (% Busy)
This gauge also displays the following related metrics. For more details click on their names below.
• Disk Queue Length (I/O Requests)
• Sort Overflows
Status IndicatorsStatus indicators appear on the bottom of the page indicating:
36 Foglight Performance Analysis for DB2 LUWUser Guide
• Activity Baselines availability - if enabled in Foglight Performance Analysis Configuration - Baseline tab.
• Monitor Switches ON/OFF status - if enabled in Foglight Performance Analysis Configuration - Home Configuration Tab.
Related Topics
“Databases Performance Tab” on page 36
“Home Page” on page 29
Databases Performance TabThe Databases Performance tab displays performance information for individual databases in the monitored instance.
This tab includes the panes described in the following topics:
Database Summary List (left pane)
Database Performance Graph (upper right)
DB2 LUW Performance Resource Breakdown Gauge (lower right)
Memory (%)
Status Indicators
Database Summary List (left pane)Displays individual databases within the monitored instance and their overall resource consumption statistics. For more details click on their names below.
Select a database from the list in this pane to display a breakdown performance statistics in the right pane (see below).
Database Performance Graph (upper right)The Database Performance activity timeline displays DB2 instance activity (system workload) over the specified recent time frame, measured by the average number of active sessions. You can toggle between Performance Baseline the and resources views

37Databases Performance Tab
(see “Wait Event Categories” on page 177) to gain a better understanding of database activity trends and levels, and of resource consumption.
DB2 LUW Performance Resource Breakdown Gauge (lower right)Resource Breakdown displays both the numeric and analogous resource distribution as a percentage of workload activity (displaying the same data as the Real-Time Resource Breakdown pie chart). Use the baseline comparison feature (like the Workload) to display resource metric usage details and to launch further investigations. Understand the composition of the present database activity at-a-glance, and determine specifically which, if any, resource is creating a problem based both on the normative baseline and accepted industry standards.
This gauge also displays the following related metrics. For more details click on their names below.
• CPU Usage Wait
• CPU Wait
• I/O Wait
• Transaction
• Lock Wait
• Remote Wait
• Performance Baseline
• UOW Execution
• UOW Queued
• Admin
• Other Wait
Minimal Load
No resource alarm is generated when the selected database is experiencing a minimal load on resources. During periods of low activity the following message appears below the DB2 Resource Breakdown:
Minimal load - no resource alarm will be generated.
38 Foglight Performance Analysis for DB2 LUWUser Guide
Memory (%)This gauge displays memory resource consumption.
Click More Details to open a dialog which displays information on Memory Heap metrics affecting memory resources. For more information, see “Memory Heap Details Dialog” on page 38.
Status IndicatorsStatus indicators appear on the bottom of the page indicating:
• Activity Baselines availability - if enabled in Foglight Performance Analysis Configuration - Baseline tab.
• Monitor Switches ON/OFF status - if enabled in Foglight Performance Analysis Configuration - Home Configuration Tab.
Related Topics
“Instance Performance Tab” on page 32
“Home Page” on page 29
“Memory Heap Details Dialog” on page 38
Memory Heap Details DialogThis dialog displays information on the following Memory Heap metrics affecting memory resources during the selected time range.
• Buffer Pool Heap Size
• Catalog Cache Heap Size
• Database Heap Size
• Lock Manager Heap Size
• Package Cache Heap Size
• Shared Sort Heap Size
• Utility Heap Size
Click the appropriate column header to sort the list according to:
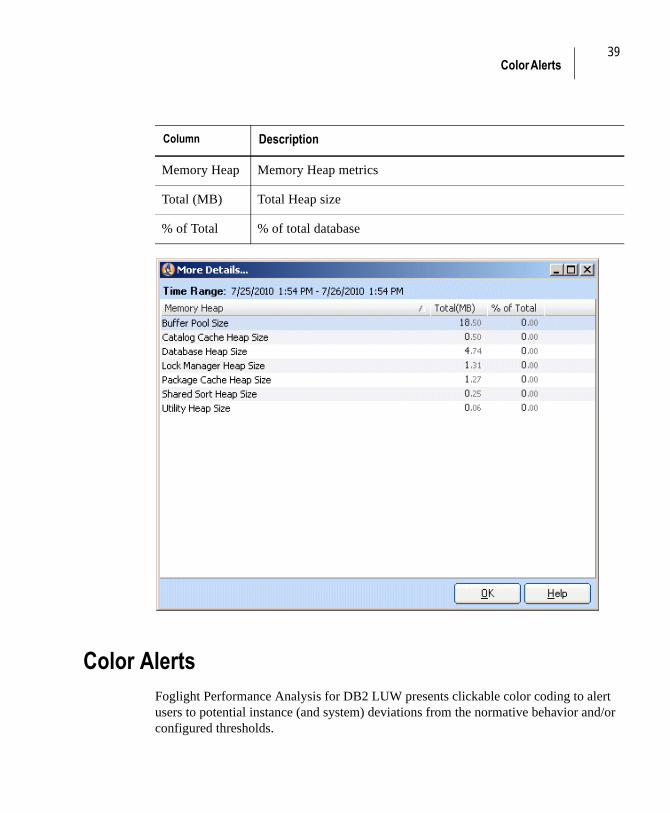
39Color Alerts
Figure 1
Color AlertsFoglight Performance Analysis for DB2 LUW presents clickable color coding to alert users to potential instance (and system) deviations from the normative behavior and/or configured thresholds.
Column Description
Memory Heap Memory Heap metrics
Total (MB) Total Heap size
% of Total % of total database
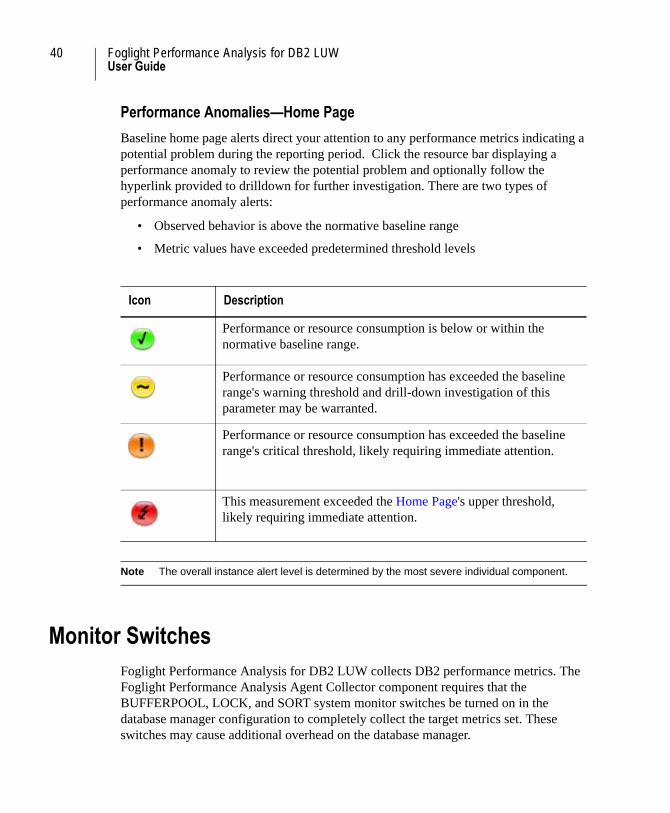
40 Foglight Performance Analysis for DB2 LUWUser Guide
Performance Anomalies—Home Page
Baseline home page alerts direct your attention to any performance metrics indicating a potential problem during the reporting period. Click the resource bar displaying a performance anomaly to review the potential problem and optionally follow the hyperlink provided to drilldown for further investigation. There are two types of performance anomaly alerts:
• Observed behavior is above the normative baseline range
• Metric values have exceeded predetermined threshold levels
Note The overall instance alert level is determined by the most severe individual component.
Monitor SwitchesFoglight Performance Analysis for DB2 LUW collects DB2 performance metrics. The Foglight Performance Analysis Agent Collector component requires that the BUFFERPOOL, LOCK, and SORT system monitor switches be turned on in the database manager configuration to completely collect the target metrics set. These switches may cause additional overhead on the database manager.
Icon Description
Performance or resource consumption is below or within the normative baseline range.
Performance or resource consumption has exceeded the baseline range's warning threshold and drill-down investigation of this parameter may be warranted.
Performance or resource consumption has exceeded the baseline range's critical threshold, likely requiring immediate attention.
This measurement exceeded the Home Page's upper threshold, likely requiring immediate attention.
41Monitor Switches
The relevant monitor switches can be turned on or off by updating the database manager configuration.
For additional information, search for System Monitor Switches on IBM's DB2 InfoCenter website, or review the information in the DB2 System Monitor Guide and Reference Redbook.

42 Foglight Performance Analysis for DB2 LUWUser Guide
3
Real-Time Mode
The real-time mode is the Foglight Performance Analysis for DB2 LUW tool for real-time and recent (up to the last 60 minutes) monitoring of both instance and session activity. Use this tool to trace session activities down to the statement resolution. You can identify excessive resource consuming sessions and determine which SQL statements caused this excessive consumption. Powered by the StealthCollect™ technology, this tool offers resource-light real-time monitoring in a friendly graphical interface.
The customizable Time and Resource specifications are a powerful and user-friendly mechanism for DBAs. For analysis of your DB2 system’s current performance, you can obtain instant drilldown and metric data for active sessions, Top Sessions and Current Sessions Node.
Foglight Performance Analysis Real-Time mode has two nodes:
• Real-time Instance View for rapid and comprehensive analysis of the current DB2 instance resource usage
• Current Sessions Node for real-time display and drilldown into all active sessions.
Report Time Range and IntervalsUse this screen to specify a time range and data interval for the report.
Time RangeSelect one of the following options.
44 Foglight Performance Analysis for DB2 LUWUser Guide
Predefined Time Range
The report will be generated for the selected period, with the following options:
• system default
• user-defined in the History page time selector
Specific Time Range
The report will be generated for the time range specified.
1 Specify a day and hour in the From range. Click Minimum to specify the earliest available time and date.
2 Specify a day and hour in the To range. Click Maximum to specify the earliest available time and date.
Data IntervalThe report is generated using selected data interval resolution. The options are based on the selected time range with the default being the optimum resolution for that range.
Related Procedures and Topics
“Running Comparisons” on page 95
“Generating a Report” on page 99
“Saving, Printing and Output of a Report” on page 100
“Scheduling and Delivery” on page 100
“Reports” on page 97
“Reports and Templates” on page 103
Metric Selection DialogThis dialog appears when right-clicking anywhere in the lower tabs of the Real-time or History pages. This feature is recommended for advanced users only and must be first enabled in the Foglight Performance Analysis Configuration - Support tab.
Select the metrics to be displayed using the arrow selection buttons or double-clicking on a specific metric. The lower pane of this dialog briefly describes the selected metric.
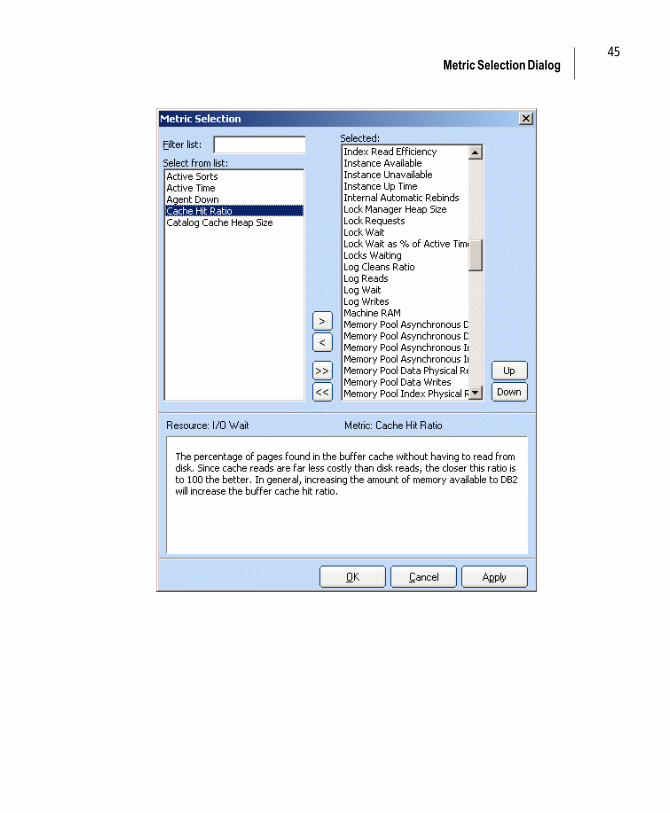
45Metric Selection Dialog
Figure 1
46 Foglight Performance Analysis for DB2 LUWUser Guide
Real-time Instance View
This window facilitates monitoring of current instance activity.
The graphs in the upper portion of the window display the entire instance activity (see “Activity Timeline” on page 15) layered by active wait states and a pie chart Resource Breakdown display.
Use the middle tabs to toggle between the Overview Tab and the Top Sessions Tab. When the selected resource is Lock, the Blocking Locks Tab is available.
Overview TabThe Overview tab and feature is the primary history and real-time tool for initial understanding of the system resource use patterns that you see in the Activity Timeline graph. The tool lets you view the performance-oriented metrics, time correlated with any activity drill-down. The middle pane timeline graphical representation and explanation displays respond to the choice of resource focus in the Resource/Metric list pane. ToolTip hints display any additional available information. The display is composed of the resource timeline and expert metrics (in accordance with the selected resource
The overview tab is a unified view of the entire range of activity projections: full instance, specific session, and any historical activity drill-down (for example, User JOHN executing a program on machine ATLAS).
The pane list metrics displayed in the window's lower third are determined by the chosen Resource. The Resource chosen displays those metrics that have the greatest relevance and impact on that resource as it may affect throughput and response time. In turn, the chosen metric determines the text displayed in the middle third right side. For those metrics that can be represented as a percentage of a total, a horizontal bar presentation presents both its internal component portions (for example, in the DB2/System CPU Usage metric, CPU consumption is composed of the instance background and foreground CPU and CPU used by all other processes) and their total.
The overview representation and values are determined by Metric Totaling. For ease of use and comparability, differing totaling methods can be applied. Select from among the possible methods in accordance with your summary needs:
Real-time Instance View 47Top Sessions Tab
• Period Total (default) metric aggregation within one column for the entire time range
• Rate (per second)
Note For methods that entail both averages and totals, the horizontal bar presentation and ToolTip display reflect the column in focus.
Top Sessions TabThe Top Sessions tab is a pane display that lists the top resource consuming sessions per time range. Both resource and time range can be specified. The sessions are sorted in a descending resource consuming order (according to the specified resource). Because the display includes all activity up to one hour ago, sessions that were active in this period but are no longer connected (dead), are also displayed.
The resources displayed include an initial general set and an additional listing of metrics specific to the chosen resource. The following table contains a description of the general columns displayed in the Top Sessions grid. If you enabled grid customization in the Configuration dialog | Support tab, you can display additional metrics by right-clicking and selecting Select Metric.
Column Description
Agent ID DB2 process ID number.
Partition # Node partition number.
Database The database where the session is running.
Logon Time The date and time when the user logged on to the session.
DB User The DB2 user used by the program to connect to the DB2 instance.
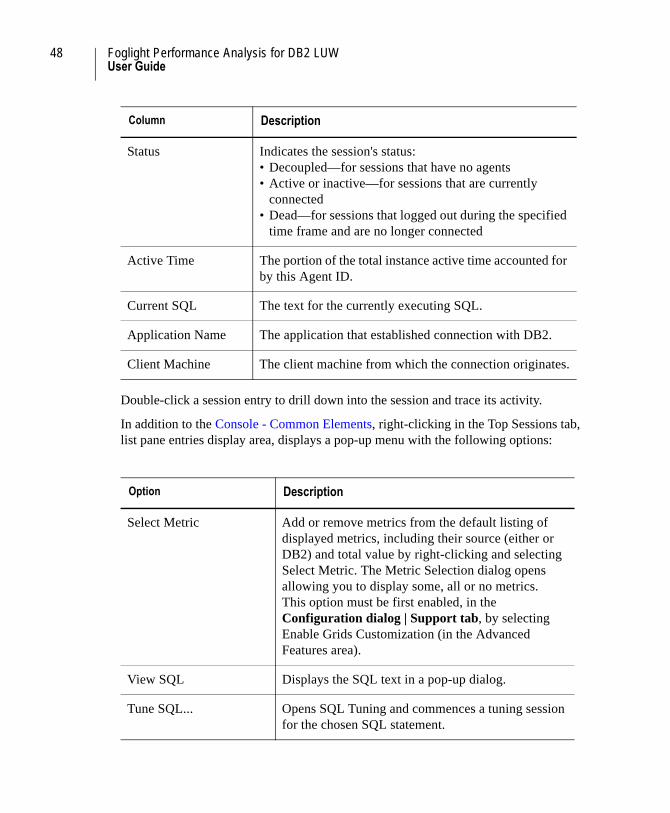
48 Foglight Performance Analysis for DB2 LUWUser Guide
Double-click a session entry to drill down into the session and trace its activity.
In addition to the Console - Common Elements, right-clicking in the Top Sessions tab, list pane entries display area, displays a pop-up menu with the following options:
Status Indicates the session's status:• Decoupled—for sessions that have no agents• Active or inactive—for sessions that are currently
connected• Dead—for sessions that logged out during the specified
time frame and are no longer connected
Active Time The portion of the total instance active time accounted for by this Agent ID.
Current SQL The text for the currently executing SQL.
Application Name The application that established connection with DB2.
Client Machine The client machine from which the connection originates.
Option Description
Select Metric Add or remove metrics from the default listing of displayed metrics, including their source (either or DB2) and total value by right-clicking and selecting Select Metric. The Metric Selection dialog opens allowing you to display some, all or no metrics.This option must be first enabled, in the Configuration dialog | Support tab, by selecting Enable Grids Customization (in the Advanced Features area).
View SQL Displays the SQL text in a pop-up dialog.
Tune SQL... Opens SQL Tuning and commences a tuning session for the chosen SQL statement.
Column Description
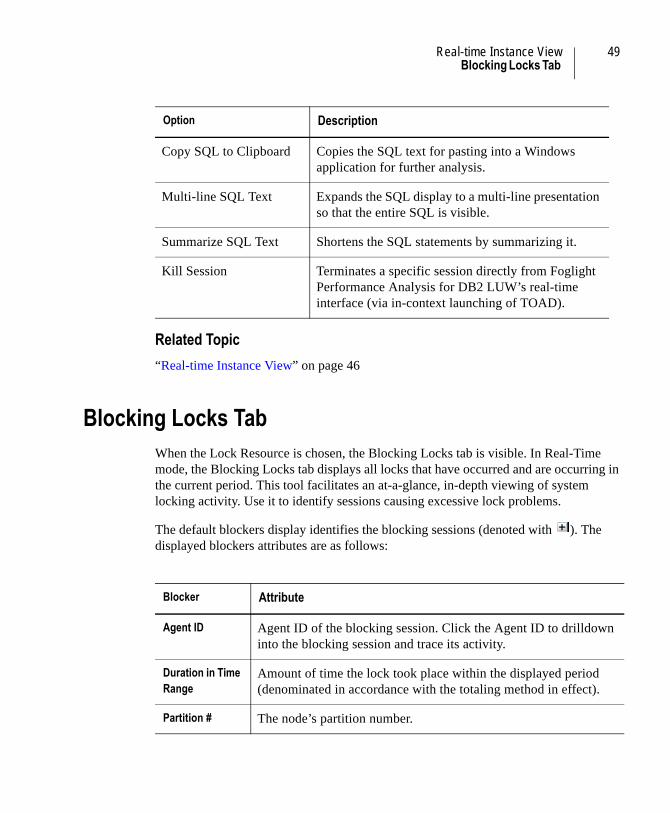
Real-time Instance View 49Blocking Locks Tab
Related Topic
“Real-time Instance View” on page 46
Blocking Locks TabWhen the Lock Resource is chosen, the Blocking Locks tab is visible. In Real-Time mode, the Blocking Locks tab displays all locks that have occurred and are occurring in the current period. This tool facilitates an at-a-glance, in-depth viewing of system locking activity. Use it to identify sessions causing excessive lock problems.
The default blockers display identifies the blocking sessions (denoted with ). The displayed blockers attributes are as follows:
Copy SQL to Clipboard Copies the SQL text for pasting into a Windows application for further analysis.
Multi-line SQL Text Expands the SQL display to a multi-line presentation so that the entire SQL is visible.
Summarize SQL Text Shortens the SQL statements by summarizing it.
Kill Session Terminates a specific session directly from Foglight Performance Analysis for DB2 LUW’s real-time interface (via in-context launching of TOAD).
Option Description
Blocker Attribute
Agent ID Agent ID of the blocking session. Click the Agent ID to drilldown into the blocking session and trace its activity.
Duration in Time Range
Amount of time the lock took place within the displayed period (denominated in accordance with the totaling method in effect).
Partition # The node’s partition number.
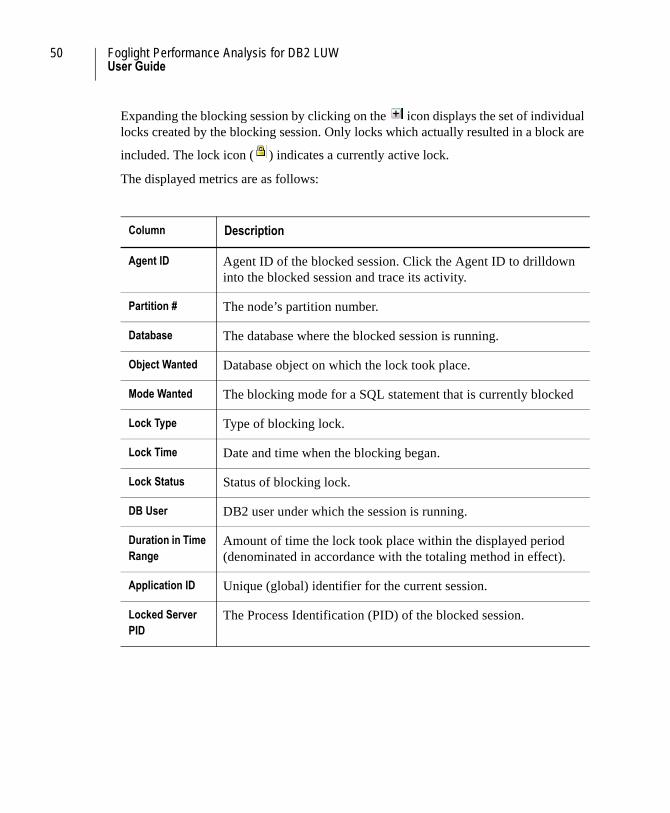
50 Foglight Performance Analysis for DB2 LUWUser Guide
Expanding the blocking session by clicking on the icon displays the set of individual locks created by the blocking session. Only locks which actually resulted in a block are
included. The lock icon ( ) indicates a currently active lock.
The displayed metrics are as follows:
Column Description
Agent ID Agent ID of the blocked session. Click the Agent ID to drilldown into the blocked session and trace its activity.
Partition # The node’s partition number.
Database The database where the blocked session is running.
Object Wanted Database object on which the lock took place.
Mode Wanted The blocking mode for a SQL statement that is currently blocked
Lock Type Type of blocking lock.
Lock Time Date and time when the blocking began.
Lock Status Status of blocking lock.
DB User DB2 user under which the session is running.
Duration in Time Range
Amount of time the lock took place within the displayed period (denominated in accordance with the totaling method in effect).
Application ID Unique (global) identifier for the current session.
Locked Server PID
The Process Identification (PID) of the blocked session.
Current Sessions Node 51Blocking Locks Tab
Current Sessions Node
The Real-Time mode Current Sessions node traces real-time instance and session activity sorted in accordance with chosen Resource and toolbar settings. The Time range selector is unavailable, as all displays are fixed on real-time presentation.
Current Instance Activity
The Activity Timeline dynamic representation displays the instance resource consumption in a layered manner, and the Resource Breakdown in pie-chart fashion, both, as of the last minute.
Activity Summary Panels
The following two panels are displayed/hidden by clicking on the / icon
The DB2 Sessions Summary panel displays a current reading of the number of existing DB2 sessions, and their grouping as to whether active or idle. Active sessions are further classified as to their current wait state usage. These readings indicate how your DB2 sessions are employing system resources. For details, see “Wait Event Categories” on page 177.
The System Resource Usage panel displays the CPU and Memory resources as follows:
• CPU - Total percentage of CPU being used, divided into the portion used by this DB2 instance and the portion used by all other activities.
• Memory - Server computer RAM, divided into the amount used by this DB2 instance, the amount used by all other activities and the remaining idle (Free) capacity.
Current Session Pane Listing
The list pane displays a current snapshot of all presently live sessions sorted in accordance with the resource selection.
Select individual current sessions ( - see “Individual Session Nodes” on page 53) for further analysis and display by double-clicking the session of interest. The selected session then joins the left node listing, where it remains until up-to-an-hour after the
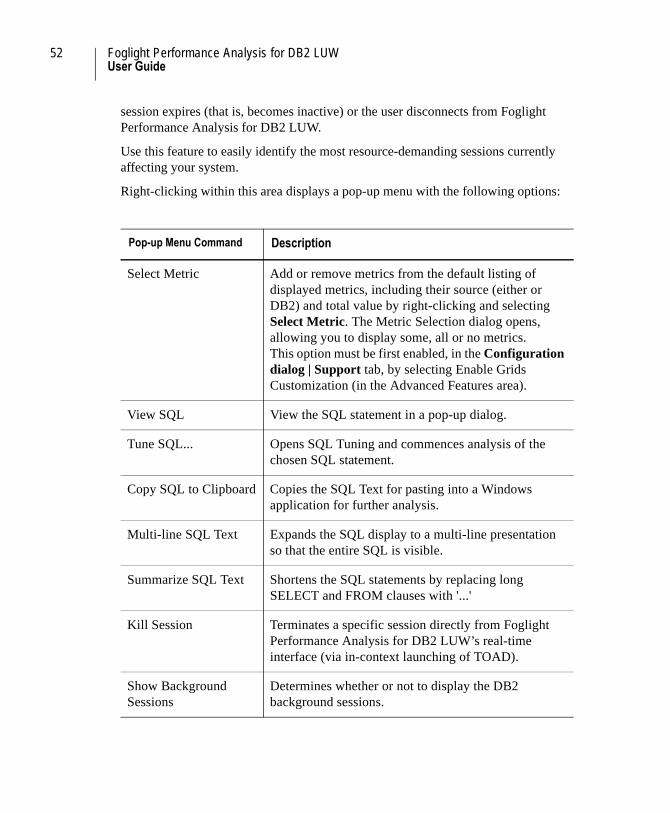
52 Foglight Performance Analysis for DB2 LUWUser Guide
session expires (that is, becomes inactive) or the user disconnects from Foglight Performance Analysis for DB2 LUW.
Use this feature to easily identify the most resource-demanding sessions currently affecting your system.
Right-clicking within this area displays a pop-up menu with the following options:
Pop-up Menu Command Description
Select Metric Add or remove metrics from the default listing of displayed metrics, including their source (either or DB2) and total value by right-clicking and selecting Select Metric. The Metric Selection dialog opens, allowing you to display some, all or no metrics.This option must be first enabled, in the Configuration dialog | Support tab, by selecting Enable Grids Customization (in the Advanced Features area).
View SQL View the SQL statement in a pop-up dialog.
Tune SQL... Opens SQL Tuning and commences analysis of the chosen SQL statement.
Copy SQL to Clipboard Copies the SQL Text for pasting into a Windows application for further analysis.
Multi-line SQL Text Expands the SQL display to a multi-line presentation so that the entire SQL is visible.
Summarize SQL Text Shortens the SQL statements by replacing long SELECT and FROM clauses with '...'
Kill Session Terminates a specific session directly from Foglight Performance Analysis for DB2 LUW’s real-time interface (via in-context launching of TOAD).
Show Background Sessions
Determines whether or not to display the DB2 background sessions.
Current Sessions Node 53Individual Session Nodes
Related Topic
“Real-time Instance View” on page 46
Individual Session NodesThis feature's purpose is to trace the activity of a currently running session and its resource consumption up to the last hour. On this screen, the Time Selector again becomes active. The Individual Session screen is divided into three panes.
Session Activity Timeline
The upper-third graphically display an Activity Timeline and Resource Breakdown pie chart for the chosen session.
Session Detail Panels
The following two panels are displayed/hidden by clicking on the / icon
The DB2 Session Details panel displays the DB2 session properties on a dynamic basis.
The “Waiting For” parameter is the actual wait event on which the session is presently waiting.
The System Process Details panel displays operating system attributes of the session's server process/thread.
Session Analysis Tools
The lower-third session tabs display facilitates focusing on specific session parameters:
• Session Overview tab—total DB2 resource usage and breakdown for the session in the activity timeline period with pane-listed metrics, corresponding to the selected time frame
• Running SQL tab—addresses the question “What is the current statement being executed by this session?”
• Traced SQL tab—addresses the question “What were the most recent statements executed by this session?” The display offers a trace of all the recently executed statements. Similar display to that of the Open Cursors, but includes statements that have also already completed. Each statement refers to a specific execution.
Use the Statement Level Tabs for additional statement analysis.
54 Foglight Performance Analysis for DB2 LUWUser Guide
• SQL Summary tab—addresses the question “What is the impact of a specific SQL on recent session activity?” Statements with identical SQL text are aggregated into a single entry. The SQL Executions value indicates the number of distinct executions of the specified syntax as reflected in each summary line. This feature is useful when a session is rapidly executing SQL statements (for example, within a loop) with different bind variables and you are interested in the entire impact of the SQL rather than a single execution.
Use the Statement Level Tabs for analyzing the SQL activity (the analysis tool will refer to the entire SQL grouping)
• Session Locks tab—listing of the locks (and their corresponding sessions) that are blocking ( or when expanded) or blocked by ( or without icon) this session during the course of its statement executions. An active lock that is currently blocking the session is indicated with an ( ) icon.
The second drop-down listing totals either for:
• Selected Time Range: The metric display reflects only the currently displayed time range activity.
• Since (session) Logon: Reflects the entire session activity from its logon time, regardless of the selected time range.
Related Topic
“Real-time Instance View” on page 46
Statement Level TabsThe following parameter sets describe statement-level properties:
• Activity tab—full statement syntax; The Resource Breakdown pie chart reflects all activity from its start to end or to the present if the statement is still active.
• Statistics tab—the drop down listing of cumulative statistics since the beginning of statement execution or to the present if the statement is still active. The columns show the metric and the relevant resource consumption.
• Blocking Locks tab—listing of the locks (and their corresponding sessions) that are blocking (or blocked) the statement during the course of its execution. An active lock that is currently blocking the statement is indicated with an ( ) icon.
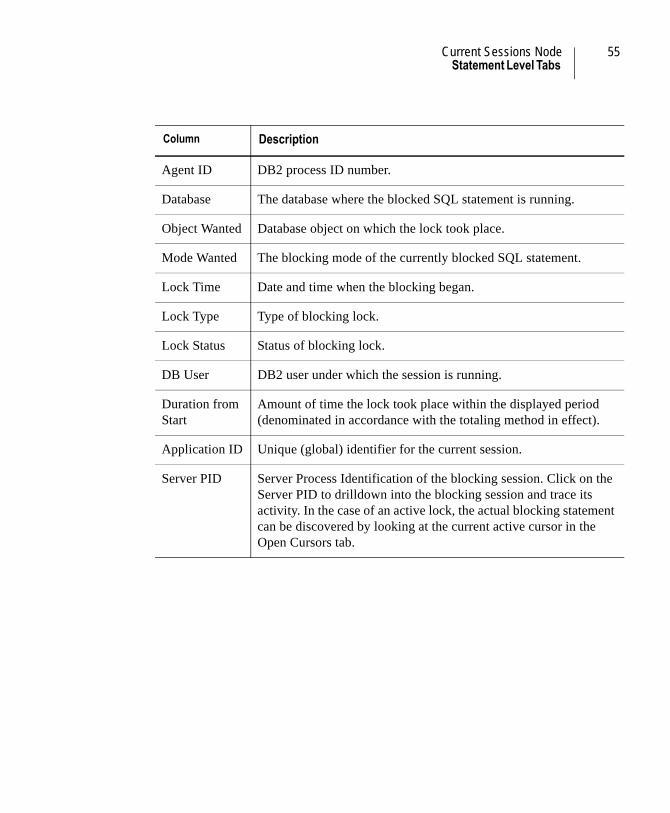
Current Sessions Node 55Statement Level Tabs
Column Description
Agent ID DB2 process ID number.
Database The database where the blocked SQL statement is running.
Object Wanted Database object on which the lock took place.
Mode Wanted The blocking mode of the currently blocked SQL statement.
Lock Time Date and time when the blocking began.
Lock Type Type of blocking lock.
Lock Status Status of blocking lock.
DB User DB2 user under which the session is running.
Duration from Start
Amount of time the lock took place within the displayed period (denominated in accordance with the totaling method in effect).
Application ID Unique (global) identifier for the current session.
Server PID Server Process Identification of the blocking session. Click on the Server PID to drilldown into the blocking session and trace its activity. In the case of an active lock, the actual blocking statement can be discovered by looking at the current active cursor in the Open Cursors tab.

56 Foglight Performance Analysis for DB2 LUWUser Guide
4
History Mode
The Historical Activity window is the Foglight Performance Analysis for DB2 LUW historical diagnostic activity component.
Foglight Performance Analysis for DB2 LUW introduces OLAP concepts for application performance analysis. The tool facilitates an iteration of detect, diagnose and resolve through examination of the activity dimension of interest.
The data that is displayed reflects the collection settings you specified at installation. The opening displayed History View (and the default view for most view drill downs) is as follows:
• The Dimension Navigation tree pane on the left. The drilldown feature provides access to any of the key dimensions associated with DB2 databases activity, the tree node dimension display determines what subset of activity is displayed.
• The upper portion graphically displays the DB2 wait state instance resource usage in either a baseline normative view (see “Performance Baseline” on page 2) or a dynamic activity timeline layered representation (see “Time Navigation” on page 60). Use the sliding magnification scale: _ _ _ _0_ _ _ to magnify the metric scale range. The period activity is summarized in a resource breakdown pie chart (see “Resource Breakdown” on page 23). Configurable by Resource and Time parameters, these graphical representations provide you with an intuitive introductory picture and overview tool to the system DB2 activity at a glance.
• The lower historical tabs (Historical Views) display explanatory parameters of the system DB2 activity for purposes of greater understanding of the behavior of interest. The display includes a list pane of DB2 and system statistics whose activity you can individually time-line display and focus on through the assorted tab modalities.
58 Foglight Performance Analysis for DB2 LUWUser Guide
Historical data exists from the most recent minute. A wide variety of means exist to view and navigate through the collected historical data, using dimension drill downs, filters, wait state selections, period analyses, and change occurrences.
Related Topics
“Dimension Navigation” on page 58
“Time Navigation” on page 60
Resource Navigation
“Console - Common Elements” on page 15
Dimension NavigationThe History mode features multidimensional drilldown navigation to facilitate iterative (up to three levels) access to the key information associated with DB2 activity. The intuitive drill-down search style allows for a simplified means of performing increasingly refined queries to arrive at the root cause of performance anomalies quickly. A number of related Quest tools are available to aid in analysis, to determine appropriate actions, and to perform additional testing.
The root node to which the display opens is the entire instance activity. Expanding the tree shifts the focus to the specified dimension and refines the data to the specified area of interest. Iterative drilldowns increasingly refine focus and diagnosis until the core cause of the performance problem is identified.
ScenariosFoglight Performance Analysis for DB2 LUW dimensions can provide key insight in the following sample scenarios:
• Find the topmost SQL Statements executed by a specific user.
• Determine the most resource-intensive client machine executing a specific application. For the client machine of interest, identify the SQL Statements consuming the most resources.
• Identify the most active Application, which Routines it is executing, and the static SQL Statements that consume the most resources
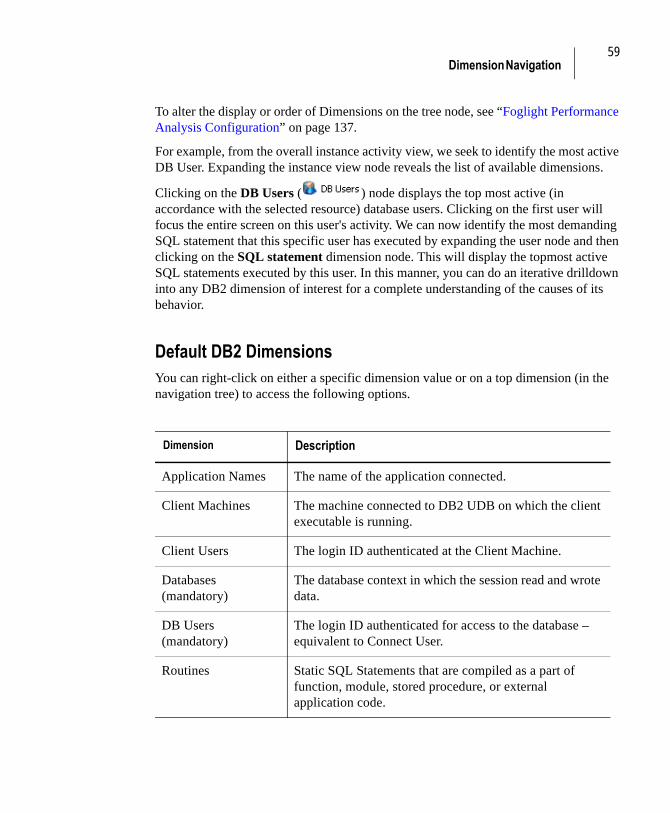
59Dimension Navigation
To alter the display or order of Dimensions on the tree node, see “Foglight Performance Analysis Configuration” on page 137.
For example, from the overall instance activity view, we seek to identify the most active DB User. Expanding the instance view node reveals the list of available dimensions.
Clicking on the DB Users ( ) node displays the top most active (in accordance with the selected resource) database users. Clicking on the first user will focus the entire screen on this user's activity. We can now identify the most demanding SQL statement that this specific user has executed by expanding the user node and then clicking on the SQL statement dimension node. This will display the topmost active SQL statements executed by this user. In this manner, you can do an iterative drilldown into any DB2 dimension of interest for a complete understanding of the causes of its behavior.
Default DB2 DimensionsYou can right-click on either a specific dimension value or on a top dimension (in the navigation tree) to access the following options.
Dimension Description
Application Names The name of the application connected.
Client Machines The machine connected to DB2 UDB on which the client executable is running.
Client Users The login ID authenticated at the Client Machine.
Databases (mandatory)
The database context in which the session read and wrote data.
DB Users (mandatory)
The login ID authenticated for access to the database – equivalent to Connect User.
Routines Static SQL Statements that are compiled as a part of function, module, stored procedure, or external application code.
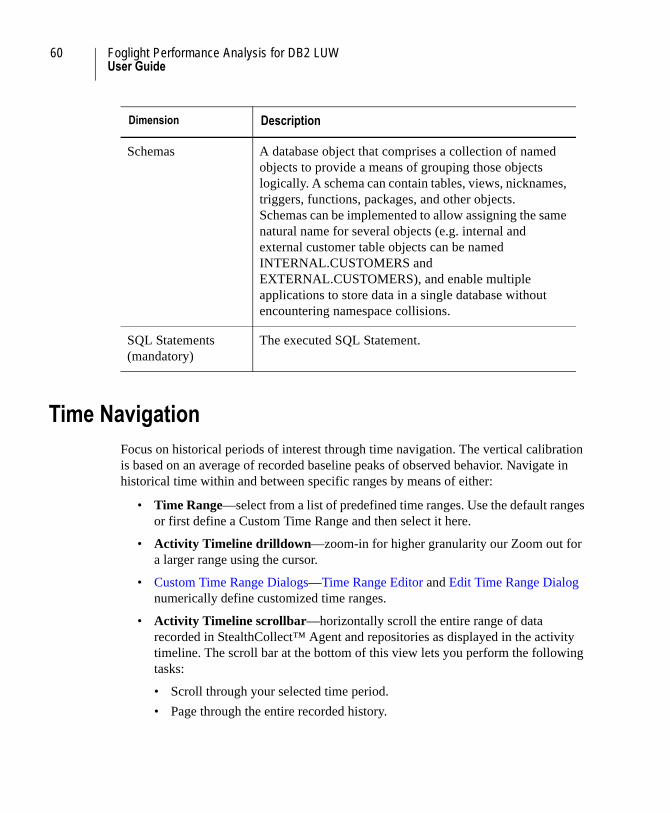
60 Foglight Performance Analysis for DB2 LUWUser Guide
Time NavigationFocus on historical periods of interest through time navigation. The vertical calibration is based on an average of recorded baseline peaks of observed behavior. Navigate in historical time within and between specific ranges by means of either:
• Time Range—select from a list of predefined time ranges. Use the default ranges or first define a Custom Time Range and then select it here.
• Activity Timeline drilldown—zoom-in for higher granularity our Zoom out for a larger range using the cursor.
• Custom Time Range Dialogs—Time Range Editor and Edit Time Range Dialog numerically define customized time ranges.
• Activity Timeline scrollbar—horizontally scroll the entire range of data recorded in StealthCollect™ Agent and repositories as displayed in the activity timeline. The scroll bar at the bottom of this view lets you perform the following tasks:
• Scroll through your selected time period.
• Page through the entire recorded history.
Schemas A database object that comprises a collection of named objects to provide a means of grouping those objects logically. A schema can contain tables, views, nicknames, triggers, functions, packages, and other objects. Schemas can be implemented to allow assigning the same natural name for several objects (e.g. internal and external customer table objects can be named INTERNAL.CUSTOMERS and EXTERNAL.CUSTOMERS), and enable multiple applications to store data in a single database without encountering namespace collisions.
SQL Statements(mandatory)
The executed SQL Statement.
Dimension Description
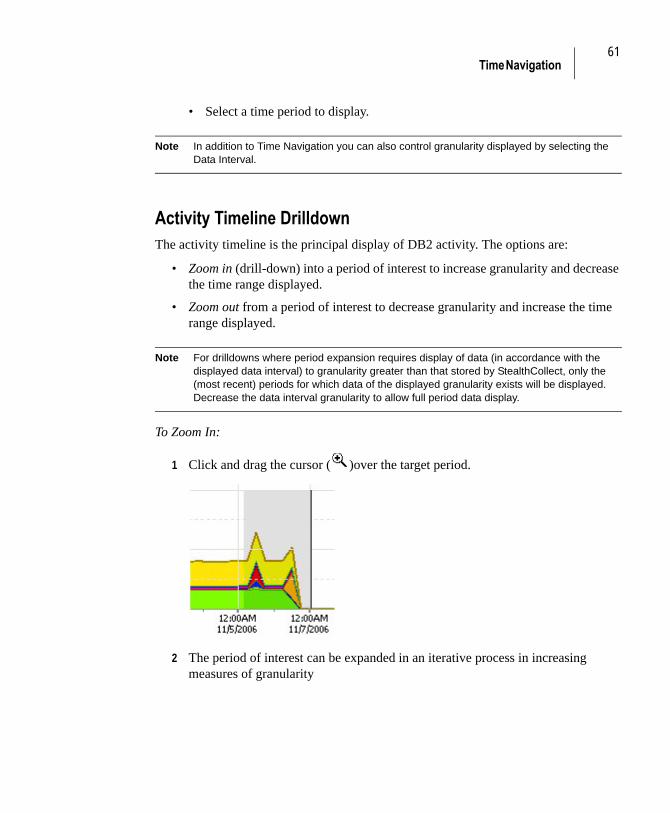
61Time Navigation
• Select a time period to display.
Note In addition to Time Navigation you can also control granularity displayed by selecting the Data Interval.
Activity Timeline DrilldownThe activity timeline is the principal display of DB2 activity. The options are:
• Zoom in (drill-down) into a period of interest to increase granularity and decrease the time range displayed.
• Zoom out from a period of interest to decrease granularity and increase the time range displayed.
Note For drilldowns where period expansion requires display of data (in accordance with the displayed data interval) to granularity greater than that stored by StealthCollect, only the (most recent) periods for which data of the displayed granularity exists will be displayed. Decrease the data interval granularity to allow full period data display.
To Zoom In:
1 Click and drag the cursor ( )over the target period.
2 The period of interest can be expanded in an iterative process in increasing measures of granularity

62 Foglight Performance Analysis for DB2 LUWUser Guide
Custom Time Range DialogsUse these dialogs for creation of new time ranges or deletion or modification of existing time ranges.
Time Range Editor
Use this dialog to manage periods of interest. It is accessed by clicking the Time range
button ( ) on the toolbar.
To Add a time range:
1 Click Add to open the Edit Time Range Dialog.
2 Define a specific or relative time range in that dialog.
3 After clicking OK, the new range is added to the Time Range Editor list.
To Edit a time range:
1 Select a time range and click Edit to open the Edit Time Range Dialog.
2 Change the settings for a specific or relative time range in that dialog. You can also change a relative to a specific time range or visa-versa.
3 After clicking OK, the Time Range Editor list is updated. If you changed the name this new name replaces the old one in the list.
To Remove a time range:
1 Select a time range and click Remove to remove the selected time range from the list.
63Time Navigation
2 Click Apply to remove and continue or OK to remove and close the dialog.
Note No confirmation prompt appears before removal of the selected time range.
Edit Time Range Dialog
The Edit Time Range dialog defines or a customized time range or changes a previously defined range. It is accessed by through the Time Range Editor dialog or by selecting Other in the Time Range combo-box.
To define a specific time range:
1 Select Specific time range.
2 Specify a day and hour in the From range. Click Minimum to specify the earliest available time and date.
3 Specify a day and hour in the To range. Click Maximum to specify the earliest available time and date.
4 The Name field, by default, displays the specified time range. You can assign a verbal name to this range by typing it in the Name field.
5 Click OK to close the dialog.
To define a relative time range:
1 Select Relative time range.
2 Select Previous or Last.
3 Select amount and time unit.
4 The Name field is read-only and displays the relative time selected. For example: Previous 1 week means the week previous to the present week that ended now.Last 4 Days means the last 4 days up to now.
5 Click OK to close the dialog.
Related Topic
“Understanding Time Ranges and Data Intervals” on page 65
64 Foglight Performance Analysis for DB2 LUWUser Guide
Metric Selection DialogThis dialog appears when right-clicking anywhere in the lower tabs of the Real-time or History pages. This feature is recommended for advanced users only and must be first enabled in the Performance Analysis Configuration dialog > Support tab.
Select the metrics to be displayed using the arrow selection buttons or double-clicking on a specific metric. The lower pane of this dialog briefly describes the selected metric.

65Understanding Time Ranges and Data Intervals
Figure 1
Understanding Time Ranges and Data IntervalsThe History mode allows the selection of time ranges and data intervals to display data for. You can navigate to different time ranges to display varying granularity (data resolution) and time ranges.
This Time Navigation only affects the data displayed in Foglight Performance Analysis for DB2 LUW, not the data collected. Data collection parameters are defined when

66 Foglight Performance Analysis for DB2 LUWUser Guide
installing the Foglight Performance Analysis Agent or later through Agent Administration.
Time Ranges
You can choose either of the following Time Range types:
Specific Time Range
An interval with a specified beginning and ending date and time. Once defined, this period remains static and does not update with the passage of time.
Relative Time Range
An interval relative to now, using the following definitions. The relative period updates continuously.
• Last period - Interval of specified units up to the current moment.
• Previous period - Interval of specified units from start to end of that unit, that ended prior to the current equivalent time unit.
The following examples are for a Gregorian calendar with days beginning and ending at 12:00 am (24:00) and the week beginning on Sunday and ending on Saturday.
Time Range Description
Last 1 week A complete month beginning at same moment exactly a week before now and ending now.
Previous 5 Days 5 calendar days, that preceded the current day, beginning at 12:00 am (24:00) on the first day ending at 12:00 am (24:00) yesterday.
Previous 1 Month
1 calendar month, preceding the current month, beginning at 12:00 am (24:00) on the first day of that previous month ending at 12:00 am (24:00) on the last day of that month.
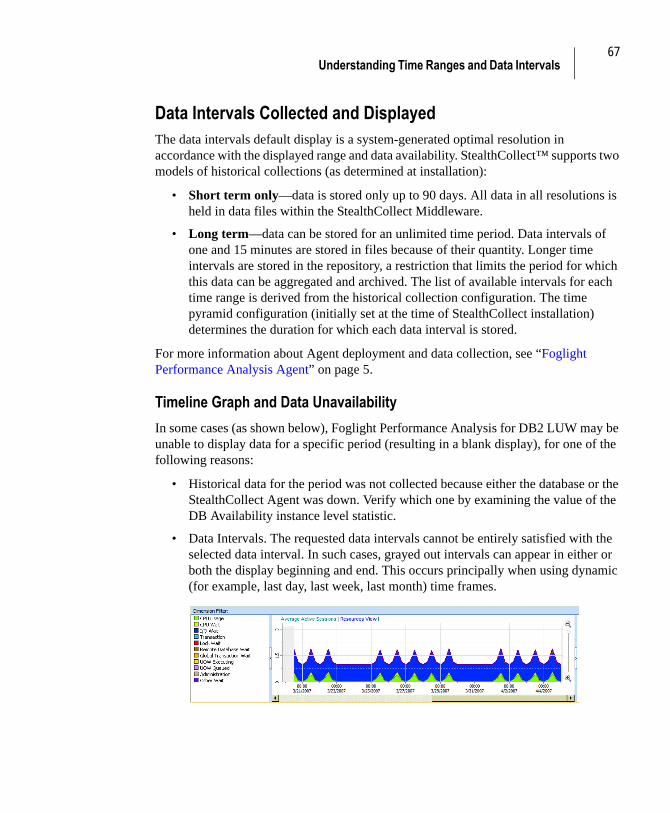
67Understanding Time Ranges and Data Intervals
Data Intervals Collected and DisplayedThe data intervals default display is a system-generated optimal resolution in accordance with the displayed range and data availability. StealthCollect™ supports two models of historical collections (as determined at installation):
• Short term only—data is stored only up to 90 days. All data in all resolutions is held in data files within the StealthCollect Middleware.
• Long term—data can be stored for an unlimited time period. Data intervals of one and 15 minutes are stored in files because of their quantity. Longer time intervals are stored in the repository, a restriction that limits the period for which this data can be aggregated and archived. The list of available intervals for each time range is derived from the historical collection configuration. The time pyramid configuration (initially set at the time of StealthCollect installation) determines the duration for which each data interval is stored.
For more information about Agent deployment and data collection, see “Foglight Performance Analysis Agent” on page 5.
Timeline Graph and Data Unavailability
In some cases (as shown below), Foglight Performance Analysis for DB2 LUW may be unable to display data for a specific period (resulting in a blank display), for one of the following reasons:
• Historical data for the period was not collected because either the database or the StealthCollect Agent was down. Verify which one by examining the value of the DB Availability instance level statistic.
• Data Intervals. The requested data intervals cannot be entirely satisfied with the selected data interval. In such cases, grayed out intervals can appear in either or both the display beginning and end. This occurs principally when using dynamic (for example, last day, last week, last month) time frames.
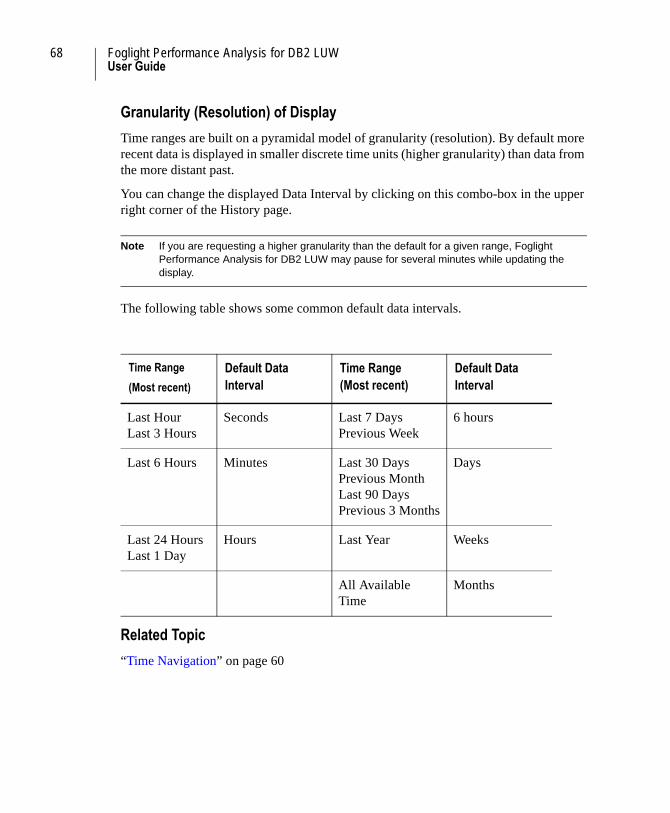
68 Foglight Performance Analysis for DB2 LUWUser Guide
Granularity (Resolution) of Display
Time ranges are built on a pyramidal model of granularity (resolution). By default more recent data is displayed in smaller discrete time units (higher granularity) than data from the more distant past.
You can change the displayed Data Interval by clicking on this combo-box in the upper right corner of the History page.
Note If you are requesting a higher granularity than the default for a given range, Foglight Performance Analysis for DB2 LUW may pause for several minutes while updating the display.
The following table shows some common default data intervals.
Related Topic
“Time Navigation” on page 60
Time Range
(Most recent)
Default DataInterval
Time Range(Most recent)
Default DataInterval
Last HourLast 3 Hours
Seconds Last 7 DaysPrevious Week
6 hours
Last 6 Hours Minutes Last 30 DaysPrevious MonthLast 90 DaysPrevious 3 Months
Days
Last 24 HoursLast 1 Day
Hours Last Year Weeks
All Available Time
Months
69Understanding Activity Significance
Understanding Activity SignificanceThe Foglight Performance Analysis Resource Breakdown timeline provides you with a powerful and intuitive tool to rapidly isolate offending resource utilization,
relative to entire instance and category totals. Use the Activity Timeline Scaling Options configuration in the Foglight Performance Analysis Configuration History tab (see “History” on page 138) to focus the display:
• Select the Scale graph to instance check box if you want the display to retain the instance vertical scaling. Thus, any drilldown activity display is proportional to the total instance activity, granting you an immediate sense of its significance. You can manually refocus by using the vertical magnifier to the right of the timeline display.
If cleared, the display scale is that of the dimension subset of which the present drilldown is a part. (For example, the vertical scale could be a specific SQL statement and the activity representation, that of a specific database users portion within it.)
• Select the Focus on target activity check box if you want the view to automatically refocus as you drill down within dimensions. You can manually refocus by using the vertical magnifier to the right of the timeline display.
If cleared, the scale reverts to that of the instance (if selected, as above) or that of the dimension in which this drill down is a part.
• Select the Show total in graph check box to display a dotted line representing total instance activity (if selected, as above) or that of the dimension in which this drill down is a part.
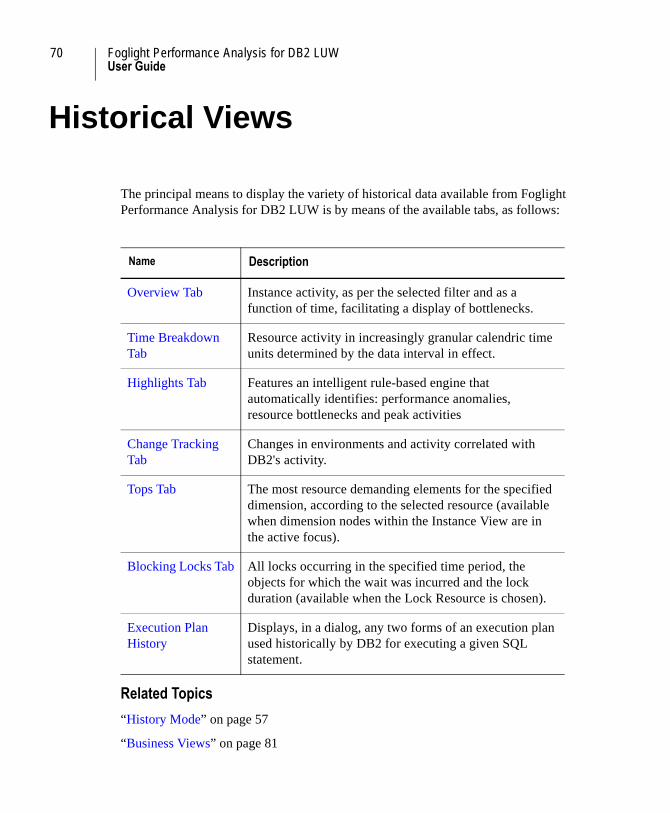
70 Foglight Performance Analysis for DB2 LUWUser Guide
Historical Views
The principal means to display the variety of historical data available from Foglight Performance Analysis for DB2 LUW is by means of the available tabs, as follows:
Related Topics
“History Mode” on page 57
“Business Views” on page 81
Name Description
Overview Tab Instance activity, as per the selected filter and as a function of time, facilitating a display of bottlenecks.
Time Breakdown Tab
Resource activity in increasingly granular calendric time units determined by the data interval in effect.
Highlights Tab Features an intelligent rule-based engine that automatically identifies: performance anomalies, resource bottlenecks and peak activities
Change Tracking Tab
Changes in environments and activity correlated with DB2's activity.
Tops Tab The most resource demanding elements for the specified dimension, according to the selected resource (available when dimension nodes within the Instance View are in the active focus).
Blocking Locks Tab All locks occurring in the specified time period, the objects for which the wait was incurred and the lock duration (available when the Lock Resource is chosen).
Execution Plan History
Displays, in a dialog, any two forms of an execution plan used historically by DB2 for executing a given SQL statement.

Historical Views 71Overview Tab
“Real-time Instance View” on page 46
Overview TabThe Overview tab and feature is the primary history and real-time tool for initial understanding of the system resource use patterns that you see in the Activity Timeline graph. The tool lets you view the performance-oriented metrics, time correlated with any activity drill-down. The middle pane timeline graphical representation and explanation displays respond to the choice of resource focus in the Resource/Metric list pane. ToolTip hints display any additional available information. The display is composed of the resource timeline and expert metrics (in accordance with the selected resource).
The overview tool is a unified view of the entire range of activity projections: full instance, specific session, and any historical activity drill-down (for example, User JOHN executing a program on machine ATLAS).
The pane list metrics displayed in the window's lower third are determined by the chosen Resource. The Resource chosen displays those metrics that have the greatest relevance and impact on that resource as it may affect throughput and response time. In turn, the chosen metric determines the text displayed in the middle third right side. For those metrics that can be represented as a percentage of a total, a horizontal bar presentation presents both its internal component portions (for example, in the DB2/System CPU Usage metric, CPU consumption is composed of the instance background and foreground CPU and CPU used by all other processes) and their total.
The overview representation and values are determined by:
• Dimension Navigation parameters
• Metric Totaling—for ease of use and comparability, differing totaling methods can be applied. Select from among the possible methods in accordance with your summary needs:
• Period Total (default) metric aggregation within one column for the entire time range
• Rate (Per Interval) summarizes the data for averages and totals with periods defined by the Data Interval
• Rate (Per Second)

72 Foglight Performance Analysis for DB2 LUWUser Guide
• Per Execution of SQL statements
Note For methods that entail both averages and totals, the horizontal bar presentation and ToolTip display reflect the column in focus.
Related Topics
“Highlights Tab” on page 74
“Time Breakdown Tab” on page 72
“Change Tracking Tab” on page 75
“Tops Tab” on page 77
“Blocking Locks Tab” on page 79
“Blocking Locks Tab” on page 79
“History Mode” on page 57
Time Breakdown TabUse this tab to display, in a pane-listed manner, resource activity in increasingly granular calendric time units determined by the data interval in effect. This feature is particularly useful in comparative analysis of periodic system performance. The selected resource (DB2 wait state) determines which metrics are shown in the pane listing display and the totaling method in effect determines the metric values.
Right-clicking within the pane listing display area brings up a dialog with the following options:
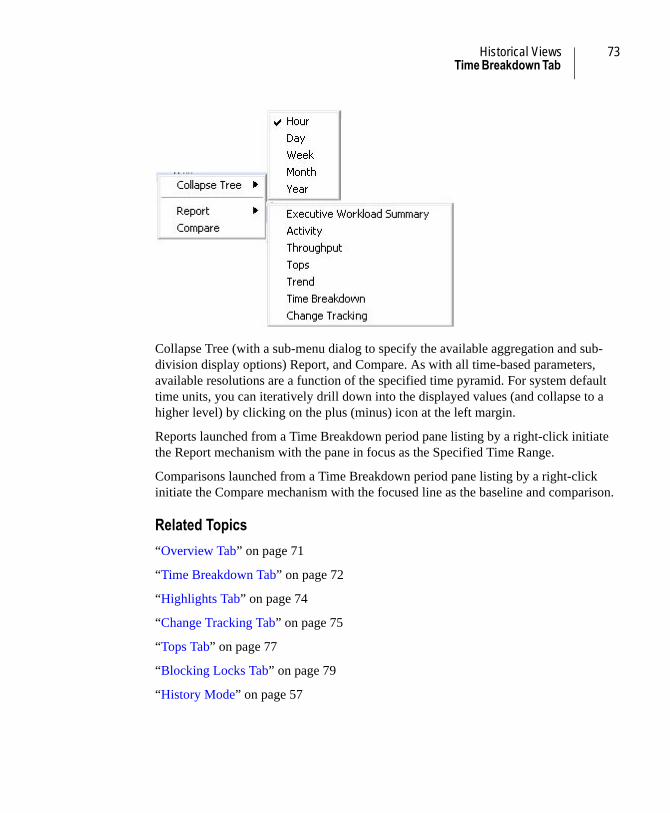
Historical Views 73Time Breakdown Tab
Figure 2
Collapse Tree (with a sub-menu dialog to specify the available aggregation and sub-division display options) Report, and Compare. As with all time-based parameters, available resolutions are a function of the specified time pyramid. For system default time units, you can iteratively drill down into the displayed values (and collapse to a higher level) by clicking on the plus (minus) icon at the left margin.
Reports launched from a Time Breakdown period pane listing by a right-click initiate the Report mechanism with the pane in focus as the Specified Time Range.
Comparisons launched from a Time Breakdown period pane listing by a right-click initiate the Compare mechanism with the focused line as the baseline and comparison.
Related Topics
“Overview Tab” on page 71
“Time Breakdown Tab” on page 72
“Highlights Tab” on page 74
“Change Tracking Tab” on page 75
“Tops Tab” on page 77
“Blocking Locks Tab” on page 79
“History Mode” on page 57
74 Foglight Performance Analysis for DB2 LUWUser Guide
Highlights TabUse the Highlights tab as an effective insight into your historical instance activity. The window features an intelligent rule-based engine that automatically identifies:
• Performance anomalies
• Resource bottlenecks
• Peak activities
The Highlights feature performs a primary intelligent interpretation of your instance performance, saving the DBA precious time as the performance analysis is completed automatically. In addition to the performance findings, links are provided to provide one-click access to the issues requiring further attention.
The Highlights tab is available only for the History mode | Instance view (top level).
Performance HighlightsPerformance Highlights displays instance level anomalies as measured in exceptional and significant metric values. For example, CPU and memory usage.
The textual row listings entries consist of:
• Performance metrics listings
• (Explanations of the egregious behavior)
• Hyper-links to the relevant time period
• (Quantitative metric values)
Additional information is available by clicking.
Right-click on a specific rule implementation to display the Performance Highlights tab for configuration, with the focus on that rule.
Activity HighlightsUse the Activity Highlights pane listing to identify situations in which an individual or small activity subset (characterized by dimension values) is the primary source of an activity (resource) workload, likely to be exceptional and significant behavior.
Clicking on the dimension hyper-link will navigate you to the consuming activity.
Historical Views 75Change Tracking Tab
Configure the rule engine in the Activity Highlights tab.
Related Topics
“Overview Tab” on page 71
“Time Breakdown Tab” on page 72
“Change Tracking Tab” on page 75
“Tops Tab” on page 77
“Highlights Tab” on page 74
“History Mode” on page 57
Change Tracking TabThe change tracking tool is an integrated monitoring mechanism available only if the Performance Repository is installed. It tracks environmental, configuration and schema changes that can potentially influence system performance and enables the user to correlate changes with DB2 activity. Use the Filter mechanism to refine the set of change tracking occurrences displayed.
In the following graphic, position the mouse over the number pointers to learn more about a particular area of interest:
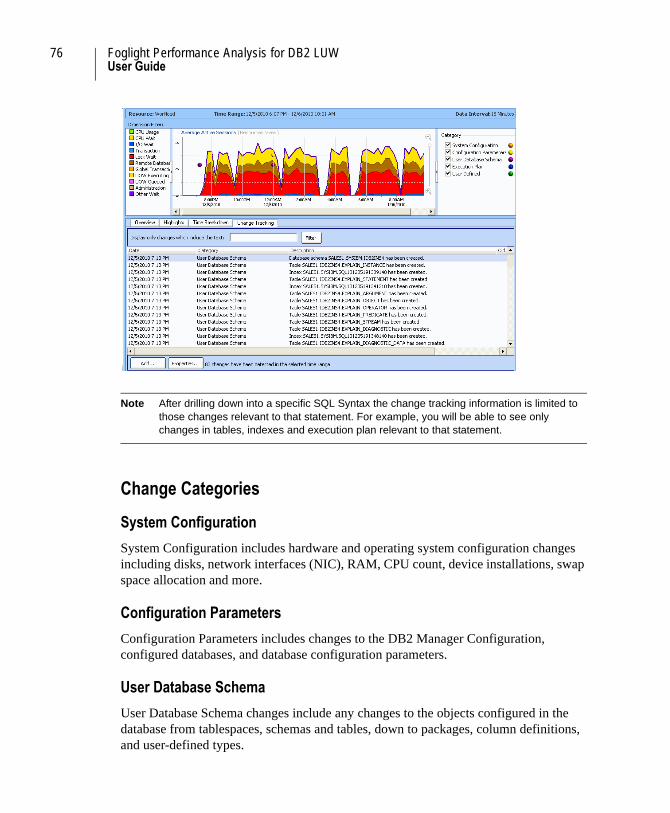
76 Foglight Performance Analysis for DB2 LUWUser Guide
Figure 3
Note After drilling down into a specific SQL Syntax the change tracking information is limited to those changes relevant to that statement. For example, you will be able to see only changes in tables, indexes and execution plan relevant to that statement.
Change Categories
System Configuration
System Configuration includes hardware and operating system configuration changes including disks, network interfaces (NIC), RAM, CPU count, device installations, swap space allocation and more.
Configuration Parameters
Configuration Parameters includes changes to the DB2 Manager Configuration, configured databases, and database configuration parameters.
User Database Schema
User Database Schema changes include any changes to the objects configured in the database from tablespaces, schemas and tables, down to packages, column definitions, and user-defined types.

Historical Views 77Tops Tab
Execution Plan
Execution Plan changes are recorded for every SQL statement captured by Foglight Performance Analysis for DB2 LUW. When an execution plan has (unintentionally) changed, the outcome can result in SQL performance degradation. Therefore it is essential you investigate the change, by clicking the Properties button to graphically display the execution plan before and after the change, to verify that the nature and outcome of the change improve SQL performance.
User Defined
Changes inserted by user. Use this feature to document occurrences of interest. For example, the System Administrator installed an operating system patch. Recording this activity can assist in determining whether a change in performance can be directly associated with this event.
Create user-defined change-tracking points by clicking the Add button and specifying the time and description in the subsequently displayed Add Change dialog.
Related Topic
“Overview Tab” on page 71
“Time Breakdown Tab” on page 72
“Highlights Tab” on page 74
“Tops Tab” on page 77
“Blocking Locks Tab” on page 79
“History Mode” on page 57
Tops TabIn accordance with the dimension filter, the most resource demanding elements for the specified dimension are displayed and sorted, according to the selected resource. (Available when dimension nodes within the Instance View are in the active focus)
The Tops graphical display contains the overall Resource activity in accordance with the defining Dimension Filter. Clicking on a dimension value within the Tops pane listing displays its portion of the total resource activity in the graphic display above it. Thus you can readily see its usage as a portion of the total, over time. In this manner you
78 Foglight Performance Analysis for DB2 LUWUser Guide
can determine more fully this element’s behavior pattern over the entire period of interest, including mutual effects of several entities on total activity.
The combination of top pane-listings of the entire period and a graphical view over the period lets you distinguish between elements whose resource usage is monotonous and elements with anomalous behavior (which are more likely to be causing bottlenecks).
To investigate behavior other than the default resource usage, use the drop-down listing in the graphical portion to focus on the different metrics. The metrics are those which are relevant to the displayed resource. The change of metrics does not alter the pane element listing, which are dependent solely on the resource selection.
Double clicking a tops entry drills down into it and causes it to be a focus of activity.
Note The displayed dimension listing of top resource consuming entries is sorted based on the selected resource. Thus the pane listing will differ for a given period, depending on the Resource selection in effect.
To configure the default number of Tops displays, see.
SQL Filtering
Foglight Performance Analysis for DB2 LUW offers a filtering feature to limit display in the right pane listing to only those dimensions matching a set of user-defined expression conditions. When the left tree-node focus is on a dimension, use the Click to create... hyperlink to launch the Filter Definition dialog wherein you can construct, modify and delete a filter set composed of three part expressions (predicates):
• Field - The current dimension selected or any of the displayed DB2 wait event performance metrics
• Condition
• Dimension - contains, does not contain, begins with, ends with, or is
• DB2 wait event metric - =, <>, >=, >, <=, or <
• Value - a valid character string or numeric value for the specified field
Related Topic
“Overview Tab” on page 71
“Time Breakdown Tab” on page 72
“Highlights Tab” on page 74
Historical Views 79Blocking Locks Tab
“Change Tracking Tab” on page 75
“Tops Tab” on page 77
“Blocking Locks Tab” on page 79
“History Mode” on page 57
Blocking Locks TabWhen the Lock Resource is chosen, the Blocking Locks tab is visible. At the instance view level, the resulting pane listed entries comprise all locks occurring in the specified time period, the objects for which the wait was incurred and the lock duration (in accordance with the totaling method).
At the level of a drilldown into a specific Dimension, you can see the objects on which the current activity has been locked. Expanding the object displays the list of activities (characterized by their dimensions) that created the lock on that specific object and therefore blocked the current activity. Duration represents the time period for which this lock occurred. Clicking on a dimension entry facilitates a roll-up of the tree node with the selected dimension in focus, so that you can initiate an investigation of the locking source.
Related Topics
“Lock Wait” on page 179
“Overview Tab” on page 71
“Time Breakdown Tab” on page 72
“Highlights Tab” on page 74
“Change Tracking Tab” on page 75
“Tops Tab” on page 77
“History Mode” on page 57
Execution Plan HistoryDisplay in a dialog any two forms of an execution plan used historically by DB2 for executing a given SQL statement.
80 Foglight Performance Analysis for DB2 LUWUser Guide
To access the Execution Plan History dialog:
From a Change Tracking > Execution Plan entry, click the History button or by right-clicking a SQL statement of interest in either:
• Left node pane listing
• Tops tab pane listing
Related Topics
“Overview Tab” on page 71
“Highlights Tab” on page 74
“Change Tracking Tab” on page 75
“Blocking Locks Tab” on page 79
“History Mode” on page 57
Business Views 81Shortcuts
Business Views
Views are user-defined historical projections used for a more detailed, refined, and convenient presentation.
Use the views mechanism to rapidly and powerfully identify specific historical behavior of interest, both continuous and episodic. Views have the inherent advantage of greater flexibility and comprehensiveness in their ability to include multiple dimensions and domains for an at-a-glance understanding of pre-defined DB2 resources usages of interest.
In addition to dynamic Instance View drilldowns, with Foglight Performance Analysis for DB2 LUW you can create the following:
• Shortcutsare to be used like activity bookmarks, for one-click recall and continued observance of a specific activity defined by a dimension set of interest.
• User Defined Collections (UDCs) are shortcuts powered by a dedicated data collection in the back end to supply better resolution, more data, and more refined granularity than the system's default configuration.
Shortcuts
In its simplest usage, views are permanent shortcuts ( ) to tree-view dimension node drilldowns, imposing no additional system resource requirements. Use shortcuts to gain rapid and convenient bookmark-like access to specific filter definitions.
Shortcuts definitions are saved on the user client computer and are therefore available only to the defining user.
With shortcuts you can preserve tree-navigation views of interest as you work.
• From within the application flow, as you encounter a drilldown of interest that you want to monitor over time.
• Or you can manually formulate more complex dimension combinations (for example, the resource consumption of a “cost unit” consisting of three specific users running any of four specific programs). Such complex combinations are unavailable by only using the dimension tree-node drilldown.
82 Foglight Performance Analysis for DB2 LUWUser Guide
The Quest Benchmark Factory load testing process view is included by default. Use Benchmark Factory to generate system stress through automated testing, virtual users and agents by means of industry standard benchmarks to measure system capacity and performance bottlenecks. The Benchmark Factory view exposes the load generated by Benchmark Factory.
Related Topic
“Creating a Shortcut” on page 82
Creating a ShortcutTo open the Shortcut Editor dialog from the Foglight Performance Analysis for DB2 LUW tree view
1 From within the History node, right-click the Instance View. The Foglight Performance Analysis for DB2 LUW action item right-click menu appears.
2 Select Shortcut > New.
Alternatively, create (Save) a shortcut from an existing dimension tree domain drill-down node by right-clicking on the domain view of interest:
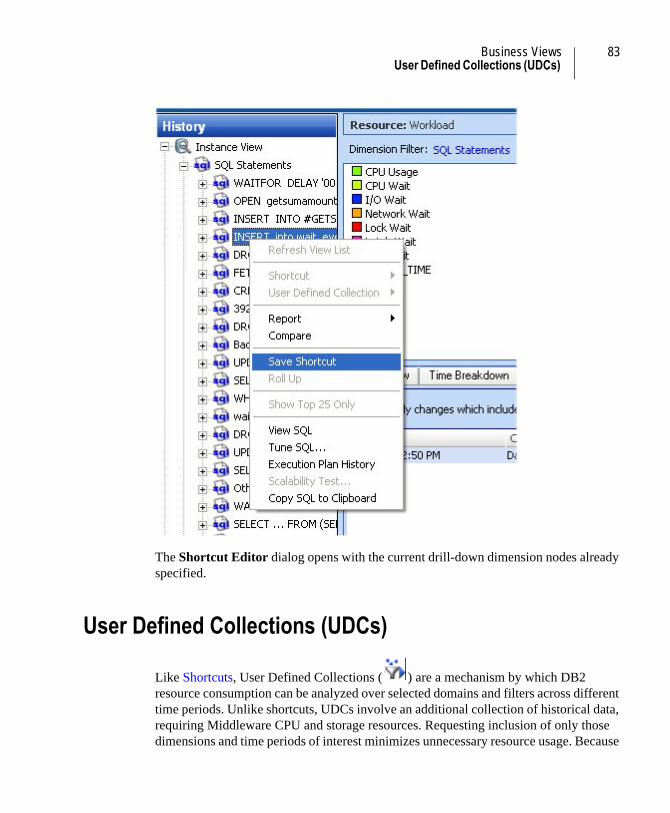
Business Views 83User Defined Collections (UDCs)
Figure 4
The Shortcut Editor dialog opens with the current drill-down dimension nodes already specified.
User Defined Collections (UDCs)
Like Shortcuts, User Defined Collections ( ) are a mechanism by which DB2 resource consumption can be analyzed over selected domains and filters across different time periods. Unlike shortcuts, UDCs involve an additional collection of historical data, requiring Middleware CPU and storage resources. Requesting inclusion of only those dimensions and time periods of interest minimizes unnecessary resource usage. Because
84 Foglight Performance Analysis for DB2 LUWUser Guide
of this additional resource consumption it imposes, you are advised to limit the quantity of concurrent UDCs to only those that are critical. Similarly, you are well advised to delete UDCs once you have completed your usage of them.
Data for UDC is kept within Middleware files and not in the Performance Repository.
The default history collection addresses the entire system activity and therefore records activity only at a level of significance to the entire system-wide picture, so some of the activity is left out. Use User Defined Collections when you have identified a specific activity of interest and the granularity level provided in the default system collection is insufficient. By creating a UDC, you can record and monitor activity of interest at any level of granularity.
Added UDCs appear as additional Views tree nodes and are navigated in the same manner as the instance. The initial UDC node view is that of the total activity recorded by the specified dimension aggregation filter when the UDC was created and with the drilldown reflecting the dimension subsets.
After creation, you can only alter the history collection and storage attributes.
To delete your User Defined Collections
• Right-click the UDC tree node to display the pop-up menu. Select Delete.
or
• From the Toolbar, click Configure | StealthCollect. From within the User Defined Collections node, with the cursor focus on the UDC to be eliminated, click Delete.
In addition to Delete, from within Configure | StealthCollect | User Defined Collection, you can also:
• Clear your UDC of data. Perform this action to reset the existing content of the collection in situations where the data is no longer valid or of interest.
• Stop/Start the UDC from continued and additional activity. Use this action when you seek to preserve the collected data but have no further or a renewed interest in any further collection.
Related Topic
“Creating a User Defined Collection” on page 85

Business Views 85Creating a User Defined Collection
Creating a User Defined CollectionThe UDC definition wizard entails the following defining screens:
• Identification—record here the referential Name and description parameters. See “User Defined Collection (UDC) Creation Wizard ” on page 86.
• Dimension—limit the set of historical data to be stored and retrieved by clearing from check-box selection those dimensions that are not of interest for this UDC. After the setup is executed, modifying the dimension may cause data loss. See “User Defined Collection (UDC) Wizard - Dimension” on page 86.
• Activity Filter—limit the set for which historical dimension data is to be collected to that which includes up to three domain instances. See “User Defined Collection (UDC) Wizard - Activity Filters” on page 87.
• Scheduling—specify here the time range, frequency and collection duration of historical data to be gathered. Limit the time range to only the period of interest because, as with dimensions, the time range size determines the extent of Middleware resource requirements. See “User Defined Collection (UDC) Wizard - Scheduling” on page 87.
• History Model—UDCs also require data storage by the Foglight Performance Analysis Agent in both Middleware data files and the Performance Repository, with data granularity a function of allocated disk space. Define here the general level of collection or use the Custom option to configure the data collection pyramid. Separately, accept the default data directory or specify an alternative location. See “User Defined Collection (UDC) Wizard - History Model Custom Configuration” on page 89.
• Summary—review the UDC parameter settings displayed here as subsequent changes may cause data loss. See “User Defined Collection (UDC) Wizard - Summary” on page 91.
To access the defining History Configuration dialog feature:
1 From the Foglight Performance Analysis tree view, right-click in the left pane History mode.
2 Select New User Defined Collection in the displayed action item menu.
Related Topic
“User Defined Collection (UDC) Creation Wizard ” on page 86

86 Foglight Performance Analysis for DB2 LUWUser Guide
User Defined Collection (UDC) Creation Wizard Create a User Defined Collection when you have identified a specific activity of interest and the granularity level provided in the default system collection is insufficient.
The usefulness of UDCs as a performance monitoring tool is a function of how well the administrator knows the system's DB2 resources and (potential) bottlenecks. The ease and rapidity with which problematic behavior is identified and isolated depends on how well the critical dimensions are chosen.
For example:
• A user reports performance problems every Thursday between 13:00 and 16:00. Use the UDC to fully monitor the user's activity down to the statement activity level.
• Trace a known problematic SQL statement through an orientation of mutual effect of the SQL in response to tuning efforts (for example, index optimization or I/O optimization) and in this manner identify the specific effects and trends.
Related Topic
“User Defined Collections (UDCs)” on page 83
User Defined Collection (UDC) Wizard - DimensionThis screen defines the dimensions you want to collect data for. Mandatory dimensions will be used for every UDC. All dimensions are selected by default. In order to minimize the size of the storage files required by the UDC, check only the desired dimensions.
Review the topic Dimension Navigation for a list of supported dimensions and their use.
Caution Once the UDC has been created, the dimension list cannot be modified.
Related Topic
“User Defined Collections (UDCs)” on page 83
Business Views 87User Defined Collection (UDC) Creation Wizard
User Defined Collection (UDC) Wizard - Activity FiltersThis screen specifies the dimension filters determining which instance activity subset to collect. For each dimension filter a list of values appears below. Select the dimension values to narrow down the data collection further minimize the size of the collected data.
For example, when DB Users John_Doe and Rebecca_Smith run the Programs monthly payroll (monroll.exe) and invoice accrual (invaccr.exe), they occasionally encounter performance problems. A UDC can be created for these two users and two programs by including only DB User dimension values John_Doe and Rebecca_Smith and program dimension values monroll.exe and invaccr.exe.
The activity Search entry box specification serves a multiple role. Search entries can be used for either:
• a dimension set initial limiting string. For example, specification of “DROP” as a Command Types filter will display only and all those commands beginning with “DROP” (for example, DROP TABLE, DROP INDEX) for your individual (>) or group (>>) item selection.
• values not available through the displayed drop-down listing. Enter the value in the Search box and click “>” to add it to the included filter set.
Note If no filters are specified, the UDC view will be that of the entire instance.
Related Topic
“User Defined Collections (UDCs)” on page 83
User Defined Collection (UDC) Wizard - SchedulingThis screen specifies the date and time for the collection. Make sure this time frame is compatible with the selected dimension and filters from the previous screens.
Collection Period
The Collection Period defines the entire period where data collection occurs. Data will not be collected for any period prior to the actual starting date of the UDC.

88 Foglight Performance Analysis for DB2 LUWUser Guide
For the Following Days
For the Following Days lets you set for which days within the week or month data collection is to occur. Use Weekly or Monthly scheduling in accordance with the underlying activity of interest.
Note For selection of Monthly dates, the Days entry box allows specific days in a comma separated string, or ranges spanning a “-” for example, “2,16” for the collection to occur on the 2nd and 16th of each month or “10-15” for the collection to occur each month from the 10th through the 15th.
Collection hours within each day
Collection hours within each day defines the starting time and duration for the collection within each calendar day.
Related Topic
“User Defined Collections (UDCs)” on page 83
User Defined Collection (UDC) Wizard - History ModelThis screen determines the quantity and granularity of data stored for historical analysis.
Select the history level most appropriate for your system characteristics and needs. The data model selected determines the short term and long term space requirements.
Level Select When...
Entry Uses less disk space. Top offenders still visible. High resolution data is saved for a short period only.
Standard Suitable for most collections. Optimal combination of accuracy, granularity and space consumption.
High Volume For collections of intensive activity (thousands of SQL executions per minute) and for which most of the activity is to be recorded. Offers high granularity at a cost of large disk space requirement.

Business Views 89User Defined Collection (UDC) Creation Wizard
Disk Space
Sufficient space must exist in the data directory in order to proceed with the collection creation.
Short term historical data is stored in files (in the Middleware). The entire space is claimed at the time of installation. The Data directory (located on the Middleware host) contains the history data files. This space is claimed during collection creation and therefore the directory should have sufficient free space to hold the indicated amount of required data.
When the amount of disk free space is lower than the estimated required amount, the free space indicator is marked in red and you must either select a less demanding history model (or manually customize) or find a sufficient data directory location. Either
manually enter the data directory, or use the browse ( ) option.
User Defined Collection (UDC) Wizard - History Model Custom Configuration
Time Pyramid Tab
The purpose of the time pyramid tab is to allow for optimized storage and performance, as well as to provide rapid access to the data of interest. The logic of this model is based on the premise that the closer the data is to the present, the more granular (i.e. measured in finer time units) you want it to be. Conversely, the further it is from the present, the less refined the desired time unit of measurement, illustrated as follows:
Custom Advanced Users only. Tailor the aggregation options to meet your needs. See Custom Configuration.
Level Select When...
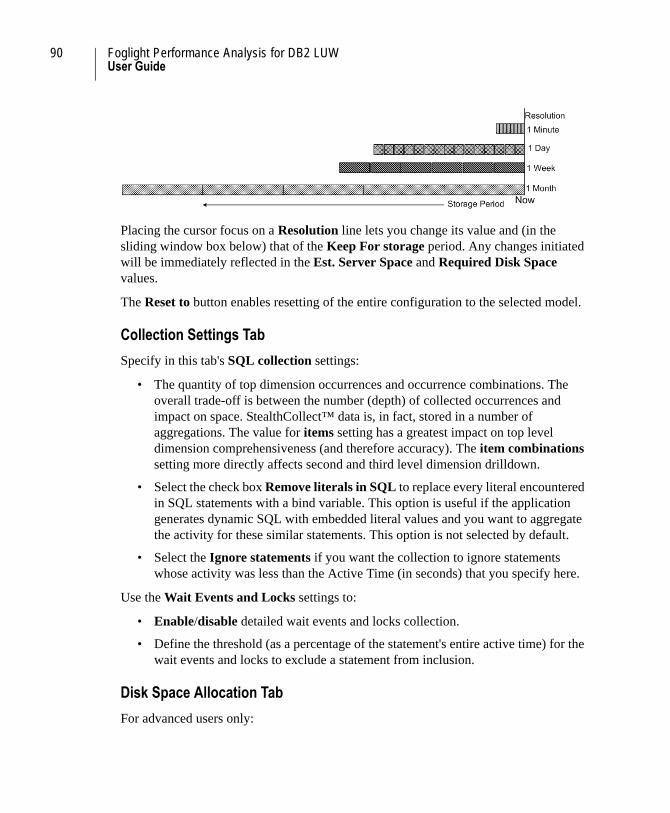
90 Foglight Performance Analysis for DB2 LUWUser Guide
Figure 5
Placing the cursor focus on a Resolution line lets you change its value and (in the sliding window box below) that of the Keep For storage period. Any changes initiated will be immediately reflected in the Est. Server Space and Required Disk Space values.
The Reset to button enables resetting of the entire configuration to the selected model.
Collection Settings Tab
Specify in this tab's SQL collection settings:
• The quantity of top dimension occurrences and occurrence combinations. The overall trade-off is between the number (depth) of collected occurrences and impact on space. StealthCollect™ data is, in fact, stored in a number of aggregations. The value for items setting has a greatest impact on top level dimension comprehensiveness (and therefore accuracy). The item combinations setting more directly affects second and third level dimension drilldown.
• Select the check box Remove literals in SQL to replace every literal encountered in SQL statements with a bind variable. This option is useful if the application generates dynamic SQL with embedded literal values and you want to aggregate the activity for these similar statements. This option is not selected by default.
• Select the Ignore statements if you want the collection to ignore statements whose activity was less than the Active Time (in seconds) that you specify here.
Use the Wait Events and Locks settings to:
• Enable/disable detailed wait events and locks collection.
• Define the threshold (as a percentage of the statement's entire active time) for the wait events and locks to exclude a statement from inclusion.
Disk Space Allocation Tab
For advanced users only:
Business Views 91User Defined Collection (UDC) Creation Wizard
• Use this option to manually override the system-determined UDC disk space requirement by specifying an alternative disk allocation. Your files will be permanently relocated to the new directory.
Note Manually decreasing this disk allocation may cause a loss of data.
• Override the suggested default Data directory. The collection data files will be placed in the specified directory. Use this option if the default directory does not have sufficient free space.
User Defined Collection (UDC) Wizard - SummaryTo complete the Wizard creation process
1 Click the Create button to create the specified UDC.
2 Click Done upon completion to close the Wizard.

92 Foglight Performance Analysis for DB2 LUWUser Guide
Compare 93
Analysis Tools
Compare
Use the Compare tool to gain a full, detailed understanding of the differences in your critical applications' performance. This full-featured tool compares virtually any information available in Foglight Performance Analysis for DB2 LUW (such as points in time or selected dimensional breakdowns) to determine whether performance deviations are isolated or chronic. The intuitive report structure provides an easy to understand display of the extent of the changes and the performance impacts, allowing quick and efficient problem resolution.
Compare between whole instances or selected dimension breakdowns (such as user or SQL). Use this tool to address questions such as:
• What caused a specific activity?
• What were the resource and load demands of today's instance activity compared with that of a previous day's?
• Is an instance imposing different load levels now than previously?
• How do we explain the difference in a SQL performance compared with a previous period?
• What are the differences in program characteristics over two periods that caused different performance?
After identifying the different resource usage, you can use compare to identify what caused this difference: Usage pattern? Different SQL behavior? Environmental problem?
Overall Activity
The upper third Overall Activity panes graphically displays the Workload and SQL
Executions and itemizes those wait events whose activity is significantly ( ) or
moderately ( ) different between the two comparisons. Expanding a specific wait

94 Foglight Performance Analysis for DB2 LUWUser Guide
event displays graphically its occurrence over the source and target. (Workloads which
are similar over the source and target are designated with a yellow icon ( )).
Use this section to understand which wait states are most resource-demanding and likely causing the difference in resource usage or whether the difference in behavior can be explained by the difference in quantity of SQL executions.
Note The graphical comparisons are on an absolute time basis, with the period commencements aligned.
Activity Highlights
For the wait event in focus, the middle Activity Highlights section displays the dimensions (of up to the top five) which were significant elements of the difference. Expanding the individual lines displays the dimension members which caused the difference and the composing metrics whose differences exceed the specified threshold.
Use the set of performance related metrics (defined by the chosen resource) to help you explain the difference in resource consumption; for example, a rise in I/O Wait might be explained by a rise in the quantity of physical reads.
All the Comparison Results thresholds (see “Compare” on page 93) and Metric Totaling methods are configurable.
Environment
The Environment section displays key metric values as occurred in both source and target, regardless of their absolute or relative value or difference. The displayed metrics reflect total instance or system activity, which are considered as an environmental factor that might affect the application behavior. Use this section to understand whether system or instance level problems are externally affecting your application so as to be the root cause of a problem (rather than the application itself). For example, an increase in the non-DB2 CPU consumption might explain an increase in a DB2 CPU wait state (as external applications consume more CPU, DB2 must wait more for CPU to become available).
Related Topics
“Running Comparisons” on page 95
“History Mode” on page 57

Compare 95Running Comparisons
Running ComparisonsRun comparisons and display, save print reports through the Compare screen. The default settings are context sensitive with the time ranges and dimensions reflecting the settings in effect when the comparison was launched.
Opening the Compare window
The Compare window can be accessed from several locations in Foglight Performance Analysis for DB2 LUW.
• toolbar icon in the Home and History pages
• selecting Compare from the action menu in the History page navigation tree or Tops or Time Breakdown tabs
• Reports page
To run a comparison
1 Open the Compare window as explained above.
2 In the Compare Options (left middle) pane, click Start a new comparison to define the comparison input parameters. Each definition option opens a comparison customization window. Parameter options:
• Same object activity within a different time range
• Different object activity within the same time range
• Different object activity within a different time range
• Modify source settings
3 Click Compare.
You can run a different comparison by repeating step 2, changing the comparison options and clicking Compare.
To save an existing comparison
1 In the Compare Options area select Save compare settings as...
2 Enter name for the comparison settings and click Save.
To rerun a saved comparison
Select a Saved Comparison in the lower left pane.
96 Foglight Performance Analysis for DB2 LUWUser Guide
To remove a saved comparison
1 In the Saved Comparisons area, click the More Comparisons icon to open the Saved Comparisons dialog.
2 Click Remove this comparison from the list icon.
To print the comparison in a report
• Click the Print Report button.
Related Topics
“Compare” on page 93
“Reports” on page 97
“Reports and Templates” on page 103
97Designing a Report
Reports
Foglight Performance Analysis for DB2 LUW reports assist DBAs and managers in understanding their system's unique behavior:
• Run context-sensitive reports on a one-time basis or at scheduled intervals.
• Create custom reports based on Foglight Performance Analysis for DB2 LUW built-in templates.
• Create, save and later modify custom report templates.
• View reports directly in Foglight Performance Analysis for DB2 LUW.
• Output reports in a variety of formats for periodic delivery, distribution and archiving.
• Save reports and templates for easy retrieval.
• Automatically deploy reports on the web or other public folders for easy updating of relevant personnel.
• The Reports navigation pane allows users to quickly determine the type of report to generate.
Related Procedures and Topics
“Running Comparisons” on page 95
“Generating a Report” on page 99
“Saving, Printing and Output of a Report” on page 100
“Scheduling and Delivery” on page 100
“Reports” on page 97
“Reports and Templates” on page 103
Designing a ReportReports can be run from built-in or user designed templates with various customization and context-sensitive options.

98 Foglight Performance Analysis for DB2 LUWUser Guide
To create a new report from scratch
1 Switch to the Report mode if necessary.
2 Select a Report Type in the Navigation tree.
3 Open the report wizard by doing one of the following:
• Right-click and select Add new report.
• Double-click Add new report in the Reports pane.
4 Proceed with the relevant wizard instructions for adding your chosen report and save your report.
To create a custom report from an existing template
1 Open the Reports wizard by doing one of the following:
• In the Reports mode, double click on a specific report in the Navigation tree or the Reports pane (or right click and select Execute).
• In the History mode, select either a:
• Node in the Navigation tree
• Activity line in the Time Breakdown Tab
• Dimension value (for example, SQL Statement) or group in the Tops Tab
A report wizard opens at the Summary page with default settings based on the mode you launched from.
2 Edit the values in the Summary page and click Back to edit other pages as needed.
3 When done, save your report.
Note Executive Workload and Database Overview Summary reports can also be accessed from the Home and History mode toolbars.
Compare Reports
See “Running Comparisons” on page 95.
Related Topics
“Generating a Report” on page 99
“Saving, Printing and Output of a Report” on page 100
“Scheduling and Delivery” on page 100
99Generating a Report
“Reports and Templates” on page 103
Generating a ReportContext-sensitive reports can be launched from the following locations. They can be run as is or customized.
An overview is available of the various Reports and Templates.
Context-sensitive reports can be launched:
• From the Home or History Pages by clicking the
• icon for the Executive Workload Summary Report or Database Overview Summary Report
• icon for a Compare Report
• From the History Page, by right-clicking a dimension type (e.g. SQL Statements) or dimension value, or by choosing a time from the Time Breakdown and selecting Report > [report type] or Compare for a comparison report
• From the Reports Page by selecting the type of report to generate
Context-sensitive reports can be run as-is or can be customized.
To customize a report
1 Edit the values in the Summary page and click Back to edit other report settings as desired.
2 Click the hyperlink to see an overview of the various Reports and Templates.
For Compare reports: see “Running Comparisons” on page 95.
Related Procedures and Topics
“Running Comparisons” on page 95
“Saving, Printing and Output of a Report” on page 100
“Scheduling and Delivery” on page 100
“Reports” on page 97
“Reports and Templates” on page 103
100 Foglight Performance Analysis for DB2 LUWUser Guide
Saving, Printing and Output of a ReportReports can be output in a variety of formats for effortless periodic delivery, distribution and archiving, saved in the Foglight Performance Analysis Client and later deployed. Reports can also be printed or viewed on the screen.
Note Built-in report templates cannot be overwritten.
Use the Scheduling Properties dialog's Delivery Options tab to define the printing and output settings.
• To print a report: select Print Report and click Finish.
• To view a report: select Preview Report on Screen and click Finish.
• To store a report in the local Foglight Performance Analysis report directory: select Save to Performance Analysis and click Finish.
• To Compare reports: see “Running Comparisons” on page 95.
Related Procedures and Topics
“Running Comparisons” on page 95
“Generating a Report” on page 99
“Scheduling and Delivery” on page 100
“Reports” on page 97
“Reports and Templates” on page 103
Scheduling and DeliveryManage the scheduling and delivery of reports through the Scheduling Properties dialog which can be accessed by selecting Schedule in the Reports wizard Summary or from the pop-up report menu.
Schedule TabSelect the report’s start time and start date, and determine how frequently the report should be run including:

101Scheduling and Delivery
• Weekly: on specific weekdays, every weekday or only on weekends
• Monthly: on specific days of the month or the occurrence of a day within a month (example Third Monday)
• One-time only: run once on the selected Start time and Start date
For reports to be run as scheduled, the Windows task schedule systems service must be running and the client must be active and have a network connection.
Windows Scheduler Account Information
The Reports Wizard uses the account already defined in the Performance Analysis Configuration Scheduler.
If no such accounts exists, do one of the following:
• Close this wizard and define the account in the Performance Analysis Configuration Scheduler.
• Specify the account on the fly by clicking Edit Account...
Delivery Options TabUse this tab to set the Report output's destination (target) and format.
Check one or more of the following options:
Output to Performance Analysis
• The report template and all reports generated from this template will be archived and accessible in the Performance Analysis tree node.
• Reports generated from the template at the specified intervals will be accessible in the Reports pane on the right.
Output to the following directory
• The report template and all reports generated from this template will be stored in the specified (type or browse) location.
• The account used must have WRITE permissions in that location.
• Periodic updates can be stored on public folders or web-accessible addresses for controlled dissemination of key performance indicators.
102 Foglight Performance Analysis for DB2 LUWUser Guide
Output by Email to the following addresses
• Reports will be sent by email, as attachments, to the specified addresses.
• Delimit recipients with a semicolon.
• No validity or receipt checks will be performed and the recipients will be unable to reply to the sender.
• Click Set SMTP Properties... to define the Simple Mail Transfer Protocol and sender information.
Related Procedures and Topics
“Running Comparisons” on page 95
“Generating a Report” on page 99
“Saving, Printing and Output of a Report” on page 100
“Reports” on page 97
“Reports and Templates” on page 103
Reports and Templates 103Scheduling and Delivery
Reports and Templates
Report templates provide a ready mechanism for an automatic creation and distribution
of usage reporting of general interest. For example, a daily report of intensive resource users can be automatically published on an intranet site for wide dissemination, awaiting your morning arrival. In this manner, customized reports can fulfill key DBA monitoring and reporting responsibilities.
Foglight Performance Analysis for DB2 LUW allows you to select from among nine types of reports. From within each group, you can customize a report (by changing any of its arguments and display formats) and save it as a report template. Performance Analysis provides built-in default reports for some report groups.
The existing report groups are displayed in the table below with links to more detailed information and procedures for each.
Report Description
Executive Workload Summary
A one-click report that delivers the information displayed on the Home Page to key decision-makers.
Database Overview Summary
Provides database active time, DB2 and operating system resource consumption forthose databases observed to be active.
Activity Report Allow users to see the impact of a given dimension over time in a format similar to that of the Foglight Performance Analysis for DB2 LUW history page.
Throughput Report Provide a clear indication of application environment efficiency. For example, userscan clearly see how SQL Executions compare to CPU consumption during a specifiedtime frame.
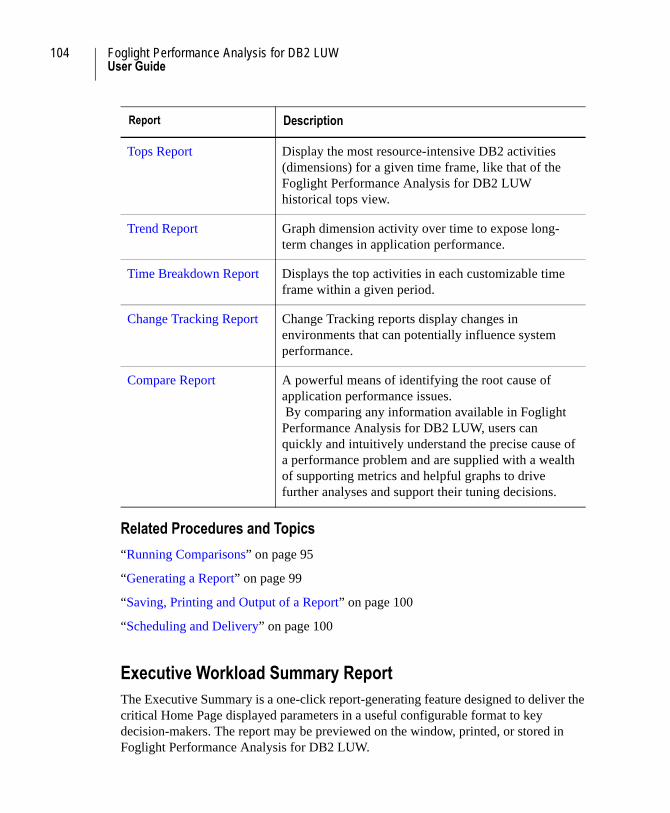
104 Foglight Performance Analysis for DB2 LUWUser Guide
Related Procedures and Topics
“Running Comparisons” on page 95
“Generating a Report” on page 99
“Saving, Printing and Output of a Report” on page 100
“Scheduling and Delivery” on page 100
Executive Workload Summary ReportThe Executive Summary is a one-click report-generating feature designed to deliver the critical Home Page displayed parameters in a useful configurable format to key decision-makers. The report may be previewed on the window, printed, or stored in Foglight Performance Analysis for DB2 LUW.
Tops Report Display the most resource-intensive DB2 activities (dimensions) for a given time frame, like that of the Foglight Performance Analysis for DB2 LUW historical tops view.
Trend Report Graph dimension activity over time to expose long-term changes in application performance.
Time Breakdown Report Displays the top activities in each customizable time frame within a given period.
Change Tracking Report Change Tracking reports display changes in environments that can potentially influence system performance.
Compare Report A powerful means of identifying the root cause of application performance issues. By comparing any information available in Foglight Performance Analysis for DB2 LUW, users can quickly and intuitively understand the precise cause of a performance problem and are supplied with a wealth of supporting metrics and helpful graphs to drive further analyses and support their tuning decisions.
Report Description
Reports and Templates 105Scheduling and Delivery
Wizard and TemplatesThis report is defined in the following wizard screens. Additional help is available by clicking on the relevant topic link
• Metrics:
• Select Metrics for Resource - select here the resource for display as the upper graph. The most resource demanding elements for the specified dimension are displayed and sorted, according to the selected resource. The chosen resource determines which metrics are available for the other presentations in the report.
• Select from among the potential metric set that will appear in the table for each time unit in the reporting period.
• Time Range
• Summary
Foglight Performance Analysis for DB2 LUW provides a read-only report template: Workload summary for the last 24 hours which displays Workload and health summary for the DB2 instance and the underlying Operating system.
You can run this template as is or generate customized reports by temporarily modifying the template settings.
Related Procedures and Topics
“Running Comparisons” on page 95
“Generating a Report” on page 99
“Saving, Printing and Output of a Report” on page 100
“Scheduling and Delivery” on page 100
“Reports” on page 97
“Reports and Templates” on page 103
Database Overview Summary ReportThe Database Overview Summary Report provides database active time, DB2 and operating system resource consumption for those databases observed to be active.
106 Foglight Performance Analysis for DB2 LUWUser Guide
Wizard and Templates
This report is defined in the following wizard screens. Additional help is available by clicking on the relevant topic link.
1 Time Range
2 Summary
Foglight Performance Analysis for DB2 LUW provides a read-only report template: DB2 overview for the last 24 hours which displays database active time and DB2 and Operating System resource consumption for those databases observed to be active during the monitored time frame.
You can run this template as is or generate customized reports by temporarily modifying the template settings.
Related Procedures and Topics
“Running Comparisons” on page 95
“Generating a Report” on page 99
“Saving, Printing and Output of a Report” on page 100
“Scheduling and Delivery” on page 100
“Reports” on page 97
“Reports and Templates” on page 103
Activity ReportThe Activity report traces the activity and impact of a specific DB2 entity in a specific time frame. The report is modeled on the Foglight Performance Analysis for DB2 LUW historical diagnostics screens and gives an overview of behavior of a specific DB2 activity over time.
Wizard and Templates
This report is defined in the following wizard screens. Additional help is available by clicking on the relevant topic link.
1 Dimensions: choose to include in your report template either:
• Instance - Entire unfiltered Instance Level activity.

Reports and Templates 107Scheduling and Delivery
• Specify Activity Filter - Activity for up to three dimensions. At least one or more databases must be selected.
2 Metrics:
• Select Metrics for Resource - select here the resource for display as the upper graph. The most resource demanding elements for the specified dimension are displayed and sorted, according to the selected resource. The chosen resource determines which metrics are available for the other presentations in the report.
• Display Timeline Graph for - metric to be displayed in the lower graph.
• Select from among the potential metric set that will appear in the table for each time unit in the reporting period.
3 Time Range
4 Summary
You can run built-in Activity report templates (see “Activity Report Templates” on page 181) or generate customized reports by temporarily modifying the template settings.
Related Procedures and Topics
“Running Comparisons” on page 95
“Generating a Report” on page 99
“Saving, Printing and Output of a Report” on page 100
“Scheduling and Delivery” on page 100
“Reports” on page 97
“Reports and Templates” on page 103
Throughput ReportThe Throughput report shows the throughput of a specific resource as a result of the load placed upon the resource by a given DB2 entity. The most common Template defaults: Upper is response time and lower is load (example CPU usage compared with SQL executions) so that variable functions can be compared one to another.

108 Foglight Performance Analysis for DB2 LUWUser Guide
Wizard and Templates
This report is defined in the following wizard screens. Additional help is available by clicking on the relevant topic link.
1 Dimensions: choose to include in your report template either:
• Instance - Entire unfiltered Instance Level activity.
• Specify Activity Filter - Activity for up to three dimensions. At least one or more databases must be selected.
2 Metrics:
• Select Metrics for Resource - select here the resource for display as the upper graph. The most resource demanding elements for the specified dimension are displayed and sorted, according to the selected resource. The chosen resource determines which metrics are available for the other presentations in the report.
• Display Timeline Graph for - metric to be displayed in the lower graph.
• Select from among the potential metric set that will appear in the table for each time unit in the reporting period.
3 Time Range
4 Summary
You can run built-in Throughput Report Templates or generate customized reports by temporarily modifying the template settings.
Related Procedures and Topics
“Running Comparisons” on page 95
“Generating a Report” on page 99
“Saving, Printing and Output of a Report” on page 100
“Scheduling and Delivery” on page 100
“Reports” on page 97
“Reports and Templates” on page 103
Reports and Templates 109Scheduling and Delivery
Tops ReportThe Tops report displays the most resource-intensive DB2 activities (dimensions) for a given time frame, like that of the Foglight Performance Analysis for DB2 LUW historical tops view.
Wizard and Templates
This report is defined in the following wizard screens. Additional help is available by clicking on the relevant topic link.
1 Dimensions: choose to include in your report template either:
• Instance - Entire unfiltered Instance Level activity.
• Specify Activity Filter - Activity for up to three dimensions. At least one or more databases must be selected.
2 Metrics:
• Select Metrics for Resource: select here the resource for display as the upper graph. The most resource demanding elements for the specified dimension are displayed and sorted, according to the selected resource. The chosen resource determines which metrics are available for the other presentations in the report.
• Show Top <number> <dimensions>: Determines the number of top dimension activities to be displayed. For example, display top five SQL statements.
• For TSQL Batches, a Group Batches check box allows you to sort the TSQL Batch results into the following groupings, as appropriate: Stored Procedures, Functions, Triggers and Others.
• Sorted By—determines the metric by the top results will be sorted (though not selected as the selection is according to the selected resource). The default is always according to the selected resource.
3 Time Range
4 Summary
You can run built-in Tops Report Templates or generate customized reports by temporarily modifying the template settings.
Related Procedures and Topics
“Running Comparisons” on page 95
“Generating a Report” on page 99
110 Foglight Performance Analysis for DB2 LUWUser Guide
“Saving, Printing and Output of a Report” on page 100
“Scheduling and Delivery” on page 100
“Reports” on page 97
“Reports and Templates” on page 103
Trend ReportTop aggregation over time. The reported trend is that of the most resource demanding, over time.
Wizard and Templates
This report is defined in the following wizard screens. Additional help is available by clicking on the relevant topic link.
1 Dimensions: choose to include in your report template either:
• Instance - Entire unfiltered Instance Level activity.
• Specify Activity Filter - Activity for up to three dimensions. At least one or more databases must be selected.
2 Metrics:
• Select Metrics for Resource - select here the resource for display as the upper graph. The most resource demanding elements for the specified dimension are displayed and sorted, according to the selected resource. The chosen resource determines which metrics are available for the other presentations in the report.
• Show Top <number> <dimensions>: Determines the number of top dimension activities to be displayed. For example, display top five SQL statements.
• Sorted By: Determines the metric by the top results will be sorted (though not selected as the selection is according to the selected resource). The default is always according to the selected resource.
3 Time Range
4 Summary
You can run built-in Trend Report Templates or generate customized reports by temporarily modifying the template settings.
Reports and Templates 111Scheduling and Delivery
Related Procedures and Topics
“Running Comparisons” on page 95
“Generating a Report” on page 99
“Saving, Printing and Output of a Report” on page 100
“Scheduling and Delivery” on page 100
“Reports” on page 97
“Reports and Templates” on page 103
Time Breakdown ReportThe Time breakdown report displays the top activities in each customizable time frame within a given period.
Wizard Screens
This report is defined in the following wizard screens. Additional help is available by clicking on the relevant topic link.
1 Dimensions: choose to include in your report template either:
• Instance - Entire unfiltered Instance Level activity.
• Specify Activity Filter - Activity for up to three dimensions. At least one or more databases must be selected.
2 Metrics:
• Select Metrics for Resource: select here the resource for display as the upper graph. The most resource demanding elements for the specified dimension are displayed and sorted, according to the selected resource. The chosen resource determines which metrics are available for the other presentations in the report.
• Show Top <number> <dimensions>: Determines the number of top dimension activities to be displayed. For example, display top five SQL statements.
• For TSQL Batches, a Group Batches check box allows you to sort the TSQL Batch results into the following groupings, as appropriate: Stored Procedures, Functions, Triggers and Others.

112 Foglight Performance Analysis for DB2 LUWUser Guide
• Sorted By: determines the metric by the top results will be sorted (though not selected as the selection is according to the selected resource). The default is always according to the selected resource.
3 Time Range
4 Summary
Related Procedures and Topics
“Running Comparisons” on page 95
“Generating a Report” on page 99
“Saving, Printing and Output of a Report” on page 100
“Scheduling and Delivery” on page 100
“Reports” on page 97
“Reports and Templates” on page 103
Change Tracking ReportFor instances with an installed repository, change tracking reports display changes in environments and activity that can potentially influence system performance and enables the user to view correlation between occurrences of changes and DB2's activity and behavior patterns.
Change Tracking Wizard Screens
This report is defined in the following wizard screens. Additional help is available by clicking on the relevant topic link.
1 Change Types: specify here the change tracking events to be included in the report.
2 Time Range
3 Summary
You can run built-in Change Tracking Report Template or generate customized reports by temporarily modifying the template settings.
Related Procedures and Topics
“Running Comparisons” on page 95

Reports and Templates 113Scheduling and Delivery
“Generating a Report” on page 99
“Saving, Printing and Output of a Report” on page 100
“Scheduling and Delivery” on page 100
“Reports” on page 97
“Reports and Templates” on page 103
Compare ReportThe Compare Report helps determine whether a comparison occurrence is an isolated incident or a sign of a potentially significant performance problem. The comparison can be of: whole instances or selected dimension breakdowns (such as user or SQL).
• For detailed information about the Compare tool: see “Compare” on page 93.
• To generate a compare report: see “Running Comparisons” on page 95.
Related Procedures and Topics
“Generating a Report” on page 99
“Saving, Printing and Output of a Report” on page 100
“Scheduling and Delivery” on page 100
“Reports” on page 97
“Reports and Templates” on page 103
Report Time Range and IntervalsUse this screen to specify a time range and data interval for the report.
Time Range
Select one of the following options.
Predefined Time Range
The report will be generated the selected period. Options:
• system default
• user-defined in the History page time selector

114 Foglight Performance Analysis for DB2 LUWUser Guide
Specific Time Range
The report will be generated for the time range specified.
1 Specify a day and hour in the From range. Click Minimum to specify the earliest available time and date.
2 Specify a day and hour in the To range. Click Maximum to specify the earliest available time and date.
Data Interval
The report will be generated using selected data interval resolution. The options are based on the selected time range with the default being the optimum resolution for that range.
Related Procedures and Topics
“Running Comparisons” on page 95
“Generating a Report” on page 99
“Saving, Printing and Output of a Report” on page 100
“Scheduling and Delivery” on page 100
“Reports” on page 97
“Reports and Templates” on page 103
Report SummaryUse this screen to summarize and manage the report information.
Additional Comments
Information in this read-only field is based on wizard settings and describes the information, time range, and data interval resolution to be displayed in the report.
Save Definitions
Enter a Report name and Description and Click Save to save the report.
Reports and Templates 115Scheduling and Delivery
Scheduling and Delivery
Click Schedule to open the Scheduling Properties dialog and define settings for the Scheduling and Delivery of the report.
Output and Storage Options
Select one of the following:
• Preview Report on Screen - the report will be displayed in the Reports (right) pane.
• Print Report - the report will be printed on the selected printer.
• Save to Performance Analysis - the report will be saved on the local disk and accessible through the Reports (right) pane.
Report Preferences
Click Preferences to open the Report Wizard Preferences dialog to change the settings for:
• Metrics Calculation
• Graph “look and feel”
Related Procedures and Topics
“Running Comparisons” on page 95
“Generating a Report” on page 99
“Saving, Printing and Output of a Report” on page 100
“Scheduling and Delivery” on page 100
“Reports” on page 97
“Reports and Templates” on page 103
116 Foglight Performance Analysis for DB2 LUWUser Guide
7
Agent Administration
Click Agent Administration ( ) to display the Agent Administration screen.
This utility lets you configure the Foglight Performance Analysis Agent components behavior.
All changes made in this utility influence the collection of data.
Related Topics
“StealthCollect™ Agent” on page 117
“History Collection” on page 121
“Agent Options” on page 126
“Performance Repository” on page 127
“Home Page” on page 130
“IntelliProfile™ (Baseline)” on page 130
“Support” on page 131
“Adding the Performance Repository” on page 132
“Starting and Stopping the Quest Launcher” on page 133
StealthCollect™ Agent
1 Click Agent Administration ( ) to display the StealthCollect Agent tab -OR-
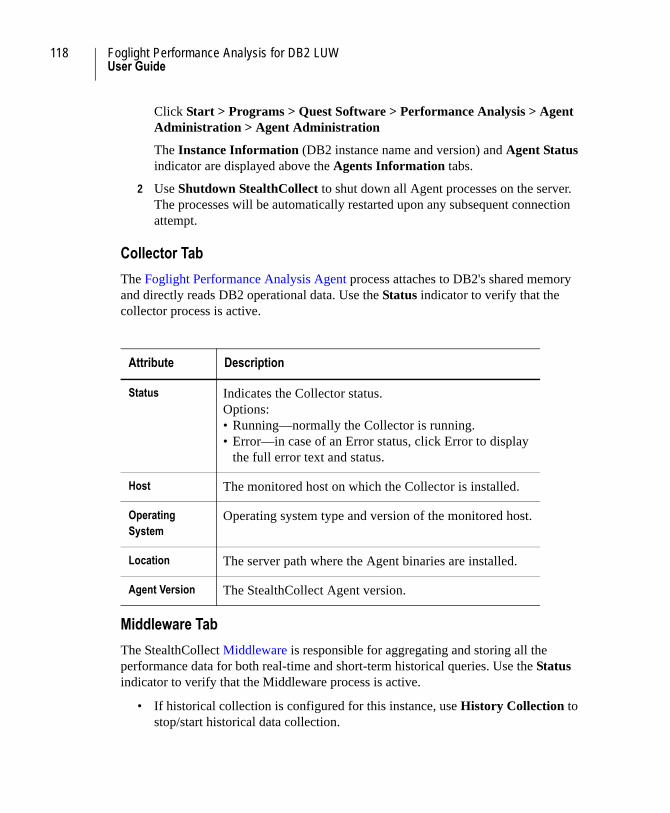
118 Foglight Performance Analysis for DB2 LUWUser Guide
Click Start > Programs > Quest Software > Performance Analysis > Agent Administration > Agent Administration
The Instance Information (DB2 instance name and version) and Agent Status indicator are displayed above the Agents Information tabs.
2 Use Shutdown StealthCollect to shut down all Agent processes on the server. The processes will be automatically restarted upon any subsequent connection attempt.
Collector Tab
The Foglight Performance Analysis Agent process attaches to DB2's shared memory and directly reads DB2 operational data. Use the Status indicator to verify that the collector process is active.
Middleware Tab
The StealthCollect Middleware is responsible for aggregating and storing all the performance data for both real-time and short-term historical queries. Use the Status indicator to verify that the Middleware process is active.
• If historical collection is configured for this instance, use History Collection to stop/start historical data collection.
Attribute Description
Status Indicates the Collector status.Options:• Running—normally the Collector is running.• Error—in case of an Error status, click Error to display
the full error text and status.
Host The monitored host on which the Collector is installed.
Operating System
Operating system type and version of the monitored host.
Location The server path where the Agent binaries are installed.
Agent Version The StealthCollect Agent version.
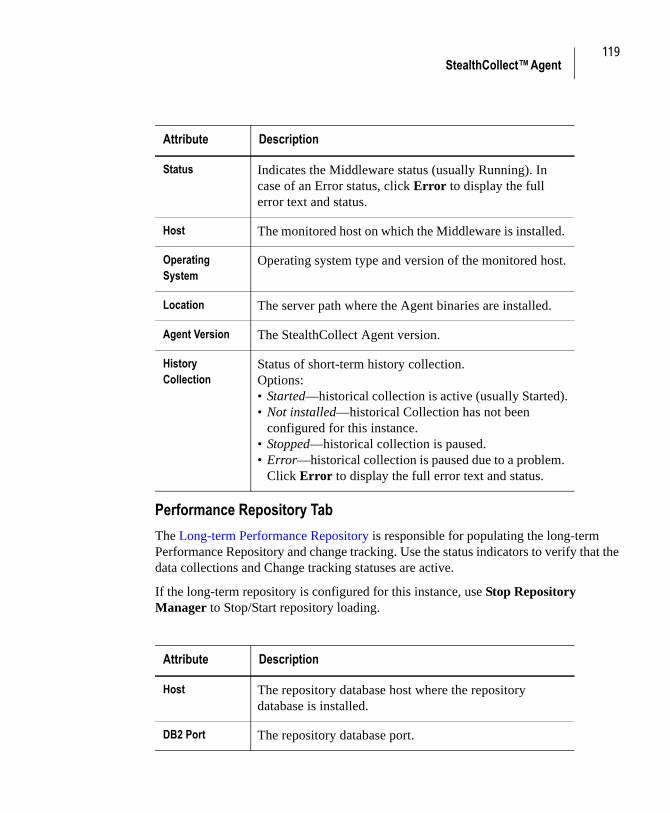
119StealthCollect™ Agent
Performance Repository Tab
The Long-term Performance Repository is responsible for populating the long-term Performance Repository and change tracking. Use the status indicators to verify that the data collections and Change tracking statuses are active.
If the long-term repository is configured for this instance, use Stop Repository Manager to Stop/Start repository loading.
Attribute Description
Status Indicates the Middleware status (usually Running). In case of an Error status, click Error to display the full error text and status.
Host The monitored host on which the Middleware is installed.
Operating System
Operating system type and version of the monitored host.
Location The server path where the Agent binaries are installed.
Agent Version The StealthCollect Agent version.
History Collection
Status of short-term history collection.Options:• Started—historical collection is active (usually Started).• Not installed—historical Collection has not been
configured for this instance. • Stopped—historical collection is paused.• Error—historical collection is paused due to a problem.
Click Error to display the full error text and status.
Attribute Description
Host The repository database host where the repository database is installed.
DB2 Port The repository database port.
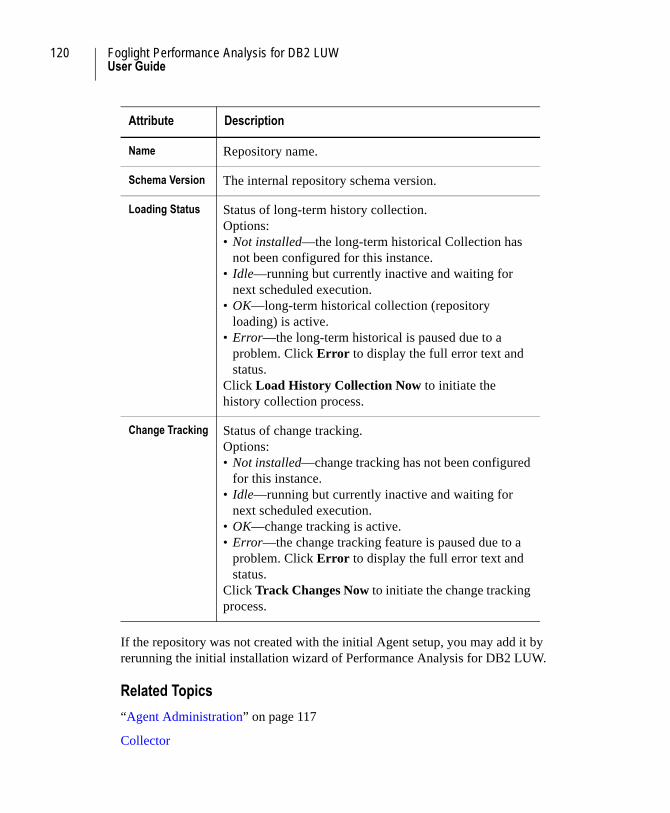
120 Foglight Performance Analysis for DB2 LUWUser Guide
If the repository was not created with the initial Agent setup, you may add it by rerunning the initial installation wizard of Performance Analysis for DB2 LUW.
Related Topics
“Agent Administration” on page 117
Collector
Name Repository name.
Schema Version The internal repository schema version.
Loading Status Status of long-term history collection.Options:• Not installed—the long-term historical Collection has
not been configured for this instance. • Idle—running but currently inactive and waiting for
next scheduled execution.• OK—long-term historical collection (repository
loading) is active.• Error—the long-term historical is paused due to a
problem. Click Error to display the full error text and status.
Click Load History Collection Now to initiate the history collection process.
Change Tracking Status of change tracking.Options:• Not installed—change tracking has not been configured
for this instance. • Idle—running but currently inactive and waiting for
next scheduled execution.• OK—change tracking is active.• Error—the change tracking feature is paused due to a
problem. Click Error to display the full error text and status.
Click Track Changes Now to initiate the change tracking process.
Attribute Description
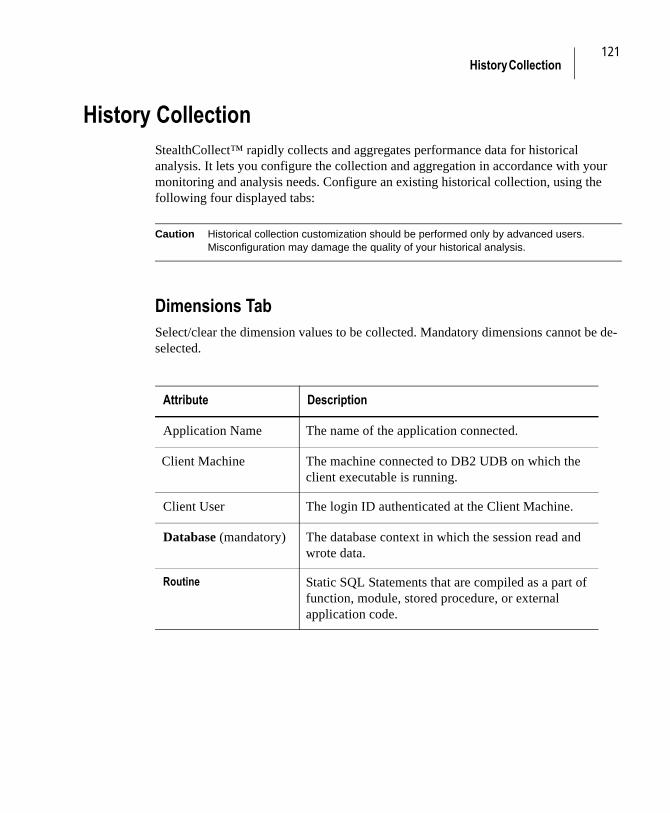
121History Collection
History CollectionStealthCollect™ rapidly collects and aggregates performance data for historical analysis. It lets you configure the collection and aggregation in accordance with your monitoring and analysis needs. Configure an existing historical collection, using the following four displayed tabs:
Caution Historical collection customization should be performed only by advanced users. Misconfiguration may damage the quality of your historical analysis.
Dimensions TabSelect/clear the dimension values to be collected. Mandatory dimensions cannot be de-selected.
Attribute Description
Application Name The name of the application connected.
Client Machine The machine connected to DB2 UDB on which the client executable is running.
Client User The login ID authenticated at the Client Machine.
Database (mandatory) The database context in which the session read and wrote data.
Routine Static SQL Statements that are compiled as a part of function, module, stored procedure, or external application code.
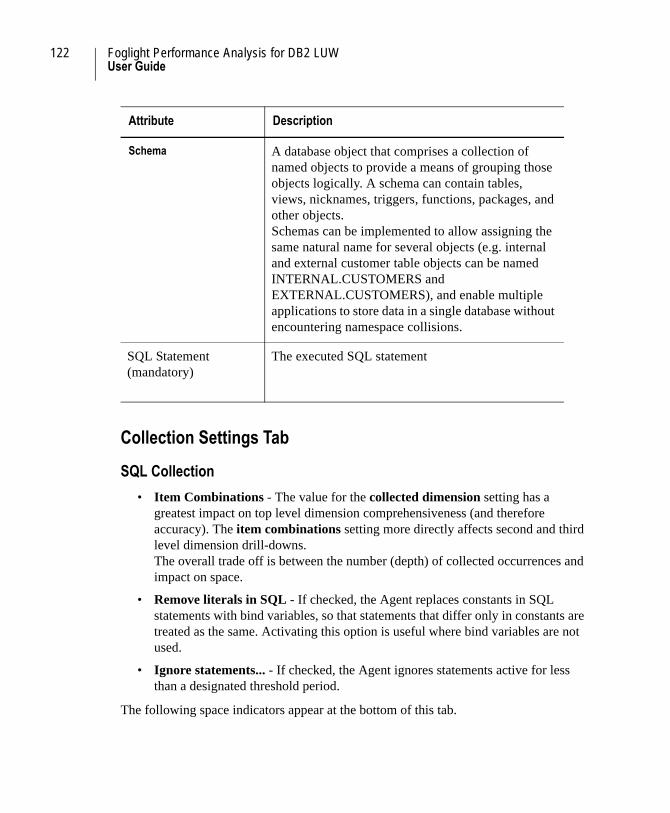
122 Foglight Performance Analysis for DB2 LUWUser Guide
Collection Settings Tab
SQL Collection
• Item Combinations - The value for the collected dimension setting has a greatest impact on top level dimension comprehensiveness (and therefore accuracy). The item combinations setting more directly affects second and third level dimension drill-downs.The overall trade off is between the number (depth) of collected occurrences and impact on space.
• Remove literals in SQL - If checked, the Agent replaces constants in SQL statements with bind variables, so that statements that differ only in constants are treated as the same. Activating this option is useful where bind variables are not used.
• Ignore statements... - If checked, the Agent ignores statements active for less than a designated threshold period.
The following space indicators appear at the bottom of this tab.
Schema A database object that comprises a collection of named objects to provide a means of grouping those objects logically. A schema can contain tables, views, nicknames, triggers, functions, packages, and other objects. Schemas can be implemented to allow assigning the same natural name for several objects (e.g. internal and external customer table objects can be named INTERNAL.CUSTOMERS and EXTERNAL.CUSTOMERS), and enable multiple applications to store data in a single database without encountering namespace collisions.
SQL Statement(mandatory)
The executed SQL statement
Attribute Description
123History Collection
Middleware Disk Space
Short term historical data (one and fifteen minute data resolution data) is stored in files on the Middleware host.
• The Estimated required entire space was Allocated during installation. Any changes will be applied immediately once the new storage model is finalized.
• The Free space is the available unused space in the agent directory. If the value for Free space is less than that for the Allocated, the value will appear in red and you must either select a less demanding history model free space in the agent directory, or perform Space Allocation Override.
Performance Repository Space
This applies to installations including the long-term Performance Repository. These tablespaces constitute the long-term historical data.
• The Estimated size of the repository schema includes all tables and indexes. As the long-term Performance Repository houses historical data for several years, and databases can be configured to auto-grow, the allocation can occur dynamically.
• The Allocated space has already been used by the Repository. If the value for Free space is less than that needed to allow the schema to expand to that of the total Estimated size, it appears in orange, indicating that more space should be added to the tablespaces as historical data is added, i.e. you may proceed without adjustments, though you will have to add additional space in the future.
The following space indicators appear at the bottom of this tab.
“Middleware Disk Space” on page 123
“Performance Repository Space ” on page 123
Time Pyramid TabUse this tab to provide optimized storage and performance. The logic of this model is based on the premise that the closer the data is to the present, the more granular (that is, measured in finer time units) it should be.
Placing the cursor focus on a Resolution line lets you change the storage duration in the sliding window box below and view the impact on the respective Middleware and repository space layers.
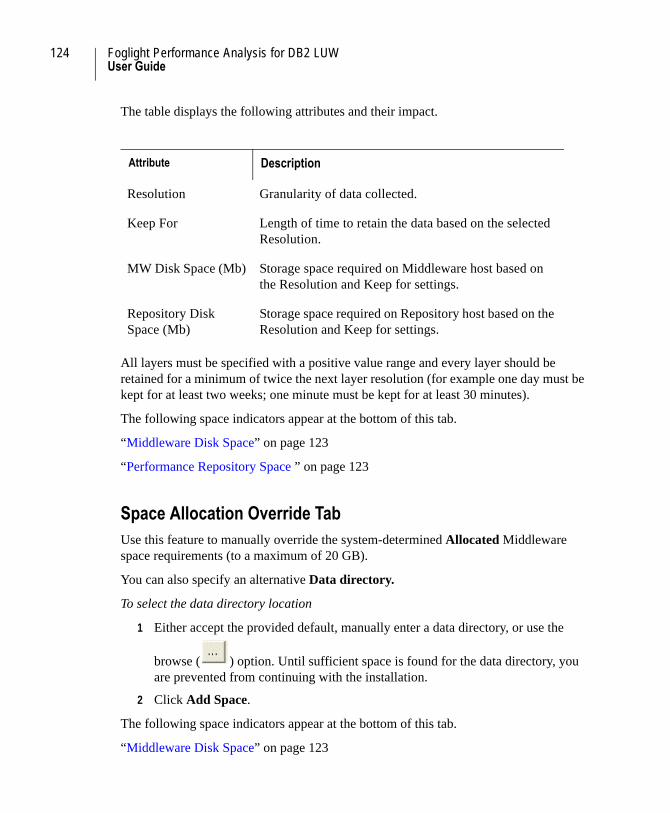
124 Foglight Performance Analysis for DB2 LUWUser Guide
The table displays the following attributes and their impact.
All layers must be specified with a positive value range and every layer should be retained for a minimum of twice the next layer resolution (for example one day must be kept for at least two weeks; one minute must be kept for at least 30 minutes).
The following space indicators appear at the bottom of this tab.
“Middleware Disk Space” on page 123
“Performance Repository Space ” on page 123
Space Allocation Override TabUse this feature to manually override the system-determined Allocated Middleware space requirements (to a maximum of 20 GB).
You can also specify an alternative Data directory.
To select the data directory location
1 Either accept the provided default, manually enter a data directory, or use the
browse ( ) option. Until sufficient space is found for the data directory, you are prevented from continuing with the installation.
2 Click Add Space.
The following space indicators appear at the bottom of this tab.
“Middleware Disk Space” on page 123
Attribute Description
Resolution Granularity of data collected.
Keep For Length of time to retain the data based on the selected Resolution.
MW Disk Space (Mb) Storage space required on Middleware host based on the Resolution and Keep for settings.
Repository Disk Space (Mb)
Storage space required on Repository host based on the Resolution and Keep for settings.

125Configuring User Defined Collections
“Performance Repository Space ” on page 123
Related Topic
“Agent Administration” on page 117
Configuring User Defined CollectionsUser-defined collections are a feature by which DB2 resource consumption can be analyzed over selected domains and filters across different time periods. This tab provides the following options:
• New... Launch the User Defined Collections creation wizard.
• Stop/Start – Pause/Recommence data collection for the User Defined Collections on the selected collection.
• Delete—delete the selected collection.
• Clear—erase the selected collection contents.
To view and configure existing User Defined Collections
• Double click the User Defined Collections pane listing of interest to display the defining set-up tabs:
Identification Tab
Displays the UDC name (read only) and description.
DB2 Dimensions Tab
(For viewing only) Displays those dimensions which are enabled in this collection.
Activity Filter Tab
(For viewing only) - Activity filters are a means to focus on and limit collections of occurrences of activities of interest. Activities are defined by their corresponding dimension values.
126 Foglight Performance Analysis for DB2 LUWUser Guide
Collection Settings Tab
Fine tune SQL collection settings and Wait and Lock event granularity rules, and rule exceptions. For further information, see History Collection > “Collection Settings Tab” on page 122.
Time Pyramid Tab
Optimize storage and performance and gain rapid access to the data of interest through the time pyramid settings. For further information, see History Collection > “Time Pyramid Tab” on page 123.
Scheduling Tab
Scheduling (for viewing only) - Displays the exact date and time at which the collection takes place.
Space Allocation Override Tab
Use this option to manually override the system-determined UDC disk space requirement by specifying an alternative disk allocation.
Related Topic
“Agent Administration” on page 117
Agent OptionsThe StealthCollect™ Collector process is responsible for sampling both the memory and the underlying operating system. The light-weight sampling combined with the high-frequency capacity is the StealthCollect technological core. The sampling frequency has a trade-off of data accuracy and application overhead. Higher sampling frequency yields more accurate data, at a cost of increased overhead on the monitored host.
To control the memory/OS sampling frequency:
Modify the DB2 Memory Sampling Rate as follows:
• Fixed - A Fixed number of samples are performed each second, regardless of the overhead imposed on the server.
127Performance Repository
• Automatic - The Agent automatically adjusts the sampling frequency such that the imposed overhead does not exceed the given threshold (as measured in % Server CPU usage); Yet this limitation itself does not lower the sampling frequency below that specified in the second criteria of the minimal acceptable (as measured in samples per second).
Clicking on either button lets you define each criteria with a more detailed resolution, consisting of the memory sampling and OS sampling components.
The StealthCollect Agent features a low-rate Dictionary Sampling for supplementary data. Adjust the collection and refresh sampling frequency (measured in hours), as desired. Click Refresh Now to initiate an immediate collection of dictionary information.
Related Topic
“Agent Administration” on page 117
Performance Repository
Identification TabThe repository manager is responsible for populating the long-term Performance Repository and manages the change tracking process (For more information, see “Foglight Performance Analysis Agent” on page 5.). Use the status indicators to verify that the data collections and change tracking processes are active.
Area Attribute Description
Repository Settings
Host The host on which the repository is installed.
DB2 Port The TCIP/IP port configured for the DB2 instance where the repository database has been created.
Database Name The name of the repository database.

128 Foglight Performance Analysis for DB2 LUWUser Guide
Change Tracking TabThe change tracking tool is an integrated monitoring feature available only if the long-term Performance Repository is installed. It periodically tracks changes in the operating system and database environments and activity that can potentially influence application performance. Change tracking enables the user to view the correlation between changes and DB2's activity and behavior patterns.
The change tracking process is performed by the StealthCollect Repository Manager.
To enable/disable Change Tracking:
• Select/clear the Enable change tracking check box.
To set the retention period for change tracking data:
• Set the period for which discovered change occurrences are stored in the Performance Repository by specifying the expiration period in the Expire changes after box (measured in days).
Important Change items dated beyond the threshold are automatically purged from the database).
To configure the tracked change types:
Tracked change types determine the monitored DB2 instance overhead and repository space requirements. Therefore, track only those change types which are relevant to your system.
• Select/clear the change types from their associated check boxes for the inclusion/exclusion of the change type.
To schedule the Change Tracking
1 Specify which days of the week, which exact time (hh:mm:ss) within these days the change tracking process is to be executed. By default, the process is executed daily at midnight.
Repository Manager
Version The StealthCollect™ Repository Manager version.
DB2 Repository account
Username The user under which the repository was accessed.
Area Attribute Description
129Performance Repository
2 Enable multiple daily Change Tracking in the times per day box.
Maintenance TabThe long-term Performance Repository is designed to hold a large volume of data, and has been designed with a built-in feature for analyzing its objects and rebuilding its indexes to ensure ongoing performance. The maintenance procedures are automatically executed in the background
Maintenance procedures can be initiated at any time by clicking Perform Now.
To customize the Repository Maintenance procedure:
1 Select/clear the Table REORG check box for inclusion/exclusion of this repository maintenance procedure.
2 Select/clear the Index REORG check box for inclusion/exclusion of this repository maintenance procedure.
3 Set the performance statistics and Change Analysis loading time (in seconds) thresholds which when exceeded trigger performance of the repository maintenance procedures.
4 Specify the minimal interval (in days) between each execution of maintenance procedures.
5 Select/clear the Daily maintenance check box for running the maintenance procedure on a daily basis.
6 Click Perform Now to perform (above) selected maintenance procedures.
Instance List TabThe instance (and host) data contained within the specified long-term Performance Repository database are listed here, in addition to space allocation totals.
Related Topic
“Agent Administration” on page 117
130 Foglight Performance Analysis for DB2 LUWUser Guide
Home PageThe Foglight Performance Analysis Home mode (page) is both the primary system health measurement functionality and the starting point for drill-down analysis through its user-configurable: alarming, normative baseline and applied knowledge base toolsets. Its digital dashboard at-a-glance comprehensiveness facilitates optimal user monitoring and tuning effort by intuitively focusing administrative attention on instance and system aspects most in need of attention.
Designate here the resource consumption thresholds for insignificant (green) and critical (red) levels relative to the total resource availability. Levels below the insignificant threshold or above the critical threshold are color-indicated.
Related Topic
“Agent Administration” on page 117
IntelliProfile™ (Baseline)The baseline algorithm parses sampled data into pre-defined time units (for example, day of the week) and distinct episodes (for example, systematically recurring spikes in CPU consumption). These episodes form the basis on which a normative distribution of instance behavior is projected, allowing for both exception monitoring and performance diagnostics. In this manner, the dynamically-created statistically-expected range of resource consumption for both overall workload and individual metrics lend themselves to configurable high and low metric values. The IntelliProfile engine learns the instance “signature” behavior characteristics via sophisticated algorithms to identify the various cyclical and periodic behavior and to neutralize and minimize the random noise distortion (for example, an employee absent due to illness). Its adaptive element grows “smarter” and more accurate with increases in the sampling period. Armed with this knowledge, IntelliProfile can project the acceptable/normal ranges of activity per each point in time.
General
Status - Enable/Disable the baseline functionality. When the adaptive engine is disabled, baseline data collection stops until re-enabled, but data collected until that moment remains available for the algorithm to process
131Support
IntelliProfile™
IntelliProfile™ is a “smart” functionality which continually learns the specific instance “signature” (and in the process builds the baseline) either automatically (recommended) or via a specified sample.
Excluded Periods
IntelliProfile™ can exclude abnormal periods whose data would distort calculation. Use the listing to specify periods to be excluded.
The IntelliProfile™ learning process is, by default, scheduled to occur in the early hours of the morning. As the specific instance “signature” understanding grows over time, the re-learning process is scheduled to occur at increasing intervals.
Related Topics
“Performance Baseline” on page 2
“Baseline” on page 142
“Agent Administration” on page 117
SupportTo access the Support Tools Utility:
• Select Agent Options | Support
or
start | Programs | Quest Software | Performance Analysis | Agent Administration | Utilities
The Quest Agent Support Tools dialog offers utilities to configure and manage the Agent settings and a means to generate a support bundle package of files required by Quest Support for diagnosing and troubleshooting your environment.
User Manager
This utility is designed to allow users with the Administrator role to grant or deny users access to the Agent and change passwords or roles. Other users are limited to changing their own passwords.
132 Foglight Performance Analysis for DB2 LUWUser Guide
For security purposes, Foglight Performance Analysis for DB2 LUW enables Administrators to define and maintain a list of users authorized to use the client software to access each DB2 instance. When a user attempts to use the client software to access a specific DB2 instance, the user is prompted to specify a DB User and password that appears on the list of authorized users for the DB2 instance.
Verify Accounts
This utility verifies that the DB2 and Agent accounts credentials supplied at the Foglight Performance Analysis (StealthCollect™) Agent installation stage is valid. This tool is required in environments in which passwords are periodically updated.
Support Bundle
StealthCollect has a built-in support utility that retrieves troubleshooting information from the system if you encounter a problem with it. When turning to support, you will be requested to generate and send a support bundle, through either of the following methods.
To fully service troubleshooting and diagnosis requests, use this utility to generate a package containing the requisite files for forwarding onto Quest support. In the displayed Support Bundle tab, select the Memory Monitor (Collector), Middleware, and Performance Analysis (GUI) check boxes as warranted and navigate to the directory in which the bundle is to be stored.
Related Topic
“Agent Administration” on page 117
Adding the Performance RepositoryThe value and power of Foglight Performance Analysis for DB2 LUW is enhanced when configured with a Performance Repository. If the repository was not created with the initial Agent setup, you may add it by re-configuring the Foglight Performance Analysis Agent.
To subsequently add the Long Term Performance Repository:
1 Launch the Foglight Performance Analysis for DB2 LUW Agent for DB2 Installer.
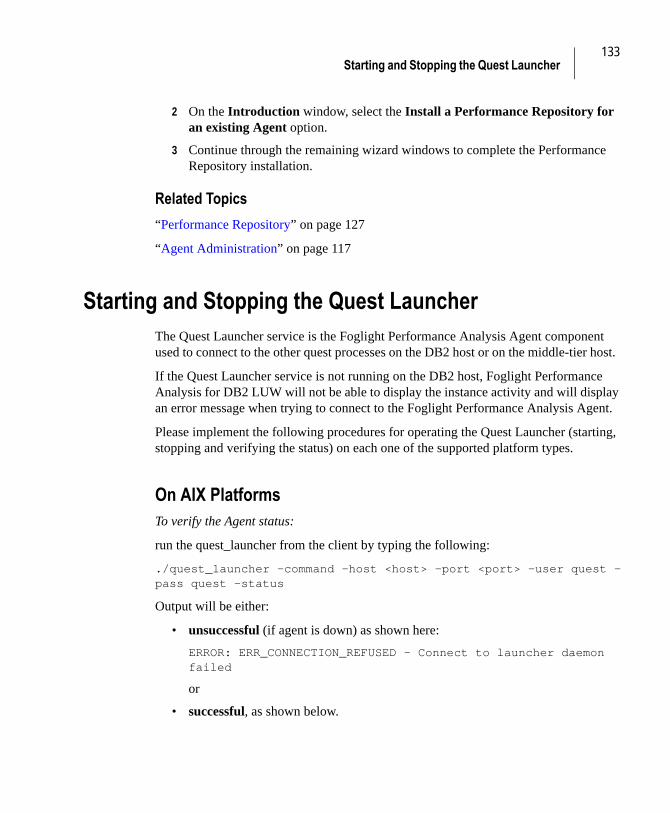
133Starting and Stopping the Quest Launcher
2 On the Introduction window, select the Install a Performance Repository for an existing Agent option.
3 Continue through the remaining wizard windows to complete the Performance Repository installation.
Related Topics
“Performance Repository” on page 127
“Agent Administration” on page 117
Starting and Stopping the Quest LauncherThe Quest Launcher service is the Foglight Performance Analysis Agent component used to connect to the other quest processes on the DB2 host or on the middle-tier host.
If the Quest Launcher service is not running on the DB2 host, Foglight Performance Analysis for DB2 LUW will not be able to display the instance activity and will display an error message when trying to connect to the Foglight Performance Analysis Agent.
Please implement the following procedures for operating the Quest Launcher (starting, stopping and verifying the status) on each one of the supported platform types.
On AIX Platforms To verify the Agent status:
run the quest_launcher from the client by typing the following:
./quest_launcher -command –host <host> -port <port> -user quest -pass quest –status
Output will be either:
• unsuccessful (if agent is down) as shown here:
ERROR: ERR_CONNECTION_REFUSED - Connect to launcher daemon failed
or
• successful, as shown below.
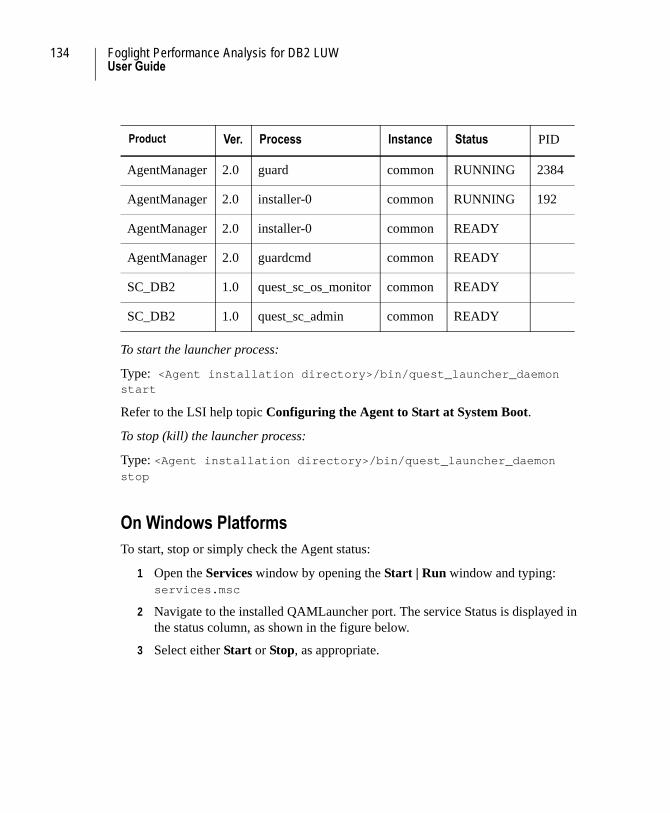
134 Foglight Performance Analysis for DB2 LUWUser Guide
To start the launcher process:
Type: <Agent installation directory>/bin/quest_launcher_daemon start
Refer to the LSI help topic Configuring the Agent to Start at System Boot.
To stop (kill) the launcher process:
Type: <Agent installation directory>/bin/quest_launcher_daemon stop
On Windows PlatformsTo start, stop or simply check the Agent status:
1 Open the Services window by opening the Start | Run window and typing: services.msc
2 Navigate to the installed QAMLauncher port. The service Status is displayed in the status column, as shown in the figure below.
3 Select either Start or Stop, as appropriate.
Product Ver. Process Instance Status PID
AgentManager 2.0 guard common RUNNING 2384
AgentManager 2.0 installer-0 common RUNNING 192
AgentManager 2.0 installer-0 common READY
AgentManager 2.0 guardcmd common READY
SC_DB2 1.0 quest_sc_os_monitor common READY
SC_DB2 1.0 quest_sc_admin common READY

135Starting and Stopping the Quest Launcher
Figure 1
Related Topic
“Agent Administration” on page 117

136 Foglight Performance Analysis for DB2 LUWUser Guide
137Home Configuration Tab
Foglight Performance Analysis Configuration
Click Display Options ( ) to display the Foglight Performance Analysis Configuration dialog.
This utility lets you configure the display and behavior of Foglight Performance Analysis. Configurations defined here affect only your client computer.
All changes made in this utility influence only display and not collection of data, which are principally defined in the StealthCollect™ Agent.
Related Topics
“Home Configuration Tab” on page 137
“Real-Time” on page 138
“History” on page 138
“General” on page 139
“Change Tracking” on page 140
“Compare” on page 141
“Scheduler” on page 142
“Baseline” on page 142
“Support” on page 143
Home Configuration TabUse the Home configuration tab to set the:
• Default time Range - Determines the period (Last 5 minutes, 15 minutes, 1 hour, 6 hours, 12 hours or 24 hours) which is to be displayed upon initial client connection to the monitored instance.
138 Foglight Performance Analysis for DB2 LUWUser Guide
• DB2 Default Monitor Switch Status Alert - If checked, the status of required default monitor switches is displayed.
Real-TimeUse the Real-Time configuration tab to set the refresh and display options for the recent instance view screen.
• Refresh Screen Interval - Determines the default screen refresh interval (seconds), when set to Recent.
Top Sessions Screen
• Number of top sessions - Maximum number of top sessions to display in the Top Sessions tab.
HistoryUse the History configuration tab to set the display and scaling options for the history instance view screen.
• Number of top values to display - Determines the default amount of top items that are retrieved when the navigation tree is expanded.
• Select Collection—specifies the set from which you may select dimensions for display. select a User Defined Collection rather than the default History if it includes dimensions which, because of resource consumption constraints, consists of a larger set.
• Selected dimensions—determines the dimensions for which historical processes and queries can be performed and their order appearance in the navigation tree. The set of available dimensions is specified during StealthCollect™ installation and cannot be subsequently changed.
• Activity Timeline Scaling Options - The three check boxes determine the scaling and display of the historical activity timeline graph.
• Select the Scale graph to instance check box if you want the display to retain the instance vertical scaling. Thus, any drilldown activity display is proportional to the total instance activity, granting you an immediate sense of its significance.
139General
If cleared, the display scale is that of the dimension subset of which the present drilldown is a part. (For example, the vertical scale could be a specific SQL statement and the activity representation, that of a specific database user's portion within it.
• Select the Focus on target activity check box if you want the scale to re-calibrate as you drill down within dimensions.
If cleared, the scale reverts to that of the instance (if selected, as above) or that of the dimension in which this drill down is a part.
• Select the Show total in graph check box to display a dotted line representing total instance activity.
• Select the Display batch hash in tree check box to display the batch hash number rather than the initial SQL text in the T-SQL batch node.
GeneralUse the General configuration tab to modify the SQL statement appearance.
SQL Statement Appearance
Sets the default appearance for SQL statements across the entire application.
• Show SQL statements summarized - Shortens the SQL statements by replacing long SELECT and FROM clauses with (...).
• Show SQL statements in multiple lines - Expands the SQL display to a multi-line presentation so that the entire SQL is visible.
Chart Appearance
Specifies whether to display empty series and how the chart contours are to be represented.
• Hide empty series - Suppresses display of wait events with no measurable activity.
• Contour visible - Displays a marked contour at the edge of the activity timeline series representation.
140 Foglight Performance Analysis for DB2 LUWUser Guide
Contour Color (when Contour visible selected)
Specifies whether the border (contour) color line of the activity timeline is to be represented as:
• Black
• 65% Fill color
Color Mode
Specifies the palette-type of color of the activity timeline representation, whether:
• Pastel (pale)
• Vibrant (bright)
Application Mode
Specifies whether the Wait Event Categories display is to be:
• Simple
• Expert (detailed)
Refreshing Options
Lets you minimize the application automatic refreshing overhead in specific circumstances.
• Refresh data when the application is inactive (select/clear) - When the application is not the desktop active window, automatic refreshing will/will not occur.
• Refresh data when the application is minimized (select/clear) - When the application is in minimized mode, automatic refreshing will/will not occur.
Change TrackingUse the Change Tracking tab to define the set of configuration and schema parameters to be monitored and displayed.
Select changes to trace - For databases with repository enabled, select/clear changes to track on the displayed check box tree node entries. The set of possible changes is specified during StealthCollect™ installation and can be subsequently changed. Enable
141Compare
only those changes of interest so as to minimize both visual screen clutter and system resources required for processing the data.
CompareUse the Compare configuration as follows:
• In the Resources tab, set the Resource thresholds severity levels and significance thresholds for resource usage reporting in the Overall Activity view.
• In the Activity Highlights tab, set the minimum inclusion Threshold for comparison percentage resource difference in the Activity Highlights view. Set the Grouping and Group size values as per your desired Activity Highlights view group size focus.
Performance HighlightsUse this tab to configure the rule-based engine used by the Highlights tab.
The left pane displays the available rules for each resource. For each Resource, specify which rules you do not want tested by clearing their check boxes. Clicking on a rule will display in the right pane the list of the composing necessary conditions.
Use the right pane to customize the rule thresholds.
This tab is context-sensitive accessible directly through a right-click a specific rule implementation in the Highlights tab.
Activity HighlightsUse the Activity rules to specify and configure dimension nodes (singly and in groups) whose exceptional and significant behavior or distribution is of interest. The default setting is to include all rules.
For each dimension, specify which rules you do not want tested by clearing their check boxes. Alter the Threshold percentage and Group size values as wanted. Set the Grouping sliding low–high setting according to your preferred group size focus.
142 Foglight Performance Analysis for DB2 LUWUser Guide
SchedulerBefore reports can be run (or to change the network user), specify here the Windows operating system user account to be used by the Windows Scheduler to perform the actual task of report creation:
Click the Edit Account button to display the Set Scheduler Account dialog, wherein you supply the valid Windows operating system user ID and password. If yours is a domain account, the user identification must be prefixed with the domain identification and “\”. (For example, user Paul Leno in the PRODUCTION environment might have a user identification of: PROD\PLeno)
Note Once you enter this data, it updates all existing schedules to that account information and any subsequently created schedules (for this and all other DB2 instances accessed from this client) will also have that same account. If your network user/password is changed, you must reenter the User Information for your schedules to work.
BaselineUse the Baseline configuration tab to enable or disable the baseline display and to set the speed with which the IntelliProfile™-generated baseline ranges are calculated and displayed.
• Enable baseline display - Use this check box to enable or disable the baseline display on this Foglight Performance Analysis client. This option will only affect the graphical representation. Use the Agent IntelliProfile™ (Baseline) configuration to manage the IntelliProfile baseline engine.
• Animate baseline-to-resource display switch - Use this check box to specify if the transition in the timeline background view between the baseline range and resources is to fade in-and-out (animate) or to occur abruptly.
• Minimal baseline period for knowledge base generation - Use this setting to determine the minimal baseline “learning” period before the baseline is first displayed. Baseline accuracy is dependent upon the amount of historical activity gathered for the baseline calculation and is improved as the historical sampling period is increased. For optimal baseline information, Quest recommends a minimal “learning” period of 24 hours before initial baseline presentation.
143Support
Related Topics
“Performance Baseline” on page 2
SupportUse the Support tab, under the direction of the Quest Support team, to enable (by checking) Support features.
Protocol Log
Enabling these options creates logs of data exchange between the server and client. This feature causes additional overhead and so should only be enabled under the direction of Quest Support.
• Log Server - a log will be created in the Server path:
<Agent Installation Root>\agents\SC_DB2\6.0\<host-instance>\quest_sc_mw\protocol.log{.<logfile ver>}
• Log Client - a log will be created in the Client path:
\Documents and Settings\<OS user>\Local Settings\Application Data\Quest Software\Performance Analysis DB2 6.0\Services\<host-instance>protocol.log {.<logfile ver>}
Repository Protocol Log
Enabling these options creates logs of data exchange between the server and client. This feature causes additional overhead and so should only be enabled under the direction of Quest Support.
• Log Server—a log will be created in the Server path:
<Agent Installation Root>\agents\SC_DB2\7.0\<host-instance>\quest_sc_mw\protocol.log{.<logfile ver>}
• Log Client—a log will be created in the Client path
\Documents and Settings\<OS user>\Local Settings\Application Data\Quest Software\Performance Analysis DB2 7.0\Services\<host-instance>portocol.log {.<logfile ver>}
• Log Activity—the Log activity creates logs of data exchange between the server and client. This feature can be used to determine potential problems with PADB2 installation or activity.
144 Foglight Performance Analysis for DB2 LUWUser Guide
Advanced Settings
• Enable grids customization - Enables activation of the Metric Selection Dialog. Once activated, the user can right-click in the resource metric pane of the History and Real-Time mode lower tabs add or remove metrics from the default listing of displayed metrics, including their source (either or DB2) and total value by right-clicking anywhere in that pane and then selecting Select Metric.
• Show Activity Highlights - Enables display of the Highlights Tab in the History mode | Instance View top level to identify performance anomalies, resource bottlenecks and peak activities. Display settings are configured in the Activity Highlights configuration tab.
• Show Time Breakdown - Enables display of the Time Breakdown Tab in the History mode to display resource activity in increasingly granular calendric time units determined by the data interval in effect. This feature is particularly useful in comparative analysis of periodic system performance.
• Allow Selection of Historical Data Resolution - Enables display of data interval to allow the user to change the granularity (resolution) of data displayed in the Average Active Sessions graph in both the Real-time and History modes.
Related Topics
“Performance Highlights” on page 141
“Activity Highlights” on page 141
“Foglight Performance Analysis Configuration” on page 137
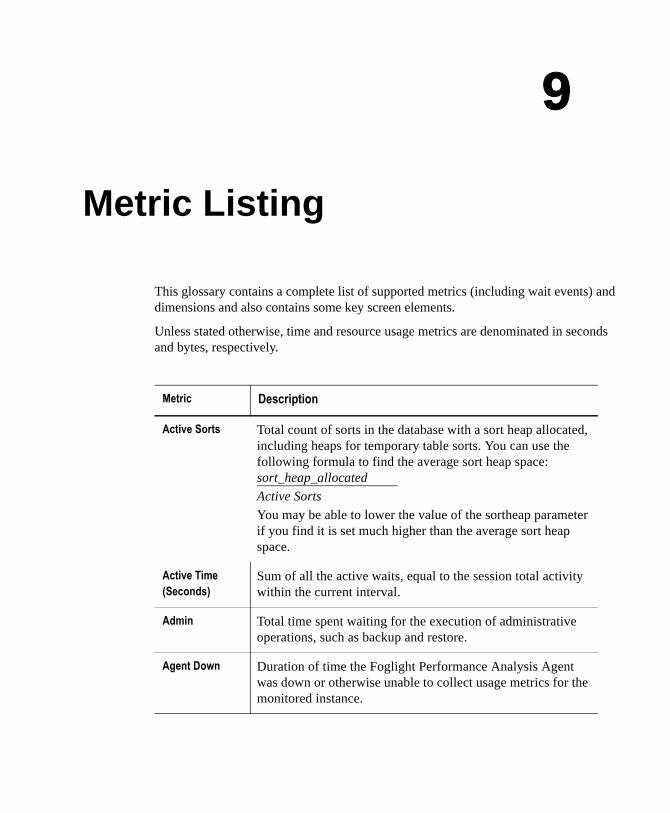
9
Metric Listing
This glossary contains a complete list of supported metrics (including wait events) and dimensions and also contains some key screen elements.
Unless stated otherwise, time and resource usage metrics are denominated in seconds and bytes, respectively.
Metric Description
Active Sorts Total count of sorts in the database with a sort heap allocated, including heaps for temporary table sorts. You can use the following formula to find the average sort heap space: sort_heap_allocated_____________________Active Sorts
You may be able to lower the value of the sortheap parameter if you find it is set much higher than the average sort heap space.
Active Time (Seconds)
Sum of all the active waits, equal to the session total activity within the current interval.
Admin Total time spent waiting for the execution of administrative operations, such as backup and restore.
Agent Down Duration of time the Foglight Performance Analysis Agent was down or otherwise unable to collect usage metrics for the monitored instance.
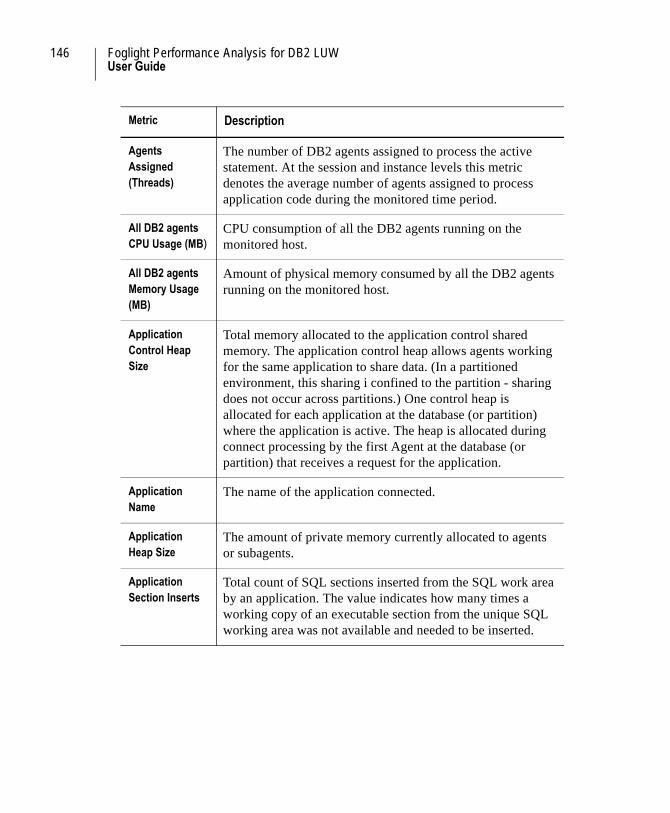
146 Foglight Performance Analysis for DB2 LUWUser Guide
Agents Assigned (Threads)
The number of DB2 agents assigned to process the active statement. At the session and instance levels this metric denotes the average number of agents assigned to process application code during the monitored time period.
All DB2 agents CPU Usage (MB)
CPU consumption of all the DB2 agents running on the monitored host.
All DB2 agents Memory Usage (MB)
Amount of physical memory consumed by all the DB2 agents running on the monitored host.
Application Control Heap Size
Total memory allocated to the application control shared memory. The application control heap allows agents working for the same application to share data. (In a partitioned environment, this sharing i confined to the partition - sharing does not occur across partitions.) One control heap is allocated for each application at the database (or partition) where the application is active. The heap is allocated during connect processing by the first Agent at the database (or partition) that receives a request for the application.
Application Name
The name of the application connected.
Application Heap Size
The amount of private memory currently allocated to agents or subagents.
Application Section Inserts
Total count of SQL sections inserted from the SQL work area by an application. The value indicates how many times a working copy of an executable section from the unique SQL working area was not available and needed to be inserted.
Metric Description
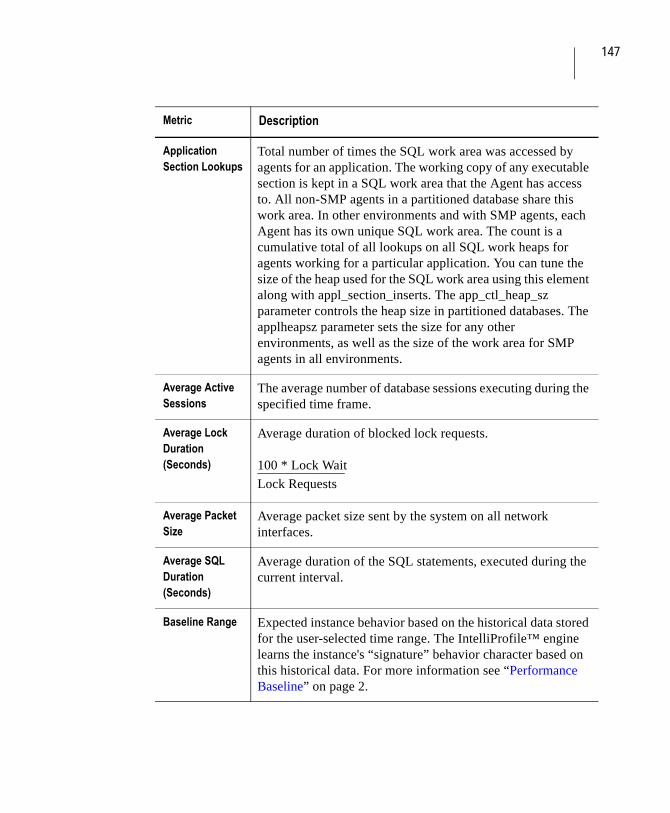
147
Application Section Lookups
Total number of times the SQL work area was accessed by agents for an application. The working copy of any executable section is kept in a SQL work area that the Agent has access to. All non-SMP agents in a partitioned database share this work area. In other environments and with SMP agents, each Agent has its own unique SQL work area. The count is a cumulative total of all lookups on all SQL work heaps for agents working for a particular application. You can tune the size of the heap used for the SQL work area using this element along with appl_section_inserts. The app_ctl_heap_sz parameter controls the heap size in partitioned databases. The applheapsz parameter sets the size for any other environments, as well as the size of the work area for SMP agents in all environments.
Average Active Sessions
The average number of database sessions executing during the specified time frame.
Average Lock Duration (Seconds)
Average duration of blocked lock requests.
100 * Lock Wait_____________Lock Requests
Average Packet Size
Average packet size sent by the system on all network interfaces.
Average SQL Duration (Seconds)
Average duration of the SQL statements, executed during the current interval.
Baseline Range Expected instance behavior based on the historical data stored for the user-selected time range. The IntelliProfile™ engine learns the instance's “signature” behavior character based on this historical data. For more information see “Performance Baseline” on page 2.
Metric Description
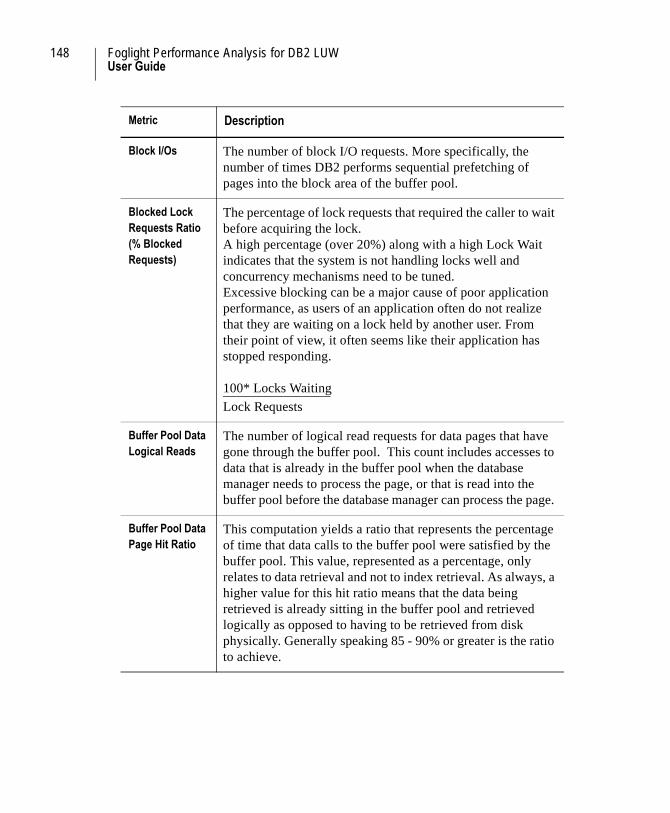
148 Foglight Performance Analysis for DB2 LUWUser Guide
Block I/Os The number of block I/O requests. More specifically, the number of times DB2 performs sequential prefetching of pages into the block area of the buffer pool.
Blocked Lock Requests Ratio (% Blocked Requests)
The percentage of lock requests that required the caller to wait before acquiring the lock.A high percentage (over 20%) along with a high Lock Wait indicates that the system is not handling locks well and concurrency mechanisms need to be tuned.Excessive blocking can be a major cause of poor application performance, as users of an application often do not realize that they are waiting on a lock held by another user. From their point of view, it often seems like their application has stopped responding.
100* Locks Waiting________________Lock Requests
Buffer Pool Data Logical Reads
The number of logical read requests for data pages that have gone through the buffer pool. This count includes accesses to data that is already in the buffer pool when the database manager needs to process the page, or that is read into the buffer pool before the database manager can process the page.
Buffer Pool Data Page Hit Ratio
This computation yields a ratio that represents the percentage of time that data calls to the buffer pool were satisfied by the buffer pool. This value, represented as a percentage, only relates to data retrieval and not to index retrieval. As always, a higher value for this hit ratio means that the data being retrieved is already sitting in the buffer pool and retrieved logically as opposed to having to be retrieved from disk physically. Generally speaking 85 - 90% or greater is the ratio to achieve.
Metric Description
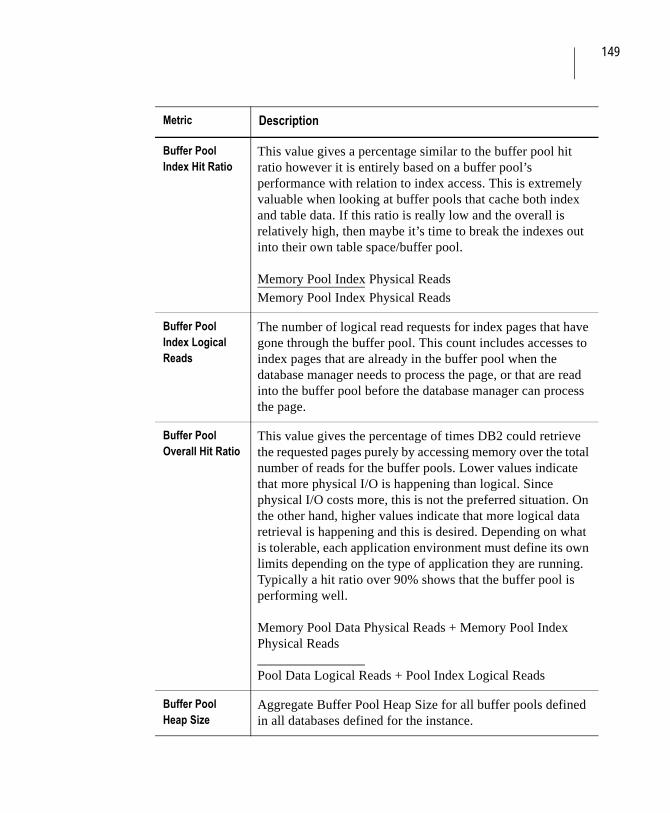
149
Buffer Pool Index Hit Ratio
This value gives a percentage similar to the buffer pool hit ratio however it is entirely based on a buffer pool’s performance with relation to index access. This is extremely valuable when looking at buffer pools that cache both index and table data. If this ratio is really low and the overall is relatively high, then maybe it’s time to break the indexes out into their own table space/buffer pool.
Memory Pool Index Physical Reads________________Memory Pool Index Physical Reads
Buffer Pool Index Logical Reads
The number of logical read requests for index pages that have gone through the buffer pool. This count includes accesses to index pages that are already in the buffer pool when the database manager needs to process the page, or that are read into the buffer pool before the database manager can process the page.
Buffer Pool Overall Hit Ratio
This value gives the percentage of times DB2 could retrieve the requested pages purely by accessing memory over the total number of reads for the buffer pools. Lower values indicate that more physical I/O is happening than logical. Since physical I/O costs more, this is not the preferred situation. On the other hand, higher values indicate that more logical data retrieval is happening and this is desired. Depending on what is tolerable, each application environment must define its own limits depending on the type of application they are running. Typically a hit ratio over 90% shows that the buffer pool is performing well.
Memory Pool Data Physical Reads + Memory Pool Index Physical Reads________________Pool Data Logical Reads + Pool Index Logical Reads
Buffer Pool Heap Size
Aggregate Buffer Pool Heap Size for all buffer pools defined in all databases defined for the instance.
Metric Description

150 Foglight Performance Analysis for DB2 LUWUser Guide
Buffer Pool Log Space Cleaners Triggered
(Dirty Page Steal Cleaner Triggers)
The number of times a page cleaner was invoked because the logging space used had reached a predefined criterion for the database. The page cleaning criterion is determined by the setting for the SOFTMAX configuration parameter.
Buffer Pool Temporary Data Logical Reads
The number of data pages that have been requested from the buffer pool for temporary table spaces.
Buffer Pool Temporary Data Physical Reads
Total number of physical read requests that needed I/O to get data pages into the temporary tablespace.
Buffer Pool Temporary Index Logical Reads
The number of index pages that have been requested from the buffer pool for temporary table spaces.
Buffer Pool Temporary Index Physical Reads
Indicates the number of physical read requests that required I/O to get index pages into the temporary tablespace.
Buffer Pool Victim Page Cleaners Triggered
The number of times a page cleaner was invoked because a synchronous write was needed during the victim buffer replacement for the database. If your chngpgs_thresh is set too low, you may be writing out pages that you will dirty later. Aggressive cleaning defeats one purpose of the buffer pool, that is to defer writing to the last possible moment. Conversely, too few page cleaners will increase recovery time after failures.
Catalog Cache Heap Size
Total amount of memory allocated for the catalog cache, where system catalog information is cached. There is one catalog cache for each database partition in a partitioned database system.
Metric Description
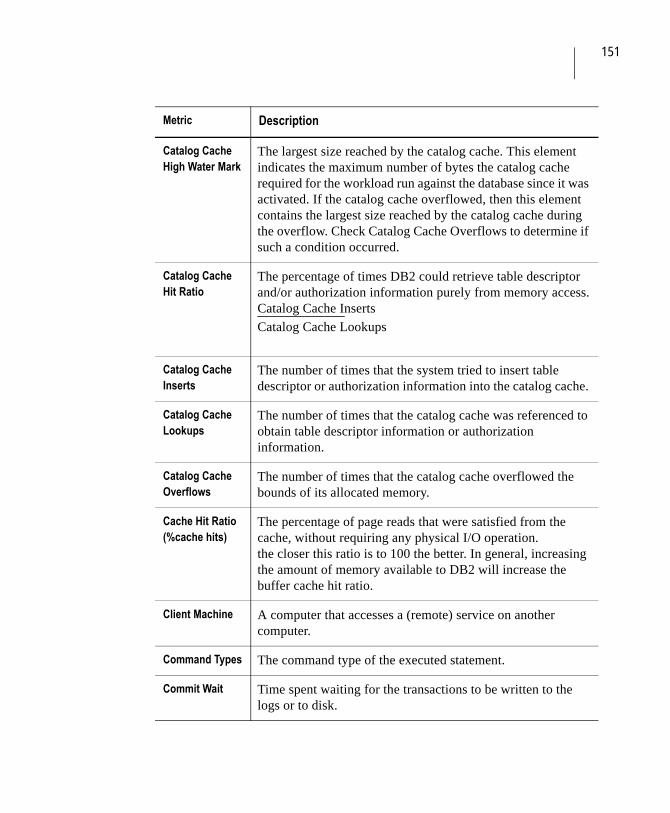
151
Catalog Cache High Water Mark
The largest size reached by the catalog cache. This element indicates the maximum number of bytes the catalog cache required for the workload run against the database since it was activated. If the catalog cache overflowed, then this element contains the largest size reached by the catalog cache during the overflow. Check Catalog Cache Overflows to determine if such a condition occurred.
Catalog Cache Hit Ratio
The percentage of times DB2 could retrieve table descriptor and/or authorization information purely from memory access.Catalog Cache Inserts_____________Catalog Cache Lookups
Catalog Cache Inserts
The number of times that the system tried to insert table descriptor or authorization information into the catalog cache.
Catalog Cache Lookups
The number of times that the catalog cache was referenced to obtain table descriptor information or authorization information.
Catalog Cache Overflows
The number of times that the catalog cache overflowed the bounds of its allocated memory.
Cache Hit Ratio (%cache hits)
The percentage of page reads that were satisfied from the cache, without requiring any physical I/O operation.the closer this ratio is to 100 the better. In general, increasing the amount of memory available to DB2 will increase the buffer cache hit ratio.
Client Machine A computer that accesses a (remote) service on another computer.
Command Types The command type of the executed statement.
Commit Wait Time spent waiting for the transactions to be written to the logs or to disk.
Metric Description
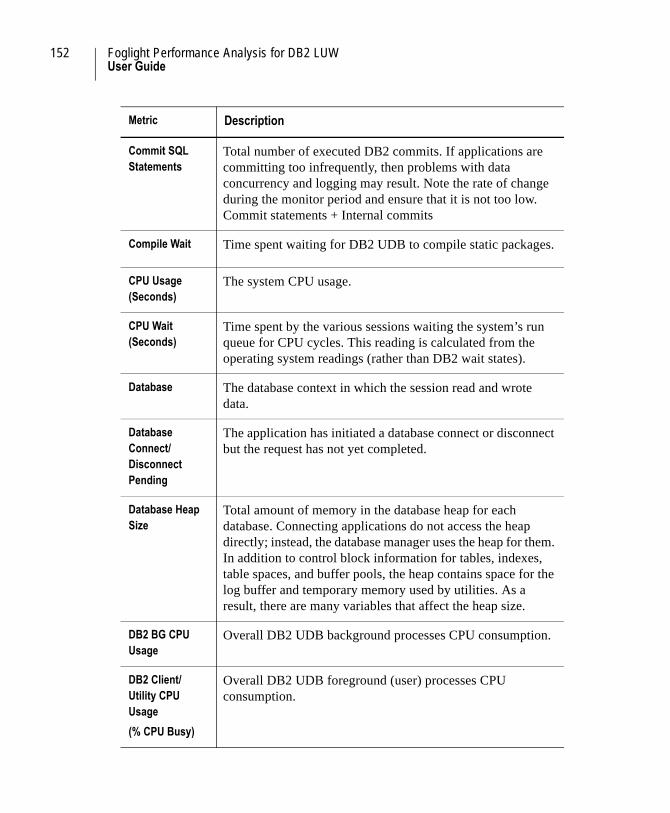
152 Foglight Performance Analysis for DB2 LUWUser Guide
Commit SQL Statements
Total number of executed DB2 commits. If applications are committing too infrequently, then problems with data concurrency and logging may result. Note the rate of change during the monitor period and ensure that it is not too low.Commit statements + Internal commits
Compile Wait Time spent waiting for DB2 UDB to compile static packages.
CPU Usage (Seconds)
The system CPU usage.
CPU Wait (Seconds)
Time spent by the various sessions waiting the system’s run queue for CPU cycles. This reading is calculated from the operating system readings (rather than DB2 wait states).
Database The database context in which the session read and wrote data.
Database Connect/Disconnect Pending
The application has initiated a database connect or disconnect but the request has not yet completed.
Database Heap Size
Total amount of memory in the database heap for each database. Connecting applications do not access the heap directly; instead, the database manager uses the heap for them. In addition to control block information for tables, indexes, table spaces, and buffer pools, the heap contains space for the log buffer and temporary memory used by utilities. As a result, there are many variables that affect the heap size.
DB2 BG CPU Usage
Overall DB2 UDB background processes CPU consumption.
DB2 Client/Utility CPU Usage
(% CPU Busy)
Overall DB2 UDB foreground (user) processes CPU consumption.
Metric Description
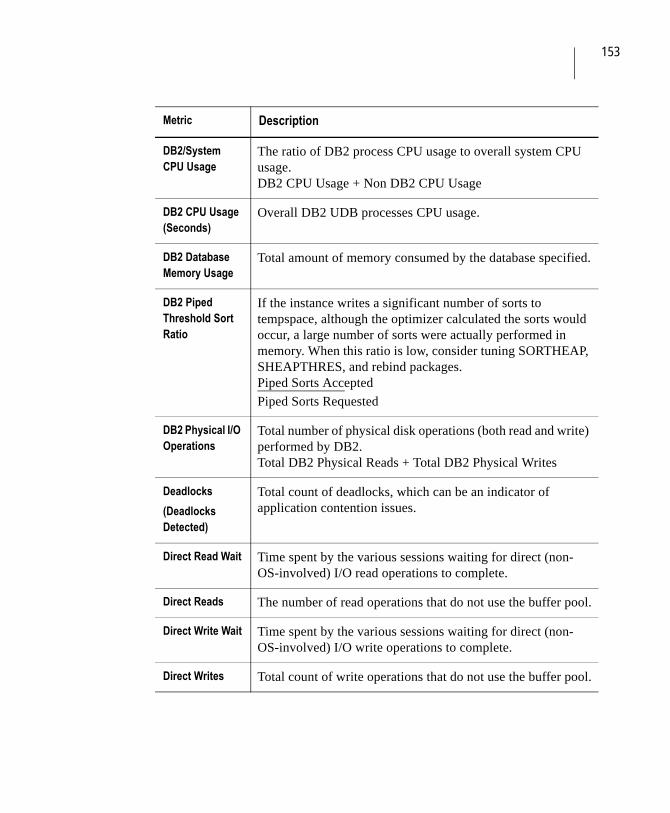
153
DB2/System CPU Usage
The ratio of DB2 process CPU usage to overall system CPU usage.DB2 CPU Usage + Non DB2 CPU Usage
DB2 CPU Usage (Seconds)
Overall DB2 UDB processes CPU usage.
DB2 Database Memory Usage
Total amount of memory consumed by the database specified.
DB2 Piped Threshold Sort Ratio
If the instance writes a significant number of sorts to tempspace, although the optimizer calculated the sorts would occur, a large number of sorts were actually performed in memory. When this ratio is low, consider tuning SORTHEAP, SHEAPTHRES, and rebind packages.Piped Sorts Accepted_____________Piped Sorts Requested
DB2 Physical I/O Operations
Total number of physical disk operations (both read and write) performed by DB2.Total DB2 Physical Reads + Total DB2 Physical Writes
Deadlocks
(Deadlocks Detected)
Total count of deadlocks, which can be an indicator of application contention issues.
Direct Read Wait Time spent by the various sessions waiting for direct (non-OS-involved) I/O read operations to complete.
Direct Reads The number of read operations that do not use the buffer pool.
Direct Write Wait Time spent by the various sessions waiting for direct (non-OS-involved) I/O write operations to complete.
Direct Writes Total count of write operations that do not use the buffer pool.
Metric Description
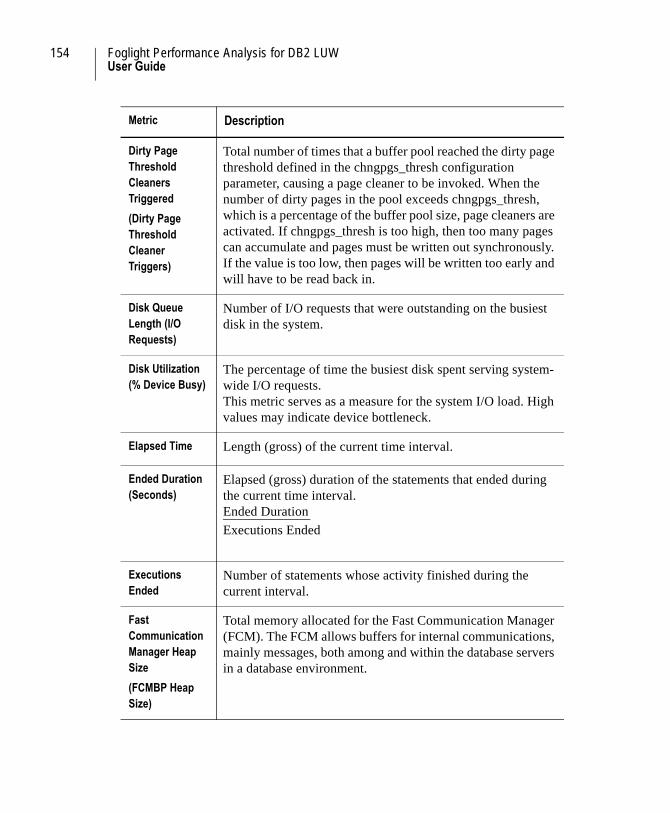
154 Foglight Performance Analysis for DB2 LUWUser Guide
Dirty Page Threshold Cleaners Triggered
(Dirty Page Threshold Cleaner Triggers)
Total number of times that a buffer pool reached the dirty page threshold defined in the chngpgs_thresh configuration parameter, causing a page cleaner to be invoked. When the number of dirty pages in the pool exceeds chngpgs_thresh, which is a percentage of the buffer pool size, page cleaners are activated. If chngpgs_thresh is too high, then too many pages can accumulate and pages must be written out synchronously. If the value is too low, then pages will be written too early and will have to be read back in.
Disk Queue Length (I/O Requests)
Number of I/O requests that were outstanding on the busiest disk in the system.
Disk Utilization (% Device Busy)
The percentage of time the busiest disk spent serving system-wide I/O requests.This metric serves as a measure for the system I/O load. High values may indicate device bottleneck.
Elapsed Time Length (gross) of the current time interval.
Ended Duration (Seconds)
Elapsed (gross) duration of the statements that ended during the current time interval.Ended Duration _____________Executions Ended
Executions Ended
Number of statements whose activity finished during the current interval.
Fast Communication Manager Heap Size
(FCMBP Heap Size)
Total memory allocated for the Fast Communication Manager (FCM). The FCM allows buffers for internal communications, mainly messages, both among and within the database servers in a database environment.
Metric Description
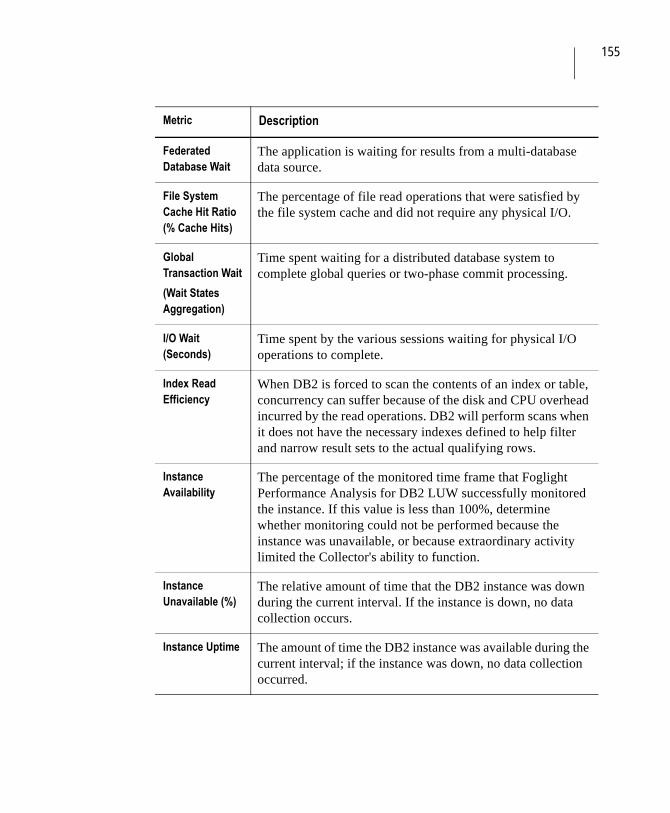
155
Federated Database Wait
The application is waiting for results from a multi-database data source.
File System Cache Hit Ratio (% Cache Hits)
The percentage of file read operations that were satisfied by the file system cache and did not require any physical I/O.
Global Transaction Wait
(Wait States Aggregation)
Time spent waiting for a distributed database system to complete global queries or two-phase commit processing.
I/O Wait (Seconds)
Time spent by the various sessions waiting for physical I/O operations to complete.
Index Read Efficiency
When DB2 is forced to scan the contents of an index or table, concurrency can suffer because of the disk and CPU overhead incurred by the read operations. DB2 will perform scans when it does not have the necessary indexes defined to help filter and narrow result sets to the actual qualifying rows.
Instance Availability
The percentage of the monitored time frame that Foglight Performance Analysis for DB2 LUW successfully monitored the instance. If this value is less than 100%, determine whether monitoring could not be performed because the instance was unavailable, or because extraordinary activity limited the Collector's ability to function.
Instance Unavailable (%)
The relative amount of time that the DB2 instance was down during the current interval. If the instance is down, no data collection occurs.
Instance Uptime The amount of time the DB2 instance was available during the current interval; if the instance was down, no data collection occurred.
Metric Description
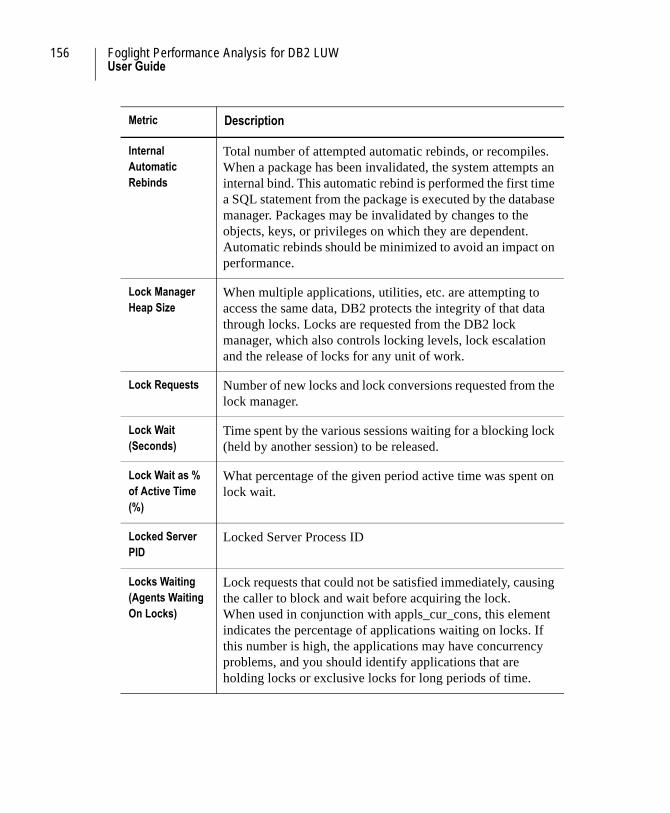
156 Foglight Performance Analysis for DB2 LUWUser Guide
Internal Automatic Rebinds
Total number of attempted automatic rebinds, or recompiles. When a package has been invalidated, the system attempts an internal bind. This automatic rebind is performed the first time a SQL statement from the package is executed by the database manager. Packages may be invalidated by changes to the objects, keys, or privileges on which they are dependent. Automatic rebinds should be minimized to avoid an impact on performance.
Lock Manager Heap Size
When multiple applications, utilities, etc. are attempting to access the same data, DB2 protects the integrity of that data through locks. Locks are requested from the DB2 lock manager, which also controls locking levels, lock escalation and the release of locks for any unit of work.
Lock Requests Number of new locks and lock conversions requested from the lock manager.
Lock Wait (Seconds)
Time spent by the various sessions waiting for a blocking lock (held by another session) to be released.
Lock Wait as % of Active Time (%)
What percentage of the given period active time was spent on lock wait.
Locked Server PID
Locked Server Process ID
Locks Waiting (Agents Waiting On Locks)
Lock requests that could not be satisfied immediately, causing the caller to block and wait before acquiring the lock.When used in conjunction with appls_cur_cons, this element indicates the percentage of applications waiting on locks. If this number is high, the applications may have concurrency problems, and you should identify applications that are holding locks or exclusive locks for long periods of time.
Metric Description
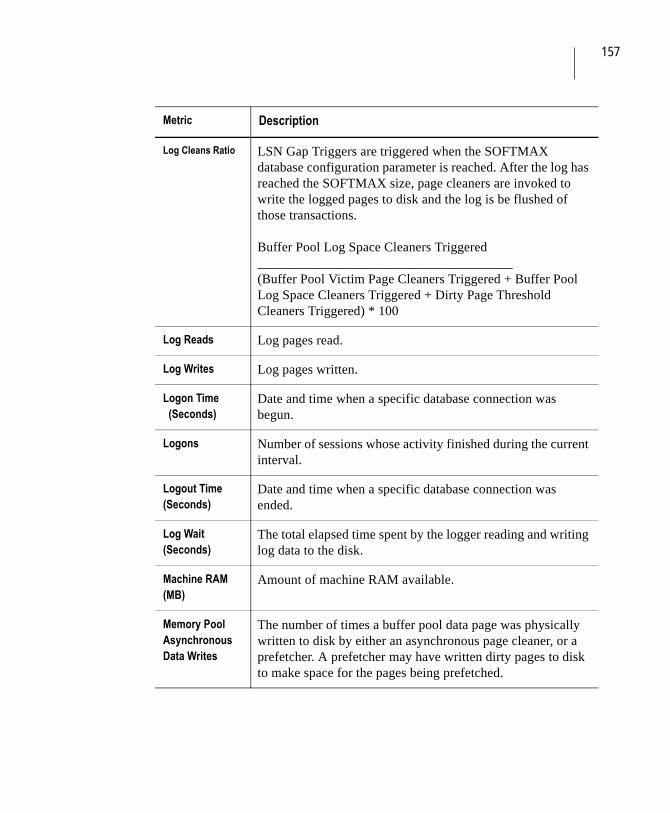
157
Log Cleans Ratio LSN Gap Triggers are triggered when the SOFTMAX database configuration parameter is reached. After the log has reached the SOFTMAX size, page cleaners are invoked to write the logged pages to disk and the log is be flushed of those transactions. Buffer Pool Log Space Cleaners Triggered______________________________________(Buffer Pool Victim Page Cleaners Triggered + Buffer Pool Log Space Cleaners Triggered + Dirty Page Threshold Cleaners Triggered) * 100
Log Reads Log pages read.
Log Writes Log pages written.
Logon Time (Seconds)
Date and time when a specific database connection was begun.
Logons Number of sessions whose activity finished during the current interval.
Logout Time (Seconds)
Date and time when a specific database connection was ended.
Log Wait (Seconds)
The total elapsed time spent by the logger reading and writing log data to the disk.
Machine RAM (MB)
Amount of machine RAM available.
Memory Pool Asynchronous Data Writes
The number of times a buffer pool data page was physically written to disk by either an asynchronous page cleaner, or a prefetcher. A prefetcher may have written dirty pages to disk to make space for the pages being prefetched.
Metric Description
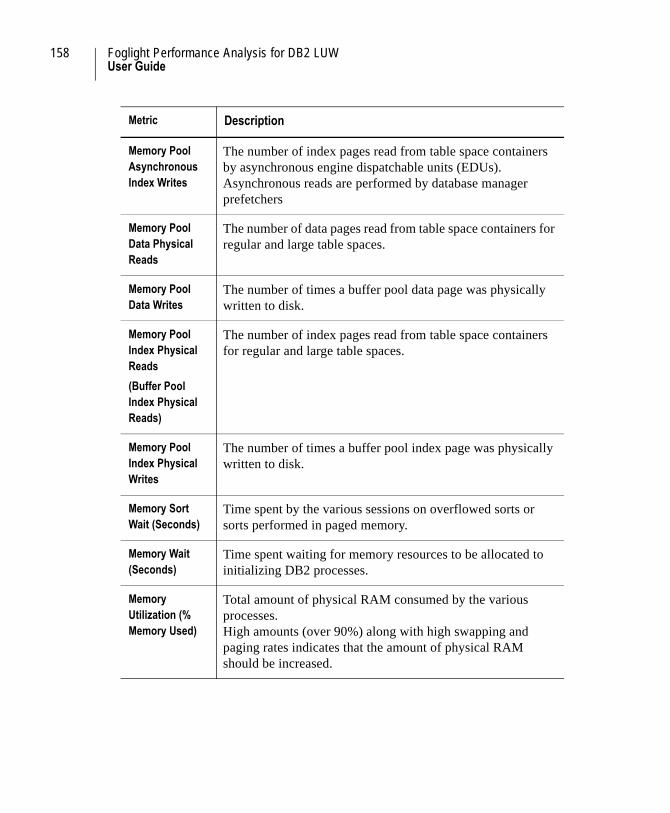
158 Foglight Performance Analysis for DB2 LUWUser Guide
Memory Pool Asynchronous Index Writes
The number of index pages read from table space containers by asynchronous engine dispatchable units (EDUs). Asynchronous reads are performed by database manager prefetchers
Memory Pool Data Physical Reads
The number of data pages read from table space containers for regular and large table spaces.
Memory Pool Data Writes
The number of times a buffer pool data page was physically written to disk.
Memory Pool Index Physical Reads
(Buffer Pool Index Physical Reads)
The number of index pages read from table space containers for regular and large table spaces.
Memory Pool Index Physical Writes
The number of times a buffer pool index page was physically written to disk.
Memory Sort Wait (Seconds)
Time spent by the various sessions on overflowed sorts or sorts performed in paged memory.
Memory Wait (Seconds)
Time spent waiting for memory resources to be allocated to initializing DB2 processes.
Memory Utilization (% Memory Used)
Total amount of physical RAM consumed by the various processes.High amounts (over 90%) along with high swapping and paging rates indicates that the amount of physical RAM should be increased.
Metric Description

159
Miscellaneous Heap Sizes
(Application Group, DFM, and DB2 Other Heap Current Size)
DB2 controls operating system files referenced in a database’s DATALINK columns with the Data Links Manager (DFM or DLFM). Note that DB2 Data Links must have been installed and configured for this heap to register. The Application Group shared memory segment stores data shared among agents working on the same application. Multiple applications share a single application group in a partitioned environment. (This is also true in a non-partitioned environment where intra-partition parallelism or concentrator is enabled.) Each application will have its own application control heap within the application group shared memory segment and all applications will share a single application group shared heap.
Monitor Down Time (Seconds)
The relative amount of time that the DB2 instance was down during the current interval. If the instance is down, no data collection occurs.
100 * (Interval Length-n seconds)_____________(Interval Length)
Monitor Heap Size
Total amount of memory allocated for database monitoring activities. Memory for activities such as taking a snapshot, turning on a monitor switch, resetting a monitor, or activating an event monitor is allocated from the Monitor Heap. This memory, which is specified in pages, is used to store the system monitor data. No monitor data can be collected if the Monitor Heap is set to zero.
Monitor Sampling Time Ratio
The relative amount of time that the StealthCollect™ Agent was active during the current interval. If the Agent is not active, no data collection occurs. Thus, if this metric value is less than the interval length, the value of other performance metrics does not represent their entire interval activity.
100 * (Monitor Sampling Time)_____________(Interval Length)
Metric Description

160 Foglight Performance Analysis for DB2 LUWUser Guide
Monitor Up Time (Seconds)
The amount of time that the Quest StealthCollect™ Agent was running during the current interval.
Network Collisions
Number of times when two machines send packets at the same time on the network and the packets “collide” so both packets need to be re-transmitted.
Network Errors Amount of packets that contained errors that prevented them from being transmitted or delivered.
Network Outgoing Traffic (KB)
Volume of data sent on all network interfaces.
Network Traffic Volume (KB)
The total of incoming and outgoing network traffic.
Non-[Resource] Activity
Instance activity generated by resources other than the selected SQL wait event.
Non-DB2 CPU Usage (% CPU Busy)
Overall CPU consumption not associated with the monitored DB2 instance (non-DB2 processes).Total CPU Usage – IBM DB2 CPU Usage
Non DB2 Memory Usage
Overall RAM consumption not associated with the monitored DB2 instance (background and foreground processes).
Non DB2 Resident Memory Usage (% CPU Busy)
Overall RAM consumption not associated with the monitored DB2 instance (background and foreground processes).
Other CPU Usage (% CPU Busy)
CPU consumption of processes not related to DB2 or associated services.
Other CPU Usage Wait (Seconds)
Other CPU activity.
Metric Description
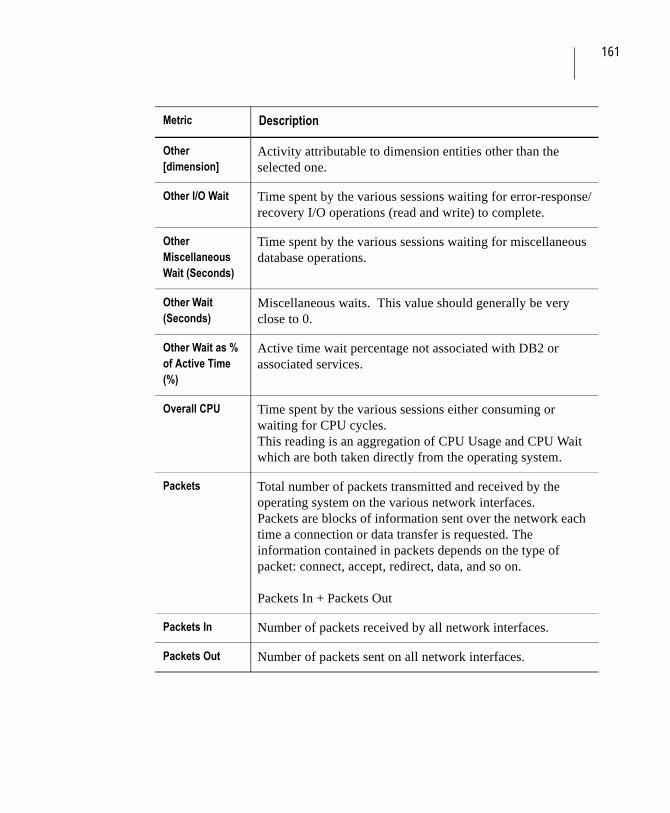
161
Other [dimension]
Activity attributable to dimension entities other than the selected one.
Other I/O Wait Time spent by the various sessions waiting for error-response/recovery I/O operations (read and write) to complete.
Other Miscellaneous Wait (Seconds)
Time spent by the various sessions waiting for miscellaneous database operations.
Other Wait (Seconds)
Miscellaneous waits. This value should generally be very close to 0.
Other Wait as % of Active Time (%)
Active time wait percentage not associated with DB2 or associated services.
Overall CPU Time spent by the various sessions either consuming or waiting for CPU cycles.This reading is an aggregation of CPU Usage and CPU Wait which are both taken directly from the operating system.
Packets Total number of packets transmitted and received by the operating system on the various network interfaces. Packets are blocks of information sent over the network each time a connection or data transfer is requested. The information contained in packets depends on the type of packet: connect, accept, redirect, data, and so on.
Packets In + Packets Out
Packets In Number of packets received by all network interfaces.
Packets Out Number of packets sent on all network interfaces.
Metric Description
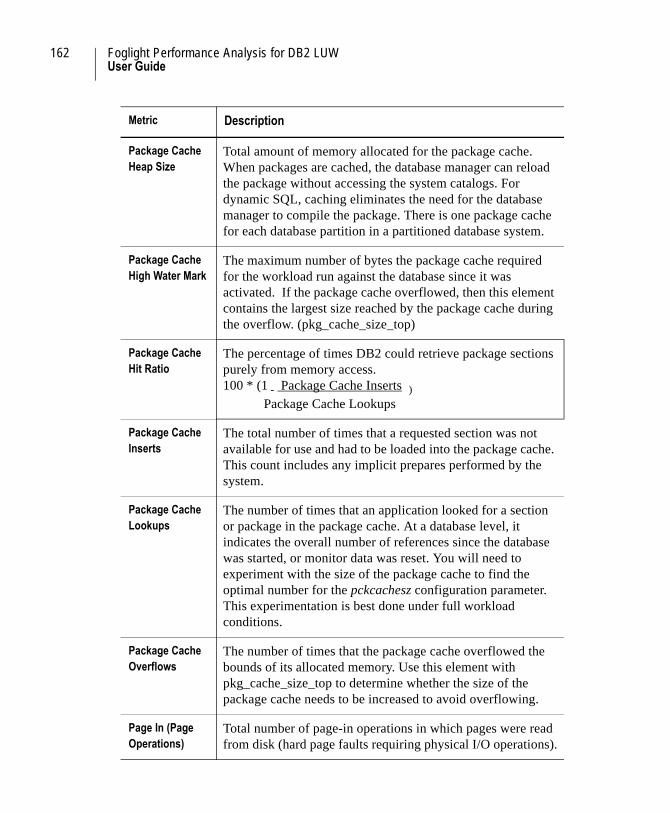
162 Foglight Performance Analysis for DB2 LUWUser Guide
Package Cache Heap Size
Total amount of memory allocated for the package cache. When packages are cached, the database manager can reload the package without accessing the system catalogs. For dynamic SQL, caching eliminates the need for the database manager to compile the package. There is one package cache for each database partition in a partitioned database system.
Package Cache High Water Mark
The maximum number of bytes the package cache required for the workload run against the database since it was activated. If the package cache overflowed, then this element contains the largest size reached by the package cache during the overflow. (pkg_cache_size_top)
Package Cache Hit Ratio
The percentage of times DB2 could retrieve package sections purely from memory access. 100 * (1 - Package Cache Inserts ) Package Cache Lookups
Package Cache Inserts
The total number of times that a requested section was not available for use and had to be loaded into the package cache. This count includes any implicit prepares performed by the system.
Package Cache Lookups
The number of times that an application looked for a section or package in the package cache. At a database level, it indicates the overall number of references since the database was started, or monitor data was reset. You will need to experiment with the size of the package cache to find the optimal number for the pckcachesz configuration parameter. This experimentation is best done under full workload conditions.
Package Cache Overflows
The number of times that the package cache overflowed the bounds of its allocated memory. Use this element with pkg_cache_size_top to determine whether the size of the package cache needs to be increased to avoid overflowing.
Page In (Page Operations)
Total number of page-in operations in which pages were read from disk (hard page faults requiring physical I/O operations).
Metric Description
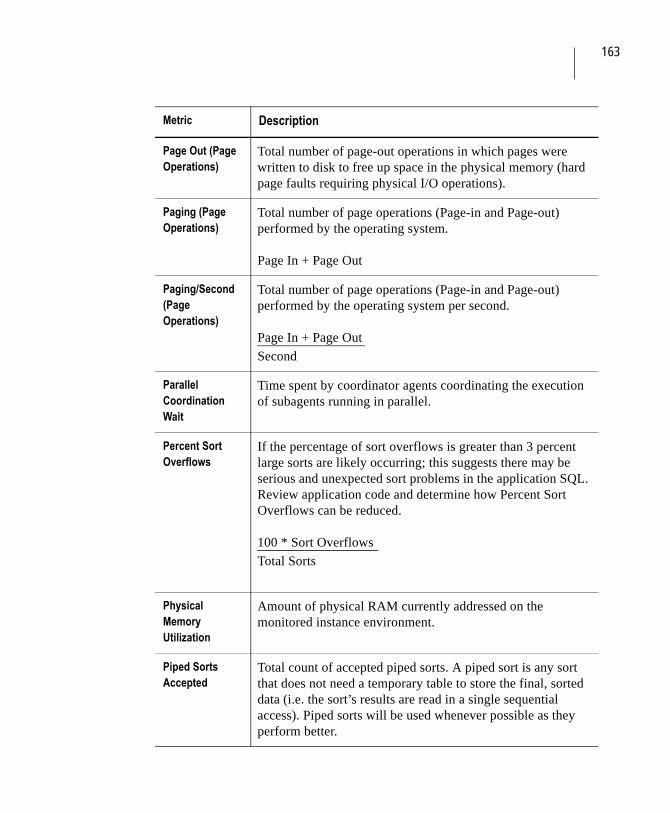
163
Page Out (Page Operations)
Total number of page-out operations in which pages were written to disk to free up space in the physical memory (hard page faults requiring physical I/O operations).
Paging (Page Operations)
Total number of page operations (Page-in and Page-out) performed by the operating system.
Page In + Page Out
Paging/Second (Page Operations)
Total number of page operations (Page-in and Page-out) performed by the operating system per second.
Page In + Page Out________________Second
Parallel Coordination Wait
Time spent by coordinator agents coordinating the execution of subagents running in parallel.
Percent Sort Overflows
If the percentage of sort overflows is greater than 3 percent large sorts are likely occurring; this suggests there may be serious and unexpected sort problems in the application SQL. Review application code and determine how Percent Sort Overflows can be reduced.
100 * Sort Overflows__________________Total Sorts
Physical Memory Utilization
Amount of physical RAM currently addressed on the monitored instance environment.
Piped Sorts Accepted
Total count of accepted piped sorts. A piped sort is any sort that does not need a temporary table to store the final, sorted data (i.e. the sort’s results are read in a single sequential access). Piped sorts will be used whenever possible as they perform better.
Metric Description
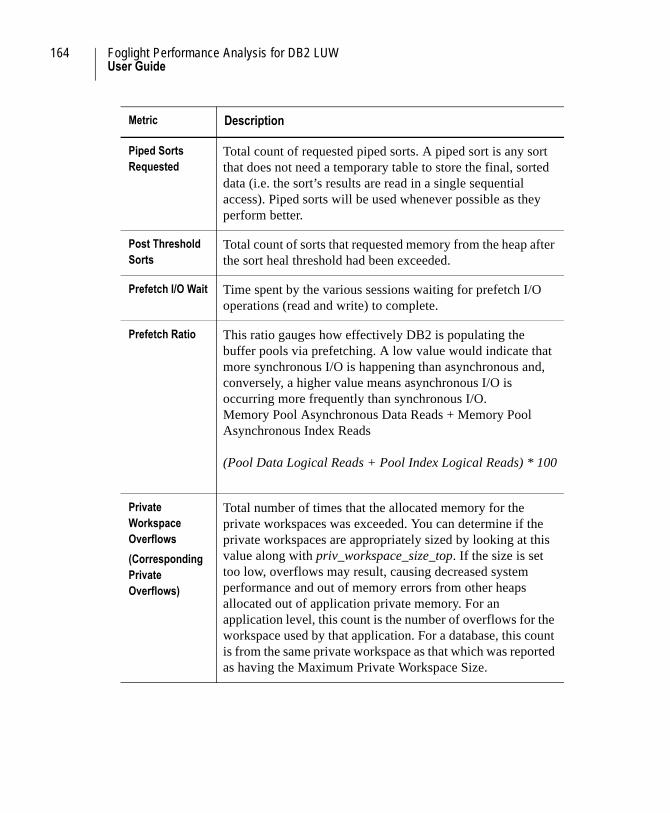
164 Foglight Performance Analysis for DB2 LUWUser Guide
Piped Sorts Requested
Total count of requested piped sorts. A piped sort is any sort that does not need a temporary table to store the final, sorted data (i.e. the sort’s results are read in a single sequential access). Piped sorts will be used whenever possible as they perform better.
Post Threshold Sorts
Total count of sorts that requested memory from the heap after the sort heal threshold had been exceeded.
Prefetch I/O Wait Time spent by the various sessions waiting for prefetch I/O operations (read and write) to complete.
Prefetch Ratio This ratio gauges how effectively DB2 is populating the buffer pools via prefetching. A low value would indicate that more synchronous I/O is happening than asynchronous and, conversely, a higher value means asynchronous I/O is occurring more frequently than synchronous I/O. Memory Pool Asynchronous Data Reads + Memory Pool Asynchronous Index Reads
(Pool Data Logical Reads + Pool Index Logical Reads) * 100
Private Workspace Overflows
(Corresponding Private Overflows)
Total number of times that the allocated memory for the private workspaces was exceeded. You can determine if the private workspaces are appropriately sized by looking at this value along with priv_workspace_size_top. If the size is set too low, overflows may result, causing decreased system performance and out of memory errors from other heaps allocated out of application private memory. For an application level, this count is the number of overflows for the workspace used by that application. For a database, this count is from the same private workspace as that which was reported as having the Maximum Private Workspace Size.
Metric Description

165
Private Workspace Section Inserts
(Total Private Section Inserts)
Total count of SQL sections inserted into private workspaces by an application. The value indicates how many times a working copy of an executable section from the private workspaces was not available and needed to be inserted. For an application, the count is the sum total of all inserts for all sections in the private workspace of that application. For a database, this count is the sum total of all inserts for all applications across all of the private workspaces in that database. Additional private workspace inserts may be required in a concentrator environment where agents are being associated with different applications because new agents may not have the required section available in their private workspaces.
Private Workspace Section Lookups
(Total Private Section Lookups)
Total count of SQL sections looked up in private workspaces by an application. The value indicates the number of times that a specific section for an application was located by looking in the private workspace. For an application, the count is the sum total of all lookups for all sections in the private workspace of that application. For a database, this count is the sum total of all lookups for all applications across all of the private workspaces in that database. The size of the private workspace (applheapsz) can be tuned using this value in tandem with Private Workspace Section Inserts.
Process ID Process ID
Read Wait Time spent by the various sessions waiting for read operations to complete.
Rebind Activity (%)
Percentage of SQL package rebinds, or recompilations taking place. High percents might indicate that elements of the application or database code needs to be modified to remove DDL SQL statements.
Internal Automatic Rebinds_______________________Executions Running
Metric Description

166 Foglight Performance Analysis for DB2 LUWUser Guide
Rebind Recompilation Ratio (%)
This ratio identifies potential problems with database caches as well as inefficient SQL statements (most likely those that mix DDL and DML statements).
Rebind Activity_______________________Dynamic SQL Compilations
Recompile Wait Time spent waiting for DB2 UDB to recompile static packages.
Remote DB2 Partition Wait
Time spent by the various sessions waiting for responses from remote databases.
Remote Database Wait
Time spent by various sessions waiting for remote operations to complete.
Resource Usage The processing activity measured through the total DB2 Wait Event Categories and denominated in time duration and percentage of the total. All displayed metrics are a reflection of the chosen resource.
Request Interrupted
An interrupt of a request is in progress. This could be the result of a manual interrupt, of a signal handling component of compiled code, or of a remote DCS system sending an interrupt request to the server, among others.
Rollback SQL Statements
Total number of executed DB2 rollbacks. This metric is an indicator of the amount of activity on the database or in the application and may be an indicator of conflict among applications.Rollback statements + Internal rollbacks
Rollback Wait Time spent waiting for transactions to be rolled back due to a failure.
Metric Description
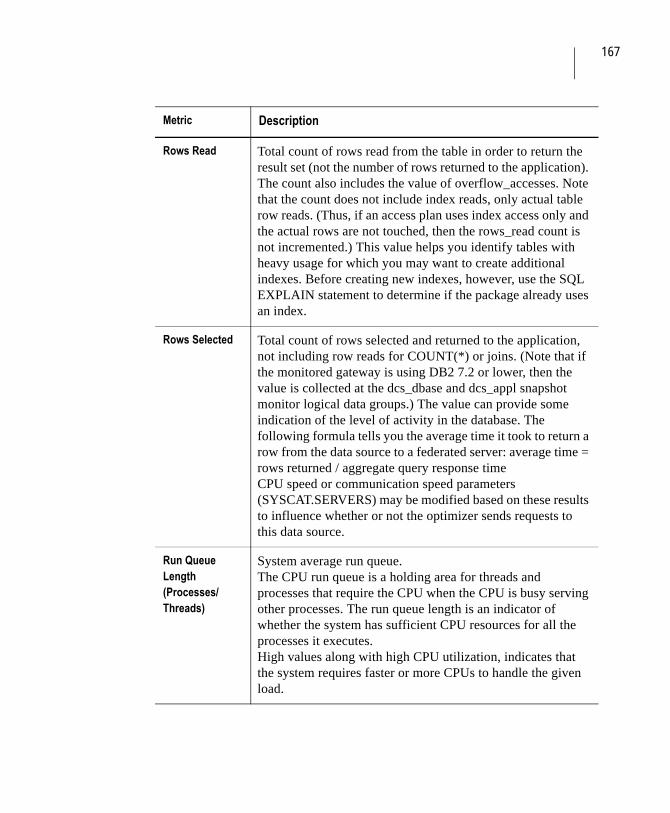
167
Rows Read Total count of rows read from the table in order to return the result set (not the number of rows returned to the application). The count also includes the value of overflow_accesses. Note that the count does not include index reads, only actual table row reads. (Thus, if an access plan uses index access only and the actual rows are not touched, then the rows_read count is not incremented.) This value helps you identify tables with heavy usage for which you may want to create additional indexes. Before creating new indexes, however, use the SQL EXPLAIN statement to determine if the package already uses an index.
Rows Selected Total count of rows selected and returned to the application, not including row reads for COUNT(*) or joins. (Note that if the monitored gateway is using DB2 7.2 or lower, then the value is collected at the dcs_dbase and dcs_appl snapshot monitor logical data groups.) The value can provide some indication of the level of activity in the database. The following formula tells you the average time it took to return a row from the data source to a federated server: average time = rows returned / aggregate query response timeCPU speed or communication speed parameters (SYSCAT.SERVERS) may be modified based on these results to influence whether or not the optimizer sends requests to this data source.
Run Queue Length (Processes/Threads)
System average run queue.The CPU run queue is a holding area for threads and processes that require the CPU when the CPU is busy serving other processes. The run queue length is an indicator of whether the system has sufficient CPU resources for all the processes it executes.High values along with high CPU utilization, indicates that the system requires faster or more CPUs to handle the given load.
Metric Description
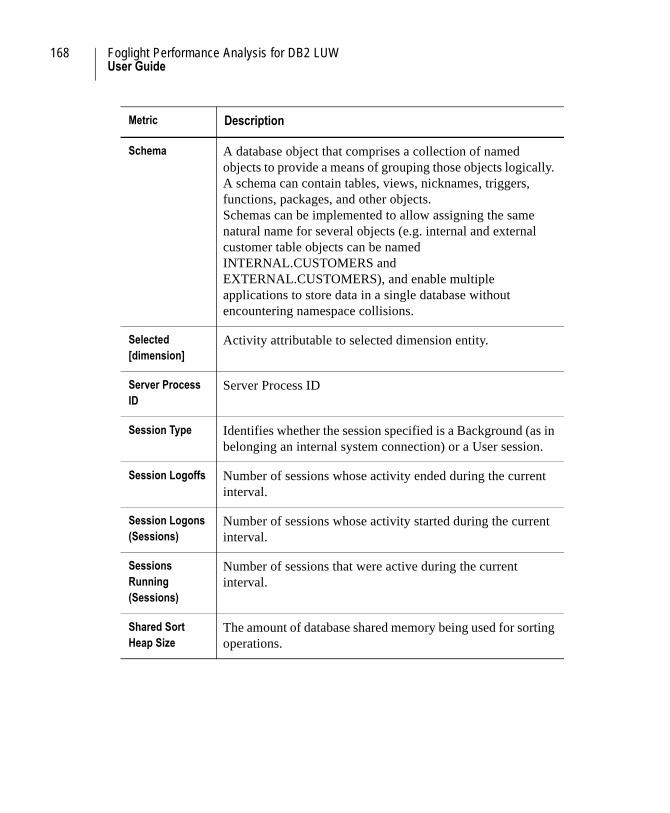
168 Foglight Performance Analysis for DB2 LUWUser Guide
Schema A database object that comprises a collection of named objects to provide a means of grouping those objects logically. A schema can contain tables, views, nicknames, triggers, functions, packages, and other objects. Schemas can be implemented to allow assigning the same natural name for several objects (e.g. internal and external customer table objects can be named INTERNAL.CUSTOMERS and EXTERNAL.CUSTOMERS), and enable multiple applications to store data in a single database without encountering namespace collisions.
Selected [dimension]
Activity attributable to selected dimension entity.
Server Process ID
Server Process ID
Session Type Identifies whether the session specified is a Background (as in belonging an internal system connection) or a User session.
Session Logoffs Number of sessions whose activity ended during the current interval.
Session Logons (Sessions)
Number of sessions whose activity started during the current interval.
Sessions Running (Sessions)
Number of sessions that were active during the current interval.
Shared Sort Heap Size
The amount of database shared memory being used for sorting operations.
Metric Description
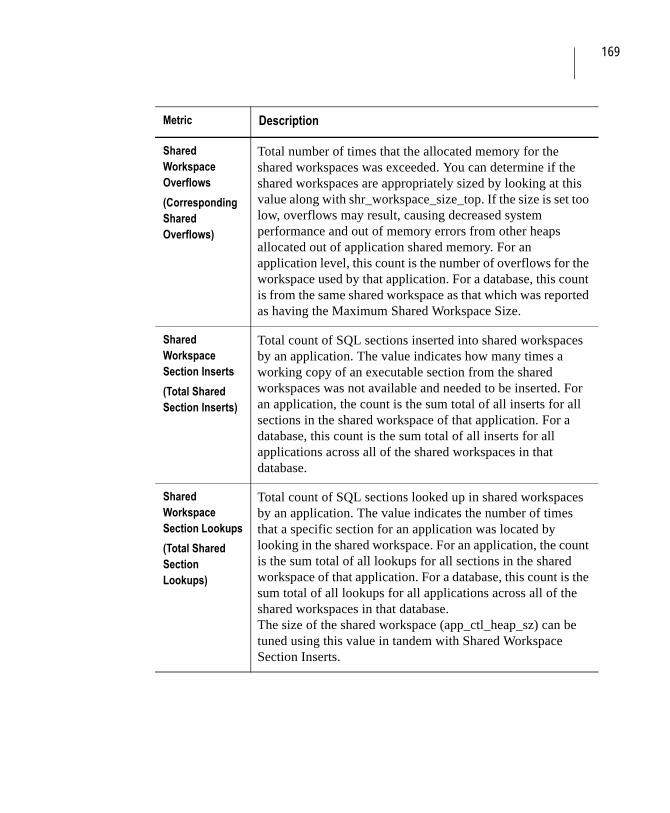
169
Shared Workspace Overflows
(Corresponding Shared Overflows)
Total number of times that the allocated memory for the shared workspaces was exceeded. You can determine if the shared workspaces are appropriately sized by looking at this value along with shr_workspace_size_top. If the size is set too low, overflows may result, causing decreased system performance and out of memory errors from other heaps allocated out of application shared memory. For an application level, this count is the number of overflows for the workspace used by that application. For a database, this count is from the same shared workspace as that which was reported as having the Maximum Shared Workspace Size.
Shared Workspace Section Inserts
(Total Shared Section Inserts)
Total count of SQL sections inserted into shared workspaces by an application. The value indicates how many times a working copy of an executable section from the shared workspaces was not available and needed to be inserted. For an application, the count is the sum total of all inserts for all sections in the shared workspace of that application. For a database, this count is the sum total of all inserts for all applications across all of the shared workspaces in that database.
Shared Workspace Section Lookups
(Total Shared Section Lookups)
Total count of SQL sections looked up in shared workspaces by an application. The value indicates the number of times that a specific section for an application was located by looking in the shared workspace. For an application, the count is the sum total of all lookups for all sections in the shared workspace of that application. For a database, this count is the sum total of all lookups for all applications across all of the shared workspaces in that database. The size of the shared workspace (app_ctl_heap_sz) can be tuned using this value in tandem with Shared Workspace Section Inserts.
Metric Description
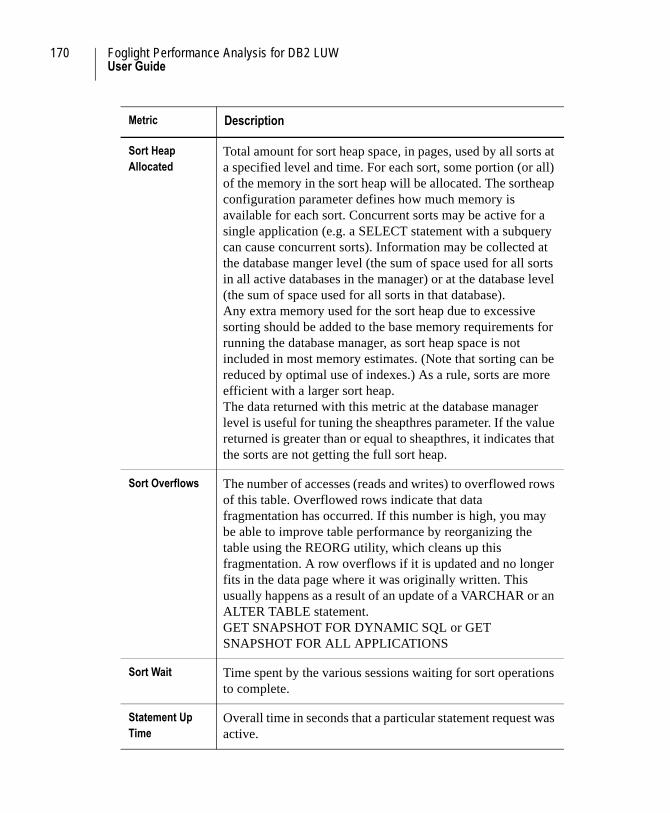
170 Foglight Performance Analysis for DB2 LUWUser Guide
Sort Heap Allocated
Total amount for sort heap space, in pages, used by all sorts at a specified level and time. For each sort, some portion (or all) of the memory in the sort heap will be allocated. The sortheap configuration parameter defines how much memory is available for each sort. Concurrent sorts may be active for a single application (e.g. a SELECT statement with a subquery can cause concurrent sorts). Information may be collected at the database manger level (the sum of space used for all sorts in all active databases in the manager) or at the database level (the sum of space used for all sorts in that database). Any extra memory used for the sort heap due to excessive sorting should be added to the base memory requirements for running the database manager, as sort heap space is not included in most memory estimates. (Note that sorting can be reduced by optimal use of indexes.) As a rule, sorts are more efficient with a larger sort heap. The data returned with this metric at the database manager level is useful for tuning the sheapthres parameter. If the value returned is greater than or equal to sheapthres, it indicates that the sorts are not getting the full sort heap.
Sort Overflows The number of accesses (reads and writes) to overflowed rows of this table. Overflowed rows indicate that data fragmentation has occurred. If this number is high, you may be able to improve table performance by reorganizing the table using the REORG utility, which cleans up this fragmentation. A row overflows if it is updated and no longer fits in the data page where it was originally written. This usually happens as a result of an update of a VARCHAR or an ALTER TABLE statement.GET SNAPSHOT FOR DYNAMIC SQL or GET SNAPSHOT FOR ALL APPLICATIONS
Sort Wait Time spent by the various sessions waiting for sort operations to complete.
Statement Up Time
Overall time in seconds that a particular statement request was active.
Metric Description
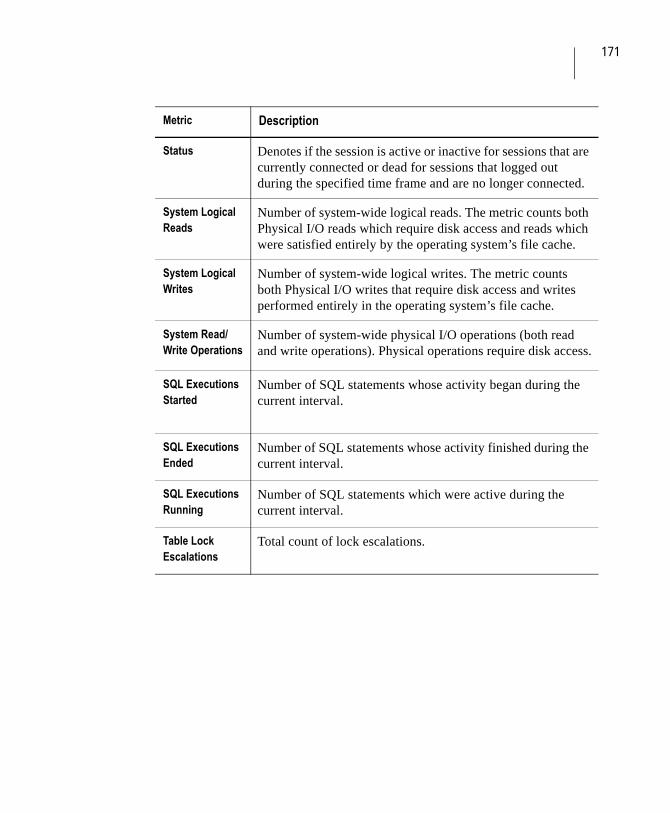
171
Status Denotes if the session is active or inactive for sessions that are currently connected or dead for sessions that logged out during the specified time frame and are no longer connected.
System Logical Reads
Number of system-wide logical reads. The metric counts both Physical I/O reads which require disk access and reads which were satisfied entirely by the operating system’s file cache.
System Logical Writes
Number of system-wide logical writes. The metric counts both Physical I/O writes that require disk access and writes performed entirely in the operating system’s file cache.
System Read/Write Operations
Number of system-wide physical I/O operations (both read and write operations). Physical operations require disk access.
SQL Executions Started
Number of SQL statements whose activity began during the current interval.
SQL Executions Ended
Number of SQL statements whose activity finished during the current interval.
SQL Executions Running
Number of SQL statements which were active during the current interval.
Table Lock Escalations
Total count of lock escalations.
Metric Description

172 Foglight Performance Analysis for DB2 LUWUser Guide
Threshold Cleans Ratio
Dirty Page Threshold Cleaner Triggers shows the number of asynchronous page cleaners triggered due to the changed pages threshold (CHNGPGS_THRESH) being reached. This could potentially be because large buffer pools are trying to write large chunks of changed pages to disk infrequently, or small buffer pools are triggering too many small writes.Dirty Page Threshold Cleaners Triggered
(Buffer Pool Victim Page Cleaners Triggered + Dirty Page Threshold Cleaners Triggered + Buffer Pool Log Space Cleaners Triggered) * 100
Total CPU Usage (% CPU Used)
Overall operating system CPU Usage (including DB2 UDB).Total Kernel CPU Usage + Total User CPU Usage
Total Database Size
Total memory allocated to the database.
Total DB2 Logical Reads
Number of system-wide logical reads. The metric counts both Physical I/O reads which require disk access and reads which were satisfied entirely by the operating system’s file cache.
Total DB2 Logical Writes
Number of system-wide logical writes. The metric counts both Physical I/O writes that require disk access and writes performed entirely in the operating systems file cache.
Total DB2 Instance Memory
The amount of memory the DB2 instance consumed during the monitored time frame.
Total DB2 Physical Reads
The number of DB2 I/O reads that require disk access. Physical reads occur when the requested data is not present in the cache. Memory Pool Data Physical Reads + Memory Pool Index Physical Reads + Log Reads + Direct Reads + Buffer Pool Temporary Data Physical Reads + Buffer Pool Temporary Index Physical Reads
Metric Description

173
Total DB2 Physical Writes
The number of DB2 I/O writes which require disk access.Log Writes + Memory Pool Data Writes + Memory Pool______________________________________________Index Writes + Direct Writes
Total Free Memory
Amount of free RAM in the system.
Total Kernel CPU Usage (% CPU Busy)
Percentage of CPU time consumed by the operating system's processes (kernel mode activities).
Total User CPU Usage (% CPU Busy)
Percentage of CPU time consumed by the operating system's processes (user mode activities).
Total Memory Usage (MB)
Amount of memory consumed by all OS processes (including DB2), both RAM resident and swapped.
Total Physical I/O Operations
Total number of disk operations (both read and write) performed by the operating system. This metric does not include operations that were satisfied using the file system cache.Total Physical Reads + Total Physical Writes
Total Physical Reads
Number of system-wide physical reads. The metric counts Physical I/O reads that require disk access. Physical reads occur when the requested data is not present in the file system cache.
Total Physical Writes
Number of system-wide physical writes. The metric counts Physical I/O writes that require disk access.
Total Resident Memory Usage (MB)
Amount of resident memory consumed by entire operating system processes (including DB2 UDB).
Metric Description

174 Foglight Performance Analysis for DB2 LUWUser Guide
Total Sorts Total count of executed sorts. For a database or application, you can determine the percentage of sorts that need more heap space by dividing Total Sorts by sort_overflows. Additionally, you can determine average sort time by dividing total_sort_time by Total Sorts. Increasing the sort heap size will have little impact on performance unless the number of sort overflows is small with respect to the total sorts is significant. The Total Sorts value (with the SQL EXPLAIN statement) can also help you determine which statements perform large numbers of sorts and thus require tuning.
UOW Execution Time spent waiting for the database manager to execute requests on behalf of the unit of work, when they wait event type's is not CPU or I/O.
UOW Queued Time spent waiting for a task that is queued, because the database manager does not have the resources to execute it. This wait event type was added in version 9.7.
Utility Heap Size Aggregate Utility Heap Size for all databases defined for the instance.
Utility Wait Time spent waiting on the various system utilities such as database backup/restore, data fast load, etc.
Vectored I/O Requests
The number of vectored I/O requests. More specifically, the number of times DB2 performs sequential prefetching of pages into the page area of the buffer pool.
Victim Page Cleaners Ratio (%)
If this ratio is low, DB2 is being forced to dirty steal too frequently, either the number of page cleaners cannot keep up with dirty buffer pools, CHNGPGS_THRESH is set too high, or NUM_IOCLEANERS is too low.Buffer Pool Victim Page Cleaners Triggered________________________________________________(Buffer Pool Victim Page Cleaners Triggered + Dirty PageThreshold Cleaners Triggered + Buffer Pool Log Space Cleaners Triggered) * 100
Metric Description
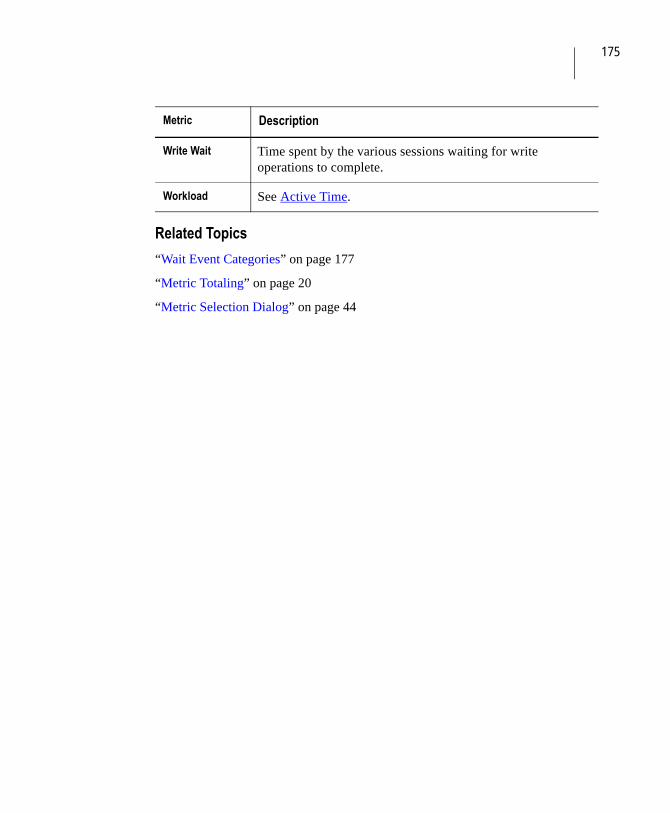
175
Related Topics
“Wait Event Categories” on page 177
“Metric Totaling” on page 20
“Metric Selection Dialog” on page 44
Write Wait Time spent by the various sessions waiting for write operations to complete.
Workload See Active Time.
Metric Description

176 Foglight Performance Analysis for DB2 LUWUser Guide
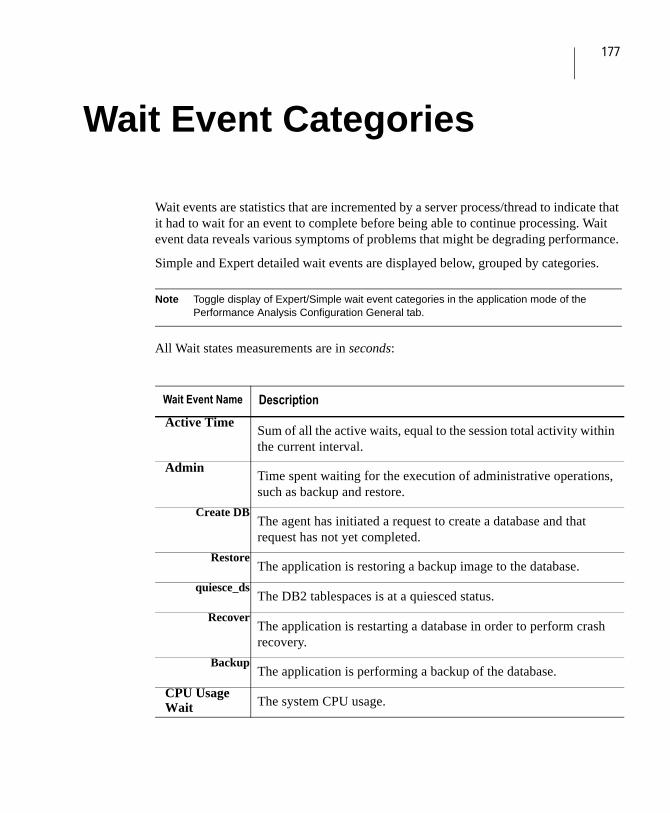
177
Wait Event Categories
Wait events are statistics that are incremented by a server process/thread to indicate that it had to wait for an event to complete before being able to continue processing. Wait event data reveals various symptoms of problems that might be degrading performance.
Simple and Expert detailed wait events are displayed below, grouped by categories.
Note Toggle display of Expert/Simple wait event categories in the application mode of the Performance Analysis Configuration General tab.
All Wait states measurements are in seconds:
Wait Event Name Description
Active TimeSum of all the active waits, equal to the session total activity within the current interval.
AdminTime spent waiting for the execution of administrative operations, such as backup and restore.
Create DBThe agent has initiated a request to create a database and that request has not yet completed.
RestoreThe application is restoring a backup image to the database.
quiesce_dsThe DB2 tablespaces is at a quiesced status.
RecoverThe application is restarting a database in order to perform crash recovery.
BackupThe application is performing a backup of the database.
CPU Usage Wait The system CPU usage.
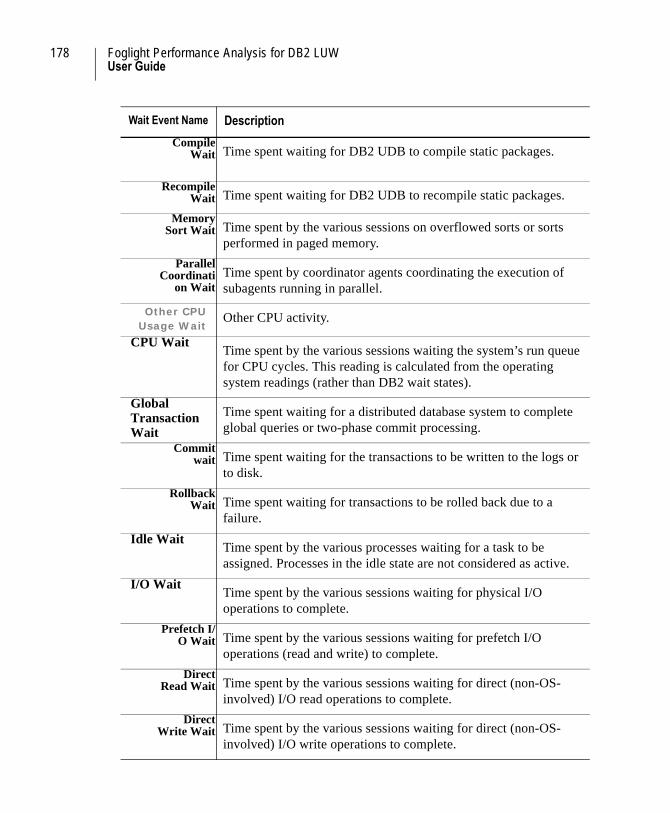
178 Foglight Performance Analysis for DB2 LUWUser Guide
Compile Wait Time spent waiting for DB2 UDB to compile static packages.
Recompile Wait Time spent waiting for DB2 UDB to recompile static packages.
Memory Sort Wait Time spent by the various sessions on overflowed sorts or sorts
performed in paged memory.
Parallel Coordinati
on WaitTime spent by coordinator agents coordinating the execution of subagents running in parallel.
Other CPU Usage Wait
Other CPU activity.
CPU WaitTime spent by the various sessions waiting the system’s run queue for CPU cycles. This reading is calculated from the operating system readings (rather than DB2 wait states).
Global Transaction Wait
Time spent waiting for a distributed database system to complete global queries or two-phase commit processing.
Commit wait Time spent waiting for the transactions to be written to the logs or
to disk.
Rollback Wait Time spent waiting for transactions to be rolled back due to a
failure.
Idle WaitTime spent by the various processes waiting for a task to be assigned. Processes in the idle state are not considered as active.
I/O WaitTime spent by the various sessions waiting for physical I/O operations to complete.
Prefetch I/O Wait Time spent by the various sessions waiting for prefetch I/O
operations (read and write) to complete.
Direct Read Wait Time spent by the various sessions waiting for direct (non-OS-
involved) I/O read operations to complete.
Direct Write Wait Time spent by the various sessions waiting for direct (non-OS-
involved) I/O write operations to complete.
Wait Event Name Description
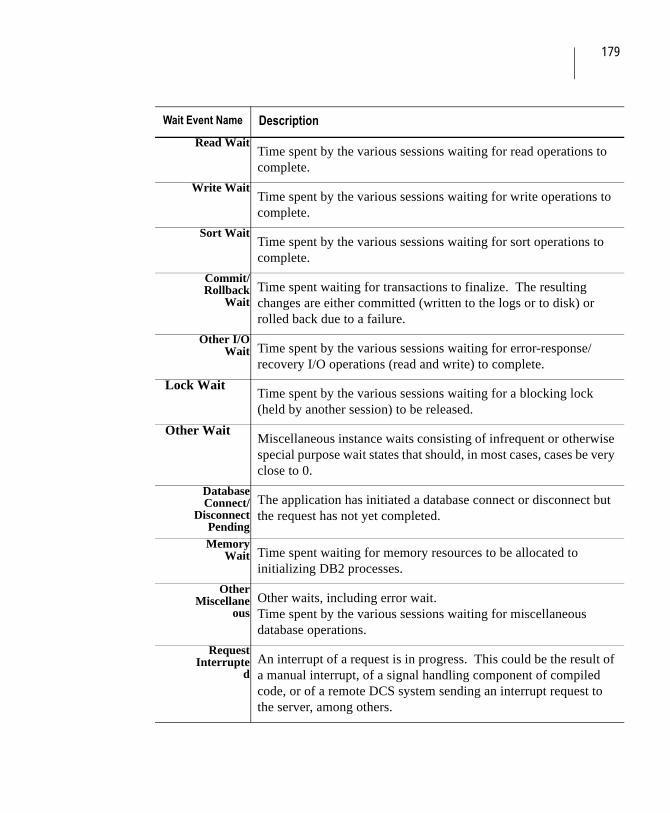
179
Read WaitTime spent by the various sessions waiting for read operations to complete.
Write Wait Time spent by the various sessions waiting for write operations to complete.
Sort WaitTime spent by the various sessions waiting for sort operations to complete.
Commit/Rollback
WaitTime spent waiting for transactions to finalize. The resulting changes are either committed (written to the logs or to disk) or rolled back due to a failure.
Other I/O Wait Time spent by the various sessions waiting for error-response/
recovery I/O operations (read and write) to complete.
Lock WaitTime spent by the various sessions waiting for a blocking lock (held by another session) to be released.
Other Wait Miscellaneous instance waits consisting of infrequent or otherwise
special purpose wait states that should, in most cases, cases be very close to 0.
Database Connect/
Disconnect Pending
The application has initiated a database connect or disconnect but the request has not yet completed.
Memory Wait Time spent waiting for memory resources to be allocated to
initializing DB2 processes.
Other Miscellane
ousOther waits, including error wait.Time spent by the various sessions waiting for miscellaneous database operations.
Request Interrupte
dAn interrupt of a request is in progress. This could be the result of a manual interrupt, of a signal handling component of compiled code, or of a remote DCS system sending an interrupt request to the server, among others.
Wait Event Name Description
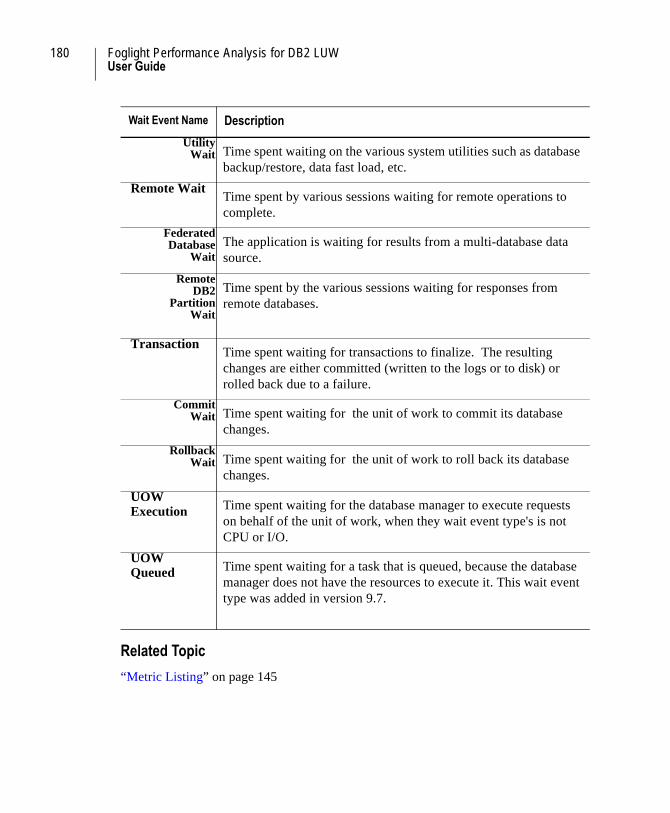
180 Foglight Performance Analysis for DB2 LUWUser Guide
Related Topic
“Metric Listing” on page 145
Utility Wait Time spent waiting on the various system utilities such as database
backup/restore, data fast load, etc.
Remote WaitTime spent by various sessions waiting for remote operations to complete.
Federated Database
WaitThe application is waiting for results from a multi-database data source.
Remote DB2
Partition Wait
Time spent by the various sessions waiting for responses from remote databases.
TransactionTime spent waiting for transactions to finalize. The resulting changes are either committed (written to the logs or to disk) or rolled back due to a failure.
Commit Wait Time spent waiting for the unit of work to commit its database
changes.
Rollback Wait Time spent waiting for the unit of work to roll back its database
changes.
UOW Execution
Time spent waiting for the database manager to execute requests on behalf of the unit of work, when they wait event type's is not CPU or I/O.
UOW Queued Time spent waiting for a task that is queued, because the database
manager does not have the resources to execute it. This wait event type was added in version 9.7.
Wait Event Name Description
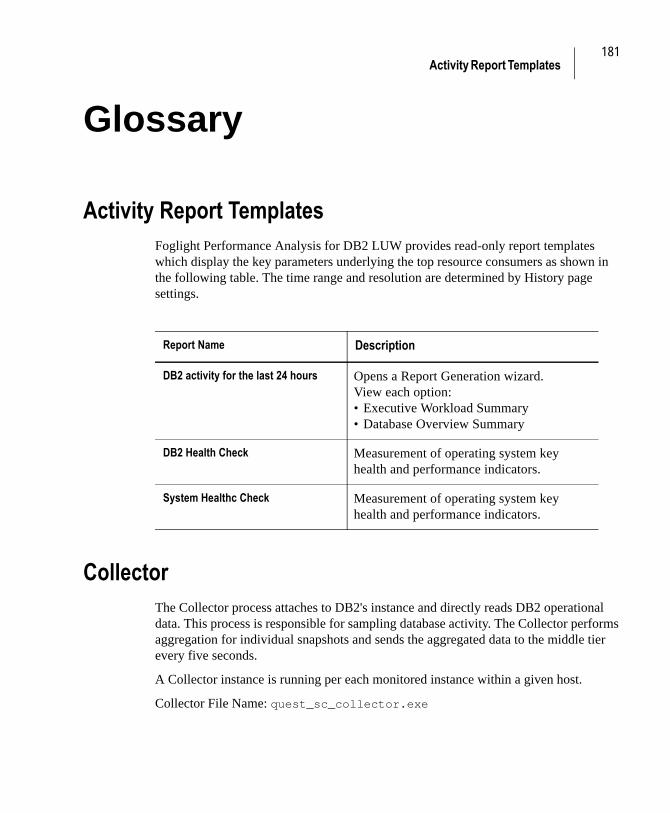
181Activity Report Templates
Glossary
Activity Report TemplatesFoglight Performance Analysis for DB2 LUW provides read-only report templates which display the key parameters underlying the top resource consumers as shown in the following table. The time range and resolution are determined by History page settings.
CollectorThe Collector process attaches to DB2's instance and directly reads DB2 operational data. This process is responsible for sampling database activity. The Collector performs aggregation for individual snapshots and sends the aggregated data to the middle tier every five seconds.
A Collector instance is running per each monitored instance within a given host.
Collector File Name: quest_sc_collector.exe
Report Name Description
DB2 activity for the last 24 hours Opens a Report Generation wizard. View each option:• Executive Workload Summary• Database Overview Summary
DB2 Health Check Measurement of operating system key health and performance indicators.
System Healthc Check Measurement of operating system key health and performance indicators.
182 Foglight Performance Analysis for DB2 LUWUser Guide
CPU UsageTime spent by the various sessions consuming CPU cycles.
This reading is taken directly from the operating system (rather than DB2 wait states).
When SQL statements and other types of calls are made to DB2, an amount of CPU time is necessary to process the call. Average calls require a small amount of CPU time.
However, a SQL statement involving a large amount of data or a runaway query can potentially consume a large amount of CPU time, reducing CPU time available for other
processing.
CPU utilization is the most important operating system statistic in the tuning process.
Excessive CPU usage usually means that there is little idle CPU on the system. This could be caused by an inadequately-sized system, by untuned SQL statements, or by inefficient application programs.
CPU WaitTime spent by the various sessions waiting in the system’s run queue for CPU cycles.
This reading is calculated from the operating system readings (rather than DB2 wait states).
The amount of CPU Wait time is dependant upon the number of concurrent processes
and threads requesting CPU time. The metric value should be inspected in conjunction
with the value of the "Run Queue Length" metric.
Resource UsageResource usage is the processing activity measured through the total DB2 Wait Event Categories and denominated in time duration and percentage of the total. All displayed metrics are a reflection of the chosen resource.