Embed Size (px)
Citation preview
Focusing on Demand: Using eBay data to
analyze the demand for telescopes.
Christopher P. Adams
Laura L. Bivins∗
Bureau of Economics, Federal Trade Commission
Email: [email protected] or [email protected]
Draft
January 17, 2003
Abstract
This paper analyzes the value of using data from on-line auctions to de-
termine product market definitions and competitive effects of mergers. Tra-
ditionally this type of demand analysis has been based on retail transaction
data, particularly “scanner” data. However, such data is not always readily
available and may be difficult to interpret. Auction data, particularly data
from on-line auctions like eBay may be easy to access and may be much
easier to interpret. The authors analyze data from a series of auctions for
3 different types of telescopes, held over a 8 week period. The results sug-
gest that the demand for telescopes is very elastic and that the two types
of telescope designs (the Schmidt-Cassegrain and the Maksutov-Cassegrain
designs) are in different product markets, supporting a position taken by the
Commission in a recent case.
∗The authors would like to thank George Deltas, Dan Hosken, Mike Moiseyev, DavidSchmidt, Mike Vita, Bill Vogt, two anonymous referees and other FTC colleagues for usefuldiscussions on these issues. However, all errors are our own. Note also that this paper doesnot necessarily represent the views of the Commission or any individual Commissioners.
1

1 Introduction
Antitrust economists working at the FTC and the DOJ are routinely asked to
determine the answer to two questions when evaluating a potential merger:
• What is the product market?
• What will be the competitive effects of the merger?
Traditionally, evidence from interviews and documents have been com-
plemented by econometric evidence based on retail price and transaction
data. Recently, the use of scanner data has become widespread. This data
allows for the estimation of cross-price elasticities which are used to deter-
mine product market definitions, and own-price elasticities which are used
to determine the price effects of a merger.1 Unfortunately, transaction data
is not always available, and even when such data is available the results may
not be easy to interpret.2 On the other hand, on-line auction data may be
readily available from sites such as eBay.com. It is possible that auction data
is able to provide enough information to identify each bidder’s “willingness
to pay” for the item and thus the demand curve for the item. Further, it
may be possible to determine an individual’s willingness to pay for multiple
items and thus identify a demand system over multiple products.
This paper presents an analysis of eBay auction data for three types of
telescopes, Meade’s ETX90EC, ETX125EC and LX200, that retail for be-
tween $500 and $1,500. This data was collected over an eight week period
in April, May and June of 2002, and includes information from over 58 sepa-
rate auctions with over 200 separate bidders. The data was used to estimate
the demand for the three telescopes and calculate own-price and cross-price
elasticities. The results suggest that demand for these telescopes is very elas-
tic. This result corresponds with our understanding that these telescopes are
1See Hosken et al. (2002) for a discussion of some of the issues involved with using suchdata.
2Such data often suffers from the classic “simultaneity” problem, in that changes inprice may be the result of changes in demand rather than changes in supply. See Nevo(2000) for an excellent introduction to one possible solution, the BLP model.
1

expensive luxury items, generally bought by hobbyists and high end con-
sumers. The results also suggest that the Schmidt-Cassegrain telescopes and
the Maksutov-Cassegrain telescopes are in different product markets. This
result supports the claim that was made by the Commission in a previous
merger case regarding this industry,3 as well as in the more recent merger
case.4
EBay and other online auction houses may be a rich source of data for
economists analyzing the market structure of certain industries. There exists
a number of papers that have used data from online auctions to analyze differ-
ent aspects of the auction mechanism and the value of information available
to buyers and sellers. For example, Lucking-Reiley et al. (2000), Livingston
(2002) and Hasker et al. (2001) discuss the importance of seller’s ratings,
reserve prices and the length of the auction, and Roth and Ockenfels (2000)
analyze the effect of the fixed endpoint of eBay auctions as compared to the
“going, going, gone” feature of Amazon.com auctions. While it is not the
focus of the paper, Hasker et al. (2001) analyze the effect on bids of charac-
teristics of computer monitors sold on eBay (flat screen, dpi, size), the good
being sold (like new, refurbished), as well as the auction (secret reserve price).
There are also a number of papers that look at the question of whether bids
in auctions can be used to infer demand functions. In particular, Haile and
Tamer (2002) propose two different methods of bounding demand curves (ac-
tually the distribution of private values) from English auction data similar
to the data found in eBay auctions. The authors use these methods to make
predictions on reserve price policies from timber auction data. The analysis
presented below will explicitly look at inferring demand from eBay auction
data and discuss some of the concerns relating to this type of inference.
The rest of the paper proceeds as follows. Section 2 discusses the data
and how it was obtained. It also describes the telescopes and provides some
background information on the product market. Section 3 analyzes the de-
mand for these telescopes, based on high bids from the eBay auctions. This
section will present own-price and cross-price demand elasticities and discuss
3FTC v. Harbour Group Investments, 1990 WL 198819 (D.D.C. 1990).4http://www.ftc.gov/opa/2002/05/meadecelestron.htm.
2

some of the issues and concerns with the estimations. Section 4 concludes.
2 EBay Data on Bids for Cassegrain Tele-
scopes
2.1 Product Market
Telescopes come in three major optical configurations, refractors, reflectors
and catadioptric (mirror-lens). The first type of telescope to be invented was
a refractor. These telescopes were developed by Galileo and use lenses to
magnify the light. The major advantage of refractors is that they can give a
sharp image of the object. Refractors are generally used for observing plan-
ets, the moon and the sun. The next to be developed was the reflector. This
type of telescope was developed by Sir Isaac Newton. This telescope uses
a mirror at its base to focus and magnify the light. The major advantage
of reflectors is that they can be made at very large apertures very cheaply.
This means that they can let in a lot of light, enabling the observer to view
very faint objects, such as small galaxies. Newest are the catadioptric opti-
cal systems, including the Schmidt-Cassegrain and the Maksutov-Cassegrain
designs. These telescopes are also reflectors but they use multiple mirrors to
increase the focal distance (the magnification) in a smaller physical space.
These are good all-purpose telescopes that tend to have large apertures and
large focal lengths for their physical size. The two ETX models are Maksutov-
Cassegrain designs, while the LX200 is a Schmidt-Cassegrain design.
The most important characteristic of the telescope is aperture size. Mag-
nification and light gathering ability are both functions of the aperture size.
Light gathering ability is a function of the area of the mirror or lens, and thus
a function of the square of the telescope’s diameter. The greater the light
gathering ability the fainter the objects that can be seen. The ETX90EC
is the smallest at 90mm (3.5 inches), then the ETX125EC at 125mm (4.9
inches), and largest is the LX200 at 200mm (7.9 inches). Our understanding
of the product market suggests, that the actual design difference between the
3

two Maksutov-Cassegrains (ETX90EC and ETX125EC) and the Schmidt-
Cassegrain (LX200) is not as important as the difference in aperture (a 3
inch difference between the ETX125EC and the LX200).
In the 1990 case, the Commission argued that the appropriate antitrust
market was for 8 inch Schmidt-Cassegrain telescopes (of which the LX200
is one).5 Only two firms manufactured and sold 8 inch Schmidt-Cassegrain
telescopes in the United States, Meade and Celestron, and these two firms
were planning to undertake a joint venture. This joint venture was seen by
the Commission as being equivalent to a merger. Because of their high quality
optics, relatively low prices and relatively compact size, these telescopes were
the most popular telescope for the serious amateur astronomer. Due to
the Commission’s actions, the merger was never consummated. Since 1990,
both companies have introduced a line of smaller and cheaper Maksutov-
Cassegrain telescopes. Two of Meade’s Maksutov-Cassegrain telescopes are
the ETX90EC and the ETX125EC. The ETX series is the most popular
type of telescope sold by Meade, with sales of around $70 million dollars
annually,6 although the Schmidt-Cassegrain remains highly prized by the
serious hobbyists.7 Recently the Commission stated, “that the two companies
together would monopolize the market for Schmidt-Cassegrain telescopes and
would eliminate substantial actual competition between Meade and Celestron
in the market for performance telescopes.”8
2.2 Auctions Methods on EBay
EBay runs a second price English auction for a variety of consumer goods,
including telescopes. The auction is “second price” because the winner pays
5At the time, the Maksutov-Cassegrain designs were made by very small scale manu-facturers and were substantially more expensive than the comparable Schmidt-Cassegraindesigns.
6This estimate is based on Meade’s 2001 10K filing with the SEC and statements byMeade CEO, John Diebel, at the April 2002 Press Conference.
7See “astro note” 19 from the Astronomy League (http://www.astroleague.org) for adiscussion of the different types of telescopes.
8http://www.ftc.gov/opa/2002/05/meadecelestron.htm
4

the next highest bid, and they are “English auctions” because bids are as-
cending. A typical eBay auction lasts for 7 days, although the seller can
decide to have an auction last for 3, 5, or 10 days. When a potential bidder
views a current auction on eBay, they see a description of the item for sale.
This description is up to the seller’s discretion, but is usually fairly detailed
and may include a picture of the item. The bidder can also review the recent
history of the seller and ratings by previous customers. Most importantly,
the bidder observes the current high bid for the item. They also observe
information on other bidders for that auction including when they bid, but
not what their bid was.9 Lastly, all bidders know the exact time remaining
before the close of the auction.10
After observing this information, the bidder may decide to bid on the
item. The amount entered by the bidder is actually a “proxy” bid. That
is, eBay will take that bid and automatically bid slightly above the next
highest bidder up to the amount entered. For example, lets assume the
bidding increment is $1 and say that the current high bidder is “bidmaniac”
and the current high bid is $47. Then “scopeme” enters the auction with
a bid of $300. What happens next depends on the actual bid entered by
bidmaniac. If it is $50, then scopeme becomes the high bidder and $51
becomes the current high bid. If, however, bidmaniac entered a bid of $302,
then bidmaniac remains the highest bidder and the current high bid is $301.
This system allows the bidder to leave the auction, without having to worry
about being outbid, as the proxy system will keep on bidding automatically.
If however, a bidder is outbid, then eBay can notify them by email. The
winner of the auction, is the highest bidder (at the earliest time if there is a
tie), at the end of the auction. The winner pays an amount slightly above
the next highest bid.
9The bidder’s ID is clickable and provides a recent history of that bidder’s transactions,as well as ratings from sellers or buyers involved in those transactions.
10An important difference between eBay auctions and Amazon.com auctions is thateBay auctions have a precise end point. Roth and Ockenfels (2000) discuss the effect ofthis difference in detail.
5
2.3 EBay Auction Data
At the close of each auction, eBay provides the following information: a
description of the product, including photos and other information at the
seller’s discretion, the date and time of each bid, the identification name for
each bid (their eBay account name), and the amount of each bid, except for
the highest bid.11 We collected data from 31 auctions for the ETX90EC, 20
auctions for the ETX125EC and 7 auctions for the LX200 during April, May
and June of 2002. Table 1 presents some summary statistics for the auctions
that we observed. These figures clearly show that the ETX90 is the most
popular of the three telescopes, with greater numbers of both buyers and
sellers. Note that the retail prices are for the basic units which don’t come
with tripods or the “go to” system in the case of the ETX products (both are
included in the price of the LX200). Winning bids are greater than the retail
prices because many of the telescope auctioned come with accessories. Note
also that the retail price for the LX200 is actually the retail price for the
equivalent Celestron telescope, as the current version of the LX200 includes
GPS tracking hardware and is significantly more expensive.
Table 2 presents summary statistics of important characteristics of the
actual telescopes sold. Note that we did not include auctions with very small
number of bidders. The telescopes themselves are second hand, while the
sellers may be individual owners or stores. The product itself may be fairly
new or even “in the box.” For example, one seller stated that their ETX90EC
was
“...a great piece of glass for viewing your cosmic neighbors from
your backyard. The package includes the ETX-90 telescope, a
hard carrying case made to fit, a tripod, t-adaptor to connect
to your SLR camera, a hand controller, an upgraded lens, and a
right-angle viewfinder. I’ve used it only twice over the past year
11The exact information on the high bid depends on how much greater it is than thesecond highest bid. If the difference between the two high bids is less than the increment,then the high bid is observed. Otherwise, the amount listed for the high bid is equal tothe second highest bid plus the increment.
6

ETX90 ETX125 LX200
Number of Auctions 31 20 7
Number of Bidders 157 98 44
Average Bidders 6.7 6.9 7.9
Average Bid $394.68 $785.19 $1166.39
Average High Bid $506.47 $966.68 $1555.07
Highest High Bid $830 $1349.01 $1750
Lowest High Bid $270 $680 $1331.50
Retail Price (Basic) $495 $895 $1,499
Table 1: Summary Statistics of Telescope Auctions
to catch a glimpse of Saturn’s rings and Jupiter’s moons. It is in
excellent condition.”
Sellers often describe their telescope as being “like new” or “as if new”.
Hasker et al. (2001) shows that this type of statement is an important deter-
minant of computer monitor prices. Another important characteristic of the
Meade telescopes is the inclusion of the “go to” or Autostar computer con-
troller. All of Meade’s telescopes come with a computer located in the mount
of the telescope. Once the telescope is aligned, this computer can point the
telescope at any of the thousands of celestial objects that are programmed
into the computer’s database.12 The Autostar controller allows the user to
access the computer. The other vital accessory is the tripod, especially for
the larger telescopes. The camera adapter (T-adapter) allows a 35mm SLR
camera to be attached to the telescope for celestial photography.
Table 3 presents information on the 85 bidders who bid in more than
one auction for one of the three products during the time in which the data
was being collected. The first row states that for bidders who bid multiple
times and bid on the ETX90, 56 % bid only on the ETX90, 39 % also bid
on the ETX125, and 11 % also bid on the LX200. Of the 85 bidders who
12This system is also fairly simple to align. The process involves setting the telescopelevel and pointing north, entering time and location (unnecessary with GPS), and correct-ing the alignment against two prominent stars.
7

ETX90 ETX125 LX200
“Like New” 20 % 56 % 42 %
“Go to” 53 % 86 % 58 %
Tripod 64 % 71 % 100 %
Camera Adapter 18 % 12 % 27 %
Table 2: Summary Statistics of Telescope Characteristics
ETX90 ETX125 LX200 N
ETX90 .56 .39 .11 54
ETX125 .53 .45 .10 40
LX200 .32 .21 .63 19
Table 3: Tracking Bidders Across Products (85 Bidders)
bid multiple times, 54 bid on the ETX90. Note that the choices are not
exclusive and so the percentages add to more than 100%. The numbers sug-
gest an important characteristic of the telescope market. That is, bidders
on the Schmidt-Cassegrain (LX200) are more likely to only bid on that tele-
scope and not on the Maksutov-Cassegrain (ETX90 and ETX125) telescopes,
while bidders for the Maksutov-Cassegrain telescopes are unlikely to bid on
the Schmidt-Cassegrain. These statistics support the Commission’s position
that the two telescope designs are not in the same antitrust product market.
This table also highlights an important characteristic of eBay data, which is
that it is possible to follow people across a series of auctions for related prod-
ucts providing the Commission with information on how customer’s perceive
differentiated products.
8

3 Inferring Demand for Telescopes from EBay
Data
3.1 Estimation Techniques
We use bids from these auctions to estimate the demand for the ETX90, the
ETX125 and the LX200. If in the population, we know each person’s value
or “willingness to pay” for each particular telescope, then we can calculate
the demand for each telescope. At each price, all those people with values
greater than the price will buy a telescope and choose the telescope with the
highest consumer surplus, giving the quantity demanded at that price. By
changing the prices and recalculating demand for the three telescopes at the
new prices, we can calculated own and cross-price elasticities. If however, we
have valuations for a random sample of the population then we can estimate
the demand. The eBay data gives a sample of the population, although
not a random sample of the population. The sample is a self-selected group
willing to bid on telescopes on eBay. This sample is also not a sample of each
person’s valuation, but rather a sample of each person’s bid for a particular
telescope. The following is a list of assumptions necessary to use this data
to estimate demand.
Assumption 1 The sample represents buyers for new telescopes.
Assumption 1 captures three issues. First, it assumes that eBay bidders
for telescopes are representative of the general population of telescope buy-
ers. Unfortunately, we are not aware of any demographic information on
either eBay bidders or telescope buyers. However, in 2002 there were over 50
million registered eBay users, and there is no reason to expect an substantial
difference between the two groups. Second, it assumes that eBay bidders
are randomly selected out of the population of telescope buyers. Due to the
low cost of searching and bidding on-line, such buyers may have a greater
elasticity of demand than off-line buyers. Therefore, our estimates may be
biased to the high side. Third, it is based on people buying second-hand
9

telescopes. It is not clear how this affect the interpretation of our elasticity
estimates.
Assumption 2 Each bidder’s highest bid in each auction is equal to that
bidders value for the product being auctioned.
We assume that the highest bid that a person makes in a particular auc-
tion is equal to that person’s valuation for the product sold in that auction.
There are two characteristics of eBay auctions that justify this assumption.
First, as discussed above, eBay uses a “proxy” bidding system. That is, it
asks the bidder to enter their “maximum” bid for the item, and then it au-
tomatically bids the lowest amount such that the bidder with the highest
maximum is the highest bidder. In a sealed bid second-price auction, the
weakly dominant strategy is for the bidder to bid their valuation for the
product. In fact, eBay states that this is what each person should do (Roth
and Ockenfels (2000)). Second, eBay is an English (ascending price auction),
and in the “button model” of such an auction, each bidder holds down a
button up until their valuation is reached. The last person holding down
her button wins the auction. Therefore, even if people don’t understand the
proxy bidding system, they should remain in the auction and keep bidding
until their valuation is reached.13 However, there are good reasons to think
that people do not bid their valuations, and these are discussed at the end
of this section.
Assumption 3 Bidder i’s high bid in auction j is
log(Bij) = log(vij) = Xjβ + log(εij) (1)
Where Bij is bidder i’s highest bid in auction j, vij is bidder i’s value
for the item sold in auction j, Xj is the observable characteristics of the
item, and εij is the error term. This assumption allows the estimation of
a “hedonic” bid model using OLS. It states that bids vary linearly with
respect to characteristics of the product that is being auctioned. We can
13EBay offers the option of emailing the bidder once they have been outbid.
10
interpret Xjβ as representing the “common value” for the telescope and εij
as representing the “private value” for the telescope. In the results section,
β and εij are estimated using OLS.
Assumption 4 Each Bij represents a distinct buyer, k.
Assumption 5 Each buyer, k, has a value vkl for each of the three tele-
scopes, denoted l ∈ {ETX90, ETX125, LX200}.
Assumptions 4 and 5 form the basis for the demand estimation. Even
though one bidder may bid in multiple auctions, their bids in the different
auctions are assumed to represent distinct bidders. These is mainly done
for simplicity. The fact that bids are not independent can be accounted for
by bootstrapping the standard errors. The distribution of errors (private
values) across the three telescopes is accounted for by Assumption 6. This
method allows the own and cross-elasticities to be calculated without making
unreasonable assumptions on the distribution of errors. The distribution of
errors is drawn from the actual residuals, with correlation across telescopes
based on the actual probability that different bidders bid across different
types of telescopes.
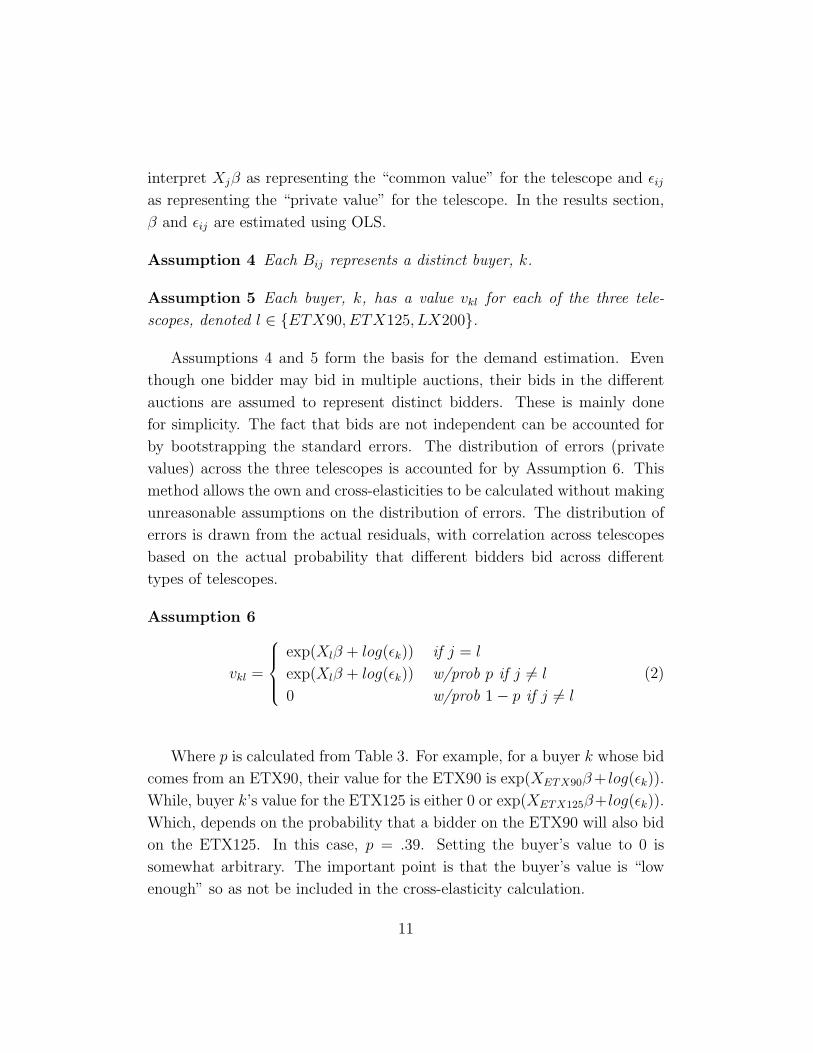
Assumption 6
vkl =
exp(Xlβ + log(εk)) if j = l
exp(Xlβ + log(εk)) w/prob p if j 6= l
0 w/prob 1− p if j 6= l
(2)
Where p is calculated from Table 3. For example, for a buyer k whose bid
comes from an ETX90, their value for the ETX90 is exp(XETX90β + log(εk)).
While, buyer k’s value for the ETX125 is either 0 or exp(XETX125β+log(εk)).
Which, depends on the probability that a bidder on the ETX90 will also bid
on the ETX125. In this case, p = .39. Setting the buyer’s value to 0 is
somewhat arbitrary. The important point is that the buyer’s value is “low
enough” so as not be included in the cross-elasticity calculation.
11

Demand is estimated in three steps. Step 1 estimates β̂ using OLS and
Equation (1), where the Xj variables include dummies for the ETX90, the
ETX125, a dummy for “like new”, a dummy for the “go to” system, a dummy
for a tripod, and a dummy for a camera adapter.
Step 2 calculates the “new” value of each of the three types of telescopes
for every observation (that is for every bidder’s high bid in every auction).
This is done using β̂, the estimated residual (εij), and the probabilities of
bidding across products calculated from Table 3, where each telescope is
assumed to be “like new” and have no camera adapter. Additionally, in the
case of the LX200, the telescope is assumed to have a tripod and “go to”.
In the case of the ETX90 and the ETX125, the telescope is assumed to have
neither. Therefore, for bidder i who bid in auction j, where auction j is for
an ETX90 telescope, their value for the ETX90, vij(ETX90), that is “like
new” and doesn’t have any accessories is given by,
vij(ETX90) = exp(XETX90β̂ETX90+Xlikenewβ̂likenew+β̂constant+log(εij)) (3)
Next we need to determine what the “like new” value is for products that
were not bid upon by an individual bidder. Here we use the probabilities of
bidding across products to give us our estimates. For example, if the bidder
is from an auction for the ETX125, the probability a priori that bidder has a
positive value for the ETX90 is 53 % which, from our data, is the proportion
of ETX125 bidders who bid multiple times and bid on the ETX90. Thus, for
bidder i who bid in auction j, where auction j is for an ETX125, their value
for the ETX90 that is “like new” and doesn’t have any accessories is given
by
vij(ETX90) =
exp(Xβ̂ETX90 + log(εij)) with probability .53
0 with prob (1− .53).(4)
To summarize, for each observation (ij) we calculate vij(ETX90), vij(ETX125)
and vij(LX200). If ij is from an ETX90 auction, then vij(ETX90) is de-
fined by Equation (3). While vij(ETX125) and vij(LX200) could be either
positive (using the OLS estimates and the residual (εij)) or 0. The propor-
12

tion that are 0, is determined by the probabilities from Table 3, and the
observations are assigned 0 at random.14
Step 3 uses these valuations and the prices to determine whether each
bidder i for auction j will purchase an ETX90, an ETX125, a LX200 or
nothing. An ETX90 is purchased if
1. vij(ETX90) > PETX90, and
2. vij(ETX90)− PETX90 > vij(ETX125)− PETX125, and
3. vij(ETX90)− PETX90 > vij(LX200)− PLX200,
where Pj is the retail price of product sold in auction j.
3.2 Results
Table 4 presents the results for the OLS estimates.15 The assumption that
bidders bid their values for each telescope is of major concern. One argument
is that higher bidders or “later” bidders are going to bid much closer to their
value than lower bidders or earlier bidders. The results are estimated on
four different samples. The first column shows the estimates for a sample
restricted to the top 8 bidders in each auction, the second column estimates
the regression on a sample restricted to the top 4 bidders in each auction, the
third column is for the bidders who bid on the last day of the auction, and
the fourth column is for bidders who bid in the last 4 hours of the auction. A
concern with these estimates is sample selection bias. A possible alternative is
to use quantile regression (Koenker and Hallock (2001)). These results don’t
seem to depend crucially on the sample that is used, however it is necessary
to look at the elasticity estimates for each sample. Step 2 calculates the log
residuals using the estimated coefficients for Equation (1). Table 5 presents
the mean value for the telescopes, assuming that every buyer has a positive
14An alternative is to just use the people who bid across products, but the sample isvery small, given the variation in the characteristics in the telescopes.
15The standard errors are from the OLS estimates, however the bootstrap standarderrors were similar.
13

Top 8 Bidders Top 4 Bidders Last Day Last 4 Hours
ETX90 -.97 -1.03 -.93 -.98
(.06) (.04) (.04) (.05)
ETX125 -.34 -.45 -.41 - .43
(.07) (.04) (.04) (.05)
“Like New” .12 .07 .08 .06
(.04) (.03) (.03) (.03)
“Go to” .15 .22 .21 .24
(.05) (.03) (.03) (.04)
Tripod .21 .22 .21 .24
(.05) (.03) (.03) (.03)
Adapter .22 .12 .06 .06
(.05) (.03) (.03) (.04)
Constant 6.59 6.84 6.82 6.87
(.07) (.05) (.05) (.06)
N 400 226 178 113
R2 .60 .86 .86 .89
Table 4: OLS estimates (Standard Errors)
14

Top 8 Top 4 Last 24 hours Last 4 hours
ETX90 328.00 336.26 400.00 387.69
(99.40) (65.77) (66.77) (59.47)
ETX125 618.45 654.04 671.46 669.99
(187.42) (117.45) (112.08) (102.78)
LX200 1241.20 1585.17 1541.94 1651.40
(376.14) (284.67) (257.38) (253.33)
Table 5: Mean Value by Telescope Type (Standard Deviation)
value for every telescope. Step 3 uses the values for each type of telescope
for each bidder in each auction to calculate the demand system for the three
telescopes. The assumption is that each bidder in each auction is a distinct
individual demander of telescopes.
Table 6 presents the own-price and cross-price elasticities for the three
types of telescopes, calculated at retail prices for the basic telescope (pre-
sented in Table 1) using the sample of the top 8 bidders for each auction.
The numbers presented are the absolute value of the ratio of a percentage
change in the demand for the telescope named at the top of each column over
a 10 % increase in the price of the telescope named in the left hand column.
This table shows that the own-price elasticity of demand for the three types
of telescopes is very high, confirming our intuition that these are expensive
luxury items. It also shows that while there is a lot of movement between
the ETX models (the Maksutov-Cassegrain design), especially down from the
ETX125 to the cheaper ETX90, there is no movement between either ETX
model and the LX200 (the 8 inch Schmidt-Cassegrain). Table 7 presents the
own-price and cross-price elasticity measures calculated at retail prices for
the sample of bidders who bid in the last day. The results show that the
demand elasticities are higher for this population. However, there is still no
movement between the two telescope designs.
15

ETX90 ETX125 LX200
ETX90 3.33 0 0
ETX125 13.33 5 0
LX200 0 0 5
Table 6: Demand Elasticities at Retail Prices (Basic) - Top 8
ETX90 ETX125 LX200
ETX90 5.56 10 0
ETX125 0 10 0
LX200 0 0 4.83
Table 7: Demand Elasticities at Retail Prices (Basic) - Last Day
3.3 Issues and Concerns
There are three major concerns with using data from eBay auctions to infer
demand for new telescopes. First, in many cases the telescopes sold on eBay
are second-hand. Second, we do not have a random sample of potential
telescope buyers. Third, bidders may not actually bid their valuation (or
willingness-to-pay) for the telescope.
In regards to the first concern, there does not seem to be a major lemons
problem with the market and the telescopes seem to hold their value well.
We see from Table 1 that the retail price for the ETX90, ETX125 and the
LX200 is $495, $895, and $1,499 respectively. The average sale price on
eBay is higher because these auctions include accessories. For example, the
retail price for the ETX90 does not include the “go to” system or a tripod,
while a high proportion of ETX90s sold on eBay come with these acces-
sories. The overall success of eBay suggests that it has been able to resolve
the lemons problem in a great number of markets (Cohen (2002); Livingston
(2002)). While the estimated coefficients are calculated using all of the tele-
scope auctions, the demand elasticities are calculated at the value for “like
new” telescopes.
The second concern is a concern with any data used to infer demand for
16

the whole population. It is likely that data from different supply channels
(speciality telescope retailers, camera shops, department stores) will each
give different estimates of elasticity. The value of the data collected from
a particular channel, depends on how important that channel is. The tele-
scopes analyzed in this paper are sold on Amazon.com, Ritz Camera (Wolfe
Camera), Scope City (a major speciality telescope retailer), the Discovery
Store and Astronomics (another major speciality telescope retailer). It seems
reasonable to suspect that data collected from eBay is going to give higher
elasticities of demand than data collected from a speciality telescope retailer
like Scope City.16 Another issue is that eBay bidders on telescopes may not
be representative of buyers of telescopes. However, it is not obvious why there
would be a substantial difference between the two groups. EBay users are
likely to have higher incomes than the general population, however telescope
buyers are also likely to have higher incomes than the general population.
The third concern with these estimates is the assumption that each person
bids their valuation. A more reasonable assumption would be that each
person bids below their valuation for the telescope.17 Unfortunately, knowing
that bidders are bidding under their valuation and that the demand curve
may be biased in this way, does not tell us whether the estimate for the
elasticity is too high or too low. Haile and Tamer (2002) discuss this issue in
detail and present two methods for “bounding” the demand curve, by making
two assumptions. First, that each bidder bids below their valuation. Second,
that the final auction price is above each losing participants valuation for the
item. The authors show that with a large number of auctions (around 200),
it is possible to get very tight bounds with just these two assumptions by
using general characteristics of order statistics. Hasker et al. (2001) makes
the assumption that last minute bids (literally) are equal to the bidder’s
valuation for the item. Their argument is that in the last minute of an
16Speciality stores are more likely to have customers with a high interest in buying atelescope. It would be good to test this hypothesis, however the data for such a comparisonis not currently available.
17See Arora et al. (2002) for an estimate of how eBay bidders discount their bids toaccount for the “option” value of future auctions for the same good.
17

auction on eBay, it is “as if” the auction is a sealed bid second price auction
and therefore Vickery’s result applies.18
Two other issues are that the data may be censored and that arbitrage
may affect the demand estimates. Censoring may occur because when a
potential bidder arrives at an eBay auction, the current price may already be
above their willingness to pay.19 Censoring is a major problem for estimating
the whole demand curve using this kind of data. However in this case it is
not a major concern because we do not estimate the whole demand curve,
just the elasticities at retail prices. Arbitrage is likely to be a problem in
many markets, particularly those with low transaction costs. Arbitragers
may introduce supply shocks into the data reducing the accuracy of the
demand estimates. However, telescopes have substantial transaction costs
because they are difficult and expensive to ship. The telescopes analyzed in
this paper are quite large, fairly heavy and quite fragile.
4 Conclusion
EBay data may provide a solution to a number of problems faced by economists
analyzing demand in particular industries. The data has a number of im-
portant characteristics, including the fact that it is based on bids in second
price auctions, and thus may allow the economist to directly estimate demand
characteristics. This paper analyzes the demand for three types of telescopes
ranging in price from $500 to $1,500. The results suggest that the demand for
telescopes is highly elastic, and that the smaller Maksutov-Cassegrain designs
are not a close substitutes for the larger more expensive Schmidt-Cassegrain
designs. There are, however, a number of concerns about the assumptions
necessary to generate these results. The authors believe that much more
research needs to be done before an accurate conclusion can be drawn about
18Note, such bidders may still discount in order to account for future auctions (Aroraet al. (2002)).
19See Zhang et al. (2002) for a discussion of how to account for this problem. Notehowever that a disproportionate number of bidders bid at the end of the auction. In ourdata, 38% of bidders bid in the last day, and over 25% of those bid in the last 20 minutes.
18

the overall value of using data from on-line auctions for antitrust purposes.
References
Arora, Ashish, Hao Xu, Rema Padman, and William Vogt, “Optimal
Bidding in Sequential Online Auctions,” 2002. Heinz School of Public
Policy, Carnegie Mellon University.
Cohen, Adam, The Perfect Store: Inside eBay, first ed., Little, Brown and
Company, 2002.
Haile, Philip A. and Elie T. Tamer, “Inference with Incomplete Model
of English Auctions,” Journal of Political Economy, 2002. Forthcoming.
Hasker, Kevin, Raul Gonzalez, and Robin Sickles, “An Analysis of
Strategic Behavior and Consumer Surplus in eBay Auctions,” October
2001. Rice University.
Hosken, Daniel, Daniel O’Brien, David Scheffman, and Michael
Vita, “Demand System Estimation and its Application to Horizontal
Merger Analysis,” FTC Working Paper April 2002.
Koenker, Roger and Kevin F. Hallock, “Quantile Regression,” Journal
of Economic Perspectives, 2001, 15 (4), 143–156.
Livingston, Jeffrey, “How Valuable is a Good Reputation? A Sample
Selection Model of Internet Auctions,” September 2002. University of
Maryland.
Lucking-Reiley, David, Doug Bryan, Naghi Prasad, and Daniel
Reeves, “Pennies from EBay: the Determinants of Price in Online Auc-
tions,” January 2000. Vanderbilt University.
Nevo, Aviv, “A Practicioner’s Guide to Estimation of Random-Coefficients
Logit Models of Demand,” Journal of Economics and Management Strat-
egy, 2000, 9 (4), 513–548.
19

Roth, Al and Axel Ockenfels, “Last Minute Bidding and the Rules of
Ending Second-Price Auctions: Theory and Evidence from a Natural Ex-
periment on the Internet,” 2000. Department of Economics, Harvard.
Zhang, Alex, Dirk Beyer, Julie Ward, Tongwei Liu, Alan Karp,
Kemal Guler, Shailendra Jain, and Hsiu-Khuern Tang, “Model-
ing the Price-Demand Relationship Using Auction Bid Data,” July 2002.
Hewlett-Packard.
20