Embed Size (px)
Citation preview
Measurement =
MotivationFOCUS ON THE PROCESS
Cole Kanyer – Ellensburg High School
Resume
• 2002 EHS graduate
• ’02-’04 Played at Wenatchee Valley College
• ‘04-’06 played at Central Washington University
• Spring ‘07 volunteer baseball coach at EHS
• Spring ‘08-spring ‘09 assistant coach at Mossyrock High School
• Spring ’10-Spring’13 Head coach at Mossyrock High School
• 3 final four appearances, 4th place in ‘10, 3rd place in 12, 3rd
place in 13

Why I do it
• I love watching kids succeed -- It truly is all about the players and the baseball lessons and life lessons baseball can teach
• What type of team will you have if you don’t have a solid relationship with your athletes?
• Fun bonus is being able to watch kids succeed playing baseball
Why I do it cont’d
• Attended baseball specific professional development
• ABCA conference-THE BEST baseball P.D. you can
receive. Spend the $$ to go!!
• Introduced to Brian Cain in ‘10, Justin Dehmer in ’12
• Look into these guys! Invaluable information from both
regarding the mental game
• Dive into baseball information-
• Books by ABCA coaches; baseball publications such as
Collegiate Baseball Magazine
Why measure?
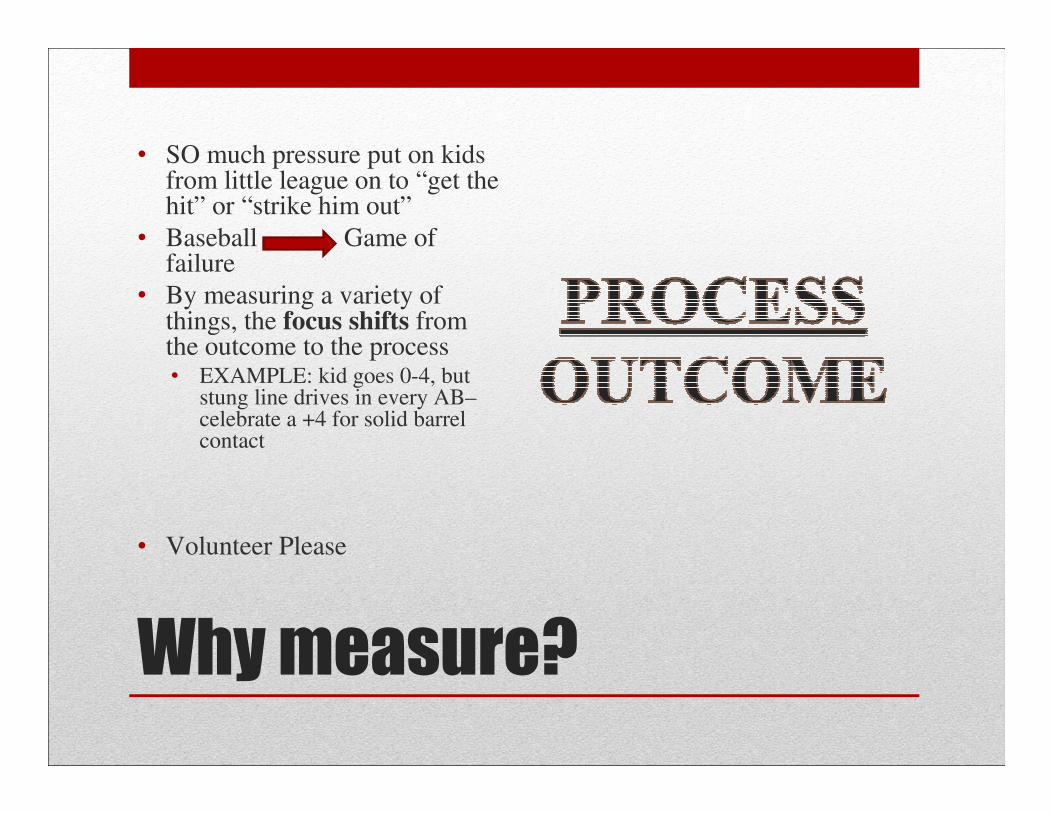
• SO much pressure put on kids from little league on to “get the hit” or “strike him out”
• Baseball Game of failure
• By measuring a variety of things, the focus shifts from the outcome to the process• EXAMPLE: kid goes 0-4, but
stung line drives in every AB–celebrate a +4 for solid barrel contact
• Volunteer Please
What to measure
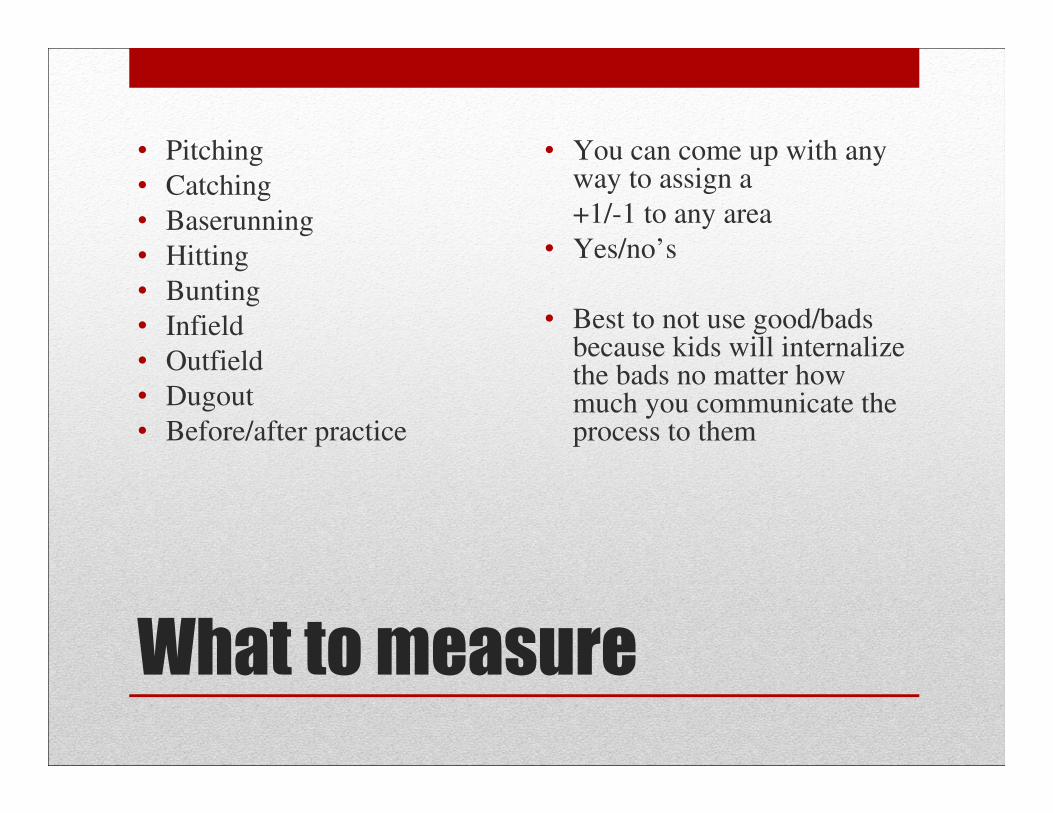
• Pitching
• Catching
• Baserunning
• Hitting
• Bunting
• Infield
• Outfield
• Dugout
• Before/after practice
• You can come up with any way to assign a
+1/-1 to any area
• Yes/no’s
• Best to not use good/bads because kids will internalize the bads no matter how much you communicate the process to them

In game measurement
• Dugout Board
• QAB
• Dirt ball Reads
• Freebies
• Foul Balls
• First pitches seen
• BASE2
• Charts
• Freebie Chart
• BASE 2
• Pitching Charts
• Hitting Charts
(opponent)
• Extra Bases Taken

BASE2B A S E 2 W/L
Visitor
Home
Season 1/5
QAB’s:
Season 2/5
Season 3/5
Season 4/5
Season 5/5
B=Big Inning – 3 Runs or More
A=Answer Back RBI
S=Score First In Game
E=Extend Your Lead RBI
2=2 Out RBI
Count Each Category Once Per Game
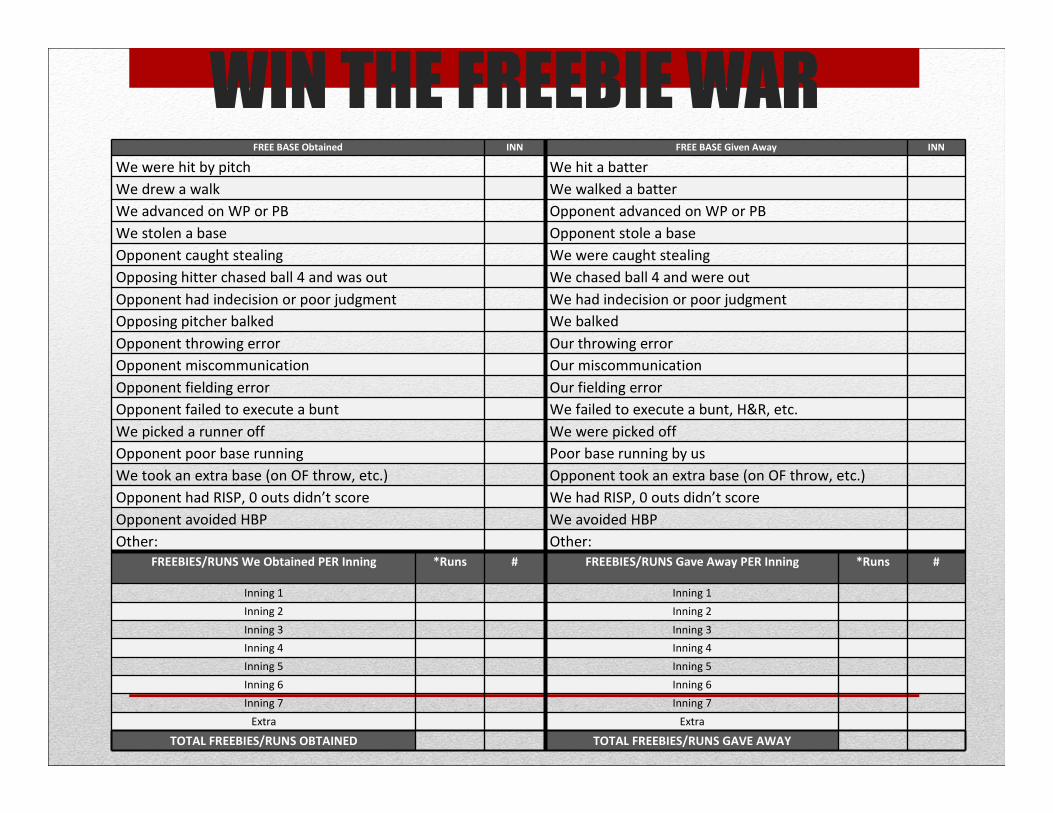
FREE BASE Obtained INN FREE BASE Given Away INN
We were hit by pitch We hit a batter
We drew a walk We walked a batter
We advanced on WP or PB Opponent advanced on WP or PB
We stolen a base Opponent stole a base
Opponent caught stealing We were caught stealing
Opposing hitter chased ball 4 and was out We chased ball 4 and were out
Opponent had indecision or poor judgment We had indecision or poor judgment
Opposing pitcher balked We balked
Opponent throwing error Our throwing error
Opponent miscommunication Our miscommunication
Opponent fielding error Our fielding error
Opponent failed to execute a bunt We failed to execute a bunt, H&R, etc.
We picked a runner off We were picked off
Opponent poor base running Poor base running by us
We took an extra base (on OF throw, etc.) Opponent took an extra base (on OF throw, etc.)
Opponent had RISP, 0 outs didn’t score We had RISP, 0 outs didn’t score
Opponent avoided HBP We avoided HBP
Other: Other:
FREEBIES/RUNS We Obtained PER Inning *Runs # FREEBIES/RUNS Gave Away PER Inning *Runs #
Inning 1 Inning 1
Inning 2 Inning 2
Inning 3 Inning 3
Inning 4 Inning 4
Inning 5 Inning 5
Inning 6 Inning 6
Inning 7 Inning 7
Extra Extra
TOTAL FREEBIES/RUNS OBTAINED TOTAL FREEBIES/RUNS GAVE AWAY
WIN THE FREEBIE WAR
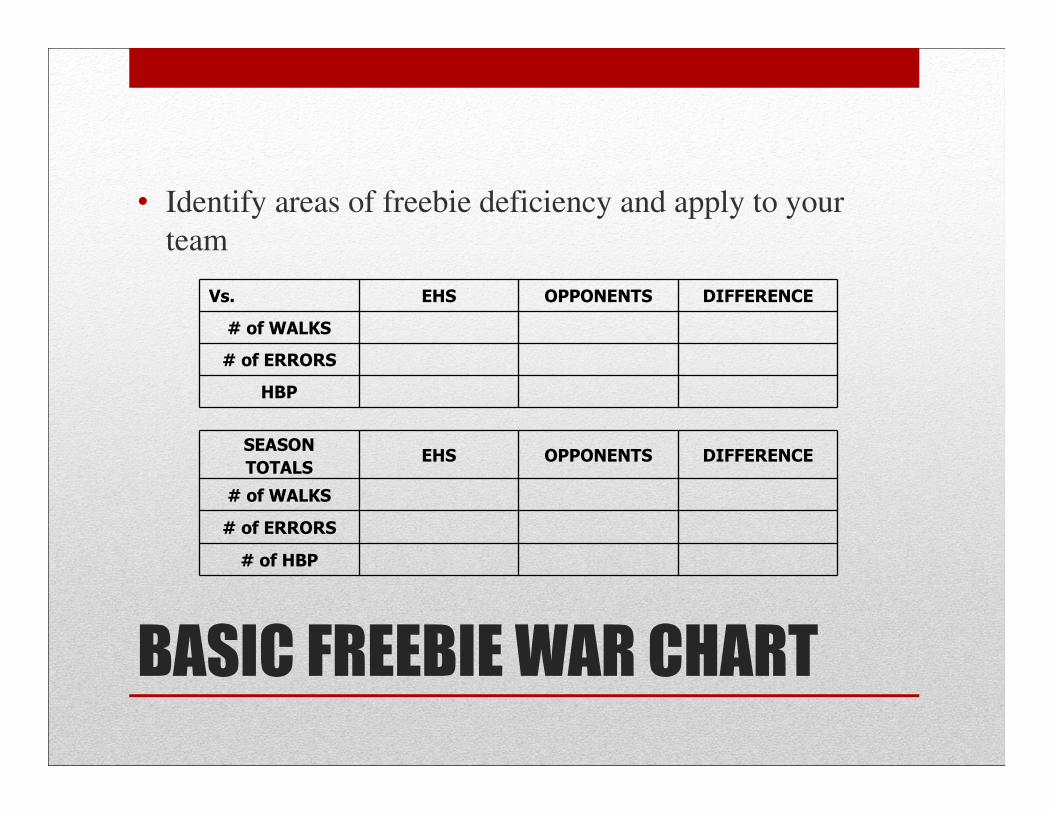
BASIC FREEBIE WAR CHART
• Identify areas of freebie deficiency and apply to your
team
Vs. EHS OPPONENTS DIFFERENCE
# of WALKS
# of ERRORS
HBP
SEASON
TOTALSEHS OPPONENTS DIFFERENCE
# of WALKS
# of ERRORS
# of HBP
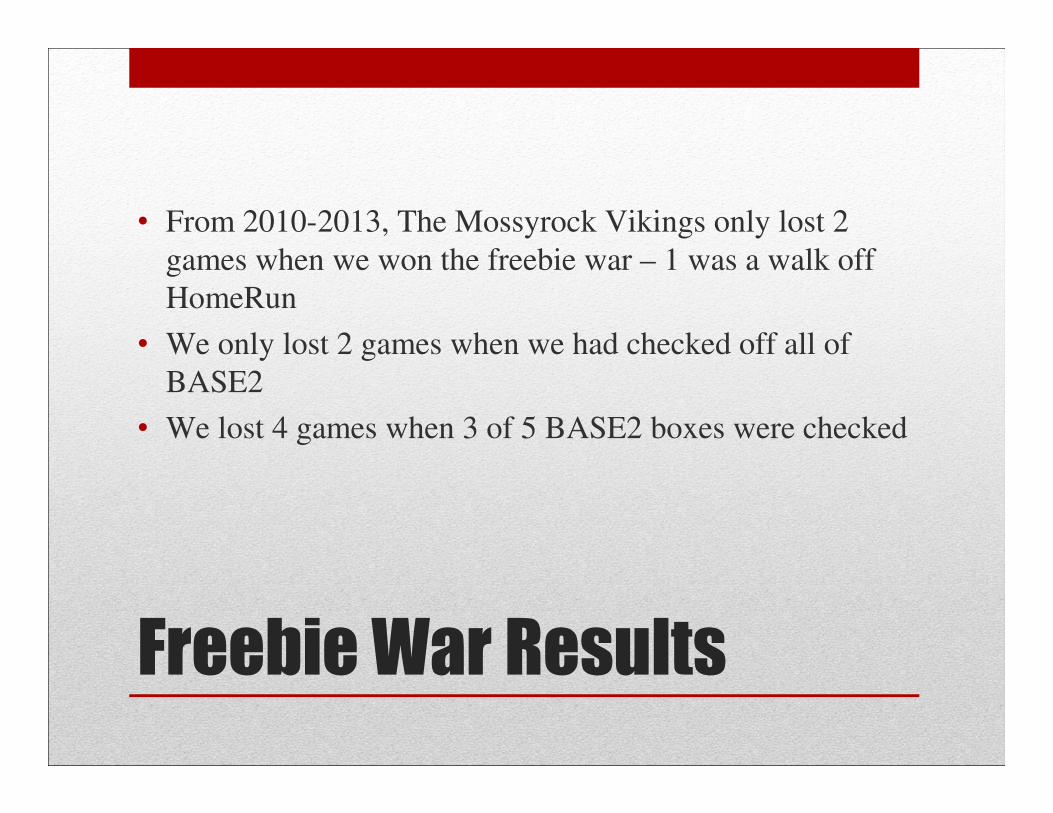
Freebie War Results
• From 2010-2013, The Mossyrock Vikings only lost 2
games when we won the freebie war – 1 was a walk off
HomeRun
• We only lost 2 games when we had checked off all of
BASE2
• We lost 4 games when 3 of 5 BASE2 boxes were checked
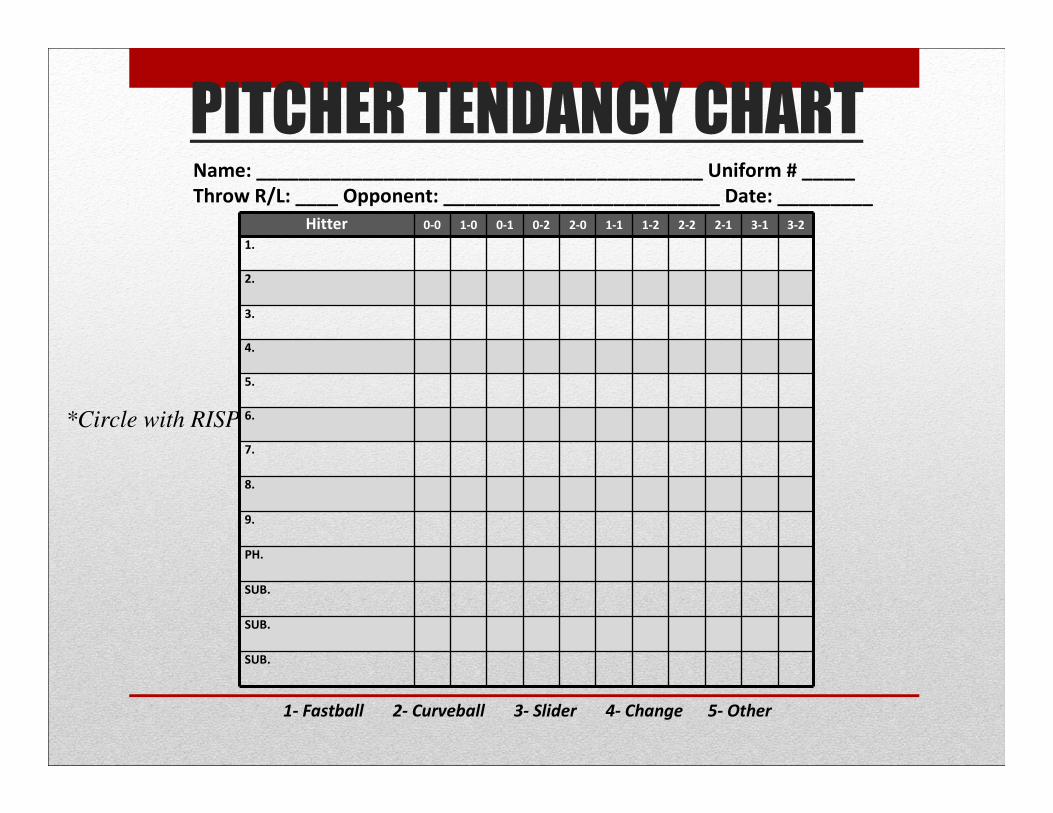
PITCHER TENDANCY CHART
Hitter 0-0 1-0 0-1 0-2 2-0 1-1 1-2 2-2 2-1 3-1 3-2
1.
2.
3.
4.
5.
6.
7.
8.
9.
PH.
SUB.
SUB.
SUB.
1- Fastball 2- Curveball 3- Slider 4- Change 5- Other
*Circle with RISP
Name: __________________________________________ Uniform # _____
Throw R/L: ____ Opponent: __________________________ Date: _________
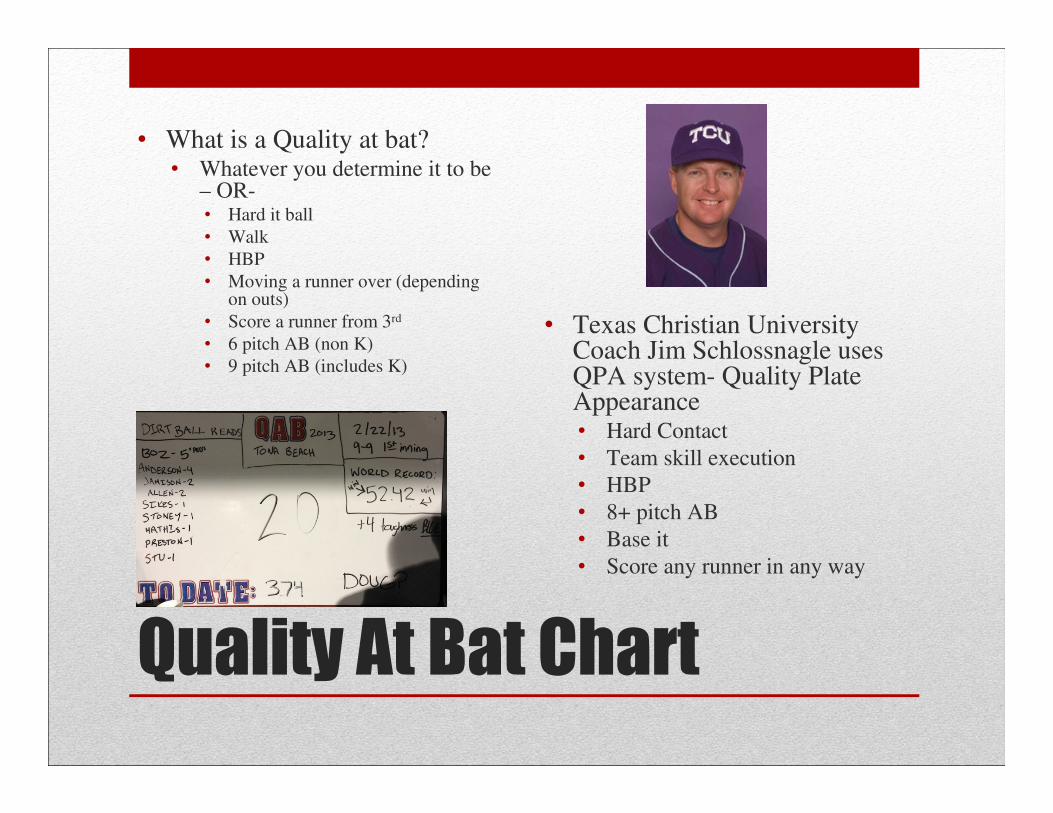
Quality At Bat Chart
• What is a Quality at bat?• Whatever you determine it to be
– OR-• Hard it ball
• Walk
• HBP
• Moving a runner over (depending on outs)
• Score a runner from 3rd
• 6 pitch AB (non K)
• 9 pitch AB (includes K)
• Texas Christian University Coach Jim Schlossnagle uses QPA system- Quality Plate Appearance• Hard Contact
• Team skill execution
• HBP
• 8+ pitch AB
• Base it
• Score any runner in any way
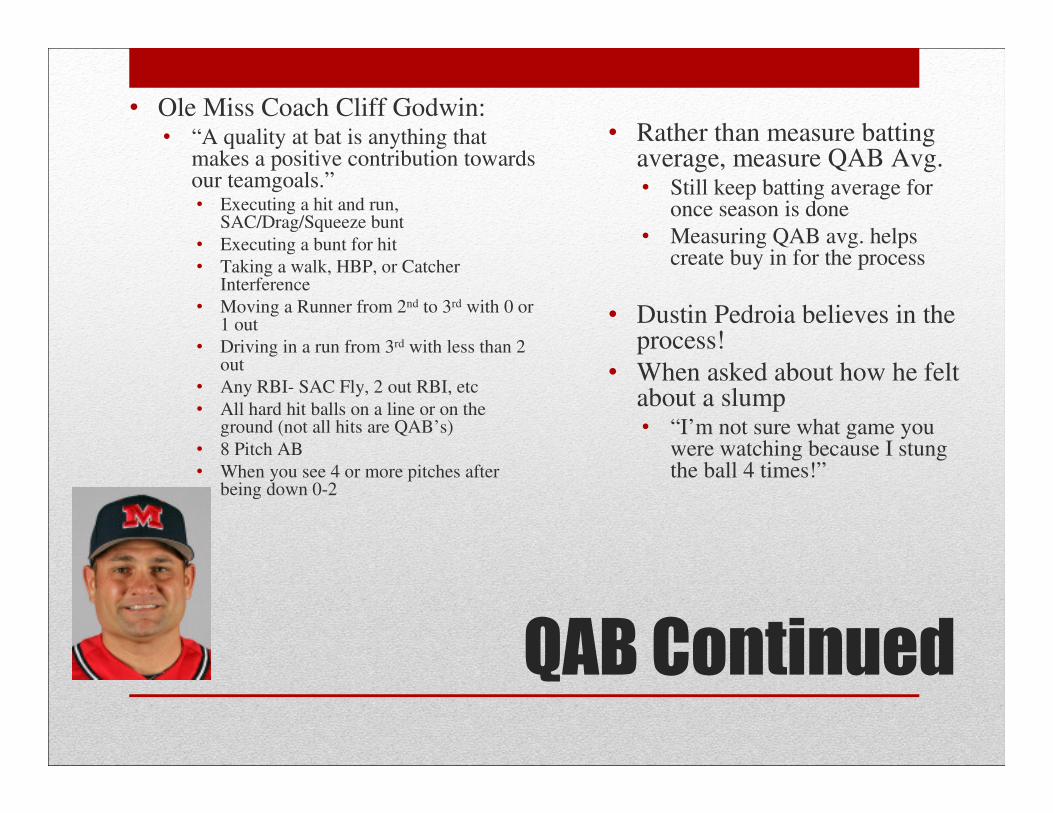
QAB Continued
• Rather than measure batting average, measure QAB Avg.• Still keep batting average for
once season is done
• Measuring QAB avg. helps create buy in for the process
• Dustin Pedroia believes in the process!
• When asked about how he felt about a slump• “I’m not sure what game you
were watching because I stung the ball 4 times!”
• Ole Miss Coach Cliff Godwin:• “A quality at bat is anything that
makes a positive contribution towards our teamgoals.”• Executing a hit and run,
SAC/Drag/Squeeze bunt
• Executing a bunt for hit
• Taking a walk, HBP, or Catcher Interference
• Moving a Runner from 2nd to 3rd with 0 or 1 out
• Driving in a run from 3rd with less than 2 out
• Any RBI- SAC Fly, 2 out RBI, etc
• All hard hit balls on a line or on the ground (not all hits are QAB’s)
• 8 Pitch AB
• When you see 4 or more pitches after being down 0-2

Charting in the Dugout
• All athletes can stay engaged if they have a job to do
• Any of the aforementioned charts or dugout
white/chalkboard
• Is it just busy work?
• Not if you’re utilizing
the what they show
• Baseball IQ goes up
& creates intrinsic
motivation
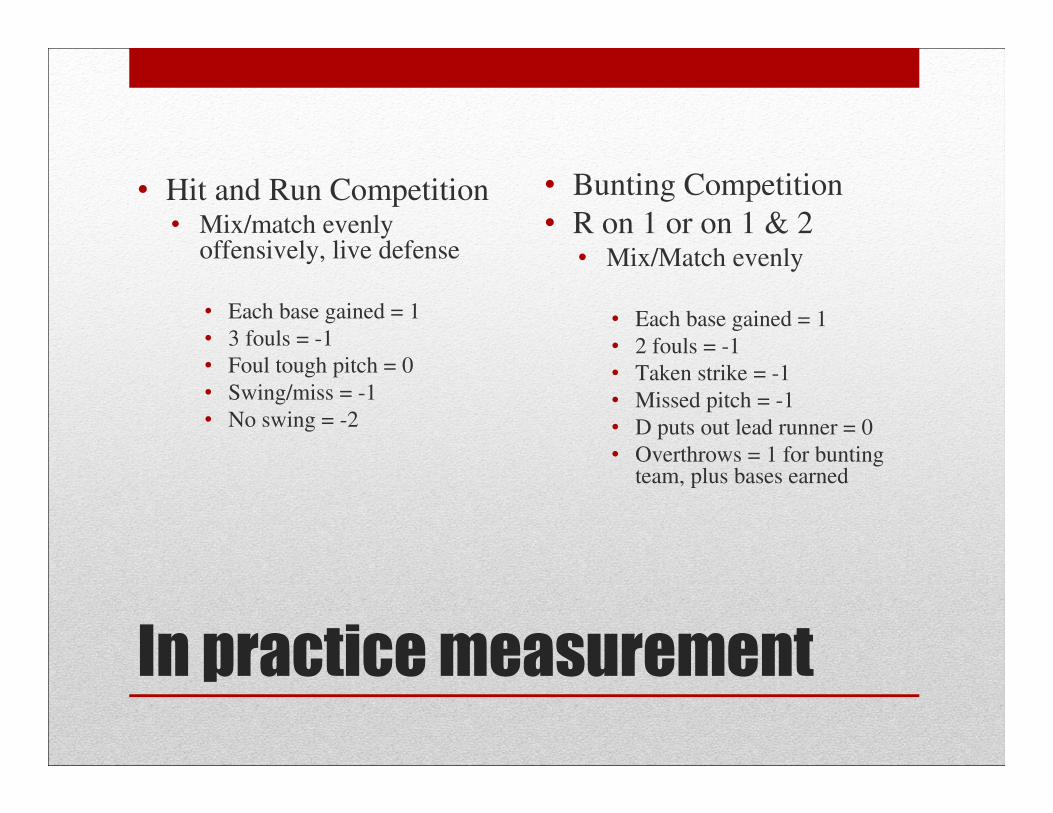
In practice measurement
• Hit and Run Competition• Mix/match evenly
offensively, live defense
• Each base gained = 1
• 3 fouls = -1
• Foul tough pitch = 0
• Swing/miss = -1
• No swing = -2
• Bunting Competition
• R on 1 or on 1 & 2• Mix/Match evenly
• Each base gained = 1
• 2 fouls = -1
• Taken strike = -1
• Missed pitch = -1
• D puts out lead runner = 0
• Overthrows = 1 for bunting team, plus bases earned
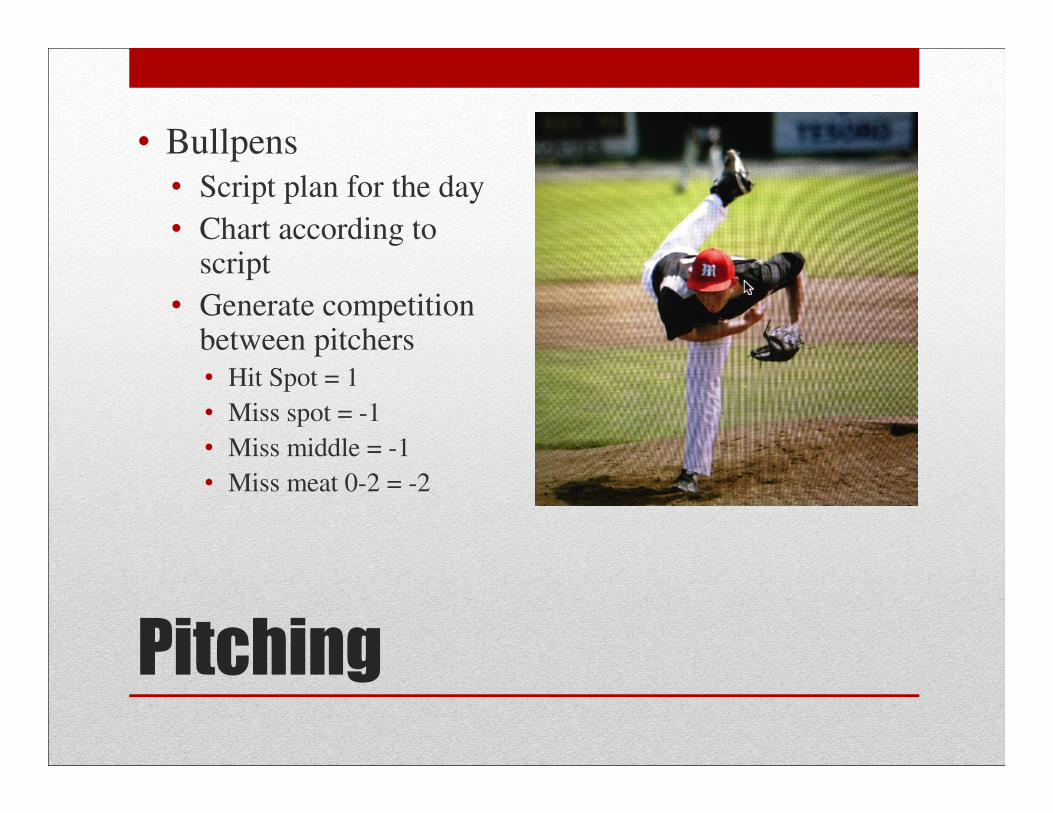
Pitching
• Bullpens• Script plan for the day
• Chart according to script
• Generate competition between pitchers• Hit Spot = 1
• Miss spot = -1
• Miss middle = -1
• Miss meat 0-2 = -2

Rewards for Competition
• Important to make them fun and worthwhile
• “Top Gun” award for highest bullpen points bi-weekly
• “QABBIE” award for the highest QAB avg bi weekly
• “Dirtbagger” or “Charlie Hustle” award for great
baserunning – (i.e. bases taken and dirtball reads)

Rewards Continued
Conclusion
• The More you can measure, the more you can increase motivation among your players and increase their capacity for competition
• If you want any of the charts listed in this presentation, emailme at [email protected]
• Questions? Comments?


![Dawn (Ellensburg, Wash.) (Ellensburg, Wash.) 1897-09-04 [p ]tTEWS EEPCETED." HASHED, SLASHED, ROLLED, MASHED, HATCH- ED, MATCHED AND DISPATCHED Next Monday is Labor Day. Court convenes](https://img.pdfslide.us/doc/110x75/6072ab3a9fdd76395c78ca12/dawn-ellensburg-wash-ellensburg-wash-1897-09-04-p-ttews-eepceted.jpg)


![RIS ELLENSBURG, WAtriplelproperties.com/docs/brokers/triple_l_brochure.pdfBOB C HANSEN, CCIM, CRB | Re/Max CoMMunity Realty 700 e Mt View aVe, Ste 504, ellenSbuRg, wa 98926 [p] 509-933-7306](https://img.pdfslide.us/doc/110x75/5f0fe3467e708231d44661fb/ris-ellensburg-bob-c-hansen-ccim-crb-remax-community-realty-700-e-mt-view.jpg)