Embed Size (px)
Citation preview

Focus on Energy Evaluated Deemed Savings
Changes September 12, 2016
Updated February 17, 2017
Public Service Commission of Wisconsin

This page left blank.
i
Table of Contents Deemed Savings Analysis .............................................................................................................................. 1
2015 Deemed and Evaluated Savings Values ......................................................................................... 3
Evaluation Savings Analysis ........................................................................................................................... 6
Natural Gas Furnace Measures .............................................................................................................. 6
Annual Energy-Savings Algorithm .................................................................................................... 7
Summer Coincident Peak Savings Algorithm ................................................................................... 9
Lifecycle Energy-Savings Algorithm ................................................................................................. 9
Evaluated Savings........................................................................................................................... 10
Upstream CFLs and LEDs ...................................................................................................................... 11
Cross-Sector Sales .......................................................................................................................... 11
Delta Watts .................................................................................................................................... 11
Annual Energy-Savings Algorithm .................................................................................................. 13
Summer Coincident Peak Savings Algorithm ................................................................................. 14
Lifecycle Energy-Savings Algorithm ............................................................................................... 15
Evaluated Savings........................................................................................................................... 15
Appliance Recycling .............................................................................................................................. 16
Unit Energy Savings ........................................................................................................................ 16
Part-Use Factor .............................................................................................................................. 16
Annual Energy-Savings Algorithm .................................................................................................. 17
Summer Coincident Peak Savings Algorithm ................................................................................. 17
Lifecycle Energy-Savings Algorithm ............................................................................................... 17
Evaluated Savings........................................................................................................................... 17
Steam Trap Repairs............................................................................................................................... 18
Steam Trap Repair, High Pressure, General Heating ..................................................................... 18
Steam Trap Repair, Low Pressure, Radiator .................................................................................. 19
Steam Trap Repair, Low Pressure, General Heating ...................................................................... 20
Steam Trap Repair, High Pressure, Industrial ................................................................................ 20
Steam Trap Repair, Low Pressure, Industrial ................................................................................. 20
Boiler Replacements ............................................................................................................................. 21
Energy-Savings Algorithm, Condensing Boiler ............................................................................... 21
ii
Energy-Savings Algorithm, Near-Condensing Boiler, ≥ 300 MBH .................................................. 23
Energy-Savings Algorithm, Condensing Hybrid Boiler Plant, ≥ 1,000 MBH ................................... 23
Final Recommendations ............................................................................................................................. 25
1
Deemed Savings Analysis
This report contains measure-specific findings from evaluating the CY 2015 Wisconsin Focus on Energy programs. These findings are the result of individual project-level evaluation activities, such as the standard market practice study, supporting research, and engineering reviews.
The CY 2015 evaluation activities revealed the following values for key input variables and practices. Furnace, lighting, appliance recycling, and boiler measure updates were originally published in September 2016. Steam trap measure updates were added in February 2017, after an extensive revision of these measures. Specific details regarding all of these inputs are described further in this document.
1. Natural Gas Furnace:
a. Residential standard baseline AFUE: 92.8%
b. Residential income-qualified (Tier 2) baseline AFUE: 80%
2. Upstream CFLs and LEDs:
a. Cross-sector sales percentage: 6.6%
b. Delta watts by lumen bins (values included below)
3. Appliance Recycling Measure:
a. Refrigerators part-use factor= 0.82
b. Freezers part-use factor= 0.79
c. Refrigerators unit energy consumption = 1,139
d. Freezer unit energy consumption = 1,077
4. Steam trap repair measures
a. Low/high system pressure cutoff established at 10 psig
b. Clear and separate flow equations employed for low- and high-pressure savings calculations
c. New measures established for various diameters of low-pressure general space heating
d. New measure established for low-pressure industrial process heating
e. System pressure for low-pressure space and process heating measures = 6 psig
f. System pressure for high-pressure space and process heating measures = set by user, in psia
g. Derating factor for low-pressure space heating measures = 5.6%
h. Derating factor for high-pressure space heating measures = 17%
i. Derating factor for low- and high-pressure process heating measures = 32%
j. Hours of use for heating applications: 5,510
k. Hours of use for process applications: 7,000
2
5. Boiler replacement measures
a. AFUEBASE = 82%
b. EFLH = 1,909
c. Oversize factor (values included below)
The Evaluation Team recommends updating the savings calculations for natural gas furnaces, upstream CFLs, LEDs and reflector lamps, appliance recycling measures, steam trap repair and replacement measures, and boiler replacement and retrofit measures in CY 2017 to reflect these assumptions. This report identifies the measures affected, the ex ante savings assumptions for those measures in the SPECTRUM database during CY 2015 and CY 2016, and the revised savings values calculated based on the recommended savings updates.
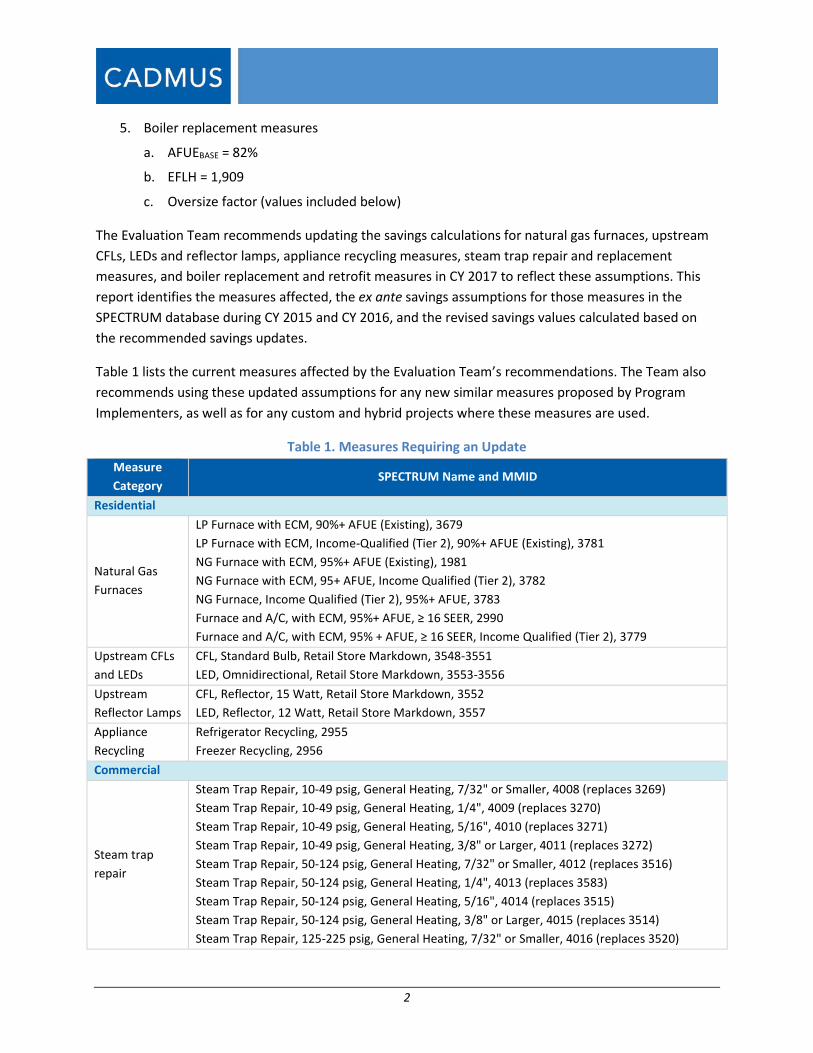
Table 1 lists the current measures affected by the Evaluation Team’s recommendations. The Team also recommends using these updated assumptions for any new similar measures proposed by Program Implementers, as well as for any custom and hybrid projects where these measures are used.
Table 1. Measures Requiring an Update Measure Category
SPECTRUM Name and MMID
Residential
Natural Gas Furnaces
LP Furnace with ECM, 90%+ AFUE (Existing), 3679 LP Furnace with ECM, Income-Qualified (Tier 2), 90%+ AFUE (Existing), 3781 NG Furnace with ECM, 95%+ AFUE (Existing), 1981 NG Furnace with ECM, 95+ AFUE, Income Qualified (Tier 2), 3782 NG Furnace, Income Qualified (Tier 2), 95%+ AFUE, 3783 Furnace and A/C, with ECM, 95%+ AFUE, ≥ 16 SEER, 2990 Furnace and A/C, with ECM, 95% + AFUE, ≥ 16 SEER, Income Qualified (Tier 2), 3779
Upstream CFLs and LEDs
CFL, Standard Bulb, Retail Store Markdown, 3548-3551 LED, Omnidirectional, Retail Store Markdown, 3553-3556
Upstream Reflector Lamps
CFL, Reflector, 15 Watt, Retail Store Markdown, 3552 LED, Reflector, 12 Watt, Retail Store Markdown, 3557
Appliance Recycling
Refrigerator Recycling, 2955 Freezer Recycling, 2956
Commercial
Steam trap repair
Steam Trap Repair, 10-49 psig, General Heating, 7/32" or Smaller, 4008 (replaces 3269) Steam Trap Repair, 10-49 psig, General Heating, 1/4", 4009 (replaces 3270) Steam Trap Repair, 10-49 psig, General Heating, 5/16", 4010 (replaces 3271) Steam Trap Repair, 10-49 psig, General Heating, 3/8" or Larger, 4011 (replaces 3272) Steam Trap Repair, 50-124 psig, General Heating, 7/32" or Smaller, 4012 (replaces 3516) Steam Trap Repair, 50-124 psig, General Heating, 1/4", 4013 (replaces 3583) Steam Trap Repair, 50-124 psig, General Heating, 5/16", 4014 (replaces 3515) Steam Trap Repair, 50-124 psig, General Heating, 3/8" or Larger, 4015 (replaces 3514) Steam Trap Repair, 125-225 psig, General Heating, 7/32" or Smaller, 4016 (replaces 3520)
3
Measure Category
SPECTRUM Name and MMID
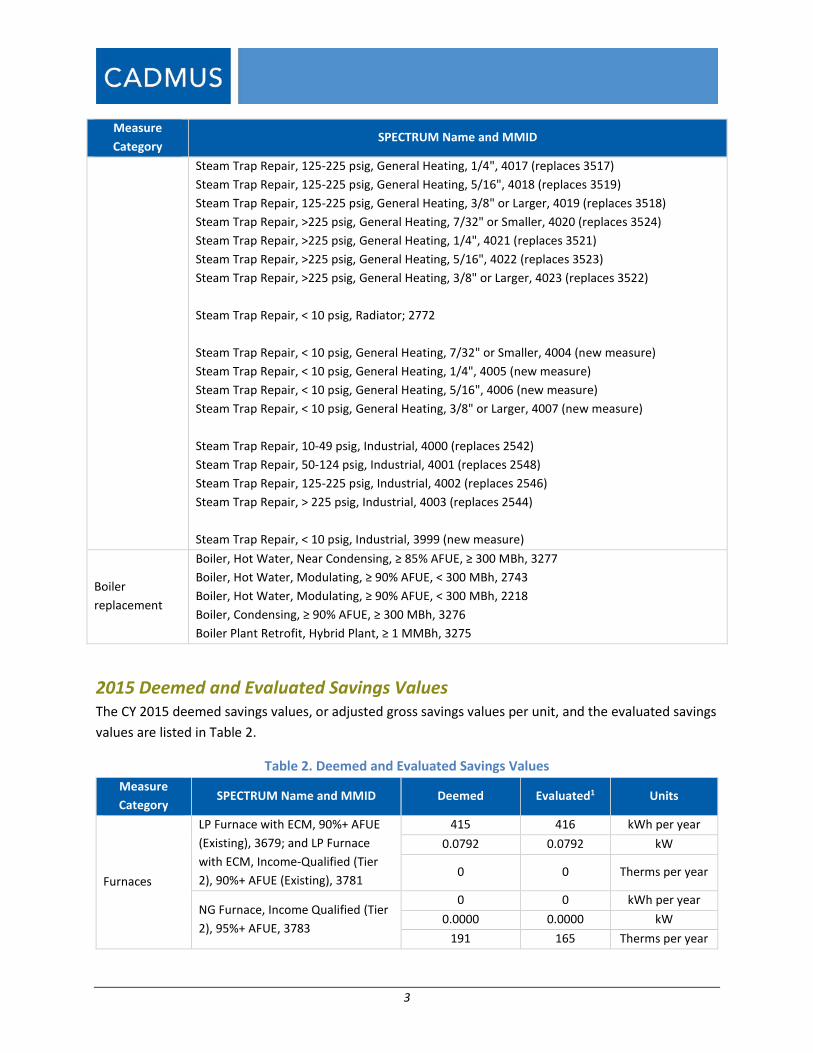
Steam Trap Repair, 125-225 psig, General Heating, 1/4", 4017 (replaces 3517) Steam Trap Repair, 125-225 psig, General Heating, 5/16", 4018 (replaces 3519) Steam Trap Repair, 125-225 psig, General Heating, 3/8" or Larger, 4019 (replaces 3518) Steam Trap Repair, >225 psig, General Heating, 7/32" or Smaller, 4020 (replaces 3524) Steam Trap Repair, >225 psig, General Heating, 1/4", 4021 (replaces 3521) Steam Trap Repair, >225 psig, General Heating, 5/16", 4022 (replaces 3523) Steam Trap Repair, >225 psig, General Heating, 3/8" or Larger, 4023 (replaces 3522) Steam Trap Repair, < 10 psig, Radiator; 2772 Steam Trap Repair, < 10 psig, General Heating, 7/32" or Smaller, 4004 (new measure) Steam Trap Repair, < 10 psig, General Heating, 1/4", 4005 (new measure) Steam Trap Repair, < 10 psig, General Heating, 5/16", 4006 (new measure) Steam Trap Repair, < 10 psig, General Heating, 3/8" or Larger, 4007 (new measure) Steam Trap Repair, 10-49 psig, Industrial, 4000 (replaces 2542) Steam Trap Repair, 50-124 psig, Industrial, 4001 (replaces 2548) Steam Trap Repair, 125-225 psig, Industrial, 4002 (replaces 2546) Steam Trap Repair, > 225 psig, Industrial, 4003 (replaces 2544) Steam Trap Repair, < 10 psig, Industrial, 3999 (new measure)
Boiler replacement
Boiler, Hot Water, Near Condensing, ≥ 85% AFUE, ≥ 300 MBh, 3277 Boiler, Hot Water, Modulating, ≥ 90% AFUE, < 300 MBh, 2743 Boiler, Hot Water, Modulating, ≥ 90% AFUE, < 300 MBh, 2218 Boiler, Condensing, ≥ 90% AFUE, ≥ 300 MBh, 3276 Boiler Plant Retrofit, Hybrid Plant, ≥ 1 MMBh, 3275
2015 Deemed and Evaluated Savings Values The CY 2015 deemed savings values, or adjusted gross savings values per unit, and the evaluated savings values are listed in Table 2.
Table 2. Deemed and Evaluated Savings Values Measure Category
SPECTRUM Name and MMID Deemed Evaluated1 Units
Furnaces
LP Furnace with ECM, 90%+ AFUE (Existing), 3679; and LP Furnace with ECM, Income-Qualified (Tier 2), 90%+ AFUE (Existing), 3781
415 416 kWh per year 0.0792 0.0792 kW
0 0 Therms per year
NG Furnace, Income Qualified (Tier 2), 95%+ AFUE, 3783
0 0 kWh per year 0.0000 0.0000 kW
191 165 Therms per year

4
Measure Category
SPECTRUM Name and MMID Deemed Evaluated1 Units
NG Furnace with ECM, 95%+ AFUE (Existing), 1981
415 416 kWh per year 0.0792 0.0792 kW
29 21 Therms per year
NG Furnace with ECM, 95+ AFUE, Income Qualified (Tier 2), 3782
415 416 kWh per year 0.0792 0.0792 kW
191 165 Therms per year
Furnace and A/C, with ECM, 95%+ AFUE, ≥ 16 SEER, 2990
518 518 kWh per year 0.0277 0.2768 kW
29 21 Therms per year Furnace and A/C, with ECM, 95% + AFUE, ≥ 16 SEER, Income Qualified (Tier 2), 3779
518 518 kWh per year 0.0277 0.2768 kW
191 165 Therms per year
Upstream CFLs and LEDs
CFL Standard Bulb 310-749 Lumens, 3548
20 19 kWh per year 0.0024 0.0022 kW
0 0 Therms per year
CFL Standard Bulb 750-1,049 Lumens, 3549
30 31 kWh per year 0.0036 0.0036 kW
0 0 Therms per year
CFL Standard Bulb 1,050-1,489 Lumens, 3550
35 34 kWh per year 0.0042 0.0040 kW
0 0 Therms per year
CFL Standard Bulb 1,490-2,600 Lumens, 3551
50 50 kWh per year 0.0058 0.0058 kW
0 0 Therms per year
LED, Omnidirectional 310-749 lumens, 3553
22 23 kWh per year 0.0026 0.0027 kW
0 0 Therms per year
LED, Omnidirectional 750-1,049 Lumens, 3554
33 32 kWh per year 0.0039 0.0037 kW
0 0 Therms per year
LED, Omnidirectional 1,050 -1,489 Lumens, 3555
41 39 kWh per year 0.0048 0.0045 kW
0 0 Therms per year
LED, Omnidirectional 1,490-2,600 Lumens,3556
55 55 kWh per year 0.0065 0.0064 kW
0 0 Therms per year
Upstream Reflector Lamps
CFL, Reflector, 15 Watt, Retail Store Markdown, 3552
51 39 kWh per year 0.0059 0.0045 kW
0 0 Therms per year LED, Reflector, 12 Watt, Retail Store Markdown, 3557
54 50 kWh per year 0.0063 0.0058 kW

5
Measure Category
SPECTRUM Name and MMID Deemed Evaluated1 Units
0 0 Therms per year
Appliance Recycling
Refrigerator Recycling, 2955 886 987 kWh per year
0.1020 0.1149 kW 0 0 Therms per year
Freezer Recycling, 2956 962 786 kWh per year
0.1190 0.0969 kW 0 0 Therms per year
Stream Trap Repair
Steam Trap Repair, < 10 psig, Radiator, 2772
0 0 kWh per year 0 0 kW
245 107 Therms per year
Other Steam Trap Repair Measures
These measures were extensively revised and are not directly comparable to their previous versions. Savings were generally reduced. Details are below and in the
March 2017 Technical Reference Manual.
Boiler Replacement
Boiler, Hot Water, Near Condensing, ≥ 85% AFUE, ≥ 300 MBh, 3277
0 0 kWh per year 0 0 kW
1.42 1.03 Therms per year,
per MBh
Boiler, Hot Water, Modulating, ≥ 90% AFUE, < 300 MBh, 2743
0 0 kWh per year 0 0 kW
2.57 3.39 Therms per year,
per MBh
Boiler, Hot Water, Modulating, ≥ 90% AFUE, < 300 MBh, 2218
n/a 0 kWh per year n/a 0 kW
n/a 4.22 Therms per year,
per MBh
Boiler, Condensing, ≥ 90% AFUE, ≥ 300 MBh, 3276
n/a 0 kWh per year n/a 0 kW
n/a 2.33 Therms per year,
per MBh
Boiler Plant Retrofit, Hybrid Plant, ≥ 1 MMBh, 3275
0 0 kWh per year 0 0 kW
1.54 1.43 Therms per year,
per MBh 1 There are minor differences in kWh values for furnace measures caused by rounding.

6
Evaluation Savings Analysis
The algorithms presented in this section show how the Team applied evaluation results to generate deemed savings values for specific measures.
Natural Gas Furnace Measures Where adequate market data were available, the Evaluation Team calculated net savings for CY 2015 using standard market practice methodology. For the analysis, we relied on program tracking data and data collected through the evaluation process to define the average market baseline and average energy consumption of select measures installed through the program. To determine the baseline for each furnace measure, the Evaluation Team used two sources of sales and installation data: D+R International data and CY 2012-CY 2015 Home Performance with ENERGY STAR Program assessment data.1 Based on our analysis, the Team suggests updating the baseline AFUE in the TRM, which is the efficiency rating of standard furnaces. The adjusted savings would apply to these seven measures in SPECTRUM:
• LP Furnace with ECM, 90%+ AFUE (Existing), 3679
• LP Furnace with ECM, Income-Qualified (Tier 2), 90%+ AFUE (Existing), 3781
• NG Furnace with ECM, 95%+ AFUE (Existing), 1981
• NG Furnace with ECM, 95%+ AFUE, Income Qualified (Tier 2), 3782
• NG Furnace, Income Qualified (Tier 2), 95%+ AFUE, 3783
• Furnace and A/C, with ECM, 95%+ AFUE, ≥ 16 SEER, 2990
• Furnace and A/C, with ECM, 95% + AFUE, ≥ 16 SEER, Income Qualified (Tier 2), 3779
The findings in this report reflect current measures; the Program Implementers are currently redeveloping workpapers for these measures and similar measures. Other measures may be added to or created to replace these measures. The Evaluation Team suggests that the evaluated baseline AFUE be applied to the redeveloped and/or new furnace workpapers.
The Evaluation Team established a market baseline by reviewing and analyzing available market data that showed existing efficiency levels of a particular equipment type sold within and outside of the Wisconsin Focus on Energy territory (using D+R International data and Home Performance with ENERGY STAR audit data). These data included a range of efficiency levels (both inefficient and efficient) and
1 The Evaluation Team contracted with D+R International to purchase a report of residential HVAC measures
sold in Wisconsin during 2014, which used sales data reported to D+R International by HARDI members participating in the Unitary HVAC Market Report. The report contained summaries of the quantities of observed sales by efficiency level and estimations of the size of each measure’s total market in 2014. The Program Implementer for the Home Performance with ENERGY STAR Program shared data collected from all assessments conducted since 2012. The Evaluation Team limited the assessment data to manufacture dates of 2010 to 2015 for all furnaces and air conditioners used in the market data analysis (to align with the prior and current quadrennium).

7
represented the average efficiency of equipment sold in Wisconsin within the prior (CY 2011 through CY 2014) or current quadrennium (CY 2015 through CY 2018). The end result is a baseline condition that represents a mixture of efficient and inefficient equipment.
The joint review of both baseline sources identified that baseline conditions for AFUE were greater than current baseline conditions assumed in Technical Reference Manual. The Team suggests updating baseline AFUE to 92.8% from 92% for standard baseline furnace measures and to 80% from 78% for the income-qualified (Tier 2) program measures. The income-qualified baseline information was further qualitatively supplemented by Trade Ally feedback that a relevant amount of low AFUE units were being sold to income-qualifying customers.
Annual Energy-Savings Algorithm ThermsSAVED = CAP * HOUHEATING * (1/AFUEBASE - 1/AFUEEE) * (1/100)
kWhSAVED = kWhSAVED COOLING + kWhSAVED HEATING + kWhSAVED CIRC
kWhSAVED COOLING (non-A/C measures) = tons * EFLHCOOLING * 12 kBtu/ton * (1/SEERBASE -1/SEERECM) * AC%
kWhSAVED COOLING (A/C measures) = tons * EFLHCOOL * 12 kBtu/ton * (1/SEERBASE -1/SEEREE)
kWhSAVED HEATING = hoursHEATING * kWSAVED HEAT
kWhSAVED CIRC = hoursCIRC * kWSAVED CIRC
Where:
CAP = Heating capacity (= 72 MBtu/hour)2
HOUHEATING = Hours of heating operation (= 1,158 hours)2
AFUEBASE = Efficiency rating of standard efficiency furnace (= 80% AFUE for income qualified (Tier 2); = 92.8% AFUE for standard baseline; and = 78% for LP furnaces)
AFUEEE = Efficiency rating of efficient furnace (= 95% AFUE or 97% AFUE)
tons = Equipment cooling capacity (= 2.425 tons)
EFLHCOOLING = Effective full-load cooling hours (= 410 hours; see Table 3)
SEERBASE = Federal minimum seasonal energy efficiency ratio (= 12 for non-air conditioner measures2 and = 13 for air conditioner measures)
SEERECM = Seasonal energy efficiency rating of efficient unit (= 13)2
SEEREE = Efficient measure seasonal energy efficiency ratio (= 16)
2 Cadmus. Focus on Energy Evaluated Deemed Savings Changes. October 27, 2014.
https://focusonenergy.com/sites/default/files/FoE_Deemed_WriteUp%20CY14%20Final.pdf

8
AC% = Percentage of non-air conditioner furnace measures that also had an air conditioner installed (= 92.5%)2
kWSAVED HEAT = Heating demand (= 0.116 kW)2
hoursCIRC = Annual hours on circulate setting (= 1,020 hours)2
kWSAVED CIRC = Demand on circulate setting (= 0.207 kW)2
Table 3. EFLH Cooling by Location Location EFLHCOOLING Weighting by Participant
Green Bay 344 22% Lacrosse 323 3% Madison 395 18% Milwaukee 457 48% Wisconsin Average 380 9% Overall 410
The Team’s Wisconsin Focus on Energy evaluation work in CY 2015 provides data to update the baseline AFUE. Applying the updated baseline AFUE to the updated gross savings assumptions yields an evaluated adjusted per-unit gross savings that is less than the CY 2014 deemed savings. The evaluated annual energy savings are presented in Table 4 and Table 5.
Table 4. Evaluated Annual Therms Savings Income Qualified (Tier 2) Standard Baseline
LP Furnace with ECM, 90%+ AFUE (Existing),
3781
NG Furnace,
95%+ AFUE, 3783
NG Furnace with ECM,
95%+ AFUE, 3782
Furnace and A/C, with
ECM, 95%+ AFUE, ≥ 16 SEER, 3779
LP Furnace with ECM, 90%+ AFUE (Existing),
3679
NG Furnace with ECM, 95%+ AFUE (Existing),
1981
Furnace and A/C, with
ECM, 95%+ AFUE, ≥ 16 SEER, 2990
0 165 165 165 0 21 21
Table 5. Evaluated Annual kWh Savings Income Qualified (Tier 2) Standard Baseline
LP Furnace with ECM, 90%+ AFUE (Existing),
3781
NG Furnace,
95%+ AFUE, 3783
NG Furnace with ECM,
95%+ AFUE, 3782
Furnace and A/C, with
ECM, 95%+ AFUE, ≥ 16 SEER, 3779
LP Furnace with ECM, 90%+ AFUE (Existing),
3679
NG Furnace with ECM, 95%+ AFUE (Existing),
1981
Furnace and A/C, with ECM,
95%+ AFUE, ≥ 16 SEER, 2990
416 0 416 518 416 416 518

9
Summer Coincident Peak Savings Algorithm kWSAVED (non-A/C measures) = tons * 12 kBtu/ton * (1/EERBASE – 1/EERECM) * CF * AC%
kWSAVED (A/C measures) = tons * 12 kBtu/ton * (1/EERBASE – 1/EERECM) * CF
Where:
EERBASE = Energy efficiency rating of baseline unit (= 10.5 for non-air conditioner measures and = 11 for air conditioner measures)2
EERECM = Energy efficiency rating of efficient unit (= 11 for non-air conditioner measures and = 13 for air conditioner measures)2
CF = Coincidence factor (68%)2
Table 6 provides the evaluated demand reduction.
Table 6. Evaluated kW Reduction Income Qualified (Tier 2) Standard Baseline
LP Furnace with ECM, 90%+ AFUE (Existing),
3781
NG Furnace,
95%+ AFUE, 3783
NG Furnace with ECM,
95%+ AFUE, 3782
Furnace and A/C, with ECM,
95%+ AFUE, ≥ 16 SEER,
3779
LP Furnace with ECM, 90%+ AFUE (Existing),
3679
NG Furnace with ECM, 95%+ AFUE (Existing),
1981
Furnace and A/C, with ECM,
95%+ AFUE, ≥ 16 SEER, 2990
0.0792 0.0000 0.0792 0.2768 0.0792 0.0792 0.2768
Lifecycle Energy-Savings Algorithm ThermLIFECYCLE = ThermsSAVED * EUL
kWhLIFECYCLE = kWhSAVED * EUL
Where:
EUL = Effective useful life (=18 years)3
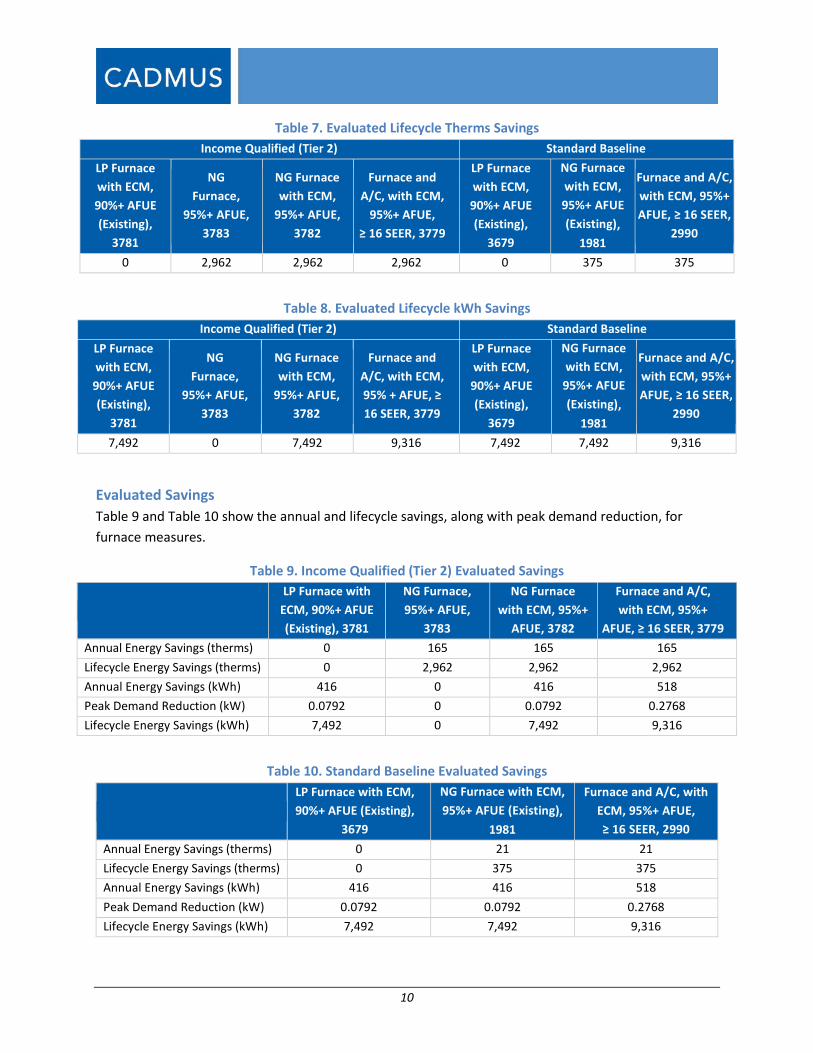
Table 7 and Table 8 provide evaluated lifecycle savings.
3 PA Consulting Group Inc. “State of Wisconsin Public Service Commission of Wisconsin Focus on Energy
Evaluation Business Programs: Measure Life Study.” Final Report. August 25, 2009. Available online: https://focusonenergy.com/sites/default/files/bpmeasurelifestudyfinal_evaluationreport.pdf
10
Table 7. Evaluated Lifecycle Therms Savings Income Qualified (Tier 2) Standard Baseline
LP Furnace with ECM, 90%+ AFUE (Existing),
3781
NG Furnace,
95%+ AFUE, 3783
NG Furnace with ECM,
95%+ AFUE, 3782
Furnace and A/C, with ECM,
95%+ AFUE, ≥ 16 SEER, 3779
LP Furnace with ECM, 90%+ AFUE (Existing),
3679
NG Furnace with ECM, 95%+ AFUE (Existing),
1981
Furnace and A/C, with ECM, 95%+ AFUE, ≥ 16 SEER,
2990
0 2,962 2,962 2,962 0 375 375
Table 8. Evaluated Lifecycle kWh Savings Income Qualified (Tier 2) Standard Baseline
LP Furnace with ECM, 90%+ AFUE (Existing),
3781
NG Furnace,
95%+ AFUE, 3783
NG Furnace with ECM,
95%+ AFUE, 3782
Furnace and A/C, with ECM, 95% + AFUE, ≥ 16 SEER, 3779
LP Furnace with ECM, 90%+ AFUE (Existing),
3679
NG Furnace with ECM, 95%+ AFUE (Existing),
1981
Furnace and A/C, with ECM, 95%+ AFUE, ≥ 16 SEER,
2990
7,492 0 7,492 9,316 7,492 7,492 9,316
Evaluated Savings Table 9 and Table 10 show the annual and lifecycle savings, along with peak demand reduction, for furnace measures.
Table 9. Income Qualified (Tier 2) Evaluated Savings
LP Furnace with
ECM, 90%+ AFUE (Existing), 3781
NG Furnace, 95%+ AFUE,
3783
NG Furnace with ECM, 95%+
AFUE, 3782
Furnace and A/C, with ECM, 95%+
AFUE, ≥ 16 SEER, 3779 Annual Energy Savings (therms) 0 165 165 165 Lifecycle Energy Savings (therms) 0 2,962 2,962 2,962 Annual Energy Savings (kWh) 416 0 416 518 Peak Demand Reduction (kW) 0.0792 0 0.0792 0.2768 Lifecycle Energy Savings (kWh) 7,492 0 7,492 9,316
Table 10. Standard Baseline Evaluated Savings
LP Furnace with ECM, 90%+ AFUE (Existing),
3679
NG Furnace with ECM, 95%+ AFUE (Existing),
1981
Furnace and A/C, with ECM, 95%+ AFUE, ≥ 16 SEER, 2990
Annual Energy Savings (therms) 0 21 21 Lifecycle Energy Savings (therms) 0 375 375 Annual Energy Savings (kWh) 416 416 518 Peak Demand Reduction (kW) 0.0792 0.0792 0.2768 Lifecycle Energy Savings (kWh) 7,492 7,492 9,316

11
Upstream CFLs and LEDs The Evaluation Team suggests updating the TRM cross-sector sales and delta watts for upstream lighting measures.
Cross-Sector Sales The upstream lighting component of the Wisconsin Focus on Energy Residential Lighting Program is intended for residential customers; however, because Focus on Energy pays incentives directly to retailers, actual participants are not known. Focus on Energy assumes that small business owners make up a proportion of the customers buying discounted bulbs from participating retailers. Because bulbs installed in nonresidential settings are subject to different assumptions that affect annual savings, the Evaluation Team surveyed Wisconsin Focus on Energy residential customers (via a residential general population survey), as well as a subset of its small business customer base, to estimate the percentage of customers (from each population) who purchased CFLs and/or LEDs from a participating retailer during the previous 12 months.
From the survey data, the Evaluation Team estimated the percentage of customers purchasing bulbs and the average number of bulbs they purchased. Then, the Team multiplied these two metrics by each surveyed population’s total customer base to estimate the number of bulbs purchased during the year between the two groups (residents and small businesses). The resulting proportion of cross-sector sales of bulbs purchased from participating retailers is the CY 2015 cross-sector sales factor. Appendix I of Focus on Energy Calendar Year 2015 Evaluation Report describes the full methodology and findings.4
The existing TRM assumed measures that are incented through a markdown on the retail price at the store cannot be clearly assigned to a sector, they are assigned to the “upstream” sector based on the program design. The Evaluation Team calculated 6.0% for the CY 2015 Wisconsin Focus on Energy cross-sector sales study. Because store intercept studies and phone surveys have inherent biases specific to the populations they target and the methods they employ, the Team combined and averaged the results from CY 2015 and CY 2014: this produced the most reliable estimate because it incorporates both small business and residential perspectives. The average of the CY 2014 residential store intercept study (7.1%) and the CY 2015 phone survey (6.0%) led to a cross-sector sales proportion of 6.6%, which get applied to the CY 2015 verified gross savings.
Delta Watts The Evaluation Team employed the lumen equivalence method to determine the baseline wattage for each program bulb. The difference between the baseline and efficient wattages is the delta watts input. The Team used the ENERGY STAR-qualified bulb product list updated on October 5, 2015 for this analysis.
4 Cadmus. Focus on Energy Calendar Year 2015 Evaluation Report, Appendices. May 20, 2016. Available online:
https://focusonenergy.com/sites/default/files/WI%20FOE%20CY%202015%20Appendices_web.pdf

12
The Evaluation Team analyzed the ENERGY STAR-qualified lamps for two reasons. The primary reason was to estimate the lumen output of bulbs that could not be matched directly by stock keeping unit number. The secondary reason was to develop a list of estimated CFL and LED wattages associated with each lumen bin.
The Evaluation Team matched each individual bulb from the Program Implementer’s tracking database, using its model number, to its corresponding listing in the ENERGY STAR-qualified product list database. The sales database for the Residential Lighting Program consisted of approximately 7,900 CFL products and 11,500 LED products, along with their associated wattages and lumens. The ENERGY STAR database provided other product details for each bulb, including lumen output, rated wattage, technology (CFL or LED), type, and ENERGY STAR certification status. If these data were not available, the Evaluation Team used the database values for lumens and/or efficient wattage, or we interpolated the lumen output from efficient wattage based on a best-fit line derived from the ENERGY STAR database. Appendix I of Focus on Energy Calendar Year 2015 Evaluation Report describes the full methodology and findings.
Then the Evaluation Team categorized each bulb into specific bins, based on the bulb lumen output and type. Each bin had an assumed baseline wattage for use in the delta watts calculation. The Uniform Methods Project (UMP) provides lumen bins for standard, decorative, globe, and Energy Independence and Security Act of 2007 (EISA)-exempt lamps.5 For example, the bins and associated baseline halogen watts for standard bulbs are shown in Table 11.
Table 11. EISA Lumen Bins and Baseline Watts for Standard Bulbs Lumen Bins EISA 2015 EISA Baseline Wattage
0-309 Not Impacted by EISA 25 310-449
Impacted by EISA
25 450-799 29 800-1,099 43 1,100-1,599 53 1,600-1,999 72 2,000-2,600 72 2,601-3,300
Not Impacted by EISA 150
3,301-4,815 200 Source: Energy Independence and Security Act of 2007. Public Law 110-140-December 19, 2007. 121 Stat. 1492. Available online: https://www.gpo.gov/fdsys/pkg/PLAW-110publ140/pdf/PLAW-110publ140.pdf
5 National Renewable Energy Laboratory. The Uniform Methods Project: Methods for Determining Energy
Efficiency Savings for Specific Measures. “Chapter 21: Residential Lighting Evaluation Protocol.” Prepared by Apex Analytics, LLC. February 2015. Available online: http://energy.gov/sites/prod/files/2015/02/f19/UMPChapter21-residential-lighting-evaluation-protocol.pdf

13
As shown in Table 11, EISA only affects bulbs in the 310 to 2,600 lumen output range. The Evaluation Team applied a similar methodology to categorize specialty bulbs, reflectors, or EISA-exempt bulbs into respective bins with different lumen ranges and different baselines. For reflectors, the UMP defers to federal requirements for the determining lumen bins. The Mid-Atlantic TRM6, based on these requirements7, defines lumen bins for six different reflector categories based on reflector type and diameter.
The Evaluation Team suggests updating the proportion of cross-sector sales to 6.6% for upstream CFL and LED measures, as well as updating the power consumption of baseline and efficient measures by lumen bin. The cross-sector sales update is incorporated in the hours-of-use and the coincidence factor.
Annual Energy-Savings Algorithm kWhSAVED = Gross Delta Watts / 1,000 * HOU
Where:
Gross Delta Watts = Calculated by subtracting the efficient bulb wattage from the baseline wattage determined from its lumen bin, which causes variation between the ex ante delta watts and the evaluated delta watts (= varies by lumen bin; see Table 13, which also includes Fall 2015 TRM values for comparison)
1,000 = Kilowatt conversion factor
HOU = Hours-of-use (= 996 [(2.2 * 93.4% + 10.2 * 6.6%) * 365 days/year]; see Table 12 for additional detail on weightings by sector)2
Table 12. Cross-Sector Sales HOU Weighting Sector Weighting HOU per Day
Single Family 74.7% 2.27 Multifamily 25.3% 2.01 Residential 93.4% 2.20 Commercial 6.6% 10.20
6 Northeast Energy Efficiency Partnership. Mid-Atlantic Technical Reference Manual. Version 5.0. May 2015.
Available online: http://www.neep.org/mid-atlantic-technical-reference-manual-v5
7 Electronic Code of Federal Regulations. §430.32(n)(6). http://www.ecfr.gov/cgi-bin/text-idx?c=ecfr&SID=1ae0322478999c2c4ff2c83d9ce4c04a&rgn=div8&view=text&node=10:3.0.1.4.18.3.9.2&idno=10l

14
Table 13. Power Consumption of Baseline and Efficient Measures by Lumen Bin
Measure Name MMID Current Ex Ante
Delta Watts (TRM Fall 2015)
Evaluated Gross Delta
Watts CFL, Reflector, 15 Watt, Retail Store Markdown 3552 50 39 CFL, Standard Bulb, Retail Store Markdown, 310-749 Lumens 3548 20 19 CFL, Standard Bulb, Retail Store Markdown, 750-1,049 Lumens 3549 30 31 CFL, Standard Bulb, Retail Store Markdown, 1,050-1,489 Lumens 3550 35 34 CFL, Standard Bulb, Retail Store Markdown, 1,490-2,600 Lumens 3551 49 50 LED, Reflector, 12 Watt, Retail Store Markdown 3557 53 50 LED, Omnidirectional, Retail Store Markdown, 310-749 Lumens 3553 22 23 LED, Omnidirectional, Retail Store Markdown, 750-1,049 Lumens 3554 32 32 LED, Omnidirectional, Retail Store Markdown, 1,050-1,489 Lumens 3555 40 39 LED, Omnidirectional, Retail Store Markdown, 1,490-2,600 Lumens 3556 55 55
Summer Coincident Peak Savings Algorithm kWSAVED= Gross Delta Watts / 1,000 * CF
Where:
CF = Coincidence factor (= 0.1162 [6.99% * 93.4% + 77% * 6.6%]; see Table 14 for additional detail on weightings by sector)8
Table 14.Cross-Sector Sales Coincidence Factor Weighting Sector Weighting CF
Single Family 74.7% 7.5% Multifamily 25.3% 5.5% Residential 93% 6.99% Commercial 7% 77%
8 ENERGY STAR. Qualified Products List. December 5, 2014. Mean wattage of omnidirectional LEDs falling within
the specified lumens bin.
15
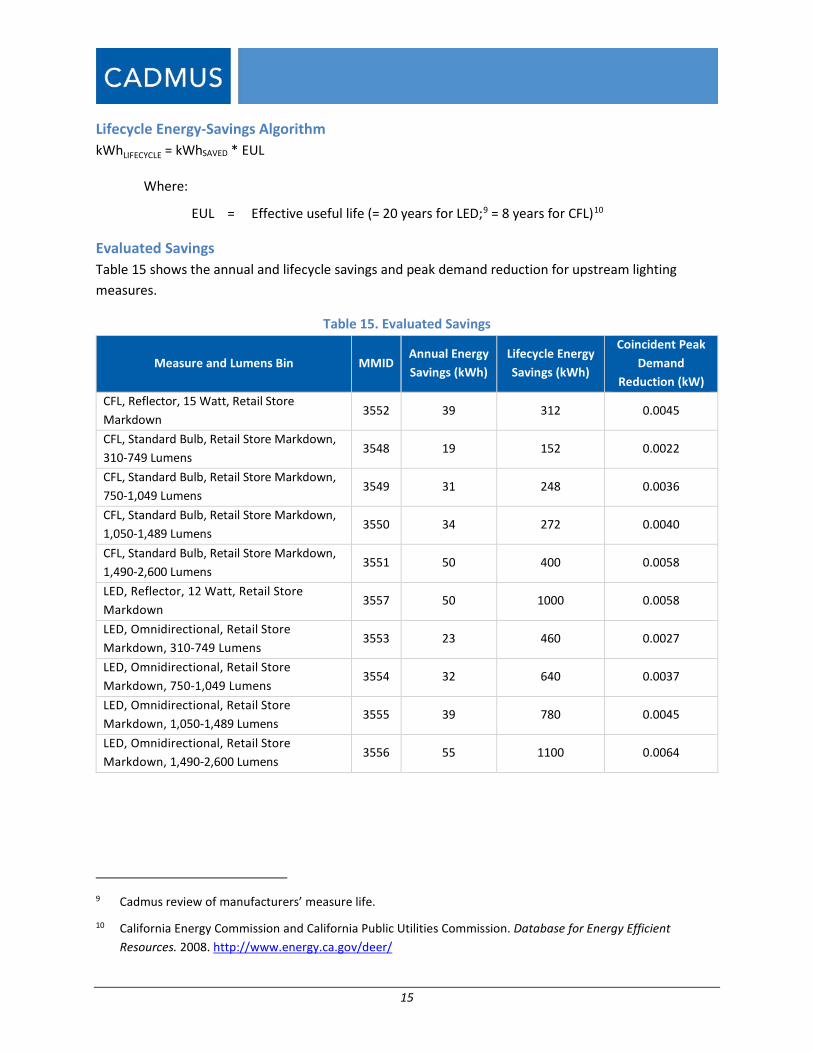
Lifecycle Energy-Savings Algorithm kWhLIFECYCLE = kWhSAVED * EUL
Where:
EUL = Effective useful life (= 20 years for LED;9 = 8 years for CFL)10
Evaluated Savings Table 15 shows the annual and lifecycle savings and peak demand reduction for upstream lighting measures.
Table 15. Evaluated Savings
Measure and Lumens Bin MMID Annual Energy Savings (kWh)
Lifecycle Energy Savings (kWh)
Coincident Peak Demand
Reduction (kW) CFL, Reflector, 15 Watt, Retail Store Markdown
3552 39 312 0.0045
CFL, Standard Bulb, Retail Store Markdown, 310-749 Lumens
3548 19 152 0.0022
CFL, Standard Bulb, Retail Store Markdown, 750-1,049 Lumens
3549 31 248 0.0036
CFL, Standard Bulb, Retail Store Markdown, 1,050-1,489 Lumens
3550 34 272 0.0040
CFL, Standard Bulb, Retail Store Markdown, 1,490-2,600 Lumens
3551 50 400 0.0058
LED, Reflector, 12 Watt, Retail Store Markdown
3557 50 1000 0.0058
LED, Omnidirectional, Retail Store Markdown, 310-749 Lumens
3553 23 460 0.0027
LED, Omnidirectional, Retail Store Markdown, 750-1,049 Lumens
3554 32 640 0.0037
LED, Omnidirectional, Retail Store Markdown, 1,050-1,489 Lumens
3555 39 780 0.0045
LED, Omnidirectional, Retail Store Markdown, 1,490-2,600 Lumens
3556 55 1100 0.0064
9 Cadmus review of manufacturers’ measure life.
10 California Energy Commission and California Public Utilities Commission. Database for Energy Efficient Resources. 2008. http://www.energy.ca.gov/deer/

16
Appliance Recycling In CY 2015 the Evaluation Team updated the unit energy consumption (UEC) estimates and part use factors for refrigerators and freezers recycled through the Appliance Recycling Program.
Unit Energy Savings As in the CY 2013 evaluation, the CY 2015 evaluation used secondary meter data and multivariate regression models to estimate gross per-unit savings. Full-year unit energy savings estimates (resulting from a regression-based metering analysis) are multiplied by average annual running time estimates (resulting from 2015 participant survey analysis).
Appendix I of Focus on Energy Calendar Year 2015 Evaluation Report describes the full methodology and findings4. Appendix I also includes additional details on the UEC model specification the Evaluation Team used to estimate annual energy consumption in CY 2015, along with the model’s estimated coefficients, and population values for each independent variable. Table 16 provides the 2014 deemed UEC estimates and the 2015 evaluated UEC estimates.
Table 16. Deemed and Evaluated UEC Estimates
Appliance 2013-2014 Average Per-Unit Annual Energy Consumption (kWh/Year)1
2015 Average Per-Unit Annual Energy Consumption (kWh/Year)
Refrigerators 1,081 1,139 Freezers 1,215 1,077 1 Values in 2015 TRM from: Cadmus. Focus on Energy Calendar Year 2013 Evaluation Report, Volume II. Table 24. May 15, 2014.
Part-Use Factor The Evaluation Team also updated the part-use factor (derived through CY 2015 participant surveys) for refrigerators and freezers recycled through the Program. Part-use is an adjustment factor used to convert the annual unit energy consumption of a refrigerator or freezer into an average per-unit gross savings value.
In CY 2015, the part-use factor for refrigerators continued trending upward, from 0.78, 0.82, to 0.87 in CY 2013, CY 2014, and CY 2015, respectively. The increase in refrigerator part-use is expected as programs mature, more primary units are replaced, and customers recycle their old primary appliance rather than selling or giving the old appliance away.
The freezer part-use factor declined from 0.80 and 0.79 in CY 2013 and CY 2014, respectively. Freezer part-use tends to be relatively stable over time but is generally always lower than refrigerators. The decrease for freezers observed in CY 2015 (0.73) is also not statistically significant.
The determined part-use factors for both refrigerators and freezers are lower than the currently applied factor of 0.90. Applying the updated part-use factors to the updated gross savings assumptions yields an evaluated-adjusted per-unit gross savings less than the CY 2014 deemed savings.
17
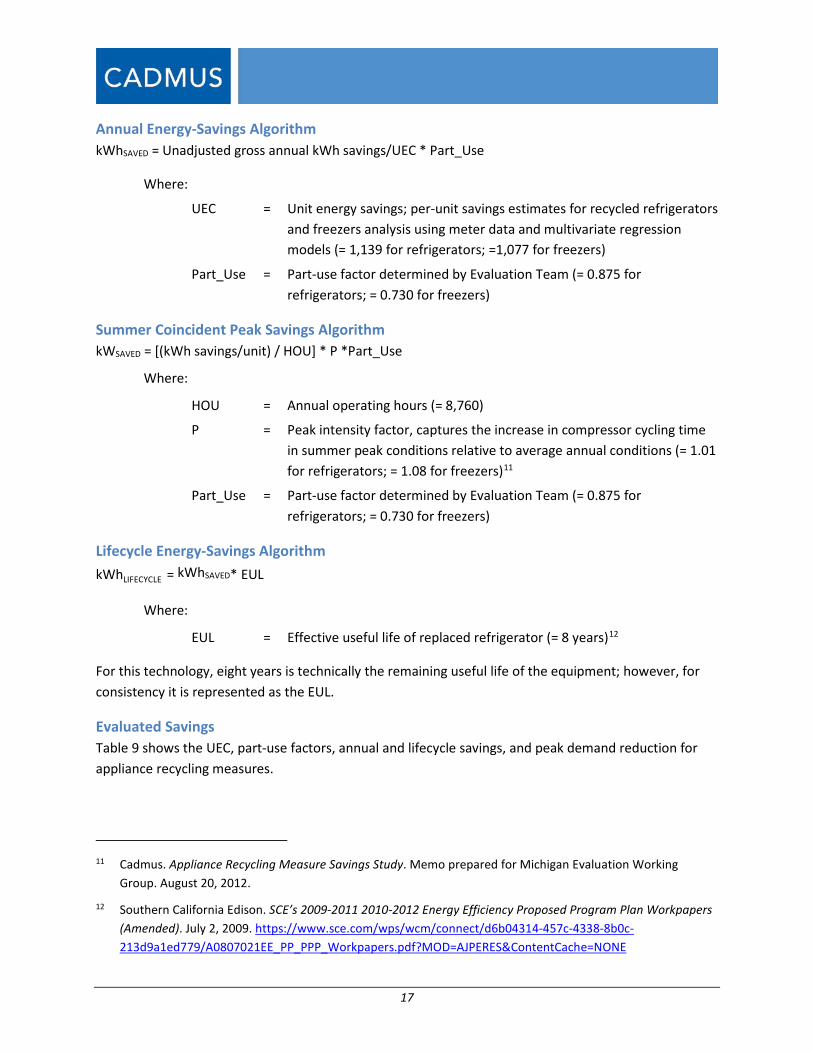
Annual Energy-Savings Algorithm kWhSAVED = Unadjusted gross annual kWh savings/UEC * Part_Use
Where:
UEC = Unit energy savings; per-unit savings estimates for recycled refrigerators and freezers analysis using meter data and multivariate regression models (= 1,139 for refrigerators; =1,077 for freezers)
Part_Use = Part-use factor determined by Evaluation Team (= 0.875 for refrigerators; = 0.730 for freezers)
Summer Coincident Peak Savings Algorithm kWSAVED = [(kWh savings/unit) / HOU] * P *Part_Use
Where:
HOU = Annual operating hours (= 8,760)
P = Peak intensity factor, captures the increase in compressor cycling time in summer peak conditions relative to average annual conditions (= 1.01 for refrigerators; = 1.08 for freezers)11
Part_Use = Part-use factor determined by Evaluation Team (= 0.875 for refrigerators; = 0.730 for freezers)
Lifecycle Energy-Savings Algorithm kWhLIFECYCLE = kWhSAVED* EUL
Where:
EUL = Effective useful life of replaced refrigerator (= 8 years)12
For this technology, eight years is technically the remaining useful life of the equipment; however, for consistency it is represented as the EUL.
Evaluated Savings Table 9 shows the UEC, part-use factors, annual and lifecycle savings, and peak demand reduction for appliance recycling measures.
11 Cadmus. Appliance Recycling Measure Savings Study. Memo prepared for Michigan Evaluation Working
Group. August 20, 2012.
12 Southern California Edison. SCE’s 2009-2011 2010-2012 Energy Efficiency Proposed Program Plan Workpapers (Amended). July 2, 2009. https://www.sce.com/wps/wcm/connect/d6b04314-457c-4338-8b0c-213d9a1ed779/A0807021EE_PP_PPP_Workpapers.pdf?MOD=AJPERES&ContentCache=NONE
18
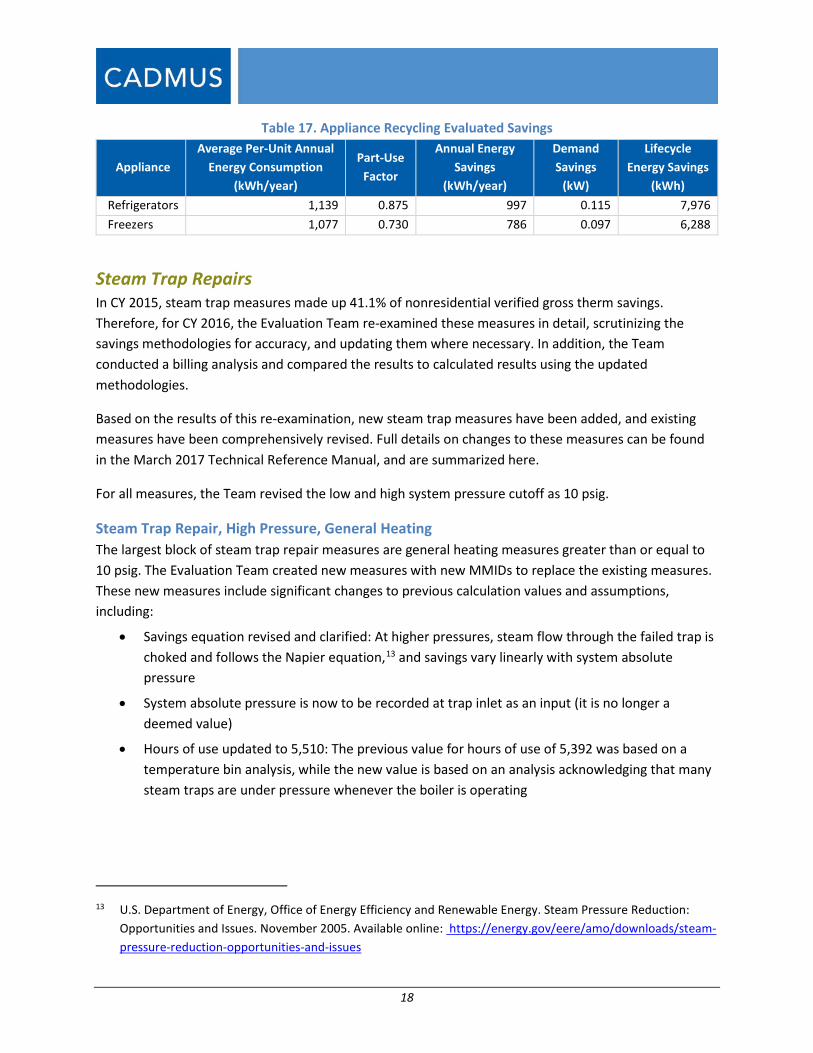
Table 17. Appliance Recycling Evaluated Savings
Appliance Average Per-Unit Annual
Energy Consumption (kWh/year)
Part-Use Factor
Annual Energy Savings
(kWh/year)
Demand Savings
(kW)
Lifecycle Energy Savings
(kWh) Refrigerators 1,139 0.875 997 0.115 7,976 Freezers 1,077 0.730 786 0.097 6,288
Steam Trap Repairs In CY 2015, steam trap measures made up 41.1% of nonresidential verified gross therm savings. Therefore, for CY 2016, the Evaluation Team re-examined these measures in detail, scrutinizing the savings methodologies for accuracy, and updating them where necessary. In addition, the Team conducted a billing analysis and compared the results to calculated results using the updated methodologies.
Based on the results of this re-examination, new steam trap measures have been added, and existing measures have been comprehensively revised. Full details on changes to these measures can be found in the March 2017 Technical Reference Manual, and are summarized here.
For all measures, the Team revised the low and high system pressure cutoff as 10 psig.
Steam Trap Repair, High Pressure, General Heating The largest block of steam trap repair measures are general heating measures greater than or equal to 10 psig. The Evaluation Team created new measures with new MMIDs to replace the existing measures. These new measures include significant changes to previous calculation values and assumptions, including:
• Savings equation revised and clarified: At higher pressures, steam flow through the failed trap is choked and follows the Napier equation,13 and savings vary linearly with system absolute pressure
• System absolute pressure is now to be recorded at trap inlet as an input (it is no longer a deemed value)
• Hours of use updated to 5,510: The previous value for hours of use of 5,392 was based on a temperature bin analysis, while the new value is based on an analysis acknowledging that many steam traps are under pressure whenever the boiler is operating
13 U.S. Department of Energy, Office of Energy Efficiency and Renewable Energy. Steam Pressure Reduction:
Opportunities and Issues. November 2005. Available online: https://energy.gov/eere/amo/downloads/steam-pressure-reduction-opportunities-and-issues
19
• Derating factor updated to account for the average percentage open a trap fails, and actual versus theoretical energy loss (= 17%)
This variable represents the average percentage open that steam traps fail. A value of 50% is commonly used, and was used previously for these measures. However, this value likely varies widely, and may not be close to 50% on average for a given set of steam trap failures. The Team altered this variable to align calculated savings with results from Cadmus’ CY 2016 Focus on Energy Steam Trap Study. In this study, Cadmus determined realized savings from billing data for four sites that had applied for steam trap incentives during the CY 2012 to CY 2014 program years. These sites showed an overall realization rate of billing data results to calculated savings of 34% (using values and methods described here, with a derating factor of 50%), suggesting that a derating factor of 17% is appropriate.
Steam Trap Repair, Low Pressure, Radiator The workpaper for Steam Trap Repair, < 10 psig, Radiator (MMID: 2772) has been revised based on updating the following values and assumptions:
• Savings equation revised and clarified: At lower pressures, steam flow through the failed trap follows a separate equation,14 and savings vary as a complex function of system pressure
• Only applicable for radiator steam traps with orifice size of 1/4-inches
• Deemed pressure at trap inlet is 6 psig: The 2016 Focus on Energy Steam Trap Study by Cadmus determined 6 psig as the weighted average pressure of less than 10 psig steam traps surveyed during the CY 2012 to CY 2014 program application years
• Hours of use are 5,510 (see above)
• Derating factor is 5.6%: As described above, the Team calculated the derating factor using results from the 2016 Focus on Energy Steam Trap Study by Cadmus. The study determined realized savings from billing data for 31 sites that had applied for steam trap incentives during the CY 2012 to CY 2014 program years. These sites showed an overall realization rate of billing data results to calculated savings of 11.2%, suggesting that a derating factor of 5.6% is appropriate.
14 Hornaday, William T. “Steam: Its Generation and Use.” Merchant Books, 2007. Project Gutenberg. Equation
50, pp 317. July 13, 2016. Available online: http://www.gutenberg.org/files/22657/22657-h/chapters/flow.html#page_321

20
Steam Trap Repair, Low Pressure, General Heating The Evaluation Team created new measures for low pressure general heating steam trap repairs. The measures include orifice sizes of 7/32-inches or smaller, 1/4-inches, 5/16-inches, and 3/8-inches. New values and assumptions for these measures include:
• Savings equation revised and clarified: At lower pressures, steam flow through the failed trap follows a separate equation,14 and savings vary as a complex function of system pressure
• Deemed pressure at trap inlet is 6 psig (see above)
• Hours of use is 5,510 (see above)
• Derating factor is 5.6% (see above)
Steam Trap Repair, High Pressure, Industrial The Team created new measures for high-pressure industrial process steam trap repairs. New values and assumptions for this measure group include:
• Savings equation revised and clarified: At higher pressures, steam flow through the failed trap is choked and follows the Napier equation,13 and savings vary linearly with system absolute pressure
• System absolute pressure to be recorded at trap inlet as an input, no longer a deemed value
• Hours of use is 7,000: This is an educated guess value that corresponds to a process running 9.7 months of the year. Calculated savings, using this value, ultimately align with billing analysis results by the alteration of the derating factor.
• Derating factor to account for the average percentage open a trap fails and actual versus theoretical energy loss (= 32%): As described above, the Team calculated the derating factor using results from the 2016 Focus on Energy Steam Trap Study by Cadmus. The study determined realized savings from billing data for four sites that had applied for steam trap incentives during the CY 2012 to CY 2014 program years. These sites showed an overall realization rate of billing data results to calculated savings of 64%, suggesting that a derating factor of 32% is appropriate.
Steam Trap Repair, Low Pressure, Industrial The Team added a new measure for low pressure (<10 psig) industrial steam trap repairs used for industrial process heating. New values and assumptions for this measure group include:
• Savings equation revised and clarified: At lower pressures, steam flow through the failed trap follows a separate equation,14 and savings vary as a complex function of system pressure
• Only applicable for radiator steam traps with orifice size of 1/4-inches
• Deemed pressure at trap inlet is 6 psig (see above)
• Hours of use is 7,000 (see above)
• Derating factor is 32% (see above)

21
All measures use the same lifecycle savings algorithm, shown immediately below.
ThermLIFECYCLE = ThermSAVED * EUL
Boiler Replacements In CY 2015, boiler measures made up 7.8% of nonresidential verified gross therm savings; therefore, as with steam trap measures, the Evaluation Team re-examined boiler measures for CY 2016. The Team scrutinized the savings methodologies for accuracy, then updated if necessary. In addition, the Team Evaluation conducted a billing analysis for these measures and compared the results to calculated results using the updated methodologies.
Energy-Savings Algorithm, Condensing Boiler This section discusses savings calculations for MMIDs 2743, 2218, and 3276. These are all condensing boilers differing only by their sector and size. A single HOU value is adopted. This is an average of the four regional HOU values previously employed, which are based on ENERGY STAR® values and modified by Cadmus metering studies. In addition, a single AFUEBASE is employed. Finally, like the derating factor for steam trap measures, the Team determined that the oversize factor is the loosest assumption in the savings equation, and therefore modified this factor to fit the savings calculation to the billing analysis results.
The savings equation is therefore:
ThermSAVED = BC * OF * EFLH * (1/AFUEBASE – 1/AFUEEFF) / 100
ThermLIFECYCLE = ThermSAVED * EUL
Where:
BC = Boiler rated capacity (MBtu/hour)
OF = Oversizing factor (= varies by measure; see table below)
EFLH = Effective full-load hours (= 1,909)15
15 Several Cadmus metering studies reveal that the ENERGY STAR calculator EFLH values are overestimated by
25%. The Evaluation Team adjusted the heating EFLH by population-weighted heating degree days and typical meterological year values. The Team then averaged the result for the state of Wisconsin. ENERGY STAR EFLH values available online: https://www.energystar.gov/sites/default/uploads/buildings/old/files/ASHP_Sav_Calc.xls

22
AFUEBASE = Boiler baseline thermal efficiency (= 82%)16,17
AFUEEFF = Boiler proposed thermal efficiency (= 90%)
100 = Conversion factor from MBtu to therms
EUL = Effective useful life (= 20 years)3
Table 18. Oversize Factors for Condensing Boilers ≥ 300 MBh MMID Description OF1
2743 < 300 MBh input, ≥ 90% AFUE (multifamily) 164% 2218 < 300 MBh input, ≥ 90% AFUE (other) 204% 3276 ≥ 300 MBh input, ≥ 90% AFUE (multifamily and other) 113%
1 The Evaluation Team calculated the oversize factor using results from the 2016 Focus on Energy Boiler Measure Study by Cadmus. The study determined realized savings from billing data for sites that had applied for boiler incentives during the CY 2012 to CY 2014 program years. The oversize factors in this report align each measure’s calculated savings, in conjunction with assumed EFLH and AFUE values, with the savings calculated from billing data results. The number of sites examined from each measure are: 17 sites for MMID 2743, 26 sites for MMID 2218, and 33 sites for MMID 3276.
16 Swager, Ron, C. Burger. Focus on Energy Evaluation. ACES: Default Deemed Savings Review. Final Report. June
24, 2008. Deemed Savings median for measure. Available online: https://www.focusonenergy.com/sites/default/files/acesdeemedsavingsreview_evaluationreport.pdf
17 Department of Energy. “2008-07-28 Energy Conservation Program for Consumer Products: Energy Conservation Standards for Residential Furnaces and Boilers; Final rule; technical amendment.” Last accessed June 2016. https://www.regulations.gov/document?D=EERE-2006-STD-0102-0009

23
Energy-Savings Algorithm, Near-Condensing Boiler, ≥ 300 MBh This section discusses savings calculations for MMID 3277. This measure is a near-condensing boiler plant replacement. The adopted savings equation is the same as for the previous measures, but with a different AFUEEFF and oversize factor.
ThermSAVED = BC * OF * EFLH * (1/AFUEBASE – 1/AFUEEFF) / 100
ThermLIFECYCLE = ThermSAVED * EUL
Where:
BC = Boiler rated capacity (MBtu/hour)
OF = Oversizing factor (= 77%)18
EFLH = Effective full-load hours (= 1,909)15
AFUEBASE = Boiler baseline thermal efficiency (= 82%)16
AFUEEFF = Boiler proposed thermal efficiency (= 87%)
100 = Conversion factor from MBtu to therms
EUL = Effective useful life (= 20 years)3
Energy-Savings Algorithm, Condensing Hybrid Boiler Plant, ≥ 1,000 MBh This section discusses savings calculations for MMID 3275. This measure is a > 1,000 MBh boiler plant retrofit. The adopted savings equation is the same as for the previous measures, but with a different AFUEEFF and oversize factor.
ThermSAVED = BC * OF * EFLH * (1/AFUEBASE – 1/AFUEEFF) / 100
ThermLIFECYCLE = ThermSAVED * EUL
Where:
BC = Boiler rated capacity (MBtu/hour)
OF = Oversizing factor (= 107%)19
EFLH = Effective full-load hours (= 1,909)15
18 Only three sites were included in the billing analysis for this measure. This amount of data is not sufficient to
update the oversizing factor. The value used is from: PA Consulting Group Inc. “Public Service Commission of Wisconsin Focus on Energy Evaluation, Business Programs: Deemed Savings Manual.” Final Report. March 22, 2010. Available online: https://www.focusonenergy.com/sites/default/files/bpdeemedsavingsmanuav10_evaluationreport.pdf
19 The Evaluation Team calculated the oversizing factor using results from the 2016 Focus on Energy Boiler Measure Study by Cadmus. The study determined realized savings from billing data for sites that had applied for boiler incentives during the CY 2012 to CY 2014 program years. The oversize factor in this report aligns the calculated savings, in conjunction with assumed EFLH and AFUE values, with the savings calculated from billing data results. The Team analyzed billing data for a total of nine sites.
24
AFUEBASE = Boiler baseline thermal efficiency (= 82%)16
AFUEEFF = Boiler proposed thermal efficiency (= 87%)
100 = Conversion factor from MBtu to therms
EUL = Effective useful life (= 20 years)3

25
Final Recommendations
The Evaluation Team recommends updating the savings values in the Wisconsin TRM for several measures. Table 19 shows a comparison of the evaluated and deemed savings and shows the changes to final savings.
Table 19. CY 2015 Deemed and Evaluated Savings Results Measure Category
SPECTRUM Name and MMID Deemed Evaluated1 Difference Units
Furnaces
LP Furnace with ECM, 90%+ AFUE (Existing), 3679; and LP Furnace with ECM, Income-Qualified (Tier 2), 90%+ AFUE (Existing), 3781
415 416 1 kWh per year 0.0792 0.0792 0 kW
0 0 0 Therms per year
NG Furnace, Income Qualified (Tier 2), 95%+ AFUE, 3783
0 0 0 kWh per year 0.0000 0.0000 0 kW
191 165 -26 Therms per year
NG Furnace with ECM, 95%+ AFUE (Existing), 1981
415 416 1 kWh per year 0.0792 0.0792 0 kW
29 21 -8 Therms per year
NG Furnace with ECM, 95+ AFUE, Income Qualified (Tier 2), 3782
415 416 1 kWh per year 0.0792 0.0792 0 kW
191 165 -26 Therms per year
Furnace and A/C, with ECM, 95%+ AFUE, ≥ 16 SEER, 2990
518 518 0 kWh per year 0.0277 0.2768 0.2491 kW
29 21 -8 Therms per year Furnace and A/C, with ECM, 95%+ AFUE, ≥ 16 SEER, Income Qualified (Tier 2), 3779
518 518 0 kWh per year 0.0277 0.2768 0.2491 kW
191 165 -26 Therms per year
Upstream CFLs and LEDs
CFL Standard Bulb, Retail Store Markdown, 310-749 Lumens, 3548
20 19 -1 kWh per year 0.0024 0.0022 -0.0002 kW
0 0 0 Therms per year
CFL Standard Bulb, Retail Store Markdown, 750-1,049 Lumens, 3549
30 31 1 kWh per year 0.0036 0.0036 0.0000 kW
0 0 0 Therms per year CFL Standard Bulb, Retail Store Markdown, 1,050-1,489 Lumens, 3550
35 34 -1 kWh per year 0.0042 0.0040 -0.0002 kW
0 0 0 Therms per year CFL Standard Bulb, Retail Store Markdown, 1,490-2,600 Lumens, 3551
50 50 0 kWh per year 0.0058 0.0058 0.0000 kW
0 0 0 Therms per year
LED, Omnidirectional, Retail Store Markdown, 310-749 Lumens, 3553
22 22 0 kWh per year 0.0026 0.0026 0.0000 kW
0 0 0 Therms per year

26
Measure Category
SPECTRUM Name and MMID Deemed Evaluated1 Difference Units
LED, Omnidirectional, Retail Store Markdown, 750-1,049 Lumens, 3554
33 32 -1 kWh per year 0.0039 0.0037 -0.0002 kW
0 0 0 Therms per year LED, Omnidirectional, Retail Store Markdown, 1,050-1,489 Lumens, 3555
41 39 -2 kWh per year 0.0048 0.0045 -0.0003 kW
0 0 0 Therms per year LED, Omnidirectional, Retail Store Markdown, 1,490-2,600 Lumens, 3556
55 55 0 kWh per year 0.0065 0.0064 -0.0001 kW
0 0 0 Therms per year
CFL, Reflector, 15 Watt, Retail Store Markdown, 3552
51 39 -12 kWh per year 0.0059 0.0045 -0.0014 kW
0 0 0 Therms per year
LED, Reflector, 12 Watt, Retail Store Markdown, 3557
54 50 -4 kWh per year 0.0063 0.0058 -0.0005 kW
0 0 0 Therms per year
Appliance Recycling
Refrigerator Recycling, 2955 886 987 101 kWh per year
0.1020 0.1149 0.0129 kW 0 0 0 Therms per year
Freezer Recycling, 2956 962 786 -176 kWh per year
0.1190 0.0969 -0.0221 kW 0 0 0 Therms per year
Steam Trap Repair
Steam Trap Repair, < 10 psig, Radiator, 2772
0 0 0 kWh per year 0 0 0 kW
245 107 -138 Therms per year
Other steam trap measures
These measures were extensively revised and are not directly comparable to their previous versions. Savings were
generally reduced. Details above and in the March 2017 Technical Reference Manual.
Boiler Replacement
Boiler, Hot Water, Near Condensing, ≥ 85% AFUE, ≥ 300 MBh, 3277
0 0 0 kWh per year 0 0 0 kW
1.42 1.03 -0.39 Therms per year,
per MBh
Boiler, Hot Water, Modulating, ≥ 90% AFUE, < 300 MBh, 2743
0 0 0 kWh per year 0 0 0 kW
2.57 3.39 0.82 Therms per year,
per MBh
Boiler, Hot Water, Modulating, ≥ 90% AFUE, < 300 MBh, 2218
n/a 0 n/a kWh per year n/a 0 n/a kW
n/a 4.22 n/a Therms per year,
per MBh n/a 0 n/a kWh per year

27
Measure Category
SPECTRUM Name and MMID Deemed Evaluated1 Difference Units
Boiler, Condensing, ≥ 90% AFUE, ≥ 300 MBh, 3276
n/a 0 n/a kW
n/a 2.33 n/a Therms per year,
per MBh
Boiler Plant Retrofit, Hybrid Plant, ≥ 1 MMBh, 3275
0 0 0 kWh per year 0 0 0 kW
1.54 1.43 -0.11 Therms per year,
per MBh 1 Minor differences in kWh values for furnace measures are caused by rounding.