Embed Size (px)
Citation preview

ECONOMIC PERFORMANCE RESIDENTIAL ANALYSISREGENERATION
RESIDENTIAL RESEARCH
FOCUS ON: BATH AND BRISTOL 2015

2
Bristol is the second largest city in the South of England, and is hosting one of the largest urban regeneration projects currently taking place in the country.
Bath, meanwhile, has been designated a UNESCO World Heritage Site and plans have been approved to press ahead with a £1 billion Enterprise Area which will create thousands of new jobs and homes over the next 14 years.
Both cities boast wide cultural offerings, buoyant economies and good access to London, they also share an increased commitment to new infrastructure, investment and home-building.
One of the key infrastructure changes in the coming years will be the trimming of commuting times from Bristol to London by rail, as examined on page 4. The relative price differential between housing in the capital and these regional centres is also starting to attract more attention among buyers.
Added to this, the area around Bristol and Bath is already a well-established hub for aerospace engineering and
OVERVIEW
microelectronics, and is now second only to London as a digital and tech centre. This is reflected in the economic growth in the two cities, as examined on page 3. Investment in the region continues, with 37 companies opting to set up a base in the region in the year to April 2015 alone.
All of these factors are likely to boost activity in residential property markets.
Economic and residential market analysisOver the last decade, the mainstream housing markets in both Bristol and Bath and North East Somerset have far outperformed the average, with prices rising by 46% and 42% respectively, compared to a 30% rise across England and Wales (figure 4).
In the prime markets, price growth is also higher in these city markets than across the rest of the country. Annual price growth in the year to the beginning of July was 5.1%, compared to 2.3% across the rest of the prime country markets (figure 1). This reflects the demand for prime property in city centre locations, which is also underlined by a 17% rise in the number of potential buyers registering their interest in buying in Bristol with Knight Frank between 2013 and 2014, and a 28% jump in sales volumes over the same period.
Prime prices in Bath rose by 5.3% in the year to July, with average values in Lansdown seeing the biggest price increase at 7.5%.
In terms of annual economic growth, forecasts suggest that Bristol and Bath will outperform the South West this year
Bristol’s Clifton Suspension Bridge and the Royal Crescent in Bath are two of the most instantly recognisable landmarks in England. These cities may have a rich historical heritage, but as this report shows, they are firmly focused on the future.
46%Growth in prices in Bristol 2004 - 2015
42%Growth in residential prices in Bath and North East Somerset 2004 - 2015
FIGURE 1
Prime residential price change Annual change, year to end Q2 2015
Source: Knight Frank Residential Research
ENGLAND & WALES2.3%
BRISTOL BATH
5.1%5.3%
Please refer to the important notice at the end of this report
3
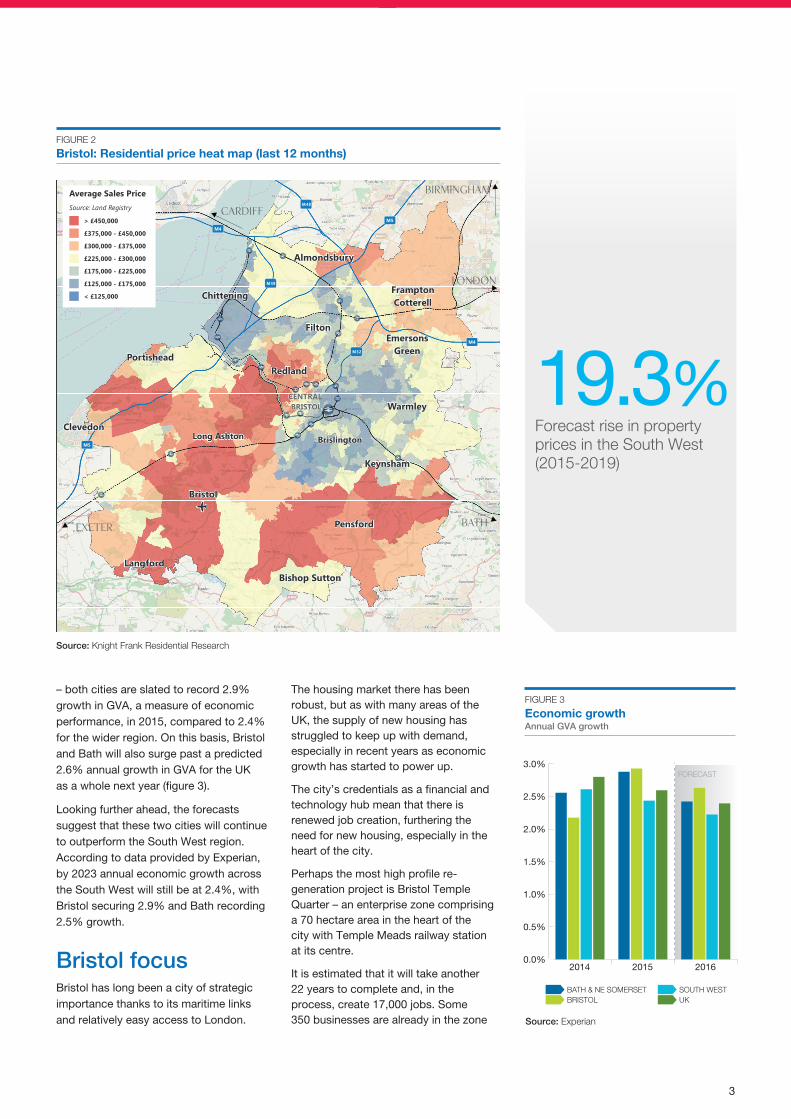
FIGURE 2
Bristol: Residential price heat map (last 12 months)
o
CENTRAL BRISTOL
Long Ashton
Filton
Keynsham
Bristol
Portishead
EmersonsGreen
Warmley
Pensford
Average Sales PriceSource: Land Registry
> £450,000
£375,000 - £450,000
£300,000 - £375,000
£225,000 - £300,000
£175,000 - £225,000
£125,000 - £175,000
< £125,000 Chittening
M5
M4
M32
M48
M49
M5
M4
Redland
cardiff
Exeter
london
birmingham
bath
LangfordBishop Sutton
FramptonCotterell
Clevedon
Almondsbury
Brislington
Source: Knight Frank Residential Research
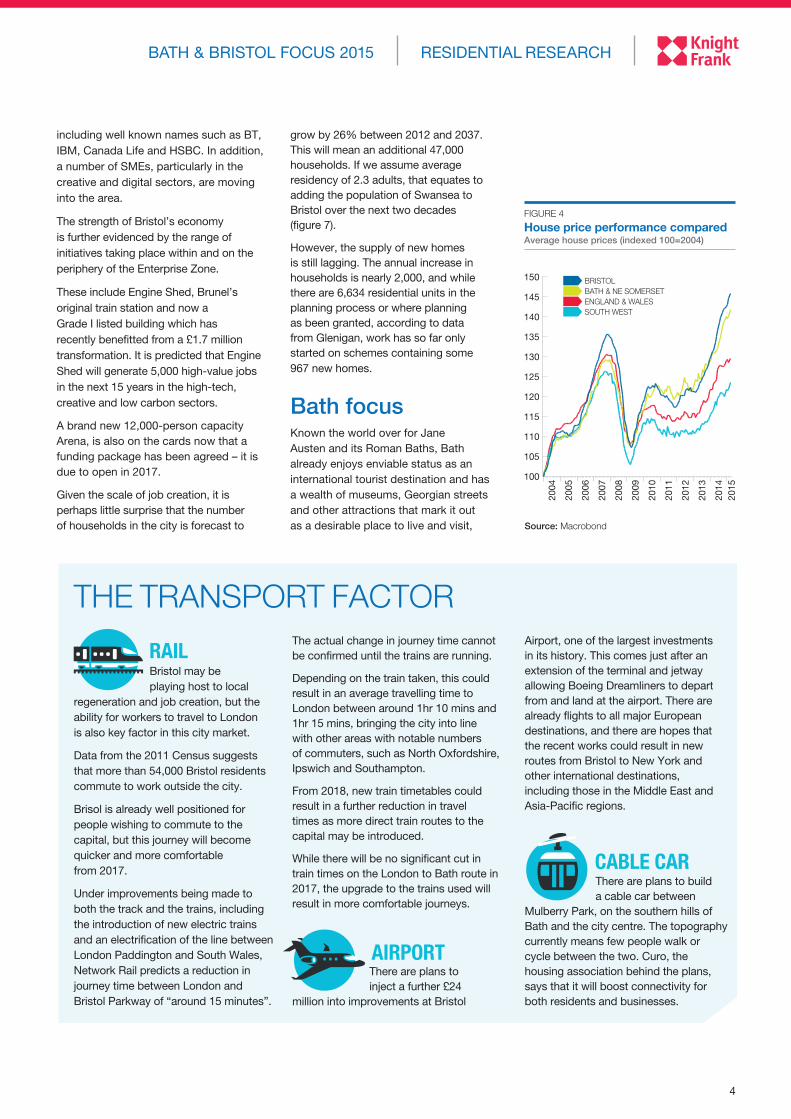
– both cities are slated to record 2.9% growth in GVA, a measure of economic performance, in 2015, compared to 2.4% for the wider region. On this basis, Bristol and Bath will also surge past a predicted 2.6% annual growth in GVA for the UK as a whole next year (figure 3).
Looking further ahead, the forecasts suggest that these two cities will continue to outperform the South West region. According to data provided by Experian, by 2023 annual economic growth across the South West will still be at 2.4%, with Bristol securing 2.9% and Bath recording 2.5% growth.
Bristol focusBristol has long been a city of strategic importance thanks to its maritime links and relatively easy access to London.
The housing market there has been robust, but as with many areas of the UK, the supply of new housing has struggled to keep up with demand, especially in recent years as economic growth has started to power up.
The city’s credentials as a financial and technology hub mean that there is renewed job creation, furthering the need for new housing, especially in the heart of the city.
Perhaps the most high profile re-generation project is Bristol Temple Quarter – an enterprise zone comprising a 70 hectare area in the heart of the city with Temple Meads railway station at its centre.
It is estimated that it will take another 22 years to complete and, in the process, create 17,000 jobs. Some 350 businesses are already in the zone
0.0%
0.5%
1.0%
1.5%
2.0%
2.5%
3.0%
201620152014
BATH & NE SOMERSETBRISTOL
SOUTH WESTUK
FORECAST
FIGURE 3
Economic growth Annual GVA growth
Source: Experian
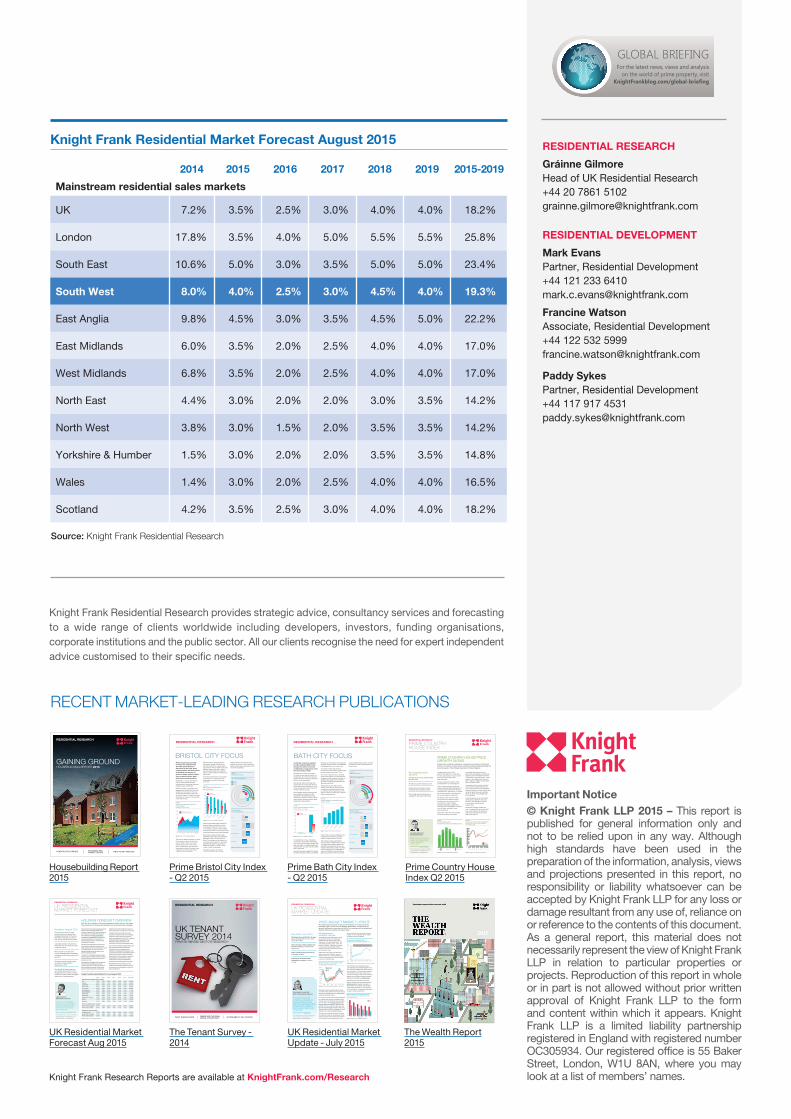
19.3%Forecast rise in property prices in the South West (2015-2019)
4
RESIDENTIAL RESEARCHBATH & BRISTOL FOCUS 2015
including well known names such as BT, IBM, Canada Life and HSBC. In addition, a number of SMEs, particularly in the creative and digital sectors, are moving into the area.
The strength of Bristol’s economy is further evidenced by the range of initiatives taking place within and on the periphery of the Enterprise Zone.
These include Engine Shed, Brunel’s original train station and now a Grade I listed building which has recently benefitted from a £1.7 million transformation. It is predicted that Engine Shed will generate 5,000 high-value jobs in the next 15 years in the high-tech, creative and low carbon sectors.
A brand new 12,000-person capacity Arena, is also on the cards now that a funding package has been agreed – it is due to open in 2017.
Given the scale of job creation, it is perhaps little surprise that the number of households in the city is forecast to
grow by 26% between 2012 and 2037. This will mean an additional 47,000 households. If we assume average residency of 2.3 adults, that equates to adding the population of Swansea to Bristol over the next two decades (figure 7).
However, the supply of new homes is still lagging. The annual increase in households is nearly 2,000, and while there are 6,634 residential units in the planning process or where planning as been granted, according to data from Glenigan, work has so far only started on schemes containing some 967 new homes.
Bath focusKnown the world over for Jane Austen and its Roman Baths, Bath already enjoys enviable status as an international tourist destination and has a wealth of museums, Georgian streets and other attractions that mark it out as a desirable place to live and visit,
100
105
110
115
120
125
130
135
140
145
150
2004
2005
2006
2007
2008
2009
2010
2011
2012
2013
2014
2015
BRISTOLBATH & NE SOMERSETENGLAND & WALES SOUTH WEST
FIGURE 4
House price performance compared Average house prices (indexed 100=2004)
Source: Macrobond
THE TRANSPORT FACTOR
Bristol may be playing host to local regeneration and job creation, but the ability for workers to travel to London is also key factor in this city market.
Data from the 2011 Census suggests that more than 54,000 Bristol residents commute to work outside the city.
Brisol is already well positioned for people wishing to commute to the capital, but this journey will become quicker and more comfortable from 2017.
Under improvements being made to both the track and the trains, including the introduction of new electric trains and an electrification of the line between London Paddington and South Wales, Network Rail predicts a reduction in journey time between London and Bristol Parkway of “around 15 minutes”.
The actual change in journey time cannot be confirmed until the trains are running.
Depending on the train taken, this could result in an average travelling time to London between around 1hr 10 mins and 1hr 15 mins, bringing the city into line with other areas with notable numbers of commuters, such as North Oxfordshire, Ipswich and Southampton.
From 2018, new train timetables could result in a further reduction in travel times as more direct train routes to the capital may be introduced.
While there will be no significant cut in train times on the London to Bath route in 2017, the upgrade to the trains used will result in more comfortable journeys.
There are plans to inject a further £24 million into improvements at Bristol
Airport, one of the largest investments in its history. This comes just after an extension of the terminal and jetway allowing Boeing Dreamliners to depart from and land at the airport. There are already flights to all major European destinations, and there are hopes that the recent works could result in new routes from Bristol to New York and other international destinations, including those in the Middle East and Asia-Pacific regions.
There are plans to build a cable car between Mulberry Park, on the southern hills of Bath and the city centre. The topography currently means few people walk or cycle between the two. Curo, the housing association behind the plans, says that it will boost connectivity for both residents and businesses.
RAIL
AIRPORT
CABLE CAR

5
including a compact city centre with a good retail offering.
Behind the Georgian facades however, Bath is also home to a cluster of leading software consultancies – indeed the city was named by NESTA as one of the UK’s top ten tech clusters in the UK in 2010.
Looking forward, the local council has ambitious plans to grow the value of the city’s economy by a further £1 billion by 2026, creating some 10,000 new jobs.
The city is also undertaking large-scale regeneration. Perhaps the notable project is Bath City Riverside Enterprise Area. Covering a total area of 98 hectares, it has the potential to accommodate up to 9,000 new jobs and 3,400 homes along the river corridor and in central
and western Bath. The council believes it could increase the value of the Bath economy by £620 million a year.
The number of households in Bath and North East Somerset is forecast to grow by around 15% over the next two decades, according to government figures, or around 500 a year (figure 4). The pipeline supply of new-build development in Bath indicates there are 2,817 residential units in the planning system or with permission granted. However construction work has only started, or is due to start imminently, on 887 units in and around Bath.
Knight Frank forecasts show that average prices in the South West are expected to rise by 4% this year – and by more than 19% over the next 5 years.
CENTRAL BATH
Bathampton
Bradford-on-AvonLimpley Stoke
Newton St Loe
Odd Down
Charlcombe
Ashley
Average Sales PriceSource: Land Registry
> £650,000
£450,000 - £650,000
£375,000 - £450,000
£300,000 - £375,000
£250,000 - £300,000
£200,000 - £250,000
< £200,000
A4
A4
A4
A 36
A 46
A 46
A361
Claverton DownThe Oval
BRISTOLSWINDON &LONDON
Dunkerton
Kelston
South Wraxall
Monkton Farleigh
Wellow
LansdownLansdown
Source: Knight Frank Residential Research
RESIDENTIAL RESEARCHBATH & BRISTOL FOCUS 2015
FIGURE 5
Bath: Residential price heat map (last 12 months)
FIGURE 6
Average price of a semi-detached home in…
Source: Knight Frank Residential Research
0
50k
100k
150k
200k
250k
203720322027202220172012
BATH & NE SOMERSETBRISTOL
FIGURE 7
Forecast growth in households in Bath and Bristol
Source: DCLG
London
£475,000Bath & NW Somerset
£276,000
Bristol
£207,000
Important Notice © Knight Frank LLP 2015 – This report is published for general information only and not to be relied upon in any way. Although high standards have been used in the preparation of the information, analysis, views and projections presented in this report, no responsibility or liability whatsoever can be accepted by Knight Frank LLP for any loss or damage resultant from any use of, reliance on or reference to the contents of this document. As a general report, this material does not necessarily represent the view of Knight Frank LLP in relation to particular properties or projects. Reproduction of this report in whole or in part is not allowed without prior written approval of Knight Frank LLP to the form and content within which it appears. Knight Frank LLP is a limited liability partnership registered in England with registered number OC305934. Our registered office is 55 Baker Street, London, W1U 8AN, where you may look at a list of members’ names.
Knight Frank Residential Research provides strategic advice, consultancy services and forecasting to a wide range of clients worldwide including developers, investors, funding organisations, corporate institutions and the public sector. All our clients recognise the need for expert independent advice customised to their specific needs.
RECENT MARKET-LEADING RESEARCH PUBLICATIONS
Knight Frank Research Reports are available at KnightFrank.com/Research
For the latest news, views and analysison the world of prime property, visit
KnightFrankblog.com/global-briefing
GLOBAL BRIEFING
RESIDENTIAL RESEARCH
Gráinne Gilmore Head of UK Residential Research +44 20 7861 5102 [email protected]
RESIDENTIAL DEVELOPMENT
Mark Evans Partner, Residential Development +44 121 233 6410 [email protected]
Francine WatsonAssociate, Residential Development +44 122 532 [email protected]
Paddy Sykes Partner, Residential Development+44 117 917 4531 [email protected]
UK housing and economic overviewHouse prices continued to ease in June according to figures from Nationwide Building Society, with average prices slipping by 0.2% during the month. This took annual growth to 3.3%, with 7.3% growth in London. The picture on prices is not entirely clear however. Halifax’s monthly house price data showed a 1.7% rise in prices in June.
Additionally, the house price sentiment index, produced by Knight Frank and Markit Economics, a forward indicator for house price movements, ticked up slightly in June after falling in May.
RESIDENTIAL RESEARCH
UK RESIDENTIAL MARKET UPDATE
“ The government has ramped up pressure on local authorities around planning, emphasising that increasing the supply of new homes is high on its “to do” list.”Follow Gráinne at @ggilmorekf
For the latest news, views and analysis on the world of prime property, visit Global Briefing or @kfglobalbrief
GRÁINNE GILMORE Head of UK Residential Research
POST-BUDGET MARKET UPDATE The Chancellor focussed on buy-to-let landlords, non-doms and the planning regime in his summer Budget. Meanwhile, residential price growth continued to ease across the UK, as rental growth strengthened. Gráinne Gilmore examines the latest data.
Annual change in house prices, UK Annual change in house prices, UK
Source: Knight Frank Residential Research / Macrobond
0
50,000
100,000
150,000
200,000
250,000
300,000
350,000
400,000
450,000
2013
2010
2007
2004
2001
1998
1995
1992
1989
1986
1983
1980
1977
1974
1971
1968
1965
1962
1959
1956
1953
-5.0%
-2.5%
0.0%
2.5%
5.0%
7.5%
10.0%
12.5%
201520142013201220112010
Land RegistryNationwideONSHalifax
Key facts July 2015UK house prices fell by 0.2% in June, taking annual growth to 3.3%, down from 4.6% in May
Prices in prime central London rose by 0.5% in June, as annual growth eased to 2%
Prime country house prices are up 2.3% year-on-year
House price sentiment index, bellwether for market, ticked up in June
move could also drive up rents if costs are passed on, but competition in the market will likely curb such increases.
The Chancellor also changed the rules surrounding non-domiciled residents in the UK, cutting the timeframe for those claiming non-dom status to 15 years and scrapping the inheritance of non-dom status. There was also a change to rules for those holding property in an offshore company, meaning that they will be liable for inheritance tax.
Additionally, the chancellor announced plans to increase the tax free allowance for inheritance tax for couples who pass on their home to their children. The increase will be tapered from 2017 eventually rising to £1m in 2020-21. An allowance will be put in place to protect downsizers.
House price sentiment rises House Price Sentiment Index, June 2015, UK
Source: Knight Frank Residential Research / Markit Economics
0
50,000
100,000
150,000
200,000
250,000
300,000
350,000
400,000
450,000
2013
2010
2007
2004
2001
1998
1995
1992
1989
1986
1983
1980
1977
1974
1971
1968
1965
1962
1959
1956
1953
30
35
40
45
50
55
60
65
70
75
80
May-15May-14May-13May-12May-11May-10
Pricesrising
Pricesfalling
Nochange
GeneralElection
30
35
40
45
50
55
60
65
70
Jun-15Jun-14Jun-13Jun-12Jun-11Jun-10
Pricesrising
Pricesfalling
Nochange
While the market is underpinned by record low interest rates, there are still issues around accessing mortgage finance and affordability which are having an impact.
For owner-occupiers, the summer Budget did not include major reforms to property taxes, however buy-to-let landlords who pay higher rate tax will see the mortgage interest relief they can claim cut from 2017, falling to 20% by 2020. The move came just days after the Bank of England flagged concerns that rising interest rates could pose a challenge to some landlords in its Financial Stability Review.
The new rules could see landlords reviewing the offers they make on new property as they will have to factor in the new tax environment. There has been some speculation that the
Prime London price growth eases Annual change in values in prime central and prime outer London
Source: Knight Frank Residential Research
0
50,000
100,000
150,000
200,000
250,000
300,000
350,000
400,000
450,000
2013
2010
2007
2004
2001
1998
1995
1992
1989
1986
1983
1980
1977
1974
1971
1968
1965
1962
1959
1956
1953
0%
1%
2%
3%
4%
5%
6%
7%
JunMayAprMarFebJan
POL
2015
PCL
Compared to one month ago, what do you think has happened to the value of your home?
WHERE ARE THE IDEAL RENTAL PROPERTIES?
UK TENANT SURVEY 2014 PRIVATE RENTED SECTOR RESEARCH
RESIDENTIAL RESEARCH
AFFORDABILITY VS LOCATION WHAT TENANTS WANT
The Tenant Survey - 2014
UK Residential Market Update - July 2015
Prime Country House Index Q2 2015
Prime Bath City Index - Q2 2015
Prime Bristol City Index - Q2 2015
Average values rose by 0.9% between April and June, an indication that any expectations of a post-election price jump in the prime market were unfounded.
Annual price growth slowed to 2.3%, its lowest level in two years (figure 1).
One of the key reasons price growth remains subdued, despite the election of a majority government and the removal of the threat of a ‘mansion tax’, is the fact that the prime market is still absorbing the recent changes to stamp duty.
The change, which came into effect in December, has resulted in higher purchase costs for properties worth more than £1.1 million. There is anecdotal evidence to suggest that some buyers are factoring the increased cost into offers, resulting in some price adjustments.
Additionally, while there was a release of pent-up demand in the weeks
immediately following the vote as buyers who had adopted a wait and see approach prior to the election returned to the market, rising stock levels – which peaked to their highest level all year in May – helped to mitigate any significant jump in property values.
The greater political certainty afforded by the election result means there is a more positive outlook for the residential property market as a whole. Interest rates remain at record low levels, economic growth is steady and mortgage rates are competitive.
During the quarter, prime city markets continued to outperform more rural locations, with notable price growth in Bath, Bristol and Winchester among others.
Prime urban property markets are now, on average, 2% above their 2007 peak, while neighbouring village and rural locations remain 13.2% below peak levels (figure 2).
PRIME COUNTRY HOUSE PRICE GROWTH SLOWSDespite the certainty provided by a majority government, activity and prices in the prime country house market remained subdued during the second quarter. Oliver Knight examines the latest figures.
Key headlines from Q2 2015Average values rose by 0.9% between April and June
Annual price growth slowed to 2.3%
Higher stamp duty rates for prime properties has moderated activity
Prime urban property values are on average 2% above their 2007 peak
FIGURE 1
Price growth slows Annual change in prime country property values
FIGURE 2
Town and city markets outperform Price growth in urban and rural locations (100 = March 2005)
Source: Knight Frank Residential Research Source: Knight Frank Residential Research
201520142013Q2Q1Q4Q3Q2Q1Q4
0
1
2
3
4
5
6
Q2Q1Q4Q3Q2Q1Q4
3.1%
4.5%
5.2%4.7%
3.4%
2.5% 2.3%
RURALURBAN
60
70
80
90
100
110
120
130
Jun-
15
Jun-
14
Jun-
13
Jun-
12
Jun-
11
Jun-
10
Jun-
09
Jun-
08
Jun-
07
Jun-
06
Jun-
05
RESIDENTIAL RESEARCH
PRIME COUNTRY HOUSE INDEX
OLIVER KNIGHT Residential Research
“ The prime country house market is still absorbing recent changes to stamp duty.”
Follow Oliver at @oliverknightkf
For the latest news, views and analysis on the world of prime property, visit Global Briefing or @kfglobalbrief
UK Residential Market Forecast Aug 2015
RESIDENTIAL RESEARCH
UK RESIDENTIAL MARKET FORECAST
“ One of the most notable changes is the Chancellor’s move to equalise the tax treatment of companies and individuals.”
Follow Liam at @LIAMBAILEYRESI
For the latest news, views and analysis on the world of prime property, visit Global Briefing or @kfglobalbrief
LIAM BAILEY Global Head of Research
HOUSING FORECAST OVERVIEWWith the tax treatment of housing undergoing further reform, we gauge the net impact on demand and pricing from recent and future changes.
Headlines August 2015The cumulative impact of recent and future reforms to Stamp Duty, mortgage interest relief for investors, CGT and IHT will take some time to work through the UK housing market
Cumulative growth in UK prices will total a little over 18% in the five years to the end of 2019
While political risk for the prime London market has fallen, affordability constraints will limit price growth in the near term
UK rents and prime central London rents will rise 2.2% and 3.5% respectively in 2015
The risk that UK interest rates rise more rapidly than expected or that the global economy suffers a notable slowdown in activity remain the biggest risks to the UK housing market
Knight Frank Residential Market Forecast August 2015
2014 2015 2016 2017 2018 2019 2015-2019
Mainstream residential sales markets
UK 7.2% 3.5% 2.5% 3.0% 4.0% 4.0% 18.2%
London 17.8% 3.5% 4.0% 5.0% 5.5% 5.5% 25.8%
South East 10.6% 5.0% 3.0% 3.5% 5.0% 5.0% 23.4%
South West 8.0% 4.0% 2.5% 3.0% 4.5% 4.0% 19.3%
East Anglia 9.8% 4.5% 3.0% 3.5% 4.5% 5.0% 22.2%
East Midlands 6.0% 3.5% 2.0% 2.5% 4.0% 4.0% 17.0%
West Midlands 6.8% 3.5% 2.0% 2.5% 4.0% 4.0% 17.0%
North East 4.4% 3.0% 2.0% 2.0% 3.0% 3.5% 14.2%
North West 3.8% 3.0% 1.5% 2.0% 3.5% 3.5% 14.2%
Yorkshire & Humber 1.5% 3.0% 2.0% 2.0% 3.5% 3.5% 14.8%
Wales 1.4% 3.0% 2.0% 2.5% 4.0% 4.0% 16.5%
Scotland 4.2% 3.5% 2.5% 3.0% 4.0% 4.0% 18.2%
Prime residential sales markets
Prime Central London 6.7% 1.0% 4.5% 5.0% 5.0% 6.0% 23.3%
Prime Outer London 10.5% 3.0% 5.5% 5.0% 5.0% 5.0% 25.8%
Residential rental markets
UK Mainstream 2.0% 2.2% 2.3% 2.3% 2.4% 2.4% 12.1%
Prime Central London 4.0% 3.5% 3.3% 3.3% 3.0% 3.0% 17.1%
Prime Outer London 0.5% 4.0% 3.3% 3.0% 2.8% 2.8% 16.8%
Source: Knight Frank Residential Research
The UK economy provides a relatively positive backdrop for the housing market. Most forecasters expect GDP to rise by upwards of 2.5% this year. In line with this outlook, the latest data from the Knight Frank/Markit House Price Sentiment Index confirms that an increasing majority of households are expecting house prices to continue to rise over the next 12 months.
The ability of households to continue to bid house prices higher will be influenced by a range of factors, which we summarise overleaf in our Risk Monitor, not least recent and planned changes to the tax system which directly impact on property.
Last month’s “emergency budget” allowed George Osborne to tweak a number of taxes, just as previously announced reforms were coming in to effect.
The creation of an additional nil-rate band for IHT from 2017, benefitting owners with property valued up to £2.35m, should act to add to demand for property. However this uptick in demand should be at least partly
offset by the innovation that downsizers will see property equity “ring fenced” for the future.
Changes which could weigh on demand include the restriction of buy-to-let mortgage interest tax relief to basic rate income tax, which is being phased in from 2017. In addition anecdotal evidence suggests that last December’s Stamp Duty reforms are impacting on activity and trading above £2m.
One of the most notable changes which could have an impact in central London is the Chancellor’s move to equalise the tax treatment of companies and individuals. First we saw the introduction of the additional rate of Stamp Duty (don’t buy through a structure), followed by ATED (if you insist you will pay for the privilege), and now IHT reform which undermines for many the final benefit for maintaining structured property ownership.
Despite the pace of tax change, our view remains that it is interest rates and economic performance which will shape the outlook for prices and demand.
valued up to £1m with the recent changes to stamp duty announced in the December 2014 Budget likely to be a factor here.
As a result of stamp duty revisions, purchase costs have fallen for those buying property valued at less than £1.14m.
Above this threshold however, potential buyers have become more price sensitive. Properties in Bath valued at over £2m, for example, fell in value by 0.7% between April and June taking price growth so far this year to just 0.3%.
Price growth has also been far from uniform across the city. Property values in Lansdown and Widcombe have risen by 4.6% and 3.2% respectively over the first six months of 2015, and by 7.5% and 6.2% over the past year.
A shortage of prime properties for sale combined with strong demand for homes in the city contributed to rising prices in the first six months of 2015.
According to our index, which tracks the value of prime property in Bath, the average price of a home in the city rose by 2.8% between January and June and by 5.3% on an annual basis.
Such growth means that values have outperformed the wider prime market in the UK where prices have risen by 1.8% so far this year and by 2.3% over the 12 months to the end of June.
Price increases in Bath are being driven by a shortage of properties for sale at all levels of the market and strong demand from buyers for homes in prime urban markets with good schools, good infrastructure and amenities.
To illustrate this, in June, while prime stock levels in Bath were at their lowest level of the year according to Knight Frank data, the number of potential new buyers registering with our office was 32% higher than a year earlier.
Anecdotal evidence suggests that interest has been particularly strong for properties
FIGURE 2
Bath annual price growth by area Q2 2014 - Q2 2015
0%
1%
2%
3%
4%
5%
6%
7%
8%
Widco
mbe
Lans
down
Combe D
own
Centra
l
Bathw
ick
Source: Knight Frank Residential Research
Source: Knight Frank Residential Research
FIGURE 1
Price outperformance in Bath Prime property price change
0%
1%
2%
3%
4%
5%
6%
BathUK prime country
ANNUALYEAR-TO-DATE
BATH CITY FOCUS
Source: Knight Frank Residential Research / VOA
FIGURE 3
Bath City Focus
Property type As a % of housing stock
Flat
14%
38%
23%
Terraced
Detached
25%Semi-detached
RESIDENTIAL RESEARCH
South of the city centre, in Bathwick and Combe Down annual price growth of 5.6% and 4.8% has been recorded.
The number of people searching for homes in Bath on Knight Frank’s website was 40% higher between January and June 2015 compared with last year, an indication that activity is likely to continue in the coming months. The prospect of a more comfortable commute between Bath and London from 2017 as a result
of improvements being made to both the track and the trains has also given lift to buyer interest.
Age of housing stock
Pre-19001900-1939
1945-19721973-2014
37%
17%
28%
18%
17%
18%
28%
37%
Pre-19001900-19391945-19721973-2014
This can put upwards pressure on prices. Prime property values in Bristol have risen by 2.4% in the first six months of 2015 and by 5.1% on an annual basis. Comparatively, over the same time property values in the wider prime market across the UK have risen by 1.8% and 2.3% respectively.
Prime property price growth in Bristol has outperformed the wider prime market in the UK so far this year. Such outperformance has been driven by demand from buyers for homes in prime urban locations close to good schools, good infrastructure and amenities.
Additionally, so far this year Bristol’s prime property market has been characterised by a growing imbalance between supply and demand.
While the number of potential buyers registered with Knight Frank has risen steadily over the course of the year, stock levels have failed to keep pace, as shown in figure 1. At the end of June the number of homes for sale was 36% lower year-on-year.
BRISTOL CITY FOCUS
RESIDENTIAL RESEARCH
While the bulk of demand has been from buyers moving within Bristol or from the South West – a group which accounted for 75% of Knight Frank sales between January and June – agents report growing interest from potential buyers currently based in the South East and London.
One reason behind this rise in enquiries is the prospect of a faster and more comfortable commute to the capital from 2017.
Under improvements being made to the track and trains, a reduction in journey time between Bristol and London of up to 15 minutes is expected. This will bring travel times from the city into line with other commuter locations such as the Cotswolds.
Such buyers are also looking to take advantage of the relative price differential between housing in the capital and in Bristol. The average cost per square foot of a prime house in Bristol is, on average, between £300 and £400, according to Knight Frank figures. In areas of prime London £1,250+ is achievable.
Properties located by the harbour recorded the biggest price growth
FIGURE 2
Bristol prime property price growth by area
Stoke
Bish
op
Sneyd
Par
k
Redlan
d
Leigh W
oods
Harbour
side
Clifton
0%
1%
2%
3%
4%
5%
6%
7%ANNUALYEAR-TO-DATE
Source: Knight Frank Residential Research
FIGURE 1
Supply and demand in Bristol’s prime market Indexed to 100 = Feb 2014
60
80
100
120
140
160
180
MF M2014 2015
A JJ M MA JSA NO JD F
PROSPECTIVE BUYERSPROPERTIES FOR SALE
Source: Knight Frank Residential Research
between January and June at 3.3%, followed by homes in Clifton and Stoke Bishop where values have risen by 3.2% and 2.9% respectively.
Source: Knight Frank Residential Research / VOA
FIGURE 3
Bristol City Focus
Property type As a % of housing stock
Flat
11%
39%
20%
Terraced
Detached
30%Semi-detached
Age of housing stock
9%
36%
Pre-19001900-19391945-19721973-2014
26%29%
The Wealth Report 2015
CONSTRUCTION TRENDS ECONOMIC AND MARKET UPDATE HELP TO BUY ANALYSIS
RESIDENTIAL RESEARCH
EXCLUSIVE 2015 UK
HOUSEBUILD
ER SURVEY
RESULTS
GAINING GROUND HOUSEBUILDING REPORT 2015
Housebuilding Report 2015
Knight Frank Residential Market Forecast August 2015
2014 2015 2016 2017 2018 2019 2015-2019
Mainstream residential sales markets
UK 7.2% 3.5% 2.5% 3.0% 4.0% 4.0% 18.2%
London 17.8% 3.5% 4.0% 5.0% 5.5% 5.5% 25.8%
South East 10.6% 5.0% 3.0% 3.5% 5.0% 5.0% 23.4%
South West 8.0% 4.0% 2.5% 3.0% 4.5% 4.0% 19.3%
East Anglia 9.8% 4.5% 3.0% 3.5% 4.5% 5.0% 22.2%
East Midlands 6.0% 3.5% 2.0% 2.5% 4.0% 4.0% 17.0%
West Midlands 6.8% 3.5% 2.0% 2.5% 4.0% 4.0% 17.0%
North East 4.4% 3.0% 2.0% 2.0% 3.0% 3.5% 14.2%
North West 3.8% 3.0% 1.5% 2.0% 3.5% 3.5% 14.2%
Yorkshire & Humber 1.5% 3.0% 2.0% 2.0% 3.5% 3.5% 14.8%
Wales 1.4% 3.0% 2.0% 2.5% 4.0% 4.0% 16.5%
Scotland 4.2% 3.5% 2.5% 3.0% 4.0% 4.0% 18.2%
Source: Knight Frank Residential Research