Embed Size (px)
Citation preview
FOCUS APPLIED TECHNOLOGIES
VEHICLE DATA LOGGER DL-5 Manual Rev. 2
16-CHANNEL DATA LOGGER WITH VARIOUS
SENSOR INTERFACE CIRCUITS
FOCUS APPLIED TECHNOLOGIES SDN. BHD. #34 Jalan Jawi Indah Sungai Jawi 14200
PENANG, MALAYSIA www.FocusAppliedTechnologies.com
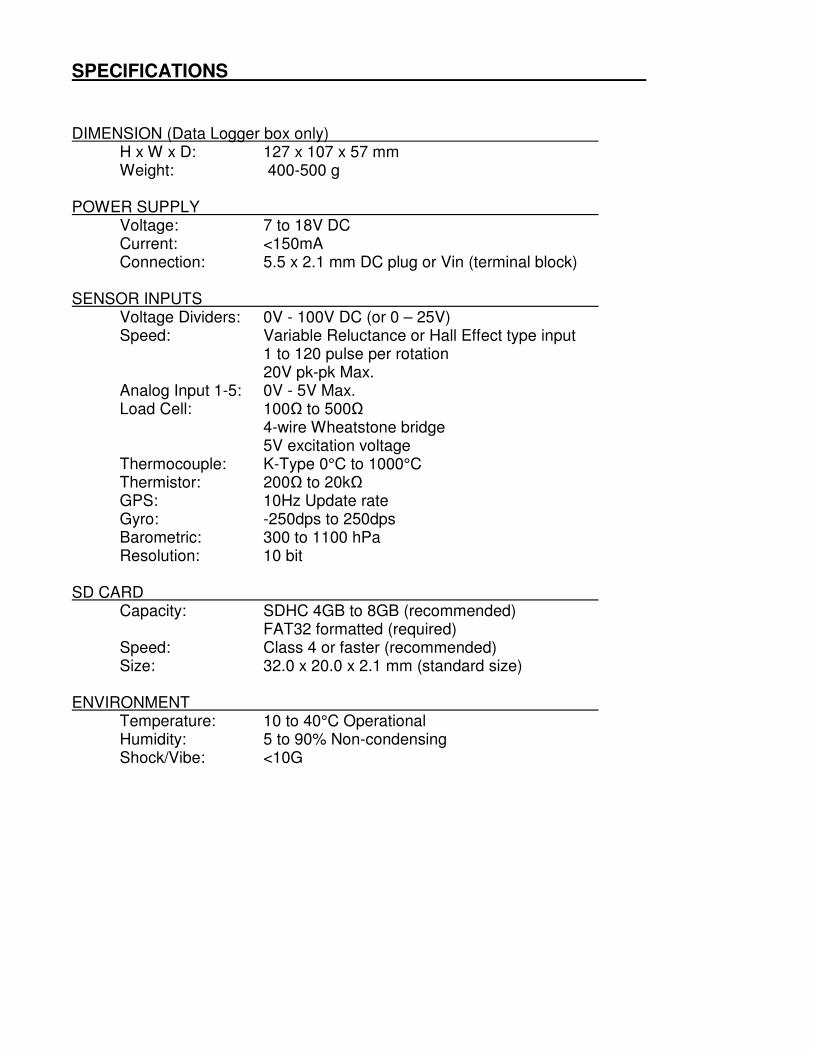
SPECIFICATIONS DIMENSION (Data Logger box only) H x W x D: 127 x 107 x 57 mm Weight: 400-500 g POWER SUPPLY Voltage: 7 to 18V DC Current: <150mA Connection: 5.5 x 2.1 mm DC plug or Vin (terminal block) SENSOR INPUTS Voltage Dividers: 0V - 100V DC (or 0 – 25V) Speed: Variable Reluctance or Hall Effect type input 1 to 120 pulse per rotation 20V pk-pk Max. Analog Input 1-5: 0V - 5V Max. Load Cell: 100Ω to 500Ω 4-wire Wheatstone bridge 5V excitation voltage Thermocouple: K-Type 0°C to 1000°C Thermistor: 200Ω to 20kΩ GPS: 10Hz Update rate Gyro: -250dps to 250dps Barometric: 300 to 1100 hPa Resolution: 10 bit SD CARD Capacity: SDHC 4GB to 8GB (recommended) FAT32 formatted (required) Speed: Class 4 or faster (recommended) Size: 32.0 x 20.0 x 2.1 mm (standard size) ENVIRONMENT Temperature: 10 to 40°C Operational Humidity: 5 to 90% Non-condensing Shock/Vibe: <10G
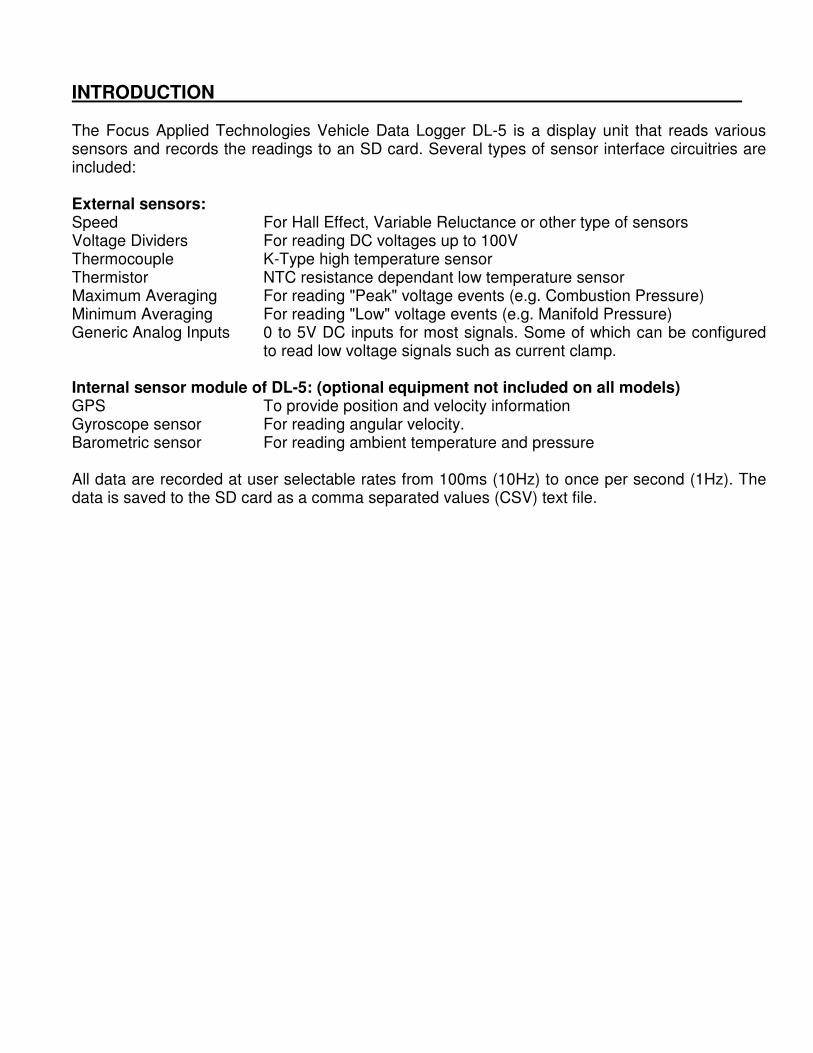
INTRODUCTION The Focus Applied Technologies Vehicle Data Logger DL-5 is a display unit that reads various sensors and records the readings to an SD card. Several types of sensor interface circuitries are included: External sensors: Speed For Hall Effect, Variable Reluctance or other type of sensors Voltage Dividers For reading DC voltages up to 100V Thermocouple K-Type high temperature sensor Thermistor NTC resistance dependant low temperature sensor Maximum Averaging For reading "Peak" voltage events (e.g. Combustion Pressure) Minimum Averaging For reading "Low" voltage events (e.g. Manifold Pressure) Generic Analog Inputs 0 to 5V DC inputs for most signals. Some of which can be configured to read low voltage signals such as current clamp. Internal sensor module of DL-5: (optional equipment not included on all models) GPS To provide position and velocity information Gyroscope sensor For reading angular velocity. Barometric sensor For reading ambient temperature and pressure All data are recorded at user selectable rates from 100ms (10Hz) to once per second (1Hz). The data is saved to the SD card as a comma separated values (CSV) text file.
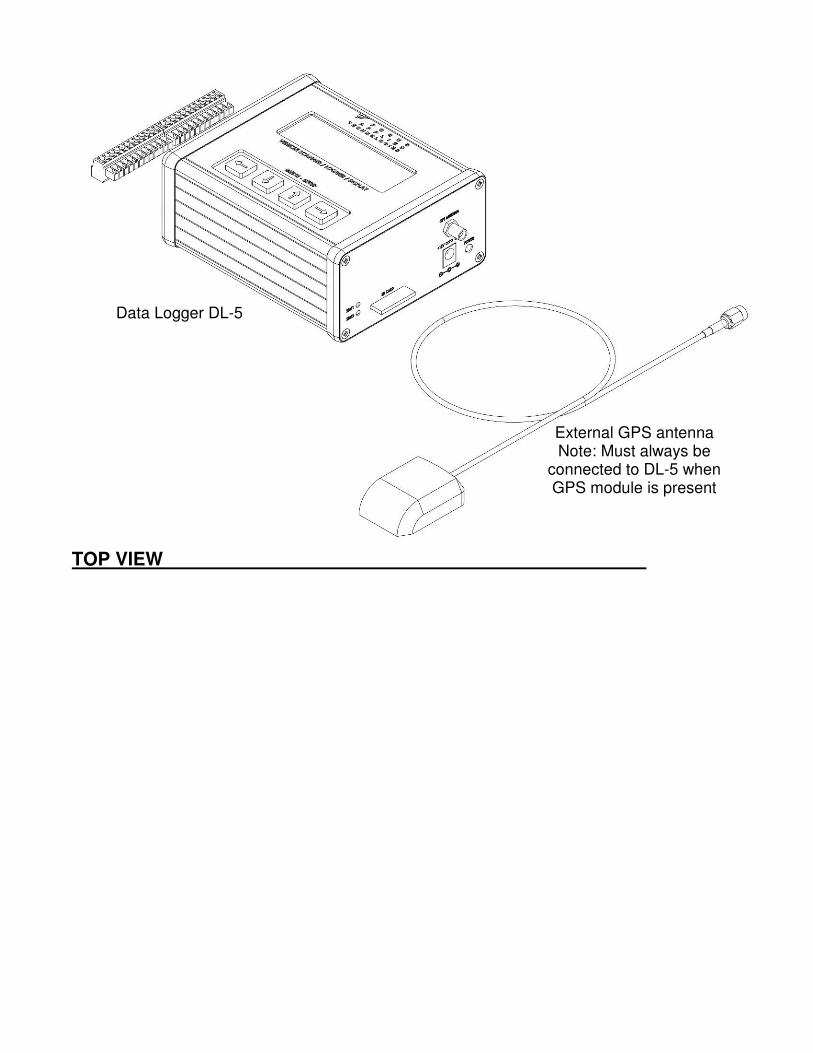
TOP VIEW
Data Logger DL-5
External GPS antenna Note: Must always be
connected to DL-5 when GPS module is present
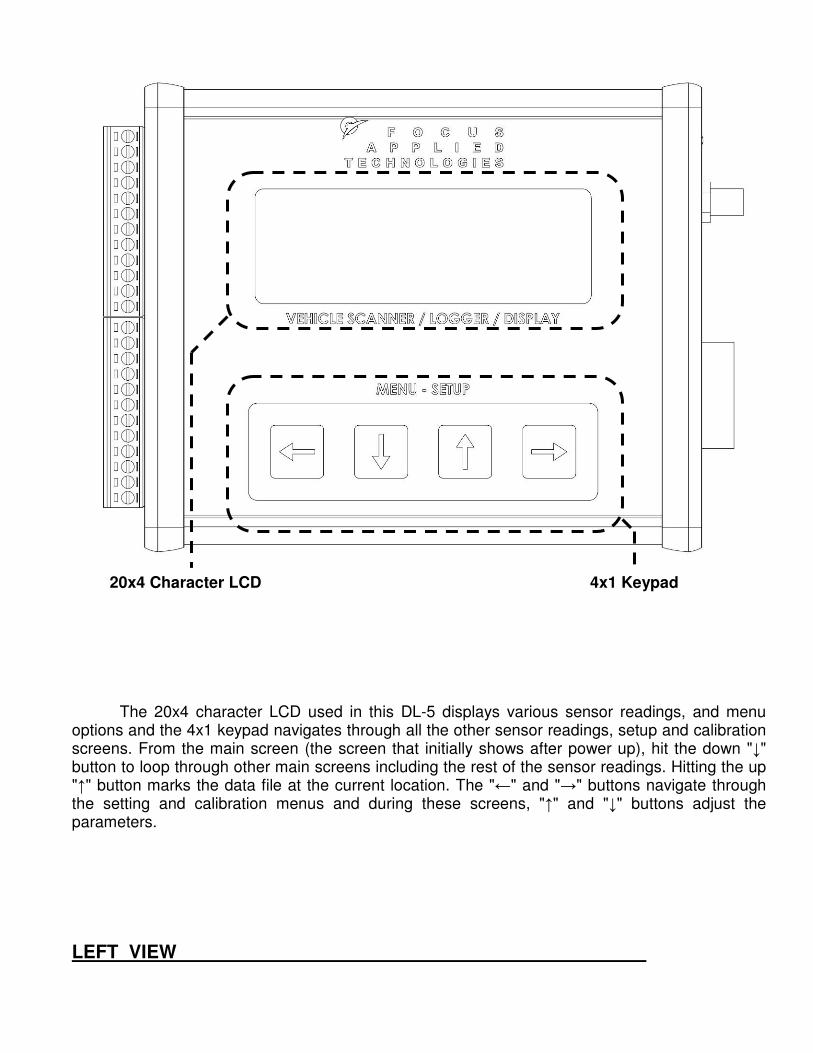
The 20x4 character LCD used in this DL-5 displays various sensor readings, and menu options and the 4x1 keypad navigates through all the other sensor readings, setup and calibration screens. From the main screen (the screen that initially shows after power up), hit the down "↓" button to loop through other main screens including the rest of the sensor readings. Hitting the up "↑" button marks the data file at the current location. The "←" and "→" buttons navigate through the setting and calibration menus and during these screens, "↑" and "↓" buttons adjust the parameters.
LEFT VIEW
4x1 Keypad 20x4 Character LCD
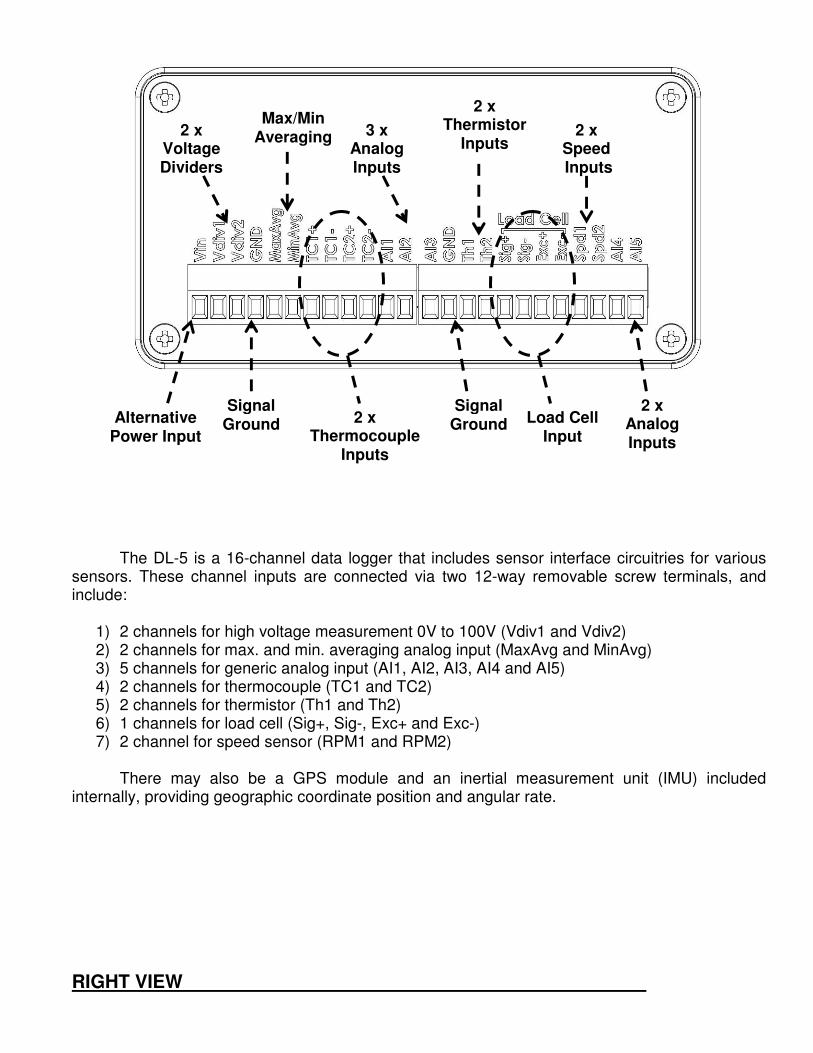
The DL-5 is a 16-channel data logger that includes sensor interface circuitries for various sensors. These channel inputs are connected via two 12-way removable screw terminals, and include:
1) 2 channels for high voltage measurement 0V to 100V (Vdiv1 and Vdiv2) 2) 2 channels for max. and min. averaging analog input (MaxAvg and MinAvg) 3) 5 channels for generic analog input (AI1, AI2, AI3, AI4 and AI5) 4) 2 channels for thermocouple (TC1 and TC2) 5) 2 channels for thermistor (Th1 and Th2) 6) 1 channels for load cell (Sig+, Sig-, Exc+ and Exc-) 7) 2 channel for speed sensor (RPM1 and RPM2)
There may also be a GPS module and an inertial measurement unit (IMU) included internally, providing geographic coordinate position and angular rate.
RIGHT VIEW
2 x Voltage Dividers
2 x Thermocouple
Inputs
Max/Min Averaging
Load Cell Input
2 x Speed Inputs
2 x Thermistor
Inputs 3 x
Analog Inputs
Signal Ground
Signal Ground Alternative
Power Input
2 x Analog Inputs
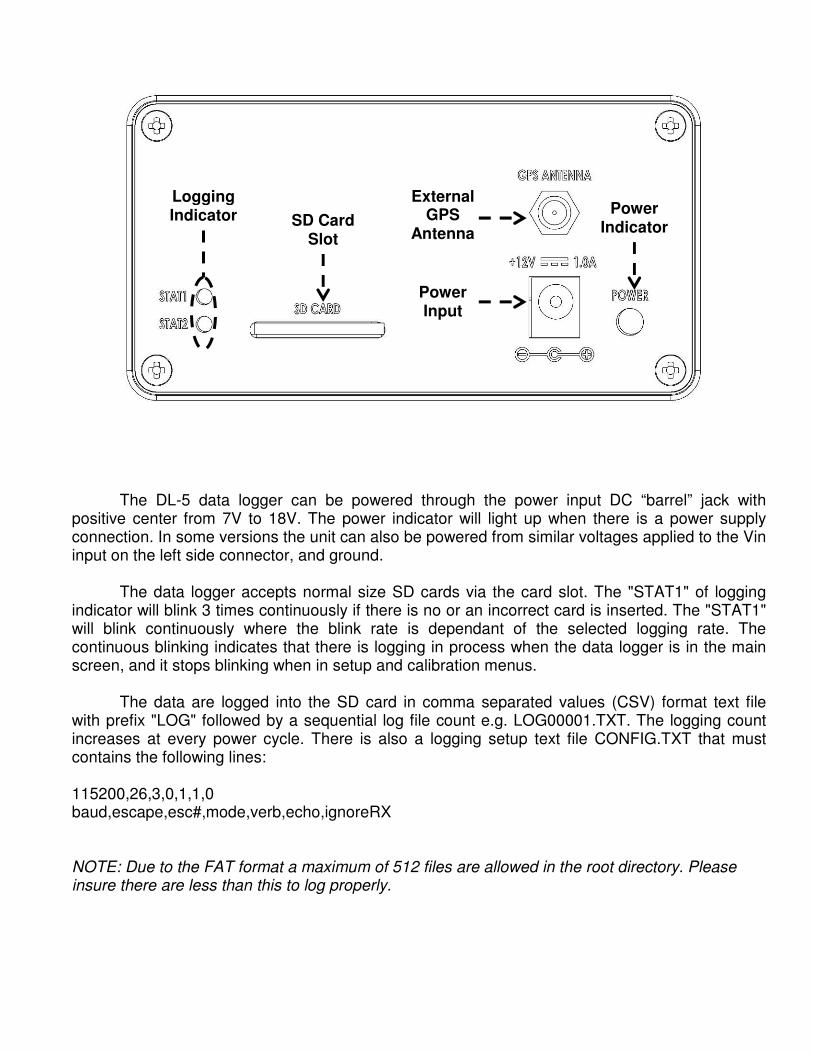
The DL-5 data logger can be powered through the power input DC “barrel” jack with positive center from 7V to 18V. The power indicator will light up when there is a power supply connection. In some versions the unit can also be powered from similar voltages applied to the Vin input on the left side connector, and ground. The data logger accepts normal size SD cards via the card slot. The "STAT1" of logging indicator will blink 3 times continuously if there is no or an incorrect card is inserted. The "STAT1" will blink continuously where the blink rate is dependant of the selected logging rate. The continuous blinking indicates that there is logging in process when the data logger is in the main screen, and it stops blinking when in setup and calibration menus. The data are logged into the SD card in comma separated values (CSV) format text file with prefix "LOG" followed by a sequential log file count e.g. LOG00001.TXT. The logging count increases at every power cycle. There is also a logging setup text file CONFIG.TXT that must contains the following lines: 115200,26,3,0,1,1,0 baud,escape,esc#,mode,verb,echo,ignoreRX
NOTE: Due to the FAT format a maximum of 512 files are allowed in the root directory. Please insure there are less than this to log properly.
Logging Indicator SD Card
Slot
External GPS
Antenna
Power Indicator
Power Input
EXTERNAL WIRING DIAGRAM
Speed
Speed
TC +
TC -
GND
Thermistor
Exc+
Exc -
Load Cell Sig +Sig -
VD,
Mx/Mn or
A1-A5
..
..
Variable Reluctance Sensor
+
Hall Effect Sensor
External Power, or Exc + (from Load Cell Amp)
..
..
Thermo Couple
Thermistor
Grounding is required for any Analog Input
Sensor
or Device..
DAQ Unit
Load Cell
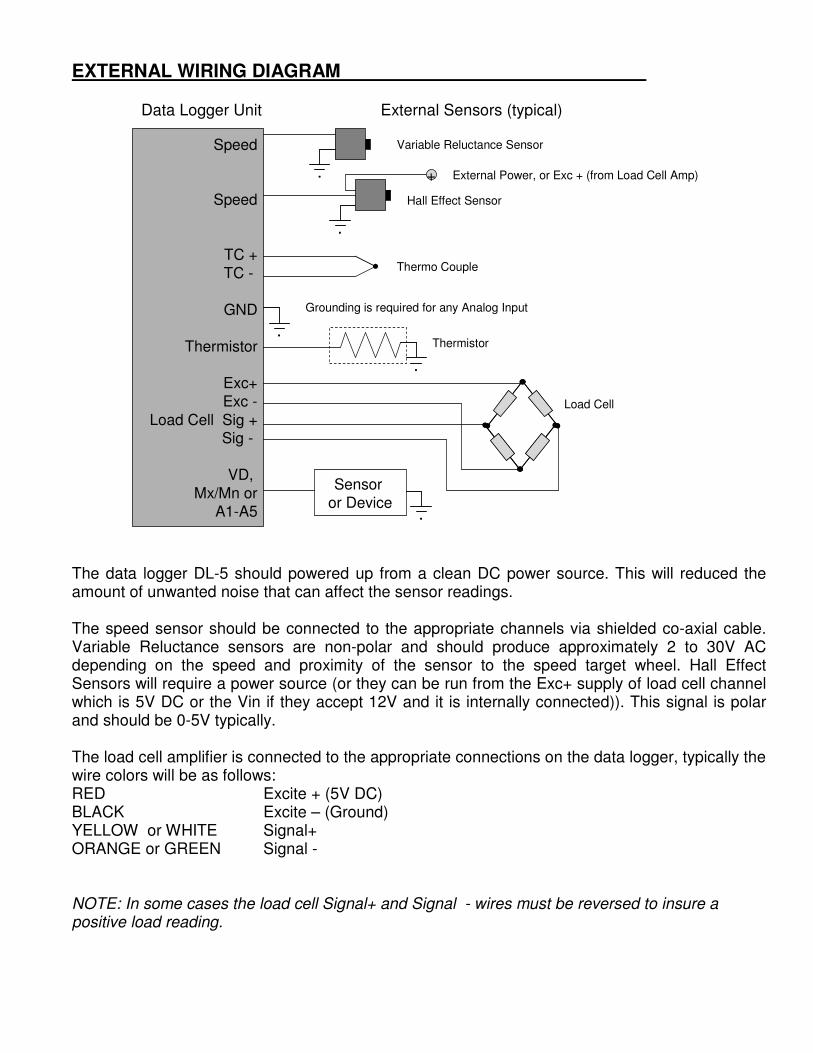
The data logger DL-5 should powered up from a clean DC power source. This will reduced the amount of unwanted noise that can affect the sensor readings. The speed sensor should be connected to the appropriate channels via shielded co-axial cable. Variable Reluctance sensors are non-polar and should produce approximately 2 to 30V AC depending on the speed and proximity of the sensor to the speed target wheel. Hall Effect Sensors will require a power source (or they can be run from the Exc+ supply of load cell channel which is 5V DC or the Vin if they accept 12V and it is internally connected)). This signal is polar and should be 0-5V typically. The load cell amplifier is connected to the appropriate connections on the data logger, typically the wire colors will be as follows: RED Excite + (5V DC) BLACK Excite – (Ground) YELLOW or WHITE Signal+ ORANGE or GREEN Signal -
NOTE: In some cases the load cell Signal+ and Signal - wires must be reversed to insure a positive load reading.
Data Logger Unit External Sensors (typical)
MAIN SCREENS
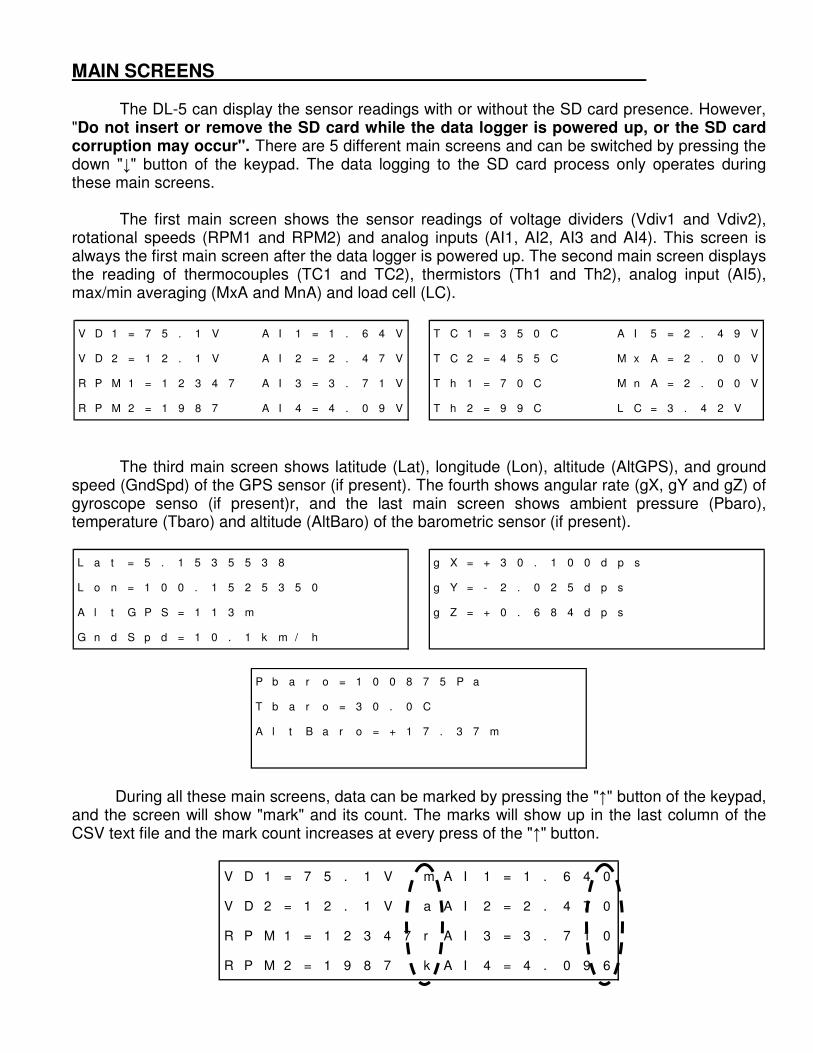
The DL-5 can display the sensor readings with or without the SD card presence. However, "Do not insert or remove the SD card while the data logger is powered up, or the SD card corruption may occur". There are 5 different main screens and can be switched by pressing the down "↓" button of the keypad. The data logging to the SD card process only operates during these main screens. The first main screen shows the sensor readings of voltage dividers (Vdiv1 and Vdiv2), rotational speeds (RPM1 and RPM2) and analog inputs (AI1, AI2, AI3 and AI4). This screen is always the first main screen after the data logger is powered up. The second main screen displays the reading of thermocouples (TC1 and TC2), thermistors (Th1 and Th2), analog input (AI5), max/min averaging (MxA and MnA) and load cell (LC).
V D 1 = 7 5 . 1 V A I 1 = 1 . 6 4 V
V D 2 = 1 2 . 1 V A I 2 = 2 . 4 7 V
R P M 1 = 1 2 3 4 7 A I 3 = 3 . 7 1 V
R P M 2 = 1 9 8 7 A I 4 = 4 . 0 9 V
T C 1 = 3 5 0 C A I 5 = 2 . 4 9 V
T C 2 = 4 5 5 C M x A = 2 . 0 0 V
T h 1 = 7 0 C M n A = 2 . 0 0 V
T h 2 = 9 9 C L C = 3 . 4 2 V
The third main screen shows latitude (Lat), longitude (Lon), altitude (AltGPS), and ground speed (GndSpd) of the GPS sensor (if present). The fourth shows angular rate (gX, gY and gZ) of gyroscope senso (if present)r, and the last main screen shows ambient pressure (Pbaro), temperature (Tbaro) and altitude (AltBaro) of the barometric sensor (if present).
L a t = 5 . 1 5 3 5 5 3 8
L o n = 1 0 0 . 1 5 2 5 3 5 0
A l t G P S = 1 1 3 m
G n d S p d = 1 0 . 1 k m / h
g X = + 3 0 . 1 0 0 d p s
g Y = - 2 . 0 2 5 d p s
g Z = + 0 . 6 8 4 d p s
P b a r o = 1 0 0 8 7 5 P a
T b a r o = 3 0 . 0 C
A l t B a r o = + 1 7 . 3 7 m
During all these main screens, data can be marked by pressing the "↑" button of the keypad, and the screen will show "mark" and its count. The marks will show up in the last column of the CSV text file and the mark count increases at every press of the "↑" button.
V D 1 = 7 5 . 1 V m A I 1 = 1 . 6 4 0
V D 2 = 1 2 . 1 V a A I 2 = 2 . 4 7 0
R P M 1 = 1 2 3 4 7 r A I 3 = 3 . 7 1 0
R P M 2 = 1 9 8 7 k A I 4 = 4 . 0 9 6
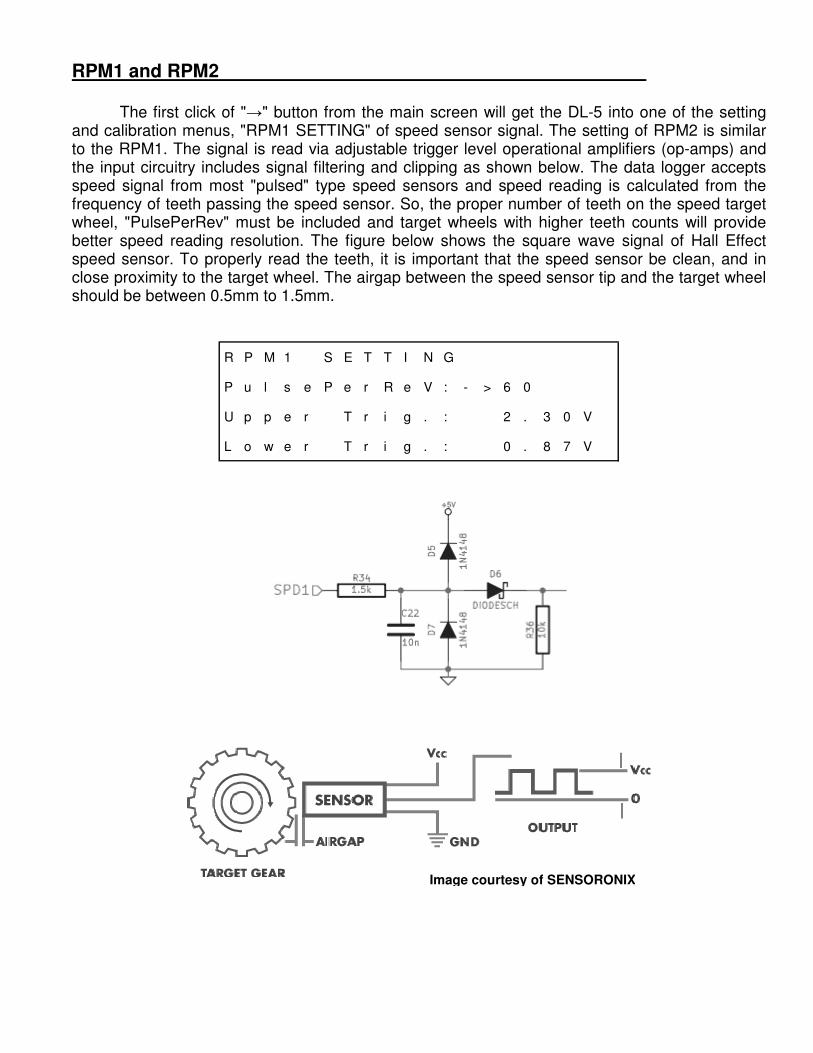
RPM1 and RPM2 The first click of "→" button from the main screen will get the DL-5 into one of the setting and calibration menus, "RPM1 SETTING" of speed sensor signal. The setting of RPM2 is similar to the RPM1. The signal is read via adjustable trigger level operational amplifiers (op-amps) and the input circuitry includes signal filtering and clipping as shown below. The data logger accepts speed signal from most "pulsed" type speed sensors and speed reading is calculated from the frequency of teeth passing the speed sensor. So, the proper number of teeth on the speed target wheel, "PulsePerRev" must be included and target wheels with higher teeth counts will provide better speed reading resolution. The figure below shows the square wave signal of Hall Effect speed sensor. To properly read the teeth, it is important that the speed sensor be clean, and in close proximity to the target wheel. The airgap between the speed sensor tip and the target wheel should be between 0.5mm to 1.5mm.
R P M 1 S E T T I N G
P u l s e P e r R e V : - > 6 0
U p p e r T r i g . : 2 . 3 0 V
L o w e r T r i g . : 0 . 8 7 V
Image courtesy of SENSORONIX
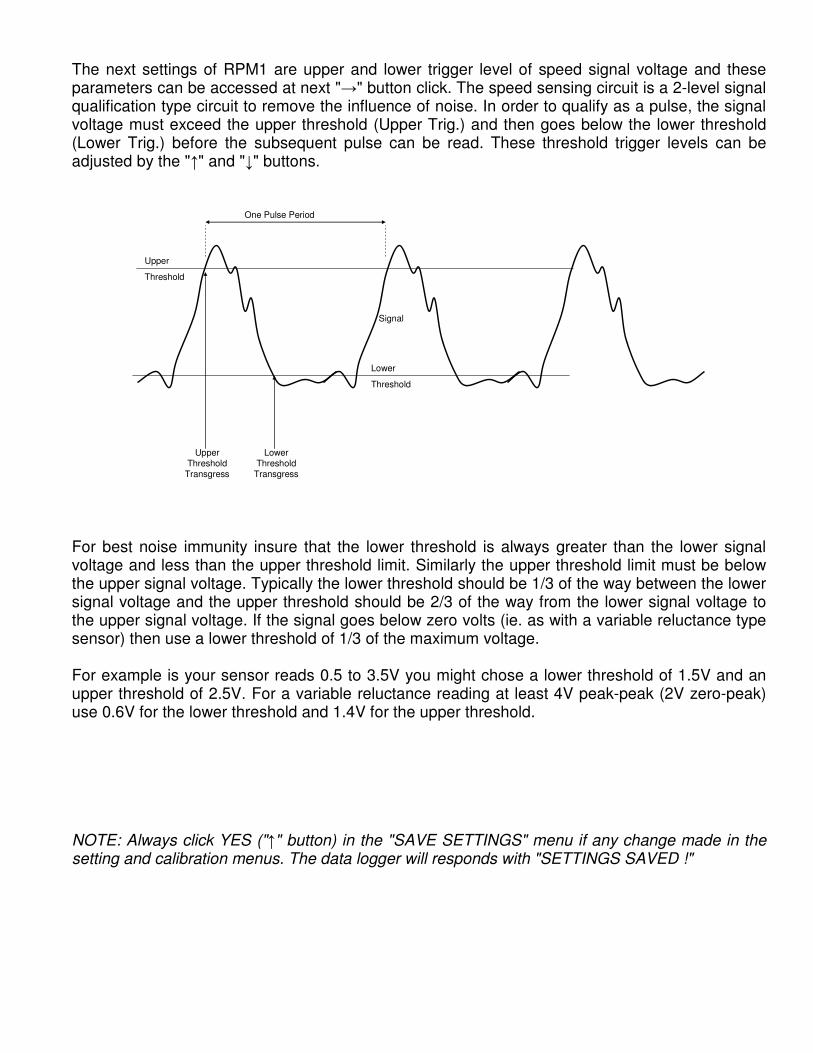
The next settings of RPM1 are upper and lower trigger level of speed signal voltage and these parameters can be accessed at next "→" button click. The speed sensing circuit is a 2-level signal qualification type circuit to remove the influence of noise. In order to qualify as a pulse, the signal voltage must exceed the upper threshold (Upper Trig.) and then goes below the lower threshold (Lower Trig.) before the subsequent pulse can be read. These threshold trigger levels can be adjusted by the "↑" and "↓" buttons.
One Pulse Period
Upper Threshold
Transgress
Lower Threshold
Transgress
Signal
Upper
Threshold
Lower
Threshold
For best noise immunity insure that the lower threshold is always greater than the lower signal voltage and less than the upper threshold limit. Similarly the upper threshold limit must be below the upper signal voltage. Typically the lower threshold should be 1/3 of the way between the lower signal voltage and the upper threshold should be 2/3 of the way from the lower signal voltage to the upper signal voltage. If the signal goes below zero volts (ie. as with a variable reluctance type sensor) then use a lower threshold of 1/3 of the maximum voltage. For example is your sensor reads 0.5 to 3.5V you might chose a lower threshold of 1.5V and an upper threshold of 2.5V. For a variable reluctance reading at least 4V peak-peak (2V zero-peak) use 0.6V for the lower threshold and 1.4V for the upper threshold. NOTE: Always click YES ("↑" button) in the "SAVE SETTINGS" menu if any change made in the setting and calibration menus. The data logger will responds with "SETTINGS SAVED !"
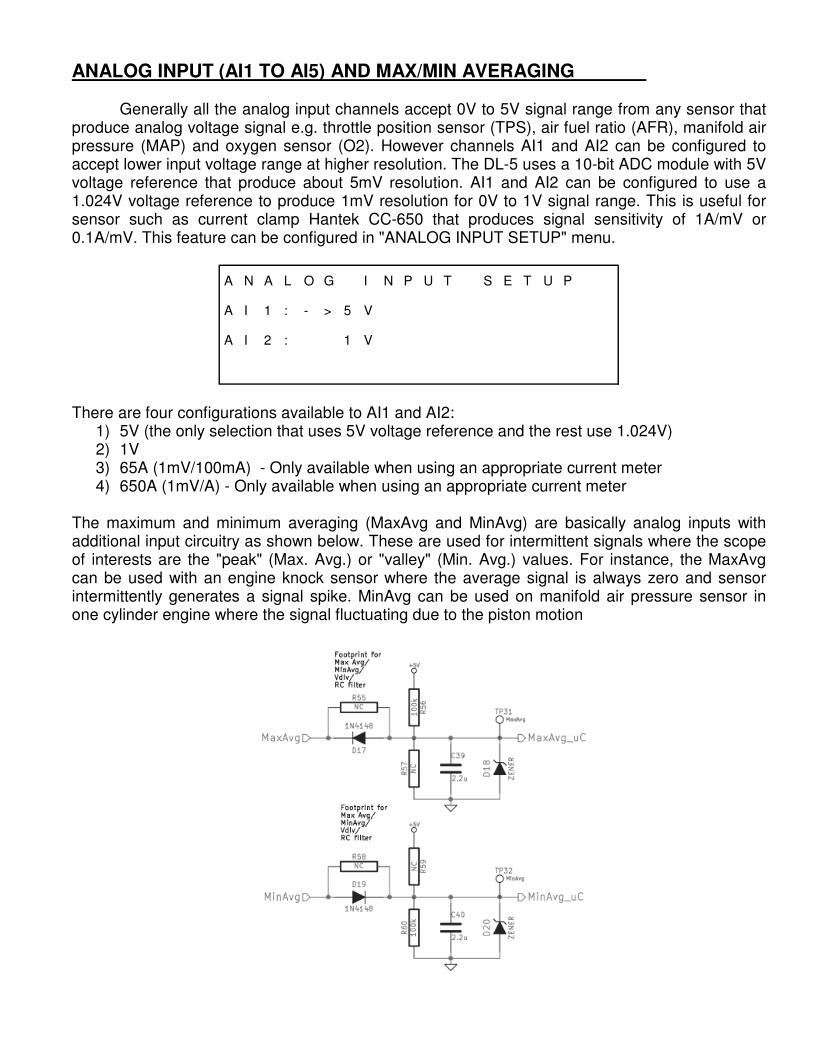
ANALOG INPUT (AI1 TO AI5) AND MAX/MIN AVERAGING Generally all the analog input channels accept 0V to 5V signal range from any sensor that produce analog voltage signal e.g. throttle position sensor (TPS), air fuel ratio (AFR), manifold air pressure (MAP) and oxygen sensor (O2). However channels AI1 and AI2 can be configured to accept lower input voltage range at higher resolution. The DL-5 uses a 10-bit ADC module with 5V voltage reference that produce about 5mV resolution. AI1 and AI2 can be configured to use a 1.024V voltage reference to produce 1mV resolution for 0V to 1V signal range. This is useful for sensor such as current clamp Hantek CC-650 that produces signal sensitivity of 1A/mV or 0.1A/mV. This feature can be configured in "ANALOG INPUT SETUP" menu.
A N A L O G I N P U T S E T U P
A I 1 : - > 5 V
A I 2 : 1 V
There are four configurations available to AI1 and AI2: 1) 5V (the only selection that uses 5V voltage reference and the rest use 1.024V) 2) 1V 3) 65A (1mV/100mA) - Only available when using an appropriate current meter 4) 650A (1mV/A) - Only available when using an appropriate current meter
The maximum and minimum averaging (MaxAvg and MinAvg) are basically analog inputs with additional input circuitry as shown below. These are used for intermittent signals where the scope of interests are the "peak" (Max. Avg.) or "valley" (Min. Avg.) values. For instance, the MaxAvg can be used with an engine knock sensor where the average signal is always zero and sensor intermittently generates a signal spike. MinAvg can be used on manifold air pressure sensor in one cylinder engine where the signal fluctuating due to the piston motion
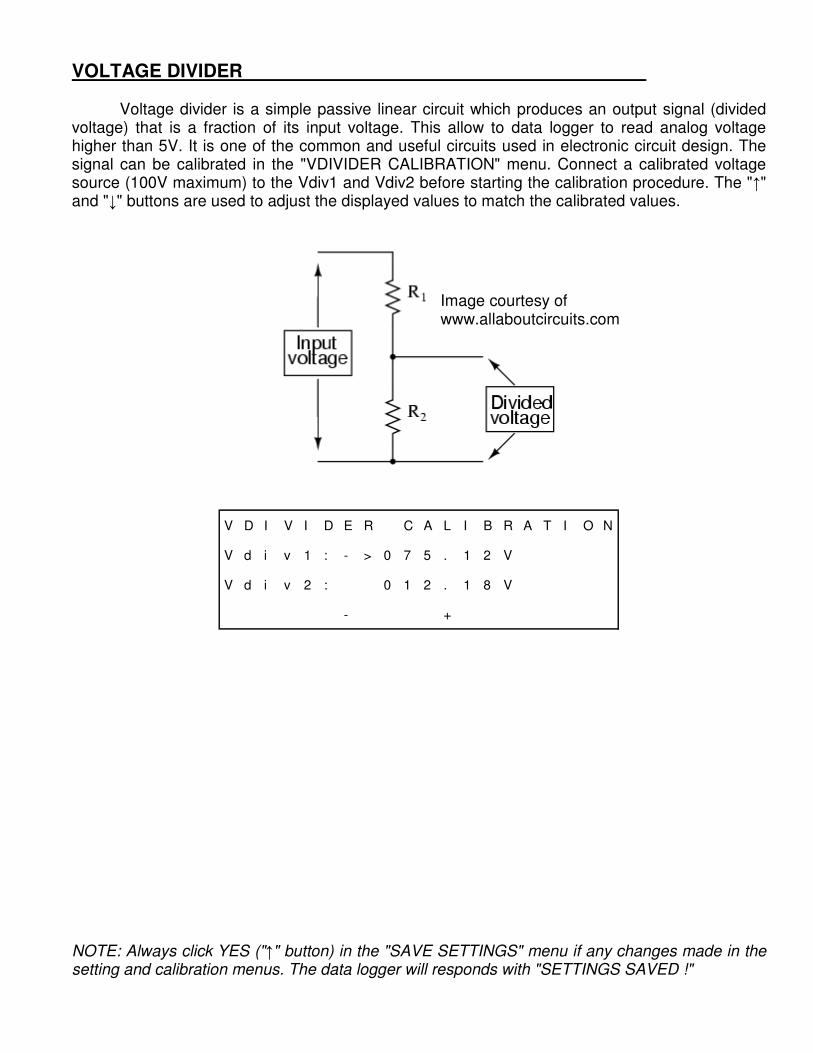
VOLTAGE DIVIDER Voltage divider is a simple passive linear circuit which produces an output signal (divided voltage) that is a fraction of its input voltage. This allow to data logger to read analog voltage higher than 5V. It is one of the common and useful circuits used in electronic circuit design. The signal can be calibrated in the "VDIVIDER CALIBRATION" menu. Connect a calibrated voltage source (100V maximum) to the Vdiv1 and Vdiv2 before starting the calibration procedure. The "↑" and "↓" buttons are used to adjust the displayed values to match the calibrated values.
V D I V I D E R C A L I B R A T I O N
V d i v 1 : - > 0 7 5 . 1 2 V
V d i v 2 : 0 1 2 . 1 8 V
- +
NOTE: Always click YES ("↑" button) in the "SAVE SETTINGS" menu if any changes made in the setting and calibration menus. The data logger will responds with "SETTINGS SAVED !"
Image courtesy of www.allaboutcircuits.com
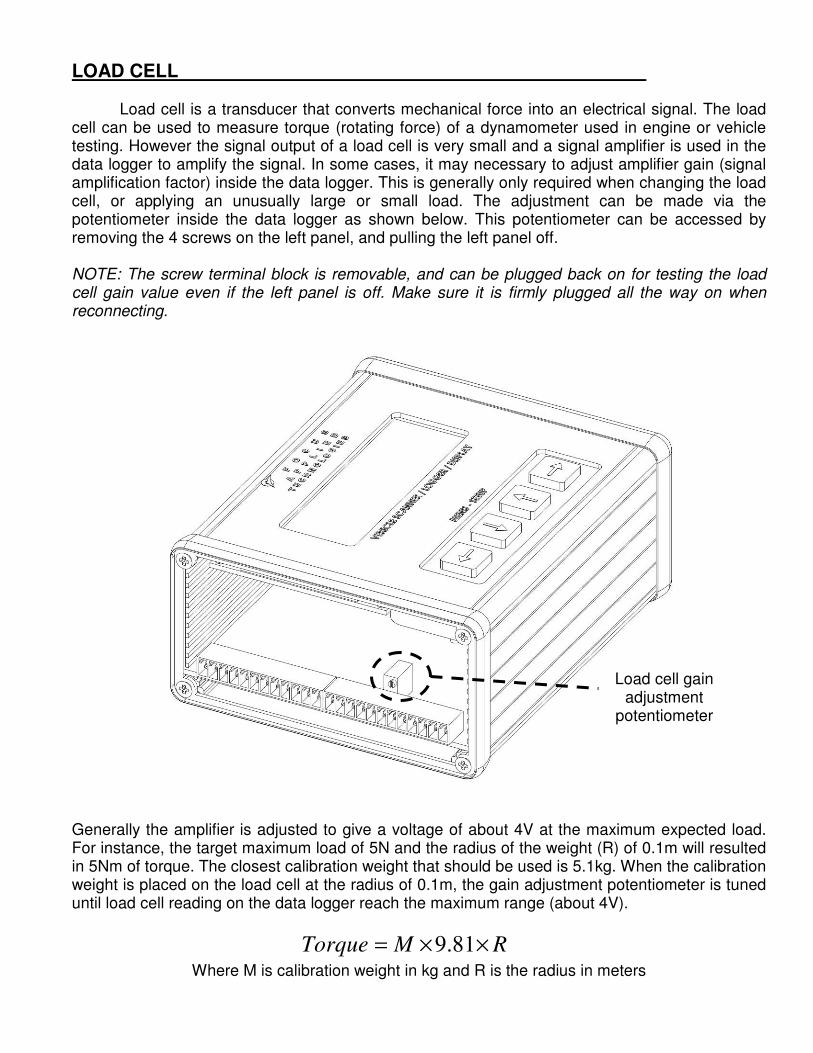
LOAD CELL Load cell is a transducer that converts mechanical force into an electrical signal. The load cell can be used to measure torque (rotating force) of a dynamometer used in engine or vehicle testing. However the signal output of a load cell is very small and a signal amplifier is used in the data logger to amplify the signal. In some cases, it may necessary to adjust amplifier gain (signal amplification factor) inside the data logger. This is generally only required when changing the load cell, or applying an unusually large or small load. The adjustment can be made via the potentiometer inside the data logger as shown below. This potentiometer can be accessed by removing the 4 screws on the left panel, and pulling the left panel off. NOTE: The screw terminal block is removable, and can be plugged back on for testing the load cell gain value even if the left panel is off. Make sure it is firmly plugged all the way on when reconnecting.
Generally the amplifier is adjusted to give a voltage of about 4V at the maximum expected load. For instance, the target maximum load of 5N and the radius of the weight (R) of 0.1m will resulted in 5Nm of torque. The closest calibration weight that should be used is 5.1kg. When the calibration weight is placed on the load cell at the radius of 0.1m, the gain adjustment potentiometer is tuned until load cell reading on the data logger reach the maximum range (about 4V).
RMTorque ××= 81.9
Where M is calibration weight in kg and R is the radius in meters
Load cell gain adjustment
potentiometer
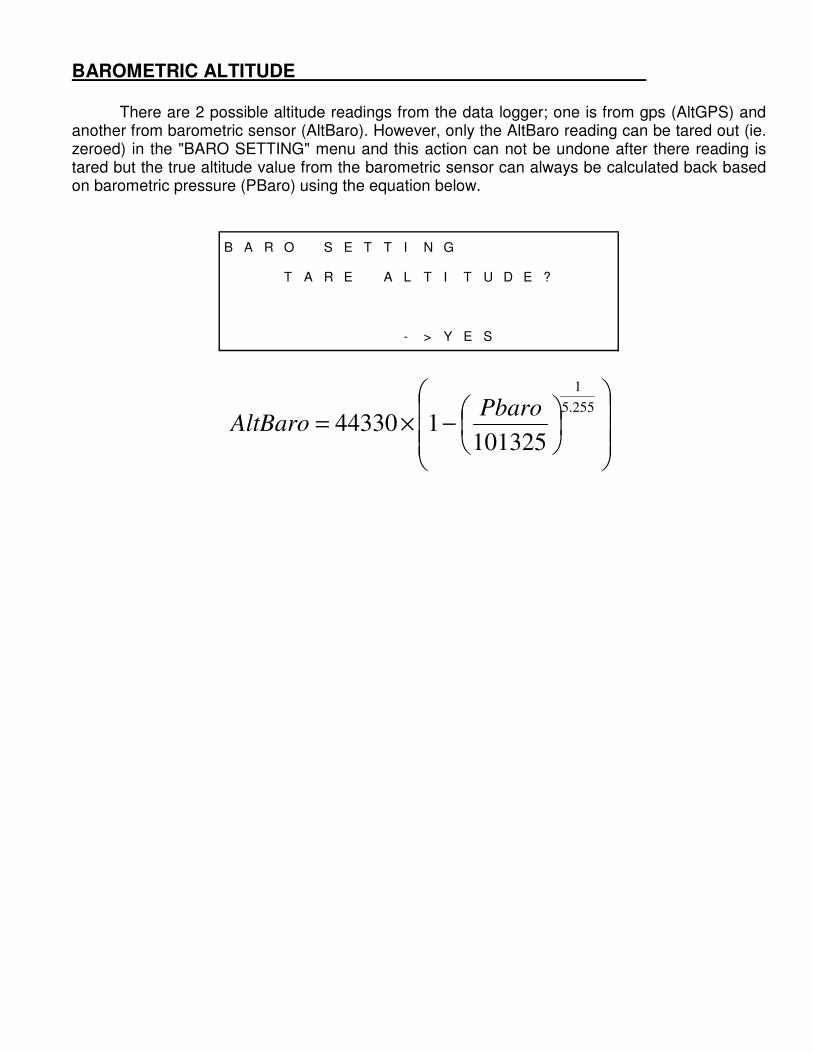
BAROMETRIC ALTITUDE There are 2 possible altitude readings from the data logger; one is from gps (AltGPS) and another from barometric sensor (AltBaro). However, only the AltBaro reading can be tared out (ie. zeroed) in the "BARO SETTING" menu and this action can not be undone after there reading is tared but the true altitude value from the barometric sensor can always be calculated back based on barometric pressure (PBaro) using the equation below.
B A R O S E T T I N G
T A R E A L T I T U D E ?
- > Y E S
−×=
255.5
1
101325144330
PbaroAltBaro
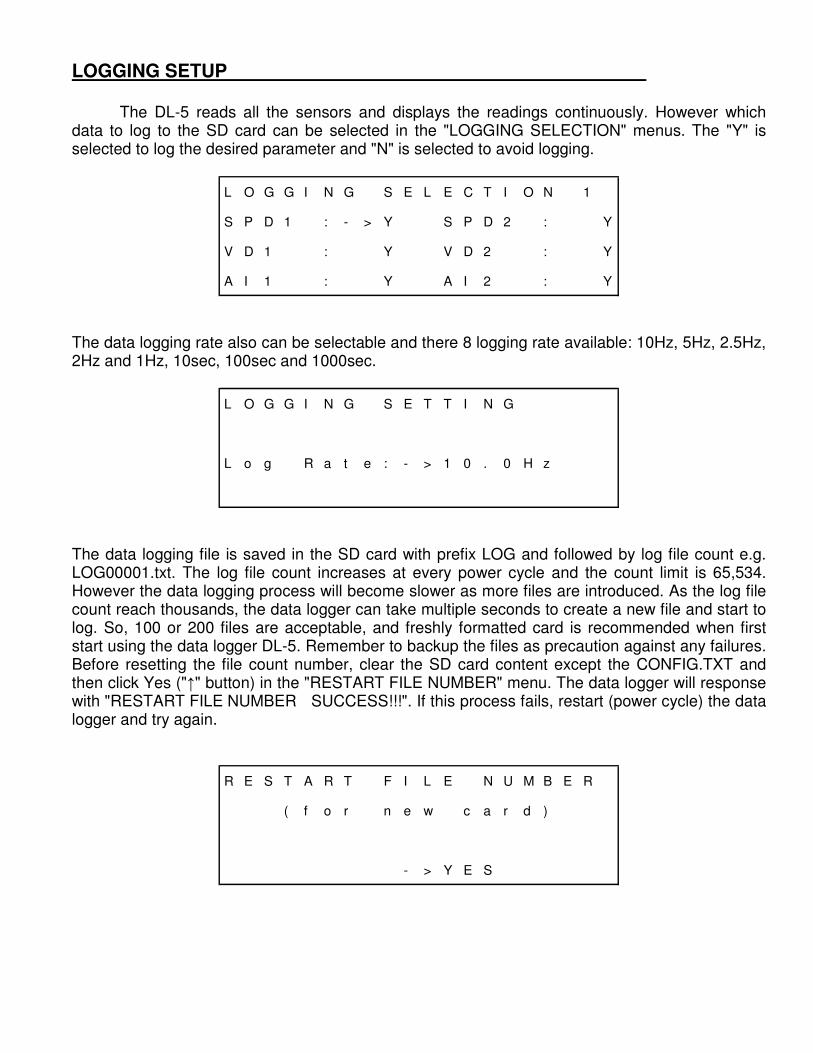
LOGGING SETUP The DL-5 reads all the sensors and displays the readings continuously. However which data to log to the SD card can be selected in the "LOGGING SELECTION" menus. The "Y" is selected to log the desired parameter and "N" is selected to avoid logging.
L O G G I N G S E L E C T I O N 1
S P D 1 : - > Y S P D 2 : Y
V D 1 : Y V D 2 : Y
A I 1 : Y A I 2 : Y
The data logging rate also can be selectable and there 8 logging rate available: 10Hz, 5Hz, 2.5Hz, 2Hz and 1Hz, 10sec, 100sec and 1000sec.
L O G G I N G S E T T I N G
L o g R a t e : - > 1 0 . 0 H z
The data logging file is saved in the SD card with prefix LOG and followed by log file count e.g. LOG00001.txt. The log file count increases at every power cycle and the count limit is 65,534. However the data logging process will become slower as more files are introduced. As the log file count reach thousands, the data logger can take multiple seconds to create a new file and start to log. So, 100 or 200 files are acceptable, and freshly formatted card is recommended when first start using the data logger DL-5. Remember to backup the files as precaution against any failures. Before resetting the file count number, clear the SD card content except the CONFIG.TXT and then click Yes ("↑" button) in the "RESTART FILE NUMBER" menu. The data logger will response with "RESTART FILE NUMBER SUCCESS!!!". If this process fails, restart (power cycle) the data logger and try again.
R E S T A R T F I L E N U M B E R
( f o r n e w c a r d )
- > Y E S
For any changes made in the setting and calibration menus, always save the settings by clicking YES ("↑" button) in the "SAVE SETTINGS" menu. The data logger will responds with "SETTINGS SAVED !". If this procedure is not performed, the changes made will be lost when the data logger is powered down.
S A V E S E T T I N G S ?
- > Y E S
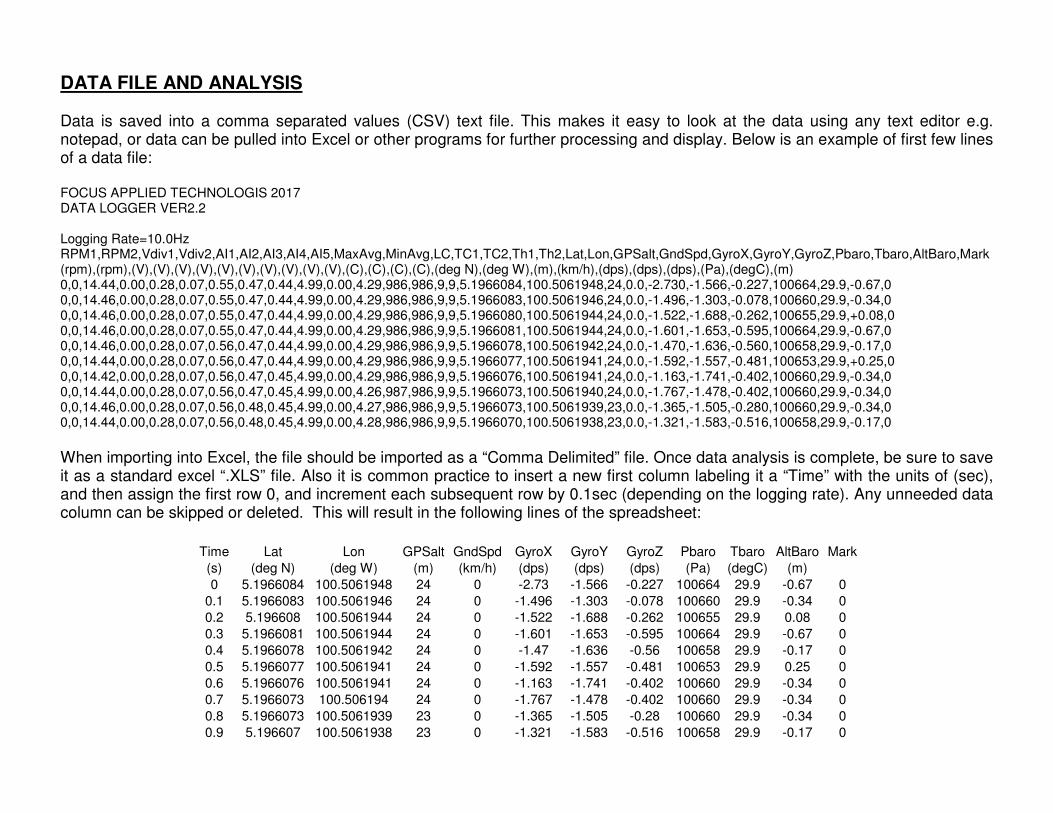
DATA FILE AND ANALYSIS Data is saved into a comma separated values (CSV) text file. This makes it easy to look at the data using any text editor e.g. notepad, or data can be pulled into Excel or other programs for further processing and display. Below is an example of first few lines of a data file: FOCUS APPLIED TECHNOLOGIS 2017 DATA LOGGER VER2.2 Logging Rate=10.0Hz RPM1,RPM2,Vdiv1,Vdiv2,AI1,AI2,AI3,AI4,AI5,MaxAvg,MinAvg,LC,TC1,TC2,Th1,Th2,Lat,Lon,GPSalt,GndSpd,GyroX,GyroY,GyroZ,Pbaro,Tbaro,AltBaro,Mark (rpm),(rpm),(V),(V),(V),(V),(V),(V),(V),(V),(V),(V),(C),(C),(C),(C),(deg N),(deg W),(m),(km/h),(dps),(dps),(dps),(Pa),(degC),(m) 0,0,14.44,0.00,0.28,0.07,0.55,0.47,0.44,4.99,0.00,4.29,986,986,9,9,5.1966084,100.5061948,24,0.0,-2.730,-1.566,-0.227,100664,29.9,-0.67,0 0,0,14.46,0.00,0.28,0.07,0.55,0.47,0.44,4.99,0.00,4.29,986,986,9,9,5.1966083,100.5061946,24,0.0,-1.496,-1.303,-0.078,100660,29.9,-0.34,0 0,0,14.46,0.00,0.28,0.07,0.55,0.47,0.44,4.99,0.00,4.29,986,986,9,9,5.1966080,100.5061944,24,0.0,-1.522,-1.688,-0.262,100655,29.9,+0.08,0 0,0,14.46,0.00,0.28,0.07,0.55,0.47,0.44,4.99,0.00,4.29,986,986,9,9,5.1966081,100.5061944,24,0.0,-1.601,-1.653,-0.595,100664,29.9,-0.67,0 0,0,14.46,0.00,0.28,0.07,0.56,0.47,0.44,4.99,0.00,4.29,986,986,9,9,5.1966078,100.5061942,24,0.0,-1.470,-1.636,-0.560,100658,29.9,-0.17,0 0,0,14.44,0.00,0.28,0.07,0.56,0.47,0.44,4.99,0.00,4.29,986,986,9,9,5.1966077,100.5061941,24,0.0,-1.592,-1.557,-0.481,100653,29.9,+0.25,0 0,0,14.42,0.00,0.28,0.07,0.56,0.47,0.45,4.99,0.00,4.29,986,986,9,9,5.1966076,100.5061941,24,0.0,-1.163,-1.741,-0.402,100660,29.9,-0.34,0 0,0,14.44,0.00,0.28,0.07,0.56,0.47,0.45,4.99,0.00,4.26,987,986,9,9,5.1966073,100.5061940,24,0.0,-1.767,-1.478,-0.402,100660,29.9,-0.34,0 0,0,14.46,0.00,0.28,0.07,0.56,0.48,0.45,4.99,0.00,4.27,986,986,9,9,5.1966073,100.5061939,23,0.0,-1.365,-1.505,-0.280,100660,29.9,-0.34,0 0,0,14.44,0.00,0.28,0.07,0.56,0.48,0.45,4.99,0.00,4.28,986,986,9,9,5.1966070,100.5061938,23,0.0,-1.321,-1.583,-0.516,100658,29.9,-0.17,0
When importing into Excel, the file should be imported as a “Comma Delimited” file. Once data analysis is complete, be sure to save it as a standard excel “.XLS” file. Also it is common practice to insert a new first column labeling it a “Time” with the units of (sec), and then assign the first row 0, and increment each subsequent row by 0.1sec (depending on the logging rate). Any unneeded data column can be skipped or deleted. This will result in the following lines of the spreadsheet:
Time Lat Lon GPSalt GndSpd GyroX GyroY GyroZ Pbaro Tbaro AltBaro Mark
(s) (deg N) (deg W) (m) (km/h) (dps) (dps) (dps) (Pa) (degC) (m)
0 5.1966084 100.5061948 24 0 -2.73 -1.566 -0.227 100664 29.9 -0.67 0
0.1 5.1966083 100.5061946 24 0 -1.496 -1.303 -0.078 100660 29.9 -0.34 0
0.2 5.196608 100.5061944 24 0 -1.522 -1.688 -0.262 100655 29.9 0.08 0
0.3 5.1966081 100.5061944 24 0 -1.601 -1.653 -0.595 100664 29.9 -0.67 0
0.4 5.1966078 100.5061942 24 0 -1.47 -1.636 -0.56 100658 29.9 -0.17 0
0.5 5.1966077 100.5061941 24 0 -1.592 -1.557 -0.481 100653 29.9 0.25 0
0.6 5.1966076 100.5061941 24 0 -1.163 -1.741 -0.402 100660 29.9 -0.34 0
0.7 5.1966073 100.506194 24 0 -1.767 -1.478 -0.402 100660 29.9 -0.34 0
0.8 5.1966073 100.5061939 23 0 -1.365 -1.505 -0.28 100660 29.9 -0.34 0
0.9 5.196607 100.5061938 23 0 -1.321 -1.583 -0.516 100658 29.9 -0.17 0
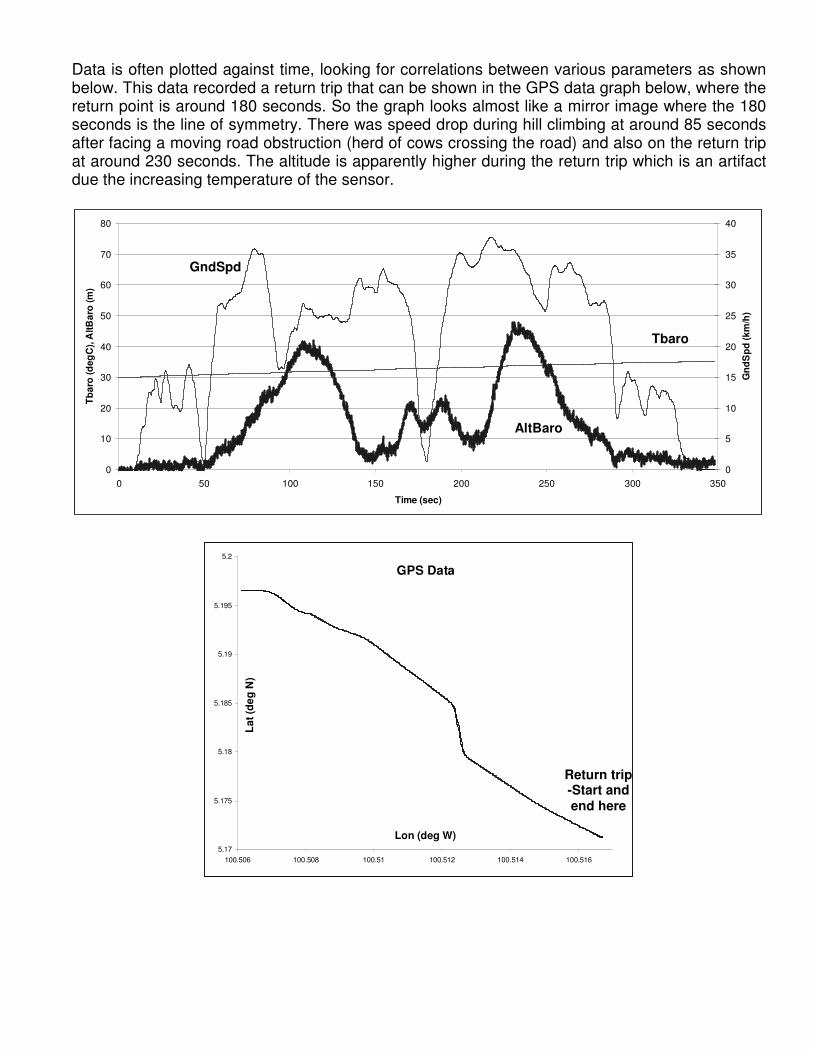
Data is often plotted against time, looking for correlations between various parameters as shown below. This data recorded a return trip that can be shown in the GPS data graph below, where the return point is around 180 seconds. So the graph looks almost like a mirror image where the 180 seconds is the line of symmetry. There was speed drop during hill climbing at around 85 seconds after facing a moving road obstruction (herd of cows crossing the road) and also on the return trip at around 230 seconds. The altitude is apparently higher during the return trip which is an artifact due the increasing temperature of the sensor.
0
10
20
30
40
50
60
70
80
0 50 100 150 200 250 300 350
Time (sec)
Tb
aro
(d
eg
C),
AltB
aro
(m
)
0
5
10
15
20
25
30
35
40
Gn
dS
pd
(km
/h)
GPS Data
5.17
5.175
5.18
5.185
5.19
5.195
5.2
100.506 100.508 100.51 100.512 100.514 100.516
Lon (deg W)
Lat
(de
g N
)
GndSpd
AltBaro
Tbaro
Return trip -Start and end here
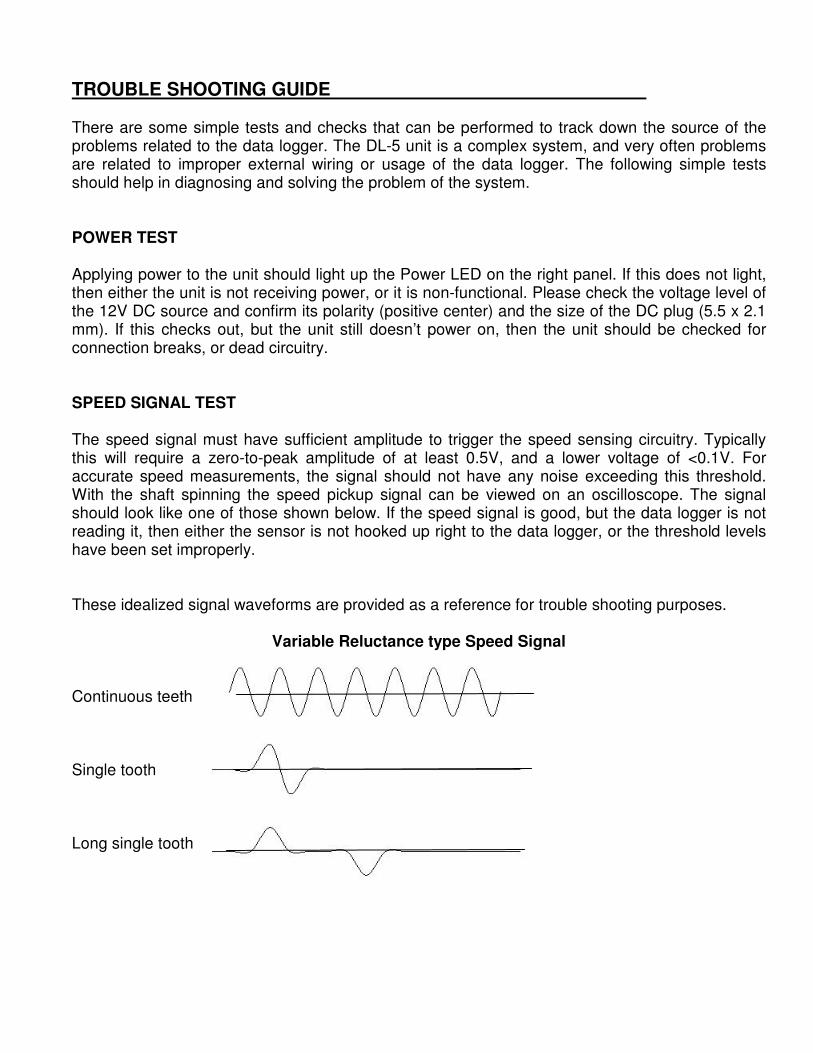
TROUBLE SHOOTING GUIDE There are some simple tests and checks that can be performed to track down the source of the problems related to the data logger. The DL-5 unit is a complex system, and very often problems are related to improper external wiring or usage of the data logger. The following simple tests should help in diagnosing and solving the problem of the system. POWER TEST Applying power to the unit should light up the Power LED on the right panel. If this does not light, then either the unit is not receiving power, or it is non-functional. Please check the voltage level of the 12V DC source and confirm its polarity (positive center) and the size of the DC plug (5.5 x 2.1 mm). If this checks out, but the unit still doesn’t power on, then the unit should be checked for connection breaks, or dead circuitry. SPEED SIGNAL TEST The speed signal must have sufficient amplitude to trigger the speed sensing circuitry. Typically this will require a zero-to-peak amplitude of at least 0.5V, and a lower voltage of <0.1V. For accurate speed measurements, the signal should not have any noise exceeding this threshold. With the shaft spinning the speed pickup signal can be viewed on an oscilloscope. The signal should look like one of those shown below. If the speed signal is good, but the data logger is not reading it, then either the sensor is not hooked up right to the data logger, or the threshold levels have been set improperly. These idealized signal waveforms are provided as a reference for trouble shooting purposes.
Variable Reluctance type Speed Signal Continuous teeth Single tooth Long single tooth
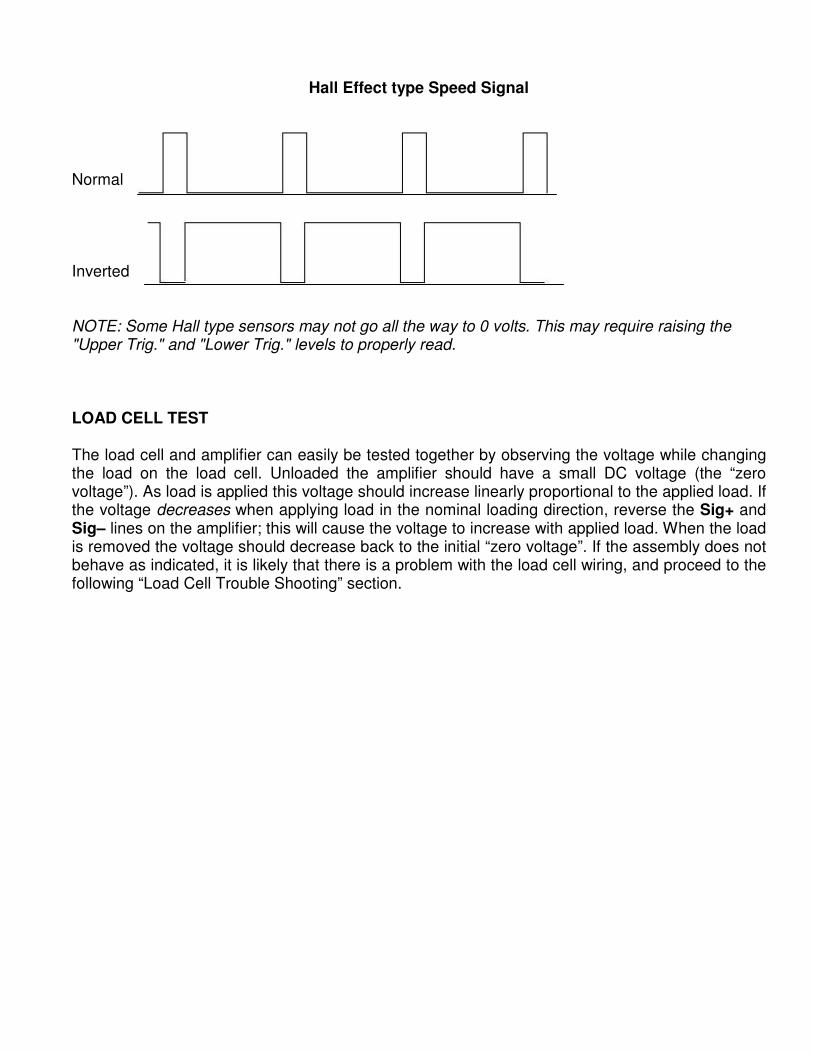
Hall Effect type Speed Signal
Normal Inverted NOTE: Some Hall type sensors may not go all the way to 0 volts. This may require raising the "Upper Trig." and "Lower Trig." levels to properly read. LOAD CELL TEST The load cell and amplifier can easily be tested together by observing the voltage while changing the load on the load cell. Unloaded the amplifier should have a small DC voltage (the “zero voltage”). As load is applied this voltage should increase linearly proportional to the applied load. If the voltage decreases when applying load in the nominal loading direction, reverse the Sig+ and Sig– lines on the amplifier; this will cause the voltage to increase with applied load. When the load is removed the voltage should decrease back to the initial “zero voltage”. If the assembly does not behave as indicated, it is likely that there is a problem with the load cell wiring, and proceed to the following “Load Cell Trouble Shooting” section.
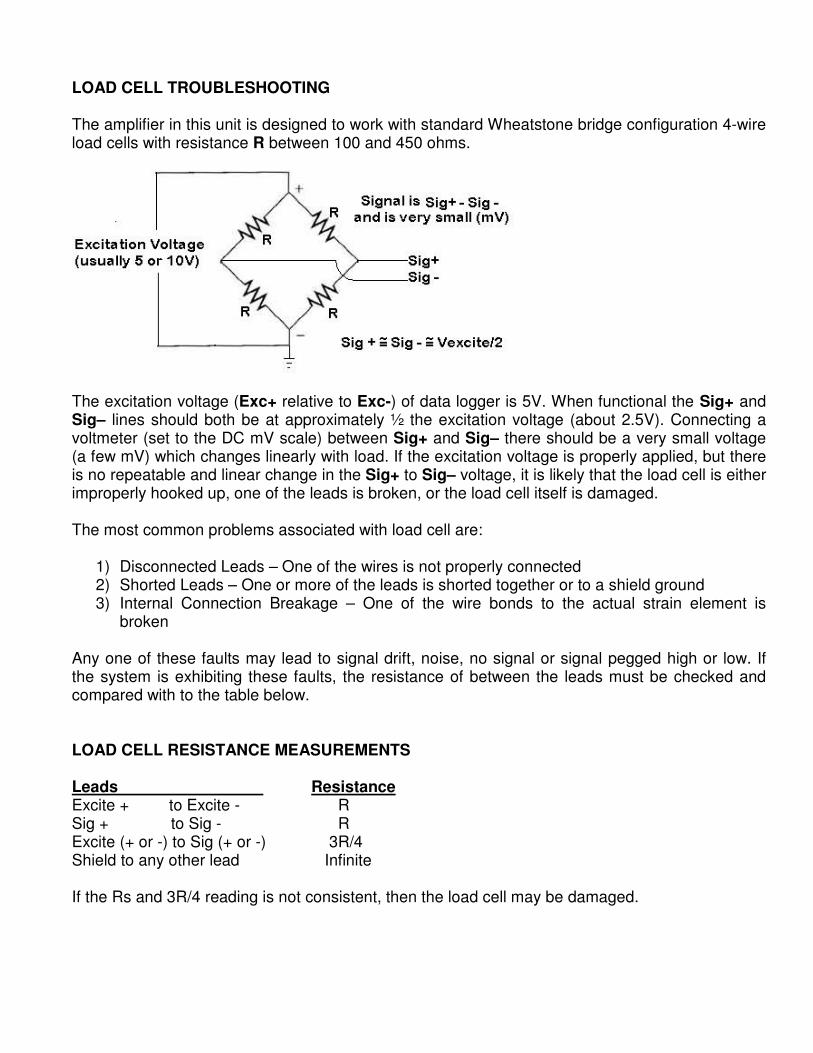
LOAD CELL TROUBLESHOOTING The amplifier in this unit is designed to work with standard Wheatstone bridge configuration 4-wire load cells with resistance R between 100 and 450 ohms.
The excitation voltage (Exc+ relative to Exc-) of data logger is 5V. When functional the Sig+ and Sig– lines should both be at approximately ½ the excitation voltage (about 2.5V). Connecting a voltmeter (set to the DC mV scale) between Sig+ and Sig– there should be a very small voltage (a few mV) which changes linearly with load. If the excitation voltage is properly applied, but there is no repeatable and linear change in the Sig+ to Sig– voltage, it is likely that the load cell is either improperly hooked up, one of the leads is broken, or the load cell itself is damaged. The most common problems associated with load cell are:
1) Disconnected Leads – One of the wires is not properly connected 2) Shorted Leads – One or more of the leads is shorted together or to a shield ground 3) Internal Connection Breakage – One of the wire bonds to the actual strain element is
broken Any one of these faults may lead to signal drift, noise, no signal or signal pegged high or low. If the system is exhibiting these faults, the resistance of between the leads must be checked and compared with to the table below. LOAD CELL RESISTANCE MEASUREMENTS Leads Resistance Excite + to Excite - R Sig + to Sig - R Excite (+ or -) to Sig (+ or -) 3R/4 Shield to any other lead Infinite If the Rs and 3R/4 reading is not consistent, then the load cell may be damaged.
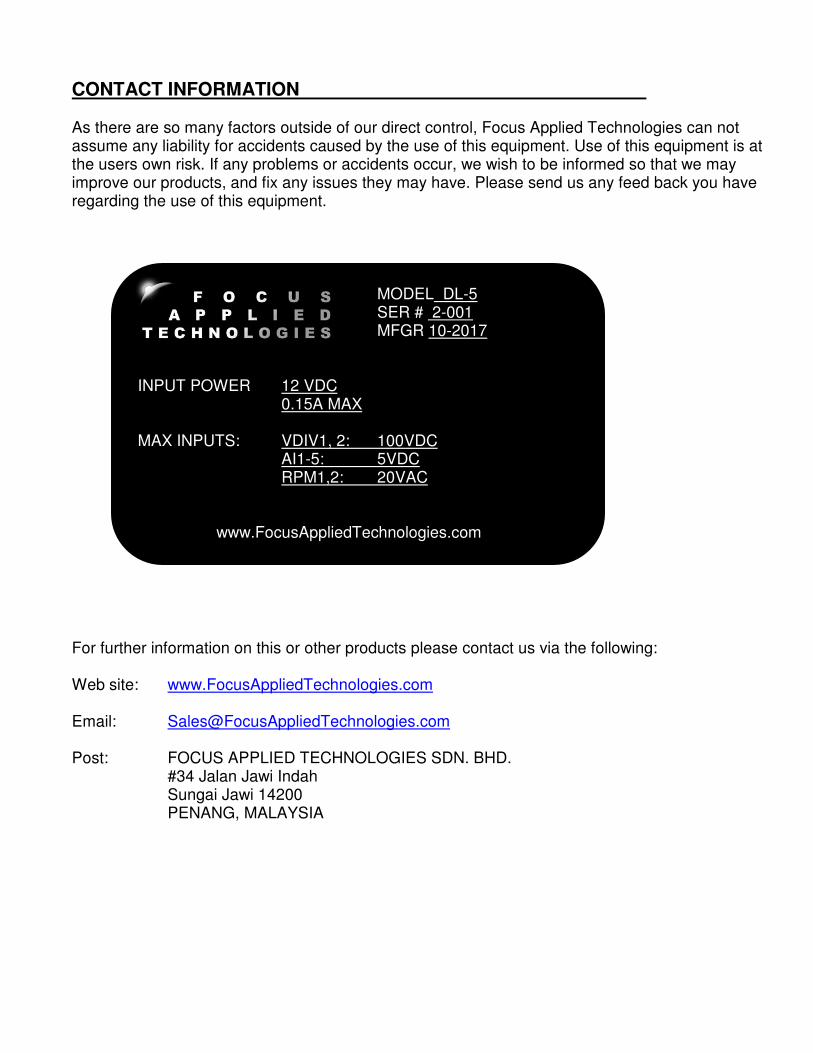
CONTACT INFORMATION As there are so many factors outside of our direct control, Focus Applied Technologies can not assume any liability for accidents caused by the use of this equipment. Use of this equipment is at the users own risk. If any problems or accidents occur, we wish to be informed so that we may improve our products, and fix any issues they may have. Please send us any feed back you have regarding the use of this equipment.
For further information on this or other products please contact us via the following: Web site: www.FocusAppliedTechnologies.com Email: [email protected] Post: FOCUS APPLIED TECHNOLOGIES SDN. BHD.
#34 Jalan Jawi Indah Sungai Jawi 14200 PENANG, MALAYSIA
* F O C U S MODEL DL-5 A P P L I E D SER # 2-001 T E C H N O L O G I E S MFGR 10-2017 INPUT POWER 12 VDC
0.15A MAX MAX INPUTS: VDIV1, 2: 100VDC
AI1-5: 5VDC RPM1,2: 20VAC
www.FocusAppliedTechnologies.com