Embed Size (px)
Citation preview
This is the translation of the financial statements. CPAs do not audit or review on this translation.
FocalTech Systems Co., Ltd. and Subsidiaries Consolidated Financial Statements for the Years Ended December 31, 2020 and 2019
This is the translation of the financial statements. CPAs do not audit or review on this translation.
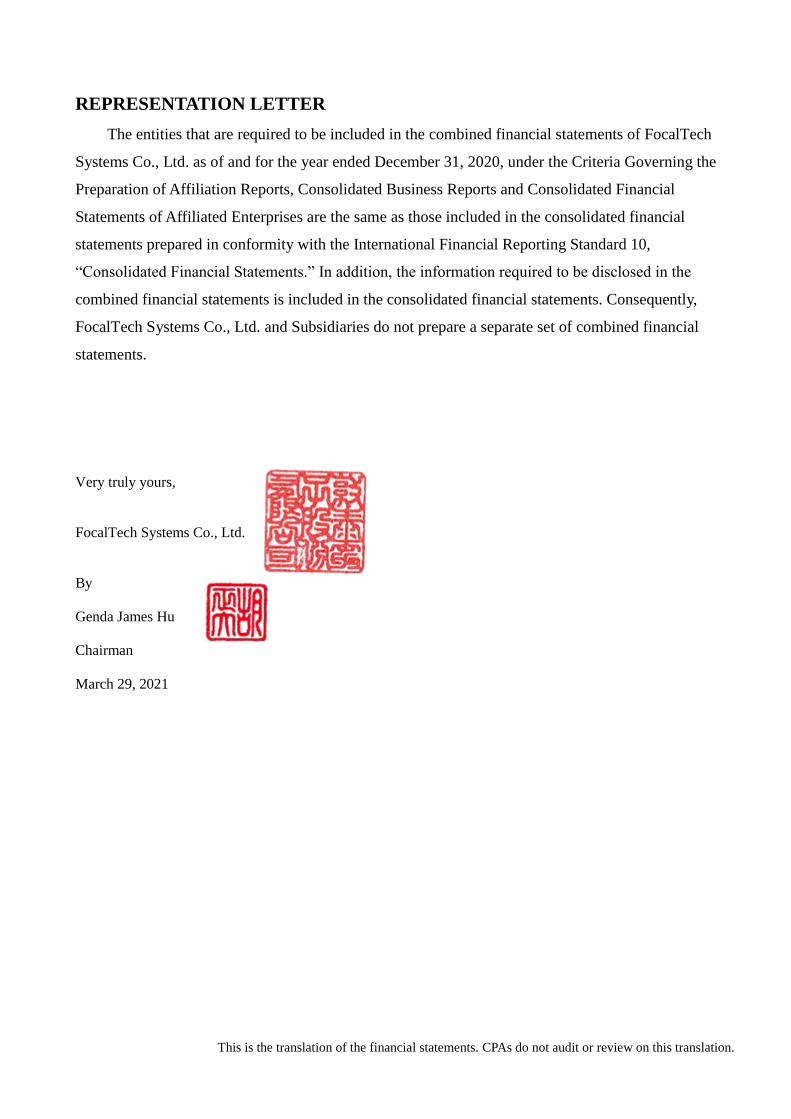
REPRESENTATION LETTER
The entities that are required to be included in the combined financial statements of FocalTech
Systems Co., Ltd. as of and for the year ended December 31, 2020, under the Criteria Governing the
Preparation of Affiliation Reports, Consolidated Business Reports and Consolidated Financial
Statements of Affiliated Enterprises are the same as those included in the consolidated financial
statements prepared in conformity with the International Financial Reporting Standard 10,
“Consolidated Financial Statements.” In addition, the information required to be disclosed in the
combined financial statements is included in the consolidated financial statements. Consequently,
FocalTech Systems Co., Ltd. and Subsidiaries do not prepare a separate set of combined financial
statements.
Very truly yours,
FocalTech Systems Co., Ltd.
By
Genda James Hu
Chairman
March 29, 2021
This is the translation of the financial statements. CPAs do not audit or review on this translation.
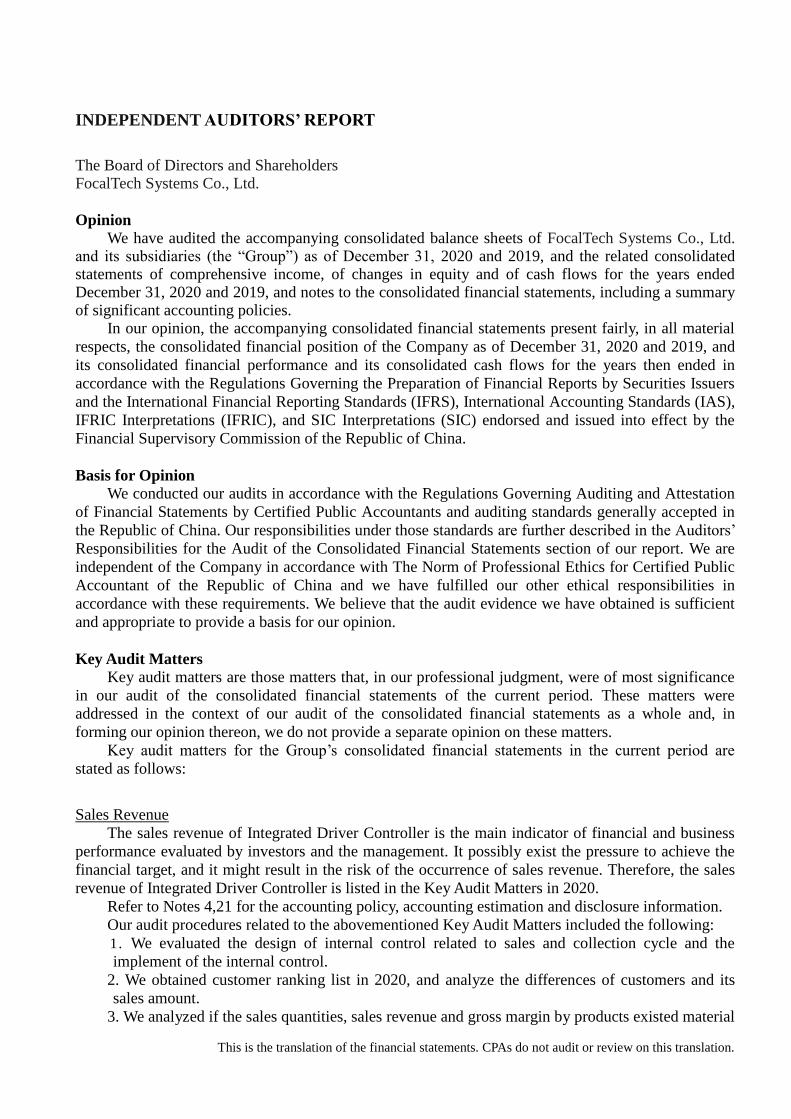
INDEPENDENT AUDITORS’ REPORT
The Board of Directors and Shareholders FocalTech Systems Co., Ltd.
Opinion
We have audited the accompanying consolidated balance sheets of FocalTech Systems Co., Ltd. and its subsidiaries (the “Group”) as of December 31, 2020 and 2019, and the related consolidated statements of comprehensive income, of changes in equity and of cash flows for the years ended December 31, 2020 and 2019, and notes to the consolidated financial statements, including a summary of significant accounting policies. In our opinion, the accompanying consolidated financial statements present fairly, in all material
respects, the consolidated financial position of the Company as of December 31, 2020 and 2019, and
its consolidated financial performance and its consolidated cash flows for the years then ended in
accordance with the Regulations Governing the Preparation of Financial Reports by Securities Issuers
and the International Financial Reporting Standards (IFRS), International Accounting Standards (IAS),
IFRIC Interpretations (IFRIC), and SIC Interpretations (SIC) endorsed and issued into effect by the
Financial Supervisory Commission of the Republic of China.
Basis for Opinion
We conducted our audits in accordance with the Regulations Governing Auditing and Attestation
of Financial Statements by Certified Public Accountants and auditing standards generally accepted in
the Republic of China. Our responsibilities under those standards are further described in the Auditors’
Responsibilities for the Audit of the Consolidated Financial Statements section of our report. We are
independent of the Company in accordance with The Norm of Professional Ethics for Certified Public
Accountant of the Republic of China and we have fulfilled our other ethical responsibilities in
accordance with these requirements. We believe that the audit evidence we have obtained is sufficient
and appropriate to provide a basis for our opinion.
Key Audit Matters
Key audit matters are those matters that, in our professional judgment, were of most significance
in our audit of the consolidated financial statements of the current period. These matters were
addressed in the context of our audit of the consolidated financial statements as a whole and, in
forming our opinion thereon, we do not provide a separate opinion on these matters.
Key audit matters for the Group’s consolidated financial statements in the current period are
stated as follows:
Sales Revenue
The sales revenue of Integrated Driver Controller is the main indicator of financial and business
performance evaluated by investors and the management. It possibly exist the pressure to achieve the
financial target, and it might result in the risk of the occurrence of sales revenue. Therefore, the sales
revenue of Integrated Driver Controller is listed in the Key Audit Matters in 2020.
Refer to Notes 4,21 for the accounting policy, accounting estimation and disclosure information.
Our audit procedures related to the abovementioned Key Audit Matters included the following:
1. We evaluated the design of internal control related to sales and collection cycle and the
implement of the internal control.
2. We obtained customer ranking list in 2020, and analyze the differences of customers and its
sales amount.
3. We analyzed if the sales quantities, sales revenue and gross margin by products existed material
This is the translation of the financial statements. CPAs do not audit or review on this translation.
exception.
4. We sampled purchase orders, shipping documents bills of lading, and collection records in
revenue breakdown to ensure the occurrence of sales revenue.
Other Matter
We have also audited the parent company only financial statements of FocalTech Systems Co., Ltd. as of and for the years ended December 31, 2020 and 2019 on which we have issued an unmodified opinion.
Responsibilities of Corporate Management and Governance hierarchy For the Consolidated
Financial Statements
Management Level is responsible for the preparation and fair presentation of the consolidated
financial statements in accordance with the Regulations Governing the Preparation of Financial
Reports by Securities Issuers and the IFRS, IAS, IFRIC, and SIC endorsed and issued into effect by
the Financial Supervisory Commission of the Republic of China, and for such internal control as
management determines is necessary to enable the preparation of consolidated financial statements that
are free from material misstatement, whether due to fraud or error.
In preparing the consolidated financial statements, management level is responsible for assessing
the Company’s ability to continue as a going concern, disclosing, as applicable, matters related to
going concern and using the going concern basis of accounting unless management either intends to
liquidate the Company or to cease operations, or has no realistic alternative but to do so.
Corporate governance level (including members of the Audit Committee) is responsible for
overseeing the Company’s financial reporting process.
Auditors’ Responsibilities for the Audit of the Consolidated Financial Statements
Our objectives are to obtain reasonable assurance about whether the consolidated financial
statements as a whole are free from material misstatement, whether due to fraud or error, and to issue
an auditors’ report that includes our opinion. Reasonable assurance is a high level of assurance, but is
not a guarantee that an audit conducted in accordance with the auditing standards generally accepted in
the Republic of China will always detect a material misstatement when it exists. Misstatements can
arise from fraud or error and are considered material if, individually or in the aggregate, they could
reasonably be expected to influence the economic decisions of users taken on the basis of these
consolidated financial statements.
As part of an audit in accordance with the auditing standards generally accepted in the Republic
of China, we exercise professional judgment and maintain professional skepticism throughout the audit.
We also:
1. Identify and assess the risks of material misstatement of the consolidated financial statements,
whether due to fraud or error, design and perform audit procedures responsive to those risks, and
obtain audit evidence that is sufficient and appropriate to provide a basis for our opinion. The risk
of not detecting a material misstatement resulting from fraud is higher than for one resulting from
error, as fraud may involve collusion, forgery, intentional omissions, misrepresentations, or the
override of internal control.
2. Obtain an understanding of internal control relevant to the audit in order to design audit procedures
that are appropriate in the circumstances, but not for the purpose of expressing an opinion on the
effectiveness of the Group’s internal control.
3. Evaluate the appropriateness of accounting policies used and the reasonableness of accounting
estimates and related disclosures made by management.
4. Conclude on the appropriateness of management’s use of the going concern basis of accounting
and, based on the audit evidence obtained, whether a material uncertainty exists related to events
or conditions that may cast significant doubt on the Group’s ability to continue as a going concern.
This is the translation of the financial statements. CPAs do not audit or review on this translation.
If we conclude that a material uncertainty exists, we are required to draw attention in our auditors’
report to the related disclosures in the consolidated financial statements or, if such disclosures are
inadequate, to modify our opinion. Our conclusions are based on the audit evidence obtained up to
the date of our auditors’ report. However, future events or conditions may cause the Group to cease
to continue as a going concern.
5. Evaluate the overall presentation, structure and content of the consolidated financial statements,
including the disclosures, and whether the consolidated financial statements represent the
underlying transactions and events in a manner that achieves fair presentation.
6. Obtain sufficient and appropriate audit evidence regarding the financial information of entities or
business activities within the Group to express an opinion on the consolidated financial statements.
We are responsible for the direction, supervision, and performance of the group audit. We remain
solely responsible for our audit opinion.
We communicate with those charged with governance regarding, among other matters, the planned
scope and timing of the audit and significant audit findings, including any significant deficiencies in
internal control that we identify during our audit.
We also provide those charged with governance with a statement that we have complied with
relevant ethical requirements regarding independence, and to communicate with them all relationships
and other matters that may reasonably be thought to bear on our independence, and where applicable,
related safeguards.
From the matters communicated with those charged with governance, we determine those matters
that were of most significance in the audit of the consolidated financial statements for the year ended
December 31, 2020 and are therefore the key audit matters. We describe these matters in our auditors’
report unless law or regulation precludes public disclosure about the matter or when, in extremely rare
circumstances, we determine that a matter should not be communicated in our report because the
adverse consequences of doing so would reasonably be expected to outweigh the public interest
benefits of such communication.
The engagement partners on the audit resulting in this independent auditors’ report are
Shiow-Ming Shue and Chih-Ming Shao.
Deloitte & Touche
Taipei, Taiwan
Republic of China
March 29, 2021
This is the translation of the financial statements. CPAs do not audit or review on this translation.
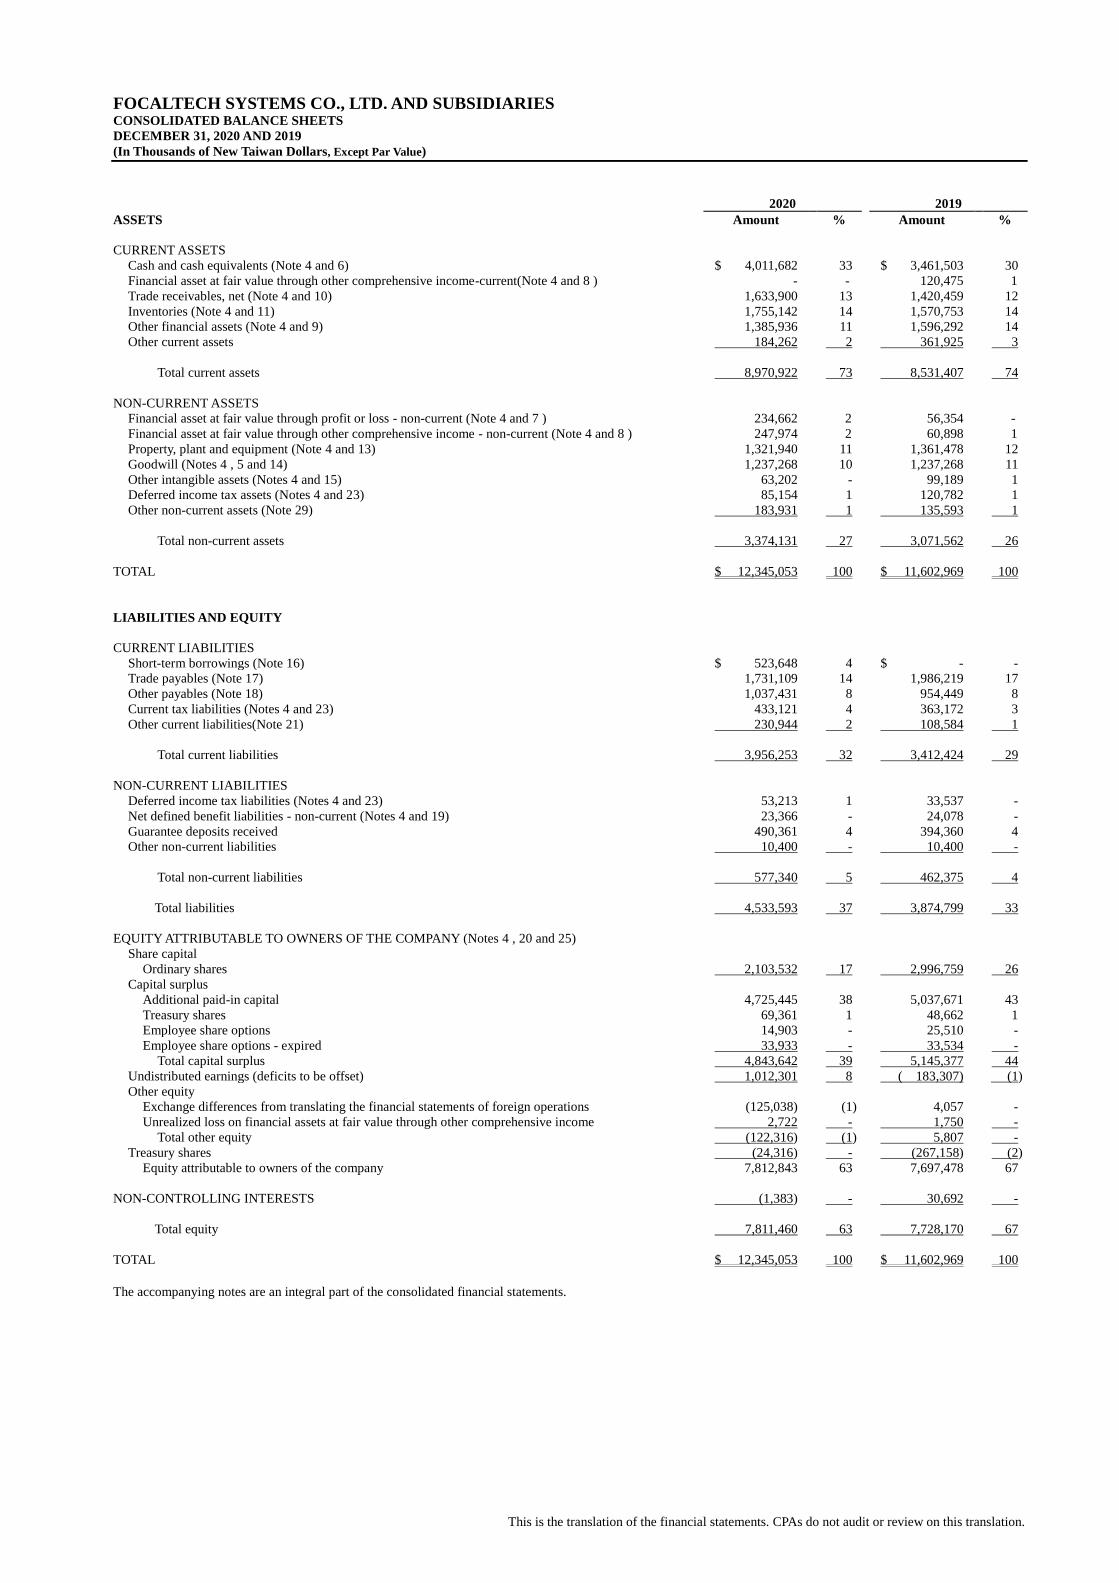
FOCALTECH SYSTEMS CO., LTD. AND SUBSIDIARIES CONSOLIDATED BALANCE SHEETS
DECEMBER 31, 2020 AND 2019
(In Thousands of New Taiwan Dollars, Except Par Value)
2020 2019
ASSETS Amount % Amount %
CURRENT ASSETS
Cash and cash equivalents (Note 4 and 6) $ 4,011,682 33 $ 3,461,503 30
Financial asset at fair value through other comprehensive income-current(Note 4 and 8 ) - - 120,475 1
Trade receivables, net (Note 4 and 10) 1,633,900 13 1,420,459 12
Inventories (Note 4 and 11) 1,755,142 14 1,570,753 14
Other financial assets (Note 4 and 9) 1,385,936 11 1,596,292 14
Other current assets 184,262 2 361,925 3
Total current assets 8,970,922 73 8,531,407 74
NON-CURRENT ASSETS
Financial asset at fair value through profit or loss - non-current (Note 4 and 7 ) 234,662 2 56,354 -
Financial asset at fair value through other comprehensive income - non-current (Note 4 and 8 ) 247,974 2 60,898 1
Property, plant and equipment (Note 4 and 13) 1,321,940 11 1,361,478 12
Goodwill (Notes 4 , 5 and 14) 1,237,268 10 1,237,268 11
Other intangible assets (Notes 4 and 15) 63,202 - 99,189 1
Deferred income tax assets (Notes 4 and 23) 85,154 1 120,782 1
Other non-current assets (Note 29) 183,931 1 135,593 1
Total non-current assets 3,374,131 27 3,071,562 26
TOTAL $ 12,345,053 100 $ 11,602,969 100
LIABILITIES AND EQUITY
CURRENT LIABILITIES
Short-term borrowings (Note 16) $ 523,648 4 $ - -
Trade payables (Note 17) 1,731,109 14 1,986,219 17
Other payables (Note 18) 1,037,431 8 954,449 8
Current tax liabilities (Notes 4 and 23) 433,121 4 363,172 3
Other current liabilities(Note 21) 230,944 2 108,584 1
Total current liabilities 3,956,253 32 3,412,424 29
NON-CURRENT LIABILITIES
Deferred income tax liabilities (Notes 4 and 23) 53,213 1 33,537 -
Net defined benefit liabilities - non-current (Notes 4 and 19) 23,366 - 24,078 -
Guarantee deposits received 490,361 4 394,360 4
Other non-current liabilities 10,400 - 10,400 -
Total non-current liabilities 577,340 5 462,375 4
Total liabilities 4,533,593 37 3,874,799 33
EQUITY ATTRIBUTABLE TO OWNERS OF THE COMPANY (Notes 4 , 20 and 25)
Share capital
Ordinary shares 2,103,532 17 2,996,759 26
Capital surplus
Additional paid-in capital 4,725,445 38 5,037,671 43
Treasury shares 69,361 1 48,662 1
Employee share options 14,903 - 25,510 -
Employee share options - expired 33,933 - 33,534 -
Total capital surplus 4,843,642 39 5,145,377 44
Undistributed earnings (deficits to be offset) 1,012,301 8 ( 183,307) (1)
Other equity
Exchange differences from translating the financial statements of foreign operations (125,038) (1) 4,057 -
Unrealized loss on financial assets at fair value through other comprehensive income 2,722 - 1,750 -
Total other equity (122,316) (1) 5,807 -
Treasury shares (24,316) - (267,158) (2)
Equity attributable to owners of the company 7,812,843 63 7,697,478 67
NON-CONTROLLING INTERESTS (1,383) - 30,692 -
Total equity 7,811,460 63 7,728,170 67
TOTAL $ 12,345,053 100 $ 11,602,969 100
The accompanying notes are an integral part of the consolidated financial statements.
This is the translation of the financial statements. CPAs do not audit or review on this translation.
FOCALTECH SYSTEMS CO., LTD. AND SUBSIDIARIES
CONSOLIDATED STATEMENTS OF COMPREHENSIVE INCOME
FOR THE YEARS ENDED DECEMBER 31, 2020 AND 2019
(In Thousands of New Taiwan Dollars, Except Earnings Per Share)
2020 2019
Amount % Amount %
REVENUE (Note 4 and 21) $ 13,800,348 100 $ 9,160,261 100
COSTS OF SALES (Notes 4,11 and 22) (10,371,572) (75) (7,167,061) (78)
GROSS PROFIT 3,428,776 25 1,993,200 22
OPERATING EXPENSES (Notes 23, 25,27 and 30)
Selling and marketing expenses (398,828) (3) (469,272) (5)
General and administrative expenses (363,193) (3) (312,638) (4)
Research and development expenses (1,636,018) (12) (1,551,946) (17)
Total operating expenses (2,398,039) (18) (2,333,856) (26)
OPERATIONS LOSS 1,030,737 7 (340,656) (4)
NON-OPERATING INCOME AND EXPENSES
Finance costs (Note 22) (2,009) - (1,152) -
Share of loss of subsidiaries and joint
ventures(Note4) (4,970) - - -
Interest income (Note 4) 51,835 - 111,144 1
Gain (loss) on financial assets and liabilities at fair
value through profit or loss (Notes 4) (5,607) - 1,077 -
Other gains and losses, net 92,446 1 71,949 1
Loss on foreign currency exchange(Note 4) (5,335) - (22,723) -
Total non-operating income and expenses 126,360 1 160,295 2
INCOME (LOSS) BEFORE INCOME TAX 1,157,097 8 (180,361) ( 2)
INCOME TAX EXPENSE (Notes 4 and 23) (173,639) (1) (25,319) -
NET INCOME (LOSS) 983,458 7 (205,680) (2)
OTHER COMPREHENSIVE (LOSS) INCOME
Items that will not be reclassified subsequently to
profit or loss:
Remeasurement of defined benefit plans(Notes 4
and 19) 359 - 1,677 -
Income tax related to items that will not be
reclassified subsequently to profit or loss(Notes
4 and 23) (50) - (235) -
309 - 1,442 -
(Continued)
This is the translation of the financial statements. CPAs do not audit or review on this translation.
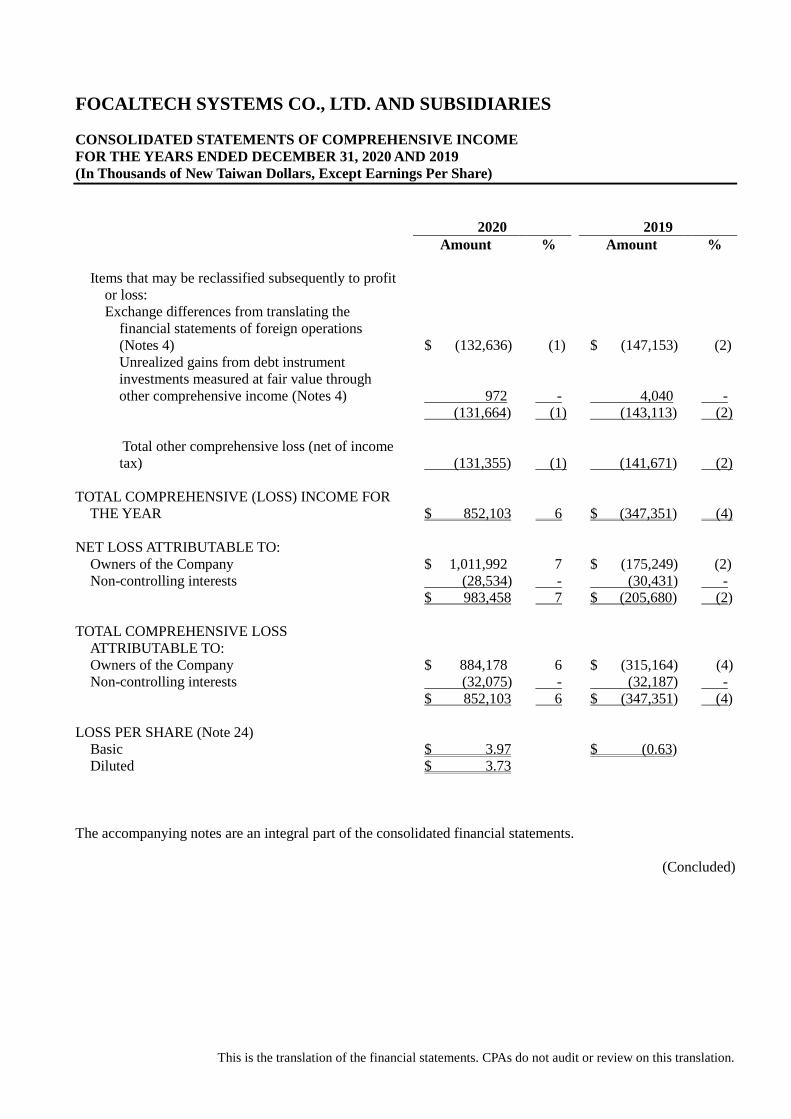
FOCALTECH SYSTEMS CO., LTD. AND SUBSIDIARIES
CONSOLIDATED STATEMENTS OF COMPREHENSIVE INCOME
FOR THE YEARS ENDED DECEMBER 31, 2020 AND 2019
(In Thousands of New Taiwan Dollars, Except Earnings Per Share)
2020 2019
Amount % Amount %
Items that may be reclassified subsequently to profit
or loss:
Exchange differences from translating the
financial statements of foreign operations
(Notes 4) $ (132,636) (1) $ (147,153) (2)
Unrealized gains from debt instrument
investments measured at fair value through
other comprehensive income (Notes 4) 972 - 4,040 -
(131,664) (1) (143,113) (2)
Total other comprehensive loss (net of income
tax) (131,355) (1) (141,671) (2)
TOTAL COMPREHENSIVE (LOSS) INCOME FOR
THE YEAR $ 852,103 6 $ (347,351) (4)
NET LOSS ATTRIBUTABLE TO:
Owners of the Company $ 1,011,992 7 $ (175,249) (2)
Non-controlling interests (28,534) - (30,431) -
$ 983,458 7 $ (205,680) (2)
TOTAL COMPREHENSIVE LOSS
ATTRIBUTABLE TO:
Owners of the Company $ 884,178 6 $ (315,164) (4)
Non-controlling interests (32,075) - (32,187) -
$ 852,103 6 $ (347,351) (4)
LOSS PER SHARE (Note 24)
Basic $ 3.97 $ (0.63)
Diluted $ 3.73
The accompanying notes are an integral part of the consolidated financial statements.
(Concluded)
This is the translation of the financial statements. CPAs do not audit or review on this translation.
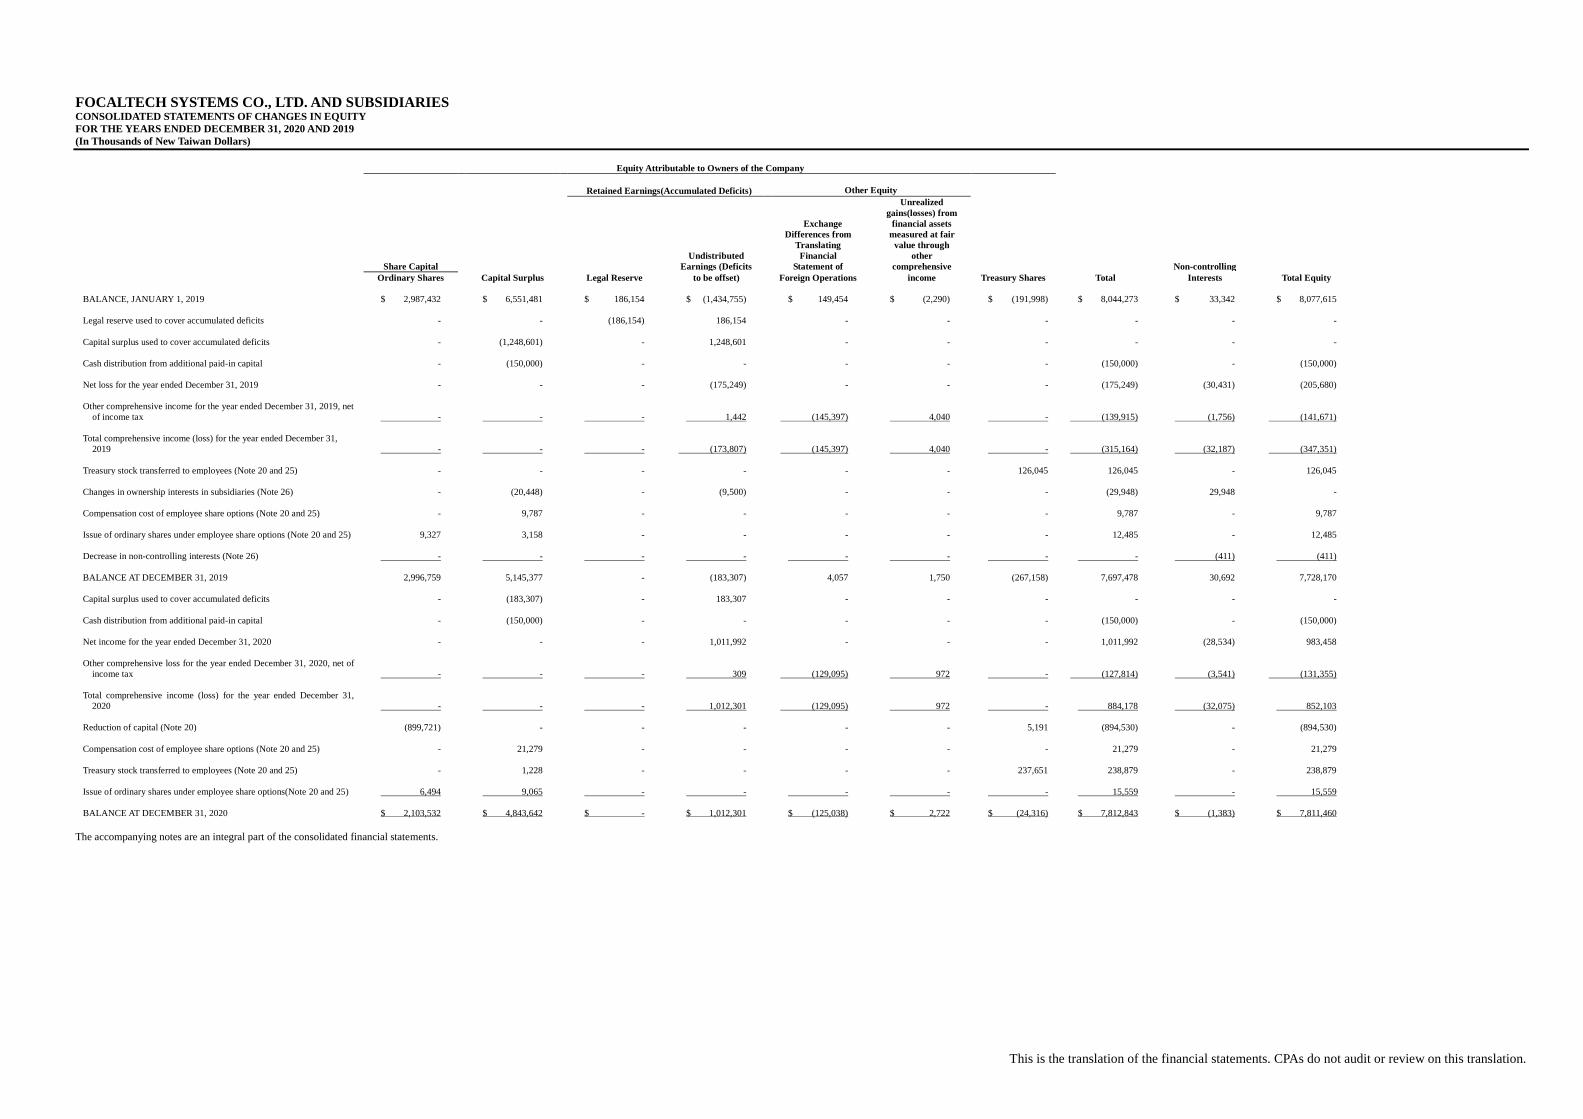
FOCALTECH SYSTEMS CO., LTD. AND SUBSIDIARIES CONSOLIDATED STATEMENTS OF CHANGES IN EQUITY
FOR THE YEARS ENDED DECEMBER 31, 2020 AND 2019
(In Thousands of New Taiwan Dollars)
Equity Attributable to Owners of the Company
Retained Earnings(Accumulated Deficits)
Other Equity
Share Capital
Undistributed
Earnings (Deficits
Exchange
Differences from
Translating
Financial
Statement of
Unrealized
gains(losses) from
financial assets
measured at fair
value through
other
comprehensive Non-controlling
Ordinary Shares Capital Surplus Legal Reserve to be offset) Foreign Operations income Treasury Shares Total Interests Total Equity
BALANCE, JANUARY 1, 2019 $ 2,987,432 $ 6,551,481 $ 186,154 $ (1,434,755) $ 149,454 $ (2,290) $ (191,998) $ 8,044,273 $ 33,342 $ 8,077,615
Legal reserve used to cover accumulated deficits - - (186,154) 186,154 - - - - - -
Capital surplus used to cover accumulated deficits - (1,248,601) - 1,248,601 - - - - - -
Cash distribution from additional paid-in capital - (150,000) - - - - - (150,000) - (150,000)
Net loss for the year ended December 31, 2019 - - - (175,249) - - - (175,249) (30,431) (205,680)
Other comprehensive income for the year ended December 31, 2019, net
of income tax
- - - 1,442 (145,397) 4,040 - (139,915) (1,756) (141,671)
Total comprehensive income (loss) for the year ended December 31,
2019
- - - (173,807) (145,397) 4,040 - (315,164) (32,187) (347,351)
Treasury stock transferred to employees (Note 20 and 25) - - - - - - 126,045 126,045 - 126,045
Changes in ownership interests in subsidiaries (Note 26) - (20,448) - (9,500) - - - (29,948) 29,948 -
Compensation cost of employee share options (Note 20 and 25) - 9,787 - - - - - 9,787 - 9,787
Issue of ordinary shares under employee share options (Note 20 and 25) 9,327 3,158 - - - - - 12,485 - 12,485
Decrease in non-controlling interests (Note 26) - - - - - - - - (411) (411)
BALANCE AT DECEMBER 31, 2019 2,996,759 5,145,377 - (183,307) 4,057 1,750 (267,158) 7,697,478 30,692 7,728,170
Capital surplus used to cover accumulated deficits - (183,307) - 183,307 - - - - - -
Cash distribution from additional paid-in capital - (150,000) - - - - - (150,000) - (150,000)
Net income for the year ended December 31, 2020 - - - 1,011,992 - - - 1,011,992 (28,534) 983,458
Other comprehensive loss for the year ended December 31, 2020, net of
income tax
- - - 309 (129,095) 972 - (127,814) (3,541) (131,355)
Total comprehensive income (loss) for the year ended December 31,
2020
- - - 1,012,301 (129,095) 972 - 884,178 (32,075) 852,103
Reduction of capital (Note 20) (899,721) - - - - - 5,191 (894,530) - (894,530)
Compensation cost of employee share options (Note 20 and 25) - 21,279 - - - - - 21,279 - 21,279
Treasury stock transferred to employees (Note 20 and 25) - 1,228 - - - - 237,651 238,879 - 238,879
Issue of ordinary shares under employee share options(Note 20 and 25) 6,494 9,065 - - - - - 15,559 - 15,559
BALANCE AT DECEMBER 31, 2020 $ 2,103,532 $ 4,843,642 $ - $ 1,012,301 $ (125,038) $ 2,722 $ (24,316) $ 7,812,843 $ (1,383) $ 7,811,460
The accompanying notes are an integral part of the consolidated financial statements.
This is the translation of the financial statements. CPAs do not audit or review on this translation.
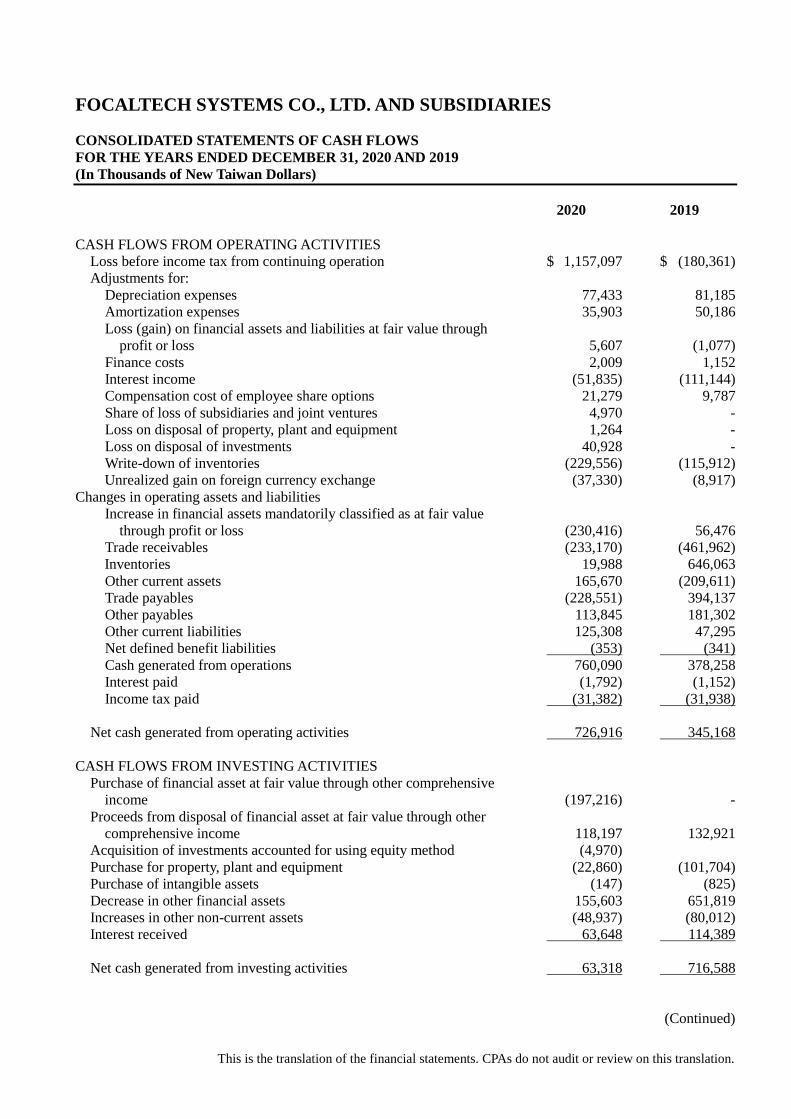
FOCALTECH SYSTEMS CO., LTD. AND SUBSIDIARIES
CONSOLIDATED STATEMENTS OF CASH FLOWS
FOR THE YEARS ENDED DECEMBER 31, 2020 AND 2019
(In Thousands of New Taiwan Dollars)
2020 2019
CASH FLOWS FROM OPERATING ACTIVITIES
Loss before income tax from continuing operation $ 1,157,097 $ (180,361)
Adjustments for:
Depreciation expenses 77,433 81,185
Amortization expenses 35,903 50,186
Loss (gain) on financial assets and liabilities at fair value through
profit or loss 5,607 (1,077)
Finance costs 2,009 1,152
Interest income (51,835) (111,144)
Compensation cost of employee share options 21,279 9,787
Share of loss of subsidiaries and joint ventures 4,970 -
Loss on disposal of property, plant and equipment 1,264 -
Loss on disposal of investments 40,928 -
Write-down of inventories (229,556) (115,912)
Unrealized gain on foreign currency exchange (37,330) (8,917)
Changes in operating assets and liabilities
Increase in financial assets mandatorily classified as at fair value
through profit or loss (230,416) 56,476
Trade receivables (233,170) (461,962)
Inventories 19,988 646,063
Other current assets 165,670 (209,611)
Trade payables (228,551) 394,137
Other payables 113,845 181,302
Other current liabilities 125,308 47,295
Net defined benefit liabilities (353) (341)
Cash generated from operations 760,090 378,258
Interest paid (1,792) (1,152)
Income tax paid (31,382) (31,938)
Net cash generated from operating activities 726,916 345,168
CASH FLOWS FROM INVESTING ACTIVITIES
Purchase of financial asset at fair value through other comprehensive
income (197,216) -
Proceeds from disposal of financial asset at fair value through other
comprehensive income 118,197 132,921
Acquisition of investments accounted for using equity method (4,970)
Purchase for property, plant and equipment (22,860) (101,704)
Purchase of intangible assets (147) (825)
Decrease in other financial assets 155,603 651,819
Increases in other non-current assets (48,937) (80,012)
Interest received 63,648 114,389
Net cash generated from investing activities 63,318 716,588
(Continued)
This is the translation of the financial statements. CPAs do not audit or review on this translation.
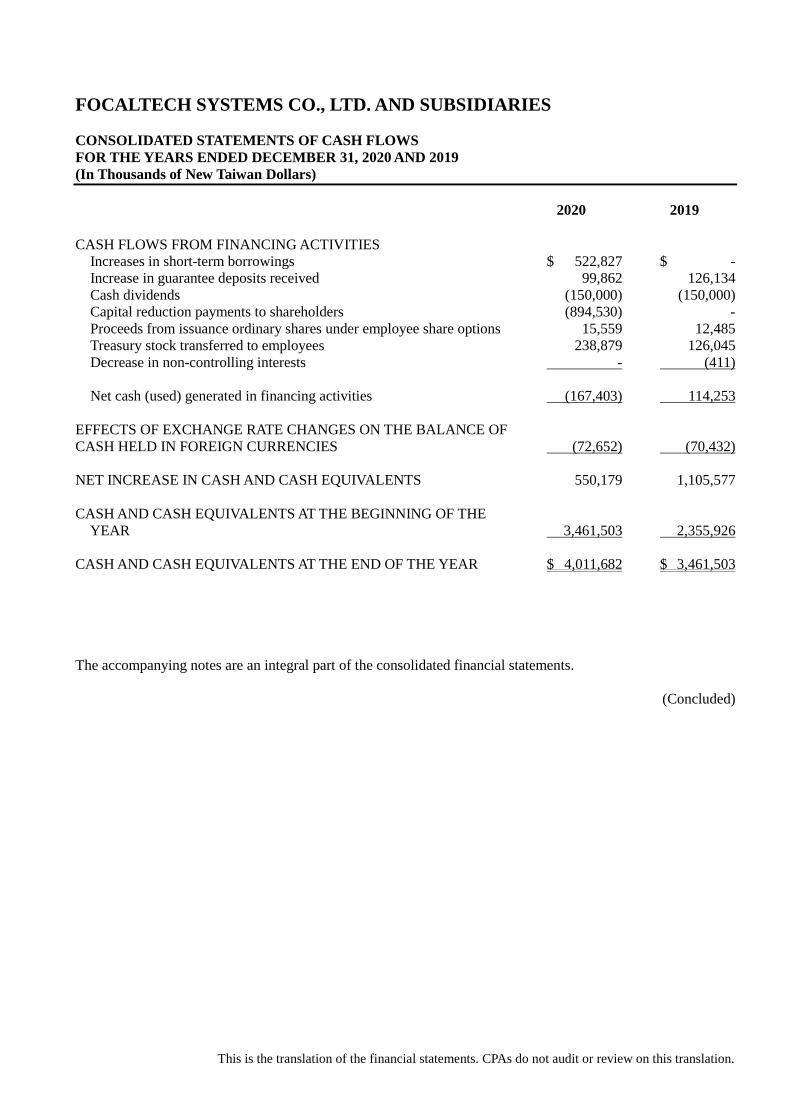
FOCALTECH SYSTEMS CO., LTD. AND SUBSIDIARIES
CONSOLIDATED STATEMENTS OF CASH FLOWS
FOR THE YEARS ENDED DECEMBER 31, 2020 AND 2019
(In Thousands of New Taiwan Dollars)
2020 2019
CASH FLOWS FROM FINANCING ACTIVITIES
Increases in short-term borrowings $ 522,827 $ -
Increase in guarantee deposits received 99,862 126,134
Cash dividends (150,000) (150,000)
Capital reduction payments to shareholders (894,530) -
Proceeds from issuance ordinary shares under employee share options 15,559 12,485
Treasury stock transferred to employees 238,879 126,045
Decrease in non-controlling interests - (411)
Net cash (used) generated in financing activities (167,403) 114,253
EFFECTS OF EXCHANGE RATE CHANGES ON THE BALANCE OF
CASH HELD IN FOREIGN CURRENCIES (72,652) (70,432)
NET INCREASE IN CASH AND CASH EQUIVALENTS 550,179 1,105,577
CASH AND CASH EQUIVALENTS AT THE BEGINNING OF THE
YEAR 3,461,503 2,355,926
CASH AND CASH EQUIVALENTS AT THE END OF THE YEAR $ 4,011,682 $ 3,461,503
The accompanying notes are an integral part of the consolidated financial statements.
(Concluded)
This is the translation of the financial statements. CPAs do not audit or review on this translation.
FOCALTECH SYSTEMS CO., LTD. AND SUBSIDIARIES
NOTES TO CONSOLIDATED FINANCIAL STATEMENTS
FOR THE YEARS ENDED DECEMBER 31, 2020 AND 2019
(In Thousands of New Taiwan Dollars, Unless Stated Otherwise)
1. GENERAL INFORMATION
FocalTech Systems Co., Ltd. (the “FocalTech” or the “Company”), formerly named as Orise Technology
Co., Ltd., was incorporated in the Republic of China (“ROC”) in January 2006 and moved to Hsinchu
Science Park in April in the same year. The Company’s shares have been listed on the Taiwan Stock
Exchange (“TSE”) since July 2007. On January 2, 2015, the Company acquired FocalTech Corporation,
Ltd. through a share swap and renamed on January 17, 2015. This acquisition was comprehensively
considered as a reverse merger, where FocalTech Corporation, Ltd. was treated as the acquirer in the
financial statements. The Company is mainly engaged in research, development, design, manufacturing,
and sales of solutions regarding to human and machine interface devices, such as Display Driver IC, Touch
Control IC and so on.
The consolidated financial statements are presented in the Company’s functional currency, New Taiwan
dollars.
2. APPROVAL OF FINANCIAL STATEMENTS
The consolidated financial statements were approved by the Company’s board of directors on February 4,
2021.
3. APPLICATION OF NEW, AMENDED AND REVISED STANDARDS AND INTERPRETATIONS
a. Initial application of the International Financial Reporting Standards (IFRS), International Accounting
Standards (IAS), IFRIC Interpretations (IFRIC), and SIC Interpretations (SIC) (collectively,
“IFRSs”)endorsed and issued into effect by the Financial Supervisory Commission (FSC).
The initial application of the amendments to the IFRSs endorsed and issued into effect by the FSC did
not have significant impact on the Group’s accounting policies:
b. The IFRSs endorsed by the Financial Supervisory Commission (FSC) for application starting from 2021
New, Revised or Amended Standards and Interpretations
Effective Date
Issued by IASB
Amendments to IFRS 4 “Extension of the Temporary Exemption from
Applying IFRS 9”
Effective immediately upon
promulgation by the IASB
Amendments to IFRS 9, IAS 39, IFRS 7, IFRS 4 and IFRS 16
“Interest Rate Benchmark Reform - Phase 2”
January 1, 2021
The Group assessed the application of abovementioned standards and interpretations do not have
significant impact on the Group’s accounting policies.
This is the translation of the financial statements. CPAs do not audit or review on this translation.
c. New IFRSs in issue but not yet endorsed and issued into effect by the FSC
New, Revised or Amended Standards and Interpretations
Effective Date
Announced by IASB (Note 1)
“Annual Improvements to IFRS Standards 2018-2020” January 1, 2022 (Note 2)
Amendments to IFRS 3 “Reference to the Conceptual Framework” January 1, 2022 (Note 3)
Amendments to IFRS 10 and IAS 28 “Sale or Contribution of Assets
between an Investor and its Associate or Joint Venture”
To be determined by IASB
IFRS 17 “Insurance Contracts” January 1, 2023
Amendments to IFRS 17 January 1, 2023
Amendments to IAS 1 “Classification of Liabilities as Current or
Non-current”
January 1, 2023
Amendments to IAS 1 “Disclosure of Accounting Policies” January 1, 2023 (Note 6)
Amendments to IAS 8 “Definition of Accounting Estimates” January 1, 2023 (Note 7)
Amendments to IAS 16 “Property, Plant and Equipment - Proceeds
before Intended Use”
January 1, 2022 (Note 4)
Amendments to IAS 37 “Onerous Contracts - Cost of Fulfilling a
Contract”
January 1, 2022 (Note 5)
Note 1: Unless stated otherwise, the above New IFRSs are effective for annual periods beginning on
or after their respective effective dates.
Note 2: The amendments to IFRS 9 will be applied prospectively to modifications and exchanges of
financial liabilities that occur on or after the annual reporting periods beginning on or after
January 1, 2022. The amendments to IAS 41 “Agriculture” will be applied prospectively to
the fair value measurements on or after the annual reporting periods beginning on or after
January 1, 2022. The amendments to IFRS 1 “First-time Adoptions of IFRSs” will be applied
retrospectively for annual reporting periods beginning on or after January 1, 2022.
Note 3: The amendments are applicable to business combinations for which the acquisition date is on
or after the beginning of the annual reporting period beginning on or after January 1, 2022.
Note 4: The amendments are applicable to property, plant and equipment that are brought to the
location and condition necessary for them to be capable of operating in the manner intended
by management on or after January 1, 2021.
Note 5: The amendments are applicable to contracts for which the entity has not yet fulfilled all its
obligations on January 1, 2022.
Note 6: The amendments will be applied prospectively for annual reporting periods beginning on or
after January 1, 2023.
Note 7: The amendments are applicable to changes in accounting estimates and changes in accounting
policies that occur on or after the beginning of the annual reporting period beginning on or
after January 1, 2023.
As of the date the financial statements were authorized for issue, the Group is continuously assessing
the possible impact that the application of other standards and interpretations will have on the Group’s
financial position and financial performance and will disclose the relevant impact when the assessment
is completed.
4. SUMMARY OF SIGNIFICANT ACCOUNTING POLICIES
a. Statement of compliance
The present Consolidated Financial Report has been prepared in accordance with the Regulations
Governing the Preparation of Financial Reports by Securities Issuers and IFRSs as endorsed and issued
This is the translation of the financial statements. CPAs do not audit or review on this translation.
into effect by Financial Supervisory Commission.
b. Basis of preparation
The consolidated financial statements are prepared on the historical cost basis, except for the financial
instruments measured at fair value and the net defined benefit liabilities recognized in the fair value of
the estimated assets, and explained in the accounting policies below.
The evaluation of fair value could be classified into level 1 to level 3 based on the degree of the
observable intensity and importance of related input value:
1) Level 1 inputs are quoted prices (unadjusted) in active markets for identical assets or liabilities;
2) Level 2 inputs are inputs other than quoted prices included within Level 1 that are observable for
the asset or liability, either directly (i.e. as prices) or indirectly (i.e. derived from prices); and
3) Level 3 inputs are unobservable inputs for the asset or liability.
c. Standards in differentiating current and non-current assets and liabilities
Current assets include:
1) Assets held primarily for the purpose of trading;
2) Assets expected to be realized within twelve months after the reporting period; and
3) Cash and cash equivalents unless the asset is restricted from being exchanged or used to settle a
liability for at least twelve months after the reporting period.
Current liabilities include:
1) Assets expected to be realized within 12 months after the reporting period; and
2) Liabilities for which the Company does not have an unconditional right to defer settlement for at
least 12 months after the reporting period.
Those not as aforementioned current assets or current liabilities are classified as non-current assets or
non-current liabilities.
d. Basis of consolidation
The consolidated financial statements incorporate the financial statements of the Company and entities
controlled by the Company (its subsidiaries). Applicable adjustments are made to the financial
statements of subsidiaries to bring their accounting policies in line with those used by the Company. All
intra-group transactions, balances, income and expenses are eliminated in full on consolidation. Total
comprehensive income of the subsidiaries is attributed both to the shareholders of the parent and the
non-controlling interests even if this results in the non-controlling interests having a deficit balance.
Changes in the Company’s ownership interests in subsidiaries that do not result in the Company losing
controlling over the subsidiaries are accounted as equity transactions. The carrying amounts of the
Company’s interests and the non-controlling interests are adjusted to reflect the changes in their
interests in the subsidiaries respectively. The amount adjusted for the non-controlling interests and the
difference between fair value and the consideration paid or received are recognized directly in equity
and attributed to shareholders of the parent.
See Note 12, Table 5 and Table 6 for the detailed information of the subsidiaries (including the
percentage of ownership and main business).
This is the translation of the financial statements. CPAs do not audit or review on this translation.
e. Foreign currencies
In preparing the financial statements of each individual group entity, transactions in currencies other
than the entity’s functional currency (foreign currencies) are recognized at the rates of exchange
prevailing at the dates of the transactions.
At the end of each reporting period, monetary items denominated in foreign currencies are retranslated
at the rates prevailing at that date. Exchange differences on monetary items arising from settlement or
translation are recognized in profit or loss in the period.
Non-monetary items that are measured at historical cost in a foreign currency are not retranslated.
For the purpose of presenting consolidated financial statements, the functional currencies of the
Company and the Group entities (including subsidiaries in other countries that use currency different
from the currency of the Company) are translated into the presentation currency - New Taiwan dollars
as follows: Assets and liabilities are translated at the exchange rates prevailing at the end of the
reporting period; income and expense items are translated at the average exchange rates for the period.
The resulting currency translation differences are recognized in other comprehensive income and
accumulated in equity (attributed to non-controlling interests as appropriate).
f. Inventories
Inventories consist of raw materials, supplies, finished goods and work-in-process and are stated at the
lower of cost or net realizable value. Inventory write-downs are made by item, except where it may be
appropriate to group similar or related items. Net realizable value is the estimated selling price of
inventories less all estimated costs of completion and costs necessary to make the sale. Inventories are
recorded at weighted-average cost on the balance sheet date.
g. Property, plant and equipment
Property, plant and equipment are initially measured at cost, and subsequently measured at cost less
accumulated depreciation.
Depreciation on property, plant and equipment is recognized using the straight-line method. Each
significant part is depreciated separately. The estimated useful lives, residual values and depreciation
method are reviewed at the end of each reporting period, with the effect of any changes in estimate
accounted for on a prospective basis.
On derecognition of an item of property, plant and equipment, the difference between the sales proceeds
and the carrying amount of the asset is recognized in profit or loss.
h. Goodwill
Goodwill arising from the acquisition of a business is carried at cost, and subsequently measured at cost
less accumulated impairment loss.
For the purposes of impairment testing, goodwill is allocated to each of the Group’s cash-generating
units or groups of cash-generating units (referred to as cash-generating units) that is expected to benefit
from the synergies of the combination.
A cash-generating unit to which goodwill has been allocated is tested for impairment annually, or more
frequently when there is an indication that the unit may be impaired, by comparing its carrying amount,
including the attributed goodwill, with its recoverable amount. If the recoverable amount of the
cash-generating unit is less than its carrying amount, the impairment loss is allocated first to reduce the
carrying amount of any goodwill allocated to the unit and then to the other assets of the unit pro rata
based on the carrying amount of each asset in the unit. Any impairment loss is recognized directly in
This is the translation of the financial statements. CPAs do not audit or review on this translation.
profit or loss. An impairment loss recognized for goodwill is not reversed in subsequent periods.
i. Intangible assets
Intangible assets with finite useful lives that are acquired separately are initially measured at cost and
subsequently measured at cost less accumulated amortization. Amortization is recognized on a
straight-line basis. The estimated useful life, residual value, and amortization method are reviewed at
the end of each reporting period, with the effect of any changes in estimate accounted for on a
prospective basis.
Intangible assets acquired in a business combination and recognized separately from goodwill are
initially recognized at their fair value at the acquisition date (which is regarded as their cost).
Subsequent to initial recognition, they are measured on the same basis as intangible assets that are
acquired separately.
On derecognition of an intangible asset, the difference between the net disposal proceeds and the
carrying amount of the asset are recognized in profit or loss.
j. Impairment of tangible and intangible assets other than goodwill
At the end of each reporting period, the Group reviews the carrying amounts of its tangible and
intangible assets, excluding goodwill, to determine whether there is any indication that those assets
have suffered an impairment loss. If any such indication exists, the recoverable amount of the asset is
estimated in order to determine the extent of the impairment loss. When it is not possible to estimate the
recoverable amount of an individual asset, the Group estimates the recoverable amount of the
cash-generating unit to which the asset belongs to.
Recoverable amount is the higher of fair value less costs to sell and value in use. If the recoverable
amount of an asset or cash-generating unit is estimated to be less than its carrying amount, the carrying
amount of the asset or cash-generating unit is reduced to its recoverable amount, with the resulting
impairment loss recognized in profit or loss.
When an impairment loss is subsequently reversed, the carrying amount of the asset or cash-generating
unit is increased to the revised estimate of its recoverable amount, but only to the extent of the carrying
amount that would have been determined had no impairment loss been recognized for the asset or
cash-generating unit in prior years. A reversal of an impairment loss is recognized in profit or loss.
k. Financial instruments
Financial assets and financial liabilities are recognized when a group entity becomes a party to the
contractual provisions of the instruments.
Financial assets and financial liabilities are initially measured at fair value. Transaction costs that are
directly attributable to the acquisition or issue of financial assets and financial liabilities are added to or
deducted from the fair value of the financial assets or financial liabilities, as appropriate, on initial
recognition. Transaction costs directly attributable to the acquisition of financial assets or financial
liabilities at fair value through profit or loss are recognized immediately in profit or loss.
1) Financial assets
All regular way purchases or sales of financial assets are recognized and derecognized on a trade
date basis.
i) Measurement category
The Group’s financial assets include those measured at FVTPL, at amortized cost and
This is the translation of the financial statements. CPAs do not audit or review on this translation.
investments in debt instruments measured at FVTOCI.
A. Financial asset at FVTPL
The equity instruments that are not specified as FVTOCI and debt instruments that do not
meet the criteria of amortized cost or FVTOCI are mandatorily required to be measured at
FVTPL.
Any dividends, interest earned and gain or loss arising from the remeasurement is
recognized in profit or loss at fair value. The determination methodology of fair value of
financial instruments states in Note 29.
B. Financial assets at amortized cost
Financial assets that meet both two following conditions will subsequently be measured at
amortized cost:
(1) The objective of the business model to hold the financial asset is to collect
contractual cash flows; and
(2) The cash flows from contractual terms of the financial asset on specified dates are
solely matched for payments of principal and interests on the principal amount
outstanding.
Subsequent to initial recognition, financial assets at amortized cost, including cash and cash
equivalents, account receivables at amortized cost, other financial assets, and refundable
deposits, are measured at amortized cost, which equals to gross carrying amount determined
by the effective interest method, subtracting any impairment loss. Foreign exchange
differences are recognized in profit or loss.
Interest income is calculated by applying the effective interest rate to the gross carrying
amount of a financial asset.
Cash equivalents include time deposits with original maturities within 3 months from
obtaining date, high liquidation level, readily convertible to a known amount of cash at any
time, and low risk of changes in value. These cash equivalents are held for the purpose of
meeting short-term cash commitments.
C. Investments in debt instruments at FVTOCI
Investments in debt instruments that meet both the following conditions are subsequently
measured at FVTOCI:
(1) The objective of the business model to hold the financial asset is to collect
contractual cash flows and sell financial assets; and
(2) The cash flows from contractual terms of the financial asset on specified dates are
solely matched for payments of principal and interests on the principal amount
outstanding.
Interest income calculated using the effective interest method, foreign exchange gains and
losses and impairment losses or reversed gains on investments in debt instruments at
FVTOCI are recognized in profit or loss. Other changes in the carrying amount of these debt
instruments are recognized in other comprehensive income and will be reclassified to profit
or loss when these debt instruments are disposed.
This is the translation of the financial statements. CPAs do not audit or review on this translation.
ii) Impairment of financial assets
At the end of each reporting period, the impairment loss is recognized by expected credit
loss method for financial assets at amortized cost (including trade receivables) and for
investments in debt instruments in FVTOCI.
The loss allowance for trade receivables is determined by the expected credit losses over the
lifetime. For other financial assets at amortized cost and investments in debt instruments that
are measured at FVTOCI, if the credit risk on the financial instrument has not increased
significantly after initial recognition, a loss allowance is determined by the expected credit
losses resulting from the possible default events within 12 months after the reporting date. If,
on the other hand, there has been a significant increase in credit risk after initial recognition,
a loss allowance is determined by the expected credit losses resulting from all possible
default events over the expected life of a financial instrument.
Expected credit losses (ECLS) reflect the weighted average of credit losses with the respective risks
of default occurring as the weights. 12-month ECLs represent the portion of lifetime ECLs that is
expected to result from default events on a financial instrument that are possible within 12 months
after the reporting date. In contrast, Lifetime ECLs represent the expected credit losses that will result
from all possible default events over the expected life of a financial instrument.
All impairment loss of the financial instruments with a corresponding adjustment to their
carrying amount are through an allowance account, except for investments in debt
instruments that are measured at FVTOCI, for which the loss allowance is recognized in
other comprehensive income and does not reduce the carrying amount of the financial asset.
iii) Derecognition of financial assets
The Group derecognizes a financial asset only when the contractual rights to the cash flows
from the asset expire, or when it transfers the financial asset and substantially all the risks
and rewards of ownership of the asset to another party.
When a financial asset carried at amortized cost is derecognized in its entirety, the difference
between the asset’s carrying amount and the consideration is recognized in profit or loss. If
the financial asset is an investment in debt instruments at FVTOCI and derecognized in its
entirety, the difference between the asset’s carrying amount and the sum of the consideration
plus the cumulative gain or loss that had been recognized in other comprehensive income is
recognized in profit or loss.
2) Equity instruments
Debt and equity instruments issued by a group entity are classified as either financial liabilities
or as equity in accordance with the substance of the contractual arrangements and the definitions
of a financial liability and an equity instrument.
Equity instruments issued by a group entity are recognized at the proceeds received, net of
direct issue costs.
Repurchase of the Company’s own equity instruments is recognized in and deducted directly
from equity. No gain or loss is recognized in profit or loss on the purchase, sale, issue or
cancellation of the Company’s own equity instruments.
3) Financial liabilities
i) Subsequent measurement
All the financial liabilities are measured by amortized cost using the effective interest method.
This is the translation of the financial statements. CPAs do not audit or review on this translation.
ii) Derecognition of financial liabilities
The difference between the carrying amount of the financial liability derecognized and the
consideration paid, including any non-cash assets transferred or liabilities assumed, is
recognized in profit or loss.
l. Provisions
Provisions are measured at the best estimate of the discounted cash flows of the consideration required
to settle the present obligation at the end of the reporting period, taking into account the risks and
uncertainties surrounding the obligation.
m. Revenue recognition
The Group recognizes revenue when customer’s contract obligations are satisfied.
Revenue comes from sales of human and machine interface devices ICs. Revenue is recognized when
the ICs start to be shipped or are delivered to the specific locations instructed by customers, at which
time the customer has full discretion over the ICs. Revenue and trade receivables are recognized
concurrently.
The Group considers varying contractual terms to estimate sales returns and recognize refund liabilities,
which is classified under other payables.
n. Lease
2020
The Group evaluates if the contract belongs to or includes the lease the commencement date.
The Group as lessee
Except for the leases of low-value asset or short-term leases recognized as expenses on a straight-line
basis, the Group recognizes right-of-use assets and lease liabilities for all leases on the consolidated
balance sheets from the commencement date.
o. Government Grants
Government grants are not recognized until it is assured reasonably that the Group will be able to
comply with the conditions attaching to the subsidies and the grants will be received possibly.
Government grants used as the compensation for expenses or losses already incurred are recognized in
profit or loss in the period in which they become receivable and are not necessary to return.
p. Employee benefits
1) Short-term employee benefits
Liabilities recognized in respect of short-term employee benefits are measured at the undiscounted
amount of the benefits expected to be paid in exchange for the related service.
2) Retirement benefits
Payments to defined contribution retirement benefit plans are recognized as an expense when
employees have rendered service entitling them to the contributions.
This is the translation of the financial statements. CPAs do not audit or review on this translation.
Defined benefit costs (including service cost, net interest and remeasurement) under the defined
benefit retirement benefit plans are determined using the projected unit credit method. Service cost,
including current service cost and net interest on the net defined benefit liability (asset), is
recognized as employee benefits expense in the period it occurs. Remeasurement, comprising
actuarial gains and losses and the return on plan assets (excluding interest), is recognized in other
comprehensive income in the period in which they occur and will not be reclassified to profit or
loss.
Net defined benefit liability represents the actual deficit in the Company’s defined benefit plan.
q. Share-based payment arrangements
Equity-settled and share-based payment arrangements granted to employees
The fair value at the grant date of the equity-settled and share-based payments is expensed on a
straight-line basis over the vesting period, based on the Group’s optimal estimate number of shares or
options that are expected to ultimately vest, with a corresponding increase in capital surplus - employee
share options.
r. Taxation
Income tax expense represents the sum of the tax currently payable and deferred tax.
1) Current tax
The tax on unappropriated earnings according to the Income Tax Law should be accrued in the year
when the resolution regarding to the appropriated earnings is made in the shareholder meeting.
Any adjustment of prior years’ tax liability is counted in the current year’s tax provision.
2) Deferred tax
Deferred tax is recognized on temporary differences between the carrying amounts of assets and
liabilities and the corresponding tax bases used in the computation of taxable profit. In addition, a
deferred tax liability is not recognized on taxable temporary difference arising from initial
recognition of goodwill.
Deferred tax liabilities are generally recognized for all taxable temporary differences. Deferred tax
assets are generally recognized for all deductible temporary differences to the extent that it is
probable that taxable profits will be available against which those deductible temporary differences
can be utilized.
Deferred tax liabilities are recognized for taxable temporary differences associated with investments
in subsidiaries, except where the Group is able to control the reversal of the temporary difference
and it is probable that the temporary difference will not reverse in the foreseeable future. Deferred
tax assets arising from deductible temporary differences associated with such investments and
interests are only recognized to the extent that it is probable that there will be sufficient taxable
profits against which to utilize the benefits of the temporary differences and they are expected to
reverse in the foreseeable future.
The carrying amount of deferred tax assets is reviewed at the end of each reporting period and
reduced to the extent that it is no longer probable that sufficient taxable profits will be available to
allow all or part of the asset to be recovered. A previously unrecognized deferred tax asset is also
reviewed at the end of each reporting period and recognized to the to the extent that it has become
probable that future taxable profit will allow the deferred tax asset to be recovered.
This is the translation of the financial statements. CPAs do not audit or review on this translation.
Deferred tax liabilities and assets are measured at the tax rates that are expected to apply in the
period in which the liability is settled or the asset realized, based on tax rates (and tax laws) that
have been enacted or substantively enacted by the end of the reporting period. The measurement
of deferred tax liabilities and assets reflects the tax consequences that would follow from the
manner in which the Group expects, at the end of the reporting period, to recover or settle the
carrying amount of its assets and liabilities.
3) Current and deferred tax for the year
Current and deferred tax are recognized in profit or loss, except when they relate to items that are
recognized in other comprehensive income, in which case, the deferred tax are recognized in other
comprehensive income.
5. CRITICAL ACCOUNTING JUDGMENTS AND KEY SOURCES OF ESTIMATION
UNCERTAINTY
In the application of the Group’s accounting policies, management is required to make judgments, estimates
and assumptions about the carrying amounts of assets and liabilities that are not readily apparent from other
sources. The estimates and associated assumptions are based on historical experience and other factors that
are considered relevant. Actual results may differ from these estimates.
The estimates and underlying assumptions are reviewed on an ongoing basis. Revisions to accounting
estimates are recognized in the period in which the estimate is revised if the revision affects only that period
or in the period of the revision and future periods if the revision affects both current and future periods.
Impairment of Goodwill
Determining whether goodwill is impaired requires an estimation of the value in use of the cash-generating
units to which goodwill has been allocated. The value in use calculation requires management to estimate
the future cash flows expected to arise from the cash-generating unit and a suitable discount rate in order to
calculate present value. Where the actual future cash flows are less than expected, a material impairment
loss may arise.
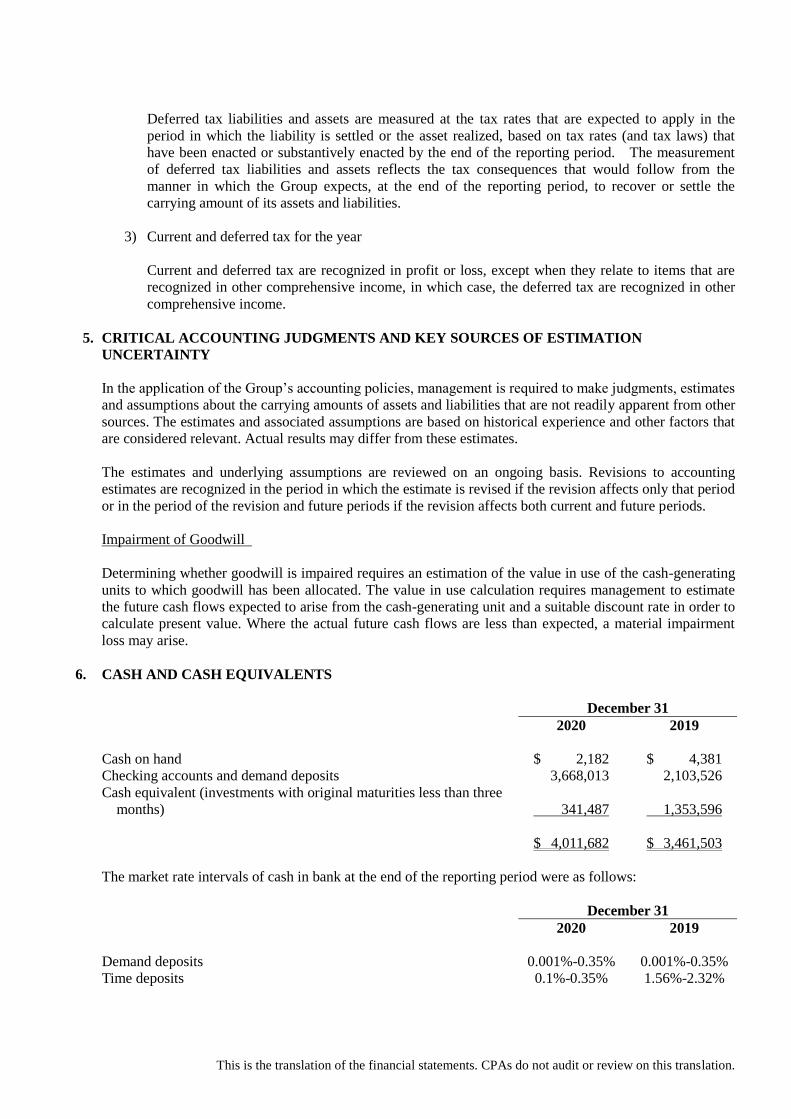
6. CASH AND CASH EQUIVALENTS
December 31
2020 2019
Cash on hand $ 2,182 $ 4,381
Checking accounts and demand deposits 3,668,013 2,103,526
Cash equivalent (investments with original maturities less than three
months) 341,487 1,353,596
$ 4,011,682 $ 3,461,503
The market rate intervals of cash in bank at the end of the reporting period were as follows:
December 31
2020 2019
Demand deposits 0.001%-0.35% 0.001%-0.35%
Time deposits 0.1%-0.35% 1.56%-2.32%
This is the translation of the financial statements. CPAs do not audit or review on this translation.
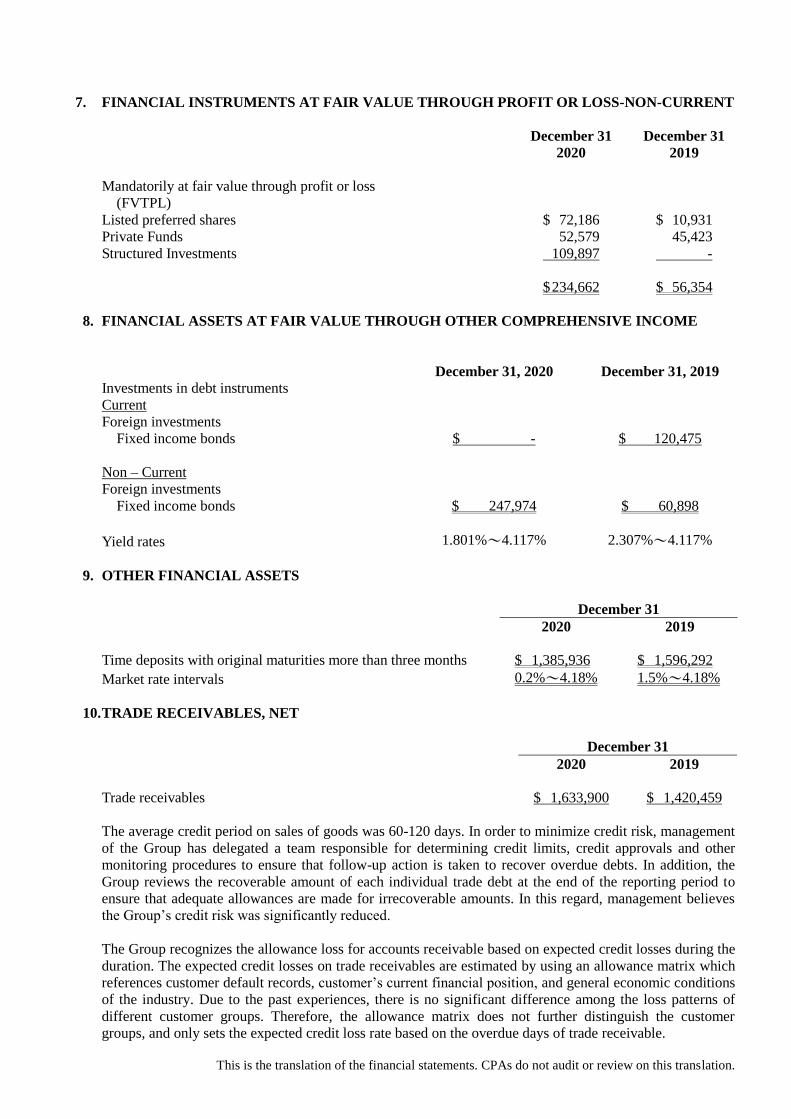
7. FINANCIAL INSTRUMENTS AT FAIR VALUE THROUGH PROFIT OR LOSS-NON-CURRENT
December 31
2020
December 31
2019
Mandatorily at fair value through profit or loss
(FVTPL)
Listed preferred shares $ 72,186 $ 10,931
Private Funds 52,579 45,423
Structured Investments 109,897 -
$ 234,662 $ 56,354
8. FINANCIAL ASSETS AT FAIR VALUE THROUGH OTHER COMPREHENSIVE INCOME
December 31, 2020 December 31, 2019
Investments in debt instruments
Current
Foreign investments
Fixed income bonds $ - $ 120,475
Non – Current
Foreign investments
Fixed income bonds $ 247,974 $ 60,898
Yield rates 1.801%~4.117% 2.307%~4.117%
9. OTHER FINANCIAL ASSETS
December 31
2020 2019
Time deposits with original maturities more than three months $ 1,385,936 $ 1,596,292
Market rate intervals 0.2%~4.18% 1.5%~4.18%
10. TRADE RECEIVABLES, NET
December 31
2020 2019
Trade receivables $ 1,633,900 $ 1,420,459
The average credit period on sales of goods was 60-120 days. In order to minimize credit risk, management
of the Group has delegated a team responsible for determining credit limits, credit approvals and other
monitoring procedures to ensure that follow-up action is taken to recover overdue debts. In addition, the
Group reviews the recoverable amount of each individual trade debt at the end of the reporting period to
ensure that adequate allowances are made for irrecoverable amounts. In this regard, management believes
the Group’s credit risk was significantly reduced.
The Group recognizes the allowance loss for accounts receivable based on expected credit losses during the
duration. The expected credit losses on trade receivables are estimated by using an allowance matrix which
references customer default records, customer’s current financial position, and general economic conditions
of the industry. Due to the past experiences, there is no significant difference among the loss patterns of
different customer groups. Therefore, the allowance matrix does not further distinguish the customer
groups, and only sets the expected credit loss rate based on the overdue days of trade receivable.
This is the translation of the financial statements. CPAs do not audit or review on this translation.
The following table details the loss allowance of trade receivables based on the Group’s allowance matrix.
December 31, 2020
Non Past Due
Overdue 1-60
Days
Overdue 61-180
Days
Overdue Over
181 Days Total
Expected credit loss
rate 0% 0% 0% 0%
0%
Gross carrying amount
and Amortized cost $1,593,485 $ 40,401 $ 14 $ - $ 1,633,900
December 31, 2019
Non Past Due
Overdue 1-60
Days
Overdue 61-180
Days
Overdue Over
181 Days Total
Expected credit loss
rate 0% 0% 0% 0%
0%
Gross carrying amount
and Amortized cost $1,420,085 $ 374 $ - $ - $ 1,420,459
11. INVENTORIES
December 31
2020 2019
Finished goods $ 418,694 $ 476,430
Work in progress 1,025,201 775,899
Raw materials and supplies 311,247 318,424
$ 1,755,142 $ 1,570,753
The cost of inventories recognized as cost of goods sold for the years ended December 31, 2020 and 2019
was $10,371,572 thousand and $7,167,061 thousand, included gain from price recovery of inventory of
$229,556 thousand and $115,912 thousand for the years ended December 31, 2020 and 2019, respectively.
12. SUBSIDIARIES
Subsidiaries included in the consolidated financial statement were as follows:
Proportion of
Ownership
December 31
Investor Investee Nature of Activities 2020 2019
FocalTech Systems FocalTech Corporation, Ltd. Investment activity 100% 100%
Co., Ltd. FocalTech Electronics, Ltd. Investment activity 100% 100%
FocalTech Systems
Co., Ltd. and
FocalTech
Electronics Co.,
Ltd.
FocalTech Smart Sensors,Ltd. Investment activity 67.15%
(a)
67.15%
FocalTech Smart
Sensors,Ltd.
FocalTech Smart Sensors Co.,
Ltd. Research, development, manufacturing
and sale of integrated circuits 100% 100%
FocalTech
Corporation, Ltd.
FocalTech Systems, Inc. Investment activity 100% 100%
FocalTech Systems,
Inc.
FocalTech Systems, Ltd. Investment activity 100% 100%
FocalTech Systems,
Ltd.
FocalTech Systems (Shenzhen)
Co., Ltd. Design and research of integrated circuits 100% 100%
FocalTech Electronics Co., Ltd. Import and export of integrated circuits 100% 100%
FocalTech Electronics, FocalTech Electronics Sales support and post-sales service for 100% 100%
This is the translation of the financial statements. CPAs do not audit or review on this translation.
Ltd. (Shanghai) Co., Ltd. affiliates’ IC products
FocalTech Electronics
(Shenzhen) Co., Ltd. Research, development, manufacturing
and sale of integrated circuits 100% 100%
Hefei PineTech Electronics Co.,
Ltd. Research, development and sale of
integrated circuits 100% 100%
a. FocalTech Smart Sensors, Ltd. is owned solely by FocalTech Electronics Co., Ltd. which was held by
The company and FocalTech Electronics Co., Ltd.
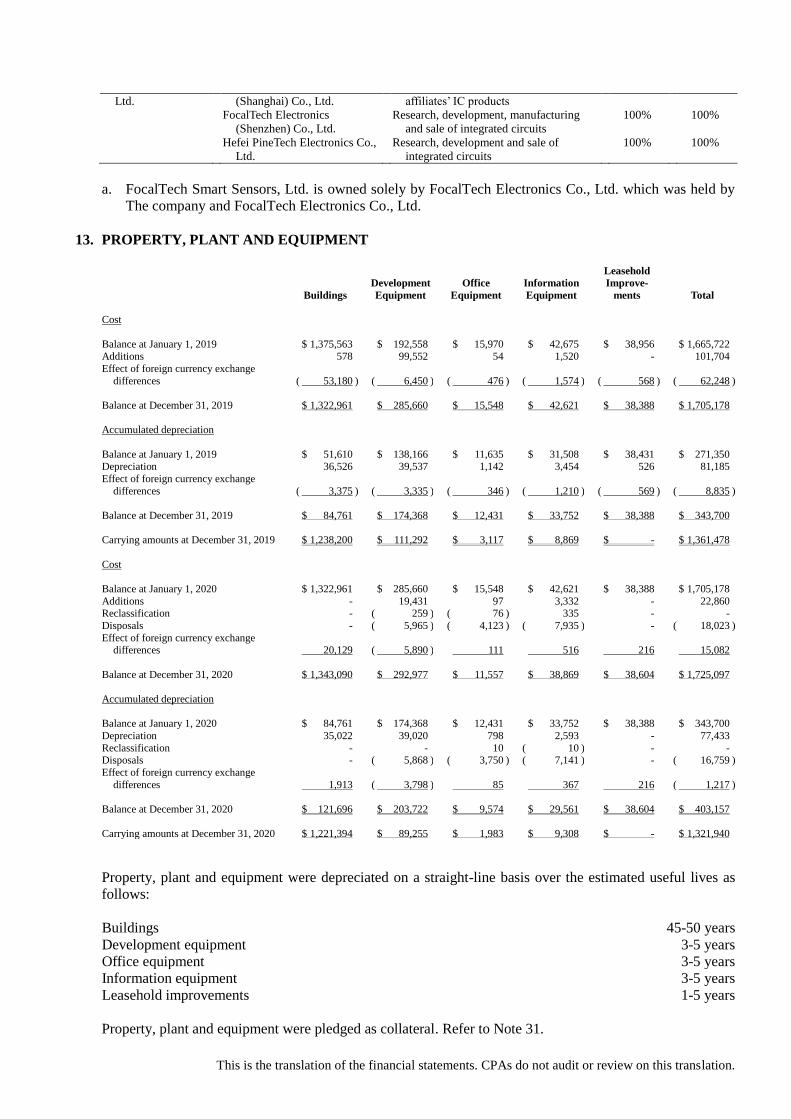
13. PROPERTY, PLANT AND EQUIPMENT
Buildings
Development
Equipment
Office
Equipment
Information
Equipment
Leasehold
Improve-
ments Total
Cost
Balance at January 1, 2019 $ 1,375,563 $ 192,558 $ 15,970 $ 42,675 $ 38,956 $ 1,665,722
Additions 578 99,552 54 1,520 - 101,704
Effect of foreign currency exchange
differences ( 53,180 )
( 6,450 )
( 476 )
( 1,574 )
( 568 )
( 62,248 )
Balance at December 31, 2019 $ 1,322,961 $ 285,660 $ 15,548 $ 42,621 $ 38,388 $ 1,705,178
Accumulated depreciation
Balance at January 1, 2019 $ 51,610 $ 138,166 $ 11,635 $ 31,508 $ 38,431 $ 271,350 Depreciation 36,526 39,537 1,142 3,454 526 81,185
Effect of foreign currency exchange
differences ( 3,375 )
( 3,335 )
( 346 )
( 1,210 )
( 569 )
( 8,835 )
Balance at December 31, 2019 $ 84,761 $ 174,368 $ 12,431 $ 33,752 $ 38,388 $ 343,700
Carrying amounts at December 31, 2019 $ 1,238,200 $ 111,292 $ 3,117 $ 8,869 $ - $ 1,361,478
Cost
Balance at January 1, 2020 $ 1,322,961 $ 285,660 $ 15,548 $ 42,621 $ 38,388 $ 1,705,178
Additions - 19,431 97 3,332 - 22,860 Reclassification - ( 259 ) ( 76 ) 335 - -
Disposals - ( 5,965 ) ( 4,123 ) ( 7,935 ) - ( 18,023 )
Effect of foreign currency exchange differences 20,129
( 5,890 )
111
516
216
15,082
Balance at December 31, 2020 $ 1,343,090 $ 292,977 $ 11,557 $ 38,869 $ 38,604 $ 1,725,097
Accumulated depreciation
Balance at January 1, 2020 $ 84,761 $ 174,368 $ 12,431 $ 33,752 $ 38,388 $ 343,700
Depreciation 35,022 39,020 798 2,593 - 77,433
Reclassification - - 10 ( 10 ) - - Disposals - ( 5,868 ) ( 3,750 ) ( 7,141 ) - ( 16,759 )
Effect of foreign currency exchange
differences 1,913
( 3,798 )
85
367
216
( 1,217 )
Balance at December 31, 2020 $ 121,696 $ 203,722 $ 9,574 $ 29,561 $ 38,604 $ 403,157
Carrying amounts at December 31, 2020 $ 1,221,394 $ 89,255 $ 1,983 $ 9,308 $ - $ 1,321,940
Property, plant and equipment were depreciated on a straight-line basis over the estimated useful lives as
follows:
Buildings 45-50 years
Development equipment 3-5 years
Office equipment 3-5 years
Information equipment 3-5 years
Leasehold improvements 1-5 years
Property, plant and equipment were pledged as collateral. Refer to Note 31.
This is the translation of the financial statements. CPAs do not audit or review on this translation.
14. GOODWILL
For the Year Ended December 31
2020 2019
Ending balance $ 1,237,268 $ 1,237,268
Considering the synergy of integration of LCD driver and touch controller under the industry trend, the
reverse merger was triggered by FocalTech Corporation, Ltd. on January 2, 2015, resulting the goodwill of
$3,237,268 thousand. In 2018, the impacts of market improper competition and the shortage of wafer
supply made the company a serious market share decline, which is expected to influence the market shares
and gross margins in the future. Therefore, the recoverable amount from IDC (Integrated Driver Controller)
less than the carrying value so the Company recognized the impairment loss of $2,000,000 thousand. In
2019, based on the market growth and market share gain in smartphone market, the Group estimated cash
flows from sales of IDC (Integrated Driver Controller), and the recoverable amount exceeded the carrying
value. Therefore, the Group did not recognize any impairment on goodwill.
The recoverable amount is calculated by IDC projected net cash flows, discounted at 15.45% and 10.66%
for the years ended December 31, 2020 and 2019, under the assumptions of management team judgments
and historical experiences with regard to future growth rates and gross margin .
15. OTHER INTANGIBLE ASSETS
Licenses
and
Franchises Software Patents Trademark Total
Cost
Balance at January 1, 2019 $ 130,393 $ 157,801 $ 76,714 $ 74,000 $ 438,908
Additions - 825 - - 825
Effect of foreign currency
exchange differences ( 2,674 )
( 3,656 )
( 10 )
-
( 6,340 )
Balance at December 31, 2019 $ 127,719 $ 154,970 $ 76,704 $ 74,000 $ 433,393
Accumulated amortization
Balance at January 1, 2019 $ 95,724 $ 133,210 $ 31,376 $ 29,600 $ 289,910
Amortization expense 16,296 18,704 7,786 7,400 50,186
Effect of foreign currency
exchange differences ( 2,344 )
( 3,538 )
( 10 )
-
( 5,892 )
Balance at December 31, 2019 $ 109,676 $ 148,376 $ 39,152 $ 37,000 $ 334,204
Carrying amounts at
December 31, 2019 $ 18,043
$ 6,594
$ 37,552
$ 37,000
$ 99,189
Cost
Balance at January 1, 2020 $ 127,719 $ 154,970 $ 76,704 $ 74,000 $ 433,393
Additions - 147 - - 147
Effect of foreign currency
exchange differences ( 5,457 )
( 6,870 )
4
-
( 12,323 )
Balance at December 31, 2020 $ 122,262 $ 148,247 $ 76,708 $ 74,000 $ 421,217
This is the translation of the financial statements. CPAs do not audit or review on this translation.
Accumulated amortization
Balance at January 1, 2020 $ 109,676 $ 148,376 $ 39,152 $ 37,000 $ 334,204
Amortization expense 17,660 3,057 7,786 7,400 35,903
Effect of foreign currency
exchange differences ( 5,206 )
( 6,890 )
4
-
( 12,092 )
Balance at December 31, 2020 $ 122,130 $ 144,543 $ 46,942 $ 44,400 $ 358,015
Carrying amounts at
December 31, 2020 $ 132
$ 3,704
$ 29,766
$ 29,600
$ 63,202
Other intangible assets were amortized on a straight-line basis over the estimated useful lives as follows:
Licenses and franchises 3-5 years
Software 1-5 years
Patents 7-10 years
Trademark 10 years
16. SHORT-TERM BORROWINGS
December 31
2020 2019
Unsecured bank loans $ 480,000 $ -
Secured bank loans 43,648 -
$ 523,648 $ -
Annual interest rate
Unsecured bank loans 0.88~1.06%
Secured bank loans 4.1%
17. TRADE PAYABLES
December 31
2020 2019
Trade payables $ 1,731,109 $ 1,986,219
The average credit period on purchases was 30-60 days. The Group has financial risk management policies
in place to ensure that all payables are paid within the pre-agreed credit terms.
18. OTHER PAYABLES
December 31
2020 2019
Payable for rebates $ 423,800 $ 408,291
Payable for salaries and bonus 467,979 411,236
Payable for labor, health and social insurance 13,977 12,367
Reserve for litigations 47,598 50,105
Payable for professional services and others 84,077 72,450
$1,037,431 $ 954,449
This is the translation of the financial statements. CPAs do not audit or review on this translation.
19. RETIREMENT BENEFIT
a. Defined contribution plans
The Company、FocalTech Smart Sensors Co., Ltd. and FocalTech Electronics Co., Ltd. adopted a
pension plan under the Labor Pension Act (the “LPA”), which is a state-managed defined contribution
plan. Under the LPA, an entity makes monthly contributions to employees’ individual pension accounts
at 6% of monthly salaries and wages.
b. Defined benefit plans
The defined benefit plan adopted by the Company in accordance with the Labor Standards Law is
operated by the government. Pension benefits are calculated on the basis of the length of service and
average monthly salaries of the six months before retirement. The Company contributes amounts
equal to 2% of total monthly salaries and wages to a pension fund administered by the pension fund
monitoring committee. Pension contributions are deposited in the Bank of Taiwan in the committee’s
name. Before the end of each year, the Company assesses the balance in the pension fund. If the
amount of the balance in the pension fund is inadequate to pay retirement benefits for employees who
conform to retirement requirements in the next year, the Company is required to fund the difference in
one appropriation that should be made before the end of March of the next year. The pension fund is
managed by the Bureau of Labor Funds, Ministry of Labor (“the Bureau”); the Company has no right to
influence the investment policy and strategy.
The amounts included in the consolidated balance sheets in respect of the Group’s defined benefit plans
were as follows:
December 31
2020 2019
Present value of defined benefit obligation $ 42,275 $ 45,235
Fair value of plan assets ( 18,909) ( 21,157)
Net defined benefit liability $ 23,366 $ 24,078
Movements in net defined benefit liability were as follows:
Present Value of
the Defined
Benefit
Obligation
Fair Value of
the Plan Assets
Net Defined
Benefit
Liability (Asset)
Balance at January 1, 2019 $ 45,590 ($ 19,494) $ 26,096
Service cost
Current service cost 125 - 125
Net interest expense (income) 570 ( 248) 322
Recognized in profit or loss 695 ( 248) 447
Remeasurement
Return on plan assets (excluding amounts
included in net interest) - ( 627) ( 627)
Actuarial loss - changes in financial
assumptions 1,421 - 1,421
Actuarial loss - experience adjustments ( 2,471) - ( 2,471)
Recognized in other comprehensive income ( 1,050) ( 627) ( 1,677)
Contributions from the employer - ( 788) ( 788)
This is the translation of the financial statements. CPAs do not audit or review on this translation.
Balance at December 31, 2019 45,235 ( 21,157) 24,078
Service cost
Current service cost 126 - 126
Net interest expense (income) 452 ( 215) 237
Recognized in profit or loss 578 ( 215) 363
Remeasurement
Return on plan assets (excluding amounts
included in net interest) - ( 619) ( 619)
1,436 - 1,436
Actuarial loss - changes in financial
assumptions 1,151 - 1,151
Actuarial loss - experience adjustments ( 2,327) - ( 2,327)
Recognized in other comprehensive income 260 ( 619) ( 359)
Contributions from the employer - ( 716) ( 716)
Benefits paid ( 3,798) 3,798 -
Balance at December 31, 2020 $ 42,275 ($ 18,909) $ 23,366
Through the defined benefit plans under the Labor Standards Law, the Group is exposed to the
following risks:
1) Investment risk: The plan assets are invested in domestic/and foreign/equity and debt securities,
bank deposits, etc. The investment is conducted at the discretion of the Bureau or under the
mandated management. However, in accordance with relevant regulations, the return generated by
plan assets should not be below the interest rate for a 2-year time deposit with local banks.
2) Interest risk: A decrease in the government bond interest rate will increase the present value of the
defined benefit obligation; however, this will be partially offset by an increase in the return on the
plan’s debt investments.
3) Salary risk: The present value of the defined benefit obligation is calculated by reference to the
future salaries of plan participants. As such, an increase in the salary of the plan participants will
increase the present value of the defined benefit obligation.
The actuarial valuations of the present value of the defined benefit obligation were carried out by
qualified actuaries. The significant assumptions used for the purposes of the actuarial valuations were as
follows:
December 31
2020 2019
Discount rate 0.8% 1%
Expected rate of salary increase 4.5% 4.5%
If possible reasonable change in each of the significant actuarial assumptions will occur and all other
assumptions will remain constant, the present value of the defined benefit obligation would increase
(decrease) as follows:
December 31
2020 2019
Discount rate
0.25% increase ($ 1,501) ($ 1,422)
0.25% decrease $ 1,566 $ 1,481
Expected rate of salary increase
This is the translation of the financial statements. CPAs do not audit or review on this translation.
1% increase $ 6,441 $ 6,141
1% decrease ($ 5,567) ($ 5,334)
The sensitivity analysis presented above may not be representative of the actual change in the present
value of the defined benefit obligation as it is unlikely that the change in assumptions would occur in
isolation of one another as some of the assumptions may be correlated.
December 31
2020 2019
The expected contributions to the plan for the next year $ 717 $ 770
The average duration of the defined benefit obligation 16.1 years 14.9 years
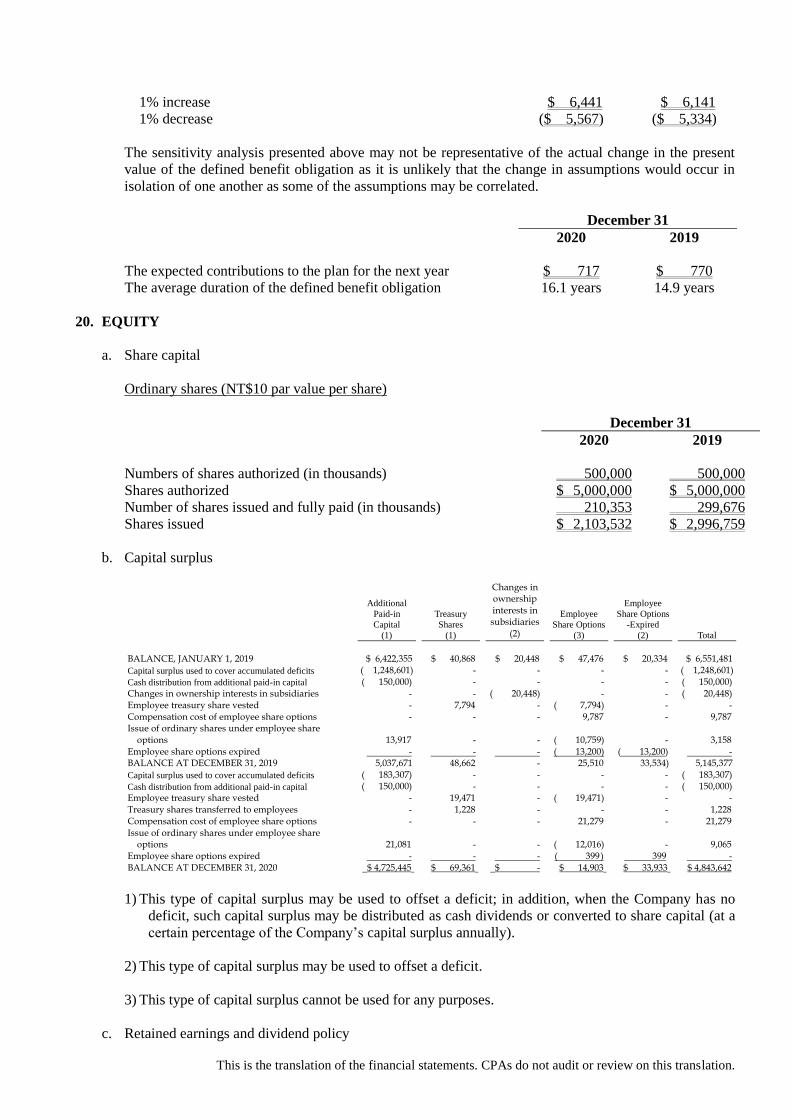
20. EQUITY
a. Share capital
Ordinary shares (NT$10 par value per share)
December 31
2020 2019
Numbers of shares authorized (in thousands) 500,000 500,000
Shares authorized $ 5,000,000 $ 5,000,000
Number of shares issued and fully paid (in thousands) 210,353 299,676
Shares issued $ 2,103,532 $ 2,996,759
b. Capital surplus
Additional
Paid-in
Capital
(1)
Treasury
Shares
(1)
Changes in ownership interests in subsidiaries
(2)
Employee
Share Options
(3)
Employee
Share Options
-Expired
(2) Total
BALANCE, JANUARY 1, 2019 $ 6,422,355 $ 40,868 $ 20,448 $ 47,476 $ 20,334 $ 6,551,481
Capital surplus used to cover accumulated deficits ( 1,248,601) - - - - ( 1,248,601)
Cash distribution from additional paid-in capital ( 150,000) - - - - ( 150,000) Changes in ownership interests in subsidiaries - - ( 20,448) - - ( 20,448) Employee treasury share vested - 7,794 - ( 7,794) - - Compensation cost of employee share options - - - 9,787 - 9,787 Issue of ordinary shares under employee share
options 13,917 - - ( 10,759) - 3,158 Employee share options expired - - - ( 13,200) ( 13,200) - BALANCE AT DECEMBER 31, 2019 5,037,671 48,662 - 25,510 33,534) 5,145,377
Capital surplus used to cover accumulated deficits ( 183,307) - - - - ( 183,307)
Cash distribution from additional paid-in capital ( 150,000) - - - - ( 150,000) Employee treasury share vested - 19,471 - ( 19,471) - - Treasury shares transferred to employees - 1,228 - - - 1,228
Compensation cost of employee share options - - - 21,279 - 21,279 Issue of ordinary shares under employee share
options 21,081 - - ( 12,016) - 9,065 Employee share options expired - - - ( 399 ) 399 - BALANCE AT DECEMBER 31, 2020 $ 4,725,445 $ 69,361 $ - $ 14,903 $ 33,933 $ 4,843,642
1) This type of capital surplus may be used to offset a deficit; in addition, when the Company has no
deficit, such capital surplus may be distributed as cash dividends or converted to share capital (at a
certain percentage of the Company’s capital surplus annually).
2) This type of capital surplus may be used to offset a deficit.
3) This type of capital surplus cannot be used for any purposes.
c. Retained earnings and dividend policy
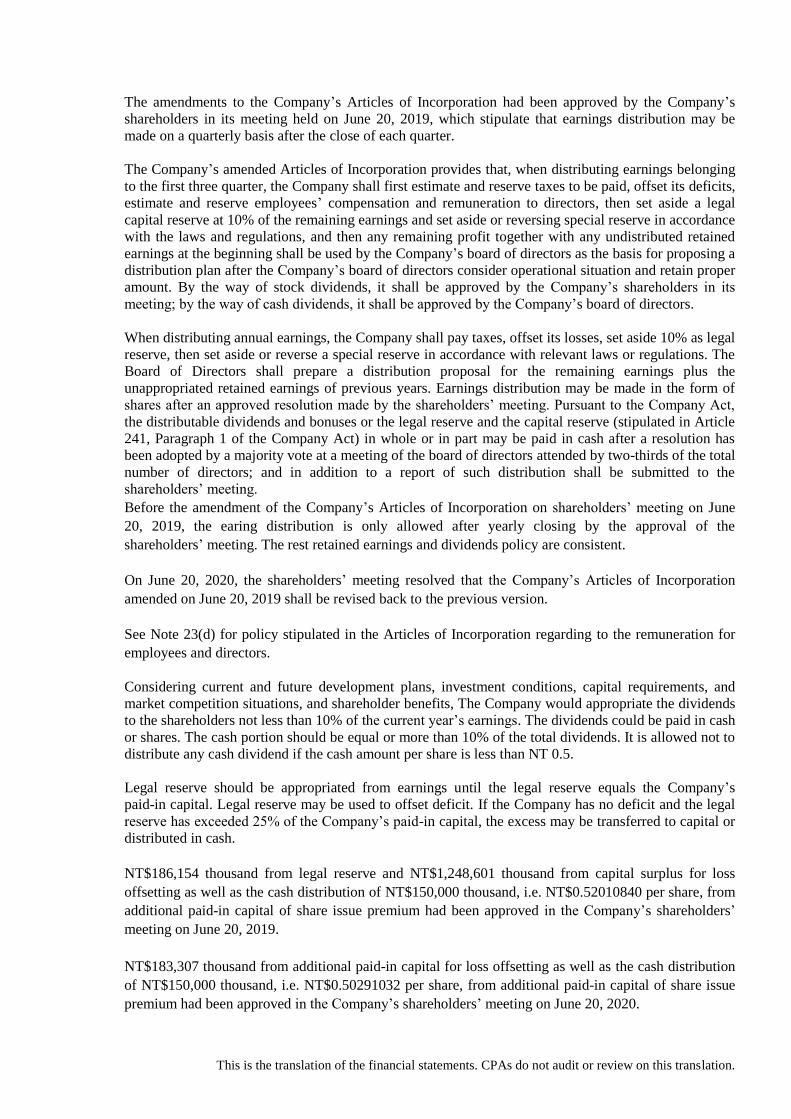
This is the translation of the financial statements. CPAs do not audit or review on this translation.
The amendments to the Company’s Articles of Incorporation had been approved by the Company’s
shareholders in its meeting held on June 20, 2019, which stipulate that earnings distribution may be
made on a quarterly basis after the close of each quarter.
The Company’s amended Articles of Incorporation provides that, when distributing earnings belonging
to the first three quarter, the Company shall first estimate and reserve taxes to be paid, offset its deficits,
estimate and reserve employees’ compensation and remuneration to directors, then set aside a legal
capital reserve at 10% of the remaining earnings and set aside or reversing special reserve in accordance
with the laws and regulations, and then any remaining profit together with any undistributed retained
earnings at the beginning shall be used by the Company’s board of directors as the basis for proposing a
distribution plan after the Company’s board of directors consider operational situation and retain proper
amount. By the way of stock dividends, it shall be approved by the Company’s shareholders in its
meeting; by the way of cash dividends, it shall be approved by the Company’s board of directors.
When distributing annual earnings, the Company shall pay taxes, offset its losses, set aside 10% as legal
reserve, then set aside or reverse a special reserve in accordance with relevant laws or regulations. The
Board of Directors shall prepare a distribution proposal for the remaining earnings plus the
unappropriated retained earnings of previous years. Earnings distribution may be made in the form of
shares after an approved resolution made by the shareholders’ meeting. Pursuant to the Company Act,
the distributable dividends and bonuses or the legal reserve and the capital reserve (stipulated in Article
241, Paragraph 1 of the Company Act) in whole or in part may be paid in cash after a resolution has
been adopted by a majority vote at a meeting of the board of directors attended by two-thirds of the total
number of directors; and in addition to a report of such distribution shall be submitted to the
shareholders’ meeting.
Before the amendment of the Company’s Articles of Incorporation on shareholders’ meeting on June
20, 2019, the earing distribution is only allowed after yearly closing by the approval of the
shareholders’ meeting. The rest retained earnings and dividends policy are consistent.
On June 20, 2020, the shareholders’ meeting resolved that the Company’s Articles of Incorporation
amended on June 20, 2019 shall be revised back to the previous version.
See Note 23(d) for policy stipulated in the Articles of Incorporation regarding to the remuneration for
employees and directors.
Considering current and future development plans, investment conditions, capital requirements, and
market competition situations, and shareholder benefits, The Company would appropriate the dividends
to the shareholders not less than 10% of the current year’s earnings. The dividends could be paid in cash
or shares. The cash portion should be equal or more than 10% of the total dividends. It is allowed not to
distribute any cash dividend if the cash amount per share is less than NT 0.5.
Legal reserve should be appropriated from earnings until the legal reserve equals the Company’s
paid-in capital. Legal reserve may be used to offset deficit. If the Company has no deficit and the legal
reserve has exceeded 25% of the Company’s paid-in capital, the excess may be transferred to capital or
distributed in cash.
NT$186,154 thousand from legal reserve and NT$1,248,601 thousand from capital surplus for loss
offsetting as well as the cash distribution of NT$150,000 thousand, i.e. NT$0.52010840 per share, from
additional paid-in capital of share issue premium had been approved in the Company’s shareholders’
meeting on June 20, 2019.
NT$183,307 thousand from additional paid-in capital for loss offsetting as well as the cash distribution
of NT$150,000 thousand, i.e. NT$0.50291032 per share, from additional paid-in capital of share issue
premium had been approved in the Company’s shareholders’ meeting on June 20, 2020.
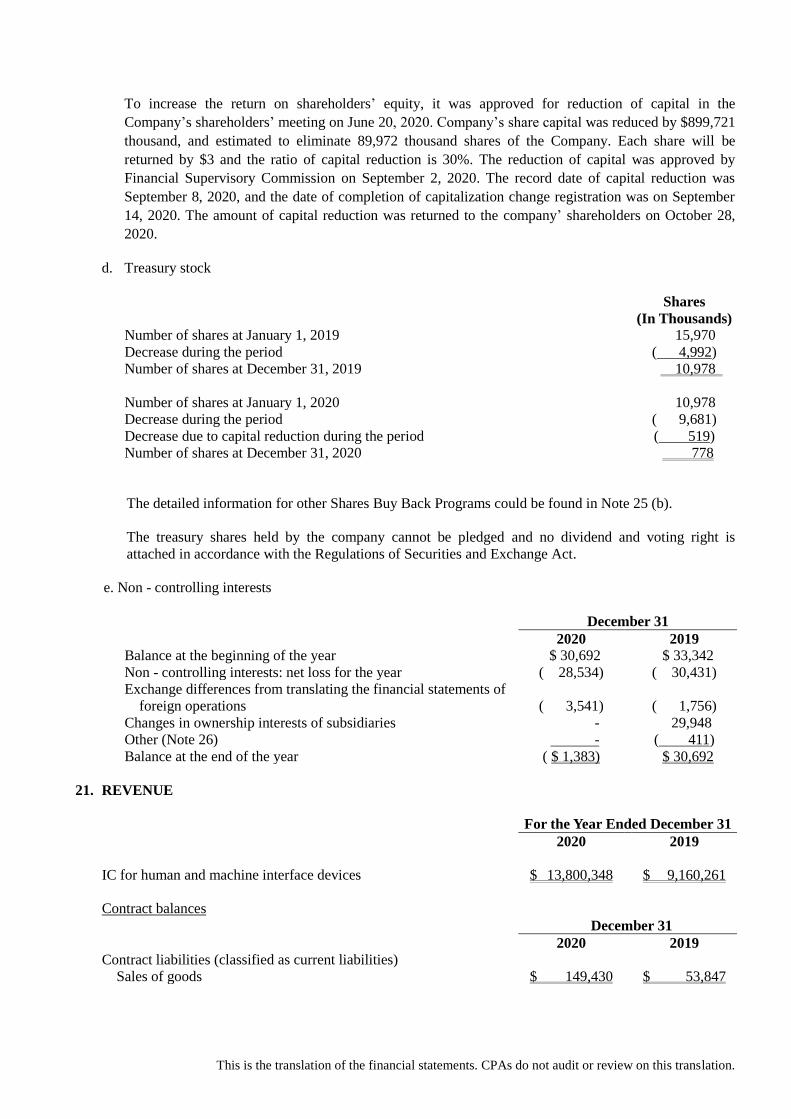
This is the translation of the financial statements. CPAs do not audit or review on this translation.
To increase the return on shareholders’ equity, it was approved for reduction of capital in the
Company’s shareholders’ meeting on June 20, 2020. Company’s share capital was reduced by $899,721
thousand, and estimated to eliminate 89,972 thousand shares of the Company. Each share will be
returned by $3 and the ratio of capital reduction is 30%. The reduction of capital was approved by
Financial Supervisory Commission on September 2, 2020. The record date of capital reduction was
September 8, 2020, and the date of completion of capitalization change registration was on September
14, 2020. The amount of capital reduction was returned to the company’ shareholders on October 28,
2020.
d. Treasury stock
Shares
(In Thousands)
Number of shares at January 1, 2019 15,970
Decrease during the period ( 4,992)
Number of shares at December 31, 2019 10,978
Number of shares at January 1, 2020 10,978
Decrease during the period ( 9,681)
Decrease due to capital reduction during the period ( 519)
Number of shares at December 31, 2020 778
The detailed information for other Shares Buy Back Programs could be found in Note 25 (b).
The treasury shares held by the company cannot be pledged and no dividend and voting right is
attached in accordance with the Regulations of Securities and Exchange Act.
e. Non - controlling interests
December 31
2020 2019
Balance at the beginning of the year $ 30,692 $ 33,342
Non - controlling interests: net loss for the year ( 28,534) ( 30,431)
Exchange differences from translating the financial statements of
foreign operations ( 3,541) ( 1,756)
Changes in ownership interests of subsidiaries - 29,948
Other (Note 26) - ( 411)
Balance at the end of the year ( $ 1,383) $ 30,692
21. REVENUE
For the Year Ended December 31
2020 2019
IC for human and machine interface devices $ 13,800,348 $ 9,160,261
Contract balances
December 31
2020 2019
Contract liabilities (classified as current liabilities)
Sales of goods $ 149,430 $ 53,847
This is the translation of the financial statements. CPAs do not audit or review on this translation.
22. NET INCOME
a. Finance costs
For the Year Ended December 31
2020 2019
Interest on deposits $ 1,078 $ 1,150
Interest on bank loans 931 2
$ 2,009 $ 1,152
b. Depreciation and amortization
For the Year Ended December 31
2020 2019
Property, plant and equipment $ 77,433 $ 81,185
Intangible assets 35,903 50,186
$ 113,336 $ 131,371
An analysis of depreciation and
amortization by function
Operating costs $ 722 $ 1,299
Operating expenses 112,614 130,072
$ 113,336 $ 131,371
c. Employee benefits expense
For the Year Ended December 31
2020 2019
Post-employment benefits
Defined contribution plans $ 28,022 $ 28,771
Defined benefit plans (see Note 19) 363 447
Share-based payments (see Note 25) 21,279 9,787
Other employee benefits 1,442,245 1,431,412
Total employee benefits expense $ 1,491,909 $ 1,470,417
An analysis of employee benefits expense by function
Operating costs $ 124,636 $ 111,910
Operating expenses 1,367,273 1,358,237
$ 1,491,909 $ 1,470,147
d. The remuneration to employees and directors
The Company stipulates to distribute employees’ compensation and remuneration to directors at the
rates no less than 1% and no higher than 1.5%, respectively, of net profit before income tax,
employees’ compensation, and remuneration to directors. In 2020 and 2019, due to the net loss before
tax, there was no accrual for any remuneration to employees and directors. The accrued employees’
compensation and remuneration to directors for the year ended December 31, 2020 are as follows:
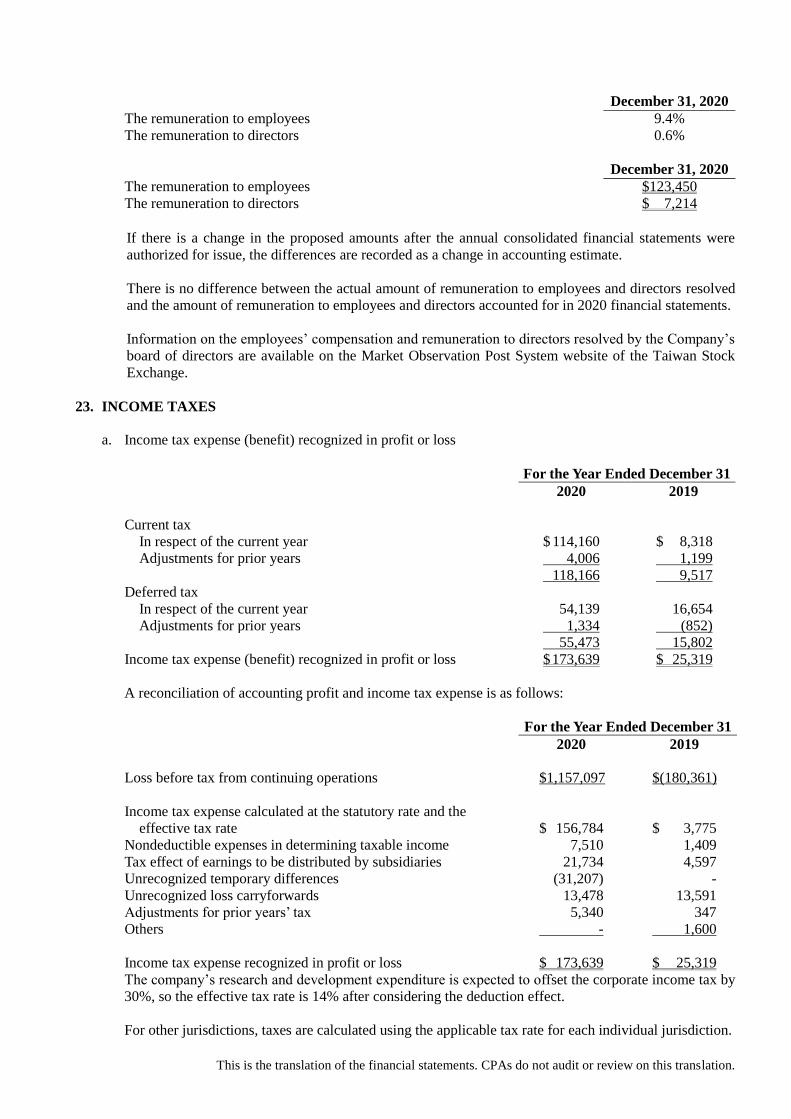
This is the translation of the financial statements. CPAs do not audit or review on this translation.
December 31, 2020
The remuneration to employees 9.4%
The remuneration to directors 0.6%
December 31, 2020
The remuneration to employees $123,450
The remuneration to directors $ 7,214
If there is a change in the proposed amounts after the annual consolidated financial statements were
authorized for issue, the differences are recorded as a change in accounting estimate.
There is no difference between the actual amount of remuneration to employees and directors resolved
and the amount of remuneration to employees and directors accounted for in 2020 financial statements.
Information on the employees’ compensation and remuneration to directors resolved by the Company’s
board of directors are available on the Market Observation Post System website of the Taiwan Stock
Exchange.
23. INCOME TAXES
a. Income tax expense (benefit) recognized in profit or loss
For the Year Ended December 31
2020 2019
Current tax
In respect of the current year $ 114,160 $ 8,318
Adjustments for prior years 4,006 1,199
118,166 9,517
Deferred tax
In respect of the current year 54,139 16,654
Adjustments for prior years 1,334 (852)
55,473 15,802
Income tax expense (benefit) recognized in profit or loss $ 173,639 $ 25,319
A reconciliation of accounting profit and income tax expense is as follows:
For the Year Ended December 31
2020 2019
Loss before tax from continuing operations $1,157,097 $(180,361)
Income tax expense calculated at the statutory rate and the
effective tax rate $ 156,784 $ 3,775
Nondeductible expenses in determining taxable income 7,510 1,409
Tax effect of earnings to be distributed by subsidiaries 21,734 4,597
Unrecognized temporary differences (31,207) -
Unrecognized loss carryforwards 13,478 13,591
Adjustments for prior years’ tax 5,340 347
Others - 1,600
Income tax expense recognized in profit or loss $ 173,639 $ 25,319
The company’s research and development expenditure is expected to offset the corporate income tax by
30%, so the effective tax rate is 14% after considering the deduction effect.
For other jurisdictions, taxes are calculated using the applicable tax rate for each individual jurisdiction.
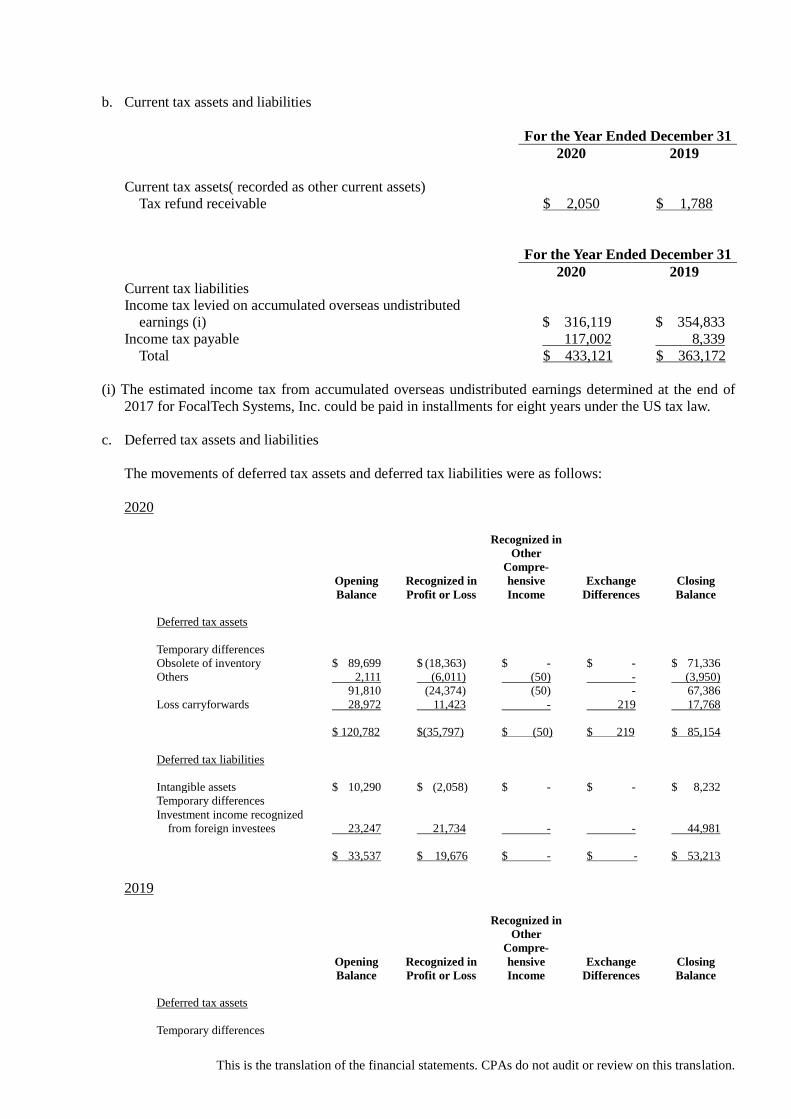
This is the translation of the financial statements. CPAs do not audit or review on this translation.
b. Current tax assets and liabilities
For the Year Ended December 31
2020 2019
Current tax assets( recorded as other current assets)
Tax refund receivable $ 2,050 $ 1,788
For the Year Ended December 31
2020 2019
Current tax liabilities
Income tax levied on accumulated overseas undistributed
earnings (i) $ 316,119 $ 354,833
Income tax payable 117,002 8,339
Total $ 433,121 $ 363,172
(i) The estimated income tax from accumulated overseas undistributed earnings determined at the end of
2017 for FocalTech Systems, Inc. could be paid in installments for eight years under the US tax law.
c. Deferred tax assets and liabilities
The movements of deferred tax assets and deferred tax liabilities were as follows:
2020
Opening
Balance Recognized in
Profit or Loss
Recognized in
Other
Compre-
hensive
Income
Exchange
Differences Closing
Balance
Deferred tax assets
Temporary differences
Obsolete of inventory $ 89,699 $ (18,363)
$ -
$ - $ 71,336
Others 2,111 (6,011)
(50)
- (3,950)
91,810 (24,374)
(50)
- 67,386
Loss carryforwards 28,972 11,423
-
219 17,768
$ 120,782 $(35,797)
$ (50)
$ 219 $ 85,154
Deferred tax liabilities
Intangible assets $ 10,290 $ (2,058)
$ - $ - $ 8,232
Temporary differences
Investment income recognized
from foreign investees 23,247 21,734
- - 44,981
$ 33,537 $ 19,676
$ - $ - $ 53,213
2019
Opening
Balance Recognized in
Profit or Loss
Recognized in
Other
Compre-
hensive
Income
Exchange
Differences Closing
Balance
Deferred tax assets
Temporary differences
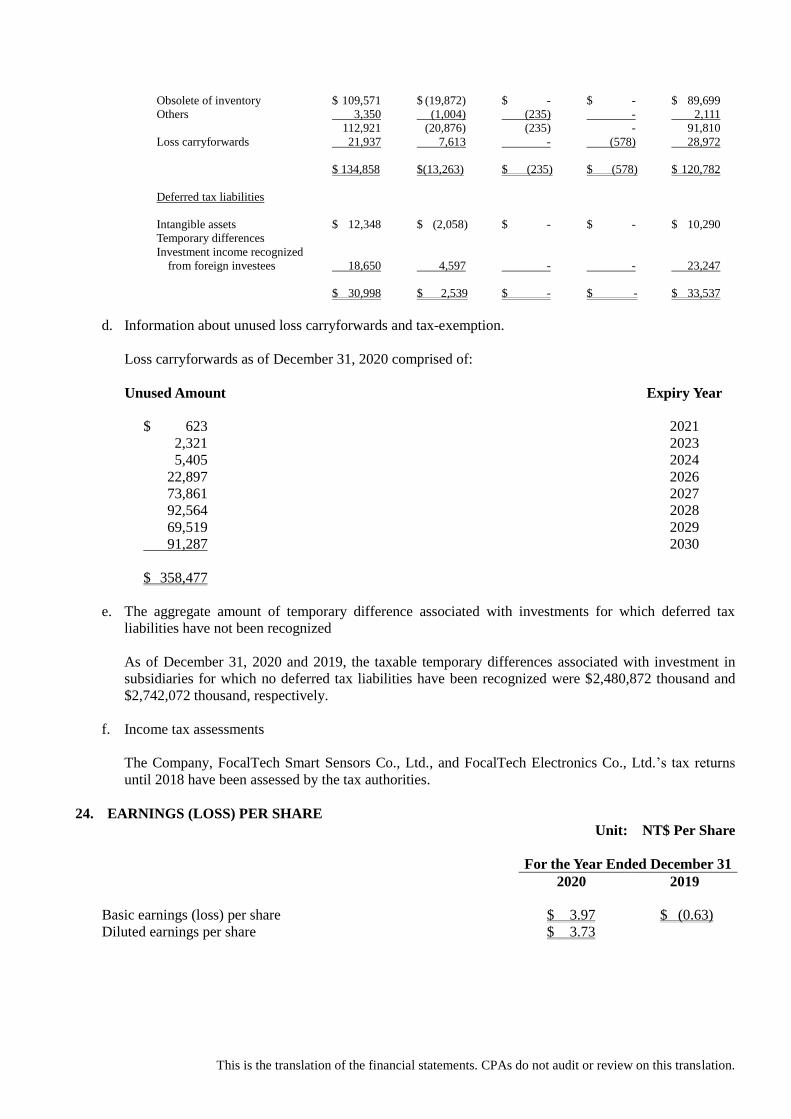
This is the translation of the financial statements. CPAs do not audit or review on this translation.
Obsolete of inventory $ 109,571 $ (19,872)
$ -
$ - $ 89,699
Others 3,350 (1,004)
(235)
- 2,111
112,921 (20,876)
(235)
- 91,810
Loss carryforwards 21,937 7,613
-
(578) 28,972
$ 134,858 $(13,263)
$ (235)
$ (578) $ 120,782
Deferred tax liabilities
Intangible assets $ 12,348 $ (2,058)
$ - $ - $ 10,290
Temporary differences
Investment income recognized
from foreign investees 18,650 4,597
- - 23,247
$ 30,998 $ 2,539
$ - $ - $ 33,537
d. Information about unused loss carryforwards and tax-exemption.
Loss carryforwards as of December 31, 2020 comprised of:
Unused Amount Expiry Year
$ 623 2021
2,321 2023
5,405 2024
22,897 2026
73,861 2027
92,564 2028
69,519 2029
91,287 2030
$ 358,477
e. The aggregate amount of temporary difference associated with investments for which deferred tax
liabilities have not been recognized
As of December 31, 2020 and 2019, the taxable temporary differences associated with investment in
subsidiaries for which no deferred tax liabilities have been recognized were $2,480,872 thousand and
$2,742,072 thousand, respectively.
f. Income tax assessments
The Company, FocalTech Smart Sensors Co., Ltd., and FocalTech Electronics Co., Ltd.’s tax returns
until 2018 have been assessed by the tax authorities.
24. EARNINGS (LOSS) PER SHARE
Unit: NT$ Per Share
For the Year Ended December 31
2020 2019
Basic earnings (loss) per share $ 3.97 $ (0.63)
Diluted earnings per share $ 3.73
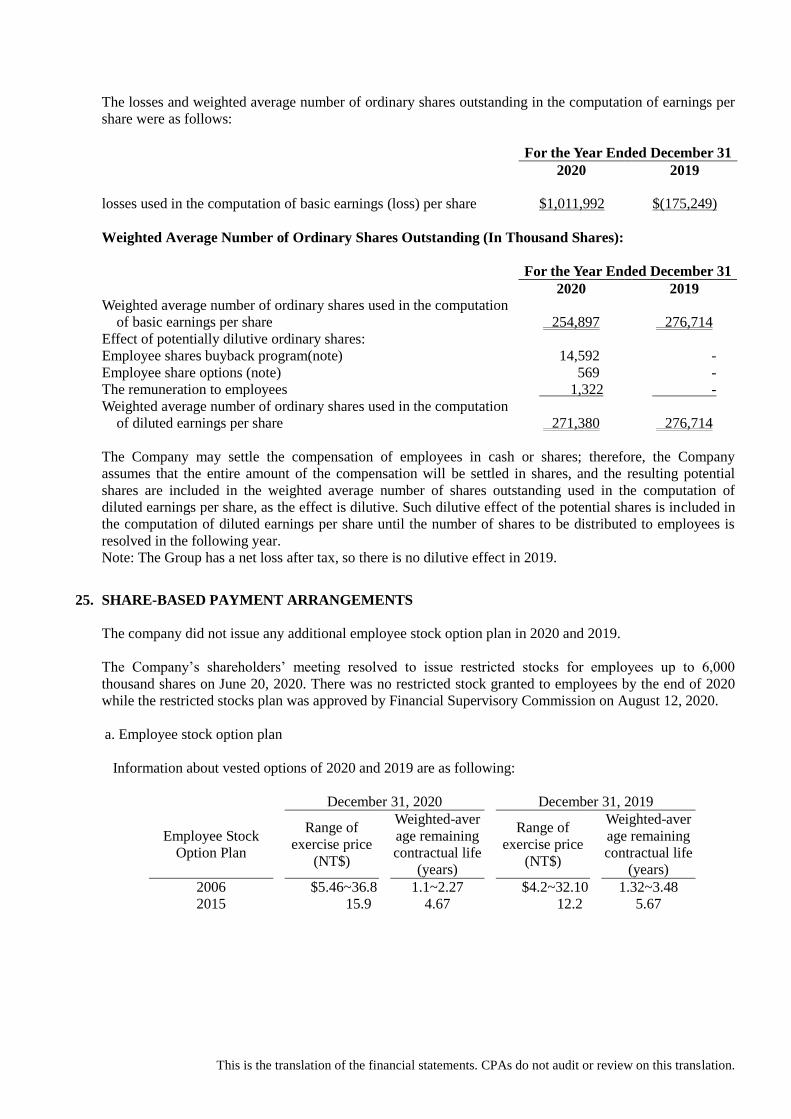
This is the translation of the financial statements. CPAs do not audit or review on this translation.
The losses and weighted average number of ordinary shares outstanding in the computation of earnings per
share were as follows:
For the Year Ended December 31
2020 2019
losses used in the computation of basic earnings (loss) per share $1,011,992 $(175,249)
Weighted Average Number of Ordinary Shares Outstanding (In Thousand Shares):
For the Year Ended December 31
2020 2019
Weighted average number of ordinary shares used in the computation
of basic earnings per share 254,897 276,714
Effect of potentially dilutive ordinary shares:
Employee shares buyback program(note) 14,592 -
Employee share options (note) 569 -
The remuneration to employees 1,322 -
Weighted average number of ordinary shares used in the computation
of diluted earnings per share 271,380 276,714
The Company may settle the compensation of employees in cash or shares; therefore, the Company
assumes that the entire amount of the compensation will be settled in shares, and the resulting potential
shares are included in the weighted average number of shares outstanding used in the computation of
diluted earnings per share, as the effect is dilutive. Such dilutive effect of the potential shares is included in
the computation of diluted earnings per share until the number of shares to be distributed to employees is
resolved in the following year.
Note: The Group has a net loss after tax, so there is no dilutive effect in 2019.
25. SHARE-BASED PAYMENT ARRANGEMENTS
The company did not issue any additional employee stock option plan in 2020 and 2019.
The Company’s shareholders’ meeting resolved to issue restricted stocks for employees up to 6,000
thousand shares on June 20, 2020. There was no restricted stock granted to employees by the end of 2020
while the restricted stocks plan was approved by Financial Supervisory Commission on August 12, 2020.
a. Employee stock option plan
Information about vested options of 2020 and 2019 are as following:
December 31, 2020 December 31, 2019
Employee Stock
Option Plan
Range of
exercise price
(NT$)
Weighted-aver
age remaining
contractual life
(years)
Range of
exercise price
(NT$)
Weighted-aver
age remaining
contractual life
(years)
2006 $5.46~36.8 1.1~2.27 $4.2~32.10 1.32~3.48
2015 15.9 4.67 12.2 5.67
This is the translation of the financial statements. CPAs do not audit or review on this translation.
Information about outstanding options in 2020 and 2019 is as following:
2020
Beginning Balance Options unvested Options exercised Options expired Ending Balance
Employee
Stock Option Plan
Quantity
of Options
Weighted-
average
Exercise Price
(NT$)
Quantity
of Options
Weighted-
average
Exercise Price
(NT$)
Quantity
of Options
Weighted-
average
Exercise Price
(NT$)
Quantity
of Options
Weighted-
average
Exercise Price
(NT$)
Quantity
of Options
Weighted-
average
Exercise Price
(NT$)
2006 805,599 $ 23.49 - $ - (407,400) $ 29.68 $ - 398,199 $ 26.65
2015 677,500 12.20 - - (242,000) 14.33 ( 38,000) 13.56 397,500 15.90
2019
Beginning Balance Options unvested Options exercised Options expired Ending Balance
Employee
Stock Option Plan
Quantity
of Options
Weighted-
average
Exercise Price
(NT$)
Quantity
of Options
Weighted-
average
Exercise Price
(NT$)
Quantity
of Options
Weighted-
average
Exercise Price
(NT$)
Quantity
of Options
Weighted-
average
Exercise Price
(NT$)
Quantity
of Options
Weighted-
average
Exercise Price
(NT$)
2006 1,594,999 $ 19.86 - $ - (660,200) $ 13.86 (129,200) $ 27.80 805,599 $ 23.49
2013 627,250 37.90 - - - - (627,250) 37.90 - -
2015 985,750 12.2 (35,750) 12.2 (272,500) 12.2 - - 677,500 12.2
As of December 31, 2020, the valid and outstanding employee stock option plans are as following:
Plan
Number of
Options
Valid
Period
Vesting Terms 2006 employee stock option
plan 12,600,000 10 years (1) A certain percentages of the options
defined in the plan are vested and
exercisable after the first anniversary,
or (2) according to the achievement
level of the performance target defined
in advance.
2015 employee stock option
plan
2,800,000 10 years (1) A certain percentage of the options
defined in the plan are vested and
exercisable after the second
anniversary.
For the subsequent changes in the Company’s ordinary share capital, such as issuance of shares in cash,
from earnings and capital surplus, consolidation, spin-off, share split,issuance of global depositary
receipts,and decrease in ordinary shares which is not resulted from treasury share retired, the exercise
price and the conversion ratio would be considered to adjust accordingly based on the plans.
b. Shares Buy Back Program
Information about the Company buyback its shares as follows:
Items
The date of
board of
directors
approved
Buyback
shares
(In thousand
share)
Transferred
shares
(In thousand
share)
Adjustment
due to capital
reduction
(In thousand
share)
Shares not
transferred
yet
(In thousand
share)
Transferred
price
(in dollar)
The 2nd Shares Buy
Back Program
2016/4/28 5,000 5,000 - - $ 26.53
The 3rd Shares Buy Back
Program
2017/5/12 6,808 6,808 - - 36.11
The 4th Shares Buy Back
Program
2018/7/26 8,000 7,848 ( 46 ) 106 33.81
(Adjusted)
This is the translation of the financial statements. CPAs do not audit or review on this translation.
Items
The date of
board of
directors
approved
Buyback
shares
(In thousand
share)
Transferred
shares
(In thousand
share)
Adjustment
due to capital
reduction
(In thousand
share)
Shares not
transferred
yet
(In thousand
share)
Transferred
price
(in dollar)
The 5th Shares Buy Back
Program
2018/8/23 7,689 6,544 ( 473 ) 672 34.09
(Adjusted)
Information about Shares Buy Back Programs is as follows:
The 2nd Shares Buy Back Program The 3rd Shares Buy Back Program
Employee
subscription
base date
Shares
transferred (In
Thousands)
The fair value of the
right to
subscribe (NT$)
Employee
subscription
base date
Shares
transferred (In
Thousands)
The fair value of the
right to
subscribe (NT$)
2016/10/28 2,624 $ 11.26 2017/07/24 3,198 $ 12.85
2017/02/24 50 11.26 2018/07/26 3,515 -
2018/02/08 120 4.20 2019/05/07 95 - 2018/04/24 255 4.30
2018/07/26 1,765 -
2019/05/07 186 -
Total 5,000 Total 6,808
The 4th Shares Buy Back Program The 5th Shares Buy Back Program
Employee
subscription base date
Shares transferred
(In
Thousands)
The fair
value of the
right to subscribe
(NT$)
Employee
subscription base date
Shares transferred
(In
Thousands)
The fair
value of the
right to subscribe
(NT$)
2020/03/20 7,848 $ 11.26 2019/05/07 4,651 $ -
2019/11/08 60 - 2020/03/20 1,399 3.70
2020/11/06 434 1.90
Total 7,848 Total 6,544
The limitations and rights on the unvested shares were as follows;
1) The employees cannot sell, pledge, transfer, donate, or dispose these shares.
2) The Company and the employees should enter into a trust agreement with a trust and custodian
institution and authorize the institution to exercise the shareholders’ rights including but not limited
to attendance, proposing, speaking and voting in the shareholder meetings.
3) The unvested shares are entitled to receive cash and/or share dividends and the derivatives.
If an employee fails to meet the vesting conditions, the trust institution would dispose the unvested
shares and return proceeds to the employee no more than the original purchase price.
c. Options of the share transfer plan granted were measured by using the Black-Scholes pricing model
Compensation cost recognized for share-based payments above in 2020 and 2019 were as follows:
For the Year Ended December 31
2020 2019
Employee share option plans $ - $ 669
Shares buy back program 21,279 9,118
$ 21,279 $ 9,787
For the Year Ended December 31
2020 2019
Capital surplus - employee share options $ 21,279 $ 9,787
This is the translation of the financial statements. CPAs do not audit or review on this translation.
26. Equity transactions with non - controlling interests
In November 2019, the Group ownership interest over FocalTech Smart Sensors Co., Ltd. increase to
67.15% from 61.88% Due to capital injection and no pro rata subscription in new shares.
The transactions did not change the controlling status. FocalTech Smart Sensors Co., Ltd. was treated as
a subsidiary under equity method.
27. OPERATING LEASE ARRANGEMENTS
The Group is Lessee
The Company and its subsidiaries have lease contracts for office, plant and some office equipment, which
would be expired before December 2021. Above mentioned lease contracts are short-term lease agreement,
and the Group applies practical expedients so the Group does not recognize right-of-use assets and lease
liabilities. The amount of short-term commitment which the Group apply practical expedients is $16,702
thousand and $16,611 thousand for the years ended December 31,2020 and 2019,respectively.
The lease payments recognized in profit or loss for the current period was as follows:
For the Year Ended December 31
2020 2019
lease payment $ 35,178 $ 36,524
28. CAPITAL MANAGEMENT
The capital structure of the Group is consisted by debt and equity .The Group manages its capital to ensure
that entities in the Group will be able to continue as going concerns while maximizing the return to
stockholders through the optimization of the debt and equity balance.
To define the strategy of the Group’s capital structure, the Group first sets its target market share according
to the industry scale, the growth of the industry and the product roadmap. Based on the projected market
position, the Group plans the research and development investment and capital expenditure. Furthermore,
the Group calculates working capitals and cash demands based on the long-term development plan
considering the industry characteristics to build up the overall operating model. Finally, the Group
evaluates not only the possible contribution margin, operating profit ratio and cash flows according to the
product competitiveness but also risk factors such as the fluctuation of the business circle and the life circle
of the product to decide the suitable capital structure. The management reviews capital structures
periodically and considers the possible costs and risks of different capital structures. Generally, the Group
adopted prudent capital management strategy.
The Group was not restricted to other external capital requirements.
29. FINANCIAL INSTRUMENTS
a. Fair value of financial instruments that are not measured at fair value
The management believes the carrying amounts of financial assets and financial liabilities not measured
of fair value approximate their fair values or cannot be reliably measured.
This is the translation of the financial statements. CPAs do not audit or review on this translation.
b. Fair value of financial instruments that are measured at fair value on a recurring basis
1.) Fair value hierarchy
December 31, 2020
Level 1 Level 2 Level 3 Total
Financial asset at FVTPL
Listed preferred shares $ 72,186 $ - $ - $ 72,186
Private funds - - 52,579 52,579
Structured Investments - 109,897 - 109,897
Total $ 72,186 $ 109,897 $ 52,579 $ 234,662
Financial assets at FVTOCI assets
Investments in debt instruments
Fixed income bonds $ - $ 247,974 $ - $ 247,974
December 31, 2019
Level 1 Level 2 Level 3 Total
Financial asset at FVTPL
Listed preferred shares $ 10,931 $ - $ - $ 10,931
Private funds - - 45,423 45,423
Total $ 10,931 $ - $ 45,423 $ 56,354
Financial assets at FVTOCI assets
Investments in debt instruments
Fixed income bonds $ - $ 181,373 $ - $ 181,373
There were no transfers between Level 1 and Level 2 in 2020 and 2019.
2) Reconciliation of financial instruments measured by Level 3 fair value
December 31
2020 2019 Financial assets at FVTPL
Balance at January 1, 2020 $ 45,423 $ 41,023
Purchases 10,000 5,355
Disposals ( 483) ( 7)
Recognized in profit or loss(other income or loss) ( 914) ( 251)
Effect of foreign currency exchange differences ( 1,447) ( 697)
Balance at December 31, 2020 $ 52,579 $ 45,423
3) Valuation techniques and inputs applied for the purpose of measuring Level 2 fair value
measurement
The fair values of foreign fixed income bonds are determined by quoted market prices provided by
the independent third party. The fair values of structured investments are determined by quoted
prices provided by the seller.
4) Valuation techniques and inputs applied for the purpose of measuring Level 3 fair value
measurement
The unlisted equity investment is measured by the market approach, which decides fair value by
referring to the recent financing activities of investees or the market transaction prices and status of
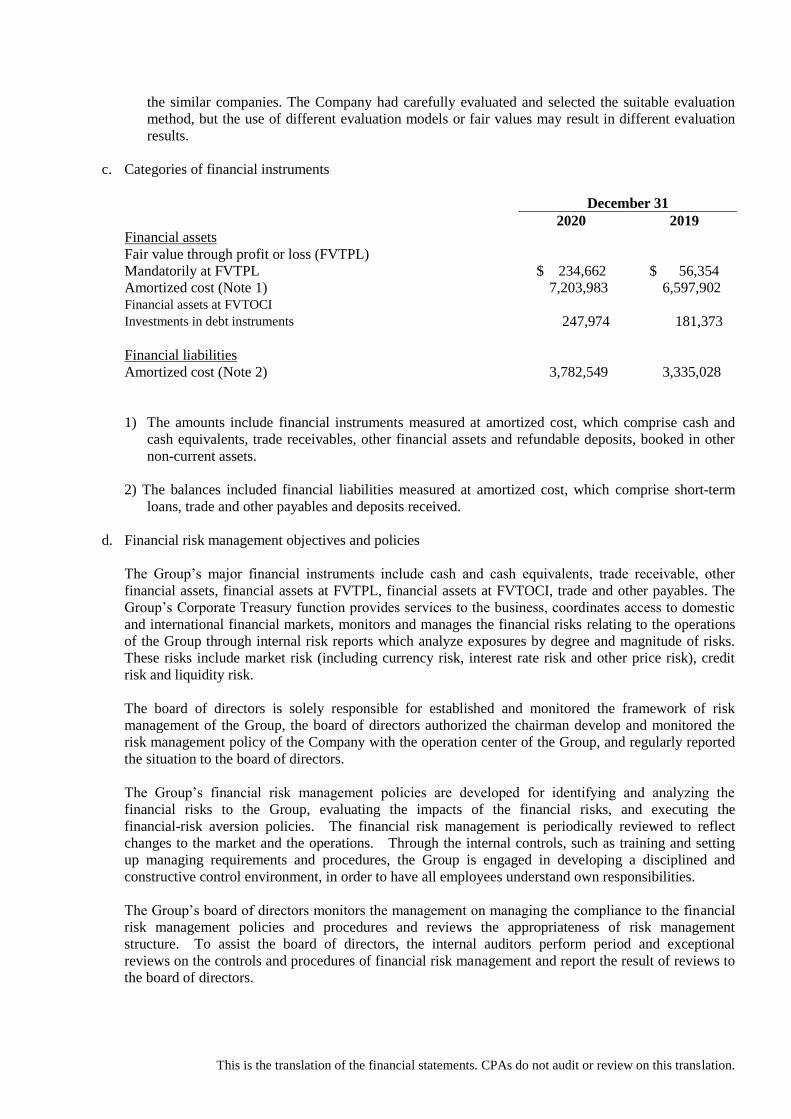
This is the translation of the financial statements. CPAs do not audit or review on this translation.
the similar companies. The Company had carefully evaluated and selected the suitable evaluation
method, but the use of different evaluation models or fair values may result in different evaluation
results.
c. Categories of financial instruments
December 31
2020 2019
Financial assets
Fair value through profit or loss (FVTPL)
Mandatorily at FVTPL $ 234,662 $ 56,354
Amortized cost (Note 1) 7,203,983 6,597,902 Financial assets at FVTOCI Investments in debt instruments 247,974 181,373
Financial liabilities
Amortized cost (Note 2) 3,782,549 3,335,028
1) The amounts include financial instruments measured at amortized cost, which comprise cash and
cash equivalents, trade receivables, other financial assets and refundable deposits, booked in other
non-current assets.
2) The balances included financial liabilities measured at amortized cost, which comprise short-term
loans, trade and other payables and deposits received.
d. Financial risk management objectives and policies
The Group’s major financial instruments include cash and cash equivalents, trade receivable, other
financial assets, financial assets at FVTPL, financial assets at FVTOCI, trade and other payables. The
Group’s Corporate Treasury function provides services to the business, coordinates access to domestic
and international financial markets, monitors and manages the financial risks relating to the operations
of the Group through internal risk reports which analyze exposures by degree and magnitude of risks.
These risks include market risk (including currency risk, interest rate risk and other price risk), credit
risk and liquidity risk.
The board of directors is solely responsible for established and monitored the framework of risk
management of the Group, the board of directors authorized the chairman develop and monitored the
risk management policy of the Company with the operation center of the Group, and regularly reported
the situation to the board of directors.
The Group’s financial risk management policies are developed for identifying and analyzing the
financial risks to the Group, evaluating the impacts of the financial risks, and executing the
financial-risk aversion policies. The financial risk management is periodically reviewed to reflect
changes to the market and the operations. Through the internal controls, such as training and setting
up managing requirements and procedures, the Group is engaged in developing a disciplined and
constructive control environment, in order to have all employees understand own responsibilities.
The Group’s board of directors monitors the management on managing the compliance to the financial
risk management policies and procedures and reviews the appropriateness of risk management
structure. To assist the board of directors, the internal auditors perform period and exceptional
reviews on the controls and procedures of financial risk management and report the result of reviews to
the board of directors.
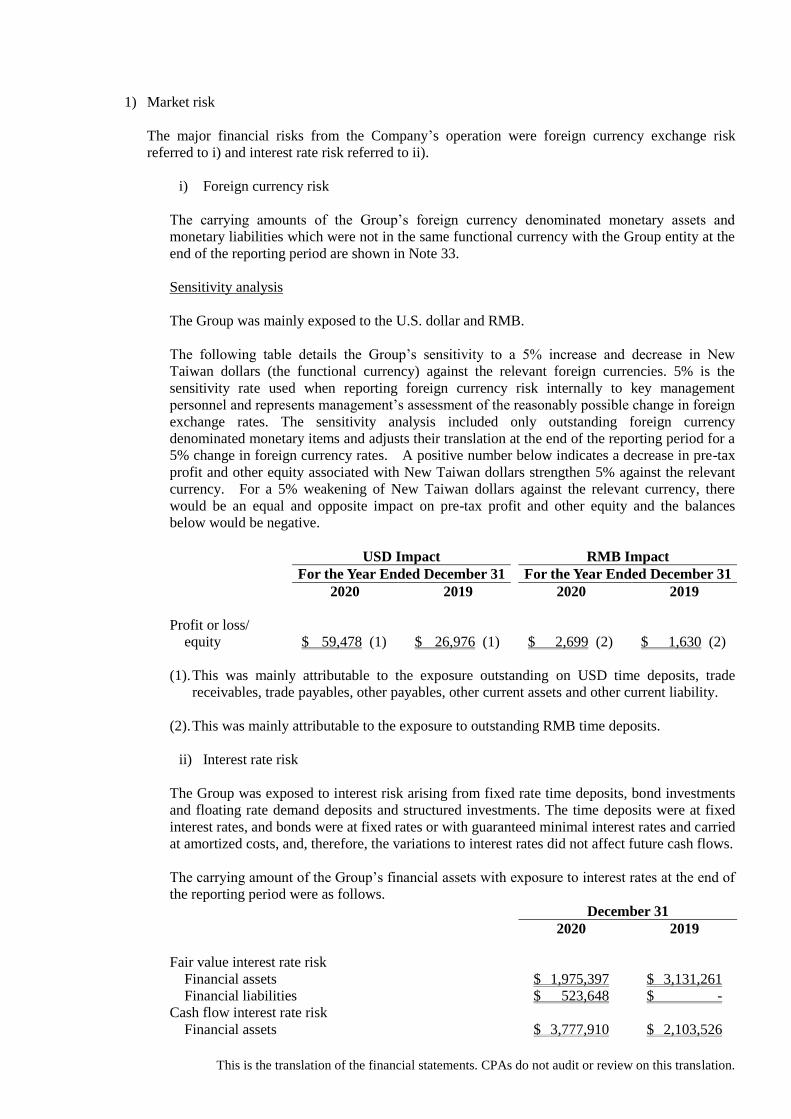
This is the translation of the financial statements. CPAs do not audit or review on this translation.
1) Market risk
The major financial risks from the Company’s operation were foreign currency exchange risk
referred to i) and interest rate risk referred to ii).
i) Foreign currency risk
The carrying amounts of the Group’s foreign currency denominated monetary assets and
monetary liabilities which were not in the same functional currency with the Group entity at the
end of the reporting period are shown in Note 33.
Sensitivity analysis
The Group was mainly exposed to the U.S. dollar and RMB.
The following table details the Group’s sensitivity to a 5% increase and decrease in New
Taiwan dollars (the functional currency) against the relevant foreign currencies. 5% is the
sensitivity rate used when reporting foreign currency risk internally to key management
personnel and represents management’s assessment of the reasonably possible change in foreign
exchange rates. The sensitivity analysis included only outstanding foreign currency
denominated monetary items and adjusts their translation at the end of the reporting period for a
5% change in foreign currency rates. A positive number below indicates a decrease in pre-tax
profit and other equity associated with New Taiwan dollars strengthen 5% against the relevant
currency. For a 5% weakening of New Taiwan dollars against the relevant currency, there
would be an equal and opposite impact on pre-tax profit and other equity and the balances
below would be negative.
USD Impact RMB Impact
For the Year Ended December 31 For the Year Ended December 31
2020 2019 2020 2019
Profit or loss/
equity $ 59,478 (1) $ 26,976 (1) $ 2,699 (2) $ 1,630 (2)
(1). This was mainly attributable to the exposure outstanding on USD time deposits, trade
receivables, trade payables, other payables, other current assets and other current liability.
(2). This was mainly attributable to the exposure to outstanding RMB time deposits.
ii) Interest rate risk
The Group was exposed to interest risk arising from fixed rate time deposits, bond investments
and floating rate demand deposits and structured investments. The time deposits were at fixed
interest rates, and bonds were at fixed rates or with guaranteed minimal interest rates and carried
at amortized costs, and, therefore, the variations to interest rates did not affect future cash flows.
The carrying amount of the Group’s financial assets with exposure to interest rates at the end of
the reporting period were as follows.
December 31
2020 2019
Fair value interest rate risk
Financial assets $ 1,975,397 $ 3,131,261
Financial liabilities $ 523,648 $ -
Cash flow interest rate risk
Financial assets $ 3,777,910 $ 2,103,526
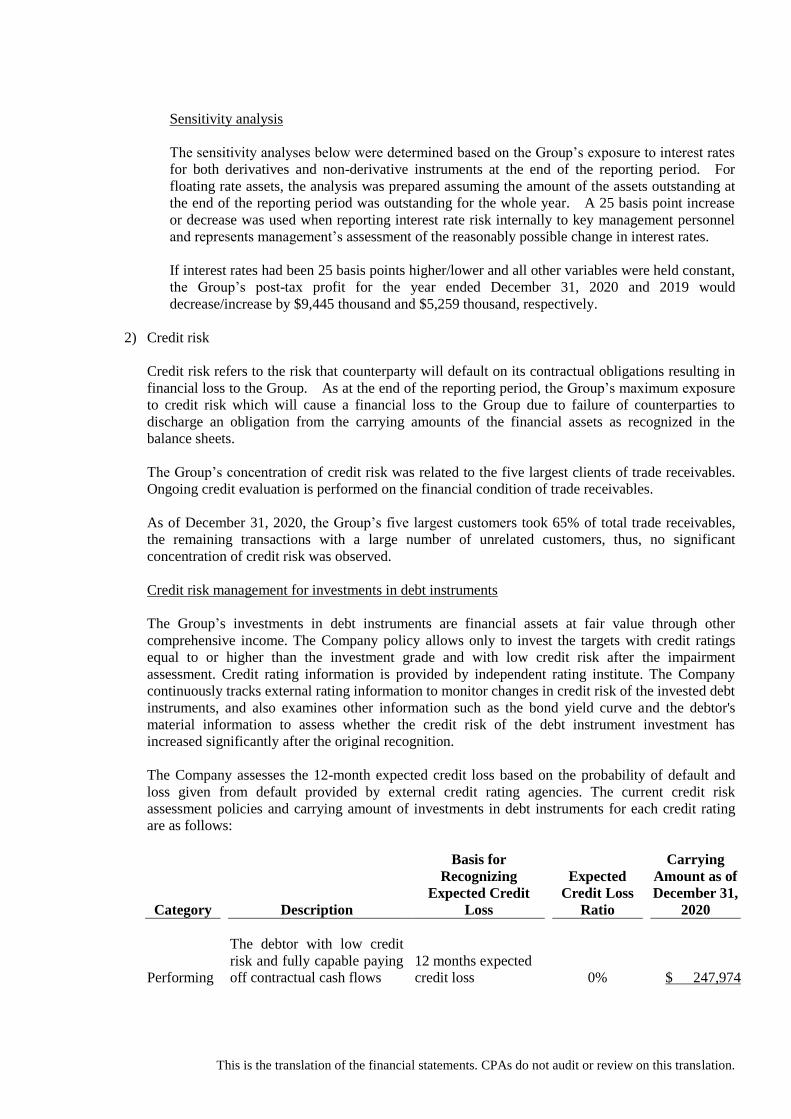
This is the translation of the financial statements. CPAs do not audit or review on this translation.
Sensitivity analysis
The sensitivity analyses below were determined based on the Group’s exposure to interest rates
for both derivatives and non-derivative instruments at the end of the reporting period. For
floating rate assets, the analysis was prepared assuming the amount of the assets outstanding at
the end of the reporting period was outstanding for the whole year. A 25 basis point increase
or decrease was used when reporting interest rate risk internally to key management personnel
and represents management’s assessment of the reasonably possible change in interest rates.
If interest rates had been 25 basis points higher/lower and all other variables were held constant,
the Group’s post-tax profit for the year ended December 31, 2020 and 2019 would
decrease/increase by $9,445 thousand and $5,259 thousand, respectively.
2) Credit risk
Credit risk refers to the risk that counterparty will default on its contractual obligations resulting in
financial loss to the Group. As at the end of the reporting period, the Group’s maximum exposure
to credit risk which will cause a financial loss to the Group due to failure of counterparties to
discharge an obligation from the carrying amounts of the financial assets as recognized in the
balance sheets.
The Group’s concentration of credit risk was related to the five largest clients of trade receivables.
Ongoing credit evaluation is performed on the financial condition of trade receivables.
As of December 31, 2020, the Group’s five largest customers took 65% of total trade receivables,
the remaining transactions with a large number of unrelated customers, thus, no significant
concentration of credit risk was observed.
Credit risk management for investments in debt instruments
The Group’s investments in debt instruments are financial assets at fair value through other
comprehensive income. The Company policy allows only to invest the targets with credit ratings
equal to or higher than the investment grade and with low credit risk after the impairment
assessment. Credit rating information is provided by independent rating institute. The Company
continuously tracks external rating information to monitor changes in credit risk of the invested debt
instruments, and also examines other information such as the bond yield curve and the debtor's
material information to assess whether the credit risk of the debt instrument investment has
increased significantly after the original recognition.
The Company assesses the 12-month expected credit loss based on the probability of default and
loss given from default provided by external credit rating agencies. The current credit risk
assessment policies and carrying amount of investments in debt instruments for each credit rating
are as follows:
Category Description
Basis for
Recognizing
Expected Credit
Loss
Expected
Credit Loss
Ratio
Carrying
Amount as of
December 31,
2020
Performing
The debtor with low credit
risk and fully capable paying
off contractual cash flows
12 months expected
credit loss 0% $ 247,974
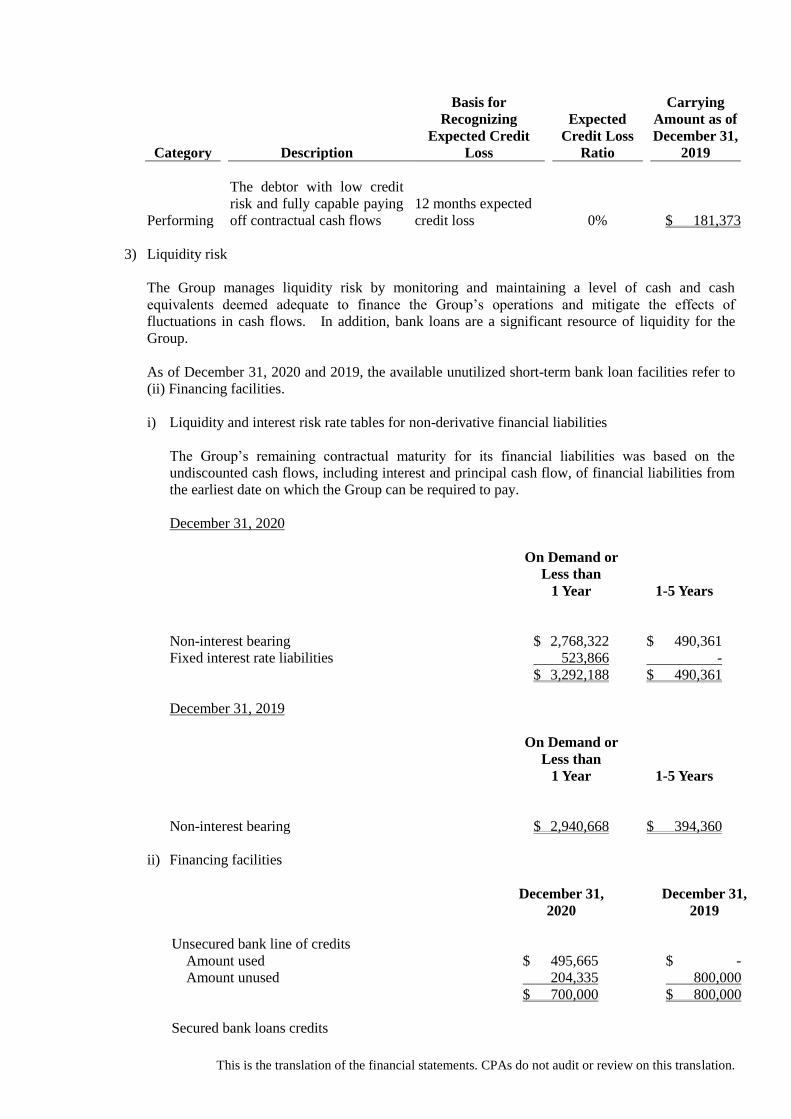
This is the translation of the financial statements. CPAs do not audit or review on this translation.
Category Description
Basis for
Recognizing
Expected Credit
Loss
Expected
Credit Loss
Ratio
Carrying
Amount as of
December 31,
2019
Performing
The debtor with low credit
risk and fully capable paying
off contractual cash flows
12 months expected
credit loss 0% $ 181,373
3) Liquidity risk
The Group manages liquidity risk by monitoring and maintaining a level of cash and cash
equivalents deemed adequate to finance the Group’s operations and mitigate the effects of
fluctuations in cash flows. In addition, bank loans are a significant resource of liquidity for the
Group.
As of December 31, 2020 and 2019, the available unutilized short-term bank loan facilities refer to
(ii) Financing facilities.
i) Liquidity and interest risk rate tables for non-derivative financial liabilities
The Group’s remaining contractual maturity for its financial liabilities was based on the
undiscounted cash flows, including interest and principal cash flow, of financial liabilities from
the earliest date on which the Group can be required to pay.
December 31, 2020
On Demand or
Less than
1 Year 1-5 Years
Non-interest bearing $ 2,768,322 $ 490,361
Fixed interest rate liabilities 523,866 -
$ 3,292,188 $ 490,361
December 31, 2019
On Demand or
Less than
1 Year 1-5 Years
Non-interest bearing $ 2,940,668 $ 394,360
ii) Financing facilities
December 31,
2020 December 31,
2019
Unsecured bank line of credits
Amount used $ 495,665 $ -
Amount unused 204,335 800,000
$ 700,000 $ 800,000
Secured bank loans credits
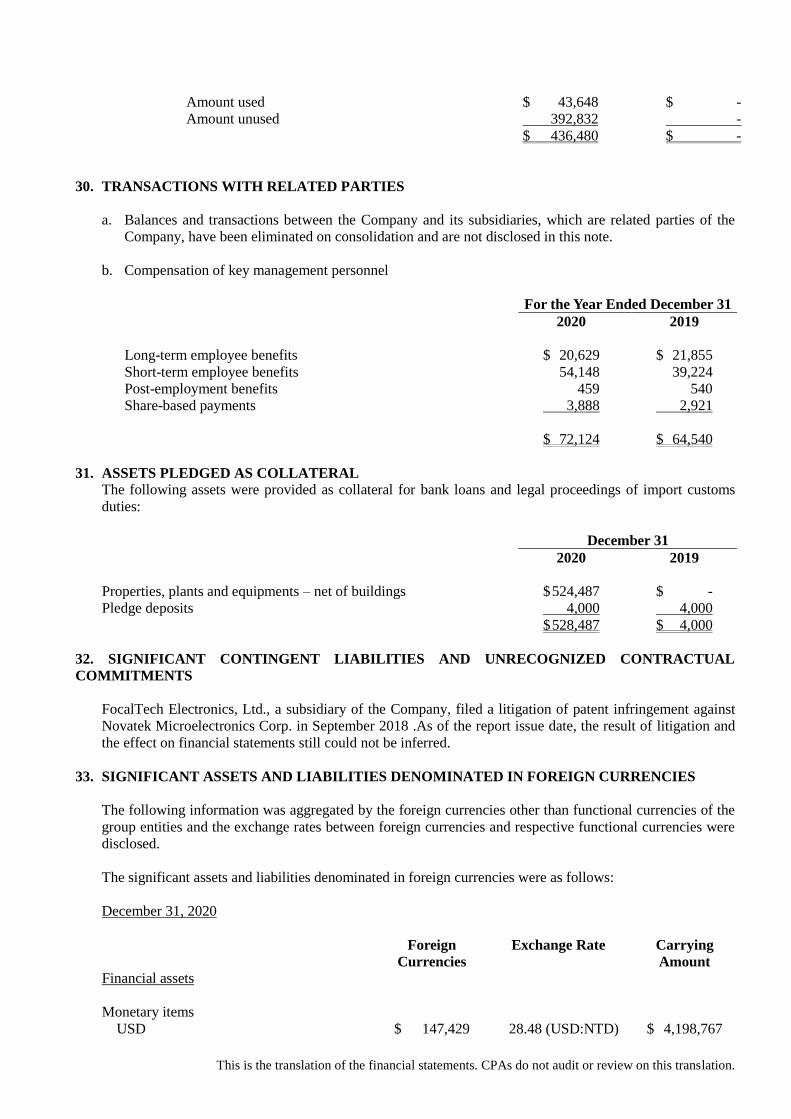
This is the translation of the financial statements. CPAs do not audit or review on this translation.
Amount used $ 43,648 $ -
Amount unused 392,832 -
$ 436,480 $ -
30. TRANSACTIONS WITH RELATED PARTIES
a. Balances and transactions between the Company and its subsidiaries, which are related parties of the
Company, have been eliminated on consolidation and are not disclosed in this note.
b. Compensation of key management personnel
For the Year Ended December 31
2020 2019
Long-term employee benefits $ 20,629 $ 21,855
Short-term employee benefits 54,148 39,224
Post-employment benefits 459 540
Share-based payments 3,888 2,921
$ 72,124 $ 64,540
31. ASSETS PLEDGED AS COLLATERAL
The following assets were provided as collateral for bank loans and legal proceedings of import customs
duties:
December 31
2020 2019
Properties, plants and equipments – net of buildings $ 524,487 $ -
Pledge deposits 4,000 4,000
$ 528,487 $ 4,000
32. SIGNIFICANT CONTINGENT LIABILITIES AND UNRECOGNIZED CONTRACTUAL
COMMITMENTS
FocalTech Electronics, Ltd., a subsidiary of the Company, filed a litigation of patent infringement against
Novatek Microelectronics Corp. in September 2018 .As of the report issue date, the result of litigation and
the effect on financial statements still could not be inferred.
33. SIGNIFICANT ASSETS AND LIABILITIES DENOMINATED IN FOREIGN CURRENCIES
The following information was aggregated by the foreign currencies other than functional currencies of the
group entities and the exchange rates between foreign currencies and respective functional currencies were
disclosed.
The significant assets and liabilities denominated in foreign currencies were as follows:
December 31, 2020
Foreign
Currencies
Exchange Rate
Carrying
Amount
Financial assets
Monetary items
USD $ 147,429 28.48 (USD:NTD) $ 4,198,767
This is the translation of the financial statements. CPAs do not audit or review on this translation.
USD 2,459 6.5249 (USD:RMB) 70,018
RMB 12,369 0.1533 (RMB:USD) 53,988
Financial liabilities
Monetary items
USD 105,765 28.48 (USD:NTD) 3,012,178
USD 2,354 6.5249 (USD:RMB) 67,049
December 31, 2019
Foreign
Currencies
Exchange Rate
Carrying
Amount
Financial assets
Monetary items
USD $ 55,218 29.98 (USD:NTD) $ 1,655,432
USD 6,641 6.9762 (USD:RMB) 199,101
RMB 7,588 0.1433 (RMB:USD) 32,610
Financial liabilities
Monetary items
USD 38,218 29.98 (USD:NTD) 1,145,788
USD 5,644 6.9762 (USD:RMB) 169,222
35. SEPARATELY DISCLOSED ITEMS
a. Information about significant transactions and investees:
1) Financing provided to others (Table 1)
2) Endorsements/guarantees provided (Table 2)
3) Marketable securities held (excluding investments in subsidiaries, associates and joint ventures)
(Table 3)
4) Marketable securities acquired and disposed of at costs or prices of at least NT$300 million or 20%
of the paid-in capital (None)
5) Acquisition of individual real estate at costs of at least NT$300 million or 20% of the paid-in capital
(None)
6) Disposal of individual real estate at prices of at least NT$300 million or 20% of the paid-in capital
(None)
7) Total purchases from or sales to related parties amounting to at least NT$100 million or 20% of the
paid-in capital (None)
8) Receivables from related parties amounting to at least NT$100 million or 20% of the paid-in capital
(None)
9) Trading in derivative instruments (None)
10) Others: The business relationship between the parent and the subsidiaries and significant
transactions between them: (Table 4)
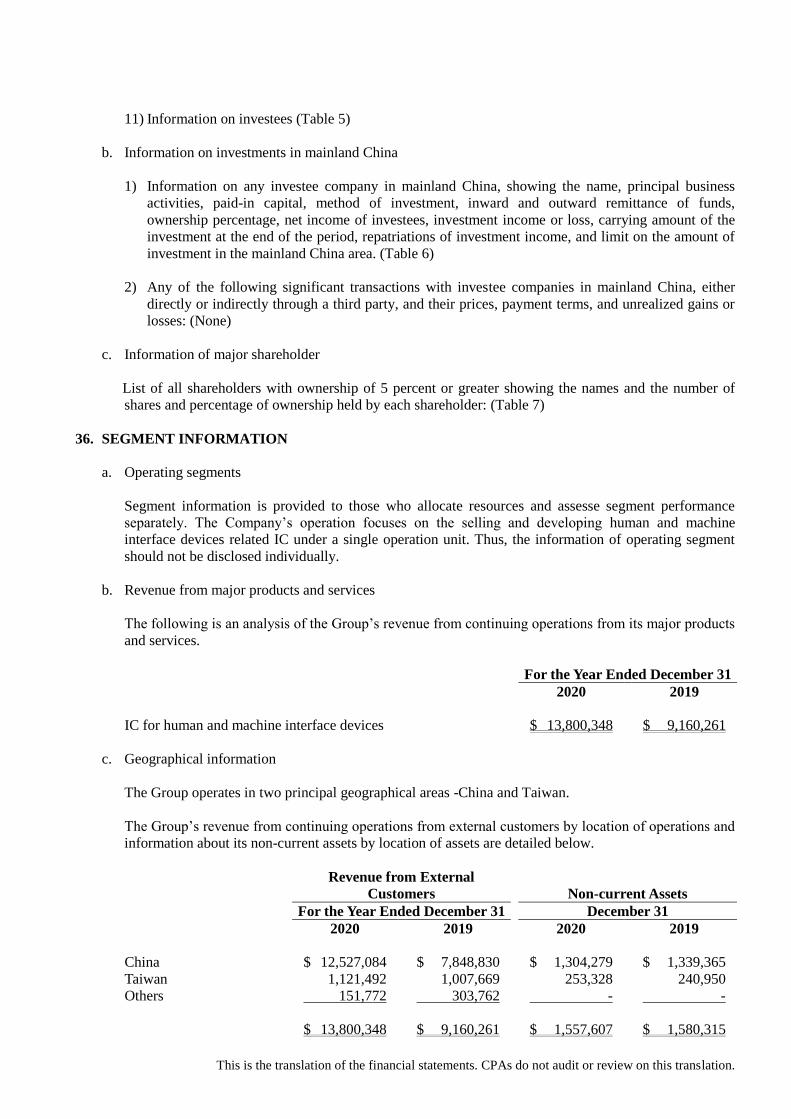
This is the translation of the financial statements. CPAs do not audit or review on this translation.
11) Information on investees (Table 5)
b. Information on investments in mainland China
1) Information on any investee company in mainland China, showing the name, principal business
activities, paid-in capital, method of investment, inward and outward remittance of funds,
ownership percentage, net income of investees, investment income or loss, carrying amount of the
investment at the end of the period, repatriations of investment income, and limit on the amount of
investment in the mainland China area. (Table 6)
2) Any of the following significant transactions with investee companies in mainland China, either
directly or indirectly through a third party, and their prices, payment terms, and unrealized gains or
losses: (None)
c. Information of major shareholder
List of all shareholders with ownership of 5 percent or greater showing the names and the number of
shares and percentage of ownership held by each shareholder: (Table 7)
36. SEGMENT INFORMATION
a. Operating segments
Segment information is provided to those who allocate resources and assesse segment performance
separately. The Company’s operation focuses on the selling and developing human and machine
interface devices related IC under a single operation unit. Thus, the information of operating segment
should not be disclosed individually.
b. Revenue from major products and services
The following is an analysis of the Group’s revenue from continuing operations from its major products
and services.
For the Year Ended December 31
2020 2019
IC for human and machine interface devices $ 13,800,348 $ 9,160,261
c. Geographical information
The Group operates in two principal geographical areas -China and Taiwan.
The Group’s revenue from continuing operations from external customers by location of operations and
information about its non-current assets by location of assets are detailed below.
Revenue from External
Customers Non-current Assets
For the Year Ended December 31 December 31
2020 2019 2020 2019
China $ 12,527,084 $ 7,848,830 $ 1,304,279 $ 1,339,365
Taiwan 1,121,492 1,007,669 253,328 240,950
Others 151,772 303,762 - -
$ 13,800,348 $ 9,160,261 $ 1,557,607 $ 1,580,315
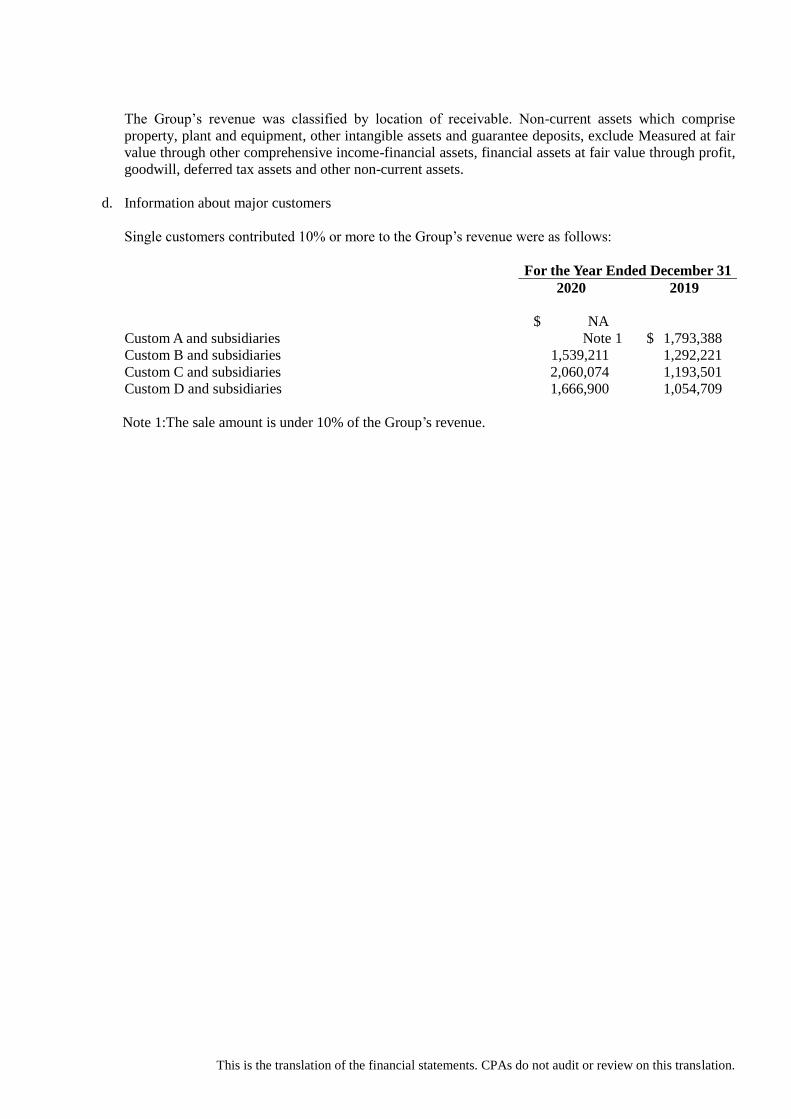
This is the translation of the financial statements. CPAs do not audit or review on this translation.
The Group’s revenue was classified by location of receivable. Non-current assets which comprise
property, plant and equipment, other intangible assets and guarantee deposits, exclude Measured at fair
value through other comprehensive income-financial assets, financial assets at fair value through profit,
goodwill, deferred tax assets and other non-current assets.
d. Information about major customers
Single customers contributed 10% or more to the Group’s revenue were as follows:
For the Year Ended December 31
2020 2019
Custom A and subsidiaries
$ NA
Note 1 $ 1,793,388
Custom B and subsidiaries 1,539,211 1,292,221
Custom C and subsidiaries 2,060,074 1,193,501
Custom D and subsidiaries 1,666,900 1,054,709
Note 1:The sale amount is under 10% of the Group’s revenue.
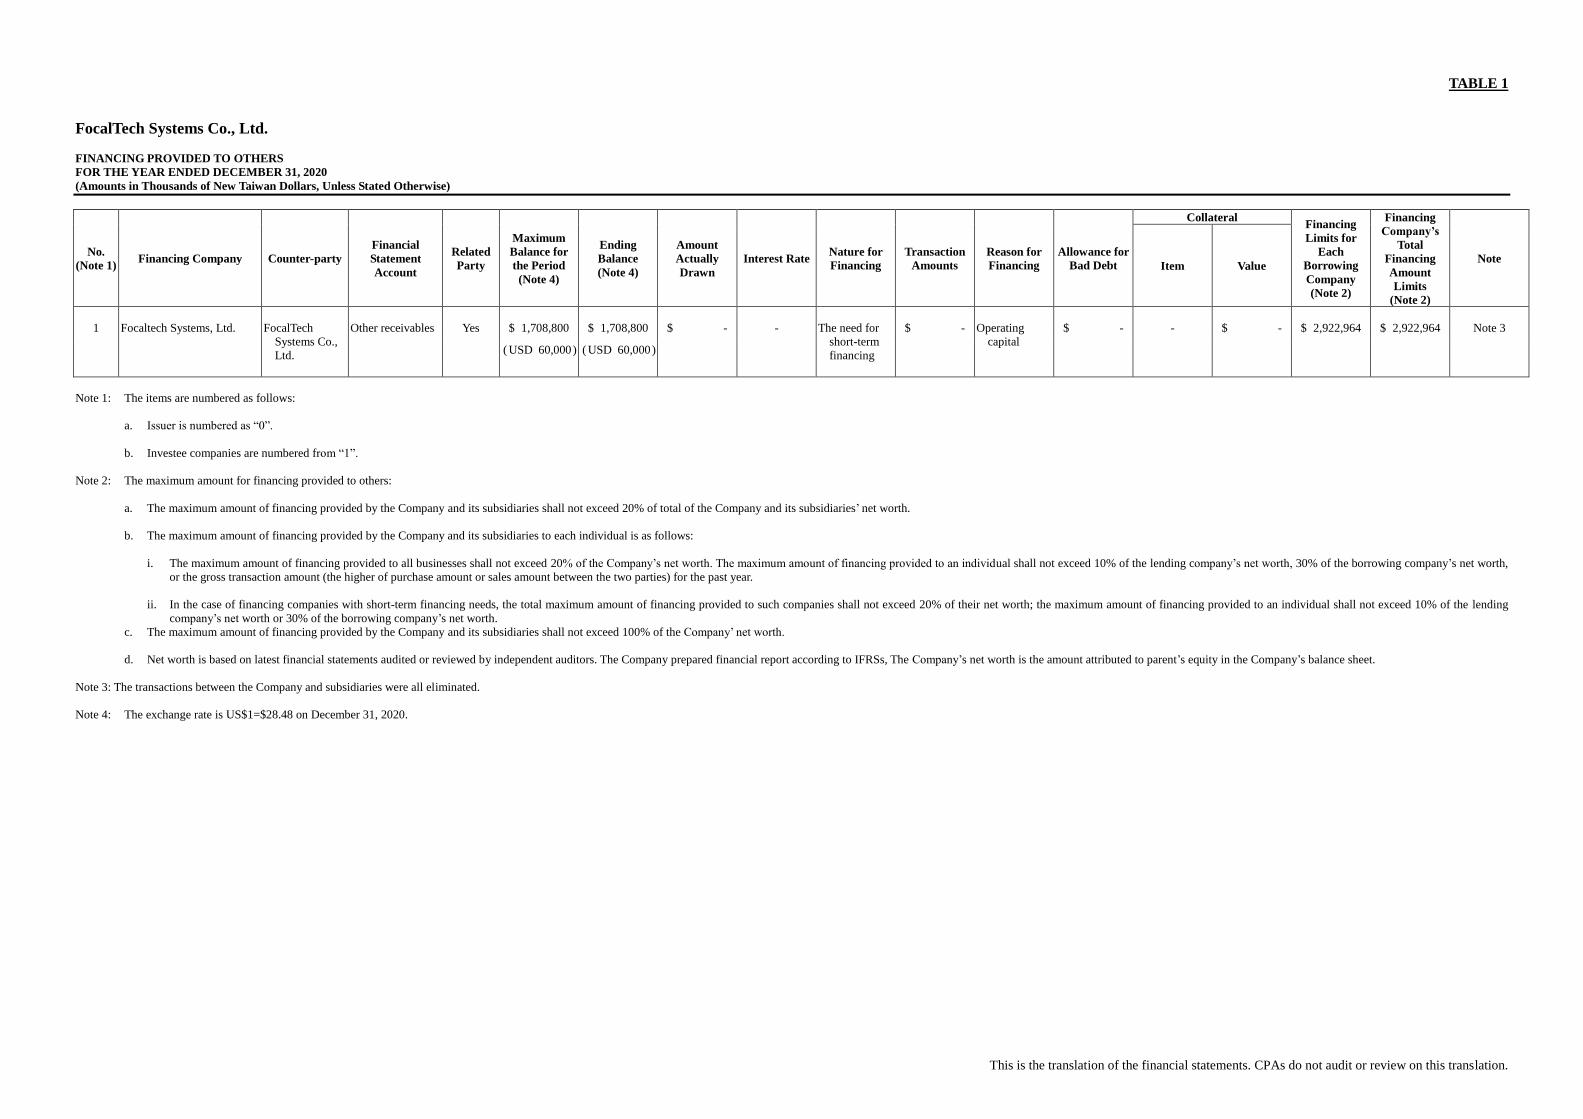
This is the translation of the financial statements. CPAs do not audit or review on this translation.
TABLE 1
FocalTech Systems Co., Ltd.
FINANCING PROVIDED TO OTHERS
FOR THE YEAR ENDED DECEMBER 31, 2020
(Amounts in Thousands of New Taiwan Dollars, Unless Stated Otherwise)
No.
(Note 1) Financing Company Counter-party
Financial
Statement
Account
Related
Party
Maximum
Balance for
the Period
(Note 4)
Ending
Balance
(Note 4)
Amount
Actually
Drawn
Interest Rate Nature for
Financing
Transaction
Amounts
Reason for
Financing
Allowance for
Bad Debt
Collateral Financing
Limits for
Each
Borrowing
Company
(Note 2)
Financing
Company’s
Total
Financing
Amount
Limits
(Note 2)
Note Item Value
1 Focaltech Systems, Ltd. FocalTech
Systems Co.,
Ltd.
Other receivables Yes $ 1,708,800 $ 1,708,800 $ - - The need for
short-term
financing
$ - Operating
capital
$ - - $ - $ 2,922,964 $ 2,922,964 Note 3
( USD 60,000 ) ( USD 60,000 )
Note 1: The items are numbered as follows:
a. Issuer is numbered as “0”.
b. Investee companies are numbered from “1”.
Note 2: The maximum amount for financing provided to others:
a. The maximum amount of financing provided by the Company and its subsidiaries shall not exceed 20% of total of the Company and its subsidiaries’ net worth.
b. The maximum amount of financing provided by the Company and its subsidiaries to each individual is as follows:
i. The maximum amount of financing provided to all businesses shall not exceed 20% of the Company’s net worth. The maximum amount of financing provided to an individual shall not exceed 10% of the lending company’s net worth, 30% of the borrowing company’s net worth,
or the gross transaction amount (the higher of purchase amount or sales amount between the two parties) for the past year.
ii. In the case of financing companies with short-term financing needs, the total maximum amount of financing provided to such companies shall not exceed 20% of their net worth; the maximum amount of financing provided to an individual shall not exceed 10% of the lending
company’s net worth or 30% of the borrowing company’s net worth.
c. The maximum amount of financing provided by the Company and its subsidiaries shall not exceed 100% of the Company’ net worth.
d. Net worth is based on latest financial statements audited or reviewed by independent auditors. The Company prepared financial report according to IFRSs, The Company’s net worth is the amount attributed to parent’s equity in the Company’s balance sheet.
Note 3: The transactions between the Company and subsidiaries were all eliminated.
Note 4: The exchange rate is US$1=$28.48 on December 31, 2020.
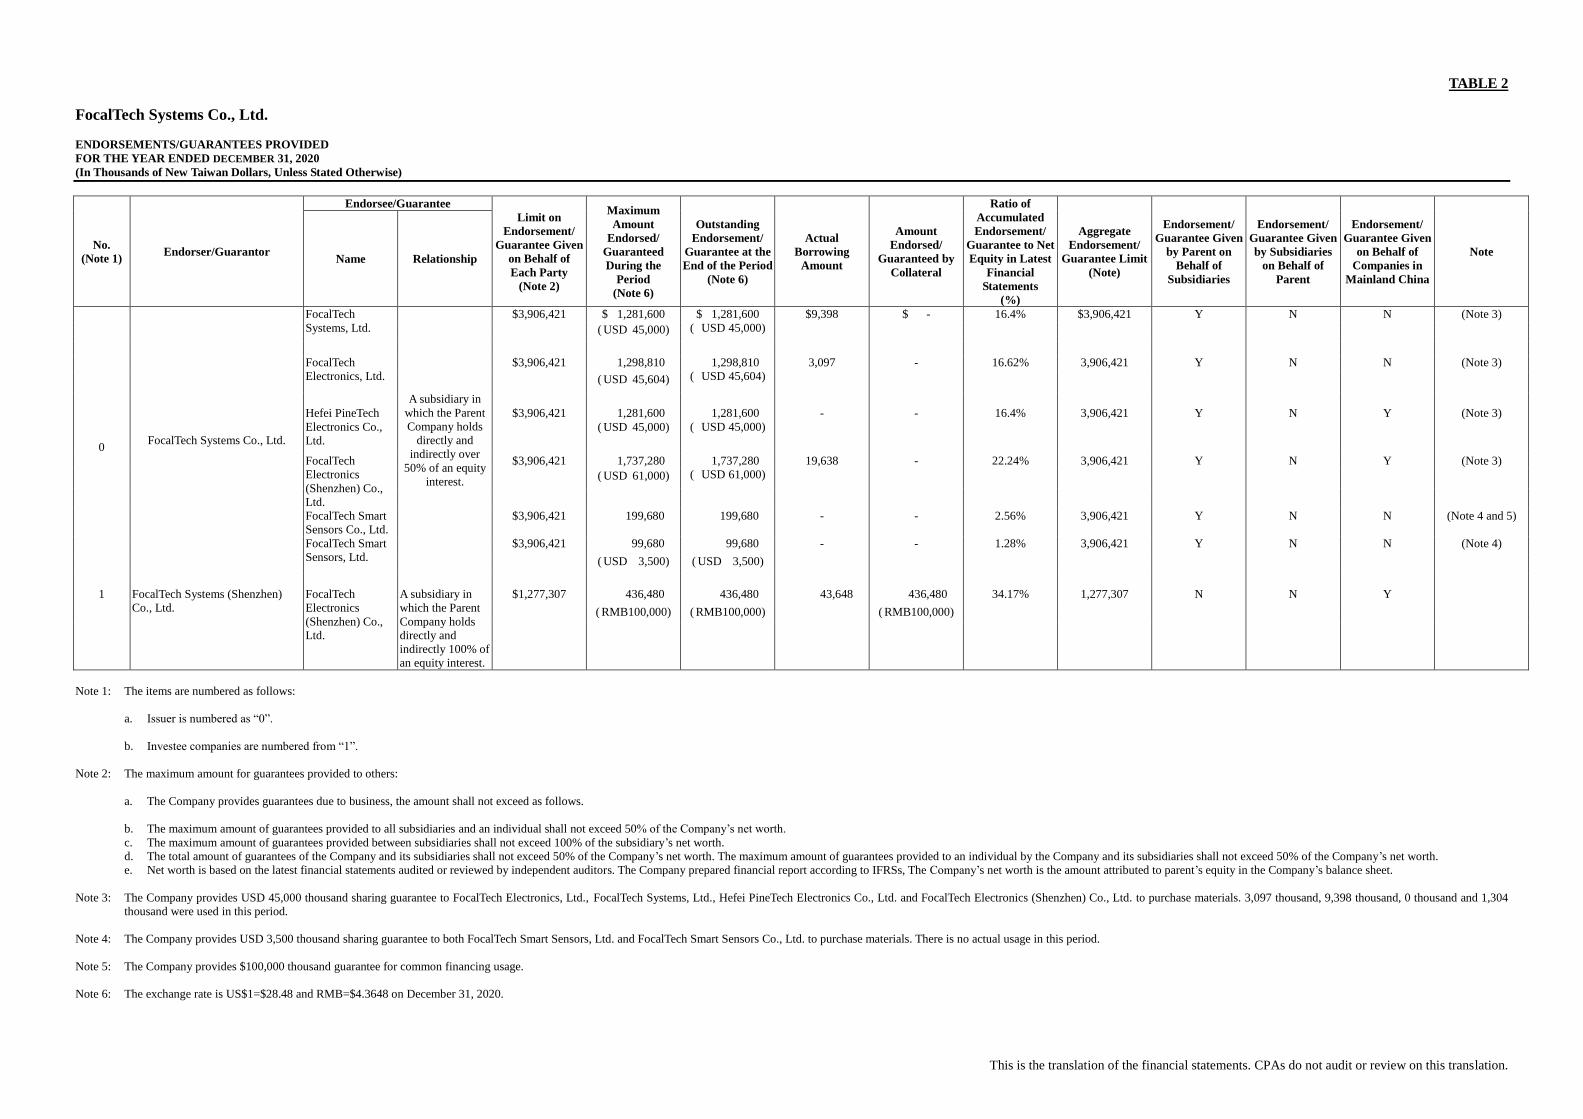
This is the translation of the financial statements. CPAs do not audit or review on this translation.
TABLE 2
FocalTech Systems Co., Ltd.
ENDORSEMENTS/GUARANTEES PROVIDED
FOR THE YEAR ENDED DECEMBER 31, 2020
(In Thousands of New Taiwan Dollars, Unless Stated Otherwise)
No.
(Note 1) Endorser/Guarantor
Endorsee/Guarantee
Limit on
Endorsement/
Guarantee Given
on Behalf of
Each Party
(Note 2)
Maximum
Amount
Endorsed/
Guaranteed
During the
Period
(Note 6)
Outstanding
Endorsement/
Guarantee at the
End of the Period
(Note 6)
Actual
Borrowing
Amount
Amount
Endorsed/
Guaranteed by
Collateral
Ratio of
Accumulated
Endorsement/
Guarantee to Net
Equity in Latest
Financial
Statements
(%)
Aggregate
Endorsement/
Guarantee Limit
(Note)
Endorsement/
Guarantee Given
by Parent on
Behalf of
Subsidiaries
Endorsement/
Guarantee Given
by Subsidiaries
on Behalf of
Parent
Endorsement/
Guarantee Given
on Behalf of
Companies in
Mainland China
Note Name Relationship
0 FocalTech Systems Co., Ltd.
FocalTech
Systems, Ltd.
A subsidiary in
which the Parent
Company holds
directly and
indirectly over
50% of an equity
interest.
$3,906,421 $ 1,281,600 $ 1,281,600
( USD 45,000)
$9,398 $ - 16.4% $3,906,421 Y N N (Note 3)
( USD 45,000)
FocalTech
Electronics, Ltd.
$3,906,421 1,298,810 1,298,810
( USD 45,604)
3,097 - 16.62% 3,906,421 Y N N (Note 3)
( USD 45,604)
Hefei PineTech
Electronics Co.,
Ltd.
$3,906,421 1,281,600 1,281,600
( USD 45,000)
- - 16.4% 3,906,421 Y N Y (Note 3)
( USD 45,000)
FocalTech
Electronics
(Shenzhen) Co.,
Ltd.
$3,906,421 1,737,280 1,737,280
( USD 61,000)
19,638 - 22.24% 3,906,421 Y N Y (Note 3)
( USD 61,000)
FocalTech Smart
Sensors Co., Ltd.
$3,906,421 199,680 199,680 - - 2.56% 3,906,421 Y N N (Note 4 and 5)
FocalTech Smart
Sensors, Ltd.
$3,906,421 99,680 99,680 - - 1.28% 3,906,421 Y N N (Note 4)
( USD 3,500) ( USD 3,500)
1 FocalTech Systems (Shenzhen)
Co., Ltd.
FocalTech
Electronics
(Shenzhen) Co.,
Ltd.
A subsidiary in
which the Parent
Company holds
directly and
indirectly 100% of
an equity interest.
$1,277,307 436,480 436,480 43,648 436,480 34.17% 1,277,307 N N Y
( RMB100,000) ( RMB100,000) ( RMB100,000)
Note 1: The items are numbered as follows:
a. Issuer is numbered as “0”.
b. Investee companies are numbered from “1”.
Note 2: The maximum amount for guarantees provided to others:
a. The Company provides guarantees due to business, the amount shall not exceed as follows.
b. The maximum amount of guarantees provided to all subsidiaries and an individual shall not exceed 50% of the Company’s net worth.
c. The maximum amount of guarantees provided between subsidiaries shall not exceed 100% of the subsidiary’s net worth.
d. The total amount of guarantees of the Company and its subsidiaries shall not exceed 50% of the Company’s net worth. The maximum amount of guarantees provided to an individual by the Company and its subsidiaries shall not exceed 50% of the Company’s net worth.
e. Net worth is based on the latest financial statements audited or reviewed by independent auditors. The Company prepared financial report according to IFRSs, The Company’s net worth is the amount attributed to parent’s equity in the Company’s balance sheet.
Note 3: The Company provides USD 45,000 thousand sharing guarantee to FocalTech Electronics, Ltd., FocalTech Systems, Ltd., Hefei PineTech Electronics Co., Ltd. and FocalTech Electronics (Shenzhen) Co., Ltd. to purchase materials. 3,097 thousand, 9,398 thousand, 0 thousand and 1,304
thousand were used in this period.
Note 4: The Company provides USD 3,500 thousand sharing guarantee to both FocalTech Smart Sensors, Ltd. and FocalTech Smart Sensors Co., Ltd. to purchase materials. There is no actual usage in this period.
Note 5: The Company provides $100,000 thousand guarantee for common financing usage.
Note 6: The exchange rate is US$1=$28.48 and RMB=$4.3648 on December 31, 2020.
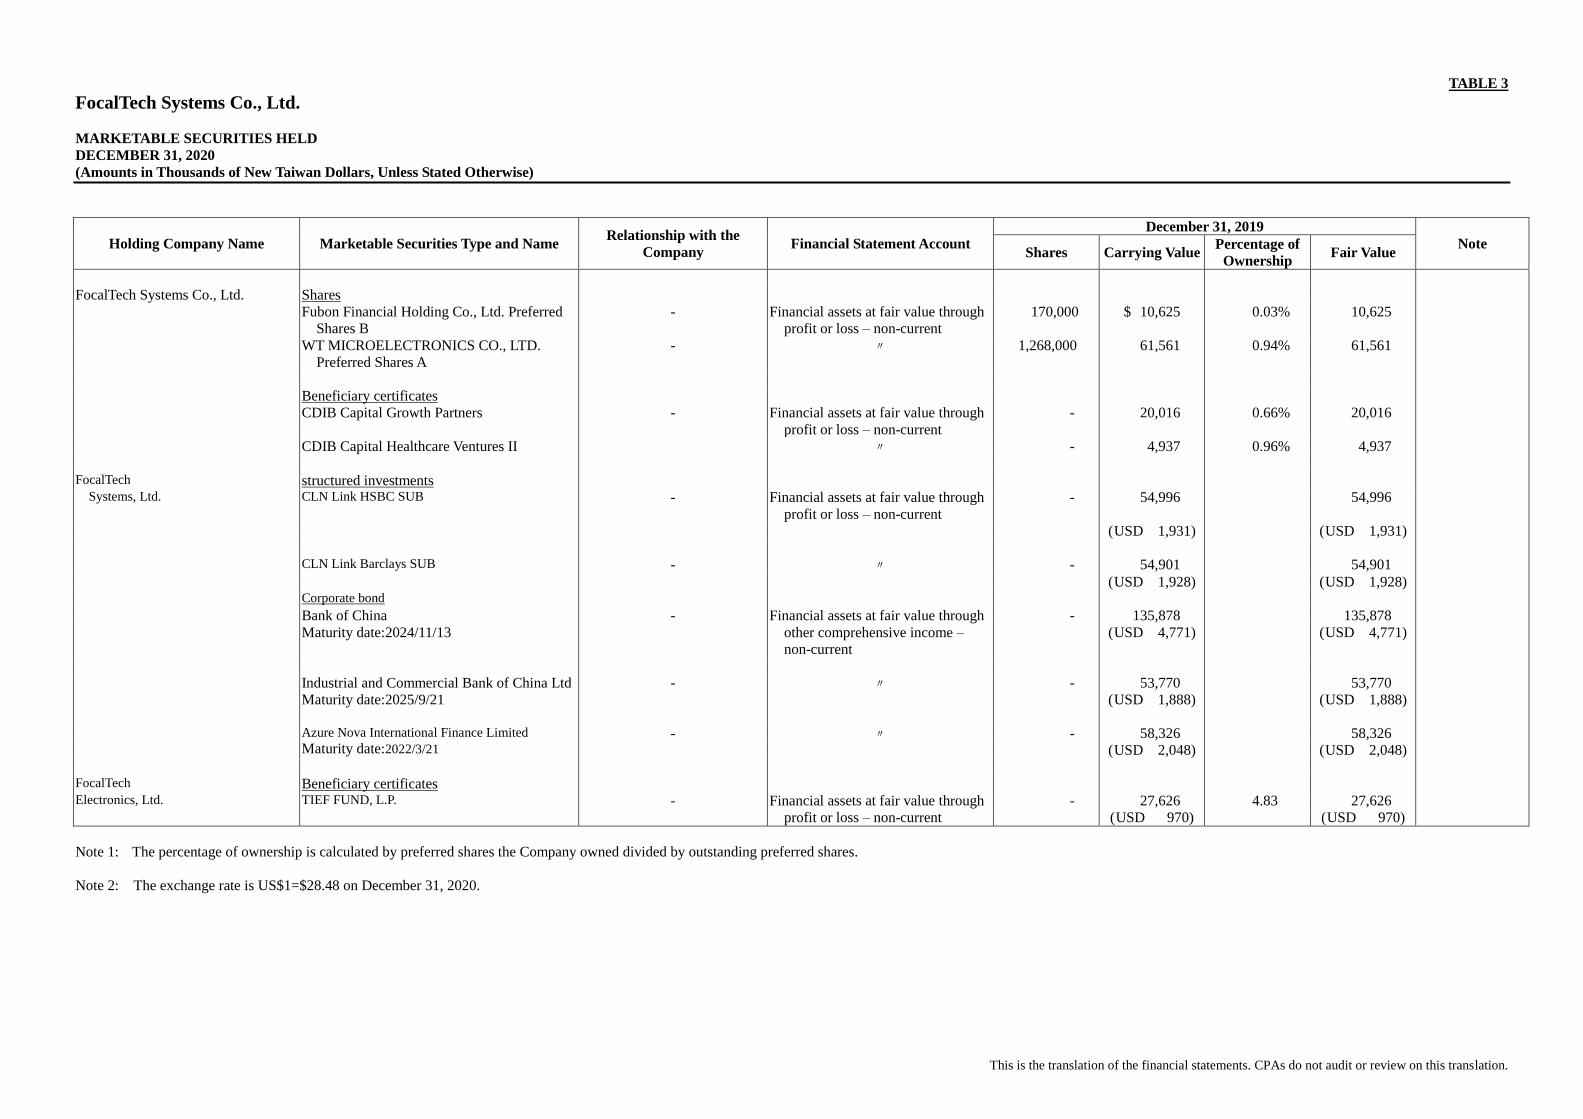
This is the translation of the financial statements. CPAs do not audit or review on this translation.
TABLE 3
FocalTech Systems Co., Ltd.
MARKETABLE SECURITIES HELD
DECEMBER 31, 2020
(Amounts in Thousands of New Taiwan Dollars, Unless Stated Otherwise)
Holding Company Name Marketable Securities Type and Name Relationship with the
Company Financial Statement Account
December 31, 2019
Note Shares Carrying Value
Percentage of
Ownership Fair Value
FocalTech Systems Co., Ltd. Shares
Fubon Financial Holding Co., Ltd. Preferred
Shares B
- Financial assets at fair value through
profit or loss – non-current
170,000 $ 10,625 0.03% 10,625
WT MICROELECTRONICS CO., LTD.
Preferred Shares A
- 〃 1,268,000 61,561 0.94% 61,561
Beneficiary certificates
CDIB Capital Growth Partners - Financial assets at fair value through
profit or loss – non-current
- 20,016 0.66% 20,016
CDIB Capital Healthcare Ventures II 〃 - 4,937 0.96% 4,937
FocalTech structured investments Systems, Ltd. CLN Link HSBC SUB - Financial assets at fair value through
profit or loss – non-current
- 54,996 54,996
( USD 1,931) ( USD 1,931)
CLN Link Barclays SUB - 〃 - 54,901 54,901
( USD 1,928) ( USD 1,928)
Corporate bond
Bank of China
Maturity date:2024/11/13
- Financial assets at fair value through
other comprehensive income –
non-current
- 135,878 135,878
( USD 4,771) ( USD 4,771)
Industrial and Commercial Bank of China Ltd
Maturity date:2025/9/21
- 〃 - 53,770 53,770
( USD 1,888) ( USD 1,888)
Azure Nova International Finance Limited
Maturity date:2022/3/21 - 〃 - 58,326 58,326
( USD 2,048) ( USD 2,048)
FocalTech Beneficiary certificates Electronics, Ltd. TIEF FUND, L.P. - Financial assets at fair value through
profit or loss – non-current
- 27,626 4.83 27,626
( USD 970) ( USD 970)
Note 1: The percentage of ownership is calculated by preferred shares the Company owned divided by outstanding preferred shares.
Note 2: The exchange rate is US$1=$28.48 on December 31, 2020.
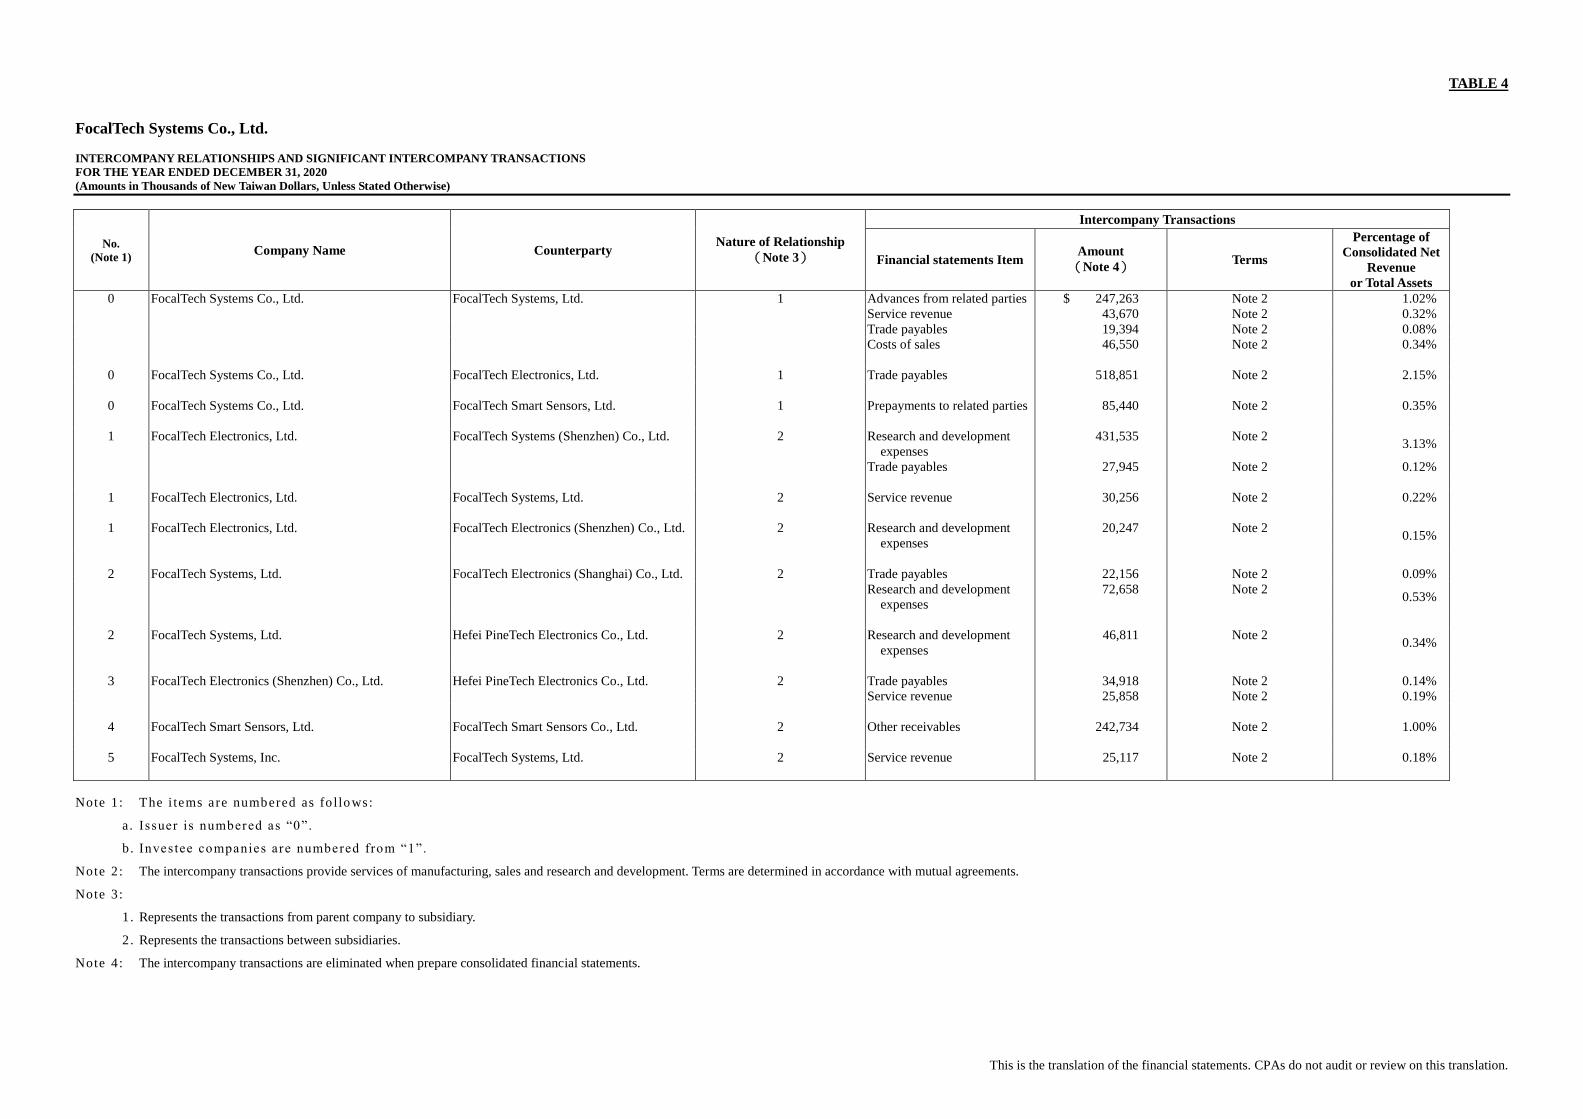
This is the translation of the financial statements. CPAs do not audit or review on this translation.
TABLE 4
FocalTech Systems Co., Ltd.
INTERCOMPANY RELATIONSHIPS AND SIGNIFICANT INTERCOMPANY TRANSACTIONS
FOR THE YEAR ENDED DECEMBER 31, 2020
(Amounts in Thousands of New Taiwan Dollars, Unless Stated Otherwise)
No.
(Note 1) Company Name Counterparty
Nature of Relationship
(Note 3)
Intercompany Transactions
Financial statements Item Amount
(Note 4) Terms
Percentage of
Consolidated Net
Revenue
or Total Assets
0 FocalTech Systems Co., Ltd. FocalTech Systems, Ltd. 1 Advances from related parties $ 247,263 Note 2 1.02%
Service revenue 43,670 Note 2 0.32%
Trade payables 19,394 Note 2 0.08%
Costs of sales 46,550 Note 2 0.34%
0 FocalTech Systems Co., Ltd. FocalTech Electronics, Ltd. 1 Trade payables 518,851 Note 2 2.15%
0 FocalTech Systems Co., Ltd. FocalTech Smart Sensors, Ltd. 1 Prepayments to related parties 85,440 Note 2 0.35%
1 FocalTech Electronics, Ltd. FocalTech Systems (Shenzhen) Co., Ltd. 2 Research and development
expenses
431,535 Note 2 3.13%
Trade payables 27,945 Note 2 0.12%
1 FocalTech Electronics, Ltd. FocalTech Systems, Ltd. 2 Service revenue 30,256 Note 2 0.22%
1 FocalTech Electronics, Ltd. FocalTech Electronics (Shenzhen) Co., Ltd. 2 Research and development
expenses
20,247 Note 2 0.15%
2 FocalTech Systems, Ltd. FocalTech Electronics (Shanghai) Co., Ltd. 2 Trade payables 22,156 Note 2 0.09%
Research and development
expenses
72,658 Note 2 0.53%
2 FocalTech Systems, Ltd. Hefei PineTech Electronics Co., Ltd. 2 Research and development
expenses
46,811 Note 2 0.34%
3 FocalTech Electronics (Shenzhen) Co., Ltd. Hefei PineTech Electronics Co., Ltd. 2 Trade payables 34,918 Note 2 0.14%
Service revenue 25,858 Note 2 0.19%
4 FocalTech Smart Sensors, Ltd. FocalTech Smart Sensors Co., Ltd. 2 Other receivables 242,734 Note 2 1.00%
5 FocalTech Systems, Inc. FocalTech Systems, Ltd. 2 Service revenue 25,117 Note 2 0.18%
Note 1: The i tems are numbered as fo l lo ws:
a . Issuer is numbered as “0”.
b . Investee companies are numbered from “1”.
Note 2: The intercompany transactions provide services of manufacturing, sales and research and development. Terms are determined in accordance with mutual agreements.
Note 3:
1 . Represents the transactions from parent company to subsidiary.
2 . Represents the transactions between subsidiaries.
Note 4: The intercompany transactions are eliminated when prepare consolidated financial statements.
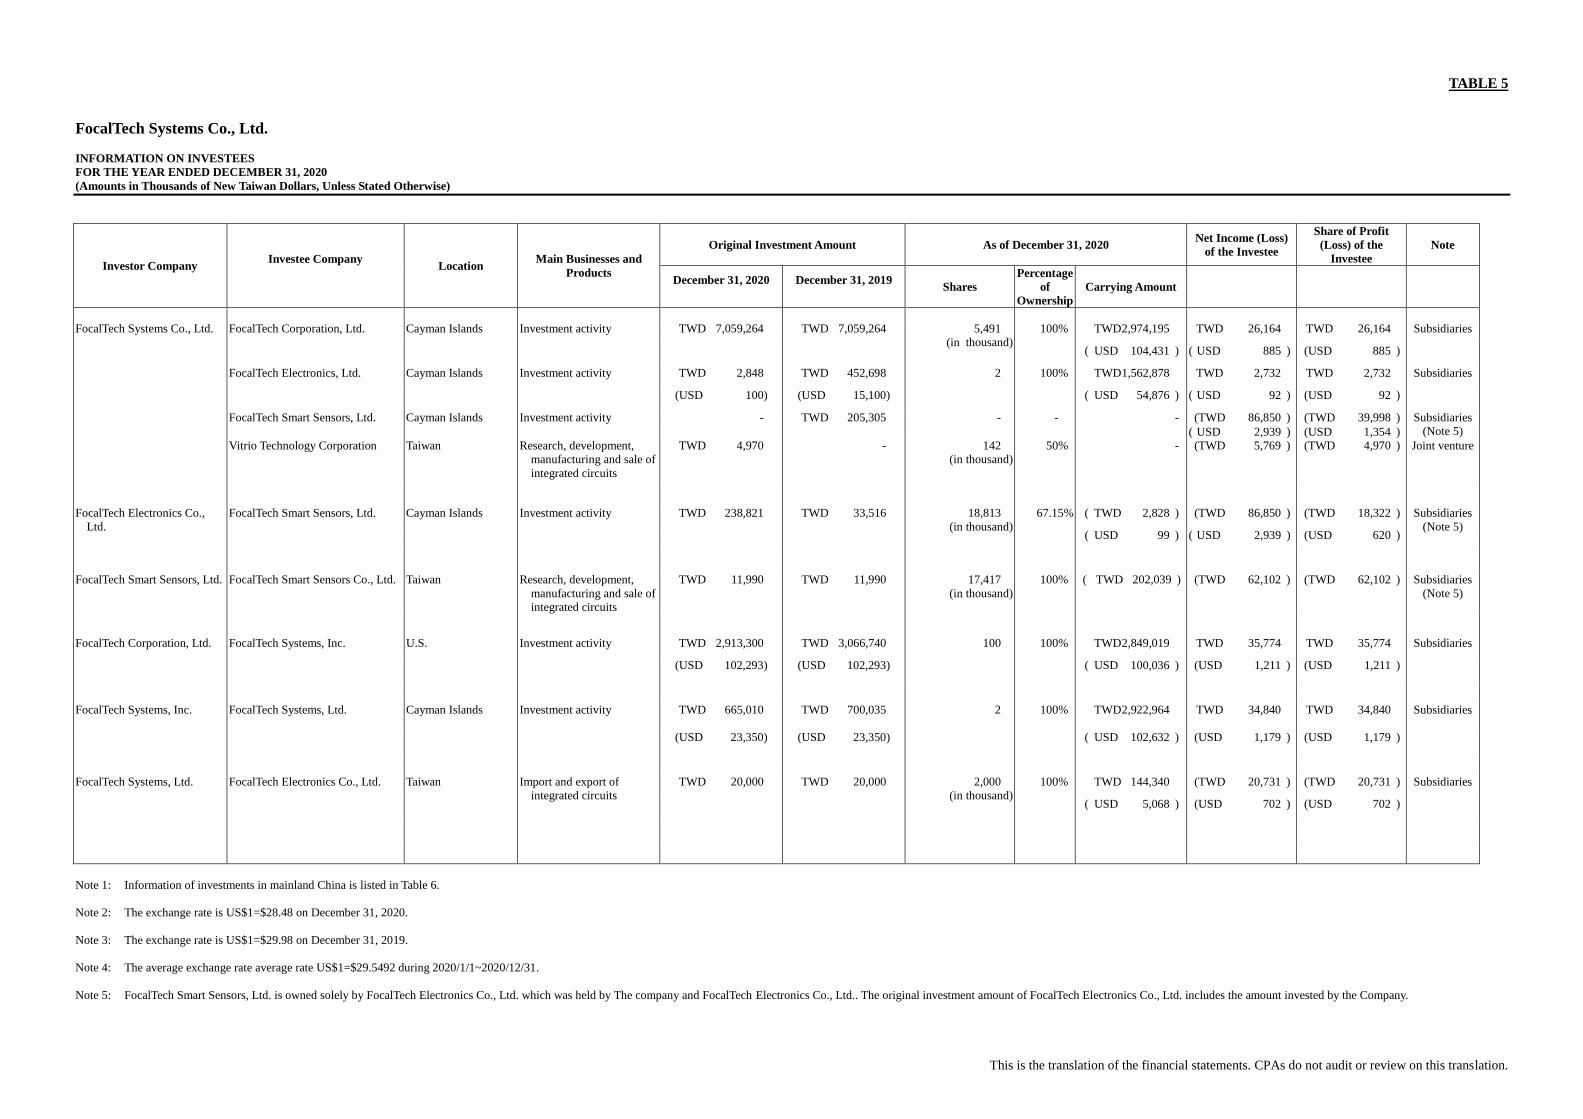
This is the translation of the financial statements. CPAs do not audit or review on this translation.
TABLE 5
FocalTech Systems Co., Ltd.
INFORMATION ON INVESTEES
FOR THE YEAR ENDED DECEMBER 31, 2020
(Amounts in Thousands of New Taiwan Dollars, Unless Stated Otherwise)
Investor Company Investee Company
Location
Main Businesses and
Products
Original Investment Amount As of December 31, 2020 Net Income (Loss)
of the Investee
Share of Profit
(Loss) of the
Investee
Note
December 31, 2020
December 31, 2019
Shares
Percentage
of
Ownership
Carrying Amount
FocalTech Systems Co., Ltd. FocalTech Corporation, Ltd. Cayman Islands Investment activity TWD 7,059,264 TWD 7,059,264 5,491
(in thousand)
100% TWD 2,974,195 TWD 26,164 TWD 26,164 Subsidiaries
( USD 104,431 ) ( USD 885 ) (USD 885 )
FocalTech Electronics, Ltd. Cayman Islands Investment activity TWD 2,848 TWD 452,698 2 100% TWD 1,562,878 TWD 2,732 TWD 2,732 Subsidiaries
(USD 100) (USD 15,100) ( USD 54,876 ) ( USD 92 ) (USD 92 )
FocalTech Smart Sensors, Ltd. Cayman Islands Investment activity - TWD 205,305 - - - (TWD 86,850 ) (TWD 39,998 ) Subsidiaries
(Note 5) ( USD 2,939 ) (USD 1,354 )
Vitrio Technology Corporation Taiwan Research, development,
manufacturing and sale of
integrated circuits
TWD 4,970 - 142
(in thousand)
50% - (TWD 5,769 ) (TWD 4,970 ) Joint venture
FocalTech Electronics Co.,
Ltd.
FocalTech Smart Sensors, Ltd. Cayman Islands Investment activity TWD 238,821 TWD 33,516 18,813
(in thousand)
67.15% ( TWD 2,828 ) (TWD 86,850 ) (TWD 18,322 ) Subsidiaries
(Note 5) ( USD 99 ) ( USD 2,939 ) (USD 620 )
FocalTech Smart Sensors, Ltd. FocalTech Smart Sensors Co., Ltd. Taiwan Research, development,
manufacturing and sale of
integrated circuits
TWD 11,990 TWD 11,990 17,417
(in thousand)
100% ( TWD 202,039 ) (TWD 62,102 ) (TWD 62,102 ) Subsidiaries
(Note 5)
FocalTech Corporation, Ltd. FocalTech Systems, Inc. U.S. Investment activity TWD 2,913,300 TWD 3,066,740 100 100% TWD 2,849,019 TWD 35,774 TWD 35,774 Subsidiaries
(USD 102,293) (USD 102,293) ( USD 100,036 ) (USD 1,211 ) (USD 1,211 )
FocalTech Systems, Inc. FocalTech Systems, Ltd. Cayman Islands Investment activity TWD 665,010
TWD 700,035
2 100% TWD 2,922,964 TWD 34,840 TWD 34,840 Subsidiaries
(USD 23,350) (USD 23,350) ( USD 102,632 ) (USD 1,179 ) (USD 1,179 )
FocalTech Systems, Ltd. FocalTech Electronics Co., Ltd. Taiwan Import and export of
integrated circuits
TWD 20,000
TWD 20,000
2,000
(in thousand)
100% TWD 144,340 (TWD 20,731 ) (TWD 20,731 ) Subsidiaries
( USD 5,068 ) (USD 702 ) (USD 702 )
Note 1: Information of investments in mainland China is listed in Table 6.
Note 2: The exchange rate is US$1=$28.48 on December 31, 2020.
Note 3: The exchange rate is US$1=$29.98 on December 31, 2019.
Note 4: The average exchange rate average rate US$1=$29.5492 during 2020/1/1~2020/12/31.
Note 5: FocalTech Smart Sensors, Ltd. is owned solely by FocalTech Electronics Co., Ltd. which was held by The company and FocalTech Electronics Co., Ltd.. The original investment amount of FocalTech Electronics Co., Ltd. includes the amount invested by the Company.
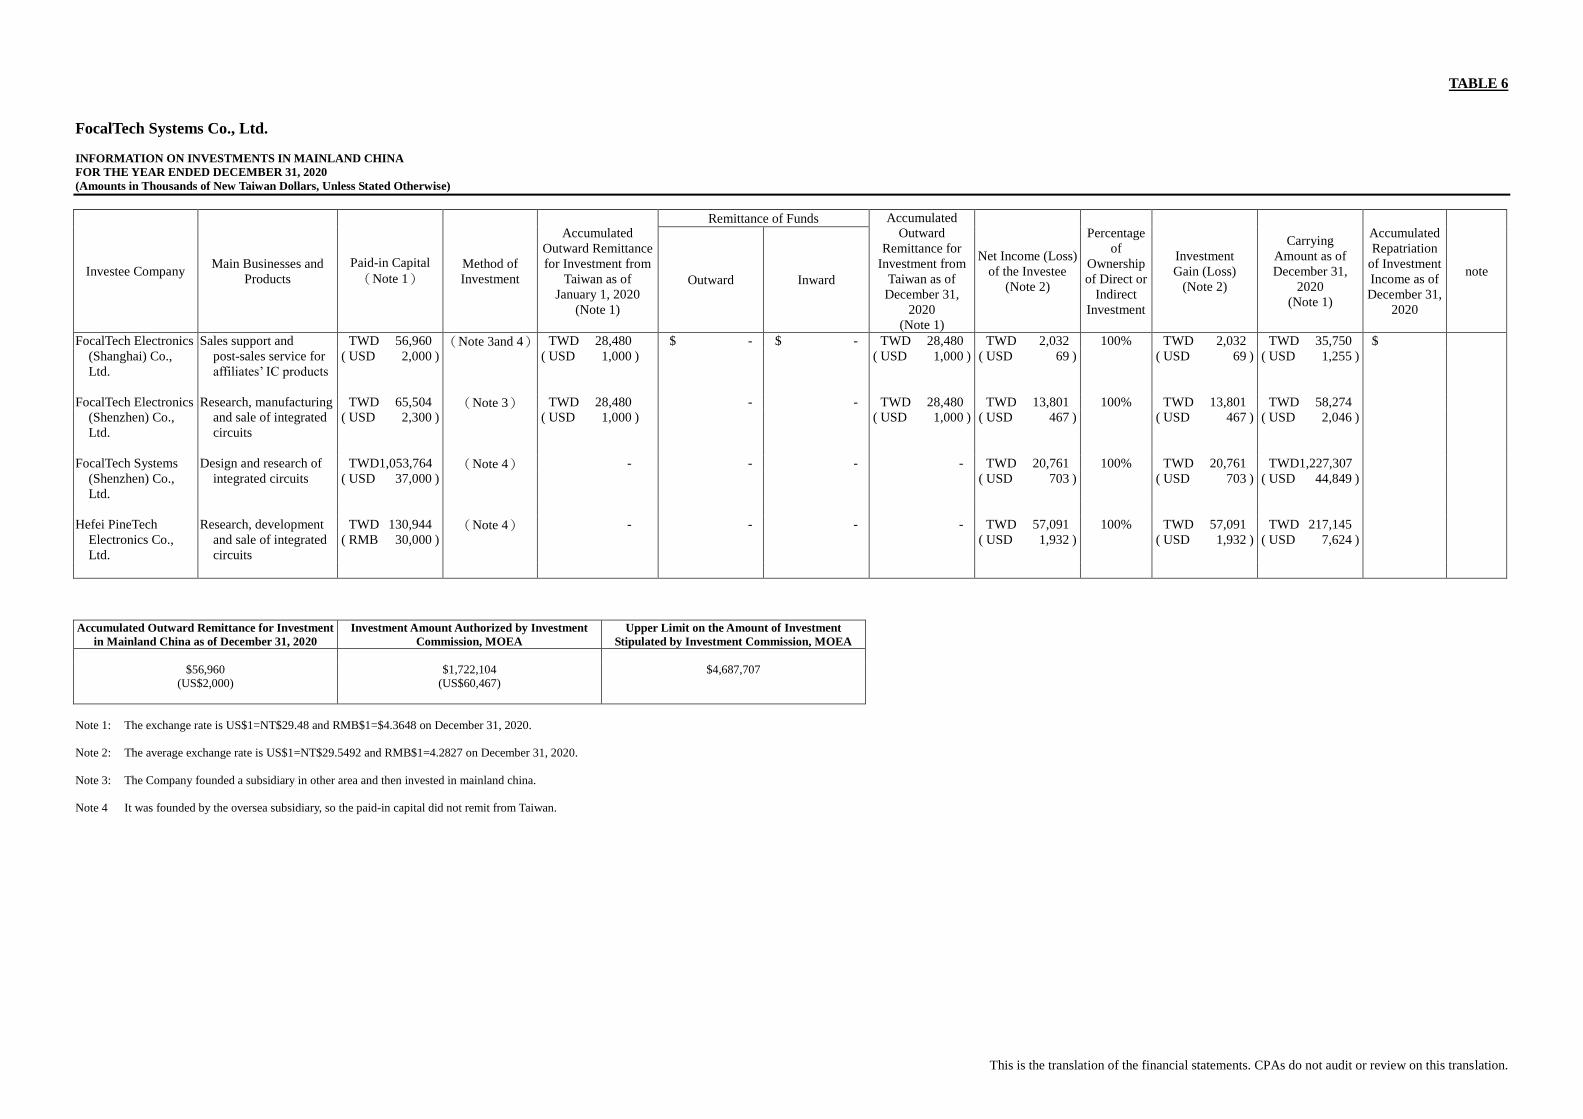
This is the translation of the financial statements. CPAs do not audit or review on this translation.
TABLE 6
FocalTech Systems Co., Ltd.
INFORMATION ON INVESTMENTS IN MAINLAND CHINA
FOR THE YEAR ENDED DECEMBER 31, 2020
(Amounts in Thousands of New Taiwan Dollars, Unless Stated Otherwise)
Investee Company Main Businesses and
Products
Paid-in Capital
(Note 1) Method of
Investment
Accumulated
Outward Remittance
for Investment from
Taiwan as of
January 1, 2020
(Note 1)
Remittance of Funds Accumulated
Outward
Remittance for
Investment from
Taiwan as of
December 31,
2020
(Note 1)
Net Income (Loss)
of the Investee
(Note 2)
Percentage
of
Ownership
of Direct or
Indirect
Investment
Investment
Gain (Loss)
(Note 2)
Carrying
Amount as of
December 31,
2020
(Note 1)
Accumulated
Repatriation
of Investment
Income as of
December 31,
2020
note Outward Inward
FocalTech Electronics
(Shanghai) Co.,
Ltd.
Sales support and
post-sales service for
affiliates’ IC products
TWD 56,960 (Note 3and 4) TWD 28,480 $ - $ - TWD 28,480 TWD 2,032 100% TWD 2,032 TWD 35,750 $ -
( USD 2,000 ) ( USD 1,000 ) ( USD 1,000 ) ( USD 69 ) ( USD 69 ) ( USD 1,255 )
FocalTech Electronics
(Shenzhen) Co.,
Ltd.
Research, manufacturing
and sale of integrated
circuits
TWD 65,504 (Note 3) TWD 28,480 - - TWD 28,480 TWD 13,801 100% TWD 13,801 TWD 58,274 -
( USD 2,300 ) ( USD 1,000 ) ( USD 1,000 ) ( USD 467 ) ( USD 467 ) ( USD 2,046 )
FocalTech Systems
(Shenzhen) Co.,
Ltd.
Design and research of
integrated circuits
TWD1,053,764 (Note 4) - - - - TWD 20,761 100% TWD 20,761 TWD1,227,307 -
( USD 37,000 ) ( USD 703 ) ( USD 703 ) ( USD 44,849 )
Hefei PineTech
Electronics Co.,
Ltd.
Research, development
and sale of integrated
circuits
TWD 130,944 (Note 4) - - - - TWD 57,091 100% TWD 57,091 TWD 217,145 -
( RMB 30,000 ) ( USD 1,932 ) ( USD 1,932 ) ( USD 7,624 )
Accumulated Outward Remittance for Investment
in Mainland China as of December 31, 2020
Investment Amount Authorized by Investment
Commission, MOEA
Upper Limit on the Amount of Investment
Stipulated by Investment Commission, MOEA
$56,960
(US$2,000)
$1,722,104
(US$60,467)
$4,687,707
Note 1: The exchange rate is US$1=NT$29.48 and RMB$1=$4.3648 on December 31, 2020.
Note 2: The average exchange rate is US$1=NT$29.5492 and RMB$1=4.2827 on December 31, 2020.
Note 3: The Company founded a subsidiary in other area and then invested in mainland china.
Note 4 It was founded by the oversea subsidiary, so the paid-in capital did not remit from Taiwan.
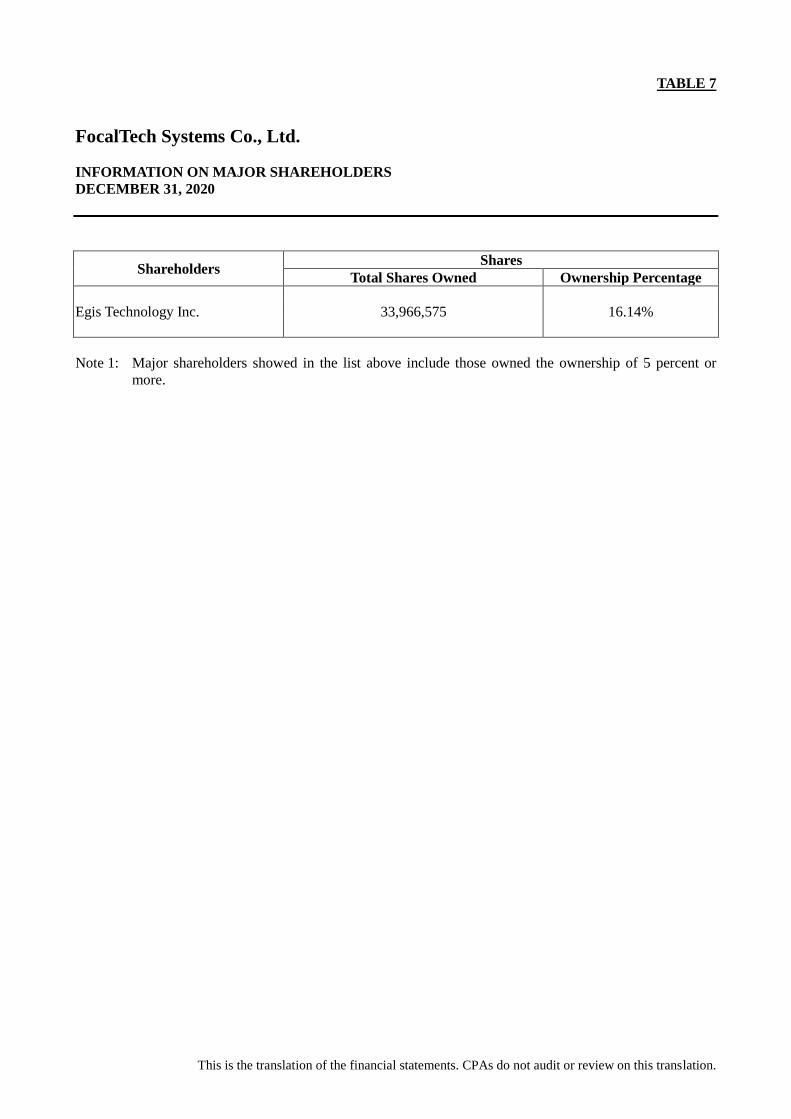
This is the translation of the financial statements. CPAs do not audit or review on this translation.
TABLE 7
FocalTech Systems Co., Ltd.
INFORMATION ON MAJOR SHAREHOLDERS
DECEMBER 31, 2020
Shareholders Shares
Total Shares Owned Ownership Percentage
Egis Technology Inc. 33,966,575 16.14%
Note 1: Major shareholders showed in the list above include those owned the ownership of 5 percent or
more.