Embed Size (px)
Citation preview
Functional Magnetic Resonance Imaging analysis of the Central Nervous System
response to pain Developing and assessing an in-house made pneumatic compression device as a means to elicit pain in a fMRI compatible way
Sérgio Santos Vide Dissertação de Mestrado Integrado em Medicina 2013
Functional Magnetic Resonance Imaging analysis of the Central Nervous System response to pain
Developing and assessing an in-house made pneumatic compression device as a
means to elicit pain in a fMRI compatible way
Dissertação de candidatura ao grau de mestre em Medicina, submetida ao Instituto de Ciências Biomédicas Abel Salazar da Universidade do Porto
Autor | Sérgio Santos Vide
Orientador | Dr. Pedro Amorim
Assistente Hospitalar Graduado Sénior do CHP-HGSA.
Professor Auxiliar Convidado, ICBAS
Co-orientador | Dr. João Abel Loureiro Marques Xavier
Assistente Hospitalar Graduado Sénior do CHP-HGSA.
Professor Catedrático Convidado, ICBAS
1
INDEX
INDEX .................................................................................................................................................... 2
ABSTRACT........................................................................................................................................... 3
RESUMO ............................................................................................................................................... 5
INTRODUCTION .................................................................................................................................. 9
METHODS........................................................................................................................................... 11
Subjects ........................................................................................................................................... 11
Study Design ................................................................................................................................... 11
Stimulation Paradigm ..................................................................................................................... 12
fMRI scanning ................................................................................................................................. 12
Analyses of imaging data .............................................................................................................. 14
Single-Subject Model Analysis ................................................................................................. 14
Single Subject Independent Component Analysis ................................................................ 15
Group-level analysis .................................................................................................................. 16
RESULTS ............................................................................................................................................ 17
Pain Ratings .................................................................................................................................... 17
Neuroimaging Data ........................................................................................................................ 17
DISCUSSION and CONCLUSION.................................................................................................. 20
ACKNOWLEDGEMENTS ................................................................................................................ 23
BIBLIOGRAPHY ................................................................................................................................ 24
Supplementary Materials ............................................................................................................... 27
Supplementary Section 1 .............................................................................................................. 28
Lower-Level analysis – Subject 1 ............................................................................................ 28
Lower-Level analysis – Subject 2 ............................................................................................ 29
Lower-Level analysis – Subject 3 ............................................................................................ 30
Supplementary Section 2 .................................................................................................................. 31
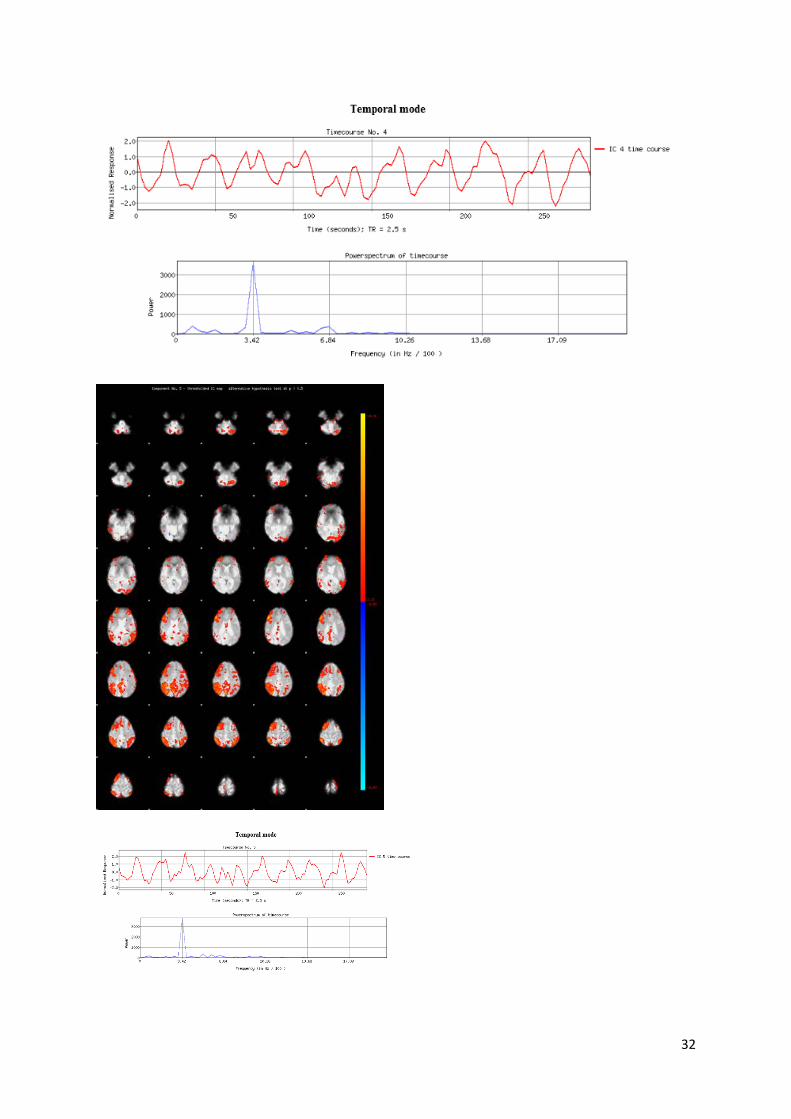
Independent component analysis – Subject 3 ....................................................................... 31
Supplementary Section 3 .............................................................................................................. 33
E-Prime® script used overview ................................................................................................ 33
2
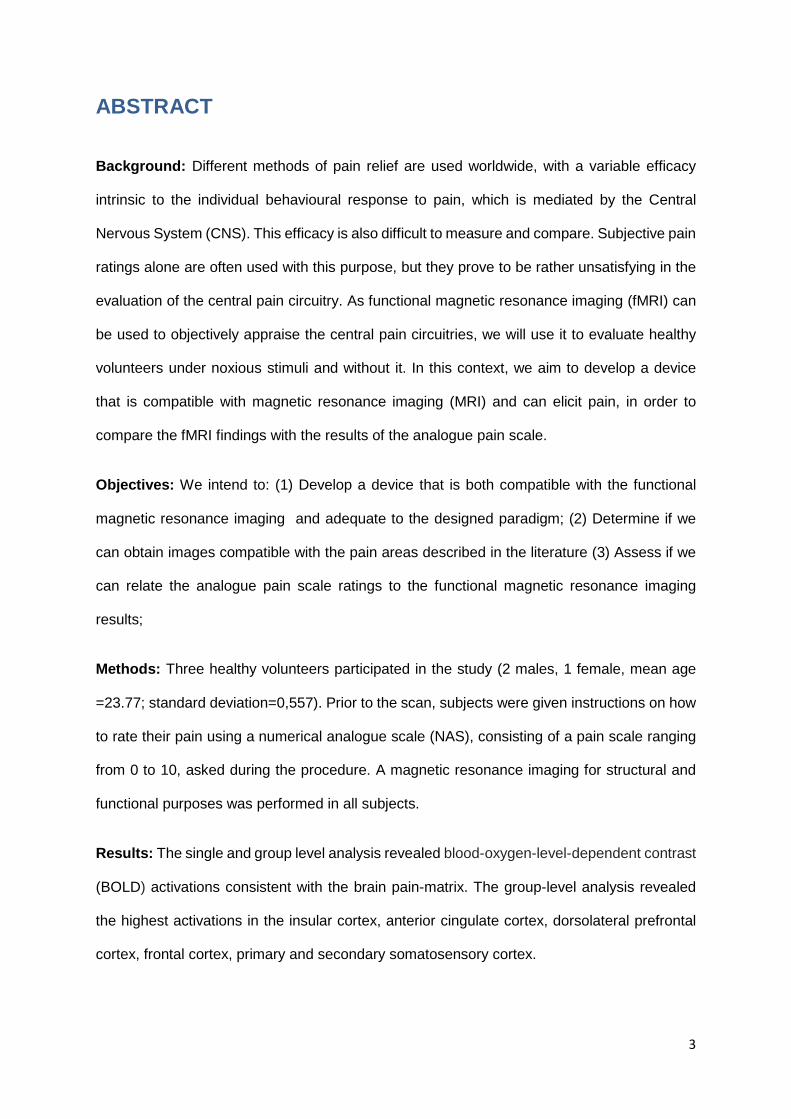
ABSTRACT
Background: Different methods of pain relief are used worldwide, with a variable efficacy
intrinsic to the individual behavioural response to pain, which is mediated by the Central
Nervous System (CNS). This efficacy is also difficult to measure and compare. Subjective pain
ratings alone are often used with this purpose, but they prove to be rather unsatisfying in the
evaluation of the central pain circuitry. As functional magnetic resonance imaging (fMRI) can
be used to objectively appraise the central pain circuitries, we will use it to evaluate healthy
volunteers under noxious stimuli and without it. In this context, we aim to develop a device
that is compatible with magnetic resonance imaging (MRI) and can elicit pain, in order to
compare the fMRI findings with the results of the analogue pain scale.
Objectives: We intend to: (1) Develop a device that is both compatible with the functional
magnetic resonance imaging and adequate to the designed paradigm; (2) Determine if we
can obtain images compatible with the pain areas described in the literature (3) Assess if we
can relate the analogue pain scale ratings to the functional magnetic resonance imaging
results;
Methods: Three healthy volunteers participated in the study (2 males, 1 female, mean age
=23.77; standard deviation=0,557). Prior to the scan, subjects were given instructions on how
to rate their pain using a numerical analogue scale (NAS), consisting of a pain scale ranging
from 0 to 10, asked during the procedure. A magnetic resonance imaging for structural and
functional purposes was performed in all subjects.
Results: The single and group level analysis revealed blood-oxygen-level-dependent contrast
(BOLD) activations consistent with the brain pain-matrix. The group-level analysis revealed
the highest activations in the insular cortex, anterior cingulate cortex, dorsolateral prefrontal
cortex, frontal cortex, primary and secondary somatosensory cortex.
3
Conclusions: The developed pneumatic setup compatible with the MRI, which applied
pressure in the pain and non-pain range to the volunteers, was able to elicit BOLD responses
that are compatible with the previous literature regarding the pain matrix activation. Although
the sample size is very small, this preliminary results points us in an optimistic direction,
showing that further studies could be done using this equipment and paradigm.
LIST OF ABBREVIATIONS
Numerical Analogue Scale (NAS);
Magnetic Resonance Imaging (MRI);
Functional Magnetic Resonance Imaging (fMRI);
Blood-Oxygen-Level-Dependent Contrast (BOLD);
Somatosensory (S1); Secondary Somatosensory (S2);
Anterior Cingulate Cortex (ACC); Prefrontal Cortex (PFC); Insular Cortex (IC);
Montreal Neurological Institute [MNI];
Repetition Time [TR]; Echo-Time [TE];
FSL (FMRIB's Software Library);
FEAT (FMRI Expert Analysis Tool);
Affine Registration (FLIRT);
Degrees Of Freedom (DOF);
MELODIC (Multivariate Exploratory Linear Decomposition into Independent Components);
Higher-Level Estimation Method in FEAT (FLAME);
4
RESUMO
A dor está presente em aproximadamente 20% da população adulta no mundo ocidental [8]
e é a razão mais comum pela qual os norte-americanos procuram a ajuda de profissionais de
saúde, com 21,5% dos pacientes que são atendidos nos cuidados de saúde primários a
sofrerem de dor crónica [9]. Esta prevalência de dor associa-se a uma grande utilização dos
cuidados de saúde e a enormes custos socioeconómicos [10]. Neste âmbito, a compreensão
da dor assume um papel central, pois é o primeiro passo para o desenvolvimento de
tratamentos bem-sucedidos.
A investigação na área da dor tem avançado muito desde que Descartes [1] fez a primeira
tentativa documentada de compreender a dor, argumentando que um estímulo nóxico ativaria
o cérebro numa via única. Actualmente é claro que o processamento da dor é muito mais
complexo do que inicialmente se pensava [2], mas para chegar à compreensão que temos
da dor nos dias de hoje, várias técnicas tiveram de ser usadas. Destacam-se os estudos
anatómicos, funcionais, moleculares e de tractografia, quer a nível do sistema nervoso
central, quer a nível da medula espinhal e dos nociceptores periféricos [3].
Nos estudos que são desenvolvidos na área da dor, a ressonância magnética dependente do
nível de oxigenação sanguínea (BOLD) tem um papel fundamental e foi demonstrada como
sendo o melhor método disponível para avaliar os circuitos do sistema nervoso central
envolvidos no processamento da estimulação dolorosa [4]. Para além do BOLD, diferentes
métodos para classificar a dor podem ser utilizados. Existem escalas visuais e analógicas
que se mostraram ferramentas úteis na avaliação da dor em diferentes estudos [5]. No
entanto, continuam a ser medidas relativamente inconsistentes e dificilmente reprodutíveis,
sendo também pouco úteis na compreensão do circuito central da dor [6]. A ressonância
magnética funcional assume então um papel preponderante nesta área.
5
Devido à complexidade que rodeia a dor, abrangendo uma perceção subjetiva
multidimensional de componentes sensoriais, cognitivas e emocionais, atualmente os seus
diferentes elementos são integrados numa "matriz da dor". Esta matriz inclui várias áreas do
cérebro, que podem ser divididas em laterais (áreas que envolvem o córtex sensitivo primário
e secundário, o tálamo, e as partes posteriores da ínsula) e mediais (parte anterior da ínsula,
cíngulo anterior e córtex pré-frontal) [7]. Destas áreas, a ínsula é a que mais consistentemente
é ativada durante a estimulação dolorosa [8]. Todas estas partes interagem gerando a
perceção integrada individual de dor [2].
Sendo assim, a ressonância magnética funcional será utilizada para avaliar objetivamente os
circuitos centrais da dor. O estudo recorre a voluntários saudáveis, submetidos a períodos de
estimulação nóxica e não nóxica.
Neste contexto, é necessário um dispositivo capaz de administrar estimulação nóxica e que
seja também compatível com a ressonância magnética. Atualmente existem disponíveis
diferentes métodos de estimulação nóxica, sendo os mais usados baseados em térmodos e
em lasers [21-23]. No entanto, estes dispositivos são de elevado custo.
Objetivos: Considerando a importância da realização de estudos na área da dor, e dado que
um método de estimulação nóxica com as características necessárias para ser utilizado com
a ressonância magnética não está ao nosso dispôr, pretende-se: (1) criar um dispositivo que
seja compatível com a ressonância magnética funcional e adequado a um paradigma para
estudar a dor (2) Determinar se com esse dispositivo é possivel obter imagens compatíveis
com as áreas de dor que estão descritas na literatura (3) Avaliar a correlação entre os
resultados da escala analógica da dor e a ativação das áreas cerebrais através da
ressonância magnética funcional.
6

Métodos: Três voluntários saudáveis participaram no estudo, dois do sexo masculino e um
do sexo feminino com idade média de 23.77 anos (um desvio padrão de 0,0557 anos). Antes
de realizarem a ressonância magnética, os indivíduos foram instruídos em como classificar a
sua dor usando a escala analógica numérica (Numerical Analog Scale – NAS), e em que
ocasiões é que o deveriam fazer. A escala analógica numérica (NAS) consiste numa escala
de dor que varia de 1 a 10. Pelo menos uma sessão para aquisição de dados estruturais e
funcionais foi feita para cada voluntário. Para desencadear a dor, foi usada uma manga de
insuflação na coxa dos voluntários, que estava ligada a um regulador de pressão e ao sistema
de ar comprimido do hospital e sincronizada com o gerador de paradigmas da ressonância
magnética através de um microcontrolador baseado em Arduino®.
Resultados: A análise individual e de grupo das activações cerebrais revelou resultados
consistentes com a matriz cerebral da dor. A análise de grupo apresentou as seguintes
activações máximas: ínsula (Direita: x, y, z = 42, -14, 0; Z=2.11; p<0,05 // Esquerda: x, y, z=-
36, 16, -6 Z=2.24 p<0,05; coordenadas x, y, and z registadas no espaço de Montreal
Neurological Institute (MNI)), cíngulo anterior (Direito: x, y, z=2, 46, 10; Z=2.40; p<0,05 //
Esquerdo: x, y, z=-2, 46, 10; Z=2.38; p<0,05), córtex pré-frontal dorsolateral (Direito: x, y,
z=26, 50,30 Z=2.00; p<0,05 // Esquerdo: x, y, z=-46, 14, 48; Z=2.10; p<0,05), córtex frontal
(Direito: x, y, z = 2,60,18 ; Z=2.44; p<0,05 // Esquerdo: x, y, z=-46, 14, 48; Z=2.10; p<0,05)
córtex sensitivo primário (Direito: x, y, z=8, -30, 64 Z=1.30; p<0,05 // Esquerdo: x, y, z= -50, -
28, 60 Z=2.04; p<0,05), córtex sensitivo secundário (Direito: x, y, z=2, -14,64 Z=1.86; p<0,05
// Esquerdo: x, y, z = -2, -8, 64; Z=2.11; p<0,05) e tálamo (Direito: x, y, z=20, -26, 0 Z=1.63;
p<0,05 // Esquerdo: x, y, z=-14, -14, 4; Z=1.44; p<0,05). A escala numérica analógica
demonstrou uma classificação média de 7,11 (desvio padrão de 0,19) durante a insuflação
da manga e uma média de dor de 1,22 (desvio padrão de 0,19) durante a desinsuflação.
7
Conclusões: O sistema pneumático que foi desenvolvido mostrou-se compatível com a
ressonância magnética e permitiu-nos realizar uma estimulação nóxica. A sua utilização
durante estudos funcionais revelou uma ativação cerebral durante a estimulação dolorosa
que é compatível com as áreas que a literatura define como sendo as responsáveis pelo
processamento da dor.
Embora o tamanho da amostra seja demasiado pequena para resultados estatisticamente
robustos, estes dados preliminares apontam-nos numa direção otimista, mostrando que
novos estudos poderão ser feitos usando o equipamento que desenvolvemos e o paradigma
que aplicamos, e que é possível construir um equipamento para este tipo de estudos, com
um custo relativamente baixo.
8
INTRODUCTION
Pain is present in approximately 20% of the adult population in the Western World [9] and is
the most common reason why North Americans seek help from health professionals, with
21.5% of the patients seen by primary care physicians suffering from persistent pain [10].
This prevalence of pain represents high health-care and socioeconomic costs [11], so
understanding pain is the first step to develop successful treatments.
Pain research has advanced greatly since Descartes [1] made the first documented attempt
to understand nociception. By then, it was argued that a noxious stimulus was to activate the
brain in a single line-labelled fashion. It is now obvious that pain processing is far more
complex [2], with anatomical, functional, molecular, and tractography studies being used to
increment our knowledge, contributing the current understanding of pain [3, 12-14].
In these researches, blood oxygenation level-dependent (BOLD) [15] functional MRI (fMRI)
has a pivotal role and was shown to be a method that can be used to probe the CNS circuitry
during a painful stimulus [4]. Although measurements such as pain rating are useful for the
evaluation of pain [5], they are intrinsically highly variable measures [6] and alone do not
facilitate a comprehension of the CNS pain circuitry, hence the importance of fMRI.
Due to pain complexity, as a multidimensional subjective perception covering sensory,
cognitive, and emotional components, nowadays all its constituents are encompassed in a
“pain matrix” [16]. This pain matrix is not a static entity and includes various areas of the brain,
that can be divided into lateral (sensory–discriminatory involving areas such as primary
somatosensory (S1), secondary somatosensory (S2), thalamus, and posterior parts of insula)
and medial [affective–cognitive–evaluative involving areas like the anterior parts of insula,
anterior cingulate cortex (ACC), and prefrontal cortex (PFC)] neuroanatomical components
[7]. The insular cortex (IC) is the most consistently activated area during pain [8, 17, 18]. All
these parts interact with each other, ultimately generating the individual perception of pain [2].
9
All these different interactions make the study of pain a very complex task [19]. What functional
neuroimaging experiments do is to simulate a constrained version of the pain experience in a
laboratory environment and primarily use the signal change evoked in response to a stimulus
event to elucidate the timing, intensity and spatial location of the underlying brain activity [20].
Diverse arrays of noxious stimulus have been used for this purpose, ranging from the
stimulation of the skin, muscle or viscera, using mechanical, electrical, ischemic, chemical or
thermal approaches; subcutaneous or intramuscular injections of pain-inducing or
inflammatory compounds such as hypertonic saline, glutamate or capsaicin; to the more
invasive techniques, such as rectal balloon distension [21-23].
In this study it is used pressure for the mechanical stimulation of deep tissues (muscle, bone,
vascular and nervous structures), which has been used in a slightly different way in previous
studies as noxious stimuli in fMRI pain studies [24, 25].
The intent is to assess the possibility of achieving BOLD responses consistent with the
literature defined pain-matrix of the brain[16], using a low-budget equipment set-up and
evaluate the possibility of implementing this very equipment in future fMRI pain studies.
10
METHODS
Subjects
3 healthy volunteers were investigated (2 males, 1 female, mean age=23.77; standard
deviation=0,557). They were not under any medication at the time of the study. Participants
were recruited among 6th year medical students of the University of Porto and all gave their
written informed consent.
Study Design
This is an applied, basic research study, where a fMRI compatible device was developed and
tested as a means to elicit pain. It was also conceptualized and implemented a paradigm for
fMRI acquisition, designed so it would suit the device.
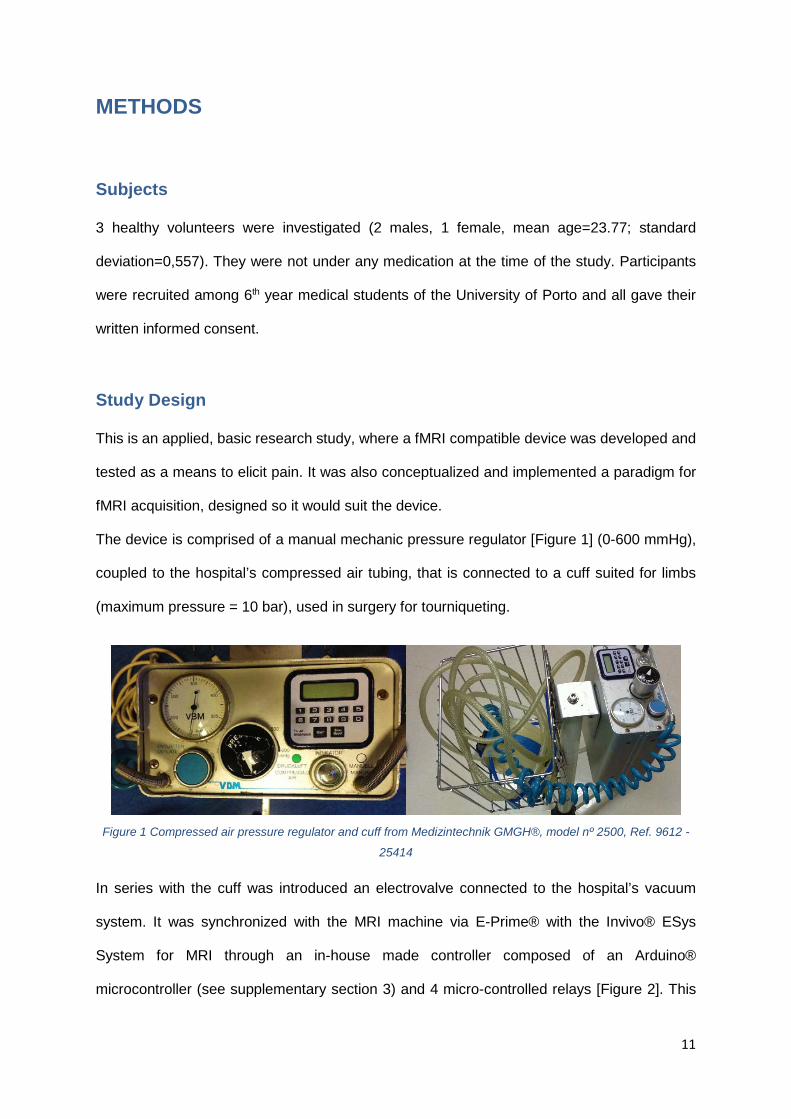
The device is comprised of a manual mechanic pressure regulator [Figure 1] (0-600 mmHg),
coupled to the hospital’s compressed air tubing, that is connected to a cuff suited for limbs
(maximum pressure = 10 bar), used in surgery for tourniqueting.
Figure 1 Compressed air pressure regulator and cuff from Medizintechnik GMGH®, model nº 2500, Ref. 9612 -
25414
In series with the cuff was introduced an electrovalve connected to the hospital’s vacuum
system. It was synchronized with the MRI machine via E-Prime® with the Invivo® ESys
System for MRI through an in-house made controller composed of an Arduino®
microcontroller (see supplementary section 3) and 4 micro-controlled relays [Figure 2]. This
11
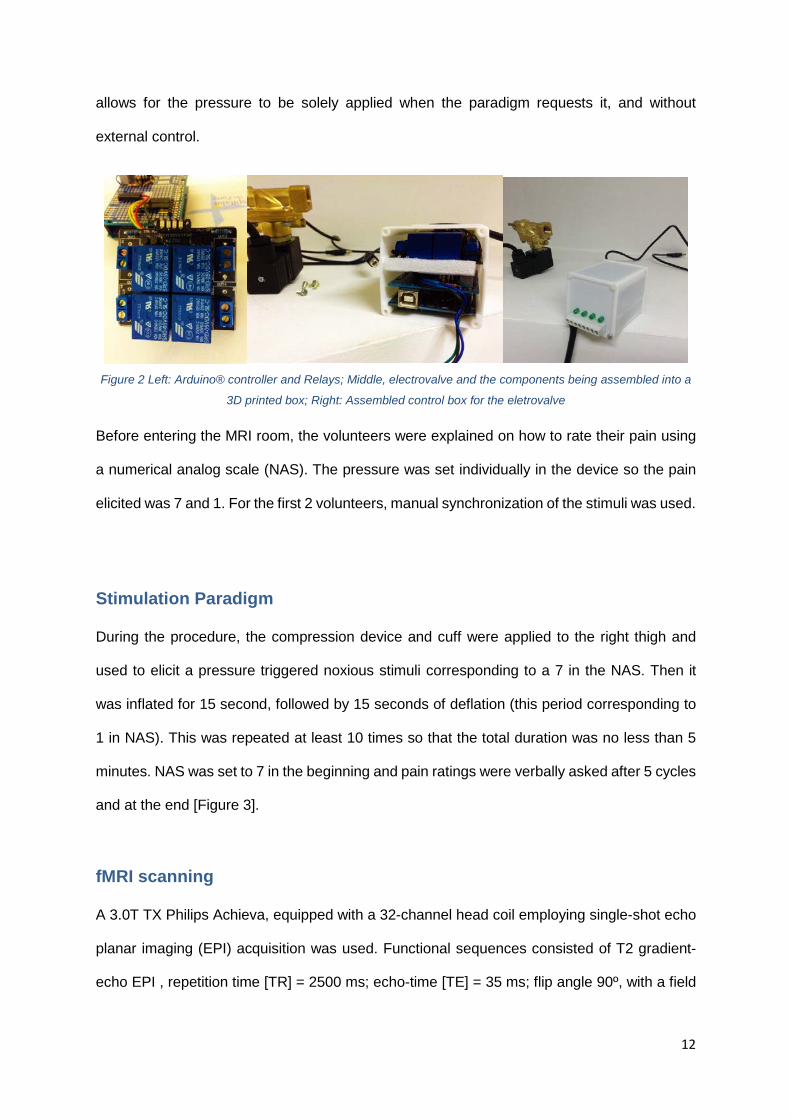
allows for the pressure to be solely applied when the paradigm requests it, and without
external control.
Figure 2 Left: Arduino® controller and Relays; Middle, electrovalve and the components being assembled into a
3D printed box; Right: Assembled control box for the eletrovalve
Before entering the MRI room, the volunteers were explained on how to rate their pain using
a numerical analog scale (NAS). The pressure was set individually in the device so the pain
elicited was 7 and 1. For the first 2 volunteers, manual synchronization of the stimuli was used.
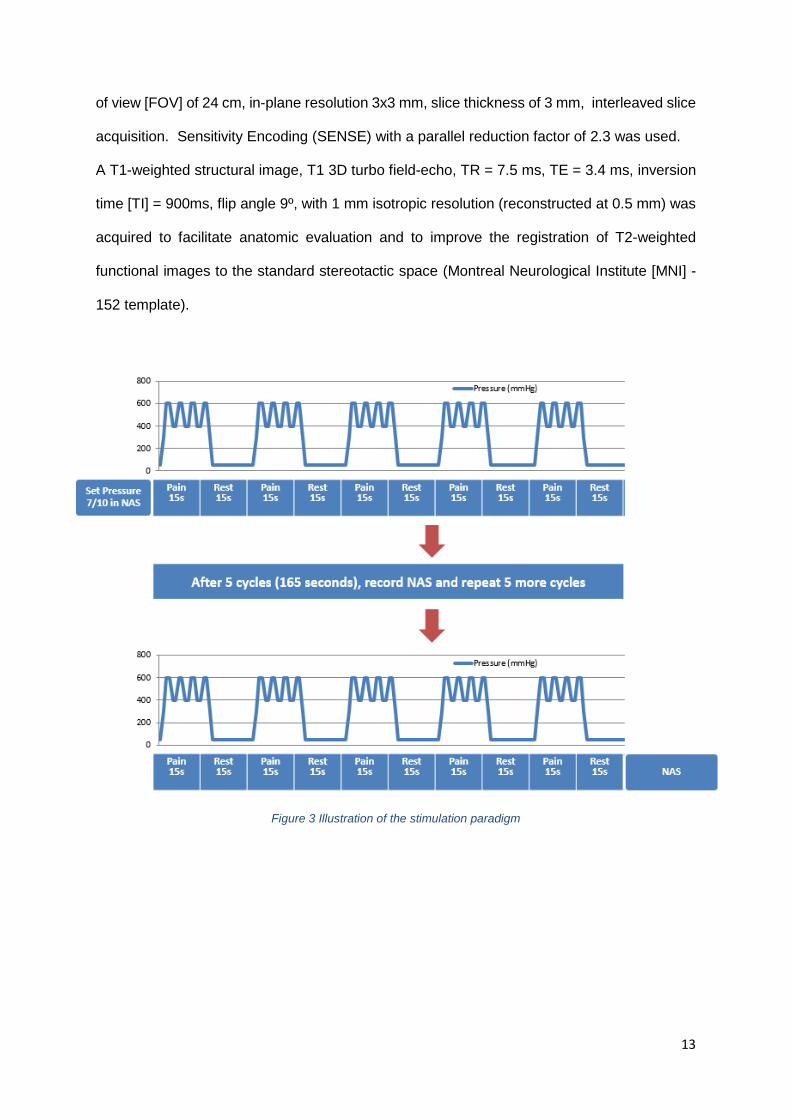
Stimulation Paradigm
During the procedure, the compression device and cuff were applied to the right thigh and
used to elicit a pressure triggered noxious stimuli corresponding to a 7 in the NAS. Then it
was inflated for 15 second, followed by 15 seconds of deflation (this period corresponding to
1 in NAS). This was repeated at least 10 times so that the total duration was no less than 5
minutes. NAS was set to 7 in the beginning and pain ratings were verbally asked after 5 cycles
and at the end [Figure 3].
fMRI scanning
A 3.0T TX Philips Achieva, equipped with a 32-channel head coil employing single-shot echo
planar imaging (EPI) acquisition was used. Functional sequences consisted of T2 gradient-
echo EPI , repetition time [TR] = 2500 ms; echo-time [TE] = 35 ms; flip angle 90º, with a field
12
of view [FOV] of 24 cm, in-plane resolution 3x3 mm, slice thickness of 3 mm, interleaved slice
acquisition. Sensitivity Encoding (SENSE) with a parallel reduction factor of 2.3 was used.
A T1-weighted structural image, T1 3D turbo field-echo, TR = 7.5 ms, TE = 3.4 ms, inversion
time [TI] = 900ms, flip angle 9º, with 1 mm isotropic resolution (reconstructed at 0.5 mm) was
acquired to facilitate anatomic evaluation and to improve the registration of T2-weighted
functional images to the standard stereotactic space (Montreal Neurological Institute [MNI] -
152 template).
Figure 3 Illustration of the stimulation paradigm
13
Analyses of imaging data
Single-Subject Model Analysis
Analysis methods for FMRI data processing was carried out using FEAT (FMRI Expert
Analysis Tool) Version 6.00, part of FSL (FMRIB's Software Library, www.fmrib.ox.ac.uk/fsl).
Registration to high resolution structural and standard space images was carried out using
FLIRT. [26, 27].
The following pre-statistics processing was applied: motion correction using MCFLIRT [26];
slice-timing correction using Fourier-space time-series phase-shifting; non-brain removal
using BET [28]; spatial smoothing using a Gaussian kernel of FWHM 5mm; grand-mean
intensity normalisation of the entire 4D dataset by a single multiplicative factor; highpass
temporal filtering (Gaussian-weighted least-squares straight line fitting, with sigma=30.0s).
After preprocessing, the functional scans were registered to the MNI152 standard space
[average T1 brain image constructed from 152 normal subjects at the Montreal Neurological
Institute (MNI), Montreal, QC, Canada] by using affine registration (FLIRT) [26], 6 degrees of
freedom (DOF) between the EPI and the T1 structural scan and 12 DOF from this to the MNI
standard.
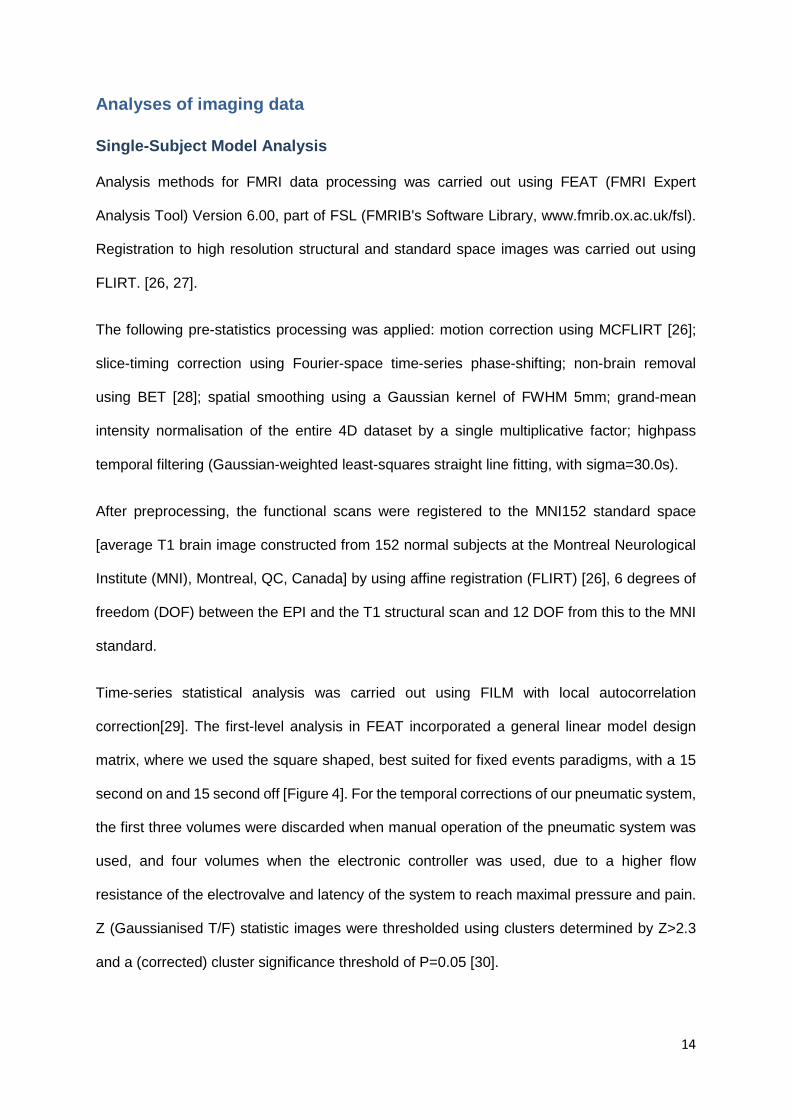
Time-series statistical analysis was carried out using FILM with local autocorrelation
correction[29]. The first-level analysis in FEAT incorporated a general linear model design
matrix, where we used the square shaped, best suited for fixed events paradigms, with a 15
second on and 15 second off [Figure 4]. For the temporal corrections of our pneumatic system,
the first three volumes were discarded when manual operation of the pneumatic system was
used, and four volumes when the electronic controller was used, due to a higher flow
resistance of the electrovalve and latency of the system to reach maximal pressure and pain.
Z (Gaussianised T/F) statistic images were thresholded using clusters determined by Z>2.3
and a (corrected) cluster significance threshold of P=0.05 [30].
14
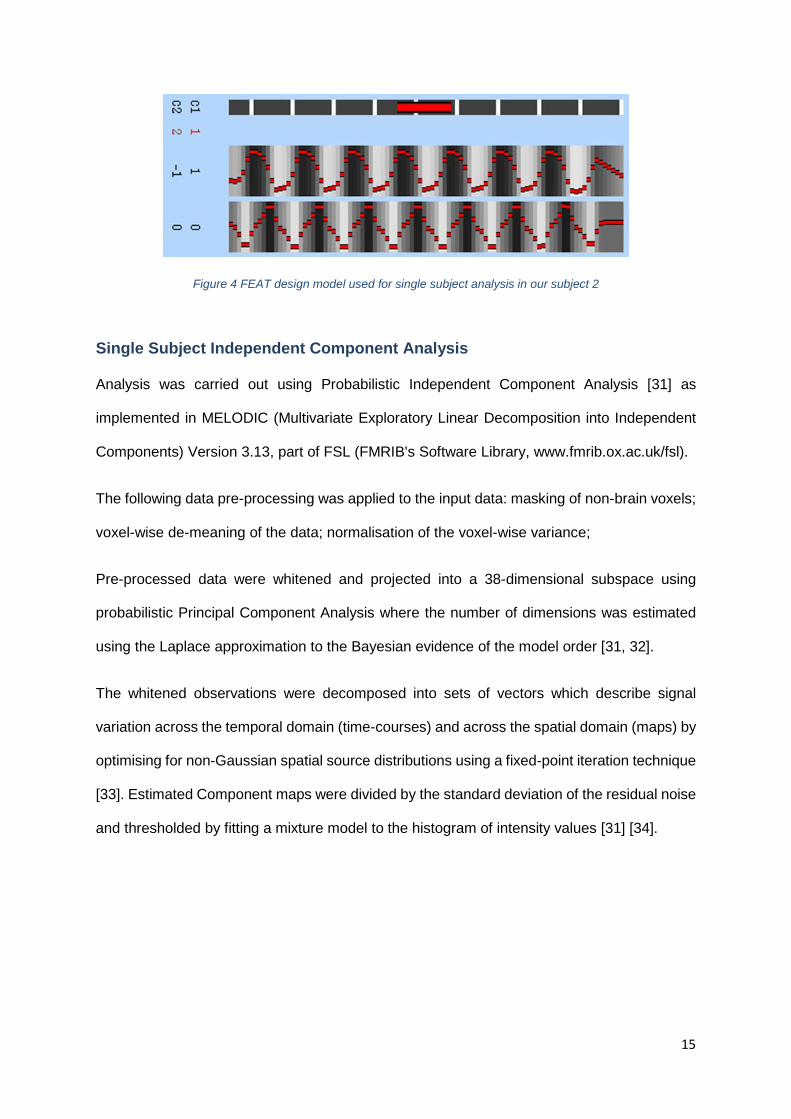
Figure 4 FEAT design model used for single subject analysis in our subject 2
Single Subject Independent Component Analysis
Analysis was carried out using Probabilistic Independent Component Analysis [31] as
implemented in MELODIC (Multivariate Exploratory Linear Decomposition into Independent
Components) Version 3.13, part of FSL (FMRIB's Software Library, www.fmrib.ox.ac.uk/fsl).
The following data pre-processing was applied to the input data: masking of non-brain voxels;
voxel-wise de-meaning of the data; normalisation of the voxel-wise variance;
Pre-processed data were whitened and projected into a 38-dimensional subspace using
probabilistic Principal Component Analysis where the number of dimensions was estimated
using the Laplace approximation to the Bayesian evidence of the model order [31, 32].
The whitened observations were decomposed into sets of vectors which describe signal
variation across the temporal domain (time-courses) and across the spatial domain (maps) by
optimising for non-Gaussian spatial source distributions using a fixed-point iteration technique
[33]. Estimated Component maps were divided by the standard deviation of the residual noise
and thresholded by fitting a mixture model to the histogram of intensity values [31] [34].
15
Group-level analysis
Cluster-wise statistical analysis was extended to a second (group) level in a mixed effects
analysis using FLAME, integrated in FEAT (FMRI Expert Analysis Tool) Version 6.00, part of
FSL (FMRIB's Software Library, www.fmrib.ox.ac.uk/fsl). Z (Gaussianised T/F) statistic
images were thresholded using clusters determined by Z > 1.5 and a (corrected) cluster
significance threshold of P < 0.05 (Worsley et al, 1992). Registration to high resolution and
standard images was performed using FLIRT.
16
RESULTS
Pain Ratings
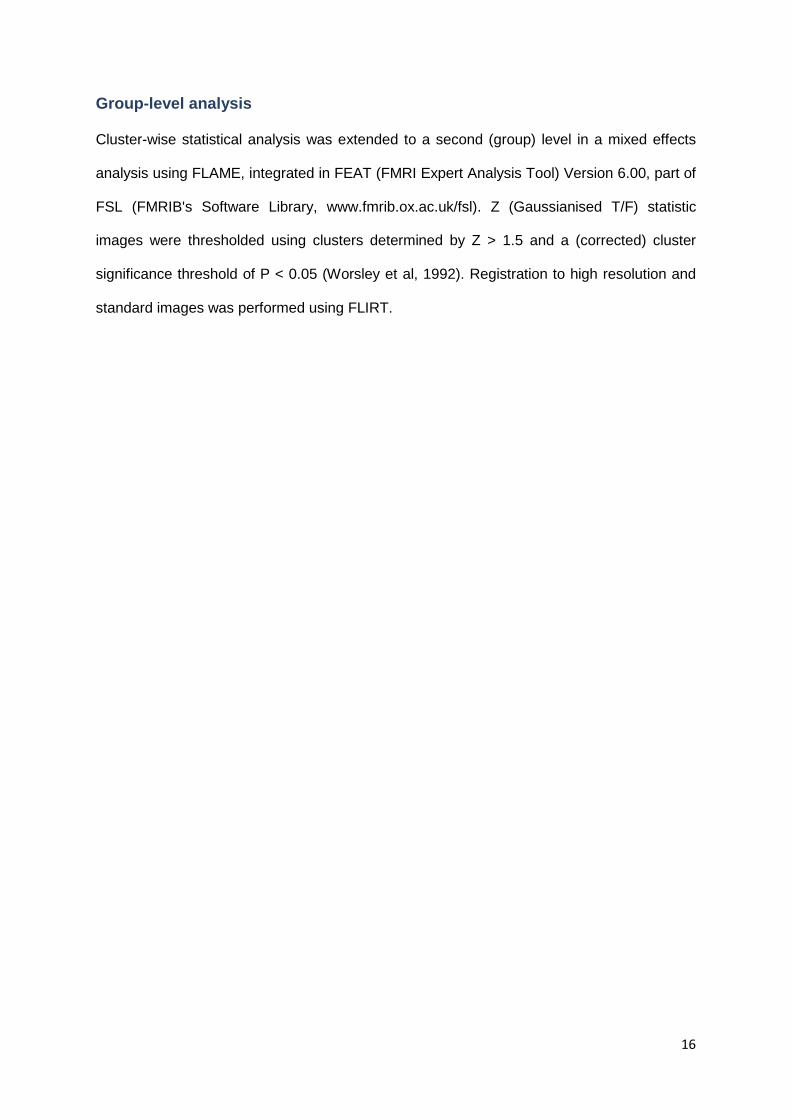
The different pain ratings for both inflation and deflation, throughout the session, are shown in
Figure 5. As expected, the inflation elicits a much higher pain rating than deflation. The mean
inflation pain rating was 7.11 (standard deviation of 0.19) and the mean deflation pain rating
was 1.22 (standard deviation of 0.19)
This is necessary for the block design paradigm of imaging analysis, enabling us to compare
the BOLD responses between the two different states and levels of pain. A baseline pressure
sensation without too much pain is desired, so we can eliminate the bold response to pressure
during our image analysis. As the session progresses, there is some minor residual pain noted
during the deflation period (3rd pain rating: mean 7.33 and standard deviation of 0.577).
Figure 5 - Mean pain intensity ratings using NAS for both inflation (blue) and deflation (red), throughout the
session. Error bars show mean ± standard deviation
Neuroimaging Data
Both single and group level analysis [Figure 7, Table 1] revealed consistent activations with
the pain matrix (for model base single-level analysis see supplementary section 1 and for
example of independent component analysis see supplementary section 2). The group level
analysis revealed significant activation in the anterior insular cortex (Right: x, y, z= 42, -14, 0
;Z=2.11; p<0,05 //Left: x, y, z=-36, 16, -6 Z=2.24 p<0,05; x, y, and z coordinates in Montreal
0123456789
10
1st Pain Rating 2nd Pain Rating 3rd Pain Rating
17
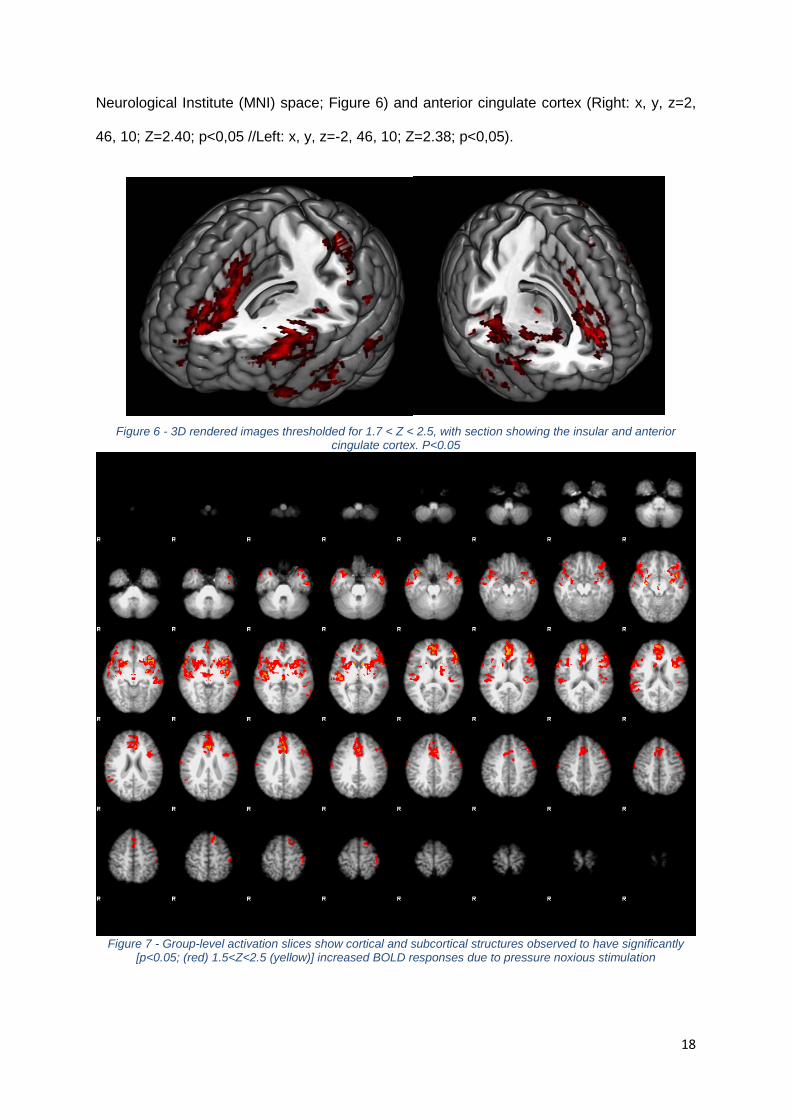
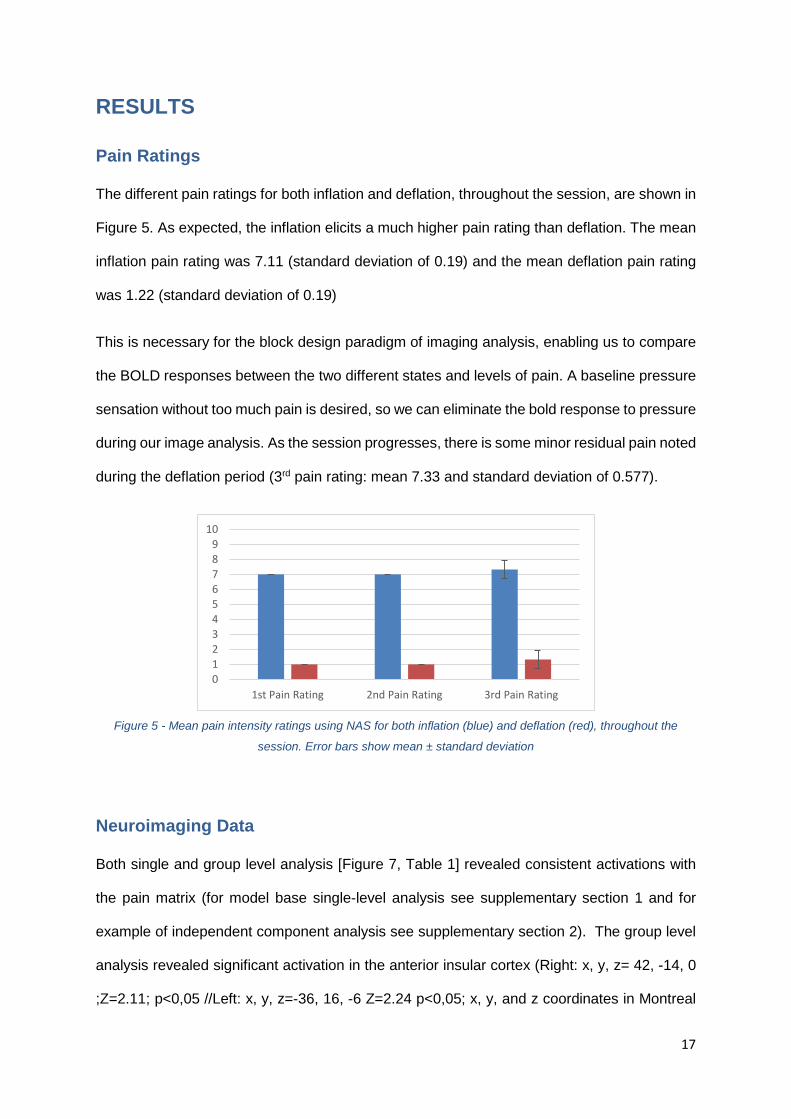
Neurological Institute (MNI) space; Figure 6) and anterior cingulate cortex (Right: x, y, z=2,
46, 10; Z=2.40; p<0,05 //Left: x, y, z=-2, 46, 10; Z=2.38; p<0,05).
Figure 6 - 3D rendered images thresholded for 1.7 < Z < 2.5, with section showing the insular and anterior
cingulate cortex. P<0.05
Figure 7 - Group-level activation slices show cortical and subcortical structures observed to have significantly
[p<0.05; (red) 1.5<Z<2.5 (yellow)] increased BOLD responses due to pressure noxious stimulation
18
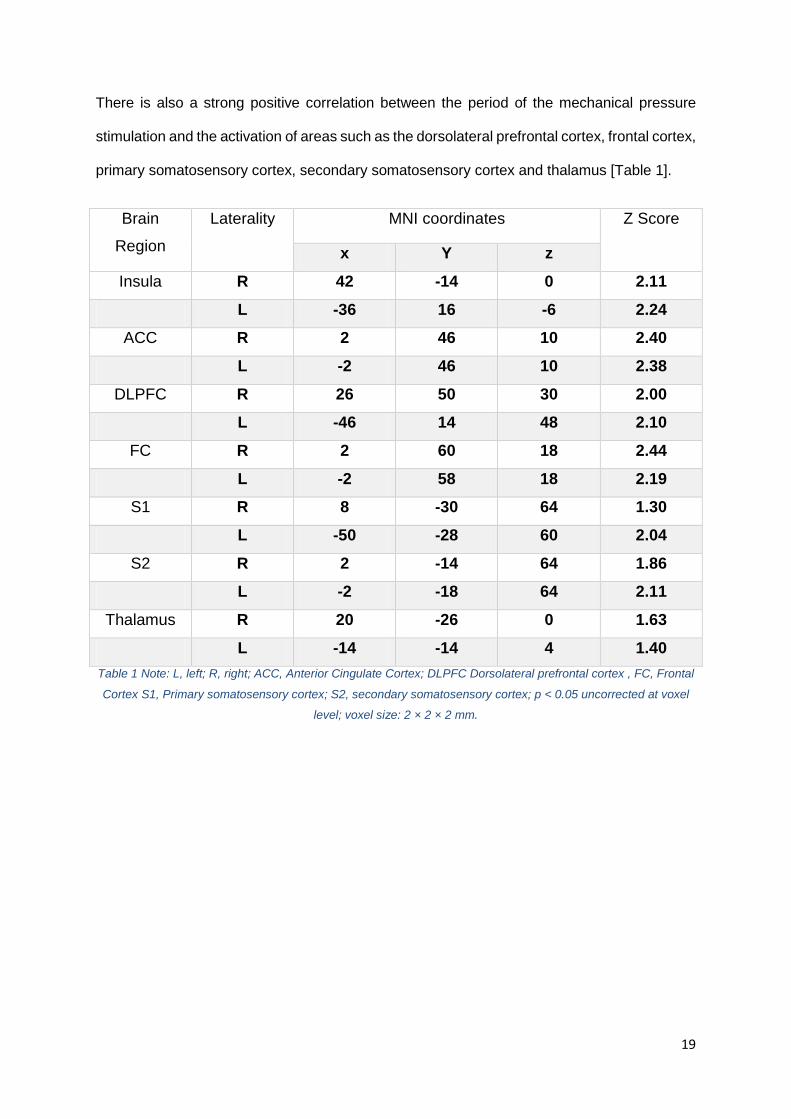
There is also a strong positive correlation between the period of the mechanical pressure
stimulation and the activation of areas such as the dorsolateral prefrontal cortex, frontal cortex,
primary somatosensory cortex, secondary somatosensory cortex and thalamus [Table 1].
Brain
Region Laterality MNI coordinates Z Score
x Y z Insula R 42 -14 0 2.11
L -36 16 -6 2.24 ACC R 2 46 10 2.40
L -2 46 10 2.38 DLPFC R 26 50 30 2.00
L -46 14 48 2.10 FC R 2 60 18 2.44
L -2 58 18 2.19 S1 R 8 -30 64 1.30
L -50 -28 60 2.04 S2 R 2 -14 64 1.86
L -2 -18 64 2.11 Thalamus R 20 -26 0 1.63
L -14 -14 4 1.40 Table 1 Note: L, left; R, right; ACC, Anterior Cingulate Cortex; DLPFC Dorsolateral prefrontal cortex , FC, Frontal
Cortex S1, Primary somatosensory cortex; S2, secondary somatosensory cortex; p < 0.05 uncorrected at voxel
level; voxel size: 2 × 2 × 2 mm.
19
DISCUSSION and CONCLUSION
Our analysis revealed a bilateral activation in the medial brain regions such as anterior parts
of insula, anterior cingulate cortex and dorsolateral prefrontal cortex. These areas were shown
to have increased activity during pain stimulation in previous studies of pain [35]. The most
consistent activations during pain are usually seen in the insular cortex [8], so our activations
are in line with the expected results. There was also a bilateral activation in the lateral pain
areas of the brain, as the primary somatosensory, secondary somatosensory and thalamus.
On the other hand, we didn’t have a high level activation in the posterior insula, which was
described in previous pain studies [3]. Although the thalamus didn’t show a very high
threshold for activation, we included it in the evaluation to account for all the areas mentioned
in the article we used as a reference for the pain matrix [9].
The differences in lateralization of nociceptive processing were previously shown to be
significant greater in the S1 and thalamus for the contralateral hemisphere, and no differences
were show for S2 [36]. Although our results show slightly higher levels of activation for this
contralateral structures (Left 2.04 vs Right 1.03 for the S1 and Left 1.63 vs Right 1.40 for the
thalamus), our small size sample doesn’t allow us to make statistical inferences using the
General Linear Model.
One of our main concerns was if the stimulation of muscle, bone, vascular and nervous
structures as a mean to elicit pain would convey the same activations as the traditional
methods used for this kind of research. The closest method to ours that we found described
in the literature, was of a pressure probe (diameter, 10mm) manually pressed down
perpendicularly to the skin surface over the right calf (gastrocnemius muscle) from the medial
side. This study revealed no brain region specifically activated by nociceptive muscle stimuli.
[37]. They found activation in anterior midcingulate cortex, anterior and posterior insular
cortex, lentiform nucleus, thalamus, pre-supplementary motor area, dorsolateral prefrontal
20
cortex and inferior parietal lobule, which was reasonably similar to ours. On the other hand,
they did not found activation of the secondary somatosensory cortex (S2) and postulated that
this area would only be responsive to cutaneous pain, not muscle pain, because S2 was
specifically activated by nociceptive cutaneous stimuli in their study. In our study, this was not
the case, and higher S2 activation was found, in comparison to the S1. This may mean that
the use of a cuff also causes stimulation of the skin noxious receptors, something that we
didn’t consider beforehand.
We also found a higher frontal cortex activation than expected. From the images pattern we
are inclined to assume that this higher activation is due to attention phenomenons during the
pain stimulation. The volunteers reported downward counting from 15 during the pain periods
so they could be aware of how much longer the pain would persist. In the resting state they
would simply relax, and this would account for the differences. In upcoming studies we will
account for this variation, making the volunteers also count in the resting periods.
Regarding the pain ratings, we found a slight raise of the basal and stimulation pain ratings
towards the end of the experiment, with the 3rd pain rating having a mean of 7.33 (standard
deviation of 0.577), instead of the expected 7 out of 10. Once again, due to the small sample
we can’t make statistically significant conclusions, and further evaluation and validation of the
consistency of pain ratings using our pain method will be needed, so in higher sized sample
we can account for the pain rating fluctuation introducing different explanatory variable in the
design of the image analysis.
As the image analysis accounts for the temporal distribution of the pressure in noxious and
non-noxious level, the general linear model integrated in FEAT reveals that when we have a
7/10 pain rating, we activate the pain areas shown before, in contrast with the 1/10 pain rating.
In comparison to the single level analysis, the group analysis revealed a much lower threshold
of activation. This is due to the sophisticated methods used in FEAT for modelling and
estimating the random-effects component of the measured inter-session mixed-effects
21
variance, during the high-level analysis, which uses Markov chain Monte Carlo sampling to
get an accurate estimation of the true random-effects variance and degrees of freedom at
each voxel, and requires at least 12 subjects, in accordance to the software developers, in
order to obtain very reliable and solid data. Having this in mind, although our data seems
promising, more volunteers will have to be used if we want to have robust statistical evidence.
This study was meant as a pilot trial, to assess if with the available financial and logistic
resources a pain fMRI study could be done in our Hospital. Although the bureaucracy involved
in starting a project was very dissuading and even a barrier in many aspects, the doctors with
whom I have worked made possible to overcome many of those obstacles.
If further studies corroborate the analysed data in this study, the approximate cost of 400 euros
to fully develop this system, makes this a very appealing alternative to the commonly used
thermodes compatible with the fMRI that cost between 50-100 thousand euros, in research
facilities that don’t have the means to acquire it, but are interested in this field of research.
In conclusion, the developed pneumatic setup compatible with the MRI, which applied
pressure in the pain range to the volunteers, was able to elicit BOLD responses that are
compatible with the previous literature regarding the pain matrix activation. Although the
sample size was very small, this preliminary results points us in an optimistic direction,
showing that further studies could be done using this equipment and paradigm.
22
ACKNOWLEDGEMENTS
The author would like to thank the following people:
Dr. Pedro Amorim, who got me interested in research and anaesthetics, who conceptualized
this project, who made everything to overcome all the difficulties that came up along the way,
and without whom this work would have never started in the first place;
Dr. Luis Botelho, whose expertise, ideias and hardwork made literally all the pieces come
together;
Dr. João Xavier, who supported this ideas from the beginning, even though back there they
didn’t seem very feasible and who gave extraordinary logistics support and ideas;
Professor Irene Tracey and her team, who received me, shared their ideas and took time to
teach and advise me.
Dr. Germano Cardoso, who gave valuable insight into pain research and helped shaping the
study.
Eng. Paulo Gomes Costa, who donated and assembled all the materials used for the
eletrovalve microcontroller and helped with the computed coding.
Dr. Francisca Costa, who supported me in every step of the way, gave uncountable advices
and thorough readings and volunteered for the study.
Rui Elias, who gave a lot of technical support and helped in the acquisition and development
of many components used in this study.
Bernardo Bordalo, who was involved in the physics reasoning and who helped in the
conceptualization of the device that was developed.
Dr. Luís Silva, who volunteered and participated in this study
Ana Oliveira, who read this document carefully and made valuable corrections.
My parents, who supported the internship in the FMRIB Centre, University of Oxford.
23
BIBLIOGRAPHY
1. R., D., Treatise of man. Cambridge, MA: Harvard University Press;, 1972.
2. Bingel, U. and I. Tracey, Imaging CNS modulation of pain in humans. Physiology (Bethesda),
2008. 23: p. 371-80.
3. Tracey, I. and P.W. Mantyh, The cerebral signature for pain perception and its modulation.
Neuron, 2007. 55(3): p. 377-91.
4. Peyron, R., B. Laurent, and L. Garcia-Larrea, Functional imaging of brain responses to pain. A
review and meta-analysis (2000). Neurophysiol Clin, 2000. 30(5): p. 263-88.
5. Hjermstad, M.J., et al., Studies comparing Numerical Rating Scales, Verbal Rating Scales, and
Visual Analogue Scales for assessment of pain intensity in adults: a systematic literature
review. J Pain Symptom Manage, 2011. 41(6): p. 1073-93.
6. Upadhyay, J., et al., Imaging drugs with and without clinical analgesic efficacy.
Neuropsychopharmacology, 2011. 36(13): p. 2659-73.
7. Tracey, I., Imaging pain. Br J Anaesth, 2008. 101(1): p. 32-9.
8. Lee, M.C. and I. Tracey, Unravelling the mystery of pain, suffering, and relief with brain
imaging. Curr Pain Headache Rep, 2010. 14(2): p. 124-31.
9. Breivik, H., et al., Survey of chronic pain in Europe: prevalence, impact on daily life, and
treatment. Eur J Pain, 2006. 10(4): p. 287-333.
10. Gureje, O., et al., Persistent pain and well-being: a World Health Organization Study in Primary
Care. JAMA, 1998. 280(2): p. 147-51.
11. Stewart, W.F., et al., Lost productive time and cost due to common pain conditions in the US
workforce. JAMA, 2003. 290(18): p. 2443-54.
12. Schweinhardt, P., C. Bountra, and I. Tracey, Pharmacological FMRI in the development of new
analgesic compounds. NMR Biomed, 2006. 19(6): p. 702-11.
24
13. Hadjipavlou, G., et al., Determining anatomical connectivities between cortical and brainstem
pain processing regions in humans: a diffusion tensor imaging study in healthy controls. Pain,
2006. 123(1-2): p. 169-78.
14. Stroman, P.W., et al., The current state-of-the-art of spinal cord imaging: Methods.
Neuroimage, 2013.
15. Naruse, S., [Functional MRI of the brain]. Rinsho Shinkeigaku, 1995. 35(12): p. 1345-50.
16. Tracey, I., Nociceptive processing in the human brain. Curr Opin Neurobiol, 2005. 15(4): p. 478-
87.
17. Brooks, J.C. and I. Tracey, The insula: a multidimensional integration site for pain. Pain, 2007.
128(1-2): p. 1-2.
18. Brooks, J.C., et al., Somatotopic organisation of the human insula to painful heat studied with
high resolution functional imaging. Neuroimage, 2005. 27(1): p. 201-9.
19. Tracey, I. and E. Johns, The pain matrix: reloaded or reborn as we image tonic pain using
arterial spin labelling. Pain, 2010. 148(3): p. 359-60.
20. Mayhew, S.D., et al., Intrinsic variability in the human response to pain is assembled from
multiple, dynamic brain processes. Neuroimage, 2013. 75C: p. 68-78.
21. Knudsen, L., et al., Review of neuroimaging studies related to pain modulation. Scandinavian
Journal of Pain, 2011. 2(3): p. 108-120.
22. Becerra, L.R., et al., Human brain activation under controlled thermal stimulation and
habituation to noxious heat: an fMRI study. Magn Reson Med, 1999. 41(5): p. 1044-57.
23. Iannetti, G.D., et al., Simultaneous recording of laser-evoked brain potentials and continuous,
high-field functional magnetic resonance imaging in humans. Neuroimage, 2005. 28(3): p.
708-19.
24. Kobayashi, Y., et al., Augmented cerebral activation by lumbar mechanical stimulus in chronic
low back pain patients: an FMRI study. Spine (Phila Pa 1976), 2009. 34(22): p. 2431-6.
25
25. Maeda, L., et al., Human brain activity associated with painful mechanical stimulation to
muscle and bone. J Anesth, 2011. 25(4): p. 523-30.
26. Jenkinson, M., et al., Improved optimization for the robust and accurate linear registration and
motion correction of brain images. Neuroimage, 2002. 17(2): p. 825-41.
27. Jenkinson, M. and S. Smith, A global optimisation method for robust affine registration of brain
images. Med Image Anal, 2001. 5(2): p. 143-56.
28. Smith, S.M., Fast robust automated brain extraction. Hum Brain Mapp, 2002. 17(3): p. 143-55.
29. Woolrich, M.W., et al., Temporal autocorrelation in univariate linear modeling of FMRI data.
Neuroimage, 2001. 14(6): p. 1370-86.
30. Worsley, K.J., Statistical analysis of activation images. Ch 14, in Functional MRI: An
Introduction to Methods, Oxford University Press, 2001.
31. Beckmann, C.F. and S.M. Smith, Probabilistic independent component analysis for functional
magnetic resonance imaging. IEEE Trans Med Imaging, 2004. 23(2): p. 137-52.
32. Minka, T., Automatic choice of dimensionality for PCA. Technical Report 514, MIT Media Lab
Vision and Modeling Group, 2000.
33. Hyvarinen, A., Fast and robust fixed-point algorithms for independent component analysis.
IEEE Trans Neural Netw, 1999. 10(3): p. 626-34.
34. Everson, R. and S. Roberts, Inferring the eigenvalues of covariance matrices from limited, noisy
data. Trans. Sig. Proc., 2000. 48(7): p. 2083-2091.
35. Apkarian, A.V., et al., Human brain mechanisms of pain perception and regulation in health
and disease. Eur J Pain, 2005. 9(4): p. 463-84.
36. Youell, P.D., et al., Lateralisation of nociceptive processing in the human brain: a functional
magnetic resonance imaging study. Neuroimage, 2004. 23(3): p. 1068-77.
37. Uematsu, H., et al., Brain imaging of mechanically induced muscle versus cutaneous pain.
Neurosci Res, 2011. 70(1): p. 78-84.
26

SUPPLEMENTARY MATERIALS
27
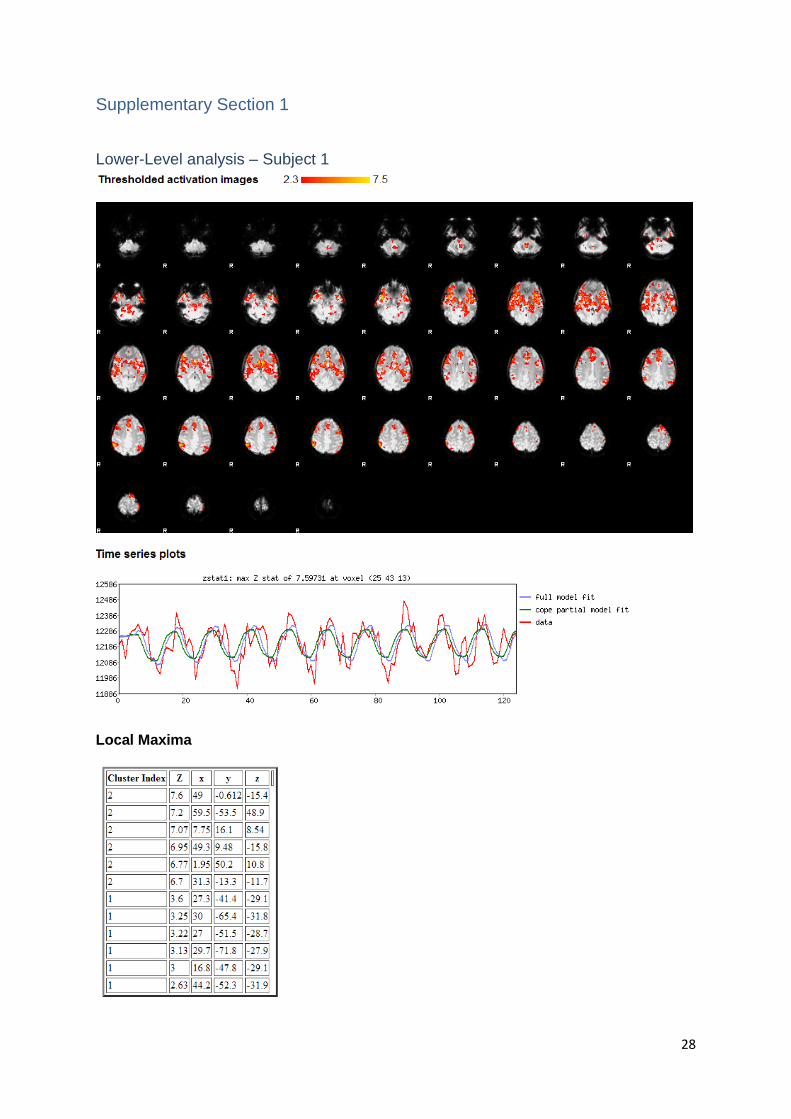
Supplementary Section 1
Lower-Level analysis – Subject 1
Local Maxima
28
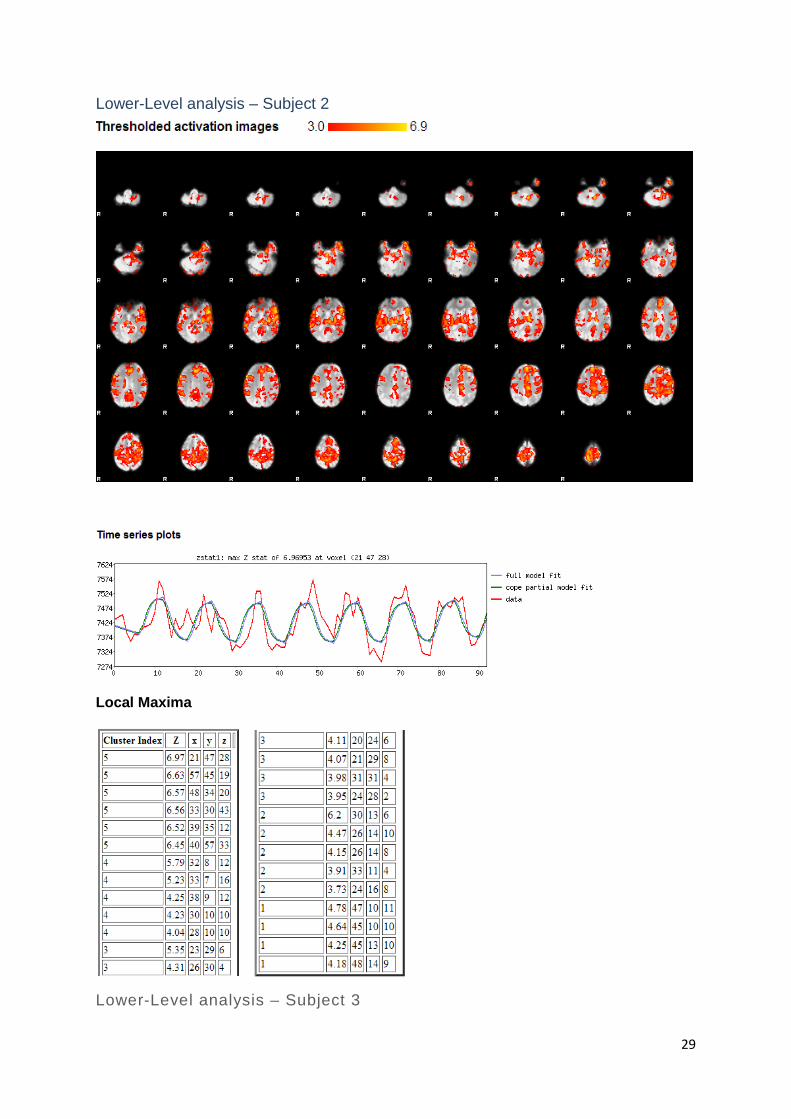
Lower-Level analysis – Subject 2
Local Maxima
Lower-Level analysis – Subject 3
29
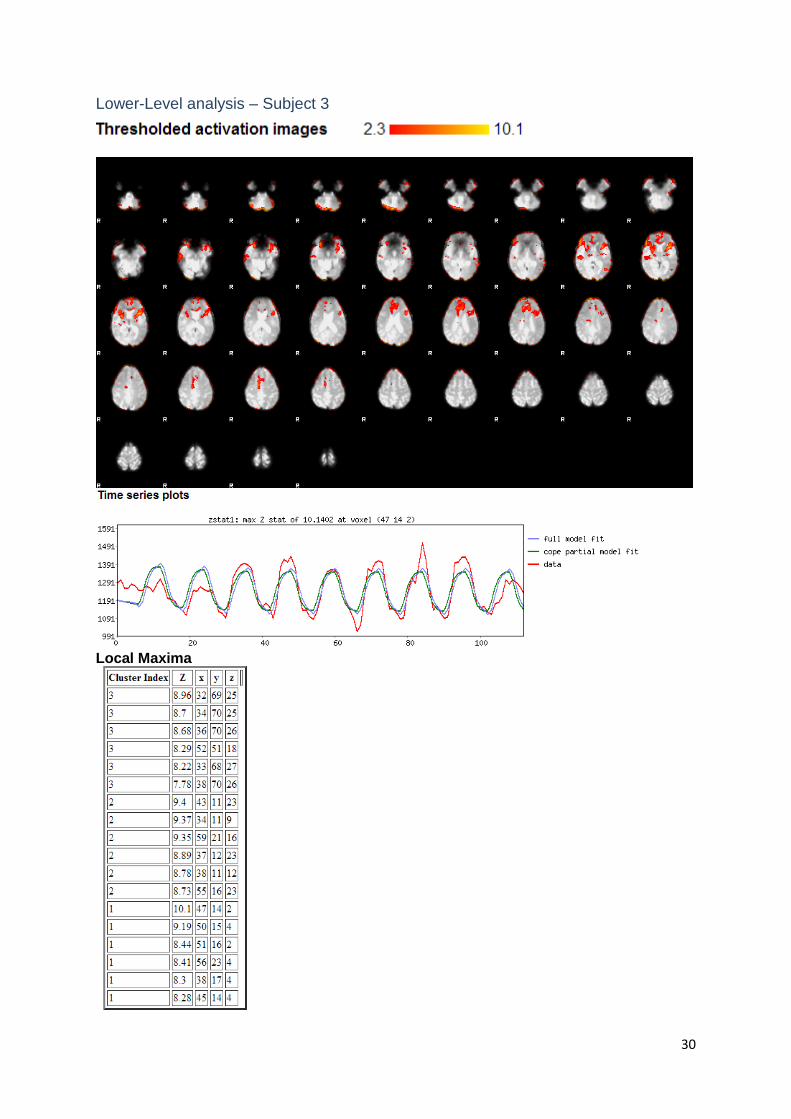
Lower-Level analysis – Subject 3
Local Maxima
30
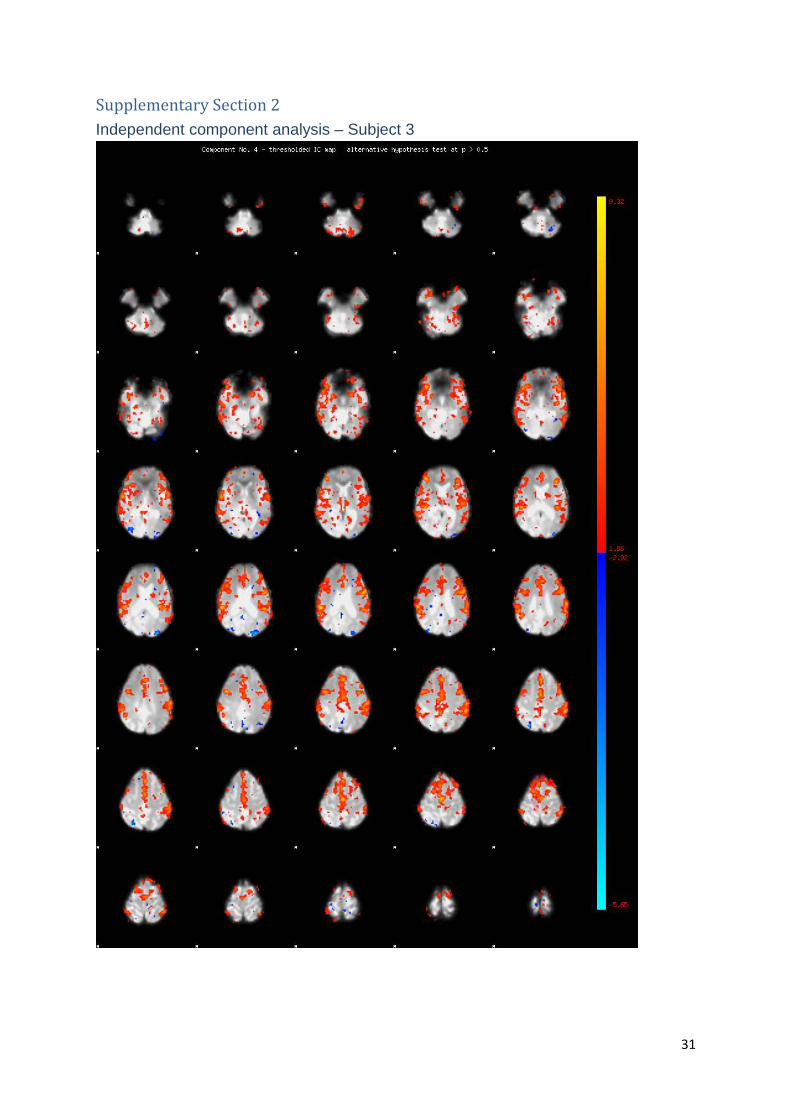
Supplementary Section 2 Independent component analysis – Subject 3
31
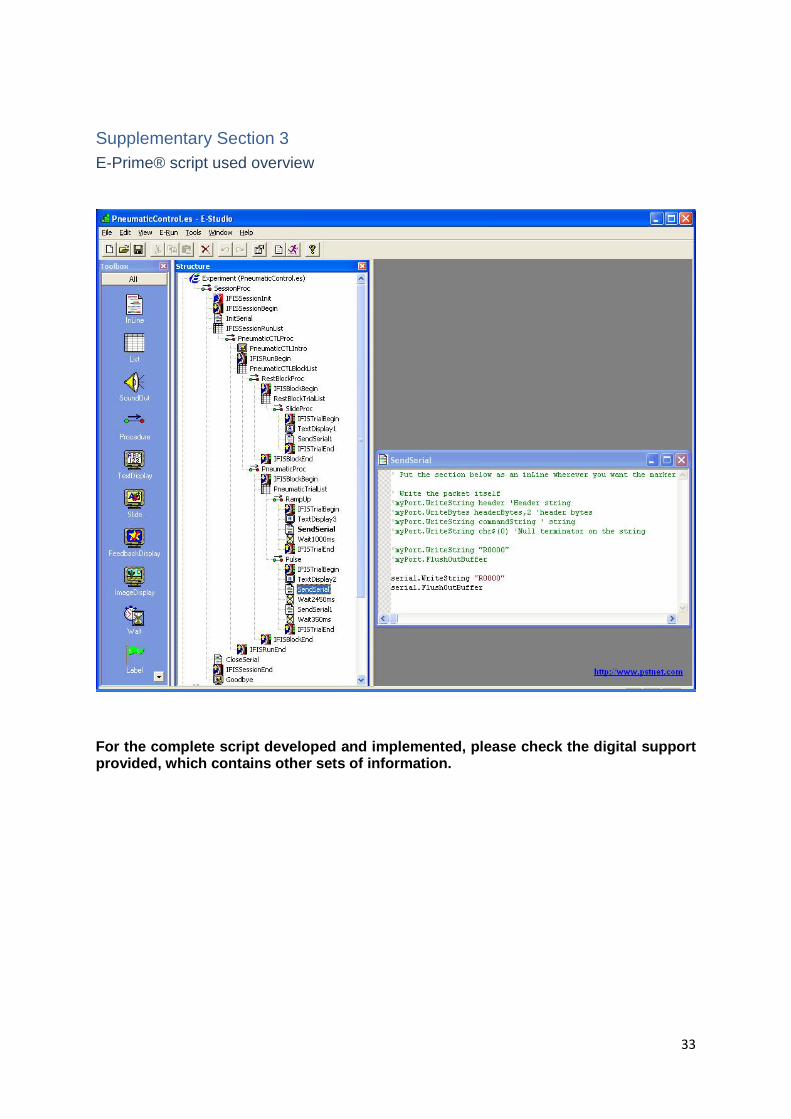
Supplementary Section 3 E-Prime® script used overview
For the complete script developed and implemented, please check the digital support provided, which contains other sets of information.
33