Embed Size (px)
Citation preview

FM:Interact: Advanced Report Builder
Document Release Date: 2/15/2016
Edition: 1

1 FM:Interact: Advanced Report Builder
Legal Notices Copyright Notices © Copyright 1994-2014 FM:Systems, Inc. All rights reserved. Confidential computer software. Valid license from FM:Systems required for possession, use or copying. Warranty The only warranties for FM:Systems products and services are set forth in the express warranty statements accompanying such products and services. Nothing herein should be construed as constituting an additional warranty. FM: Systems shall not be liable for technical or editorial errors or omissions contained herein. The information contained herein is subject to change without notice. Trademark Notices
FM:Systems® is a registered trademark of FM:Systems, Inc.
FM:Interact® is a registered trademark of FM:Systems, Inc.
FM:CAD® is a registered trademark of FM:Systems, Inc.
FM:Mobile™ is a trademark of FM:Systems, Inc.
AutoCAD® and Revit® Architectural Suite are registered trademarks of Autodesk, Inc.
LEED® is a registered trademark of the U.S. Green Building Council.
Green Globes™ is a trademark of ECD Energy and Environment Canada.
iPad® ,iPhone®, and Safari® are registered trademarks of Apple, Inc.
Firefox® is a registered trademark of Mozilla.
Blackberry® is a registered trademark of Research In Motion.
Adobe®, Adobe logo®, Acrobat® and Acrobat Logo® are trademarks of Adobe Systems Incorporated.
Microsoft®,Windows®,Windows NT®,Windows® XP,Windows Mobile® and Windows Vista are U.S. registered trademarks of Microsoft Corporation.
Oracle® is a registered trademark of Oracle Corporation and/or its affiliates.
All other brand names, product names or trademarks belong to their respective holders. Published By: FM:Systems 2301 Sugar Bush Rd. Suite 500 Raleigh, NC 27612, USA
2 FM:Interact: Advanced Report Builder
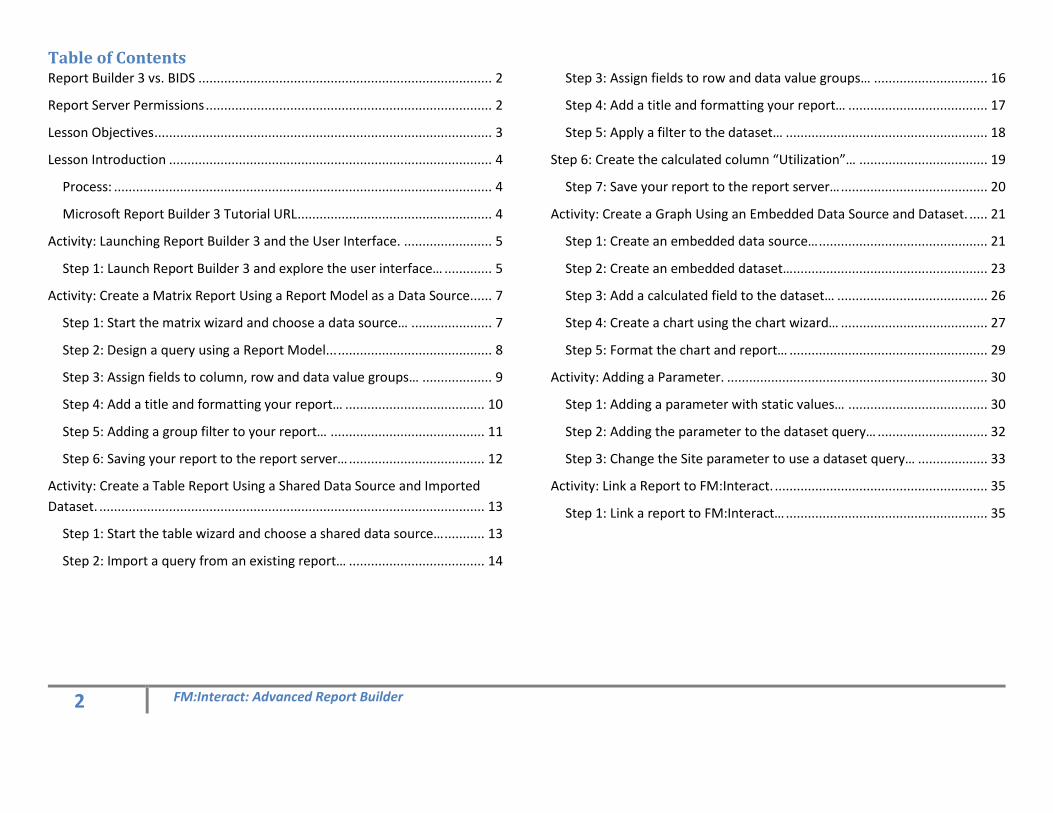
Table of Contents Report Builder 3 vs. BIDS ................................................................................ 2
Report Server Permissions .............................................................................. 2
Lesson Objectives ............................................................................................ 3
Lesson Introduction ........................................................................................ 4
Process: ....................................................................................................... 4
Microsoft Report Builder 3 Tutorial URL ..................................................... 4
Activity: Launching Report Builder 3 and the User Interface. ........................ 5
Step 1: Launch Report Builder 3 and explore the user interface… ............. 5
Activity: Create a Matrix Report Using a Report Model as a Data Source. ..... 7
Step 1: Start the matrix wizard and choose a data source… ...................... 7
Step 2: Design a query using a Report Model... .......................................... 8
Step 3: Assign fields to column, row and data value groups… ................... 9
Step 4: Add a title and formatting your report… ...................................... 10
Step 5: Adding a group filter to your report… .......................................... 11
Step 6: Saving your report to the report server… ..................................... 12
Activity: Create a Table Report Using a Shared Data Source and Imported
Dataset. ......................................................................................................... 13
Step 1: Start the table wizard and choose a shared data source… ........... 13
Step 2: Import a query from an existing report… ..................................... 14
Step 3: Assign fields to row and data value groups… ............................... 16
Step 4: Add a title and formatting your report… ...................................... 17
Step 5: Apply a filter to the dataset… ....................................................... 18
Step 6: Create the calculated column “Utilization”… ................................... 19
Step 7: Save your report to the report server… ........................................ 20
Activity: Create a Graph Using an Embedded Data Source and Dataset. ..... 21
Step 1: Create an embedded data source… .............................................. 21
Step 2: Create an embedded dataset… ..................................................... 23
Step 3: Add a calculated field to the dataset… ......................................... 26
Step 4: Create a chart using the chart wizard… ........................................ 27
Step 5: Format the chart and report… ...................................................... 29
Activity: Adding a Parameter. ....................................................................... 30
Step 1: Adding a parameter with static values… ...................................... 30
Step 2: Adding the parameter to the dataset query… .............................. 32
Step 3: Change the Site parameter to use a dataset query… ................... 33
Activity: Link a Report to FM:Interact. .......................................................... 35
Step 1: Link a report to FM:Interact… ....................................................... 35

2 FM:Interact: Advanced Report Builder
Report Builder 3 vs. BIDS The choice to use Report Builder 3, SQL Server Business Intelligence Development Studio (BIDS) or Visual Studio mostly depends on what version of SQL
Server Reporting Services (SSRS) you will be using.
SSRS 2005 through 2012 all support writing reports in BIDS. Note however that starting with version 2010 the BIDS tool was incorporated into the main
Visual Studio application and is no longer a separate installation. With SQL 2012 the tool is now called SSDT (SQL Server Data Tools). BIDS, Visual Studio
2010, and SSDT are all effectively just different versions of the same thing just with different names.
Report Builder 3 is supported starting with SSRS 2008 R2 and is not supported in SSRS 2005 or 2008. You cannot open or save a report on an SSRS 2008 or
earlier server from Report Builder 3.
Other considerations for Report Builder 3 vs. BIDS include:
You cannot edit or update Report Models with Report Builder 3. You must use BIDS for creating or updating Report Models. However Report Models
are no longer officially supported and can no longer be modified starting with SSRS 2012.
Report Builder 3 allows all the same functionality for writing reports as BIDS/Visual Studio/SSDT.
Report Builder 3 is a smaller program with only the report writing features of BIDS. This makes it easier to use for people who only need to write
reports.
Report Builder 3 is available either as a “One-Click” application from an SSRS 2008 R2 or higher server, or as a self-contained, no-cost download from the
Microsoft website.
This activity guide assumes the use of Report Builder 3, however all of these activities can be completed in BIDS/Visual Studio/SSDT. The steps are identical
however the appearance of the screenshots, dialogue boxes, menus, wizards, etc. will be different.
Report Server Permissions Before being able to create reports on an SSRS server, the user must know the URL to the SSRS server and be granted the appropriate permissions. Contact
your IT department or DBA for this information as it will vary from one organization to the next.

3 FM:Interact: Advanced Report Builder
Lesson Objectives Upon completing this lesson, you will be able to:
Launch and navigate the Report Builder 3 interface.
Use a Report Model as a Data Source
Use a shared Data Source
Create a Data Source embedded in your report
Create a Dataset from a Report Model Data Source
Import a Dataset from an existing report
Create a Dataset using the query designer
Create a matrix report using the table and matrix wizard
Create a table report using the table and matrix wizard
Create a graphical report
Create a calculated field in a report
Create a calculated field in a dataset
Format graphs, tables and values in reports
Create a filter on a report group
Create a filter on a dataset
Create a report parameter with static values
Create a report parameter from a dataset (query)
Save a report to the SSRS server
Define a report link from FM:Interact 8.x in order to display the report in the FM:Interact application.

4 FM:Interact: Advanced Report Builder
Lesson Introduction In the following activities you will be
creating 3 different reports using various
techniques that will demonstrate the
lesson objectives.
This lesson is intended as an overview of
the capabilities of the Report Builder 3
tool. These activities do not cover the
entire breadth of the capabilities and
settings available for reports.
There is a tremendous amount of
information available via the web
regarding creating SSRS reports. For
example, Microsoft offers free Report
Builder 3 tutorials via their website.
Students are encouraged to use the
information presented here as a starting
point and to continue their knowledge
and skill development in report writing to
gain the most out of the tools available to
them and the data contained in the
FM:Interact database.
Process: Stage Description
1 Launch Report Builder 3 from the SSRS server.
2 Select what type of report you wish to create.
3 Define the data source for the report.
4 Define the dataset for the report.
5 Define the grouping for the report data.
6 Define any needed filters or report parameters.
7 Format text boxes, graph elements, values, etc.
8 Add a title, images or other desired report elements.
9 Save the report to the SSRS server.
10 Link to the report in FM:Interact and set appropriate permissions so the report can be viewed from the FM:Interact application.
Microsoft Report Builder 3 Tutorial URL http://technet.microsoft.com/en-us/library/dd239338(v=sql.105).aspx

5 FM:Interact: Advanced Report Builder
Activity: Launching Report
Builder 3 and the User
Interface.
Step 1: Launch Report Builder 3
and explore the user interface… 1. Launch Report Builder 3 by
double clicking on the “Report
Builder 3” icon on the desktop.
Result: The Report Builder 3
application is run from the SSRS
server. This may take 1 – 2
minutes if the report services
have to start in the background.
2. Review the “Getting Started”
dialogue box and the different
“wizards” that can be launched
to aid you.
3. Select “Blank Report” to close
the “Getting Started” dialogue
without running a wizard.

6 FM:Interact: Advanced Report Builder
4. Explore the elements of the
Report Builder 3 interface. Key
elements of the interface
include:
The Menu and quick save
buttons at the top of the
window.
Home, Insert and View ribbons.
The Report Data pane.
The design pane.
The Group pane.
The connection and zoom bar at
the bottom of the window.
5. In the “View” ribbon, turn on and
review the “Properties” pane.
6. Turn off the “Properties” pane,
we will not be using it in these
exercises.
7. When done, select “Exit Report
Builder” from the main menu.
What’s next: Create a matrix report using
a Report Model as a data source…

7 FM:Interact: Advanced Report Builder
Activity: Create a Matrix Report
Using a Report Model as a Data
Source.
Step 1: Start the matrix wizard
and choose a data source… 1. Launch Report Builder 3.
2. From the “Getting Started”
dialogue box select: “Table or
Matrix Wizard”.
3. From the “Choose a dataset”
dialogue box select “Create a
dataset” and click “Next”.
4. In the “Choose a connection to a
data source” dialogue box click
“Browse…” to select an existing
Report Model as a data source.
5. In the “Select Data Source”
dialogue box navigate to the
“Models” folder and open the
Report Model “Space and
Occupancy”.
6. In the “Choose a connection to a
data source” dialogue box click
“Next”.

8 FM:Interact: Advanced Report Builder
Step 2: Design a query using a
Report Model... 1. In the “Design a query” dialogue
box choose the following fields
for your report by selecting the
entity in the “Entities:” pane, then
dragging the desired field from
the “Fields:” pane to the box on
the right.
Entities and Fields to choose:
Entity Field Building Site Code
Rooms # Area
Space Types Space Type
2. Click the red “!” to test the query.
Note that due to the way this
Report Model is built, in the
results window you will see two
fields are returned for Space
Type: “Space Type” and “Space
Type1”.
3. Click “Next”

9 FM:Interact: Advanced Report Builder
Step 3: Assign fields to column,
row and data value groups… 1. In the “Arrange Fields” dialogue
box drag and drop the field
“Site_Code” to the “Row Groups”
list.
2. Drag and drop the field
“Space_Type1” to the “Column
Groups” list.
3. Drag and drop the field “Area” to
the ”Values” list. Note that it
becomes “Sum(Area)”.
4. Click “Next”.
5. In the “Choose the layout”
dialogue box, leave “Show
subtotals and grand totals”
checked and click “Next”.
6. In the “Choose a style” dialogue
box, choose a style for the report
and click “Finish > >”.

10 FM:Interact: Advanced Report Builder
Step 4: Add a title and formatting
your report… 1. In report design pane, click to add
title. Title your report “Area by
Site and Space Type”.
2. Highlight the four “[Sum(Area)]”
fields.
3. On the Home ribbon – Number
pane, change the category from
“Default” to “Number”.
4. Click the “Placeholder styles”
button ( ) and choose “Sample
Values”.
5. Run the report by clicking the
“Run” button on the Home
ribbon.
6. After reviewing your report, on
the Run ribbon click “Design” to
go back to the report designer.

11 FM:Interact: Advanced Report Builder
Step 5: Adding a group filter to
your report… 1. In the “Column Groups” pane,
right-click on the Space_Type1
group and select “Group
Properties…”.
2. Select “Filters”.
3. Click “Add”.
4. From the “Expression” dropdown
choose “[Space_Type1]”.
5. From the “Operator” dropdown
choose “Like”.
6. In the “Value” text box type:
P–*
7. Click “OK”.
8. Run the report again and observe
the change. Only Space Types
that begin with “P-“ are included
in the report.
9. After reviewing your report, on
the Report ribbon click “Design”
to go back to the report designer.

12 FM:Interact: Advanced Report Builder
Step 6: Saving your report to the
report server… 1. Click on the Main menu and click
“Save”.
2. Navigate to the folder:
“FMI8 Reports\Space Management Reports”
3. Save the report as:
“2.90 Area by Space Type”
4. Exit Report Builder 3.

13 FM:Interact: Advanced Report Builder
Activity: Create a Table Report
Using a Shared Data Source and
Imported Dataset.
Step 1: Start the table wizard and
choose a shared data source… 1. Launch Report Builder 3.
2. From the “Getting Started”
dialogue box select: “Table or
Matrix Wizard”.
3. From the “Choose a dataset”
dialogue box select “Create a
dataset” and click “Next”.
4. In the “Choose a connection to a
data source” dialogue box click
“Browse…” to select a shared
data source.
5. In the “Select Data Source”
dialogue box navigate to the
“Data Sources” folder and open
the shared data source “Fmi8”.
6. In the “Choose a connection to a
data source” dialogue box click
“Next”.
7. In the “Enter Data Source
Credentials” dialogue box, enter
the username “sa” and password
“Sales@Work” and click “OK”.

14 FM:Interact: Advanced Report Builder
Step 2: Import a query from an
existing report… 1. In the “Design a query”
dialogue box click “Import…”.
2. In the “Import Query” dialogue
box browse to the folder:
“FMI8 Reports/Space Mgmt Reports”
Open the report:
“2.01 Space Analysis by Building”
3. In the “Import Query” dialogue
box on the “Datasets:” pane
select the dataset “FMI8”.
4. Click “Import”.

15 FM:Interact: Advanced Report Builder
5. In the “Design a query”
dialogue box, edit the query to
remove the WHERE clause:
Scroll to the bottom of the
query.
Delete starting with the word
“WHERE…” to the end of the
query.
6. Click the red “!” to test the
query.
7. Click “Next”.

16 FM:Interact: Advanced Report Builder
Step 3: Assign fields to row and
data value groups… 1. In the “Arrange Fields” dialogue
box drag and drop the fields
“SITEDESC” and “BLDGDESC” to
the “Row Groups” list.
2. Drag and drop the fields “OCC”
and “CAPACITY” to the ”Values”
list. Note that the “Sum” formula
is applied to these fields.
3. Click “Next”.
4. In the “Choose the layout”
dialogue box, leave the default
selections checked and click
“Next”.
5. In the “Choose a style” dialogue
box, choose a style for the report
and click “Finish > >”.

17 FM:Interact: Advanced Report Builder
Step 4: Add a title and formatting
your report… 1. In report design pane, click to add
title. Title your report
“Occupancy by Site and
Building”.
2. Select each column header and
change the name to something
more readable. Ex. Change
“SITEDESC” to “Site”.
3. Run the report by clicking the
“Run” button on the Home
ribbon.
4. Expand the “Chicago” site by
clicking the ‘+’ symbol to display
the buildings.
5. After reviewing your report, on
the Run ribbon click “Design” to
go back to the report designer.

18 FM:Interact: Advanced Report Builder
Step 5: Apply a filter to the
dataset… 1. In the “Report Data” pane,
expand the “Datasets” folder.
2. Right-click on “DataSet1” and
choose “Dataset Properties”.
3. On the “Dataset Properties”
dialogue box choose “Filters”.
4. Click “Add”.
5. From the “Expression”
dropdown choose “Capacity”.
6. From the “Operator”
dropdown choose “>”.
7. In the “Value” text box type:
“0” (zero).
8. Click “OK”.
9. Rerun the report and observe
the difference in the results.
For example the building
“Research North” no longer
appears in the Chicago site.
10. After reviewing your report,
on the Run ribbon click
“Design” to go back to the
report designer.

19 FM:Interact: Advanced Report Builder
Step 6: Create the calculated
column “Utilization”… 1. In the report, right-click on the
“Capacity” column and under
“Tablix” choose “Insert
Column -> Right”.
Result: an empty column is
added in the table to the right
of the “Capacity” column.
2. Enter the text “Utilization” in
the column header.
3. Click on the first blank cell
under the “Utilization” header
to highlight it.
4. Right-click on the highlighted
cell and choose
“Expression…”.
5. In the “Set expression for:
Value” text box enter:
=Sum(Fields!OCC.Value) /
Sum(Fields!CAPACITY.Value)
6. Click “OK”.
7. Repeat adding the same
expression for the remaining
two cells.

20 FM:Interact: Advanced Report Builder
8. Similar to the previous activity,
format the Utilization values to
be a percentage.
9. Run the report and review the
changes you’ve made.
Step 7: Save your report to the
report server… 1. Click on the Main menu and click
“Save”.
2. Navigate to the folder:
“FMI8 Reports\Space Management Reports”
3. Save the report as:
“2.91 Occupancy by Site and
Building
4. Exit Report Builder 3.
21 FM:Interact: Advanced Report Builder
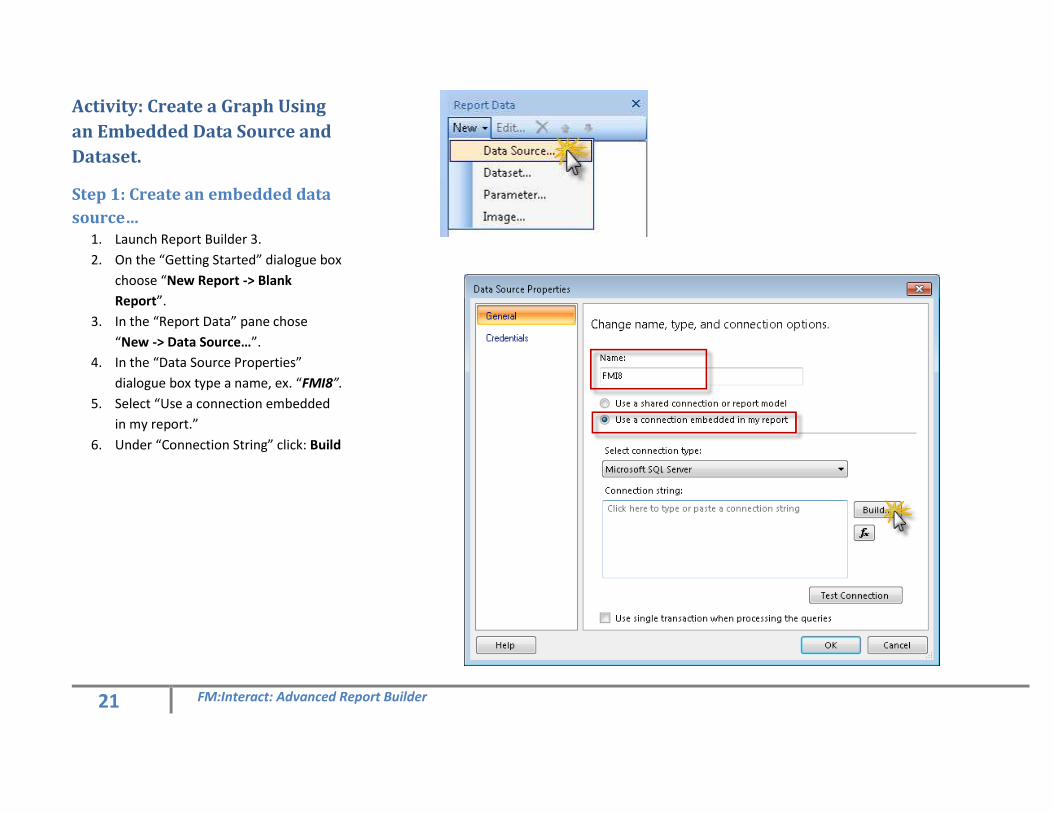
Activity: Create a Graph Using
an Embedded Data Source and
Dataset.
Step 1: Create an embedded data
source… 1. Launch Report Builder 3.
2. On the “Getting Started” dialogue box
choose “New Report -> Blank
Report”.
3. In the “Report Data” pane chose
“New -> Data Source…”.
4. In the “Data Source Properties”
dialogue box type a name, ex. “FMI8”.
5. Select “Use a connection embedded
in my report.”
6. Under “Connection String” click: Build

22 FM:Interact: Advanced Report Builder
7. In the “Connection Properties”
dialogue box enter:
Server name: localhost Select “Use SQL Server Authentication”. User name: sa Password: Sales@Work Select “Save my password”. Select “Select or Enter a database name:” Select the database FMI8.
8. Verify connection by clicking “Test
Connection”
9. Click “OK”.
10. In the “Data Source Properties”
dialogue box, click “OK”.

23 FM:Interact: Advanced Report Builder
Step 2: Create an embedded
dataset… 1. In the “Report Data” pane chose
“New -> Dataset…”.
2. In the “Dataset Properties” dialogue
box, enter the dataset name. ex.
“Moves”.
3. Select “Use a dataset embedded in
my report.”
4. Under “Data Source” choose FMI8
5. Click “Query Designer”
6. In the “Query Designer” dialogue box,
in the “Database View” pane, expand
the “Views” folder and select the
following three fields
a. LS.SITEDESC (Site Name)
b. MH.MOVEID (Move ID)
c. MH.SCHEDMOVE (Scheduled
move date)
Note the MH view holds the completed
(posted) move tickets.

24 FM:Interact: Advanced Report Builder
7. Expand the “Relationships” pane and
click “Auto Detect” to unselect it.
8. Click the icon to add a
relationship… Add the following
relationships:
Left Table Join Type Right Table
MH Inner A0
A0 Inner B0
B0 Inner LS
9. Double click under “Join Fields” for
each relationship. In the “Edit
Relationship Fields” dialogue box click
the icon to add fields… Add the
following fields:
Relationship Left Right
MH / A0 TORMID = BLDGCODE
A0 / B0 BLDGCODE = BLDGCODE
B0 / LS SITECODE = SITECODE
10. Click OK after adding each set of
fields.
11. Click OK to close the “Query
Designer” dialogue box.

25 FM:Interact: Advanced Report Builder
Note: The Query Designer only allows you to
select single fields and does not allow you to
create the concatenated field relationship
that exists between views MH and A0.
Therefore the relationship between MH and
A0 must be edited manually.
12. In the “Dataset Properties” dialogue
box, edit the Query:
Change the line: ON MH.TORMID = A0.BLDGCODE
To read: ON MH.TORMID = A0.BLDGCODE+A0.RMID
Note the table name “A0” is the letter
‘A’ and the number ‘0’ (zero), not a
capital ‘o’.
13. Click OK in the “Dataset Properties”
dialogue box and note that the
dataset now shows in the “Report
Data” pane.

26 FM:Interact: Advanced Report Builder
Step 3: Add a calculated field to
the dataset… 1. In the “Report Data” pane, right-click
on the dataset and select “Add
calculated field…”
2. In the “Dataset Properties” dialogue
box enter a “Field Name” of Quarter
and click the button to open the
“Expression” editor dialogue box.
3. In the “Set expression for: Value” text
box enter:
=DatePart ("q" , Fields!SCHEDMOVE.Value )
4. Click OK to close the “Expression”
editor.
5. Click OK to close the “Dataset
Properties” dialogue box.
6. Note the field “Quarter” has been
added to the list of dataset fields in
the “Report Data” pane.

27 FM:Interact: Advanced Report Builder
Step 4: Create a chart using the
chart wizard… 1. From the Insert ribbon select
“Chart -> Chart Wizard…”
2. In the “Choose a dataset”
dialogue box, select “Choose an
existing dataset in this report…”.
3. Select the “Moves” dataset.
4. Click “Next”.
5. In the “Choose a chart type”
dialogue box, select “Column”.
6. Leave “Use a stacked chart…” and
“Use a 100 percent stacked
chart…” unchecked.
7. Click “Next”.

28 FM:Interact: Advanced Report Builder
8. In the “Arrange chart fields”
dialogue box drag and drop the
field “SITEDESC” to the
“Categories” group list.
9. Drag the “Quarter” field to the
“Series” group list.
10. Drag the field “MOVEID” to the
“Values” list.
11. Click on the “MOVEID” field in the
Values list and select “Count”.
Note the “Values” list now shows
“Count(MOVEID)”.
12. Click “Next”.
13. In the “Choose a style” dialogue
box, choose a style for the report
and click “Finish > >”.

29 FM:Interact: Advanced Report Builder
Step 5: Format the chart and
report… 1. Select and delete the “Click to add
title” text box.
2. Right-click on the chart title and
select “Title properties…”.
3. In the “Chart title properties”
dialogue box, set the title of the
chart, ex. “Moves by Site and
Quarter”.
4. Click “OK”.
5. Right-click on the legend and
select “Show legend title”.
6. Right-click on the legend, select
“Legend title properties…”.
7. Set the legend title to “Quarter”.
8. Click “OK”.
9. Click on and set the titles for the
Category and Value Axis
10. Click “Run” to review the report.
11. Return to the design view and
resize the report as needed.
12. Save the report as:
FMI8 Reports/Move Reports/4.90 Moves by
Site and Quarter

30 FM:Interact: Advanced Report Builder
Activity: Adding a Parameter.
Step 1: Adding a parameter with
static values… This activity continues from the previous
activity with the “Moves by Site and
Quarter” graphic report.
1. In the “Report Data” pane select
“New -> Parameter…”.
2. In the “Report Parameter
Properties” dialogue box, select
“General”.
3. Set the “Name:” and “Prompt:” to
“Site”.
4. Check the box for “Allow multiple
values”.

31 FM:Interact: Advanced Report Builder
5. Click “Available Values”.
6. Select “Specify values”.
7. Click “Add” twice and specify the
following values:
Label Value Chicago CHI
New York NY
8. Click “Default Values”.
9. Select “Specify values”.
10. Click “Add”.
11. Enter the value: “CHI”.
12. Click “OK”.

32 FM:Interact: Advanced Report Builder
Step 2: Adding the parameter to
the dataset query… 1. Right-click the “Moves”
dataset and select “Dataset
Properties…”
2. In the “Dataset Properties”
dialogue box, edit the query
by adding the following line to
the end of the current query:
WHERE LS.SITECODE IN (@Site)
3. Click “Refresh Fields”.
4. Click “Parameters”.
5. In the “Parameter Value” box,
select “[@Site]”.
6. Click “OK”.
7. Run the report and review the
“Site” parameter and it’s
effects.
8. Return to the report design
mode.

33 FM:Interact: Advanced Report Builder
Step 3: Change the Site parameter
to use a dataset query… 1. In the “Report Data” pane,
select “New -> Dataset…”.
2. Set the dataset name to
“Sites”.
3. Select “Use dataset
embedded in my report”.
4. Select the “FMI8” data
source.
5. Click “Query Designer…”.
6. In the “Query Designer”
dialogue box, from the “LS”
view, select the fields
“SITECODE” and “SITEDESC”.
7. Click “OK” in the “Query
Designer” dialogue box.
8. Click “OK” in the “Dataset
Properties” dialogue box.
Result: A “Sites” dataset is
added in the “Report Data”
pane.

34 FM:Interact: Advanced Report Builder
9. Right-click on the “Site”
parameter and select
“Parameter properties…”.
10. Select “Available Values”.
11. Select “Get values from a
query”.
12. Set the following values:
Dataset: “Sites” Value field: “SITECODE” Label field: “SITEDESC” 13. Select “Default Values”.
14. Select “Get values from
query”.
15. Set the following values:
Dataset: “Sites” Value field: “SITECODE” 16. Click “OK”.
17. Run the report and review the
changes to the “Site”
parameter.
18. Save the report.
19. Exit Report Builder 3

35 FM:Interact: Advanced Report Builder
Activity: Link a Report to
FM:Interact.
Step 1: Link a report to
FM:Interact… 1. Start FM:Interact
2. Login as:
Username: Administrator
Password: fms
3. Navigate to: “Space Management ->
Reports -> Report Management”
4. Click “Add Report”.
5. Select one of the reports you’ve
created from the “Report” dropdown.
6. Specify the “Report Code” and
“Report Display Name” based on the
report you’ve chosen.
7. Click “Save & Permission”.
8. Select “Administrators” and
“Everyone” from the role list and click
“OK”.
9. Click “Sign Out”.
10. Login as Administrator.
11. Navigate to: “Space Management ->
Reports”
12. Click on your report to display it in
FM:Interact.