Embed Size (px)
Citation preview

T F
QUARTERLY REPORTJune 30, 2017
FMI Large Cap FundInvestor Class (FMIHX)
Institutional Class (FMIQX)
FMI Common Stock FundInvestor Class (FMIMX)
Institutional Class (FMIUX)
FMI International FundInvestor Class (FMIJX)
Institutional Class (FMIYX)
FMI Funds, Inc. Advised by Fiduciary Management, Inc. www.fmifunds.com

FMI Large Cap Fund
Shareholder Letter . . . . . . . . . . . . . . . . . . . . . . . . . . . . . . . . . . . . . . . . . . . . . . . . . . . . . . . 1
Statement of Net Assets . . . . . . . . . . . . . . . . . . . . . . . . . . . . . . . . . . . . . . . . . . . . . . . . . . 7
FMI Common Stock Fund
Shareholder Letter . . . . . . . . . . . . . . . . . . . . . . . . . . . . . . . . . . . . . . . . . . . . . . . . . . . . . . . 10
Statement of Net Assets . . . . . . . . . . . . . . . . . . . . . . . . . . . . . . . . . . . . . . . . . . . . . . . . . . 16
FMI International Fund
Shareholder Letter . . . . . . . . . . . . . . . . . . . . . . . . . . . . . . . . . . . . . . . . . . . . . . . . . . . . . . . 19
Statement of Net Assets . . . . . . . . . . . . . . . . . . . . . . . . . . . . . . . . . . . . . . . . . . . . . . . . . . 26
Schedule of Forward Currency Contracts . . . . . . . . . . . . . . . . . . . . . . . . . . . . . . . . . . . . . 29
Performance and Disclosure Information . . . . . . . . . . . . . . . . . . . . . . . . . . . . . . . . . . . . . . . . . 30
FMI Funds, Inc.TABLE OF CONTENTS
T F

FMILarge CapFund
June 30, 2017
Dear Fellow Shareholders:
The FMI Large Cap Fund gained 2.88%1 in the June quarter compared to 3.09% forthe Standard & Poor’s 500 Index. Consumer Non-Durables, Finance and Health Serviceswere all positive contributors, from a sector standpoint. Nestlé, Progressive and United-Health Group were individual stocks in these respective sectors that performed well. Onthe flipside, Consumer Services, Industrial Services, Health Technology and above-av-erage cash all detracted from performance. Twenty-First Century Fox, Schlumberger,and our zero exposure to the Health Technology sector hurt relative performance.
Final data is not yet available for the June quarter, but March quarter corporate salesgrowth improved to roughly 5-7% (depending on firm size) from flat to down in 2016.Estimates for second quarter revenue growth appear to be in the 4.5% range, accordingto FactSet. This is an encouraging improvement over the flattish revenue growth corpo-rations experienced in 2016. Last year corporate sales growth lagged nominal GDPgrowth (+2.95%); thus far in 2017 it looks to be the opposite. Nominal GDP growth es-timates for 2017 have been reduced in recent months due to some developing weaknessesthat are articulated below. Over time, nominal GDP growth and U.S. corporate salesshould be highly correlated.
It has been widely reported in the financial and popular press that earnings grew ap-proximately “14%” in the first quarter. One should always be wary when the subject isearnings. In recent years, it has been common to read about double-digit earnings growth,but unless margins have expanded significantly, earnings growth should be about the sameas sales growth. Margins are actually down modestly from their peak, so that hasn’tdriven the earnings improvement. The earnings results reported by Bloomberg, CNBCand brokers are what we affectionately call B.S. or “Wall Street” earnings. These earningshave been “adjusted” to exclude the-all-too-familiar “one-time” items, a.k.a. unpleasantthings, amortization of intangible assets, and in some cases, other elements like stockcompensation. It turns out that over 400 of the S&P 500 companies now use “adjusted”earnings. The widely-respected economist David Rosenberg had this to say about firstquarter 2017 earnings: “But the unscrubbed data for all companies, big and small, listedand unlisted, in strict dollar terms and importantly, seasonally adjusted, actually shrank7.3% in the first quarter (at an annualized rate) and the year-to-year trend decelerated to3.7% from 9.3%.” Bloomberg recently cited FactSet numbers showing how wide
_____________1 Performance for both the FMI Large Cap Fund Investor Class (FMIHX) and the FMI Large Cap Fund Institutional Class (FMIQX) was 2.88% for the second quarter of 2017.
— 1 —
T F

the gap betweenWall Street earningsand GAAP (gener-ally accepted ac-counting principles)earnings has become(see nearby chart).
Because of thewide use of adjustedfigures, it is difficultto determine at what rate earnings are actually growing, but over time, it is logical to as-sume that the rate should roughly match revenue growth. With higher corporate revenuegrowth being reported, we hope true earnings also move into the mid-single-digit growthrate range.
Margins, as mentioned, have come down from their peak but remain quite high froma historical perspective. The significant improvement in margins over the past eight yearsis largely due tolower interest ex-pense and the effectsof higher leveragebeing deployed oncorporate balancesheets, rather thanan organic improve-ment in efficiency.Interest rates andleverage may haverun their respectivecourses as the Fedtightens, and corpo-rations’ ability toadd more debt to already stretched balance sheets is limited. Share repurchase activityhas moderated, diminishing this source of earnings per share (EPS) growth.
Today we have the proverbial mixed bag of corporate and economic signals. Institute forSupply Management (ISM) numbers continue to be above 50, and core investment in research& development have bounced off the bottom. Corporate revenue growth picked up in the firstquarter (and may be decent in the second quarter) but at the same time, some important eco-nomic indicators are going the other way. These factors get little airtime in a bull market butthey are worth noting. Housing starts dropped 5.5% in May to 1.092 million units at an annualrate, the weakest since September. As David Rosenberg reports, “This was the third straightdecline—a whopping plunge of 48% annualized over this stretch…” Multi-family housingstarts dropped 9.7%—the fifth monthly drop in a row. The long up cycle in autos appears tohave rolled over, with new car sales falling in four of the last five months. Oil prices have col-lapsed. Durable goods orders slipped 0.2% in May. The 10 Year Treasury yield has rolledover. Lending volumes across a variety of consumer and business categories have fallen, as
— 2 —
T F

articulated in last quar-ter’s letter. Wagegrowth and consumerspending remain sub-dued even though theunemployment rate islow at 4.3%. The Eco-nomic Cycle ResearchInstitute (ECRI) indexof weekly leading in-dicators growth ratehas fallen significantlyin 2017, from approx-imately 11% to 4%.
Stock prices, on the other hand, continue to soar. The character of the market hasalso returned to momentum and speculation. Biotechnology investing has become acasino again. [Investors seem to have forgotten the prior collapses in this sector.] Theso-called FAANG stocks (Facebook, Amazon, Apple, Netflix and Google [Alphabet])have been on fire and the market has become narrower, as is customary late in the cycle.Additionally, the growth style has beaten the value style over both short- and long-termtime horizons, seemingly calling into question the widely-held notion that value alwaystrumps growth over the long run, as depicted in the nearby table.
— 3 —
T F

The remarkable duration of this bull market has turned the world upside down formost of us on the value spectrum. We are confident that once we see the flipside of today’sup cycle, value outperformance will be restored. Our industry is trained to look at 3- and5-year performance. What happens when the cycle goes one way (up) for eight, nine orten years? Two things happen:
First, valuations go to extremes; today the data shows we are near all-time highs inmost valuation measures. The roughly fifty valuation measures that Leuthold Grouptracks, which we cite in nearly every letter, reside in the ninth decile and are pushing thetenth. Warren Buffett’s favorite stock market measure of value (total stock market valuedivided by GDP) is also near a record high (see nearby chart). Second, passive strategiesgain share and become momentum strategies. These two elements could get even moreextreme if the passive to active flow turns into a torrent.
The popularity of index funds and exchange-traded funds (ETFs) has a structural as-pect and a chase-the-winner (momentum) aspect. Investors’ desire to have low-cost funds,along with the belief that passive will continuously beat active, have caused a structuralmovement in this direction. We acknowledge that passive will have a larger share of themarket over time. In the investment business, however, it’s always important to rememberthe old quote, “What the wise do in the beginning, fools do in the end.” We have littledoubt that the capitulation taking place today will be wrong. Steve Bregman, from Hori-zon Kinetics, last fall published data showing some interesting characteristics of the ETFand index world that reveal just how risky the passive approach has become. The corre-lation of the largest members of the S&P 500 with the index has about doubled over the
— 4 —
T F

past twenty years. Additionally,many of the largest ETFs haveseen their correlations with theS&P 500 reach very high levels,as depicted in the nearby table(with perfect correlation as 1.0).Even investors who acknowl-edge that the S&P 500 has be-come a crowded trade, and whomove into ETFs to diversify,may find their results movingright with the S&P 500 after all.
Additionally, due to the rapid adoptionof ETF trading, the turnover rates of thelargest ETFs have skyrocketed. The twomost popular, The SPDR S&P 500 ETFand the iShares Russell 2000 Index ETF,have turnover rates that exceed 3500% (anaverage holding period of about a week).As Bregman points out, “That is dozens oftimes greater than the trading liquidity ofeven its most liquid constituents. [...] Whenthe music stops, is there enough underlyingliquidity?” With robots (algorithms) incharge, we could see some very unusualETF behavior when volatility arrives.
It is fascinating to look at the last peak in the market, which was October 9, 2007.The Leuthold Group thought it would be interesting to investigate how investors wouldhave done had they been “unlucky” enough to enter the market at the absolute peak. Theythen decomposed the returns into the following table:
— 5 —
T F

Putting aside the incredibly low growth rate in sales and earnings per share (1.6%and 1.1%, respectively)—which may be the subject of another letter—it turns out in-vestors did surprisingly well… 6.8% compounded over 9 ½ years. Note, however, fromwhere these returns have come. Roughly half of the return was “fundamental” (+1.1%earnings growth and +2.3% from the dividend), and half was from multiple expansion.When looking at future returns, it seems highly unlikely that multiples (which are at ex-tremes), or margins (which are high from a historical perspective), will provide a tailwind.The opposite is much more likely, leaving the burden for performance on fundamentalsales and earnings growth. Unless we break into a period of rapid sales growth, the back-drop for fundamentally-driven equity performance in the near term seems limited.
Today is a very trying and testing time for the cautious, the skeptic, the value-orientedand the history lover. Short sellers and hedge funds that are truly hedged have been clos-ing down. Investment committees and the public are increasingly chasing a very crowdedtrade (passive management). A visible long-time stock market skeptic has recently ca-pitulated. It’s a sobering reminder that the market sometimes operates on a time horizonthat is much longer than investors’ patience. While we remain strong believers in equitiesfor the long run, we are trying to be as cautious and prudent as possible in the short run.
Thank you for your support of the FMI Large Cap Fund.
100 E. Wisconsin Ave., Suite 2200 • Milwaukee, WI 53202 • 414-226-4555www.fmifunds.com
— 6 —
T F

Shares Value (b) ______ ________
COMMON STOCKS — 92.3% (a)
COMMERCIAL SERVICES SECTOR — 3.0% Advertising/Marketing Services — 3.0% 2,264,000 Omnicom Group Inc. . . . . . . . . . . . . . . . . . . . . . . . . . . . . . . . . . . . . . . . . $ 187,685,600
COMMUNICATIONS SECTOR — 3.8% Specialty Telecommunications — 3.8% 1,777,150 CenturyLink Inc. . . . . . . . . . . . . . . . . . . . . . . . . . . . . . . . . . . . . . . . . . . . 42,438,342 3,325,000 Level 3 Communications Inc. . . . . . . . . . . . . . . . . . . . . . . . . . . . . . . . . . 197,172,500 _____________ 239,610,842
CONSUMER DURABLES SECTOR — 3.4% Tools & Hardware — 3.4% 1,550,000 Stanley Black & Decker Inc. . . . . . . . . . . . . . . . . . . . . . . . . . . . . . . . . . . . 218,131,500
CONSUMER NON-DURABLES SECTOR — 5.2% Food: Major Diversified — 3.2% 2,340,000 Nestle’ S.A. – SP-ADR . . . . . . . . . . . . . . . . . . . . . . . . . . . . . . . . . . . . . . . 204,048,000 Household/Personal Care — 2.0% 2,360,000 Unilever PLC – SP-ADR . . . . . . . . . . . . . . . . . . . . . . . . . . . . . . . . . . . . . . 127,723,200
CONSUMER SERVICES SECTOR — 12.8% Cable/Satellite TV — 5.1% 8,304,000 Comcast Corp. – Cl A . . . . . . . . . . . . . . . . . . . . . . . . . . . . . . . . . . . . . . . . 323,191,680 Movies/Entertainment — 3.9% 2,762,000 Twenty-First Century Fox Inc. – Cl A . . . . . . . . . . . . . . . . . . . . . . . . . . . . . 78,275,080 6,066,000 Twenty-First Century Fox Inc. – Cl B . . . . . . . . . . . . . . . . . . . . . . . . . . . . . 169,059,420 _____________ 247,334,500 Other Consumer Services — 3.8% 6,811,000 eBay Inc. . . . . . . . . . . . . . . . . . . . . . . . . . . . . . . . . . . . . . . . . . . . . . . . . . 237,840,120
DISTRIBUTION SERVICES SECTOR — 3.9% Medical Distributors — 3.9% 2,627,000 AmerisourceBergen Corp. . . . . . . . . . . . . . . . . . . . . . . . . . . . . . . . . . . . . 248,330,310
ELECTRONIC TECHNOLOGY SECTOR — 3.7% Electronic Components — 3.7% 2,953,000 TE Connectivity Ltd. . . . . . . . . . . . . . . . . . . . . . . . . . . . . . . . . . . . . . . . . . 232,342,040
ENERGY MINERALS SECTOR — 1.2% Oil & Gas Production — 1.2% 2,313,000 Devon Energy Corp. . . . . . . . . . . . . . . . . . . . . . . . . . . . . . . . . . . . . . . . . . 73,946,610
FINANCE SECTOR — 15.5% Financial Conglomerates — 8.7% 1,815,000 Berkshire Hathaway Inc. – Cl B . . . . . . . . . . . . . . . . . . . . . . . . . . . . . . . . . 307,406,550 2,663,000 JPMorgan Chase & Co. . . . . . . . . . . . . . . . . . . . . . . . . . . . . . . . . . . . . . . 243,398,200 _____________ 550,804,750
— 7 —
FMI Large Cap FundSTATEMENT OF NET ASSETSJune 30, 2017 (Unaudited)
T F

Shares Value (b) ______ ________
COMMON STOCKS — 92.3% (a) (Continued)
FINANCE SECTOR — 15.5% (Continued) Major Banks — 3.3% 4,070,000 Bank of New York Mellon Corp. . . . . . . . . . . . . . . . . . . . . . . . . . . . . . . . . $ 207,651,400 Property/Casualty Insurance — 3.5% 5,062,000 Progressive Corp. . . . . . . . . . . . . . . . . . . . . . . . . . . . . . . . . . . . . . . . . . . 223,183,580
HEALTH SERVICES SECTOR — 4.8% Managed Health Care — 4.8% 1,624,000 UnitedHealth Group Inc. . . . . . . . . . . . . . . . . . . . . . . . . . . . . . . . . . . . . . 301,122,080
INDUSTRIAL SERVICES SECTOR — 2.9% Oilfield Services/Equipment — 2.9% 2,742,000 Schlumberger Ltd. . . . . . . . . . . . . . . . . . . . . . . . . . . . . . . . . . . . . . . . . . . 180,533,280
PROCESS INDUSTRIES SECTOR — 2.8% Chemicals: Agricultural — 2.8% 10,672,000 Potash Corp. of Saskatchewan Inc. . . . . . . . . . . . . . . . . . . . . . . . . . . . . . 173,953,600
PRODUCER MANUFACTURING SECTOR — 7.7% Industrial Conglomerates — 4.5% 2,115,000 Honeywell International Inc. . . . . . . . . . . . . . . . . . . . . . . . . . . . . . . . . . . 281,908,350 Trucks/Construction/Farm Machinery — 3.2% 3,068,000 PACCAR Inc. . . . . . . . . . . . . . . . . . . . . . . . . . . . . . . . . . . . . . . . . . . . . . . 202,610,720
RETAIL TRADE SECTOR — 6.3% Apparel/Footwear Retail — 2.4% 2,100,000 The TJX Companies Inc. . . . . . . . . . . . . . . . . . . . . . . . . . . . . . . . . . . . . . 151,557,000 Discount Stores — 3.9% 3,393,000 Dollar General Corp. . . . . . . . . . . . . . . . . . . . . . . . . . . . . . . . . . . . . . . . . 244,601,370
TECHNOLOGY SERVICES SECTOR — 12.0% Information Technology Services — 7.6% 1,991,000 Accenture PLC . . . . . . . . . . . . . . . . . . . . . . . . . . . . . . . . . . . . . . . . . . . . . 246,246,880 3,544,000 Cerner Corp. . . . . . . . . . . . . . . . . . . . . . . . . . . . . . . . . . . . . . . . . . . . . . . 235,569,680 _____________ 481,816,560 Packaged Software — 4.4% 1,930,000 Microsoft Corp. . . . . . . . . . . . . . . . . . . . . . . . . . . . . . . . . . . . . . . . . . . . . 133,034,900 2,925,000 Oracle Corp. . . . . . . . . . . . . . . . . . . . . . . . . . . . . . . . . . . . . . . . . . . . . . . . 146,659,500 _____________ 279,694,400
TRANSPORTATION SECTOR — 3.3% Air Freight/Couriers — 3.3% 3,732,000 Expeditors International of Washington Inc. . . . . . . . . . . . . . . . . . . . . . . 210,783,360 _____________ Total common stocks . . . . . . . . . . . . . . . . . . . . . . . . . . . . . . . . . . . . . . . . 5,830,404,852
— 8 —
FMI Large Cap FundSTATEMENT OF NET ASSETS (Continued)June 30, 2017 (Unaudited)
T F
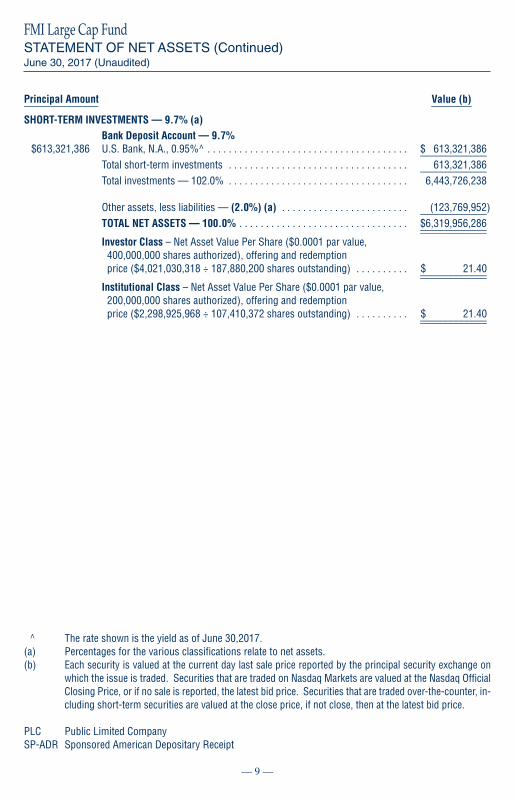
Principal Amount Value (b)______________ ________
SHORT-TERM INVESTMENTS — 9.7% (a) Bank Deposit Account — 9.7% $613,321,386 U.S. Bank, N.A., 0.95%^ . . . . . . . . . . . . . . . . . . . . . . . . . . . . . . . . . . . . . . $ 613,321,386 _____________ Total short-term investments . . . . . . . . . . . . . . . . . . . . . . . . . . . . . . . . . . 613,321,386 _____________ Total investments — 102.0% . . . . . . . . . . . . . . . . . . . . . . . . . . . . . . . . . . 6,443,726,238
Other assets, less liabilities — (2.0%) (a) . . . . . . . . . . . . . . . . . . . . . . . . (123,769,952) _____________ TOTAL NET ASSETS — 100.0% . . . . . . . . . . . . . . . . . . . . . . . . . . . . . . . . $6,319,956,286 _____________ _____________ Investor Class – Net Asset Value Per Share ($0.0001 par value, 400,000,000 shares authorized), offering and redemption price ($4,021,030,318 ÷ 187,880,200 shares outstanding) . . . . . . . . . . $ 21.40 _____________ _____________ Institutional Class – Net Asset Value Per Share ($0.0001 par value, 200,000,000 shares authorized), offering and redemption price ($2,298,925,968 ÷ 107,410,372 shares outstanding) . . . . . . . . . . $ 21.40 _____________ _____________
^ The rate shown is the yield as of June 30,2017.(a) Percentages for the various classifications relate to net assets.(b) Each security is valued at the current day last sale price reported by the principal security exchange on
which the issue is traded. Securities that are traded on Nasdaq Markets are valued at the Nasdaq OfficialClosing Price, or if no sale is reported, the latest bid price. Securities that are traded over-the-counter, in-cluding short-term securities are valued at the close price, if not close, then at the latest bid price.
PLC Public Limited CompanySP-ADR Sponsored American Depositary Receipt
— 9 —
FMI Large Cap FundSTATEMENT OF NET ASSETS (Continued)June 30, 2017 (Unaudited)
T F

— 10 —
T F
FMICommon Stock
FundJune 30, 2017
Dear Fellow Shareholders:
The FMI Common Stock Fund gained 2.22%1 in the June quarter compared to 2.46%for the Russell 2000 Index. Energy, Finance and Consumer Services were all positivecontributors, from a sector standpoint. Our low direct exposure to Energy accounted forthe outperformance of this sector, as energy prices fell dramatically. FirstCash and CableOne were the leading performers in Finance and Consumer Services, respectively. Onthe flipside, Health Technology, Health Services, Technology Services and elevated cashall detracted from performance. Our low exposure to Biotechnology and other HealthTechnology businesses (due to valuation) hurt, while MEDNAX and Allscripts also un-derperformed. Our underweighted position in Technology Services was also a factor onthe downside.
Final data is not yet available for the June quarter, but March quarter corporate salesgrowth improved to roughly 5-7% (depending on firm size) from flat to down in 2016.Estimates for second quarter revenue growth appear to be in the 4.5% range, accordingto FactSet. This is an encouraging improvement over the flattish revenue growth corpo-rations experienced in 2016. Last year corporate sales growth lagged nominal GDPgrowth (+2.95%); thus far in 2017 it looks to be the opposite. Nominal GDP growth es-timates for 2017 have been reduced in recent months due to some developing weaknessesthat are articulated below. Over time, nominal GDP growth and U.S. corporate salesshould be highly correlated.
It has been widely reported in the financial and popular press that earnings grew ap-proximately “14%” in the first quarter. One should always be wary when the subject isearnings. In recent years, it has been common to read about double-digit earnings growth,but unless margins have expanded significantly, earnings growth should be about the sameas sales growth. Margins are actually down modestly from their peak, so that hasn’t driventhe earnings improvement. The earnings results reported by Bloomberg, CNBC and bro-kers are what we affectionately call B.S. or “Wall Street” earnings. These earnings havebeen “adjusted” to exclude the all-too-familiar “one-time” items, a.k.a. unpleasant things,amortization of intangible assets, and in some cases, other elements like stock compensa-tion. It turns out that over 400 of the S&P 500 companies now use “adjusted” earnings.The widely-respected economist David Rosenberg had this to say about first quarter 2017earnings: “But the unscrubbed data for all companies, big and small, listed and unlisted,in strict dollar terms and importantly, seasonally adjusted, actually shrank 7.3% in the firstquarter (at an annualized rate) and the year-to-year trend decelerated to 3.7% from 9.3%.”
_____________1 Performance for the FMI Common Stock Fund Investor Class (FMIMX) for the second quarter of 2017 was2.22%, and for the FMI Common Stock Fund Institutional Class (FMIUX), 2.25%.

Bloomberg recentlycited FactSet num-bers showing howwide the gap betweenWall Street earningsand GAAP (gener-ally accepted ac-counting principles)earnings has become(see nearby chart).
Because of the wide use of adjusted figures, it is difficult to determine at what rateearnings are actually growing, but over time, it is logical to assume that the rate shouldroughly match revenue growth. With higher corporate revenue growth being reported,we hope true earnings also move into the mid-single-digit growth rate range.
Margins, as mentioned, have come down from their peak but remain quite high froma historical perspective. The significant improvement in margins over the past eight yearsis largely due tolower interest ex-pense and the effectsof higher leveragebeing deployed oncorporate balancesheets, rather thanan organic improve-ment in efficiency.Interest rates andleverage may haverun their respectivecourses as the Fedtightens, and corpo-rations’ ability toadd more debt to already stretched balance sheets is limited. Share repurchase activityhas moderated, diminishing this source of earnings per share (EPS) growth.
Today we have the proverbial mixed bag of corporate and economic signals. Institute forSupply Management (ISM) numbers continue to be above 50, and core investment in research& development have bounced off the bottom. Corporate revenue growth picked up in the firstquarter (and may be decent in the second quarter) but at the same time, some important eco-nomic indicators are going the other way. These factors get little airtime in a bull market butthey are worth noting. Housing starts dropped 5.5% in May to 1.092 million units at an annualrate, the weakest since September. As David Rosenberg reports, “This was the third straightdecline—a whopping plunge of 48% annualized over this stretch…” Multi-family housingstarts dropped 9.7%—the fifth monthly drop in a row. The long up cycle in autos appears tohave rolled over, with new car sales falling in four of the last five months. Oil prices have col-lapsed. Durable goods orders slipped 0.2% in May. The 10 Year Treasury yield has rolledover. Lending volumes across a variety of consumer and business categories have fallen, as
— 11 —
T F
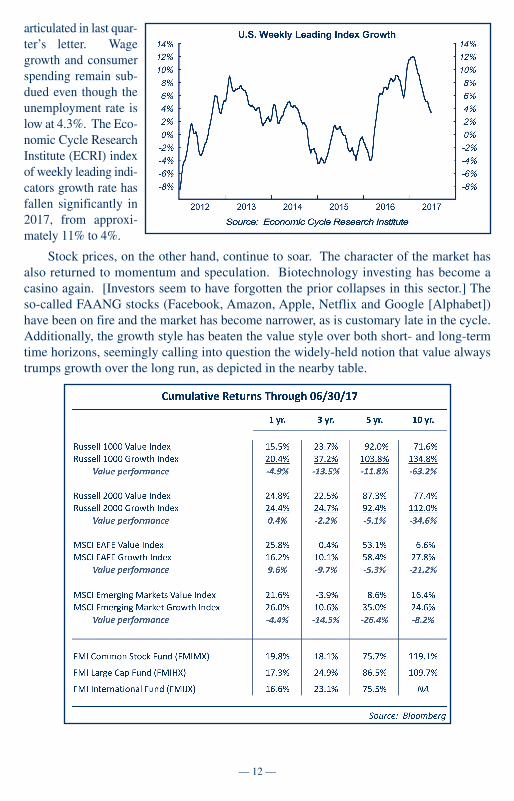
articulated in last quar-ter’s letter. Wagegrowth and consumerspending remain sub-dued even though theunemployment rate islow at 4.3%. The Eco-nomic Cycle ResearchInstitute (ECRI) indexof weekly leading indi-cators growth rate hasfallen significantly in2017, from approxi-mately 11% to 4%.
Stock prices, on the other hand, continue to soar. The character of the market hasalso returned to momentum and speculation. Biotechnology investing has become acasino again. [Investors seem to have forgotten the prior collapses in this sector.] Theso-called FAANG stocks (Facebook, Amazon, Apple, Netflix and Google [Alphabet])have been on fire and the market has become narrower, as is customary late in the cycle.Additionally, the growth style has beaten the value style over both short- and long-termtime horizons, seemingly calling into question the widely-held notion that value alwaystrumps growth over the long run, as depicted in the nearby table.
— 12 —
T F

The remarkable duration of this bull market has turned the world upside down formost of us on the value spectrum. We are confident that once we see the flipside of today’sup cycle, value outperformance will be restored. Our industry is trained to look at 3- and5-year performance. What happens when the cycle goes one way (up) for eight, nine orten years? Two things happen:
First, valuations go to extremes; today the data shows we are near all-time highs inmost valuation measures. The roughly fifty valuation measures that Leuthold Grouptracks, which we cite in nearly every letter, reside in the ninth decile and are pushing thetenth. Warren Buffett’s favorite stock market measure of value (total stock market valuedivided by GDP) is also near a record high (see nearby chart). Second, passive strategiesgain share and become momentum strategies. These two elements could get even moreextreme if the passive to active flow turns into a torrent.
The popularity of index funds and exchange-traded funds (ETFs) has a structural as-pect and a chase-the-winner (momentum) aspect. Investors’ desire to have low-cost funds,along with the belief that passive will continuously beat active, have caused a structuralmovement in this direction. We acknowledge that passive will have a larger share of themarket over time. In the investment business, however, it’s always important to rememberthe old quote, “What the wise do in the beginning, fools do in the end.” We have littledoubt that the capitulation taking place today will be wrong. Steve Bregman, from Hori-zon Kinetics, last fall published data showing some interesting characteristics of the ETFand index world that reveal just how risky the passive approach has become. The corre-lation of the largest members of the S&P 500 with the index has about doubled over the
— 13 —
T F

past twenty years. Additionally,many of the largest ETFs haveseen their correlations with theS&P 500 reach very high levels,as depicted in the nearby table(with perfect correlation as 1.0).Even investors who acknowl-edge that the S&P 500 has be-come a crowded trade, and whomove into ETFs to diversify,may find their results movingright with the S&P 500 after all.
Additionally, due to the rapid adoptionof ETF trading, the turnover rates of thelargest ETFs have skyrocketed. The twomost popular, The SPDR S&P 500 ETFand the iShares Russell 2000 Index ETF,have turnover rates that exceed 3500% (anaverage holding period of about a week).As Bregman points out, “That is dozens oftimes greater than the trading liquidity ofeven its most liquid constituents. [...] Whenthe music stops, is there enough underlyingliquidity?” With robots (algorithms) incharge, we could see some very unusualETF behavior when volatility arrives.
It is fascinating to look at the last peak in the market, which was October 9, 2007.The Leuthold Group thought it would be interesting to investigate how investors wouldhave done had they been “unlucky” enough to enter the market at the absolute peak. Theythen decomposed the returns into the following table:
— 14 —
T F

Putting aside the incredibly low growth rate in sales and earnings per share (1.6%and 1.1%, respectively) which may be the subject of another letter it turns out investorsdid surprisingly well… 6.8% compounded over 9 ½ years. Note, however, from wherethese returns have come. Roughly half of the return was “fundamental” (+1.1% earningsgrowth and +2.3% from the dividend), and half was from multiple expansion. Whenlooking at future returns, it seems highly unlikely that multiples (which are at extremes),or margins (which are high from a historical perspective), will provide a tailwind. Theopposite is much more likely, leaving the burden for performance on fundamental salesand earnings growth. Unless we break into a period of rapid sales growth, the backdropfor fundamentally-driven equity performance in the near term seems limited.
Today is a very trying and testing time for the cautious, the skeptic, the value-orientedand the history lover. Short sellers and hedge funds that are truly hedged have been clos-ing down. Investment committees and the public are increasingly chasing a very crowdedtrade (passive management). A visible long-time stock market skeptic has recently ca-pitulated. It’s a sobering reminder that the market sometimes operates on a time horizonthat is much longer than investors’ patience. While we remain strong believers in equitiesfor the long run, we are trying to be as cautious and prudent as possible in the short run.
Thank you for your support of the FMI Common Stock Fund.
100 E. Wisconsin Ave., Suite 2200 • Milwaukee, WI 53202 • 414-226-4555www.fmifunds.com
— 15 —
T F

Shares Value (b) ______ ________
COMMON STOCKS — 82.3% (a)
COMMERCIAL SERVICES SECTOR — 14.3% Advertising/Marketing Services — 3.1% 1,338,000 Interpublic Group of Cos. Inc. . . . . . . . . . . . . . . . . . . . . . . . . . . . . . . . . . $ 32,914,800 Financial Publishing/Services — 1.0% 65,000 FactSet Research Systems Inc. . . . . . . . . . . . . . . . . . . . . . . . . . . . . . . . . 10,801,700 Miscellaneous Commercial Services — 4.4% 1,650,000 Genpact Ltd. . . . . . . . . . . . . . . . . . . . . . . . . . . . . . . . . . . . . . . . . . . . . . . 45,919,500 Personnel Services — 5.8% 250,000 ManpowerGroup Inc. . . . . . . . . . . . . . . . . . . . . . . . . . . . . . . . . . . . . . . . . 27,912,500 689,000 Robert Half International Inc. . . . . . . . . . . . . . . . . . . . . . . . . . . . . . . . . . . 33,023,770 _____________ 60,936,270
CONSUMER DURABLES SECTOR — 1.5% Homebuilding — 1.5% 6,600 NVR Inc. . . . . . . . . . . . . . . . . . . . . . . . . . . . . . . . . . . . . . . . . . . . . . . . . . 15,910,026
CONSUMER SERVICES SECTOR — 5.4% Cable/Satellite TV — 1.5% 22,000 Cable One Inc. . . . . . . . . . . . . . . . . . . . . . . . . . . . . . . . . . . . . . . . . . . . . . 15,639,800 Other Consumer Services — 3.9% 68,000 Graham Holdings Co. . . . . . . . . . . . . . . . . . . . . . . . . . . . . . . . . . . . . . . . . 40,776,200
DISTRIBUTION SERVICES SECTOR — 8.1% Electronics Distributors — 2.7% 365,000 Arrow Electronics Inc. . . . . . . . . . . . . . . . . . . . . . . . . . . . . . . . . . . . . . . . 28,623,300 Wholesale Distributors — 5.4% 373,000 Anixter International Inc. . . . . . . . . . . . . . . . . . . . . . . . . . . . . . . . . . . . . . 29,168,600 240,000 Applied Industrial Technologies Inc. . . . . . . . . . . . . . . . . . . . . . . . . . . . . 14,172,000 150,000 MSC Industrial Direct Co. Inc. . . . . . . . . . . . . . . . . . . . . . . . . . . . . . . . . . 12,894,000 _____________ 56,234,600
ELECTRONIC TECHNOLOGY SECTOR — 5.0% Aerospace & Defense — 3.1% 337,000 Esterline Technologies Corp. . . . . . . . . . . . . . . . . . . . . . . . . . . . . . . . . . . 31,947,600 Electronic Production Equipment — 1.0% 160,000 MKS Instruments Inc. . . . . . . . . . . . . . . . . . . . . . . . . . . . . . . . . . . . . . . . 10,768,000 Telecommunications Equipment — 0.9% 147,000 ViaSat Inc. . . . . . . . . . . . . . . . . . . . . . . . . . . . . . . . . . . . . . . . . . . . . . . . . 9,731,400
FINANCE SECTOR — 19.1% Finance/Rental/Leasing — 11.0% 360,000 ePlus Inc. . . . . . . . . . . . . . . . . . . . . . . . . . . . . . . . . . . . . . . . . . . . . . . . . . 26,676,000 1,025,000 FirstCash Inc. . . . . . . . . . . . . . . . . . . . . . . . . . . . . . . . . . . . . . . . . . . . . . . 59,757,500 403,000 Ryder System Inc. . . . . . . . . . . . . . . . . . . . . . . . . . . . . . . . . . . . . . . . . . . 29,007,940 _____________ 115,441,440
— 16 —
FMI Common Stock FundSTATEMENT OF NET ASSETSJune 30, 2017 (Unaudited)
T F

Shares Value (b) ______ ________
COMMON STOCKS — 82.3% (a) (Continued)
FINANCE SECTOR — 19.1% (Continued) Property/Casualty Insurance — 5.5% 687,000 Greenlight Capital Re Ltd. . . . . . . . . . . . . . . . . . . . . . . . . . . . . . . . . . . . . $ 14,358,300 327,000 W.R. Berkley Corp. . . . . . . . . . . . . . . . . . . . . . . . . . . . . . . . . . . . . . . . . . . 22,618,590 24,000 White Mountains Insurance Group Ltd. . . . . . . . . . . . . . . . . . . . . . . . . . . 20,847,120 _____________ 57,824,010 Real Estate Development — 1.5% 835,000 Kennedy-Wilson Holdings Inc. . . . . . . . . . . . . . . . . . . . . . . . . . . . . . . . . . 15,906,750 Regional Banks — 1.1% 253,000 Zions Bancorporation . . . . . . . . . . . . . . . . . . . . . . . . . . . . . . . . . . . . . . . . 11,109,230
HEALTH SERVICES SECTOR — 2.1% Medical/Nursing Services — 2.1% 366,000 MEDNAX Inc. . . . . . . . . . . . . . . . . . . . . . . . . . . . . . . . . . . . . . . . . . . . . . . 22,095,420
HEALTH TECHNOLOGY SECTOR — 2.1% Medical Specialties — 2.1% 215,000 Varian Medical Systems Inc. . . . . . . . . . . . . . . . . . . . . . . . . . . . . . . . . . . 22,185,850
PROCESS INDUSTRIES SECTOR — 5.1% Containers/Packaging — 2.6% 309,000 Avery Dennison Corp. . . . . . . . . . . . . . . . . . . . . . . . . . . . . . . . . . . . . . . . 27,306,330 Industrial Specialties — 2.5% 514,000 H.B. Fuller Co. . . . . . . . . . . . . . . . . . . . . . . . . . . . . . . . . . . . . . . . . . . . . . 26,270,540
PRODUCER MANUFACTURING SECTOR — 9.4% Building Products — 2.7% 620,000 Armstrong World Industries Inc. . . . . . . . . . . . . . . . . . . . . . . . . . . . . . . . 28,520,000 Industrial Machinery — 2.8% 441,000 Woodward Inc. . . . . . . . . . . . . . . . . . . . . . . . . . . . . . . . . . . . . . . . . . . . . 29,802,780 Miscellaneous Manufacturing — 3.9% 129,000 Carlisle Cos. Inc. . . . . . . . . . . . . . . . . . . . . . . . . . . . . . . . . . . . . . . . . . . . 12,306,600 921,000 TriMas Corp. . . . . . . . . . . . . . . . . . . . . . . . . . . . . . . . . . . . . . . . . . . . . . . 19,202,850 65,000 Valmont Industries Inc. . . . . . . . . . . . . . . . . . . . . . . . . . . . . . . . . . . . . . . 9,724,000 _____________ 41,233,450
RETAIL TRADE SECTOR — 3.0% Food Retail — 0.9% 90,000 Casey’s General Stores Inc. . . . . . . . . . . . . . . . . . . . . . . . . . . . . . . . . . . . 9,639,900 Specialty Stores — 2.1% 487,450 Penske Automotive Group Inc. . . . . . . . . . . . . . . . . . . . . . . . . . . . . . . . . 21,403,930
TECHNOLOGY SERVICES SECTOR — 5.8% Data Processing Services — 3.3% 455,000 Broadridge Financial Solutions Inc. . . . . . . . . . . . . . . . . . . . . . . . . . . . . . 34,379,800 Information Technology Services — 2.5% 2,045,000 Allscripts Healthcare Solutions Inc. . . . . . . . . . . . . . . . . . . . . . . . . . . . . . 26,094,200
— 17 —
FMI Common Stock FundSTATEMENT OF NET ASSETS (Continued)June 30, 2017 (Unaudited)
T F

Shares or Principal Amount Value (b)_______________________ ________
COMMON STOCKS — 82.3% (a) (Continued)
TRANSPORTATION SECTOR — 1.4% Marine Shipping — 1.4% 221,000 Kirby Corp. . . . . . . . . . . . . . . . . . . . . . . . . . . . . . . . . . . . . . . . . . . . . . . . $ 14,773,850 _____________ Total common stocks . . . . . . . . . . . . . . . . . . . . . . . . . . . . . . . . . . . . . . . . 864,190,676
SHORT-TERM INVESTMENTS — 17.7% (a) Bank Deposit Account — 8.2% $86,033,569 U.S. Bank, N.A., 0.95%^ . . . . . . . . . . . . . . . . . . . . . . . . . . . . . . . . . . . . . . 86,033,569 U.S. Treasury Securities — 9.5% 50,000,000 U.S. Treasury Bills, 0.378%, due 07/06/17^ . . . . . . . . . . . . . . . . . . . . . . . 49,996,850 50,000,000 U.S. Treasury Bills, 0.729%, due 07/27/17^ . . . . . . . . . . . . . . . . . . . . . . . 49,972,650 _____________ Total U.S. treasury securities . . . . . . . . . . . . . . . . . . . . . . . . . . . . . . . . . . 99,969,500 _____________ Total short-term investments . . . . . . . . . . . . . . . . . . . . . . . . . . . . . . . . . . 186,003,069 _____________ Total investments — 100.0% . . . . . . . . . . . . . . . . . . . . . . . . . . . . . . . . . . 1,050,193,745
Other assets, less liabilities — (0.0%) (a) . . . . . . . . . . . . . . . . . . . . . . . . (10,780) _____________ TOTAL NET ASSETS — 100.0% . . . . . . . . . . . . . . . . . . . . . . . . . . . . . . . . $1,050,182,965 _____________ _____________ Investor Class – Net Asset Value Per Share ($0.0001 par value, 200,000,000 shares authorized), offering and redemption price ($797,457,774 ÷ 28,829,122 shares outstanding) . . . . . . . . . . . . . $ 27.66 _____________ _____________ Institutional Class – Net Asset Value Per Share ($0.0001 par value, 100,000,000 shares authorized), offering and redemption price ($252,725,191 ÷ 9,132,793 shares outstanding) . . . . . . . . . . . . . . $ 27.67 _____________ _____________
^ The rate shown is the yield as of June 30, 2017.(a) Percentages for the various classifications relate to net assets.(b) Each security is valued at the current day last sale price reported by the principal security exchange on which
the issue is traded. Securities that are traded on Nasdaq Markets are valued at the Nasdaq Official ClosingPrice, or if no sale is reported, the latest bid price. Securities that are traded over-the-counter, includingshort-term securities are valued at the close price, if not close, then at the latest bid price.
— 18 —
FMI Common Stock FundSTATEMENT OF NET ASSETS (Continued)June 30, 2017 (Unaudited)
T F

FMIInternational
FundJune 30, 2017
Dear Fellow Shareholders:
International stock markets continued their relentless climb in the June quarter, as theoutlook for global economic growth improved. The FMI International Fund (FMIJX, or“The Fund”) gained 3.51%1 in the period, compared with the MSCI EAFE Index’s increaseof 2.71% in local currency and 6.12% in U.S. Dollars (USD). The Fund’s performancewas driven by strong relative moves in the Electronic Technology, Consumer Durables,and Consumer Non-Durables sectors, while Industrial Services, Finance, and DistributionServices detracted. Top individual contributors included Rolls-Royce, Samsung Electronicsand Electrolux, with Schlumberger, Fairfax Financial, and Wolseley weighing on the re-sults. Currency hedging and an elevated cash balance remained a headwind.
The global economy’s fragile recovery is showing signs of life, with manufacturingimproving, some commodity producers recovering, and trade and investment picking upfrom low levels. The Organisation for Economic Co-operation and Development (OECD)now predicts world GDP growth will accelerate to 3.5% in 2017 (from 3.0% in 2016),and 3.6% in 2018. However, growth remains below historical norms despite a boost fromplanned fiscal initiatives. In China, for example, fixed investment for infrastructure in-creased by more than 23% through April of 2017 (year-over-year).2 Combined with aroaring housing market, China’s ramped-up stimulus program helped drive better-than-expected growth (6.9%) in the first quarter. China is on pace to account for around a thirdof global growth in 2017, an outsized impact.3 Elsewhere, GDP in Europe and Japan hasalso modestly improved, on the back of extraordinary (and potentially dangerous) moneyprinting and quantitative easing (QE) efforts. Despite the recent uptick, the risks to theoutlook appear skewed to the downside, and include elevated stock and bond valuations,high (and rising) debt levels, overheated property markets, unsustainable interest ratesand central bank policies, weak productivity and wage growth, and geopolitical uncer-tainty, among others. As optimism and complacency continue to permeate the investmentlandscape, we remain prudently positioned with a focus on capital preservation.
Pricing In Risk: Not Today
As we look around the world, with each passing day it becomes increasingly clearthat asset values (across the spectrum) are not adequately pricing in risk. Despite whatthe pundits on CNBC would have you believe, stocks are expensive – both domesticallyand overseas. Valuations are well above historical levels using most conventional metrics. _____________1 Performance for the FMI International Fund Investor Class (FMIJX) for the first quarter of 2017 was 3.51%,and for the FMI International Fund Institutional Class (FMIYX), 3.55%.
2 “OECD Economic Outlook” presentation. June 7, 2017. www.oecd.org/economy/economicoutlook.htm.3 “China Roars Back to Lift Global Outlook as U.S. Consumer Weakens.” Bloomberg News. April 17, 2017.
— 19 —
T F

If you exclude everything bad that happens (restructuring charges, one-time costs, amor-tization of intangibles, etc.) and pretend stock compensation is not a real cost, you cancome up with an “adjusted” price-to-earnings (P/E) ratio that suits your fancy. This is nota game we will play. While there will always be idiosyncratic opportunities in the stockmarket (and we are tirelessly turning over new rocks to find them), in aggregate, the op-portunity set is highly-valued. This is especially true for quality, well-run companies withstrong balance sheets. Finding traditional “FMI names” is as hard as it’s been since westarted the business over 37 years ago. Notwithstanding the aforementioned commentary,public equities still appear to be the best house (asset class) on the block.
While stocks might be levitating, the bond market is completely upside down. Re-markably, negative interest rates remain prevalent, with about $9.5 trillion of sovereigndebt still trading at a negative yield.4 With no such precedent (for negative interest rates)in 5,000 years of banking history,5 the notion of guaranteed losses on fixed income invest-ments (if held to maturity) is hard to fathom. Common sense does not apply, as the greaterfool theory is the only reasonable explanation. Meanwhile, with investors starved for yield,a country like Argentina is somehow able to come to market with a 100-year bond pricedat only 7.9%. As a reminder, this is a country that has defaulted on its debt eight times, in-cluding in 2001 ($100 billion) and 2014. Grant’s Interest Rate Observer aptly writes, “Atits historical pace… [Argentina] will default more than four times over before that so very-distant prospective maturity date. From banking crises, to political dysfunction, to depres-sion-level economic contractions and hyperinflation, Argentines (and their creditors) haveseen it all, usually more than once.”6 Elsewhere in emerging markets, 10-year bond yields(in USD) for Russia and Brazil are priced at 4.28% and 4.88%, respectively. Russia is notfar removed from its longest recession in two decades7 (and energy prices have recentlycollapsed), while Brazil just exited its worst recession (eight straight quarters) in history.8
Yet both sovereign issues trade at a similar yield to that of the U.S. equivalent averaged inthe decade leading up to the financial crisis (4.88%), which is much closer to “normal”than the manipulatedground-hugging envi-ronment that we havetoday. In Europe, thedetachment from real-ity is just as troubling.Italy’s 10-year bondtrades at a lower yield(2.15%) than that ofthe U.S. (2.31%), despite facing weak economic growth, a
_____________4 Jeff Cox. “Negative-yielding government debt ‘supernova’ jumps to $9.5 trillion.” CNBC, June 16, 2017.5 Jeff Cox. “$12 trillion of QE and the lowest rates in 5,000 years...for this?” CNBC, June 13, 2016.6 Philip Grant. “Time marches on.” Grant’s Interest Rate Observer: Almost Daily Grant’s. June 19, 2017.7 Anna Andrianova. “Russia Is Running on More Than Just the Black Stuff.” Bloomberg. March 6, 2017.8 Patrick Gillespie. “Brazil’s worst recession: 8 consecutive quarters of contraction.” CNN.March 7, 2017.
— 20 —
T F

troubled banking system, and ballooning public debt. Over the last 10 years, GDP growthin Italy has averaged -0.55%, while debt-to-GDP has jumped to 133%.9 Can any rationalobserver make the case that Italian bonds are a safer bet than their U.S. counterparts?Amazingly, Italy’s 2-year bonds trade at a negative yield.
Real estate may also be priced for perfection, as rumblings of property market bubblesin Australia, Canada, London, Japan, China and Hong Kong are all capturing their shareof headlines. After riding on the coattails of China’s growth miracle, Australia is now celebrating almost 26 years (103 quarters) without a recession, the longest recorded periodin the developed world.10 China’s fixed investment boom has driven demand for resourcesfrom Australia, as iron ore and coal are the country’s leading exports. With great economicfortune (and Chinese capital flight to overseas property markets), the Australian real estatemarket has been on a tear. Unfortunately, individual balance sheets are starting to getstretched, along with property prices. To quote Grant’s Interest Rate Observer once more,“Australian households rank fourth among the world’s most indebted [188.7% householddebt-to-income vs. U.S. peak at 132.7% during the housing bubble] […] the median ratioof house prices to income in Australia’s major markets hovered at 6.6 vs. 3.9x in the UnitedStates. The price-to-income ratio in Sydney, the second-most expensive city in Demographia’s survey, towered at 12.2, after Hong Kong (18.1) and above other high-fly-ing Anglophone cities like Vancouver (11.8) and San Francisco (9.2).”11
Aggressive Chi-nese buyers have alsohelped prop upCanada’s real estatemarket, in tandem withlocal speculation andabundant credit. WithCanadian propertymarkets overheated, anear-collapse at one ofCanada’s largest mort-gage lenders, HomeCapital Group (Ticker: HCG.CA), could be an early warning sign. The stock dropped morethan 60% in one day. Home Capital focuses on subprime lending, and its fall from gracehas been compared with New Century Bank, the second largest U.S. subprime lender,which ran into trouble 18 months before the Lehman crisis, and was one of the first domi-nos to fall.12 While history may not repeat itself, at the very least this should raise someantennas. Ours are certainly on high alert.
_____________9 World Bank data.10 “Eryk Bagshaw & James Massola.” “GDP: Australia grabs record for longest time without a recession.” The
Sydney Morning Herald. June 7, 2017.11 Grant’s Interest Rate Observer:Vol. 35, No. 12. June 16, 2017.12 Ben McLannahan. “Home Capital woes spark fears on Canada property market.” Financial Times. May 18, 2017.
— 21 —
T F

Europe: In The Clear?
Even though the herd is applauding Europe’s economic revival, we still have somelingering doubts. At the source, we do not believe printing money can solve real-worldproblems, even if it may paper over them in the near term. The fundamental structural is-sues in Europe (and elsewhere) have not been addressed. Uncertainty remains high, es-pecially after Theresa May’s failed UK snap election, with more political drama likelystill to come. Additionally, while the narrative is that employment in the eurozone is muchimproved (9.3% unemployment, the lowest in eight years), a recent European CentralBank (ECB) study paints a more troubling picture. Per the Financial Times, “The euro-zone’s labour market is in much worse shape than official jobs figures suggest, with work-ers unlikely to see real increases in pay because of the level of underemployment acrossthe bloc […] A new measure of “slack” in the labour market from ECB economists indi-cates that between 15 per cent and 18 per cent of the eurozone workforce are withoutjobs or would like to work longer hours, almost double the official unemployment rate.[…] The problem of underestimating unemployment is particularly acute in Europe be-cause Eurostat, the European Commission’s statistics bureau responsible for the measure,bases its official unemployment figure on a narrow definition of joblessness.”13 Therefore,we were not surprised to see a recent McKinsey Global Institute survey of European busi-ness leaders indicate “a continuing reluctance among European firms to invest, with manyhoarding cash. […] European business leaders cite a range of risks and uncertainties, in-cluding concern about future crises, nervousness about rising populism and anti-global-ization sentiment, and lingering fears about the future shape and direction of the EuropeanUnion (EU) itself.”14 Unfortunately, weak business investment does not typically bodewell for productivity and GDP growth.
Another sign of caution would be the recent failure of Spain’s multi-billion-euro bank,Banco Popular. After a run on the bank, Europe’s new banking resolution authority (SingleResolution Board, or SRB) had to broker an overnight sale to Santander, whose offer of€1 (without any state guarantees against hidden losses) got the deal done. It certainly bringsback memories of J.P. Morgan coming to the rescue of Bear Stearns in March of 2008.Banco Popular’s equity and subordinated debt holders were wiped out, with the SRB im-posing approximately €3.3 billion of losses on these security holders. Per the FinancialTimes, “The origins of Popular’s demise go back at least a decade, to the final years ofSpain’s ill-fated property boom, when Popular made an ill-timed bet by loading up on realestate assets and loans just before the financial crisis.”15 With Spain’s economy hummingalong (at least 3% GDP growth in eight straight quarters) and European stock markets onthe rise, it was somewhat surprising to see a notable bank fail, but even more telling to seecomplacent investors simply shrug it off and continue to push equity prices higher.
_____________13 Claire Jones and Sarah O’Connor. “Plight of eurozone jobless found to be worse than data show.” Financial
Times, May 10, 2017.14 Jacques Bughin, Eric Labaye, Frank Mattern, Sven Smit, Eckart Windhagen, Jan Mischke, and Kate Bragg.“The brightening mood of European business—and what it means for investment.” McKinsey Global Insti-tute. May 2017.
15 Tobias Buck & Jim Brundsden. “Banco Popular caught in death spiral.” Financial Times. June 8, 2017.
— 22 —
T F

BOJ: Full Throttle
When it comes to money printing and QE, the Bank of Japan (BOJ) is by far theworld’s worst offender (vs. the size of its economy). Per the Nikkei Asian Review, “Ataround 93%, the scale of the Japanese central bank’s assets in proportion to GDP has noclose match. Latest data shows that the U.S. Federal Reserve held roughly $4.5 trillion inassets, which is equivalent to 23% of the country’s GDP. The European Central Bank’sbalance sheet, at about 4.2 trillion euros ($4.71 trillion) is larger than the BOJ’s, but itstill sits at around 28% of the eurozone GDP.”16 The BOJ purchased approximately “114.4trillion yen [$1.03 billion] worth of JGBs [Japanese Government Bonds] in 2016, 71.7percent of new issues and 12.7 percent of the total market size of 903 trillion yen.”17 In2017, the BOJ has also ramped up purchasing of exchange-traded funds (ETFs), with thebalance now reaching 15.93 trillion yen ($144 billion), an 80% rise from a year earlier.Reports that the central bank is actively attempting to support the stock market, as it “buysfrequently on days when the stock market dips in the morning, serving to stabilize shareprices,”18 is alarming, to say the least. Layer on the fact that Japan’s government debt isthe highest ever recorded in the OECD (220% of GDP) and rising, and the long-term sit-uation appears untenable. If interest rates were ever to unexpectedly rise from near zero(or negative) levels, it could have a devastating impact.
During a recent FMI research trip to Tokyo in June, we were concerned to see howoblivious the general public appears to be with regard to the above-mentioned risks. Peo-ple we talked to were not at all aware that the BOJ’s policies were radical, and seemed tohave complete trust in the government’s ability to maintain stability. Financial markets(equity and debt) in Japan clearly reflect a similar optimism.
China: Not In The Mood
We have long been wary of the massive debt accumulation in China and the unsus-tainability of economic growth driven by excessive fixed investment (infrastructure spend-ing, real estate investment, etc.). China’s mountain of debt has tripled from almost $10trillion in 2009 to approximately $30 trillion, reaching around 300% of GDP. Not sur-prisingly, for the first time since 1989, Moody’s Investors Service recently cut its ratingon China’s debt (to A1 from Aa3), citing that “China’s financial strength will erode some-what over the coming years, with economy-wide debt continuing to rise as potentialgrowth slows [to approximately 5% over the next 5 years].”19 While the government hasstarted a campaign to exercise greater control over its banks, The Wall Street Journal re-ports that this has made banks reluctant to lend, and led to increased funding costs, drivingsome companies to borrow from less-transparent lenders in the shadow banking market.For example, “New loans from so-called trusts, firms that raise money from individualsand corporations to plow into riskier areas of the economy, reached 882.3 billion yuan
_____________16 “BOJ’s balance sheet almost as big as Japanese economy.” Nikkei Asian Review. June 2, 2017.17 Hideyuki Sano and Yasunori Fukui. “Stress in Japanese corporate bonds seen as a sign of things to come.”
Reuters. May 17, 2017.18 “Japan’s central bank nearly doubles ETF holdings in one year.” Nikkei Asian Review. June 5, 2017.19 “Moody’s downgrades China’s rating to A1 from Aa3 and changes outlook to stable from negative.”
Bloomberg News. May 26, 2017.
— 23 —
T F

($129.5 billion) in the first four months of the year, […] nearly five times as much as thesame period in 2016.” Trust loans can be disguised by banks as investments, making it“harder to gauge the true extent of credit in the system”20 – a real problem.
At the same time,despite an accelerationin the economy (perthe “official” govern-ment data), through thefirst quarter China hashad the most corporatebond defaults ever tostart a year (see nearbychart). A total of 9bond issues went bustin the first quarter vs.29 in all of 2016. Most of the trouble is coming from heavy industry and construction end-markets.21 In a telling statistic that is also illustrative of the mal-investment believed to beso prevalent in China, The Wall Street Journal reports that “state-backed companies thataccount for almost two-thirds of corporate debt recorded just 1% of profit growth last year,while their liabilities grew by 10%.”22 This equation will not lead to long-term prosperity.
The Chinese real estate market remains a key risk point, as new home prices continueto grow in the double digits. Total mortgage debt surged 37% in 2016, with nearly 70% ofhousing transactions financed with a mortgage (double the rate from 2013). While the gov-ernment requires down payments of at least 20% (and even more for second homes), buyersare utilizing creative workarounds. In addition to peer-to-peer lending for down payments,property developers are now offering their own loans to cover the entire down payment,with no collateral requirements. While regulators are supposed to crack down, the likelyoutcome is more bark than bite. A healthy real estate market is paramount. Per the NikkeiAsian Review, “By some estimates, property development and ancillary industries togetheraccount for more than 20% of Chinese GDP. Their importance to the economy cannot beoverstated. Any downturn in the housing market, even if commercial real estate remainedinsulated, would jeopardize the cash flow and debt-servicing ability of heavily leveragedproperty developers, with potentially severe repercussions for the companies’ lenders andbondholders.”23 The resulting collateral damage would be very hard to contain.
_____________20 Chao Deng and Lingling Wei. “China’s Debt Crackdown Is Driving Borrowers Into Riskier Territory.” The
Wall Street Journal. June 4, 2017.21 “China Has Its Worst-Ever Start to a Year For Defaults.” Bloomberg News. April 2, 2017.22 Anjani Trivedi. “Trouble Bubbling Under at Chinese Banks.” The Wall Street Journal. April 3, 2017.23 Diana Choyleva. “Why China’s next property market drop will be more severe.” Nikkei Asian Review. June 7, 2017.
— 24 —
T F

Value vs. Growth: Swimming Upstream
As illustrated by the Citi Research charts below,24 it’s been lonely being a value in-vestor for much of the last decade, with growth outperforming value on a 3-, 5- and 10-year basis (MSCI World):
History books point to a plethora of empirical evidence showing value’s considerableoutperformance over long periods of time, but the authors admittedly had never seen theextreme levels of central bank policy (e.g., QE, negative interest rates), nor the monu-mental shift from active to passive management (fueling momentum strategies) that wesee today. With elevated valuations and widespread complacency, we are confident that“reversion to the mean” will prove timely and relevant. While some renowned value in-vestors have started to capitulate and throw in the towel, we will continue to stay true toour core value principles. In time, we expect our investors will be handsomely rewardedfor our steadfast commitment.
Thank you for your support of the FMI International Fund.
_____________24 Robert Buckland, Mert Genc, et al. “Global Equity Strategist.” Citi Research. June 22, 2017.
100 E. Wisconsin Ave., Suite 2200 • Milwaukee, WI 53202 • 414-226-4555www.fmifunds.com
— 25 —
T F

Shares Value (b) ______ ________
LONG-TERM INVESTMENTS — 78.2% (a)
COMMON STOCKS — 71.3% (a)
COMMERCIAL SERVICES SECTOR — 8.6% Advertising/Marketing Services — 1.9% 7,317,000 WPP PLC (Jersey) . . . . . . . . . . . . . . . . . . . . . . . . . . . . . . . . . . . . . . . . . . $ 154,072,540 Miscellaneous Commercial Services — 3.6% 1,154,966 DKSH Holding AG (Switzerland) . . . . . . . . . . . . . . . . . . . . . . . . . . . . . . . . 93,901,342 2,635,000 Secom Co. Ltd. (Japan) . . . . . . . . . . . . . . . . . . . . . . . . . . . . . . . . . . . . . . 200,484,009 _____________ 294,385,351 Personnel Services — 3.1% 3,300,000 Adecco Group AG (Switzerland) . . . . . . . . . . . . . . . . . . . . . . . . . . . . . . . . 251,401,268
COMMUNICATIONS SECTOR — 4.3% Wireless Telecommunications — 4.3% 2,810,000 Millicom International Cellular S.A. (Luxembourg) . . . . . . . . . . . . . . . . . . 166,205,963 8,235,000 Vivendi S.A. (France) . . . . . . . . . . . . . . . . . . . . . . . . . . . . . . . . . . . . . . . . 183,373,023 _____________ 349,578,986
CONSUMER DURABLES SECTOR — 8.3% Electronics/Appliances — 3.0% 7,270,000 Electrolux AB — Series B (Sweden) . . . . . . . . . . . . . . . . . . . . . . . . . . . . . 238,392,454 Motor Vehicles — 1.5% 9,703,000 Isuzu Motors Ltd. (Japan) . . . . . . . . . . . . . . . . . . . . . . . . . . . . . . . . . . . . 120,485,690 Other Consumer Specialties — 1.3% 25,725,000 Samsonite International S.A. (Luxembourg) . . . . . . . . . . . . . . . . . . . . . . . 107,473,844 Tools & Hardware — 2.5% 5,500,300 Makita Corp. (Japan) . . . . . . . . . . . . . . . . . . . . . . . . . . . . . . . . . . . . . . . . 203,698,313
CONSUMER NON-DURABLES SECTOR — 7.3% Food: Major Diversified — 2.3% 2,080,000 Nestle’ S.A. (Switzerland) . . . . . . . . . . . . . . . . . . . . . . . . . . . . . . . . . . . . . 181,412,769 Household/Personal Care — 5.0% 2,021,000 Henkel AG & Co. KGaA (Germany) . . . . . . . . . . . . . . . . . . . . . . . . . . . . . . 244,812,917 2,950,000 Unilever PLC (Britain) . . . . . . . . . . . . . . . . . . . . . . . . . . . . . . . . . . . . . . . . 159,648,534 _____________ 404,461,451
CONSUMER SERVICES SECTOR — 7.6% Cable/Satellite TV — 2.1% 4,200,000 Liberty Global PLC (Britain) . . . . . . . . . . . . . . . . . . . . . . . . . . . . . . . . . . . 89,922,000 3,710,000 Shaw Communications Inc. (Canada) . . . . . . . . . . . . . . . . . . . . . . . . . . . . 80,934,531 _____________ 170,856,531 Casinos/Gaming — 1.1% 70,280,000 Genting Malaysia Berhad (Malaysia) . . . . . . . . . . . . . . . . . . . . . . . . . . . . . 90,035,939 Restaurants — 4.4% 5,288,462 Compass Group PLC (Britain) . . . . . . . . . . . . . . . . . . . . . . . . . . . . . . . . . 111,627,060 4,650,000 Whitbread PLC (Britain) . . . . . . . . . . . . . . . . . . . . . . . . . . . . . . . . . . . . . . 240,310,102 _____________ 351,937,162
— 26 —
FMI International FundSTATEMENT OF NET ASSETSJune 30, 2017 (Unaudited)
T F

Shares Value (b) ______ ________
LONG-TERM INVESTMENTS — 78.2% (a) (Continued)
COMMON STOCKS — 71.3% (a) (Continued)
DISTRIBUTION SERVICES SECTOR — 4.6% Wholesale Distributors — 4.6% 5,970,000 Travis Perkins PLC (Britain) . . . . . . . . . . . . . . . . . . . . . . . . . . . . . . . . . . . $ 113,173,294 4,250,000 Wolseley PLC (Jersey) . . . . . . . . . . . . . . . . . . . . . . . . . . . . . . . . . . . . . . . 260,856,689 _____________ 374,029,983
ELECTRONIC TECHNOLOGY SECTOR — 6.5% Aerospace & Defense — 3.7% 25,801,000 Rolls-Royce Holdings PLC (Britain) . . . . . . . . . . . . . . . . . . . . . . . . . . . . . 299,257,592 Electronic Components — 2.8% 2,868,000 TE Connectivity Ltd. (Switzerland) . . . . . . . . . . . . . . . . . . . . . . . . . . . . . . 225,654,240
FINANCE SECTOR — 3.8% Property/Casualty Insurance — 3.8% 2,585,000 Admiral Group PLC (Britain) . . . . . . . . . . . . . . . . . . . . . . . . . . . . . . . . . . . 67,455,524 560,000 Fairfax Financial Holdings Ltd. (Canada) . . . . . . . . . . . . . . . . . . . . . . . . . . 242,694,016 _____________ 310,149,540
INDUSTRIAL SERVICES SECTOR — 2.8% Oilfield Services/Equipment — 2.8% 3,447,000 Schlumberger Ltd. (Curacao) . . . . . . . . . . . . . . . . . . . . . . . . . . . . . . . . . . 226,950,480
PROCESS INDUSTRIES SECTOR — 2.8% Chemicals: Agricultural — 2.8% 13,633,000 Potash Corp. of Saskatchewan Inc. (Canada) . . . . . . . . . . . . . . . . . . . . . . 222,217,900
PRODUCER MANUFACTURING SECTOR — 6.4% Industrial Conglomerates — 6.4% 5,520,000 Jardine Strategic Holdings Ltd. (Bermuda) . . . . . . . . . . . . . . . . . . . . . . . . 230,114,442 13,955,000 Smiths Group PLC (Britain) . . . . . . . . . . . . . . . . . . . . . . . . . . . . . . . . . . . 290,152,801 _____________ 520,267,243
RETAIL TRADE SECTOR — 1.8% Specialty Stores — 1.8% 885,000 Dufry AG (Switzerland) . . . . . . . . . . . . . . . . . . . . . . . . . . . . . . . . . . . . . . . 145,237,621
TECHNOLOGY SERVICES SECTOR — 4.0% Information Technology Services — 4.0% 2,618,000 Accenture PLC (Ireland) . . . . . . . . . . . . . . . . . . . . . . . . . . . . . . . . . . . . . . 323,794,240
TRANSPORTATION SECTOR — 2.5% Other Transportation — 2.5% 44,763,509 Bolloré (France) . . . . . . . . . . . . . . . . . . . . . . . . . . . . . . . . . . . . . . . . . . . . 203,531,629 _____________ Total common stocks . . . . . . . . . . . . . . . . . . . . . . . . . . . . . . . . . . . . . . . . 5,769,282,766
PREFERRED STOCKS — 6.9% (a)
CONSUMER DURABLES SECTOR — 1.6% Motor Vehicles — 1.6% 1,240,000 Hyundai Motor Co. (South Korea) . . . . . . . . . . . . . . . . . . . . . . . . . . . . . . 126,258,621
— 27 —
FMI International FundSTATEMENT OF NET ASSETS (Continued)June 30, 2017 (Unaudited)
T F

Shares or Principal Amount Value (b)_______________________ ________
LONG-TERM INVESTMENTS — 78.2% (a) (Continued)
PREFERRED STOCKS — 6.9% (a) (Continued)
CONSUMER NON-DURABLES SECTOR — 2.2% Household/Personal Care — 2.2% 550,000 Amorepacific Corp. (South Korea) . . . . . . . . . . . . . . . . . . . . . . . . . . . . . . $ 89,411,353 171,000 LG Household & Health Care Ltd. (South Korea) . . . . . . . . . . . . . . . . . . . 92,954,271 _____________ 182,365,624
ELECTRONIC TECHNOLOGY SECTOR — 3.1% Telecommunications Equipment — 3.1% 156,000 Samsung Electronics Co. Ltd. (South Korea) . . . . . . . . . . . . . . . . . . . . . . 254,357,710 _____________ Total preferred stocks . . . . . . . . . . . . . . . . . . . . . . . . . . . . . . . . . . . . . . . . 562,981,955 _____________ Total long-term investments . . . . . . . . . . . . . . . . . . . . . . . . . . . . . . . . . . . 6,332,264,721
SHORT-TERM INVESTMENTS — 22.2% (a) Bank Deposit Account — 9.9% $798,305,095 U.S. Bank, N.A., 0.95%^ . . . . . . . . . . . . . . . . . . . . . . . . . . . . . . . . . . . . . . 798,305,095 U.S. Treasury Securities — 12.3% 400,000,000 U.S. Treasury Bills, 0.378%, due 07/06/17^ . . . . . . . . . . . . . . . . . . . . . . . 399,974,800 600,000,000 U.S. Treasury Bills, 0.729%, due 07/27/17^ . . . . . . . . . . . . . . . . . . . . . . . 599,671,800 _____________ Total U.S. treasury securities . . . . . . . . . . . . . . . . . . . . . . . . . . . . . . . . . . 999,646,600 _____________ Total short-term investments . . . . . . . . . . . . . . . . . . . . . . . . . . . . . . . . . . 1,797,951,695 _____________ Total investments — 100.4% . . . . . . . . . . . . . . . . . . . . . . . . . . . . . . . . . . 8,130,216,416
Other assets, less liabilities — (0.4%) (a) . . . . . . . . . . . . . . . . . . . . . . . . (36,082,505) _____________ TOTAL NET ASSETS — 100.0% . . . . . . . . . . . . . . . . . . . . . . . . . . . . . . . . $8,094,133,911 _____________ _____________ Investor Class – Net Asset Value Per Share ($0.0001 par value, 200,000,000 shares authorized), offering and redemption price ($5,690,426,625 ÷ 174,088,421 shares outstanding) . . . . . . . . . . $ 32.69 _____________ _____________ Institutional Class – Net Asset Value Per Share ($0.0001 par value, 200,000,000 shares authorized), offering and redemption price ($2,403,707,286 ÷ 73,501,819 shares outstanding) . . . . . . . . . . . $ 32.70 _____________ _____________
^ The rate shown is the yield as of June 30, 2017.(a) Percentages for the various classifications relate to net assets.(b) Each security is valued at the current day last sale price reported by the principal security exchange on which
the issue is traded. Securities that are traded on Nasdaq Markets are valued at the Nasdaq Official Closing Price,or if no sale is reported, the latest bid price. For securities that do not trade during New York Stock Exchangehours, fair value determinations are based on analyses of market movements after the close of those securities’primary markets, and may include reviews of developments in foreign markets, the performance of U.S.securities markets, and the performance of instruments trading in U.S. markets that represent foreign securitiesand baskets of foreign securities. The Board of Directors utilizes a service provided by an independent thirdparty to assist in fair valuation of certain securities. Securities that are traded over-the-counter, including short-term securities are valued at the close price, if not close, then at the latest bid price.
PLC Public Limited Company
— 28 —
FMI International FundSTATEMENT OF NET ASSETS (Continued)June 30, 2017 (Unaudited)
T F

U.S. $ Value on U.S. $ Value on June 30, 2017 June 30, 2017 UnrealizedSettlement Currency to of Currency to Currency to of Currency to Appreciation Date Counterparty be Delivered be Delivered be Received be Received (Depreciation) _________ ____________ ____________ _____________ ____________ _____________ _____________ 7/21/17 Goldman 20,000,000 $ 26,067,714 25,594,000 $ 25,594,000 $ (473,714) Sachs & Co. British Pound U.S. Dollar
7/21/17 State Street 1,000,000,000 1,303,385,686 1,284,371,000 1,284,371,000 (19,014,686) Global Markets, British Pound U.S. Dollar LLC
7/21/17 JPMorgan 340,000,000 262,298,161 253,894,227 253,894,227 (8,403,934) Chase Canadian Dollar U.S. Dollar
7/21/17 Goldman 60,000,000 68,608,997 67,268,400 67,268,400 (1,340,597) Sachs & Co. Euro U.S. Dollar
7/21/17 Northern 400,000,000 457,393,315 430,756,000 430,756,000 (26,637,315) Trust Co. Euro U.S. Dollar
7/21/17 Bank of New 45,000,000,000 400,472,093 413,964,399 413,964,399 13,492,306 York Mellon Japanese Yen U.S. Dollar
7/21/17 Bank of New 310,000,000 72,148,824 70,077,085 70,077,085 (2,071,739) York Mellon Malaysian Ringgit U.S. Dollar
7/21/17 Bank of New 520,000,000,000 454,631,329 455,302,291 455,302,291 670,962 York Mellon South Korean Won U.S. Dollar
7/21/17 Bank of New 200,000,000 23,769,802 23,012,232 23,012,232 (757,570) York Mellon Swedish Krona U.S. Dollar
7/21/17 Goldman 1,400,000,000 166,388,611 156,785,450 156,785,450 (9,603,161) Sachs & Co. Swedish Krona U.S. Dollar
7/21/17 JPMorgan 520,000,000 543,064,788 525,363,538 525,363,538 (17,701,250) Chase Swiss Franc U.S. Dollar _____________ _____________ ___________ $3,778,229,320 $3,706,388,622 $(71,840,698) _____________ _____________ ___________ _____________ _____________ ___________
— 29 —
FMI International FundSCHEDULE OF FORWARD CURRENCY CONTRACTSJune 30, 2017 (Unaudited)
T F

Performance for Period Ended June 30, 2017
Average Annual Total Returns
3 1 3 5 10 Since InceptionFMI FUND / INDEX Months1 Year Year Year Year Inception1 Date
Large Cap –Investor Class 2.88% 17.25% 7.69% 13.28% 7.68% 8.97% 12-31-01S&P 500 3.09% 17.90% 9.61% 14.63% 7.18% 7.09% 12-31-01
Large Cap – Institutional Class 2.88% N/A N/A N/A N/A 16.51% 10-31-16S&P 500 3.09% 17.90% 9.61% 14.63% 7.18% 15.63% 10-31-16
Common Stock – Investor Class 2.22% 19.78% 5.70% 11.93% 8.16% 12.01% 12-18-81Russell 2000 2.46% 24.60% 7.36% 13.70% 6.92% 10.45% 12-18-81
Common Stock – Institutional Class 2.25% N/A N/A N/A N/A 17.42% 10-31-16Russell 2000 2.46% 24.60% 7.36% 13.70% 6.92% 19.97% 10-31-16
International – Investor Class 3.51% 16.58% 7.18% 11.91% N/A 10.21% 12-31-10MSCI EAFE Net (USD) 6.12% 20.27% 1.15% 8.69% 1.03% 4.99% 12-31-10MSCI EAFE Net (LOC) 2.71% 22.10% 7.02% 12.54% 2.02% 8.05% 12-31-10
International – Institutional Class 3.55% N/A N/A N/A N/A 11.80% 10-31-16MSCI EAFE Net (USD) 6.12% 20.27% 1.15% 8.69% 1.03% 15.36% 10-31-16MSCI EAFE Net (LOC) 2.71% 22.10% 7.02% 12.54% 2.02% 13.80% 10-31-16
1 Returns for periods less than one year are not annualized.
Performance data quoted represents past performance; past performance does not guarantee future results.Investment return and principal value of an investment will fluctuate so that an investor’s shares, when re-deemed, may be worth more or less than their original cost. Current performance of a Fund may be lower orhigher than the performance quoted. Performance data current to the most recent month end may be obtainedby visiting www.fmifunds.com or by calling 1-800-811-5311. The returns do not reflect the deduction of taxesthat a shareholder would pay on Fund distributions or the redemption of Fund shares.
Securities named in the Letters to Shareholders, but not listed in the Statements of Net Assets are not held inthe Funds as of the date of this disclosure. Portfolio holdings are subject to change without notice and are notintended as recommendations of individual securities.
This report is not authorized for use as an offer of sale or a solicitation of an offer to buy shares of the Fundunless accompanied or preceded by the Fund’s current prospectus.
As of the Funds’ Prospectus dated January 31, 2017 and supplemented on March 17, 2017, the FMI Large CapFund, FMI Common Stock Fund and FMI International Funds’ Investor Class annual operating expense ratios are:0.84%, 1.04% and 0.94%, respectively. The FMI Large Cap Fund, FMI Common Stock Fund and FMI InternationalFunds’ Institutional Class annual operating expense ratios are: 0.72%, 0.94%, and 0.80%, respectively.
Risks associated with investing in the Funds are as follows:
FMI Large Cap Fund: Stock Market Risk, Medium and Large Capitalization Companies Risks, Non-Diversification Risk (Non-Diversified funds are subject to higher volatility than funds that are investedmore broadly), Value Investing Risk, Foreign Securities Risk (fluctuation of currency, different financialstandards, and political instability) and Liquidity Risk.
FMI Common Stock Fund: Stock Market Risk, Medium and Small Capitalization Companies Risks(which includes the potential for greater volatility and less financial resources than Large-Cap Com-panies), Value Investing Risk, Foreign Securities Risk (fluctuation of currency, different financial stan-dards, and political instability) and Liquidity Risk.
— 30 —
FMI Funds, Inc.PERFORMANCE AND DISCLOSURE INFORMATION
T F

FMI International Fund: Stock Market Risk, Non-Diversification Risk (Non-Diversified funds are sub-ject to higher volatility than funds that are invested more broadly), Value Investing Risk, Foreign Se-curities Risk (fluctuation of currency, different financial standards, and political instability), GeographicConcentration Risk, Currency Hedging Risk, Large Capitalization Companies Risk and Liquidity Risk.
For details regarding these risks, please refer to the Funds’ Summary or Statutory Prospectuses dated January 31, 2017, each supplemented on March 17, 2017.
For more information about the FMI Funds, call 1-800-811-5311 for a free Prospectus or Summary Prospectus.Please read these Prospectuses carefully to consider the investment objectives, risks, charges and expenses,before investing or sending money. These Prospectuses contain this and more information about the FMI Funds.Please read the Prospectuses or Summary Prospectuses carefully before investing.
Please note that the FMI International Fund is closed to new investors, effective April 30, 2017.
The Standard and Poor’s 500 Index consists of 500 selected common stocks, most of which are listed on theNew York Stock Exchange. The Standard & Poor’s Ratings Group designates the stock to be included in theIndex on a statistical basis. A particular stock’s weighting in the Index is based on its relative total market value(i.e., its market price per share times the number of shares outstanding). Stocks may be added or deleted fromthe Index from time to time.
The Russell 1000 Index measures the performance of the 1,000 largest companies in the Russell 3000 Indexwhich comprises the 3,000 largest U.S. companies based on total market capitalization. The Russell 1000 ValueIndex includes equities that exhibit value characteristics and the Russell 1000 Growth Index includes equitiesthat exhibit growth characteristics.
The Russell 2000 Index measures the performance of the 2,000 smallest companies in the Russell 3000 Indexwhich comprises the 3,000 largest U.S. companies based on total market capitalization. The Russell 2000 ValueIndex includes equities that exhibit value characteristics and the Russell 2000 Growth Index includes equitiesthat exhibit growth characteristics.
The MSCI EAFE Index (Europe, Australasia, Far East) is a free float-adjusted market capitalization index thatis designed to measure the equity market performance of developed markets, excluding the U.S. and Canada.The MSCI EAFE Index consists of the following 21 developed market country indices: Australia, Austria, Bel-gium, Denmark, Finland, France, Germany, Hong Kong, Ireland, Israel, Italy, Japan, the Netherlands, NewZealand, Norway, Portugal, Singapore, Spain, Sweden, Switzerland and the United Kingdom. The MSCI EAFEIndex is unmanaged and investors cannot invest directly in the Index. Index results are inclusive of dividendsand net of foreign withholding taxes. The reported figures include reinvestment of dividends and capital gainsdistributions and do not reflect any fees or expenses.
The MSCI EAFE Index is calculated in local currency (LOC) as well as in U.S. Dollars (USD). The conceptof a LOC calculation excludes the impact of currency fluctuations. All currencies of listing are considered inthe Index calculation in LOC where current prices (t) and previous day prices (t-1) are converted into USDusing the same exchange rate (exchange rate t-1) in the numerator and denominator. As a consequence, the FXfactor drops out of the equation. The USD calculation includes exchange rates at t and t-1. Therefore, the LOCcalculation only represents the price appreciation or depreciation of the securities, whereas the USD calculationalso accounts for the performance of the currency (or currencies) relative to the USD.
The MSCI EAFE Value Index captures large and mid cap securities exhibiting overall value style characteristicsacross Developed Markets countries around the world, excluding the U.S. and Canada. The value investmentstyle characteristics for index construction are defined using three variables: book value to price, 12-month for-ward earnings to price and dividend yield.
The MSCI EAFE Growth Index captures large and mid cap securities exhibiting overall growth style charac-teristics across Developed Markets countries around the world, excluding the U.S. and Canada. The growth in-vestment style characteristics for index construction are defined using five variables: long-term forward EPS
— 31 —
FMI Funds, Inc.PERFORMANCE AND DISCLOSURE INFORMATION (Continued)
T F

growth rate, short-term forward EPS growth rate, current internal growth rate and long-term historical EPSgrowth trend and long-term historical sales per share growth trend.
The MSCI Emerging Markets Value Index captures large and mid cap securities exhibiting overall value stylecharacteristics across 24 Emerging Markets countries. The value investment style characteristics for index con-struction are defined using three variables: book value to price, 12-month forward earnings to price and dividendyield.
The MSCI Emerging Markets Growth Index captures large and mid cap securities exhibiting overall growthstyle characteristics across 24 Emerging Markets countries. The growth investment style characteristics forindex construction are defined using five variables: long-term forward EPS growth rate, short-term forwardEPS growth rate, current internal growth rate and long-term historical EPS growth trend and long-term historicalsales per share growth trend.
The MSCI World Value Index captures large and mid cap securities exhibiting overall value style characteristicsacross 23 Developed Markets countries. The value investment style characteristics for index construction aredefined using three variables: book value to price, 12-month forward earnings to price and dividend yield.
The MSCI World Growth Index captures large and mid cap securities exhibiting overall growth style charac-teristics across 23 Developed Markets countries. The growth investment style characteristics for index con-struction are defined using five variables: long-term forward EPS growth rate, short-term forward EPS growthrate, current internal growth rate and long-term historical EPS growth trend and long-term historical sales pershare growth trend.
MSCI EAFE is a service mark of MSCI Barra.
All indices are unmanaged. It is not possible to invest directly into an index.
GLOSSARY
12-Mo. Trailing GAAP EPS – Earnings per share over the last twelve months on a GAAP (Generally AcceptedAccounting Principles) basis.
GDP – Gross Domestic Product (GDP) is the monetary value of all finished goods and services produced withina country’s borders in a specific time period.
Price-to-earnings ratio – The price-earnings ratio (P/E Ratio) is the ratio for valuing a company that measuresits current share price relative to its per-share earnings.
Reference definitions found at Investopedia.com
Distributed by Rafferty Capital Markets, LLC, 1010 Franklin Avenue, Garden City, NY 11530
— 32 —
FMI Funds, Inc.PERFORMANCE AND DISCLOSURE INFORMATION (Continued)
T F

(This Page Intentionally Left Blank.)
T F

T F
FMI Large Cap Fund FMI Common Stock Fund FMI International Fund100 East Wisconsin Avenue, Suite 2200
Milwaukee, Wisconsin 53202www.fmifunds.com414-226-4555
BOARD OF DIRECTORS BARRY K. ALLEN GORDON H. GUNNLAUGSSON ROBERT C. ARZBAECHER TED D. KELLNER JOHN S. BRANDSER PAUL S. SHAIN LAWRENCE J. BURNETT ROBERT J. VENABLE PATRICK J. ENGLISH
INVESTMENT ADVISERFIDUCIARY MANAGEMENT, INC.100 East Wisconsin Avenue, Suite 2200
Milwaukee, Wisconsin 53202
ADMINISTRATOR, ACCOUNTANT, TRANSFERAGENT AND DIVIDEND DISBURSING AGENT
U.S. BANCORP FUND SERVICES, LLC615 East Michigan Street
Milwaukee, Wisconsin 53202800-811-5311 or 414-765-4124
CUSTODIAN INDEPENDENT REGISTERED U.S. BANK, N.A. PUBLIC ACCOUNTING FIRM Milwaukee, Wisconsin COHEN & COMPANY, LTD. Cleveland, Ohio DISTRIBUTOR RAFFERTY CAPITAL MARKETS, LLC LEGAL COUNSEL Garden City, New York FOLEY & LARDNER LLP Milwaukee, Wisconsin
FMI Funds, Inc.
1-800-811-5311
www.fmifunds.com