Embed Size (px)
Citation preview
1
Hanks you
March 8 to 14, 2020 (week 11)
Overall Summary
Influenza activity continues to be reported in all regions in Canada; however, almost all indicators of influenza activity continued to decrease compared to the previous week.
Influenza-like illness activity reported by sentinel practitioners and FluWatchers increased this week. Given the evolving Canadian situation with COVID-19, we will continue to monitor this trend in the coming weeks.
In week 11, two thirds of influenza detections were influenza A, and among those subtyped, A(H1N1) continues to be the dominant subtype circulating in Canada.
The highest cumulative hospitalization rates are among children under 5 years of age and adults 65 years of age and older. Hospitalizations among adults are predominantly due to influenza A, while those among children are due to a mix of influenza A and B.
Influenza/Influenza-like Illness (ILI) Activity (geographic spread)
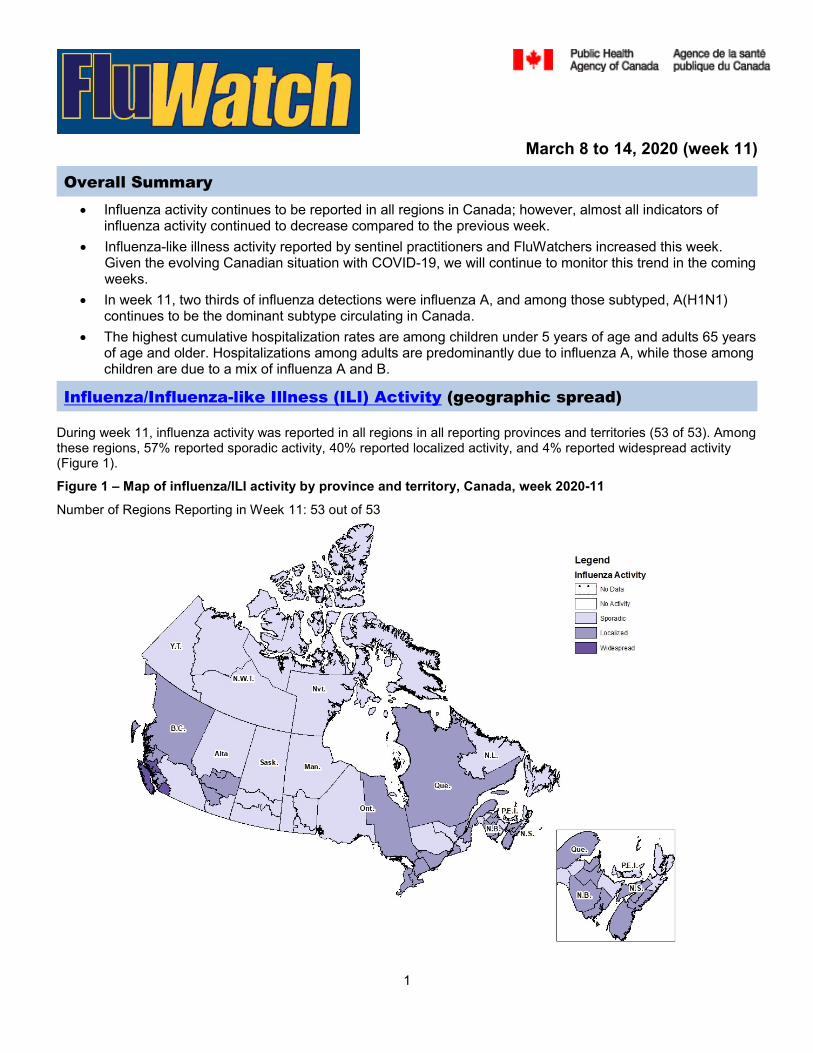
During week 11, influenza activity was reported in all regions in all reporting provinces and territories (53 of 53). Among these regions, 57% reported sporadic activity, 40% reported localized activity, and 4% reported widespread activity (Figure 1).
Figure 1 – Map of influenza/ILI activity by province and territory, Canada, week 2020-11
Number of Regions Reporting in Week 11: 53 out of 53
2
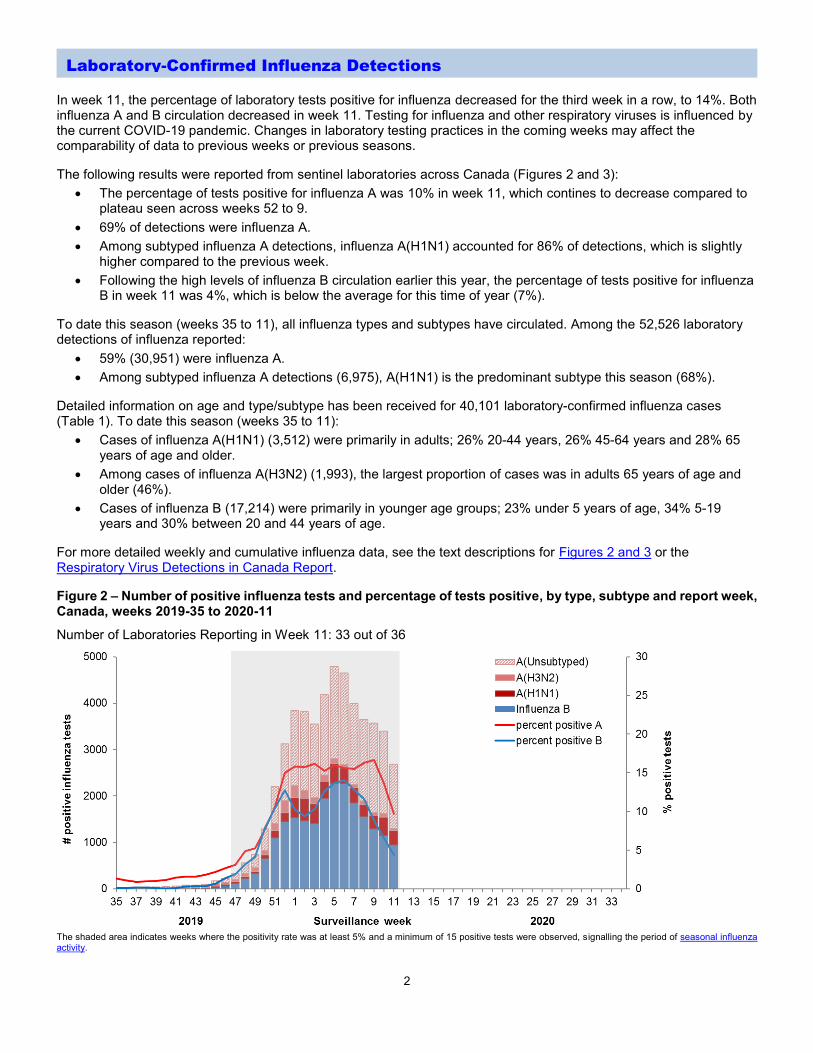
In week 11, the percentage of laboratory tests positive for influenza decreased for the third week in a row, to 14%. Both influenza A and B circulation decreased in week 11. Testing for influenza and other respiratory viruses is influenced by the current COVID-19 pandemic. Changes in laboratory testing practices in the coming weeks may affect the comparability of data to previous weeks or previous seasons.
The following results were reported from sentinel laboratories across Canada (Figures 2 and 3):
The percentage of tests positive for influenza A was 10% in week 11, which contines to decrease compared to plateau seen across weeks 52 to 9.
69% of detections were influenza A.
Among subtyped influenza A detections, influenza A(H1N1) accounted for 86% of detections, which is slightly higher compared to the previous week.
Following the high levels of influenza B circulation earlier this year, the percentage of tests positive for influenza B in week 11 was 4%, which is below the average for this time of year (7%).
To date this season (weeks 35 to 11), all influenza types and subtypes have circulated. Among the 52,526 laboratory detections of influenza reported:
59% (30,951) were influenza A.
Among subtyped influenza A detections (6,975), A(H1N1) is the predominant subtype this season (68%).
Detailed information on age and type/subtype has been received for 40,101 laboratory-confirmed influenza cases (Table 1). To date this season (weeks 35 to 11):
Cases of influenza A(H1N1) (3,512) were primarily in adults; 26% 20-44 years, 26% 45-64 years and 28% 65 years of age and older.
Among cases of influenza A(H3N2) (1,993), the largest proportion of cases was in adults 65 years of age and older (46%).
Cases of influenza B (17,214) were primarily in younger age groups; 23% under 5 years of age, 34% 5-19 years and 30% between 20 and 44 years of age.
For more detailed weekly and cumulative influenza data, see the text descriptions for Figures 2 and 3 or the Respiratory Virus Detections in Canada Report.
Figure 2 – Number of positive influenza tests and percentage of tests positive, by type, subtype and report week, Canada, weeks 2019-35 to 2020-11
Number of Laboratories Reporting in Week 11: 33 out of 36
The shaded area indicates weeks where the positivity rate was at least 5% and a minimum of 15 positive tests were observed, signalling the period of seasonal influenza activity.
Laboratory-Confirmed Influenza Detections
3
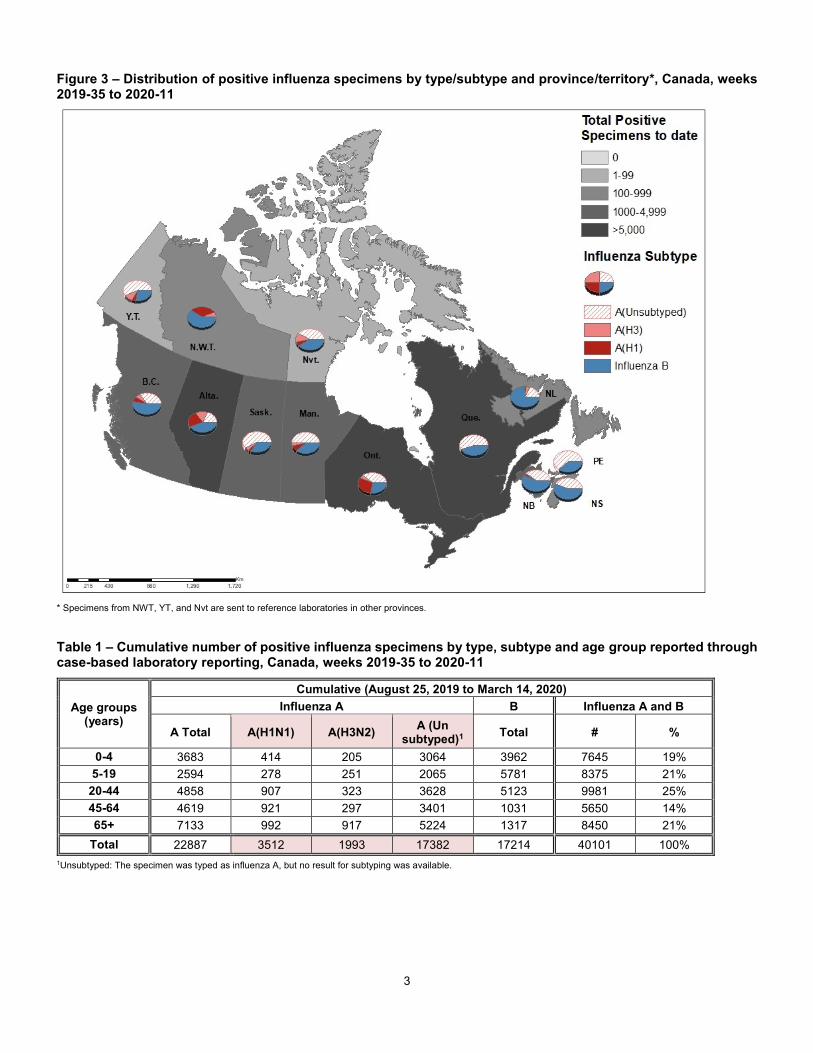
Figure 3 – Distribution of positive influenza specimens by type/subtype and province/territory*, Canada, weeks 2019-35 to 2020-11
* Specimens from NWT, YT, and Nvt are sent to reference laboratories in other provinces.
Table 1 – Cumulative number of positive influenza specimens by type, subtype and age group reported through case-based laboratory reporting, Canada, weeks 2019-35 to 2020-11
Age groups (years)
Cumulative (August 25, 2019 to March 14, 2020)
Influenza A B Influenza A and B
A Total A(H1N1) A(H3N2) A (Un
subtyped)1 Total # %
0-4 3683 414 205 3064 3962 7645 19%
5-19 2594 278 251 2065 5781 8375 21%
20-44 4858 907 323 3628 5123 9981 25%
45-64 4619 921 297 3401 1031 5650 14%
65+ 7133 992 917 5224 1317 8450 21%
Total 22887 3512 1993 17382 17214 40101 100%
1Unsubtyped: The specimen was typed as influenza A, but no result for subtyping was available.
4
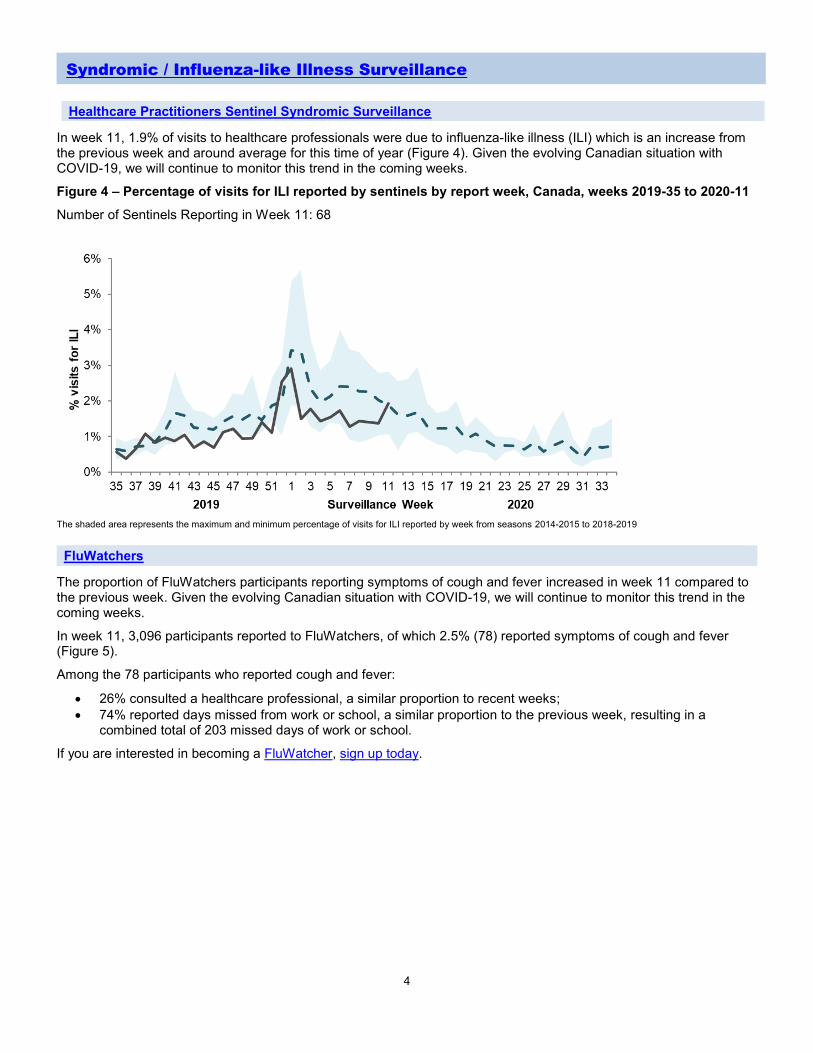
In week 11, 1.9% of visits to healthcare professionals were due to influenza-like illness (ILI) which is an increase from the previous week and around average for this time of year (Figure 4). Given the evolving Canadian situation with COVID-19, we will continue to monitor this trend in the coming weeks.
Figure 4 – Percentage of visits for ILI reported by sentinels by report week, Canada, weeks 2019-35 to 2020-11
Number of Sentinels Reporting in Week 11: 68
The shaded area represents the maximum and minimum percentage of visits for ILI reported by week from seasons 2014-2015 to 2018-2019
FluWatchers
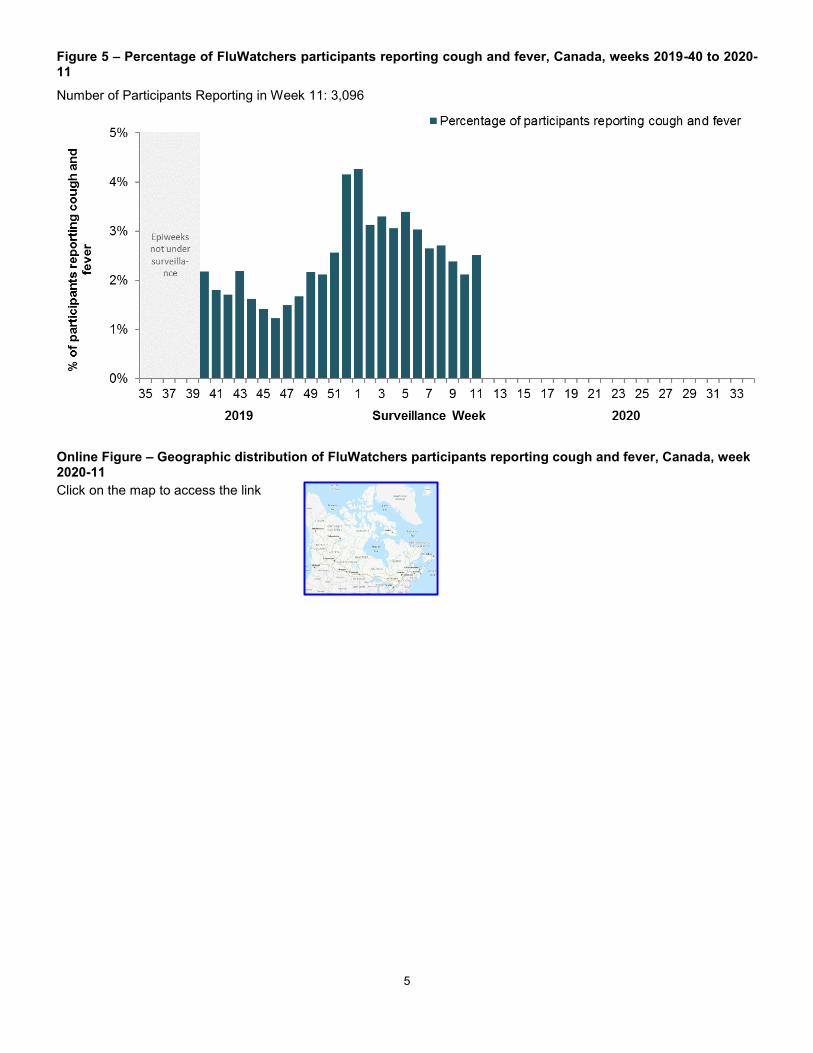
The proportion of FluWatchers participants reporting symptoms of cough and fever increased in week 11 compared to the previous week. Given the evolving Canadian situation with COVID-19, we will continue to monitor this trend in the coming weeks.
In week 11, 3,096 participants reported to FluWatchers, of which 2.5% (78) reported symptoms of cough and fever (Figure 5).
Among the 78 participants who reported cough and fever:
26% consulted a healthcare professional, a similar proportion to recent weeks;
74% reported days missed from work or school, a similar proportion to the previous week, resulting in a combined total of 203 missed days of work or school.
If you are interested in becoming a FluWatcher, sign up today.
Healthcare Practitioners Sentinel Syndromic Surveillance
Syndromic / Influenza-like Illness Surveillance
5
Figure 5 – Percentage of FluWatchers participants reporting cough and fever, Canada, weeks 2019-40 to 2020-11
Number of Participants Reporting in Week 11: 3,096
Online Figure – Geographic distribution of FluWatchers participants reporting cough and fever, Canada, week 2020-11
Click on the map to access the link
6
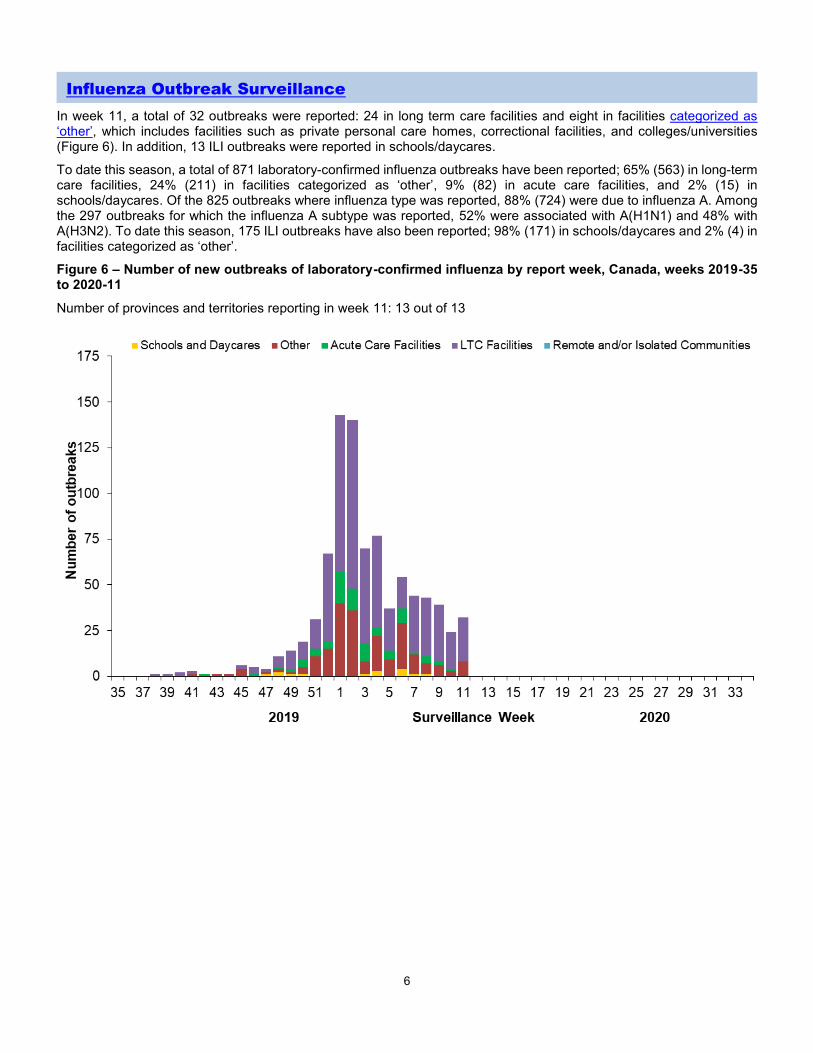
In week 11, a total of 32 outbreaks were reported: 24 in long term care facilities and eight in facilities categorized as ‘other’, which includes facilities such as private personal care homes, correctional facilities, and colleges/universities (Figure 6). In addition, 13 ILI outbreaks were reported in schools/daycares.
To date this season, a total of 871 laboratory-confirmed influenza outbreaks have been reported; 65% (563) in long-term care facilities, 24% (211) in facilities categorized as ‘other’, 9% (82) in acute care facilities, and 2% (15) in schools/daycares. Of the 825 outbreaks where influenza type was reported, 88% (724) were due to influenza A. Among the 297 outbreaks for which the influenza A subtype was reported, 52% were associated with A(H1N1) and 48% with A(H3N2). To date this season, 175 ILI outbreaks have also been reported; 98% (171) in schools/daycares and 2% (4) in facilities categorized as ‘other’.
Figure 6 – Number of new outbreaks of laboratory-confirmed influenza by report week, Canada, weeks 2019-35 to 2020-11
Number of provinces and territories reporting in week 11: 13 out of 13
Influenza Outbreak Surveillance
7
Provincial/Territorial Influenza Hospitalizations and Deaths
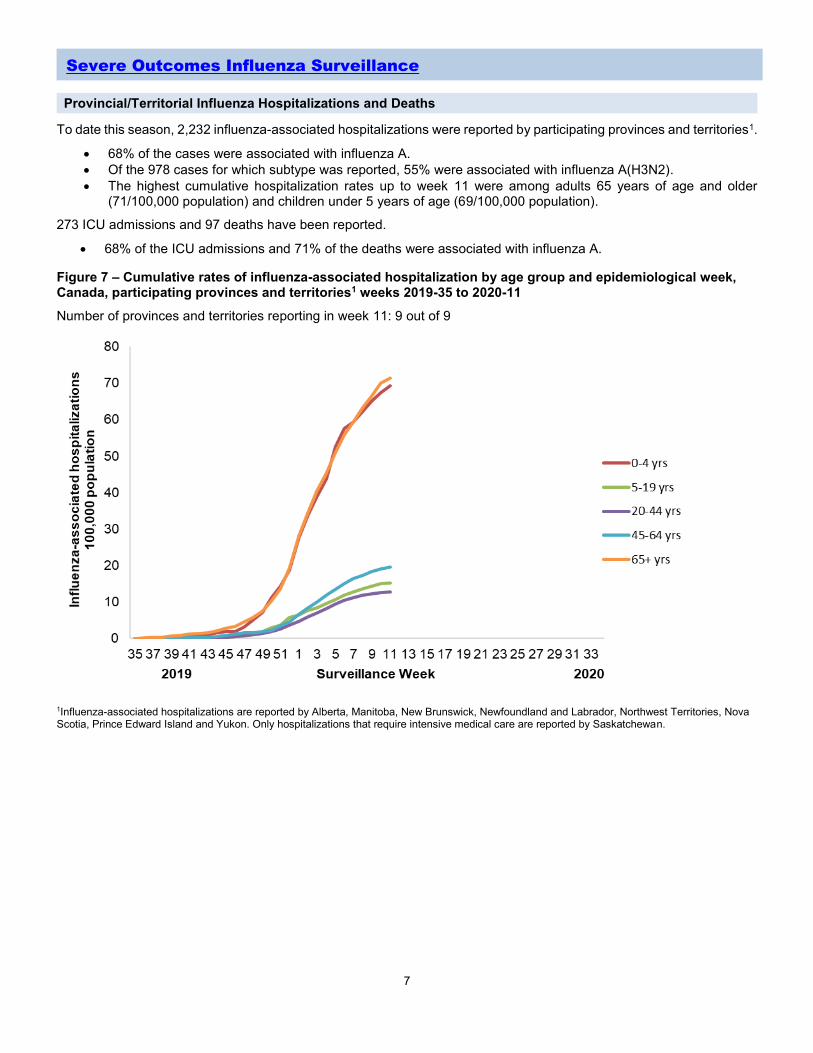
To date this season, 2,232 influenza-associated hospitalizations were reported by participating provinces and territories1.
68% of the cases were associated with influenza A.
Of the 978 cases for which subtype was reported, 55% were associated with influenza A(H3N2).
The highest cumulative hospitalization rates up to week 11 were among adults 65 years of age and older (71/100,000 population) and children under 5 years of age (69/100,000 population).
273 ICU admissions and 97 deaths have been reported.
68% of the ICU admissions and 71% of the deaths were associated with influenza A.
Figure 7 – Cumulative rates of influenza-associated hospitalization by age group and epidemiological week, Canada, participating provinces and territories1 weeks 2019-35 to 2020-11
Number of provinces and territories reporting in week 11: 9 out of 9
1Influenza-associated hospitalizations are reported by Alberta, Manitoba, New Brunswick, Newfoundland and Labrador, Northwest Territories, Nova Scotia, Prince Edward Island and Yukon. Only hospitalizations that require intensive medical care are reported by Saskatchewan.
Severe Outcomes Influenza Surveillance
8
Pediatric Influenza Hospitalizations and Deaths
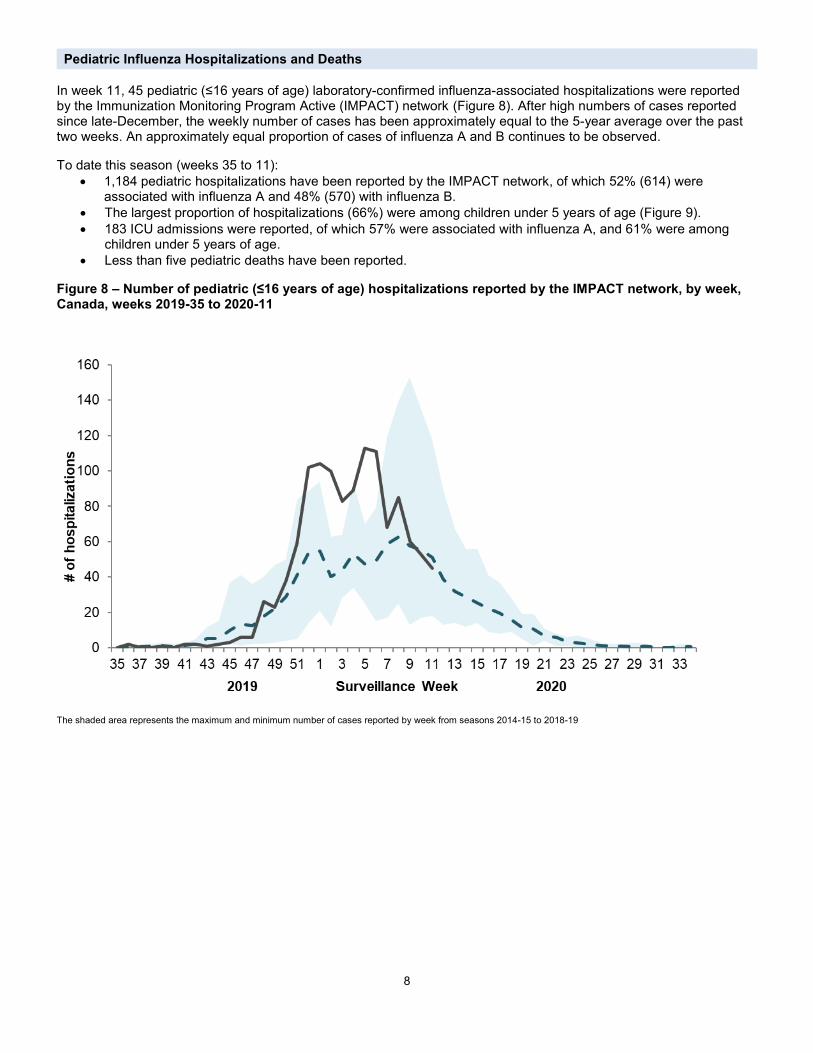
In week 11, 45 pediatric (≤16 years of age) laboratory-confirmed influenza-associated hospitalizations were reported by the Immunization Monitoring Program Active (IMPACT) network (Figure 8). After high numbers of cases reported since late-December, the weekly number of cases has been approximately equal to the 5-year average over the past two weeks. An approximately equal proportion of cases of influenza A and B continues to be observed.
To date this season (weeks 35 to 11):
1,184 pediatric hospitalizations have been reported by the IMPACT network, of which 52% (614) were associated with influenza A and 48% (570) with influenza B.
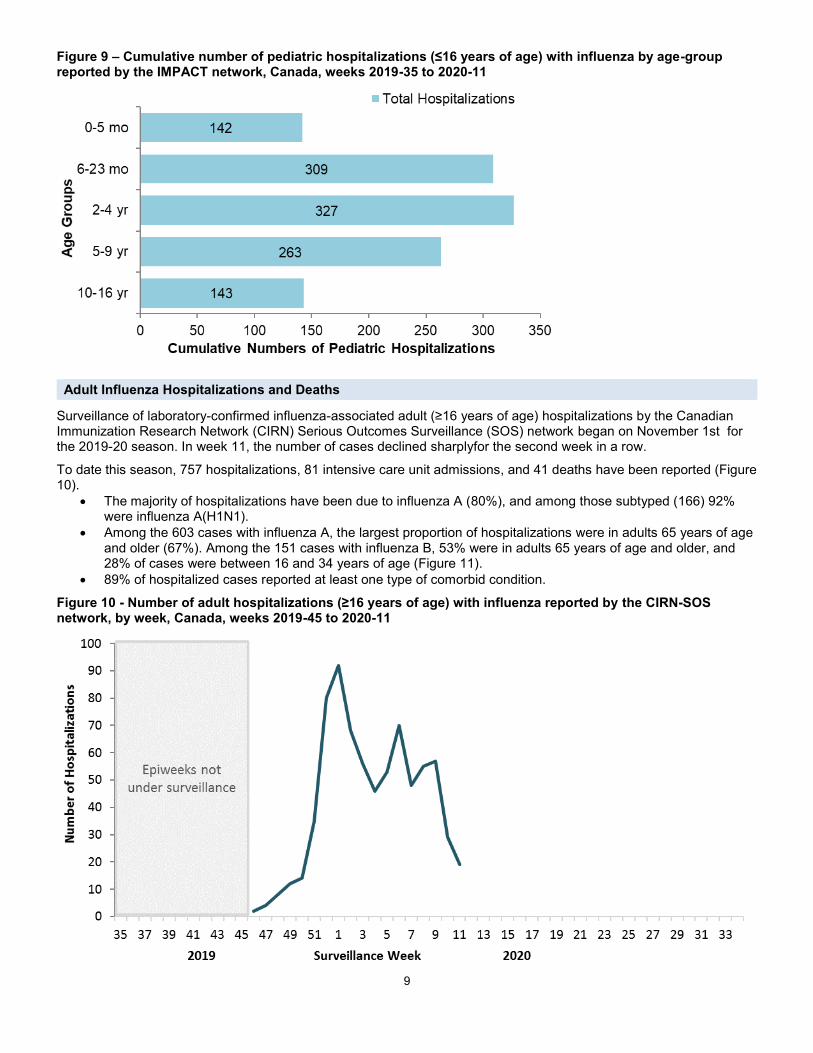
The largest proportion of hospitalizations (66%) were among children under 5 years of age (Figure 9).
183 ICU admissions were reported, of which 57% were associated with influenza A, and 61% were among children under 5 years of age.
Less than five pediatric deaths have been reported.
Figure 8 – Number of pediatric (≤16 years of age) hospitalizations reported by the IMPACT network, by week, Canada, weeks 2019-35 to 2020-11
The shaded area represents the maximum and minimum number of cases reported by week from seasons 2014-15 to 2018-19
9
Figure 9 – Cumulative number of pediatric hospitalizations (≤16 years of age) with influenza by age-group reported by the IMPACT network, Canada, weeks 2019-35 to 2020-11
Adult Influenza Hospitalizations and Deaths
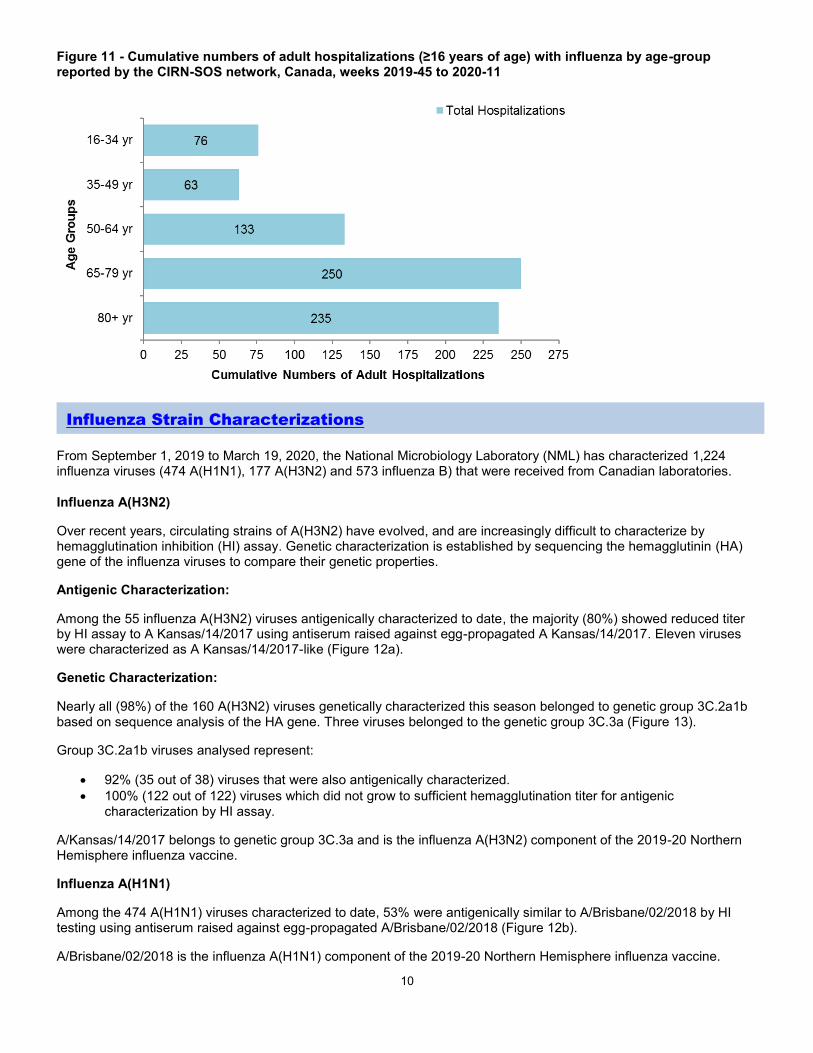
Surveillance of laboratory-confirmed influenza-associated adult (≥16 years of age) hospitalizations by the Canadian Immunization Research Network (CIRN) Serious Outcomes Surveillance (SOS) network began on November 1st for the 2019-20 season. In week 11, the number of cases declined sharplyfor the second week in a row.
To date this season, 757 hospitalizations, 81 intensive care unit admissions, and 41 deaths have been reported (Figure 10).
The majority of hospitalizations have been due to influenza A (80%), and among those subtyped (166) 92% were influenza A(H1N1).
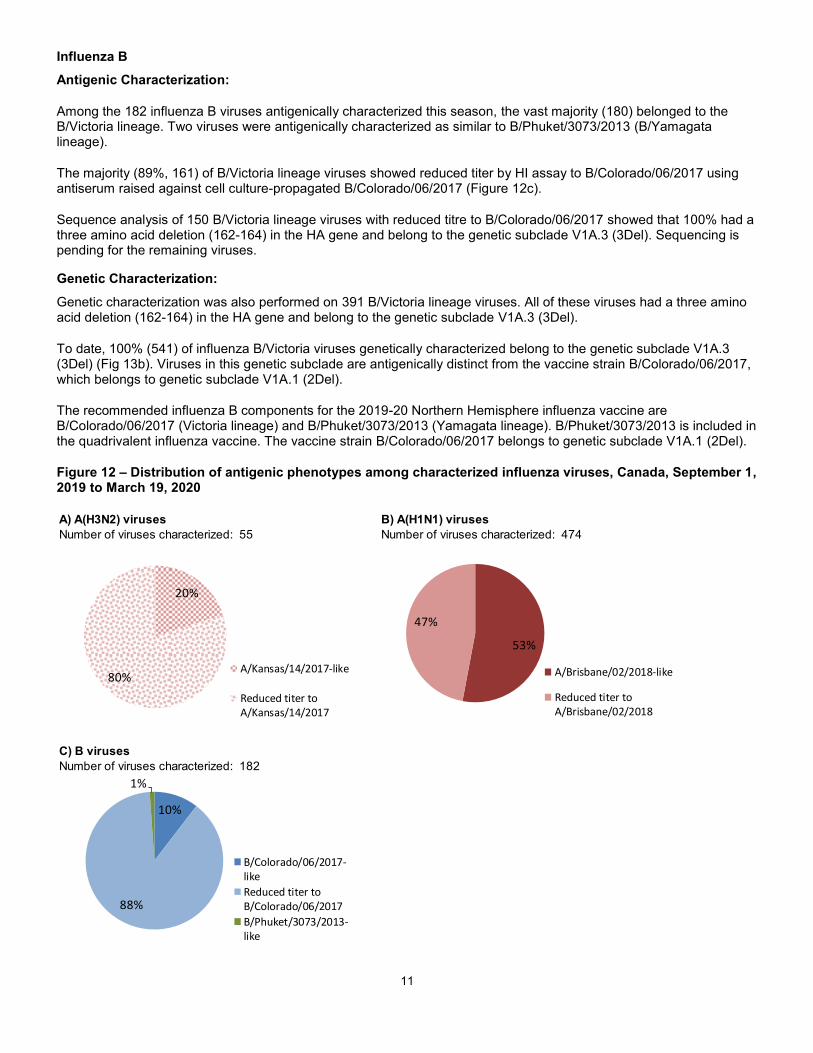
Among the 603 cases with influenza A, the largest proportion of hospitalizations were in adults 65 years of age and older (67%). Among the 151 cases with influenza B, 53% were in adults 65 years of age and older, and 28% of cases were between 16 and 34 years of age (Figure 11).
89% of hospitalized cases reported at least one type of comorbid condition.
Figure 10 - Number of adult hospitalizations (≥16 years of age) with influenza reported by the CIRN-SOS network, by week, Canada, weeks 2019-45 to 2020-11
10
Figure 11 - Cumulative numbers of adult hospitalizations (≥16 years of age) with influenza by age-group reported by the CIRN-SOS network, Canada, weeks 2019-45 to 2020-11
From September 1, 2019 to March 19, 2020, the National Microbiology Laboratory (NML) has characterized 1,224 influenza viruses (474 A(H1N1), 177 A(H3N2) and 573 influenza B) that were received from Canadian laboratories.
Influenza A(H3N2)
Over recent years, circulating strains of A(H3N2) have evolved, and are increasingly difficult to characterize by hemagglutination inhibition (HI) assay. Genetic characterization is established by sequencing the hemagglutinin (HA) gene of the influenza viruses to compare their genetic properties.
Antigenic Characterization:
Among the 55 influenza A(H3N2) viruses antigenically characterized to date, the majority (80%) showed reduced titer by HI assay to A Kansas/14/2017 using antiserum raised against egg-propagated A Kansas/14/2017. Eleven viruses were characterized as A Kansas/14/2017-like (Figure 12a).
Genetic Characterization:
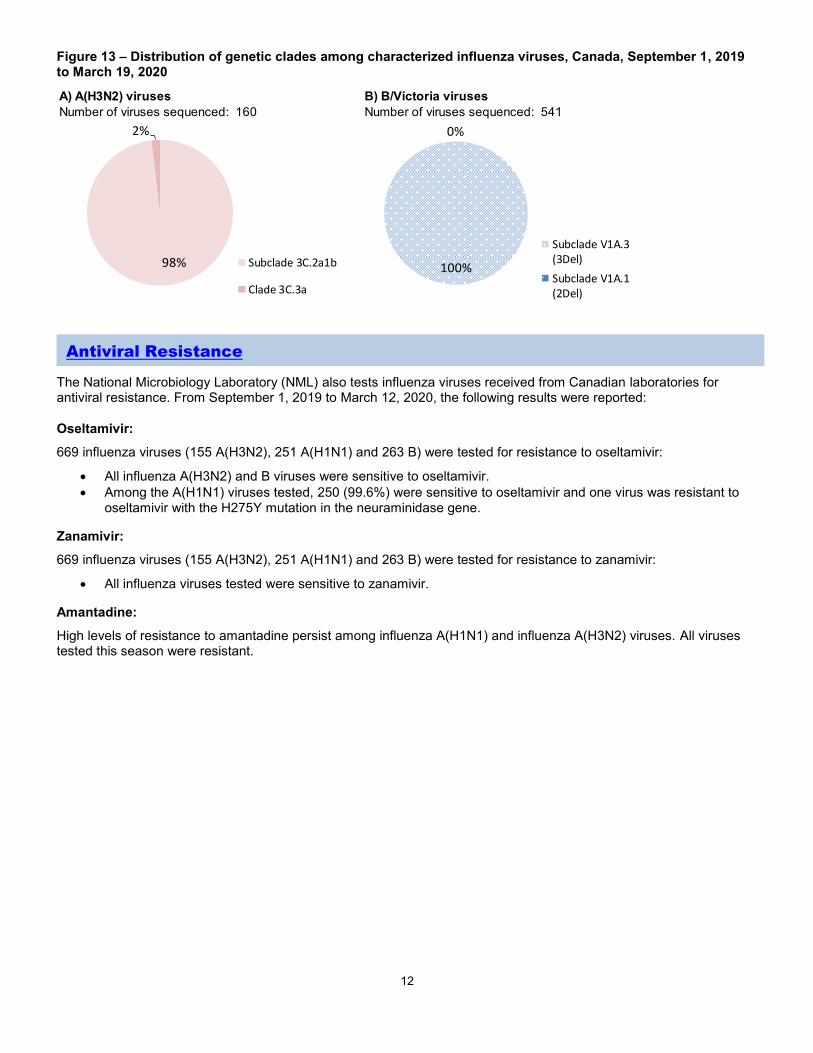
Nearly all (98%) of the 160 A(H3N2) viruses genetically characterized this season belonged to genetic group 3C.2a1b based on sequence analysis of the HA gene. Three viruses belonged to the genetic group 3C.3a (Figure 13).
Group 3C.2a1b viruses analysed represent:
92% (35 out of 38) viruses that were also antigenically characterized.
100% (122 out of 122) viruses which did not grow to sufficient hemagglutination titer for antigenic characterization by HI assay.
A/Kansas/14/2017 belongs to genetic group 3C.3a and is the influenza A(H3N2) component of the 2019-20 Northern Hemisphere influenza vaccine.
Influenza A(H1N1)
Among the 474 A(H1N1) viruses characterized to date, 53% were antigenically similar to A/Brisbane/02/2018 by HI testing using antiserum raised against egg-propagated A/Brisbane/02/2018 (Figure 12b).
A/Brisbane/02/2018 is the influenza A(H1N1) component of the 2019-20 Northern Hemisphere influenza vaccine.
Influenza Strain Characterizations
11
Influenza B
Antigenic Characterization:
Among the 182 influenza B viruses antigenically characterized this season, the vast majority (180) belonged to the B/Victoria lineage. Two viruses were antigenically characterized as similar to B/Phuket/3073/2013 (B/Yamagata lineage).
The majority (89%, 161) of B/Victoria lineage viruses showed reduced titer by HI assay to B/Colorado/06/2017 using antiserum raised against cell culture-propagated B/Colorado/06/2017 (Figure 12c).
Sequence analysis of 150 B/Victoria lineage viruses with reduced titre to B/Colorado/06/2017 showed that 100% had a three amino acid deletion (162-164) in the HA gene and belong to the genetic subclade V1A.3 (3Del). Sequencing is pending for the remaining viruses.
Genetic Characterization:
Genetic characterization was also performed on 391 B/Victoria lineage viruses. All of these viruses had a three amino acid deletion (162-164) in the HA gene and belong to the genetic subclade V1A.3 (3Del).
To date, 100% (541) of influenza B/Victoria viruses genetically characterized belong to the genetic subclade V1A.3 (3Del) (Fig 13b). Viruses in this genetic subclade are antigenically distinct from the vaccine strain B/Colorado/06/2017, which belongs to genetic subclade V1A.1 (2Del).
The recommended influenza B components for the 2019-20 Northern Hemisphere influenza vaccine are B/Colorado/06/2017 (Victoria lineage) and B/Phuket/3073/2013 (Yamagata lineage). B/Phuket/3073/2013 is included in the quadrivalent influenza vaccine. The vaccine strain B/Colorado/06/2017 belongs to genetic subclade V1A.1 (2Del).
Figure 12 – Distribution of antigenic phenotypes among characterized influenza viruses, Canada, September 1, 2019 to March 19, 2020
A) A(H3N2) viruses B) A(H1N1) viruses
Number of viruses characterized: 55 Number of viruses characterized: 474
C) B viruses
Number of viruses characterized: 182
53%
47%
A/Brisbane/02/2018-like
Reduced titer toA/Brisbane/02/2018
10%
88%
1%
B/Colorado/06/2017-like
Reduced titer toB/Colorado/06/2017
B/Phuket/3073/2013-like
20%
80%A/Kansas/14/2017-like
Reduced titer toA/Kansas/14/2017
12
Figure 13 – Distribution of genetic clades among characterized influenza viruses, Canada, September 1, 2019 to March 19, 2020
The National Microbiology Laboratory (NML) also tests influenza viruses received from Canadian laboratories for antiviral resistance. From September 1, 2019 to March 12, 2020, the following results were reported:
Oseltamivir:
669 influenza viruses (155 A(H3N2), 251 A(H1N1) and 263 B) were tested for resistance to oseltamivir:
All influenza A(H3N2) and B viruses were sensitive to oseltamivir.
Among the A(H1N1) viruses tested, 250 (99.6%) were sensitive to oseltamivir and one virus was resistant to oseltamivir with the H275Y mutation in the neuraminidase gene.
Zanamivir:
669 influenza viruses (155 A(H3N2), 251 A(H1N1) and 263 B) were tested for resistance to zanamivir:
All influenza viruses tested were sensitive to zanamivir.
Amantadine:
High levels of resistance to amantadine persist among influenza A(H1N1) and influenza A(H3N2) viruses. All viruses tested this season were resistant.
A) A(H3N2) viruses B) B/Victoria viruses
Number of viruses sequenced: 160 Number of viruses sequenced: 541
98%
2%
Subclade 3C.2a1b
Clade 3C.3a
100%
0%
Subclade V1A.3(3Del)
Subclade V1A.1(2Del)
Antiviral Resistance
13
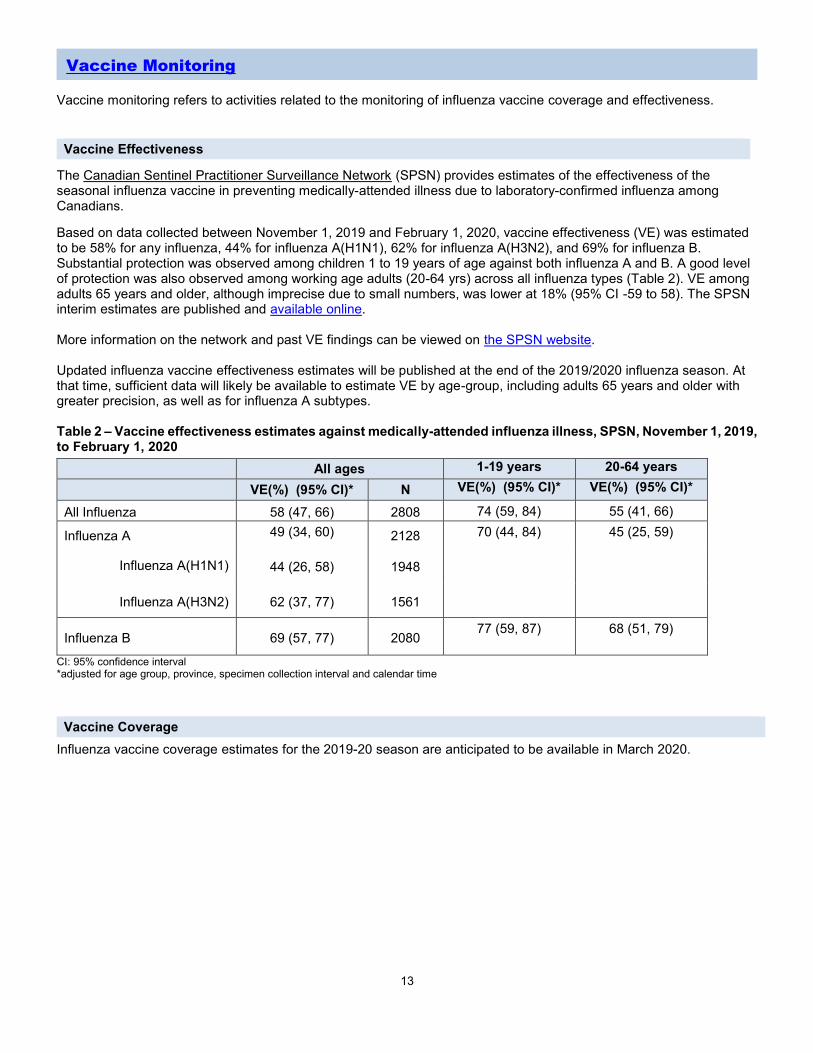
Vaccine monitoring refers to activities related to the monitoring of influenza vaccine coverage and effectiveness.
Vaccine Effectiveness
The Canadian Sentinel Practitioner Surveillance Network (SPSN) provides estimates of the effectiveness of the seasonal influenza vaccine in preventing medically-attended illness due to laboratory-confirmed influenza among Canadians.
Based on data collected between November 1, 2019 and February 1, 2020, vaccine effectiveness (VE) was estimated to be 58% for any influenza, 44% for influenza A(H1N1), 62% for influenza A(H3N2), and 69% for influenza B. Substantial protection was observed among children 1 to 19 years of age against both influenza A and B. A good level of protection was also observed among working age adults (20-64 yrs) across all influenza types (Table 2). VE among adults 65 years and older, although imprecise due to small numbers, was lower at 18% (95% CI -59 to 58). The SPSN interim estimates are published and available online. More information on the network and past VE findings can be viewed on the SPSN website. Updated influenza vaccine effectiveness estimates will be published at the end of the 2019/2020 influenza season. At that time, sufficient data will likely be available to estimate VE by age-group, including adults 65 years and older with greater precision, as well as for influenza A subtypes. Table 2 – Vaccine effectiveness estimates against medically-attended influenza illness, SPSN, November 1, 2019, to February 1, 2020
All ages 1-19 years 20-64 years
VE(%) (95% CI)* N VE(%) (95% CI)* VE(%) (95% CI)*
All Influenza 58 (47, 66) 2808 74 (59, 84) 55 (41, 66)
Influenza A 49 (34, 60) 2128 70 (44, 84) 45 (25, 59)
Influenza A(H1N1) 44 (26, 58) 1948
Influenza A(H3N2) 62 (37, 77) 1561
Influenza B 69 (57, 77) 2080 77 (59, 87) 68 (51, 79)
CI: 95% confidence interval *adjusted for age group, province, specimen collection interval and calendar time
Vaccine Coverage
Influenza vaccine coverage estimates for the 2019-20 season are anticipated to be available in March 2020.
Vaccine Monitoring
14
- British Columbia – Influenza Surveillance; Vaccine
Effectiveness Monitoring - Alberta – Respiratory Virus Surveillance - Saskatchewan – Influenza Reports - Manitoba – Seasonal Influenza Reports - Ontario – Ontario Respiratory Pathogen Bulletin - Québec – Système de surveillance de la
grippe (available in French only) - New Brunswick – Influenza Surveillance Reports - Prince Edward Island – Influenza Summary - Nova Scotia – Respiratory Watch Report - Newfoundland and Labrador – Surveillance and
Disease Reports - Yukon – Information on Pandemic, Influenza,
Seasonal Flu, Avian Flu and H1N1 - Northwest Territories – Influenza/ Flu Information - Nunavut – Influenza Information
- World Health Organization – FluNet (Global Influenza Surveillance Network)
- Pan American Health Organization – Influenza situation report
- U.S. Centers for Disease Prevention & Control (CDC) - Weekly Influenza Summary Update
- ECDC – Surveillance reports and disease data on seasonal influenza
- United Kingdom – Weekly Influenza Activity Reports
- Hong Kong Centre for Health Protection - Flu Express
- Australia – Influenza Surveillance Report and Activity Updates
- New Zealand – Influenza Weekly Update
The data in the FluWatch report represent surveillance data available at the time of writing. All data are preliminary and
may change as more reports are received.
To learn more about the FluWatch program, see the Overview of influenza monitoring in Canada page.
For more information on the flu, see our Flu (influenza) web page. We would like to thank all the Fluwatch surveillance partners participating in this year's influenza surveillance program.
This report is available on the Government of Canada Influenza webpage.
Ce rapport est disponible dans les deux langues officielles.
Provincial and International Surveillance Links
Notes