Embed Size (px)
Citation preview

123456789
101112131415161718192021222324252627282930313233343536373839404142434445464748495051525354555657
z Energy Technology & Environmental Science
Flute-like Fe2O3 Nanorods with Modulating Porosity forHigh Performance Anode Materials in Lithium Ion BatteriesHuanqing Liu, Jiajia Zou, Yanhua Ding, Tuo Xin, Bing Liu,* and Yiqian Wang*[a]
Flute-like Fe2O3 nanorods with tunable porosity are obtainedby facile hydrothermal process and subsequent calcination. Themorphology, porosity and structural stability of Fe2O3 nanorodsare effectively controlled by a two-step strategy at nano/micrometer scale. The introduction of F ions promotes theformation of nanorod-like iron hydroxide precursors, which areannealed at 400, 500 and 600 °C to obtain Fe2O3. The pore sizeincreases with the annealing temperature. When tested asanode material of lithium ion batteries (LIBs), the porous Fe2O3
nanorods obtained by annealing at 500 °C exhibit better cyclingstability and rate capability than those obtained at 400 and 600
°C. Most impressively, it delivers a capacity of 707.4 and687.7 mAhg@1 at 1 and 2 A g@1 after 200 cycles, respectively.Compared to the other two samples, the Fe2O3 nanorods withoptimized pore distribution exhibit robust porous framework,which contributes to the structural and electrochemicalstability of electrode. The porous framework can effectivelyalleviate the severe volume expansion/contraction and avoidpulverization of active materials, resulting in outstandingreversibility and rate capability. This work will benefit thedesign of novel materials for LIBs.
Introduction
Driven by the demand of new energy vehicles and stationarystorage systems, high-performance batteries have attractedincreasing attention.[1–4] Lithium ion batteries (LIBs) havebecome competitive candidate of most electric vehicle compa-nies, including Tesla, Toyota, BYD, etc., due to their high energydensity, high working voltage, long lifespan and environmentalgeniality.[5,6] However, current commercial graphite-basedanode materials (372 mAhg@1) are far from satisfying the actualdemand for high energy density. The past decades havewitnessed much progress toward advanced electrode materials,especially in transition metal oxide materials.[7,8] Among thetransition metal oxides, hematite nanomaterials have beenconsidered to be promising anode materials because of theirhigh theoretical capacity (arising from conversion reaction withlithium), low cost, natural abundance and environmentalfriendliness. Despite these distinct advantages, Fe2O3 electrodealways suffers from poor cycle ability caused by the dramaticvolume changes during charge/discharge processes, whichhinders its application in LIBs.[9–11]
To overcome the intrinsic disadvantages of Fe2O3, intensiveefforts have been devoted to the fabrication of novel micro/nano-structures and synthesis of various nanocomposites. Inparticular, the fabrication of porous structural electrodes hasproven to be a suitable strategy for LIBs.[12–26] Recently, many
studies have reported the synthesis of Fe2O3 with hierarchicalporosity and unique microstructure, such as hollow spheresand cubes,[14,15] Fe2O3@N@C hollow nanoparticles,[16] hollownanobarrels α-Fe2O3/rGO,
[17] 3DG/Fe2O3 aerogel,[18] 3D hierarch-
ical porous α-Fe2O3 nanosheets,[19] and porous Fe2O3@C rods.[20]
Sun et al. reported that porous Fe2O3 nanotubes could deliver acharge capacity of 951.6 mA h g@1, which is much higher thanthat of Fe2O3 nanoparticles.[21] The porous nanostructureprovides a larger surface area than that of non-porous systems.High surface area ensures effective contact between electrolyteand electrode surface, and promotes charge transfer across theelectrode-electrolyte interface.[22–24] In addition, vacancies inporous nanostructure buffer the volume changes associatedwith electrochemical reactions, thus ensuring the structuralstability in the cycling process.[25–26] Therefore, the introductionof a large number of pores into the electrode material is animportant factor in determining the superior rate capabilityand long cycle stability of the battery. To fabricate optimizedporous Fe2O3 anode by modulating porosity represents apromising opportunity towards high-performance LIBs.
Herein, three flute-like porous Fe2O3 samples were obtainedby annealing the precursor at 400, 500 and 600 °C. As theannealing temperature increases, the pore size increases. Theporous Fe2O3 nanorods with appropriate size distribution showbetter cycle stability and rate capability, compared to thesamples obtained at 400 and 600 °C. The improved lithiumstorage performance can be attributed to stable structure ofthe materials and the appropriate void ratio. On one hand, therobust porous framework contributes to the structural stabilityof electrode during electrochemical cycling. On the other hand,the Fe2O3 nanorods possess large pore volumes and surfaceareas, which provides sufficient space to accommodate volumechange and promote ion transport.
[a] H. Liu, J. Zou, Y. Ding, T. Xin, Dr. B. Liu, Prof. Y. WangCollege of Physics and State Key Laboratory, Qingdao University, No. 308Ningxia Road, Qingdao, 266071, ChinaE-mail: [email protected]
Supporting information for this article is available on the WWW underhttps://doi.org/10.1002/slct.201900584
Full PapersDOI: 10.1002/slct.201900584
3681ChemistrySelect 2019, 4, 3681–3689 © 2019 Wiley-VCH Verlag GmbH & Co. KGaA, Weinheim
Wiley VCH Montag, 01.04.20191913 / 133211 [S. 3681/3689] 1

123456789
101112131415161718192021222324252627282930313233343536373839404142434445464748495051525354555657
Results and Discussion
The Fe2O3 nanorods with tunable porosity were prepared bydirect calcination of the precursors in air at different temper-atures (see Supplementary Information for more experimentaldetails). The phase of the precursors was identified asorthogonal α-FeOOH by X-ray powder diffraction (XRD) (Fig-ure 1a).[27] The morphology of the as-prepared precursor wascharacterized by scanning electron microscopy (SEM) andtransmission electron microscopy (TEM). Figure 1b shows theSEM image of the sample, from which it can be seen that theprecursors possess a rod-like shape with widths of 150–250 nmand lengths of 1.2-1.5 μm. The elemental mapping (Figure 1c)confirms the uniform distribution of Fe and O elements in thesample. The F and C elements are also found, which might beintroduced by the initial agents. Furthermore, the X-ray photo-electron spectroscopy (XPS) spectrum of the precursor alsoconfirms these features (Figure S3).[28,29] The TEM images (Fig-ure 1d and e) also show distinct rod-like structure. The high-resolution TEM (HRTEM) image in Figure 1f is taken from theregion enclosed by a blue rectangle, which reveals that thegrowth direction of the precursor is along [001]. Inset inFigure 1f is the corresponding selected-area electron diffraction(SAED) pattern, which indicates that the precursor is α-FeOOH.Interestingly, in the same reaction system, cubic Fe2O3 could bedirectly synthesized without adding of NH4F, which wasconfirmed by XRD and SEM (Figure S1 and S2). Under hydro-
thermal condition, Fe(OH)3 colloid was firstly produced byhydrolysis of FeIII. Without the addition of F@, the Fe2O3
nanocrystal was synthesized through the dehydration of Fe(OH)3. The introduction of F@can enhance the structural stabilityof FeOOH, which contributes to the transformation from Fe(OH)3 to FeOOH. In addition, the existence of F@ increases thepolarity of the solution, which is conducive for FeOOH nano-crystals to grow along one-dimensional direction and finallybecome rod-like FeOOH. Therefore, the introduction of F@
changes the phase of the resultant products and the morphol-ogy of nanostructures.
Three samples obtained by annealing at 400, 500 and 600°C were referred to as Fe2O3-400, Fe2O3-500 and Fe2O3-600,respectively. Figure 2 shows the XRD patterns obtained fromthe three samples, where all the diffraction peaks can beindexed to rhombohedral phase Fe2O3 (JCPDS No.: 87–1166).[30]
No other peaks were found, indicating that the as-synthesizediron hydroxide was completely converted to Fe2O3 afterannealing in air at 400 °C. In addition, the intense and sharpdiffraction peaks suggest that the crystallinity increases withannealing temperature. Based on the thermogravimetric analy-sis (TGA) (Figure S4), iron hydroxide can be converted to Fe2O3
at about 400 °C and the mass remains unchanged after 500 °C.The chemical composition of Fe2O3-500 was determined by
XPS. Figure 3a shows distinct Fe, O and C element peaks, andweak F element peak. The small amount of residual F@ mightresult from the electrostatic interaction between F@ and Fe3+.
Figure 1. (a-c) XRD pattern, SEM image and element mapping of precursors. (d-e) typical TEM images of precursors. (f) HRTEM image taken from (e). Inset in (f)is the corresponding SAED pattern.
Full Papers
3682ChemistrySelect 2019, 4, 3681–3689 © 2019 Wiley-VCH Verlag GmbH & Co. KGaA, Weinheim
Wiley VCH Montag, 01.04.20191913 / 133211 [S. 3682/3689] 1

123456789
101112131415161718192021222324252627282930313233343536373839404142434445464748495051525354555657
The peaks at 710.9 and 724.6 eV in the Fe 2p spectrum belongto Fe 2p3/2 and Fe 2p1/2, respectively.
[31] Besides, satellite peaksare also observed at side of the main peaks, which confirms the
existence of Fe3+.[32] Figure 3c displays the specific spectrum ofO 1s. The binding energy peaks centered at 529.9 and 531.7 eVcan be assigned to O2@ binding and C@O binding.[33] In thespectrum of C 1s, the peak at 284.8 eV corresponds to sp2 bond(C@C) of the carbon, suggesting the carbonization of residues.These results further confirm the existence of α-Fe2O3.
The morphology and structure of Fe2O3-500 sample wereexamined by SEM and TEM. It can be seen from SEM image(Figure 4a) that Fe2O3-500 shows flute-like nanorod shape withdiameter of 100–250 nm. The low-magnification TEM image ofthe product (Figure 4b) clearly shows the porous structure anda large number of mesopores were observed in all visiblenanorods. The enlarged TEM and HRTEM images indicate theexistence of cavity and porous wall (Figure 4c and d). Thelattice spacings of 2.87 Å corresponds to the (20�20) latticeplanes of Fe2O3, suggesting that the long axis direction of thenanorod is along [10�10].[34]
The corresponding SAED pattern reveals the single-crystal-line nature of α-Fe2O3, which is highly consistent with the XRDresults. The formation of mesopores can be attributed, on theone hand, to the dehydration and recrystallization duringphase transformation, and on the other hand, to the loss oflarge amounts of organic groups in the FeOOH precursor
Figure 2. XRD patterns of annealed product at different temperatures.
Figure 3. XPS spectra for the Fe2O3-500. (a) full scan; (b) Fe 2p; (c) O 1s; (d) C 1s.
Full Papers
3683ChemistrySelect 2019, 4, 3681–3689 © 2019 Wiley-VCH Verlag GmbH & Co. KGaA, Weinheim
Wiley VCH Montag, 01.04.20191913 / 133211 [S. 3683/3689] 1
123456789
101112131415161718192021222324252627282930313233343536373839404142434445464748495051525354555657
during annealing process. The robust porous framework withlarge pore volumes and surface areas contributes to thestructural stability and rapid ion transport.
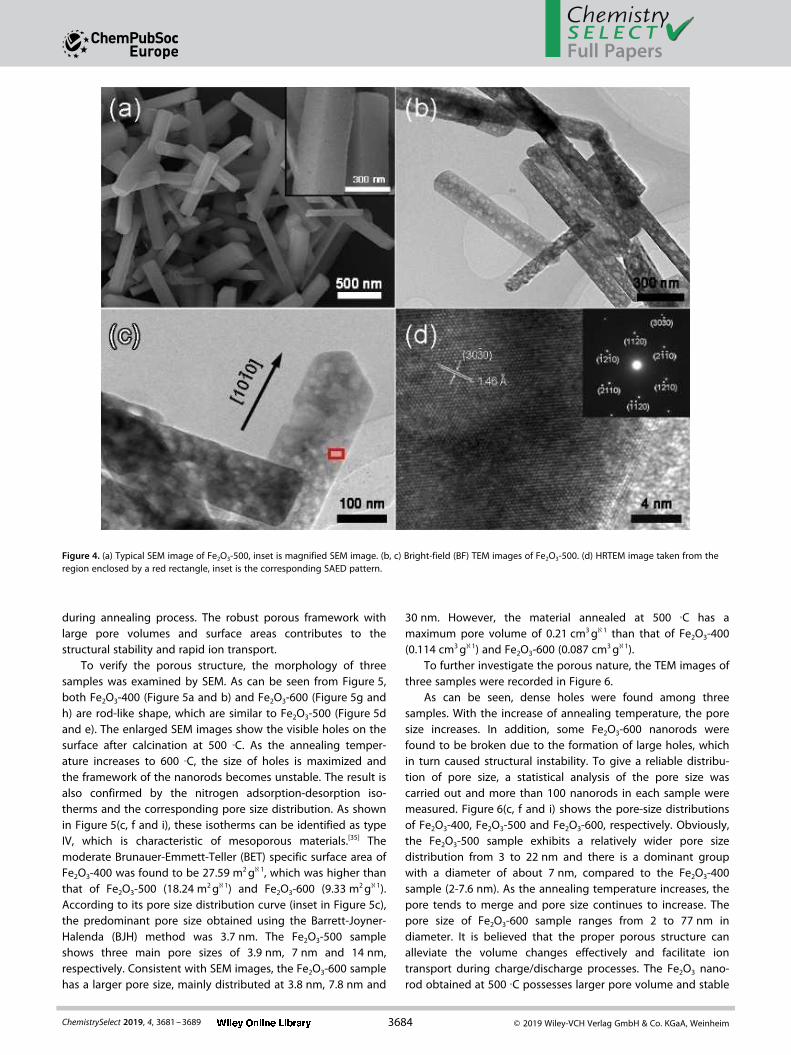
To verify the porous structure, the morphology of threesamples was examined by SEM. As can be seen from Figure 5,both Fe2O3-400 (Figure 5a and b) and Fe2O3-600 (Figure 5g andh) are rod-like shape, which are similar to Fe2O3-500 (Figure 5dand e). The enlarged SEM images show the visible holes on thesurface after calcination at 500 °C. As the annealing temper-ature increases to 600 °C, the size of holes is maximized andthe framework of the nanorods becomes unstable. The result isalso confirmed by the nitrogen adsorption-desorption iso-therms and the corresponding pore size distribution. As shownin Figure 5(c, f and i), these isotherms can be identified as typeIV, which is characteristic of mesoporous materials.[35] Themoderate Brunauer-Emmett-Teller (BET) specific surface area ofFe2O3-400 was found to be 27.59 m2g@1, which was higher thanthat of Fe2O3-500 (18.24 m2g@1) and Fe2O3-600 (9.33 m2g@1).According to its pore size distribution curve (inset in Figure 5c),the predominant pore size obtained using the Barrett-Joyner-Halenda (BJH) method was 3.7 nm. The Fe2O3-500 sampleshows three main pore sizes of 3.9 nm, 7 nm and 14 nm,respectively. Consistent with SEM images, the Fe2O3-600 samplehas a larger pore size, mainly distributed at 3.8 nm, 7.8 nm and
30 nm. However, the material annealed at 500 °C has amaximum pore volume of 0.21 cm3g@1 than that of Fe2O3-400(0.114 cm3g@1) and Fe2O3-600 (0.087 cm3g@1).
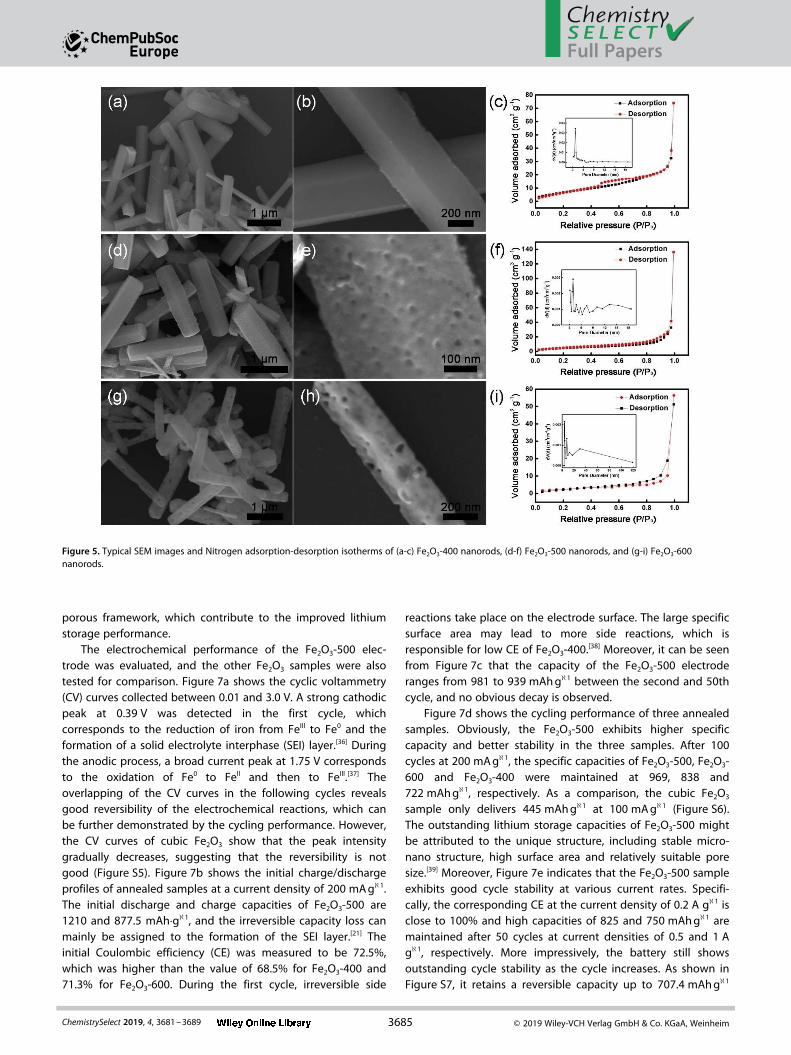
To further investigate the porous nature, the TEM images ofthree samples were recorded in Figure 6.
As can be seen, dense holes were found among threesamples. With the increase of annealing temperature, the poresize increases. In addition, some Fe2O3-600 nanorods werefound to be broken due to the formation of large holes, whichin turn caused structural instability. To give a reliable distribu-tion of pore size, a statistical analysis of the pore size wascarried out and more than 100 nanorods in each sample weremeasured. Figure 6(c, f and i) shows the pore-size distributionsof Fe2O3-400, Fe2O3-500 and Fe2O3-600, respectively. Obviously,the Fe2O3-500 sample exhibits a relatively wider pore sizedistribution from 3 to 22 nm and there is a dominant groupwith a diameter of about 7 nm, compared to the Fe2O3-400sample (2-7.6 nm). As the annealing temperature increases, thepore tends to merge and pore size continues to increase. Thepore size of Fe2O3-600 sample ranges from 2 to 77 nm indiameter. It is believed that the proper porous structure canalleviate the volume changes effectively and facilitate iontransport during charge/discharge processes. The Fe2O3 nano-rod obtained at 500 °C possesses larger pore volume and stable
Figure 4. (a) Typical SEM image of Fe2O3-500, inset is magnified SEM image. (b, c) Bright-field (BF) TEM images of Fe2O3-500. (d) HRTEM image taken from theregion enclosed by a red rectangle, inset is the corresponding SAED pattern.
Full Papers
3684ChemistrySelect 2019, 4, 3681–3689 © 2019 Wiley-VCH Verlag GmbH & Co. KGaA, Weinheim
Wiley VCH Montag, 01.04.20191913 / 133211 [S. 3684/3689] 1
123456789
101112131415161718192021222324252627282930313233343536373839404142434445464748495051525354555657
porous framework, which contribute to the improved lithiumstorage performance.
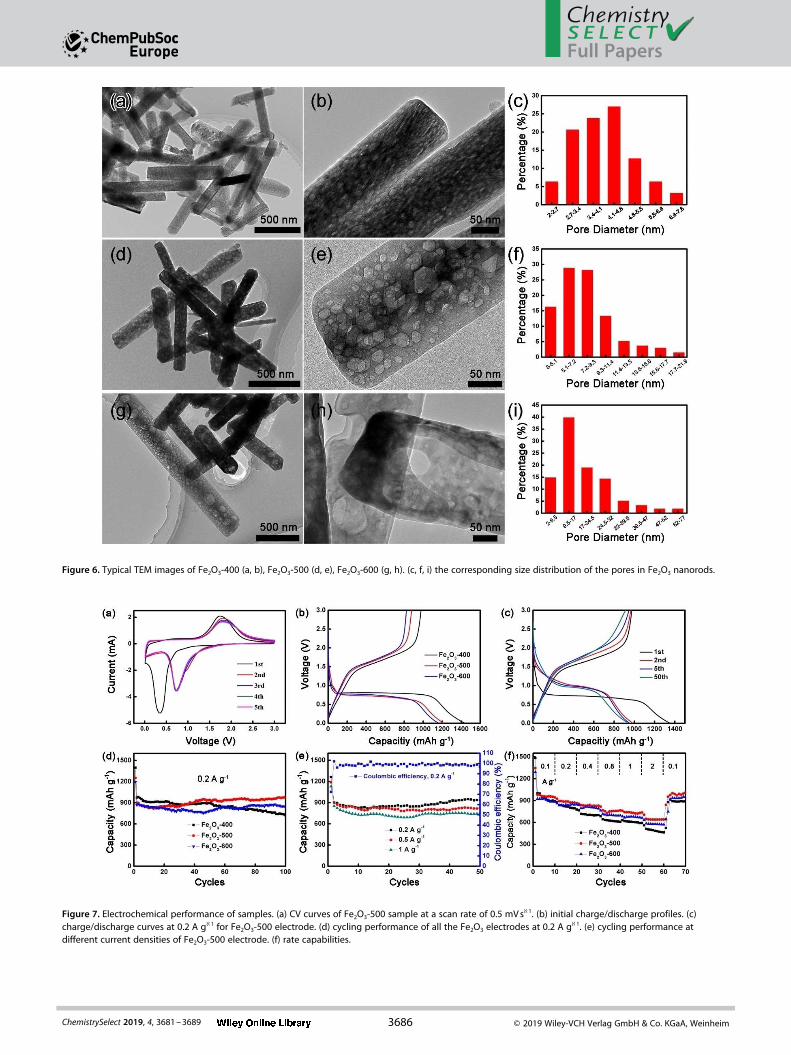
The electrochemical performance of the Fe2O3-500 elec-trode was evaluated, and the other Fe2O3 samples were alsotested for comparison. Figure 7a shows the cyclic voltammetry(CV) curves collected between 0.01 and 3.0 V. A strong cathodicpeak at 0.39 V was detected in the first cycle, whichcorresponds to the reduction of iron from FeIII to Fe0 and theformation of a solid electrolyte interphase (SEI) layer.[36] Duringthe anodic process, a broad current peak at 1.75 V correspondsto the oxidation of Fe0 to FeII and then to FeIII.[37] Theoverlapping of the CV curves in the following cycles revealsgood reversibility of the electrochemical reactions, which canbe further demonstrated by the cycling performance. However,the CV curves of cubic Fe2O3 show that the peak intensitygradually decreases, suggesting that the reversibility is notgood (Figure S5). Figure 7b shows the initial charge/dischargeprofiles of annealed samples at a current density of 200 [email protected] initial discharge and charge capacities of Fe2O3-500 are1210 and 877.5 mAh⋅g@1, and the irreversible capacity loss canmainly be assigned to the formation of the SEI layer.[21] Theinitial Coulombic efficiency (CE) was measured to be 72.5%,which was higher than the value of 68.5% for Fe2O3-400 and71.3% for Fe2O3-600. During the first cycle, irreversible side
reactions take place on the electrode surface. The large specificsurface area may lead to more side reactions, which isresponsible for low CE of Fe2O3-400.
[38] Moreover, it can be seenfrom Figure 7c that the capacity of the Fe2O3-500 electroderanges from 981 to 939 mAhg@1 between the second and 50thcycle, and no obvious decay is observed.
Figure 7d shows the cycling performance of three annealedsamples. Obviously, the Fe2O3-500 exhibits higher specificcapacity and better stability in the three samples. After 100cycles at 200 mAg@1, the specific capacities of Fe2O3-500, Fe2O3-600 and Fe2O3-400 were maintained at 969, 838 and722 mAhg@1, respectively. As a comparison, the cubic Fe2O3
sample only delivers 445 mAhg@1 at 100 mAg@1 (Figure S6).The outstanding lithium storage capacities of Fe2O3-500 mightbe attributed to the unique structure, including stable micro-nano structure, high surface area and relatively suitable poresize.[39] Moreover, Figure 7e indicates that the Fe2O3-500 sampleexhibits good cycle stability at various current rates. Specifi-cally, the corresponding CE at the current density of 0.2 A g@1 isclose to 100% and high capacities of 825 and 750 mAhg@1 aremaintained after 50 cycles at current densities of 0.5 and 1 Ag@1, respectively. More impressively, the battery still showsoutstanding cycle stability as the cycle increases. As shown inFigure S7, it retains a reversible capacity up to 707.4 mAhg@1
Figure 5. Typical SEM images and Nitrogen adsorption-desorption isotherms of (a-c) Fe2O3-400 nanorods, (d-f) Fe2O3-500 nanorods, and (g-i) Fe2O3-600nanorods.
Full Papers
3685ChemistrySelect 2019, 4, 3681–3689 © 2019 Wiley-VCH Verlag GmbH & Co. KGaA, Weinheim
Wiley VCH Montag, 01.04.20191913 / 133211 [S. 3685/3689] 1
123456789
101112131415161718192021222324252627282930313233343536373839404142434445464748495051525354555657
Figure 6. Typical TEM images of Fe2O3-400 (a, b), Fe2O3-500 (d, e), Fe2O3-600 (g, h). (c, f, i) the corresponding size distribution of the pores in Fe2O3 nanorods.
Figure 7. Electrochemical performance of samples. (a) CV curves of Fe2O3-500 sample at a scan rate of 0.5 mVs@1. (b) initial charge/discharge profiles. (c)charge/discharge curves at 0.2 A g@1 for Fe2O3-500 electrode. (d) cycling performance of all the Fe2O3 electrodes at 0.2 A g@1. (e) cycling performance atdifferent current densities of Fe2O3-500 electrode. (f) rate capabilities.
Full Papers
3686ChemistrySelect 2019, 4, 3681–3689 © 2019 Wiley-VCH Verlag GmbH & Co. KGaA, Weinheim
Wiley VCH Montag, 01.04.20191913 / 133211 [S. 3686/3689] 1
123456789
101112131415161718192021222324252627282930313233343536373839404142434445464748495051525354555657
after 200 cycles at 1 A g@1. Furthermore, the Fe2O3-500 sampledisplays excellent rate capability. As demonstrated in Figure 7f,the capacity decreases slowly in the continuous cycling processas the current density increases. The Fe2O3-500 delivers acapacity of 640 mAhg@1 at 2 A g@1, which is higher than thetheoretical capacity (372 mAhg@1) of graphite. After the currentdensity returns to 0.1 A g@1, the electrode shows a capacity ofabout 976 mAhg@1. From Figure S8, it can be seen that cubicFe2O3 only delivers discharge capacity of 257 mAhg@1 at 2 Ag@1, which is much lower than that of porous flute-like Fe2O3.The high reversible capacity of porous Fe2O3 can be attributedto its unique microstructure, which provides more reactionactive sites with Li+ and increases the utilization of activematerials. The result indicates that the optimized porousstructure can not only increase reversible capacity, but alsoimprove the rate capability.
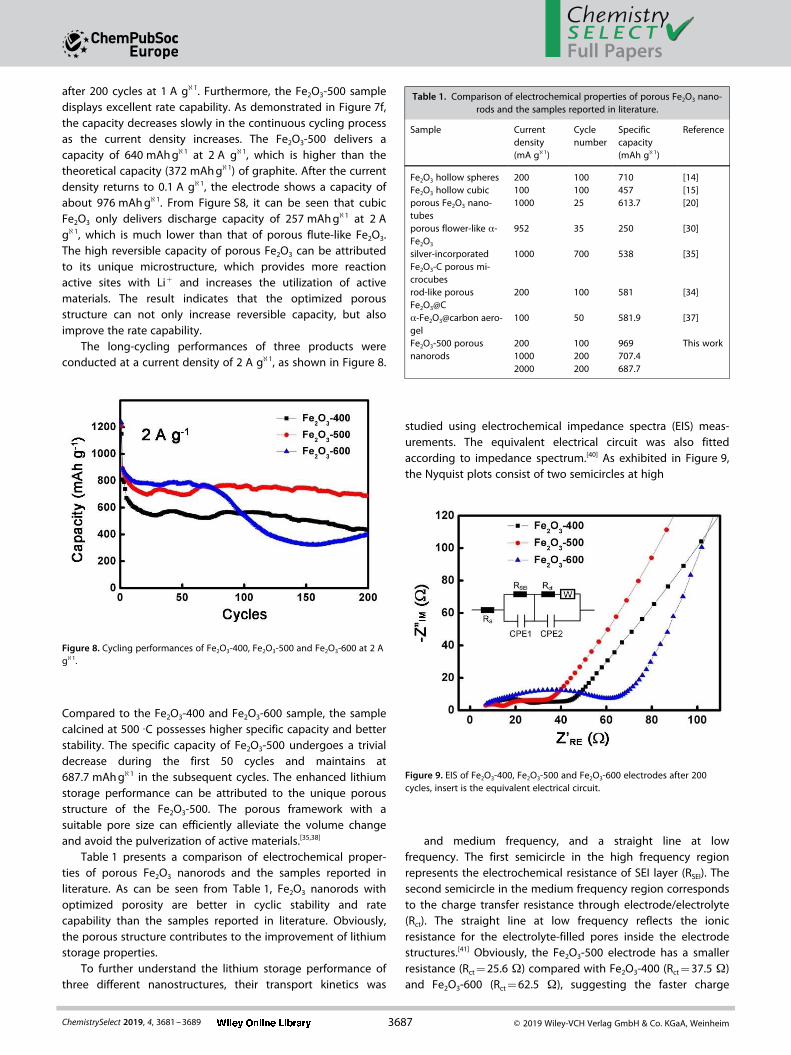
The long-cycling performances of three products wereconducted at a current density of 2 A g@1, as shown in Figure 8.
Compared to the Fe2O3-400 and Fe2O3-600 sample, the samplecalcined at 500 °C possesses higher specific capacity and betterstability. The specific capacity of Fe2O3-500 undergoes a trivialdecrease during the first 50 cycles and maintains at687.7 mAhg@1 in the subsequent cycles. The enhanced lithiumstorage performance can be attributed to the unique porousstructure of the Fe2O3-500. The porous framework with asuitable pore size can efficiently alleviate the volume changeand avoid the pulverization of active materials.[35,38]
Table 1 presents a comparison of electrochemical proper-ties of porous Fe2O3 nanorods and the samples reported inliterature. As can be seen from Table 1, Fe2O3 nanorods withoptimized porosity are better in cyclic stability and ratecapability than the samples reported in literature. Obviously,the porous structure contributes to the improvement of lithiumstorage properties.
To further understand the lithium storage performance ofthree different nanostructures, their transport kinetics was
studied using electrochemical impedance spectra (EIS) meas-urements. The equivalent electrical circuit was also fittedaccording to impedance spectrum.[40] As exhibited in Figure 9,the Nyquist plots consist of two semicircles at high
and medium frequency, and a straight line at lowfrequency. The first semicircle in the high frequency regionrepresents the electrochemical resistance of SEI layer (RSEI). Thesecond semicircle in the medium frequency region correspondsto the charge transfer resistance through electrode/electrolyte(Rct). The straight line at low frequency reflects the ionicresistance for the electrolyte-filled pores inside the electrodestructures.[41] Obviously, the Fe2O3-500 electrode has a smallerresistance (Rct=25.6 Ω) compared with Fe2O3-400 (Rct=37.5 Ω)and Fe2O3-600 (Rct=62.5 Ω), suggesting the faster charge
Figure 8. Cycling performances of Fe2O3-400, Fe2O3-500 and Fe2O3-600 at 2 Ag@1.
Table 1. Comparison of electrochemical properties of porous Fe2O3 nano-rods and the samples reported in literature.
Sample Currentdensity(mA g@1)
Cyclenumber
Specificcapacity(mAh g@1)
Reference
Fe2O3 hollow spheres 200 100 710 [14]Fe2O3 hollow cubic 100 100 457 [15]porous Fe2O3 nano-tubes
1000 25 613.7 [20]
porous flower-like α-Fe2O3
952 35 250 [30]
silver-incorporatedFe2O3-C porous mi-crocubes
1000 700 538 [35]
rod-like porousFe2O3@C
200 100 581 [34]
α-Fe2O3@carbon aero-gel
100 50 581.9 [37]
Fe2O3-500 porousnanorods
200 100 969 This work1000 200 707.42000 200 687.7
Figure 9. EIS of Fe2O3-400, Fe2O3-500 and Fe2O3-600 electrodes after 200cycles, insert is the equivalent electrical circuit.
Full Papers
3687ChemistrySelect 2019, 4, 3681–3689 © 2019 Wiley-VCH Verlag GmbH & Co. KGaA, Weinheim
Wiley VCH Montag, 01.04.20191913 / 133211 [S. 3687/3689] 1
123456789
101112131415161718192021222324252627282930313233343536373839404142434445464748495051525354555657
transfer kinetics among these samples. After 200 cycles, theFe2O3-500 electrode shows relatively high electrical conductiv-ity, which contributes to the improved lithium storage at highcurrent density.
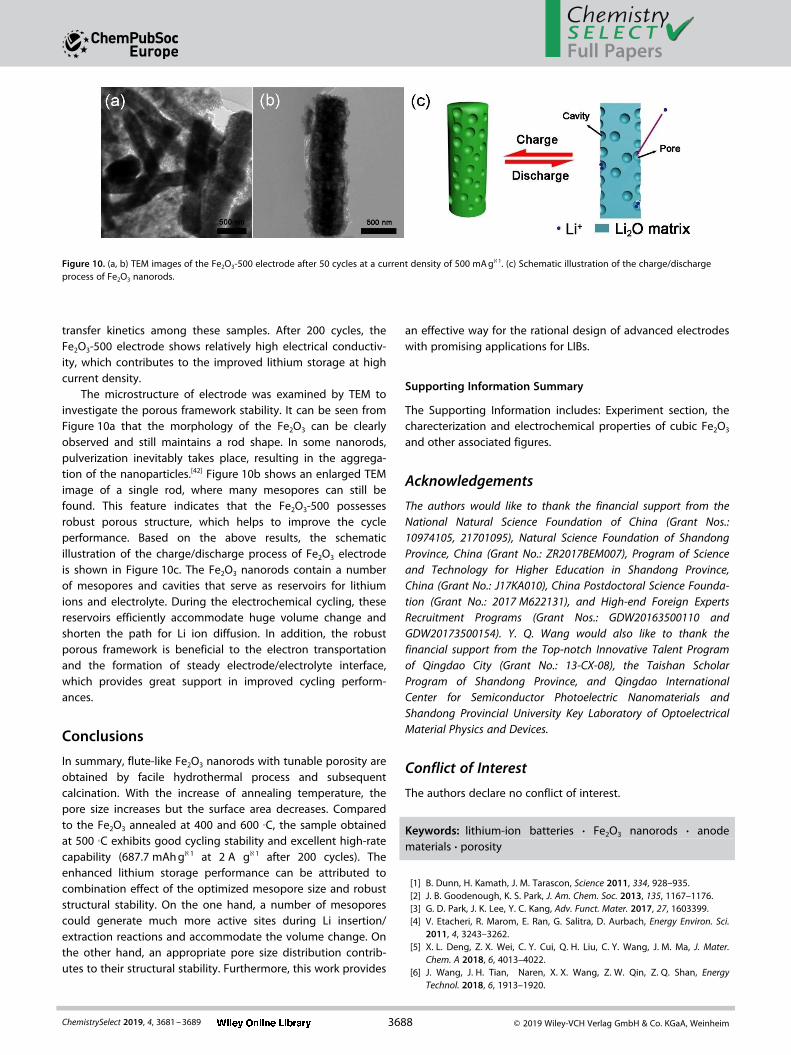
The microstructure of electrode was examined by TEM toinvestigate the porous framework stability. It can be seen fromFigure 10a that the morphology of the Fe2O3 can be clearlyobserved and still maintains a rod shape. In some nanorods,pulverization inevitably takes place, resulting in the aggrega-tion of the nanoparticles.[42] Figure 10b shows an enlarged TEMimage of a single rod, where many mesopores can still befound. This feature indicates that the Fe2O3-500 possessesrobust porous structure, which helps to improve the cycleperformance. Based on the above results, the schematicillustration of the charge/discharge process of Fe2O3 electrodeis shown in Figure 10c. The Fe2O3 nanorods contain a numberof mesopores and cavities that serve as reservoirs for lithiumions and electrolyte. During the electrochemical cycling, thesereservoirs efficiently accommodate huge volume change andshorten the path for Li ion diffusion. In addition, the robustporous framework is beneficial to the electron transportationand the formation of steady electrode/electrolyte interface,which provides great support in improved cycling perform-ances.
Conclusions
In summary, flute-like Fe2O3 nanorods with tunable porosity areobtained by facile hydrothermal process and subsequentcalcination. With the increase of annealing temperature, thepore size increases but the surface area decreases. Comparedto the Fe2O3 annealed at 400 and 600 °C, the sample obtainedat 500 °C exhibits good cycling stability and excellent high-ratecapability (687.7 mAhg@1 at 2 A g@1 after 200 cycles). Theenhanced lithium storage performance can be attributed tocombination effect of the optimized mesopore size and robuststructural stability. On the one hand, a number of mesoporescould generate much more active sites during Li insertion/extraction reactions and accommodate the volume change. Onthe other hand, an appropriate pore size distribution contrib-utes to their structural stability. Furthermore, this work provides
an effective way for the rational design of advanced electrodeswith promising applications for LIBs.
Supporting Information Summary
The Supporting Information includes: Experiment section, thecharecterization and electrochemical properties of cubic Fe2O3
and other associated figures.
Acknowledgements
The authors would like to thank the financial support from theNational Natural Science Foundation of China (Grant Nos.:10974105, 21701095), Natural Science Foundation of ShandongProvince, China (Grant No.: ZR2017BEM007), Program of Scienceand Technology for Higher Education in Shandong Province,China (Grant No.: J17KA010), China Postdoctoral Science Founda-tion (Grant No.: 2017 M622131), and High-end Foreign ExpertsRecruitment Programs (Grant Nos.: GDW20163500110 andGDW20173500154). Y. Q. Wang would also like to thank thefinancial support from the Top-notch Innovative Talent Programof Qingdao City (Grant No.: 13-CX-08), the Taishan ScholarProgram of Shandong Province, and Qingdao InternationalCenter for Semiconductor Photoelectric Nanomaterials andShandong Provincial University Key Laboratory of OptoelectricalMaterial Physics and Devices.
Conflict of Interest
The authors declare no conflict of interest.
Keywords: lithium-ion batteries · Fe2O3 nanorods · anodematerials · porosity
[1] B. Dunn, H. Kamath, J. M. Tarascon, Science 2011, 334, 928–935.[2] J. B. Goodenough, K. S. Park, J. Am. Chem. Soc. 2013, 135, 1167–1176.[3] G. D. Park, J. K. Lee, Y. C. Kang, Adv. Funct. Mater. 2017, 27, 1603399.[4] V. Etacheri, R. Marom, E. Ran, G. Salitra, D. Aurbach, Energy Environ. Sci.
2011, 4, 3243–3262.[5] X. L. Deng, Z. X. Wei, C. Y. Cui, Q. H. Liu, C. Y. Wang, J. M. Ma, J. Mater.
Chem. A 2018, 6, 4013–4022.[6] J. Wang, J. H. Tian, Naren, X. X. Wang, Z. W. Qin, Z. Q. Shan, Energy
Technol. 2018, 6, 1913–1920.
Figure 10. (a, b) TEM images of the Fe2O3-500 electrode after 50 cycles at a current density of 500 mAg@1. (c) Schematic illustration of the charge/dischargeprocess of Fe2O3 nanorods.
Full Papers
3688ChemistrySelect 2019, 4, 3681–3689 © 2019 Wiley-VCH Verlag GmbH & Co. KGaA, Weinheim
Wiley VCH Montag, 01.04.20191913 / 133211 [S. 3688/3689] 1

123456789
101112131415161718192021222324252627282930313233343536373839404142434445464748495051525354555657
[7] T. Yi, S. Yang, Y. Xie, J. Mater. Chem. A 2015, 3, 5750–5777.[8] C. T. Kacica, L. S. Wang, T. S. Chadha, P. Biswas, Energy Technol. 2018, 6,
1966–1974.[9] M. V. Reddy, T. Yu, C. H. Sow, Z. X. Shen, C. T. Lim, G. V. S. Rao, B. V. R.
Chowdari, Adv. Funct. Mater. 2007, 17, 2792–2799.[10] L. Zhang, H. B. Wu, X. W. Lou, Adv. Energy Mater. 2014, 4, 1300958.[11] Q. Su, D. Xie, J. Zhang, G. Du, B. Xu, ACS Nano 2013, 7, 9115–9121.[12] Q. L. Wei, F. Y. Xiong, S. S. Tan, L. Huang, E. H. Lan, B. Dunn, L. Q. Mai,
Adv. Mater. 2017, 29, 1602300.[13] S. H. Lee, Y. Noh, Y. Jo, Y. Kim, B. Kim, W. B. Kim, Energy Technol. 2018, 6,
1255–1260.[14] B. Wang, J. S. Chen, H. B. Wu, Z. Wang, X. W. Lou, J. Am. Chem. Soc. 2011,
133, 17146–17148.[15] H. Xiao, Y. Xia, W. K. Zhang, H. Huang, Y. P. Gan, X. Y. Tao, J. Mater.
Chem. A 2013, 1, 2307–2312.[16] F. C. Zheng, M. N. He, Y. Yang, Q. W. Chen, Nanoscale 2015, 7, 3410–
3417.[17] K. S. Lee, S. Park, W. Lee, Y. S. Yoon, ACS Appl. Mater. Interfaces 2016, 8,
2027–2034.[18] T. Jiang, F. Bu, X. Feng, I. Shakir, G. Hao, Y. Xu, ACS Nano 2017, 11, 5140–
5147.[19] K. Z. Cao, L. F. Jiao, H. Q. Liu, Y. C. Liu, Y. J. Wang, Z. P. Guo, H. T. Yuan,
Adv. Energy Mater. 2015, 5, 1401421.[20] X. Cai, H. B. Lin, X. W. Zheng, X. Q. Chen, P. Xia, X. Y. Luo, X. X. Zhong,
X. P. Li, W. S. Li, Electrochim. Acta 2016, 191, 767–775.[21] M. C. Sun, M. F. Sun, H. X. Yang, W. H. Song, Y. Nie, S. N. Sun, Ceram. Int.
2017, 43, 363–367.[22] X. D. Xu, R. G. Cao, S. Jeong, J. Cho, Nano Lett. 2012, 12, 4988–4991.[23] X. Q. Zhang, B. He, W. C. Li, A. H. Lu, Nano Research 2018, 11, 1238–1246.[24] Y. Kim, E. Choi, J. G. Kim, S. Lee, W. Yoon, M. H. Ham, W. B. Kim,
ChemElectroChem 2017, 4, 2045–2051.[25] X. Q. Zhang, W. C. Li, B. He, D. Yan, S. Xu, Y. L. Cao, A. H. Lu, J. Mater.
Chem. A 2018, 6, 1397–1402.[26] J. G. Kim, Y. Noh, Y. Kim, S. Lee, W. B. Kim, Nanoscale 2017, 9, 5119–
5128.
[27] F. Granados-Correa, N. G. Corral-Capulin, M. T. Olguín, C. E. Acosta-León,Chem. Eng. J. 2011, 171, 1027–1034.
[28] Z. Y. Wang, D. Y. Luan, S. Madhavi, Y. Hu, X. W. Lou, Energy Environ. Sci.2012, 5, 5252–5256.
[29] J. Liu D. Xue, Adv. Mater. 2008, 20, 2622–2627.[30] T. R. Penki, S. Shivakumara, M. Minakshi, N. Munichandraiah, Electrochim.
Acta 2015, 167, 330–339.[31] Y. Y. Fu, R. M. Wang, J. Xu, J. Chen, Y. Yan, A. V. Narlikar, H. Zhang, Chem.
Phys. Lett. 2003, 379, 373–379.[32] Y. S. Wang, S. R. Wang, H. X. Zhang, X. L. Gao, J. D. Yang, L. W. Wang, J.
Mater. Chem. A, 2014, 2, 7935–7943.[33] H. G. Wang, Y. Q. Zhou, Y. Shen, Y. H. Li, Q. H. Zuo, Q. Duan, Electrochim.
Acta 2015, 158, 105–112.[34] Y. Sun, X. H. Liu, F. Z. Huang, S. K. Li, Y. H. Shen, A. J. Xie, Mater. Res. Bull.
2017, 95, 321–327.[35] Q. Li, H. J. Wang, J. J. Ma, X. Yang, R. Yuan, Y. Q. Chai, J. Alloys Compd.
2018, 735, 840–846.[36] D. Larcher, D. Bonnin, R. Cortes, I. Rivals, L. Personnaz, J. M. Tarascon, J.
Electrochem. Soc. 2003, 150, A1643-A1650.[37] D. W. Luo, F. Lin, W. D. Xiao, W. J. Zhu, Ceram. Int. 2017, 43, 2051–2056.[38] C. C. Zhang, Y. H. Xu, W. Y. Chen, L. Y. Sun, D. H. Xu, Y. Yan, X. Y. Yu, J.
Electroanal. Chem. 2018, 816, 114–122.[39] S. J. Hao, B. W. Zhang, S. Ball, J. S. Wu, M. Srinivasan, Y. Z. Huang, J.
Mater. Chem. A 2016, 4, 16569–16575.[40] T. Xin, F. Y. Diao, C. Li, H. L. Feng, G. J. Liu, J. J. Zou, Y. H. Ding, B. Liu,
Y. Q. Wang, Mater. Res. Bull. 2018, 99, 196–203.[41] S. M. Xu, C. M. Hessel, H. Ren, R. B. Yu, Q. Jin, M. Yang, H. J. Zhao, D.
Wang, Energy Environ. Sci. 2014, 7, 632–637.[42] L. Zhou, Z. H. Zhuang, H. H. Zhao, M. T. Lin, D. Y. Zhao, L. Q. Mai, Adv.
Mater. 2017, 29, 1602914.
Submitted: February 13, 2019Accepted: March 18, 2019
Full Papers
3689ChemistrySelect 2019, 4, 3681–3689 © 2019 Wiley-VCH Verlag GmbH & Co. KGaA, Weinheim
Wiley VCH Montag, 01.04.20191913 / 133211 [S. 3689/3689] 1