Embed Size (px)
Citation preview
i
Fluorine-Free Omniphobic Flexible Packaging Papers
Containing Low Consistency Refined Mechanical and Chemical
Pulp Blends
by
Bahar Soltanmohammadi
A thesis submitted in conformity with the requirements
for the degree of Master of Applied Science
Department of Chemical Engineering and Applied Chemistry
University of Toronto
© Copyright by Bahar Soltanmohammadi (2018)
[Type a quote from the
document or the summary
ii
Fluorine-Free Omniphobic Flexible Packaging Papers Containing Low
Consistency Refined Mechanical and Chemical Pulp Blends
Bahar Soltanmohammadi
Master of Applied Science
Department of Chemical Engineering and Applied Chemistry
University of Toronto
2018
Abstract
In this study, the effect of partial substitution of chemical pulp by relatively lower-cost
mechanical fibres for the production of flexible packaging paper was examined. In particular, the
objective of this work was to obtain the optimum substitution percentage and refining conditions
capable of providing adequate performance and reduced production cost for sack papers. Results
indicated that the pulp mixtures containing 10% mechanical pulp and co-refined at low intensity
(0.5 J/m) had a similar performance compared to the control samples made of 100% refined
chemical pulp.
To impart omniphobic properties to the packaging samples, novel fluorine-free coating
formulations containing polyvinyl alcohol (PVA) and polymethylhydrosiloxane (PMHS)
emulsions were developed. Contact angle measurement and scanning electron microscopy
(SEM) showed that the treated sampled exhibited acceptable wetting behavior and barrier
properties. This novel coating formulation is an eco-friendly alternative to fluorinated-based
materials currently used in the food packaging industry.
iii
Acknowledgements
Foremost, I wish to express my most sincere appreciation and gratitude to my supervisor,
Professor Ramin Farnood, for his untiring guidance and support throughout this research project.
It was my biggest pleasure working with him. I would also like to thank Dr. Ivan Pikulik for his
precious advices in regards to my proposal.
I thank profusely all members from ERMP research program of University of British Colombia,
specially Professor James Olson, Meaghan Miller, Emilia Jahangir, Chitra Arcot, and Reanna
Seifert for providing me the opportunity to work with their team. This project would not have
been completed without their efforts and consistent assistance.
I am highly indebted and thoroughly grateful to Paul Bicho, Brendon Palmer, Patricia McBeath,
and Ranbir Heer from Canfor Pulp Innovation for their unending help and immense interest in
my work. They hugely and continuously guided me thorough my research process by providing
materials, contributions, trainings, and links that I could not possibly discovered on my own.
I would also like to thank Kent Fauth from Canfor’s Prince George Mill and Judith Oluku from
Canfor’s Taylor Mill for collaborating and providing the pulp needed for this project. In addition,
I owe appreciation to Dr. Javad Sameni from U of T’s Faculty of Forestry and Sal Boccia from U
of T’s Department of Materials Science and Engineering for their kind helps and patient co-
operations throughout my research.
I am thankful to all my friends and lab mates through providing further help and support during
my research period.
Finally above all, I owe a great debt of gratitude towards my supportive family for always being
there for me. Without them none of this would indeed be possible. Deepest thanks to my mother,
Salimeh, for being my truest life-time source of inspiration and my biggest emotional supporter;
my beloved grandmother, Madar, for her kindness, love, and unwavering supports; and my
father, Mehdi, for all his constant encouragements by being my greatest advisor and motivator.
iv
Table of Contents
Acknowledgements ........................................................................................................................ iii
List of Abbreviations .................................................................................................................... vii
List of Equations ............................................................................................................................ xi
List of Figures ............................................................................................................................... xii
1. Introduction ............................................................................................................................. 1
1.1. Background .......................................................................................................................... 1
1.2. Hypothesis and Objectives ................................................................................................... 4
2. Literature Review .................................................................................................................... 6
2.1. Wood Structure .................................................................................................................... 6
2.2. Fibre Morphology ................................................................................................................ 7
2.3. Pulping ................................................................................................................................. 8
2.3.1. Mechanical Pulping .......................................................................................................... 9
2.3.2. Chemical Pulping ........................................................................................................... 10
2.4. Refining.............................................................................................................................. 11
2.5. Physical Properties of Paper .............................................................................................. 13
2.6. Sack Paper .......................................................................................................................... 23
2.7. Barrier Properties of FPPs ................................................................................................. 24
3. Methodology .......................................................................................................................... 27
3.1. Co-refining of BCTMP and HCR-USKP .......................................................................... 27
3.2. Handsheet Making ............................................................................................................. 29
3.3. Fibre Characteristics .......................................................................................................... 31
3.4. Paper Testing ..................................................................................................................... 31
3.4.1. Non-Destructive Mechanical Tests ................................................................................ 31
v
3.4.1.1. Optical Properties ....................................................................................................... 31
3.4.1.2. Air Resistance ............................................................................................................. 32
3.4.1.3. Roughness ................................................................................................................... 32
3.4.1.4. Caliper, Bulk, and Density ......................................................................................... 32
3.4.2. Destructive Mechanical Tests ........................................................................................ 32
3.4.2.1. Tensile Strength, Breaking Length, Stretch, Stiffness, and TEA ............................... 33
3.4.2.2. Tear Strength .............................................................................................................. 33
3.4.2.3. Burst Strength ............................................................................................................. 33
3.4.2.4. Internal Bond Strength (Scott Type) .......................................................................... 33
3.4.2.5. Zero-Span Tensile Strength Test ................................................................................ 34
3.5. Coating Procedure .............................................................................................................. 35
3.5.1. Materials ......................................................................................................................... 35
3.5.2. Experimental Procedure ................................................................................................. 35
3.6. Scanning Electron Microscopy .......................................................................................... 36
4. Results and Discussion .......................................................................................................... 37
4.1. Co-refining of BCTMP and HCR-USKP .......................................................................... 37
4.1.1. Pulp Quality.................................................................................................................... 37
4.1.2. Characterization of Lab-made FPPs ............................................................................... 39
4.1.2.1. Density and Porosity ................................................................................................... 39
4.1.2.2. Internal Bonding ......................................................................................................... 40
4.1.2.3. Zero-span Tensile ....................................................................................................... 41
4.1.2.4. Tensile Properties ....................................................................................................... 43
4.1.2.5. Tear Resistance ........................................................................................................... 48
4.1.2.6. Burst Strength ............................................................................................................. 50
4.1.3. Comparison of Results ................................................................................................... 50
vi
4.2. Enhancing Barrier Properties of FPP ................................................................................. 54
4.3. FPP Structure Analysis ...................................................................................................... 56
5. Conclusion ............................................................................................................................. 58
6. Future Work ........................................................................................................................... 59
7. References ............................................................................................................................. 60
Appendix ....................................................................................................................................... 70
vii
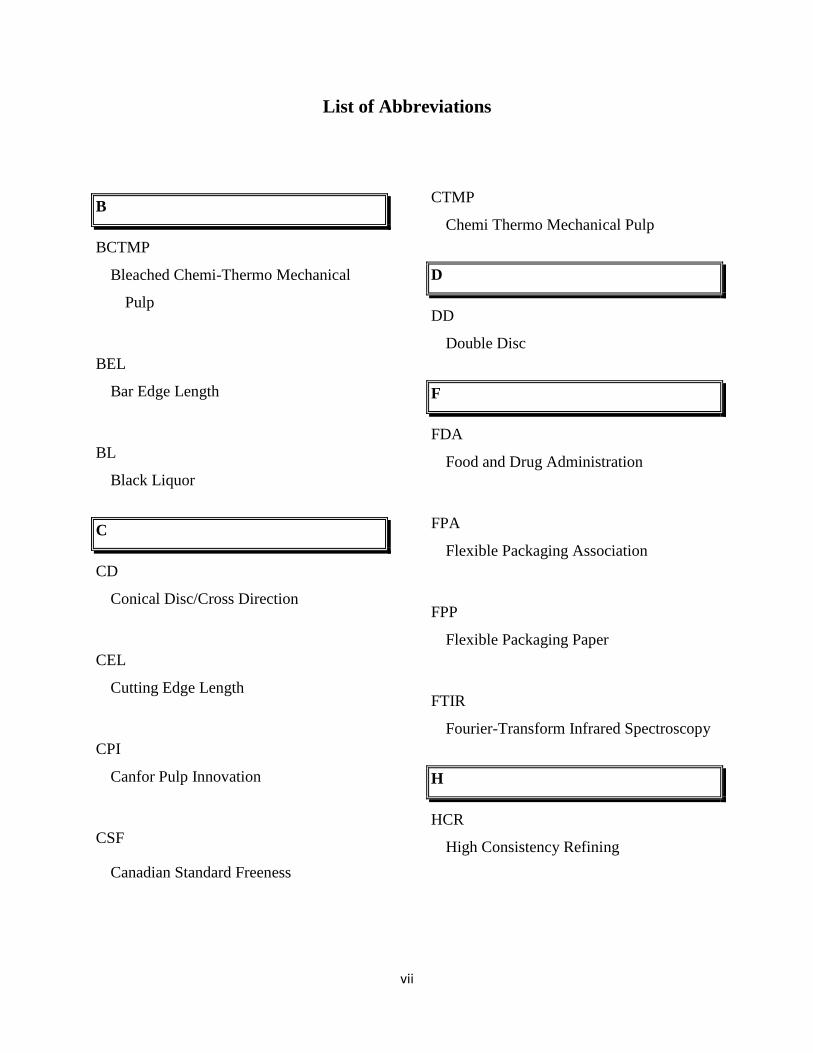
List of Abbreviations
B
BCTMP
Bleached Chemi-Thermo Mechanical
Pulp
BEL
Bar Edge Length
BL
Black Liquor
C
CD
Conical Disc/Cross Direction
CEL
Cutting Edge Length
CPI
Canfor Pulp Innovation
CSF
Canadian Standard Freeness
CTMP
Chemi Thermo Mechanical Pulp
D
DD
Double Disc
F
FDA
Food and Drug Administration
FPA
Flexible Packaging Association
FPP
Flexible Packaging Paper
FTIR
Fourier-Transform Infrared Spectroscopy
H
HCR
High Consistency Refining
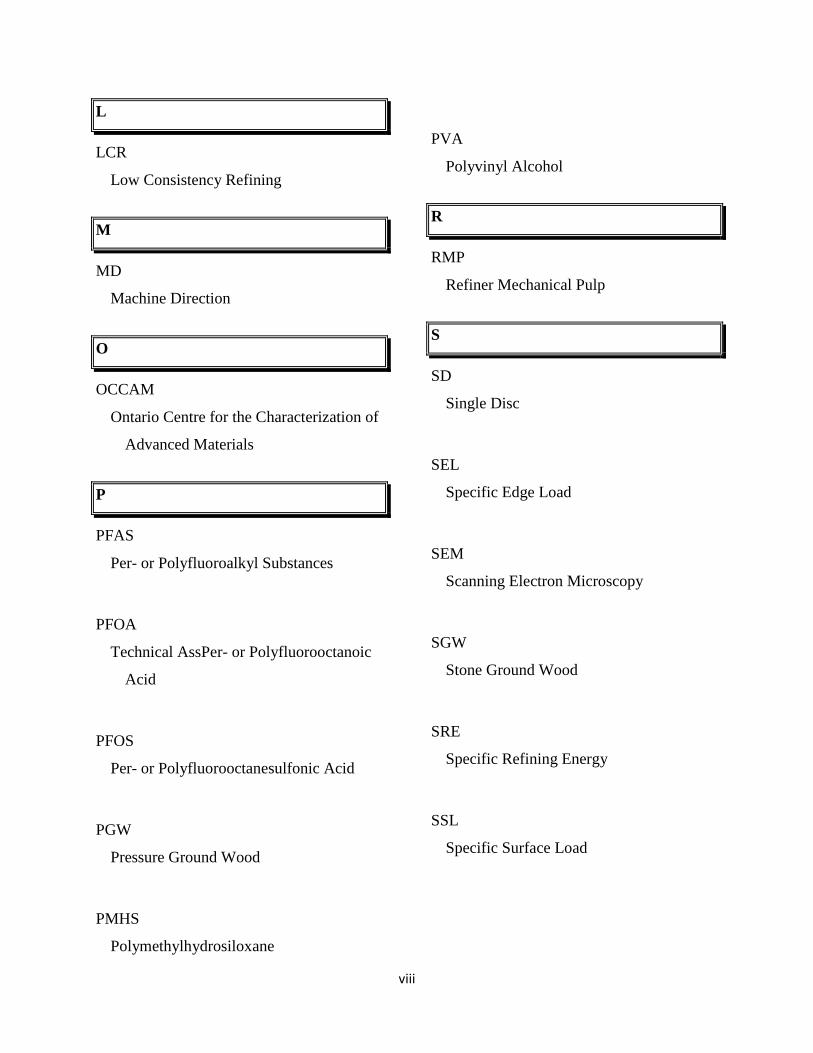
viii
L
LCR
Low Consistency Refining
M
MD
Machine Direction
O
OCCAM
Ontario Centre for the Characterization of
Advanced Materials
P
PFAS
Per- or Polyfluoroalkyl Substances
PFOA
Technical AssPer- or Polyfluorooctanoic
Acid
PFOS
Per- or Polyfluorooctanesulfonic Acid
PGW
Pressure Ground Wood
PMHS
Polymethylhydrosiloxane
PVA
Polyvinyl Alcohol
R
RMP
Refiner Mechanical Pulp
S
SD
Single Disc
SEL
Specific Edge Load
SEM
Scanning Electron Microscopy
SGW
Stone Ground Wood
SRE
Specific Refining Energy
SSL
Specific Surface Load
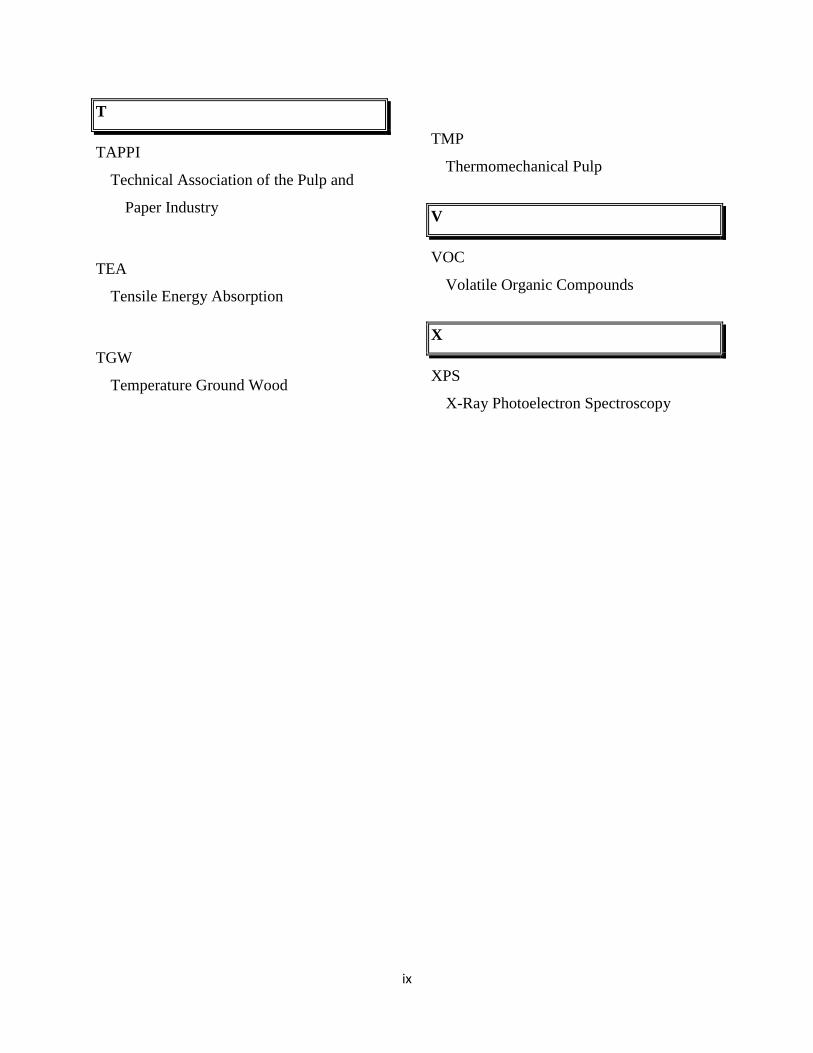
ix
T
TAPPI
Technical Association of the Pulp and
Paper Industry
TEA
Tensile Energy Absorption
TGW
Temperature Ground Wood
TMP
Thermomechanical Pulp
V
VOC
Volatile Organic Compounds
X
XPS
X-Ray Photoelectron Spectroscopy
x
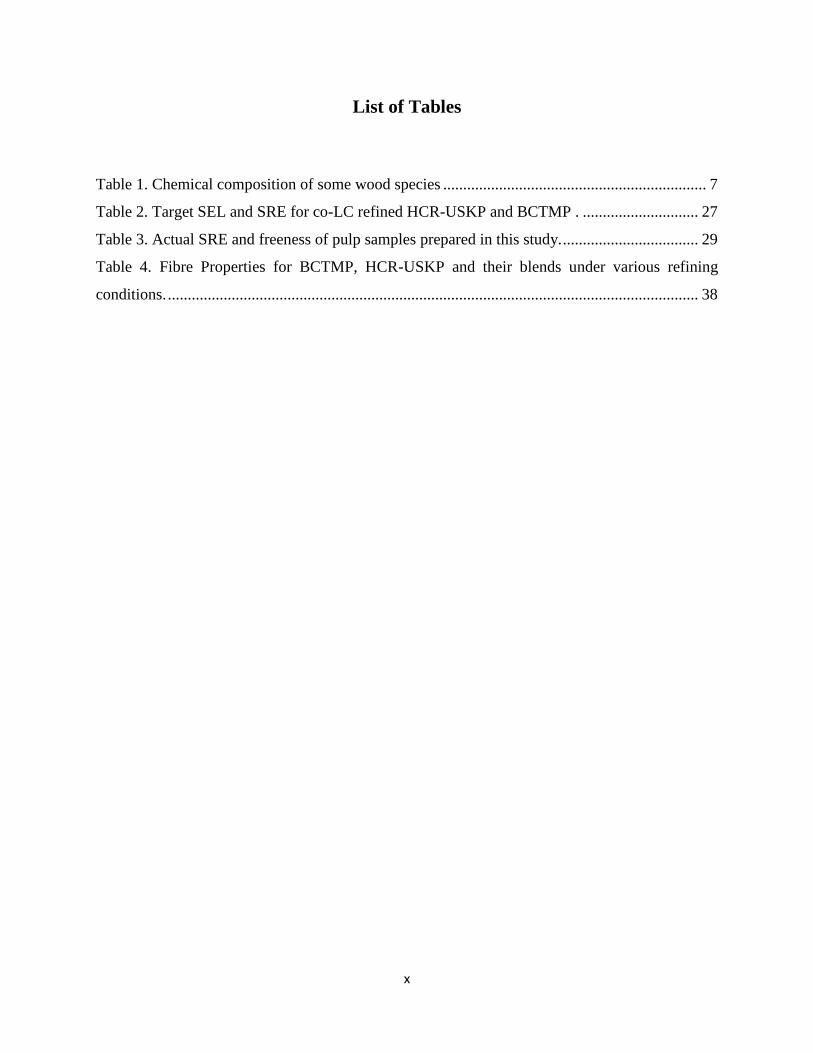
List of Tables
Table 1. Chemical composition of some wood species .................................................................. 7
Table 2. Target SEL and SRE for co-LC refined HCR-USKP and BCTMP . ............................. 27
Table 3. Actual SRE and freeness of pulp samples prepared in this study. .................................. 29
Table 4. Fibre Properties for BCTMP, HCR-USKP and their blends under various refining
conditions. ..................................................................................................................................... 38
xi
List of Equations
Equation 1. SEL ............................................................................................................................ 13
Equation 2. CEL............................................................................................................................ 13
Equation 3. SRE ............................................................................................................................ 13
Equation 4. Density ....................................................................................................................... 15
Equation 5. Porosity ...................................................................................................................... 15
Equation 6. Page Equation for Tensile Strength ........................................................................... 18
Equation 8. Young’s Equation for Equilibrium Contact Angle .................................................... 25
Equation 9. Curl Inedx .................................................................................................................. 31
xii
List of Figures
Figure 1. Typical refining process of SKP...................................................................................... 2
Figure 2. Proposed Refining process for BCTMP/USKP blends ................................................... 2
Figure 3. Chemical structure of PMHS........................................................................................... 3
Figure 4. Overview of project plan (x= 0, 10, 20%). ...................................................................... 5
Figure 5. Cell structure of hardwood and softwood ....................................................................... 6
Figure 6. Schematic representation of wood's fibre structure ......................................................... 7
Figure 7. Overview of kraft pulping process ................................................................................ 10
Figure 8. (a) Fibrillated refined fibre (b) not equally fibrillated unrefined fibre .......................... 11
Figure 9. Illustration of different refiners type ............................................................................. 12
Figure 10. A single disc for a low consistency refiner ................................................................. 12
Figure 11.An Example for A Stress-Strain Curve [59] ................................................................. 17
Figure 12. Elmendrof Test [73] .................................................................................................... 22
Figure 13. Light/Sheet Interaction ................................................................................................ 23
Figure 14. Samples of some bleached and unbleached kraft-based sack papers [85] .................. 24
Figure 15. (a) 𝛼>90, non-wetting, (b) 𝛼<90, partially wetting, (C) 𝛼=0, total wetting ................ 25
Figure 16. Refining Process .......................................................................................................... 28
Figure 17. Image of semi-automatic sheet-former ........................................................................ 30
Figure 18. Handsheets (a) before drying and (b) after drying ...................................................... 30
Figure 19. Fibre curl index represents the fractional difference between the fibre length, L, and
the fibre contour length, l (see Equation 9). .................................................................................. 31
Figure 20. A schematic overview on Scott bond mechanism ....................................................... 34
Figure 21. Optical Contact Angle measurement device ............................................................... 36
Figure 22. Canadian Standard Freeness against SRE of co-refined BCTMP/HCR-USKP blends
....................................................................................................................................................... 38
Figure 23. Density against CSF for handsheets made of co-refined BCTMP/HCR-USKP blends
....................................................................................................................................................... 39
Figure 24. Air Resistance against CSF for handsheets made of co-refined BCTMP/HCR-USKP
blends ............................................................................................................................................ 40
xiii
Figure 25. Internal Bond (Scott Bond) against CSF for handsheets made of BCTMP/HCR-USKP
blends ............................................................................................................................................ 41
Figure 26. Zero-span wet tensile against CSF for handsheets made of BCTMP/HCR-USKP
blends ............................................................................................................................................ 42
Figure 27. Zero-span dry tensile against CSF for handsheets made of BCTMP/HCR-USKP
blends ............................................................................................................................................ 42
Figure 28. Tensile Index against CSF for handsheets made of co-refined BCTMP/HCR-USKP
blends ............................................................................................................................................ 43
Figure 29. Stretch against CSF for handsheets made of co-refined BCTMP/HCR-USKP blends 44
Figure 30. Stiffness (elastic modulus) against CSF for handsheets made of BCTMP/HCR–USKP
blends ............................................................................................................................................ 45
Figure 31. TEA against CSF for laboratory-made sheets containing co-refined BCTMP/HCR–
USKP kraft pulp ............................................................................................................................ 45
Figure 32. Tensile index against air resistance for handsheets made of BCTMP/HCR-USKP
blends ............................................................................................................................................ 46
Figure 33. Stretch against air resistance for handsheets made of BCTMP/HCR-USKP blends .. 47
Figure 34. TEA against air resistance for handsheets made of BCTMP/HCR-USKP blends ...... 47
Figure 35. Tear index against CSF for handsheets made of BCTMP/HCR-USKP blends. ......... 48
Figure 36. Tear index against CSF for handsheets made of BCTMP/HCR-USKP’s blends. ...... 49
Figure 37. Burst Index against CSF for handsheets made of BCTMP/HCR-USKP’s blends. ..... 50
Figure 38. Comparing performance of FPP samples prepared using 10% BCTMP blend co-
refined at SRE of 40 kWh/t ........................................................................................................... 52
Figure 39. Comparing performance of FPP samples prepared using 10% BCTMP blend co-
refined at SRE of 80 kWh/t ........................................................................................................... 52
Figure 40. Comparing performance of FPP samples prepared using 10% BCTMP blend co-
refined to a freeness of 400 ml ...................................................................................................... 53
Figure 41. Comparing performance of FPP samples prepared using 10% BCTMP blend co-
refined to a freeness of 300 ml ...................................................................................................... 53
Figure 42. Oil and water drops on the surface of coated sack samples containing 10% BCTMP
with SEL of 0.5 J/m and SRE of 40 kWh/t ................................................................................... 54
xiv
Figure 43. Optical contact angle images for (a) water droplet, and (b) oil droplet.
Substrate: 10% BCTMP, SRE= 40 kWh/t, SEL = 0.5 J/m coated with PMHS/water emulsion. . 55
Figure 44. Changes in Contact Angle Values of Water and Oil as a function of Elapsed Time .. 56
Figure 45. SEM micrographs of (a) uncoated sample, and (b) coated sample. ............................ 57
1
1. Introduction
1.1. Background
Paper is an inhomogeneous, hygroscopic, anisotropic, and viscoelastic material [1]. Wood fibres,
recycled paper, and agricultural residues can be used as raw materials for forming various pulp
and paper products [2]. Paper products contain one or more layers of randomly arranged wood
fibres. Type of the fibre resource, pulping process, refining condition, stock preparation, and
papermaking process determine the final properties for desired applications such as printing and
packaging [1].
Packaging is one of the most widely used applications for paper. Up to 40% of all packaging
materials are based on paper compounds [3]. Despite the 1.4% drop of printing paper
consumption in 2013-2014, the development and consumption of packaging paper raised with
2.6% [4]. This indicates the rapid growth of paper packaging’s global demands over the past
recent years [5].
According to Smithers Pira (2013), flexible packaging, e.g. sack paper, accounts for the second
largest global packaging market. Flexible packaging with its competitive cost and significant
aesthetic properties has become one of the fastest growing types of packaging. Paper-based
flexible packaging (FPP) with high performance porous bio-composite structure can be a eco-
friendly alternative to the synthetic plastics due to its renewable resource, biodegradability, cost-
effective raw material, light weight, and good printing surface [6], [7], [3].
Sack kraft pulp (SKP) is the primary material used for the production of FPP. It is commonly
derived from softwood kraft pulp to provide sufficient strength properties for the final products.
These fibres can provide a high degree of extensibility and porosity depending on the required
grade performance [8].
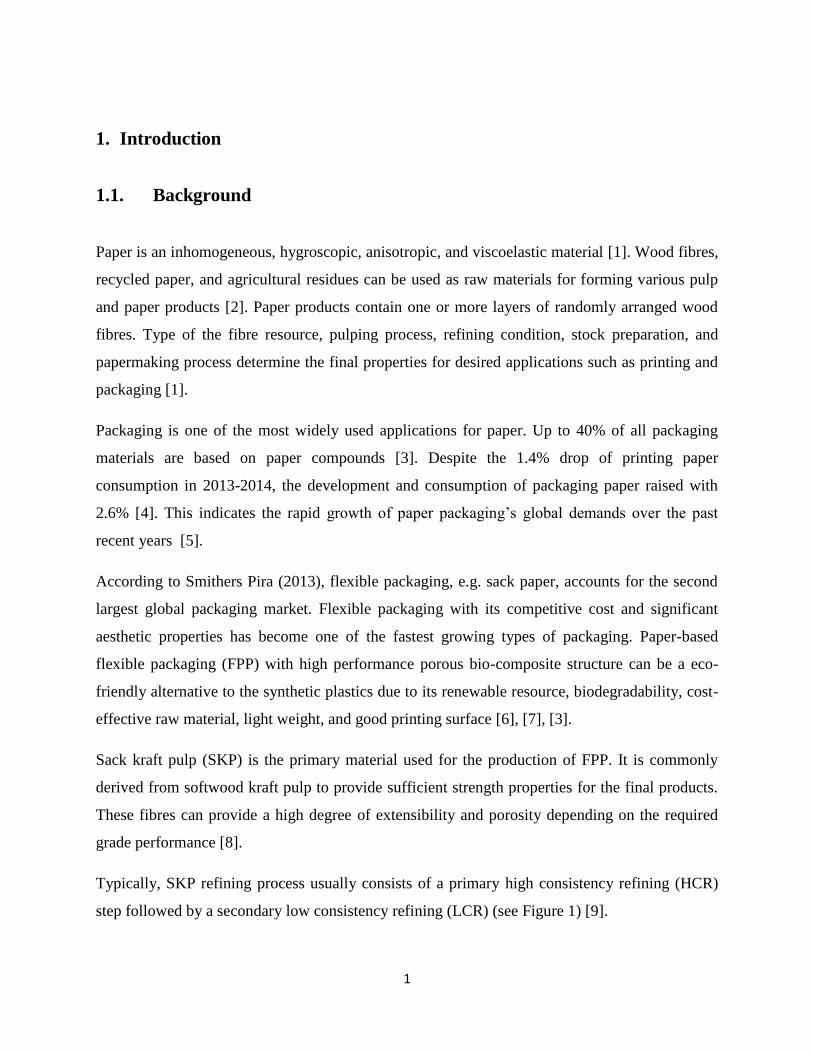
Typically, SKP refining process usually consists of a primary high consistency refining (HCR)
step followed by a secondary low consistency refining (LCR) (see Figure 1) [9].
2
Figure 1. Typical refining process of SKP
Due to high production cost of kraft pulps, it is essential to come up with energy cost reduction
alternatives and reduce capital investment. For this reason, low-cost high yield mechanical pulps
such as bleached chemi-thermomechanical pulp (BCTMP) offer an attractive opportunity.
However, kraft fibres cannot be fully replaced by BCTMP since mechanical fibres typically have
lower strength properties, and a partial substitution of SKP may be a more practical solution.
Since, the addition of BCTMP can highly affect the final product performance, it is vital to
determine the optimum mixture of chemical and mechanical pulps to produce a more eco-
friendly packaging paper that achieves the desired characteristics while reducing costs [10], [11],
[12].
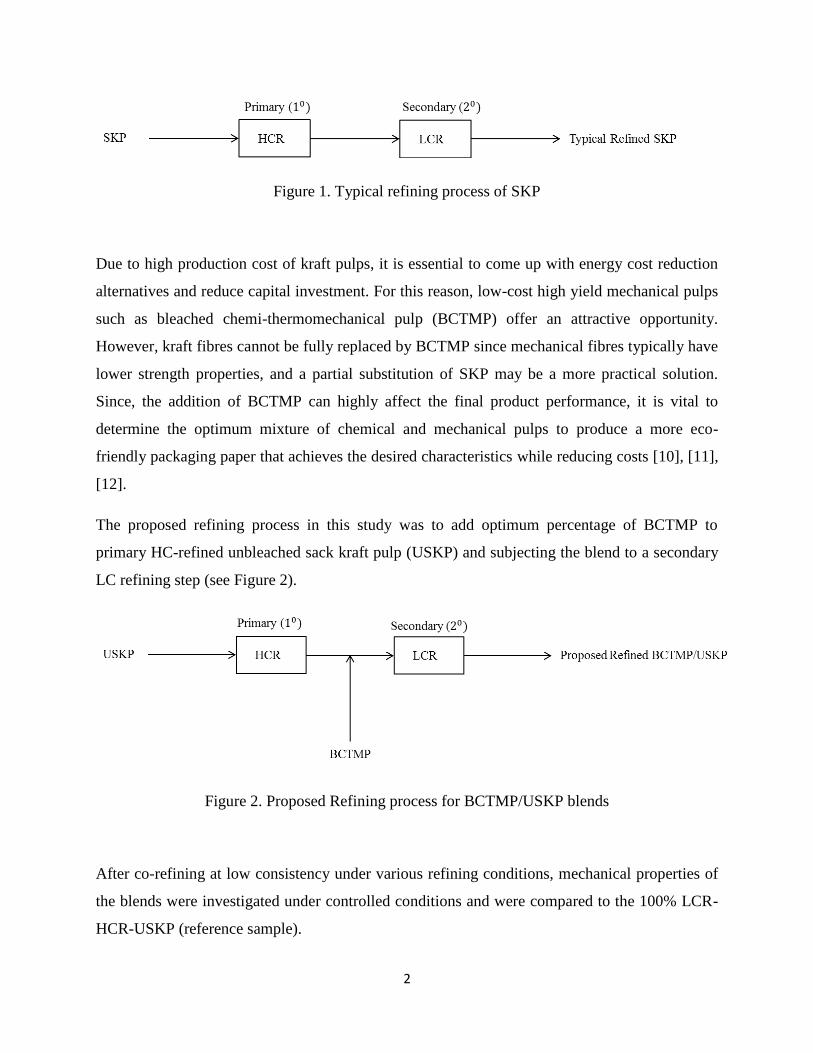
The proposed refining process in this study was to add optimum percentage of BCTMP to
primary HC-refined unbleached sack kraft pulp (USKP) and subjecting the blend to a secondary
LC refining step (see Figure 2).
Figure 2. Proposed Refining process for BCTMP/USKP blends
After co-refining at low consistency under various refining conditions, mechanical properties of
the blends were investigated under controlled conditions and were compared to the 100% LCR-
HCR-USKP (reference sample).
3
One of the most popular applications of FPP is in food packaging [6]. According to Flexible
Packaging Association (FPA-2010), over 56% of FPP is dedicated to the food industry. Since
food quality and package integrity can be compromised by the absorption of oil, grease, fat, and
moisture, barrier coatings are typically applied on food packaging papers to prevent such adverse
effects by imparting hydrophobic and oleophobic properties (both together known as omniphobic
properties) to FPPs. The most commonly used omniphobic coating materials in paper packaging
industry are highly repellent fluorinated-based compounds such as per- and polyfluoroalkyl
substances (PFASs) [13]. However, according to recent reports, PFASs are known to be
associated with cancer, developmental toxicity, immunotoxicity, and other health issues [14],
[15].
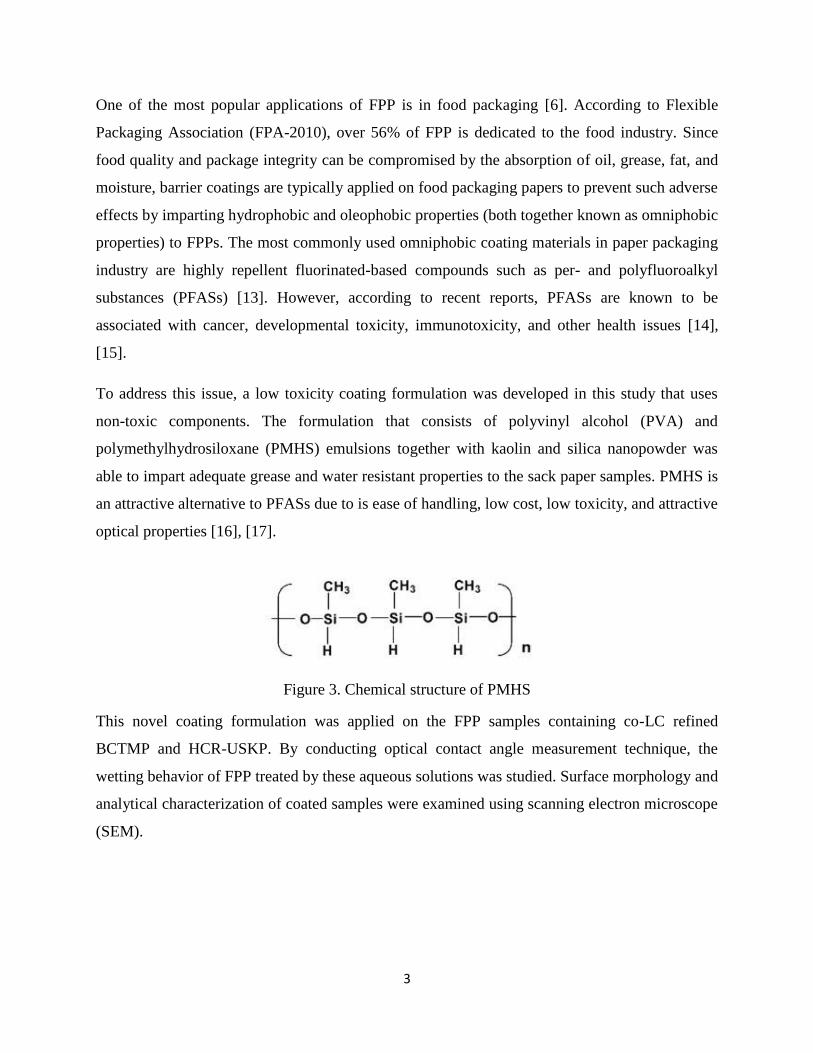
To address this issue, a low toxicity coating formulation was developed in this study that uses
non-toxic components. The formulation that consists of polyvinyl alcohol (PVA) and
polymethylhydrosiloxane (PMHS) emulsions together with kaolin and silica nanopowder was
able to impart adequate grease and water resistant properties to the sack paper samples. PMHS is
an attractive alternative to PFASs due to is ease of handling, low cost, low toxicity, and attractive
optical properties [16], [17].
Figure 3. Chemical structure of PMHS
This novel coating formulation was applied on the FPP samples containing co-LC refined
BCTMP and HCR-USKP. By conducting optical contact angle measurement technique, the
wetting behavior of FPP treated by these aqueous solutions was studied. Surface morphology and
analytical characterization of coated samples were examined using scanning electron microscope
(SEM).
4
1.2. Hypothesis and Objectives
The overall objective of this thesis was to produce an eco-friendly and cost effective oil and
water resistant FPP containing co-LC refined BCTMP and HCR-USKP.
It was attempted to provide following hypotheses for this project:
1- It is possible to maintain the mechanical properties of sack paper while introducing an
optimum amount of BCTMP to the furnish.
2- Barrier coatings containing PMHS and PVA emulsions could provide the desired omniphobic
properties to sack papers as an eco-friendly alternative to the fluorinated compounds.
Accordingly, Specific objectives of this study were sorted out as:
1- Investigating the effect of adding BCTMP to the currently used USKP on various mechanical
properties.
2- Determining optimum substitution percentage of HCR-USKP by BCTMP after co-LC refining
under different specific refining energies (SERs) and specific edge loads (SELs) by comparing
the mechanical performance of blends to the reference sample (100% LCR-HCR-USKP).
3-Examining and optimizing the non-fluorinated barrier coating formulation to achieve proper
oil and water repellency for the best combination of co-LC refined BCTMP and HCR-USKP.
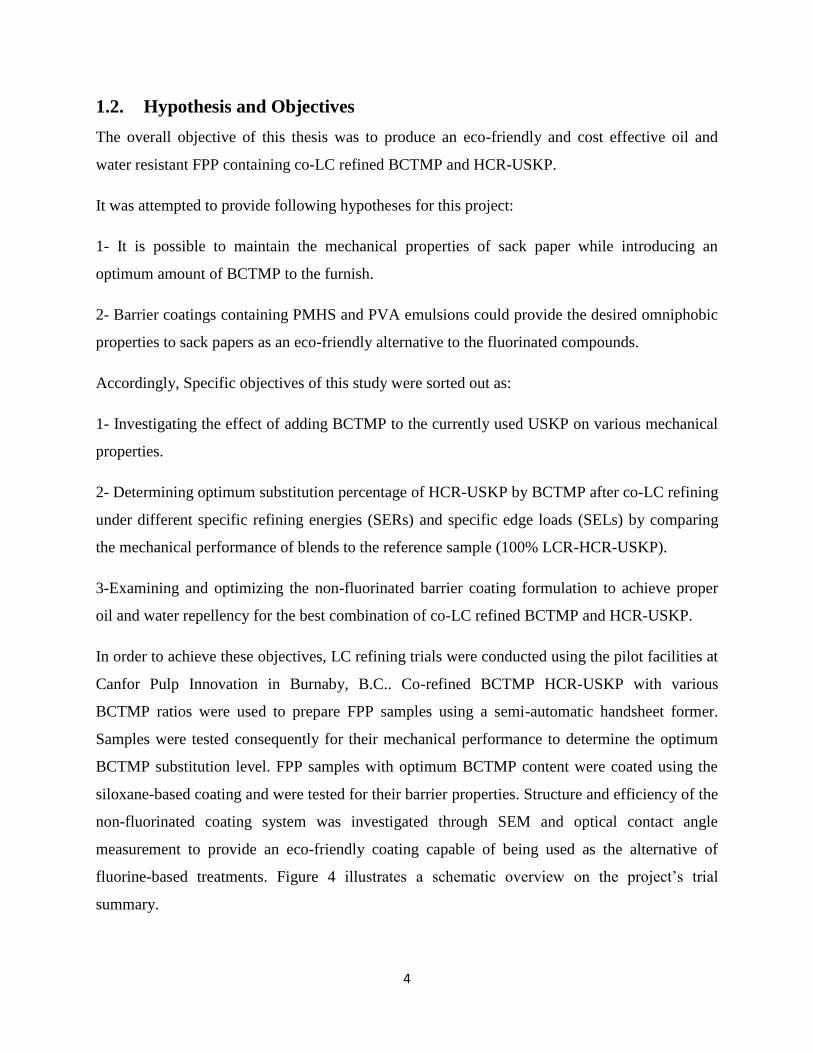
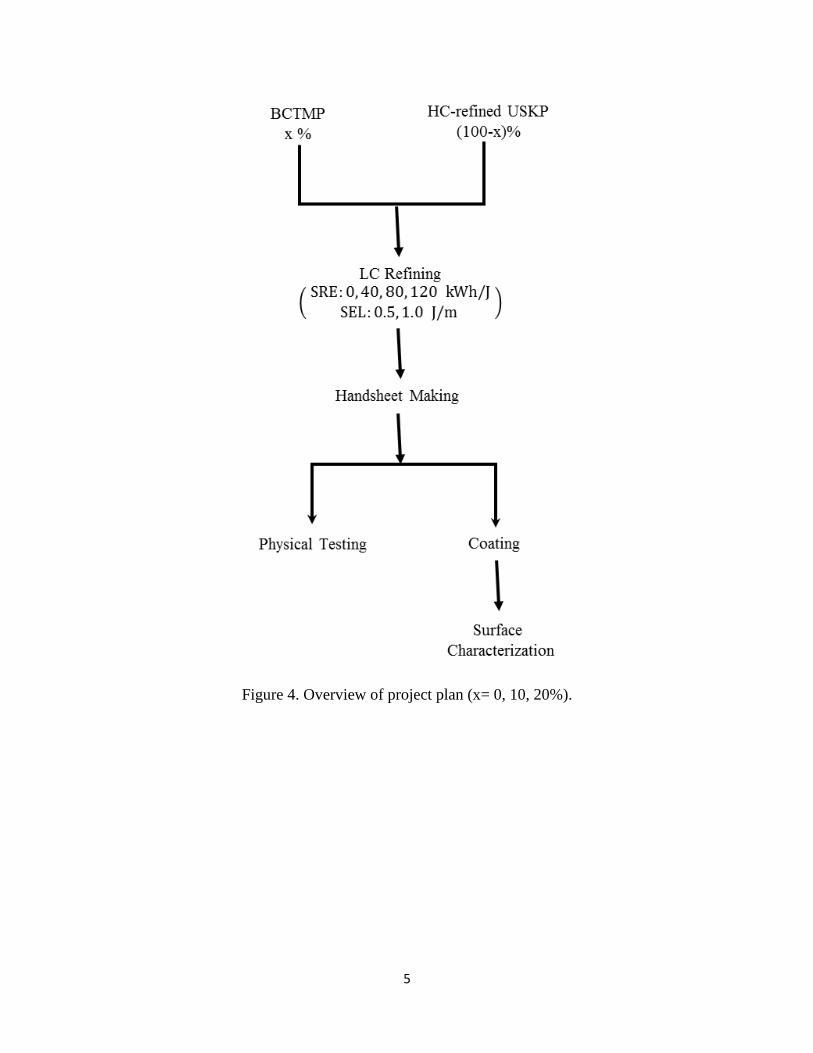
In order to achieve these objectives, LC refining trials were conducted using the pilot facilities at
Canfor Pulp Innovation in Burnaby, B.C.. Co-refined BCTMP HCR-USKP with various
BCTMP ratios were used to prepare FPP samples using a semi-automatic handsheet former.
Samples were tested consequently for their mechanical performance to determine the optimum
BCTMP substitution level. FPP samples with optimum BCTMP content were coated using the
siloxane-based coating and were tested for their barrier properties. Structure and efficiency of the
non-fluorinated coating system was investigated through SEM and optical contact angle
measurement to provide an eco-friendly coating capable of being used as the alternative of
fluorine-based treatments. Figure 4 illustrates a schematic overview on the project’s trial
summary.
5
Figure 4. Overview of project plan (x= 0, 10, 20%).
6
2. Literature Review
2.1. Wood Structure
Wood is the main source for manufacturing pulp and generally it contains elemental composition
of approximately 50% carbon, 6% hydrogen, 44% oxygen, and various amount of inorganics [2].
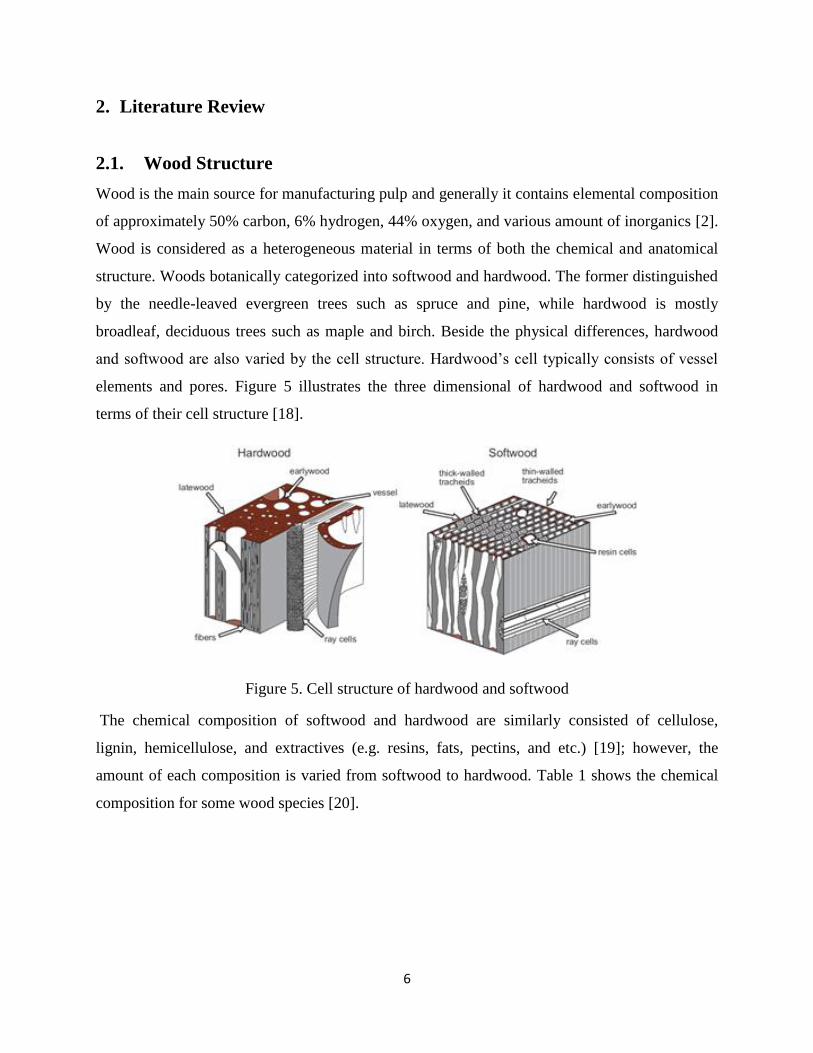
Wood is considered as a heterogeneous material in terms of both the chemical and anatomical
structure. Woods botanically categorized into softwood and hardwood. The former distinguished
by the needle-leaved evergreen trees such as spruce and pine, while hardwood is mostly
broadleaf, deciduous trees such as maple and birch. Beside the physical differences, hardwood
and softwood are also varied by the cell structure. Hardwood’s cell typically consists of vessel
elements and pores. Figure 5 illustrates the three dimensional of hardwood and softwood in
terms of their cell structure [18].
Figure 5. Cell structure of hardwood and softwood
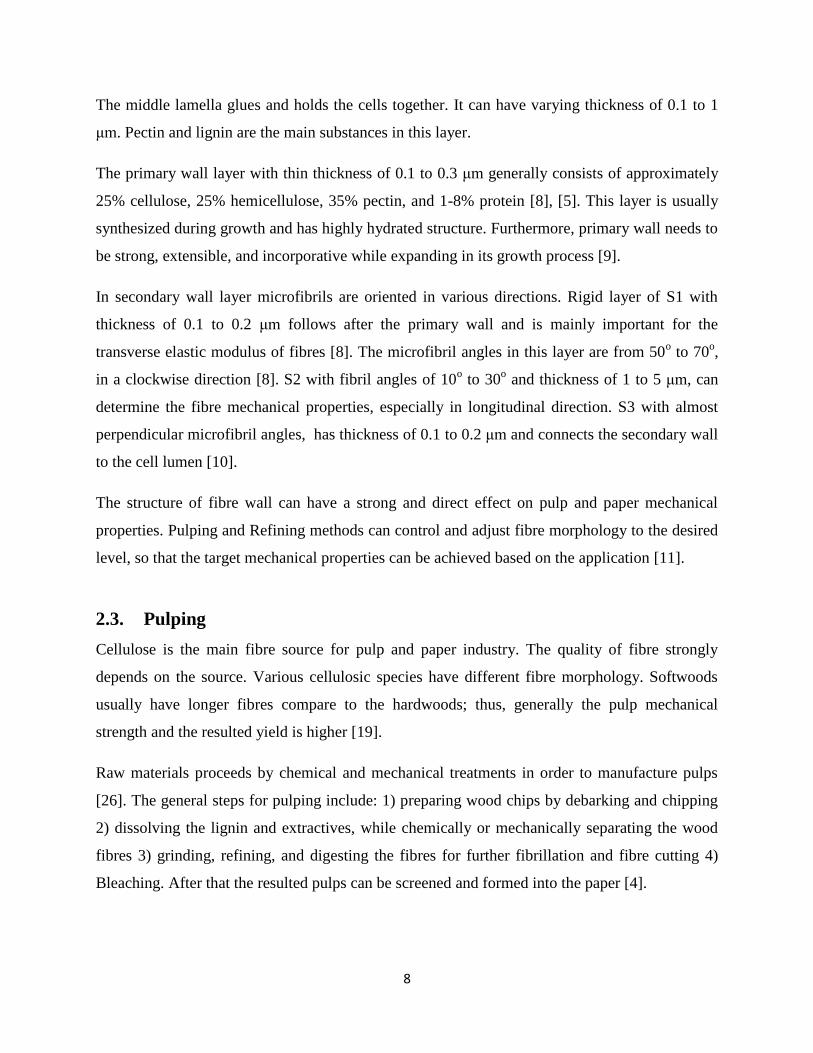
The chemical composition of softwood and hardwood are similarly consisted of cellulose,
lignin, hemicellulose, and extractives (e.g. resins, fats, pectins, and etc.) [19]; however, the
amount of each composition is varied from softwood to hardwood. Table 1 shows the chemical
composition for some wood species [20].
7
Constituent Spruce
(Picea glauca)
Silver Birch
(Betula verrucosa)
Cellulose (%) 39.5 41.0
Hemicellulose
-Glucomannan (%)
-Glucuronoxylan (%)
-Other polysaccharides (%)
17.2
10.4
3.0
2.3
27.5
2.6
Lignin (%) 27.5 22.0
Total Extractives 2.1 3.0
Table 1. Chemical composition of some wood species
In general, Softwoods such as spruce, pines, and firs have longer and stronger fibres. Hence, they
are mostly used for boxboards and packaging materials. Hardwoods, on the other hand, have
shorter and weaker fibre, but due to their smoother and more opaque structure they are mostly
suitable for printing purposes [19].
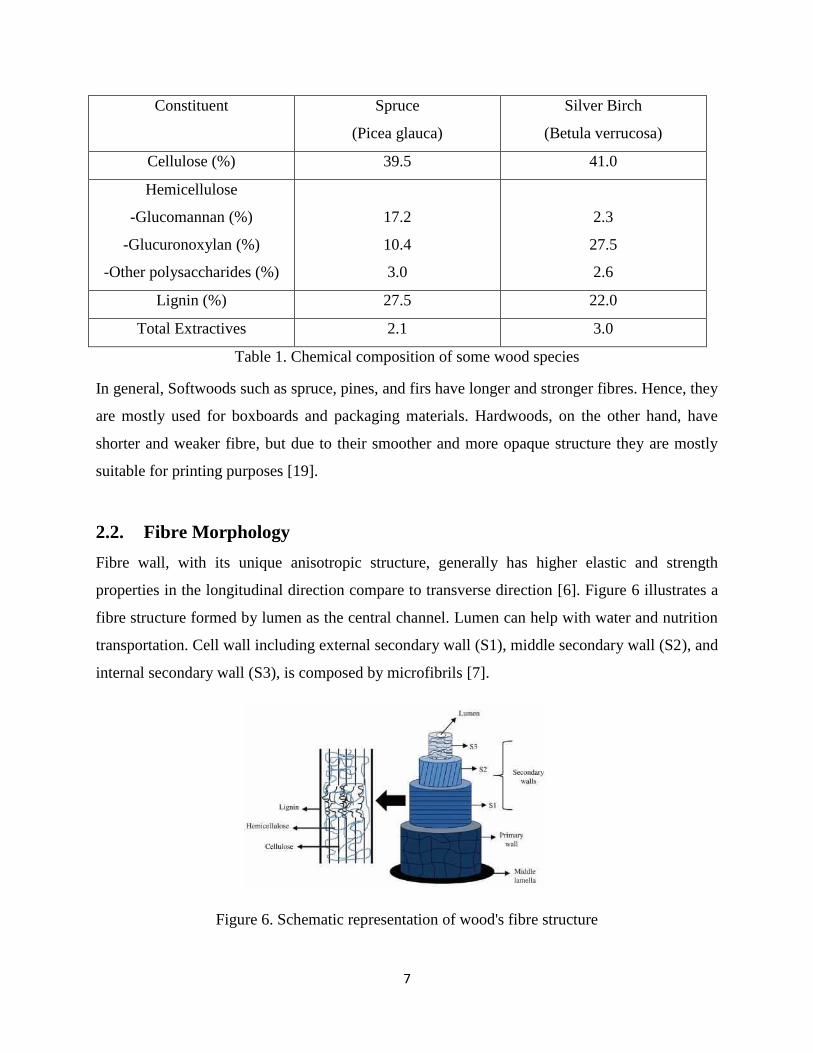
2.2. Fibre Morphology
Fibre wall, with its unique anisotropic structure, generally has higher elastic and strength
properties in the longitudinal direction compare to transverse direction [6]. Figure 6 illustrates a
fibre structure formed by lumen as the central channel. Lumen can help with water and nutrition
transportation. Cell wall including external secondary wall (S1), middle secondary wall (S2), and
internal secondary wall (S3), is composed by microfibrils [7].
Figure 6. Schematic representation of wood's fibre structure
8
The middle lamella glues and holds the cells together. It can have varying thickness of 0.1 to 1
μm. Pectin and lignin are the main substances in this layer.
The primary wall layer with thin thickness of 0.1 to 0.3 μm generally consists of approximately
25% cellulose, 25% hemicellulose, 35% pectin, and 1-8% protein [8], [5]. This layer is usually
synthesized during growth and has highly hydrated structure. Furthermore, primary wall needs to
be strong, extensible, and incorporative while expanding in its growth process [9].
In secondary wall layer microfibrils are oriented in various directions. Rigid layer of S1 with
thickness of 0.1 to 0.2 μm follows after the primary wall and is mainly important for the
transverse elastic modulus of fibres [8]. The microfibril angles in this layer are from 50o to 70
o,
in a clockwise direction [8]. S2 with fibril angles of 10o to 30
o and thickness of 1 to 5 μm, can
determine the fibre mechanical properties, especially in longitudinal direction. S3 with almost
perpendicular microfibril angles, has thickness of 0.1 to 0.2 μm and connects the secondary wall
to the cell lumen [10].
The structure of fibre wall can have a strong and direct effect on pulp and paper mechanical
properties. Pulping and Refining methods can control and adjust fibre morphology to the desired
level, so that the target mechanical properties can be achieved based on the application [11].
2.3. Pulping
Cellulose is the main fibre source for pulp and paper industry. The quality of fibre strongly
depends on the source. Various cellulosic species have different fibre morphology. Softwoods
usually have longer fibres compare to the hardwoods; thus, generally the pulp mechanical
strength and the resulted yield is higher [19].
Raw materials proceeds by chemical and mechanical treatments in order to manufacture pulps
[26]. The general steps for pulping include: 1) preparing wood chips by debarking and chipping
2) dissolving the lignin and extractives, while chemically or mechanically separating the wood
fibres 3) grinding, refining, and digesting the fibres for further fibrillation and fibre cutting 4)
Bleaching. After that the resulted pulps can be screened and formed into the paper [4].
9
2.3.1. Mechanical Pulping
In mechanical treatment, the bond between fibres is gradually broken by mechanical forces and
single fibre fragments can be achieved. Dissolvation of lignin in this pulping method cannot be
fully done; thus, the main part of the lignin can still be found in the resulted pulp. The partial
existence of lignin in the pulp can lead to having higher yield (85-96%) while maintaining the
acceptable strength properties and brightness [1], [27]. Due to wide particle size distribution in
this pulping method, optical and surface properties are usually improved. The low manufacturing
cost of mechanical pulps helps them to become a cost-effective option for various papermaking
industries [28]. Moreover, it is stated that mechanical pre-treatments usually have less
environmental impact compare to chemical ones.
The production of mechanical pulps usually consumes intensive amount of electrical energy and
the resulted strength properties are lower than chemical pulps [29]. Yellowing is another
negative prospect of mechanical fibres and is the main reason of discoloration for the most final
products such as newspapers [1]. There are various evidences of shive, undeveloped long fibre,
chop, or minishive’s existence in the mechanical pulp slurry. Thus, many properties such as
tensile strength still have to be enhanced in order to achieve a stronger final product.
Mechanical pulp can be either made from logs by a stone grinder or from wood chips by a
refiner. The former includes stone ground wood (SGW), temperature ground wood (TGW), and
pressure ground wood (PGW), while the latter includes refiner mechanical pulp (RMP),
thermomechanical pulp (TMP), and chemithermomechanical pulp (CTMP).
CTMP is the result of adding chemical and heat treatment to the refined wood chips. The
additional chemicals can help softening the lignin while not totally solving it. The resulted high-
yield-pulp is stronger and softer compare to other mechanical treatments [27], [30]. The
chemical used for this purpose is usually a weak solution of sodium sulphite at alkine PH.
Various bleaching agents such as sodium peroxide, hydrogen peroxide, sodium hydrosulfite and
sodium borohydride can be added to the CTMP in order to enhance its brightness and make it
free of dirt [31], [32].
10
2.3.2. Chemical Pulping
Chemical pulping is the most commercially used treatment for paper manufacturing [26]. In this
treatment chemicals react with lignin and hemicellulose to remove or dissolve it and produce
cleaner fibres. This delignification can help increasing the flexibility and result in stronger
mechanical properties compare to the mechanical pulping [19]. Kraft, acid sulfite, and neutral
sulfite semichemicals are the major pulping chemicals currently used in the industry [28].
Almost 75% of today pulp production over the world contributes to the chemical pulping. The
process consumes less amount of energy and can provide stronger pulps compare to the
mechanical treatments. However, it still has various disadvantages due to its capital-intensive
process, relatively low yield products, waste and low value by-product generation [12].
Sodium hydroxide (NAOH) and sodium sulphide (Na2S) are the most common chemicals added
to the kraft pulping process. Due to its high pulp strength and significant chemical recovery
efficiency (approximately 97%), this process has become one of the most dominant over the
other fibre chemical treatments [33].
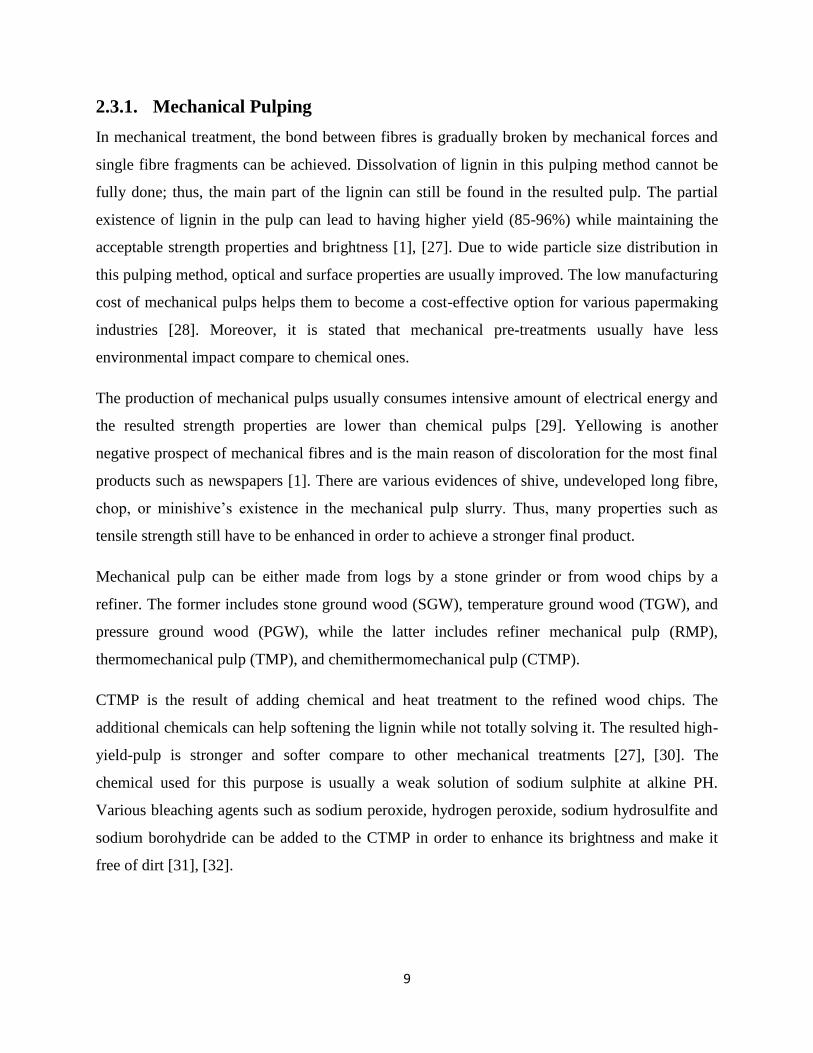
In the kraft process wood chips are cooked and their lignin is dissolved in the cooking liquor
called black liquor (BL). After passing various evaporation steps, the thick BL is burned in a
recovery boiler in order to separate cooking chemicals for regeneration and provide steam and
heat for pulping process. The resulted energy from BL burning can cover both mill and external
surplus energy. Figure 7 illustrates a diagram of the kraft pulping process [34].
Figure 7. Overview of kraft pulping process
11
2.4. Refining
Wood as a viscoelastic material can be deformed and affected by the temperature, moisture, and
time under a specific load such a refiner bar [35]. Refining can change the pulp and wood chips
properties from the known refining conditions to the point that is needed for the final application
[36]. Cellulose, as the main wood composition, is consisted of several chains of elementary fibril
units. The elementary units together can form microfibrils with diameters of 10 nm to 35 nm.
Each fibril has an angle around cell wall axis. The smaller the angle is the stronger the fibre
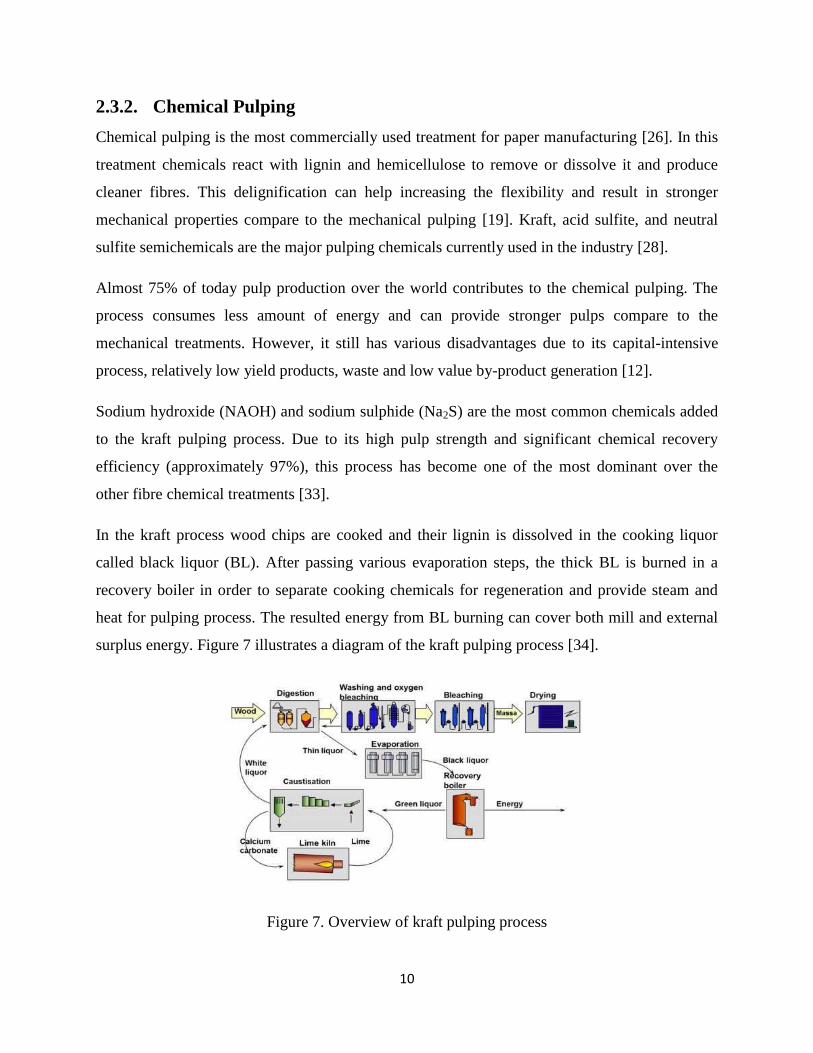
would be. Refining can affect fibre morphology such as amount of fibrillation, fibril angles, fine
formation, fibre length, fibre curl, kink, crimp, microcompression, crystallinity, and distribution
of surface chemical composition with fibre cutting to provide better properties [37], [26]. Figure
8 shows the influence of refining in fibrillation of fibres [35].
(a) (b)
Figure 8. (a) Fibrillated refined fibre (b) not equally fibrillated unrefined fibre
The ultimate goal of any refining process is to: 1) separate fibres from each other 2) reduce fibre
length by cutting 3) increase flexibility of fibres 4) reducing cell wall thickness by addition of
fibre fibrils 5) produce fines [35].
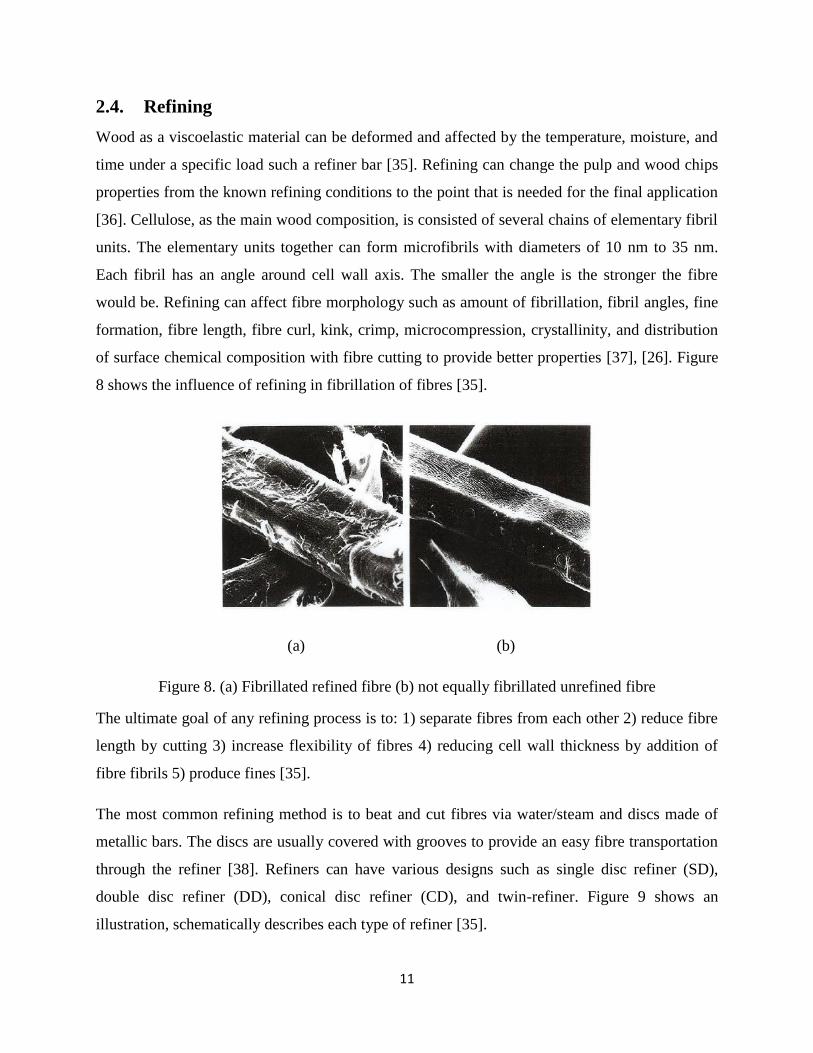
The most common refining method is to beat and cut fibres via water/steam and discs made of
metallic bars. The discs are usually covered with grooves to provide an easy fibre transportation
through the refiner [38]. Refiners can have various designs such as single disc refiner (SD),
double disc refiner (DD), conical disc refiner (CD), and twin-refiner. Figure 9 shows an
illustration, schematically describes each type of refiner [35].
12
Figure 9. Illustration of different refiners type
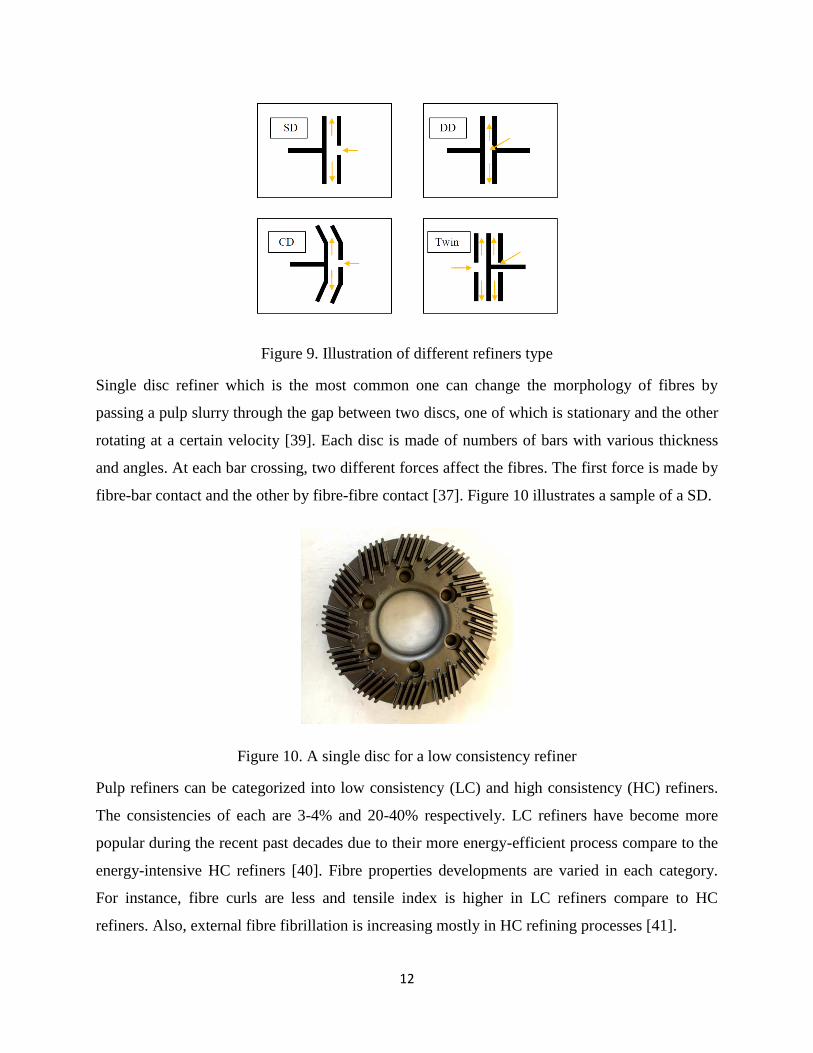
Single disc refiner which is the most common one can change the morphology of fibres by
passing a pulp slurry through the gap between two discs, one of which is stationary and the other
rotating at a certain velocity [39]. Each disc is made of numbers of bars with various thickness
and angles. At each bar crossing, two different forces affect the fibres. The first force is made by
fibre-bar contact and the other by fibre-fibre contact [37]. Figure 10 illustrates a sample of a SD.
Figure 10. A single disc for a low consistency refiner
Pulp refiners can be categorized into low consistency (LC) and high consistency (HC) refiners.
The consistencies of each are 3-4% and 20-40% respectively. LC refiners have become more
popular during the recent past decades due to their more energy-efficient process compare to the
energy-intensive HC refiners [40]. Fibre properties developments are varied in each category.
For instance, fibre curls are less and tensile index is higher in LC refiners compare to HC
refiners. Also, external fibre fibrillation is increasing mostly in HC refining processes [41].
13
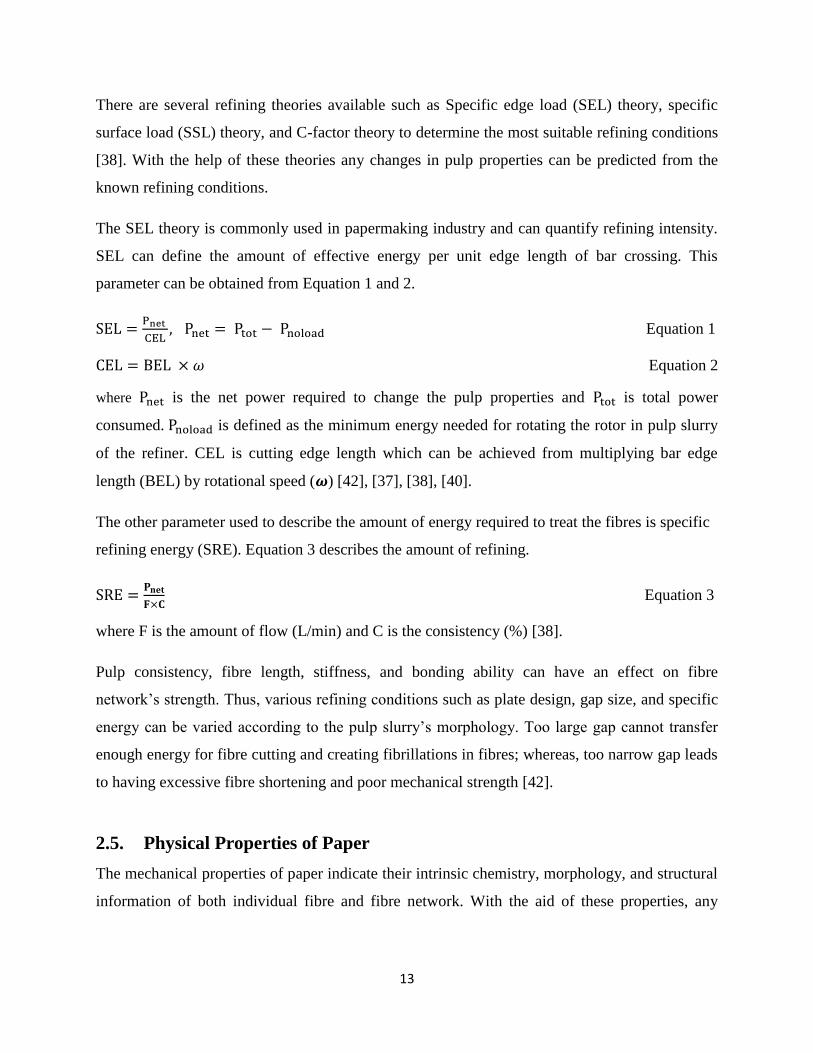
There are several refining theories available such as Specific edge load (SEL) theory, specific
surface load (SSL) theory, and C-factor theory to determine the most suitable refining conditions
[38]. With the help of these theories any changes in pulp properties can be predicted from the
known refining conditions.
The SEL theory is commonly used in papermaking industry and can quantify refining intensity.
SEL can define the amount of effective energy per unit edge length of bar crossing. This
parameter can be obtained from Equation 1 and 2.
Equation 1
Equation 2
where is the net power required to change the pulp properties and is total power
consumed. is defined as the minimum energy needed for rotating the rotor in pulp slurry
of the refiner. CEL is cutting edge length which can be achieved from multiplying bar edge
length (BEL) by rotational speed ( ) [42], [37], [38], [40].
The other parameter used to describe the amount of energy required to treat the fibres is specific
refining energy (SRE). Equation 3 describes the amount of refining.
Equation 3
where F is the amount of flow (L/min) and C is the consistency (%) [38].
Pulp consistency, fibre length, stiffness, and bonding ability can have an effect on fibre
network’s strength. Thus, various refining conditions such as plate design, gap size, and specific
energy can be varied according to the pulp slurry’s morphology. Too large gap cannot transfer
enough energy for fibre cutting and creating fibrillations in fibres; whereas, too narrow gap leads
to having excessive fibre shortening and poor mechanical strength [42].
2.5. Physical Properties of Paper
The mechanical properties of paper indicate their intrinsic chemistry, morphology, and structural
information of both individual fibre and fibre network. With the aid of these properties, any
14
changes in performance with time can be reflected. The ideal goal of any paper production is to
estimate the properties properly in order to meet any desired end-use requirements [43].
In order to conduct any property test, it is essential to collect sufficient number of representative
samples according to the procedures provided by TAPPI (Technical Association of the Pulp and
Paper Industry) standards T400-T500 [44]. The characteristics of paper generally divided into
two main categories:
1- Physical properties including basis weight, thickness, density, bulk, porosity, smoothness, and
sheet strength. Strength properties can be obtained by measuring tensile strength, stretch, tensile
energy absorption (TEA), stiffness, zero-span tensile strength, internal bonding strength, bursting
strength, and tearing resistance.
2- Optical properties including light transmittance, light absorption, and light reflectance [45],
[5].
Basis Weight (grammage) [g/m2]: This specification of the paper is expressed as mass per unit
area. Grammage is the most common parameter to the both consumer and the producer in
defining the price. Other mechanical properties are usually specified with regard to grammage as
they can be used to calculate the index value of many strength parameters [46]. Any attempts for
controlling the basis weight can lead to improving paper quality, increasing production rate, and
reducing raw material and energy consumption [47]. Grammage can be measured either directly
during paper manufacturing (on-machine) by beta-ray gauge in industrial scales or off-machine
by weighting piece of paper with a balance in laboratory scales [44].
Thickness (caliper) [μm]: This property can affect almost every physical and optical properties
of the paper and can be measured by calculating the distance between two circular plane surfaces
of 16 mm diameter, under a pressure of 8 to 9 psi [45], [44].
Density [g/cm3] and bulk [cm
3/g]: The density of paper is mass per unit volume and is typically
between 0.5 g/cm3 and 0.8 g/cm
3. It is known as probably the most important fundamental paper
property [45]. This parameter can determine the relative amount of air in paper that can affect
optical and strength properties. Density can be achieved from Equation 4 [44].
15
Equation 4
Wood species, paper machine specifications, refiners, and paper additive’s morphological
properties can successfully control the density of the final paper product [48]. Wet pressing and
calendering during papermaking can have serious effect on producing denser sheet [5]. Any
increase in amount of tensile and burst strength can be attributed to an increase in the density of
the paper; whereas, porosity and tearing strength have inverse relations to the density [45].
Bulk is known as the apparent specific volume and has an inverse correlation to density.
Paper bulk can have nominal effects on the amount of needed pulp desired for the final product
and direct impact on the production cost. High bulk can help with easier dewatering. However,
since bulkier papers can be obtained with relatively low tensile strength properties, papermakers
have been trying to find an optimum point wherein they can achieve high bulk while meeting the
strength requirements [49].
Porosity and air resistance [gurley second]: Paper porosity is known as the volume fraction of
all the voids within a sheet of paper [50]. Commercial papers are ultra-porous materials
containing as much as 70% air due to their anisotropic and deformable pores, voids, and surface
openings [45], [51].
Pulping can increase the amount of pores by thinning fibre wall and removing lignin. More pores
can be created and deformed later during papermaking and converting process [52], [51]. Fibres
with larger pores can develop larger molecular contact area between themselves and stronger
fibre/fibre joints. As the result, stronger sheets can be formed at the end [52].
The pore space can be classified into three major categories: Interconnected pores, which are
accessible from outside through one or both ends; dead-end pores, which are accessible from
only one end; and non-interconnected pores, which are not accessible at all.
Equation 5 indicates that porosity can be defined as the ratio of pore volume to total volume.
Porosity =
= 1-
Equation 5
16
where solid density can be determined accurately by gas/liquid displacement method.
Displacement method includes the measurement of the volume of gas or liquid that is contained
in a pore space [51].
Gas permeability can be used as an indirect method to describe pore structure and predict barrier
properties of the final paper [53]. It also describes how easily a gas is able to move through the
porous material [54]. Despite non-porous medium that gas flow is mostly turbulent, in porous
system gas flow is treated as a laminar or viscous flow [51].
One method to measure air permeability is to measure the time for a given volume of air to pass
through a sheet of defined area. This technique is known as air resistance Gurley method [3]. As
the grammage of the paper increases, a significant drop in permeability coefficient can be
achieved. Controlling porosity and degree of pore interconnection are the factors that should be
taken into consideration [53].
Since permeability will decrease with growth of TEA, it is necessary to find an optimum
condition. According to Gurnagul et al. (2016) the largest requirements for both high TEA and
air permeability can be met when refining intensity is kept within the range of 0.025-0.061
kW.h/odt per impact and specific refining energy is in the range of 350-500 kW.h/odt. It is
preferred to keep the specific energy low at 350 kW.h/odt, especially for producing sack papers
[55].
Smoothness and Roughness [Standard Cubic Centimeter per Minute-SCCM]: Smoothness
contributes with a paper surface free of any lumps, wire marks, fuzziness, foreign matter,
interfibre voids, crush, cockle, mechanical damage, and incompressibility [45]. This property can
play a major role for having a good printable surface and attractive appearance [56]. However,
due to having various effects in handling characteristics and tendency of the bags to slide over
each other during stacking, roughness can be a matter of importance in shipping sacks. Thus,
there should be an optimum roughness to provide both good printability and easy handling for
the packaging purposes [45].
One of the most common ways to measure paper roughness is Sheffield method (TAPPI 538). In
this procedure, roughness can be calculated by measuring the rate of air flow between the
specimen and two pressurized annular lands.
17
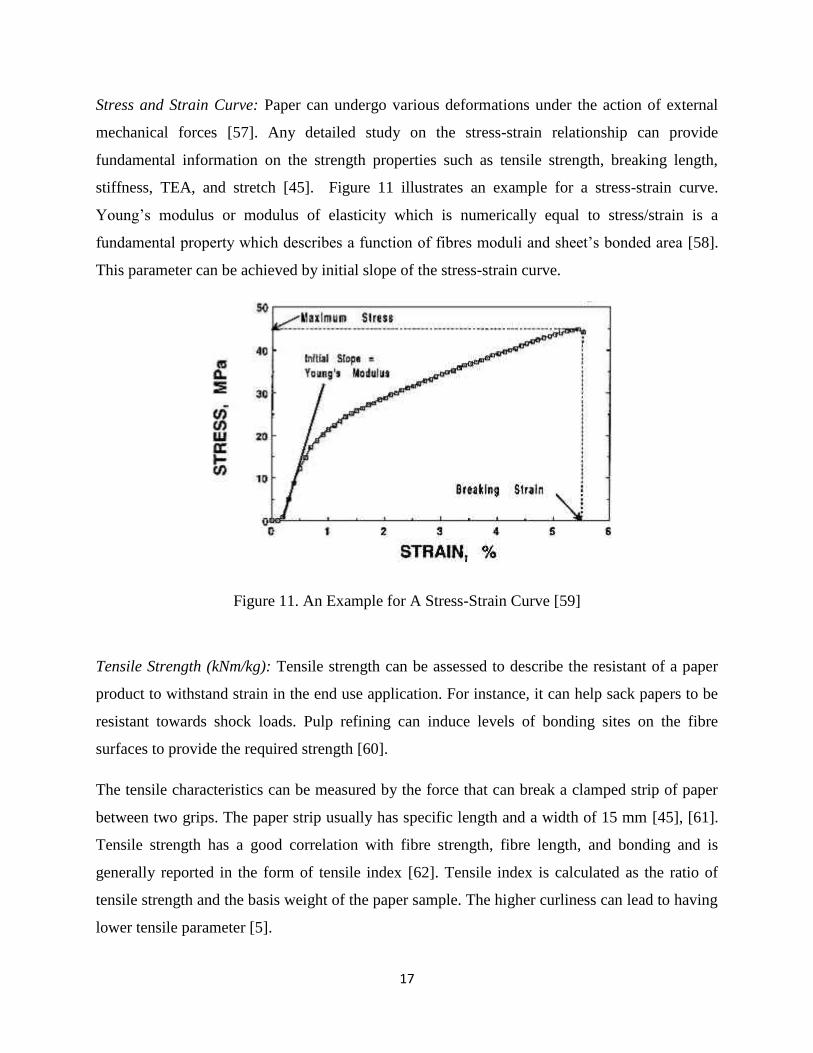
Stress and Strain Curve: Paper can undergo various deformations under the action of external
mechanical forces [57]. Any detailed study on the stress-strain relationship can provide
fundamental information on the strength properties such as tensile strength, breaking length,
stiffness, TEA, and stretch [45]. Figure 11 illustrates an example for a stress-strain curve.
Young’s modulus or modulus of elasticity which is numerically equal to stress/strain is a
fundamental property which describes a function of fibres moduli and sheet’s bonded area [58].
This parameter can be achieved by initial slope of the stress-strain curve.
Figure 11. An Example for A Stress-Strain Curve [59]
Tensile Strength (kNm/kg): Tensile strength can be assessed to describe the resistant of a paper
product to withstand strain in the end use application. For instance, it can help sack papers to be
resistant towards shock loads. Pulp refining can induce levels of bonding sites on the fibre
surfaces to provide the required strength [60].
The tensile characteristics can be measured by the force that can break a clamped strip of paper
between two grips. The paper strip usually has specific length and a width of 15 mm [45], [61].
Tensile strength has a good correlation with fibre strength, fibre length, and bonding and is
generally reported in the form of tensile index [62]. Tensile index is calculated as the ratio of
tensile strength and the basis weight of the paper sample. The higher curliness can lead to having
lower tensile parameter [5].
18
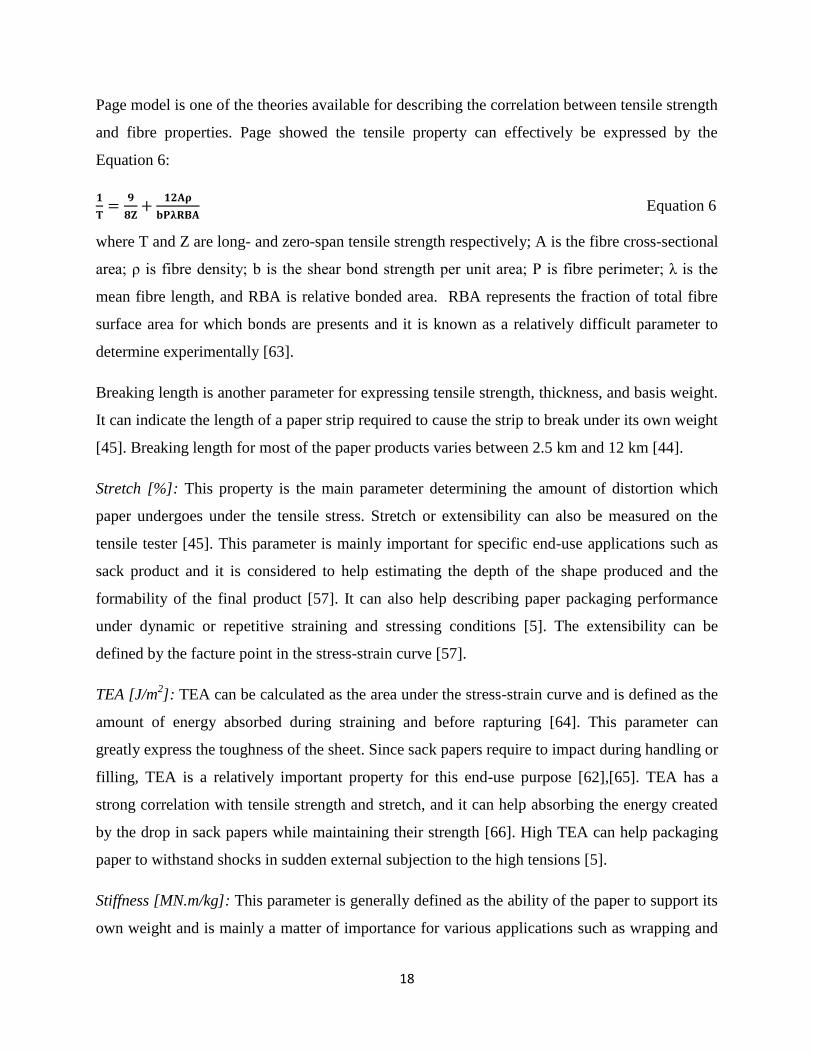
Page model is one of the theories available for describing the correlation between tensile strength
and fibre properties. Page showed the tensile property can effectively be expressed by the
Equation 6:
Equation 6
where T and Z are long- and zero-span tensile strength respectively; A is the fibre cross-sectional
area; ρ is fibre density; b is the shear bond strength per unit area; P is fibre perimeter; λ is the
mean fibre length, and RBA is relative bonded area. RBA represents the fraction of total fibre
surface area for which bonds are presents and it is known as a relatively difficult parameter to
determine experimentally [63].
Breaking length is another parameter for expressing tensile strength, thickness, and basis weight.
It can indicate the length of a paper strip required to cause the strip to break under its own weight
[45]. Breaking length for most of the paper products varies between 2.5 km and 12 km [44].
Stretch [%]: This property is the main parameter determining the amount of distortion which
paper undergoes under the tensile stress. Stretch or extensibility can also be measured on the
tensile tester [45]. This parameter is mainly important for specific end-use applications such as
sack product and it is considered to help estimating the depth of the shape produced and the
formability of the final product [57]. It can also help describing paper packaging performance
under dynamic or repetitive straining and stressing conditions [5]. The extensibility can be
defined by the facture point in the stress-strain curve [57].
TEA [J/m2]: TEA can be calculated as the area under the stress-strain curve and is defined as the
amount of energy absorbed during straining and before rapturing [64]. This parameter can
greatly express the toughness of the sheet. Since sack papers require to impact during handling or
filling, TEA is a relatively important property for this end-use purpose [62],[65]. TEA has a
strong correlation with tensile strength and stretch, and it can help absorbing the energy created
by the drop in sack papers while maintaining their strength [66]. High TEA can help packaging
paper to withstand shocks in sudden external subjection to the high tensions [5].
Stiffness [MN.m/kg]: This parameter is generally defined as the ability of the paper to support its
own weight and is mainly a matter of importance for various applications such as wrapping and
19
printing papers. Stiffness depends on the ability of the outside layer of the paper to stretch and
inside layer to undergo compression. This property is known to be proportional to Young’s
modulus (E) times the moment of inertia (I) divided by the basis weight of the paper [44], [45].
In order to increase tensile stiffness of paper, there is a crucial need for further investigation on
fibre-fibre bonds and fibre length [67]. Long fibres from chemical pulp tend to have better
bonding and higher elastic modulus; thus, type of fibres play a major role in determining the
paper stiffness [68].
Zero-Span Tensile Strength [N/cm]: This strength property highly depends on the intrinsic fibre
resistance [69]. Generally strength of fibres is not equally distributed through the network, which
makes some of the fibres to reach their ultimate strength prior to the others during straining. By
increasing the strain, unbroken fibres will get incremental load increase in order to compensate
for the loss of the broken fibres. At some specific stress point, majority of fibres are broken and
the increase in load cannot be compensated; thus, the paper will fracture. This maximum stress is
known as the zero-span tensile strength [70]. In other words, zero-span tensile test can indicate
the average ultimate strength of randomly oriented fibres in a paper network [45].
This property focuses on individual fibre strength rather than paper (fibre network) strength and
can be studied by conducting tensile test at a very short span length [71]. The former tensile
measurement method discussed in previous section is not sufficient enough for detailed
specifications of pulp properties due to lack of capability for separating between fibre strength
and fibre-to-fibre bonding strength. Since fibres are capable to form bond together, in order to
get exact evaluation of pulp properties, there is a crucial need for testing tensile properties of
fibres separately. To meet this purpose, zero-span tensile test method has been widely used [72].
In order to measure this property, paper specimen can be clamped between two grips so that the
resultant tensile stress can be applied across a plane through a thickness. The paper can be pull
apart by a zero gauge length and as a result fibre strength can be measured. Fibre pull-out is an
important factor for determining zero-span tensile and can be affected by inter-fibre bonds, fibre
length, fibre orientation, fibre curl, and fibre strength. Poorly bonded fibres tend to have higher
pull-out compare to the well-bonded pulps [73], [70].
20
Cowan et. al proposed “wet” zero-span tensile test, in which by wetting the paper samples, all
interfibre bonds can be effectively broken and is a valuable method of measuring the strength of
the wet fibres [69]. However, later Gurnagul and Page suggested that the difference between wet
and dry zero-span tensile strength does not relate to the loss of bonding. This difference is mostly
known to rely on the pulp type or the mechanical and chemical treatments to the fibres during
pulping, refining, and bleaching. Since most of data represent lower zero-span tensile strength
test result for wet sheets than for dry ones, it can be concluded that wetting tends to reduce the
strength of the individual fibres that have been degraded by previous treatments prior to
handsheet making process [70], [73].
Internal Bond Strength [J/m2]: Internal bonding is defined as the physical breaking energy in
constant strain at breakage and it is known to be proportional to “Z” directional tensile strength.
[74]. This strength property directly depends on number of bonds, the average area per bond, and
their specific strength. The pulp type and the treatment conditions prior papermaking process can
affect the internal bond strength [75]. Any impulses, impacts, and shock load to the paper
packaging can cause structural failures and delamination within the sheet and affect the internal
bonds. This property can be determined by measuring the amount of energy required to cause
delamination and the “Z’ directional rapture to the paper specimen [62]. Internal bonding
strength is mostly known to be important in any end-use applications having printing and coating
steps in their papermaking procedure [45].
Scott bond test is a general method for measuring the tensile strength in the Z direction. In this
technique a double sided adhesive tapes are used to attach a specimen to two metal strips. It is
important that the tape not penetrate to the sample and add undesired reinforcement. The upper
and lower layers can be separated and pulled apart by a pendulum hitting it with a high loading
rate. The energy used for this purpose can be obtained from the variations in kinetic energy of
the pendulum [76], [73].
Bursting Strength [kPa]: This empirical property can be used as a measure of resistance towards
rapture and is defined as the hydrostatic pressure required to rapture the handsheet when
deformed at a constant controlled loading rate [45], [62]. Mullen test can be conducted in paper
packaging industry to measure the product integrity. According to the test procedure, a paper
21
sample can be fixed by circular rigid clamps and loaded by a rubber diaphragm to provide the
rapture pressure [77].
Bursting strength is widely known to be a function of tensile strength and the square-root of
stretch [78]. Carson has shown the relation between burst and tensile strength for machine-made
papers can be followed by Equation 7:
PR=2T Equation 7
where P, R, and T are bursting strength, radius of paper curvature at the rapture, and tensile
strength in machine direction per inch of width respectively. The values for R can be calculated
from the stretch.
Fibre length, inter-fibre bonding, beating, and drying conditions are also some of the other
factors affecting the bursting strength [45].
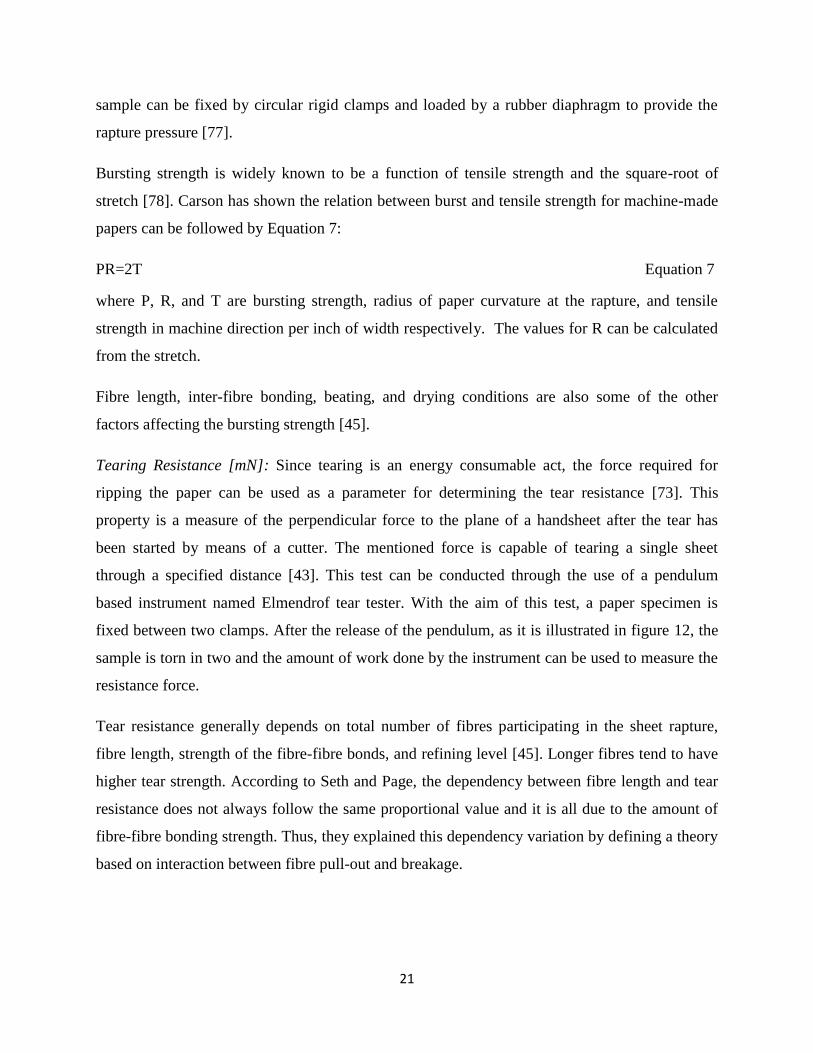
Tearing Resistance [mN]: Since tearing is an energy consumable act, the force required for
ripping the paper can be used as a parameter for determining the tear resistance [73]. This
property is a measure of the perpendicular force to the plane of a handsheet after the tear has
been started by means of a cutter. The mentioned force is capable of tearing a single sheet
through a specified distance [43]. This test can be conducted through the use of a pendulum
based instrument named Elmendrof tear tester. With the aim of this test, a paper specimen is
fixed between two clamps. After the release of the pendulum, as it is illustrated in figure 12, the
sample is torn in two and the amount of work done by the instrument can be used to measure the
resistance force.
Tear resistance generally depends on total number of fibres participating in the sheet rapture,
fibre length, strength of the fibre-fibre bonds, and refining level [45]. Longer fibres tend to have
higher tear strength. According to Seth and Page, the dependency between fibre length and tear
resistance does not always follow the same proportional value and it is all due to the amount of
fibre-fibre bonding strength. Thus, they explained this dependency variation by defining a theory
based on interaction between fibre pull-out and breakage.
22
Figure 12. Elmendrof Test [73]
Since breakage is a dominant consequence for strongly bonded networks, long fibres have less
effects in increasing the tear factor; likewise in weaker networks, due to fibre-pull out effect,
long fibres can play an important role in increasing the tear resistance [79].
Moreover, curly fibres with their high fibre pull-out effects are also known to improve tear
strength by having high stress distribution along the length of these fibres [5].
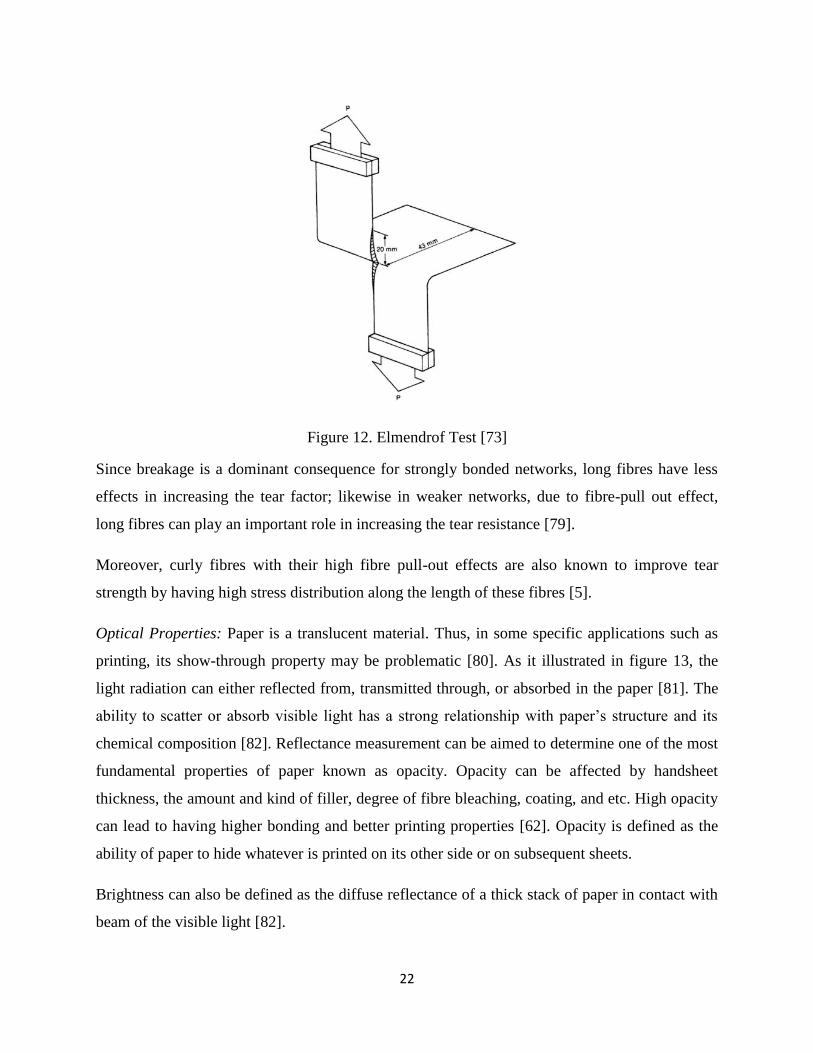
Optical Properties: Paper is a translucent material. Thus, in some specific applications such as
printing, its show-through property may be problematic [80]. As it illustrated in figure 13, the
light radiation can either reflected from, transmitted through, or absorbed in the paper [81]. The
ability to scatter or absorb visible light has a strong relationship with paper’s structure and its
chemical composition [82]. Reflectance measurement can be aimed to determine one of the most
fundamental properties of paper known as opacity. Opacity can be affected by handsheet
thickness, the amount and kind of filler, degree of fibre bleaching, coating, and etc. High opacity
can lead to having higher bonding and better printing properties [62]. Opacity is defined as the
ability of paper to hide whatever is printed on its other side or on subsequent sheets.
Brightness can also be defined as the diffuse reflectance of a thick stack of paper in contact with
beam of the visible light [82].
23
Figure 13. Light/Sheet Interaction
2.6. Sack Paper
The worldwide paper and board production overreached 370 million tons annually, in which
40% of these amounts dedicate to paper and board packaging. Among these paper packaging,
sack papers have become popular owing to their good paper structure, high strength, and
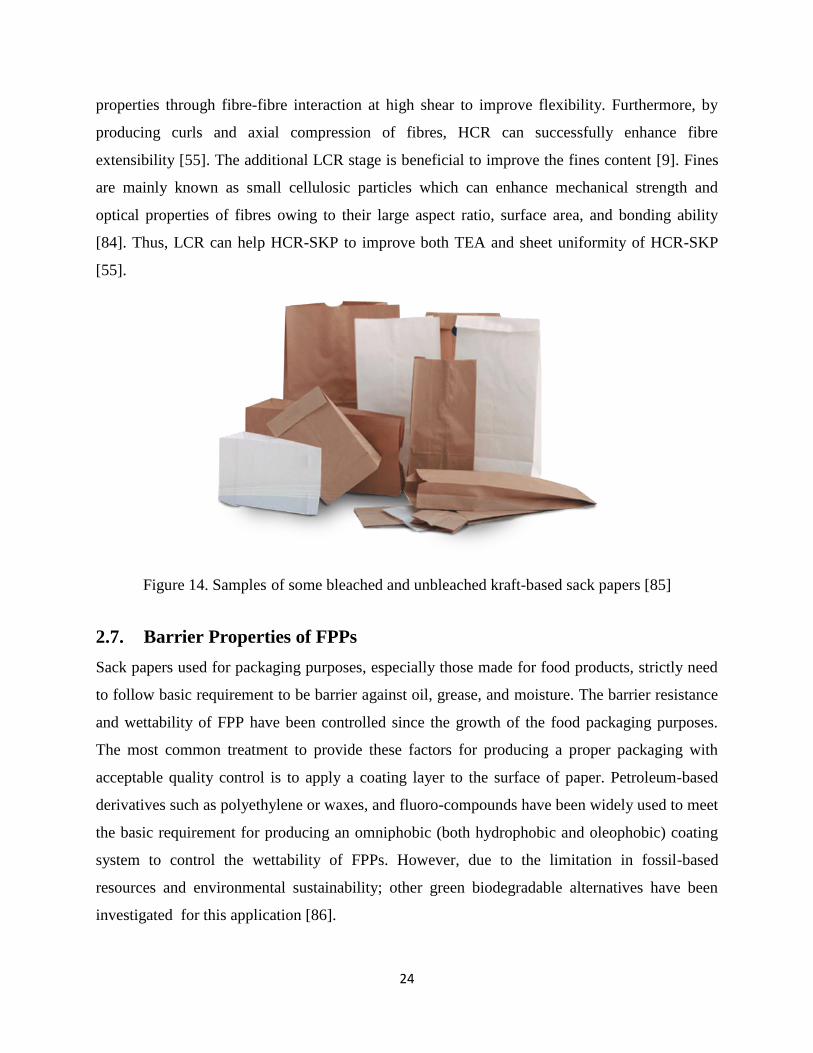
elasticity [4]. Sack papers (Figure 14) are usually made of bleached or unbleached kraft
softwood pulp in various weights from 50 to 134 g/m2
[44]. Paper as the most commonly used
product in packaging industry can exhibit moisture- and temperature-dependent anisotropic and
non-linear behavior. Paper mechanical properties can be strongly affect its end-use performance
and application [83].
Tensile strength, strain, TEA, porosity, and printability are the key properties for sack papers.
Strength defines the final product durability during filling and handling process. Porosity is
generally important for quick filling of powdered goods and printability is often required for the
packaging purposes [55]. Coating and refining are two main factors of which they can improve
bonding ability of sack papers to form stronger and smoother papers. These treatments can also
play the major role in controlling the porosity of these packaging products [38]. High porosity in
sack papers can increase filling speed, decrease sack breakage, and reduce dusting at filling
which has better environmental impact. Also, it can help air to escape quicker so the size of the
sack can be reduced.
In order to achieve desired amount of these properties, SKP usually undergoes HC followed by
LC refining. The yield range for this grade is usually 48-70%. HCR is beneficial for SKP to
enhance TEA as well as stretch [9]. This refining process can usually develop optimized pulp
24
properties through fibre-fibre interaction at high shear to improve flexibility. Furthermore, by
producing curls and axial compression of fibres, HCR can successfully enhance fibre
extensibility [55]. The additional LCR stage is beneficial to improve the fines content [9]. Fines
are mainly known as small cellulosic particles which can enhance mechanical strength and
optical properties of fibres owing to their large aspect ratio, surface area, and bonding ability
[84]. Thus, LCR can help HCR-SKP to improve both TEA and sheet uniformity of HCR-SKP
[55].
Figure 14. Samples of some bleached and unbleached kraft-based sack papers [85]
2.7. Barrier Properties of FPPs
Sack papers used for packaging purposes, especially those made for food products, strictly need
to follow basic requirement to be barrier against oil, grease, and moisture. The barrier resistance
and wettability of FPP have been controlled since the growth of the food packaging purposes.
The most common treatment to provide these factors for producing a proper packaging with
acceptable quality control is to apply a coating layer to the surface of paper. Petroleum-based
derivatives such as polyethylene or waxes, and fluoro-compounds have been widely used to meet
the basic requirement for producing an omniphobic (both hydrophobic and oleophobic) coating
system to control the wettability of FPPs. However, due to the limitation in fossil-based
resources and environmental sustainability; other green biodegradable alternatives have been
investigated for this application [86].
25
Wetting is generally known as a surface phenomenon. Two major intermolecular interactions of
dispersive and acid-base forces contribute in the wetting and adhesion behavior of surfaces.
Wood compounds, surface active agents added to pulps during refining, and fibre morphologies
can have significant effects on the penetration/absorption of liquid in/by paper. Contact angle
measurement is a simple method to describe wettability function by determining the angle
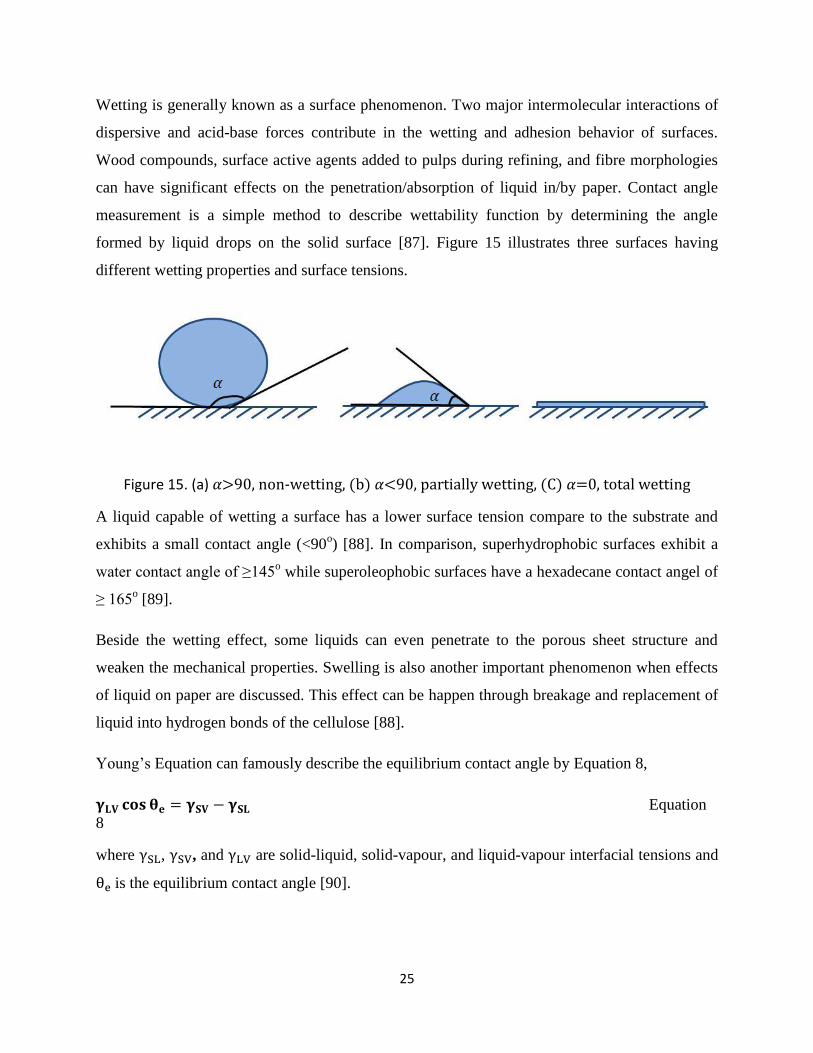
formed by liquid drops on the solid surface [87]. Figure 15 illustrates three surfaces having
different wetting properties and surface tensions.
Figure 15. (a) 𝛼>90, non-wetting, (b) 𝛼<90, partially wetting, (C) 𝛼=0, total wetting
A liquid capable of wetting a surface has a lower surface tension compare to the substrate and
exhibits a small contact angle (<90o) [88]. In comparison, superhydrophobic surfaces exhibit a
water contact angle of ≥145o while superoleophobic surfaces have a hexadecane contact angel of
≥ 165o [89].
Beside the wetting effect, some liquids can even penetrate to the porous sheet structure and
weaken the mechanical properties. Swelling is also another important phenomenon when effects
of liquid on paper are discussed. This effect can be happen through breakage and replacement of
liquid into hydrogen bonds of the cellulose [88].
Young’s Equation can famously describe the equilibrium contact angle by Equation 8,
Equation
8
where , , and are solid-liquid, solid-vapour, and liquid-vapour interfacial tensions and
is the equilibrium contact angle [90].
26
Since paper displays higher surface energy compare to most liquids, including water and oil, it is
not immune to wetting [91]. Thus, sizing or coating materials are often used to protect paper
from wetting by lowering the paper surface energy [86]. However, achieving a favorable
omniphobic surface can be challenging due to variations in intrinsic surface tension between
water and oil drops. Most coatings and sizing products are designed to introduce hydrophobic
characteristics to the paper surface. To impart adequate omniphobic property to the paper
surface, it is crucial to add a very low surface energy coating material with carefully engineered
surface structures [92].
The family of perfluoroalkyl acids (PFASs) such as perfluorooctanoic acid (PFOA) and
perfluorooctanesulfonic acid (PFOS) are widely used in stain-resistant and omniphobic paper
packaging products. Their carbon-fluorine bonds provide great resistance towards degradation
and promising low surface energy surfaces when used as a coating barrier on the paper
substrates. PFAS’ are known to be one of the few substances available that can bring
oleophobicity to the packaging surfaces. However, their toxicity and low environmental
sustainability makes them a serious threat in regards to both wildlife and human health. Research
conducted by the US Food and Drug Administration (FDA) has shown that PFAS’ can cause
health issues such as kidney and testicular cancer, low birth weight, thyroid disease, obesity,
immune suppression, and many more other health deteriorations. PFAS’ are widely used in food
packaging papers especially in the fast food industry. To address these concerns, various
attempts have been made to eliminate fluorinated compounds from paper products. For example,
it has been tried to replace long-chain PFAS’ with shorter chain (less than 6 carbons in length)
fluorinated-based or poly fluorinated polyether-based alternatives that have lower toxicity level
and are less bio-accumulative. However, these replacements also contain some percentage of
fluorine in their structure [14], [93], [94].
With increasing demands for sustainable products in recent years, various studies have been
conducted to find eco-friendly alternatives to the fluorinated compounds. However, achieving a
similar performance to PFAS coatings in terms of oil and water resistance behavior is still an
issue for the paper industry [95].
27
The above discussions highlight the need to identify a non-toxic omniphobic coating agent that
could achieve similar or better performance compared to the PFAS in the packaging paper
industry.
3. Methodology
3.1. Co-refining of BCTMP and HCR-USKP
HCR-USKP (softwood with freeness of 482 ml,) was obtained from Canfor’s Prince George mill
and a market BCTMP (softwood with freeness of 474 ml and brightness of 75.8%) from
Canfor’s Taylor mill.
The two pulps were mixed together prior to co-refining at a consistency of 4% using a pilot
refiner (Frank-PTI Laboratory Refiner LR40, with 6 inch diameter plates) located at Canfor Pulp
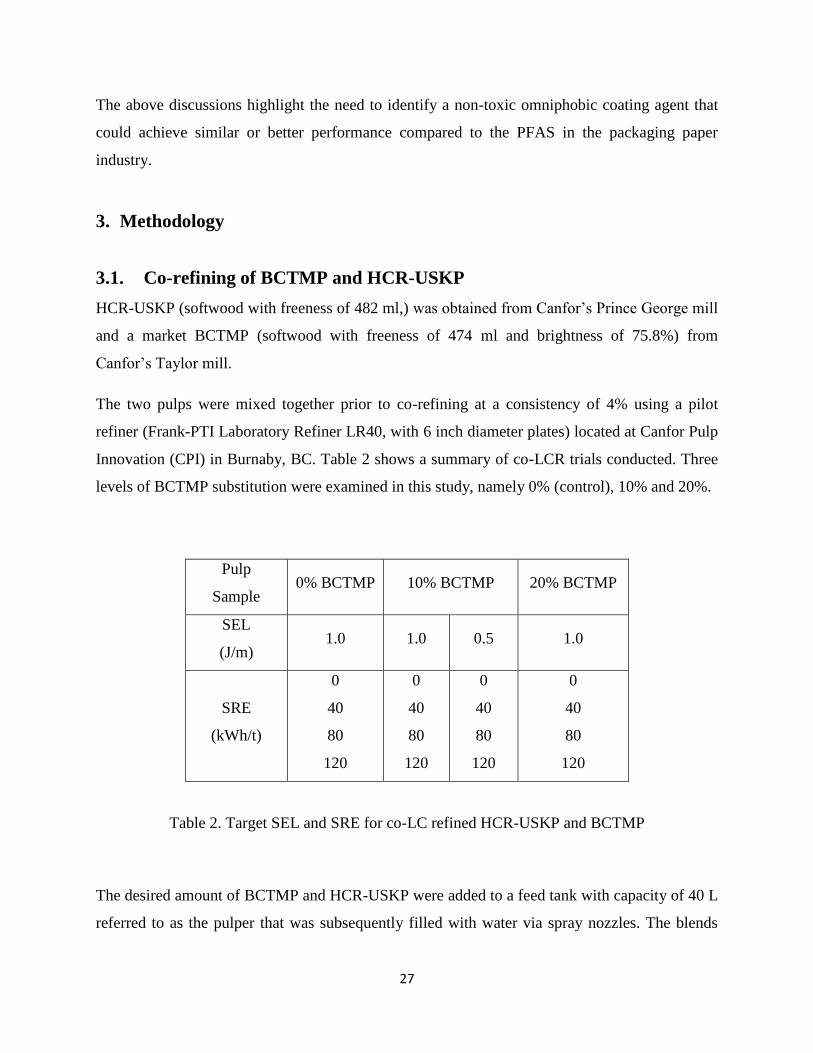
Innovation (CPI) in Burnaby, BC. Table 2 shows a summary of co-LCR trials conducted. Three
levels of BCTMP substitution were examined in this study, namely 0% (control), 10% and 20%.
Pulp
Sample 0% BCTMP 10% BCTMP 20% BCTMP
SEL
(J/m) 1.0 1.0 0.5 1.0
SRE
(kWh/t)
0
40
80
120
0
40
80
120
0
40
80
120
0
40
80
120
Table 2. Target SEL and SRE for co-LC refined HCR-USKP and BCTMP
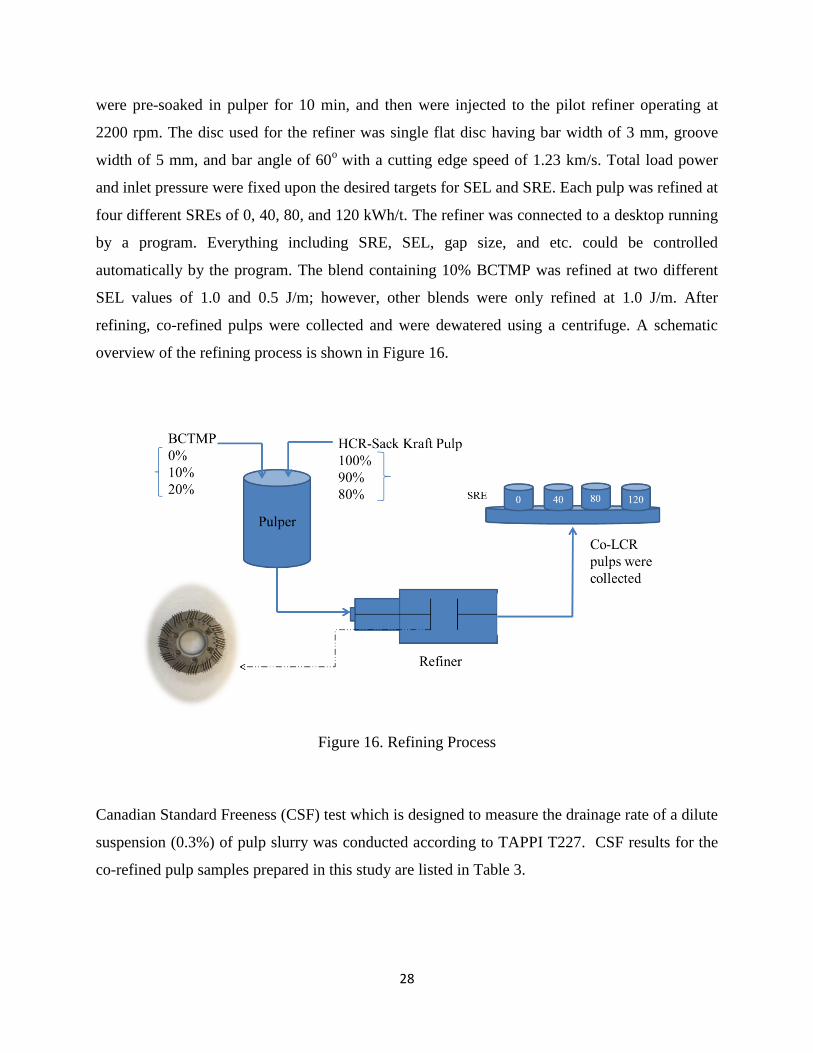
The desired amount of BCTMP and HCR-USKP were added to a feed tank with capacity of 40 L
referred to as the pulper that was subsequently filled with water via spray nozzles. The blends
28
were pre-soaked in pulper for 10 min, and then were injected to the pilot refiner operating at
2200 rpm. The disc used for the refiner was single flat disc having bar width of 3 mm, groove
width of 5 mm, and bar angle of 60o with a cutting edge speed of 1.23 km/s. Total load power
and inlet pressure were fixed upon the desired targets for SEL and SRE. Each pulp was refined at
four different SREs of 0, 40, 80, and 120 kWh/t. The refiner was connected to a desktop running
by a program. Everything including SRE, SEL, gap size, and etc. could be controlled
automatically by the program. The blend containing 10% BCTMP was refined at two different
SEL values of 1.0 and 0.5 J/m; however, other blends were only refined at 1.0 J/m. After
refining, co-refined pulps were collected and were dewatered using a centrifuge. A schematic
overview of the refining process is shown in Figure 16.
Figure 16. Refining Process
Canadian Standard Freeness (CSF) test which is designed to measure the drainage rate of a dilute
suspension (0.3%) of pulp slurry was conducted according to TAPPI T227. CSF results for the
co-refined pulp samples prepared in this study are listed in Table 3.
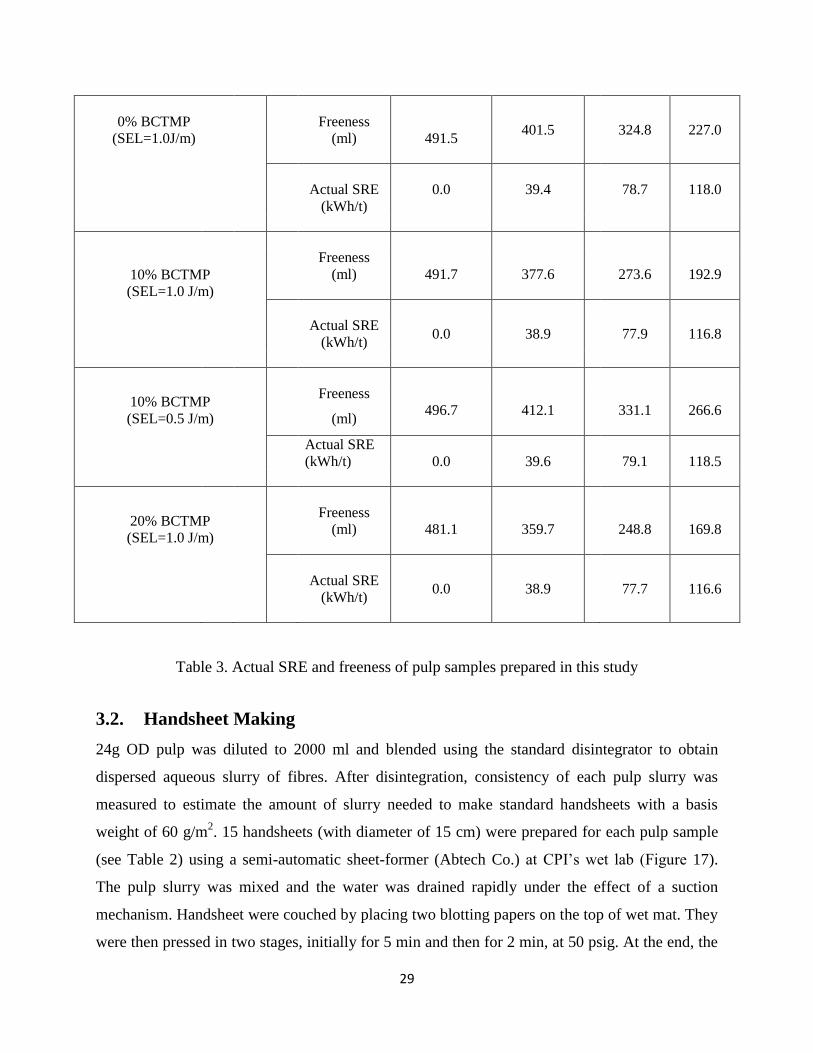
29
0% BCTMP
(SEL=1.0J/m)
Freeness
(ml)
491.5 401.5 324.8 227.0
Actual SRE
(kWh/t)
0.0 39.4 78.7 118.0
10% BCTMP
(SEL=1.0 J/m)
Freeness
(ml)
491.7 377.6 273.6 192.9
Actual SRE
(kWh/t) 0.0 38.9 77.9 116.8
10% BCTMP
(SEL=0.5 J/m)
Freeness
(ml) 496.7 412.1 331.1 266.6
Actual SRE
(kWh/t)
0.0
39.6
79.1
118.5
20% BCTMP
(SEL=1.0 J/m)
Freeness
(ml)
481.1 359.7 248.8 169.8
Actual SRE
(kWh/t)
0.0 38.9 77.7 116.6
Table 3. Actual SRE and freeness of pulp samples prepared in this study
3.2. Handsheet Making
24g OD pulp was diluted to 2000 ml and blended using the standard disintegrator to obtain
dispersed aqueous slurry of fibres. After disintegration, consistency of each pulp slurry was
measured to estimate the amount of slurry needed to make standard handsheets with a basis
weight of 60 g/m2. 15 handsheets (with diameter of 15 cm) were prepared for each pulp sample
(see Table 2) using a semi-automatic sheet-former (Abtech Co.) at CPI’s wet lab (Figure 17).
The pulp slurry was mixed and the water was drained rapidly under the effect of a suction
mechanism. Handsheet were couched by placing two blotting papers on the top of wet mat. They
were then pressed in two stages, initially for 5 min and then for 2 min, at 50 psig. At the end, the
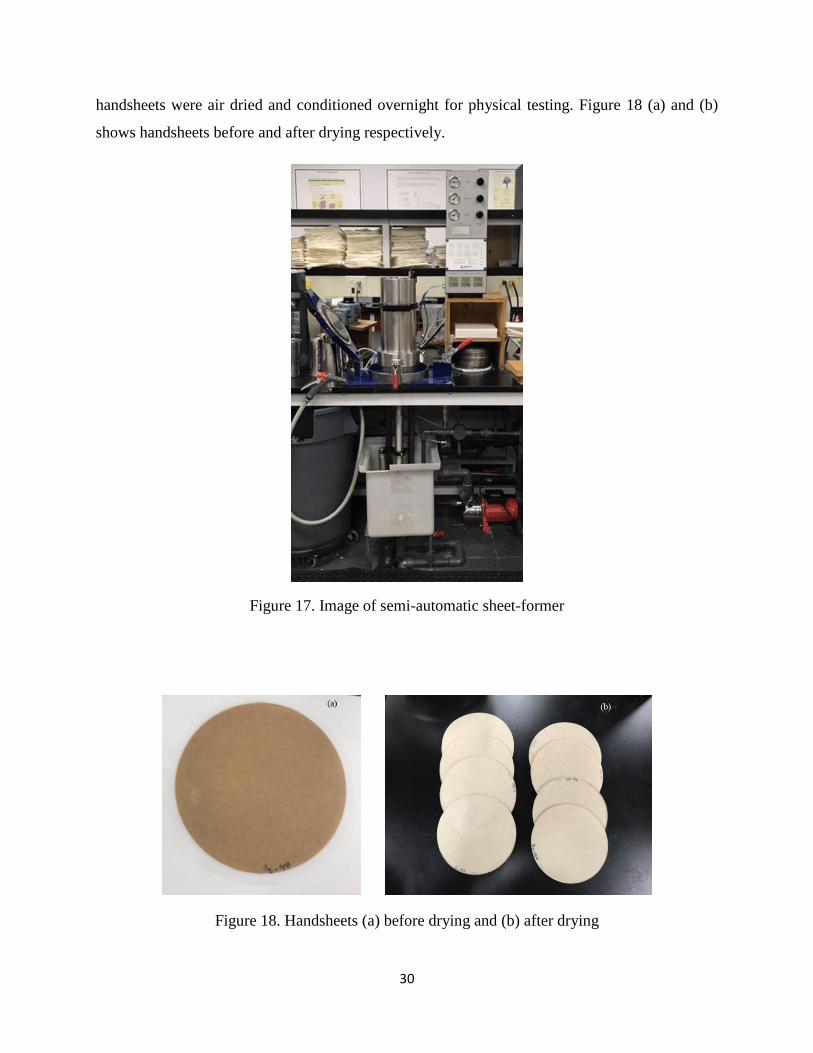
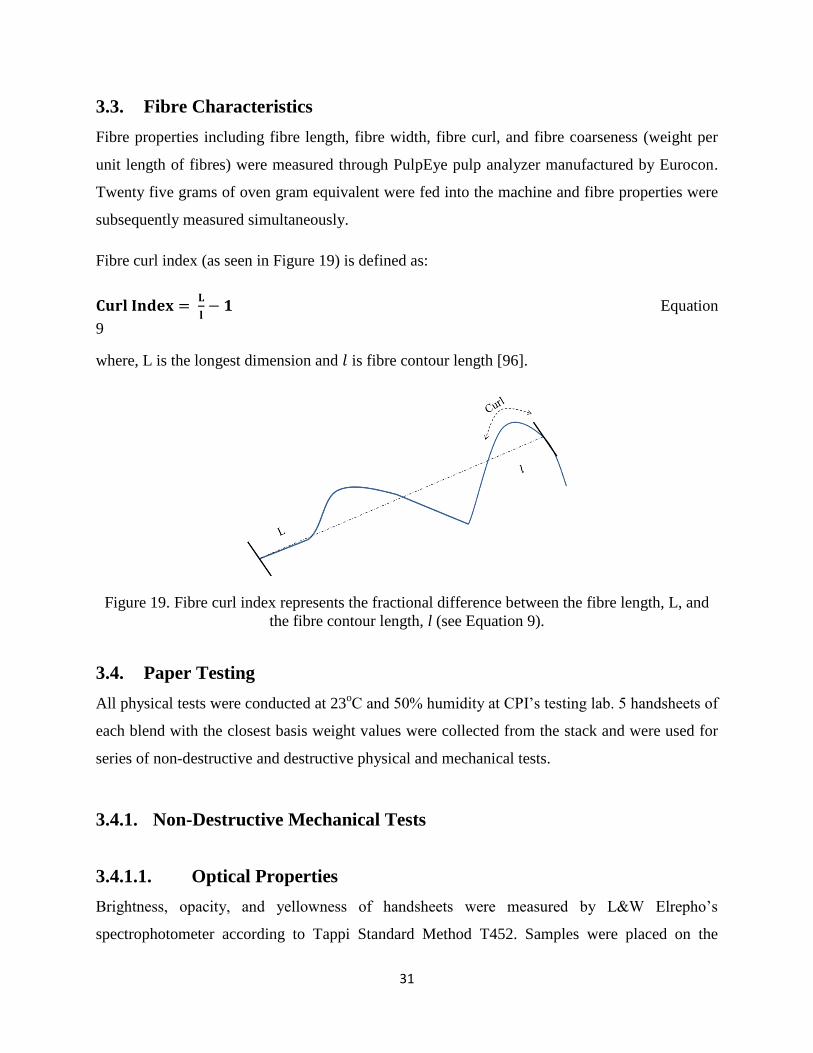
30
handsheets were air dried and conditioned overnight for physical testing. Figure 18 (a) and (b)
shows handsheets before and after drying respectively.
Figure 17. Image of semi-automatic sheet-former
Figure 18. Handsheets (a) before drying and (b) after drying
31
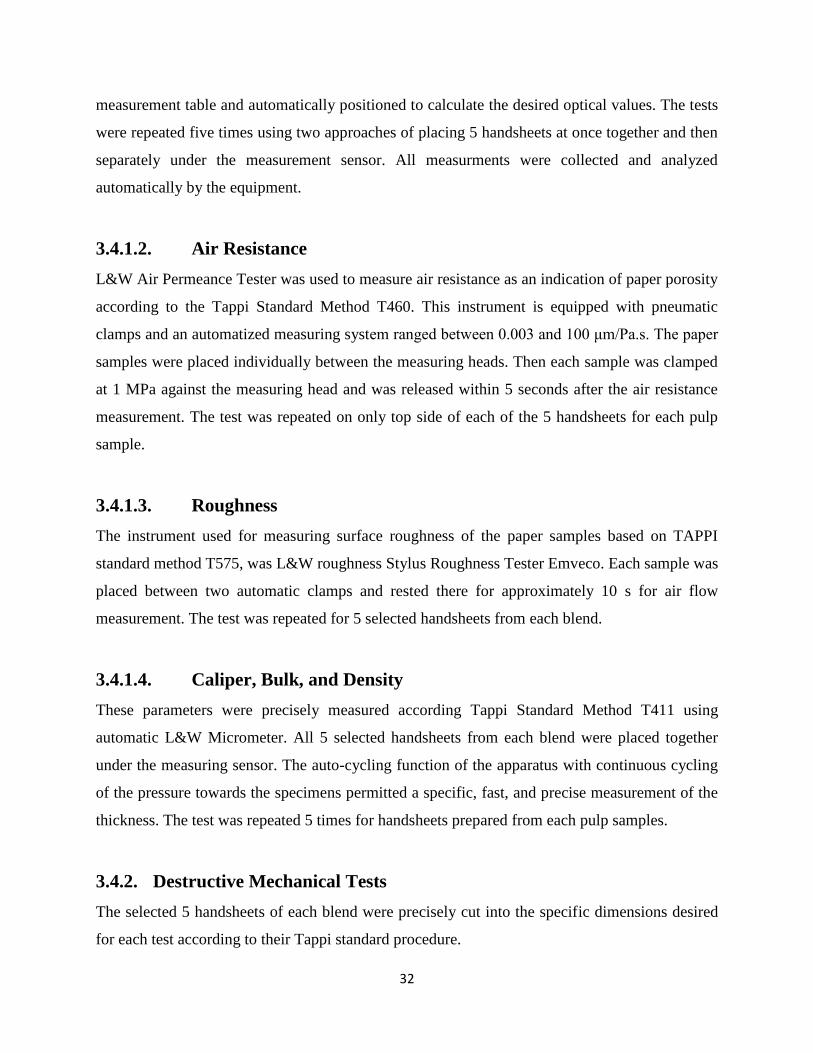
3.3. Fibre Characteristics
Fibre properties including fibre length, fibre width, fibre curl, and fibre coarseness (weight per
unit length of fibres) were measured through PulpEye pulp analyzer manufactured by Eurocon.
Twenty five grams of oven gram equivalent were fed into the machine and fibre properties were
subsequently measured simultaneously.
Fibre curl index (as seen in Figure 19) is defined as:
Equation
9
where, L is the longest dimension and is fibre contour length [96].
Figure 19. Fibre curl index represents the fractional difference between the fibre length, L, and
the fibre contour length, l (see Equation 9).
3.4. Paper Testing
All physical tests were conducted at 23oC and 50% humidity at CPI’s testing lab. 5 handsheets of
each blend with the closest basis weight values were collected from the stack and were used for
series of non-destructive and destructive physical and mechanical tests.
3.4.1. Non-Destructive Mechanical Tests
3.4.1.1. Optical Properties
Brightness, opacity, and yellowness of handsheets were measured by L&W Elrepho’s
spectrophotometer according to Tappi Standard Method T452. Samples were placed on the
32
measurement table and automatically positioned to calculate the desired optical values. The tests
were repeated five times using two approaches of placing 5 handsheets at once together and then
separately under the measurement sensor. All measurments were collected and analyzed
automatically by the equipment.
3.4.1.2. Air Resistance
L&W Air Permeance Tester was used to measure air resistance as an indication of paper porosity
according to the Tappi Standard Method T460. This instrument is equipped with pneumatic
clamps and an automatized measuring system ranged between 0.003 and 100 μm/Pa.s. The paper
samples were placed individually between the measuring heads. Then each sample was clamped
at 1 MPa against the measuring head and was released within 5 seconds after the air resistance
measurement. The test was repeated on only top side of each of the 5 handsheets for each pulp
sample.
3.4.1.3. Roughness
The instrument used for measuring surface roughness of the paper samples based on TAPPI
standard method T575, was L&W roughness Stylus Roughness Tester Emveco. Each sample was
placed between two automatic clamps and rested there for approximately 10 s for air flow
measurement. The test was repeated for 5 selected handsheets from each blend.
3.4.1.4. Caliper, Bulk, and Density
These parameters were precisely measured according Tappi Standard Method T411 using
automatic L&W Micrometer. All 5 selected handsheets from each blend were placed together
under the measuring sensor. The auto-cycling function of the apparatus with continuous cycling
of the pressure towards the specimens permitted a specific, fast, and precise measurement of the
thickness. The test was repeated 5 times for handsheets prepared from each pulp samples.
3.4.2. Destructive Mechanical Tests
The selected 5 handsheets of each blend were precisely cut into the specific dimensions desired
for each test according to their Tappi standard procedure.
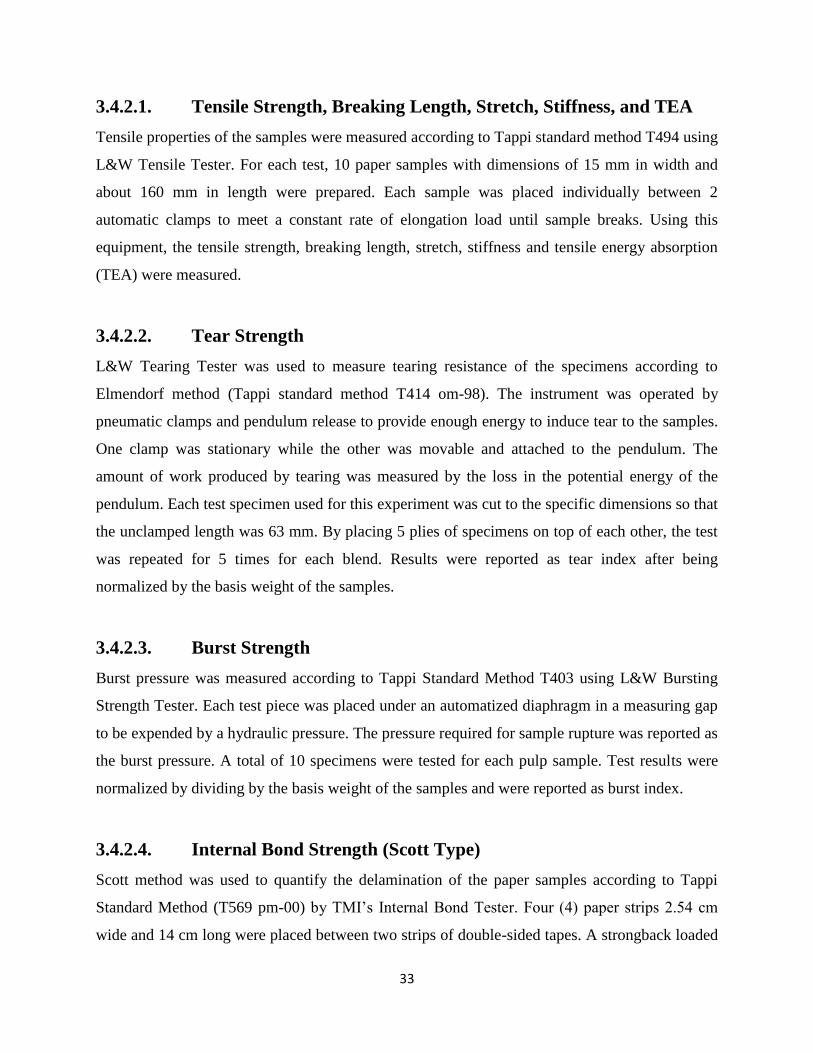
33
3.4.2.1. Tensile Strength, Breaking Length, Stretch, Stiffness, and TEA
Tensile properties of the samples were measured according to Tappi standard method T494 using
L&W Tensile Tester. For each test, 10 paper samples with dimensions of 15 mm in width and
about 160 mm in length were prepared. Each sample was placed individually between 2
automatic clamps to meet a constant rate of elongation load until sample breaks. Using this
equipment, the tensile strength, breaking length, stretch, stiffness and tensile energy absorption
(TEA) were measured.
3.4.2.2. Tear Strength
L&W Tearing Tester was used to measure tearing resistance of the specimens according to
Elmendorf method (Tappi standard method T414 om-98). The instrument was operated by
pneumatic clamps and pendulum release to provide enough energy to induce tear to the samples.
One clamp was stationary while the other was movable and attached to the pendulum. The
amount of work produced by tearing was measured by the loss in the potential energy of the
pendulum. Each test specimen used for this experiment was cut to the specific dimensions so that
the unclamped length was 63 mm. By placing 5 plies of specimens on top of each other, the test
was repeated for 5 times for each blend. Results were reported as tear index after being
normalized by the basis weight of the samples.
3.4.2.3. Burst Strength
Burst pressure was measured according to Tappi Standard Method T403 using L&W Bursting
Strength Tester. Each test piece was placed under an automatized diaphragm in a measuring gap
to be expended by a hydraulic pressure. The pressure required for sample rupture was reported as
the burst pressure. A total of 10 specimens were tested for each pulp sample. Test results were
normalized by dividing by the basis weight of the samples and were reported as burst index.
3.4.2.4. Internal Bond Strength (Scott Type)
Scott method was used to quantify the delamination of the paper samples according to Tappi
Standard Method (T569 pm-00) by TMI’s Internal Bond Tester. Four (4) paper strips 2.54 cm
wide and 14 cm long were placed between two strips of double-sided tapes. A strongback loaded
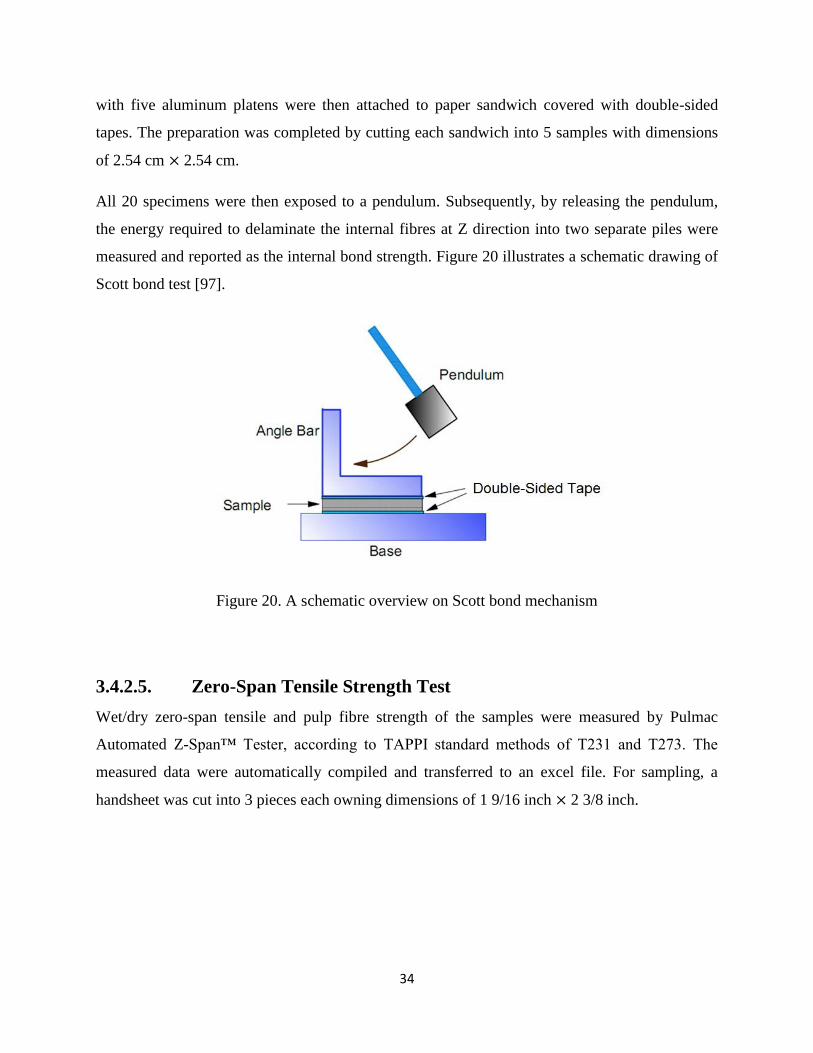
34
with five aluminum platens were then attached to paper sandwich covered with double-sided
tapes. The preparation was completed by cutting each sandwich into 5 samples with dimensions
of 2.54 cm 2.54 cm.
All 20 specimens were then exposed to a pendulum. Subsequently, by releasing the pendulum,
the energy required to delaminate the internal fibres at Z direction into two separate piles were
measured and reported as the internal bond strength. Figure 20 illustrates a schematic drawing of
Scott bond test [97].
Figure 20. A schematic overview on Scott bond mechanism
3.4.2.5. Zero-Span Tensile Strength Test
Wet/dry zero-span tensile and pulp fibre strength of the samples were measured by Pulmac
Automated Z-Span™ Tester, according to TAPPI standard methods of T231 and T273. The
measured data were automatically compiled and transferred to an excel file. For sampling, a
handsheet was cut into 3 pieces each owning dimensions of 1 9/16 inch 2 3/8 inch.
35
3.5. Coating Procedure
3.5.1. Materials
PMHS (50g) was purchased from Alfa Aesar. Other chemicals including polyvinyl alcohol
(PVA, 99+% hydrolyzed with molecular weight ranged between 85000 and 124000 g/mol),
kaolin (aluminum silicate hydroxide), silica nano-powder (silicone dioxide with 10-20 nm
particle size), and diiodomethane were all purchased from Sigma-Aldrich.
3.5.2. Experimental Procedure
The emulsified PMHS solution was used as the one-step coating material. Based on the previous
work conducted by Muzenski et al., water-based PMHS emulsion was made by adding 3.5%
w/w polyvinyl alcohol (PVA) as a surfactant and 25% w/w PMHS as a dispersion phase to a
71% w/w DI water medium. 0.4% w/w kaolin and 0.1% w/w silica nano-powder were then
added to the solution in order to provide enough stabilization [98]. The solution was then stirred
for 1 hour at 160 rpm.
Three paper specimens from handsheets made of 10% BCTMP (SEL=0.5 J/m, SRE=40 kwh/t)
with dimensions of 7 1.5 cm2
were prepared and were dip-coated to the solution for 3 min. Then
coated papers were oven-dried at 75oC for 120 min.
In order to provide a smoother surface, the oven-dried coated samples were placed between two
A4 sheets and were passed through the calendering machine. The machine was made of two rolls
providing pressure of approximately 60 psig. The total coating weight was measured
gravimetrically to be about 10.1 g/m2.
To study the omniphobic properties, the coated samples were tested using an optical contact
angle instrument, OCA 15EC (Figure 21). Drops of diiodomethane (oil) and distilled water were
placed on the specimens and their contact angles on the surface of the substrate were measured.
The microscopic pictures and surface tensions of the oil and water drops on the cellulosic coated
paper were the other factors determined via the aid of this test.
36
Figure 21. Optical Contact Angle measurement device
3.6. Scanning Electron Microscopy
Digital images of coated and un-coated paper surfaces were obtained using SEM device of
Hitachi SU 3500 located at Ontario Centre for the Characterization of Advanced Materials
(OCCAM) at Department of Chemical Engineering and Applied Chemistry of University of
Toronto.
For surface characterization, small pieces of 10mm 10 mm samples were prepared and double
coated by Bio-RAD PS3 gold sputter coater. All samples then were placed in SEM chamber to
generate microscopic images by using 5kV accelerating voltage and 30 W/m2 electron beam
intensity.
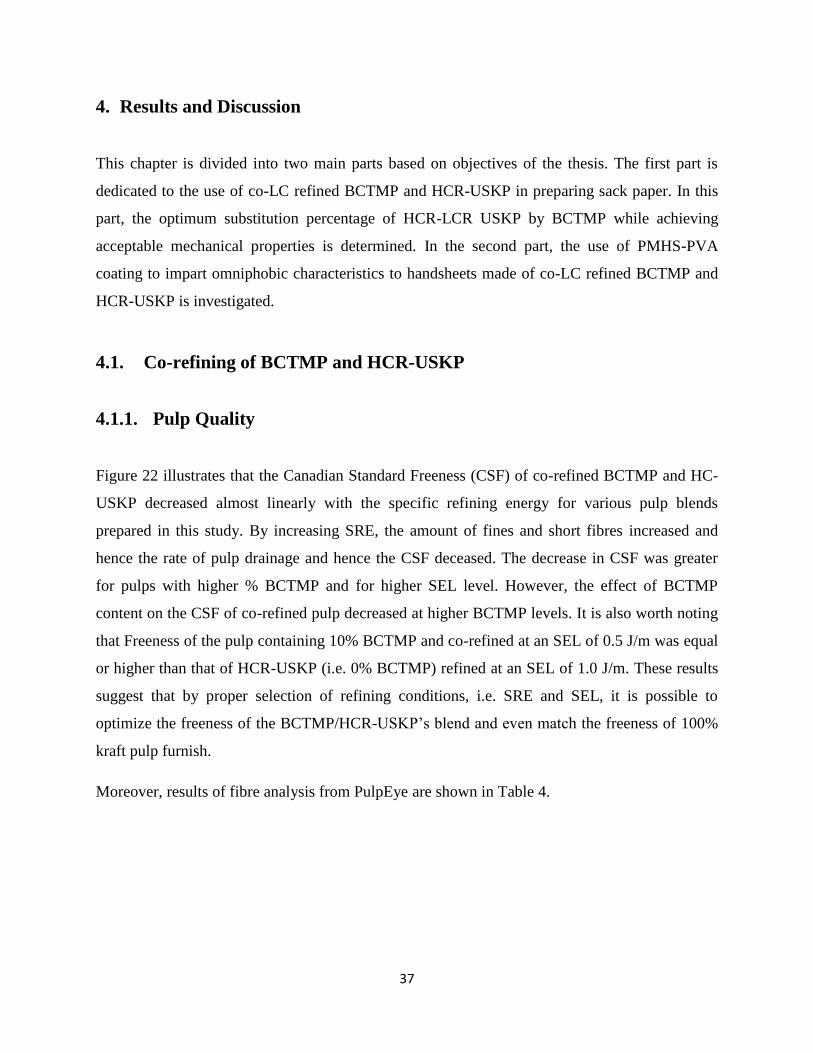
37
4. Results and Discussion
This chapter is divided into two main parts based on objectives of the thesis. The first part is
dedicated to the use of co-LC refined BCTMP and HCR-USKP in preparing sack paper. In this
part, the optimum substitution percentage of HCR-LCR USKP by BCTMP while achieving
acceptable mechanical properties is determined. In the second part, the use of PMHS-PVA
coating to impart omniphobic characteristics to handsheets made of co-LC refined BCTMP and
HCR-USKP is investigated.
4.1. Co-refining of BCTMP and HCR-USKP
4.1.1. Pulp Quality
Figure 22 illustrates that the Canadian Standard Freeness (CSF) of co-refined BCTMP and HC-
USKP decreased almost linearly with the specific refining energy for various pulp blends
prepared in this study. By increasing SRE, the amount of fines and short fibres increased and
hence the rate of pulp drainage and hence the CSF deceased. The decrease in CSF was greater
for pulps with higher % BCTMP and for higher SEL level. However, the effect of BCTMP
content on the CSF of co-refined pulp decreased at higher BCTMP levels. It is also worth noting
that Freeness of the pulp containing 10% BCTMP and co-refined at an SEL of 0.5 J/m was equal
or higher than that of HCR-USKP (i.e. 0% BCTMP) refined at an SEL of 1.0 J/m. These results
suggest that by proper selection of refining conditions, i.e. SRE and SEL, it is possible to
optimize the freeness of the BCTMP/HCR-USKP’s blend and even match the freeness of 100%
kraft pulp furnish.
Moreover, results of fibre analysis from PulpEye are shown in Table 4.
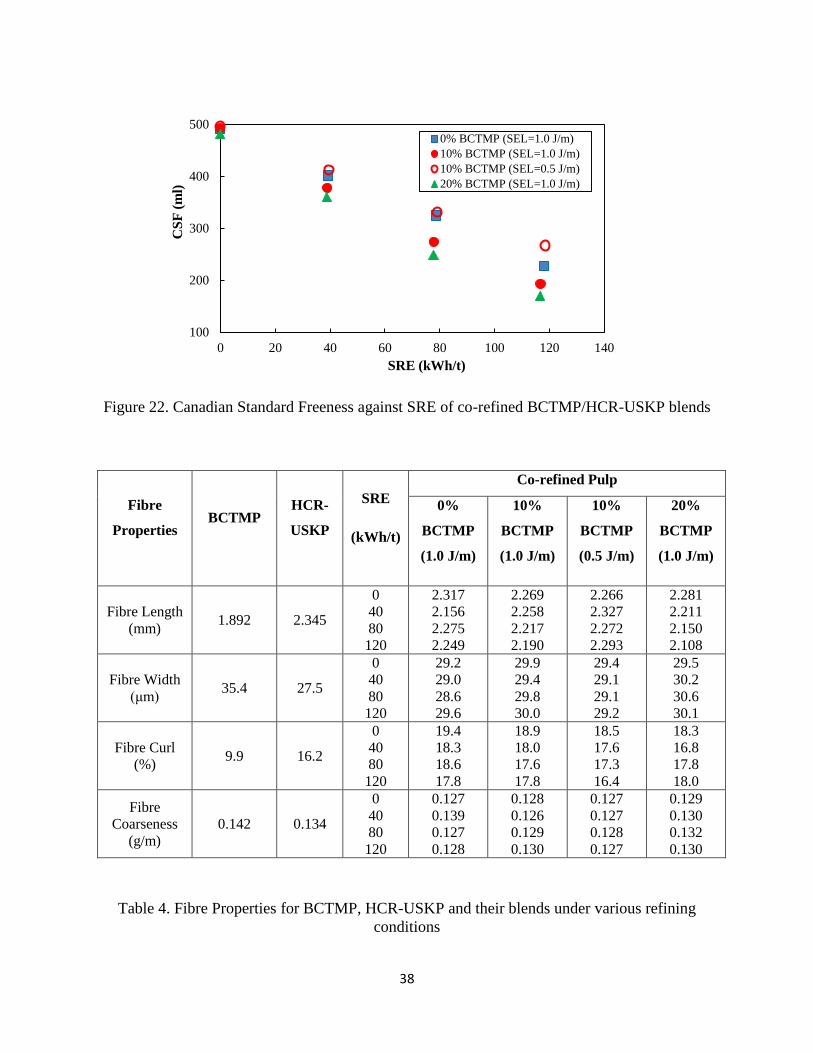
38
Figure 22. Canadian Standard Freeness against SRE of co-refined BCTMP/HCR-USKP blends
Fibre
Properties BCTMP
HCR-
USKP
SRE
(kWh/t)
Co-refined Pulp
0%
BCTMP
(1.0 J/m)
10%
BCTMP
(1.0 J/m)
10%
BCTMP
(0.5 J/m)
20%
BCTMP
(1.0 J/m)
Fibre Length
(mm) 1.892 2.345
0
40
80
120
2.317
2.156
2.275
2.249
2.269
2.258
2.217
2.190
2.266
2.327
2.272
2.293
2.281
2.211
2.150
2.108
Fibre Width
(μm) 35.4 27.5
0
40
80
120
29.2
29.0
28.6
29.6
29.9
29.4
29.8
30.0
29.4
29.1
29.1
29.2
29.5
30.2
30.6
30.1
Fibre Curl
(%) 9.9 16.2
0
40
80
120
19.4
18.3
18.6
17.8
18.9
18.0
17.6
17.8
18.5
17.6
17.3
16.4
18.3
16.8
17.8
18.0
Fibre
Coarseness
(g/m)
0.142 0.134
0
40
80
120
0.127
0.139
0.127
0.128
0.128
0.126
0.129
0.130
0.127
0.127
0.128
0.127
0.129
0.130
0.132
0.130
Table 4. Fibre Properties for BCTMP, HCR-USKP and their blends under various refining
conditions
100
200
300
400
500
0 20 40 60 80 100 120 140
CS
F (
ml)
SRE (kWh/t)
0% BCTMP (SEL=1.0 J/m)
10% BCTMP (SEL=1.0 J/m)
10% BCTMP (SEL=0.5 J/m)
20% BCTMP (SEL=1.0 J/m)
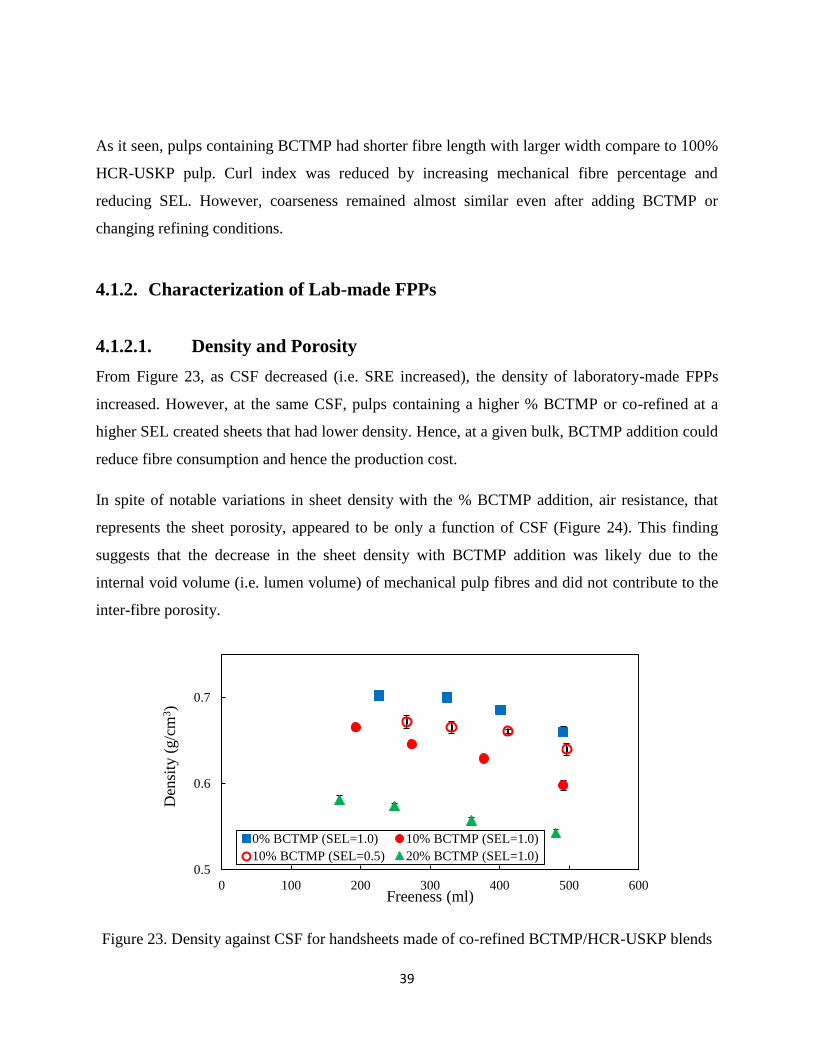
39
As it seen, pulps containing BCTMP had shorter fibre length with larger width compare to 100%
HCR-USKP pulp. Curl index was reduced by increasing mechanical fibre percentage and
reducing SEL. However, coarseness remained almost similar even after adding BCTMP or
changing refining conditions.
4.1.2. Characterization of Lab-made FPPs
4.1.2.1. Density and Porosity
From Figure 23, as CSF decreased (i.e. SRE increased), the density of laboratory-made FPPs
increased. However, at the same CSF, pulps containing a higher % BCTMP or co-refined at a
higher SEL created sheets that had lower density. Hence, at a given bulk, BCTMP addition could
reduce fibre consumption and hence the production cost.
In spite of notable variations in sheet density with the % BCTMP addition, air resistance, that
represents the sheet porosity, appeared to be only a function of CSF (Figure 24). This finding
suggests that the decrease in the sheet density with BCTMP addition was likely due to the
internal void volume (i.e. lumen volume) of mechanical pulp fibres and did not contribute to the
inter-fibre porosity.
Figure 23. Density against CSF for handsheets made of co-refined BCTMP/HCR-USKP blends
0.5
0.6
0.7
0 100 200 300 400 500 600
Den
sity
(g/c
m3)
Freeness (ml)
0% BCTMP (SEL=1.0) 10% BCTMP (SEL=1.0)
10% BCTMP (SEL=0.5) 20% BCTMP (SEL=1.0)
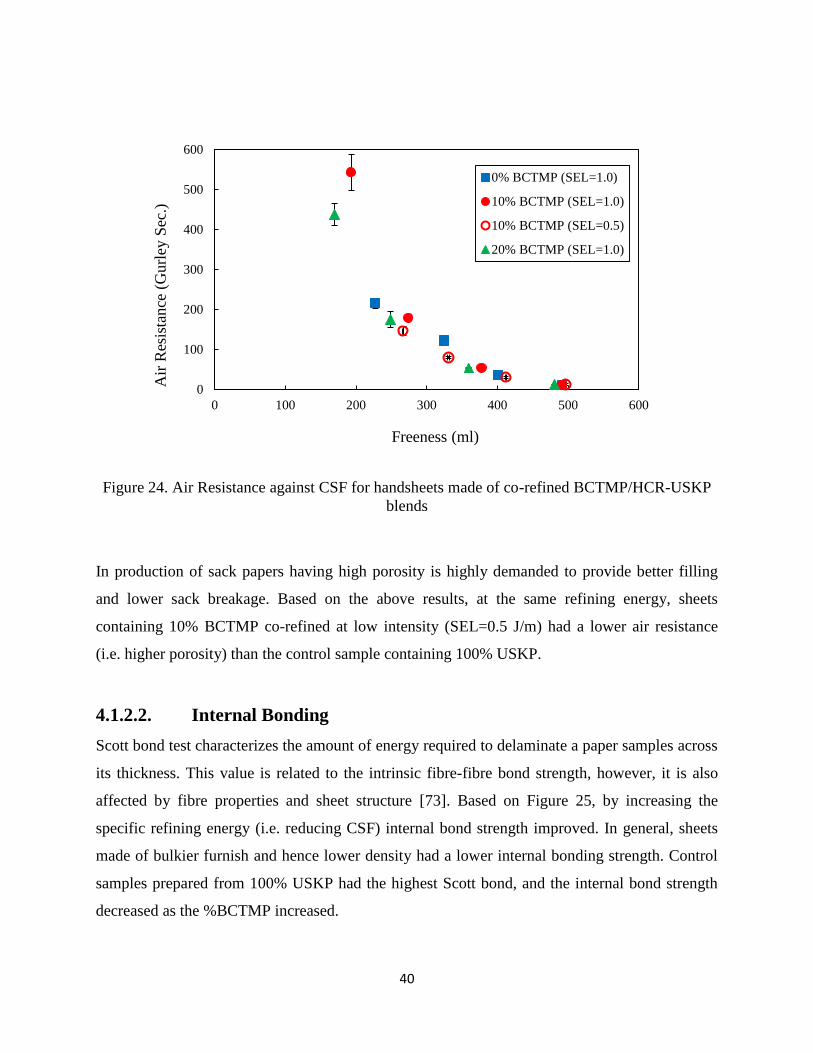
40
Figure 24. Air Resistance against CSF for handsheets made of co-refined BCTMP/HCR-USKP
blends
In production of sack papers having high porosity is highly demanded to provide better filling
and lower sack breakage. Based on the above results, at the same refining energy, sheets
containing 10% BCTMP co-refined at low intensity (SEL=0.5 J/m) had a lower air resistance
(i.e. higher porosity) than the control sample containing 100% USKP.
4.1.2.2. Internal Bonding
Scott bond test characterizes the amount of energy required to delaminate a paper samples across
its thickness. This value is related to the intrinsic fibre-fibre bond strength, however, it is also
affected by fibre properties and sheet structure [73]. Based on Figure 25, by increasing the
specific refining energy (i.e. reducing CSF) internal bond strength improved. In general, sheets
made of bulkier furnish and hence lower density had a lower internal bonding strength. Control
samples prepared from 100% USKP had the highest Scott bond, and the internal bond strength
decreased as the %BCTMP increased.
0
100
200
300
400
500
600
0 100 200 300 400 500 600
Air
Res
ista
nce
(G
url
ey S
ec.)
Freeness (ml)
0% BCTMP (SEL=1.0)
10% BCTMP (SEL=1.0)
10% BCTMP (SEL=0.5)
20% BCTMP (SEL=1.0)
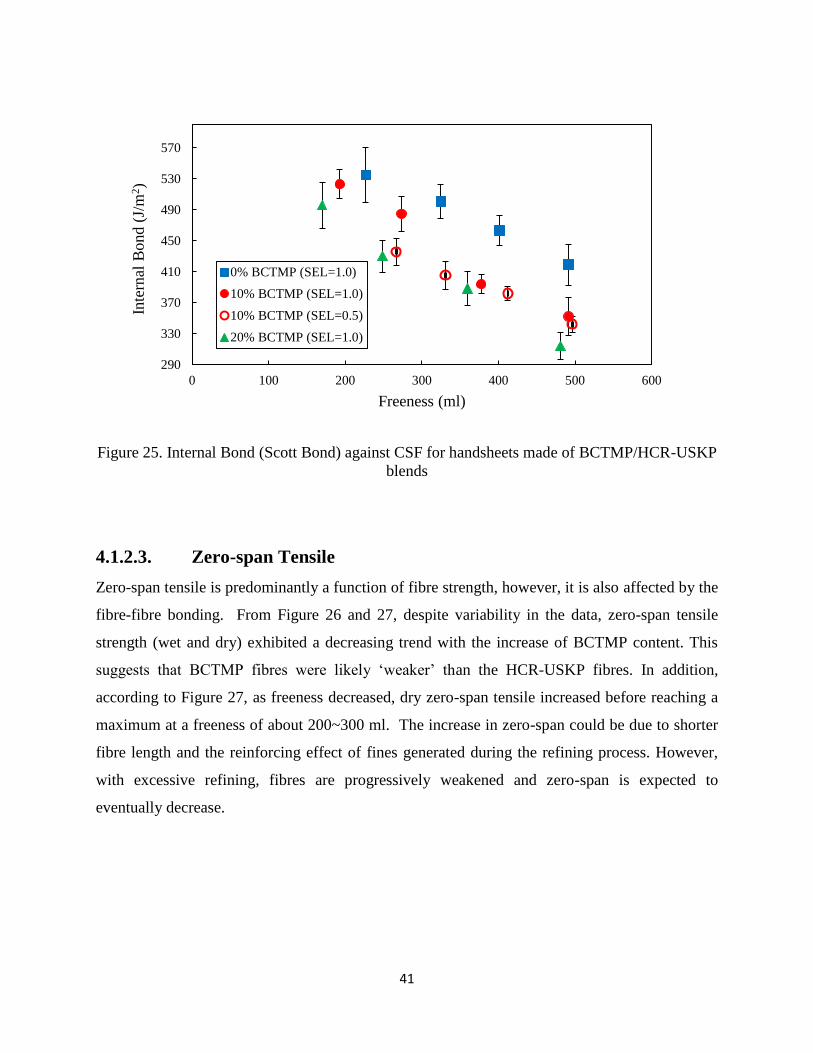
41
Figure 25. Internal Bond (Scott Bond) against CSF for handsheets made of BCTMP/HCR-USKP
blends
4.1.2.3. Zero-span Tensile
Zero-span tensile is predominantly a function of fibre strength, however, it is also affected by the
fibre-fibre bonding. From Figure 26 and 27, despite variability in the data, zero-span tensile
strength (wet and dry) exhibited a decreasing trend with the increase of BCTMP content. This
suggests that BCTMP fibres were likely ‘weaker’ than the HCR-USKP fibres. In addition,
according to Figure 27, as freeness decreased, dry zero-span tensile increased before reaching a
maximum at a freeness of about 200~300 ml. The increase in zero-span could be due to shorter
fibre length and the reinforcing effect of fines generated during the refining process. However,
with excessive refining, fibres are progressively weakened and zero-span is expected to
eventually decrease.
290
330
370
410
450
490
530
570
0 100 200 300 400 500 600
Inte
rnal
Bond (
J/m
2)
Freeness (ml)
0% BCTMP (SEL=1.0)
10% BCTMP (SEL=1.0)
10% BCTMP (SEL=0.5)
20% BCTMP (SEL=1.0)
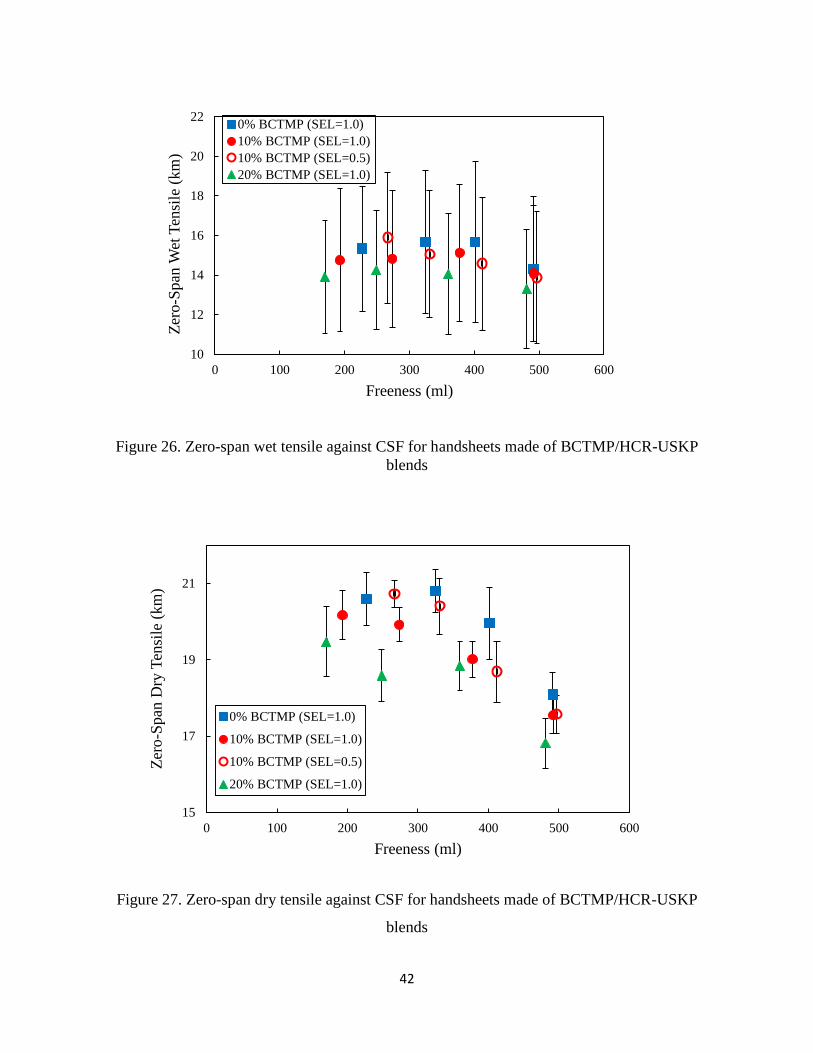
42
Figure 26. Zero-span wet tensile against CSF for handsheets made of BCTMP/HCR-USKP
blends
Figure 27. Zero-span dry tensile against CSF for handsheets made of BCTMP/HCR-USKP
blends
10
12
14
16
18
20
22
0 100 200 300 400 500 600
Zer
o-S
pan
Wet
Ten
sile
(km
)
Freeness (ml)
0% BCTMP (SEL=1.0)
10% BCTMP (SEL=1.0)
10% BCTMP (SEL=0.5)
20% BCTMP (SEL=1.0)
15
17
19
21
0 100 200 300 400 500 600
Zer
o-S
pan
Dry
Ten
sile
(km
)
Freeness (ml)
0% BCTMP (SEL=1.0)
10% BCTMP (SEL=1.0)
10% BCTMP (SEL=0.5)
20% BCTMP (SEL=1.0)
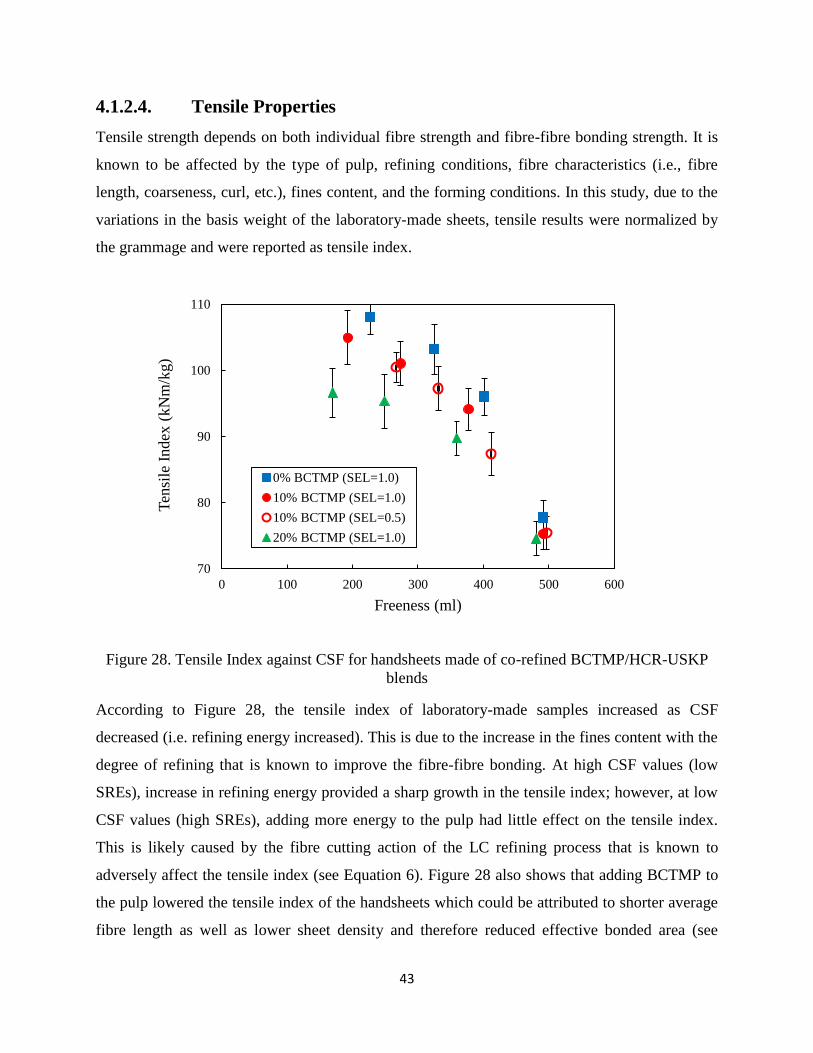
43
4.1.2.4. Tensile Properties
Tensile strength depends on both individual fibre strength and fibre-fibre bonding strength. It is
known to be affected by the type of pulp, refining conditions, fibre characteristics (i.e., fibre
length, coarseness, curl, etc.), fines content, and the forming conditions. In this study, due to the
variations in the basis weight of the laboratory-made sheets, tensile results were normalized by
the grammage and were reported as tensile index.
Figure 28. Tensile Index against CSF for handsheets made of co-refined BCTMP/HCR-USKP
blends
According to Figure 28, the tensile index of laboratory-made samples increased as CSF
decreased (i.e. refining energy increased). This is due to the increase in the fines content with the
degree of refining that is known to improve the fibre-fibre bonding. At high CSF values (low
SREs), increase in refining energy provided a sharp growth in the tensile index; however, at low
CSF values (high SREs), adding more energy to the pulp had little effect on the tensile index.
This is likely caused by the fibre cutting action of the LC refining process that is known to
adversely affect the tensile index (see Equation 6). Figure 28 also shows that adding BCTMP to
the pulp lowered the tensile index of the handsheets which could be attributed to shorter average
fibre length as well as lower sheet density and therefore reduced effective bonded area (see
70
80
90
100
110
0 100 200 300 400 500 600
Ten
sile
Index
(kN
m/k
g)
Freeness (ml)
0% BCTMP (SEL=1.0)
10% BCTMP (SEL=1.0)
10% BCTMP (SEL=0.5)
20% BCTMP (SEL=1.0)
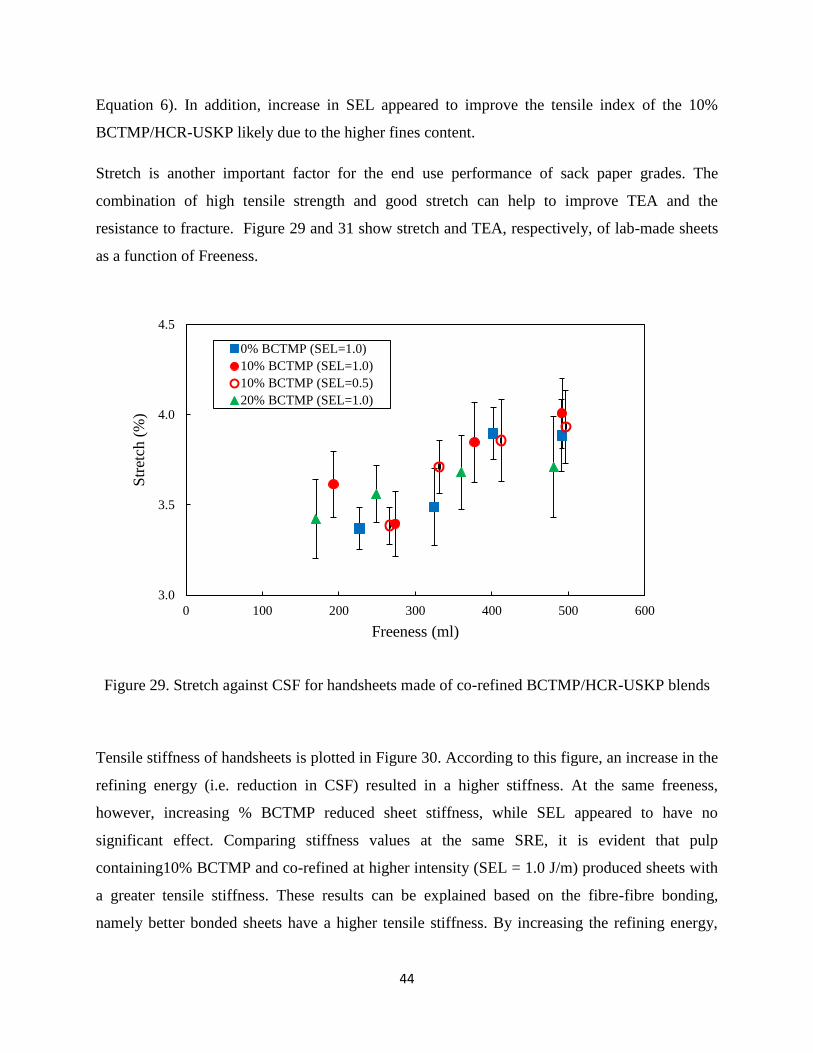
44
Equation 6). In addition, increase in SEL appeared to improve the tensile index of the 10%
BCTMP/HCR-USKP likely due to the higher fines content.
Stretch is another important factor for the end use performance of sack paper grades. The
combination of high tensile strength and good stretch can help to improve TEA and the
resistance to fracture. Figure 29 and 31 show stretch and TEA, respectively, of lab-made sheets
as a function of Freeness.
Figure 29. Stretch against CSF for handsheets made of co-refined BCTMP/HCR-USKP blends
Tensile stiffness of handsheets is plotted in Figure 30. According to this figure, an increase in the
refining energy (i.e. reduction in CSF) resulted in a higher stiffness. At the same freeness,
however, increasing % BCTMP reduced sheet stiffness, while SEL appeared to have no
significant effect. Comparing stiffness values at the same SRE, it is evident that pulp
containing10% BCTMP and co-refined at higher intensity (SEL = 1.0 J/m) produced sheets with
a greater tensile stiffness. These results can be explained based on the fibre-fibre bonding,
namely better bonded sheets have a higher tensile stiffness. By increasing the refining energy,
3.0
3.5
4.0
4.5
0 100 200 300 400 500 600
Str
etch
(%
)
Freeness (ml)
0% BCTMP (SEL=1.0)
10% BCTMP (SEL=1.0)
10% BCTMP (SEL=0.5)
20% BCTMP (SEL=1.0)
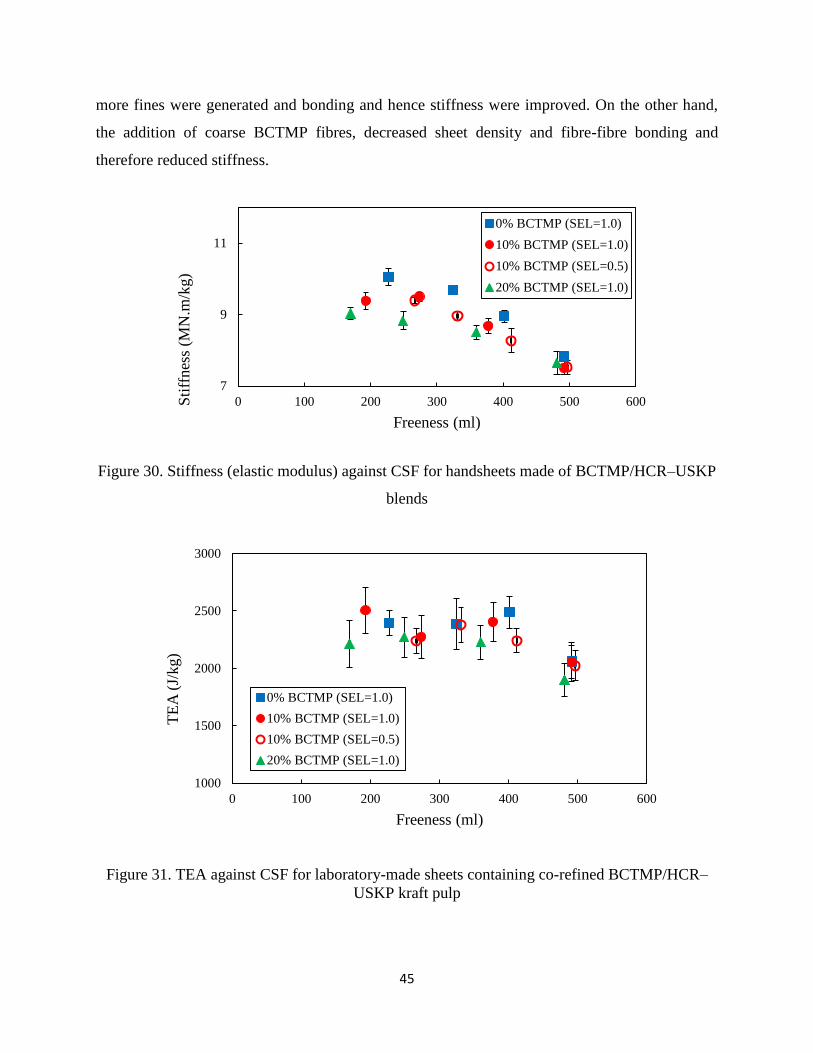
45
more fines were generated and bonding and hence stiffness were improved. On the other hand,
the addition of coarse BCTMP fibres, decreased sheet density and fibre-fibre bonding and
therefore reduced stiffness.
Figure 30. Stiffness (elastic modulus) against CSF for handsheets made of BCTMP/HCR–USKP
blends
Figure 31. TEA against CSF for laboratory-made sheets containing co-refined BCTMP/HCR–
USKP kraft pulp
7
9
11
0 100 200 300 400 500 600Sti
ffnes
s (M
N.m
/kg)
Freeness (ml)
0% BCTMP (SEL=1.0)
10% BCTMP (SEL=1.0)
10% BCTMP (SEL=0.5)
20% BCTMP (SEL=1.0)
1000
1500
2000
2500
3000
0 100 200 300 400 500 600
TE
A (
J/kg)
Freeness (ml)
0% BCTMP (SEL=1.0)
10% BCTMP (SEL=1.0)
10% BCTMP (SEL=0.5)
20% BCTMP (SEL=1.0)
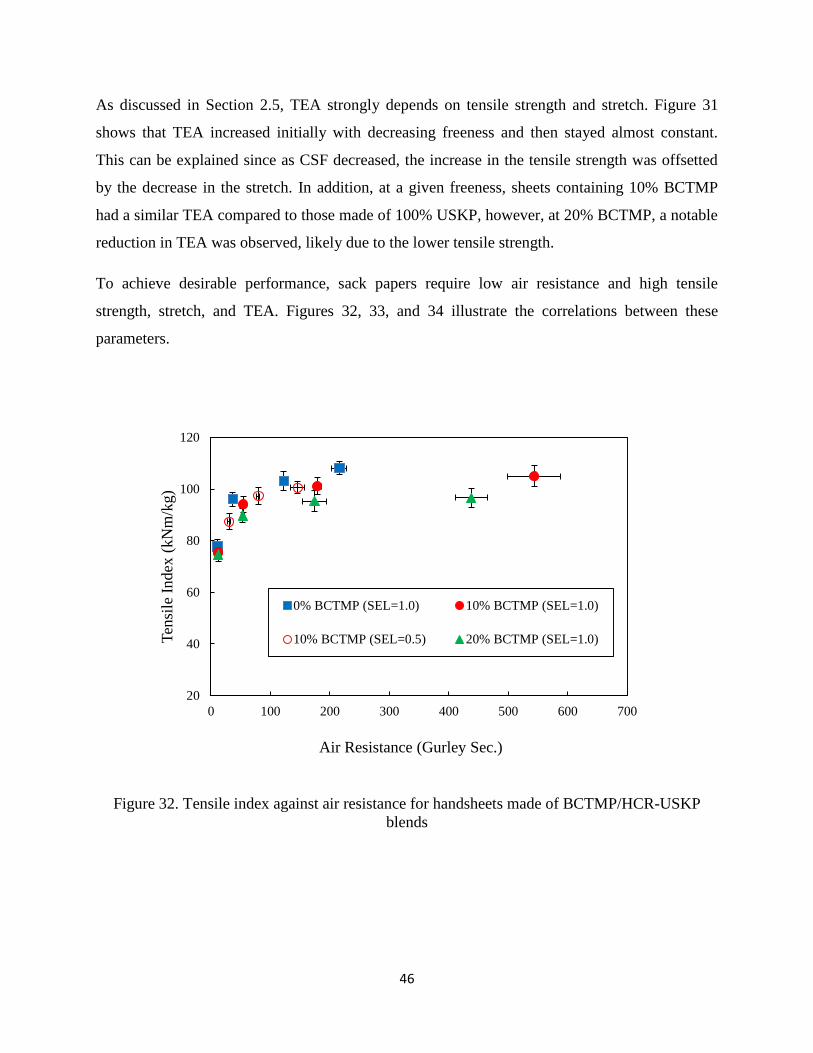
46
As discussed in Section 2.5, TEA strongly depends on tensile strength and stretch. Figure 31
shows that TEA increased initially with decreasing freeness and then stayed almost constant.
This can be explained since as CSF decreased, the increase in the tensile strength was offsetted
by the decrease in the stretch. In addition, at a given freeness, sheets containing 10% BCTMP
had a similar TEA compared to those made of 100% USKP, however, at 20% BCTMP, a notable
reduction in TEA was observed, likely due to the lower tensile strength.
To achieve desirable performance, sack papers require low air resistance and high tensile
strength, stretch, and TEA. Figures 32, 33, and 34 illustrate the correlations between these
parameters.
Figure 32. Tensile index against air resistance for handsheets made of BCTMP/HCR-USKP
blends
20
40
60
80
100
120
0 100 200 300 400 500 600 700
Ten
sile
Index
(kN
m/k
g)
Air Resistance (Gurley Sec.)
0% BCTMP (SEL=1.0) 10% BCTMP (SEL=1.0)
10% BCTMP (SEL=0.5) 20% BCTMP (SEL=1.0)
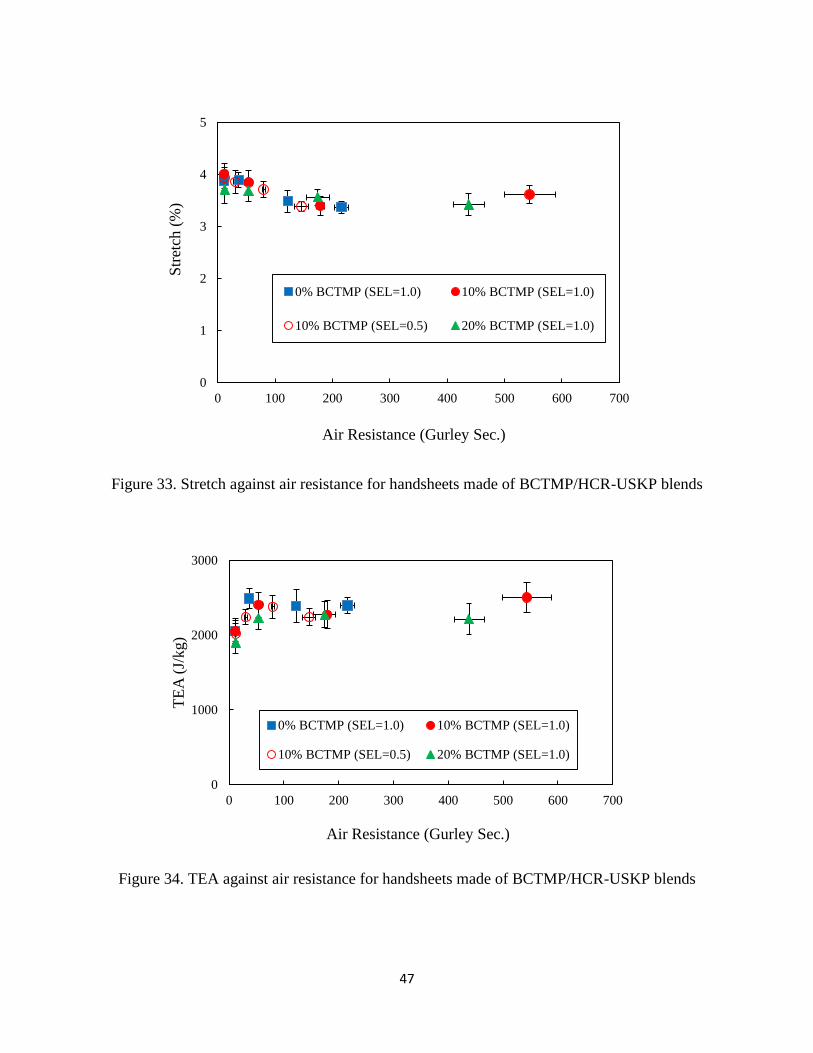
47
Figure 33. Stretch against air resistance for handsheets made of BCTMP/HCR-USKP blends
Figure 34. TEA against air resistance for handsheets made of BCTMP/HCR-USKP blends
0
1
2
3
4
5
0 100 200 300 400 500 600 700
Str
etch
(%
)
Air Resistance (Gurley Sec.)
0% BCTMP (SEL=1.0) 10% BCTMP (SEL=1.0)
10% BCTMP (SEL=0.5) 20% BCTMP (SEL=1.0)
0
1000
2000
3000
0 100 200 300 400 500 600 700
TE
A (
J/kg)
Air Resistance (Gurley Sec.)
0% BCTMP (SEL=1.0) 10% BCTMP (SEL=1.0)
10% BCTMP (SEL=0.5) 20% BCTMP (SEL=1.0)
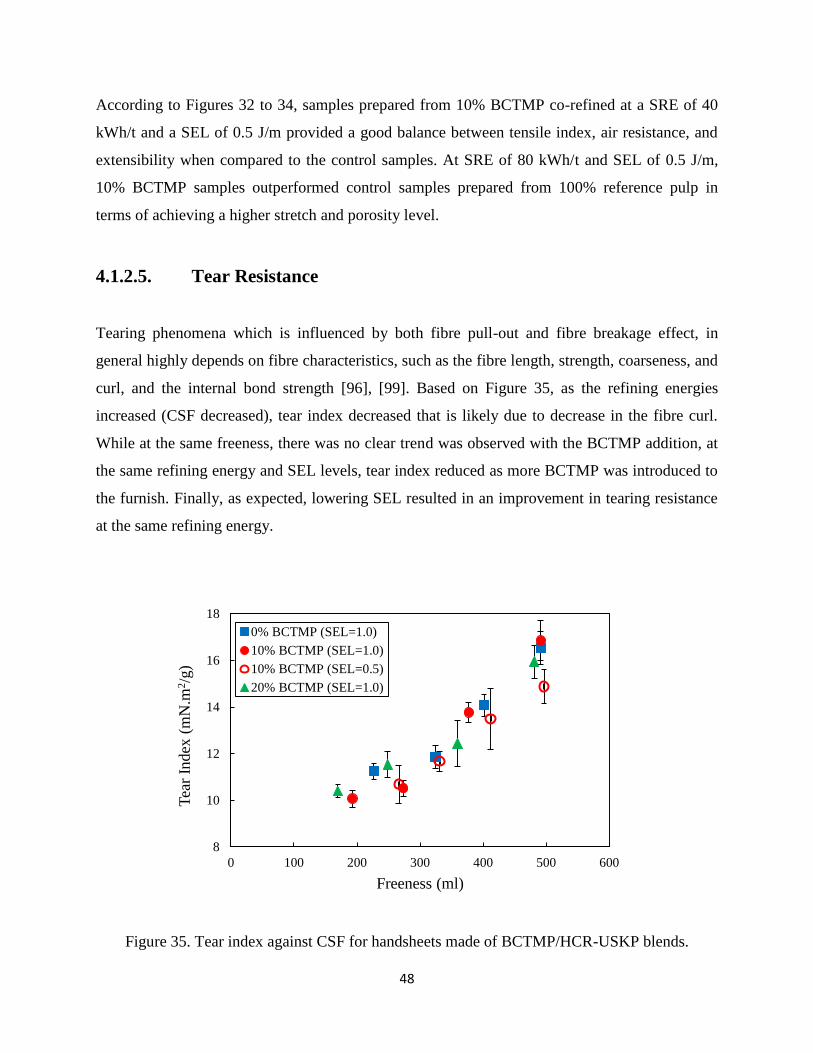
48
According to Figures 32 to 34, samples prepared from 10% BCTMP co-refined at a SRE of 40
kWh/t and a SEL of 0.5 J/m provided a good balance between tensile index, air resistance, and
extensibility when compared to the control samples. At SRE of 80 kWh/t and SEL of 0.5 J/m,
10% BCTMP samples outperformed control samples prepared from 100% reference pulp in
terms of achieving a higher stretch and porosity level.
4.1.2.5. Tear Resistance
Tearing phenomena which is influenced by both fibre pull-out and fibre breakage effect, in
general highly depends on fibre characteristics, such as the fibre length, strength, coarseness, and
curl, and the internal bond strength [96], [99]. Based on Figure 35, as the refining energies
increased (CSF decreased), tear index decreased that is likely due to decrease in the fibre curl.
While at the same freeness, there was no clear trend was observed with the BCTMP addition, at
the same refining energy and SEL levels, tear index reduced as more BCTMP was introduced to
the furnish. Finally, as expected, lowering SEL resulted in an improvement in tearing resistance
at the same refining energy.
Figure 35. Tear index against CSF for handsheets made of BCTMP/HCR-USKP blends.
8
10
12
14
16
18
0 100 200 300 400 500 600
Tea
r In
dex
(m
N.m
2/g
)
Freeness (ml)
0% BCTMP (SEL=1.0)
10% BCTMP (SEL=1.0)
10% BCTMP (SEL=0.5)
20% BCTMP (SEL=1.0)
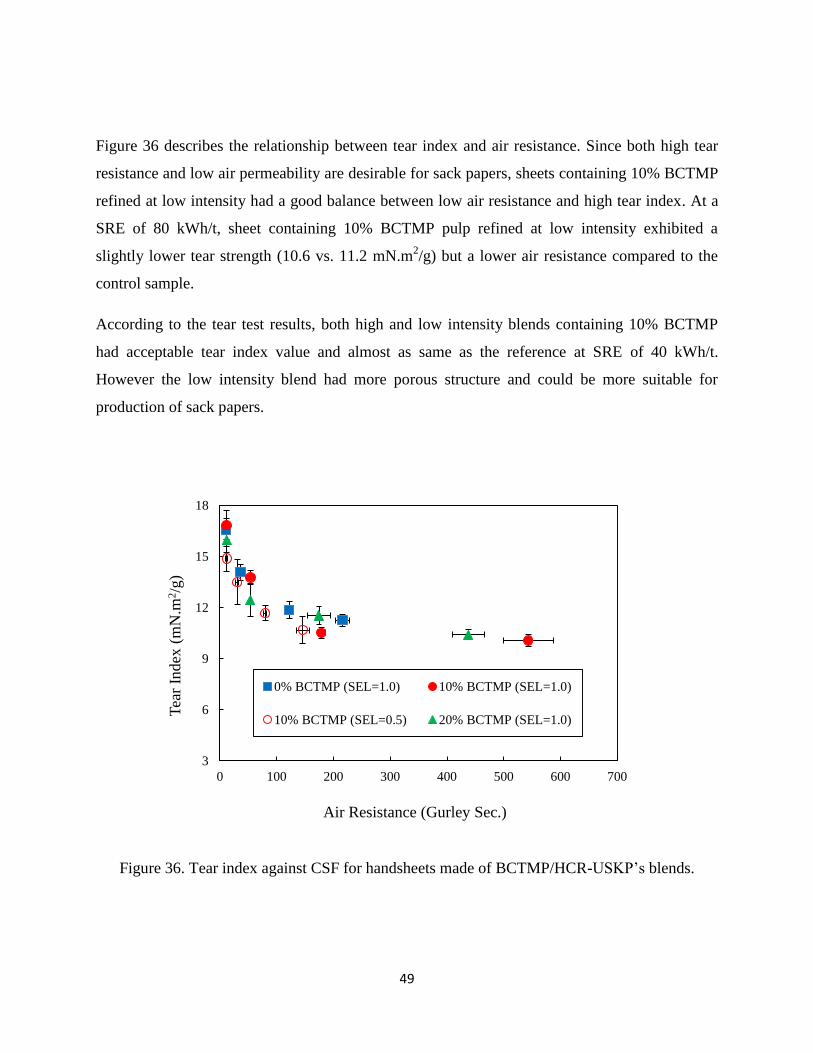
49
Figure 36 describes the relationship between tear index and air resistance. Since both high tear
resistance and low air permeability are desirable for sack papers, sheets containing 10% BCTMP
refined at low intensity had a good balance between low air resistance and high tear index. At a
SRE of 80 kWh/t, sheet containing 10% BCTMP pulp refined at low intensity exhibited a
slightly lower tear strength (10.6 vs. 11.2 mN.m2/g) but a lower air resistance compared to the
control sample.
According to the tear test results, both high and low intensity blends containing 10% BCTMP
had acceptable tear index value and almost as same as the reference at SRE of 40 kWh/t.
However the low intensity blend had more porous structure and could be more suitable for
production of sack papers.
Figure 36. Tear index against CSF for handsheets made of BCTMP/HCR-USKP’s blends.
3
6
9
12
15
18
0 100 200 300 400 500 600 700
Tea
r In
dex
(m
N.m
2/g
)
Air Resistance (Gurley Sec.)
0% BCTMP (SEL=1.0) 10% BCTMP (SEL=1.0)
10% BCTMP (SEL=0.5) 20% BCTMP (SEL=1.0)
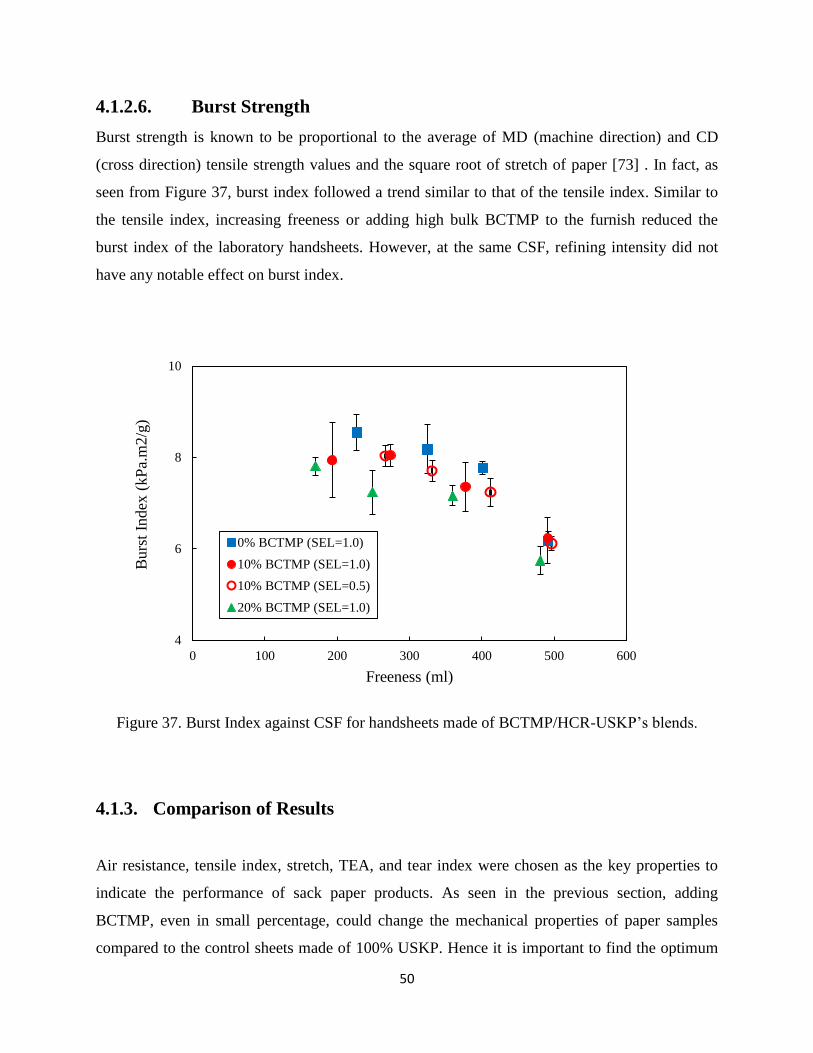
50
4.1.2.6. Burst Strength
Burst strength is known to be proportional to the average of MD (machine direction) and CD
(cross direction) tensile strength values and the square root of stretch of paper [73] . In fact, as
seen from Figure 37, burst index followed a trend similar to that of the tensile index. Similar to
the tensile index, increasing freeness or adding high bulk BCTMP to the furnish reduced the
burst index of the laboratory handsheets. However, at the same CSF, refining intensity did not
have any notable effect on burst index.
Figure 37. Burst Index against CSF for handsheets made of BCTMP/HCR-USKP’s blends.
4.1.3. Comparison of Results
Air resistance, tensile index, stretch, TEA, and tear index were chosen as the key properties to
indicate the performance of sack paper products. As seen in the previous section, adding
BCTMP, even in small percentage, could change the mechanical properties of paper samples
compared to the control sheets made of 100% USKP. Hence it is important to find the optimum
4
6
8
10
0 100 200 300 400 500 600
Burs
t In
dex
(kP
a.m
2/g
)
Freeness (ml)
0% BCTMP (SEL=1.0)
10% BCTMP (SEL=1.0)
10% BCTMP (SEL=0.5)
20% BCTMP (SEL=1.0)
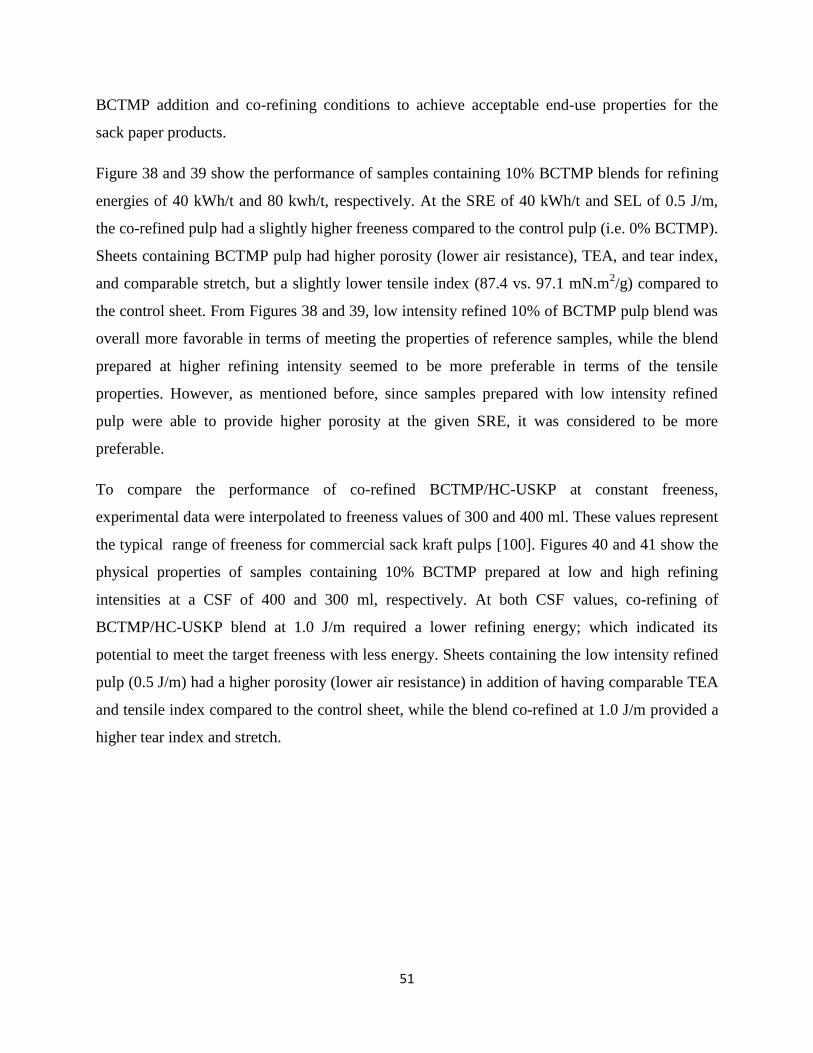
51
BCTMP addition and co-refining conditions to achieve acceptable end-use properties for the
sack paper products.
Figure 38 and 39 show the performance of samples containing 10% BCTMP blends for refining
energies of 40 kWh/t and 80 kwh/t, respectively. At the SRE of 40 kWh/t and SEL of 0.5 J/m,
the co-refined pulp had a slightly higher freeness compared to the control pulp (i.e. 0% BCTMP).
Sheets containing BCTMP pulp had higher porosity (lower air resistance), TEA, and tear index,
and comparable stretch, but a slightly lower tensile index (87.4 vs. 97.1 mN.m2/g) compared to
the control sheet. From Figures 38 and 39, low intensity refined 10% of BCTMP pulp blend was
overall more favorable in terms of meeting the properties of reference samples, while the blend
prepared at higher refining intensity seemed to be more preferable in terms of the tensile
properties. However, as mentioned before, since samples prepared with low intensity refined
pulp were able to provide higher porosity at the given SRE, it was considered to be more
preferable.
To compare the performance of co-refined BCTMP/HC-USKP at constant freeness,
experimental data were interpolated to freeness values of 300 and 400 ml. These values represent
the typical range of freeness for commercial sack kraft pulps [100]. Figures 40 and 41 show the
physical properties of samples containing 10% BCTMP prepared at low and high refining
intensities at a CSF of 400 and 300 ml, respectively. At both CSF values, co-refining of
BCTMP/HC-USKP blend at 1.0 J/m required a lower refining energy; which indicated its
potential to meet the target freeness with less energy. Sheets containing the low intensity refined
pulp (0.5 J/m) had a higher porosity (lower air resistance) in addition of having comparable TEA
and tensile index compared to the control sheet, while the blend co-refined at 1.0 J/m provided a
higher tear index and stretch.
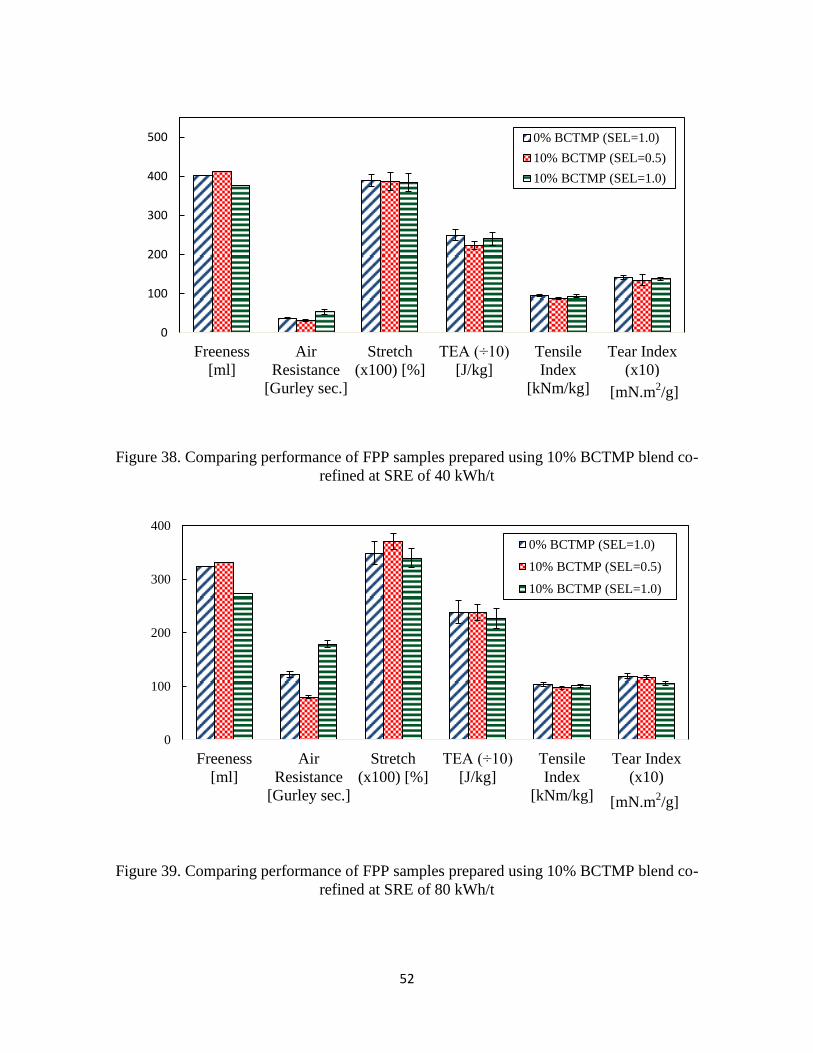
52
Figure 38. Comparing performance of FPP samples prepared using 10% BCTMP blend co-
refined at SRE of 40 kWh/t
Figure 39. Comparing performance of FPP samples prepared using 10% BCTMP blend co-
refined at SRE of 80 kWh/t
0
100
200
300
400
500
Freeness
[ml]
Air
Resistance
[Gurley sec.]
Stretch
(x100) [%]
TEA (÷10)
[J/kg]
Tensile
Index
[kNm/kg]
Tear Index
(x10)
[mN.m2/g]
0% BCTMP (SEL=1.0)
10% BCTMP (SEL=0.5)
10% BCTMP (SEL=1.0)
0
100
200
300
400
Freeness
[ml]
Air
Resistance
[Gurley sec.]
Stretch
(x100) [%]
TEA (÷10)
[J/kg]
Tensile
Index
[kNm/kg]
Tear Index
(x10)
[mN.m2/g]
0% BCTMP (SEL=1.0)
10% BCTMP (SEL=0.5)
10% BCTMP (SEL=1.0)
[mN.m2/g]
[mN.m2/g]
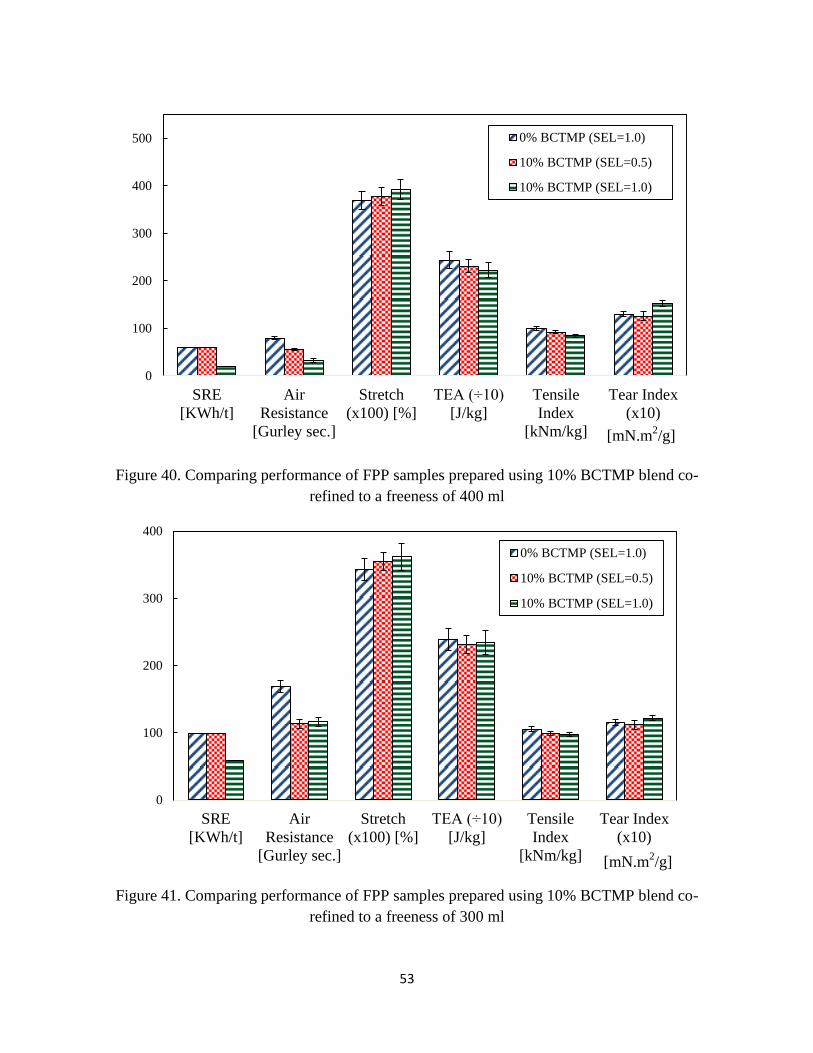
53
Figure 40. Comparing performance of FPP samples prepared using 10% BCTMP blend co-
refined to a freeness of 400 ml
Figure 41. Comparing performance of FPP samples prepared using 10% BCTMP blend co-
refined to a freeness of 300 ml
0
100
200
300
400
500
SRE
[KWh/t]
Air
Resistance
[Gurley sec.]
Stretch
(x100) [%]
TEA (÷10)
[J/kg]
Tensile
Index
[kNm/kg]
Tear Index
(x10)
[mN.m2/g]
0% BCTMP (SEL=1.0)
10% BCTMP (SEL=0.5)
10% BCTMP (SEL=1.0)
0
100
200
300
400
SRE
[KWh/t]
Air
Resistance
[Gurley sec.]
Stretch
(x100) [%]
TEA (÷10)
[J/kg]
Tensile
Index
[kNm/kg]
Tear Index
(x10)
[mN.m2/g]
0% BCTMP (SEL=1.0)
10% BCTMP (SEL=0.5)
10% BCTMP (SEL=1.0)
[mN.m2/g]
[mN.m2/g]
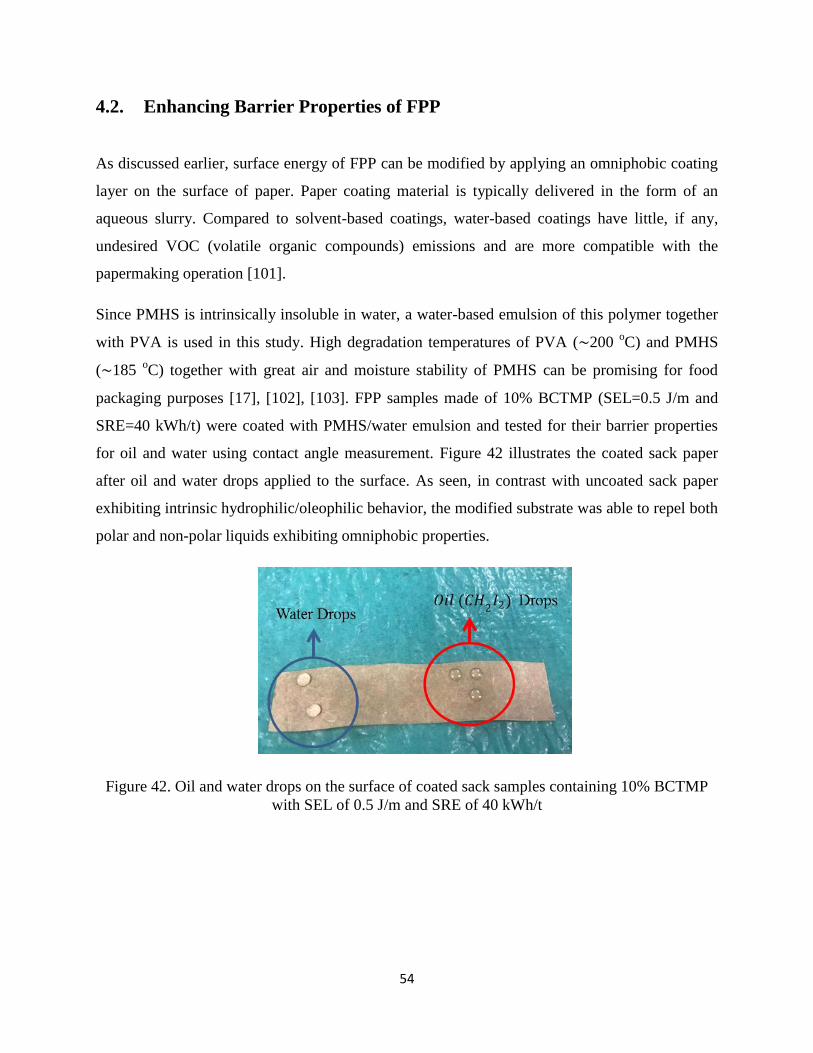
54
4.2. Enhancing Barrier Properties of FPP
As discussed earlier, surface energy of FPP can be modified by applying an omniphobic coating
layer on the surface of paper. Paper coating material is typically delivered in the form of an
aqueous slurry. Compared to solvent-based coatings, water-based coatings have little, if any,
undesired VOC (volatile organic compounds) emissions and are more compatible with the
papermaking operation [101].
Since PMHS is intrinsically insoluble in water, a water-based emulsion of this polymer together
with PVA is used in this study. High degradation temperatures of PVA ( 200 oC) and PMHS
( 185 oC) together with great air and moisture stability of PMHS can be promising for food
packaging purposes [17], [102], [103]. FPP samples made of 10% BCTMP (SEL=0.5 J/m and
SRE=40 kWh/t) were coated with PMHS/water emulsion and tested for their barrier properties
for oil and water using contact angle measurement. Figure 42 illustrates the coated sack paper
after oil and water drops applied to the surface. As seen, in contrast with uncoated sack paper
exhibiting intrinsic hydrophilic/oleophilic behavior, the modified substrate was able to repel both
polar and non-polar liquids exhibiting omniphobic properties.
Figure 42. Oil and water drops on the surface of coated sack samples containing 10% BCTMP
with SEL of 0.5 J/m and SRE of 40 kWh/t
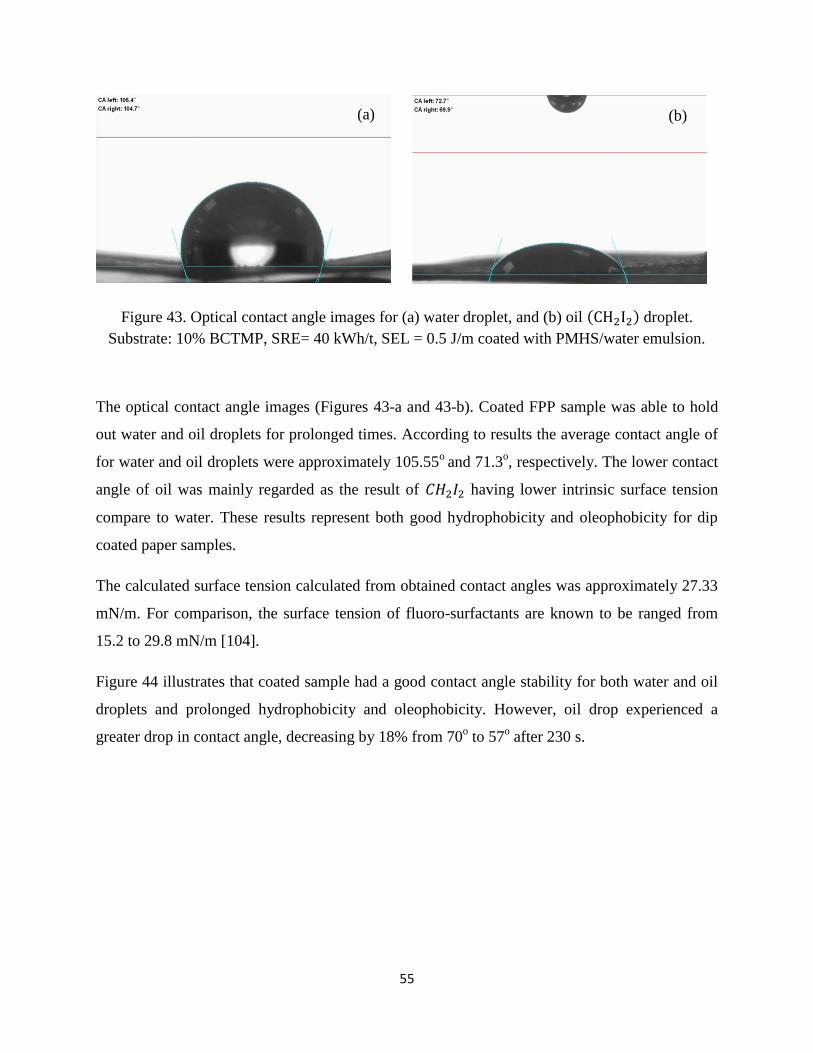
55
Figure 43. Optical contact angle images for (a) water droplet, and (b) oil ( ) droplet.
Substrate: 10% BCTMP, SRE= 40 kWh/t, SEL = 0.5 J/m coated with PMHS/water emulsion.
The optical contact angle images (Figures 43-a and 43-b). Coated FPP sample was able to hold
out water and oil droplets for prolonged times. According to results the average contact angle of
for water and oil droplets were approximately 105.55o
and 71.3o, respectively. The lower contact
angle of oil was mainly regarded as the result of having lower intrinsic surface tension
compare to water. These results represent both good hydrophobicity and oleophobicity for dip
coated paper samples.
The calculated surface tension calculated from obtained contact angles was approximately 27.33
mN/m. For comparison, the surface tension of fluoro-surfactants are known to be ranged from
15.2 to 29.8 mN/m [104].
Figure 44 illustrates that coated sample had a good contact angle stability for both water and oil
droplets and prolonged hydrophobicity and oleophobicity. However, oil drop experienced a
greater drop in contact angle, decreasing by 18% from 70o to 57
o after 230 s.
(a) (b)
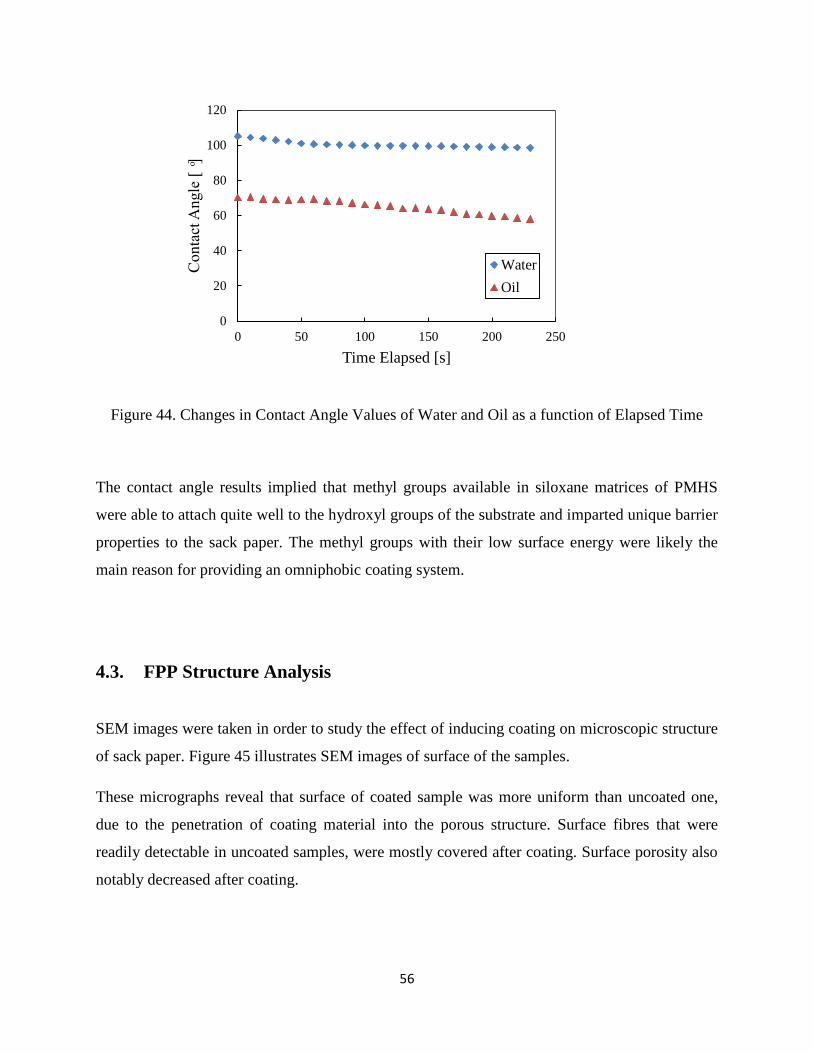
56
Figure 44. Changes in Contact Angle Values of Water and Oil as a function of Elapsed Time
The contact angle results implied that methyl groups available in siloxane matrices of PMHS
were able to attach quite well to the hydroxyl groups of the substrate and imparted unique barrier
properties to the sack paper. The methyl groups with their low surface energy were likely the
main reason for providing an omniphobic coating system.
4.3. FPP Structure Analysis
SEM images were taken in order to study the effect of inducing coating on microscopic structure
of sack paper. Figure 45 illustrates SEM images of surface of the samples.
These micrographs reveal that surface of coated sample was more uniform than uncoated one,
due to the penetration of coating material into the porous structure. Surface fibres that were
readily detectable in uncoated samples, were mostly covered after coating. Surface porosity also
notably decreased after coating.
0
20
40
60
80
100
120
0 50 100 150 200 250
Conta
ct A
ngle
[ ͦ]
Time Elapsed [s]
Water
Oil
(a) (b)
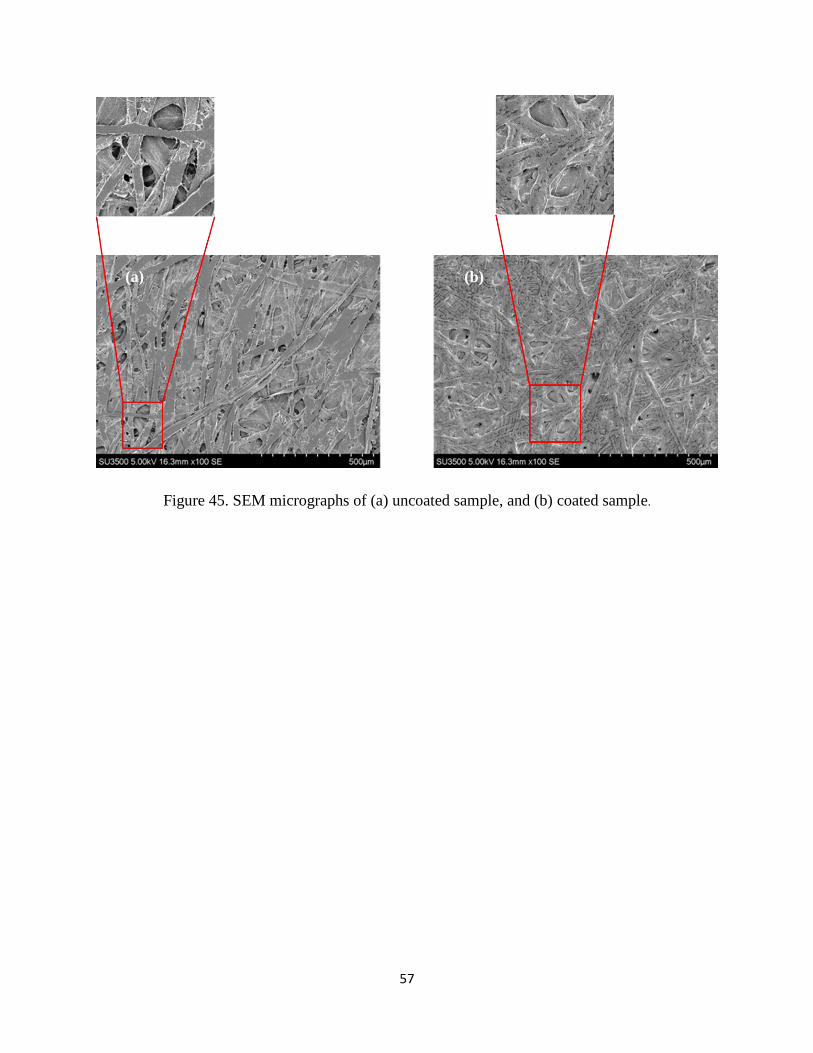
57
Figure 45. SEM micrographs of (a) uncoated sample, and (b) coated sample.
(b)
(b) (a)
58
5. Conclusion
This study confirms that sack paper could be produced with the partial replacement of USKP
with BCTMP with acceptable properties. Air resistance, tensile index, stretch, TEA, and tear
index measurements showed that co-refined pulp containing 10% BCTMP refined at an intensity
of 0.5 J/m performed similar to 100% LCR-HCR USKP at SREs of 40 and 80 kWh/t. However,
at given freeness of 300 and 400 ml, which usually actively used for production of sack products,
10% BCTMP with higher intensity consumed less amount of energy to be refined and performed
slightly better in terms of tear and stretch properties. High porosity of 10% BCTMP with low
intensity at these target CSFs highlighted this blend to be preferred over the other samples.
Mechanical pulp containing sack papers were successfully treated by a non-fluorinated aqueous
coating conatining PMHS, PVA, kaolin, and silica nano-powder indicated that this novel coating
formulation to impart omniphobic properties. Having water and oil contact angle of 105.55o
and
71.3o, respectively, the treated sack paper exhibited stable barrier properties for water and oil
penetration.
The BCTMP-containing sack paper is a fluorine-free alternative to the existing flexible
packaging products used in the food industry. In addition, partial replacement of sack kraft pulp
with mechanical pulp is expected to result in a significant reduction in cost due to the lower price
of BCTMP. The PMHS-based coating materials used for improving FPP barrier properties
eliminated the use of toxic and health hazards fluorinated compounds and proved their capability
of being used for potential applications such as food packaging.
59
6. Future Work
This study can be extended for further investigations on improving both hydrophobicity and
oleophobicity of the coating by examining various coating conditions and adding extra
pretreatments to the emulsion. Furthermore, conducting other coating methods can efficiently
affect the results and help to improve the existing work. Since coating weight cannot be fully
controlled by dip coating method, spray coater or casting knife coater can be implied to manage
the weight added to the paper samples. Various additives such as starch and chitosan can be
added to furnish to reinforce mechanical properties prior handsheet making process. It should be
noted the results used for this project was restricted to the lab scale; thus, using paper machine
instead of semi-automatic handsheet former can assess the results to be more comparable to the
mill scale.
As a supplementary work, the changes in pore size after surface modification can be studied
more precisely by either measuring the pore size or determining air resistance (Gurely method)
after the addition of coating. Surface roughness can also be measured after applying coating to
study the uniformity of the coated surface. Some fillers including talc can be added further for
improving surface smoothness. Addition of resins can also help to enhance wet strength and
other key elements of the modified FPP samples.
Surface technologies such as x-ray photoelectron spectroscopy (XPS), Raman spectroscopy, and
Fourier-transform infrared spectroscopy (FTIR) can be conducted upon coated substrates for
additional information on chemical characterization.
60
7. References
[1] O. Tillmann, “Paper and Board, 11. Grades and Their Properties,” Ullmann’s Encycl. Ind.
Chem., pp. 1–15, 2006.
[2] R. Rowell, Handbook of Wood Chemistry and Wood Composites, Second Edition, no.
February 2005. CRC Press LLC, 2012.
[3] M. J. Kirwan, Handbook of Paper and Paperboard, Second Edi. A John Wiley & Sons,
Ltd., Publication, 2013.
[4] D. A. Todorova, “Magnetic-spinning effects in sack paper technology,” J. Chem. Technol.
Metall., vol. 51, no. 5, pp. 514–518, 2016.
[5] H. H. Ettefagh, “Application of Low Consistency Refining of Pulp in Producing Multi-Ply
Folding,” University of Toronto, 2016.
[6] A. Piselli, P. Garbagnoli, I. Alfieri, A. Lorenzi, and B. Del Curto, “Natural-based coatings
for food paper packaging,” Int. J. Des. Sci. Technol., vol. 20, no. 1, pp. 55–78, 2014.
[7] S. S. Muthu, Y. Li, J.-Y. Hu, and P.-Y. Mok, “An Exploratory Comparative Study on Eco-
Impact of Paper and Plastic Bags,” J. Fiber Bioeng. Informatics, vol. 1, no. 4, pp. 307–
320, 2009.
[8] M. Martins, “A STRATEGIC ANALYSIS OF A KRAFT LINERBOARD AND
SACKKRAFT MILL,” Simon Freaser University, 2005.
[9] J. Johakimu, “INVESTIGATION OF THE POTENTIAL TO DEVELOP HIGH PULP
STRENGTH FROM HIGH YIELD KRAFT PULP MADE FROM PINUS PA TULA,”
University of KwaZulu-Natal, 2015.
[10] E. Summary, “Refining and Bleaching Optimization,” Valmet, pp. 1–18, 2013.
[11] D. W. Francis, M. T. Towers, and T. C. Browne, “Energy Cost Reduction in the Pulp and
Paper Industry – An Energy Benchmarking Perspective,” p. 30, 2002.
61
[12] T. K. Das and C. Houtman, “Evaluating chemical-, Mechanical-, and bio-pulping
processes and their sustainability characterization using life-cycle assessment,” Environ.
Prog., vol. 23, no. 4, pp. 347–357, 2004.
[13] B. Geueke, “Dossier – Per- and polyfluoroalkyl substances (PFASs),” Food Packag.
Forum, no. July, pp. 1–13, 2016.
[14] L. A. Schaider et al., “Fluorinated Compounds in U.S. Fast Food Packaging,” Environ.
Sci. Technol. Lett., vol. 4, no. 3, pp. 105–111, 2017.
[15] E. W. G. Jr, C. Tech, and T. Blog, “Media Reports Fluorinated Compounds in U . S . Fast
Food Packaging,” pp. 7–9, 2018.
[16] J. M. L. & R. E. M. Jr, “Polymethylhydrosiloxane,” no. 4. pp. 1–6.
[17] S. J. Lee, M. Goedert, M. T. Matyska, E. M. Ghandehari, M. Vijay, and J. J. Pesek,
“Polymethylhydrosiloxane (PMHS) as a functional material for microfluidic chips,” J.
Micromechanics Microengineering, vol. 18, no. 2, 2008.
[18] P. Bond, Brian; Hamner, “Wood Identification for Hardwood and Softwood Species
Native to Tennessee,” Agric. Ext. Serv., p. 16, 2002.
[19] J. & S. Wiley, “The pulp and paper making processes.PDF,” Technol. Reducing Dioxin
Manuf. Bleach. Wood Pulp, pp. 17–26, 1989.
[20] E. Sjostrom, Wood Chemistry. Fundamentals and Applications, Second. San Diego:
Academic Press, 1993.
[21] L. Taiz, “Cell Walls : Structure , Biogenesis , and Expansion,” in Plant Physiology:
Biology, Botany, 5th Editio., Just the Facts 101, 2017, pp. 314–337.
[22] P. H. F. Pereira et al., “Vegetal fibers in polymeric composites: a review,” Polímeros, vol.
25, no. 1, pp. 9–22, 2015.
[23] J. S. Srndovic, “Ultrastructure of the Primary Cell Wall of Softwood Fibres Studied Using
Dynamic Ft-Ir Spectroscopy,” Royal Institute of Technology, 2008.
62
[24] D. J. Cosgrove and M. C. Jarvis, “Comparative structure and biomechanics of plant
primary and secondary cell walls,” Front. Plant Sci., vol. 3, no. August, pp. 1–6, 2012.
[25] J. Fahlén, “The cell wall ultrastructure of wood fibres – effects of the chemical pulp fibre
line,” Dep. Fibre Polym. Technol., vol. PhD, p. 70, 2005.
[26] P. Bajpai, “Biotechnology for pulp and paper processing,” Biotechnol. Pulp Pap. Process.,
vol. 9781461414, pp. 1–414, 2011.
[27] P. F. VENA and Thesis, “Thermomechanical pulping (tmp), chemithermomechanical
pulping (ctmp) and biothermomechanical pulping (btmp) of bugweed (SOLANUM
MAURITIANUM) AND PINUS PATULA.,” the University of Stellenbosch, 2005.
[28] A. V. Someshwar and J. E. Pinkerfon, “Wood Processing Industry,” Air Pollut. Eng.
Man., p. 844, 1992.
[29] A. M. Scott G. M, “An overview of biopulping research: Discovery and Engineering,”
Journal of Korea TAPPI, vol. 30, no. 4. pp. 18–27, 1998.
[30] N. Klinga, H. Höglund, and C. Sandberg, “Energy efficient high quality CTMP for
paperboard,” no. 1, pp. 1–11, 2007.
[31] A. Tutus and M. Usta, “Bleaching of chemithermomechanical pulp (CTMP) using
environmentally friendly chemicals,” J. Environ. Biol., vol. 25, no. 2, pp. 141–145, 2004.
[32] A. N. D. C. Daneault, “Bleaching Processes for the Production of Mechanical and Chemi-
Mechanical Pulps of High Brightness,” vol. 7, pp. 18–20, 1994.
[33] H. Tran and E. K. Vakkilainnen, “The Kraft Chemical Recovery Process,” TAPPI Kraft
Recover. Course, pp. 1–8, 2012.
[34] L. Staffas, L. Tufvesson, A. Svenfelt, S. Astrom, J. Toren, and Y. Arushanyan,
“ALternative sources for competing with forest based biofuel - a pre-study,” no. February
2015, pp. 8–89, 2013.
[35] D. Muhić, “High consistency refining of mechanical pulps during varying refining
conditions - High consistency refiner conditions effect on pulp quality,” Linkopings
63
Universitet, 2008.
[36] P. Cuberos-Martinez and S. Won Park, “Review of physical principles in low consistency
refining,” O Pap., vol. 73, no. 8, pp. 65–72, 2012.
[37] S. Gharehkhani et al., “Basic effects of pulp refining on fiber properties - A review,”
Carbohydr. Polym., vol. 115, pp. 785–803, 2015.
[38] J. Lumiainen, “Refining of chemical pulp,” Papermak. Sci. Technol. Papermak. - Part1,
Stock Prep. wet end. B. 8. Vol. 8, pp. 87–121, 2000.
[39] J. E. C. J. S.Hanish Anand, P.Manigandan, J.Satish Kumar, “DESIGN AND
MANUFACTURING of DISC REFINER,” vol. 53, no. March, pp. 564–569, 2012.
[40] N. Rajabi Nasab, J. A. Olson, J. Heymer, and M. D. Martinez, “Understanding of No-load
power in low consistency refiners,” Can. J. Chem. Eng., vol. 92, no. 3, pp. 524–535, 2014.
[41] Ferritsius, “Development of TMP fibers in LC- and HC- refining,” Nord. Pulp Pap. Res.
J., vol. 27, no. 5, pp. 860–871, 2012.
[42] Andersson, “Effect of long fibre concentration on low consistency refining of mechanical
pulp,” Nord. Pulp Pap. Res. J., vol. 27, no. 4, pp. 702–706, 2012.
[43] D. Caulfield and D. Gunderson, “Paper Testing And Strength Characteristics,” TAPPI
Proc. 1988 Pap. pereservation Symp., pp. 31–40, 1988.
[44] C. J. Biermann, handbook of Pulping and Papermaking, Second Edi. Oregon: Academic
Press, 1996.
[45] J. P. Casey, Pulp and Paper, Volume 3, Second. New York: Interscience, 1961.
[46] A. Timberlake, “Grammage of paper and paperboard (weight per unit area) (Revision of T
410 om-08),” Tappi Stand., vol. T 410, pp. 1–14, 2013.
[47] Q. Xia, M. Rao, X. Shen, and H. Zhu, “Adaptive control of basis weight and moisture
content for a paperboard machine,” J. Process Control, vol. 3, no. 4, pp. 203–209, 1993.
[48] G. Duarte and A. Sousa, “Office paper bulk optimization in a paper machine using
64
multivariate techniques,” vol. 72, no. August, pp. 50–55, 2011.
[49] O. P. Joutsimo and S. Asikainen, “Effect of fiber wall pore structure on pulp sheet density
of softwood kraft pulp fibers,” BioResources, vol. 8, no. 2, pp. 2719–2737, 2013.
[50] G. H. Knauf and M. R. Doshi, “Calculations of Aerodynamic Porosity , Specific Surface
Area , and Specific Volume From Gurley Seconds Measurements,” no. 183, pp. 1–7,
1986.
[51] T. K. M. Yamauchi, “Part 3. Interaction with Liquids and Gases: Porosity and Gas
Permeability,” in Handbook of Physical Testing of Paper, Second., New York: Decker,
2002, pp. 267–303.
[52] J. C. Sjoberg and H. Hoglund, “High consistency refining of kraft pulp for reinforcing
paper based on TMP furnishes,” Int. Mech. Pulping Conf. 2007, TAPPI, vol. 2, pp. 943–
953, 2007.
[53] H. Kjellgren, “Barrier Properties of Greaseproof Paper,” Karlstad University Studies,
2005.
[54] L. Pal, M. Joyce, and P. Fleming, “A simple method for calculation of the permeability
coefficient of porous media,” Tappi J., no. September, pp. 10–16, 2006.
[55] N. Gurnagul, S. Ju, and K. Miles, “Optimizing high-consistency refining conditions for
good sack paper quality,” Appita, no. February, pp. 379–386, 2005.
[56] S. P. Singh, “A comparison of different methods of paper surface smoothness evaluation,”
BioResources, vol. 3, no. 2, pp. 503–516, 2008.
[57] A. Vishtal and E. Retulainen, “Boosting the extensibility potential of fibre networks: A
review,” BioResources, vol. 9, no. 4, pp. 7951–8001, 2014.
[58] M. News, C. Nanomaterials, P. Drinking, and W. Affordably, “Related Content,” pp. 12–
14, 2013.
[59] T. T. Schaeffer, V. Blyth-hill, and J. R. Druzik, “Aqueous Light Bleaching of Paper :
Comparison of Calcium Hydroxide and Magnesium Bicarbonate Bathing Solutions,” vol.
65
35, no. 3, pp. 219–238, 2018.
[60] P. Raw and M. Working, “Commonly used Test Methods for Paper and Board,” Group,
pp. 1–90, 2005.
[61] H. Karlsson, “Strength Properties of Paper produced from Softwood Kraft Pulp – Pulp
Mixture, Reinforcement and Sheet Stratification,” Karlstad University Studies, 2010.
[62] TAPPI, 2002-2003 TAPPI Test Methods. Atlanta, 2002.
[63] S. L. Anson, “Specific contact area and the tensile strength of paper,” Appita …, pp. 1–11,
2006.
[64] H. Karlsson, “Some aspects on strength properties in paper composed of different pulps,”
Karlstad University Studies, 2007.
[65] P. Shallhorn and N. Gurnagul, “A semi-empirical model of the tensile energy absorption
of sack kraft paper,” BioResources, vol. 5, no. 1, pp. 455–476, 2010.
[66] M. Str, R. Goyal, M. Van Der Merwe, and M. Lijhara, “SMARTER PACKAGING
SOLUTIONS: Challenging conventional packaging , for a sustainable future.,” Sweden.
[67] A. Strand et al., “The effect of chemical additives on the strength, stiffness and elongation
potential of paper - OPEN ACCESS,” Nord. Pulp Pap. Res. J., vol. 32, no. 3, pp. 324–
335, 2017.
[68] IGGESUND, “Stiffness characteristics,” PAPERBOARD, IGGESUND. [Online].
Available: https://www.iggesund.com/en/knowledge/knowledge-publications/the-
reference-manual/baseboard-physical-properties/stiffness/.
[69] N. Gurnagul and D. Page, “The difference between dry and rewetted zero-span tensile
strength of paper,” Tappi J., vol. 72, no. 12, pp. 164–167, 1989.
[70] B. J. W. Gatari, “An Experimental Analysis of the Zero and Short Span tensile tests,”
Chalmers University of Technology, 2003.
[71] R. Hägglund, P. A. Gradin, and D. Tarakameh, “Some aspects on the zero-span tensile
66
test,” Exp. Mech., vol. 44, no. 4, pp. 365–374, 2004.
[72] M. Fišerová, J. Gigac, and J. B. Č. Ák, “Relationship between fibre characteristics and
tensile strength of hardwood and softwood kraft pulps,” Cellul. Chem. Technol., vol. 44,
no. 7–8, pp. 249–253, 2010.
[73] K. A. B. Curt A. Bronkhorst, “Deformation and Failure Behavior of Paper,” in Handbook
of Physical Testing of Paper, Volume 1, Second., K. Murakami, Ed. New York: Marcel
Dekker, 2002, pp. 313–429.
[74] T. Sakaemura and T. Yamauchi, “Strength properties of wet-combination paper
containing dry strength resin,” J. Packag. Sci. Technol., vol. 21, no. 6, pp. 461–469, 2012.
[75] A. Koubaa, Z. Koran, and S. B. T. Scott, “Measure of the internal bond strength of paper
and board,” 2008, vol. 78, no. 3, pp. 103–111, 20AD.
[76] T. Uesaka, “Determination of FIbre-fibre Bond Properties,” in Handbook of Physical
Testing of Paper, Volume 1, Second., Koji Murakami, Ed. New York: Marcel Dekker,
2002, pp. 873–901.
[77] J. C. Strikwerda and J. M. Considine, “Analysis of the Burst Test Geometry A New
Approach,” pp. 579–584, 1991.
[78] R. S. Seth, “Understanding sheet extensibility,” Pulp Pap. Canada, vol. 106, no. 2, pp.
33–40, 2005.
[79] N. Yan, “Mechanistic Modelling of the Elmendorf Tear Energy of Paper,” uNIVERSITY
OF tORONTO, 1997.
[80] V. G. W. Harrison and S. R. C. Poulter, “The measurement of opacity and reflectivity for
printing papers,” Br. J. Appl. Phys., vol. 1, no. 1, pp. 13–17, 1950.
[81] J. Borch, “Optical and Appearance Properties,” in Handbook of Physical Testing of Paper,
Volume 2, Second., New York: Marcel Dekker, 2002.
[82] M. A. Hubbe, J. J. Pawlak, and A. A. Koukoulas, “Paper’s appearance: A review,”
BioResources, vol. 3, no. 2, pp. 627–665, 2008.
67
[83] T. Yokoyama and K. Nakai, “Evaluation In plane Orthotropic Elastic Constants Paper and
Paperboard,” 2007 SEM Annu. Conf., pp. 1–7, 2007.
[84] W. J. Fischer et al., “Pulp fines-characterization, sheet formation, and comparison to
microfibrillated cellulose,” Polymers (Basel)., vol. 9, no. 8, pp. 1–12, 2017.
[85] M. P. S. Bhd, “Kraft Paper Bags Printing.” [Online]. Available: http://paperbag.my/paper-
bag-wholesale-malaysia/kraft-paper-bags-printing/.
[86] V. Rastogi and P. Samyn, “Bio-Based Coatings for Paper Applications,” Coatings, vol. 5,
no. 4, pp. 887–930, 2015.
[87] T. Fort and H. T. Patterson, “a Simple Method for Measuring Solid-Liquid Contact
Angles,” J. Colloid Sci., vol. 18, pp. 217–222, 1963.
[88] M. B. Lyne, “Wetting and the Penetration of Liquids into Paper,” in Handbook of Physical
Testing of Paper, New York: Marcel Dekker, 2002, pp. 303–332.
[89] K.-Y. Law, “Definitions for Hydrophilicity, Hydrophobicity, and Superhydrophobicity:
Getting the Basics Right,” J. Phys. Chem. Lett., vol. 5, no. 4, pp. 686–688, 2014.
[90] D. Njobuenwu, “Determination of contact angle from contact area of liquid droplet
spreading on solid substrate,” Leonardo Electron. J. Pract. Technol., vol. 6, no. 10, pp.
29–38, 2007.
[91] I. Moutinho, M. Figueiredo, and P. Ferreira, “Evaluating the surface energy of laboratory-
made paper sheets by contact angle measurements,” Tappi J., vol. 6, no. 6, pp. 26–32,
2007.
[92] Z. Tang, D. W. Hess, and V. Breedveld, “Fabrication of oleophobic paper with tunable
hydrophilicity by treatment with non-fluorinated chemicals,” J. Mater. Chem. A, vol. 3,
no. 28, pp. 14651–14660, 2015.
[93] P. A. Rice, “C6-Perfluorinated Compounds: The New Greaseproofing Agents in Food
Packaging,” Curr. Environ. Heal. reports, vol. 2, no. 1, pp. 33–40, 2015.
[94] L. S. Birnbaum and P. Grandjean, “Alternatives to PFASs: Perspectives on the science,”
68
Environ. Health Perspect., vol. 123, no. 5, pp. 104–105, 2015.
[95] Z. Xu et al., “Fluorine-Free Superhydrophobic Coatings with pH-induced Wettability
Transition for Controllable Oil-Water Separation,” ACS Appl. Mater. Interfaces, vol. 8,
no. 8, pp. 5661–5667, 2016.
[96] A. Johansson, “Correlations between fibre properties and paper properties,” Mater thesis
Pulp Technol., pp. 1–49, 2011.
[97] “Scott Plybond,” Applied Paper Technology Inc. [Online]. Available:
c:%5CUsers%5CBahar SM%5CDesktop%5C45 Dunfield%5CApplied Paper Technology
Scott Plybond · Applied Paper Technology.htm.
[98] S. W. Muzenski, I. Flores-Vivian, and K. Sobolev, “The development of hydrophobic and
superhydrophobic cementitious composites,” Proc. 4th Int. Conf. Durab. Concr. Struct.
ICDCS 2014, vol. 1, no. July, pp. 1–6, 2014.
[99] N. H. Mohd Hassan, S. Muhammed, and R. Ibrahim, “Properties of Gigantochloa
scortechinii paper enhancement by beating revolution,” J. Trop. Resour. Sustain. Sci., vol.
2, no. January, pp. 59–67, 2014.
[100] F. M. Bolam, “Kraft Papers, Glazed Castings, MG Sulphites, Woodpulp Tissues,” in Stuff
Preparation for Paper and Paperboard Making, London: Pergamon Press, 1965, pp. 112–
125.
[101] T. M. T. U. R. Institute, “Alternatives to Salvent-Based Coatings,” 1994. [Online].
Available:
https://www.google.ca/url?sa=t&rct=j&q=&esrc=s&source=web&cd=1&cad=rja&uact=8
&ved=2ahUKEwjZi5iM-b3dAhVr6YMKHdL-
AmEQFjAAegQICRAC&url=https%3A%2F%2Fwww.turi.org%2Fcontent%2Fdownload
%2F1699%2F8696%2Ffile%2FFactsheet_Alternatives_to_SolventCoatings.pdf&usg=AO
.
[102] S. Nagappan and C. S. Ha, “In-situ addition of graphene oxide for improving the thermal
stability of superhydrophobic hybrid materials,” Polym. (United Kingdom), vol. 116, pp.
69
412–422, 2017.
[103] Y. Tsuchiya and K. Sumi, “Thermal decomposition products of poly(vinyl alcohol),” J.
Polym. Sci. Part A-1 Polym. Chem., vol. 7, no. 11, pp. 3151–3158, 1969.
[104] U. Järnberg and K. Holmström, “Perfluoroalkylated acids and related compounds (PFAS)
in the Swedish environment,” Chem. Sources, Expo., pp. 1–47, 2006.
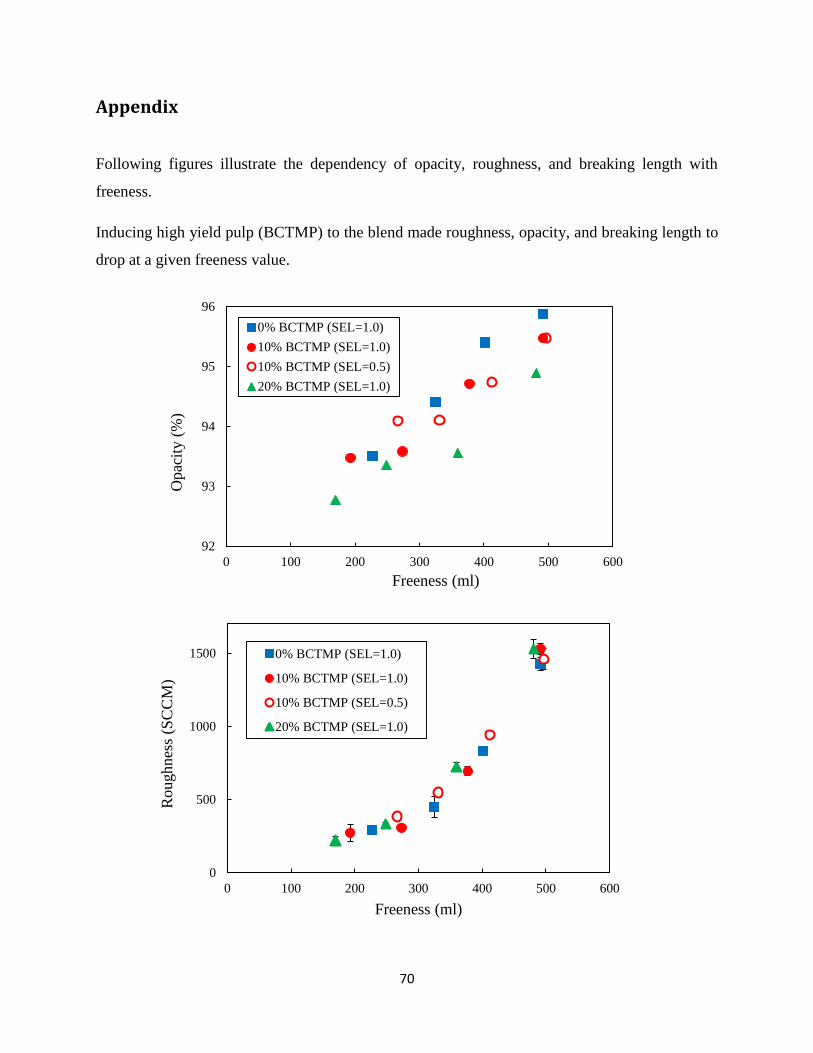
70
Appendix
Following figures illustrate the dependency of opacity, roughness, and breaking length with
freeness.
Inducing high yield pulp (BCTMP) to the blend made roughness, opacity, and breaking length to
drop at a given freeness value.
92
93
94
95
96
0 100 200 300 400 500 600
Opac
ity (
%)
Freeness (ml)
0% BCTMP (SEL=1.0)
10% BCTMP (SEL=1.0)
10% BCTMP (SEL=0.5)
20% BCTMP (SEL=1.0)
0
500
1000
1500
0 100 200 300 400 500 600
Roughnes
s (S
CC
M)
Freeness (ml)
0% BCTMP (SEL=1.0)
10% BCTMP (SEL=1.0)
10% BCTMP (SEL=0.5)
20% BCTMP (SEL=1.0)
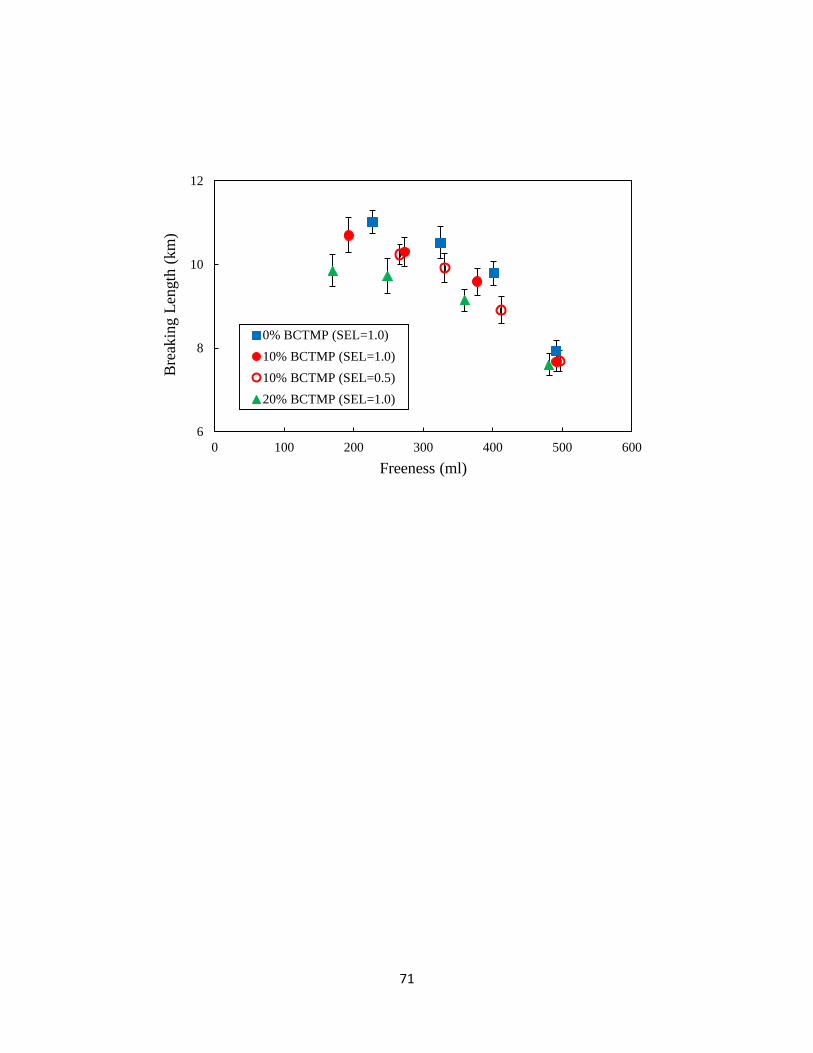
71
6
8
10
12
0 100 200 300 400 500 600
Bre
akin
g L
ength
(km
)
Freeness (ml)
0% BCTMP (SEL=1.0)
10% BCTMP (SEL=1.0)
10% BCTMP (SEL=0.5)
20% BCTMP (SEL=1.0)


![25022019 PBAPP SWSI Simpang Ampat 01032019 CHN Ampat... · -J36(uskP- V% = :uk 52019I3`1Z ]b ^ 10\ 2019I3`2Z ]b [ 10\ s JKR ROAD WIDENING PROJECT IN SEBERANG PRAI: 600MM WATER PIPE](https://img.pdfslide.us/doc/110x75/5cb85dfe88c993de5c8b61e3/25022019-pbapp-swsi-simpang-ampat-01032019-ampat-j36uskp-v-uk-52019i31z.jpg)