Embed Size (px)
Citation preview
Fluid First:Fluid First:Using PLR & SVVUsing PLR & SVV
to Optimize Volumeto Optimize Volume
Jan M. Headley, R.N. BS
DisclosureDirector, Clinical Marketing &
Professional Education
Edwards Lifesciences
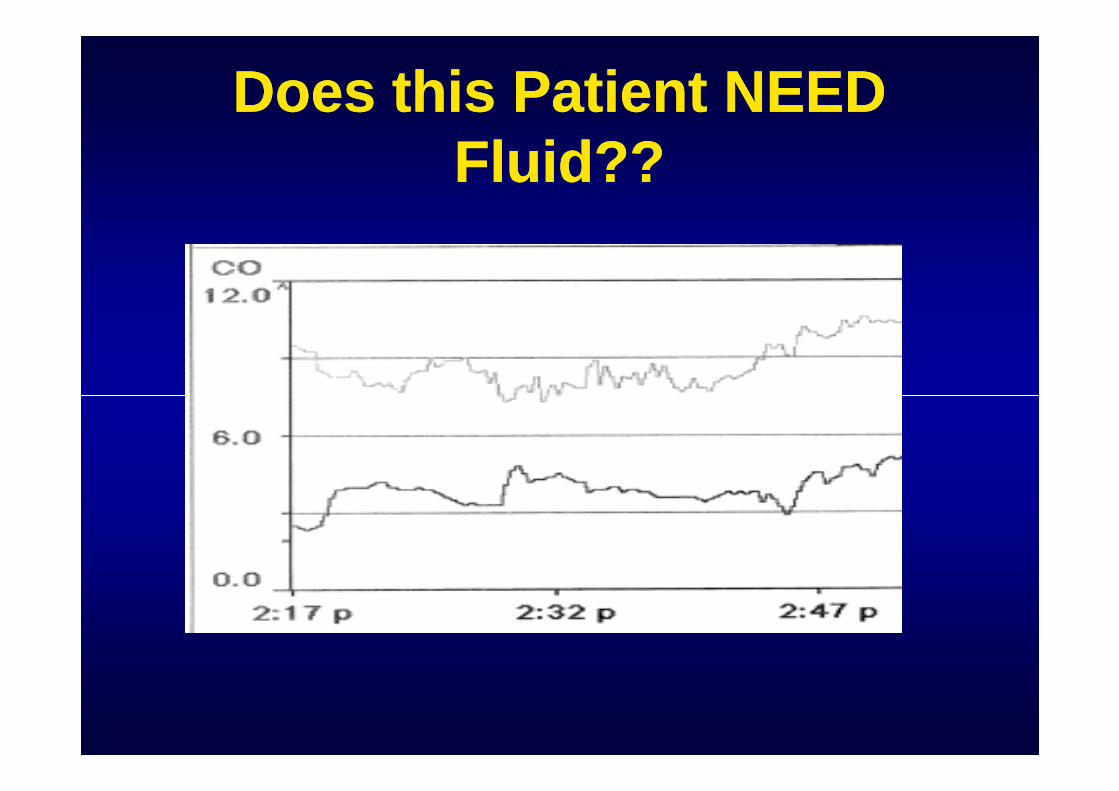
Does this Patient NEEDDoes this Patient NEEDFluid??Fluid??
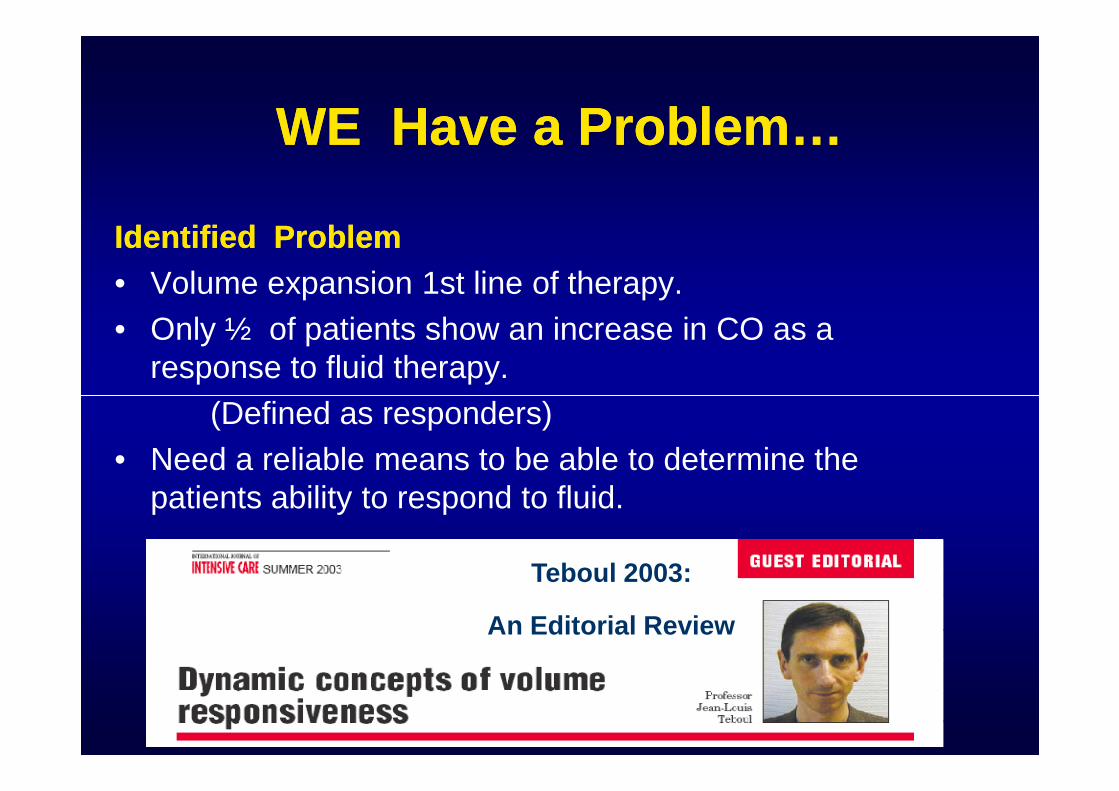
WE Have a Problem…WE Have a Problem…
Identified ProblemIdentified Problem
• Volume expansion 1st line of therapy.
• Only ½ of patients show an increase in CO as aresponse to fluid therapy.
(Defined as responders)
• Need a reliable means to be able to determine thepatients ability to respond to fluid.
Teboul 2003:
An Editorial Review
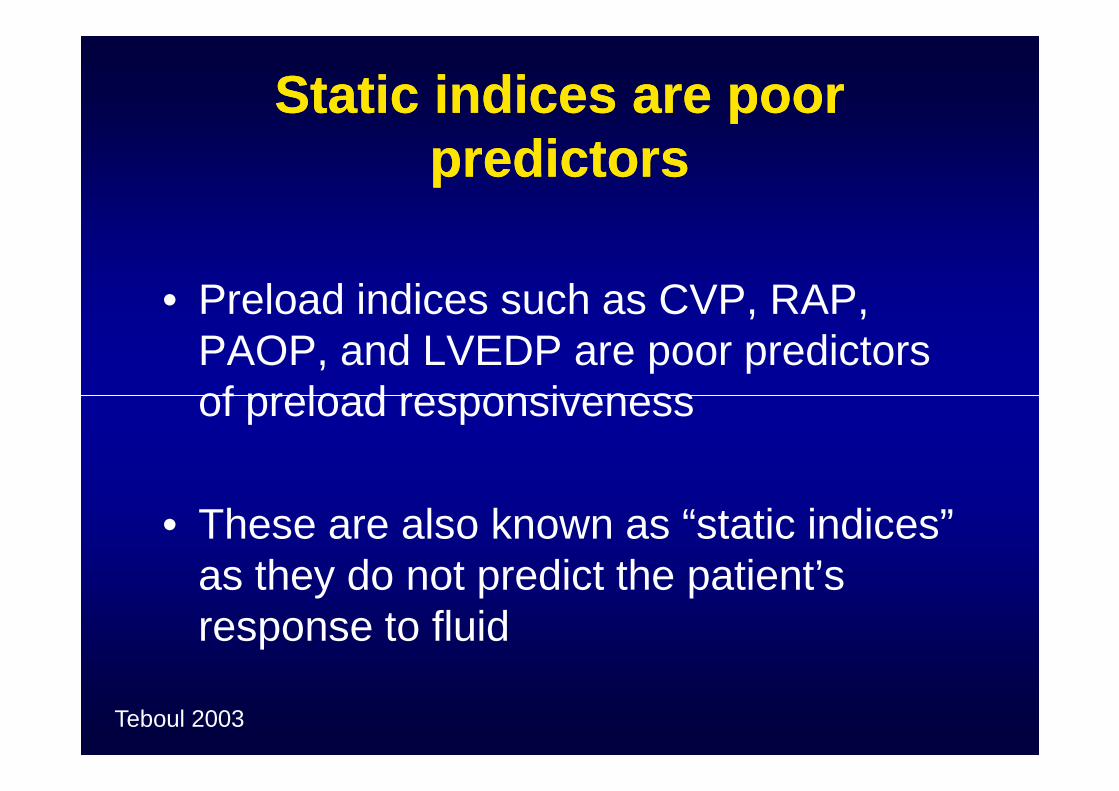
Static indices are poorStatic indices are poorpredictorspredictors
• Preload indices such as CVP, RAP,PAOP, and LVEDP are poor predictorsof preload responsivenessof preload responsiveness
• These are also known as “static indices”as they do not predict the patient’sresponse to fluid
Teboul 2003
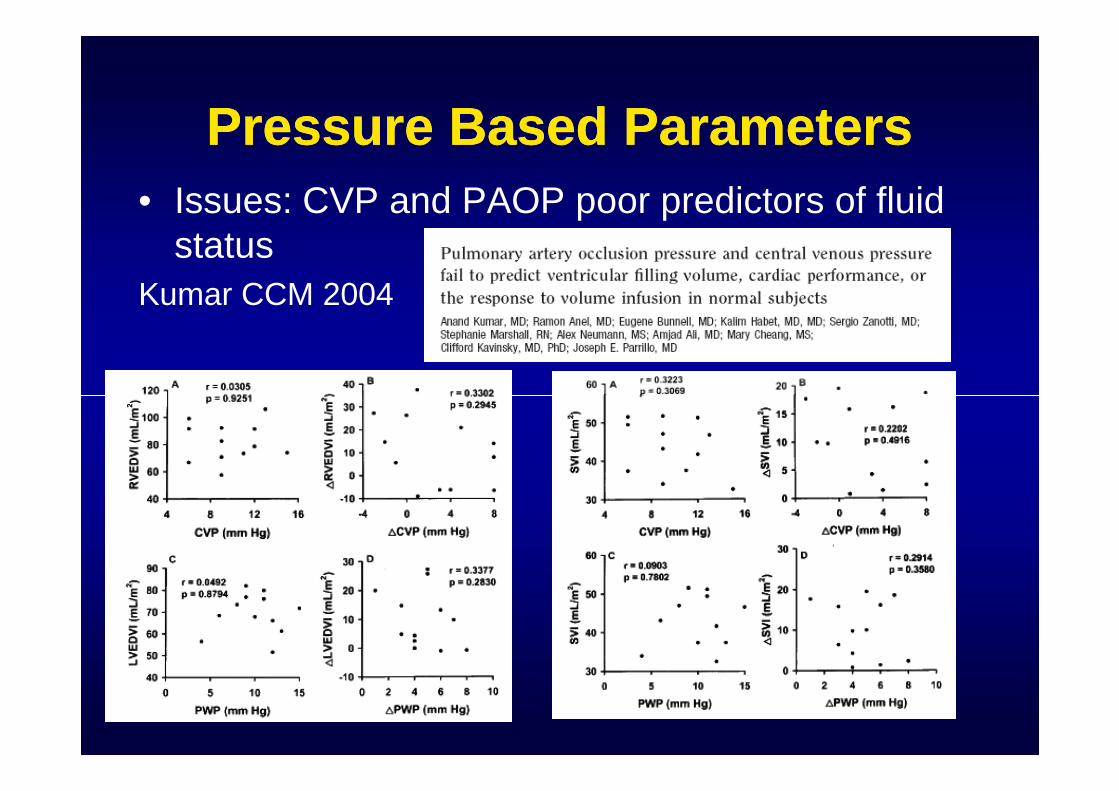
Pressure Based ParametersPressure Based Parameters
• Issues: CVP and PAOP poor predictors of fluidstatus
Kumar CCM 2004
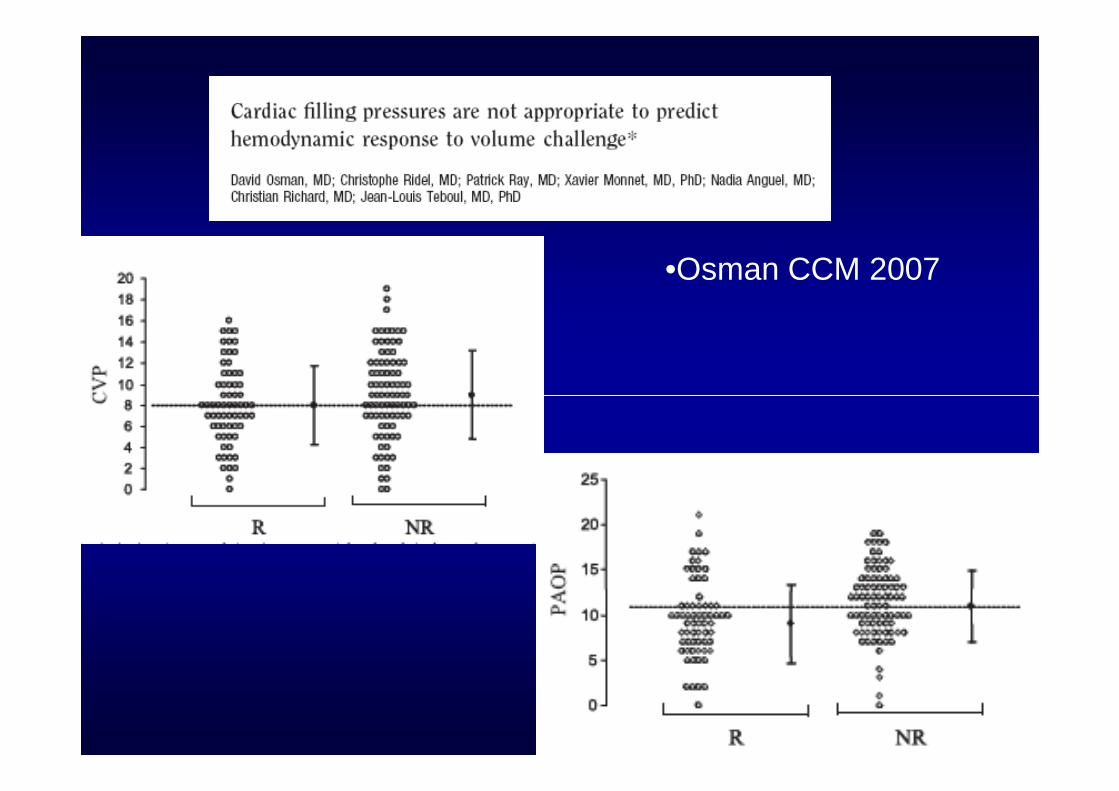
•Osman CCM 2007

Dynamic Preload PredictingDynamic Preload PredictingParametersParameters
• Dynamic preloadparameters suchas SPV and itsdelta up or down,delta up or down,PPV and SVV arebetter predictors ofpreloadresponsiveness
than static indices.
TeboulTeboul
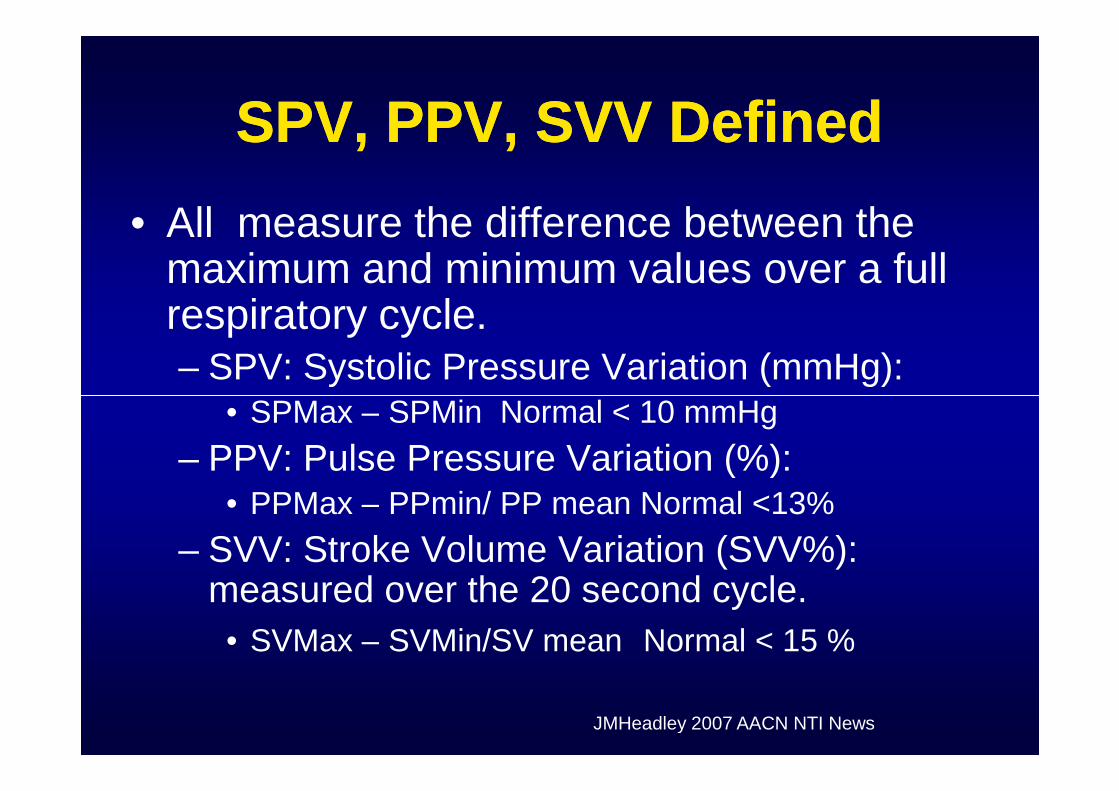
SPV, PPV, SVV DefinedSPV, PPV, SVV Defined
• All measure the difference between themaximum and minimum values over a fullrespiratory cycle.– SPV: Systolic Pressure Variation (mmHg):
• SPMax – SPMin Normal < 10 mmHg• SPMax – SPMin Normal < 10 mmHg
– PPV: Pulse Pressure Variation (%):• PPMax – PPmin/ PP mean Normal <13%
– SVV: Stroke Volume Variation (SVV%):measured over the 20 second cycle.
• SVMax – SVMin/SV mean Normal < 15 %
JMHeadley 2007 AACN NTI News
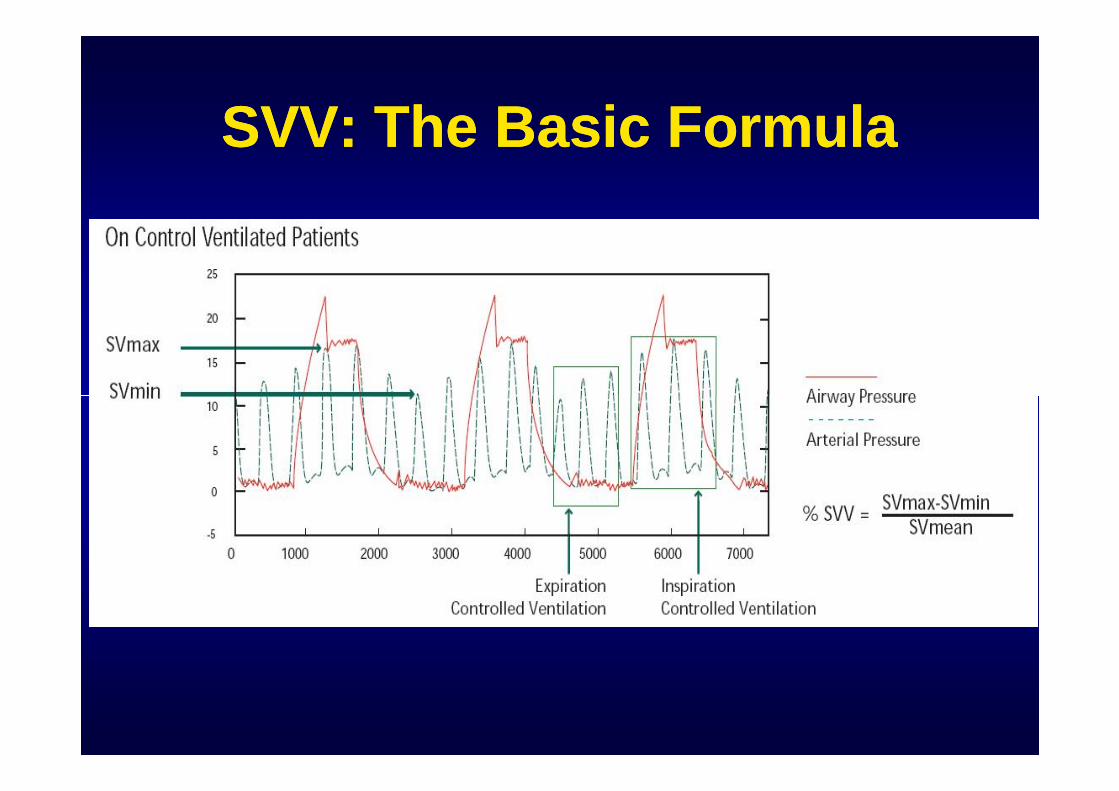
SVV: The Basic FormulaSVV: The Basic Formula
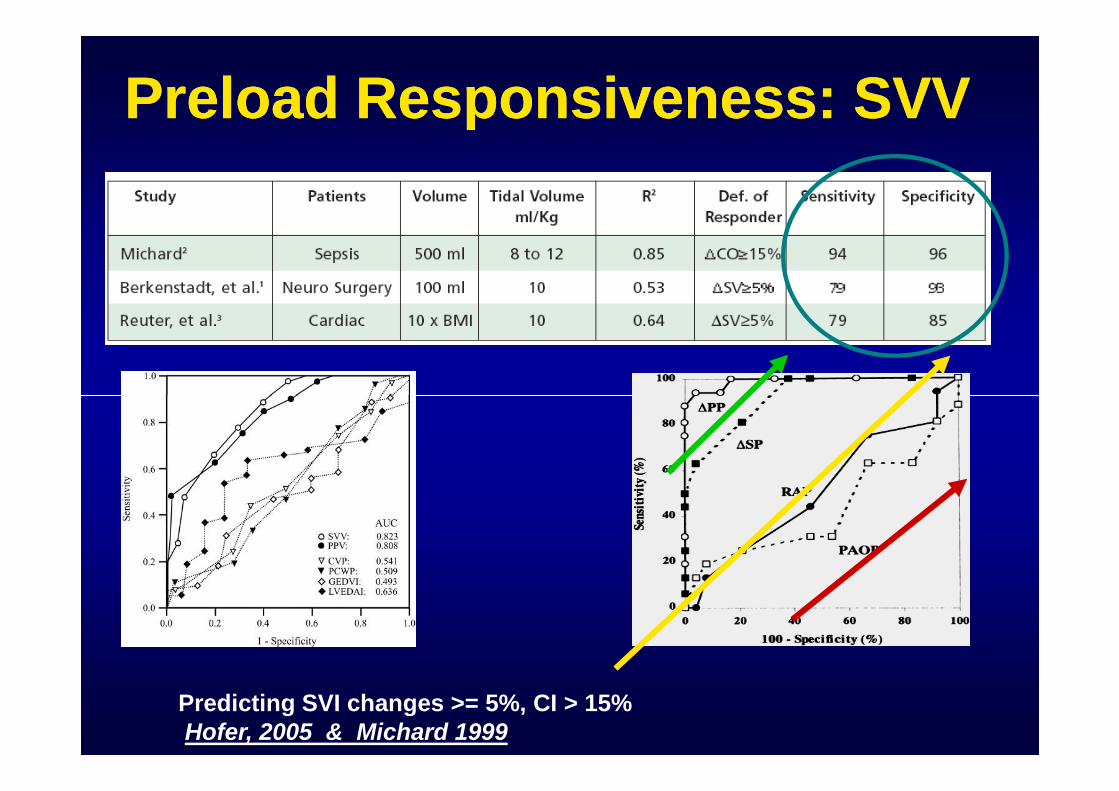
Preload Responsiveness: SVVPreload Responsiveness: SVV
Predicting SVI changes >= 5%, CI > 15%Hofer, 2005 & Michard 1999
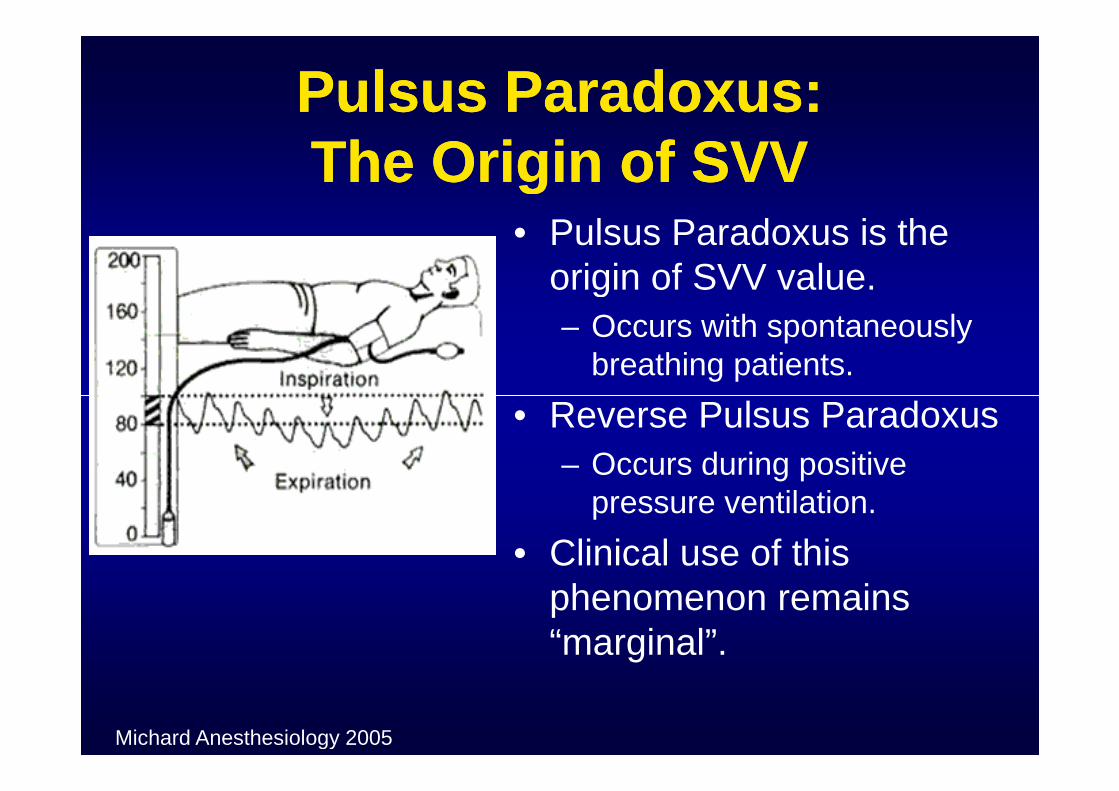
Pulsus Paradoxus:Pulsus Paradoxus:The Origin of SVVThe Origin of SVV
• Pulsus Paradoxus is theorigin of SVV value.
– Occurs with spontaneouslybreathing patients.
• Reverse Pulsus Paradoxus• Reverse Pulsus Paradoxus
– Occurs during positivepressure ventilation.
• Clinical use of thisphenomenon remains“marginal”.
Michard Anesthesiology 2005
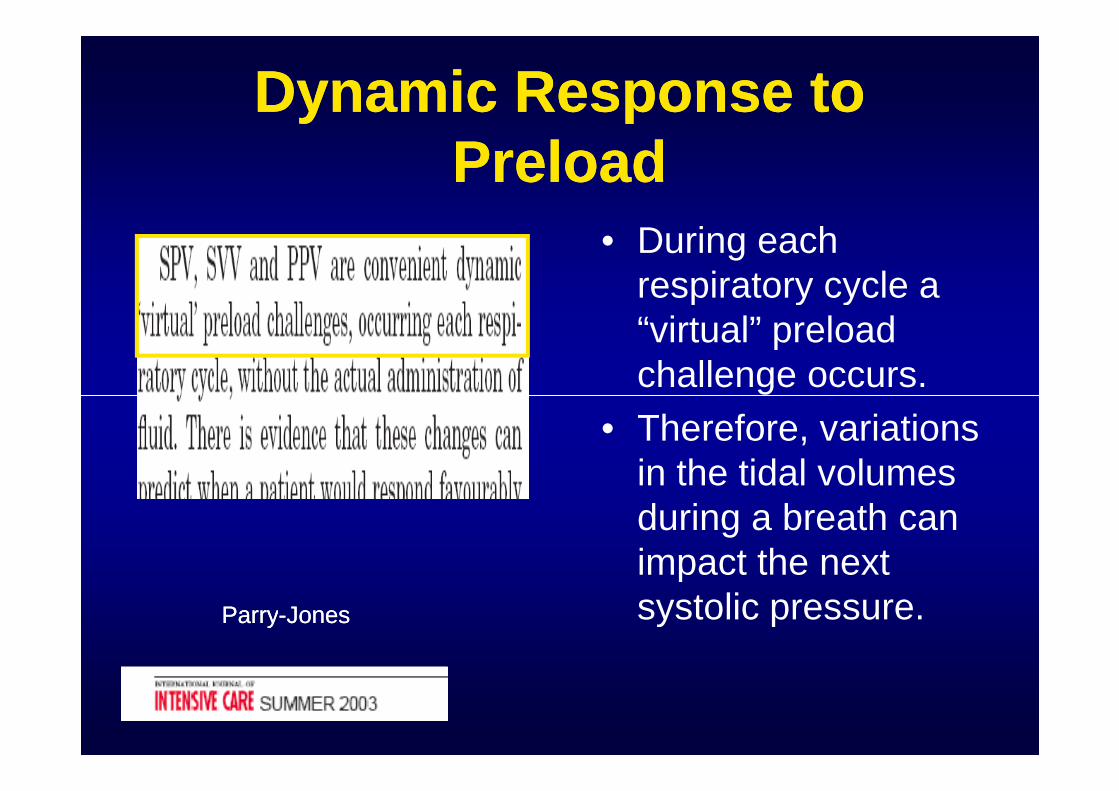
Dynamic Response toDynamic Response toPreloadPreload
• During eachrespiratory cycle a“virtual” preloadchallenge occurs.
• Therefore, variationsin the tidal volumesduring a breath canimpact the nextsystolic pressure.ParryParry--JonesJones
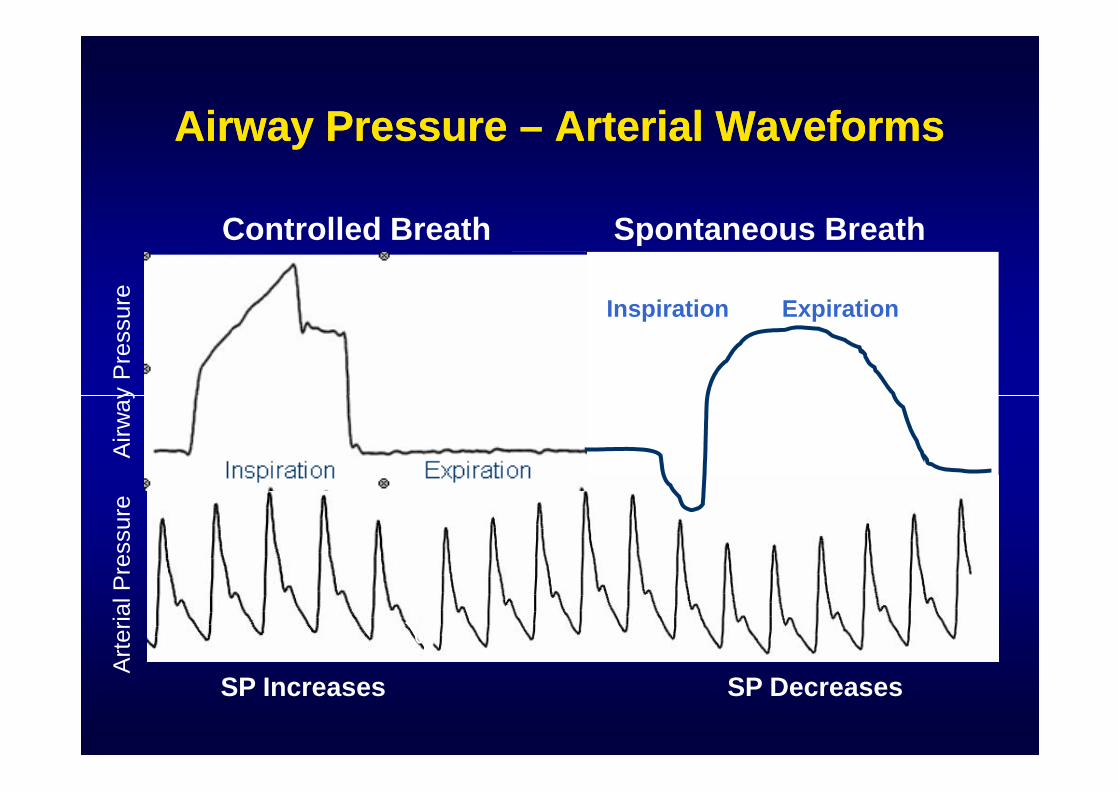
Airway PressureAirway Pressure –– Arterial WaveformsArterial Waveforms
Controlled Breath Spontaneous Breath
Airw
ay
Pre
ssure Inspiration Expiration
SP Increases SP Decreases
Airw
ay
Pre
ssure
Art
erialP
ressure
Str
oke
Volu
me
Str
oke
Volu
me
P
SV
SVV 10%
SVV 8%
Patient B
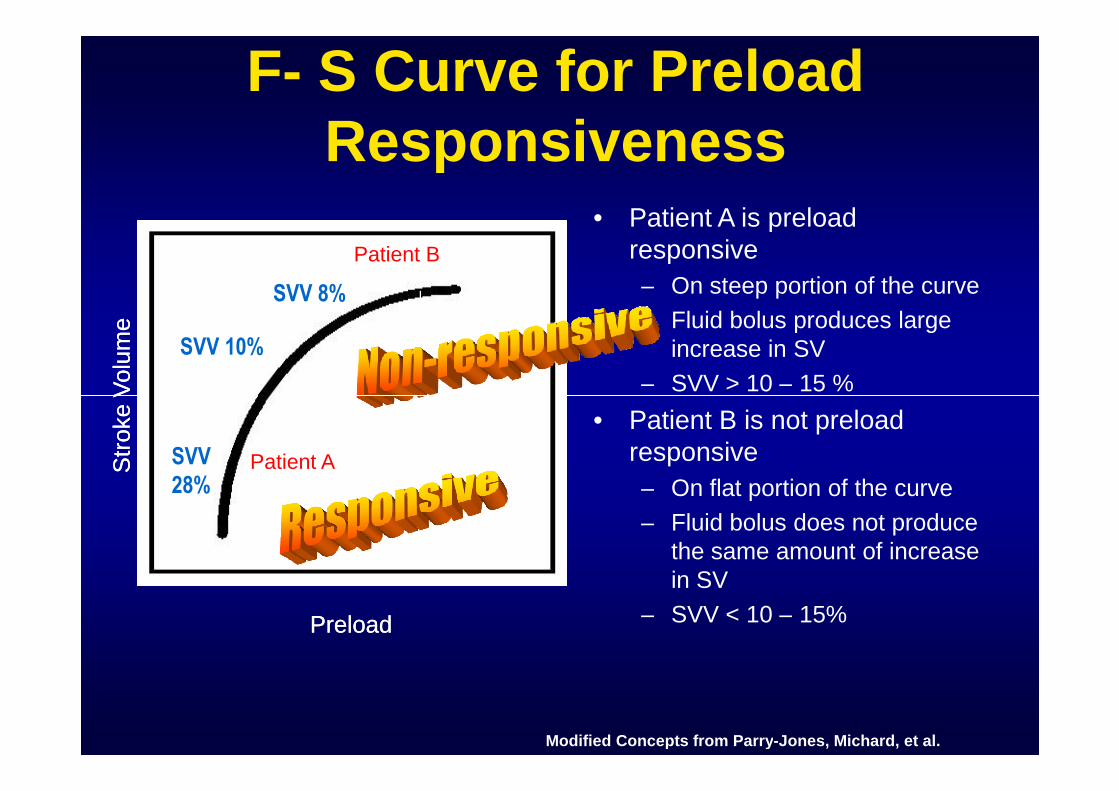
F- S Curve for PreloadResponsiveness
• Patient A is preloadresponsive
– On steep portion of the curve
– Fluid bolus produces largeincrease in SV
– SVV > 10 – 15 %
Patient B
Str
oke
Volu
me
Str
oke
Volu
me
PreloadPreload
SVV28%
Patient A
Patient B– SVV > 10 – 15 %
• Patient B is not preloadresponsive
– On flat portion of the curve
– Fluid bolus does not producethe same amount of increasein SV
– SVV < 10 – 15%
Modified Concepts from Parry-Jones, Michard, et al.
Patient A
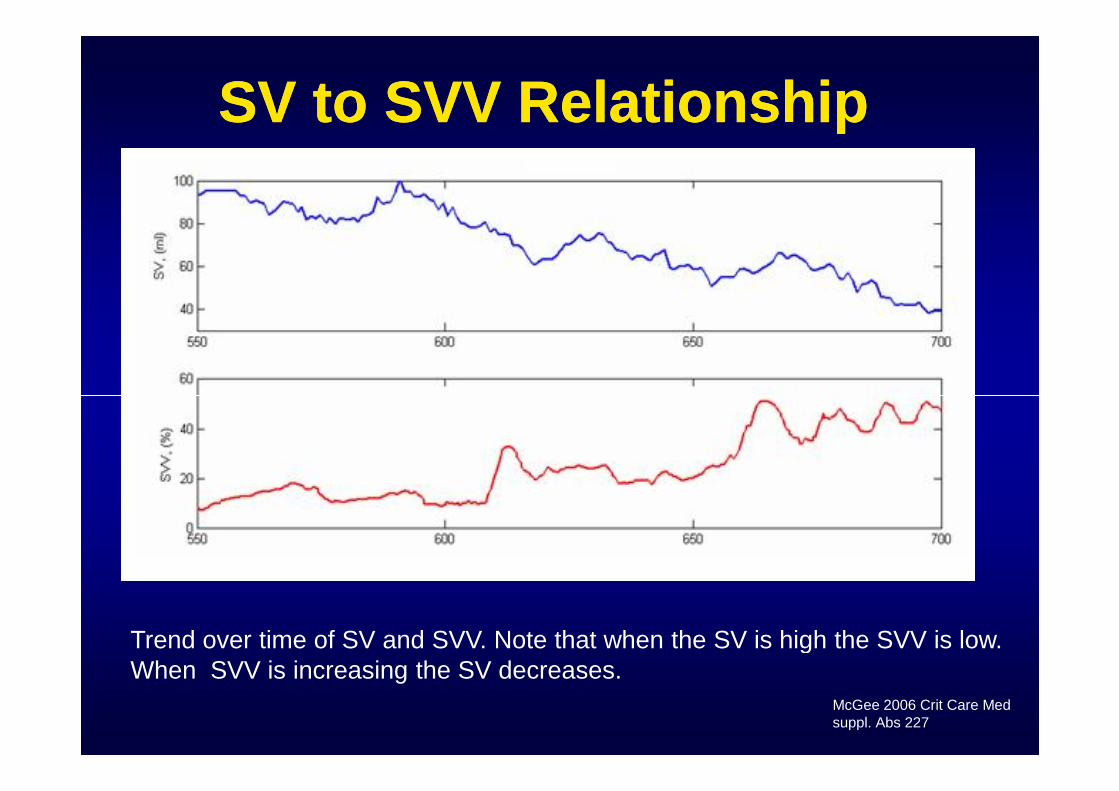
SV to SVV RelationshipSV to SVV Relationship
Trend over time of SV and SVV. Note that when the SV is high the SVV is low.When SVV is increasing the SV decreases.
McGee 2006 Crit Care Medsuppl. Abs 227
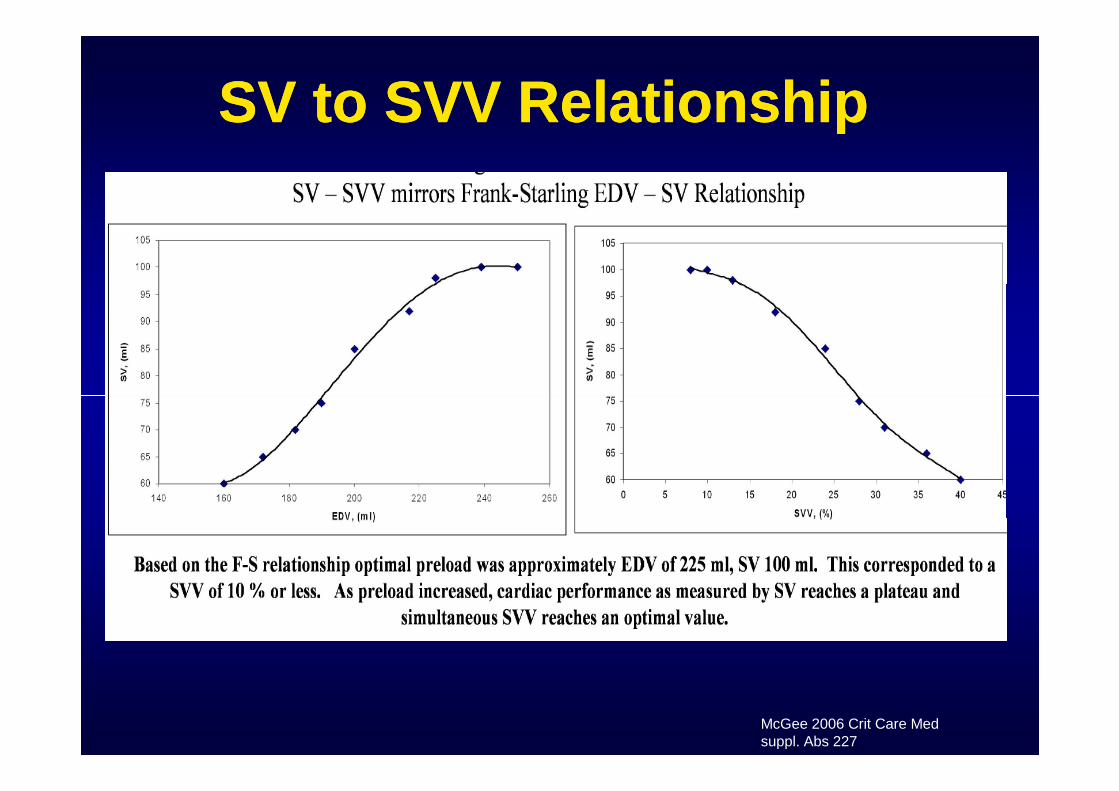
SV to SVV RelationshipSV to SVV Relationship
McGee 2006 Crit Care Medsuppl. Abs 227
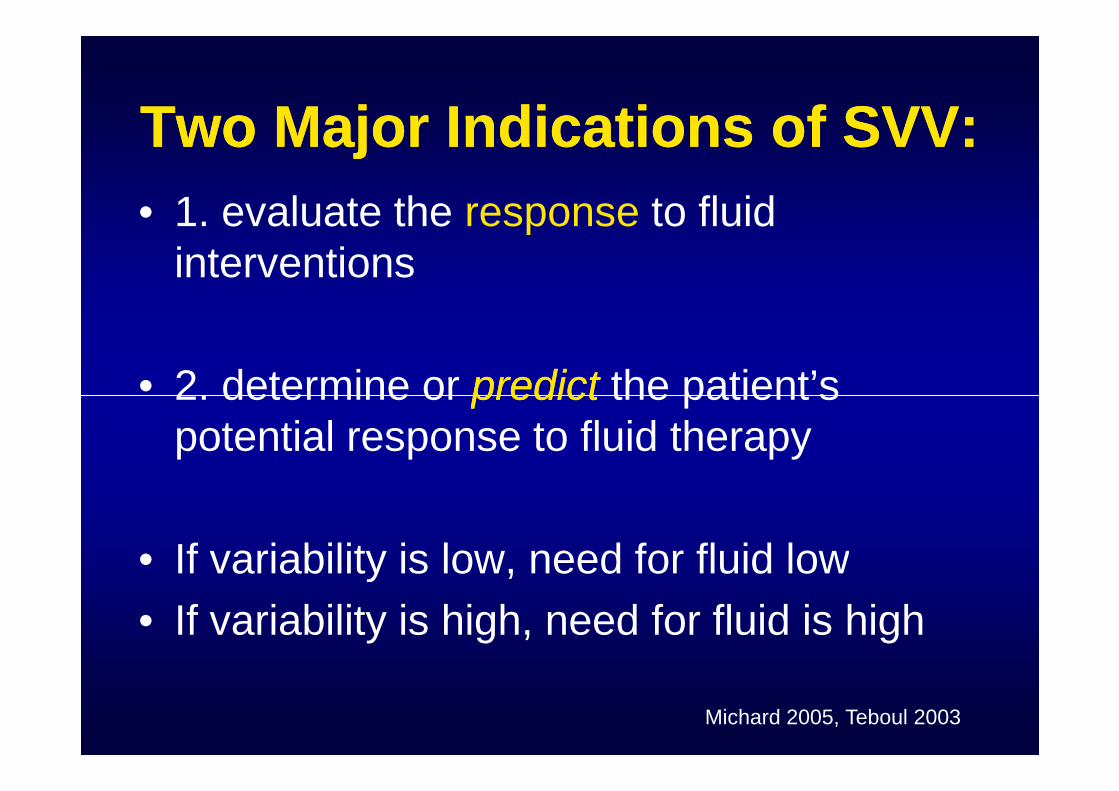
Two Major Indications of SVV:Two Major Indications of SVV:
• 1. evaluate the response to fluidinterventions
• 2. determine or predictpredict the patient’s• 2. determine or predictpredict the patient’spotential response to fluid therapy
• If variability is low, need for fluid low
• If variability is high, need for fluid is high
Michard 2005, Teboul 2003
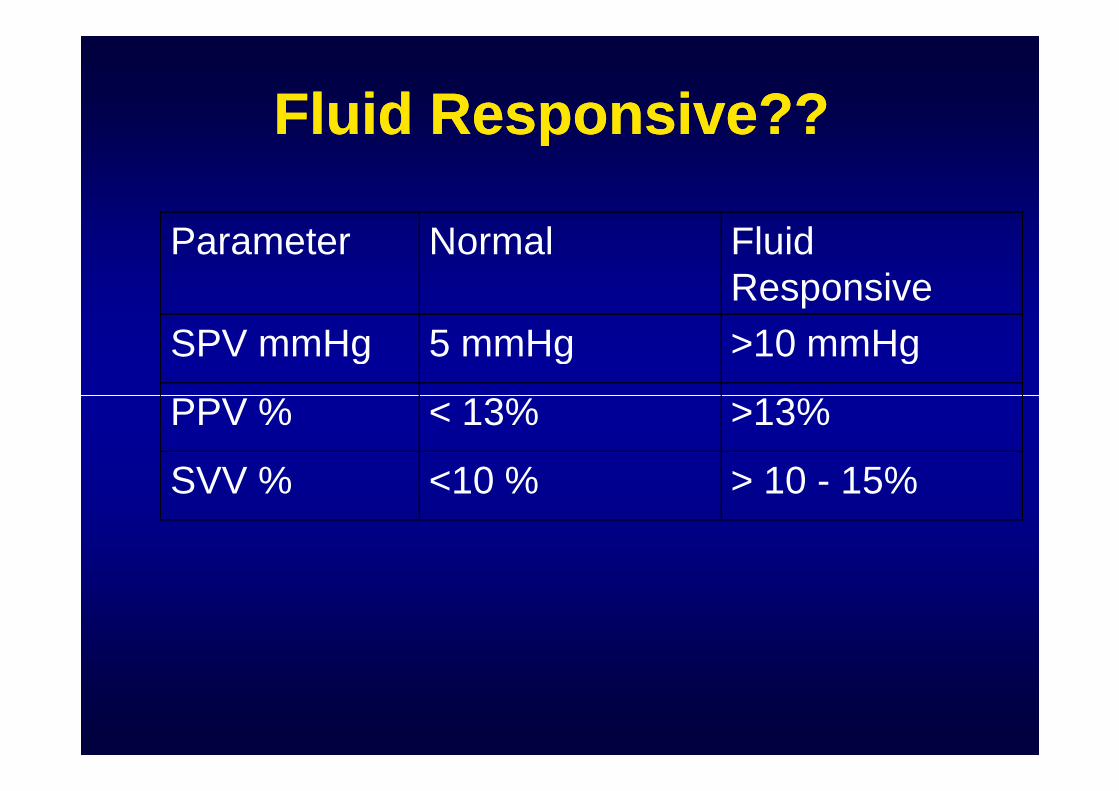
Fluid Responsive??Fluid Responsive??
Parameter Normal FluidResponsive
SPV mmHg 5 mmHg >10 mmHg
PPV % < 13% >13%PPV % < 13% >13%
SVV % <10 % > 10 - 15%
“The Clinical Value”“The Clinical Value”
• The value of dynamic parameters is theability to “predict fluid responsivenessand obviating the need for unnecessaryand obviating the need for unnecessaryfluid loading… “
Michard Anesthesiology 2005
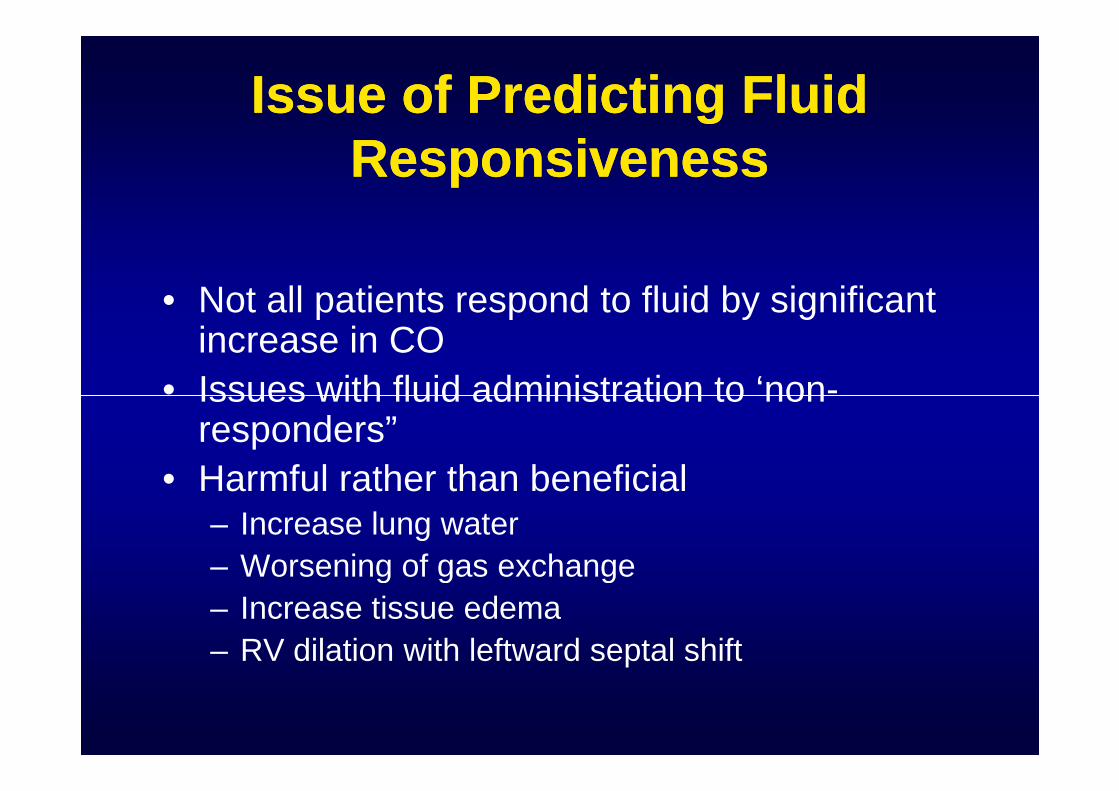
Issue of Predicting FluidIssue of Predicting FluidResponsivenessResponsiveness
• Not all patients respond to fluid by significantincrease in CO
• Issues with fluid administration to ‘non-• Issues with fluid administration to ‘non-responders”
• Harmful rather than beneficial– Increase lung water
– Worsening of gas exchange
– Increase tissue edema
– RV dilation with leftward septal shift
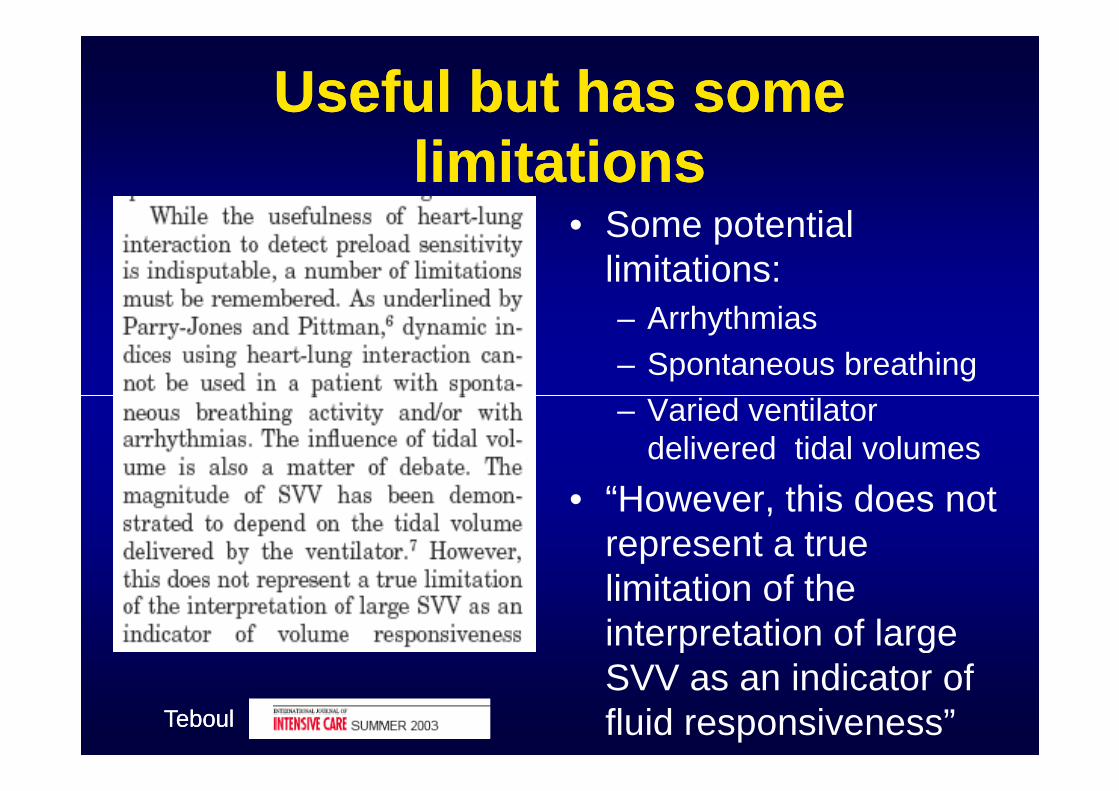
Useful but has someUseful but has somelimitationslimitations
• Some potentiallimitations:
– Arrhythmias
– Spontaneous breathing
– Varied ventilator– Varied ventilatordelivered tidal volumes
• “However, this does notrepresent a truelimitation of theinterpretation of largeSVV as an indicator offluid responsiveness”TeboulTeboul
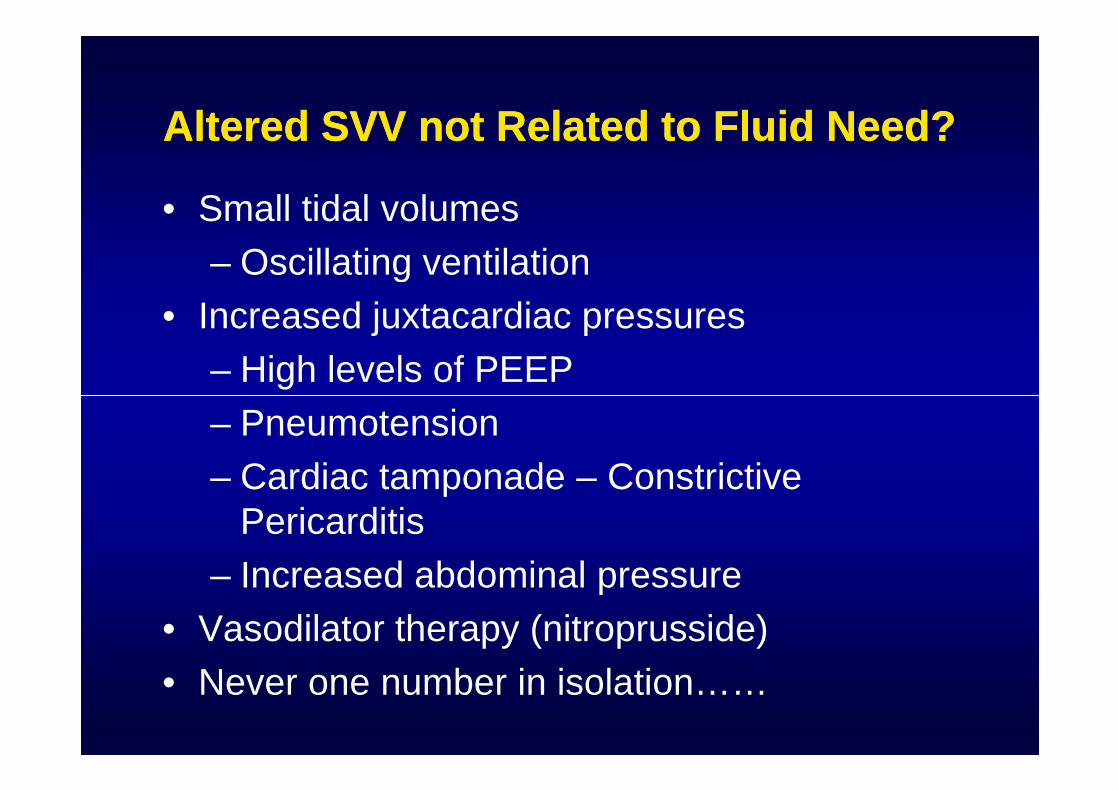
Altered SVVAltered SVV not Related to Fluid Need?not Related to Fluid Need?
• Small tidal volumes
– Oscillating ventilation
• Increased juxtacardiac pressures
– High levels of PEEP
– Pneumotension
– Cardiac tamponade – ConstrictivePericarditis
– Increased abdominal pressure
• Vasodilator therapy (nitroprusside)
• Never one number in isolation……
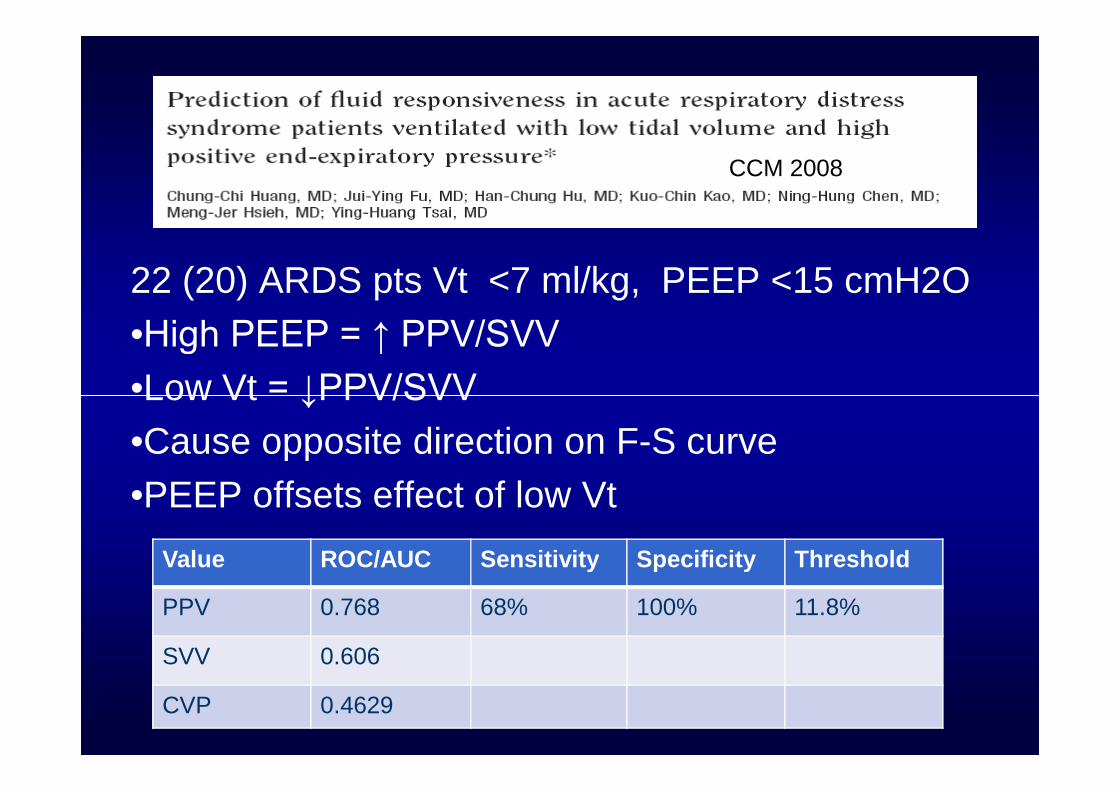
22 (20) ARDS pts Vt <7 ml/kg, PEEP <15 cmH2O
•High PEEP = ↑ PPV/SVV
•Low Vt = ↓PPV/SVV
CCM 2008
Value ROC/AUC Sensitivity Specificity Threshold
PPV 0.768 68% 100% 11.8%
SVV 0.606
CVP 0.4629
•Low Vt = ↓PPV/SVV
•Cause opposite direction on F-S curve
•PEEP offsets effect of low Vt
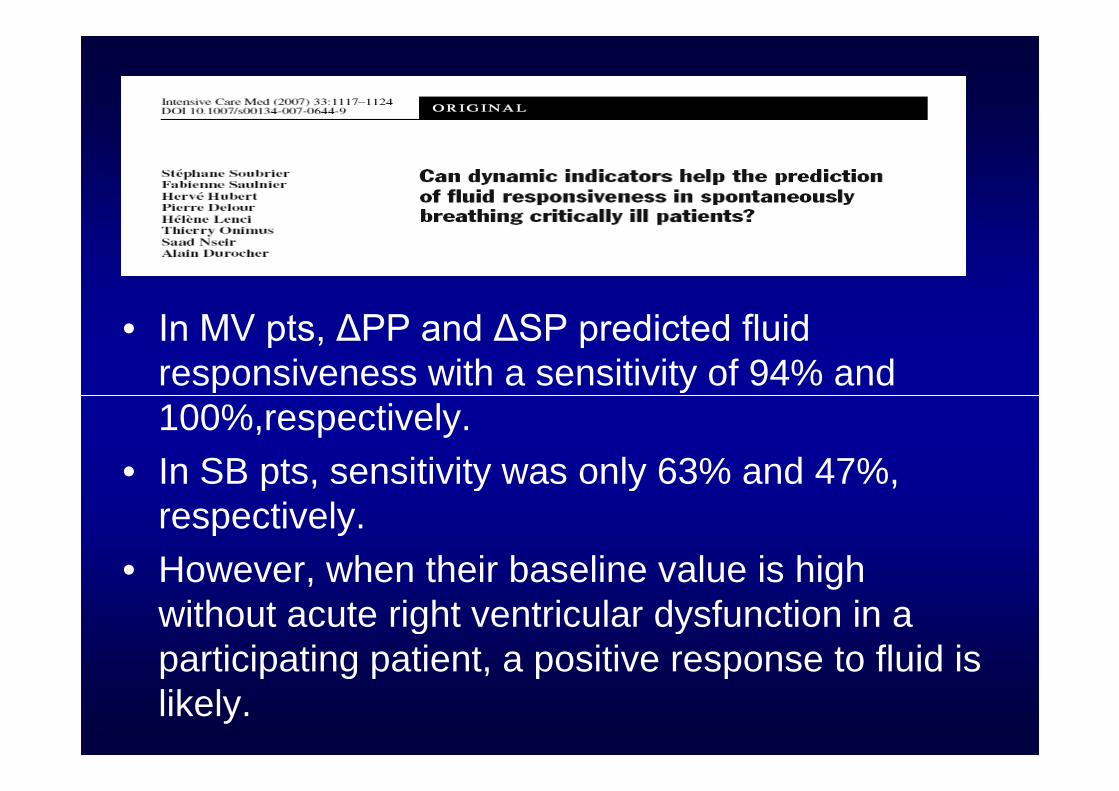
• In MV pts, ΔPP and ΔSP predicted fluid responsiveness with a sensitivity of 94% and100%,respectively.
• In SB pts, sensitivity was only 63% and 47%,respectively.
• However, when their baseline value is highwithout acute right ventricular dysfunction in aparticipating patient, a positive response to fluid islikely.
Chest 2002;121;1245-1252
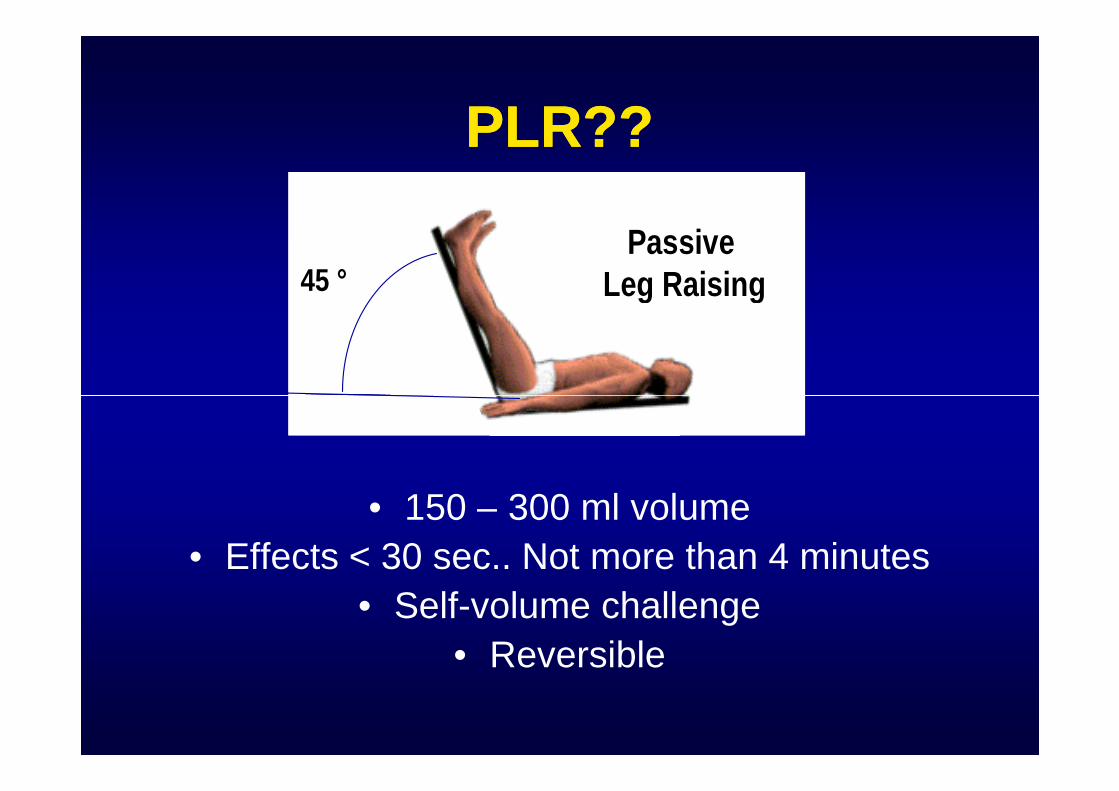
PLR??PLR??
PassiveLeg Raising45 °
PassiveLeg Raising45 °
• 150 – 300 ml volume
• Effects < 30 sec.. Not more than 4 minutes
• Self-volume challenge
• Reversible
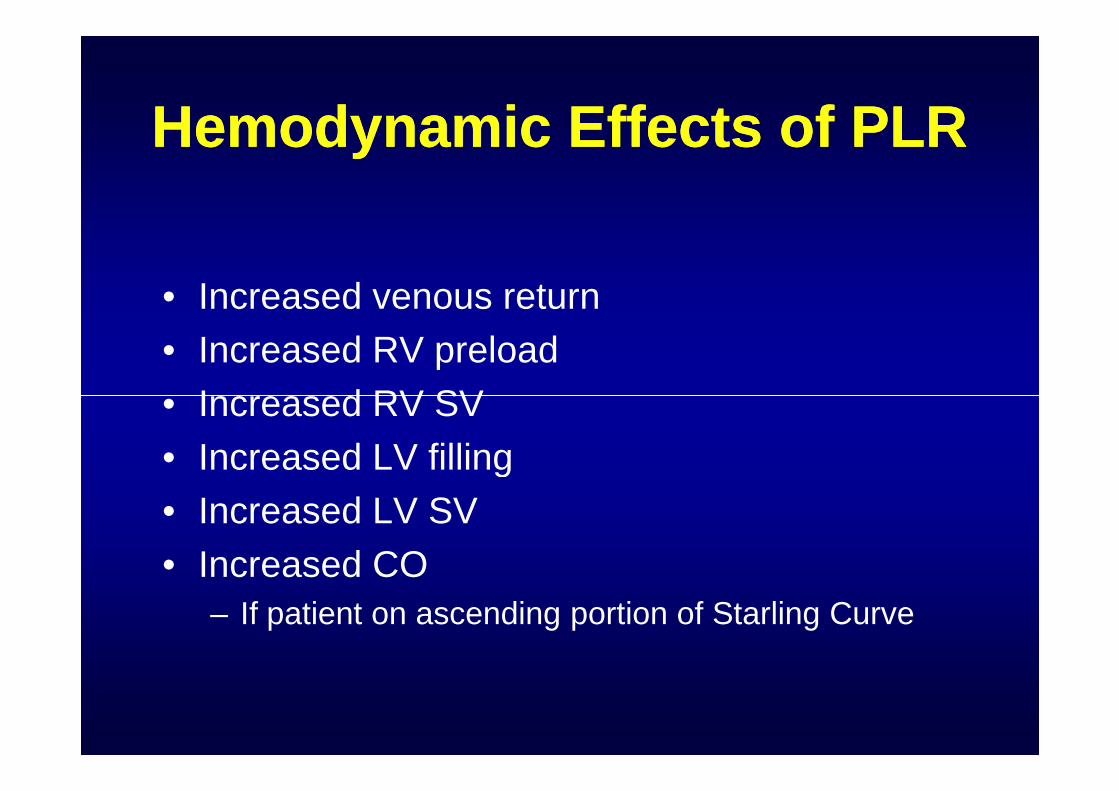
Hemodynamic Effects of PLRHemodynamic Effects of PLR
• Increased venous return
• Increased RV preload
• Increased RV SV• Increased RV SV
• Increased LV filling
• Increased LV SV
• Increased CO
– If patient on ascending portion of Starling Curve
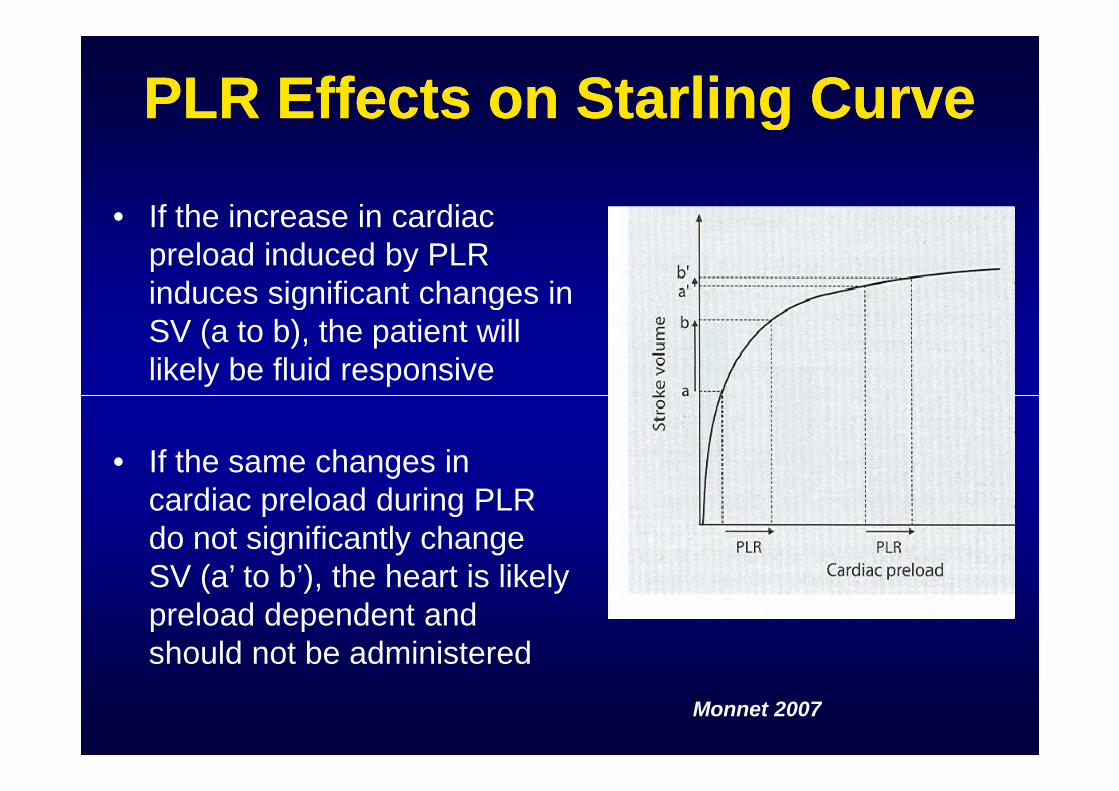
PLR Effects on Starling CurvePLR Effects on Starling Curve
• If the increase in cardiacpreload induced by PLRinduces significant changes inSV (a to b), the patient willlikely be fluid responsive
• If the same changes incardiac preload during PLRdo not significantly changeSV (a’ to b’), the heart is likelypreload dependent andshould not be administered
Monnet 2007
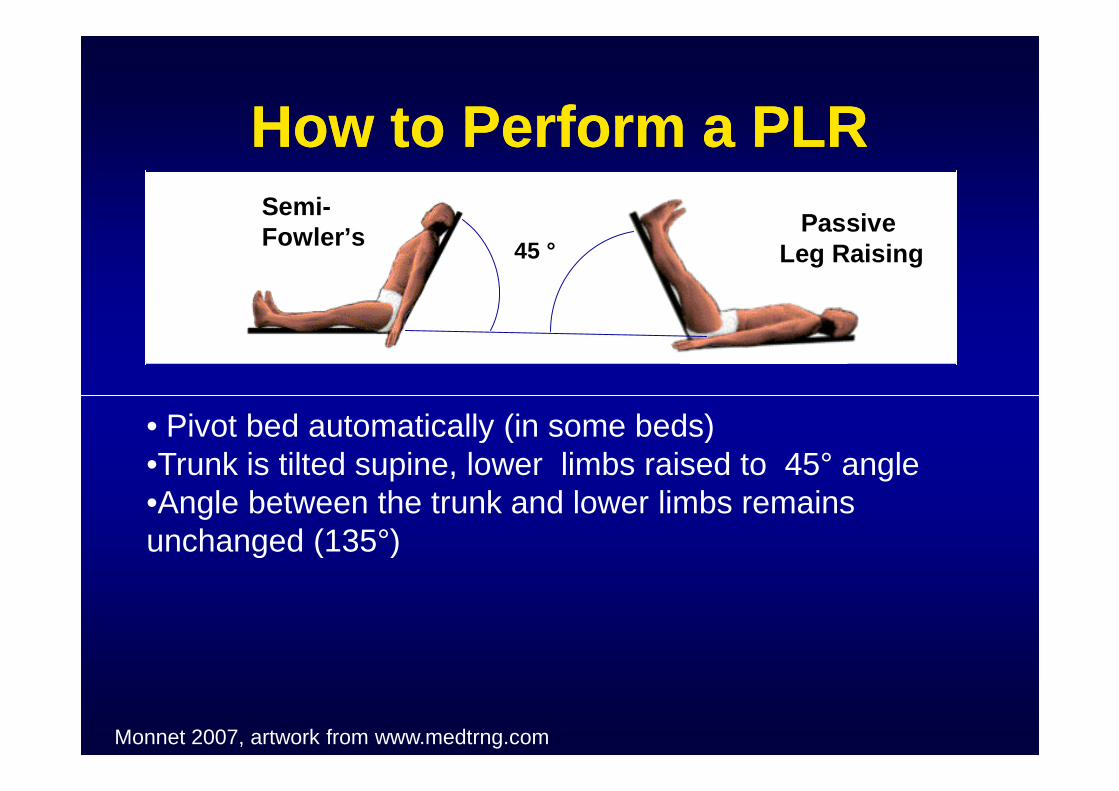
How to Perform a PLRHow to Perform a PLR
PassiveLeg Raising45 °
Semi-Fowler’s
PassiveLeg Raising45 °
Semi-Fowler’s
• Pivot bed automatically (in some beds)•Trunk is tilted supine, lower limbs raised to 45° angle•Angle between the trunk and lower limbs remainsunchanged (135°)
Monnet 2007, artwork from www.medtrng.com
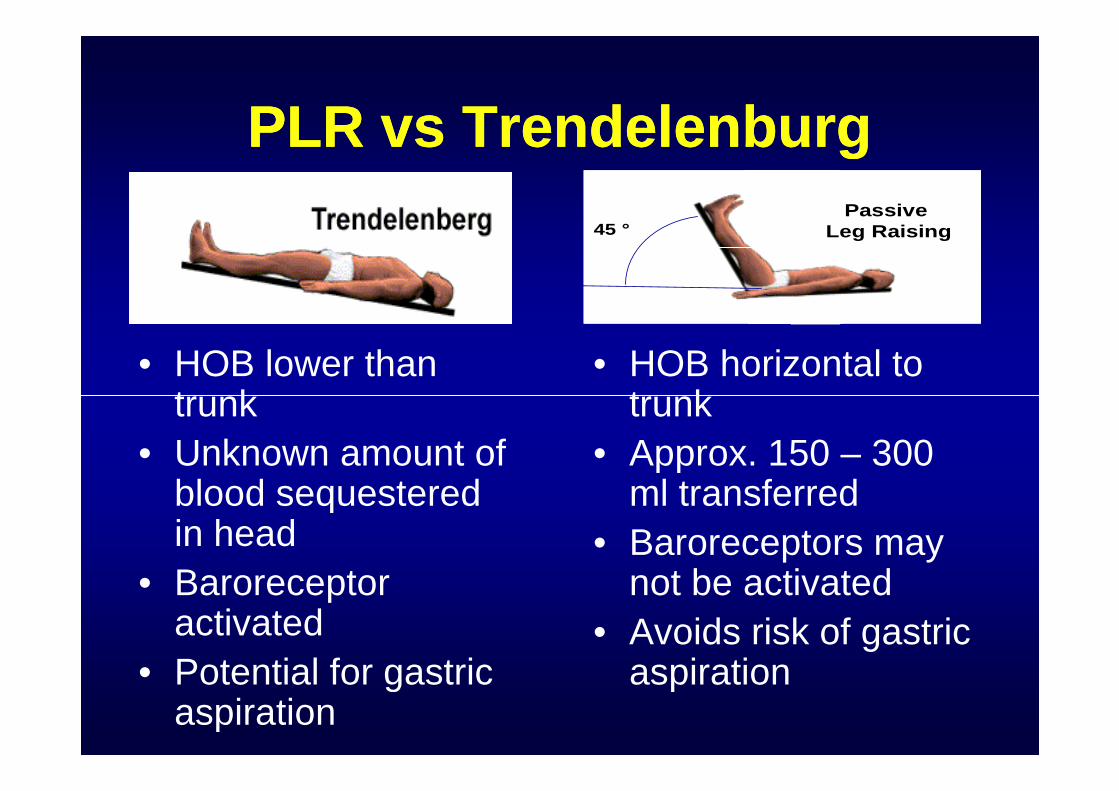
PLR vs TrendelenburgPLR vs Trendelenburg
• HOB lower thantrunk
• HOB horizontal totrunk
PassiveLeg Raising45 °
PassiveLeg Raising45 °
trunk
• Unknown amount ofblood sequesteredin head
• Baroreceptoractivated
• Potential for gastricaspiration
trunk
• Approx. 150 – 300ml transferred
• Baroreceptors maynot be activated
• Avoids risk of gastricaspiration
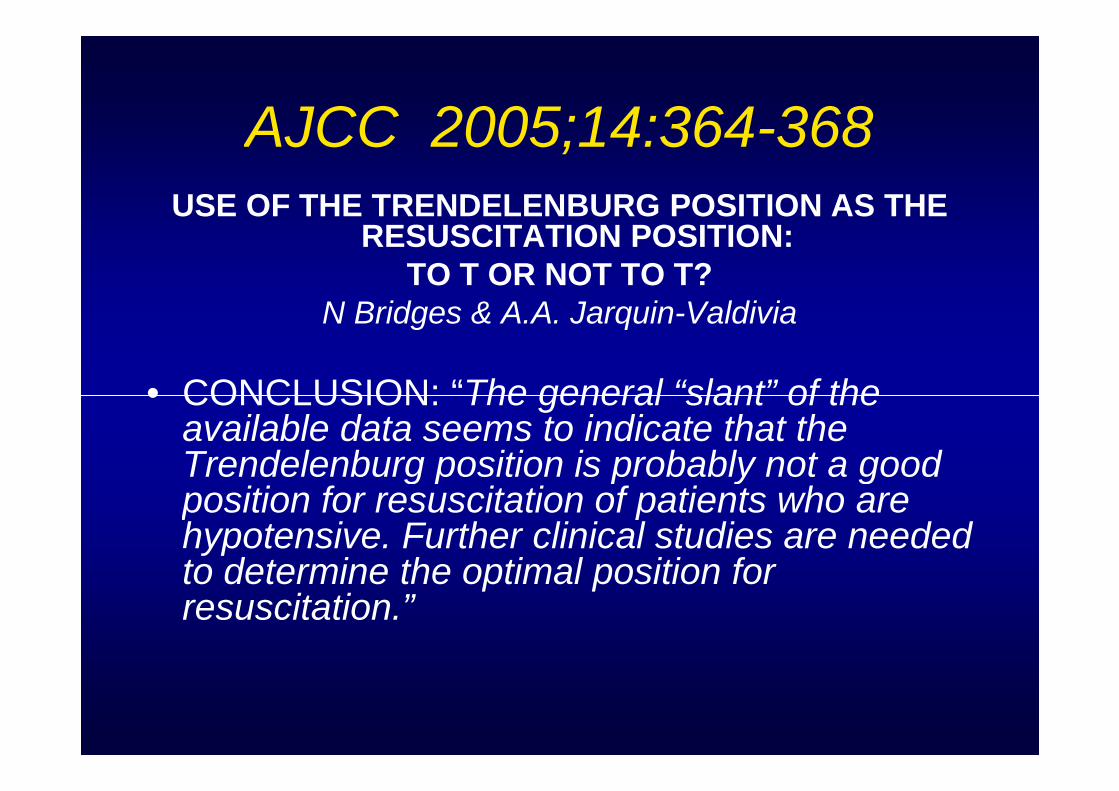
AJCC 2005;14:364-368USE OF THE TRENDELENBURG POSITION AS THE
RESUSCITATION POSITION:TO T OR NOT TO T?
N Bridges & A.A. Jarquin-Valdivia
• CONCLUSION: “The general “slant” of the• CONCLUSION: “The general “slant” of theavailable data seems to indicate that theTrendelenburg position is probably not a goodposition for resuscitation of patients who arehypotensive. Further clinical studies are neededto determine the optimal position forresuscitation.”
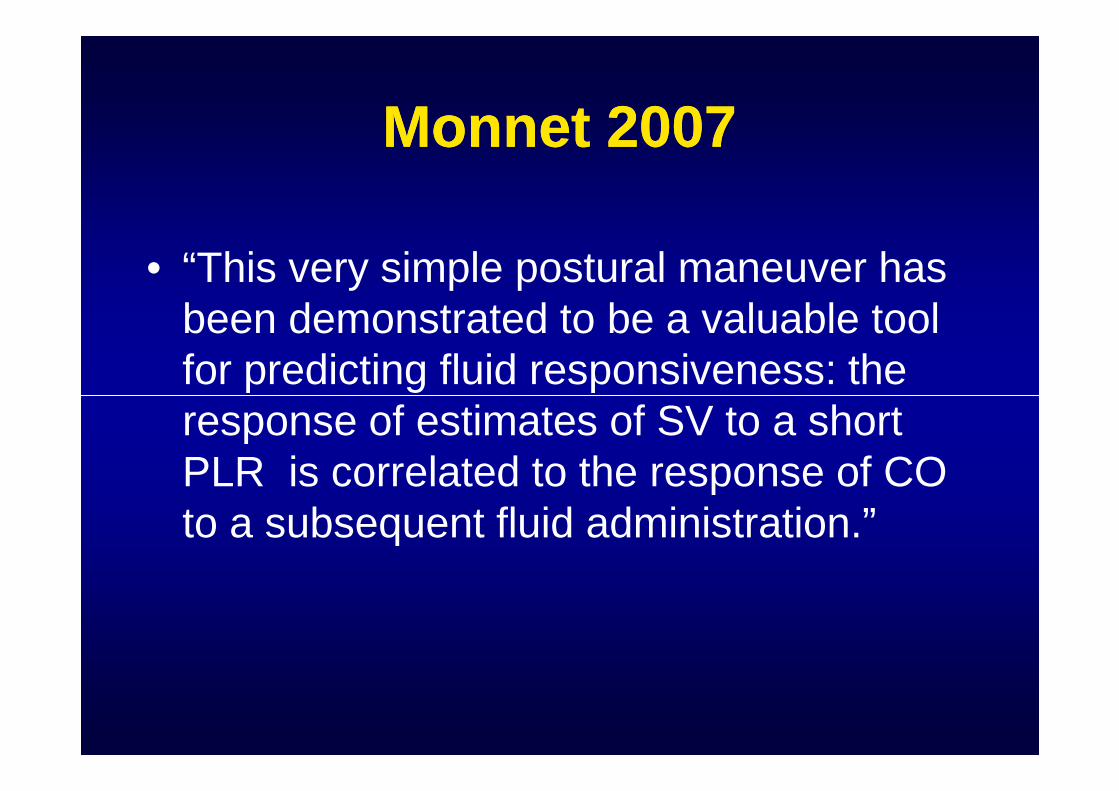
Monnet 2007Monnet 2007
• “This very simple postural maneuver hasbeen demonstrated to be a valuable toolfor predicting fluid responsiveness: theresponse of estimates of SV to a shortPLR is correlated to the response of COto a subsequent fluid administration.”
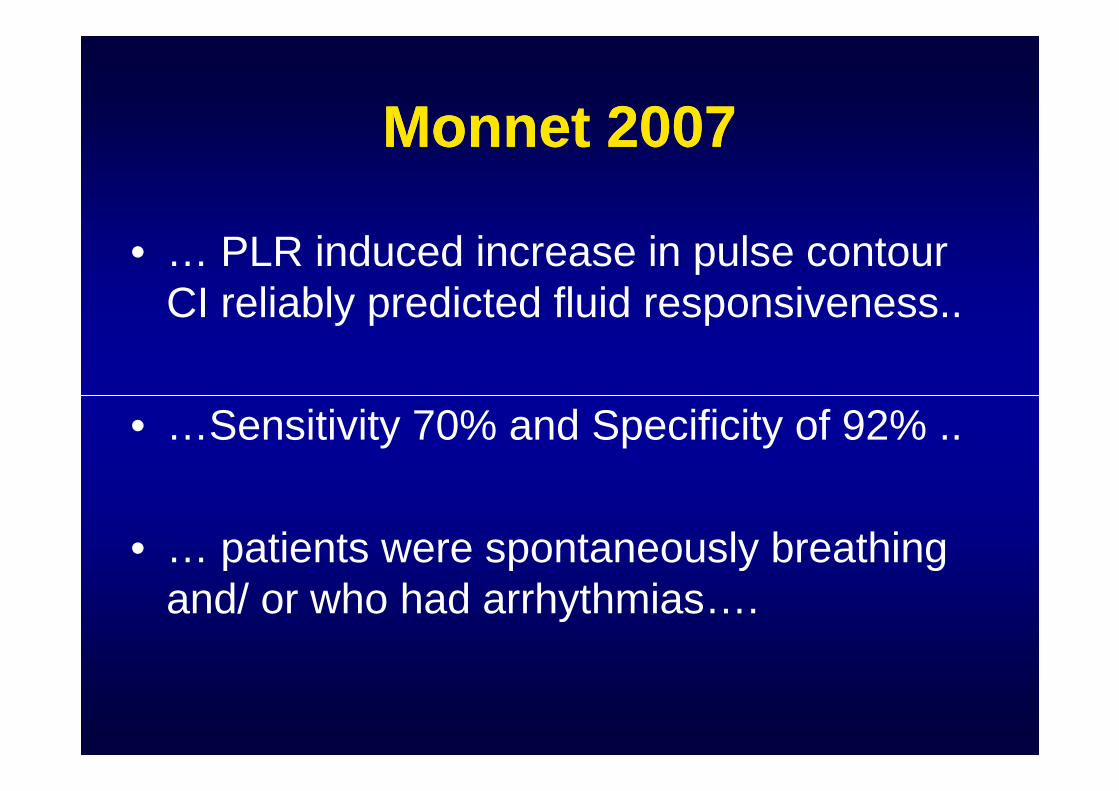
Monnet 2007Monnet 2007
• … PLR induced increase in pulse contourCI reliably predicted fluid responsiveness..
• …Sensitivity 70% and Specificity of 92% ..
• … patients were spontaneously breathingand/ or who had arrhythmias….
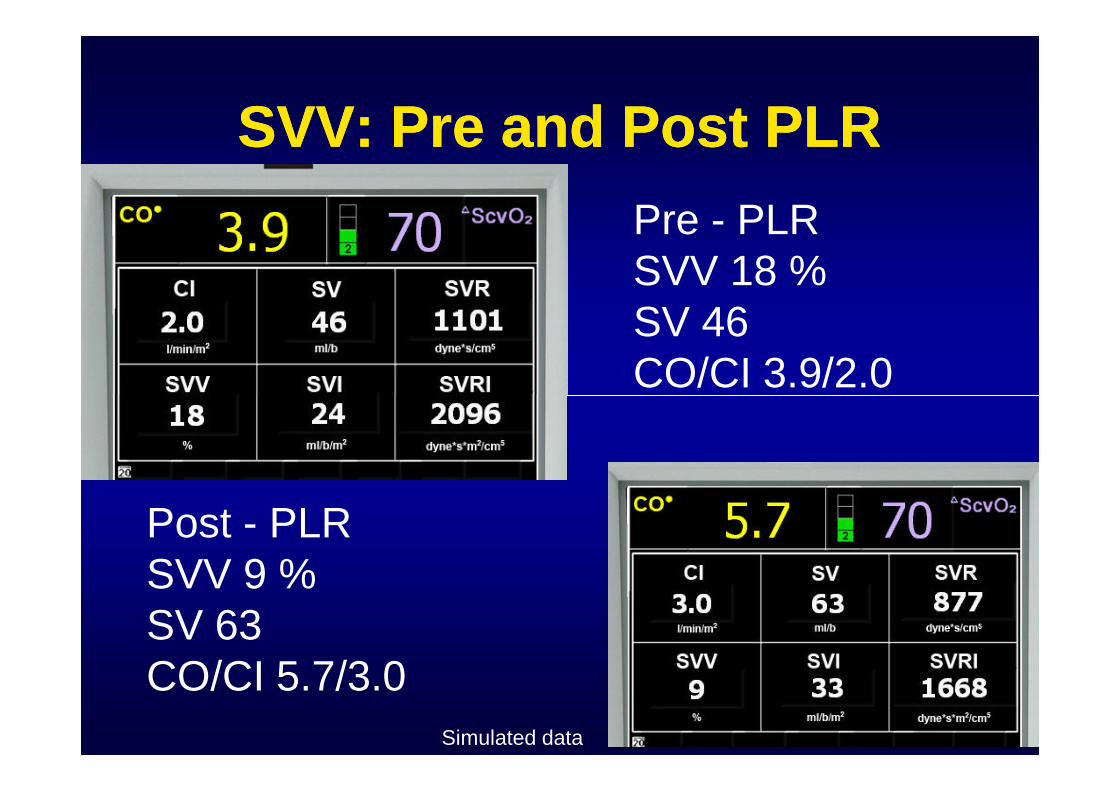
SVV: Pre and Post PLRSVV: Pre and Post PLR
Pre - PLRSVV 18 %SV 46CO/CI 3.9/2.0CO/CI 3.9/2.0
Post - PLRSVV 9 %SV 63CO/CI 5.7/3.0
Simulated data
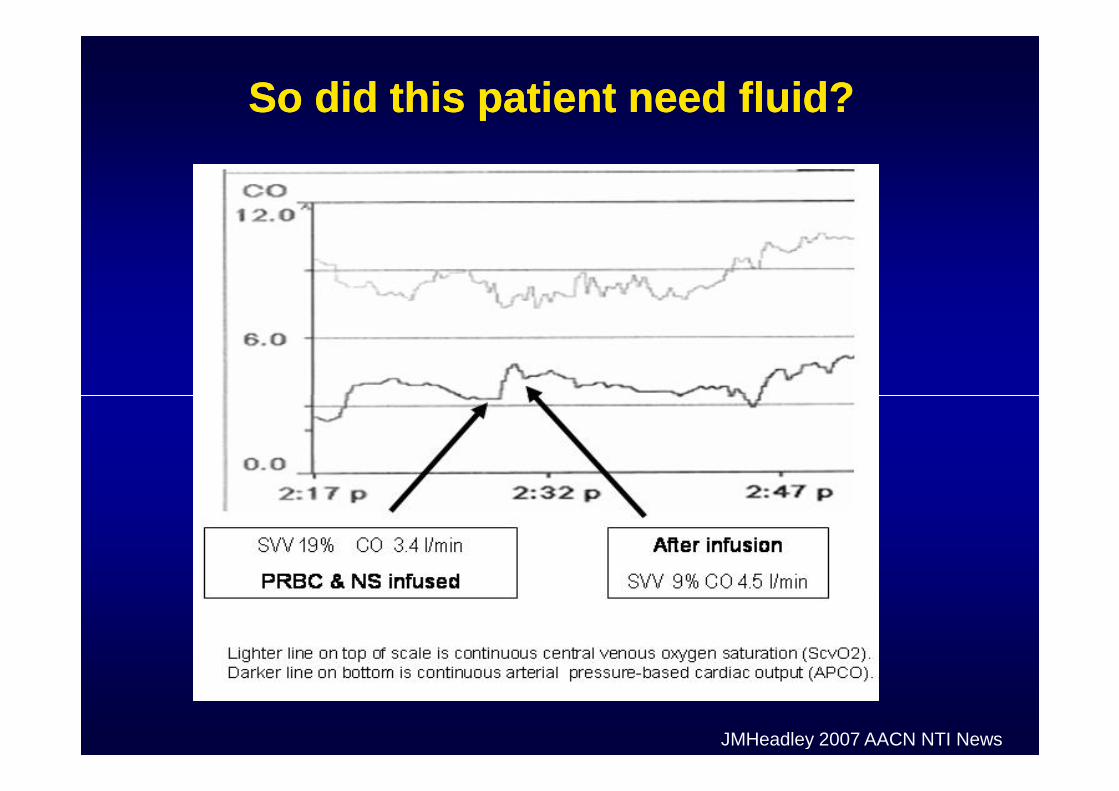
So did this patient need fluid?So did this patient need fluid?
JMHeadley 2007 AACN NTI News
Fluid First:Fluid First:Using PLR & SVV to OptimizeUsing PLR & SVV to Optimize
VolumeVolumeVolumeVolume
Contact:


![Toto the Best of Toto Full Band Score[1]](https://img.pdfslide.us/doc/110x75/54580b1fb1af9fbd038b46a4/toto-the-best-of-toto-full-band-score1.jpg)