Embed Size (px)
Citation preview
Fluid inclusions in the mesozonal gold deposit at Atud mine,Eastern Desert, Egypt
Hassan Z. Harraz
Department of Geology, Faculty of Science, Tanta University, Tanta, Egypt
Accepted 24 October 2002
Abstract
Gold mineralization at the Atud mine occurs as fracture-filling auriferous quartz veins hosted in Neoproterozoic dioritic rocks
and along their contact with metagabbro. Gold mineralization is associated with metasomatic alteration zones around shear zones
and quartz–carbonate vein arrays. The mineralized veins consist of quartz, carbonate and albite gangue enclosing minor amounts of
pyrrhotite, arsenopyrite, pyrite and sphalerite. Trace amounts of galena, chalcopyrite, magnetite and rutile are also present. Para-
genetically, the mineralization is divided, with decreasing temperature, into three stages, namely: (1) Early (Au-poor, pyrrhotite–
arsenopyrite–pyrite–quartz vein); (2) Main (Au-rich, sphalerite–arsenopyrite–pyrite–galena� chalcopyrite–quartz vein); and (3)Late (quartz–carbonate–pyrite� galena).Gold (15.6–36.2 at.% Ag) is present mainly as discrete grains of native gold (<5–20 lm in diameter). Free gold appears mainly as
inclusions in quartz and as microscopic inclusions (<5 lm) in arsenopyrite and pyrite. Gold also occurs in fractures and grainboundaries of pyrite, arsenopyrite and base metal sulphides. These occurrences of gold indicate that several influxes of gold and/or
stages of remobilization took place.
Based on temperatures inferred from arsenopyrite compositions by electron microprobe, the estimated temperatures for Early
and Main mineralized stages reach 340–430, and 273–368 �C, respectively. The sulphur activity (atm) of ore formation at the Atuddeposit was estimated for each stage as 10�6:5–10�9:6, and 10�8–10�12:2, respectively.
Fluid inclusions in quartz intimately associated with the mineralization are dominated by aqueous H2O–CO2þNaCl types. Inmost cases, these fluid inclusions co-exist in individual samples and show various CO2 phase volume proportions at 40 �C. Co-existing H2O-rich liquid and CO2-rich vapour fluid inclusions homogenized into liquid and carbonic vapour phases, respectively,
over the same temperature range (270–490 �C). The petrographic observations and microthermometric data suggest that fluid in-clusions in quartz intimately associated with the early and main mineralizing events were trapped during phase separation of an
originally homogenous H2O–CO2 liquid, with low salinity (2.8–8.2 wt.% NaCl equiv.) and high density of 0.8–0.9 g/cc (corre-
sponding to 15–76 mol% CO2). These data are consistent with transportion of gold as a bisulphide complex. Gold deposition
occurred over a temperature range of 270–430 �C and pressures of 160–272 MPa (�6–11 km depths), likely due to decreases insulphur activity (10�6:5–10�12:2) accompanying fluid unmixing. Gold deposition in the Atud diorites was related to fluid phase
separation, sulphidization and carbonatization of host dioritic rocks during hydrothermal alteration and mineralization. The di-
orites are considered to have acted as preferential sites for fluid flow and ore precipitation due to their brittle nature during regional
deformation.
� 2002 Elsevier Science Ltd. All rights reserved.
Keywords: Fluid inclusions; Microthermometry; Mineralogy of quartz veins; Atud deposit; Gold-Egypt
1. Introduction
In the Arabo–Nubian Shield, gold mineralization is
widely associated with post-tectonic granitoid rocks (El-
Gaby et al., 1988; Pohl, 1988). The majority of these
deposits occur as Au-bearing quartz veins with a poly-
metallic sulphide assemblage, exhibiting pinch-swell veintextures and showing evidence of multiple stages of
mineralization (Hilmy and Osman, 1989; Hussein, 1990;
Harraz and El-Dahhar, 1993). P–T conditions at or
below greenschist metamorphic boundary favoured es-
tablishment of brittle–ductile and brittle structures in
which gold deposits were selectively sited (El-Gaby
et al., 1988). The source of the ore-bearing fluids is
Journal of African Earth Sciences 35 (2002) 347–363
www.elsevier.com/locate/jafrearsci
E-mail address: [email protected] (H.Z. Harraz).
0899-5362/02/$ - see front matter � 2002 Elsevier Science Ltd. All rights reserved.
PII: S0899-5362 (02 )00152-5
related to Late Precambrian subduction and associatedcalc-alkaline magmatism (El-Gaby et al., 1988). The
mineralized solution was induced either by metamor-
phism or cooling magmas (Pohl, 1988). Leaching and
remobilization from a hidden source are advocated by
Hilmy and Osman (1989); Takla et al. (1990); Harraz
and El-Dahhar (1993).
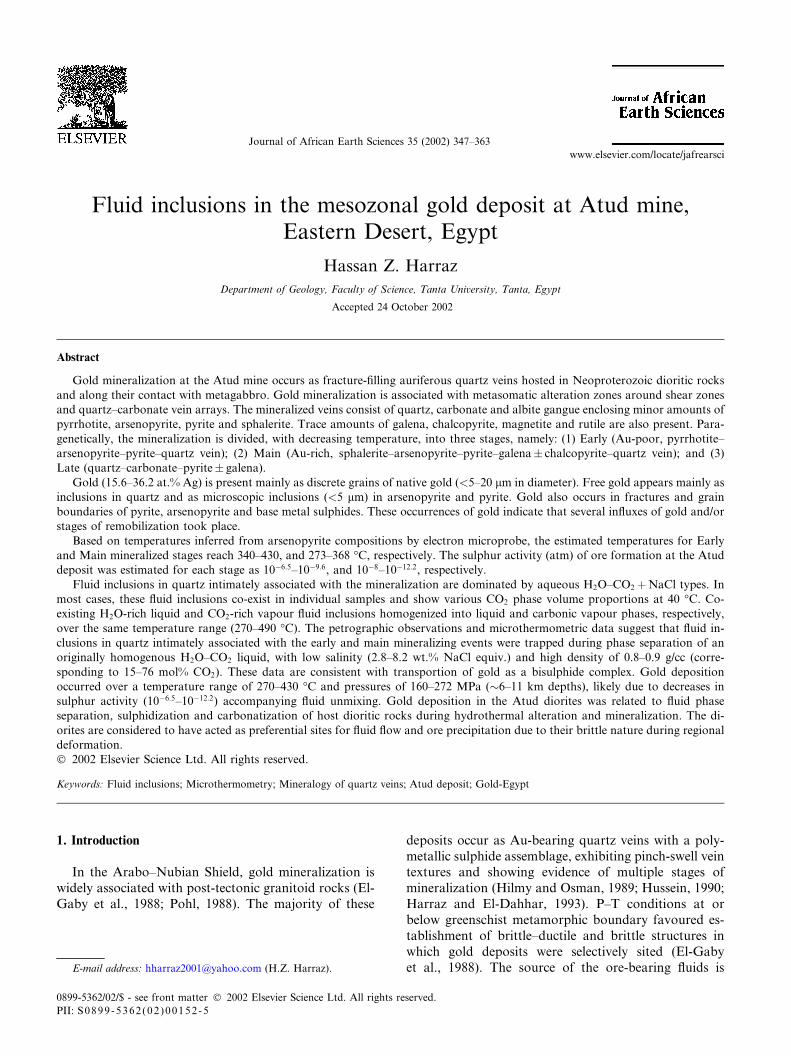
Atud area is located in the central Eastern Desert of
Egypt at the intersection of latitude 25�0001000N andlongitude 34�2401000E, �58 km west of Mersa Alam onthe Red Sea coast and �5 km south of the Idfu–MersaAlam paved road (Fig. 1). The Atud gold mine is con-
sidered to be a mesothermal vein type gold deposit
which occurs in quartz veins hosted mainly in Neopro-
terozoic dioritic rocks at Gabal Atud (Pohl, 1988). The
deposit is spatially and genetically associated with a
metagabbro–diorite complex emplaced at shallow levelsin serpentinite and metasedimentary rocks (Gabra,
1986; Harraz, 1999). This mine was first excavated
during Pharaonic times but no ore has been produced
since then. Between 1953 and 1969, Egyptian Geologic
Survey and Mining Authorities (EGSMA) performed
underground prospecting work in the Main Atud site
through three expeditions (Fig. 1). Drifting was carried
out on three levels along strike of the main lode (NNW–SSE) for a total length of 690 m. These levels were
connected by inclined shafts down the dip of the lode for
a total length of 230 m (Fig. 2). Other small shafts and
some pits were made at East Atud-I and East Atud-II
(Fig. 1). The depth of the excavations varied between
<20 and 78 m, and the Au content ranged from <0.1 to31 g/t. The principal lode contains 1900 t of gold ore
grading 16.28 g/t gold. In addition, 1600 t of dump with
12.4 g/t gold are stock-piled in the area (Hussein, 1990,
p. 547).
The present work addresses the geothermometry,
mineralogy and paragenetic relations of the Au-bearingquartz veins at the Atud mine, and discusses the com-
position, nature and origin of mineralizing fluids.
Fig. 1. Detailed geological map of the Atud gold mine district (after
Harraz, 1999).
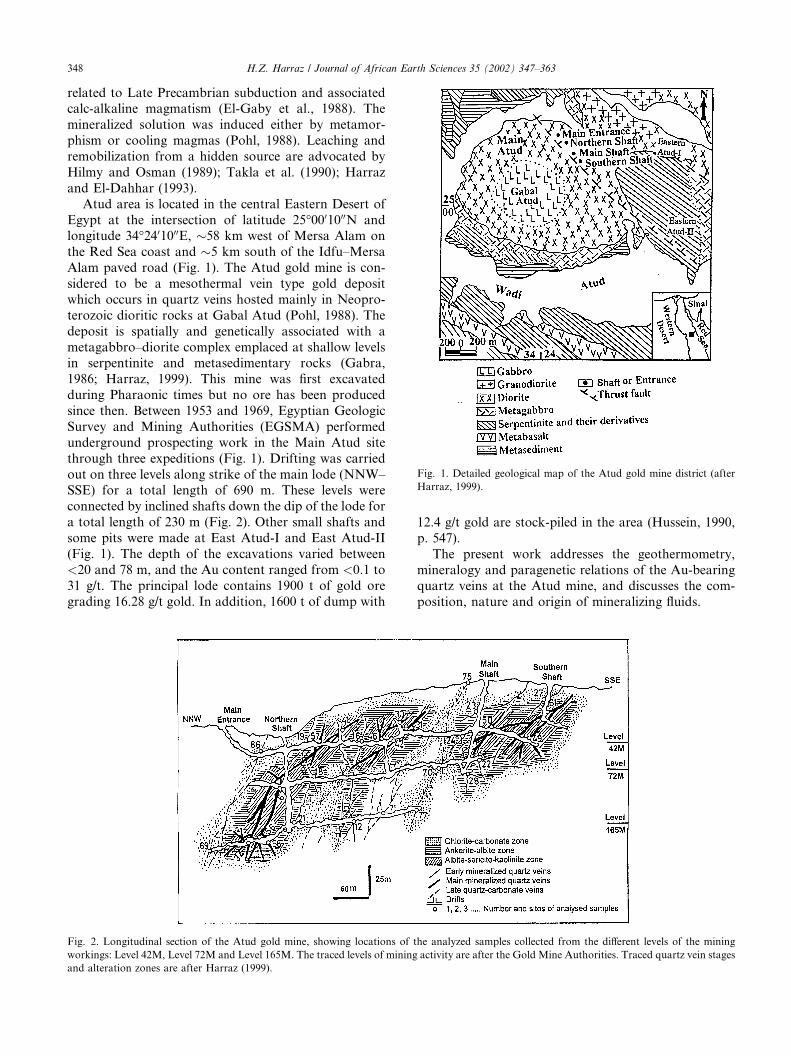
Fig. 2. Longitudinal section of the Atud gold mine, showing locations of the analyzed samples collected from the different levels of the mining
workings: Level 42M, Level 72M and Level 165M. The traced levels of mining activity are after the Gold Mine Authorities. Traced quartz vein stages
and alteration zones are after Harraz (1999).
348 H.Z. Harraz / Journal of African Earth Sciences 35 (2002) 347–363
2. Geologic setting
The Atud gold mine area covers �18 km2 and isgeologically dominated by a metagabbro–diorite com-
plex with relics of serpentinite–talc-carbonate, meta-
sediment and metavolcanic rocks (Fig. 1). The
metagabbro–diorite complex occupies the main part of
the Gabal Atud in the center of the mapped area. This
complex was emplaced into metasediments and serpen-tinites and later intruded by gabbroic rocks. In the
northeastern part, the dioritic rocks may grade into
granodiorite with transitional phases. The metasedi-
ments occupy a small area on the southern slope of
Gabal Atud and are usually mixed with serpentinite–
talc-carbonate. Akaad and Essawy (1964) noted that the
metagabbro–diorite complex shouldered the metasedi-
ments and serpentinites by a thrust plane dippingmoderately to the north and the west along the north-
eastern boundary of the Gabal Atud. The thrust con-
tains abundant planes of highly sheared talc-carbonates
(Fig. 1).
Joints are conspicuous at the Atud gold mine area
and trend in four directions: NNW–SSE, NW–SE, NE–
SW and NNE–SSW. The cross cutting relationship of
the joint systems show that the older joint system istrending N2–32�W and dipping 25�NE–44�SW while theyounger is trending N10–52�E and steeply dipping 37–47�NW. The NNW–SSE fracture systems extend be-yond the margins of Gabal Atud. Therefore, it is not
directly related to volume shrinkage due to crystalliza-
tion of gabbroic magma as suggested by Phillips (1972),
but must be related to re-activation of older regional
thrust structures that affected the whole of the EasternDesert during Red Sea opening (Sabet and Bondonosov,
1984; El-Gaby et al., 1988; Meshref, 1990). However,
the dominant NNW–SSE strike-slip zones are oriented
subparallel to the dominant strike-slip fault along the
Idfu–Mersa Alam Road (El-Gaby et al., 1988) as well as
to the Najd fault system. The younger NE and NNE
joint trends are tension fractures associated with com-
pressive stress during the intrusion of the youngergabbroic rocks.
3. Quartz veins
3.1. Geology and distribution
The area of mineralization is �9 km2, localized at theeastern and southeastern slopes of Gabal Atud. The
area includes many mineralized and unmineralized
quartz veins. The mineralized quartz veins cut mainly
across the dioritic rocks and may extend to the meta-gabbro (Fig. 1). The main quartz vein lode in the eastern
slopes of Gabal Atud (Main Atud) is conformable to the
NNW fracture systems, while the main quartz vein lodes
in the southeast (Atud East-I and Atud East-II) areconfined to NE fractures. The Main Atud is the largest
set that comprises four significant veins; namely: Main,
Eastern, Western and Southern veins; occurring within a
shear zone extending NNW and extending for �305 macross the dioritic rocks (Fig. 1). Other quartz veins
extend throughout different underground levels (Fig. 2),
invading a shear zone filled by pockets of quartz, car-
bonate and chlorite. At the first level (Level 42M), themain quartz vein is comprised mainly of bluish or
greyish quartz frequently associated with variable
amounts of milky quartz. At the second and third levels
(Level 72M and Level 165M, respectively), the main
quartz veins are predominantly milky quartz showing
relatively smaller amounts of bluish or greyish quartz.
The main sauriferous quartz veins are commonly frac-
tured and consist of brecciated bluish-grey to grey orgreyish- to bluish-white quartz, that crystallized in an
earlier and main stage, respectively. Late stage milky
quartz veins also occur. These varieties of quartz crys-
tallized successively with probable overlapping depo-
sition (Nakhla et al., 1993; Arslan and Harraz, 2001).
Mineralization in the Atud gold mine is disseminated
in nature and is localized in. and relateo to, hydrother-
mal veins that occupy pre-existing fractures (open-spacefilling). Fractures are filled with quartz with or without
carbonate, chlorite, albite, sericite, kaolinite, and sul-
phide minerals. Gold mineralization in association with
metasomatic alteration zones is observed at vein mar-
gins around shear zones and in quartz–carbonate vein
arrays (Harraz, 1999). Intense wall rock alterations are
also observed at the margins of mineralized quartz
tension gashes (Awad and Fasfous, 1981; Harraz, 1999).Contacts between veins and wall rocks are commonly
sharp and occasionally outlined by carbonate, chlorite
and iron oxide mineral selvages. Alteration zones asso-
ciated with structurally controlled veins in dioritic rock
were classified by Harraz (1999) according to their
diagnostic mineral assemblages into: Zone 1: chlorite–
carbonate; Zone 2: ankerite–albite; and Zone 3: albite–
sericite–kaolinite (Fig. 2). Zones 2 and 3 coinciderespectively with the Au-bearing quartz veins of both
early- and main-quartz vein generations, and are
sometimes surrounded and/or gradually merging into
zone 1. The latter coincides with late carbonate–quartz
veins (Fig. 2). However, the intensity of wall rock al-
teration is variable throughout the mine.
The main quartz vein lode is trending NNW and
dipping 40�W. Other mineralized quartz veins have ageneral NW (with dip 40–43�SW) andNE trend (with dip14–53�NW). Individual quartz veins vary from a few
centimetres up to 2 m wide, and<1.0 m to more than 100m long. The large veins trend N25–35�W and extend
discontinuously up to 270 m along strike and from 78 to
165 m down dip (40�SW). The veins were partiallyworked out to 42m deep, with average thickness of 0.7 m.
H.Z. Harraz / Journal of African Earth Sciences 35 (2002) 347–363 349
They usually pinch, swell, bifurcate into small veins,veinlets and stringers (off-shoots) and join other veins,
giving rise to an anastomosing network �5 m in width.
3.2. Quartz vein types and paragenetic sequences
Sulphide minerals are mainly pyrite together with
arsenopyrite, sphalerite and pyrrhotite. Other subordi-
nate species include chalcopyrite, galena and gold. Very
rarely pentlandite, graphite, marcasite, rutile, ilmenite,
magnetite, hematite, titanite, covellite, malachite, go-
ethite and limonite are present. The sulphide species
occur as medium- to fine-grained interlocking aggre-
gates or disseminations in the quartz veins and along thecontacts between the quartz veins and wall rocks. Limo-
nite and goethite represent the final weathering products
of pyrite and arsenopyrite. Weathering of the sulphides
resulted in the formation of cavities.
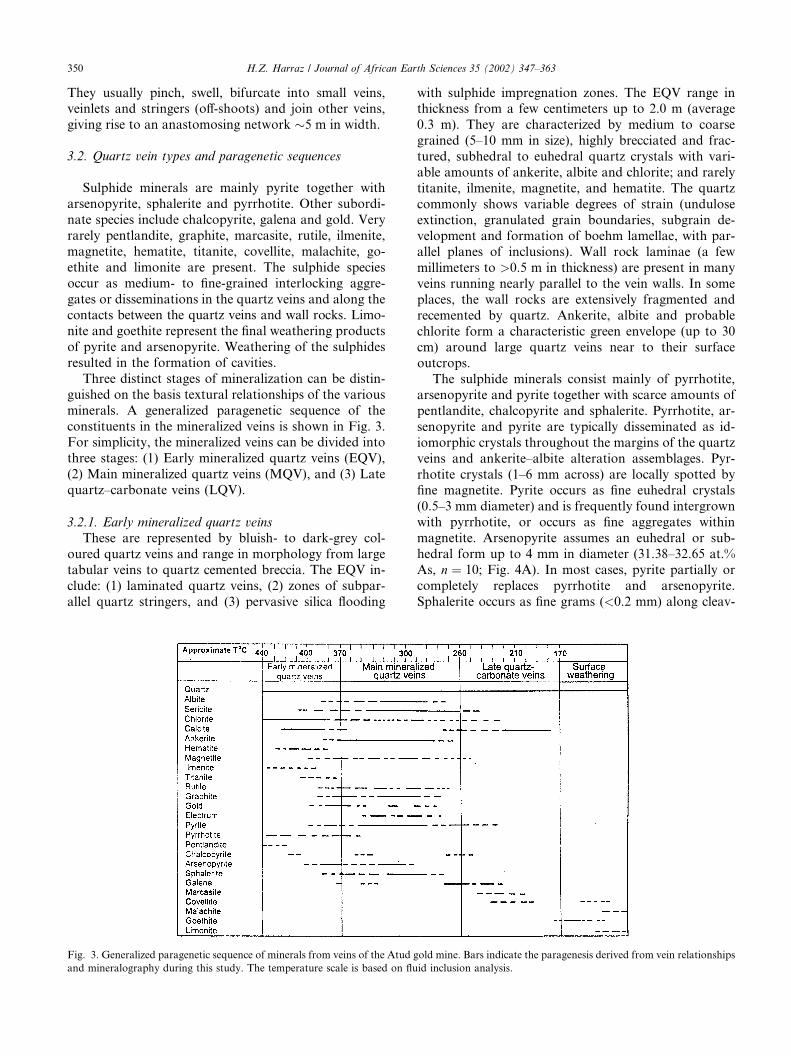
Three distinct stages of mineralization can be distin-
guished on the basis textural relationships of the various
minerals. A generalized paragenetic sequence of the
constituents in the mineralized veins is shown in Fig. 3.For simplicity, the mineralized veins can be divided into
three stages: (1) Early mineralized quartz veins (EQV),
(2) Main mineralized quartz veins (MQV), and (3) Late
quartz–carbonate veins (LQV).
3.2.1. Early mineralized quartz veins
These are represented by bluish- to dark-grey col-
oured quartz veins and range in morphology from large
tabular veins to quartz cemented breccia. The EQV in-
clude: (1) laminated quartz veins, (2) zones of subpar-
allel quartz stringers, and (3) pervasive silica flooding
with sulphide impregnation zones. The EQV range inthickness from a few centimeters up to 2.0 m (average
0.3 m). They are characterized by medium to coarse
grained (5–10 mm in size), highly brecciated and frac-
tured, subhedral to euhedral quartz crystals with vari-
able amounts of ankerite, albite and chlorite; and rarely
titanite, ilmenite, magnetite, and hematite. The quartz
commonly shows variable degrees of strain (undulose
extinction, granulated grain boundaries, subgrain de-velopment and formation of boehm lamellae, with par-
allel planes of inclusions). Wall rock laminae (a few
millimeters to >0.5 m in thickness) are present in manyveins running nearly parallel to the vein walls. In some
places, the wall rocks are extensively fragmented and
recemented by quartz. Ankerite, albite and probable
chlorite form a characteristic green envelope (up to 30
cm) around large quartz veins near to their surfaceoutcrops.
The sulphide minerals consist mainly of pyrrhotite,
arsenopyrite and pyrite together with scarce amounts of
pentlandite, chalcopyrite and sphalerite. Pyrrhotite, ar-
senopyrite and pyrite are typically disseminated as id-
iomorphic crystals throughout the margins of the quartz
veins and ankerite–albite alteration assemblages. Pyr-
rhotite crystals (1–6 mm across) are locally spotted byfine magnetite. Pyrite occurs as fine euhedral crystals
(0.5–3 mm diameter) and is frequently found intergrown
with pyrrhotite, or occurs as fine aggregates within
magnetite. Arsenopyrite assumes an euhedral or sub-
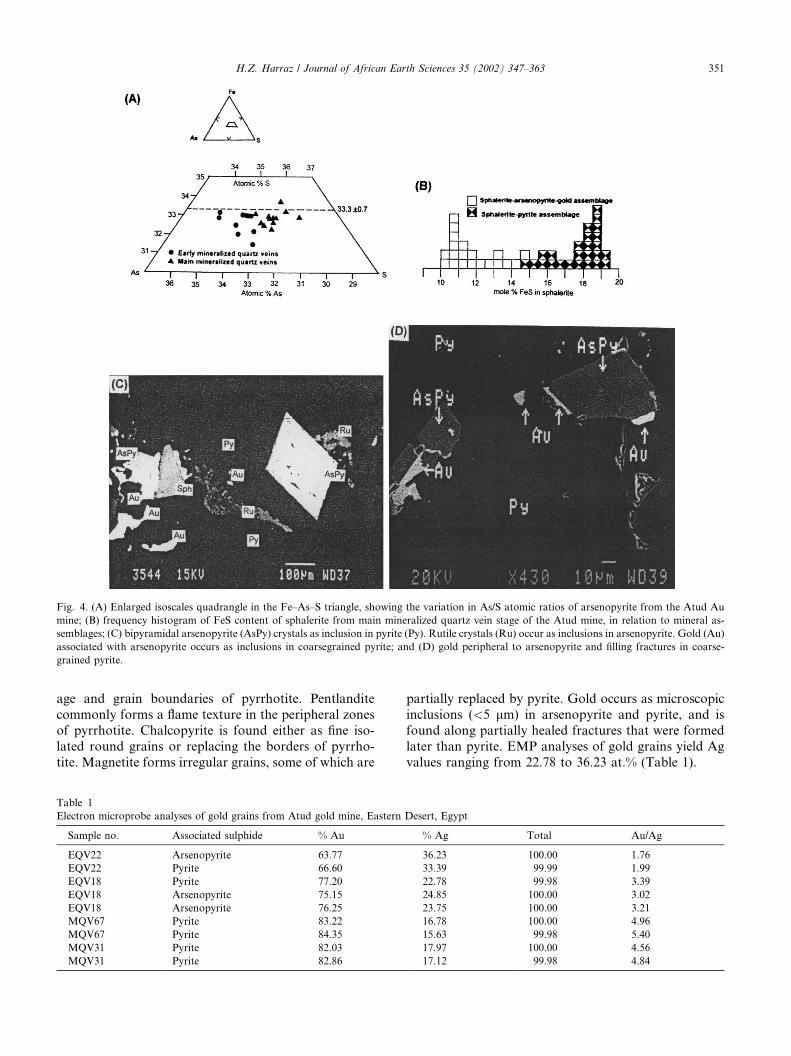
hedral form up to 4 mm in diameter (31.38–32.65 at.%
As, n ¼ 10; Fig. 4A). In most cases, pyrite partially orcompletely replaces pyrrhotite and arsenopyrite.
Sphalerite occurs as fine grams (<0.2 mm) along cleav-
Fig. 3. Generalized paragenetic sequence of minerals from veins of the Atud gold mine. Bars indicate the paragenesis derived from vein relationships
and mineralography during this study. The temperature scale is based on fluid inclusion analysis.
350 H.Z. Harraz / Journal of African Earth Sciences 35 (2002) 347–363
age and grain boundaries of pyrrhotite. Pentlandite
commonly forms a flame texture in the peripheral zones
of pyrrhotite. Chalcopyrite is found either as fine iso-
lated round grains or replacing the borders of pyrrho-
tite. Magnetite forms irregular grains, some of which are
partially replaced by pyrite. Gold occurs as microscopic
inclusions (<5 lm) in arsenopyrite and pyrite, and isfound along partially healed fractures that were formed
later than pyrite. EMP analyses of gold grains yield Ag
values ranging from 22.78 to 36.23 at.% (Table 1).
Fig. 4. (A) Enlarged isoscales quadrangle in the Fe–As–S triangle, showing the variation in As/S atomic ratios of arsenopyrite from the Atud Au
mine; (B) frequency histogram of FeS content of sphalerite from main mineralized quartz vein stage of the Atud mine, in relation to mineral as-
semblages; (C) bipyramidal arsenopyrite (AsPy) crystals as inclusion in pyrite (Py). Rutile crystals (Ru) occur as inclusions in arsenopyrite. Gold (Au)
associated with arsenopyrite occurs as inclusions in coarsegrained pyrite; and (D) gold peripheral to arsenopyrite and filling fractures in coarse-
grained pyrite.
Table 1
Electron microprobe analyses of gold grains from Atud gold mine, Eastern Desert, Egypt
Sample no. Associated sulphide % Au % Ag Total Au/Ag
EQV22 Arsenopyrite 63.77 36.23 100.00 1.76
EQV22 Pyrite 66.60 33.39 99.99 1.99
EQV18 Pyrite 77.20 22.78 99.98 3.39
EQV18 Arsenopyrite 75.15 24.85 100.00 3.02
EQV18 Arsenopyrite 76.25 23.75 100.00 3.21
MQV67 Pyrite 83.22 16.78 100.00 4.96
MQV67 Pyrite 84.35 15.63 99.98 5.40
MQV31 Pyrite 82.03 17.97 100.00 4.56
MQV31 Pyrite 82.86 17.12 99.98 4.84
H.Z. Harraz / Journal of African Earth Sciences 35 (2002) 347–363 351
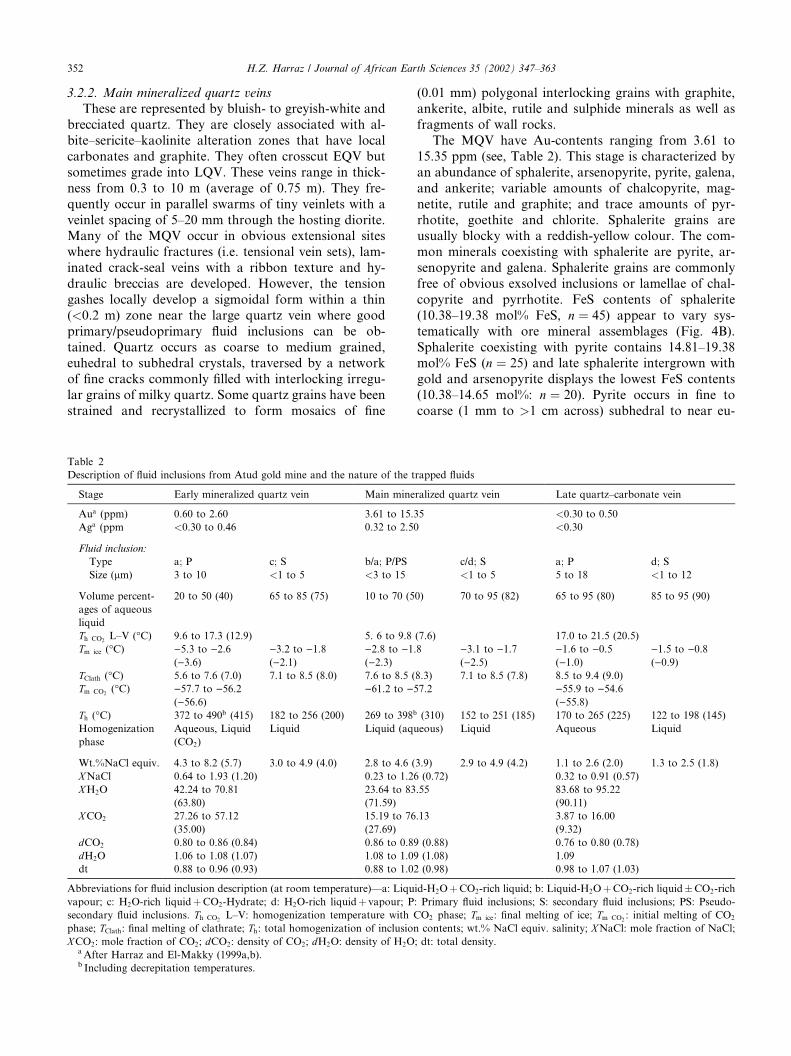
3.2.2. Main mineralized quartz veins
These are represented by bluish- to greyish-white and
brecciated quartz. They are closely associated with al-
bite–sericite–kaolinite alteration zones that have local
carbonates and graphite. They often crosscut EQV but
sometimes grade into LQV. These veins range in thick-
ness from 0.3 to 10 m (average of 0.75 m). They fre-
quently occur in parallel swarms of tiny veinlets with a
veinlet spacing of 5–20 mm through the hosting diorite.Many of the MQV occur in obvious extensional sites
where hydraulic fractures (i.e. tensional vein sets), lam-
inated crack-seal veins with a ribbon texture and hy-
draulic breccias are developed. However, the tension
gashes locally develop a sigmoidal form within a thin
(<0.2 m) zone near the large quartz vein where goodprimary/pseudoprimary fluid inclusions can be ob-
tained. Quartz occurs as coarse to medium grained,euhedral to subhedral crystals, traversed by a network
of fine cracks commonly filled with interlocking irregu-
lar grains of milky quartz. Some quartz grains have been
strained and recrystallized to form mosaics of fine
(0.01 mm) polygonal interlocking grains with graphite,ankerite, albite, rutile and sulphide minerals as well as
fragments of wall rocks.
The MQV have Au-contents ranging from 3.61 to
15.35 ppm (see, Table 2). This stage is characterized by
an abundance of sphalerite, arsenopyrite, pyrite, galena,
and ankerite; variable amounts of chalcopyrite, mag-
netite, rutile and graphite; and trace amounts of pyr-
rhotite, goethite and chlorite. Sphalerite grains areusually blocky with a reddish-yellow colour. The com-
mon minerals coexisting with sphalerite are pyrite, ar-
senopyrite and galena. Sphalerite grains are commonly
free of obvious exsolved inclusions or lamellae of chal-
copyrite and pyrrhotite. FeS contents of sphalerite
(10.38–19.38 mol% FeS, n ¼ 45) appear to vary sys-tematically with ore mineral assemblages (Fig. 4B).
Sphalerite coexisting with pyrite contains 14.81–19.38mol% FeS (n ¼ 25) and late sphalerite intergrown withgold and arsenopyrite displays the lowest FeS contents
(10.38–14.65 mol%: n ¼ 20). Pyrite occurs in fine tocoarse (1 mm to >1 cm across) subhedral to near eu-
Table 2
Description of fluid inclusions from Atud gold mine and the nature of the trapped fluids
Stage Early mineralized quartz vein Main mineralized quartz vein Late quartz–carbonate vein
Aua (ppm) 0.60 to 2.60 3.61 to 15.35 <0.30 to 0.50
Aga (ppm <0.30 to 0.46 0.32 to 2.50 <0.30
Fluid inclusion:
Type a; P c; S b/a; P/PS c/d; S a; P d; S
Size (lm) 3 to 10 <1 to 5 <3 to 15 <1 to 5 5 to 18 <1 to 12
Volume percent-
ages of aqueous
liquid
20 to 50 (40) 65 to 85 (75) 10 to 70 (50) 70 to 95 (82) 65 to 95 (80) 85 to 95 (90)
Th CO2 L–V (�C) 9.6 to 17.3 (12.9) 5. 6 to 9.8 (7.6) 17.0 to 21.5 (20.5)
Tm ice (�C) )5.3 to )2.6()3.6)
)3.2 to )1.8()2.1)
)2.8 to )1.8()2.3)
)3.1 to )1.7()2.5)
)1.6 to )0.5()1.0)
)1.5 to )0.8()0.9)
TClath (�C) 5.6 to 7.6 (7.0) 7.1 to 8.5 (8.0) 7.6 to 8.5 (8.3) 7.1 to 8.5 (7.8) 8.5 to 9.4 (9.0)
Tm CO2 (�C) )57.7 to )56.2()56.6)
)61.2 to )57.2 )55.9 to )54.6()55.8)
Th (�C) 372 to 490b (415) 182 to 256 (200) 269 to 398b (310) 152 to 251 (185) 170 to 265 (225) 122 to 198 (145)
Homogenization
phase
Aqueous, Liquid
(CO2)
Liquid Liquid (aqueous) Liquid Aqueous Liquid
Wt.%NaCl equiv. 4.3 to 8.2 (5.7) 3.0 to 4.9 (4.0) 2.8 to 4.6 (3.9) 2.9 to 4.9 (4.2) 1.1 to 2.6 (2.0) 1.3 to 2.5 (1.8)
XNaCl 0.64 to 1.93 (1.20) 0.23 to 1.26 (0.72) 0.32 to 0.91 (0.57)
XH2O 42.24 to 70.81
(63.80)
23.64 to 83.55
(71.59)
83.68 to 95.22
(90.11)
XCO2 27.26 to 57.12
(35.00)
15.19 to 76.13
(27.69)
3.87 to 16.00
(9.32)
dCO2 0.80 to 0.86 (0.84) 0.86 to 0.89 (0.88) 0.76 to 0.80 (0.78)
dH2O 1.06 to 1.08 (1.07) 1.08 to 1.09 (1.08) 1.09
dt 0.88 to 0.96 (0.93) 0.88 to 1.02 (0.98) 0.98 to 1.07 (1.03)
Abbreviations for fluid inclusion description (at room temperature)––a: Liquid-H2OþCO2-rich liquid; b: Liquid-H2OþCO2-rich liquid�CO2-richvapour; c: H2O-rich liquidþCO2-Hydrate; d: H2O-rich liquidþ vapour; P: Primary fluid inclusions; S: secondary fluid inclusions; PS: Pseudo-secondary fluid inclusions. Th CO2 L–V: homogenization temperature with CO2 phase; Tm ice: final melting of ice; Tm CO2 : initial melting of CO2phase; TClath: final melting of clathrate; Th: total homogenization of inclusion contents; wt.% NaCl equiv. salinity; XNaCl: mole fraction of NaCl;XCO2: mole fraction of CO2; dCO2: density of CO2; dH2O: density of H2O; dt: total density.aAfter Harraz and El-Makky (1999a,b).b Including decrepitation temperatures.
352 H.Z. Harraz / Journal of African Earth Sciences 35 (2002) 347–363
hedral crystals, thai frequently have cubic forms. Oc-casionally pyrite and arsenopyrite form interlocking
aggregates with pyrrhotite, or disseminations in albite
and quartz, particularly at the contacts between quartz
veins and wall rocks where graphite and rutile are
abundant. Arsenopyrite occurs as bipyramidal crystals
(29.56–31.19 at.% As, n ¼ 12), commonly associatedwith pyrrhotite and replaced by pyrite (Fig. 4C). Rutile
crystals occur as inclusions in arsenopyrite (Fig. 4C).Galena occurs as large anhedral grains or aggregates
commonly associated with sphalerite and pyrite. Gold
occurs as discrete grains of native gold (5–20 lm in di-ameter), and as inclusions and filling fractures in pyrite,
arsenopyrite and base metal sulphides. Gold is also seen
along partially healed fractures and marginal to arsen-
opyrite crystals, that were formed early than pyrite
precipitation (Fig. 4D). EMP analyses of gold grainsindicate that gold contains 15.63–17.97 at.% silver
(Table 1). These occurrences of gold indicate that sev-
eral influxes of gold and/or stages of remoblization took
place.
3.2.3. Late quartz–carbonate veins
These occur as relatively thin quartz veins post-dat-
ing all other types. The LQV range in width from 15 to
45 cm and frequently fill minute cracks in the earlier
vein varieties. They are comprised mainly of vuggy
milky quartz, calcite and pyrite. Quartz is often present
as euhedral coarse grains or euhedral terminated prisms(up to 3 cm in length) found in vugs projecting inward
from the vein walls. Quartz is also enclosed by coarse
calcite crystals forming a poikilitic texture. Calcite
generally constitutes �8 vol.% of the vein materials andoccurs in two distinctive forms: (1) white to transparent,
well-developed rhombohedrals crystals and (2) pearly
scalenohedral crystals. White transparent calcite is
found rarely as epitaxial overgrowths on the quartz invugs, while the pearly scalenohedral calcite crystals are
usually coated by malachite and goethite. A late drusy
calcite coats and/or replaces quartz in close vicinity
to the contact between the LQV and host dioritic
rocks.
Trace amounts of goethite, galena, covellite, and
malachite are also detected in the LQV. Pyrite is found
either as fine to very fine isolated round cubic crystals orreplacing the borders of galena grains. Pyrite is partially
altered to marcasite and magnetite. The LQV are also
affected by weathering and have many minute veinlets
filled by iron oxides in the form of reddish hematite and
brownish limonite. Weathering also forms colloform
intergrowths of goethite and limonite, particularly in the
upper portion of the mine.
These three vein types are also distinguished by thenature of their associated alteration assemblages. The
oldest are characterized by ankerite–albite and graphite
envelopes, the second by albite–sericite–kaolinite and
graphite envelopes, and the youngest by chlorite–car-bonate wall rock alteration (Fig. 3).
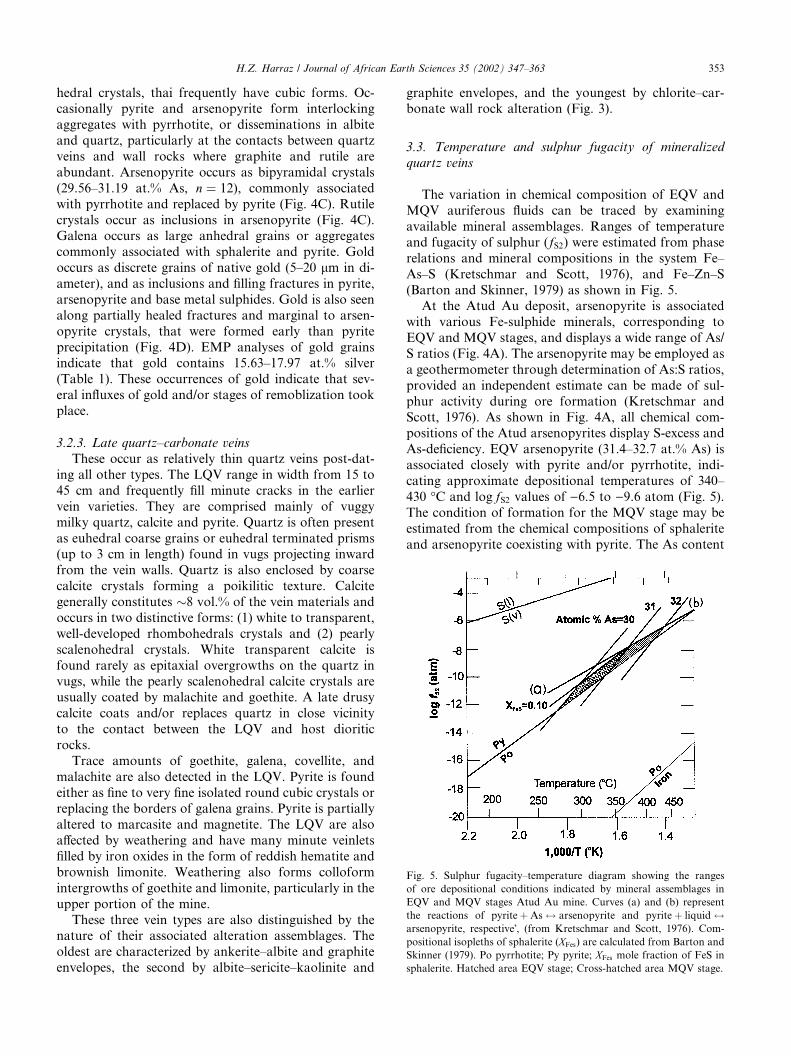
3.3. Temperature and sulphur fugacity of mineralized
quartz veins
The variation in chemical composition of EQV and
MQV auriferous fluids can be traced by examining
available mineral assemblages. Ranges of temperature
and fugacity of sulphur (fS2) were estimated from phaserelations and mineral compositions in the system Fe–
As–S (Kretschmar and Scott, 1976), and Fe–Zn–S
(Barton and Skinner, 1979) as shown in Fig. 5.At the Atud Au deposit, arsenopyrite is associated
with various Fe-sulphide minerals, corresponding to
EQV and MQV stages, and displays a wide range of As/
S ratios (Fig. 4A). The arsenopyrite may be employed as
a geothermometer through determination of As:S ratios,
provided an independent estimate can be made of sul-
phur activity during ore formation (Kretschmar and
Scott, 1976). As shown in Fig. 4A, all chemical com-positions of the Atud arsenopyrites display S-excess and
As-deficiency. EQV arsenopyrite (31.4–32.7 at.% As) is
associated closely with pyrite and/or pyrrhotite, indi-
cating approximate depositional temperatures of 340–
430 �C and log fS2 values of )6.5 to )9.6 atom (Fig. 5).The condition of formation for the MQV stage may be
estimated from the chemical compositions of sphalerite
and arsenopyrite coexisting with pyrite. The As content
Fig. 5. Sulphur fugacity–temperature diagram showing the ranges
of ore depositional conditions indicated by mineral assemblages in
EQV and MQV stages Atud Au mine. Curves (a) and (b) represent
the reactions of pyriteþAs$ arsenopyrite and pyriteþ liquid$arsenopyrite, respective�, (from Kretschmar and Scott, 1976). Com-
positional isopleths of sphalerite (XFes) are calculated from Barton andSkinner (1979). Po pyrrhotite; Py pyrite; XFes mole fraction of FeS insphalerite. Hatched area EQV stage; Cross-hatched area MQV stage.
H.Z. Harraz / Journal of African Earth Sciences 35 (2002) 347–363 353
of arsenopyrite and FeS mol% of sphalerite of the MQVvary from 29.6 to 31.2 and 10.4 to 19.4, respectively. The
ore minerals of MQV are estimated to have been formed
at temperatures of 273–368 �C and log fS2 of )8.0 to)12.2 atom (Fig. 5).The estimated temperature range for the mineralized
assemblages (273–430 �C) are consistent with meso-thermal conditions of gold deposition at Atud mine, and
is comparable to other gold deposits in central EasternDesert of Egypt. There appear to have been decreases in
temperature and sulphur fugacity with increasing time,
from EQV to MQV stages. Decrease of sulphur fuga-
city, through sulphide precipitation and/or H2S loss,
may favour gold deposition through destabilization of
gold bisulphide complexes such as Au(HS)2 (Seward,
1984; Drammond and Ohmoto, 1985; Bowers, 1991).
Thus, the decreases in fugacity of sulphur and temper-ature of ore fluids were likely causes of gold deposition
at Atud gold deposit.
4. Fluid inclusion studies
4.1. Sample selection and analytical techniques
Fluid inclusions (278 primary and 190 secondary)
were examined in 29 quartz samples from the EQV
MQV and LQV stages. Locations of the selected sam-
ples are shown in Fig. 2. Inclusions were examined in
quartz along vein margins associated with symmetrically
developed selvages of internally projecting, calcite, an-
kerite and albite crystal intergrowths with minor pyrite
and gold. This selection ensured that the inclusions weretaken from the same type of material.
Fluid inclusions were examined in thin (<0.30 mmthick) doubly polished slices. Microthermometric mea-
surements were performed using the Linkam THMSG-
600 programmed heating–freezing stage and employing
standard procedures (Shepherd et al., 1985). Stage cali-
bration was carried out at )56.6, 10.0, 30.8 and 294 �Cusing synthetic H2O–CO2 fluid inclusion standards.Measurements below 31.1 �C (the critical point of CO2)are accurate to within �0.2 �C and measurements abovethis temperature to within �1 �C. Initial melting of CO2phase (Tm CO2), final melting of ice (Tm ice), final melting
of clathrate (TClath), homogenization within CO2 phase(Th CO2 L–V) and total homogenization of inclusioncontents (Th) were measured. The warming rate wasmaintained at about 1 �C/min. The cooling rate is dif-ficult to control but it generally falls between 5 and 15
�C/min. Super-cooling was necessary for freezing ofboth CO2-hydrate and ice. Homogenization temspera-
tures were determined by observing the temperature at
which the boundary between liquid CO2 and H2O dis-
appears. A heating rate of 5 �C/min was used during the
initial stages of each heating run and reduced to 2 �C/min close to the homogenization temperature.
Salinities were calculated using the final melting
temperatures of CO2-clathrate (Collins, 1979) and ice
(Roedder, 1963) and expressed as wt.% NaCl equiv.
(Table 2). The homogenization temperature of the CO2-
rich phase in inclusions (Th CO2 L–V), together withvolume data on phase ratios (calculated from relative
areas), are used in calculating the molar ratios of CO2and H2O and the fluid density (Table 2). Disk copies of
the entire data file in the PC-Dos spreadsheet are
available from the author.
4.2. Nature of the fluid inclusions
Within all studied quartz samples, only two major
types of primary and secondary fluid inclusions are
recognized, namely: liquid-rich and vapour rich inclu-
sions. None of the studied inclusions contain any
daughter or accidentally trapped solid phases. Quartz
contain a high ratio of primary to secondary inclusionsthat are predominantly liquid-rich, representing �30 to70% of all detected inclusions at room temperatures.
Collectively the two types exhibit a relatively wide range
of liquid/vapour volume ratios indicating heterogeneity
of the trapped liquid–vapour mixtures. Most of the
quartz grains have suffered from some degree of strain
and recrystallization, showing several generations of
secondary fluid inclusion trails. However, workableprimary inclusions were located in all quartz vein stages
after careful petrographic examination. Quartz near vein
margins was found to be considerably less strained than
quartz in vein interiors.
The investigated primary fluid inclusions are com-
posed of H2O and CO2 phases in variable proportions,
and apparently represent mixtures of two end members
(Table 2). Generally, the fluid inclusions varied in sizefrom <3 to 18 lm, in largest dimension and are usuallyirregular to oblate spheroids with rare perfect negative
crystals. Most of these inclusions are located in un-
strained material, isolated by distances >5 times the in-clusion diameter, and randomly distributed within the
thickness of the section. These characteristics indicate a
primary and/or pseudosecondary origin of these inclusion
types according to the criteria defined by Roedder (1984).At 40 �C, all primary fluid inclusions observed in the
Atud vein materials consist of two (liquid-H2Oþ liquid-CO2) or three (liquid-H2OþCO2-rich liquidþCO2-richvapour) phases (Table 2). With cooling down to )10 �C,all of the liquid CO2-bearing two phase inclusions form
a CO2-rich vapour. According to relative abundance of
CO2-rich phase compared to the aqueous phase, at 40
�C, the liquid-H2Oþ liquid-CO2 inclusions can be fur-ther classified into CO2-rich and H2O-rich subtypes,
which suggest phase separation (confirmed below). The
volumetric percentages of CO2-component (LþV), at
354 H.Z. Harraz / Journal of African Earth Sciences 35 (2002) 347–363
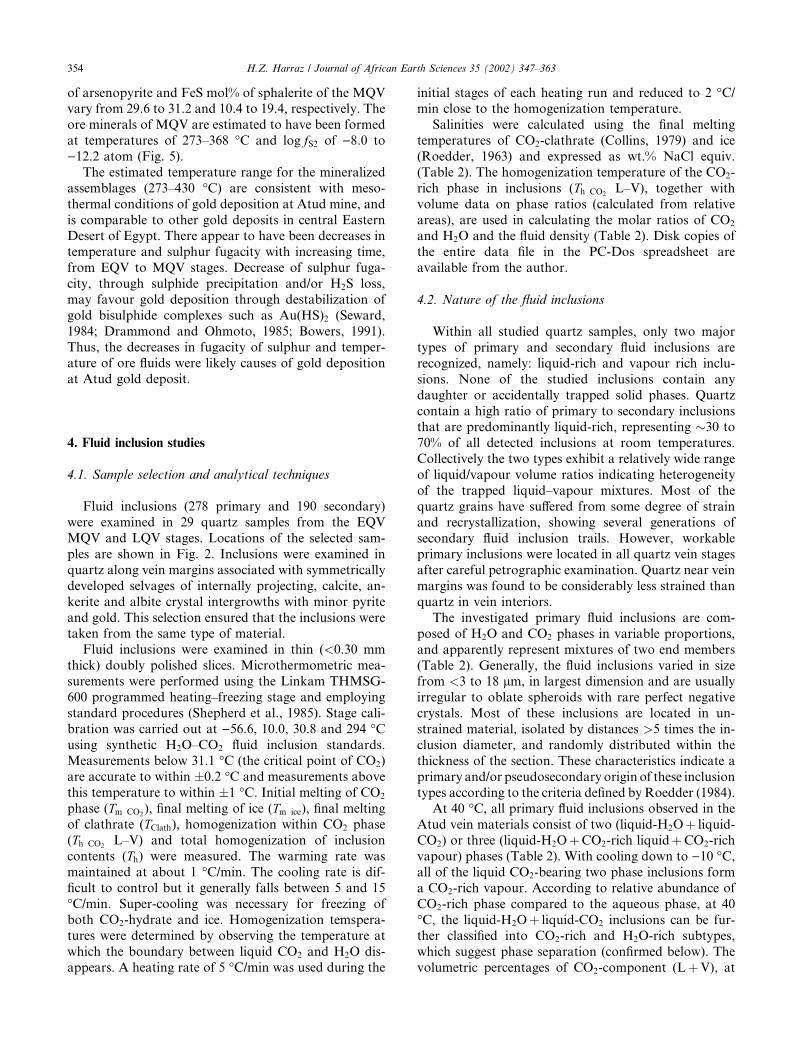
40 �C, are 50–70%, 40–90% and 20–35% of the inclu-
sions from quartz intimately associated with the EQV,MQV and LQV stages, respectively (Table 2, Fig. 6A).
Secondary inclusions trails are abundant in most
materials with densities dependent upon degree of strain
followed by recrystallization. These fluid inclusions
consist of two phases (H2O-rich liquidþ vapour) atroom temperature. In quartz from EQV and MQV
stages the secondary aqueous inclusions form clathrates
during cooling, while in quartz from LQV stagesecondary aqueous inclusions do not form a clathrate.
The secondary inclusions have very variable shapes from
small (<1 to 5 lm) oblate spheroidal forms arrangedwith long axes parallel to the controlling fracture planes,
to large (>10 lm) more irregular dendritic forms.
They often display microthermometric properties which
are distinct from those of the apparent primary inclu-sions with which they are spatially associated. During
heating runs, it was noted that decrepitation and homo-
genization (vapour to liquid) take place at much lower
temperatures than the primary inclusions (Fig. 7). These
observations suggest that secondaries were the result of
later processes after the main mineralization event.
4.3. Microthermometry
The microthermometric data, summarized in Table 2and Figs. 6 and 7, reveal wide and different ranges of
homogenization temperature of primary fluid inclusions
in quartz intimately associated with the mineralization
Fig. 6. Histograms representing the microthermometric data of the primary and pseudosecondary fluid inclusions from the three paragenetic stages
at Atud gold mine. (A) volume% CO2 at 40 �C; (B) initial melting temperature of CO2 (Tm CO2 ); (C) homogenization temperature within the CO2(Th CO2 L–V); (D) salinity (wt.% NaCl equiv.); (E) final melting temperature of clathrate CO2 (TClath); and (F) total homogenization temperature ofinclusion contents (Th).
H.Z. Harraz / Journal of African Earth Sciences 35 (2002) 347–363 355
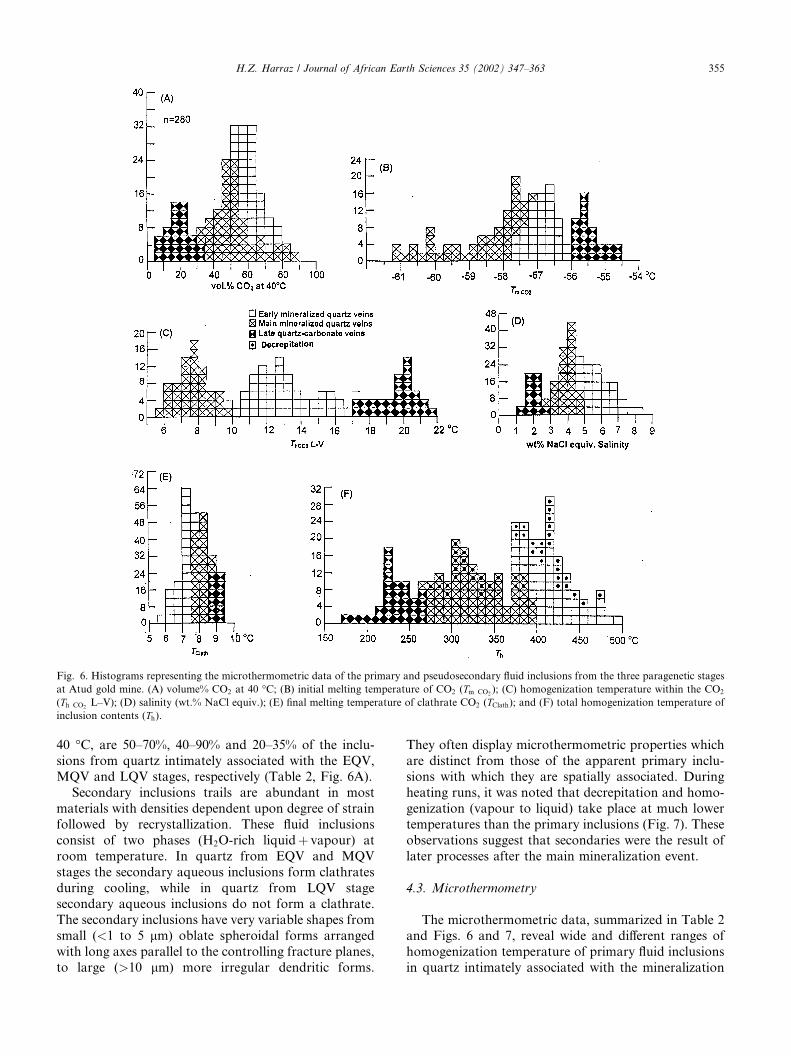
event. However, by analyzing peaks within histograms
of fluid inclusion data (Fig. 6), it is possible to decipher
individual hydrothermal events which are related to
specific mineral assemblages. Plotting of salinity (wt.%
NaCl equiv.) versus Th (Fig. 7) also allows discrimina-tion between the three paragenetic stages of the studied
mineralization. The EQV stage is characterized by fluid
inclusions of elevated salinity (4.3–8.2 wt.% NaClequiv.) and Th (372–490 �C). The MQV stage is charac-terized by moderate salinity (2.8–4.6 wt.% NaCl equiv.)
and Th (269–398 �C). The LQV stage shows low salinity(1.1–2.6 wt.% NaCl equiv.) and Th (170–265 �C). Al-though these data define three separate fields for each
type of quartz vein, the diagram suggests a trend from
EQV stage to LQV stage, through MQV stage. These
may reflect a continuum of three hydrothermal stagesduring the formation of the quartz in the Atud gold
mine rather than one single event (Roedder, 1984;
Nesbitt, 1993), which will be discussed below.
4.4. Inclusions in mineralized quartz vein stages
The Tm CO2 of primary and pseudosecondary fluid
inclusions in the quartz intimately associated with the
EQV stage are clustered between )57.7 and )56.2 �C(centered near )56.64 �C, Fig. 6B). Clearly, the liquid-CO2 component is reasonably pure, since the mean
value of )56.64 �C is close to the invariant melting
temperature of pure CO2 at )56.6 �C (Fig. 6B). In
some cases, the fluid inclusions revealed Tm CO2 between)57.7 and )57.0 �C, which indicates variations in thecompositions of the mineralized fluid.
The MQV stage is characterized by CO2-rich inclu-
sions, probably with other miscible gaseous components
such as CH4, N2 or H2S (Burruss, 1981; Read and
Meinert, 1986) as indicated by a Tm CO2 , clustered
around )58.5 and )57.2 �C (Fig. 6B) and lower thanpure CO2 ()56.6 �C). This amount of freezing pointdepression is consistent with 3–10 mol% CH4 or 15–25
mol% N2 within the CO2 phase (Swanenberg, 1980).
Moreover, a few inclusions in some quartz samples in-
timately associated with MQV, exhibited Tm CO2 as low
as )61.2 �C (Table 2, Fig. 6B), suggesting much higherconcentration of CH4, and/or have lower molar volume
of CO2-rich phase or some other component (Burruss,
1981; Heyen et al., 1982). The identification andquantification of these components through microther-
mometry were not possible because of the very small
quantities involved, and the data were therefore inter-
preted using the chemical system H2O–CO2–NaCl. A
common feature for Au-deposits, in which CH4 is in-
ferred in fluid inclusions, is the presence of ‘‘graphitic
material’’ (Ho et al., 1985). The occurrence of graphitic
materials at the Atud gold mine may be attributed tothe alteration of carbonate minerals by fluid-wall rock
reactions (Harraz, 1999). This is in agreement with the
conditions encountered in the studied samples from
level 42M (sample nos. 30, 41, 42, 49 and 50) and
level 165M (sample nos. 34 and 56; Fig. 2). Conse-
quently, the possible presence of CH4 indicates that
reduction might have played a significant role in Au
deposition (Bottrell et al., 1988; Naden and Shepherd,1989), since CH4 may not have been a component of the
original fluids. It worthy to note that CO2–H2O–CH4bearing hydrothermal fluids are a common feature
of mesothermal and other Au-bearing fluid (Mumin
et al., 1996). They (op. cit) demonstrated that a CO2–
H2O–CH4 primary gold-bearing fluids would be
produced by metamorphism of marine sedimentary
rocks.The homogenization of CO2-rich liquid–vapour
phases (always to a liquid) within the mineralized veins
(Fig. 6C) was measured in the absence of ice and
clathrate compounds. Fluid inclusions from the EQV
stage show a wide range of Th CO2 L–V (þ9.6� and þ17.3�C), while those in the MQV stage range between þ5.6and þ9.8 �C (Fig. 6C). Estimated densities of CO2 in-clusions in the mineralized veins reveal a narrow rangeof 0.80 to 0.89 g/cc and CO2 concentration ranges be-
tween 15 and 76 mol%. The MQV stage is characterized
by higher CO2-densities of 0.86–0.89 g/cc with 15.2–76.1
mol% CO2 than that of the EQV stage (0.80–0.86 g/cc
and 27.3–57.1 mol% CO2, Table 2).
TClath values of fluid inclusions in quartz from mine-ralized veins were below the þ10 �C quadruple point
Fig. 7. Total homogenization temperature (Th) versus salinity (wt.%NaCl equiv.) plots of the primary and secondary fluid inclusions from
the three paragenetic stages at Atud gold mine. Fluid unmixing has
produced the observed temperature–salinity trends of primary inclu-
sions, whereas secondary inclusions recorded later incursion of more
dilute waters. Solid symbols denote primary fluid inclusions; Open
symbols denote secondary fluid inclusions.
356 H.Z. Harraz / Journal of African Earth Sciences 35 (2002) 347–363
(Burruss, 1981), indicating a range from þ5.6 to þ8.5 �C(Fig. 6E). The TClath of CO2-rich inclusions in the EQVranges from þ5.6 to þ7.6 �C, while those in MQV showa range between þ7.6 and þ8.5 �C (Fig. 6E). However,most of Tm ice from the MQV exhibit a higher cluster
center ()2.3 �C) than the EQV stage ()3.6 �C). Aqueousphase salinities determined from clathrate melting
points for inclusions containing relatively pure CO2(CO2 m.pt. >56.6 �C) are relatively low with a totalrange from 4.3–8.2 wt.% NaCl equiv. (Fig. 6D). The
TClath values indicate a salinity of 4.3–8.2 wt.% NaCl
equiv., corresponding to the presence of 0.64–1.93 mol%
NaCl in the EQV, as well as 2.8–4.6 wt.% NaCl equiv.,
corresponding to the presence of 0.23–1.26 mol% NaCl
in the MQV (Table 2).
CO2-rich inclusions show a complex behaviour dur-
ing both heating and freezing experiments. This can beattributed to elevation of the internal pressure of the
fluid inclusion containing CO2 and/or CH4 during
heating, and/or to the development of fissures already in
existence (Burruss, 1981; Roedder, 1984). Although
most of fluid inclusions in the quartz from the mine-
ralized vein stages decrepitated prior to total homoge-
nization, 222 total homogenization (Th) were measured.H2O–CO2 inclusions in any one sample show similarranges of homogenization temperatures (269–490 �C)but to liquid H2O and the CO2 to vapour (Fig. 6F).
Hence these inclusions may be interpreted as repre-
senting two immiscible coexisting fluids (Ramboz et al.,
1982), and/or that phase separation accompanied mine-
ralization. Total homogenization occurred at tempera-
tures of 372 to 490 �C (cluster near 415 �C) for EQVinclusions and 269 to 398 �C (cluster near 310 �C) forMQV inclusions (Table 2 and Fig. 6F).
4.5. Inclusions in the late quartz–carbonate vein stage
The TClath in the fluid inclusions from the LQV stagerange from þ8.5 to þ9.4 �C (cluster near þ9.0 �C;Fig. 6E). These correspond to a maximum salinity
ranging between 1.1 and 2.6 wt.% NaCl equiv. (around
a modal value of 2.0 wt.% equiv.) in aqueous phase
(Fig. 6D). Tm CO2 of fluid inclusions in quartz from the
LQV stage range from )55.9 to )54.6 �C (cluster near)55.8 �C) and falls near the triple point of pure CO2.The lack of CH4 in the fluid inclusions from this stage
reflects a high oxidation state. The Th CO2 L–V fall
within the range þ17.0 to þ21.5 �C (clustering near
þ20.5 �C; Fig. 6C). The estimated CO2-densities ofthese inclusions reveal a narrow range from 0.76 to 0.80
g/cc, and CO2 concentrations from 3.9 to 16.0 mol%
(Table 2). Th of fluid inclusions in quartz from the LQVstage, which ranges from 170 to 265 �C (cluster near225 �C; Fig. 6F) are low relative to the other examinedmaterials.
4.6. Secondary fluid inclusions
The detected secondary fluid inclusions invariably
exhibit homogenization temperatures over a wide range
from 152 to 256 �C, with salinities from 2.9 to 4.9 wt.%NaCl equiv. (Fig. 7), indicating a decay of the temper-
ature regime subsequent to the mineralization event.
The first melting of ice in secondary aqueous inclusions
in quartz from the mineralized vein stages was recog-nized near )21 �C, although it was so difficult to observethat only a few measurements were recorded. These
measurements indicate TClath for some secondary aque-ous inclusions in quartz from mineralized vein stages are
þ7.1 to þ8.6 �C, corresponding to salinities of 2.9–4.9wt.% NaCl equiv. (Table 2). In fact, the Th and salinityrange for secondary fluid inclusions in the EQV and
MQV stages is nearly the same. The majority of thesecondary fluid inclusions in EQV stage range from 182
to 256 �C (cluster near 200 �C) with a salinity range from3.0 to 4.9 wt.% NaCl equiv. (centered near 4 wt.% NaCl
equiv.), while those from the MQV stage range from 152
to 251 �C (cluster near 185 �C) with salinity range from2.9 to 4.9 wt.% NaCl equiv. (centered near 4.2 wt.%
NaCl equiv.).
Secondary fluid inclusions in quartz from the LQVstage do not nucleate a recognizable clathrate phase,
indicating minor amounts (<2.7 wt.%) of CO2 (Heden-quist and Henley, 1985). These inclusions homogenized
at temperatures from 122 to 198 �C (centered near 145�C). Salinities of these secondary inclusions range from1.3 to 2.3 wt.% NaCl equiv. (cluster near 1.8 wt.% NaCl
equiv.; Fig. 7). The marked decrease in Th and salinitysuggests that the LQV stage fluids may have been cooledand diluted by meteoric water.
4.7. Fluid immiscibility
Fracturing was present throughout all stages of
mineralization at Atud gold mine. Many of the miner-
alized quartz veins occur in dilational shear zones in
obvious extensional sites where tension gashes, lami-
nated crack-seal veins with a ribbon texture and hy-
draulic breccias are developed Immiscibility in an ore
fluid can result from pressure release during tensional
fracturing, decreasing hydrostatic pressure during as-cent, and decrease in temperature.
As described previously, fluids trapped as primary
fluid inclusions in mineralized veins are either two phase
(two liquids) or three phase (two liquidsþ vapour), areH2O–CO2 bearing, and show quite variable vapour- to
liquid-ratios indicating heterogeneity of the trapped
liquid–vapour mixtures. These inclusions however,
show a wide range of CO2:H2O ratios, and apparentlyrepresent mixtures of two end members (Table 2)
possibly due to either unmixing of the original fluid
through a pressure decrease or CO2 phase separation
H.Z. Harraz / Journal of African Earth Sciences 35 (2002) 347–363 357
(Mumin et al., 1996). Both H2O-rich liquid and CO2-rich liquid inclusion phases are observed in quartz inti-
mately associated with the EQV and MQV stages.
Where the two inclusion types occur together, they tend
to homogenize at similar temperatures to liquid and
the CO2 to vapour (Fig. 6F). Hence these inclusions
are interpreted to represent two immiscible coexisting
fluids or phase separation accompaning mineralization
(Ramboz et al., 1982). On the other hand, primary fluid(liquid-H2OþCO2-rich liquid) inclusions show higherTh than the secondary aqueous ones. Moreover, areas ofprimary inclusions tend to show either variable
H2O:CO2 ratios even in adjacent inclusions, or a rela-
tively consistent H2O:CO2 ratios corresponding to �60and 50 vol.% CO2 in EQV and MQV, respectively.
These observations indicate that H2O–CO2 phase sepa-
ration was sporadic during deposition of mineralizedquartz veins.
The relationship between homogenization tempera-
ture and salinity of the quartz vein fluids (Fig. 7) indi-
cates a complex history of unmixing (CO2 effervescence)
induced by pressure decrease over the temperature range
of �490–270 �C. Moreover, homogenization tempera-tures of primary and pseudosecondary fluid inclusions
decrease with time from EQV to LQV stages throughthe MQV stage (Fig. 7). The lower temperatures and
especially the lower salinities of secondary inclusions in
the mineralized quartz veins are similar to those of
primary inclusions in the LQV stage of mineralization
(Table 2, Fig. 7); representing the waning stage of quartz
mineralization. Secondary H2O-richþ vapour fluids canbe produced by unmixing of a relatively primary low-
salinity H2O–CO2 fluid, because nearly all of the salt willbe fractionated into the residual H2O-rich liquid phase
rather than into the CO2-rich vapour phase (Bowers and
Helgeson, 1983a,b; So et al., 1995). Therefore, fluid
unmixing may have accompanied the observed tempe-
rature–salinity trends.
As described earlier, the liquid-H2Oþ liquid-CO2inclusions in the quartz intimately associated with the
EQV stage have relatively uniform CO2 phase ratios(50–70 vol.%; corresponding to XCO2 of about 0.35).Homogenization temperatures (n ¼ 108) for these in-clusions are high (372–490 �C). These inclusions mayrepresent the parent homogeneous fluids from which the
aqueous and CO2-rich fluids were derived through
progressive fluid unmixing.
4.8. Pressure considerations
Fluid inclusion data provide information only on the
minimum pressure and temperature during trapping,
except for the case of simultaneous trapping of immis-cible boiling fluid (Roedder and Bodnar, 1980). There-
fore, estimating entrapment pressures of fluid inclusions
using evidence of fluid immiscibility is a delicate matter
(Roedder and Bodnar, 1980; Ramboz et al., 1982). Thehomogenization temperatures of immiscible, H2O-rich
and CO2-rich (in EQV and MQV stages) inclusions
correspond to the minimum entrapment temperatures of
these fluids. The presence of a homogeneous parent fluid
(H2O–CO2) indicates that P–T conditions were above
the two-phase region (Fig. 8) for at least short periods of
time during fluid entrapment. In the calculation, the
dissolved salt was neglected because it was always <1mol% of the bulk composition (see Table 2). The highest
possible P–T conditions during mineralization can be
obtained by crossing isochores for a CO2-rich fluid of
medium to high density.
For the system H2Oþ 30 mol% CO2 (Grawford,
1981), the solvus curve is intersected by isochores of
0.80–0.89 g/cc (the calculated range of CO2 fluid density
and homogenization temperatures range from 270 to490 �C for EQV and MQV inclusions; Table 2) at
pressures of �125–185 MPa (Fig. 8). The estimatedpressures correspond to minimum depths of �5.0–7.4km, assuming a purely lithostatic pressure regime.
4.9. P–T conditions during quartz vein stages
The best estimates for mineralization temperatures
are derived from fluid inclusion homogenization tem-
peratures. Since there is evidence that H2O–CO2 phase
separation accompanied mineralization, trapping is
thought to have occurred along an immiscibility surfacein the H2O–CO2-dissolved salt system. Hence, homo-
genization temperatures (Fig. 6F) are equal to trapping
temperatures, with some perturbations associted with
the formation of mixed inclusions with intermediate
compositions and cooling. Knowing the bulk composi-
tion of the parent fluid, the conditions of fluid entrap-
ment during the mineralized stages at the Atud gold
mine can be estimated. The highest possible P–T con-ditions during mineralization are defined by the iso-
chores for CO2-rich inclusions in quartz intimately
associated with the mineralization event (Fig. 8). Iso-
chores for liquid-H2O, liquid-CO2 and liquid-H2Oþliquid-CO2 inclusions in mineralized quartz veins were
calculated based on their densities as well as the known
volumetric properties of H2O–CO2 system (Bowers
and Helgeson, 1983a,b). They imply homogenizationtemperatures in the range of 490–269 �C with CO2-
densities from 0.80 to 0.89 g/cc (�15 to 76 mol% CO2).Dissolved salt was neglected because it was always <1mol% of the bulk composition (Table 2). These ranges
are bound by the upper thermal limit for the assemblage
arsenopyriteþ pyrite at 491 �C (Kretschmar and Scott,1976), and critical curve for H2Oþ 30 mol% CO2 at 270�C (Grawford, 1981). Hence, if it is assumed that thesefluids were trapped on the solvus for the H2O–CO2system containing <2 mol% NaCl with temperatures of270–490 �C, then the maximum and minimum trapping
358 H.Z. Harraz / Journal of African Earth Sciences 35 (2002) 347–363
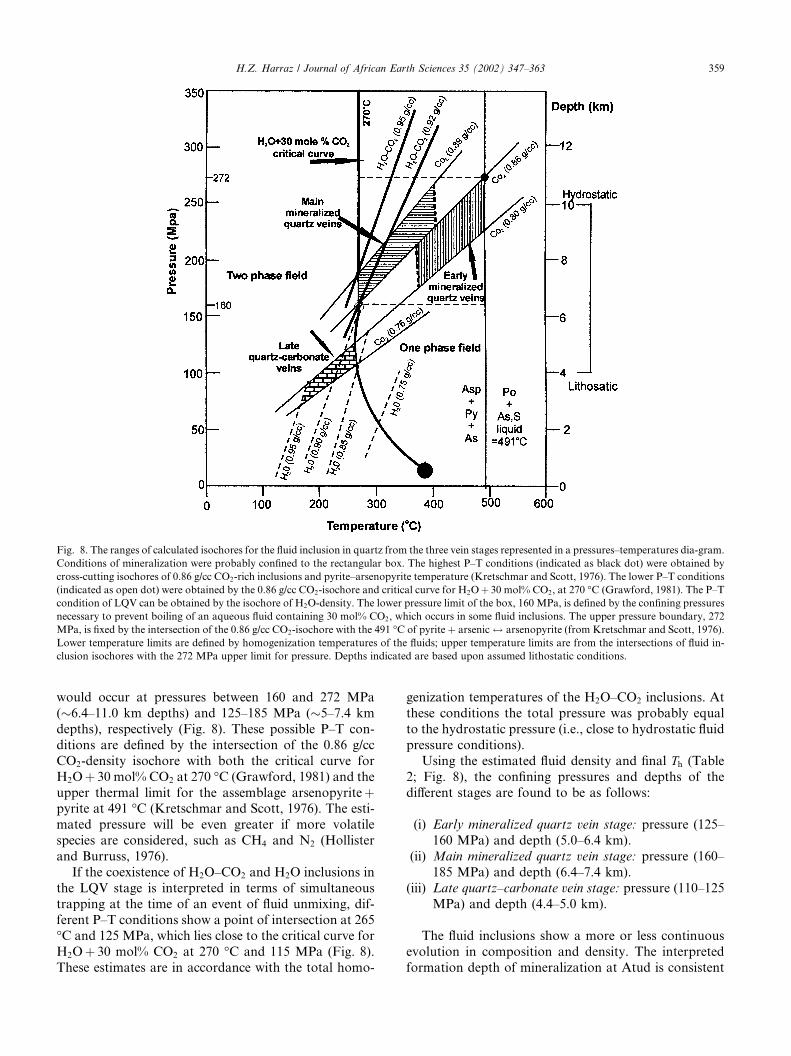
would occur at pressures between 160 and 272 MPa
(�6.4–11.0 km depths) and 125–185 MPa (�5–7.4 kmdepths), respectively (Fig. 8). These possible P–T con-
ditions are defined by the intersection of the 0.86 g/cc
CO2-density isochore with both the critical curve for
H2Oþ 30 mol% CO2 at 270 �C (Grawford, 1981) and theupper thermal limit for the assemblage arsenopyriteþpyrite at 491 �C (Kretschmar and Scott, 1976). The esti-mated pressure will be even greater if more volatile
species are considered, such as CH4 and N2 (Hollister
and Burruss, 1976).
If the coexistence of H2O–CO2 and H2O inclusions in
the LQV stage is interpreted in terms of simultaneous
trapping at the time of an event of fluid unmixing, dif-
ferent P–T conditions show a point of intersection at 265�C and 125 MPa, which lies close to the critical curve forH2Oþ 30 mol% CO2 at 270 �C and 115 MPa (Fig. 8).These estimates are in accordance with the total homo-
genization temperatures of the H2O–CO2 inclusions. At
these conditions the total pressure was probably equal
to the hydrostatic pressure (i.e., close to hydrostatic fluid
pressure conditions).
Using the estimated fluid density and final Th (Table2; Fig. 8), the confining pressures and depths of the
different stages are found to be as follows:
ii(i) Early mineralized quartz vein stage: pressure (125–
160 MPa) and depth (5.0–6.4 km).
i(ii) Main mineralized quartz vein stage: pressure (160–
185 MPa) and depth (6.4–7.4 km).
(iii) Late quartz–carbonate vein stage: pressure (110–125
MPa) and depth (4.4–5.0 km).
The fluid inclusions show a more or less continuous
evolution in composition and density. The interpreted
formation depth of mineralization at Atud is consistent
Fig. 8. The ranges of calculated isochores for the fluid inclusion in quartz from the three vein stages represented in a pressures–temperatures dia-gram.
Conditions of mineralization were probably confined to the rectangular box. The highest P–T conditions (indicated as black dot) were obtained by
cross-cutting isochores of 0.86 g/cc CO2-rich inclusions and pyrite–arsenopyrite temperature (Kretschmar and Scott, 1976). The lower P–T conditions
(indicated as open dot) were obtained by the 0.86 g/cc CO2-isochore and critical curve for H2Oþ 30 mol% CO2, at 270 �C (Grawford, 1981). The P–Tcondition of LQV can be obtained by the isochore of H2O-density. The lower pressure limit of the box, 160 MPa, is defined by the confining pressures
necessary to prevent boiling of an aqueous fluid containing 30 mol% CO2, which occurs in some fluid inclusions. The upper pressure boundary, 272
MPa, is fixed by the intersection of the 0.86 g/cc CO2-isochore with the 491 �C of pyriteþ arsenic$ arsenopyrite (from Kretschmar and Scott, 1976).
Lower temperature limits are defined by homogenization temperatures of the fluids; upper temperature limits are from the intersections of fluid in-
clusion isochores with the 272 MPa upper limit for pressure. Depths indicated are based upon assumed lithostatic conditions.
H.Z. Harraz / Journal of African Earth Sciences 35 (2002) 347–363 359
with the mesozonal class of orogenic Au-deposits (6–12km) proposed by Groves et al. (1998).
5. Discussion
5.1. Nature and origin of ore fluids
The EQV stage has Th CO2 L–V (þ9.6 to þ17.3 �C)markedly higher than the MQV (þ5.6 to þ9.8 �C). Thisanomalous behaviour might be attributed to the pres-
ence of additional gases and/or higher salinities. In addi-tion, the Tm CO2 measurements reveal that the deposition
of the gold was largely affected by wall: rock interaction
as manifested by the inferred occurrence of CH4 in some
samples collected from the graphite materials.
Previous studies of Au deposits limit the fluid source
to three main possibilities: (i) a meteoric/volcanic source
such as epithermal Au deposits, (ii) a hypabyssal mag-
matic source, and (iii) a metamorphic source. Accordingto the geologic setting of the Atud mineralized quartz
veins, the following may be concluded: (i) The large
quartz veins invade dioritic rocks and occasionally ex-
tend into adjacent metagabbroic rocks through a shear
zone. The metagabbro–diorite complex shoulder the
metasediments and serpentinites along a thrust plane
dipping moderately to the north and the west along the
north-eastern boundary of Gabal Atud. The thrustcontains abundant planes of highly sheared talc-car-
bonates, (ii) The country rocks of the Atud mining
district were metamorphosed under low greenschist
fades conditions. Typical mineral assemblages are seri-
cite–quartz–carbonate–chlorite–epidote–graphite–rutile
in the metasediments (Abu El-Ela, 1990; Harraz, 1999),
and (iii) The Au-bearing quartz veins were structurally
controlled by the older faulting system (north-north-west) that formed during the Pan-African tectonic event
and affected the whole of the Eastern Desert, with pos-
sibly a younger tectonic event with a NE trend (El-Gaby
et al., 1988; Meshref, 1990).
During these deformational events, the diorite host
rocks may have acted as preferential sites for fluid flow
and ore precipitation due to their brittle nature during
regional deformation and dilation of the Atud structuralbelts. Many of the mineralized quartz veins occur
in obvious extensionai sites where tension gashes,
laminated crack-seal veins with a ribbon texture and
hydraulic breccias are developed. Moreover, the mic-
rothermometric investigation emphasizes that there
were a continuum of mineralization events. The range of
salinity from 2.8 to 8.2 wt.% NaCl equiv. and Th from269 to 490 �C of the H2O–CO2-rich inclusions (Fig. 6,Table 2), do not support a direct magmatic source of the
ore fluids. It is more likely that the ore-bearing fluids
were of metamorphic origin and obtained their metal
contents from the leaching of country rocks duringwater/rock interactions.
The Atud Au deposits resemble Archaean lode Au
deposits; most of which formed under mesozonal con-
ditions between 300 and 475 �C at 150–300 MPa (Gebre-Mariam et al., 1995; Groves et al., 1998). Like most of
the Archaean Au deposits, the Atud deposit exhibits a
pinch and swell vein texture and evidence of multiple
mineralization events (Sibson et al., 1988). The preferredmodel for the formation of the Atud deposit is a brittle
shear zone in the earth�s crust that formed a hydro-thermal fluid conduit along vein failure surfaces (Sibson,
1990; Cole et al., 2000). The fluid is thought to have
originated through devolatization of the metasediment
and serpentinite–talc-carbonate rocks at depth and mi-
grated upward through the structural conduit during
dilation of the Atud structural belts. Hence, the dioritesmay have acted as preferential sites for fluid flow and
ore precipitation due to their brittle nature during re-
gional deformation (Yao et al., 1999). Therefore, the
source of H2O–CO2-rich fluids could be the metasedi-
ment-serpentinite rocks at depth mixed with meteoric
fluids existing at shallow crustal levels during uplift
processes. Fluid pressure drop post-dating fracture
failure at the end of the EQV stage could contribute toAu precipitation. A drop in fluid pressure is likely to
induce fluid immiscibility in a complex H2O–CO2–NaCl
fluid which further aids precipitation of the vein min-
erals (Drammond and Ohmoto, 1985; Spooner et al.,
1987). Immiscibility in an ore fluid can also result from
pressure release during tensional fracturing, decreasing
hydrostatic pressure during ascent, and decrease in
temperature.
5.2. Transport and deposition of gold
Gold deposition in the Atud area was related to fluidphase separation, sulphidization and carbonatization of
host dioritic rocks during hydrothermal alteration and
mineralization. During phase separation, volatile species
selectively partition into a secondary gas phase accord-
ing to their gas/liquid partition coefficients (H2 >CH4 > CO2 > H2S > SO2).Thiswouldaffect the residualore fluid by-causing rapid oxidations, loss of metal-
complexing ligands (mainly HS), decrease in tempera-ture, and pH fluctuations (Drammond and Ohmoto,
1985; Spooner et al., 1987). Hence, the solubility of
metals in the residual ore fluids would readily decrease
by several orders of magnitude, causing precipitation of
sulphide and gold (Drammond and Ohmoto, 1985;
Spooner et al., 1987; Seward, 1989). Iron for sulphide
minerals in the Atud ores was derived from dissolution
of Fe-bearing carbonates, wall rock Fe oxides andsilicates (Seward, 1984). Au is thought to initially have
deposited in solid solution and as inclusions in pyrite,
arsenopyrite and base metal sulphides (c.f. Mumin et al.,
360 H.Z. Harraz / Journal of African Earth Sciences 35 (2002) 347–363
1994). The formation of sulphides played a significantrole in concentrating the gold, a common feature of Au-
bearing systems (Phillips and Groves, 1983).
Fluid inclusion studies of gold mineralization indicate
that ore fluids containing CO2-rich and H2O-rich im-
miscible phases play an integral part in Au deposition in
many mesothermal vein systems (Goldfarb et al., 1989).
In light of the experimental system of the H2O–CO2–
NaCl (Bowers and Helgeson, 1983a,b), the data of thepresent study indicate that the two volatile species re-
mained unmixed at 125 MPa at temperatures above 270
�C and salinities <2 mol% NaCl when the CO2 exceed15 mol% (Naden and Shepherd, 1989). Because of the
relatively high solubility of CO2 at elevated tempera-
tures (270–490 �C) and pressures (125–185 MPa), theextent of this reaction required much greater immisci-
bility in the Atud Au-deposit. Rapid CO2–H2O phaseseparation occurred episodically throughout the evolu-
tion of the hydrothermal system.
The conditions of deposition at the Atud gold deposit
are comparable with many other mesothermal vein
systems quoted in the literature (Groves and Foster,
1993; Nesbitt, 1993; Groves et al., 1998; Yao et al.,
1999). The loss of CO2 and other volatiles from the fluid
phase during phase separation and/or boiling will causean increase of the pH, lower the fO2, decrease the activityof the bisulphide complex (Drammond and Ohmoto,
1985; Seward, 1984). At the same time total S is de-
creasing due to volatilization of H2S and precipitation of
sulphides. The loss of total S from the fluid can cause
Au-saturation and precipitation. These would effectively
destabilize the gold bisulphide complex and lead to de-
position of sulphides and gold as well as the silicate andcarbonate gangue at relatively high crystal levels and
low ambient pressure and temperature.
6. Conclusions
The Atud gold deposit formed in at least two suc-
cessive stages. The early one started with the formation
of coarse grained pyrite with pyrrhotite and arsenopy-
rite from H2O–CO2-rich solutions (27–57 mol% CO2and densities 0.80–0.86 g/cc), with low salinity (5.7 wt.%
equiv.) and high temperature (an average homogeniza-tion temperature of �415 �C). This was followed by themain stage after fracturing the Au-bearing quartz veins
and precipitating an assemblage of fine grained sphale-
rite–arsenopyrite–pyrite–galenaþ chalcopyrite. The lat-ter formed from mineralizing solutions characterized by
H2O–CO2-rich fluids (15–76 mol% CO2), high CO2density (0.86–0.89 g/cc), low salinity (3.9 wt.% equiv.)
and moderate temperature (an average homogenizationtemperature of �310 �C).Gold deposition occurred at temperature above 270
�C and pressures of at least 125 MPa (>5 km depths),
and is largely related to fluid-wall rock interaction. Goldwas repeatedly deposited during these two mineraliza-
tion stages, being more enriched in the early time of the
main mineralization stage. This may explain why gold is
mainly detected along microfractures of pyrite and ar-
senopyrite as well as along partially healed fractures that
were formed later than pyrite precipitation.
Dissolution and transportation of the Au might have
been achieved through complexing a bisulphide, whichis comparable with many mesozonal lode-gold deposits
all over the world. Gold deposition in the Atud area was
related to fluid phase separation, sulphidization and
carbonatization of the host dioritic rocks during hy-
drothermal alteration and mineralization. The diorites
are considered to have acted as preferential sites for
fluid flow and ore precipitation due to their brittle na-
ture during regional deformation. The loss of CO2 andother volatiles from the fluid phase during phase sepa-
ration will cause an increase of the pH, lower the fO2,decrease the activity of the bisulphide complex. At the
same time total S is decreasing due to volatilization of
H2S and precipitation of sulphides. The loss of total S
from the fluid can cause Au-saturation and precipita-
tion. These would effectively destabilize the gold bisul-
phide complex and lead to deposition of sulphides andgold as well as the silicate and carbonate gangue at
relatively high crystal levels and low ambient pressure
and temperature.
Acknowledgements
The author is grateful to Dr. M.F. El-Sharkawy(Tanta University) who arranged for the microprobe
analyses at the Camborne School of Mines, Exeter
University, UK. W. Pohl and A.M. Mumin AES re-
viewers are thanked for their constructive comments on
the initial manuscript.
References
Abu El-Ela, F.F., 1990. Do the Atud conglomerates belong to the
island arc metasediments? Bulletin Faculty Science, Assiut Univer-
sity 19(1-F), pp. 123–155.
Akaad, M.K., Essawy, M.A., 1964. Geology and structure of the area
east of Gabal Atud, Eastern Desert of Egypt. Bulletin Sciences
Technical, Assiut University 7, pp. 63–82.
Arslan, A.I., Harraz, H.Z., 2001. Trace element contents in pyrite and
their exploration significances, Atud Gold Mine, Eastern Desert,
Egypt. The Fifth International Geochemistry, Alexandria Univer-
sity vol. 1, pp. 303–332.
Awad, N.T., Fasfous, B.R., 1981. Petrography of Atud gold-bearing
quartz veins and associated rocks. Bulletin Nuclear Research
Central Egypt 6, 628–640.
Barton Jr., P.B., Skinner, B.J., 1979. Sulphide mineral stabilities. In:
Barnes, H.L. (Ed.), Geochemistry of hydrothermal ore deposits.
Wiley, New York, pp. 278–403.
H.Z. Harraz / Journal of African Earth Sciences 35 (2002) 347–363 361
Bottrell, S.H., Shepherd, J.J., Yardley, B.W.D., Dubessy, J., 1988. A
fluid inclusion model for the genesis of the ores of the Dolgellau
Gold Belt, North Wales. Journal Geologic Society London 145,
139–145.
Bowers, T.S., 1991. The deposition of gold and other metals: pressure-
induced fluid immiscibility and associated stable isotope signatures.
Geochimica Cosmochimica Acta 55, 2427–2434.
Bowers, T.S., Helgeson, H.C., 1983a. Calculation of thermodynamic
and geochemical consequences of nonideal mixing in the system
H2O–CO2–NaCl on phase relations in geologic systems: equation
of state for H2O–CO2–NaCl fluids at high pressures and temper-
atures. Geochimica Cosmochimica Acta 47, 1247–1275.
Bowers, T.S., Helgeson, H.C., 1983b. Calculation of the thermody-
namic and geochemical consequences of nonideal mixing in the
system H2O–CO2–NaCl on phase relations in geologic systems:
Metamorphic equilibria at high pressures and temperatures.
American Mineralogist 68, 1059–1075.
Burruss, R.C., 1981. Analysis of phase equilibria in C–O–H–S fluid
inclusions. In: Hollister, L.S., Crawford, M.L. (Eds.), Short Course
in Fluid Inclusions. In: Mineralogical Association Canada Short
Course Handbook, vol. 6, pp. 39–74.
Cole, A., Wilkinson, J.J., Halls, C., Serenko, T.J., 2000. Geological
characteristics, tectonic setting and preliminary interpretations of
the Jilau gold–quartz vein deposit, Tajikistan. Mineralium Depo-
sita 35, 600–618.
Collins, P.L.F., 1979. Gas hydrates in CO2-bearing fluid inclusions and
the use of freezing data for estimation of salinity. Economic
Geology 74, 1435–1444.
Drammond, S.E., Ohmoto, H., 1985. Chemical evolution and mineral
deposition in boiling hydrothermal systems. Economic Geology 80,
126–147.
El-Gaby, S., List, F.K., Tehrani, R., 1988. Geology, evolution and
metallogenesis of the Pan-African Belt in Egypt. In: El-Gaby, S.,
Greiling, R.O. (Eds.), The Pan-African Belt of northeast Africa
and adjacent areas. Friedrich Vieweg und Sohn, Braunschweig/
Wiesbaden, pp. 17–68.
Gabra, S.Z., 1986. Gold in Egypt. A commodity package: minerals,
petroleum and groundwater assessment program. USAID project.
363-0105, Cairo, Egypt. Geological Survey Egypt, 86p.
Gebre-Mariam, M., Hagemann, S.G., Groves, D.I., 1995. A classifi-
cation scheme for epigenetic Archaean lode-gold deposits. Mine-
ralium Deposita 30, 408–410.
Goldfarb, R.J., Leach, D.L., Rose, S.C., Landis, G.P., 1989. Fluid
inclusion geochemistry of gold-bearing quartz veins of the Juneau
Gold Belt, Southeastern Alaska: implications for ore genesis. In:
Keays, R.R., Ramsay, W.R., Groves, D.I. (Eds.), The Geology of
Gold Deposits: The Perspective in 1988. In: Economic Geology
Monograph, vol. 6, pp. 363–375.
Grawford, M.L., 1981. Phase equilibria in aqueous fluid inclusions. In:
Hollister, L.S., Crawford, M.L. (Eds.), Short Course in Fluid
Inclusions. In: Mineralogical Association Canada Short Course
Handbook, vol. 6, pp. 75–100.
Groves, D.I., Foster, R.P., 1993. In: Foster, R.P. (Ed.), Gold Metal-
logeny and Exploration. Chapman and Hall, London, pp. 63–103.
Groves, D.I., Goldfarb, R.J., Gebre-Mariam, M., Hagemann, S.G.,
Robert, F., 1998. Orogenic gold deposits: a proposed classification
in the context of the crystal distribution and relationship to other
gold deposit types. Ore Geologic Review 13, 7–27.
Harraz, H.Z., 1999. Wall rock alteration, Atud gold mine, Eastern
Desert, Egypt: processes and P–T-XCO2 conditions of metasoma-tism. Journal African Earth Sciences 20, 527–551.
Harraz, H.Z., El-Dahhar, M.A., 1993. Nature and composition of
gold-forming fluids at Umm Rus area, Eastern Desert, Egypt:
evidence from fluid inclusions in vein materials. Journal African
Earth Sciences 16, 341–353.
Harraz, H.Z., El-Makky, A.M., 1999a. Application of zoning of ore-
associated elements to exploration for auriferous quartz vein
deposits: a case study of Atud mine, Eastern Desert, Egypt. In: The
Fourth International Conference on Geochemistry, Alexandria
University, vol. I, pp. 189–206.
Harraz, H.Z., El-Makky, A.M., 1999b. Primary dispersion aureoles
around auriferous quartz veins, Atud gold mine, Central Eastern
Desert, Egypt. In: The Fourth International Conference on
Geochemistry, Alexandria University, vol. I, pp. 207–223.
Hedenquist, J.W., Henley, R.W., 1985. The importance of CO2 on
freezing point measurements of fluid inclusions: evidence from
active geothermal systems and implications for epithermal ore
depositions. Economic Geology 80, 1379–1406.
Heyen, G., Ramboz, C., Dubessy, J., 1982. Modelling of phase
equilibria in the system CO2–CH4 below 50 �C and 100 bar.
Application to inclusion fluids (in French). Comptes Rendus
Academy of Science, Paris 294, 203–206.
Hilmy, M.E., Osman, A., 1989. Remobilization of gold from a
chalcopyrite-pyrite mineralization Hamash gold mine, South-
eastern Desert, Egypt. Mineralium Deposita 24, 244–249.
Ho, S.E., Groves, D.I., Phillips, G.N., 1985. Fluid inclusions as
indicators of the nature and source of ore fluids and ore
depositional conditions for Archaean gold deposits of the Yilgarn
Lock, Western Australia. Transactions Geological Society South
Africa 88, 149–158.
Hollister, L.S., Burruss, R.C., 1976. Phase equilibria in fluid inclusions
from the Khtada Lake metamorphic complex. Geochimica Cos-
mochimica Acta 40, 163–175.
Hussein, A.A.A., 1990. Mineral deposits. In: Said, R. (Ed.), The Geol-
ogy of Egypt. A.A Balkema, Rotterdam/Brookfield, pp. 511–566.
Kretschmar, U., Scott, S.D., 1976. Phase relations involving arseno-
pyrite in the system Fe–As–S and their application. Canadian
Mineralogist 14, 364–386.
Meshref, W.M., 1990. Tectonic framework. In: Said, R. (Ed.), The
Geology of Egypt. A.A. Balkema, Rotterdam/Brookfield, pp. 113–
155.
Mumin, A.H., Fleet, M.E., Chryssoulis, S.L., 1994. Gold mineraliza-
tion in As-rich mesothermal gold ores of Bogosu-Prestea mining
district of the Ashanti Gold Belt, Ghana: remobilization of
‘‘invisible’’ gold. Mineralium Deposita 29, 445–460.
Mumin, A.H., Fleet, M.E., Longstaffe, F.J., 1996. Evolution of
hydrothermal fluids in the Ashanti gold belt, Ghana: stable isotope
geochemistry of carbonates, graphite and quartz. Economic
Geology 91, 135–148.
Naden, J., Shepherd, T.J., 1989. Role of methane and carbon dioxide
in gold deposition. Nature 342, 793–795.
Nakhla, F.M., Dardir, A.A., Saleh, S.A., Gad, N.L., 1993. Petrogra-
phy and economic appraisal of the gold mineralization in Atud
mine, Eastern desert, Egypt. Egyptian Mineralogist 5, 31–40.
Nesbitt, B.E., 1993. Phanerozoic gold deposits in tectonically active
continental margins. In: Foster, R.P. (Ed.), Gold metallogeny and
exploration. Chapman & Hall, London, pp. 104–132.
Phillips, W.J., 1972. Hydraulic fracturing and mineralization. Journal
Geologic Society London 128, 337–359.
Phillips, G.N., Groves, D.I., 1983. The nature of Archaean gold-
bearing fluids as deduced from gold deposits of Western Australia.
Geologic Society Australia Journal 30, 25–40.
Pohl, W., 1988. Precambrian metallogeny of Northeast-Africa. In: El-
Gaby, S., Greiling, R.O. (Eds.), The Pan-African Belt of northeast
Africa and adjacent areas. Friedrich Vieweg und Sohn, Braun-
schweig/Wiesbaden, pp. 319–341.
Ramboz, C., Pichavant, M., Weisbrod, A., 1982. Fluid immiscibility in
natural processes: use and misuse of fluid inclusion data. Chemical
Geology 37, 29–48.
Read, J.J., Meinert, L.D., 1986. Gold-bearing quartz vein mineraliza-
tion at the Big Hurrah Mine, Seward Peninsula, Alaska. Economic
Geology 81, 1760–1774.
Roedder, E., 1963. Studies of fluid inclusions II: freezing data and their
interpretation. Economic Geology 58, 167–211.
362 H.Z. Harraz / Journal of African Earth Sciences 35 (2002) 347–363
Roedder, E., 1984. Fluid inclusions. Reviews Mineralogy 12, 1–644.
Roedder, E., Bodnar, R.J., 1980. Geologic pressure determinations
from fluid inclusion studies, ann. Review on Earth Planetary
Science 8, 263–301.
Sabet, A.M., Bondonosov, V.P., 1984. The gold ore formations in the
EasternDesert of Egypt. AnnalsGeological Survey Egypt 14, 35–42.
Seward, T.M., 1984. The transport and deposition of gold in
hydrothermal systems. In: Foster, R.P. (Ed.), Gold�82. GeologicSociety Zimbabwe. Special Publisher, A.A. Balkema, Rotterdam,
pp. 165–182.
Seward, T.M., 1989. The hydrothermal chemistry of gold and its
implications for ore formation: boiling and conductive cooling as
examples. In: Keays, R.R., Ramsay, W.R., Groves, D.I. (Eds.),
The Geology of Gold Deposits: The Perspective in 1988. In:
Economic Geology Monograph, vol. 6, pp. 398–404.
Shepherd, T.J., Rankin, A.M., Alderton, D.H.M., 1985. A practical
guide to fluid inclusion studies. Blackie, London.
Sibson, R.H., 1990. aulting and fluid flow. In: Nesbitt, D.E. (Ed.),
Fluids in Tectonically Active Regimes of the Continental Crust. In:
Mineralogical Association Canada Short Course Handbook,
vol. 18, pp. 91–132.
Sibson, R.H., Robert, F., Poulsen, K.H., 1988. High angle reverse
faults, fluid pressure cycling and mesothermal gold deposits.
Geology 16, 551–555.
So, C.S., Yun, S.T., Shelton, K.L., 1995. Mesothermal gold vein
mineralization of the Samdong mine, Youngdong mining
district, Republic of Korea. Mineralium Deposita 30, 384–
396.
Spooner, E.T.C., Bray, C.J., Wood, P.C., Burrows, D.R., Callan, N.J.,
1987. Au–quartz vein and Cu–Au–Ag–Mo-anhydrite mineraliza-
tion, Hollinger–Mclntyre mine, Timmins, Ontario: d13C values
(Mclntyre), fluid inclusion gas geochemistry, pressure (depth)
estimation, and H2O–CO2 phase separation as a precipitation
and dilation mechanism. Ontario Geologic Survey Miscellaneous
Paper vol. 136, pp. 35–56.
Swanenberg, H.E.C., 1980. Fluid inclusions in high-grade metamor-
phic rocks from southwest Norway. University Utrecht, Geologic
Ultrecht vol. 25, 147p.
Takla, M.A., El-Dougdoug, A.A., Rasmy, A.H., Gad, M.A.,
El-Tabbal, H.K., 1990. Origin of Umm El-Eiga gold mineral-
ization, south Eastern Desert, Egypt. Egyptian Mineralogists 2,
3–20.
Yao, Y., Murphy, P.J., Robb, L.J., 1999. Fluid characteristics of
granitoid-hosted gold deposits in the Birimian terrane of
Ghana: a fluid inclusion microthermometric and Raman spec-
troscopy study. University Witwatersrand, Johannesburg, Eco-
nomic Geology Research Unit Information Circular No. 336,
36p.
H.Z. Harraz / Journal of African Earth Sciences 35 (2002) 347–363 363