Embed Size (px)
Citation preview
Flow Stress and Barreling Behavior of Aluminum Alloy
Solid Cylinder during Upset Forging at Elevated
Temperature
Thesis Submitted in Partial Fulfillment
of the Requirements for the Award of
Master of Technology
In
Production Engineering
By
Matruprasad Rout
Roll No: 209ME2203
Department of Mechanical Engineering
National Institute of Technology
Rourkela
2011
Flow Stress and Barreling Behavior of Aluminum Alloy
Solid Cylinder during Upset Forging at Elevated
Temperature
Thesis Submitted in Partial Fulfillment
of the Requirements for the Award of
Master of Technology
In
Production Engineering
By
Matruprasad Rout
Roll No: 209 ME 2203
Under the Guidance of
Prof. S.K. Sahoo
Department of Mechanical Engineering
National Institute of Technology
Rourkela
2011
ACKNOWLEDGEMENT
Successful completion of work will never be one man’s task. It requires
hard work in right direction. There are many who have helped to make my
experience as a student a rewarding one.
In particular, I express my gratitude and deep regards to my thesis guide
Prof. S.K. Sahoo first for his valuable guidance, constant encouragement and kind
cooperation throughout period of work which has been instrumental in the success
of thesis.
I also express my sincere gratitude to Prof. R. K. Sahoo, Head of the
Department, Mechanical Engineering, for providing valuable departmental
facilities.
I would like to give special thanks to Mr. L.N. Patra, PhD Scholar,
Department of Mechanical Engineering, who gave his valuable time and support
for this project work and without which the project might not be completed.
Last but not the least; I wish to express my sincere thanks to all those who
directly or indirectly helped me at various stages of this work.
Matruprasad Rout
Roll No. 209 ME 2203
Dept. of Mechanical Engg.
National Institute Of Technology
Rourkela
CERTIFICATE
This is to certify that the thesis entitled, “Flow Stress and Barreling
Behavior of Aluminum Alloy Solid Cylinder during Upset Forging at Elevated
Temperature” submitted by Shri Matruprasad Rout in partial fulfillment of
requirements for the award of Degree of Master of Technology in Mechanical
Engineering with specialization in “Production Engineering” at National
Institute of Technology, Rourkela, is an authentic work carried out by him under
my guidance and supervision. To the best of my knowledge the matter embodied in
the thesis has not been submitted to any other University or Institute for the award
of any Degree or Diploma.
Date: Dr. S.K Sahoo
Professor
Dept. of Mechanical Engg.
NIT, Rourkela
i
Abstract
Upset forging test at elevated temperature of aluminum alloy were experimentally carried
out at specified temperatures ranging from 30⁰C (room temperature) to 300⁰C and at different
true strain levels under a constant strain rate of 1 X 10⁻³
/s using powdered graphite mixed with
machine oil as lubricant throughout the tests. Calculations were made to radius of curvature of
barrel with the assumption that the curvature of the barrel followed the form of a circular arc.
The radius of curvature of the barreled aluminum cylinders measured physically was found to
confirm closely to the values calculated using the experimental data even at higher temperature.
Generalized characteristic equations for each temperature have been developed by regression
analysis. It was found that both the strength coefficient and strain hardening exponent decreases
with increase in temperature. A common characteristic equation considering both strain and
temperature was also found out. Further, different stresses like hoop stress, hydrostatic stress and
effective stress have been found out for different temperature using the dimensions of the
deformed specimens.
Keywords--Barreling, True Stress, True Strain, High Temperature, Regression Analysis
ii
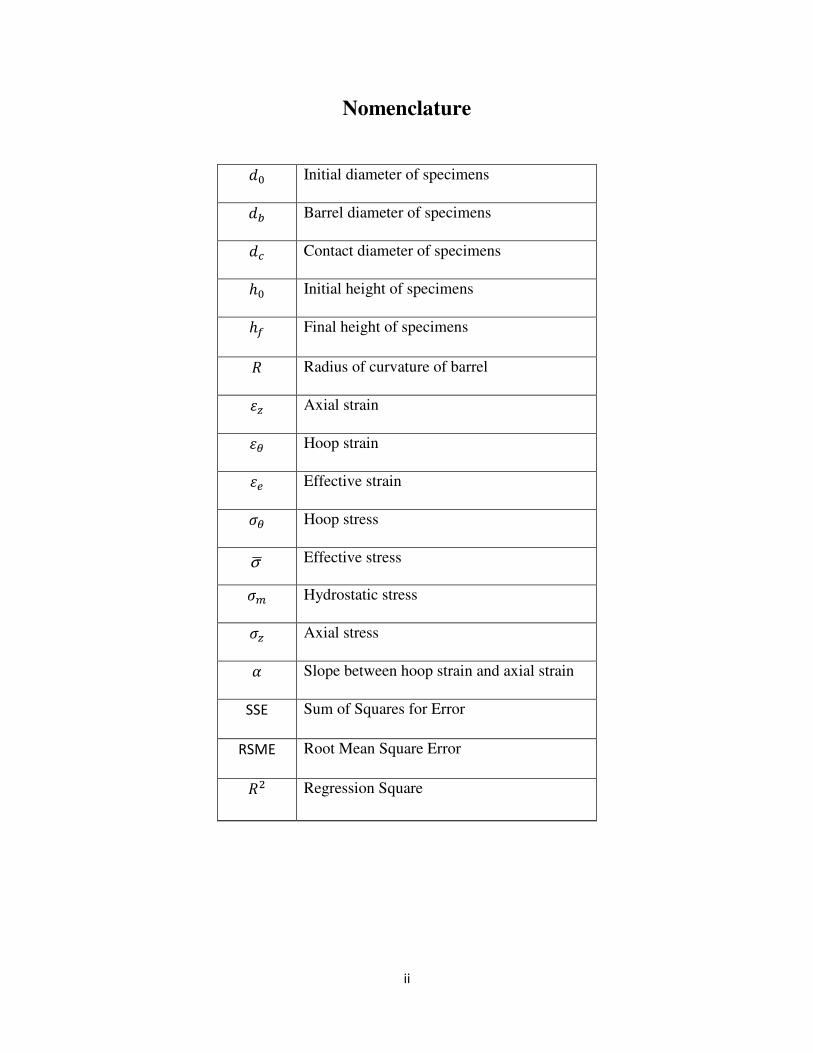
Nomenclature
�� Initial diameter of specimens
�� Barrel diameter of specimens
�� Contact diameter of specimens
�� Initial height of specimens
�� Final height of specimens
� Radius of curvature of barrel
� Axial strain
� Hoop strain
�� Effective strain
� Hoop stress
σ Effective stress
� Hydrostatic stress
� Axial stress
� Slope between hoop strain and axial strain
SSE Sum of Squares for Error
RSME Root Mean Square Error
�� Regression Square
iii
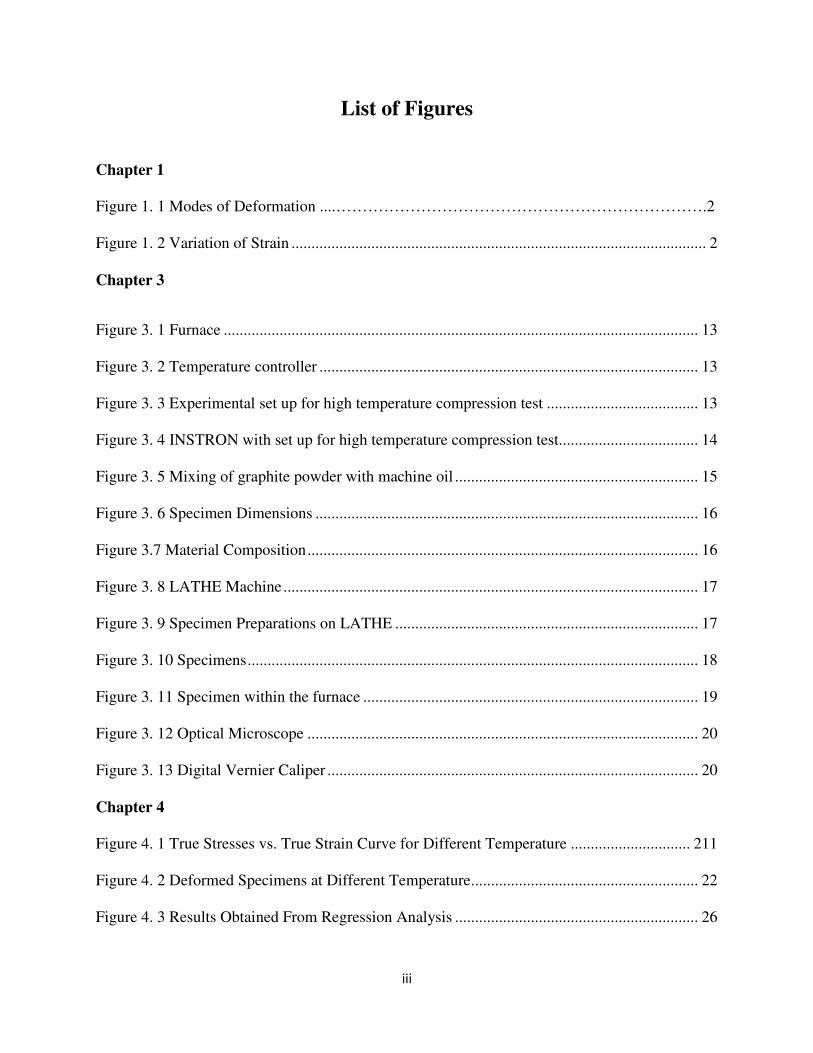
List of Figures
Chapter 1
Figure 1. 1 Modes of Deformation ....…………………………………………………………….2
Figure 1. 2 Variation of Strain ........................................................................................................ 2
Chapter 3
Figure 3. 1 Furnace ....................................................................................................................... 13
Figure 3. 2 Temperature controller ............................................................................................... 13
Figure 3. 3 Experimental set up for high temperature compression test ...................................... 13
Figure 3. 4 INSTRON with set up for high temperature compression test................................... 14
Figure 3. 5 Mixing of graphite powder with machine oil ............................................................. 15
Figure 3. 6 Specimen Dimensions ................................................................................................ 16
Figure 3.7 Material Composition .................................................................................................. 16
Figure 3. 8 LATHE Machine ........................................................................................................ 17
Figure 3. 9 Specimen Preparations on LATHE ............................................................................ 17
Figure 3. 10 Specimens ................................................................................................................. 18
Figure 3. 11 Specimen within the furnace .................................................................................... 19
Figure 3. 12 Optical Microscope .................................................................................................. 20
Figure 3. 13 Digital Vernier Caliper ............................................................................................. 20
Chapter 4
Figure 4. 1 True Stresses vs. True Strain Curve for Different Temperature .............................. 211
Figure 4. 2 Deformed Specimens at Different Temperature ......................................................... 22
Figure 4. 3 Results Obtained From Regression Analysis ............................................................. 26
iv
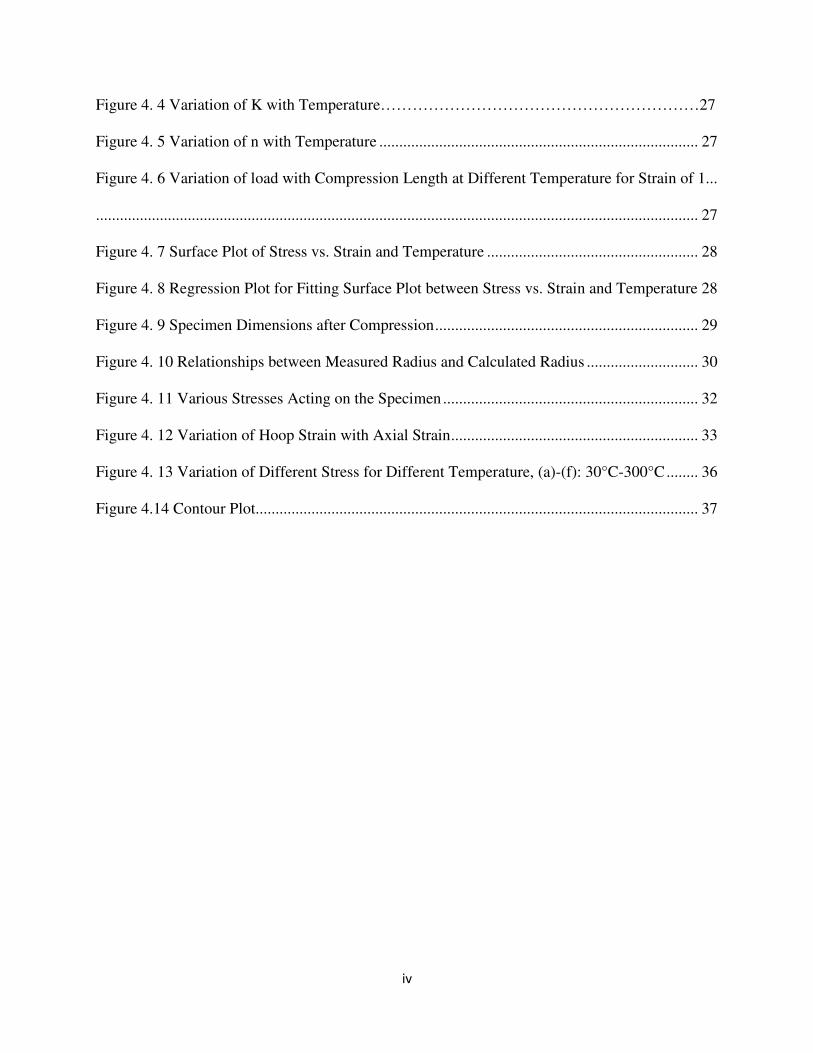
Figure 4. 4 Variation of K with Temperature……………………………………………………27
Figure 4. 5 Variation of n with Temperature ................................................................................ 27
Figure 4. 6 Variation of load with Compression Length at Different Temperature for Strain of 1...
....................................................................................................................................................... 27
Figure 4. 7 Surface Plot of Stress vs. Strain and Temperature ..................................................... 28
Figure 4. 8 Regression Plot for Fitting Surface Plot between Stress vs. Strain and Temperature 28
Figure 4. 9 Specimen Dimensions after Compression .................................................................. 29
Figure 4. 10 Relationships between Measured Radius and Calculated Radius ............................ 30
Figure 4. 11 Various Stresses Acting on the Specimen ................................................................ 32
Figure 4. 12 Variation of Hoop Strain with Axial Strain .............................................................. 33
Figure 4. 13 Variation of Different Stress for Different Temperature, (a)-(f): 30°C-300°C ........ 36
Figure 4.14 Contour Plot............................................................................................................... 37
v
List of Tables
Chapter 2
Table 2. 1 Lubricants used at high temperature by different investigators for different material .. 9
Chapter 3
Table 3. 1 Specifications of INSTRON SATEC KN 600 ............................................................. 10
Table 3. 2 Specifications of Furnace ............................................................................................. 11
Table 3. 3 Hydraulic Power Supply .............................................................................................. 12
Table 3. 4 Composition of the Specimen ...................................................................................... 16
Table 3. 5 Specifications of Optical Microscope .......................................................................... 19
Chapter 4
Table 4. 1 Results of Curve Fitting by Regression ....................................................................... 26
Table 4. 2 Result of Regression for Common Fit ........................................................................ 29
Table 4. 3 Deviation of Calculated Radius from Measured Radius ............................................. 31
Contents
Abstract ........................................................................................................................................... i
Nomenclature ................................................................................................................................ ii
List of Figures ............................................................................................................................... iii
List of Tables ................................................................................................................................. v
Chapter 1
1. Introduction ............................................................................................................................... 1
1.1 Upset Forging ...................................................................................................................................... 1
1.2 Modes of Deformation........................................................................................................................ 2
1.3 Upset Forging at High Temperature ................................................................................................... 3
1.3.1 Effects of Temperature ................................................................................................................ 3
1.3.2 Effects of Rate of Deformation .................................................................................................... 3
1.4 Aluminum alloy: .................................................................................................................................. 4
1.4.1 Alloy designation: ......................................................................................................................... 4
1.4.2 Applications:................................................................................................................................. 4
Chapter 2
2. Literature Reviews .................................................................................................................... 5
2.1 On hot upset forging: .......................................................................................................................... 5
2.2 On cold upset forging: ......................................................................................................................... 8
Chapter 3
3. Experimental Details .............................................................................................................. 10
3.1 Experimental Setup ........................................................................................................................... 10
3.1.1 INSTRON SATEC KN 600 Specifications ...................................................................................... 10
3.1.2 Furnace....................................................................................................................................... 11
3.1.3 Furnace Specifications ............................................................................................................... 11
3.1.4 Hydraulic Power Supply ............................................................................................................. 12
3.2 Graphite as a lubricant: ..................................................................................................................... 14
3.3 Procedure .......................................................................................................................................... 15
3.3.1 Specimen Preparation ................................................................................................................ 16
3.3.2 High temperature compression test in INSTRON ...................................................................... 18
3.4 Specifications of Optical Microscope ................................................................................................ 19
Chapter 4
4. Result and Discussions ............................................................................................................ 21
4.1 Flow Curve ........................................................................................................................................ 21
4.2 Non linear least square regression analysis ...................................................................................... 23
4.3 Radius of Curvature of the Barrel ..................................................................................................... 29
4.4 Determination of Various Stresses ................................................................................................... 32
Chapter 5
5. Conclusions .............................................................................................................................. 38
References .................................................................................................................................... 39

Chapter 1
Introduction
1
1. Introduction
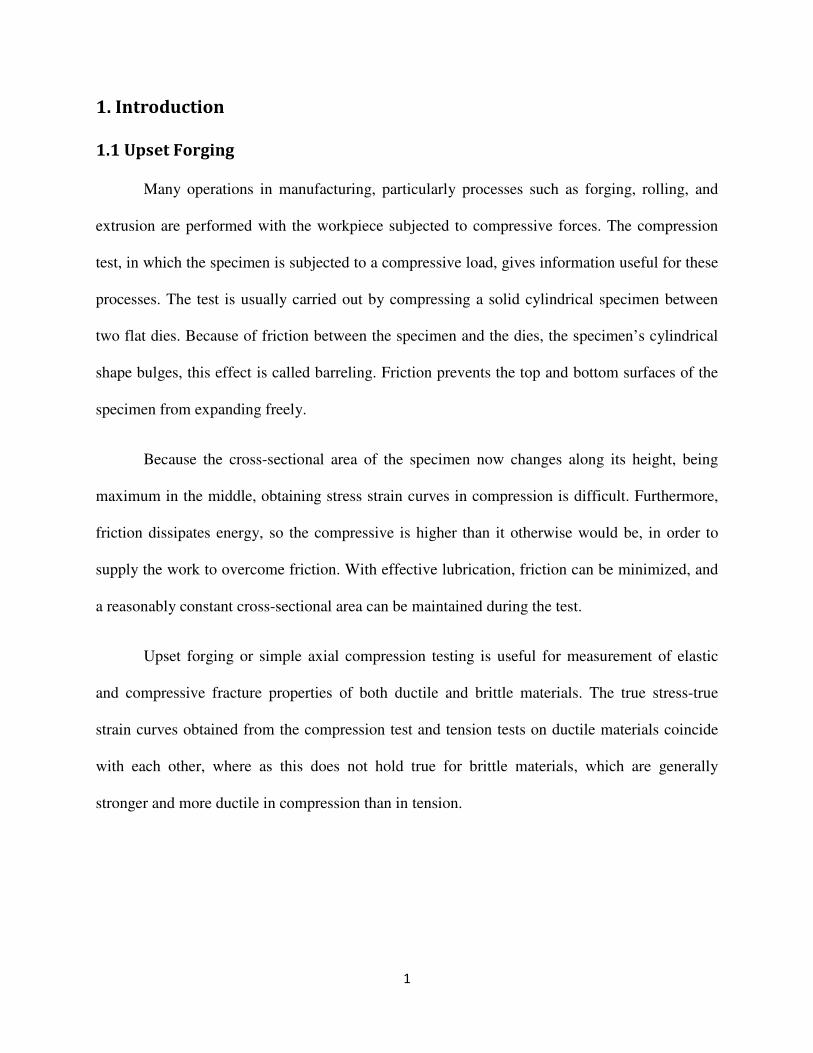
1.1 Upset Forging
Many operations in manufacturing, particularly processes such as forging, rolling, and
extrusion are performed with the workpiece subjected to compressive forces. The compression
test, in which the specimen is subjected to a compressive load, gives information useful for these
processes. The test is usually carried out by compressing a solid cylindrical specimen between
two flat dies. Because of friction between the specimen and the dies, the specimen’s cylindrical
shape bulges, this effect is called barreling. Friction prevents the top and bottom surfaces of the
specimen from expanding freely.
Because the cross-sectional area of the specimen now changes along its height, being
maximum in the middle, obtaining stress strain curves in compression is difficult. Furthermore,
friction dissipates energy, so the compressive is higher than it otherwise would be, in order to
supply the work to overcome friction. With effective lubrication, friction can be minimized, and
a reasonably constant cross-sectional area can be maintained during the test.
Upset forging or simple axial compression testing is useful for measurement of elastic
and compressive fracture properties of both ductile and brittle materials. The true stress-true
strain curves obtained from the compression test and tension tests on ductile materials coincide
with each other, where as this does not hold true for brittle materials, which are generally
stronger and more ductile in compression than in tension.
2
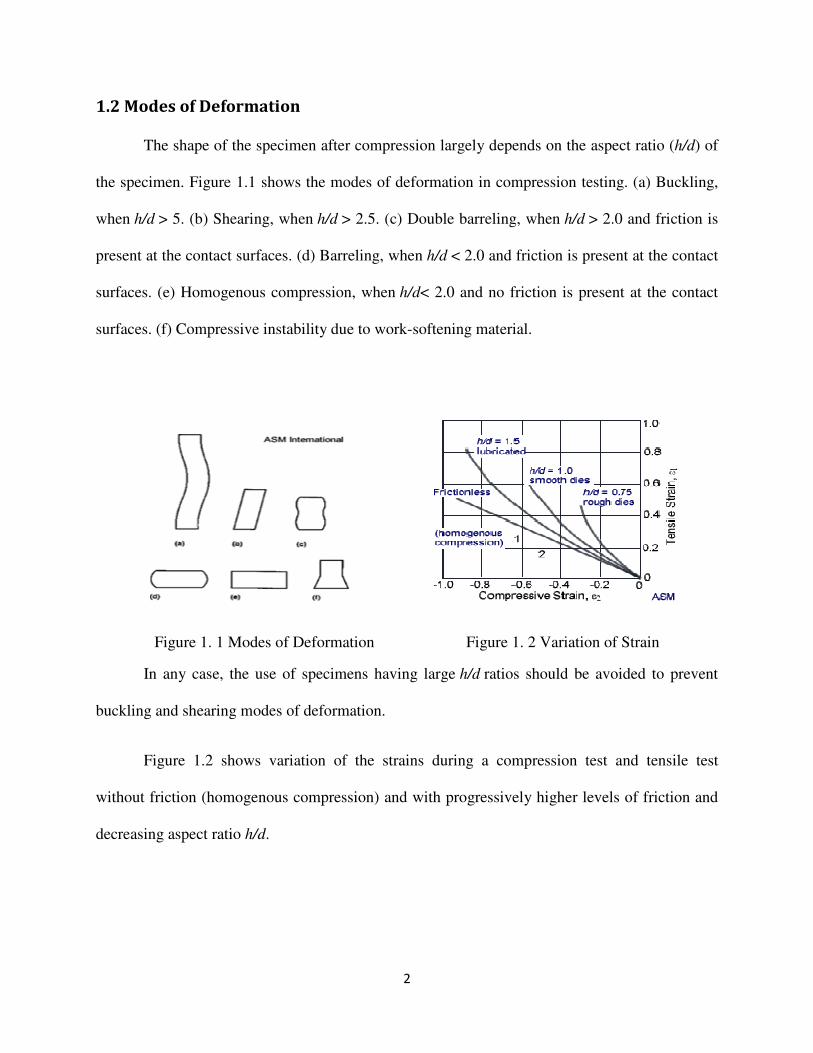
1.2 Modes of Deformation
The shape of the specimen after compression largely depends on the aspect ratio (h/d) of
the specimen. Figure 1.1 shows the modes of deformation in compression testing. (a) Buckling,
when h/d > 5. (b) Shearing, when h/d > 2.5. (c) Double barreling, when h/d > 2.0 and friction is
present at the contact surfaces. (d) Barreling, when h/d < 2.0 and friction is present at the contact
surfaces. (e) Homogenous compression, when h/d< 2.0 and no friction is present at the contact
surfaces. (f) Compressive instability due to work-softening material.
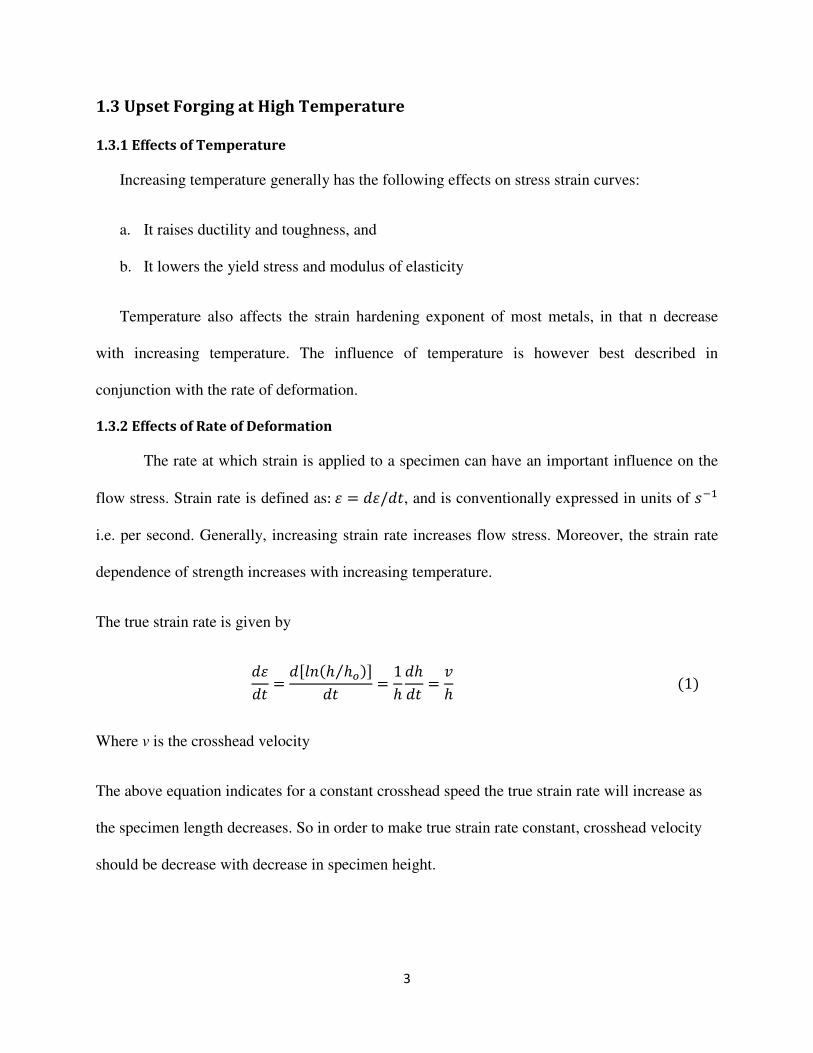
Figure 1. 1 Modes of Deformation Figure 1. 2 Variation of Strain
In any case, the use of specimens having large h/d ratios should be avoided to prevent
buckling and shearing modes of deformation.
Figure 1.2 shows variation of the strains during a compression test and tensile test
without friction (homogenous compression) and with progressively higher levels of friction and
decreasing aspect ratio h/d.
3
1.3 Upset Forging at High Temperature
1.3.1 Effects of Temperature
Increasing temperature generally has the following effects on stress strain curves:
a. It raises ductility and toughness, and
b. It lowers the yield stress and modulus of elasticity
Temperature also affects the strain hardening exponent of most metals, in that n decrease
with increasing temperature. The influence of temperature is however best described in
conjunction with the rate of deformation.
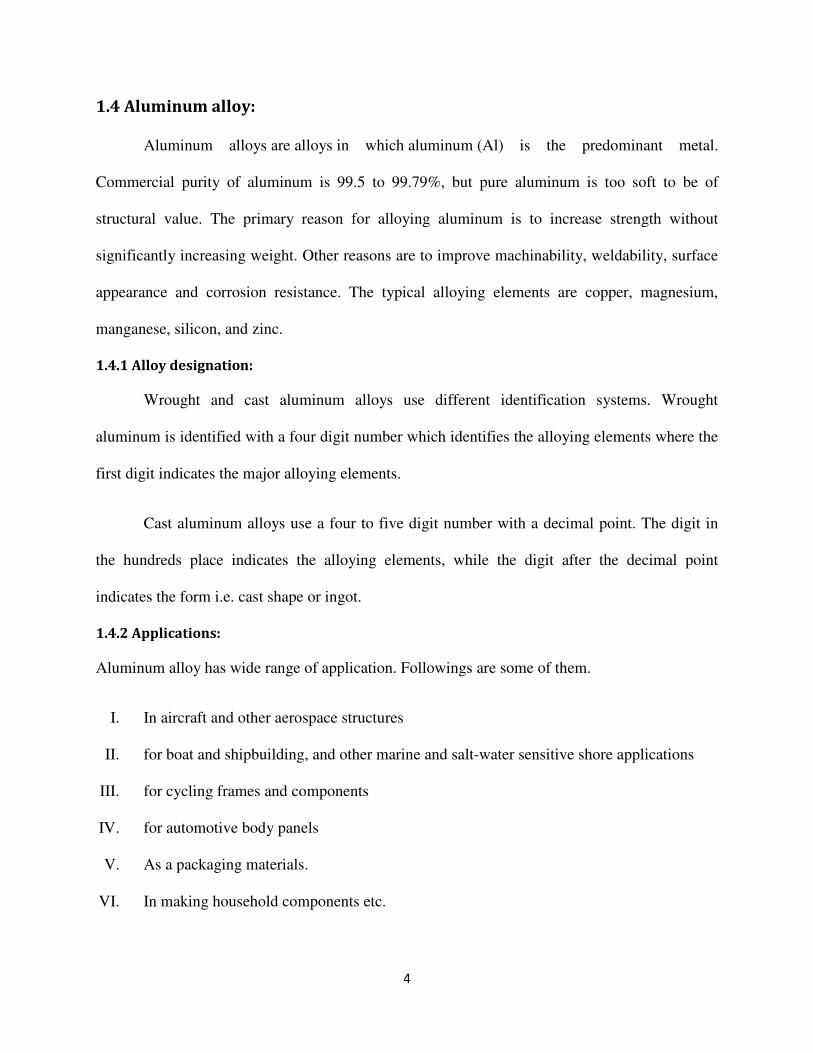
1.3.2 Effects of Rate of Deformation
The rate at which strain is applied to a specimen can have an important influence on the
flow stress. Strain rate is defined as: � � ��/��, and is conventionally expressed in units of ���
i.e. per second. Generally, increasing strain rate increases flow stress. Moreover, the strain rate
dependence of strength increases with increasing temperature.
The true strain rate is given by
���� ������� ��⁄ ��
�� � 1����� �
!� �1�
Where v is the crosshead velocity
The above equation indicates for a constant crosshead speed the true strain rate will increase as
the specimen length decreases. So in order to make true strain rate constant, crosshead velocity
should be decrease with decrease in specimen height.
4
1.4 Aluminum alloy:
Aluminum alloys are alloys in which aluminum (Al) is the predominant metal.
Commercial purity of aluminum is 99.5 to 99.79%, but pure aluminum is too soft to be of
structural value. The primary reason for alloying aluminum is to increase strength without
significantly increasing weight. Other reasons are to improve machinability, weldability, surface
appearance and corrosion resistance. The typical alloying elements are copper, magnesium,
manganese, silicon, and zinc.
1.4.1 Alloy designation:
Wrought and cast aluminum alloys use different identification systems. Wrought
aluminum is identified with a four digit number which identifies the alloying elements where the
first digit indicates the major alloying elements.
Cast aluminum alloys use a four to five digit number with a decimal point. The digit in
the hundreds place indicates the alloying elements, while the digit after the decimal point
indicates the form i.e. cast shape or ingot.
1.4.2 Applications:
Aluminum alloy has wide range of application. Followings are some of them.
I. In aircraft and other aerospace structures
II. for boat and shipbuilding, and other marine and salt-water sensitive shore applications
III. for cycling frames and components
IV. for automotive body panels
V. As a packaging materials.
VI. In making household components etc.

Chapter 2
Literature Reviews
5
2. Literature Reviews
Due to the huge application of metal forming in the field of manufacturing, many
investigators have carried out a series of investigations on upset forging at cold stage as well as
at hot stage of different materials. Many investigators has carried out the experiment at high
temperature by taking temperature and strain rate as main effecting parameters and found out the
flow behavior and microstructure evaluation of material. Some of the investigators have
predicted the flow stress of the material by using some algorithms such as fuzzy logic, neural
network, genetic algorithm etc. Followings are some literature review which is carried out during
this project work.
2.1 On hot upset forging:
� Jin Nengping. et.al. [1], showed that, the peak stress level of 7150 aluminum alloy
decreases with increasing deformation temperature and decreasing strain rate. The
deformed structures exhibit elongated grains with serrations developed in the grain
boundaries Dynamic recovery and recrystalization are the main reasons for the flow
softening at low Z value..
� Poursina. M. et.al. [2], found out that, in hot deformation of stainless steel work
hardening can be neglected and constitutive equation can be taken as a function of strain
rates only. The suggested constitutive equation was also reconfirmed by comparing the
geometrical deformation of the specimens and numerical simulation of the compression
test.
� Zhang Hui et.al. [3], found out that, the true stress strain curves of Al-Mg-Si-Cu
aluminum alloy exhibit a peak stress at a small strain, after which flow stress decrease
monotonically until high strain. The substructure in the deformed specimens consists of

6
very small amount and fine precipitates with equaxied polygonized subgrains in the
elongated grains and developed serrations in the grain boundaries.
� Xiu-yu WEI. et.al. [4], concluded that, the flow stress of 2197 Al-Li alloy decreases with
the increase of deformation temperature and increases with the increase of strain rate. The
peak flow stress during high temperature deformation can be represented by Z parameter
in a hyperbolic sine function.
� Cerri.E. et.al. [5], found out that, the stress–strain curves of AZ91 magnesium alloy can
be explained in terms of microstructure evolution, with emphasis on the eutectic phase
and on dynamic precipitation phenomena occurring at low and high temperature of
deformation.
� Zhu. Su-Ming. et.al. [6], found out that, the Fe-25Al alloy can be deformed without
cracking at temperatures above 873 K. The results show that Ti addition tend to reduce
the strain rate sensitivity and activation energy for flow deformation of Fe-25Al alloy.
� Zhang.X.Y. et.al. [7], showed that, the apparent activation energy for deformation of
TC11 titanium alloy increases with the increasing of deformation temperature gradually,
and decrease with the increasing of strain rate.
� Herrmann. J. et.al. [8], found out that, heat treatments of Fe-Al alloys at temperatures
below 600°C, has no major impact on the deformation behavior. Only heat treatments at
temperatures above 600°C affect the mechanical behavior significantly.
� Talebi Ankari. M. et.al. [9], uses ANN and inverse method to predict the flow stress for
AZ61 Mg- alloy. The predicted results depicted a good agreement with the experimental
data even if the ANN results shown the best predicted capability.
7
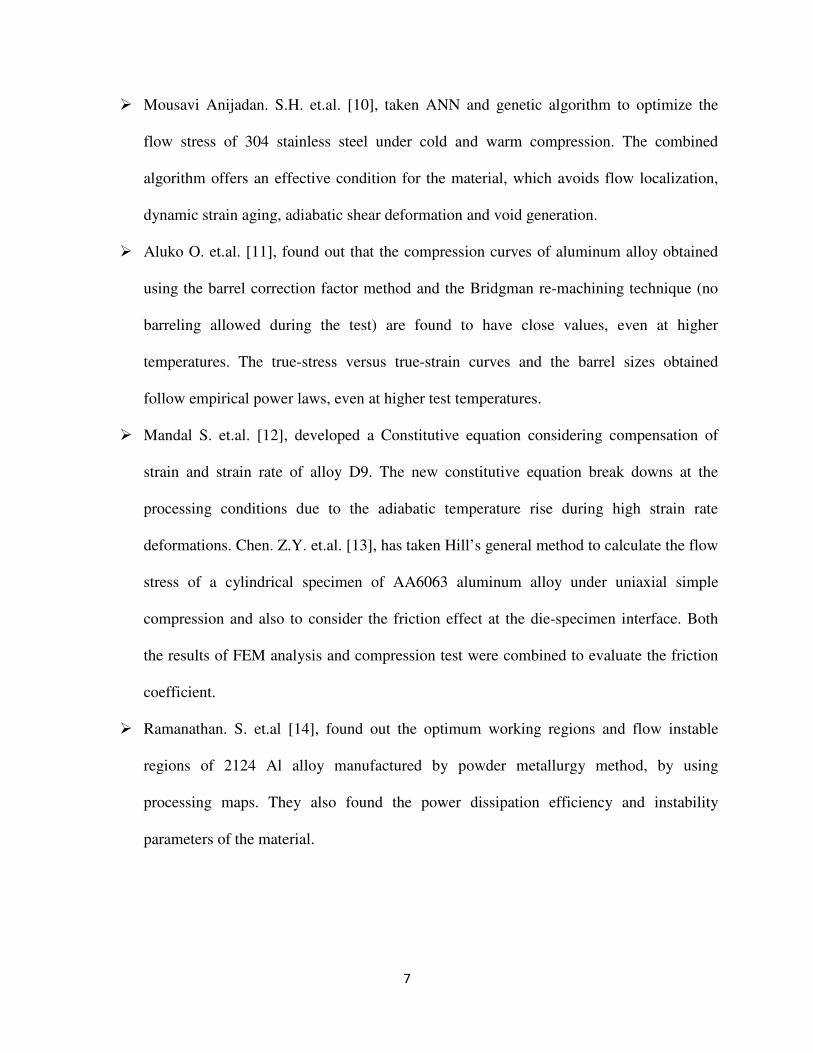
� Mousavi Anijadan. S.H. et.al. [10], taken ANN and genetic algorithm to optimize the
flow stress of 304 stainless steel under cold and warm compression. The combined
algorithm offers an effective condition for the material, which avoids flow localization,
dynamic strain aging, adiabatic shear deformation and void generation.
� Aluko O. et.al. [11], found out that the compression curves of aluminum alloy obtained
using the barrel correction factor method and the Bridgman re-machining technique (no
barreling allowed during the test) are found to have close values, even at higher
temperatures. The true-stress versus true-strain curves and the barrel sizes obtained
follow empirical power laws, even at higher test temperatures.
� Mandal S. et.al. [12], developed a Constitutive equation considering compensation of
strain and strain rate of alloy D9. The new constitutive equation break downs at the
processing conditions due to the adiabatic temperature rise during high strain rate
deformations. Chen. Z.Y. et.al. [13], has taken Hill’s general method to calculate the flow
stress of a cylindrical specimen of AA6063 aluminum alloy under uniaxial simple
compression and also to consider the friction effect at the die-specimen interface. Both
the results of FEM analysis and compression test were combined to evaluate the friction
coefficient.
� Ramanathan. S. et.al [14], found out the optimum working regions and flow instable
regions of 2124 Al alloy manufactured by powder metallurgy method, by using
processing maps. They also found the power dissipation efficiency and instability
parameters of the material.
8
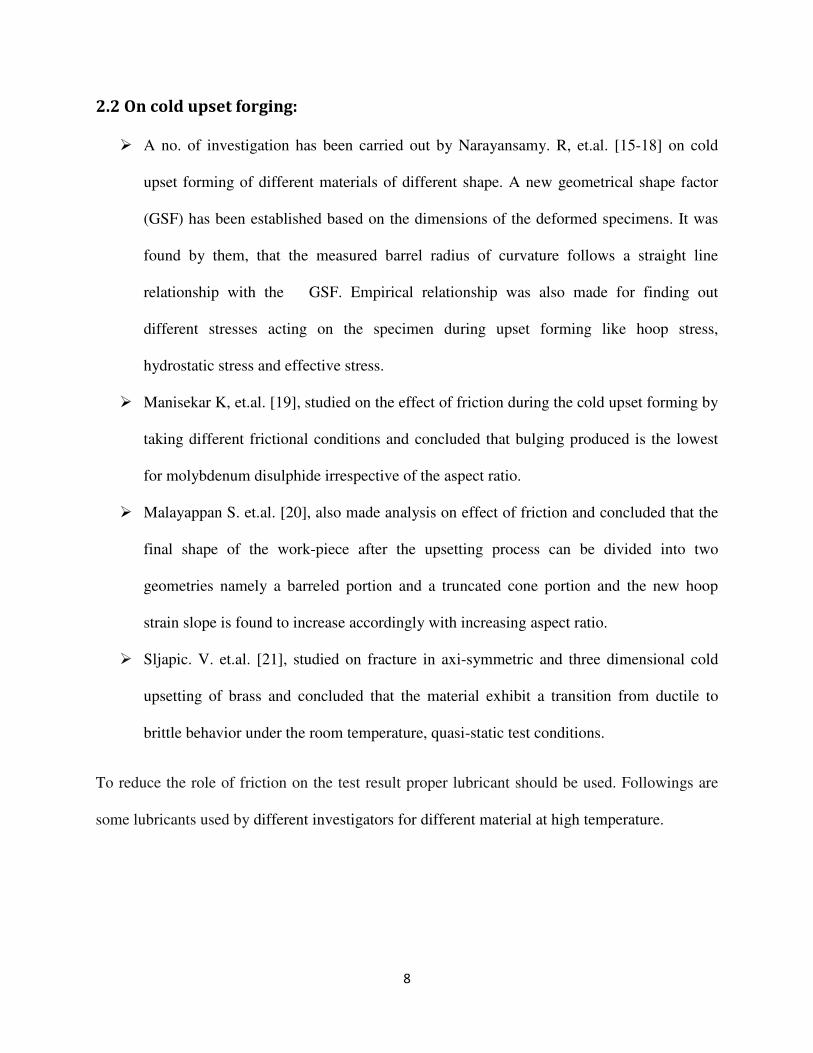
2.2 On cold upset forging:
� A no. of investigation has been carried out by Narayansamy. R, et.al. [15-18] on cold
upset forming of different materials of different shape. A new geometrical shape factor
(GSF) has been established based on the dimensions of the deformed specimens. It was
found by them, that the measured barrel radius of curvature follows a straight line
relationship with the GSF. Empirical relationship was also made for finding out
different stresses acting on the specimen during upset forming like hoop stress,
hydrostatic stress and effective stress.
� Manisekar K, et.al. [19], studied on the effect of friction during the cold upset forming by
taking different frictional conditions and concluded that bulging produced is the lowest
for molybdenum disulphide irrespective of the aspect ratio.
� Malayappan S. et.al. [20], also made analysis on effect of friction and concluded that the
final shape of the work-piece after the upsetting process can be divided into two
geometries namely a barreled portion and a truncated cone portion and the new hoop
strain slope is found to increase accordingly with increasing aspect ratio.
� Sljapic. V. et.al. [21], studied on fracture in axi-symmetric and three dimensional cold
upsetting of brass and concluded that the material exhibit a transition from ductile to
brittle behavior under the room temperature, quasi-static test conditions.
To reduce the role of friction on the test result proper lubricant should be used. Followings are
some lubricants used by different investigators for different material at high temperature.
9
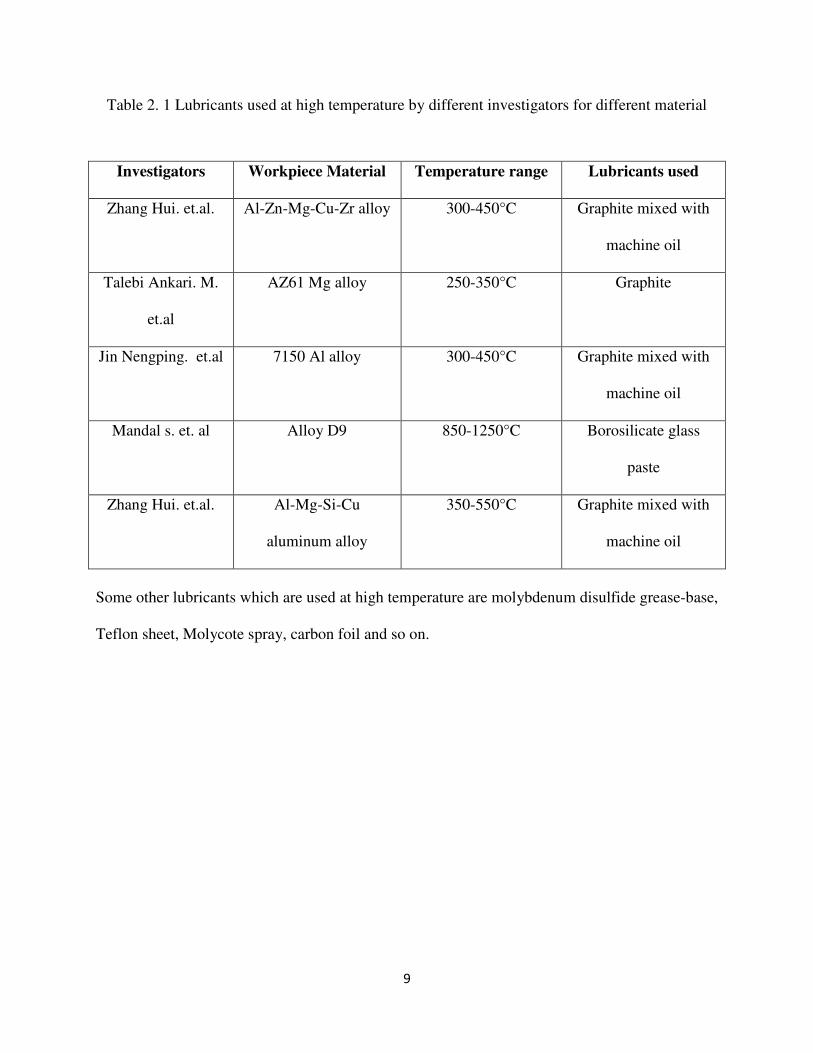
Table 2. 1 Lubricants used at high temperature by different investigators for different material
Investigators Workpiece Material Temperature range Lubricants used
Zhang Hui. et.al. Al-Zn-Mg-Cu-Zr alloy 300-450°C Graphite mixed with
machine oil
Talebi Ankari. M.
et.al
AZ61 Mg alloy 250-350°C Graphite
Jin Nengping. et.al 7150 Al alloy 300-450°C Graphite mixed with
machine oil
Mandal s. et. al Alloy D9 850-1250°C Borosilicate glass
paste
Zhang Hui. et.al. Al-Mg-Si-Cu
aluminum alloy
350-550°C Graphite mixed with
machine oil
Some other lubricants which are used at high temperature are molybdenum disulfide grease-base,
Teflon sheet, Molycote spray, carbon foil and so on.

Chapter 3
Experimental Details
10
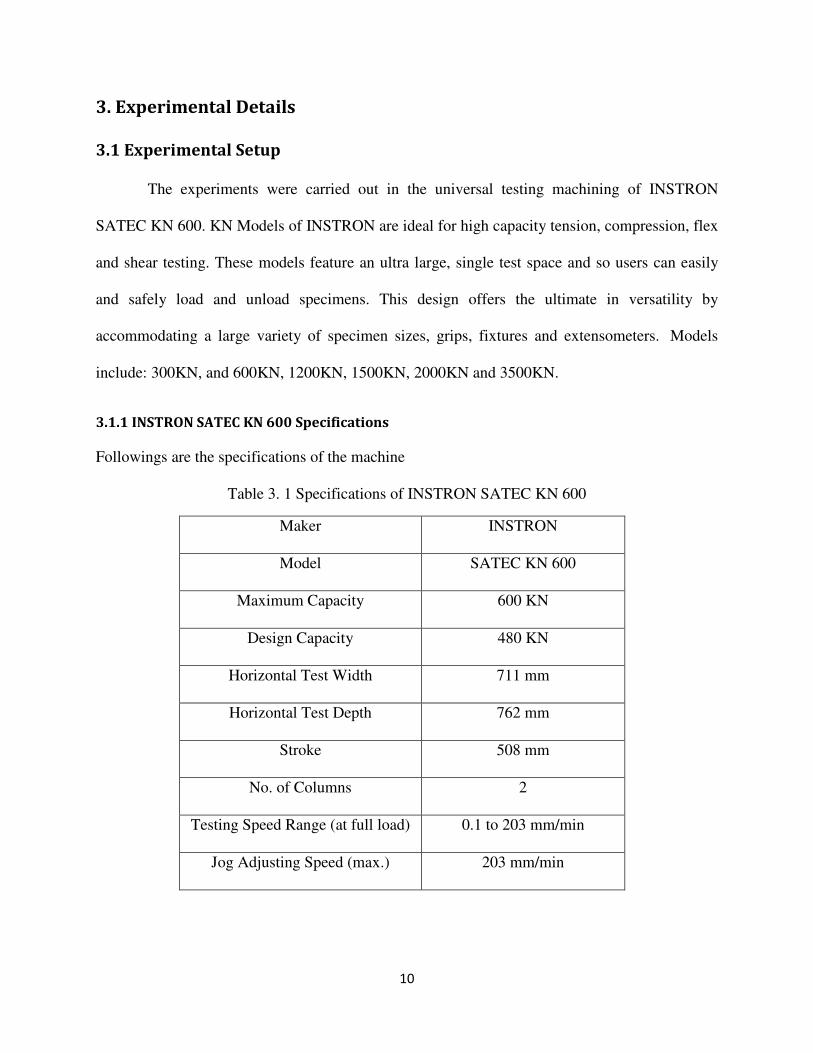
3. Experimental Details
3.1 Experimental Setup
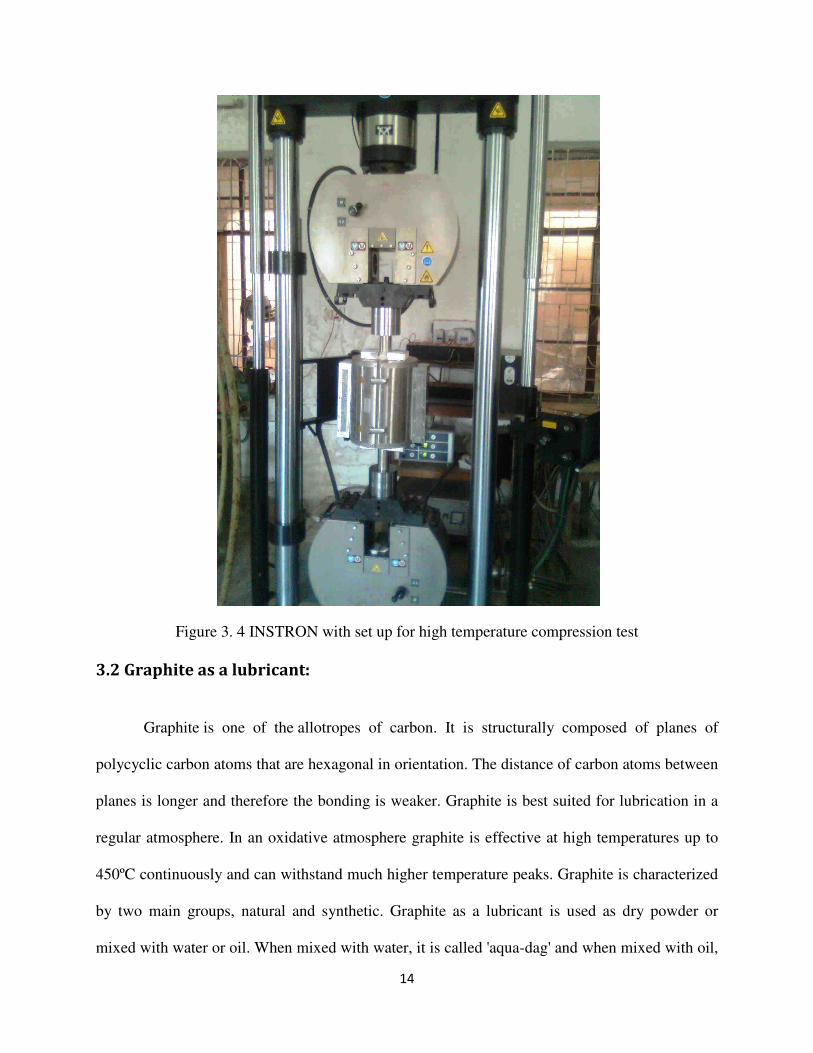
The experiments were carried out in the universal testing machining of INSTRON
SATEC KN 600. KN Models of INSTRON are ideal for high capacity tension, compression, flex
and shear testing. These models feature an ultra large, single test space and so users can easily
and safely load and unload specimens. This design offers the ultimate in versatility by
accommodating a large variety of specimen sizes, grips, fixtures and extensometers. Models
include: 300KN, and 600KN, 1200KN, 1500KN, 2000KN and 3500KN.
3.1.1 INSTRON SATEC KN 600 Specifications
Followings are the specifications of the machine
Table 3. 1 Specifications of INSTRON SATEC KN 600
Maker INSTRON
Model SATEC KN 600
Maximum Capacity 600 KN
Design Capacity 480 KN
Horizontal Test Width 711 mm
Horizontal Test Depth 762 mm
Stroke 508 mm
No. of Columns 2
Testing Speed Range (at full load) 0.1 to 203 mm/min
Jog Adjusting Speed (max.) 203 mm/min
11
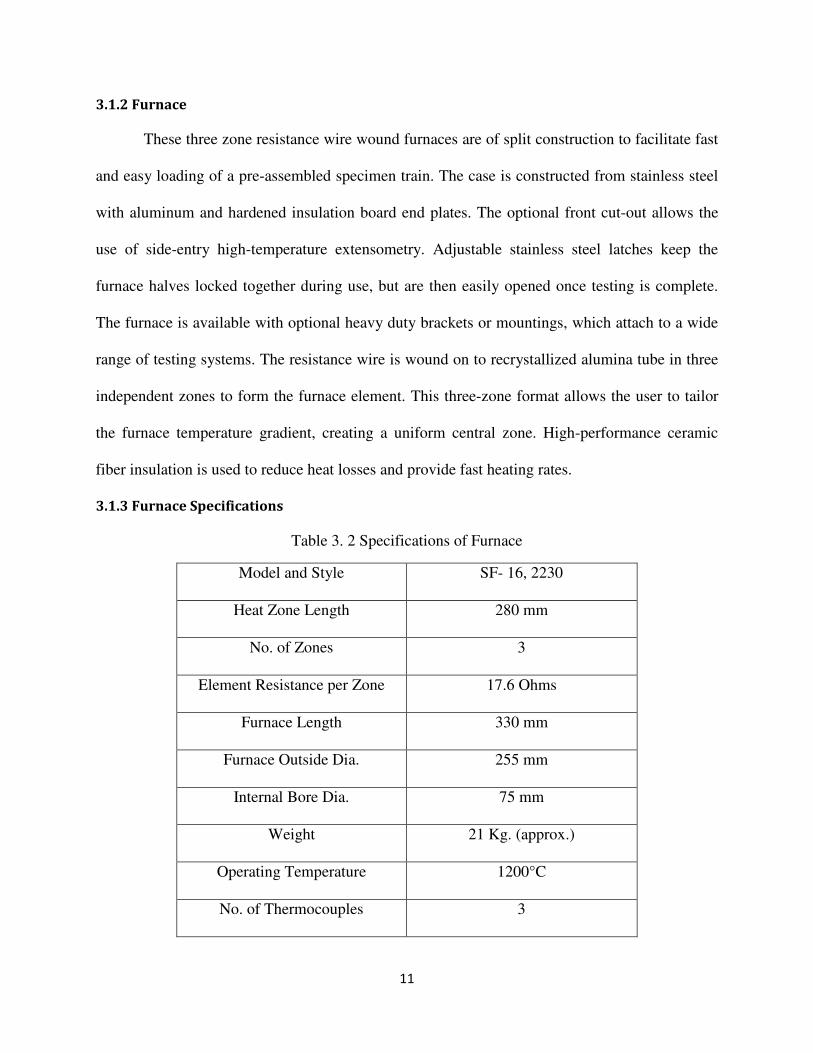
3.1.2 Furnace
These three zone resistance wire wound furnaces are of split construction to facilitate fast
and easy loading of a pre-assembled specimen train. The case is constructed from stainless steel
with aluminum and hardened insulation board end plates. The optional front cut-out allows the
use of side-entry high-temperature extensometry. Adjustable stainless steel latches keep the
furnace halves locked together during use, but are then easily opened once testing is complete.
The furnace is available with optional heavy duty brackets or mountings, which attach to a wide
range of testing systems. The resistance wire is wound on to recrystallized alumina tube in three
independent zones to form the furnace element. This three-zone format allows the user to tailor
the furnace temperature gradient, creating a uniform central zone. High-performance ceramic
fiber insulation is used to reduce heat losses and provide fast heating rates.
3.1.3 Furnace Specifications
Table 3. 2 Specifications of Furnace
Model and Style SF- 16, 2230
Heat Zone Length 280 mm
No. of Zones 3
Element Resistance per Zone 17.6 Ohms
Furnace Length 330 mm
Furnace Outside Dia. 255 mm
Internal Bore Dia. 75 mm
Weight 21 Kg. (approx.)
Operating Temperature 1200°C
No. of Thermocouples 3
12
Thermocouples Type K
Power Requirement
Voltage 115 Vac.
Watt 2250 W, 750 W/ Zone
Phase Single
Ampere 21 A, 6.52A/ Zone
Hertz 60 Hz/ 50 Hz
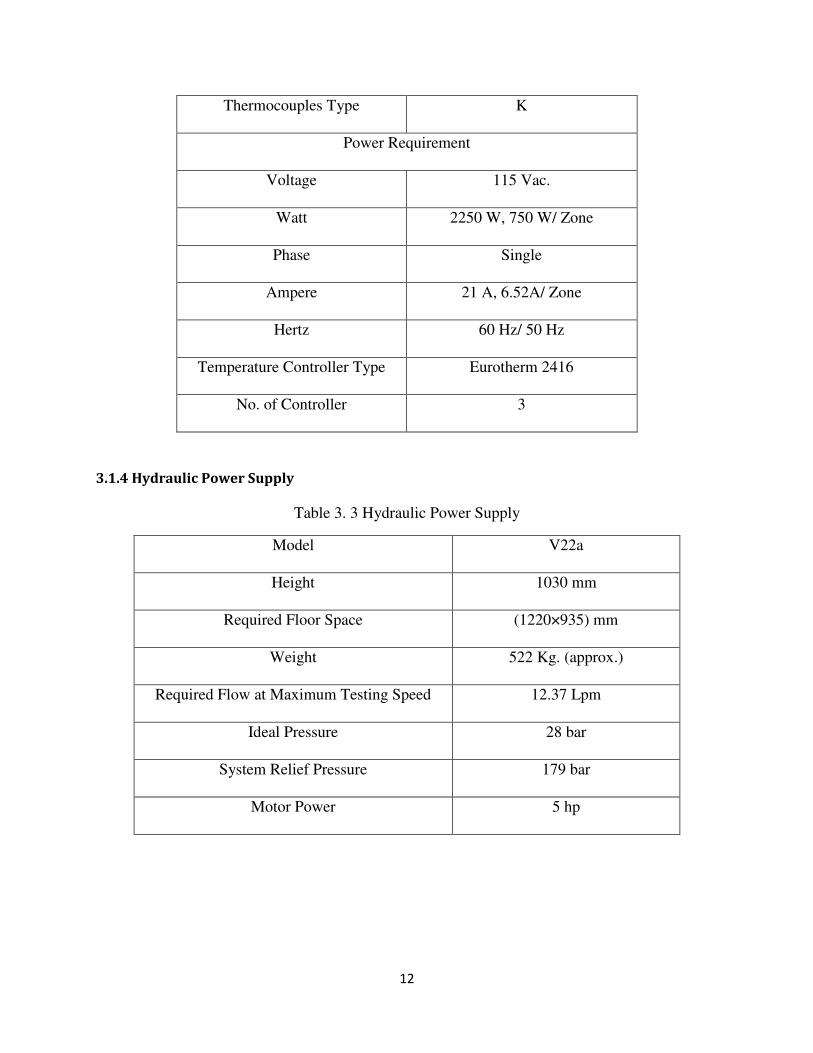
Temperature Controller Type Eurotherm 2416
No. of Controller 3
3.1.4 Hydraulic Power Supply
Table 3. 3 Hydraulic Power Supply
Model V22a
Height 1030 mm
Required Floor Space (1220×935) mm
Weight 522 Kg. (approx.)
Required Flow at Maximum Testing Speed 12.37 Lpm
Ideal Pressure 28 bar
System Relief Pressure 179 bar
Motor Power 5 hp
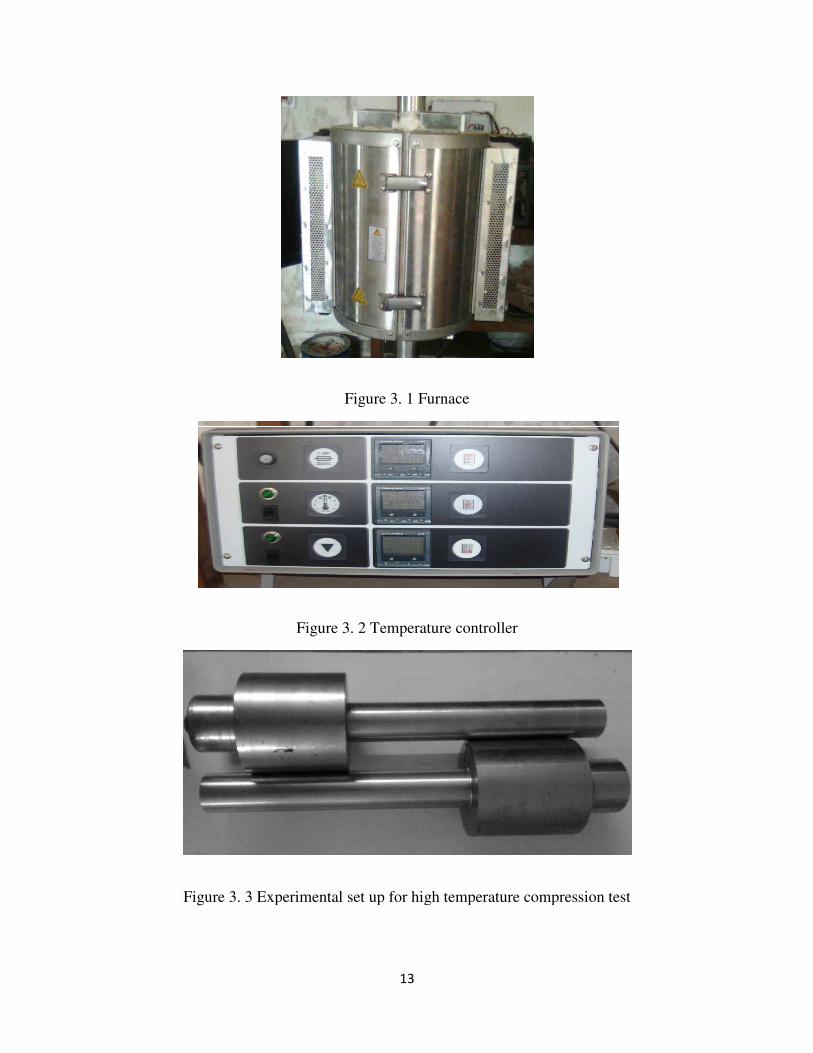
Figure 3.
Figure 3. 3 Experimental set up for high temperature compression test
13
Figure 3. 1 Furnace
Figure 3. 2 Temperature controller
Experimental set up for high temperature compression test
Experimental set up for high temperature compression test
14
Figure 3. 4 INSTRON with set up for high temperature compression test
3.2 Graphite as a lubricant:
Graphite is one of the allotropes of carbon. It is structurally composed of planes of
polycyclic carbon atoms that are hexagonal in orientation. The distance of carbon atoms between
planes is longer and therefore the bonding is weaker. Graphite is best suited for lubrication in a
regular atmosphere. In an oxidative atmosphere graphite is effective at high temperatures up to
450ºC continuously and can withstand much higher temperature peaks. Graphite is characterized
by two main groups, natural and synthetic. Graphite as a lubricant is used as dry powder or
mixed with water or oil. When mixed with water, it is called 'aqua-dag' and when mixed with oil,
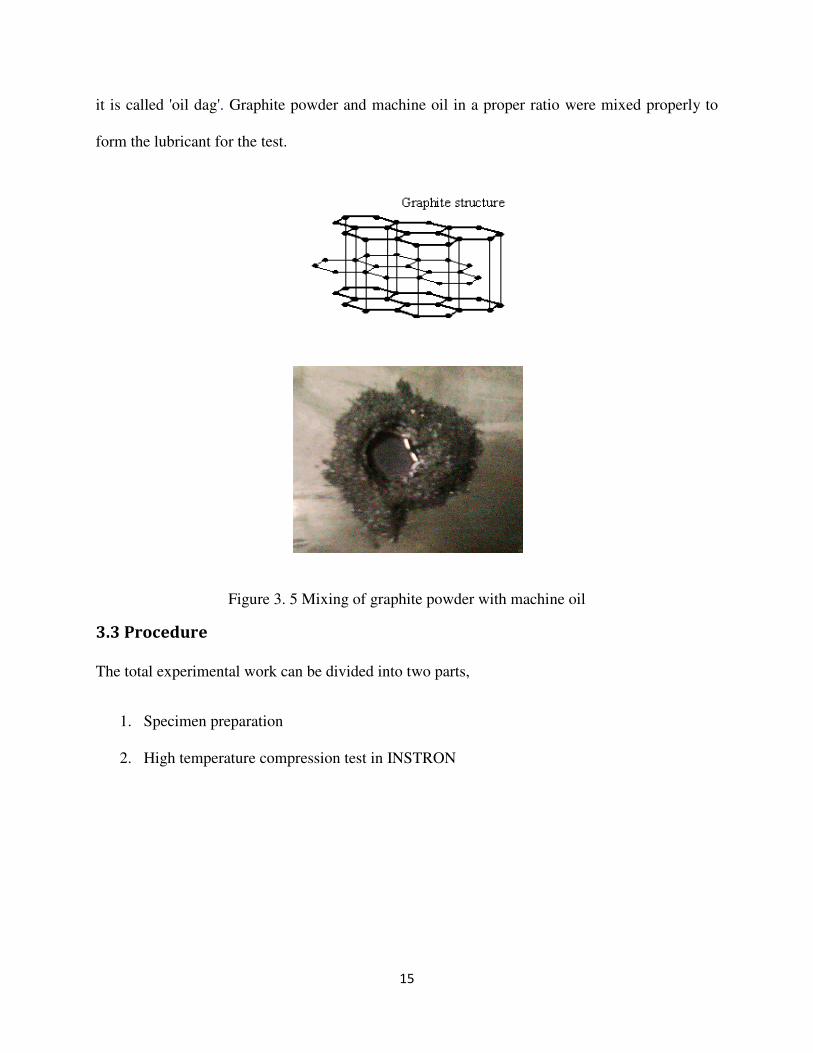
15
it is called 'oil dag'. Graphite powder and machine oil in a proper ratio were mixed properly to
form the lubricant for the test.
Figure 3. 5 Mixing of graphite powder with machine oil
3.3 Procedure
The total experimental work can be divided into two parts,
1. Specimen preparation
2. High temperature compression test in INSTRON
16
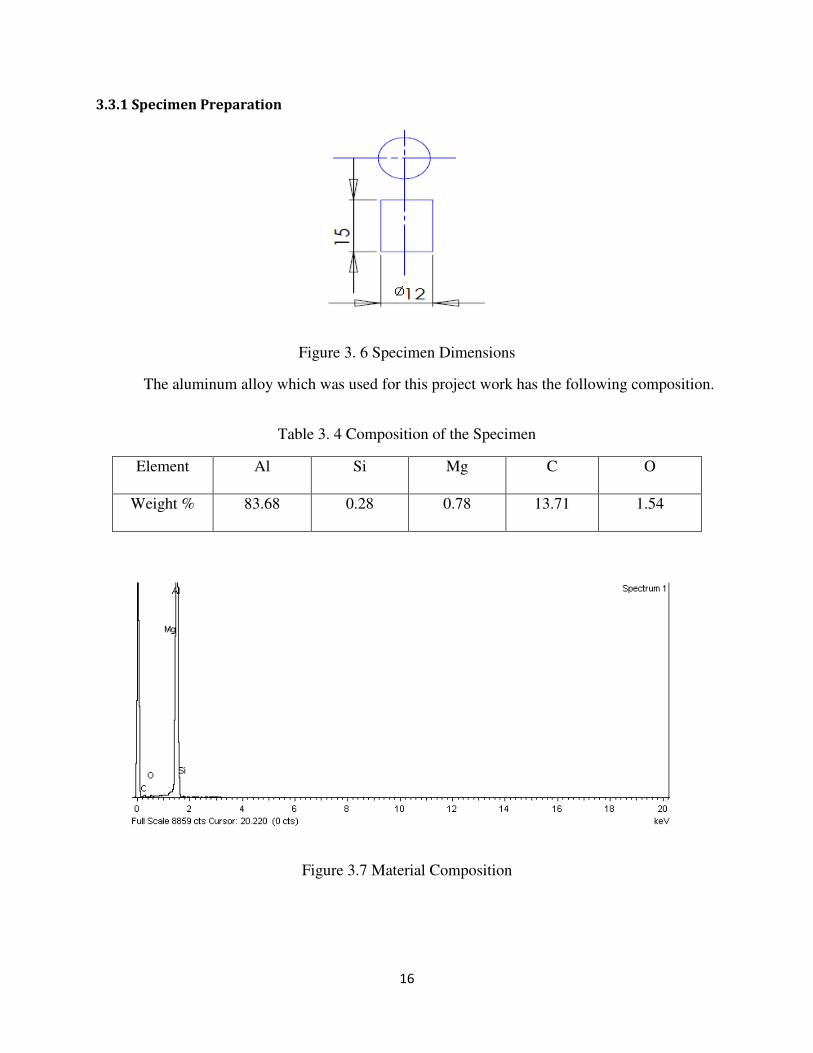
3.3.1 Specimen Preparation
Figure 3. 6 Specimen Dimensions
The aluminum alloy which was used for this project work has the following composition.
Table 3. 4 Composition of the Specimen
Element Al Si Mg C O
Weight % 83.68 0.28 0.78 13.71 1.54
Figure 3.7 Material Composition
17
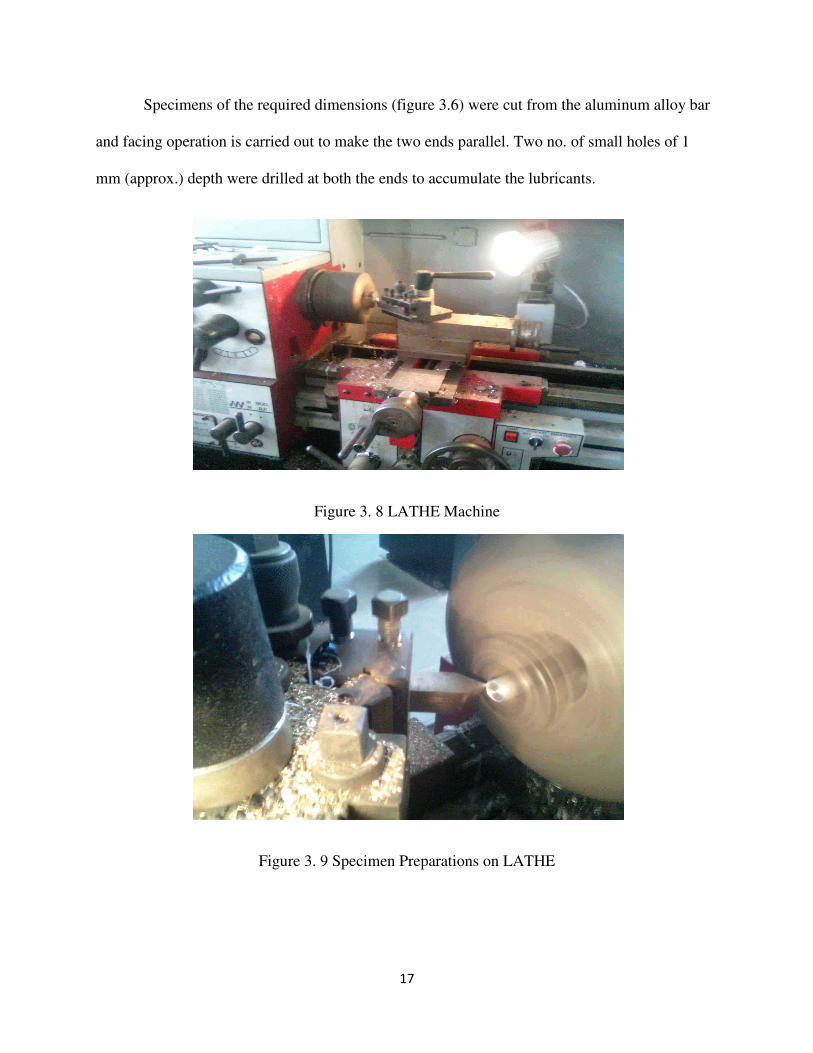
Specimens of the required dimensions (figure 3.6) were cut from the aluminum alloy bar
and facing operation is carried out to make the two ends parallel. Two no. of small holes of 1
mm (approx.) depth were drilled at both the ends to accumulate the lubricants.
Figure 3. 8 LATHE Machine
Figure 3. 9 Specimen Preparations on LATHE
18
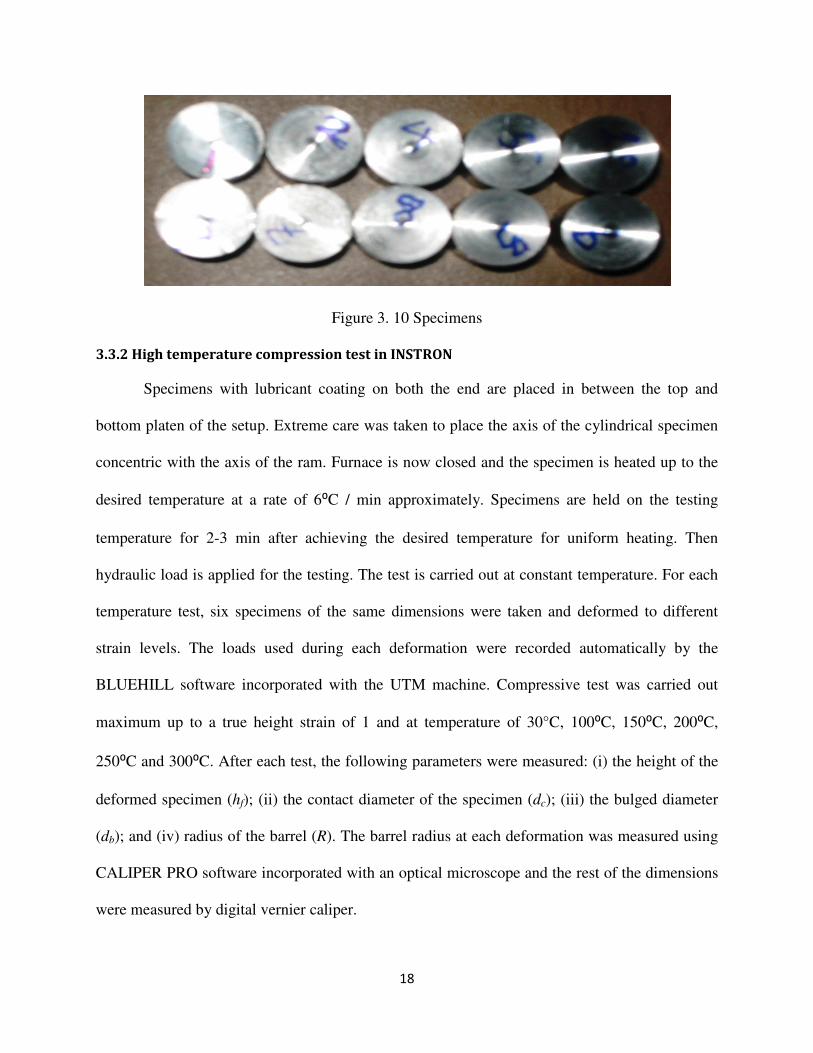
Figure 3. 10 Specimens
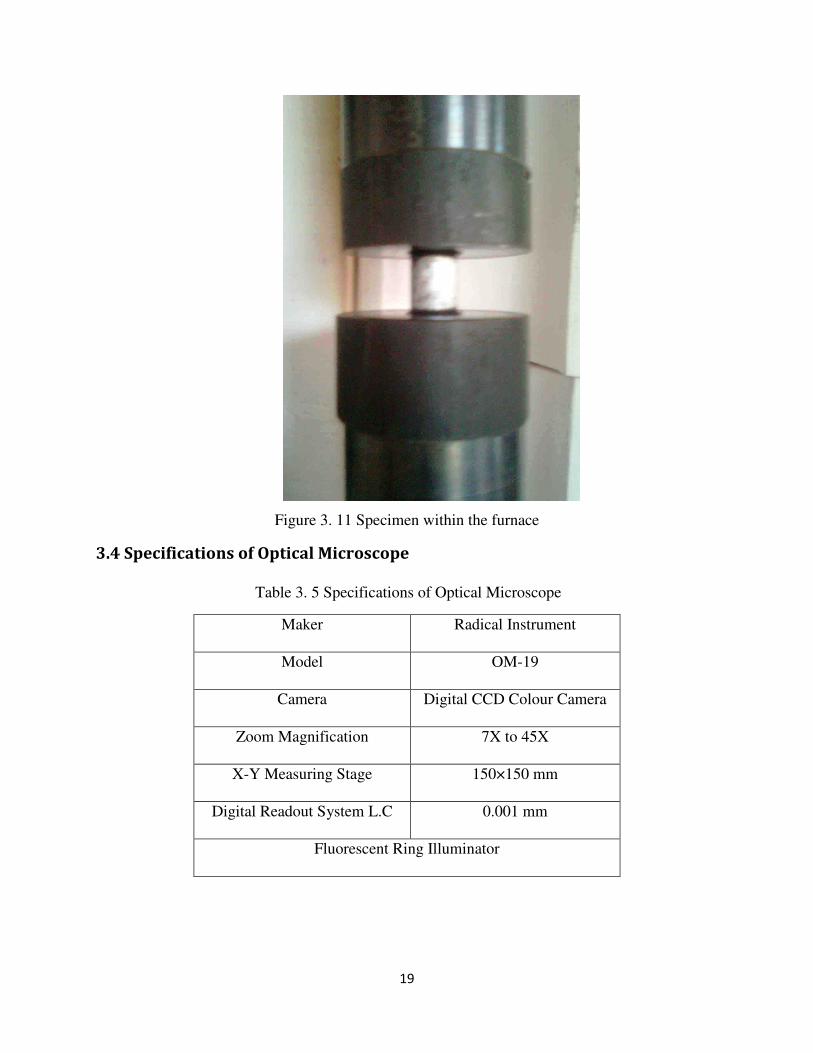
3.3.2 High temperature compression test in INSTRON
Specimens with lubricant coating on both the end are placed in between the top and
bottom platen of the setup. Extreme care was taken to place the axis of the cylindrical specimen
concentric with the axis of the ram. Furnace is now closed and the specimen is heated up to the
desired temperature at a rate of 6⁰C / min approximately. Specimens are held on the testing
temperature for 2-3 min after achieving the desired temperature for uniform heating. Then
hydraulic load is applied for the testing. The test is carried out at constant temperature. For each
temperature test, six specimens of the same dimensions were taken and deformed to different
strain levels. The loads used during each deformation were recorded automatically by the
BLUEHILL software incorporated with the UTM machine. Compressive test was carried out
maximum up to a true height strain of 1 and at temperature of 30°C, 100⁰C, 150⁰C, 200⁰C,
250⁰C and 300⁰C. After each test, the following parameters were measured: (i) the height of the
deformed specimen (hf); (ii) the contact diameter of the specimen (dc); (iii) the bulged diameter
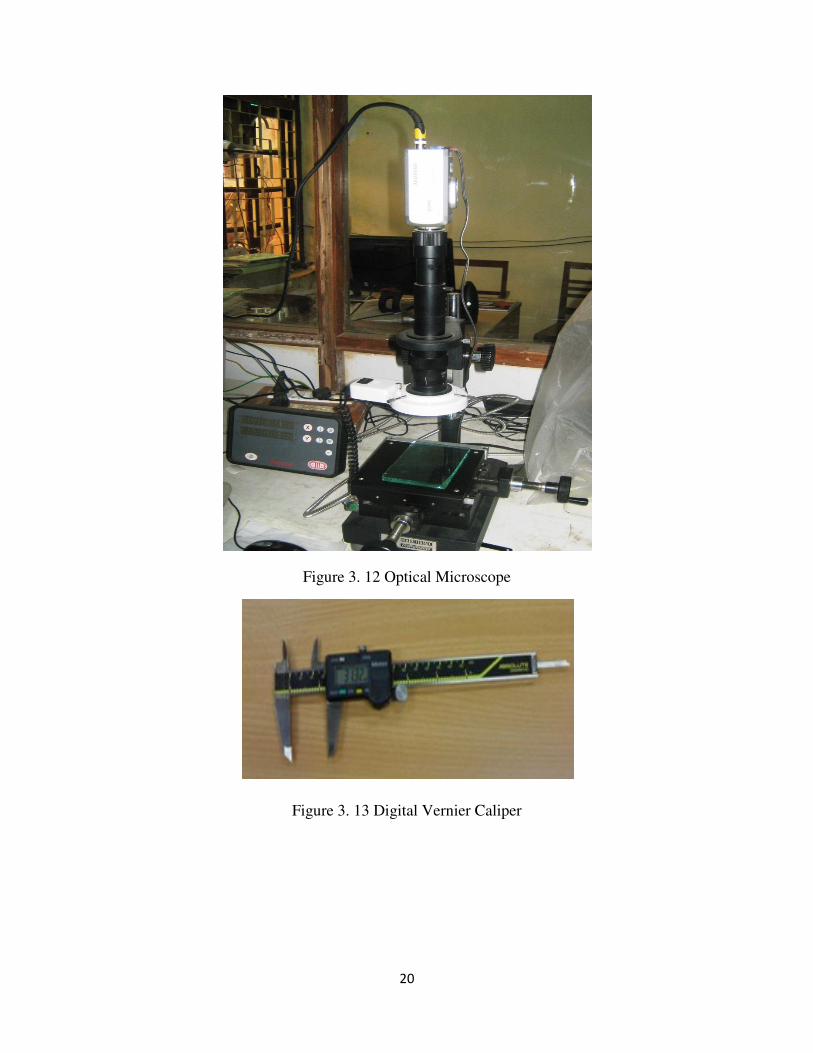
(db); and (iv) radius of the barrel (R). The barrel radius at each deformation was measured using
CALIPER PRO software incorporated with an optical microscope and the rest of the dimensions
were measured by digital vernier caliper.
19
Figure 3. 11 Specimen within the furnace
3.4 Specifications of Optical Microscope
Table 3. 5 Specifications of Optical Microscope
Maker Radical Instrument
Model OM-19
Camera Digital CCD Colour Camera
Zoom Magnification 7X to 45X
X-Y Measuring Stage 150×150 mm
Digital Readout System L.C 0.001 mm
Fluorescent Ring Illuminator
20
Figure 3. 12 Optical Microscope
Figure 3. 13 Digital Vernier Caliper

Chapter 4
Results and Discussions
21
4. Result and Discussions
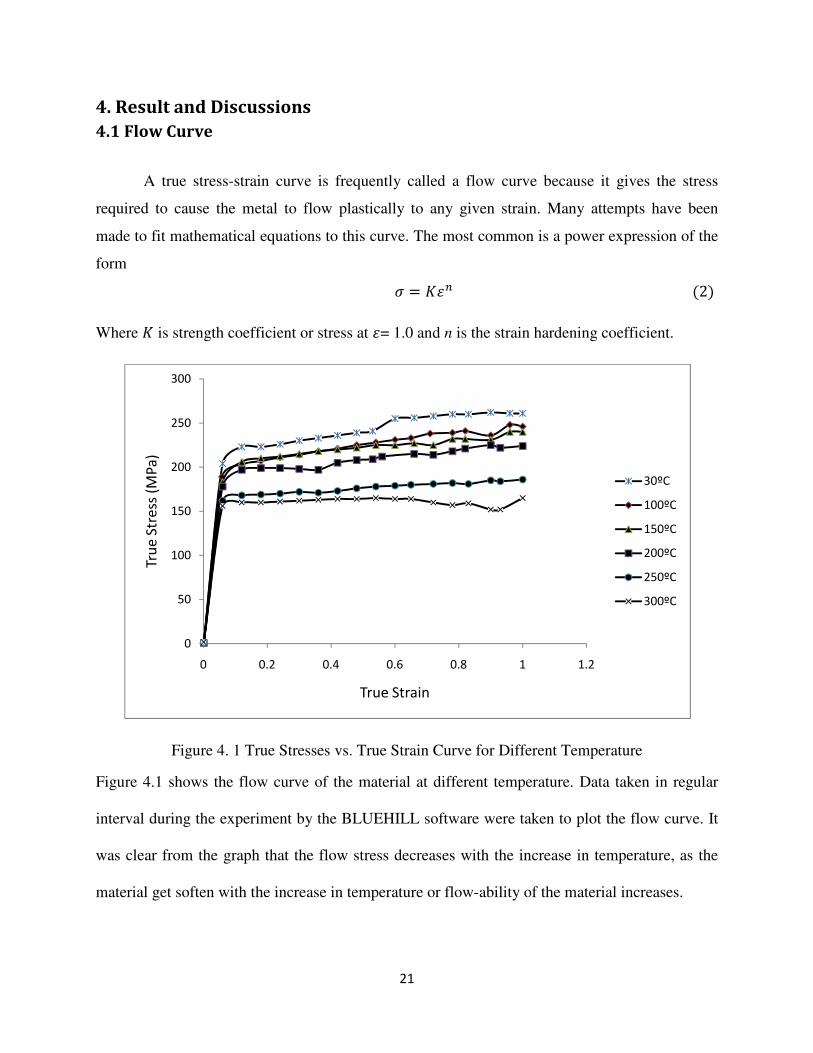
4.1 Flow Curve
A true stress-strain curve is frequently called a flow curve because it gives the stress
required to cause the metal to flow plastically to any given strain. Many attempts have been
made to fit mathematical equations to this curve. The most common is a power expression of the
form
� � "�# �2�
Where " is strength coefficient or stress at �= 1.0 and n is the strain hardening coefficient.
Figure 4. 1 True Stresses vs. True Strain Curve for Different Temperature
Figure 4.1 shows the flow curve of the material at different temperature. Data taken in regular
interval during the experiment by the BLUEHILL software were taken to plot the flow curve. It
was clear from the graph that the flow stress decreases with the increase in temperature, as the
material get soften with the increase in temperature or flow-ability of the material increases.
0
50
100
150
200
250
300
0 0.2 0.4 0.6 0.8 1 1.2
Tru
e S
tre
ss (
MP
a)
True Strain
30ºC
100ºC
150ºC
200ºC
250ºC
300ºC
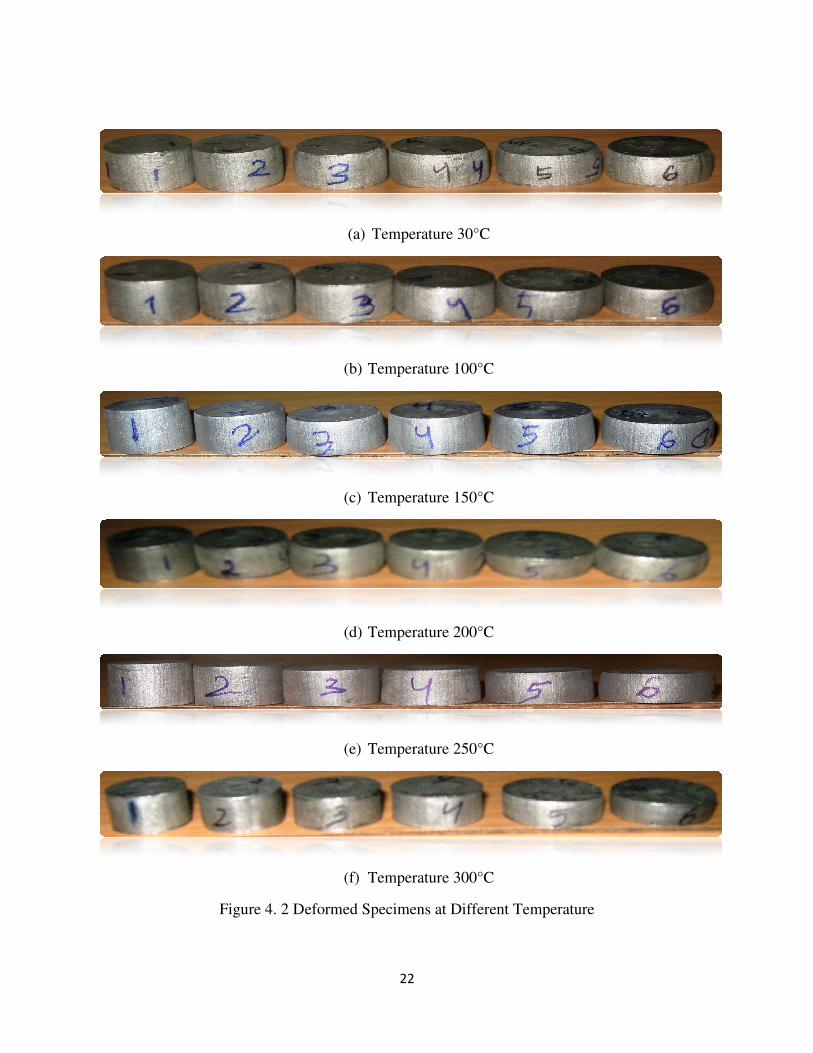
Figure 4. 2 Deformed Specimens at Different Temperature
22
(a) Temperature 30°C
(b) Temperature 100°C
(c) Temperature 150°C
(d) Temperature 200°C
(e) Temperature 250°C
(f) Temperature 300°C
Deformed Specimens at Different Temperature
23
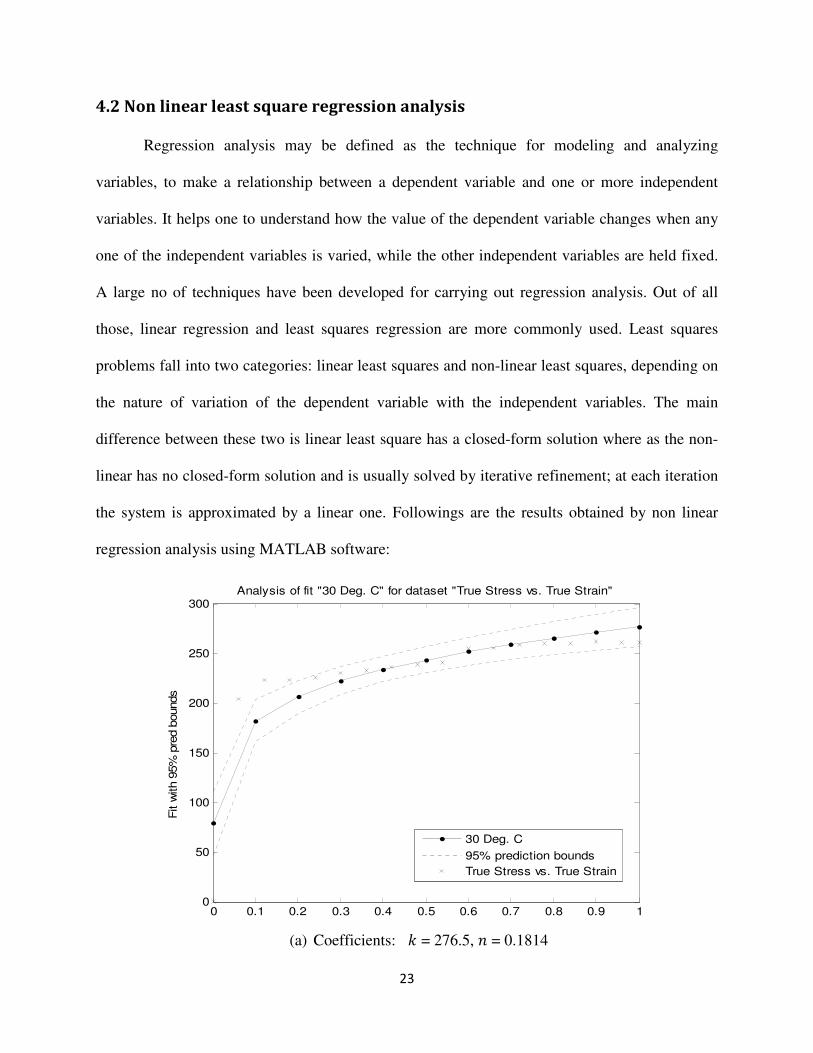
4.2 Non linear least square regression analysis
Regression analysis may be defined as the technique for modeling and analyzing
variables, to make a relationship between a dependent variable and one or more independent
variables. It helps one to understand how the value of the dependent variable changes when any
one of the independent variables is varied, while the other independent variables are held fixed.
A large no of techniques have been developed for carrying out regression analysis. Out of all
those, linear regression and least squares regression are more commonly used. Least squares
problems fall into two categories: linear least squares and non-linear least squares, depending on
the nature of variation of the dependent variable with the independent variables. The main
difference between these two is linear least square has a closed-form solution where as the non-
linear has no closed-form solution and is usually solved by iterative refinement; at each iteration
the system is approximated by a linear one. Followings are the results obtained by non linear
regression analysis using MATLAB software:
(a) Coefficients: % = 276.5, � = 0.1814
0 0.1 0.2 0.3 0.4 0.5 0.6 0.7 0.8 0.9 10
50
100
150
200
250
300
Fit w
ith 9
5%
pre
d b
ounds
Analysis of fit "30 Deg. C" for dataset "True Stress vs. True Strain"
30 Deg. C
95% prediction bounds
True Stress vs. True Strain
24
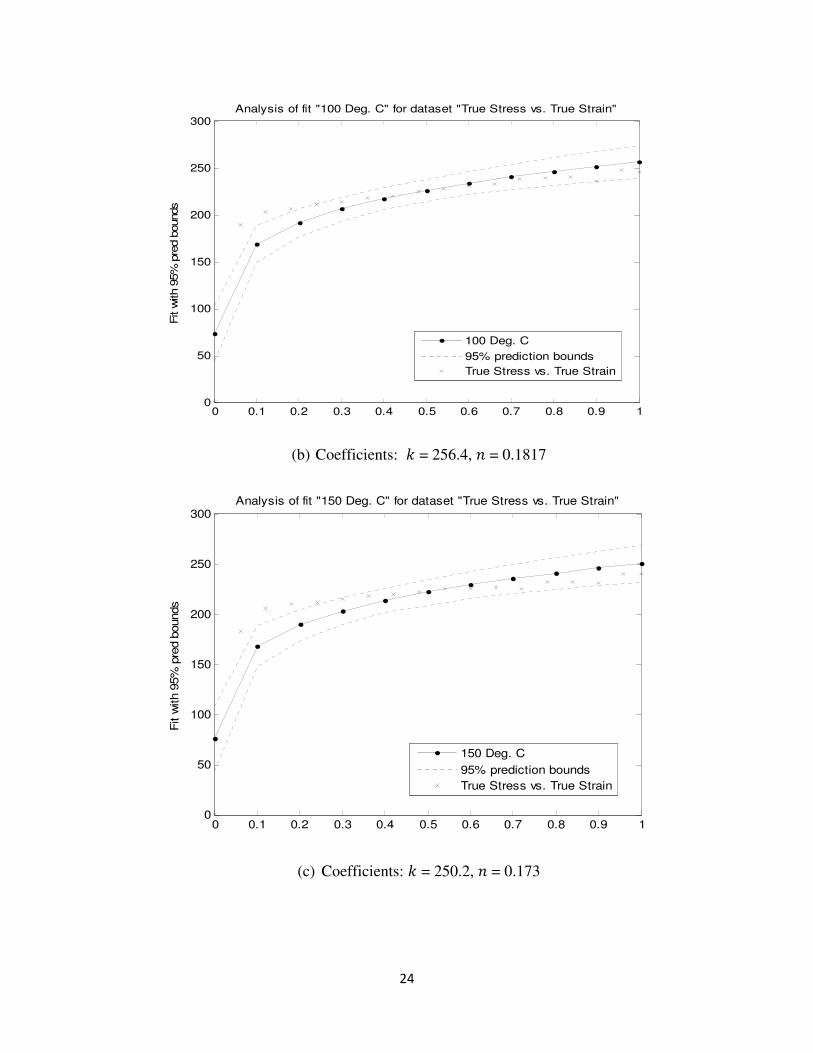
(b) Coefficients: % = 256.4, � = 0.1817
(c) Coefficients: % = 250.2, � = 0.173
0 0.1 0.2 0.3 0.4 0.5 0.6 0.7 0.8 0.9 10
50
100
150
200
250
300
Fit w
ith 9
5%
pre
d b
ounds
Analysis of fit "100 Deg. C" for dataset "True Stress vs. True Strain"
100 Deg. C
95% prediction bounds
True Stress vs. True Strain
0 0.1 0.2 0.3 0.4 0.5 0.6 0.7 0.8 0.9 10
50
100
150
200
250
300
Fit w
ith 9
5%
pre
d b
ounds
Analysis of fit "150 Deg. C" for dataset "True Stress vs. True Strain"
150 Deg. C
95% prediction bounds
True Stress vs. True Strain
25
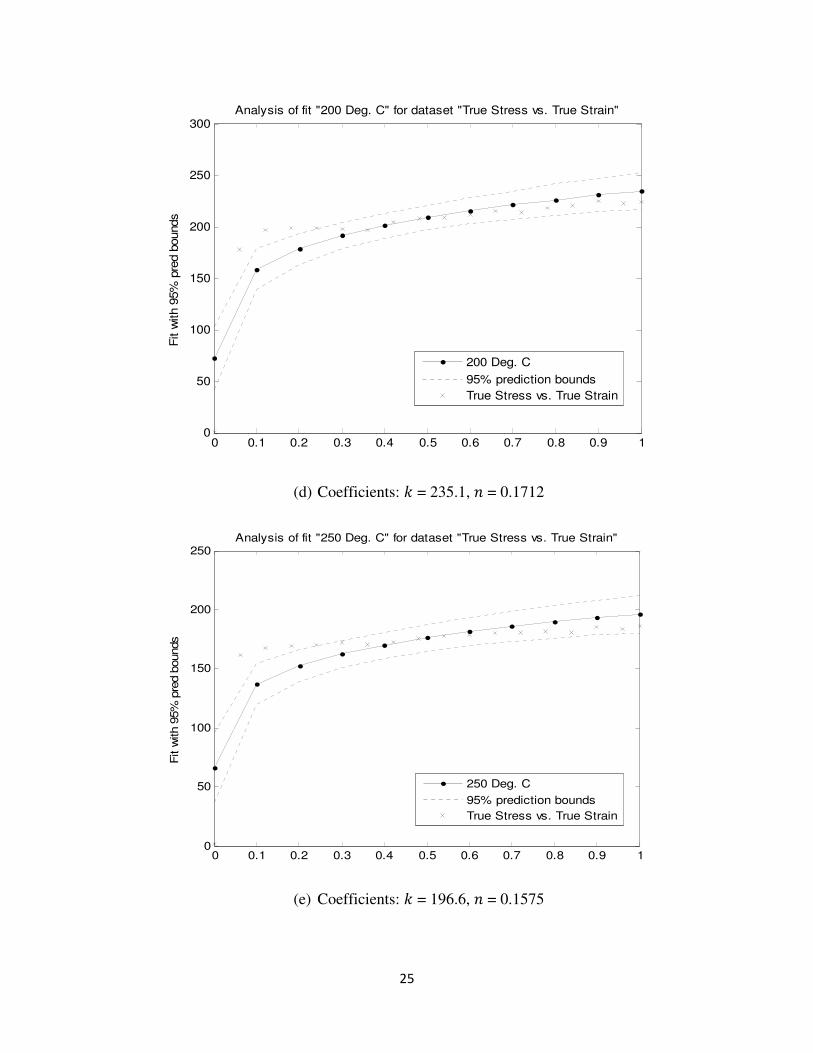
(d) Coefficients: % = 235.1, � = 0.1712
(e) Coefficients: % = 196.6, � = 0.1575
0 0.1 0.2 0.3 0.4 0.5 0.6 0.7 0.8 0.9 10
50
100
150
200
250
300
Fit w
ith 9
5%
pre
d b
ounds
Analysis of fit "200 Deg. C" for dataset "True Stress vs. True Strain"
200 Deg. C
95% prediction bounds
True Stress vs. True Strain
0 0.1 0.2 0.3 0.4 0.5 0.6 0.7 0.8 0.9 10
50
100
150
200
250
Fit w
ith 9
5%
pre
d b
ounds
Analysis of fit "250 Deg. C" for dataset "True Stress vs. True Strain"
250 Deg. C
95% prediction bounds
True Stress vs. True Strain
26
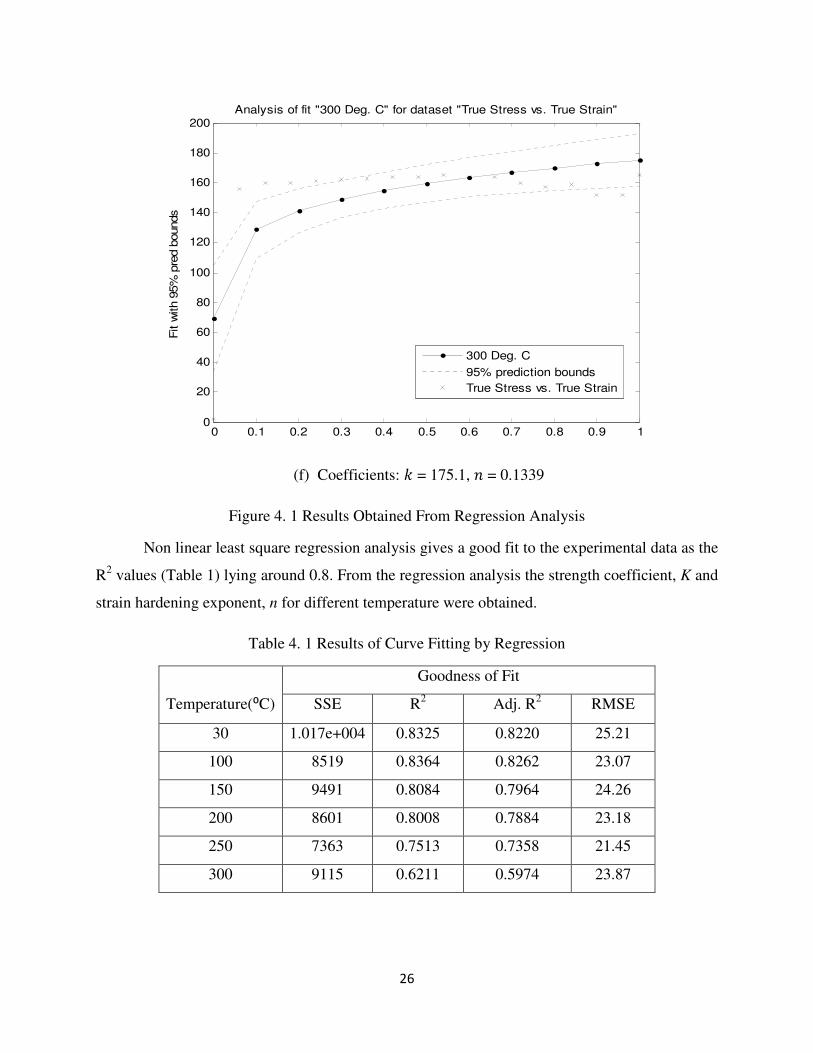
(f) Coefficients: % = 175.1, � = 0.1339
Figure 4. 1 Results Obtained From Regression Analysis
Non linear least square regression analysis gives a good fit to the experimental data as the
R2 values (Table 1) lying around 0.8. From the regression analysis the strength coefficient, K and
strain hardening exponent, n for different temperature were obtained.
Table 4. 1 Results of Curve Fitting by Regression
Temperature(⁰C)
Goodness of Fit
SSE R2 Adj. R
2 RMSE
30 1.017e+004 0.8325 0.8220 25.21
100 8519 0.8364 0.8262 23.07
150 9491 0.8084 0.7964 24.26
200 8601 0.8008 0.7884 23.18
250 7363 0.7513 0.7358 21.45
300 9115 0.6211 0.5974 23.87
0 0.1 0.2 0.3 0.4 0.5 0.6 0.7 0.8 0.9 10
20
40
60
80
100
120
140
160
180
200
Fit w
ith 9
5%
pre
d b
ounds
Analysis of fit "300 Deg. C" for dataset "True Stress vs. True Strain"
300 Deg. C
95% prediction bounds
True Stress vs. True Strain
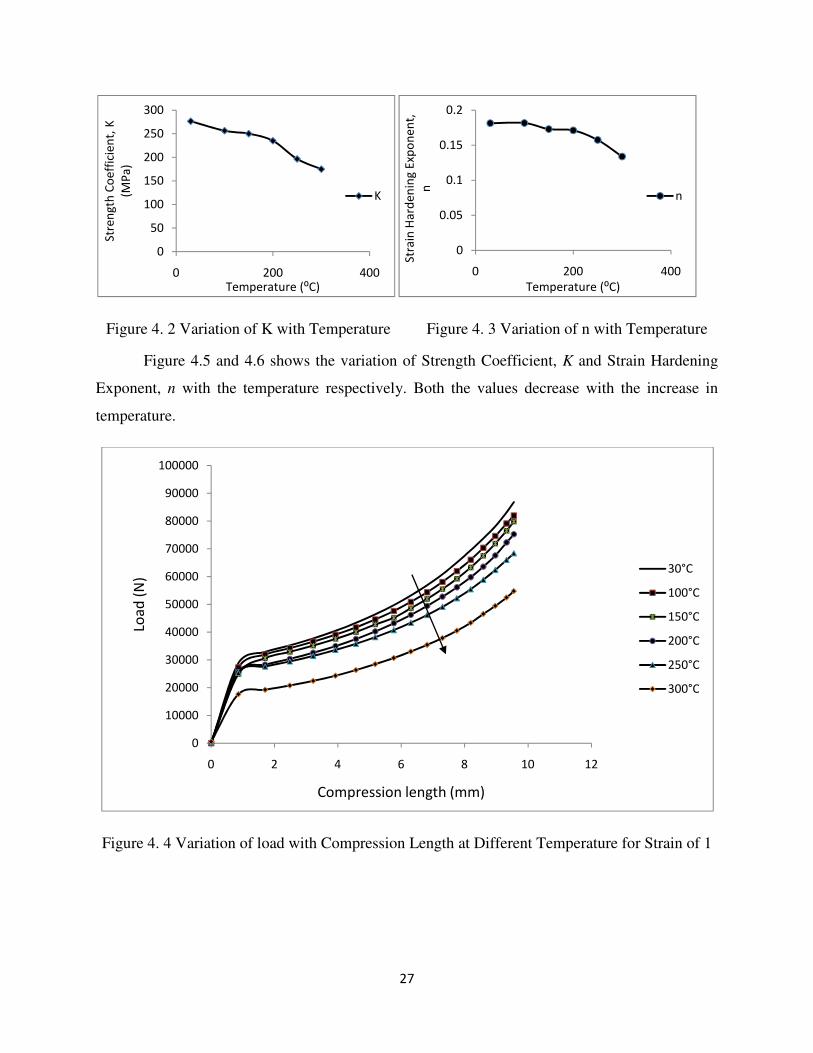
27
Figure 4. 2 Variation of K with Temperature Figure 4. 3 Variation of n with Temperature
Figure 4.5 and 4.6 shows the variation of Strength Coefficient, K and Strain Hardening
Exponent, n with the temperature respectively. Both the values decrease with the increase in
temperature.
Figure 4. 4 Variation of load with Compression Length at Different Temperature for Strain of 1
0
50
100
150
200
250
300
0 200 400
Stre
ng
th C
oe
ffic
ien
t, K
(MP
a)
Temperature (⁰C)
K
0
0.05
0.1
0.15
0.2
0 200 400
Stra
in H
ard
en
ing
Exp
on
en
t,
n
Temperature (⁰C)
n
0
10000
20000
30000
40000
50000
60000
70000
80000
90000
100000
0 2 4 6 8 10 12
Loa
d (
N)
Compression length (mm)
30°C
100°C
150°C
200°C
250°C
300°C
28
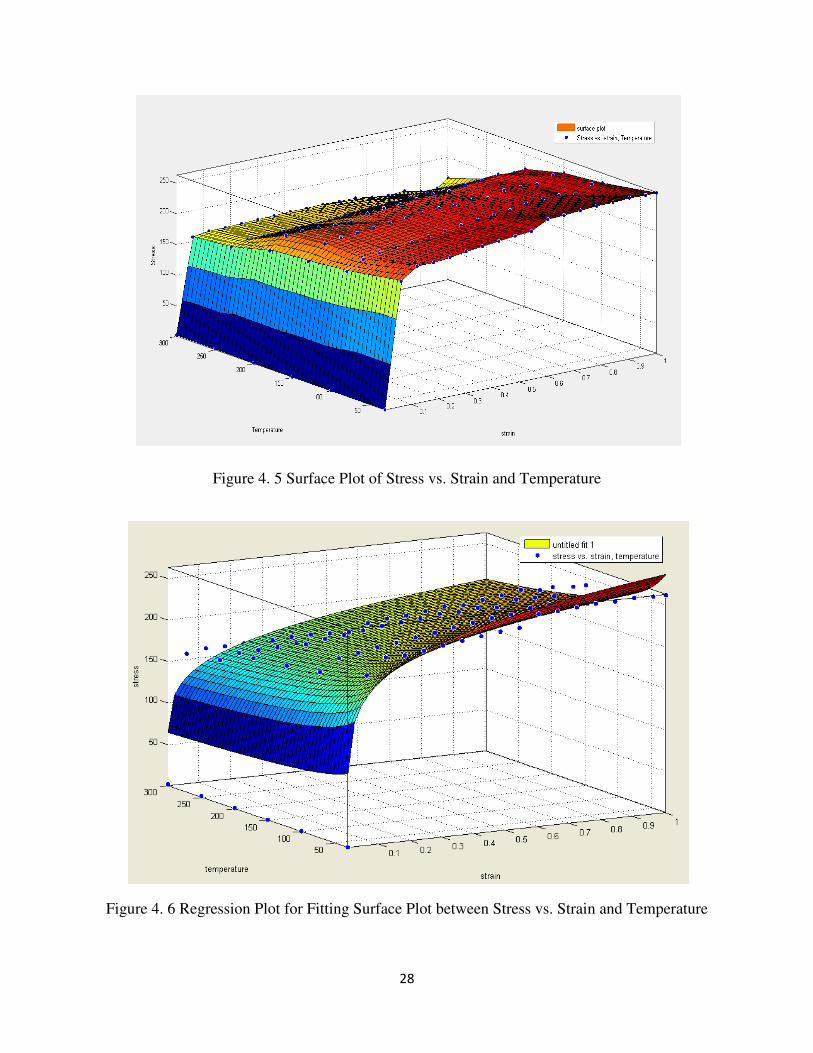
Figure 4. 5 Surface Plot of Stress vs. Strain and Temperature
Figure 4. 6 Regression Plot for Fitting Surface Plot between Stress vs. Strain and Temperature
29
Non linear regression analysis results a common power equation considering both strain and
temperature as follows
� � &� '( �3�
Where & � 463.8,/ � 0.1691, 2 � 30.1421
Table 4. 2 Result of Regression for Common Fit
SSE 8.001e+004
�� 0.763
Adj. �� 0.7585
RSME 27.6
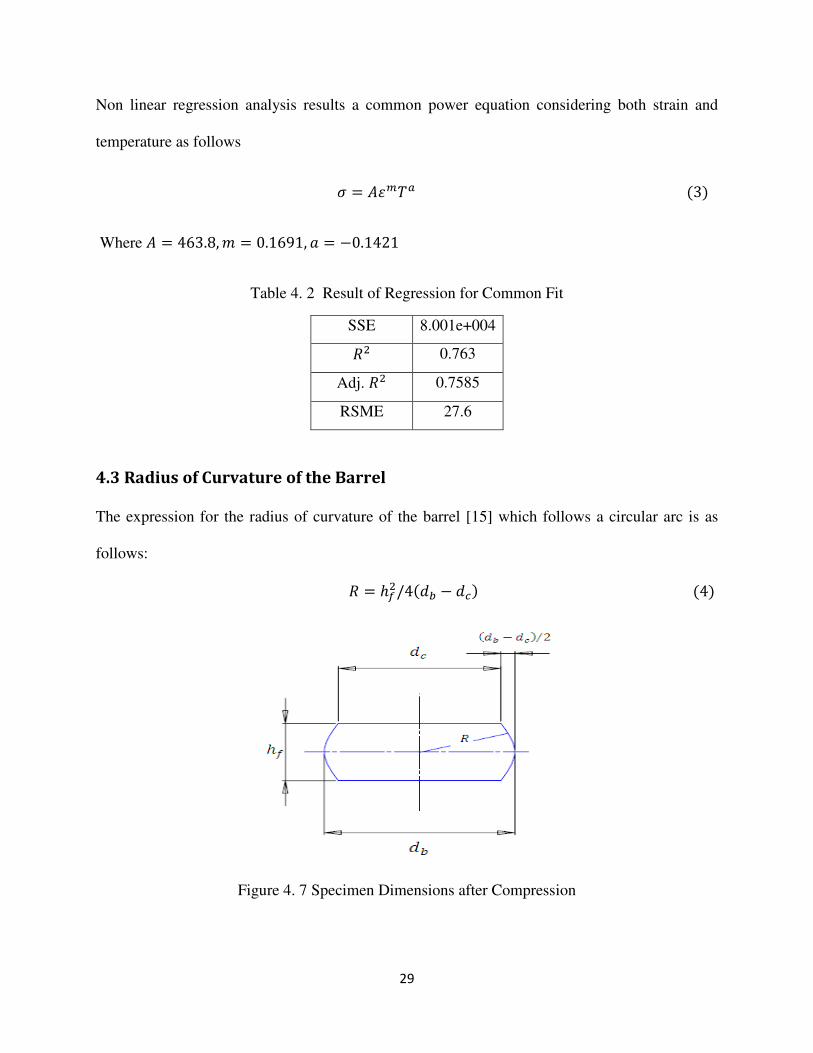
4.3 Radius of Curvature of the Barrel
The expression for the radius of curvature of the barrel [15] which follows a circular arc is as
follows:
� � ���/4��� 3 ��� �4�
Figure 4. 7 Specimen Dimensions after Compression
30
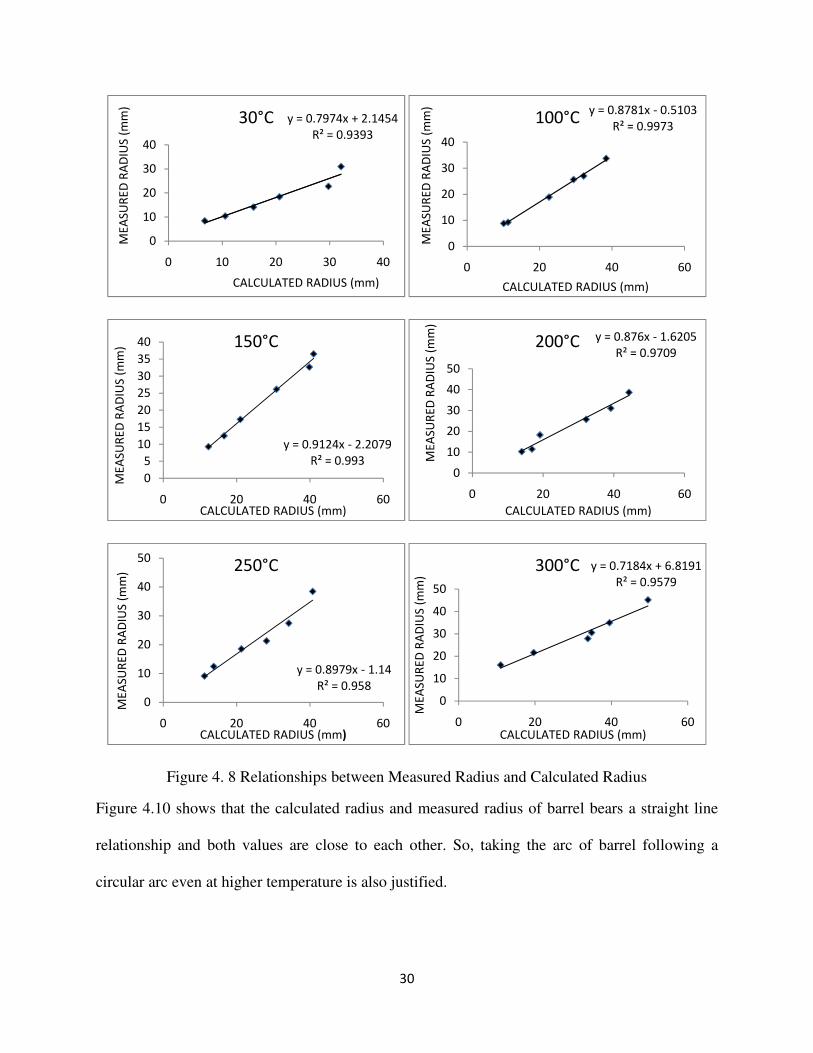
Figure 4. 8 Relationships between Measured Radius and Calculated Radius
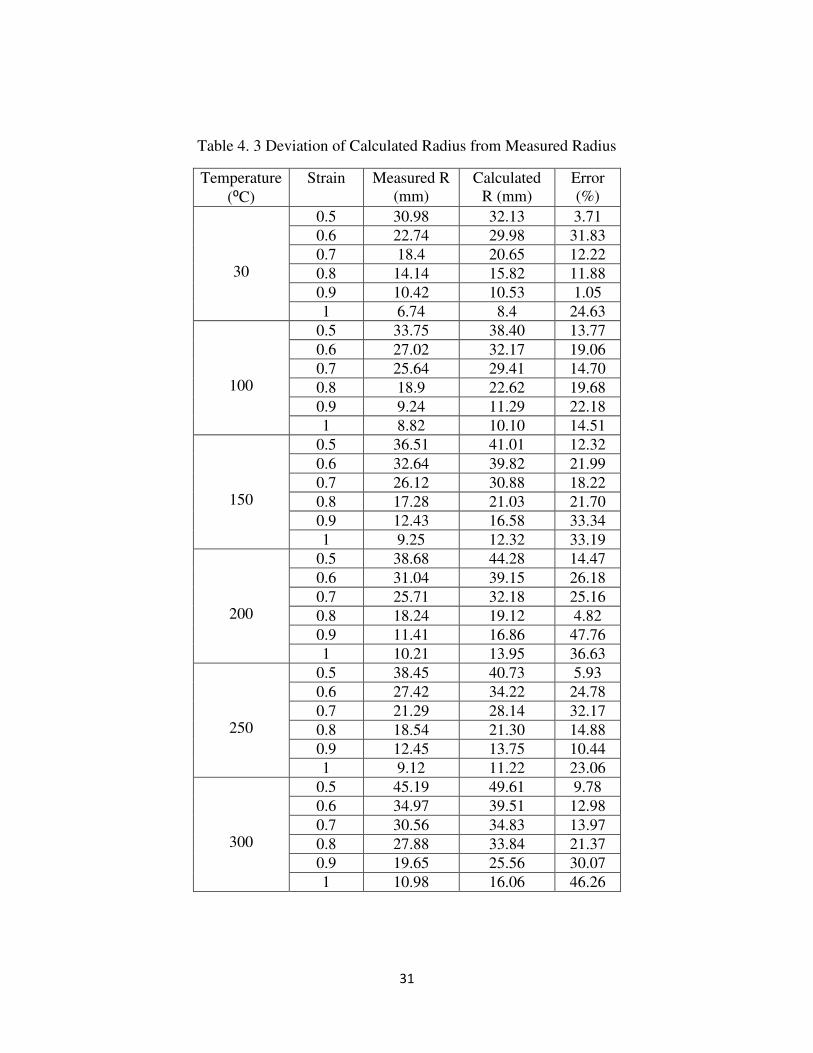
Figure 4.10 shows that the calculated radius and measured radius of barrel bears a straight line
relationship and both values are close to each other. So, taking the arc of barrel following a
circular arc even at higher temperature is also justified.
y = 0.7974x + 2.1454
R² = 0.9393
0
10
20
30
40
0 10 20 30 40
ME
ASU
RE
D R
AD
IUS
(mm
)
CALCULATED RADIUS (mm)
30°Cy = 0.8781x - 0.5103
R² = 0.9973
0
10
20
30
40
0 20 40 60
ME
ASU
RE
D R
AD
IUS
(mm
)
CALCULATED RADIUS (mm)
100°C
y = 0.9124x - 2.2079
R² = 0.993
0
5
10
15
20
25
30
35
40
0 20 40 60
ME
ASU
RE
D R
AD
IUS
(mm
)
CALCULATED RADIUS (mm)
150°C y = 0.876x - 1.6205
R² = 0.9709
0
10
20
30
40
50
0 20 40 60
ME
ASU
RE
D R
AD
IUS
(mm
)
CALCULATED RADIUS (mm)
200°C
y = 0.8979x - 1.14
R² = 0.958
0
10
20
30
40
50
0 20 40 60
ME
ASU
RE
D R
AD
IUS
(mm
)
CALCULATED RADIUS (mm)
250°C y = 0.7184x + 6.8191
R² = 0.9579
0
10
20
30
40
50
0 20 40 60
ME
ASU
RE
D R
AD
IUS
(mm
)
CALCULATED RADIUS (mm)
300°C
31
Table 4. 3 Deviation of Calculated Radius from Measured Radius
Temperature
(⁰C)
Strain Measured R
(mm)
Calculated
R (mm)
Error
(%)
30
0.5 30.98 32.13 3.71
0.6 22.74 29.98 31.83
0.7 18.4 20.65 12.22
0.8 14.14 15.82 11.88
0.9 10.42 10.53 1.05
1 6.74 8.4 24.63
100
0.5 33.75 38.40 13.77
0.6 27.02 32.17 19.06
0.7 25.64 29.41 14.70
0.8 18.9 22.62 19.68
0.9 9.24 11.29 22.18
1 8.82 10.10 14.51
150
0.5 36.51 41.01 12.32
0.6 32.64 39.82 21.99
0.7 26.12 30.88 18.22
0.8 17.28 21.03 21.70
0.9 12.43 16.58 33.34
1 9.25 12.32 33.19
200
0.5 38.68 44.28 14.47
0.6 31.04 39.15 26.18
0.7 25.71 32.18 25.16
0.8 18.24 19.12 4.82
0.9 11.41 16.86 47.76
1 10.21 13.95 36.63
250
0.5 38.45 40.73 5.93
0.6 27.42 34.22 24.78
0.7 21.29 28.14 32.17
0.8 18.54 21.30 14.88
0.9 12.45 13.75 10.44
1 9.12 11.22 23.06
300
0.5 45.19 49.61 9.78
0.6 34.97 39.51 12.98
0.7 30.56 34.83 13.97
0.8 27.88 33.84 21.37
0.9 19.65 25.56 30.07
1 10.98 16.06 46.26

32
4.4 Determination of Various Stresses
As explained elsewhere [15], the expression for bulging when following a circular arc, according
to volume constancy principle for the barrel is as follows:
14 4����� � 112 4�2��
� 5 ������ �5�
The above equation can be written as follows:
����� 2��� 5 ���
3��� �6�
Taking natural logarithm on both sides, the equation becomes:
� � � �7�
Where: � � ln :;:<
And � � ln =�>?@A>B@C>;@
D
Since the radial stress ��E� is zero at the free surface, it follows from the flow rule that:
� � ��1 5 2�� �2 5 ��⁄ �� �8� And that the effective stress can be expressed as:
σ � �1 �2 5 ��⁄ �F3�1 5 � 5 ���G� �⁄ � �9� The hydrostatic stress is given as follows:
� � �1 3⁄ ��� 5 �� �10�
where � is the slope between the hoop strain ���and the axial strain���
Figure 4. 9 Various Stresses Acting on the Specimen
33
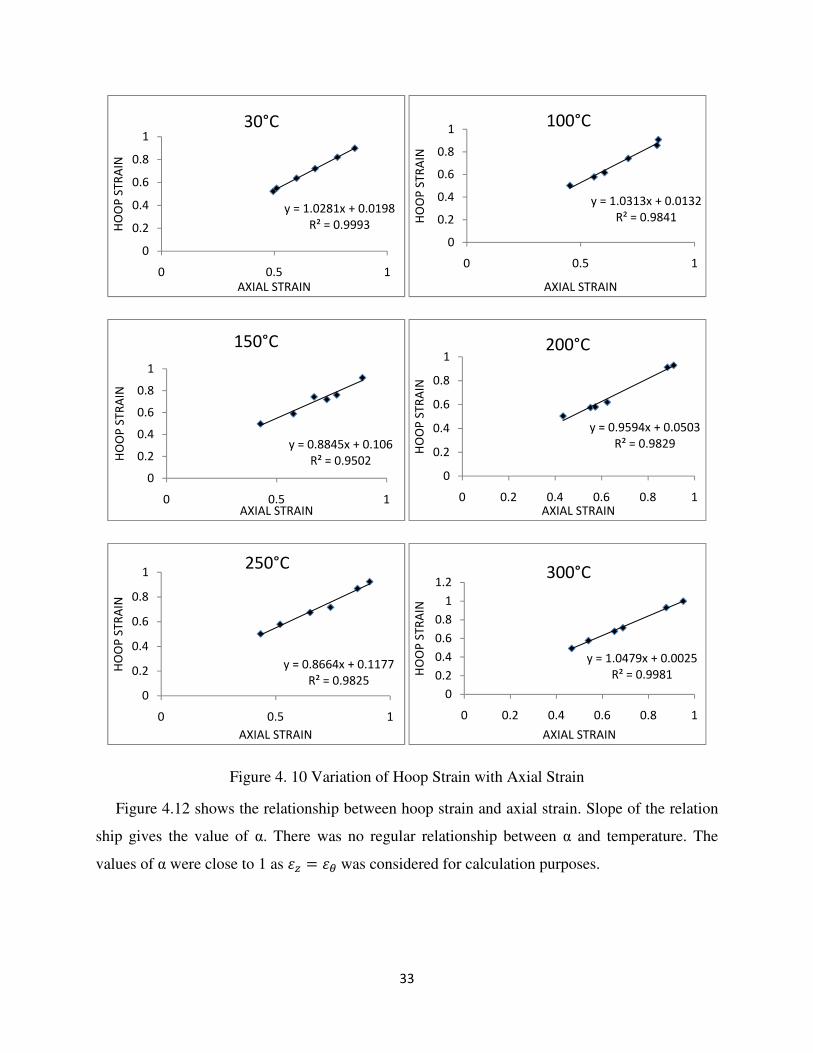
Figure 4. 10 Variation of Hoop Strain with Axial Strain
Figure 4.12 shows the relationship between hoop strain and axial strain. Slope of the relation
ship gives the value of α. There was no regular relationship between α and temperature. The
values of α were close to 1 as � � � was considered for calculation purposes.
y = 1.0281x + 0.0198
R² = 0.9993
0
0.2
0.4
0.6
0.8
1
0 0.5 1
HO
OP
ST
RA
IN
AXIAL STRAIN
30°C
y = 1.0313x + 0.0132
R² = 0.9841
0
0.2
0.4
0.6
0.8
1
0 0.5 1
HO
OP
ST
RA
IN
AXIAL STRAIN
100°C
y = 0.8845x + 0.106
R² = 0.9502
0
0.2
0.4
0.6
0.8
1
0 0.5 1
HO
OP
ST
RA
IN
AXIAL STRAIN
150°C
y = 0.9594x + 0.0503
R² = 0.9829
0
0.2
0.4
0.6
0.8
1
0 0.2 0.4 0.6 0.8 1
HO
OP
ST
RA
IN
AXIAL STRAIN
200°C
y = 0.8664x + 0.1177
R² = 0.98250
0.2
0.4
0.6
0.8
1
0 0.5 1
HO
OP
ST
RA
IN
AXIAL STRAIN
250°C
y = 1.0479x + 0.0025
R² = 0.9981
0
0.2
0.4
0.6
0.8
1
1.2
0 0.2 0.4 0.6 0.8 1
HO
OP
ST
RA
IN
AXIAL STRAIN
300°C
34
35
36
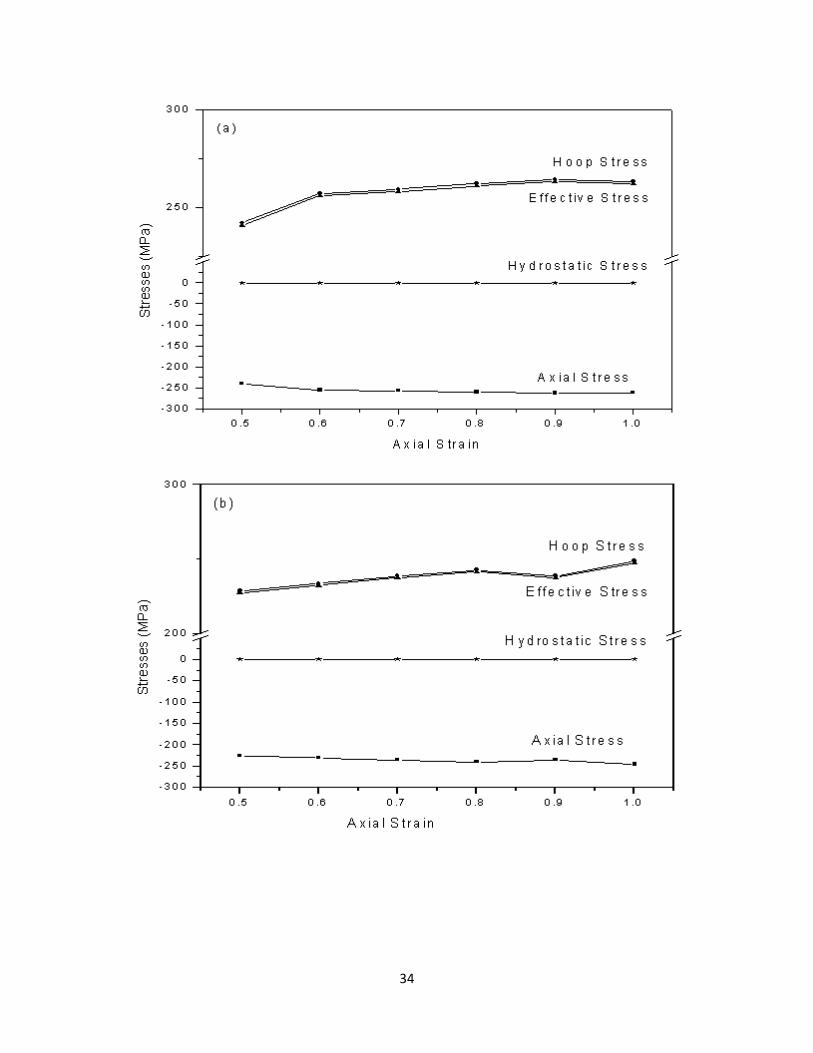
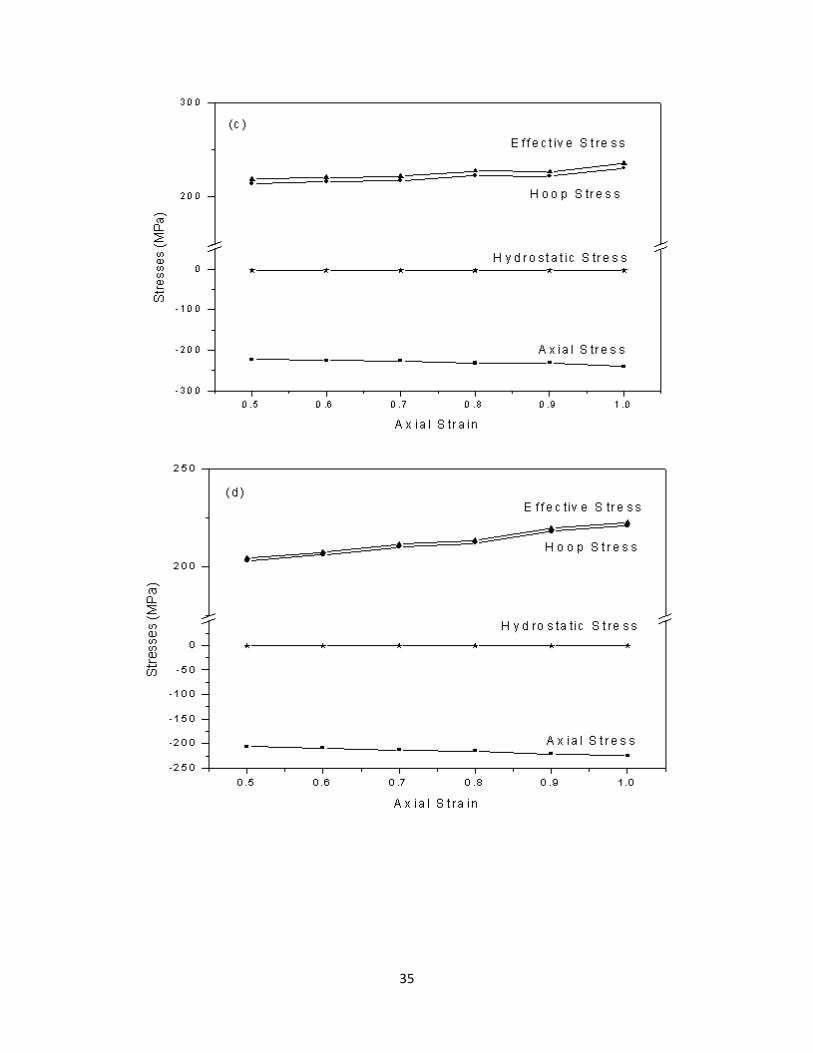
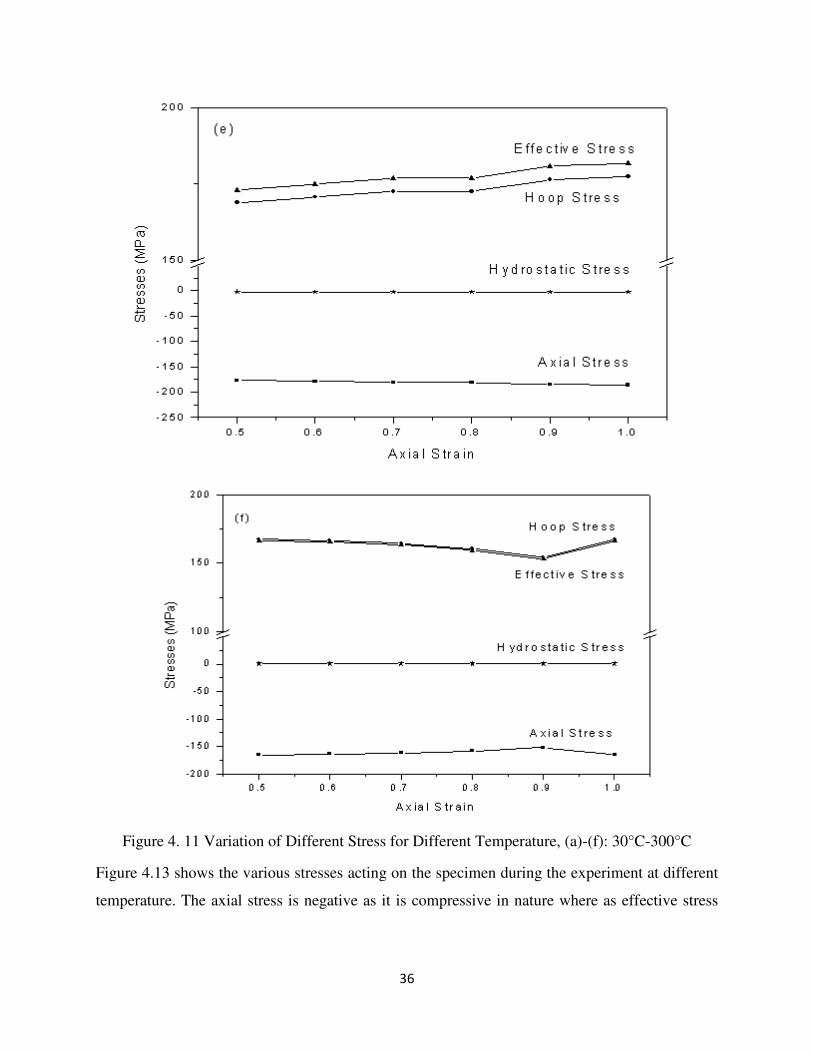
Figure 4. 11 Variation of Different Stress for Different Temperature, (a)-(f): 30°C-300°C
Figure 4.13 shows the various stresses acting on the specimen during the experiment at different
temperature. The axial stress is negative as it is compressive in nature where as effective stress
37
and hoop stress were positive as they were tensile in nature and the nature of the hydrostatic
stresses depends on the values of α.
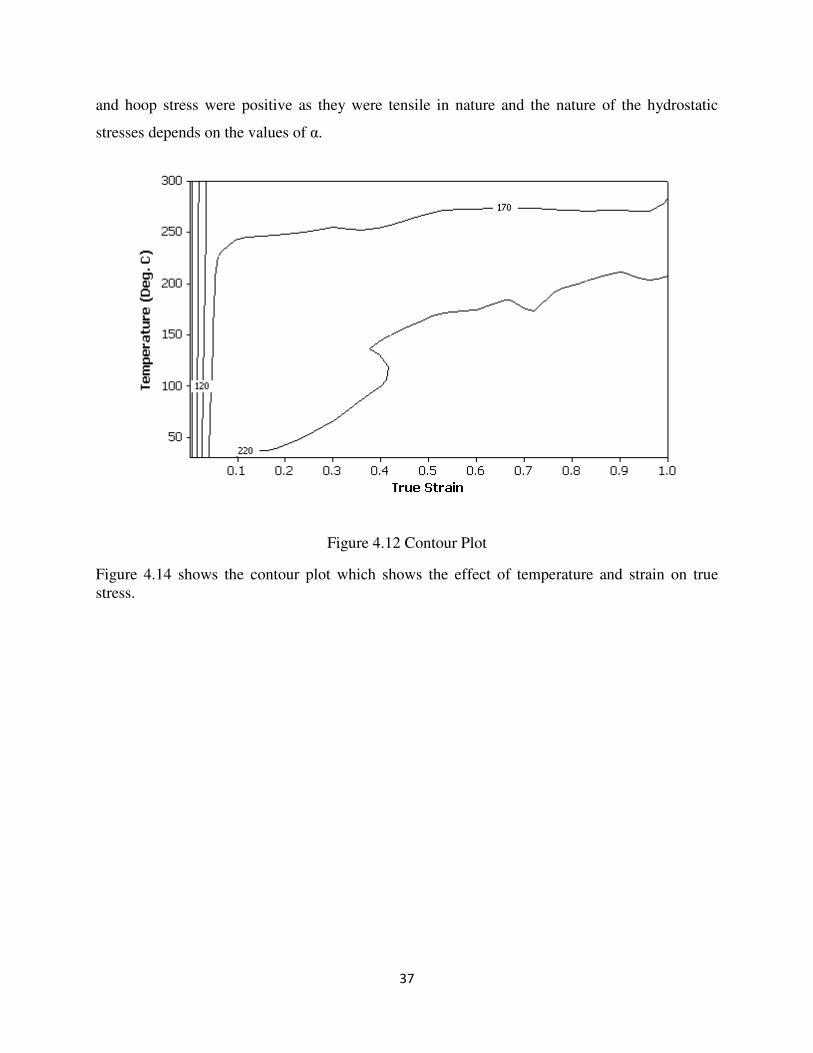
Figure 4.12 Contour Plot
Figure 4.14 shows the contour plot which shows the effect of temperature and strain on true
stress.

Chapter 5
Conclusions
38
5. Conclusions
Following conclusions were made from the above work:
(1) Flow stress, Strain hardening exponent n and strength coefficient K all decreases with the
increase in temperature. Consideration of taking barrel shape following as a circular arc
also holds good at elevated temperature.
(2) The calculated and measured radius of curvature of barrel was close to each other. The
radius value increases with the increase in test temperature and decreases with the
increases in amount of strain.
(3) The value of different stresses depends on the slope (α) of the hoop strain and axial strain.
Nature of the hydrostatic stress changes from compressive to tensile depending on α.
39
References
[1] Jin Nengping. et. al Hot deformation behavior of 7150 aluminum alloy during compression
at elevated temperature, Journal of Materials characterization 60 (2009)530-536.
[2] Poursina.M. et.al Flow stress behavior of two stainless steels: An experimental-numerical
investigation, Journal of materials processing technology 199 (2008) 287-294.
[3] Zhang Hui et.al, Hot deformation behavior of the new Al-Mg-Si-Cu aluminum alloy during
compression at elevated temperatures, Journal of Materials characterization58 (2007) 168-173.
[4] Xiu-yu WEI. et.al, Flow stress of 2197 Al-Li alloy during hot compression deformation,
Transaction of non ferrous metals society of China 17 (2007) s280-s284.
[5] Cerri.E. et.al, Hot compression behavior of the AZ91 magnesium alloy produced by high
pressure die casting, Journal of Materials Processing Technology 189 (2007) 97–106.
[6] Zhu. Su-Ming. et.al, A comparative study of the high temperature deformation behavior of
Fe-25Al and Fe-25Al-10Ti alloys, Journal of Scripta materialia 42 (2000) 905–910.
[7] Zhang.X.Y.et.al, Deformation behavior in isothermal compression of the TC11 titanium
alloy, Materials and Design 31 (2010) 2851–2857.
[8] Herrmann. J. et.al, Deformation behavior of iron-rich iron-aluminum alloys at high
temperatures, Acta Materialia 51 (2003) 3233–3242.
[9] Talebi Anaraki. M. et.al, Modeling of high temperature rheological behavior of AZ61 Mg-
alloy using inverse method and ANN, Materials and Design 29 (2008) 1701–1706.
40
[10] Mousavi Anijadan. S.H. et.al. Flow Stress Optimization for 304 Stainless Steel under Cold
and Warm Compression by Artificial Neural Network and Genetic Algorithm, Materials and
Design 28 (2007) 609-615.
[11] Aluko. O. et.al, Warm Compression Tests of Aluminum Alloy, Journal of Materials
Engineering and Performance 7 (1998) 474-478.
[12] Mandal S. et. al. Constitutive equations to predict high temperature flow stress in a Ti-
modified austenitic stainless steel, Journal of Materials science and engineering A 500 (2009)
114-121.
[13] Chen. Z.Y. et.al. Deformation Behavior of Aa6063 Aluminium Alloy After Removing
Friction Effect under Hot Working Conditions, Acta Metall. Sin. (Engl. Lett.) Vol.21 No.6
(2008) 451-458.
[14] Ramanathan. S. et.al. Hot Deformation Behavior of 2124 Al Alloy, Journal of Material
Science Technology, Vol.22 No.5, (2006) 611-615.
[15] Narayansamy. R. et.al, Phenomenon of Barreling in Aluminum Solid Cylinders during Cold
Upset Forming, Journal Of Materials Processing Technology 70 (1997) 17-21.
[16] Narayansamy. R. et.al, A Study on Barreling in Magnesium Alloy Solid Cylinders during
Cold Upset Forming, Journal of Materials Processing Technology 101 (2000) 64-69.
[17] Manisankar. K. et. al, Phenomenon of Barreling in Square Billets of Aluminum Alloy
during Cold Upset Forming, International Journal of Advance Manufacturing Technology 21
(2003) 84-49.
41
[18] Malayappan. S. et. al, Some Aspects on Barreling in Aluminum Solid Cylinders During
Cold Upset Forging using A Die with Constraints, Journal of Materials Processing Technology
135 (2003) 18-29.
[19] Manisankar. K. et. al, Effect of Friction on Barreling in Square Billets of Aluminum during
Cold Upset Forging, Journal Of Materials And Design 27 (2006) 147-155.
[20] Malayappan. S. et. al, Barreling of Aluminum Solid Cylinders during Cold Upsetting with
Differential Frictional Conditions at the Faces, International Journal of Advance Manufacturing
Technology 29 (2006) 41–48.
[21] Sljapic. V. et.al, Observations on Fracture in Axi-Symmetric and Three-Dimensional Cold
Upsetting of Brass, Journal of Materials Processing Technology 125-126 (2002) 267-274.
[22] Dieter George E., Mechanical Metallurgy. London, McGraw-Hill Book Company, 2005.
[23] Kalpakjian S. and Schmid. S. R., Manufacturing Engineering and Technology, Dorling
Kindersley (India) Pvt. Ltd., Pearson Education, 2009.
[24] http://www.instron.us/wa/home/default_en.aspx