Embed Size (px)
Citation preview
Original Article
Experimental analysis of aluminum alloyunder solid particle erosion process
Mohammad A Chowdhury1, Uttam K Debnath1,Dewan M Nuruzzaman2 and Md. Monirul Islam3
Abstract
The erosion behaviors of aluminum alloy have been evaluated practically at different test conditions under ambient
temperature. Irregular silica sand (SiO2) is used as an erodent within the range of 300–600 mm. The impact velocity
within 30–50 m/s, impact angle 15–90�, and stand-off distance 15–25 mm considered as related parameters. The max-
imum level of erosion is obtained at impact angle 15� which indicates the ductile manner of the tested alloy. The higher
the impact velocity, the higher the erosion rate as almost linear fashion is observed. Mass loss of aluminum alloy reduces
with the increase of stand-off distance. A dimensional analysis, erosion efficiency (Z) and relationship between friction
and erosion indicate the prominent correlation. The test results are designated using Taguchi’s concept to ensure the
minimization of observations for clarification of results in alternative process. ANOVA data analysis is considered to
signify the interaction of tested parameters as well as identifying most influencing operating parameter. S/N ratio indi-
cates that there are 2.92% deviations estimated between predicted and experimental results. To elaborately analyze the
results, GMDH method is mentioned. After erosion process of the tested composite, the damage propagation on the
surfaces is examined using SEM for confirming wear mechanisms. The elemental composition of eroded test samples at
varying percentage of aluminum is analyzed by energy dispersive X-ray spectroscopy analysis.
Keywords
Aluminum alloy, erosion rate, operating parameters, analyzing methods, ANOVA, GMDH, SEM and EDX
Date received: 2 June 2015; accepted: 25 February 2016
Introduction
Erosion is described as the progressive loss of originalmaterial from a solid surface due to mechanical inter-action between the surfaces and impinge solid orliquid particle which may be a multi-componentfluid or impinging solid or liquid particles also.Erosive damages of different materials in moderntechnological systems are very concerning issue forsustainability of the materials with these adverse con-ditions. In advanced engineering and industrial field,light weight of materials has several applications forminimizing the operating as well as initial investmentcost. In different environmental conditions, wind tur-bine, blower fan blade, hydraulic turbine impellers,the moving components of ship, aircraft, train andautomobile structure made by different metals andalloys experience the difficulty of impingement ofsolid particles in the form of erosion. Aluminumalloys can be used extensively in erosive wear envir-onment for their simple manufacturing technique,suitability to design different systems and mechan-isms, and also because of their low manufacturingcost. Concerning these facts, the aluminum alloy hasbeen chosen as test samples to examine the erosion
resistance at different operating conditions so thatthe exact nature of erosion can be identified.
The researches that have been done by differenttribology research groups1–6 realized that erosivewear of materials related with the various factorssuch as impingement angle, impact velocity, particlesize, particle shape, particle type, particle flux, tem-perature, nozzle geometry, type of materials, hardnessof the materials, stand-off distance, test duration,roughness of the tested materials, etc. Among thesefactors, impingement angle and impact velocity havebeen recognized as two parameters that noticeablyinfluence the erosion rates of different materials.7
1Department of Mechanical Engineering, Dhaka University of
Engineering and Technology, Gazipur, Bangladesh2Faculty of Manufacturing Engineering, University Malaysia Pahang,
Malaysia3Bangladesh Chemical Industries Cooperation, Dhaka, Bangladesh
Corresponding author:
Mohammad A Chowdhury, Department of Mechanical Engineering,
Dhaka University of Engineering and Technology, Gazipur 1700,
Bangladesh.
Email: [email protected]
Proc IMechE Part J:
J Engineering Tribology
2016, Vol. 230(12) 1516–1541
! IMechE 2016
Reprints and permissions:
sagepub.co.uk/journalsPermissions.nav
DOI: 10.1177/1350650116639466
pij.sagepub.com
by guest on November 15, 2016pij.sagepub.comDownloaded from
The erosive behavior of AISI 440C stainless steel andcermets has been conducted by researchers8 whoobserved that both of the materials exhibited notice-able plasticity during impact conditions, but in thecase of stainless steels it has been characterized tobe more ductile in nature. The blending conditionsof materials, temperature, pressure, and flow cancreate the erosive–corrosive wear especially for metaland alloys.9 Rather than different mechanical proper-ties and operating conditions, material hardness has acertain amount of role to propagate erosion damagethroughout the metals and alloys.10
The previous works1–10 on metal and alloys vary-ing with different operating and processing conditionsas well as mechanical properties and varying percent-age of material-combinations on erosion of materialscannot suggest any unique trends of the results.Therefore, the objective of this work is to investigatethe erosive wear performance of aluminum under sev-eral test conditions to understand the possible natureof erosion. A theoretical model for estimation of ero-sion wear rate under multiple impact conditions andcorrelation of erosion rate with U. No and friction co-efficient are developed. To analyze the obtainedresults in board concept, Taguchi, analysis of variance(ANOVA), erosion efficiency and group method datahandling (GMDH) approaches have been discussed.The morphology of damage surface incorporatingpossible nature has been analyzed using scanning elec-tronic microscopy (SEM). The elemental compositionof different locations of eroding aluminum surfaces isobtained by energy dispersive X-ray (spectroscopy)(EDX) analysis.
Experimental details
Materials properties, preparation and method oferosion measurement
The measured mechanical properties of tested of alu-minum alloy (Aluminum 6063) are listed in Table 1.Rectangle type specimens with a size of 50 mm�30mm�5 mm were prepared by utilizing a diamondcutter from injection–molded plaques. Before the ero-sive wear tests, all specimens were cleaned with acet-one. Great care was given to ensure clean surfacebefore and after wear tests. The sand used in experi-ments is naturally occurring granular material com-bined with a finely shaped rock and mineral particles.The moisture of the sand particle was removed usingelectric oven. Sand as well dust particles on the testsamples were cleaned after erosion test with air blast-ing and then balancing was done carefully.
Different grain sizes (300–355, 355–500, 500–600microns) with irregular shaped (combination ofrounded, slightly rounded and angular) dry quartztype silica sand (hardness: 42, 43.2, and 44 MPa, dens-ity 1436, 1440, and 1443 kg/m3) of chemical compos-ition SiO2 were used as an erodent particle. Motor
type vibration sieve machine (model: VSS-T, VinsystTechnologist, ISO 900, India) with measuringrange 97 mm to 4 mm was used to measure the particlesize. The weight of the samples before and after theerosion process was measured by using precisiondigital electronic balance (model: SP404D,Sciencetech Inc, USA). Erosion rates were calculatedfrom the differences of weight loss by considering unitof time
ER ¼Wbefore �Wafter
Time
� �: ð1Þ
The flow pattern of abrasive particle is related todifferent factors such as type of erodent materials,chemical composition, hardness, density, particleshape, and particle size and impact resistance.During experiments, under lower impact velocity,the pattern of flow of the abrasive particle was rea-lized almost similar to the laminar nature but withthe increase of velocity laminar as well as turbulentcombination of flow pattern was observed. But thechanging of impact angles may have some role forcharacterizing the flow of abrasive particle. In factthere were different modes of effect of flowing abra-sive under different operating conditions. In this con-text, elastic/plastic deformation by sliding–rubbinggrain movement; elastic/plastic deformation by roll-ing grain movement; chip formation (micro-cutting)by rubbing grain movement; ridges formation byrubbing and rolling grain movement; and low-cyclefatigue wear were identified. To ensure the exactabrasive flow, more researches can be conducted infuture study in relevant to experimental and analyt-ical point of view.
Test apparatus
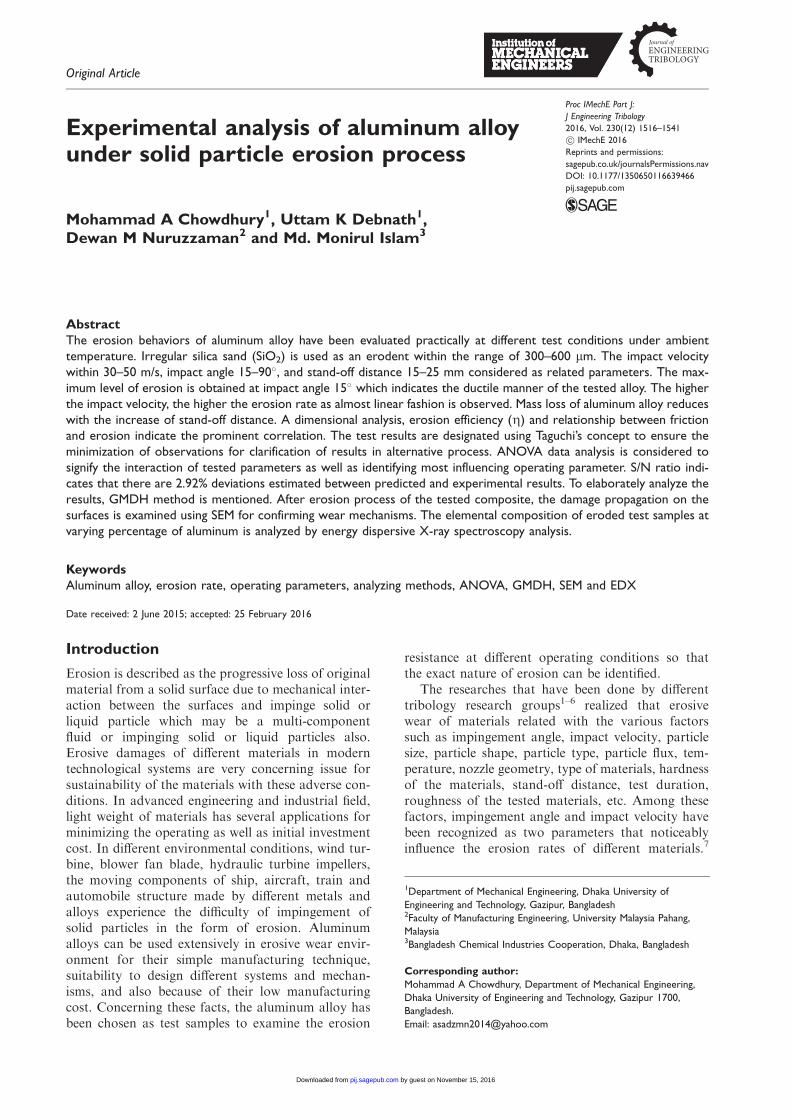
Sand blast erosive wear experimental device (Figure 1)was designed and fabricated for erosion test of alumi-num alloy. Sand comes out through the nozzle by theeffect of high pressure of compressed air at a higher
Table 1. Mechanical and related properties of aluminum alloy.
Property
Actual or
measured data Units (S.I.)
Density 2.822.7 gm/cc gm/cc
Tensile yield strength 278 MPa
Modulus of elasticity 68.5 GPa
Poisson’s ratio 0.332
Ultimate tensile strength 313 MPa
Hardness (brinell) 97
Melting point 658 (�C)
Boiling point 2450 (�C)
Thermal conductivity 0.58 Cal/cms. (�C)
Mean specific heat 0.220 Cal/gm. (�C)
Chowdhury et al. 1517
by guest on November 15, 2016pij.sagepub.comDownloaded from
velocity and strike on the test sample at differentimpact angles.
At the time of designing the number of observa-tions, 95% confidence level within 2% accuracy wasconsidered. In this context, each experiment arerepeated more than five times at identical conditions.Each experiment was conducted for 30 min.
Particles velocity measuring method
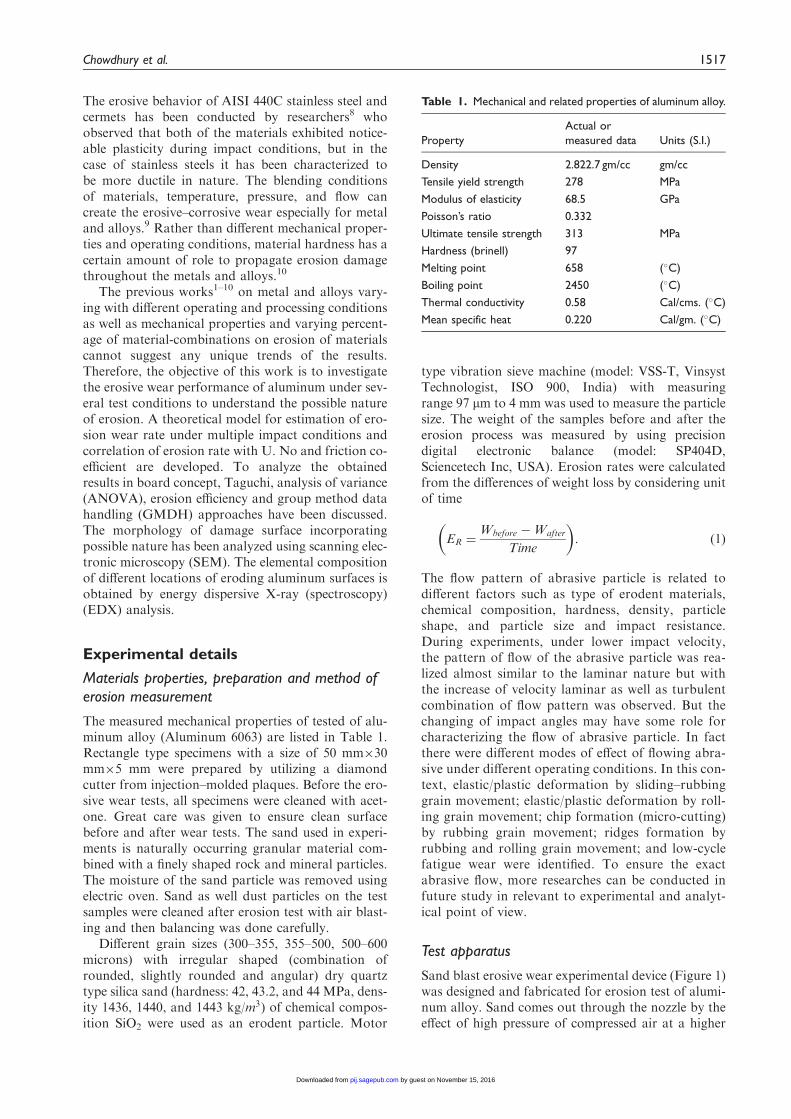
Double disc method has been used to calculatethe impingement velocity of solid particle using equa-tion (2). The mechanism followed for estimatingthe particle velocity indicated as a block diagram(Figure 2).
V ¼2 � RvL
Sð2Þ
where L ¼ distance between top and bottom horizon-tally arranged plate, v ¼ rotational rpm of top andbottom horizontally arranged plate, R ¼ radius fromcenter of bottom plate to point B and S¼ angulardistance between two color damaged locations(A and B). The measuring technique is described indifferent literatures.11,12 At different pressures,impingement velocity calibrations during this workare summarized in Table 2.
Signal-to noise ratio
Taguchi method describes the mathematical modelfor reducing the consuming of experimental period
and testing expenditure for considering the paramet-ric optimization in connection of estimating stablelevel of erosion rate under reasonable factors.Detailed explanation and clarification of control-lable experiments for identifying the ideal consider-ations, DOE (design of experiment) in such a case isa very effective analyzing process. Choosing of con-trol and fixed parameters is the significance of DOE.Here, considerable amount of factors are incorpo-rated for recognizing the less important variablesas early as possible. In previous studies, erosion ofthe metal alloy is mostly dependent on the impinge-ment velocity; in Table 3, controlling and constantfactors are listed. Considering the L27 (43) orthog-onal array design concept, the significance of fourvariable factors at four different stages aredesignated.
The first column indicates the variable param-eters and corresponding raw shows the experimen-tal conditions which are expressed in Table 4 asa blending of parameter levels. Four variable fac-tors distinctly at four stages may consider 43 ¼ 64runs in a full factorial experiment. On theother hand, Taguchi’s factorial technique minim-izes it to 27 runs providing better perception ofresults.
The numbers of test are characterized as an S/N(signal-to noise) ratio. Relating to the type of charac-teristics, various ratios exist. The analysis is based onthe concept of smaller is better characteristic.
Using this approach, this needs to be determined aslogarithmic formulation of the loss function as men-tioned under the following manner.
Gear
Sand Hopper
Pressure Gage
Mixing chamber
Nozzle
Sample holder
Feed gear
Compressor
Figure 1. Schematic diagram of the solid particle erosion rig.
1518 Proc IMechE Part J: J Engineering Tribology 230(12)
by guest on November 15, 2016pij.sagepub.comDownloaded from
In case of less is the improved quality characteris-tic, this can be estimated by the formula describedbelow
S
N¼ �10 log
1
n
Xy2
� �ð3Þ
where n is number of observations and y is theobserved data. ‘‘Less is the improved characteristic,’’concerning the mentioned S/N ratio transformation,is suitable for lowering the erosion rate. The design ofthe experimental data is listed in Table 5 where thesecond, third, fourth, and fifth columns are designatedas impact velocity (1A), impingement angle (2B),
Scar produced with disks stationary
Scar produced with disks rotatingLower disk
L
Upper disk
r
S
A
B
Particle nozzle Rotating shaft
Figure 2. Schematic diagram of methodology used for velocity calibration.
Table 2. The impact velocity calibration at various pressures.
Pressure (bar)
Speed of the
rotating disc (r/min)
Linear separation
of two marks (mm)
Impact
velocity (m/s)
Average impact
velocity (m/s)
3.5 4700
6.2 49.61
506.3 48.83
6.1 50.42
3 4500
7.4 39.98
407.2 40.88
7.4 39.78
2 4000
8.7 30.07
308.5 30.75
8.6 30.42
Table 3. Parameters of the setting.
Fixed parameters Fixed conditions/values Control factor Symbols
Nozzle diameter(mm) 5 Velocity of impact A
Length of nozzle(mm) 55 Angle of impingement B
Erodent Silica sand under dry condition Erodent size C
Erodent shape Irregular Stand-off distance D
Test temperature Room temperature
Erodent feed rate gm/s 4.56
Erodent micro-hardness (HV) 42–44
Chowdhury et al. 1519
by guest on November 15, 2016pij.sagepub.comDownloaded from

erodent size (3C), and stand-off distance (4D),respectively.
Results and discussion
Influence of impact velocity
In the erosion process, impingement velocity is aninfluencing parameter for sustainability of materiallife. The test conditions are randomly shaped silicasand of dimensions 300–355, 355–500 and 500–600mm, stand-off distance 15 mm and impingementangles 15, 30 and 60� at ambient temperature.Under these test environments, erosion rates specifythe almost gradually increasing trend with the raise ofimpingement velocity ranging from 30 to 50 m/s fortested aluminum alloy (Figure 3). In fact, particlesoccupy tremendous impact of kinetic energy at largevelocity causing higher level of impacting effect andresults in greater amount of erosion rate. In additionto that with increased velocity, the duration betweenimpacts is reduced and energy of the particle isincreased which causes higher level of mass loss.13
At 60� impacting angular adjustment of test sample,the kinetic energy 2052, 2793, 3648, 4617 and 5700 kg-m/ is estimated for impacting the velocities at 30, 35,40, 45 and 50 m/s, respectively. The propagation oftemperature variations are extended within the samplesurface with increasing velocity level. But, in reality,due the effect of some air cooling during impactingparticle by the compressor pressure, the increase oftemperature is not very significant. The similar ten-dency in results between impingement velocity anderosion rate are concluded by Nguyen et al.,14 Jhaet al.15 and ElTobgy et al.16 The extended thermalcharacteristics have been observed with high intensi-fied velocities. The temperature above the ambienttemperature level elevated from 8 to 19� for the vel-ocity enhancement in the range of 30–50 m/. The raiseof temperature in actual point of view may be signif-ied as a small amount due to the quick displacementof silica sand from the position as well as some cool-ing effect due to the compressed air pressure.
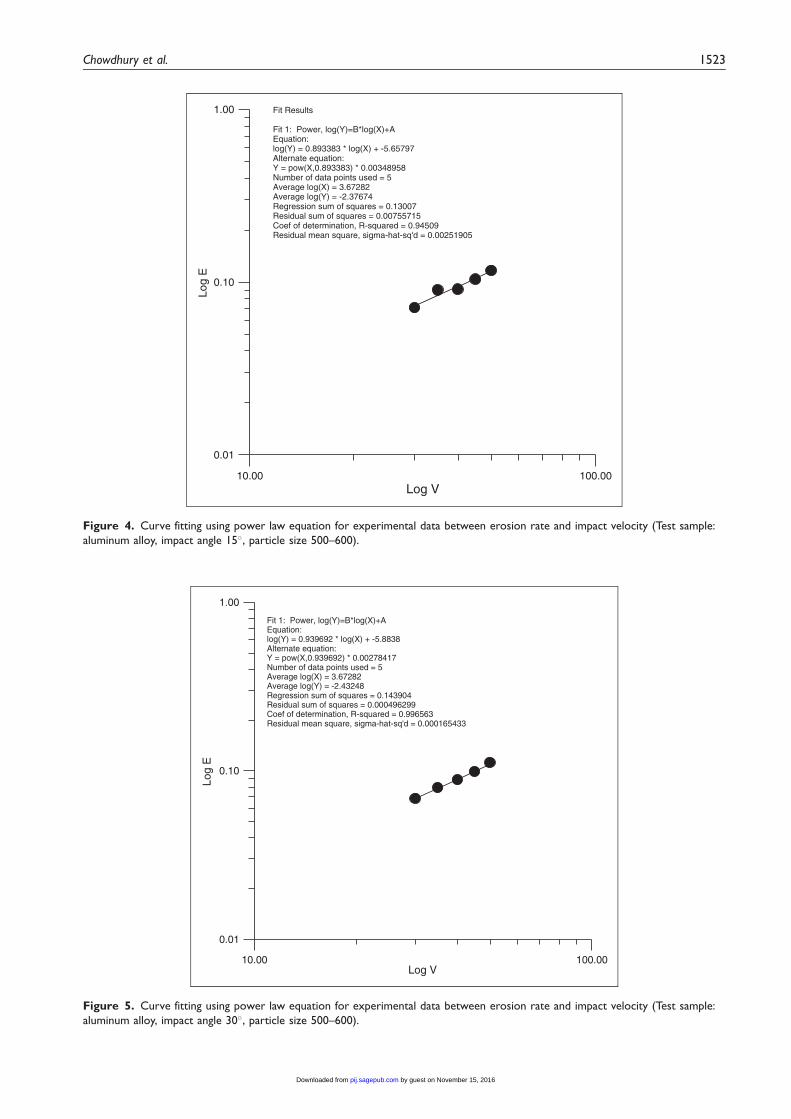
The least-squares fit concerning the actual datalevel was designated applying the concept of thepower law. In accordance of this perception, erodentparticle velocities of 30 m/s, 40 m/s and 50 m/s atimpingement angles 15�, 30�, and 60� are taken in toconsideration for these purposes.
The relationship between the stable erosive wearrate (E) and impingement velocity is stated as asimple power function formulated in the mentionedconcept
Er ¼ kvn: ð4Þ
In the above formulation, the velocity exponent n,the proportionality constant, k, involves the influenceof rest of the concerning parameters. The influence
of impact velocity on erosion rate of metals andalloys has been investigated to a limited extent. Thevelocity exponent (n) in general varies from 2 to 3and 3 to 5 which indicates that the materials are duc-tile and brittle in nature, respectively,17 The othermechanical properties (hardness, ultimate tensilestrength, modulus of elasticity, fracture toughness,yield stress, yield strain and rebound resilience, etc.)can be correlated with this designing and characteriz-ing concept.
The fitting parameters are listed in Table 6 and asan example the criteria of fitting calculation isexpressed in Figures 4–6 using GRAPHWIN soft-ware. Using the experimental data, the calculated vel-ocity exponents are obtained in the range of 0.89–0.99for multidirectional gear fiber composite at animpingement angle of 60�. This means that the findingof velocity exponents are almost closer to the expo-nents range mentioned by the different researchers forconformity of ductile behavior of tested material. Infact, the interesting observation in this study is that, inspite of that the standard range for ductile material iswithin 2–3, it has been found from the experimentaldata that this velocity exponent range is true for onlycertain lower velocities and lower particle size. But athigher impact velocities, the velocity exponent ishigher than that of the standard range. In this context,it can be realized that velocity exponent range varieswith impact velocity and particle size. In case of coef-ficient of determination, the relationship qualitybetween erosion rate and impact velocity for exponen-tial parameter is found to be stronger (94–99%) fortest samples.
Influence of impingement angle
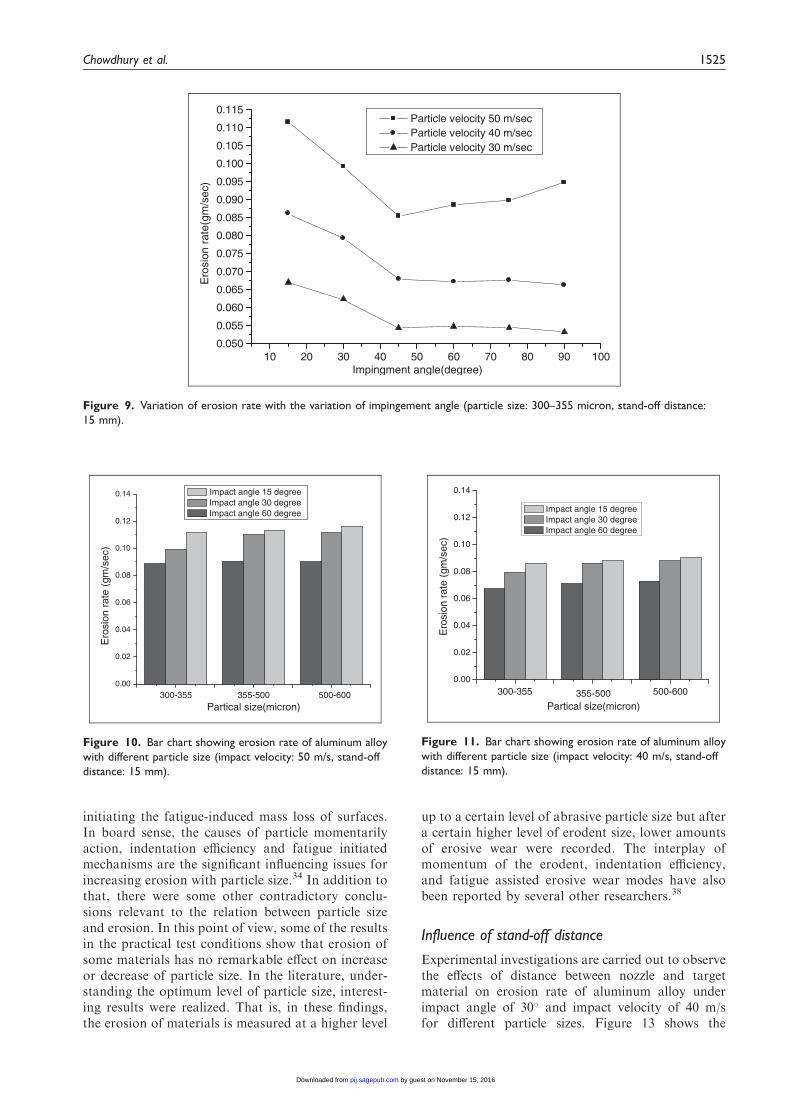
In order to study the effect of impingement angle onerosion rate, erosion tests were performed by varyingthe impact velocity from 30 to 50 m/s at impingementangles of 15� to 90� for different particle sizes. Theseresults are presented in Figures 7–9 which show theinfluence of impingement angle on the erosion rate ofaluminum alloy at different impact velocities and par-ticle sizes. It can be seen that erosion rate is maximumat 15� impingement angle for aluminum alloy at dif-ferent impact velocities and particle sizes studied. Theerosion rate in this study gradually decreases up to 45�
impact angle but starts increasing from 45� to 90�
impact angle at an impact velocity 50 m/s. That is,the second peak occurs at 90� impact angle. Theincreased erosion at 90� is characteristic of brittlematerials where the peak erosion occurs at normalincidence. At lower velocities, there is only a slightlyvariation of erosion rate ranging from 45 to 90�. Thatis, less brittleness characteristics has been occurred ascompared to higher velocity (50 m/s). The trends ofthe results are almost similar to the results available inthe literature.18,19 It is known that impingement angleis one of the most important parameters for the
1520 Proc IMechE Part J: J Engineering Tribology 230(12)
by guest on November 15, 2016pij.sagepub.comDownloaded from
erosion behavior of materials. In the erosion litera-ture, materials are broadly classified as ductile or brit-tle, based on the dependence of their erosion rate onimpingement angle. The behavior of ductile materialsis characterized by maximum erosion rate at lowimpingement angles (15�–30�). Brittle materials, onthe other hand, show maximum erosion undernormal impingement angle (90�). Some materialshave been shown, however, to exhibit a semi-ductilebehavior with maximum erosion occurring in theangular range 45–60�.20–22 However, the above classi-fication is not absolute as the erosion behavior of
metals and alloys but in reality it strongly dependsupon the experimental conditions, and mechanicaland chemical properties of target materials. In theliterature, there are no fixed trends of correlating duc-tility or brittleness of materials with �max or �min. It isfound that some target materials are characterized ina ductile manner; on the other hand, some show evi-dence of both ductile and brittle characteris-tics.7,21,23,24 Non-ferrous materials generally exhibita more ductile response than ferrous materials.25
The complexity of identifying the nature ofalloys and metals as ductile, semi-ductile or brittlebehavior makes it challenges for the researchers tosummarize unique conclusion. For example, Poolet al.26 reported that the maximum erosion rateoccurred at normal incidence for the copper-based alloy and cast iron which ensured the brittletype erosion behavior. Thus, though the use ofterms such as failure by ‘ductile’, ‘semi-ductile’ and‘brittle’ mechanisms is frequent and useful in under-standing erosion of materials, it is not strictly true inall cases.
Generally, ductile characteristics is more sensitiveto abrasive particles, and the maximum erosion lies inthe range of 15–30� as a result of micro cutting, micro-ploughing, and other damage accumulation processes.For brittle materials, mechanisms such as plasticdeformation and micro cracking are responsible forerosion rate for that property. Depending on theimpingement angle, cutting wear is dominant atacute angles while deformation wear is dominant athigh impingement angles.27,28 It has been wellaccepted that maximum erosion for ductile materialoccurs at low angles between 15 and 30� where cut-ting mechanism dominates, while lower erosionrates are seen for high impingement angles wheredeformation wear occurs. The reverse is true for brit-tle material.
Significance of particle size on erosion
Particle size has considerable effect on erosion of alu-minum alloy under various impact velocities for 15, 30and 60� impingement angles (Figures 10–12). Thesefigures indicate that the erosion rate of tested materialhas increasing trend of erosive wear loss with erodentsize. In earlier literature, it was realized thatresearches have been contributed by the scientistsemphasizing the actual and analytical effects of ero-dent size in considering solid particle erosion ofmetals, alloys, polymer and composites. In mostcases, erosive loss is increased with the increase oferodent size which have been confirmed and justifiedin previous studies.29�33 Sundararajan and Roy,34
Mondal et al.,35 Dundar and Inal,36 and Lynnet al.37 who performed erosion experiments using awide range of particle sizes, observed that the lowerdegree of collision efficiency of the particles are thefact for reducing erosive wear with lower erodent size.
Table 5. Orthogonal array for L16 (44) Taguchi design.
L27 (43) 1A 2B 3C 4D
1 1 1 1 1
2 1 1 2 2
3 1 1 3 3
4 1 2 1 2
5 1 2 2 3
6 1 2 3 1
7 1 3 1 3
8 1 3 2 1
9 1 3 3 2
10 2 1 1 2
11 2 1 2 3
12 2 1 3 1
13 2 2 1 3
14 2 2 2 1
15 2 2 3 2
16 2 3 1 1
17 2 3 2 2
18 2 3 3 3
19 3 1 1 3
20 3 1 2 1
21 3 1 3 2
22 3 2 1 1
23 3 2 2 2
24 3 2 3 3
25 3 3 1 2
26 3 3 2 3
27 3 3 3 1
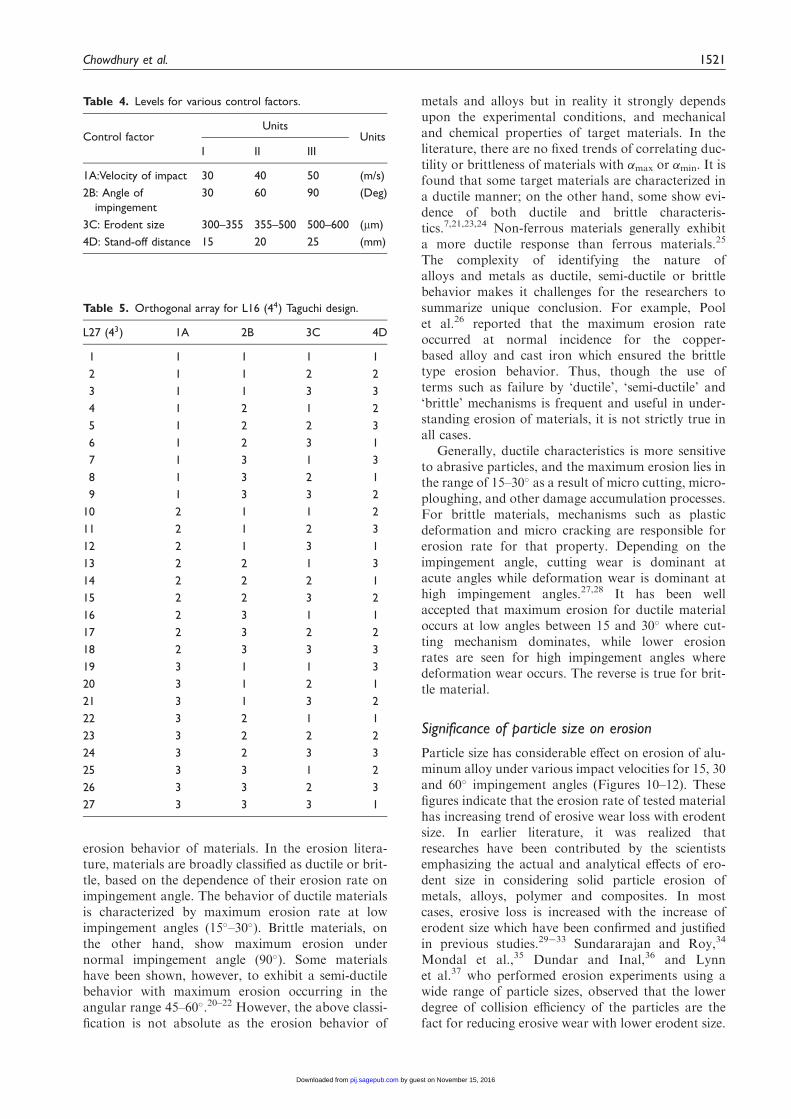
Table 4. Levels for various control factors.
Control factorUnits
Units
I II III
1A:Velocity of impact 30 40 50 (m/s)
2B: Angle of
impingement
30 60 90 (Deg)
3C: Erodent size 300–355 355–500 500–600 (mm)
4D: Stand-off distance 15 20 25 (mm)
Chowdhury et al. 1521
by guest on November 15, 2016pij.sagepub.comDownloaded from

According to their realization, they defined collisionefficiency, n as a ratio of the number of particles strik-ing a unit area of the surface in unit time to the sum ofparticles incorporated within the volume of suspen-sion swept by that area per unit time.37,38 The largerparticles size experiences retardation just earlier ofimpacting condition due to the over inertial phenom-ena. Therefore, their collision efficiency will be closeto unity.26
30 35 40 45 500.06
0.07
0.08
0.09
0.10
0.11
0.12(a)
(b)
(c)
Particle size 500-600 micron Particle size 355-500 micron Particle size 300-355 micron
Ero
sion
rat
e(gm
/sec
)
Impact velocity(m/sec)
30 35 40 45 50
0.06
0.07
0.08
0.09
0.10
0.11
Particle size 500-600 micron Particle size 355-500 micron Particle size 300-355 micron
Ero
sion
rat
e(gm
/sec
)
Impact velocity(m/sec)
30 35 40 45 500.050
0.055
0.060
0.065
0.070
0.075
0.080
0.085
0.090
0.095
Particle size 500-600 micron Particle size 355-500 micron Particle size 300-355 micron
Ero
sion
rat
e(gm
/sec
)
Impact velocity(m/sec)
Figure 3. Variation of erosion rate with the variation of impact velocity and erodent size (Impact angle: (a) 15�, (b) 30�, (c) 60� and
stand-off distance 15 mm).
Table 6. The power law calculated values at different
impingement angles.
Tested Material
Impingement
angle (�, �) k N R2
15 0.003489 0.9833 0.94
Aluminum alloy 30 0.002784 0.9396 0.99
60 0.002679 0.8931 0.98
1522 Proc IMechE Part J: J Engineering Tribology 230(12)
by guest on November 15, 2016pij.sagepub.comDownloaded from
00.00100.01Log V
0.01
0.10
1.00 Fit Results
Fit 1: Power, log(Y)=B*log(X)+AEquation:log(Y) = 0.893383 * log(X) + -5.65797Alternate equation:Y = pow(X,0.893383) * 0.00348958Number of data points used = 5Average log(X) = 3.67282Average log(Y) = -2.37674Regression sum of squares = 0.13007Residual sum of squares = 0.00755715Coef of determination, R-squared = 0.94509Residual mean square, sigma-hat-sq'd = 0.00251905
Log
E
Figure 4. Curve fitting using power law equation for experimental data between erosion rate and impact velocity (Test sample:
aluminum alloy, impact angle 15�, particle size 500–600).
00.00100.01
0.01
0.10
1.00
Fit 1: Power, log(Y)=B*log(X)+AEquation:log(Y) = 0.939692 * log(X) + -5.8838Alternate equation:Y = pow(X,0.939692) * 0.00278417Number of data points used = 5Average log(X) = 3.67282Average log(Y) = -2.43248Regression sum of squares = 0.143904Residual sum of squares = 0.000496299Coef of determination, R-squared = 0.996563Residual mean square, sigma-hat-sq'd = 0.000165433
Log
E
Log V
Figure 5. Curve fitting using power law equation for experimental data between erosion rate and impact velocity (Test sample:
aluminum alloy, impact angle 30�, particle size 500–600).
Chowdhury et al. 1523
by guest on November 15, 2016pij.sagepub.comDownloaded from

On the other hand, smaller particles would bemore susceptible to retardation before impact.Hence, their collision efficiency and kinetic energydissipated after impact will be lower, causing adecrease in the erosion rate. Many have reportedthat a higher erosion rate results when using alarger particle size, due to the higher energy transferduring the impact from particle to target material.The increased erosive wear and erodent size is asso-ciated with the causes mentioned below: (i) in the
first case, the enlargement of particle size, moment-arily as well as turbulent effect ensuring the greateramount of particle striking force on the tested sam-ples as a matter of propagation of indentationdamage on the eroded surfaces under repeatedaction within a short period of time and (ii) inanother cases, the continuing sticking of abrasiveelement of expanded size may continuously deterior-ate the subsurface lying underneath in such a casedamage indented surface of the target material
00.00100.01
0.01
0.10
Fit Results
Fit 1: Power, log(Y)=B*log(X)+AEquation:log(Y) = 0.893131 * log(X) + -5.92217Alternate equation:Y = pow(X,0.893131) * 0.00267937Number of data points used = 5Average log(X) = 3.67282Average log(Y) = -2.64186Regression sum of squares = 0.129997Residual sum of squares = 0.00169022Coef of determination, R-squared = 0.987165Residual mean square, sigma-hat-sq'd = 0.000563406
Log
E
Log V
Figure 6. Curve fitting using power law equation for experimental data between erosion rate and impact velocity (test sample:
aluminum alloy, impact angle 60�, particle size 500–600).
10 20 30 40 50 60 70 80 90 100
0.055
0.060
0.065
0.070
0.075
0.080
0.085
0.090
0.095
0.100
0.105
0.110
0.115
0.120 Impact velocity 50m/sec Impact velocity 40m/sec Impact velocity 30m/sec
Ero
sion
rat
e(gm
/sec
)
Impingement angle (degree)
Figure 7. Variation of erosion rate with the variation of
impingement angle (particle size: 500–600 micron, stand-off
distance: 15 mm).
10 20 30 40 50 60 70 80 90 100
0.055
0.060
0.065
0.070
0.075
0.080
0.085
0.090
0.095
0.100
0.105
0.110
0.115 Particle velocity 50 m/sec Particle velocity 40 m/sec Particle velocity 30 m/sec
Ero
sion
rat
e(gm
/sec
)
Impingment angle(degree)
Figure 8. Variation of erosion rate with the variation of
impingement angle (particle size: 355–500 micron, stand-off
distance: 15 mm).
1524 Proc IMechE Part J: J Engineering Tribology 230(12)
by guest on November 15, 2016pij.sagepub.comDownloaded from
initiating the fatigue-induced mass loss of surfaces.In board sense, the causes of particle momentarilyaction, indentation efficiency and fatigue initiatedmechanisms are the significant influencing issues forincreasing erosion with particle size.34 In addition tothat, there were some other contradictory conclu-sions relevant to the relation between particle sizeand erosion. In this point of view, some of the resultsin the practical test conditions show that erosion ofsome materials has no remarkable effect on increaseor decrease of particle size. In the literature, under-standing the optimum level of particle size, interest-ing results were realized. That is, in these findings,the erosion of materials is measured at a higher level
up to a certain level of abrasive particle size but aftera certain higher level of erodent size, lower amountsof erosive wear were recorded. The interplay ofmomentum of the erodent, indentation efficiency,and fatigue assisted erosive wear modes have alsobeen reported by several other researchers.38
Influence of stand-off distance
Experimental investigations are carried out to observethe effects of distance between nozzle and targetmaterial on erosion rate of aluminum alloy underimpact angle of 30� and impact velocity of 40 m/sfor different particle sizes. Figure 13 shows the
10 20 30 40 50 60 70 80 90 1000.050
0.055
0.060
0.065
0.070
0.075
0.080
0.085
0.090
0.095
0.100
0.105
0.110
0.115 Particle velocity 50 m/sec Particle velocity 40 m/sec Particle velocity 30 m/sec
Ero
sion
rat
e(gm
/sec
)
Impingment angle(degree)
Figure 9. Variation of erosion rate with the variation of impingement angle (particle size: 300–355 micron, stand-off distance:
15 mm).
0.00
0.02
0.04
0.06
0.08
0.10
0.12
0.14
Ero
sion
rat
e (g
m/s
ec)
Partical size(micron)
Impact angle 15 degree Impact angle 30 degree Impact angle 60 degree
300-355 355-500 500-600
Figure 10. Bar chart showing erosion rate of aluminum alloy
with different particle size (impact velocity: 50 m/s, stand-off
distance: 15 mm).
0.00
0.02
0.04
0.06
0.08
0.10
0.12
0.14
Ero
sion
rat
e (g
m/s
ec)
Partical size(micron)
Impact angle 15 degree Impact angle 30 degree Impact angle 60 degree
300-355 355-500 500-600
Figure 11. Bar chart showing erosion rate of aluminum alloy
with different particle size (impact velocity: 40 m/s, stand-off
distance: 15 mm).
Chowdhury et al. 1525
by guest on November 15, 2016pij.sagepub.comDownloaded from
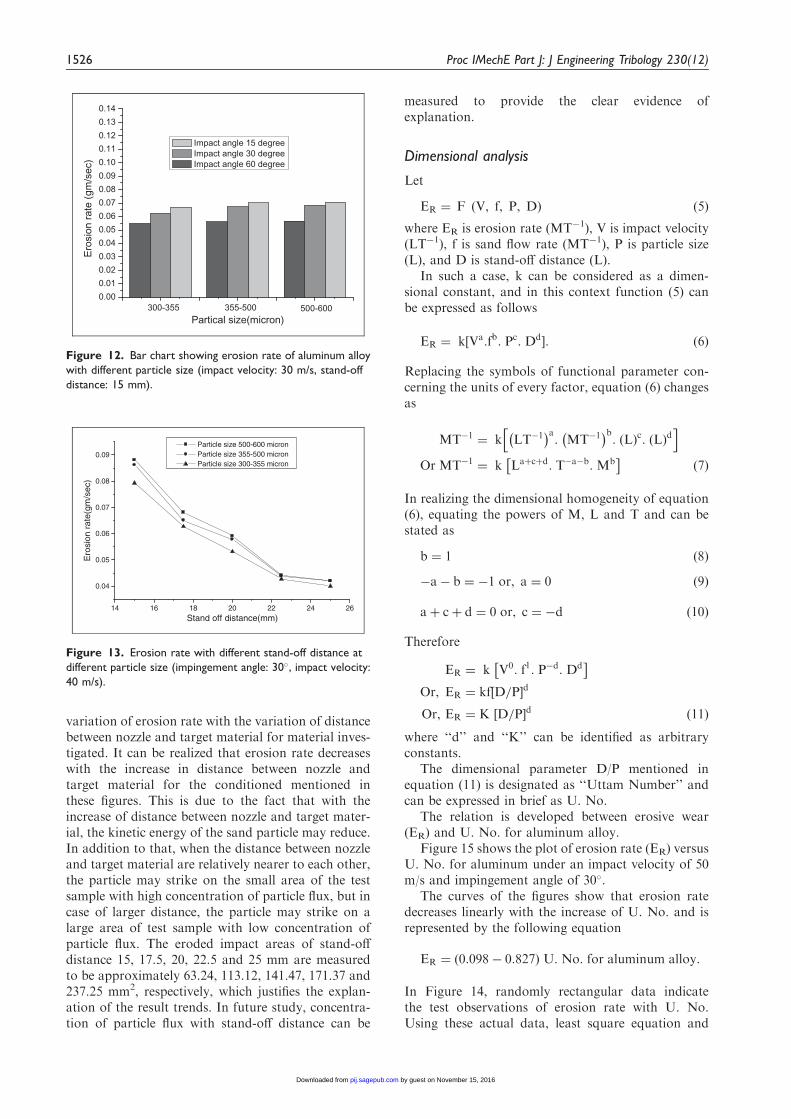
variation of erosion rate with the variation of distancebetween nozzle and target material for material inves-tigated. It can be realized that erosion rate decreaseswith the increase in distance between nozzle andtarget material for the conditioned mentioned inthese figures. This is due to the fact that with theincrease of distance between nozzle and target mater-ial, the kinetic energy of the sand particle may reduce.In addition to that, when the distance between nozzleand target material are relatively nearer to each other,the particle may strike on the small area of the testsample with high concentration of particle flux, but incase of larger distance, the particle may strike on alarge area of test sample with low concentration ofparticle flux. The eroded impact areas of stand-offdistance 15, 17.5, 20, 22.5 and 25 mm are measuredto be approximately 63.24, 113.12, 141.47, 171.37 and237.25 mm2, respectively, which justifies the explan-ation of the result trends. In future study, concentra-tion of particle flux with stand-off distance can be
measured to provide the clear evidence ofexplanation.
Dimensional analysis
Let
ER ¼ F V, f, P, Dð Þ ð5Þ
where ER is erosion rate (MT�1), V is impact velocity(LT�1), f is sand flow rate (MT�1), P is particle size(L), and D is stand-off distance (L).
In such a case, k can be considered as a dimen-sional constant, and in this context function (5) canbe expressed as follows
ER ¼ k½Va:fb: Pc: Dd�: ð6Þ
Replacing the symbols of functional parameter con-cerning the units of every factor, equation (6) changesas
MT�1 ¼ k LT�1� �a
: MT�1� �b
: Lð Þc: Lð Þdh i
Or MT�1 ¼ k Laþcþd: T�a�b:Mb�
ð7Þ
In realizing the dimensional homogeneity of equation(6), equating the powers of M, L and T and can bestated as
b ¼ 1 ð8Þ
�a� b ¼ �1 or, a ¼ 0 ð9Þ
aþ cþ d ¼ 0 or, c ¼ �d ð10Þ
Therefore
ER ¼ k V0: f1: P�d: Dd�
Or, ER ¼ kf D=P½ �d
Or, ER ¼ K D=P½ �d
ð11Þ
where ‘‘d’’ and ‘‘K’’ can be identified as arbitraryconstants.
The dimensional parameter D/P mentioned inequation (11) is designated as ‘‘Uttam Number’’ andcan be expressed in brief as U. No.
The relation is developed between erosive wear(ER) and U. No. for aluminum alloy.
Figure 15 shows the plot of erosion rate (ER) versusU. No. for aluminum under an impact velocity of 50m/s and impingement angle of 30�.
The curves of the figures show that erosion ratedecreases linearly with the increase of U. No. and isrepresented by the following equation
ER ¼ 0:098� 0:827ð Þ U: No: for aluminum alloy:
In Figure 14, randomly rectangular data indicatethe test observations of erosion rate with U. No.Using these actual data, least square equation and
0.00
0.01
0.02
0.03
0.04
0.05
0.06
0.07
0.08
0.09
0.10
0.11
0.12
0.13
0.14
Ero
sion
rat
e (g
m/s
ec)
Partical size(micron)
Impact angle 15 degree Impact angle 30 degree Impact angle 60 degree
300-355 355-500 500-600
Figure 12. Bar chart showing erosion rate of aluminum alloy
with different particle size (impact velocity: 30 m/s, stand-off
distance: 15 mm).
14 16 18 20 22 24 26
0.04
0.05
0.06
0.07
0.08
0.09 Particle size 500-600 micron Particle size 355-500 micron Particle size 300-355 micron
Ero
sion
rat
e(gm
/sec
)
Stand off distance(mm)
Figure 13. Erosion rate with different stand-off distance at
different particle size (impingement angle: 30�, impact velocity:
40 m/s).
1526 Proc IMechE Part J: J Engineering Tribology 230(12)
by guest on November 15, 2016pij.sagepub.comDownloaded from
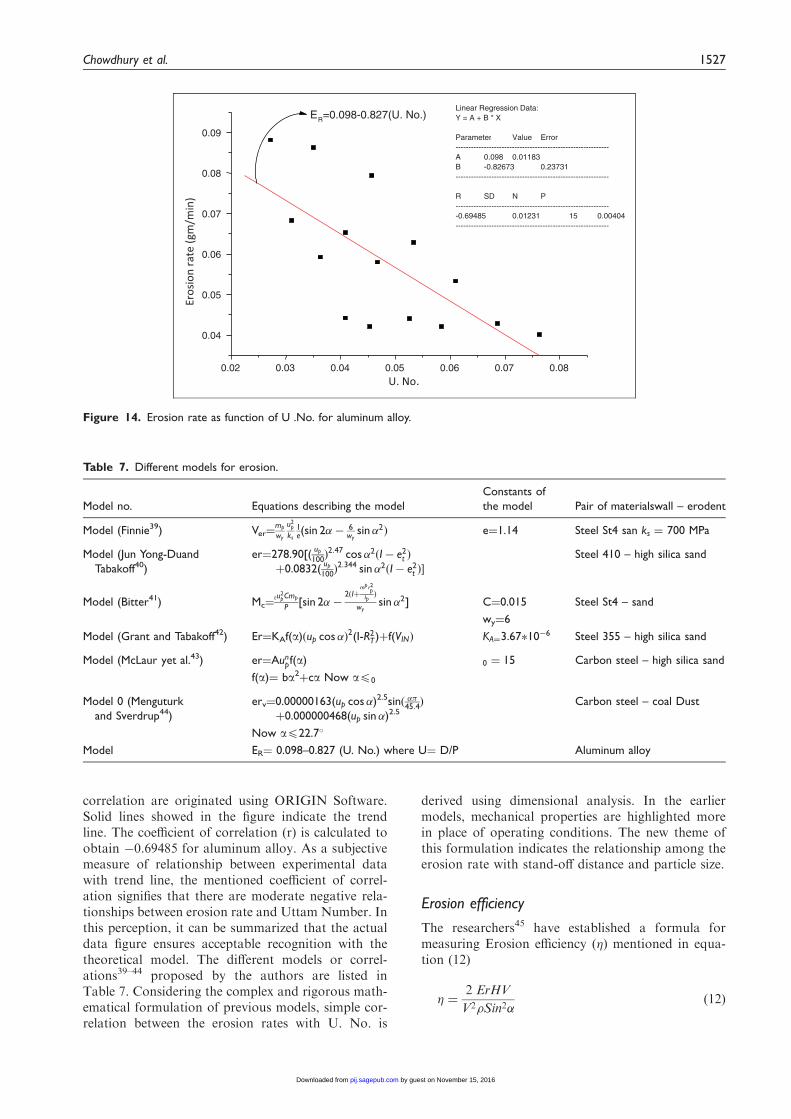
correlation are originated using ORIGIN Software.Solid lines showed in the figure indicate the trendline. The coefficient of correlation (r) is calculated toobtain �0.69485 for aluminum alloy. As a subjectivemeasure of relationship between experimental datawith trend line, the mentioned coefficient of correl-ation signifies that there are moderate negative rela-tionships between erosion rate and Uttam Number. Inthis perception, it can be summarized that the actualdata figure ensures acceptable recognition with thetheoretical model. The different models or correl-ations39–44 proposed by the authors are listed inTable 7. Considering the complex and rigorous math-ematical formulation of previous models, simple cor-relation between the erosion rates with U. No. is
derived using dimensional analysis. In the earliermodels, mechanical properties are highlighted morein place of operating conditions. The new theme ofthis formulation indicates the relationship among theerosion rate with stand-off distance and particle size.
Erosion efficiency
The researchers45 have established a formula formeasuring Erosion efficiency (�) mentioned in equa-tion (12)
� ¼2 ErHV
V2�Sin2�ð12Þ
0.02 0.03 0.04 0.05 0.06 0.07 0.08
0.04
0.05
0.06
0.07
0.08
0.09
ER=0.098-0.827(U. No.)Linear Regression Data:Y = A + B * X
Parameter Value Error------------------------------------------------------------A 0.098 0.01183B -0.82673 0.23731------------------------------------------------------------
R SD N P-------------------------------------------------------------0.69485 0.01231 15 0.00404------------------------------------------------------------
Eros
ion
rate
(gm
/min
)
U. No.
Figure 14. Erosion rate as function of U .No. for aluminum alloy.
Table 7. Different models for erosion.
Model no. Equations describing the model
Constants of
the model Pair of materialswall – erodent
Model (Finnie39) Ver¼mp
wy
u2p
ks
1e(sin 2�� 6
wysin�2Þ e¼1.14 Steel St4 san ks ¼ 700 MPa
Model (Jun Yong-Duand
Tabakoff40)
er¼278.90[(up
100Þ2:47 cos�2ðI� e2
t Þ
þ0.0832(up
100Þ2:344 sin�2ðI� e2
t Þ�
Steel 410 – high silica sand
Model (Bitter41) Mc¼tu
2pCmp
P[sin 2��
2ðIþmpr2
pIpÞ
wysin�2] C¼0.015 Steel St4 – sand
wy¼6
Model (Grant and Tabakoff42) Er¼KAf(a)ðup cos �Þ2(I-R2T)þf(VINÞ KA¼3.67�10�6 Steel 355 – high silica sand
Model (McLaur yet al.43) er¼Aunpf(a) 0 ¼ 15 Carbon steel – high silica sand
f(a)¼ ba2þca Now a40
Model 0 (Menguturk
and Sverdrup44)
erv¼0.00000163(up cos �)2.5sinð ��45:4Þ
þ0.000000468(up sin�)2.5Carbon steel – coal Dust
Now a422.7�
Model ER¼ 0.098–0.827 (U. No.) where U¼ D/P Aluminum alloy
Chowdhury et al. 1527
by guest on November 15, 2016pij.sagepub.comDownloaded from
where Er is stable level of erosive wear, HV is Vickershardness of impacting element, v is impingement vel-ocity and r is the density of silica sand. Detachmentof superficial layer in ideally micro ploughing effect oncrater has been realized without initiation of fracture(indicates non erosive nature), and it signifies zeroerosion efficiency. That is, ideally micro-cutting con-ditions are assumed to be unity. When erosive wearis most likely as a lip and simultaneously the initiationof fracturing characteristics, � can be considered atthe level of 0–1. Accordingly for the brittle material,when the erosive wear has been found due to materialspelling as well as removal of higher level of chunks(due to inter connection either lateral or radial crack-ing facts), in this case � can be assumed as larger than100%.
The hardness alone is unable to provide sufficientcorrelation with erosion rate, largely because it deter-mines only the volume displaced by each impact andnot really the volume of particle. Thus, a parameterwhich will reflect the efficiency with which the volumethat is displaced is removed should be combined withhardness to obtain a better correlation. The erosion
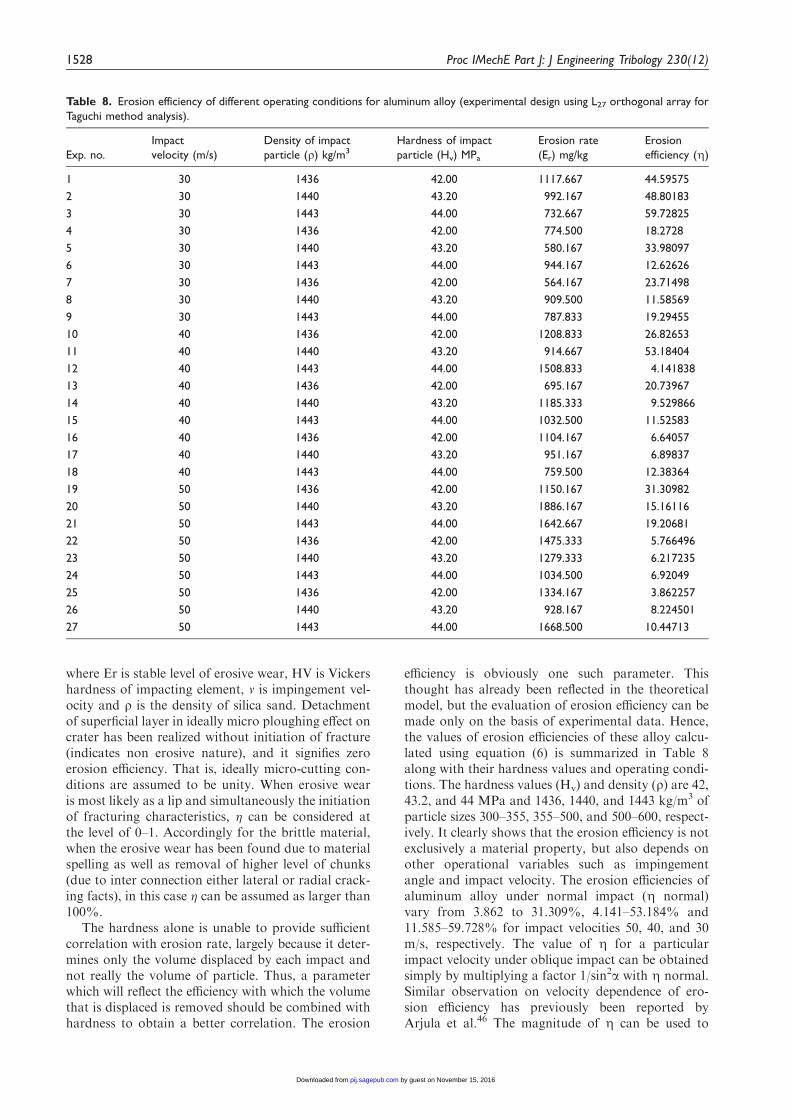
efficiency is obviously one such parameter. Thisthought has already been reflected in the theoreticalmodel, but the evaluation of erosion efficiency can bemade only on the basis of experimental data. Hence,the values of erosion efficiencies of these alloy calcu-lated using equation (6) is summarized in Table 8along with their hardness values and operating condi-tions. The hardness values (Hv) and density (r) are 42,43.2, and 44 MPa and 1436, 1440, and 1443 kg/m3 ofparticle sizes 300–355, 355–500, and 500–600, respect-ively. It clearly shows that the erosion efficiency is notexclusively a material property, but also depends onother operational variables such as impingementangle and impact velocity. The erosion efficiencies ofaluminum alloy under normal impact (Z normal)vary from 3.862 to 31.309%, 4.141–53.184% and11.585–59.728% for impact velocities 50, 40, and 30m/s, respectively. The value of Z for a particularimpact velocity under oblique impact can be obtainedsimply by multiplying a factor 1/sin2a with Z normal.Similar observation on velocity dependence of ero-sion efficiency has previously been reported byArjula et al.46 The magnitude of Z can be used to
Table 8. Erosion efficiency of different operating conditions for aluminum alloy (experimental design using L27 orthogonal array for
Taguchi method analysis).
Exp. no.
Impact
velocity (m/s)
Density of impact
particle (r) kg/m3Hardness of impact
particle (Hv) MPa
Erosion rate
(Er) mg/kg
Erosion
efficiency (Z)
1 30 1436 42.00 1117.667 44.59575
2 30 1440 43.20 992.167 48.80183
3 30 1443 44.00 732.667 59.72825
4 30 1436 42.00 774.500 18.2728
5 30 1440 43.20 580.167 33.98097
6 30 1443 44.00 944.167 12.62626
7 30 1436 42.00 564.167 23.71498
8 30 1440 43.20 909.500 11.58569
9 30 1443 44.00 787.833 19.29455
10 40 1436 42.00 1208.833 26.82653
11 40 1440 43.20 914.667 53.18404
12 40 1443 44.00 1508.833 4.141838
13 40 1436 42.00 695.167 20.73967
14 40 1440 43.20 1185.333 9.529866
15 40 1443 44.00 1032.500 11.52583
16 40 1436 42.00 1104.167 6.64057
17 40 1440 43.20 951.167 6.89837
18 40 1443 44.00 759.500 12.38364
19 50 1436 42.00 1150.167 31.30982
20 50 1440 43.20 1886.167 15.16116
21 50 1443 44.00 1642.667 19.20681
22 50 1436 42.00 1475.333 5.766496
23 50 1440 43.20 1279.333 6.217235
24 50 1443 44.00 1034.500 6.92049
25 50 1436 42.00 1334.167 3.862257
26 50 1440 43.20 928.167 8.224501
27 50 1443 44.00 1668.500 10.44713
1528 Proc IMechE Part J: J Engineering Tribology 230(12)
by guest on November 15, 2016pij.sagepub.comDownloaded from

characterize the nature and mechanism of erosion.For example, ideal micro ploughing involving justthe displacement of the material from the crater with-out any fracture (and hence no erosion) will result inZ¼0. In contrast, if the material removal is by idealmicro-cutting, Z¼1.0 or 100%. If erosion occurs bylip or platelet formation and their fracture by repeatedimpact, as is usually the case in the case of ductilematerials, the magnitude of Z will be very low, i.e.Z4100%. In the case of brittle materials, erosionoccurs usually by sapling and removal of largechunks of materials resulting from the interlinkingof lateral or radial cracks and thus Z can be expectedto be even greater than 100%.47 According to the cat-egorization made by this author, the erosion efficien-cies of the composites under the present study indicatethat at low impact speed, the erosion response is semi-ductile (Z¼10–100%). On the other hand, at relativelyhigher impact velocity, it exhibits ductile (Z<10%)erosion behavior.
Effect of friction coefficient
During the experiments, it has been realized that atthe time of contacting high velocity solid particle onthe tested materials, the impact velocity is assumed tohave generated in parallel and normal components(Figure 15). In fact, in this case, impacting of solidparticle on the target material may cause somemotion, and on the other hand, some resistance hasbeen assumed to be created due to some mechanicalproperties (such as hardness, tensile strength, etc.) oftarget material. Considering this approach, frictioncoefficient was calculated in relation to angle under
0.0 0.5 1.0 1.5 2.0 2.5 3.0 3.5 4.0
0.056
0.058
0.060
0.062
0.064
0.066
0.068
0.070
0.072ER=0.07527-[0.01806FC]+0.00349FC
2
Ero
sion
rat
e(gm
/sec
)
Friction co-efficien(FC)
Figure 18. Erosion rate as function of friction co-efficient
(Fc) for aluminum alloy at impact velocity 30 m/s.
0.0 0.5 1.0 1.5 2.0 2.5 3.0 3.5 4.0
0.090
0.095
0.100
0.105
0.110
0.115
0.120
ER=0.12538-[0.03582FC]+0.0077FC
2
Ero
sion
(gm
/sec
)
Friction co-efficient(Fc )
Figure 16. Erosion rate as function of friction co-efficient
(Fc) for aluminum alloy at impact velocity 50 m/s.
0.0 0.5 1.0 1.5 2.0 2.5 3.0 3.5 4.0
0.070
0.075
0.080
0.085
0.090ER=0.09628-[0.02332FC]+0.00444Fc
2
Ero
sion
rat
e(gm
/sec
)
Friction co-efficient(FC)
Figure 17. Erosion rate as function of friction co-efficient
(Fc) for aluminum alloy at impact velocity 40 m/s.
Table 9. Friction coefficient and corresponding erosion rate
at impact velocity 50 m/s.
Impingement
angle (�)
Friction
coefficient
Corresponding
erosion rate at
impact velocity 50 m/s
15 0.268 0.11624
30 0.577 0.11143
45 1 0.08996
60 1.732 0.09006
75 3.732 0.09861
θ
F Fy
Fx
θ
Figure 15. Impact velocity in parallel and normal directions.
Chowdhury et al. 1529
by guest on November 15, 2016pij.sagepub.comDownloaded from

theoretical ground. Applying force analysis, keepingin mind the frictional force (F) and tangential force(R), the friction coefficient can be calculated by thefollowing ways
FX ¼ F Sin� and F ¼1
2mv2
where horizontal force F X ¼12mv2, and Siny and
vertical force are equal to the reaction force
FY ¼ R ¼1
2mv2Cos�:
We know that the frictional force F¼mR
or � ¼F
R
or � ¼ tan�:
Friction coefficients calculated from the above equa-tion and their corresponding erosion rate at 15–75�
impact angles and impact velocity of 50 m/s arelisted in Table 9.
Figures 16–18 show the plot of erosion rate (ER)versus friction coefficient for aluminum alloy atimpact velocities of 50 m/s, 40 m/s, and 30 m/s. InFigures 16–18, the square scatter points show theexperimental relation between the erosion rate andfriction co-efficient. To justify the experimental rela-tion with theoretical context, liner regression and cor-relation are developed by using ORIGIN software.Continuous lines shown in these figures indicate thepolynomial regression lines. The coefficients of correl-ations are 0.8575, 0.79756, and 0.86395 for aluminumalloy, respectively. These coefficients of correlationsindicate that there are strong positive relationshipsbetween erosion rate and friction co-efficient for alu-minum alloy. In this assessment, the test data arecorrelated with theoretic computation in the justifiedacceptable level.
Steady state erosion aluminum alloy
In Table 10, the first, second, third, fourth, fifth andsixth column represents impact velocity, impingement
Table 10. Variation of erosion rate with different operating conditions for aluminum alloy (Experimental design using L27 orthogonal
array for Taguchi method analysis).
Exp. no.
Impact
velocity
1A (m/s)
Impingement
angle 2B (�)
Particlesize
3C (mm)
Stand-off
distance
4D (mm)
Erosion rate
(Er) mg/kg S/N ratio (dB)
1 30 30 300–355 15 1117.667 �60.9662
2 30 30 355–500 20 992.166 �59.9317
3 30 30 500–600 25 732.666 �57.2981
4 30 60 300–355 20 774.500 �57.7804
5 30 60 355–500 25 580.166 �55.2711
6 30 60 500–600 15 944.166 �59.501
7 30 90 300–355 25 564.166 �55.0281
8 30 90 355–500 15 909.500 �59.1761
9 30 90 500–600 20 787.833 �57.9287
10 40 30 300–355 20 1208.833 �61.6473
11 40 30 355–500 25 914.667 �59.2253
12 40 30 500–600 15 1508.833 �63.5728
13 40 60 300–355 25 695.167 �56.8418
14 40 60 355–500 15 1185.333 �61.4768
15 40 60 500–600 20 1032.500 �60.2778
16 40 90 300–355 15 1104.167 �60.8607
17 40 90 355–500 20 951.167 �59.5651
18 40 90 500–600 25 759.500 �57.6106
19 50 30 300–355 25 1150.167 �61.2152
20 50 30 355–500 15 1886.167 �65.5116
21 50 30 500–600 20 1642.667 �64.311
22 50 60 300–355 15 1475.333 �63.3778
23 50 60 355–500 20 1279.333 �62.1397
24 50 60 500–600 25 1034.500 �60.2946
25 50 90 300–355 20 1334.167 �62.5042
26 50 90 355–500 25 928.167 �59.3525
27 50 90 500–600 15 1668.500 �64.4465
1530 Proc IMechE Part J: J Engineering Tribology 230(12)
by guest on November 15, 2016pij.sagepub.comDownloaded from
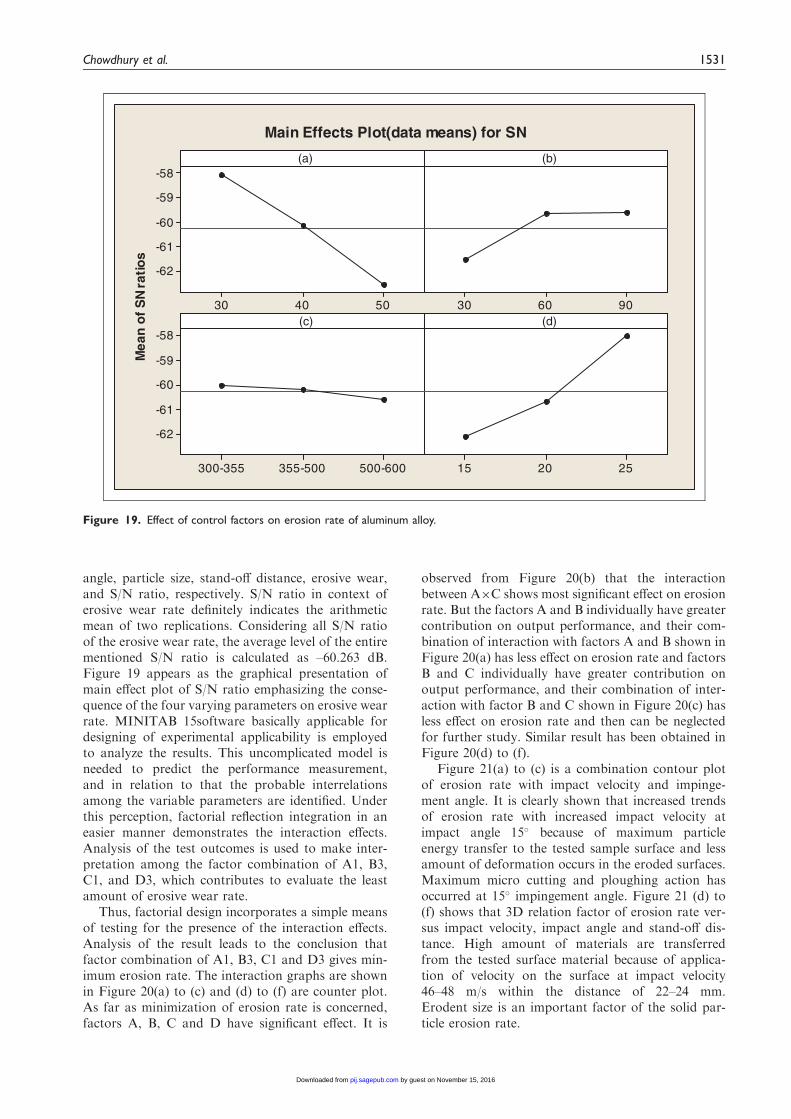
angle, particle size, stand-off distance, erosive wear,and S/N ratio, respectively. S/N ratio in context oferosive wear rate definitely indicates the arithmeticmean of two replications. Considering all S/N ratioof the erosive wear rate, the average level of the entirementioned S/N ratio is calculated as –60.263 dB.Figure 19 appears as the graphical presentation ofmain effect plot of S/N ratio emphasizing the conse-quence of the four varying parameters on erosive wearrate. MINITAB 15software basically applicable fordesigning of experimental applicability is employedto analyze the results. This uncomplicated model isneeded to predict the performance measurement,and in relation to that the probable interrelationsamong the variable parameters are identified. Underthis perception, factorial reflection integration in aneasier manner demonstrates the interaction effects.Analysis of the test outcomes is used to make inter-pretation among the factor combination of A1, B3,C1, and D3, which contributes to evaluate the leastamount of erosive wear rate.
Thus, factorial design incorporates a simple meansof testing for the presence of the interaction effects.Analysis of the result leads to the conclusion thatfactor combination of A1, B3, C1 and D3 gives min-imum erosion rate. The interaction graphs are shownin Figure 20(a) to (c) and (d) to (f) are counter plot.As far as minimization of erosion rate is concerned,factors A, B, C and D have significant effect. It is
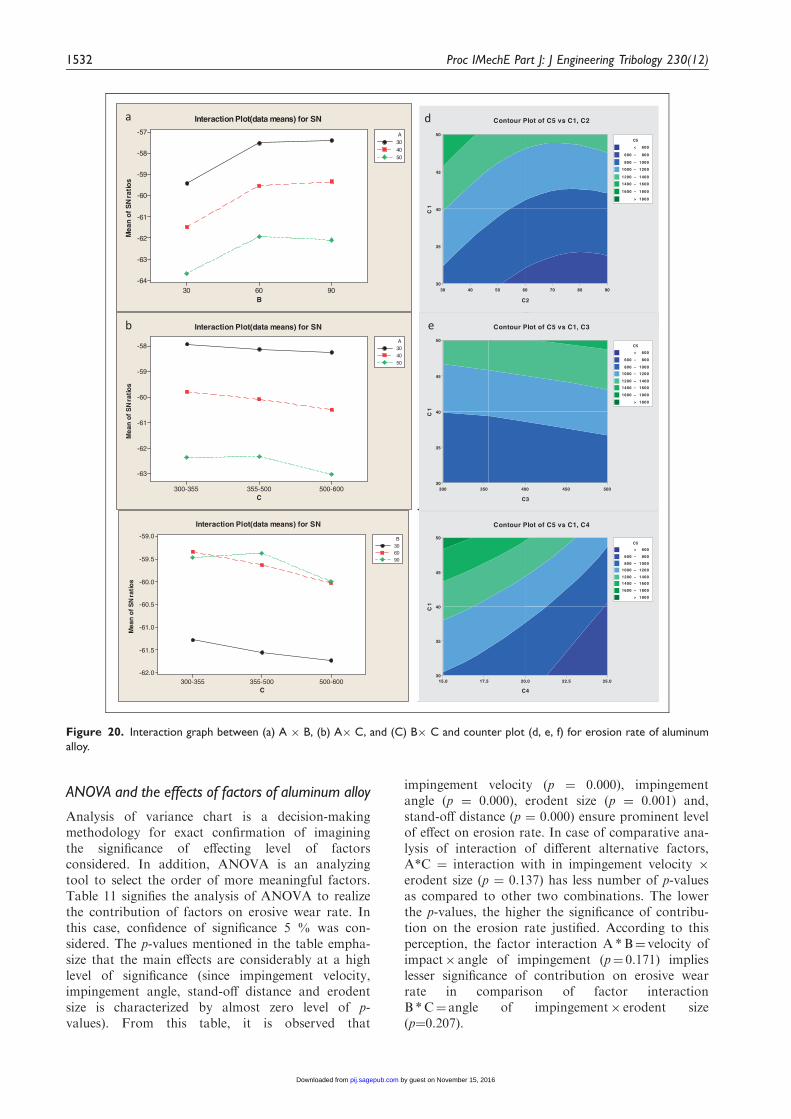
observed from Figure 20(b) that the interactionbetween A�C shows most significant effect on erosionrate. But the factors A and B individually have greatercontribution on output performance, and their com-bination of interaction with factors A and B shown inFigure 20(a) has less effect on erosion rate and factorsB and C individually have greater contribution onoutput performance, and their combination of inter-action with factor B and C shown in Figure 20(c) hasless effect on erosion rate and then can be neglectedfor further study. Similar result has been obtained inFigure 20(d) to (f).
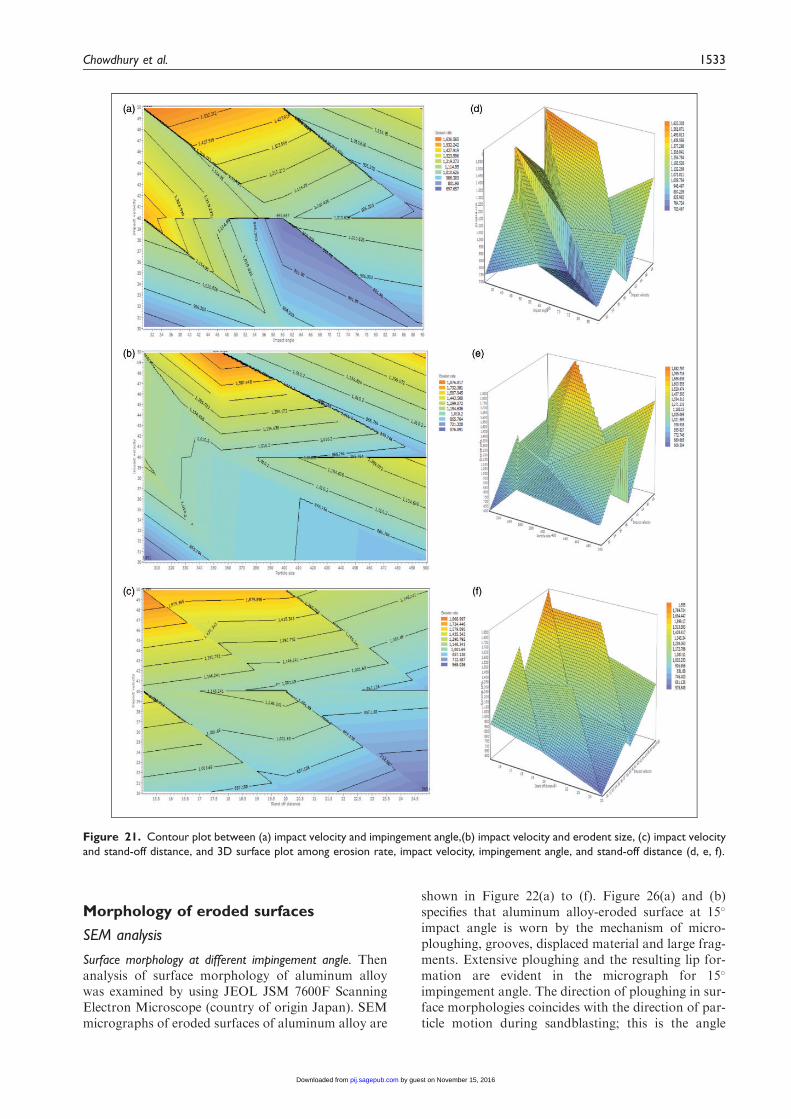
Figure 21(a) to (c) is a combination contour plotof erosion rate with impact velocity and impinge-ment angle. It is clearly shown that increased trendsof erosion rate with increased impact velocity atimpact angle 15� because of maximum particleenergy transfer to the tested sample surface and lessamount of deformation occurs in the eroded surfaces.Maximum micro cutting and ploughing action hasoccurred at 15� impingement angle. Figure 21 (d) to(f) shows that 3D relation factor of erosion rate ver-sus impact velocity, impact angle and stand-off dis-tance. High amount of materials are transferredfrom the tested surface material because of applica-tion of velocity on the surface at impact velocity46–48 m/s within the distance of 22–24 mm.Erodent size is an important factor of the solid par-ticle erosion rate.
504030
-58
-59
-60
-61
-62
906030
500-600355-500300-355
-58
-59
-60
-61
-62
252015
(a)
Mea
n o
f S
N ra
tios
(b)
(c) (d)
Main Effects Plot(data means) for SN
Figure 19. Effect of control factors on erosion rate of aluminum alloy.
Chowdhury et al. 1531
by guest on November 15, 2016pij.sagepub.comDownloaded from
ANOVA and the effects of factors of aluminum alloy
Analysis of variance chart is a decision-makingmethodology for exact confirmation of imaginingthe significance of effecting level of factorsconsidered. In addition, ANOVA is an analyzingtool to select the order of more meaningful factors.Table 11 signifies the analysis of ANOVA to realizethe contribution of factors on erosive wear rate. Inthis case, confidence of significance 5 % was con-sidered. The p-values mentioned in the table empha-size that the main effects are considerably at a highlevel of significance (since impingement velocity,impingement angle, stand-off distance and erodentsize is characterized by almost zero level of p-values). From this table, it is observed that
impingement velocity (p ¼ 0.000), impingementangle (p ¼ 0.000), erodent size (p ¼ 0.001) and,stand-off distance (p ¼ 0.000) ensure prominent levelof effect on erosion rate. In case of comparative ana-lysis of interaction of different alternative factors,A*C ¼ interaction with in impingement velocity �erodent size (p ¼ 0.137) has less number of p-valuesas compared to other two combinations. The lowerthe p-values, the higher the significance of contribu-tion on the erosion rate justified. According to thisperception, the factor interaction A*B¼ velocity ofimpact� angle of impingement (p¼ 0.171) implieslesser significance of contribution on erosive wearrate in comparison of factor interactionB *C¼ angle of impingement� erodent size(p¼0.207).
906030
-57
-58
-59
-60
-61
-62
-63
-64
B
Mea
n o
f S
N ra
tios
304050
A
Interaction Plot(data means) for SN
500-600355-500300-355
-58
-59
-60
-61
-62
-63
C
Mea
n o
f S
N ra
tios
304050
A
Interaction Plot(data means) for SN
b
C2
C1
60
50
45
40
35
>
–
–
–
–
–
–
< 600
600 800
800 1000
1000 1200
1200 1400
1400 1600
1600 1800
1800
C5
Contour Plot of C5 vs C1, C2
C3
C1
500450400350300
50
45
40
35
30
>
–
–
–
–
–
–
< 600
600 800
800 1000
1000 1200
1200 1400
1400 1600
1600 1800
1800
C5
Contour Plot of C5 vs C1, C3
C2
C1
90807060504030
50
45
40
35
30
>
–
–
–
–
–
–
< 600
600 800
800 1000
1000 1200
1200 1400
1400 1600
1600 1800
1800
C5
Contour Plot of C5 vs C1, C2a
b
d
e
500-600355-500300-355
-59.0
-59.5
-60.0
-60.5
-61.0
-61.5
-62.0
C
Mea
n o
f S
N ra
tios
306090
B
Interaction Plot(data means) for SN
c
C4
C1
25.022.520.017.515.0
50
45
40
35
30
>
–
–
–
–
–
–
< 600
600 800
800 1000
1000 1200
1200 1400
1400 1600
1600 1800
1800
C5
Contour Plot of C5 vs C1, C4
Figure 20. Interaction graph between (a) A � B, (b) A� C, and (C) B� C and counter plot (d, e, f) for erosion rate of aluminum
alloy.
1532 Proc IMechE Part J: J Engineering Tribology 230(12)
by guest on November 15, 2016pij.sagepub.comDownloaded from
Morphology of eroded surfaces
SEM analysis
Surface morphology at different impingement angle. Thenanalysis of surface morphology of aluminum alloywas examined by using JEOL JSM 7600F ScanningElectron Microscope (country of origin Japan). SEMmicrographs of eroded surfaces of aluminum alloy are
shown in Figure 22(a) to (f). Figure 26(a) and (b)specifies that aluminum alloy-eroded surface at 15�
impact angle is worn by the mechanism of micro-ploughing, grooves, displaced material and large frag-ments. Extensive ploughing and the resulting lip for-mation are evident in the micrograph for 15�
impingement angle. The direction of ploughing in sur-face morphologies coincides with the direction of par-ticle motion during sandblasting; this is the angle
Figure 21. Contour plot between (a) impact velocity and impingement angle,(b) impact velocity and erodent size, (c) impact velocity
and stand-off distance, and 3D surface plot among erosion rate, impact velocity, impingement angle, and stand-off distance (d, e, f).
Chowdhury et al. 1533
by guest on November 15, 2016pij.sagepub.comDownloaded from
where the higher amount of erosion has been notedunder all test conditions. Materials which show duc-tile erosion behavior can be easily worn off by micro-ploughing erosion mechanisms caused by the lateralimpact of the particles. In Figure 22(c) and (d) at 30�
impingement angle, pitting action and craters haveoccurred as a result lower erosion rate of the alltested materials. On the other hand, at 60� impinge-ment angle plastic deformation, craters and microcutting action have occurred which are shown inFigure 22(e) and (f). The reduction in mass loss athigher impact angles near or at 90� at velocity lowerthan 50 m/s is because there was not too much evi-dence of sliding action of abrasive particles unlikelower impact angles where the sliding component issignificant and increases the mass lost in the material.But the reverse is true in few cases for high impactvelocity 50 m/s due to the quick impacting at shortcontact time between particle and target surface.
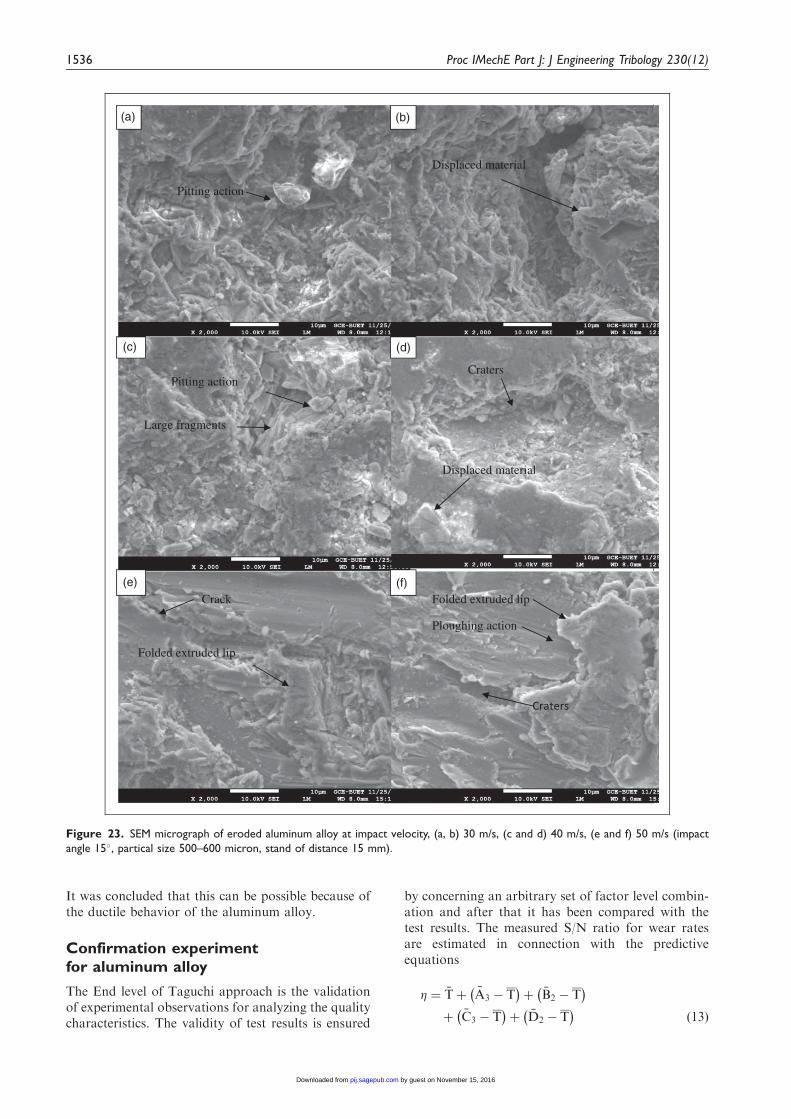
Surface morphology with different impact velocity. Surfacemorphology at different impact velocity has been pre-sented in Figure 23(a) to (d) for analyzing the wearmechanism. Figure 23 (a, b) under impact velocity 30m/s was emphasized the lower erosion rate due todisplaced material and putting action. This is becauseof the low particle energy. Figure 23(c) and (d) showsthat the damage has been occurred on the target sur-face at impact velocity of 40 m/s. In this case, thedamage has been done by the influence of craters,pitting action. At higher impact velocity (50 m/s)dueto the effect of crack and ploughing action, a higherlevel of erosion is obtained as a result of high particleenergy (Figure 23(e) and (f)).
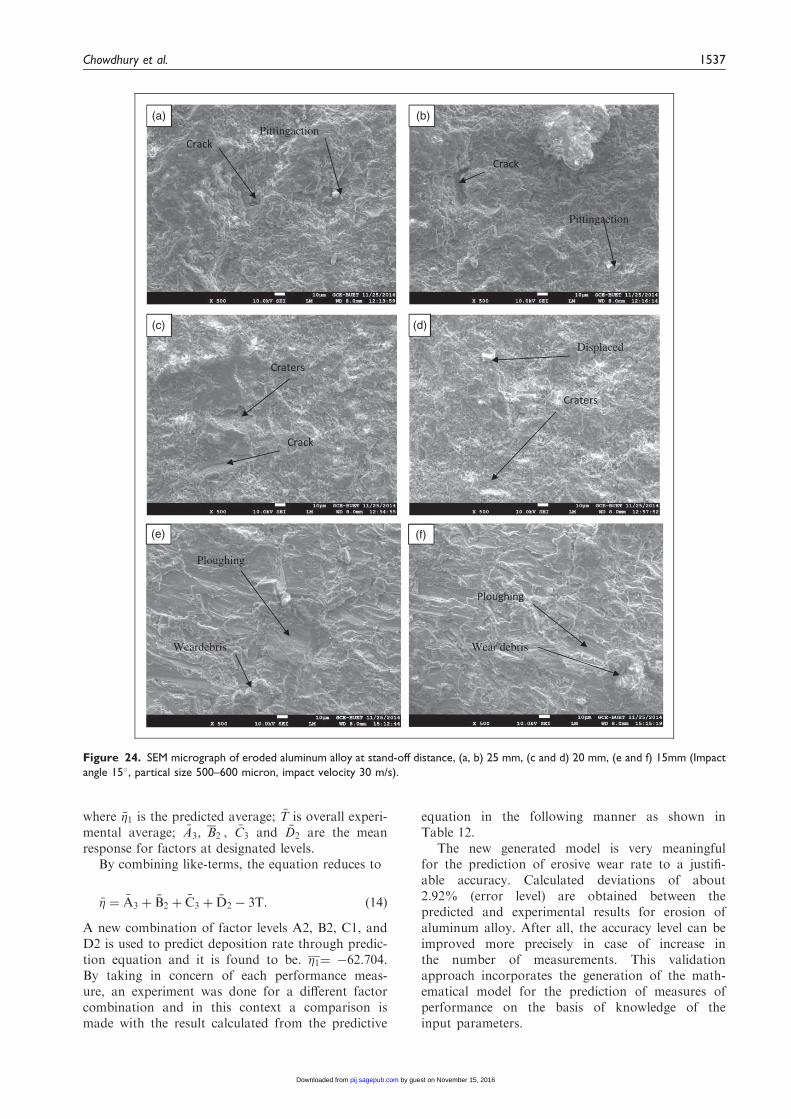
Surface morphology at different stand off distance. The sur-face morphology of eroded surfaces of tested alumi-num alloy was analyzed in relation to stand-offdistance. Figure 24(a) and (b) shows that at stand-off distance 25 mm, the lower values of erosion rateare calculated due to crack and pitting action. In thecase of stand-off distance 20 mm mentioned inFigure 24(c) and (d), the combination of craters,
crack and displaced materials are observed. Underlow stand-off distance, that is 15 mm, wear debrisand ploughing action are responsible for highervalues of erosion rate which has been indicated inFigure 24(e) and (f).
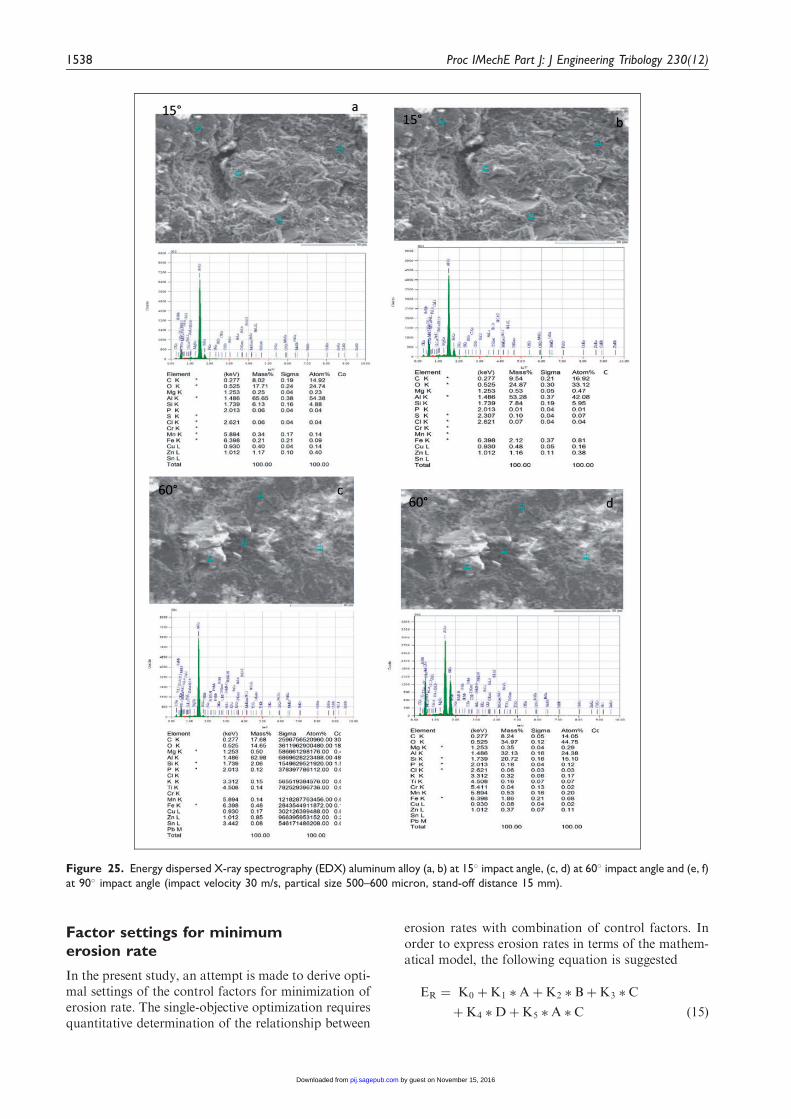
Analysis of erosion with different percentage ofaluminum at different impact angles usingenergy-dispersed X-ray spectrograph
The analysis of energy-dispersed X-ray spectrograph(EDX) of aluminum alloy was examined by usingJEOL JSM 7600F Scanning Electron Microscope(Japan). In this method, an electron beam of 10–20KeV which strikes at the tested surface causes X-rayto be emitted from the point of incidence. The emis-sion energy of X-ray depends on the types of materialsunder observation, that is the use of X-ray energyemission shows distinct nature depending on softto hard materials and thus it gives the unavoidablesignature in case of some kinds of materials. Whenan X-ray strikes the detector, it will generate a photo-electron which in turn generates electron-hole pairs.A strong electric field attracts the electrons and holestowards the opposite ends of the detector. The size ofthe pulse thus generated depends on the number elec-tron hole pairs created, which in turn depends on theenergy of the incoming X-ray. In this method, how-ever, elements with low atomic number are difficult tobe detected. The detector which is lithium-doped sili-con (SiLi) is protected by a beryllium window andoperated at liquid nitrogen temperatures.
Figure 25(a) and (b) shows the amount of silicaembedded within the eroded surfaces at impactangle 15�. Similar observations are found inFigure 25(c) and (d) for impact angle 60� and inFigure 25(e) and (f) 90�, respectively. The EDX ana-lysis shows the percentages of embedded silicaare increased with the decrease of percentage of alu-minum for all tested angles. The significance ofthese observations is that the higher the aluminumcomposition, the lower the silica engagement withinthe target surfaces which causes lower erosion rate.
Table 11. Effects of factors of aluminum alloy.
Source DF Seq SS Adj SS Adj MS F P % of contributions
A 2 90.3791 90.3791 45.1895 1564.04 0.000 47.19
B 2 21.3262 21.3262 10.6631 369.06 0.000 11.14
C 2 1.4863 1.4863 0.7432 25.72 0.001 0.78
D 2 77.3404 77.3404 38.6702 1338.40 0.000 40.38
A*B 4 0.2684 0.2684 0.0671 2.32 0.171 0.140
A*C 4 0.3077 0.3077 0.0769 2.66 0.137 0.161
B*C 4 0.2359 0.2359 0.0590 2.04 0.207 0.123
Error 6 0.1734 0.1734 0.0289 0.086
Total 26 191.5174
Note: Analysis of variance for SN, using adjusted SS for tests.
1534 Proc IMechE Part J: J Engineering Tribology 230(12)
by guest on November 15, 2016pij.sagepub.comDownloaded from

The depth at which the particle has beenembedded into the material was very small from theupper surface. Just beneath the lip, the particleembedded into the material has been observed byother researchers as well.17 It was assumed that theamount of fragmentation and secondary erosionwould be dependent on the particle velocity, impinge-ment angle, particle size, stand-off distance, and
different in hardness between the particle and targetmaterial.
The existence of the O and Si atoms in high per-centage was the evidence of the embedded erodentgarnet particles to the surface of the samples. Basedupon the EDX analysis results, it was concluded thatthe erodent particles were embedded on the surfacesof the aluminum alloy during the erosion process.
Craters
Indentations (scratches)
Crack
Craters Pitting action
Grooves Displaced material
(a) (b)
(c) (d)
(e) (f)
Displaced material
Ploughing action Ploughing action
Large fragments
Figure 22. SEM micrograph of eroded aluminum alloy at impact angle, (a,b) 15�, (c and d) 30�, (e and f) 60�. (Impact velocity 30 m/s,
partical size 500–600 micron, stand-off distance 15 mm).
Chowdhury et al. 1535
by guest on November 15, 2016pij.sagepub.comDownloaded from
It was concluded that this can be possible because ofthe ductile behavior of the aluminum alloy.
Confirmation experimentfor aluminum alloy
The End level of Taguchi approach is the validationof experimental observations for analyzing the qualitycharacteristics. The validity of test results is ensured
by concerning an arbitrary set of factor level combin-ation and after that it has been compared with thetest results. The measured S/N ratio for wear ratesare estimated in connection with the predictiveequations
� ¼ �Tþ �A3 � T� �
þ �B2 � T� �
þ �C3 � T� �
þ �D2 � T� �
ð13Þ
Folded extruded lip
Folded extruded lip
Pitting action
Craters Pitting action
Crack
Ploughing action
Large fragments
Displaced material
Displaced material
(a) (b)
(c) (d)
(e) (f)
Craters
Figure 23. SEM micrograph of eroded aluminum alloy at impact velocity, (a, b) 30 m/s, (c and d) 40 m/s, (e and f) 50 m/s (impact
angle 15�, partical size 500–600 micron, stand of distance 15 mm).
1536 Proc IMechE Part J: J Engineering Tribology 230(12)
by guest on November 15, 2016pij.sagepub.comDownloaded from
where ��1 is the predicted average; �T is overall experi-mental average; �A3, B2 , �C3 and �D2 are the meanresponse for factors at designated levels.
By combining like-terms, the equation reduces to
�� ¼ �A3 þ �B2 þ �C3 þ �D2 � 3T: ð14Þ
A new combination of factor levels A2, B2, C1, andD2 is used to predict deposition rate through predic-tion equation and it is found to be. �1¼ �62.704.By taking in concern of each performance meas-ure, an experiment was done for a different factorcombination and in this context a comparison ismade with the result calculated from the predictive
equation in the following manner as shown inTable 12.
The new generated model is very meaningfulfor the prediction of erosive wear rate to a justifi-able accuracy. Calculated deviations of about2.92% (error level) are obtained between thepredicted and experimental results for erosion ofaluminum alloy. After all, the accuracy level can beimproved more precisely in case of increase inthe number of measurements. This validationapproach incorporates the generation of the math-ematical model for the prediction of measures ofperformance on the basis of knowledge of theinput parameters.
Ploughing
Crack
Crack
Craters
Displaced
Ploughing
Wear debris
Crack
(a) (b)
(c) (d)
(e) (f)
Pittingaction
Pittingaction
Weardebris
Craters
Figure 24. SEM micrograph of eroded aluminum alloy at stand-off distance, (a, b) 25 mm, (c and d) 20 mm, (e and f) 15mm (Impact
angle 15�, partical size 500–600 micron, impact velocity 30 m/s).
Chowdhury et al. 1537
by guest on November 15, 2016pij.sagepub.comDownloaded from
Factor settings for minimumerosion rate
In the present study, an attempt is made to derive opti-mal settings of the control factors for minimization oferosion rate. The single-objective optimization requiresquantitative determination of the relationship between
erosion rates with combination of control factors. Inorder to express erosion rates in terms of the mathem-atical model, the following equation is suggested
ER ¼ K0 þK1 �AþK2 � BþK3 � C
þK4 �DþK5 �A � C ð15Þ
Figure 25. Energy dispersed X-ray spectrography (EDX) aluminum alloy (a, b) at 15� impact angle, (c, d) at 60� impact angle and (e, f)
at 90� impact angle (impact velocity 30 m/s, partical size 500–600 micron, stand-off distance 15 mm).
1538 Proc IMechE Part J: J Engineering Tribology 230(12)
by guest on November 15, 2016pij.sagepub.comDownloaded from

where ER is the performance output terms (erosionrate), A¼impact velocity, B¼ impingement angle,C¼particle size, D¼stand-off distance and Ki (i¼0,1, 2, 3, 4, 5) are the model constants. The constantsare calculated using non-linear regression analysiswith the help of SYSTAT 13 software and the follow-ing relations are obtained.
ER ¼ 1531:984þ 15:682 �A� 3:975 � B
� 3:975 � C� 0:875 �D
� 49:339 � Eþ 0:031 �A � C ð16Þ
The correctness of the calculated constants is con-firmed as high correlation coefficients (r2) to the
tune of 0.994 obtained from equation (15) and, there-fore, the models are quite suitable to use for furtheranalysis.
Conclusions
The erosion results of aluminum alloy have providedsome new findings with relevant to different operatingparameters. The validation of results and correlationof erosion with friction, Uttam number, ANOVA,erosion efficiency, S/N ratio methodology, andGMDH concept has made the realization of noveltyof the erosion study of this aluminum alloy. The mor-phological analysis provides the evidence of real wearmechanism incorporating displaced materials,grooves, ploughing action, large fragment, pittingaction, indentations, crack, folded extruded lip, weardebris, and other related concerning issues for theeroded surface characterization under differentimpact angles, impact velocity, and stand-off distance.The EDX analysis shows that the percentages ofembedded silica are increased with the decrease ofpercentage of aluminum for all tested angles. The sig-nificance of these observations is that the higher thealuminum composition, the lower the silica engage-ment within the target surfaces which causes lower
Figure 25. Continued.
Table 12. Results of the confirmation experiments for ero-
sion rate of aluminum alloy.
Optimal control parameters
Prediction Experimental
Level A2, B2, C1, D2 A2, B2, C1, D2
S/N ratio for
erosion rate (dB)
�62.704 �60.873
Chowdhury et al. 1539
by guest on November 15, 2016pij.sagepub.comDownloaded from
erosion rate. Erosion rate is maximum at 15� impinge-ment angle for aluminum alloy at different impactvelocities and particle size. At an impact angle of15�, the erosion rates are high, and then decreasesgradually up to the impingement angle of 45�. Afterthat the erosion rate increases ranging from 45�to 90�,in general, for all tested samples. The experimentalresults also show that erosion rates are slightlyhigher at 60� impingement angle in most cases as com-pared to 45�, 75� and 90� impingement angle. Theconfirmation of ductile category has been ensuredby identifying the highest erosion damage at anangle of 15�. The increase of erosion in such a fashionwith impact velocity and probable kinetic energy leveland temperature propagation through the area oftested surface has some exceptional characteristics ofthe aluminum alloy. The power law conception-basedapproach ensures the validity of tested aluminumalloy group by confirming the value of exponent ‘n’within the range 0.89–0.98 and the range mostlydepends on the impact velocity and particle sizerather than impact angle. The correlation of erosionrate with U. No. and the relationship between erosionrate and friction factor provides a fairly good agree-ment. This correlation can be used as a significanttool for future study. The erodent size and stand-off distance provide new insight of relation of theseparameters with erosion rate under clarification ofpossible trends. The average S/N ratio – 62.704 dBand Taguchi design concept ensure the validationof experimental and theoretical results. The predictedand experimental S/N ratio are fluctuated within therange 2.92% and predicted and tested model gener-ated by GMDH and 3D explanations are the promis-ing understanding of this newly tested aluminumalloy. ANOVA method ensures the identity of maindominating factors distinctly or as an interaction onerosion of the tested aluminum alloy.
It is expected that the analysis of this new or novelconcern relating to aluminum alloy can be used as anauthentic source in industry and future researches forthe applications of this material in different concernedmechanical and tribological systems.
Declaration of Conflicting Interests
The author(s) declared no potential conflicts of interest withrespect to the research, authorship, and/or publication of
this article.
Funding
The author(s) received no financial support for the research,authorship, and/or publication of this article.
References
1. Finnie I and Natesan K. The mechanism of erosionwear in ductile material: Corrosion behaviour of mater-ials. TMS-AIME 1980; 118–126.
2. Tu JP, Pan J, Matsumuran N, et al. The solid particle
erosion behavior of Al18B4O33 whisker-reinforced
AC4C Al alloy matrix composites. Wear 1981; 223:22–30.
3. Zhu W and Mao ZY. Wear of material. In:
Proceeding of conference wear of material, ASME,1987..
4. Li DY, Chen Q and BruceC. A further simulation study
on the dual role of porosity in solid-particle erosion ofmaterials. Wear 2011; 271: 1325–1330.
5. Shimizu K, Xinba Y and Araya S. Solid particle erosion
and mechanical properties of steel at elevated tempera-ture. Wear 2011; 271: 1357–1364.
6. Nsoesie S, Liu R, Chen K, et al. Analytical modeling ofsolid particle erosion of satellite alloys in combination
with experimental investigation. Wear 2014; 309:226–232.
7. Harsha AP and Bhasker DK. Solid particle erosion
behavior of ferrous and non-ferrous materials and cor-relation of erosion data with erosion models. Mater Des2008; 29: 1745–1754.
8. Rateick Jr RG, Karasek KR, Cunningham AJ, et al.Solid-particle erosion of tungsten carbide/cobalt cermetand hardened 440C stainless steel. Wear 2006; 261:
773–778.9. Miller AE and Maijer DM. Investigation of erosive-
corrosive wear in the low pressure die casting ofaluminum A356. Mater Sci Eng A 2006; 435–436:
100–111.10. Oka YI and Yoshida T. Practical estimation of erosion
damage caused by solid particle impact Part 2:
Mechanical properties of materials directly associatedwith erosion damage. Wear 2005; 259: 102–109.
11. Srivastava VK and Pawar AG. Solid particle erosion of
glass fibre reinforced flyashfilled epoxy resin compos-ites. Compos Sci Technol 2006; 66: 3021–3028.
12. Mohanta N and Acharya SK. ‘Effect of Red mud onsolid particle impact behavior of polymer composite.
Adv Polym Sci Technol: Int J 2014; 5: 18–25.13. Ramesh CS, Keshavamurthy R, Channabasappa BH,
et al. Influence of heat treatment on slurry erosive
wear resistance of Al6061 alloy. Mater Des 2009; 30:3713–3722.
14. Nguyen VB, Nguyen QB, Liu ZG, et al. A combined
numerical experimental study on the effect of surfaceevolution on the water–sand multiphase flow character-istics and the material erosion behavior. Wear 2014;
319: 96–109.15. Jha AK, Batham R, Ahmed M, et al. Effect of imping-
ing angle and rotating speed on erosion behavior ofaluminum. Nonferrous Met Soc China 2011; 21: 32–38.
16. ElTobgy MS, Ng E and Elbestawi MA. ‘Finite elementmodeling of erosive wear. Int J Mach Tools Manuf2005; 45: 1337–1346.
17. Bitter JGA. A study of erosion phenomena – Part I.Wear 1963; 6: 5–21.
18. Divakar M, Agarwal VK and Singh SN. Effect of the
material surface hardness on the erosion of AISI316.Wear 2005; 259: 110–117.
19. Young JP and Ruff AW. ‘Particle erosion measure-ments on metals. J Eng Mater Technol 1977; 99:
121–125.20. Hashish M and Suresh A. An improved model of ero-
sion by solid particle impact. In: Proceedings of the 7th
international conference on erosion by liquid and solidimpact paper, 1988.
1540 Proc IMechE Part J: J Engineering Tribology 230(12)
by guest on November 15, 2016pij.sagepub.comDownloaded from
21. Forderk A, Thew M and Harrion D. A numericalinvestigation of solid particle erosionexperienced within oilfield control valves. Wear 1998;
126: 184–193.22. Tsiang TH. Sand erosion of fiber composites testing and
evaluation for design allowable composites ceramics. vol.
2, Philadelphia, PA: American Society for Testing andMaterials, 1989, pp.155–174.
23. Balasubramaniam R, Krishnan J and Ramakrishnan N.
A study on the shape of the surface generated by abra-sive jet machining. J Mater Process Tech 2002; 121:102–106.
24. Tangestanian P, Papini M and Spelt JK. Starch media
blast cleaning of artificially aged paint films. Wear2001; 248: 128–139.
25. Raykowski A. Blast cleaning of gas turbine components
deposit removal and substrate deformation. Wear 2001;249: 126–131.
26. Pool JP and Parslow GI. Investigation of solid particle
erosion in components of complex geometry. Wear1999; 233-235: 737–745.
27. Divakar M, Agarwal VK, Singh SN, et al. A study of
erosion phenomena – Part I. Wear 1988; 6: 15–29.28. Bitter JGA. A study of erosion phenomena – Part II.
Wear 1990; 6: 169–190.29. Sundararajan G, Wong Roy KK and Clark HM. Solid
Particle size effect in slurry erosion. Wear 1991; 149:55–71.
30. Miyazaki N and Hamao T. Solid particle erosion
of thermoplastic resins reinforced by short fibers.J Compos Mater 1994; 28: 871–883.
31. Clark HM and Burmeister LC. Influence of the squeeze
film on particle impact velocities in erosion. Int JImpact Eng 1992; 12: 415–426.
32. Clark HM and Hartwich RB. A re-examination of the‘particle size effect’ in slurry erosion. Wear 2000; 248:
147–161.33. Stevenson ANJ and Hutchings. Scaling laws for particle
velocity in the gas-blast erosion. Wear 1995; 181-183:
56–62.34. Sundararajan G and Roy M. Solid particle erosion
behaviour of metallic materials at room and elevated
temperatures. Tribol Int 1997; 30: 339–359.35. Mondal DP, Das S, Jha AK, et al. Abrasive wear of Al
alloy–Al2O3 particle composite: a study on the com-
bined effect of load and size of abrasive. Wear 1998;223: 131–138.
36. Dundar M and Inal OT. Solid particle erosion ofa-brass with 5 and 25 mm particles at normal incidence.
Wear 1999; 224: 226–235.37. Lynn RS, Wong KK and Clark HM. On the particle
size effect in slurry erosion. Wear 1991; 149: 55–71.
38. Stachowiak G and Batchelor AW. Engineering trib-ology. 2nd ed. Malaysia: Butterworth, 2005.
39. Finnie I. Erosion of surfaces by solid particles. Wear
1960; 3: 87–103.40. Yong-Du J and Tabakoff W. Numerical simulation of a
dilute particle flow over tube banks: multiphase flow in
wells and pipelines. FED ASME 1992; 144: 125–133.41. Bitter JGA. A study of erosion phenomena. Wear 1963;
6: 69–90.
42. Grant G and Tabakoff W. An experimental investiga-tion of the erosion characteristics of 2024 aluminumalloy. Department of Aerospace Enginering TechnicalReport, 1973, pp.73–37.
43. McLaury B, Shirazi SA, Shadley JR, et al. Modelingerosion in chokes. FED ASME 1996; 236: 773–781.
44. Menguturk M and Sverdrup EF. Calculated tolerance
of a large electric utility gas turbine to erosion damageby coal gas ash particles. Vol. 664. Philadelphia, PA:ASTM, 1979, pp.193–224.
45. Roy M, Foley Y and Sundararagan G. Erosion effi-ciency a new parameter to characterize the dominanterosion micro mechanism. Wear 1990; 140: 369–386.
46. Arjula S, Harsha AP and Ghosh MK. Erosive wear ofunidirectional high carbon steel materials. Mater Lett2006; 62: 3246–3249.
47. Mishra A, Martin M, Thadhani NN, et al. High-strain
rate-response of ultra-fine grained copper. ActaMaterialia 2008; 56: 2770–2783.
Appendix
Notation
C sand mass of frictionD distance between nozzle and target
materialEr erosion rateF sand flow rateK constantL distance between upper and lower discsn velocity exponentP particle sizeR radius from the discs centerS linear separation of two marks A and Bv RPS (revolutions per second)V impact velocity or particle velocity
a impact angle
Chowdhury et al. 1541
by guest on November 15, 2016pij.sagepub.comDownloaded from