Embed Size (px)
Citation preview
Flow Durations, Low-Flow Frequencies, and Monthly Median Flows for Selected Streams in Connecticut through 2005
By Elizabeth A. Ahearn
Prepared in cooperation with the Connecticut Department of Environmental Protection and New England Water Pollution Control Commission
Scientific Investigations Report 2007–5270
U.S. Department of the InteriorU.S. Geological Survey
U.S. Department of the InteriorDIRK KEMPTHORNE, Secretary
U.S. Geological SurveyMark D. Myers, Director
U.S. Geological Survey, Reston, Virginia: 2008
For more information on the USGS—the Federal source for science about the Earth, its natural and living resources, natural hazards, and the environment: World Wide Web: http://www.usgs.gov Telephone: 1-888-ASK-USGS
Any use of trade, product, or firm names is for descriptive purposes only and does not imply endorsement by the U.S. Government.
Although this report is in the public domain, permission must be secured from the individual copyright owners to reproduce any copyrighted materials contained within this report.
Suggested citation:Ahearn, E.A., 2008, Flow durations, low-flow frequencies, and monthly median flows for selected streams in Connecticut through 2005: U.S. Geological Survey Scientific Investigations Report 2007–5270, 33 p. ONLINE ONLY
iii
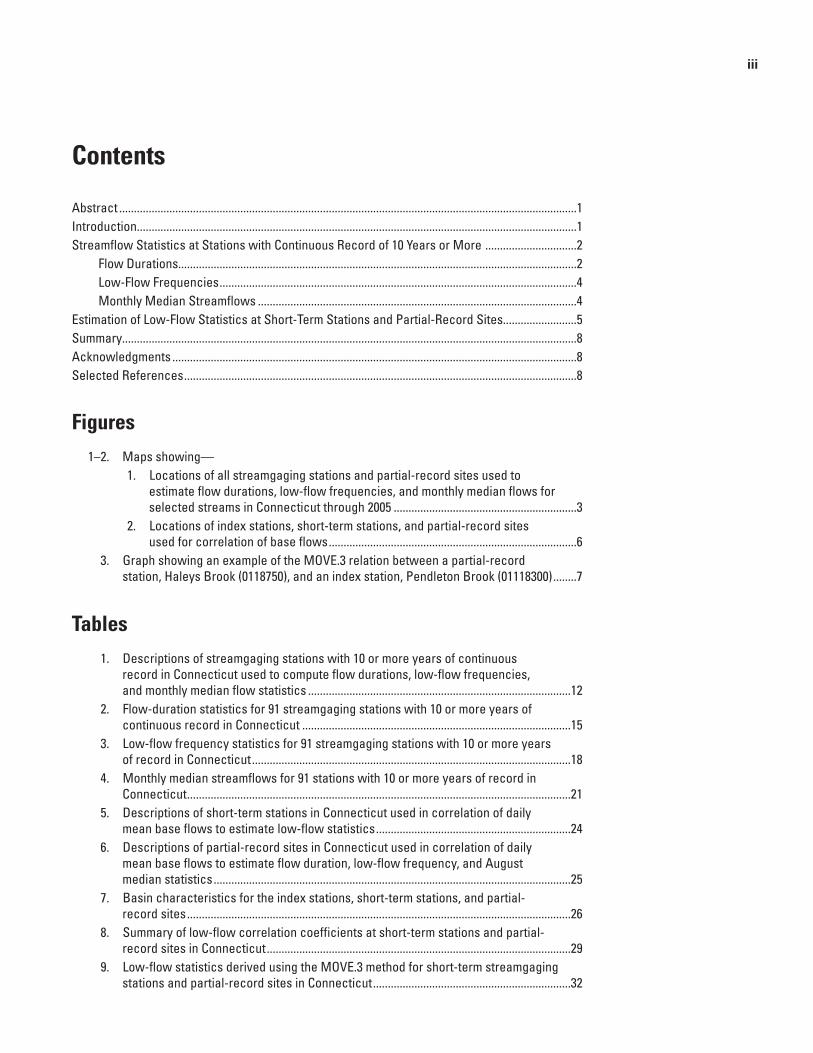
Contents
Abstract ...........................................................................................................................................................1Introduction.....................................................................................................................................................1Streamflow Statistics at Stations with Continuous Record of 10 Years or More ...............................2
Flow Durations.......................................................................................................................................2Low-Flow Frequencies .........................................................................................................................4Monthly Median Streamflows ............................................................................................................4
Estimation of Low-Flow Statistics at Short-Term Stations and Partial-Record Sites.........................5Summary..........................................................................................................................................................8Acknowledgments .........................................................................................................................................8Selected References .....................................................................................................................................8
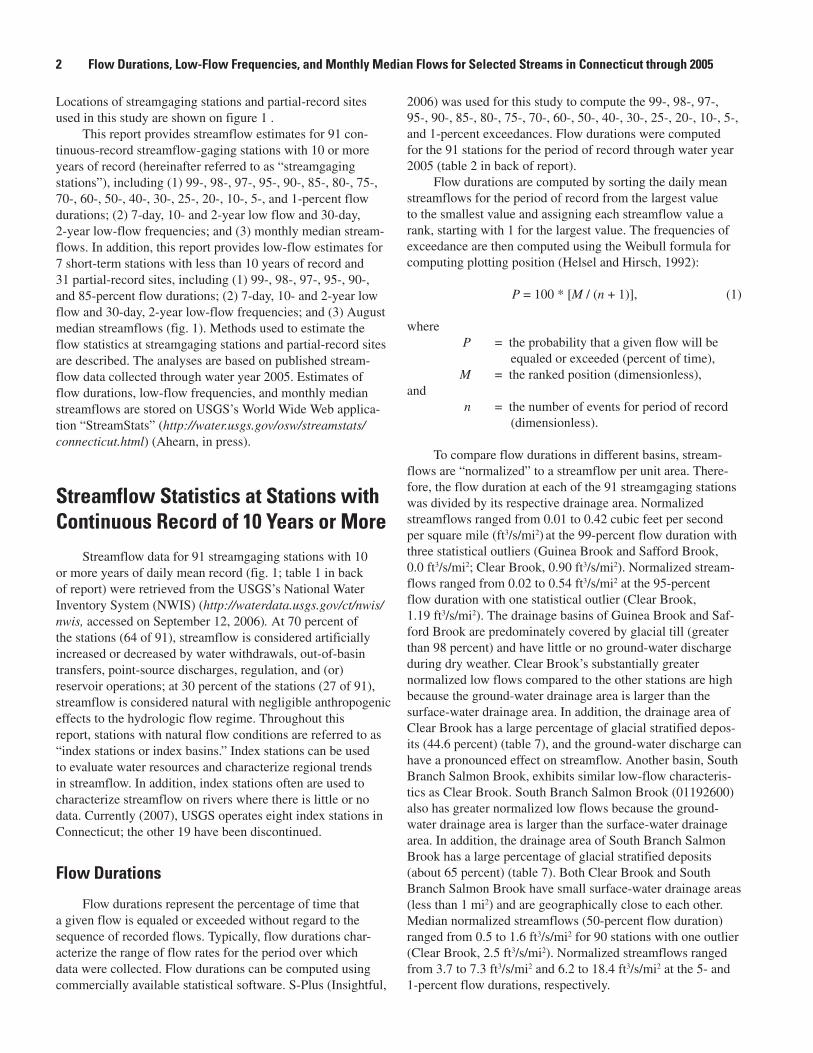
Figures 1–2. Maps showing— 1. Locations of all streamgaging stations and partial-record sites used to
estimate flow durations, low-flow frequencies, and monthly median flows for selected streams in Connecticut through 2005 ..............................................................3
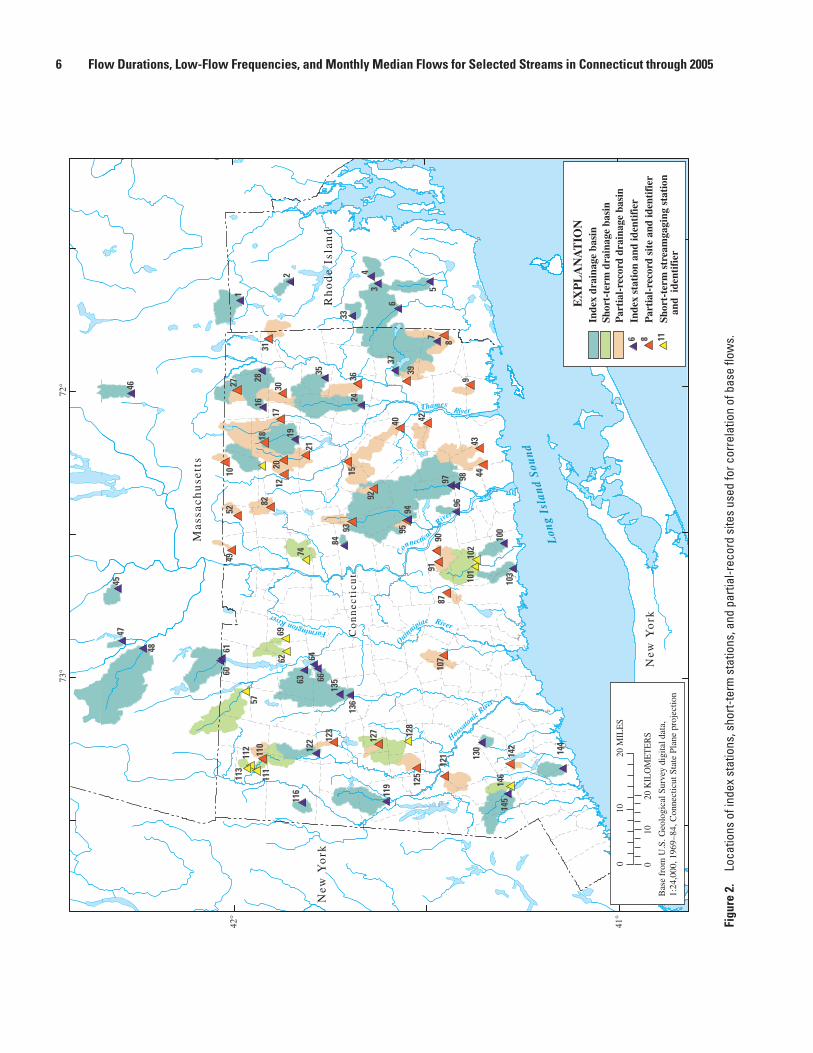
2. Locations of index stations, short-term stations, and partial-record sites used for correlation of base flows ....................................................................................6
3. Graph showing an example of the MOVE.3 relation between a partial-record station, Haleys Brook (0118750), and an index station, Pendleton Brook (01118300) ........7
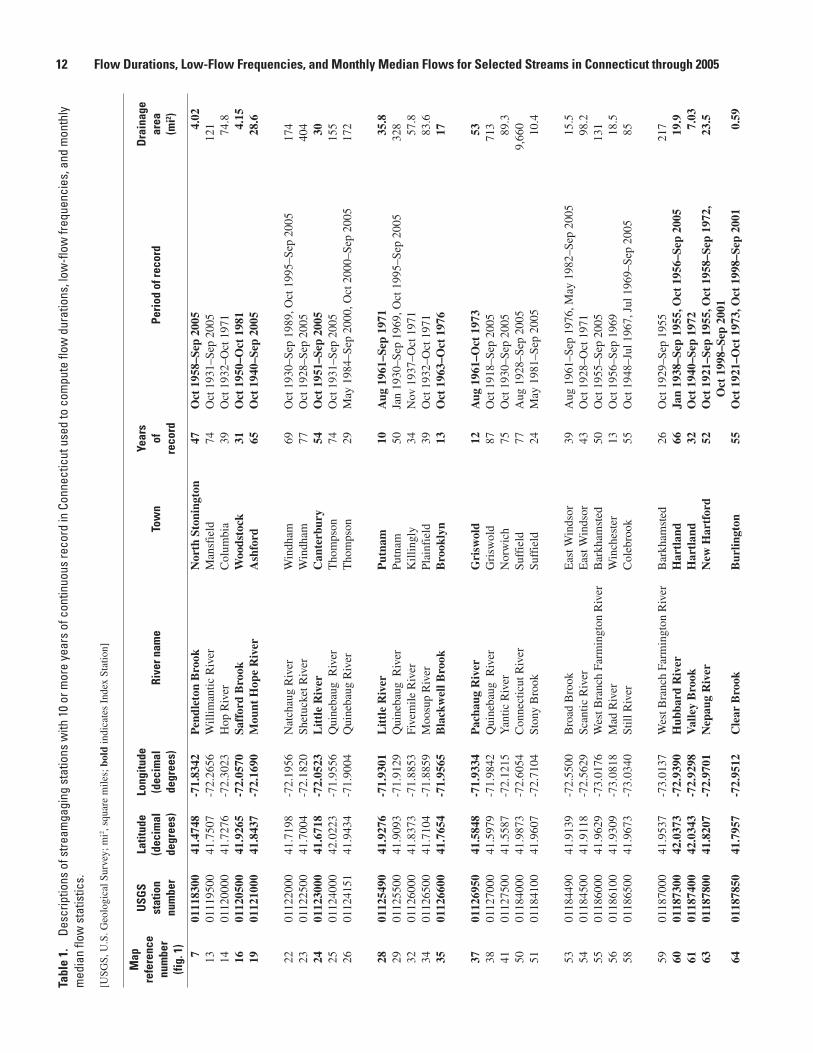
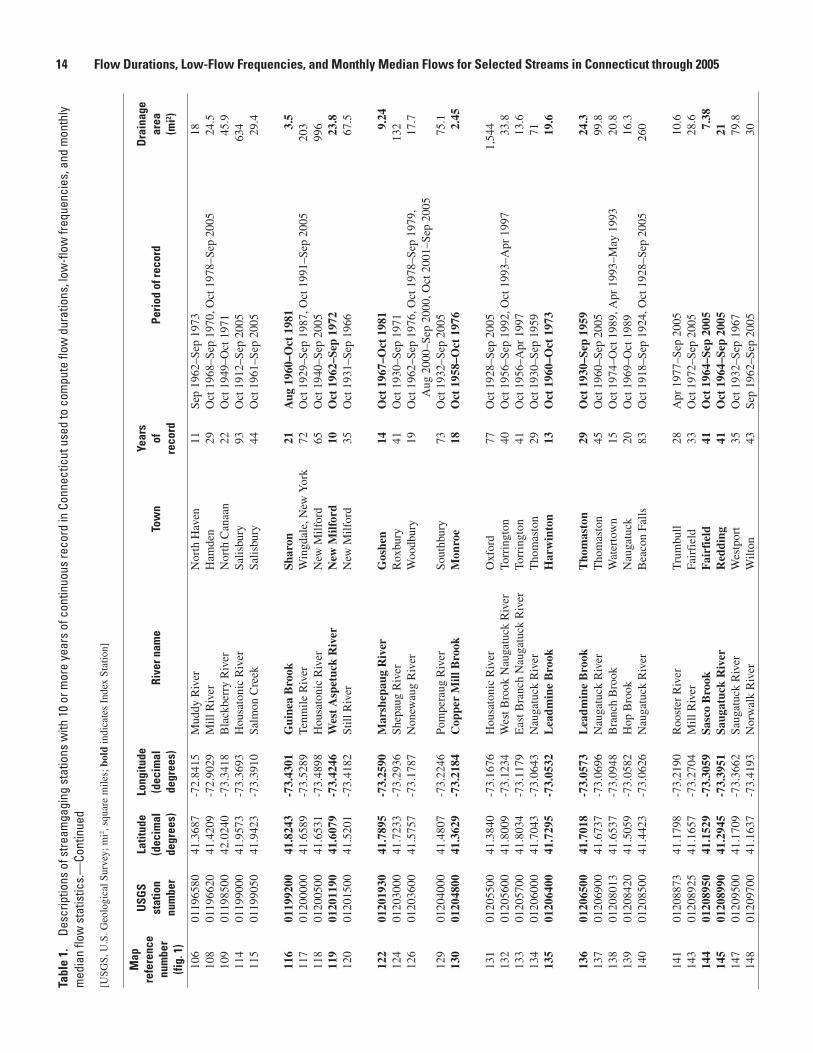
Tables 1. Descriptions of streamgaging stations with 10 or more years of continuous
record in Connecticut used to compute flow durations, low-flow frequencies, and monthly median flow statistics .........................................................................................12
2. Flow-duration statistics for 91 streamgaging stations with 10 or more years of continuous record in Connecticut ...........................................................................................15
3. Low-flow frequency statistics for 91 streamgaging stations with 10 or more years of record in Connecticut ............................................................................................................18
4. Monthly median streamflows for 91 stations with 10 or more years of record in Connecticut ..................................................................................................................................21
5. Descriptions of short-term stations in Connecticut used in correlation of daily mean base flows to estimate low-flow statistics ..................................................................24
6. Descriptions of partial-record sites in Connecticut used in correlation of daily mean base flows to estimate flow duration, low-flow frequency, and August median statistics .........................................................................................................................25
7. Basin characteristics for the index stations, short-term stations, and partial- record sites ..................................................................................................................................26
8. Summary of low-flow correlation coefficients at short-term stations and partial- record sites in Connecticut .......................................................................................................29
9. Low-flow statistics derived using the MOVE.3 method for short-term streamgaging stations and partial-record sites in Connecticut ...................................................................32
iv
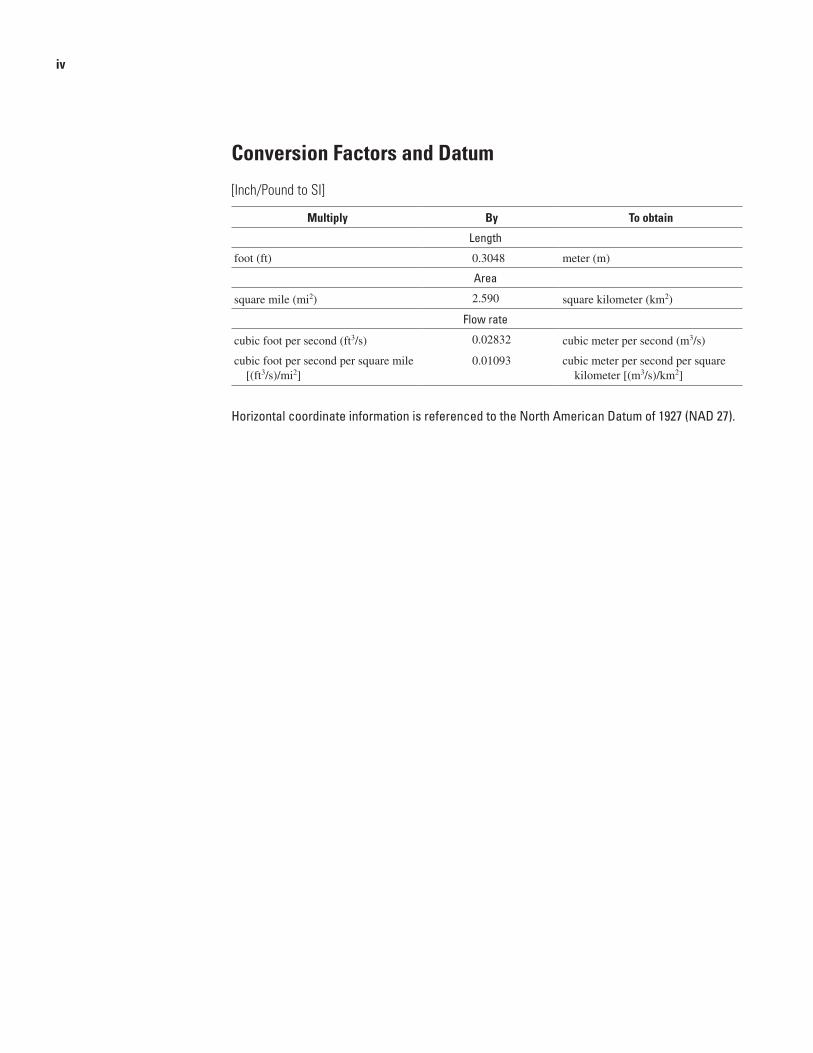
Conversion Factors and Datum
[Inch/Pound to SI]
Multiply By To obtain
Length
foot (ft) 0.3048 meter (m)
Area
square mile (mi2) 2.590 square kilometer (km2)
Flow rate
cubic foot per second (ft3/s) 0.02832 cubic meter per second (m3/s)
cubic foot per second per square mile [(ft3/s)/mi2]
0.01093 cubic meter per second per square kilometer [(m3/s)/km2]
Horizontal coordinate information is referenced to the North American Datum of 1927 (NAD 27).
AbstractFlow durations, low-flow frequencies, and monthly
median streamflows were computed for 91 continuous-record, streamflow-gaging stations in Connecticut with 10 or more years of record. Flow durations include the 99-, 98-, 97-, 95-, 90-, 85-, 80-, 75-, 70-, 60-, 50-, 40-, 30-, 25-, 20-, 10-, 5-, and 1-percent exceedances. Low-flow frequencies include the 7-day, 10-year (7Q
10) low flow; 7-day, 2-year (7Q
2) low flow;
and 30-day, 2-year (30Q2) low flow. Streamflow estimates
were computed for each station using data for the period of record through water year 2005.
Estimates of low-flow statistics for 7 short-term (operated between 3 and 10 years) streamflow-gaging stations and 31 partial-record sites were computed. Low-flow estimates were made on the basis of the relation between base flows at a short-term station or partial-record site and concurrent daily mean streamflows at a nearby index station. The relation is defined by the Maintenance of Variance Extension, type 3 (MOVE.3) method. Several short-term stations and partial-record sites had poorly defined relations with nearby index stations; therefore, no low-flow statistics were derived for these sites. The estimated low-flow statistics for the short-term stations and partial-record sites include the 99-, 98-, 97-, 95-, 90-, and 85-percent flow durations; the 7-day, 10-year (7Q
10) low flow; 7-day, 2-year (7Q
2) low flow; and 30-day,
2-year (30Q2) low-flow frequencies; and the August median
flow. Descriptive information on location and record length, measured basin characteristics, index stations correlated to the short-term station and partial-record sites, and estimated flow statistics are provided in this report for each station. Streamflow estimates from this study are stored on USGS’s World Wide Web application “StreamStats” (http://water.usgs.gov/osw/streamstats/connecticut.html).
IntroductionManagement of water resources is undergoing significant
changes and broad restructuring as biologists, ecologists, and hydrologists further the scientific understanding of natural river flows and flow conditions necessary to sustain aquatic
life. As water withdrawals increase, more rivers have become environmentally stressed. Over recent years, the state govern-ment of Connecticut has worked towards integrating water allocation and uses with protecting the ecological integrity of the riverine ecosystems. Policymakers and planners are considering the needs of freshwater environments and have been establishing in-stream flow requirements to safeguard the rivers. In-stream flows are streamflows of a particular magni-tude, frequency, and timing that are necessary to ensure that a river system remains environmentally healthy. To achieve the highest possible level of stream health for the designated class of stream use, the first challenge to is to analyze water avail-ability for the environment and for direct withdrawal and use. Streamflow statistics are an important tool used to assess water availability. Determination of timely, relevant streamflow statistics—flow durations, low-flow frequencies, and monthly median streamflows—will provide information useful to state government and local officials in making water-resource, regulatory, and other management decisions.
Flow durations and monthly median streamflows for Connecticut streams were last computed by the U.S. Geo-logical Survey (USGS) more than 20 years ago (Randall and others, 1966; Thomas, M.P., and others, 1967; Thomas, C.E., and others, 1968; Ryder and others, 1970, 1981; Cervione and others, 1972; Wilson and others, 1974; Mazzaferro and oth-ers, 1979; Weiss and others, 1982; and Handman and others, 1986). Low-flow frequencies for Connecticut streams were last computed in the early 1980s (Cervione, 1982; Weiss, 1983). Since these studies, an additional 20 years of stream-flow data have been collected and new methods have been developed for estimating low-flow statistics at short-term stations and partial-record sites. To update the streamflow statistics, the USGS in cooperation with the Connecticut Department of Environmental Protection (DEP) and the New England Interstate Water Pollution Control Commission (NEIWPCC) conducted this study to compute flow durations, low-flow frequencies, and monthly median streamflows for Connecticut streams using data through water year1 2005.
1 A water year is defined as the 12-month period October 1 through Septem-ber 30. The water year is designated by the calendar year in which it ends and which includes 9 of the 12 months. Thus, the year ending September 30, 2005 is termed the 2005 water year.
Flow Durations, Low-Flow Frequencies, and Monthly Median Flows for Selected Streams in Connecticut through 2005
By Elizabeth A. Ahearn
2 Flow Durations, Low-Flow Frequencies, and Monthly Median Flows for Selected Streams in Connecticut through 2005
Locations of streamgaging stations and partial-record sites used in this study are shown on figure 1 .
This report provides streamflow estimates for 91 con-tinuous-record streamflow-gaging stations with 10 or more years of record (hereinafter referred to as “streamgaging stations”), including (1) 99-, 98-, 97-, 95-, 90-, 85-, 80-, 75-, 70-, 60-, 50-, 40-, 30-, 25-, 20-, 10-, 5-, and 1-percent flow durations; (2) 7-day, 10- and 2-year low flow and 30-day, 2-year low-flow frequencies; and (3) monthly median stream-flows. In addition, this report provides low-flow estimates for 7 short-term stations with less than 10 years of record and 31 partial-record sites, including (1) 99-, 98-, 97-, 95-, 90-, and 85-percent flow durations; (2) 7-day, 10- and 2-year low flow and 30-day, 2-year low-flow frequencies; and (3) August median streamflows (fig. 1). Methods used to estimate the flow statistics at streamgaging stations and partial-record sites are described. The analyses are based on published stream-flow data collected through water year 2005. Estimates of flow durations, low-flow frequencies, and monthly median streamflows are stored on USGS’s World Wide Web applica-tion “StreamStats” (http://water.usgs.gov/osw/streamstats/connecticut.html) (Ahearn, in press).
Streamflow Statistics at Stations with Continuous Record of 10 Years or More
Streamflow data for 91 streamgaging stations with 10 or more years of daily mean record (fig. 1; table 1 in back of report) were retrieved from the USGS’s National Water Inventory System (NWIS) (http://waterdata.usgs.gov/ct/nwis/nwis, accessed on September 12, 2006). At 70 percent of the stations (64 of 91), streamflow is considered artificially increased or decreased by water withdrawals, out-of-basin transfers, point-source discharges, regulation, and (or) reservoir operations; at 30 percent of the stations (27 of 91), streamflow is considered natural with negligible anthropogenic effects to the hydrologic flow regime. Throughout this report, stations with natural flow conditions are referred to as “index stations or index basins.” Index stations can be used to evaluate water resources and characterize regional trends in streamflow. In addition, index stations often are used to characterize streamflow on rivers where there is little or no data. Currently (2007), USGS operates eight index stations in Connecticut; the other 19 have been discontinued.
Flow Durations
Flow durations represent the percentage of time that a given flow is equaled or exceeded without regard to the sequence of recorded flows. Typically, flow durations char-acterize the range of flow rates for the period over which data were collected. Flow durations can be computed using commercially available statistical software. S-Plus (Insightful,
2006) was used for this study to compute the 99-, 98-, 97-, 95-, 90-, 85-, 80-, 75-, 70-, 60-, 50-, 40-, 30-, 25-, 20-, 10-, 5-, and 1-percent exceedances. Flow durations were computed for the 91 stations for the period of record through water year 2005 (table 2 in back of report).
Flow durations are computed by sorting the daily mean streamflows for the period of record from the largest value to the smallest value and assigning each streamflow value a rank, starting with 1 for the largest value. The frequencies of exceedance are then computed using the Weibull formula for computing plotting position (Helsel and Hirsch, 1992):
P = 100 * [M / (n + 1)], (1)
where P = the probability that a given flow will be
equaled or exceeded (percent of time), M = the ranked position (dimensionless), and n = the number of events for period of record
(dimensionless).
To compare flow durations in different basins, stream-flows are “normalized” to a streamflow per unit area. There-fore, the flow duration at each of the 91 streamgaging stations was divided by its respective drainage area. Normalized streamflows ranged from 0.01 to 0.42 cubic feet per second per square mile (ft3/s/mi2) at the 99-percent flow duration with three statistical outliers (Guinea Brook and Safford Brook, 0.0 ft3/s/mi2; Clear Brook, 0.90 ft3/s/mi2). Normalized stream-flows ranged from 0.02 to 0.54 ft3/s/mi2 at the 95-percent flow duration with one statistical outlier (Clear Brook, 1.19 ft3/s/mi2). The drainage basins of Guinea Brook and Saf-ford Brook are predominately covered by glacial till (greater than 98 percent) and have little or no ground-water discharge during dry weather. Clear Brook’s substantially greater normalized low flows compared to the other stations are high because the ground-water drainage area is larger than the surface-water drainage area. In addition, the drainage area of Clear Brook has a large percentage of glacial stratified depos-its (44.6 percent) (table 7), and the ground-water discharge can have a pronounced effect on streamflow. Another basin, South Branch Salmon Brook, exhibits similar low-flow characteris-tics as Clear Brook. South Branch Salmon Brook (01192600) also has greater normalized low flows because the ground-water drainage area is larger than the surface-water drainage area. In addition, the drainage area of South Branch Salmon Brook has a large percentage of glacial stratified deposits (about 65 percent) (table 7). Both Clear Brook and South Branch Salmon Brook have small surface-water drainage areas (less than 1 mi2) and are geographically close to each other. Median normalized streamflows (50-percent flow duration) ranged from 0.5 to 1.6 ft3/s/mi2 for 90 stations with one outlier (Clear Brook, 2.5 ft3/s/mi2). Normalized streamflows ranged from 3.7 to 7.3 ft3/s/mi2 and 6.2 to 18.4 ft3/s/mi2 at the 5- and 1-percent flow durations, respectively.
Streamflow Statistics at Stations with Continuous Record of 10 Years or More 3
Figu
re 1
. Lo
catio
ns o
f all
stre
amga
ging
sta
tions
and
par
tial-r
ecor
d si
tes
used
to e
stim
ate
flow
dur
atio
ns, l
ow-fl
ow fr
eque
ncie
s, a
nd m
onth
ly m
edia
n flo
ws
for s
elec
ted
stre
ams
in C
onne
ctic
ut th
roug
h 20
05. R
efer
ence
num
bers
sho
wn
abov
e ar
e us
ed to
des
crib
e th
e st
atio
ns in
tabl
es 1
–9.
Housa
tonic
River
81
5711
4
146
9
87
6
543
2
1
99
9897
96
959493
92
9190
8988
8786
85
8483
82
8180
79
78
77
7675
74
7372
7170
69
6867
6665
64
63
626160 59
5857
5655
5453
5251
5049
48
4746
45
4443
42
4140
393837
36
35
3433
323130
2928
27
26
25
242322
21201918
17
16
1514
13
12
11
10
148
147146
145 14
4
143
142
141
140
139
13813
713
6
135
134
133
132
131 13
0
129
12812
7 126
125
124
123
122
121
120
119
118
117
116
11511
411
311
2
111
110
109
108
107
106
105
104
103
102
101
100
72°
73°
42°
41°
Mas
sach
use
tts
New
Yo
rkR
ho
de
Isla
nd
010
20M
ILE
S
010
20K
ILO
ME
TE
RS
Lon
g
Isla
nd
Sou
nd
New
Yo
rk
Co
nn
ecti
cut
EX
PL
AN
AT
ION
Inde
x st
atio
n an
d id
enti
fier
Gag
ing
stat
ion
and
iden
tifi
er
Par
tial
-rec
ord
site
and
id
enti
fier
Shor
t-te
rm s
trea
mga
ging
st
atio
n an
d id
enti
fier
911 7416
Bas
e fr
om U
.S. G
eolo
gica
l Sur
vey
digi
tal d
ata,
1:24
,000
, 196
9–84
, Con
nect
icut
Sta
te P
lane
pro
ject
ion
Quinnipiac River
Con
necticu
t
River
Thames RiverFarmington River
4 Flow Durations, Low-Flow Frequencies, and Monthly Median Flows for Selected Streams in Connecticut through 2005
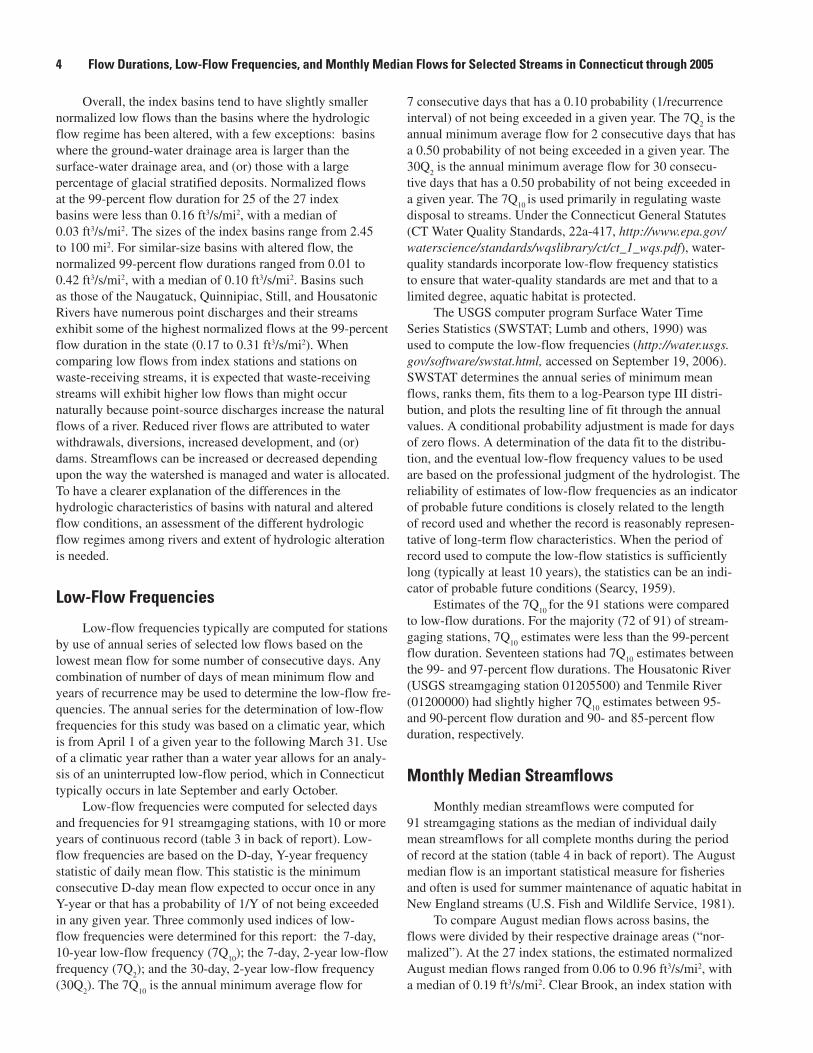
Overall, the index basins tend to have slightly smaller normalized low flows than the basins where the hydrologic flow regime has been altered, with a few exceptions: basins where the ground-water drainage area is larger than the surface-water drainage area, and (or) those with a large percentage of glacial stratified deposits. Normalized flows at the 99-percent flow duration for 25 of the 27 index basins were less than 0.16 ft3/s/mi2, with a median of 0.03 ft3/s/mi2. The sizes of the index basins range from 2.45 to 100 mi2. For similar-size basins with altered flow, the normalized 99-percent flow durations ranged from 0.01 to 0.42 ft3/s/mi2, with a median of 0.10 ft3/s/mi2. Basins such as those of the Naugatuck, Quinnipiac, Still, and Housatonic Rivers have numerous point discharges and their streams exhibit some of the highest normalized flows at the 99-percent flow duration in the state (0.17 to 0.31 ft3/s/mi2). When comparing low flows from index stations and stations on waste-receiving streams, it is expected that waste-receiving streams will exhibit higher low flows than might occur naturally because point-source discharges increase the natural flows of a river. Reduced river flows are attributed to water withdrawals, diversions, increased development, and (or) dams. Streamflows can be increased or decreased depending upon the way the watershed is managed and water is allocated. To have a clearer explanation of the differences in the hydrologic characteristics of basins with natural and altered flow conditions, an assessment of the different hydrologic flow regimes among rivers and extent of hydrologic alteration is needed.
Low-Flow Frequencies
Low-flow frequencies typically are computed for stations by use of annual series of selected low flows based on the lowest mean flow for some number of consecutive days. Any combination of number of days of mean minimum flow and years of recurrence may be used to determine the low-flow fre-quencies. The annual series for the determination of low-flow frequencies for this study was based on a climatic year, which is from April 1 of a given year to the following March 31. Use of a climatic year rather than a water year allows for an analy-sis of an uninterrupted low-flow period, which in Connecticut typically occurs in late September and early October.
Low-flow frequencies were computed for selected days and frequencies for 91 streamgaging stations, with 10 or more years of continuous record (table 3 in back of report). Low-flow frequencies are based on the D-day, Y-year frequency statistic of daily mean flow. This statistic is the minimum consecutive D-day mean flow expected to occur once in any Y-year or that has a probability of 1/Y of not being exceeded in any given year. Three commonly used indices of low-flow frequencies were determined for this report: the 7-day, 10-year low-flow frequency (7Q
10); the 7-day, 2-year low-flow
frequency (7Q2); and the 30-day, 2-year low-flow frequency
(30Q2). The 7Q
10 is the annual minimum average flow for
7 consecutive days that has a 0.10 probability (1/recurrence interval) of not being exceeded in a given year. The 7Q
2 is the
annual minimum average flow for 2 consecutive days that has a 0.50 probability of not being exceeded in a given year. The 30Q
2 is the annual minimum average flow for 30 consecu-
tive days that has a 0.50 probability of not being exceeded in a given year. The 7Q
10 is used primarily in regulating waste
disposal to streams. Under the Connecticut General Statutes (CT Water Quality Standards, 22a-417, http://www.epa.gov/waterscience/standards/wqslibrary/ct/ct_1_wqs.pdf), water-quality standards incorporate low-flow frequency statistics to ensure that water-quality standards are met and that to a limited degree, aquatic habitat is protected.
The USGS computer program Surface Water Time Series Statistics (SWSTAT; Lumb and others, 1990) was used to compute the low-flow frequencies (http://water.usgs.gov/software/swstat.html, accessed on September 19, 2006). SWSTAT determines the annual series of minimum mean flows, ranks them, fits them to a log-Pearson type III distri-bution, and plots the resulting line of fit through the annual values. A conditional probability adjustment is made for days of zero flows. A determination of the data fit to the distribu-tion, and the eventual low-flow frequency values to be used are based on the professional judgment of the hydrologist. The reliability of estimates of low-flow frequencies as an indicator of probable future conditions is closely related to the length of record used and whether the record is reasonably represen-tative of long-term flow characteristics. When the period of record used to compute the low-flow statistics is sufficiently long (typically at least 10 years), the statistics can be an indi-cator of probable future conditions (Searcy, 1959).
Estimates of the 7Q10
for the 91 stations were compared to low-flow durations. For the majority (72 of 91) of stream-gaging stations, 7Q
10 estimates were less than the 99-percent
flow duration. Seventeen stations had 7Q10
estimates between the 99- and 97-percent flow durations. The Housatonic River (USGS streamgaging station 01205500) and Tenmile River (01200000) had slightly higher 7Q
10 estimates between 95-
and 90-percent flow duration and 90- and 85-percent flow duration, respectively.
Monthly Median Streamflows
Monthly median streamflows were computed for 91 streamgaging stations as the median of individual daily mean streamflows for all complete months during the period of record at the station (table 4 in back of report). The August median flow is an important statistical measure for fisheries and often is used for summer maintenance of aquatic habitat in New England streams (U.S. Fish and Wildlife Service, 1981).
To compare August median flows across basins, the flows were divided by their respective drainage areas (“nor-malized”). At the 27 index stations, the estimated normalized August median flows ranged from 0.06 to 0.96 ft3/s/mi2, with a median of 0.19 ft3/s/mi2. Clear Brook, an index station with
Estimation of Low-Flow Statistics at Short-Term Stations and Partial-Record Sites 5
a drainage area less than 1 mi2, was a statistical outlier with a normalized August median flow of 2.37 ft3/s/mi2. At the 64 non-index stations (basins with flow alteration), the esti-mated normalized August median flows ranged from 0.15 to 1.77 ft3/s/mi2, with a median of 0.35 ft3/s/mi2. The normalized August median flows were larger in basins with flow alteration than the normalized August median flows in basins with natu-ral flow, indicating point-source discharges (e.g., wastewater releases from sewage-treatment facilities or industry) may be increasing August median flows. In addition, the data indi-cated a slightly larger range in the normalized August median flows for larger basins (greater than 45 mi2) with flow altera-tion—0.15 to 1.34 ft3/s/mi2 for basins less than 40 mi2 and 0.15 to 1.77 ft3/s/mi2 for basins between 45 and 100 mi2. A com-mon time period was not used to compare flows normalized by drainage area; therefore, the differences in flows per square mile between the stations with and without flow alteration are partly attributed to the varying record lengths.
Estimation of Low-Flow Statistics at Short-Term Stations and Partial-Record Sites
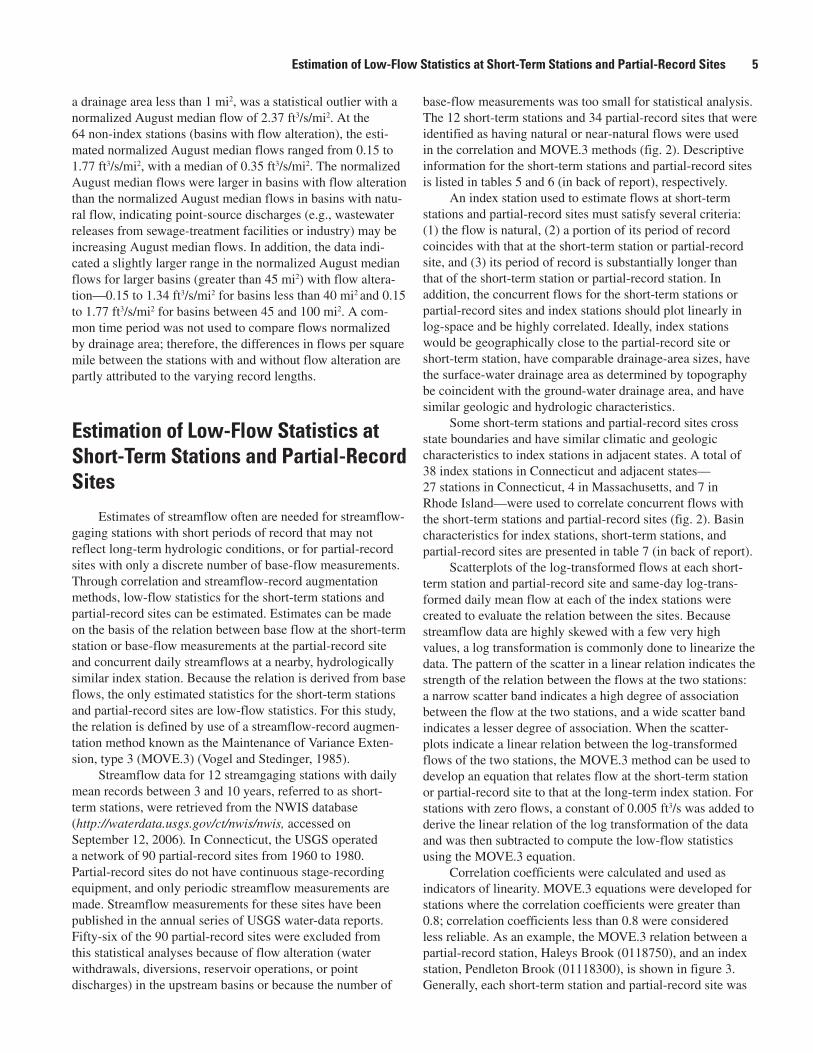
Estimates of streamflow often are needed for streamflow-gaging stations with short periods of record that may not reflect long-term hydrologic conditions, or for partial-record sites with only a discrete number of base-flow measurements. Through correlation and streamflow-record augmentation methods, low-flow statistics for the short-term stations and partial-record sites can be estimated. Estimates can be made on the basis of the relation between base flow at the short-term station or base-flow measurements at the partial-record site and concurrent daily streamflows at a nearby, hydrologically similar index station. Because the relation is derived from base flows, the only estimated statistics for the short-term stations and partial-record sites are low-flow statistics. For this study, the relation is defined by use of a streamflow-record augmen-tation method known as the Maintenance of Variance Exten-sion, type 3 (MOVE.3) (Vogel and Stedinger, 1985).
Streamflow data for 12 streamgaging stations with daily mean records between 3 and 10 years, referred to as short- term stations, were retrieved from the NWIS database (http://waterdata.usgs.gov/ct/nwis/nwis, accessed on September 12, 2006). In Connecticut, the USGS operated a network of 90 partial-record sites from 1960 to 1980. Partial-record sites do not have continuous stage-recording equipment, and only periodic streamflow measurements are made. Streamflow measurements for these sites have been published in the annual series of USGS water-data reports. Fifty-six of the 90 partial-record sites were excluded from this statistical analyses because of flow alteration (water withdrawals, diversions, reservoir operations, or point discharges) in the upstream basins or because the number of
base-flow measurements was too small for statistical analysis. The 12 short-term stations and 34 partial-record sites that were identified as having natural or near-natural flows were used in the correlation and MOVE.3 methods (fig. 2). Descriptive information for the short-term stations and partial-record sites is listed in tables 5 and 6 (in back of report), respectively.
An index station used to estimate flows at short-term stations and partial-record sites must satisfy several criteria: (1) the flow is natural, (2) a portion of its period of record coincides with that at the short-term station or partial-record site, and (3) its period of record is substantially longer than that of the short-term station or partial-record station. In addition, the concurrent flows for the short-term stations or partial-record sites and index stations should plot linearly in log-space and be highly correlated. Ideally, index stations would be geographically close to the partial-record site or short-term station, have comparable drainage-area sizes, have the surface-water drainage area as determined by topography be coincident with the ground-water drainage area, and have similar geologic and hydrologic characteristics.
Some short-term stations and partial-record sites cross state boundaries and have similar climatic and geologic characteristics to index stations in adjacent states. A total of 38 index stations in Connecticut and adjacent states— 27 stations in Connecticut, 4 in Massachusetts, and 7 in Rhode Island—were used to correlate concurrent flows with the short-term stations and partial-record sites (fig. 2). Basin characteristics for index stations, short-term stations, and partial-record sites are presented in table 7 (in back of report).
Scatterplots of the log-transformed flows at each short-term station and partial-record site and same-day log-trans-formed daily mean flow at each of the index stations were created to evaluate the relation between the sites. Because streamflow data are highly skewed with a few very high values, a log transformation is commonly done to linearize the data. The pattern of the scatter in a linear relation indicates the strength of the relation between the flows at the two stations: a narrow scatter band indicates a high degree of association between the flow at the two stations, and a wide scatter band indicates a lesser degree of association. When the scatter-plots indicate a linear relation between the log-transformed flows of the two stations, the MOVE.3 method can be used to develop an equation that relates flow at the short-term station or partial-record site to that at the long-term index station. For stations with zero flows, a constant of 0.005 ft3/s was added to derive the linear relation of the log transformation of the data and was then subtracted to compute the low-flow statistics using the MOVE.3 equation.
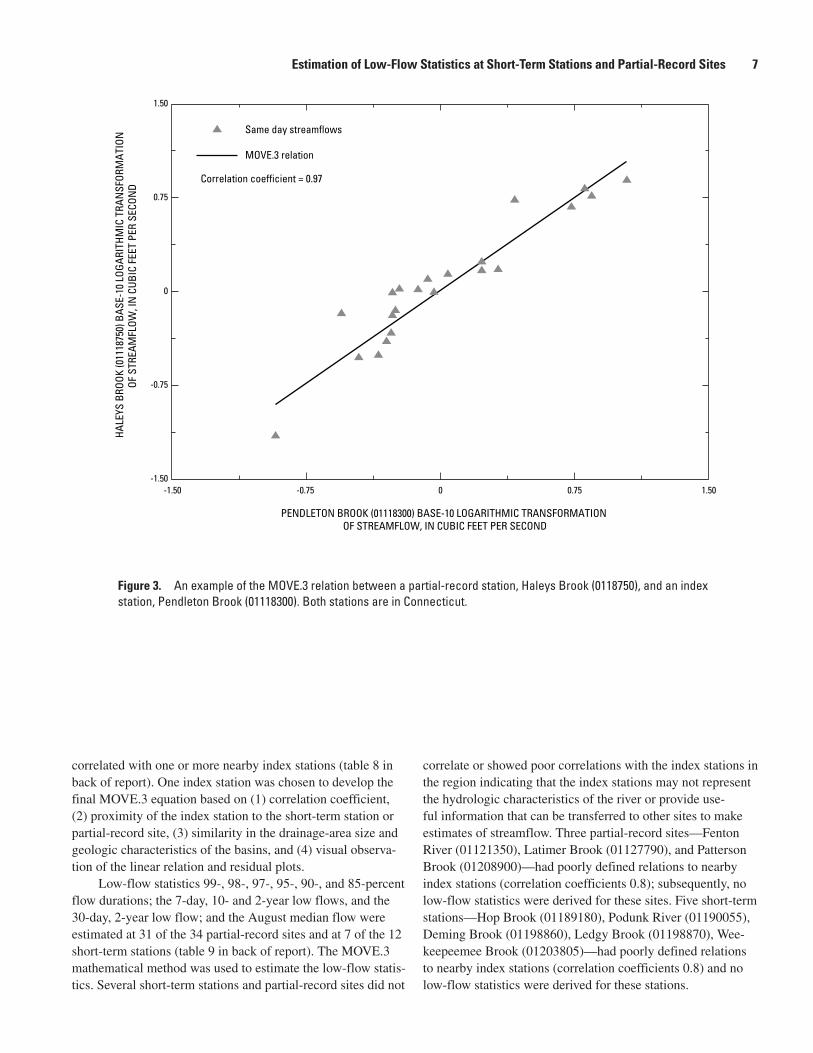
Correlation coefficients were calculated and used as indicators of linearity. MOVE.3 equations were developed for stations where the correlation coefficients were greater than 0.8; correlation coefficients less than 0.8 were considered less reliable. As an example, the MOVE.3 relation between a partial-record station, Haleys Brook (0118750), and an index station, Pendleton Brook (01118300), is shown in figure 3. Generally, each short-term station and partial-record site was
6 Flow Durations, Low-Flow Frequencies, and Monthly Median Flows for Selected Streams in Connecticut through 2005
Figu
re 2
. Lo
catio
ns o
f ind
ex s
tatio
ns, s
hort-
term
sta
tions
, and
par
tial-r
ecor
d si
tes
used
for c
orre
latio
n of
bas
e flo
ws.
Mas
sach
use
tts
New
Yo
rkR
ho
de
Isla
nd
New
Yo
rk
Housa
tonic
River
7
6
5
43
2
1
989796
94
84
6664
63
6160
48
4746
45
37
35
33
28
24
19
16
145
144
136
135
13012
2
119
116
103
100
9
8
9593
92
9190
87
82
5249
4443
4240
39
36
313027
21
2018
17
15
12
10
142
127
125
123
12111
0
107
74
6962
57
146
128
113
112
111
102
101
010
20M
ILE
S
010
20K
ILO
ME
TE
RS
Lon
g Is
land
Sou
nd
Co
nn
ecti
cut
EX
PL
AN
AT
ION
Bas
e fr
om U
.S. G
eolo
gica
l Sur
vey
digi
tal d
ata,
1:24
,000
, 196
9–84
, Con
nect
icut
Sta
te P
lane
pro
ject
ion
Inde
x dr
aina
ge b
asin
Shor
t-te
rm d
rain
age
basi
nP
arti
al-r
ecor
d dr
aina
ge b
asin
Inde
x st
atio
n an
d id
enti
fier
Par
tial
-rec
ord
site
and
iden
tifi
erSh
ort-
term
str
eam
gagi
ng s
tati
on
an
d id
enti
fier
Quinnipiac River
Con
necticu
t
River
Thames RiverFarmington River
6 8 11
72°
73°
42°
41°
Estimation of Low-Flow Statistics at Short-Term Stations and Partial-Record Sites 7
correlated with one or more nearby index stations (table 8 in back of report). One index station was chosen to develop the final MOVE.3 equation based on (1) correlation coefficient, (2) proximity of the index station to the short-term station or partial-record site, (3) similarity in the drainage-area size and geologic characteristics of the basins, and (4) visual observa-tion of the linear relation and residual plots.
Low-flow statistics 99-, 98-, 97-, 95-, 90-, and 85-percent flow durations; the 7-day, 10- and 2-year low flows, and the 30-day, 2-year low flow; and the August median flow were estimated at 31 of the 34 partial-record sites and at 7 of the 12 short-term stations (table 9 in back of report). The MOVE.3 mathematical method was used to estimate the low-flow statis-tics. Several short-term stations and partial-record sites did not
correlate or showed poor correlations with the index stations in the region indicating that the index stations may not represent the hydrologic characteristics of the river or provide use-ful information that can be transferred to other sites to make estimates of streamflow. Three partial-record sites—Fenton River (01121350), Latimer Brook (01127790), and Patterson Brook (01208900)—had poorly defined relations to nearby index stations (correlation coefficients 0.8); subsequently, no low-flow statistics were derived for these sites. Five short-term stations—Hop Brook (01189180), Podunk River (01190055), Deming Brook (01198860), Ledgy Brook (01198870), Wee-keepeemee Brook (01203805)—had poorly defined relations to nearby index stations (correlation coefficients 0.8) and no low-flow statistics were derived for these stations.
Figure 3. An example of the MOVE.3 relation between a partial-record station, Haleys Brook (0118750), and an index station, Pendleton Brook (01118300). Both stations are in Connecticut.
-1.50 -0.75 0 0.75 1.50-1.50
-0.75
0
0.75
1.50
PENDLETON BROOK (01118300) BASE-10 LOGARITHMIC TRANSFORMATION OF STREAMFLOW, IN CUBIC FEET PER SECOND
Correlation coefficient = 0.97
HAL
EYS
BROO
K (0
1118
750)
BAS
E-10
LOG
ARIT
HMIC
TRA
NSF
ORM
ATIO
N
OF S
TREA
MFL
OW, I
N C
UBIC
FEE
T PE
R SE
CON
DSame day streamflows
MOVE.3 relation
8 Flow Durations, Low-Flow Frequencies, and Monthly Median Flows for Selected Streams in Connecticut through 2005
Summary
Water-resources managers face considerable challenges due to growing demands on finite freshwater supplies and the need to safeguard the riverine ecosystems. The state govern-ment in Connecticut is working to integrate water allocation and use with protecting the ecological integrity of the state’s rivers. Current estimates of streamflow statistics at streamgag-ing stations and partial-record sites will aid the state govern-ment in doing this. The U.S. Geological Survey (USGS), in cooperation with the Connecticut Department of Environmen-tal Protection and New England Interstate Water Pollution Control Commission (NEIWPCC), computed streamflow sta-tistics for 129 stream sites in Connecticut to provide informa-tion to state and local officials for water-resource, regulatory, and other management decisions. Flow durations, low-flow frequencies, and monthly median flows were computed for 91 streamgaging stations (operated 10 or more years), 7 short-term stations (operated less than 10 years), and 31 partial-record sites. Different methods were used for statistical analy-ses, depending on the type of station operated and quantity of data collected.
The estimated streamflow statistics for the 91 long-term continuous-record streamgaging stations include the 99-, 98-, 97-, 95-, 90-, 85-, 80-, 75-, 70-, 60-, 50-, 40-, 30-, 25-, 20-, 10-, 5-, and 1-percent flow durations; the 7-day, 10- and 2-year low flow frequency and the 30-day, 2-year low flow frequency; and monthly median flows. Streamflow estimates were computed for each station using data collected through water year 2005.
Long-term streamgaging-station records provide the best data for estimating the magnitude and probability of flows; however, for many proposed water-resources proj-ects, only a short record or a limited number of discrete flow measurements may be available. Through correlation and a streamflow-record augmentation method, referred to as the Maintenance of Variance Extension (MOVE.3) method, low-flow statistics were estimated for short-term stations and partial-record sites based on of the relation between base-flow measurements at the partial-record site or daily mean (base) flows at the short-term station and concurrent daily stream-flows at a nearby, hydrologically similar index station.
The estimated low-flow statistics for the 7 short-term stations and 31 partial-record sites include the 99-, 98-, 97-, 95-, 90-, and 85-percent flow durations; the 7-day, 10-year low flow; 7-day, 2-year low flow; and 30-day, 2-year low-flow frequencies; and the August median flow. Low-flow statis-tics could not be estimated for some short-term stations and partial-record sites because base-flow relations with the index stations did not correlate or showed low correlations indicating that the index stations may not represent the hydrologic char-acteristics of these short-term stations or partial-record sites.
Acknowledgments
The author thanks Gregory Granato of the USGS for providing valuable assistance with the Streamflow Record Augmentation technique. Also, the author thanks Pamela Lombard and Amy McHugh of the USGS, and Lee Dunbar of the Connecticut Department of Environmental Protection for providing technical reviews of the report. Christopher Bellucci, Mary Becker, and Robert Gilmore provided help determining the extent of streamflow alteration in various basins.
Selected References
Ahearn, E.A., Ries, K.G., III, and Steeves, P.A., in press, StreamStats: U.S. Geological Survey Web application for streamflow statistics in Connecticut: U.S. Geological Survey Fact Sheet 2006–3129, 4 p.
Cervione, M.A., Jr., 1982, A method for estimating the 7-day, 10-year low flow of streams in Connecticut: Connecticut Water Resources Bulletin, v. 34, 17 p.
Cervione, M.A., Jr., Mazzaferro, D.L., and Melvin, R.L., 1972, Water resources inventory of Connecticut, Part 6, upper Housatonic River basin: Connecticut Water Resources Bulletin, v. 21, 84 p.
Handman, E.H., Haeni, F.P., and Thomas, M.P., 1986, Water resources inventory of Connecticut, Part 9, Farming-ton River basin: Connecticut Water Resources Bulletin, v. 29, 91 p.
Hardison, C.H., and Moss, M.E., 1972, Accuracy of low-flow characteristics estimated by correlation of base-flow measurements, Manual of Hydrology—Part 2, Low-flow techniques: U.S. Geological Survey Water-Supply Paper 1542–B, p. 35–55.
Helsel, D.R., and Hirsch, R.M., 1992, Statistical methods in water resources: Studies in Environmental Science, v. 49, New York, Elsevier Science Publishers, 529 p.
Hirsch, R.M., 1982, A comparison of four streamflow record extension techniques: Water Resources Research, v. 18, no. 4, p. 1,081–1,088.
Insightful, Inc., 2006, SPLUS version 7 modern statistics and advanced graphics: Cambridge, Mass., 558 p.
Lumb, A.M., Kittle, J.L., Jr., and Flynn, K.M., 1990, Users manual for ANNIE, a computer program for interactive hydrologic analyses and data management: U.S. Geologi-cal Survey Water-Resources Investigations Report 89–4080, 236 p.
Selected References 9
Mazzaferro, D.L., Handman, E.H., and Thomas, M.P., 1979, Water resources inventory of Connecticut, Part 8, Quinnipiac River basin: Connecticut Water Resources Bulletin, v. 27, 88 p.
Randall, A.D., Thomas, M.P., Thomas, C.E., Jr., and Baker, J.A., 1966, Water resources inventory of Connecti-cut, Part 1, Quinebaug River basin: Connecticut Water Resources Bulletin, v. 8, 102 p.
Ries, K.G., III, 1994a, Estimation of low-flow duration dis-charges in Massachusetts: U.S. Geological Survey Water-Supply Paper 2175, 50 p.
Ries, K.G., III, 1997, August median streamflows in Massa-chusetts: U.S. Geological Survey Water-Resources Investi-gations Report 97–4190, 27 p.
Ries, K.G., III, 1999, Streamflow measurements, basin characteristics, and streamflow statistics for low-flow partial-record stations operated in Massachusetts from 1989 through 1996: U.S. Geological Survey Water-Resources Investigations Report 99–4006, 162 p.
Riggs, H.C., 1972, Low-flow investigations: U.S. Geological Survey Techniques of Water-Resources Investigations, book 4, chap. B1, 18 p.
Ryder, R.B., Cervione, M.A., Jr., Thomas, C.E., Jr., and Thomas, M.P., 1970, Water resources inventory of Connect-icut, Part 4, southwestern coastal river basins: Connecticut Water Resources Bulletin, v. 17, 54 p.
Ryder, R.B., Thomas, M.P., and Weiss, L.A., 1981, Water resources inventory of Connecticut, Part 7, upper Connecti-cut River basin: Connecticut Water Resources Bulletin, v. 24, 78 p.
Searcy, J.K., 1959, Flow-duration curves. Manual of hydrol-ogy—Part 2, Low-flow techniques: U.S. Geological Survey Water-Supply Paper 1542–A, 33 p.
Soller, D.R., and Packard, P.H., 1998, Digital representation of a map showing the thickness and character of Quaternary sediments in the glaciated United States east of the Rocky Mountains: U.S. Geological Survey Digital Data Series DDS–38, one CD-ROM.
Stone, J.R., Schafer, J.P., London, E.H., and Thompson, W.B., 1992, Surficial materials map of Connecticut: U.S. Geo-logical Survey Special Map, 2 sheets, scale 1:125,000.
Thomas, C.E., Jr., Cervione, M.A., Jr., and Grossman, I.G., 1968, Water resources inventory of Connecticut, Part 3, lower Thames and southeastern coastal river basins: Connecticut Water Resources Bulletin, v. 15, 105 p.
Thomas, M.P., Bednar, G.A., Thomas, C.E., Jr., and Wilson, W.E., 1967, Water resources inventory of Connecticut, Part 2, Shetucket River basin: Connecticut Water Resources Bulletin, v. 11, 96 p.
Thomas, W.O., Jr., and Stedinger, J.R., 1991, Estimating low-flow characteristics at gaging stations and through the use of base-flow measurements: U.S. Geological Survey Open-File Report 91–244, p. 197–205.
U.S. Fish and Wildlife Service, 1981, Interim regional policy for New England streamflow recommendations: Newton Corner, Mass., U.S. Fish and Wildlife Service, 3 p.
Vogel, R.M., and Stedinger, J.R., 1985, Minimum variance streamflow record augmentation procedures: Water Resources Research, v. 21, no. 5, p. 715–723.
Weiss, L.A., 1983, Evaluation and design of a streamflow data network for Connecticut: Connecticut Water Resources Bulletin, v. 36, 30 p.
Weiss, L.A., Bingham, J.W., and Thomas, M.P., 1982, Water resources inventory of Connecticut, Part 10, lower Connecticut River basin: Connecticut Water Resources Bulletin, v. 31, 85 p.
Wilson, W.E., Burke, E.L., and Thomas, C.E., Jr., 1974, Water resources inventory of Connecticut, Part 5, lower Housatonic River basin: Connecticut Water Resources Bulletin, v. 19, 79 p.


Tables 1–9
12 Flow Durations, Low-Flow Frequencies, and Monthly Median Flows for Selected Streams in Connecticut through 2005Ta
ble
1.
Desc
riptio
ns o
f stre
amga
ging
sta
tions
with
10
or m
ore
year
s of
con
tinuo
us re
cord
in C
onne
ctic
ut u
sed
to c
ompu
te fl
ow d
urat
ions
, low
-flow
freq
uenc
ies,
and
mon
thly
m
edia
n flo
w s
tatis
tics.
—Co
ntin
ued
[USG
S, U
.S. G
eolo
gica
l Sur
vey;
mi2 ,
squa
re m
iles;
bol
d in
dica
tes
Inde
x St
atio
n]
Map
re
fere
nce
num
ber
(fig.
1)
USG
S
stat
ion
num
ber
Latit
ude
(dec
imal
de
gree
s)
Long
itude
(d
ecim
al
degr
ees)
Rive
r nam
eTo
wn
Year
s of
re
cord
Pe
riod
of r
ecor
d D
rain
age
area
(m
i2 )
701
1183
0041
.474
8-7
1.83
42P
endl
eton
Bro
okN
orth
Sto
ning
ton
47O
ct 1
958–
Sep
2005
4.02
1301
1195
0041
.750
7-7
2.26
56W
illim
antic
Riv
erM
ansf
ield
74O
ct 1
931–
Sep
2005
121
1401
1200
0041
.727
6-7
2.30
23H
op R
iver
Col
umbi
a39
Oct
193
2–O
ct 1
971
74.8
1601
1205
0041
.926
5-7
2.05
70Sa
ffor
d B
rook
Woo
dsto
ck31
Oct
195
0–O
ct 1
981
4.15
1901
1210
0041
.843
7-7
2.16
90M
ount
Hop
e R
iver
Ash
ford
65O
ct 1
940–
Sep
2005
28.6
2201
1220
0041
.719
8-7
2.19
56N
atch
aug
Riv
erW
indh
am69
Oct
193
0–Se
p 19
89, O
ct 1
995–
Sep
2005
174
2301
1225
0041
.700
4-7
2.18
20Sh
etuc
ket R
iver
Win
dham
77O
ct 1
928–
Sep
2005
404
2401
1230
0041
.671
8-7
2.05
23L
ittl
e R
iver
C
ante
rbur
y54
Oct
195
1–Se
p 20
0530
2501
1240
0042
.022
3-7
1.95
56Q
uine
baug
Riv
erT
hom
pson
74O
ct 1
931–
Sep
2005
155
2601
1241
5141
.943
4-7
1.90
04Q
uine
baug
Riv
erT
hom
pson
29M
ay 1
984–
Sep
2000
, Oct
200
0–Se
p 20
0517
2
2801
1254
9041
.927
6-7
1.93
01L
ittl
e R
iver
P
utna
m10
Aug
196
1–Se
p 19
7135
.829
0112
5500
41.9
093
-71.
9129
Qui
neba
ug R
iver
Putn
am50
Jan
1930
–Sep
196
9, O
ct 1
995–
Sep
2005
328
3201
1260
0041
.837
3-7
1.88
53Fi
vem
ile R
iver
Kill
ingl
y34
Nov
193
7–O
ct 1
971
57.8
3401
1265
0041
.710
4-7
1.88
59M
oosu
p R
iver
Plai
nfie
ld39
Oct
193
2–O
ct 1
971
83.6
3501
1266
0041
.765
4-7
1.95
65B
lack
wel
l Bro
okB
rook
lyn
13O
ct 1
963–
Oct
197
617
3701
1269
5041
.584
8-7
1.93
34P
acha
ug R
iver
Gri
swol
d12
Aug
196
1–O
ct 1
973
5338
0112
7000
41.5
979
-71.
9842
Qui
neba
ug R
iver
Gri
swol
d87
Oct
191
8–Se
p 20
0571
341
0112
7500
41.5
587
-72.
1215
Yan
tic R
iver
Nor
wic
h75
Oct
193
0–Se
p 20
0589
.350
0118
4000
41.9
873
-72.
6054
Con
nect
icut
Riv
erSu
ffie
ld77
Aug
192
8–Se
p 20
059,
660
5101
1841
0041
.960
7-7
2.71
04St
ony
Bro
okSu
ffie
ld24
May
198
1–Se
p 20
0510
.4
5301
1844
9041
.913
9-7
2.55
00B
road
Bro
okE
ast W
inds
or39
Aug
196
1–Se
p 19
76, M
ay 1
982–
Sep
2005
15.5
5401
1845
0041
.911
8-7
2.56
29Sc
antic
Riv
erE
ast W
inds
or43
Oct
192
8–O
ct 1
971
98.2
5501
1860
0041
.962
9-7
3.01
76W
est B
ranc
h Fa
rmin
gton
Riv
erB
arkh
amst
ed50
Oct
195
5–Se
p 20
0513
156
0118
6100
41.9
309
-73.
0818
Mad
Riv
erW
inch
este
r13
Oct
195
6–Se
p 19
6918
.558
0118
6500
41.9
673
-73.
0340
Still
Riv
erC
oleb
rook
55O
ct 1
948–
Jul 1
967,
Jul
196
9–Se
p 20
0585
5901
1870
0041
.953
7-7
3.01
37W
est B
ranc
h Fa
rmin
gton
Riv
erB
arkh
amst
ed26
Oct
192
9–Se
p 19
5521
760
0118
7300
42.0
373
-72.
9390
Hub
bard
Riv
erH
artl
and
66Ja
n 19
38–S
ep 1
955,
Oct
195
6–Se
p 20
0519
.961
0118
7400
42.0
343
-72.
9298
Val
ley
Bro
okH
artl
and
32O
ct 1
940–
Sep
1972
7.03
6301
1878
0041
.820
7-7
2.97
01N
epau
g R
iver
New
Har
tfor
d52
Oct
192
1–Se
p 19
55, O
ct 1
958–
Sep
1972
, O
ct 1
998–
Sep
2001
23.5
6401
1878
5041
.795
7-7
2.95
12C
lear
Bro
okB
urlin
gton
55O
ct 1
921–
Oct
197
3, O
ct 1
998–
Sep
2001
0.59
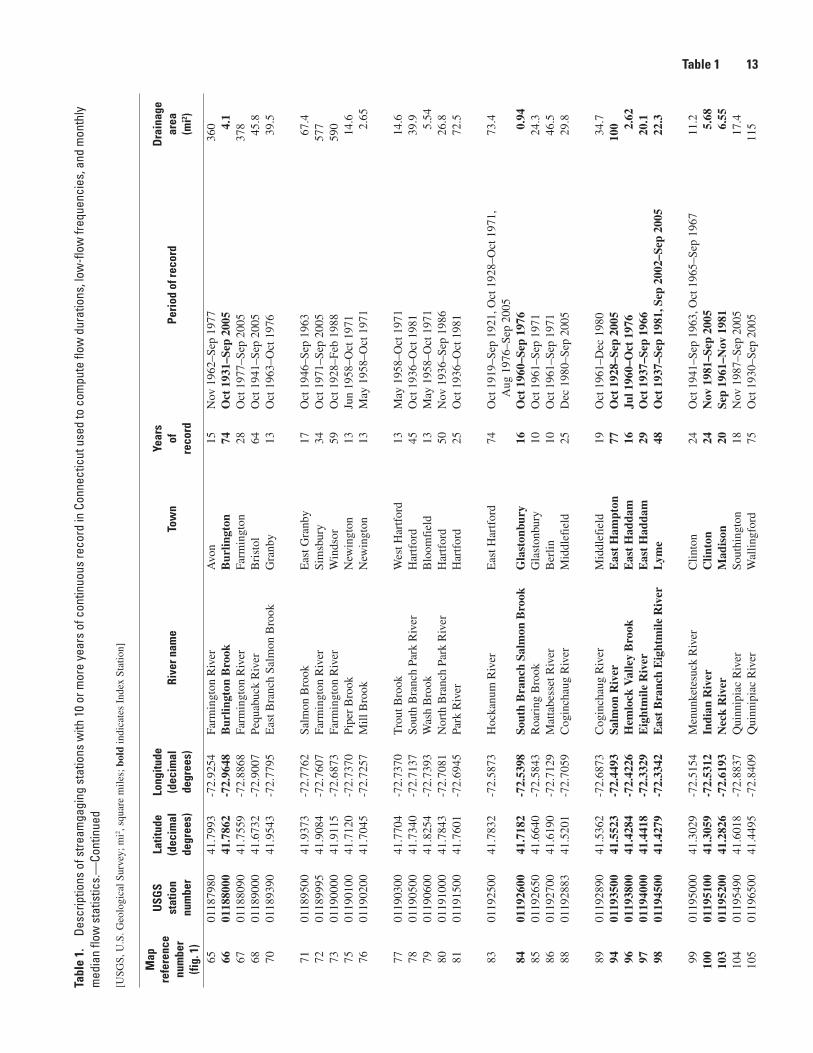
Table 1 13Ta
ble
1.
Desc
riptio
ns o
f stre
amga
ging
sta
tions
with
10
or m
ore
year
s of
con
tinuo
us re
cord
in C
onne
ctic
ut u
sed
to c
ompu
te fl
ow d
urat
ions
, low
-flow
freq
uenc
ies,
and
mon
thly
m
edia
n flo
w s
tatis
tics.
—Co
ntin
ued
[USG
S, U
.S. G
eolo
gica
l Sur
vey;
mi2 ,
squa
re m
iles;
bol
d in
dica
tes
Inde
x St
atio
n]
Map
re
fere
nce
num
ber
(fig.
1)
USG
S
stat
ion
num
ber
Latit
ude
(dec
imal
de
gree
s)
Long
itude
(d
ecim
al
degr
ees)
Rive
r nam
eTo
wn
Year
s of
re
cord
Pe
riod
of r
ecor
d D
rain
age
area
(m
i2 )
6501
1879
8041
.799
3-7
2.92
54Fa
rmin
gton
Riv
erA
von
15N
ov 1
962–
Sep
1977
360
6601
1880
0041
.786
2-7
2.96
48B
urlin
gton
Bro
okB
urlin
gton
74O
ct 1
931–
Sep
2005
4.1
6701
1880
9041
.755
9-7
2.88
68Fa
rmin
gton
Riv
erFa
rmin
gton
28O
ct 1
977–
Sep
2005
378
6801
1890
0041
.673
2-7
2.90
07Pe
quab
uck
Riv
erB
rist
ol64
Oct
194
1–Se
p 20
0545
.870
0118
9390
41.9
543
-72.
7795
Eas
t Bra
nch
Salm
on B
rook
Gra
nby
13O
ct 1
963–
Oct
197
639
.5
7101
1895
0041
.937
3-7
2.77
62Sa
lmon
Bro
okE
ast G
ranb
y17
Oct
194
6–Se
p 19
6367
.472
0118
9995
41.9
084
-72.
7607
Farm
ingt
on R
iver
Sim
sbur
y34
Oct
197
1–Se
p 20
0557
773
0119
0000
41.9
115
-72.
6873
Farm
ingt
on R
iver
Win
dsor
59O
ct 1
928–
Feb
1988
590
7501
1901
0041
.712
0-7
2.73
70Pi
per
Bro
okN
ewin
gton
13Ju
n 19
58–O
ct 1
971
14.6
7601
1902
0041
.704
5-7
2.72
57M
ill B
rook
New
ingt
on13
May
195
8–O
ct 1
971
2.65
7701
1903
0041
.770
4-7
2.73
70T
rout
Bro
okW
est H
artf
ord
13M
ay 1
958–
Oct
197
114
.678
0119
0500
41.7
340
-72.
7137
Sout
h B
ranc
h Pa
rk R
iver
Har
tfor
d45
Oct
193
6–O
ct 1
981
39.9
7901
1906
0041
.825
4-7
2.73
93W
ash
Bro
okB
loom
fiel
d13
May
195
8–O
ct 1
971
5.54
8001
1910
0041
.784
3-7
2.70
81N
orth
Bra
nch
Park
Riv
erH
artf
ord
50N
ov 1
936–
Sep
1986
26.8
8101
1915
0041
.760
1-7
2.69
45Pa
rk R
iver
Har
tfor
d25
Oct
193
6–O
ct 1
981
72.5
8301
1925
0041
.783
2-7
2.58
73H
ocka
num
Riv
erE
ast H
artf
ord
74O
ct 1
919–
Sep
1921
, Oct
192
8–O
ct 1
971,
A
ug 1
976–
Sep
2005
73.4
8401
1926
0041
.718
2-7
2.53
98So
uth
Bra
nch
Salm
on B
rook
Gla
ston
bury
16O
ct 1
960–
Sep
1976
0.94
8501
1926
5041
.664
0-7
2.58
43R
oari
ng B
rook
Gla
ston
bury
10O
ct 1
961–
Sep
1971
24
.386
0119
2700
41.6
190
-72.
7129
Mat
tabe
sset
Riv
erB
erlin
10O
ct 1
961–
Sep
1971
46
.588
0119
2883
41.5
201
-72.
7059
Cog
inch
aug
Riv
erM
iddl
efie
ld25
Dec
198
0–Se
p 20
0529
.8
8901
1928
9041
.536
2-7
2.68
73C
ogin
chau
g R
iver
Mid
dlef
ield
19O
ct 1
961–
Dec
198
034
.794
0119
3500
41.5
523
-72.
4493
Salm
on R
iver
Eas
t H
ampt
on77
Oct
192
8–Se
p 20
0510
096
0119
3800
41.4
284
-72.
4226
Hem
lock
Val
ley
Bro
okE
ast
Had
dam
16Ju
l 196
0–O
ct 1
976
2.62
9701
1940
0041
.441
8-7
2.33
29E
ight
mile
Riv
erE
ast
Had
dam
29O
ct 1
937–
Sep
1966
20.1
9801
1945
0041
.427
9-7
2.33
42E
ast
Bra
nch
Eig
htm
ile R
iver
Lym
e48
Oct
193
7–Se
p 19
81, S
ep 2
002–
Sep
2005
22.3
9901
1950
0041
.302
9-7
2.51
54M
enun
kete
suck
Riv
erC
linto
n24
Oct
194
1–Se
p 19
63, O
ct 1
965–
Sep
1967
11.2
100
0119
5100
41.3
059
-72.
5312
Indi
an R
iver
Clin
ton
24N
ov 1
981–
Sep
2005
5.68
103
0119
5200
41.2
826
-72.
6193
Nec
k R
iver
Mad
ison
20Se
p 19
61–N
ov 1
981
6.55
104
0119
5490
41.6
018
-72.
8837
Qui
nnip
iac
Riv
erSo
uthi
ngto
n18
Nov
198
7–Se
p 20
0517
.410
501
1965
0041
.449
5-7
2.84
09Q
uinn
ipia
c R
iver
Wal
lingf
ord
75O
ct 1
930–
Sep
2005
115
14 Flow Durations, Low-Flow Frequencies, and Monthly Median Flows for Selected Streams in Connecticut through 2005Ta
ble
1.
Desc
riptio
ns o
f stre
amga
ging
sta
tions
with
10
or m
ore
year
s of
con
tinuo
us re
cord
in C
onne
ctic
ut u
sed
to c
ompu
te fl
ow d
urat
ions
, low
-flow
freq
uenc
ies,
and
mon
thly
m
edia
n flo
w s
tatis
tics.
—Co
ntin
ued
[USG
S, U
.S. G
eolo
gica
l Sur
vey;
mi2 ,
squa
re m
iles;
bol
d in
dica
tes
Inde
x St
atio
n]
Map
re
fere
nce
num
ber
(fig.
1)
USG
S
stat
ion
num
ber
Latit
ude
(dec
imal
de
gree
s)
Long
itude
(d
ecim
al
degr
ees)
Rive
r nam
eTo
wn
Year
s of
re
cord
Pe
riod
of r
ecor
d D
rain
age
area
(m
i2 )
106
0119
6580
41.3
687
-72.
8415
Mud
dy R
iver
Nor
th H
aven
11Se
p 19
62–S
ep 1
973
1810
801
1966
2041
.420
9-7
2.90
29M
ill R
iver
Ham
den
29O
ct 1
968–
Sep
1970
, Oct
197
8–Se
p 20
0524
.510
901
1985
0042
.024
0-7
3.34
18B
lack
berr
y R
iver
Nor
th C
anaa
n22
Oct
194
9–O
ct 1
971
45.9
114
0119
9000
41.9
573
-73.
3693
Hou
sato
nic
Riv
erSa
lisbu
ry93
Oct
191
2–Se
p 20
0563
411
501
1990
5041
.942
3-7
3.39
10Sa
lmon
Cre
ekSa
lisbu
ry44
Oct
196
1–Se
p 20
0529
.4
116
0119
9200
41.8
243
-73.
4301
Gui
nea
Bro
okSh
aron
21A
ug 1
960–
Oct
198
13.
511
701
2000
0041
.658
9-7
3.52
89Te
nmile
Riv
erW
ingd
ale,
New
Yor
k72
Oct
192
9–Se
p 19
87, O
ct 1
991–
Sep
2005
203
118
0120
0500
41.6
531
-73.
4898
Hou
sato
nic
Riv
erN
ew M
ilfor
d65
Oct
194
0–Se
p 20
0599
611
901
2011
9041
.607
9-7
3.42
46W
est
Asp
etuc
k R
iver
New
Milf
ord
10O
ct 1
962–
Sep
1972
23.8
120
0120
1500
41.5
201
-73.
4182
Still
Riv
erN
ew M
ilfor
d35
Oct
193
1–Se
p 19
6667
.5
122
0120
1930
41.7
895
-73.
2590
Mar
shep
aug
Riv
erG
oshe
n14
Oct
196
7–O
ct 1
981
9.24
124
0120
3000
41.7
233
-73.
2936
Shep
aug
Riv
erR
oxbu
ry41
Oct
193
0–Se
p 19
7113
212
601
2036
0041
.575
7-7
3.17
87N
onew
aug
Riv
erW
oodb
ury
19O
ct 1
962–
Sep
1976
, Oct
197
8–Se
p 19
79,
Aug
200
0–Se
p 20
00, O
ct 2
001–
Sep
2005
17.7
129
0120
4000
41.4
807
-73.
2246
Pom
pera
ug R
iver
Sout
hbur
y73
Oct
193
2–Se
p 20
0575
.113
001
2048
0041
.362
9-7
3.21
84C
oppe
r M
ill B
rook
Mon
roe
18O
ct 1
958–
Oct
197
62.
45
131
0120
5500
41.3
840
-73.
1676
Hou
sato
nic
Riv
erO
xfor
d77
Oct
192
8–Se
p 20
051,
544
132
0120
5600
41.8
009
-73.
1234
Wes
t Bro
ok N
auga
tuck
Riv
erTo
rrin
gton
40O
ct 1
956–
Sep
1992
, Oct
199
3–A
pr 1
997
33.8
133
0120
5700
41.8
034
-73.
1179
Eas
t Bra
nch
Nau
gatu
ck R
iver
Torr
ingt
on41
Oct
195
6–A
pr 1
997
13.6
134
0120
6000
41.7
043
-73.
0643
Nau
gatu
ck R
iver
Tho
mas
ton
29O
ct 1
930–
Sep
1959
7113
501
2064
0041
.729
5-7
3.05
32L
eadm
ine
Bro
okH
arw
into
n13
Oct
196
0–O
ct 1
973
19.6
136
0120
6500
41.7
018
-73.
0573
Lea
dmin
e B
rook
Tho
mas
ton
29O
ct 1
930–
Sep
1959
24.3
137
0120
6900
41.6
737
-73.
0696
Nau
gatu
ck R
iver
Tho
mas
ton
45O
ct 1
960–
Sep
2005
99.8
138
0120
8013
41.6
537
-73.
0948
Bra
nch
Bro
okW
ater
tow
n15
Oct
197
4–O
ct 1
989,
Apr
199
3–M
ay 1
993
20.8
139
0120
8420
41.5
059
-73.
0582
Hop
Bro
ok
Nau
gatu
ck20
Oct
196
9–O
ct 1
989
16.3
140
0120
8500
41.4
423
-73.
0626
Nau
gatu
ck R
iver
Bea
con
Falls
83O
ct 1
918–
Sep
1924
, Oct
192
8–Se
p 20
0526
0
141
0120
8873
41.1
798
-73.
2190
Roo
ster
Riv
erT
rum
bull
28A
pr 1
977–
Sep
2005
10.6
143
0120
8925
41.1
657
-73.
2704
Mill
Riv
erFa
irfi
eld
33O
ct 1
972–
Sep
2005
28.6
144
0120
8950
41.1
529
-73.
3059
Sasc
o B
rook
Fai
rfie
ld41
Oct
196
4–Se
p 20
057.
3814
501
2089
9041
.294
5-7
3.39
51Sa
ugat
uck
Riv
erR
eddi
ng41
Oct
196
4–Se
p 20
0521
147
0120
9500
41.1
709
-73.
3662
Saug
atuc
k R
iver
Wes
tpor
t35
Oct
193
2–Se
p 19
6779
.814
801
2097
0041
.163
7-7
3.41
93N
orw
alk
Riv
erW
ilton
43Se
p 19
62–S
ep 2
005
30
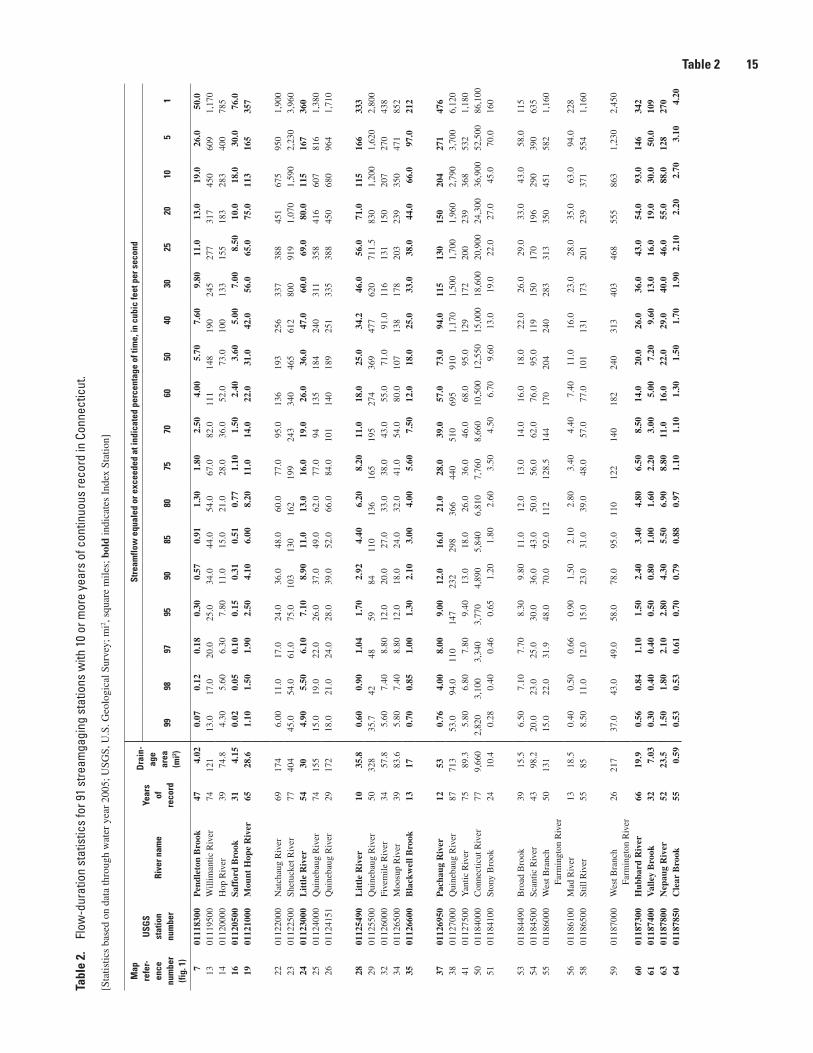
Table 2 15Ta
ble
2.
Flow
-dur
atio
n st
atis
tics
for 9
1 st
ream
gagi
ng s
tatio
ns w
ith 1
0 or
mor
e ye
ars
of c
ontin
uous
reco
rd in
Con
nect
icut
.
[Sta
tistic
s ba
sed
on d
ata
thro
ugh
wat
er y
ear
2005
; USG
S, U
.S. G
eolo
gica
l Sur
vey;
mi2 ,
squa
re m
iles;
bol
d in
dica
tes
Inde
x St
atio
n]
Map
re
fer-
ence
nu
mbe
r (fi
g. 1
)
USG
S st
atio
n nu
mbe
rRi
ver n
ame
Year
s of
re
cord
Dra
in-
age
area
(m
i2 )
Stre
amflo
w e
qual
ed o
r exc
eede
d at
indi
cate
d pe
rcen
tage
of t
ime,
in c
ubic
feet
per
sec
ond
9998
9795
9085
8075
7060
5040
3025
2010
51
701
1183
00P
endl
eton
Bro
ok47
4.02
0.07
0.12
0.18
0.30
0.57
0.91
1.30
1.80
2.50
4.00
5.70
7.60
9.80
11.0
13.0
19.0
26.0
50.0
1301
1195
00W
illim
antic
Riv
er74
121
13.0
17.0
20.0
25.0
34.0
44.0
54.0
67.0
82.0
111
148
190
245
277
317
450
609
1,17
014
0112
0000
Hop
Riv
er39
74.8
4.30
5.60
6.30
7.80
11.0
15.0
21.0
28.0
36.0
52.0
73.0
100
133
155
183
283
400
785
1601
1205
00Sa
ffor
d B
rook
314.
150.
020.
050.
100.
150.
310.
510.
771.
101.
502.
403.
605.
007.
008.
5010
.018
.030
.076
.019
0112
1000
Mou
nt H
ope
Riv
er65
28.6
1.10
1.50
1.90
2.50
4.10
6.00
8.20
11.0
14.0
22.0
31.0
42.0
56.0
65.0
75.0
113
165
357
2201
1220
00N
atch
aug
Riv
er69
174
6.00
11.0
17.0
24.0
36.0
48.0
60.0
77.0
95.0
136
193
256
337
388
451
675
950
1,90
023
0112
2500
Shet
ucke
t Riv
er77
404
45.0
54.0
61.0
75.0
103
130
162
199
243
340
465
612
800
919
1,07
01,
590
2,23
03,
960
2401
1230
00L
ittl
e R
iver
54
304.
905.
506.
107.
108.
9011
.013
.016
.019
.026
.036
.047
.060
.069
.080
.011
516
736
025
0112
4000
Qui
neba
ug R
iver
7415
515
.019
.022
.026
.037
.049
.062
.077
.094
135
184
240
311
358
416
607
816
1,38
026
0112
4151
Qui
neba
ug R
iver
2917
218
.021
.024
.028
.039
.052
.066
.084
.010
114
018
925
133
538
845
068
096
41,
710
2801
1254
90L
ittl
e R
iver
10
35.8
0.60
0.90
1.04
1.70
2.92
4.40
6.20
8.20
11.0
18.0
25.0
34.2
46.0
56.0
71.0
115
166
333
2901
1255
00Q
uine
baug
Riv
er50
328
35.7
4248
5984
110
136
165
195
274
369
477
620
711.
583
01,
200
1,62
02,
800
3201
1260
00Fi
vem
ile R
iver
3457
.85.
607.
408.
8012
.020
.027
.033
.038
.043
.055
.071
.091
.011
613
115
020
727
043
834
0112
6500
Moo
sup
Riv
er39
83.6
5.80
7.40
8.80
12.0
18.0
24.0
32.0
41.0
54.0
80.0
107
138
178
203
239
350
471
852
3501
1266
00B
lack
wel
l Bro
ok13
170.
700.
851.
001.
302.
103.
004.
005.
607.
5012
.018
.025
.033
.038
.044
.066
.097
.021
2
3701
1269
50P
acha
ug R
iver
1253
0.76
4.00
8.00
9.00
12.0
16.0
21.0
28.0
39.0
57.0
73.0
94.0
115
130
150
204
271
476
3801
1270
00Q
uine
baug
Riv
er87
713
53.0
94.0
110
147
232
298
366
440
510
695
910
1,17
01,
500
1,70
01,
960
2,79
03,
700
6,12
041
0112
7500
Yan
tic R
iver
7589
.35.
806.
807.
809.
4013
.018
.026
.036
.046
.068
.095
.012
917
220
023
936
853
21,
180
5001
1840
00C
onne
ctic
ut R
iver
779,
660
2,82
03,
100
3,34
03,
770
4,89
05,
840
6,81
07,
760
8,66
010
,500
12,5
5015
,000
18,6
0020
,900
24,3
0036
,900
52,5
0086
,100
5101
1841
00St
ony
Bro
ok24
10.4
0.28
0.40
0.46
0.65
1.20
1.80
2.60
3.50
4.50
6.70
9.60
13.0
19.0
22.0
27.0
45.0
70.0
160
5301
1844
90B
road
Bro
ok39
15.5
6.50
7.10
7.70
8.30
9.80
11.0
12.0
13.0
14.0
16.0
18.0
22.0
26.0
29.0
33.0
43.0
58.0
115
5401
1845
00Sc
antic
Riv
er43
98.2
20.0
23.0
25.0
30.0
36.0
43.0
50.0
56.0
62.0
76.0
95.0
119
150
170
196
290
390
635
5501
1860
00W
est B
ranc
h
Farm
ingt
on R
iver
5013
115
.022
.031
.948
.070
.092
.011
212
8.5
144
170
204
240
283
313
350
451
582
1,16
0
5601
1861
00M
ad R
iver
1318
.50.
400.
500.
660.
901.
502.
102.
803.
404.
407.
4011
.016
.023
.028
.035
.063
.094
.022
858
0118
6500
Still
Riv
er55
858.
5011
.012
.015
.023
.031
.039
.048
.057
.077
.010
113
117
320
123
937
155
41,
160
5901
1870
00W
est B
ranc
h
Farm
ingt
on R
iver
2621
737
.043
.049
.058
.078
.095
.011
012
214
018
224
031
340
346
855
586
31,
230
2,45
0
6001
1873
00H
ubba
rd R
iver
6619
.90.
560.
841.
101.
502.
403.
404.
806.
508.
5014
.020
.026
.036
.043
.054
.093
.014
634
261
0118
7400
Val
ley
Bro
ok32
7.03
0.30
0.40
0.40
0.50
0.80
1.00
1.60
2.20
3.00
5.00
7.20
9.60
13.0
16.0
19.0
30.0
50.0
109
6301
1878
00N
epau
g R
iver
5223
.51.
501.
802.
102.
804.
305.
506.
908.
8011
.016
.022
.029
.040
.046
.055
.088
.012
827
064
0118
7850
Cle
ar B
rook
550.
590.
530.
530.
610.
700.
790.
880.
971.
101.
101.
301.
501.
701.
902.
102.
202.
703.
104.
20
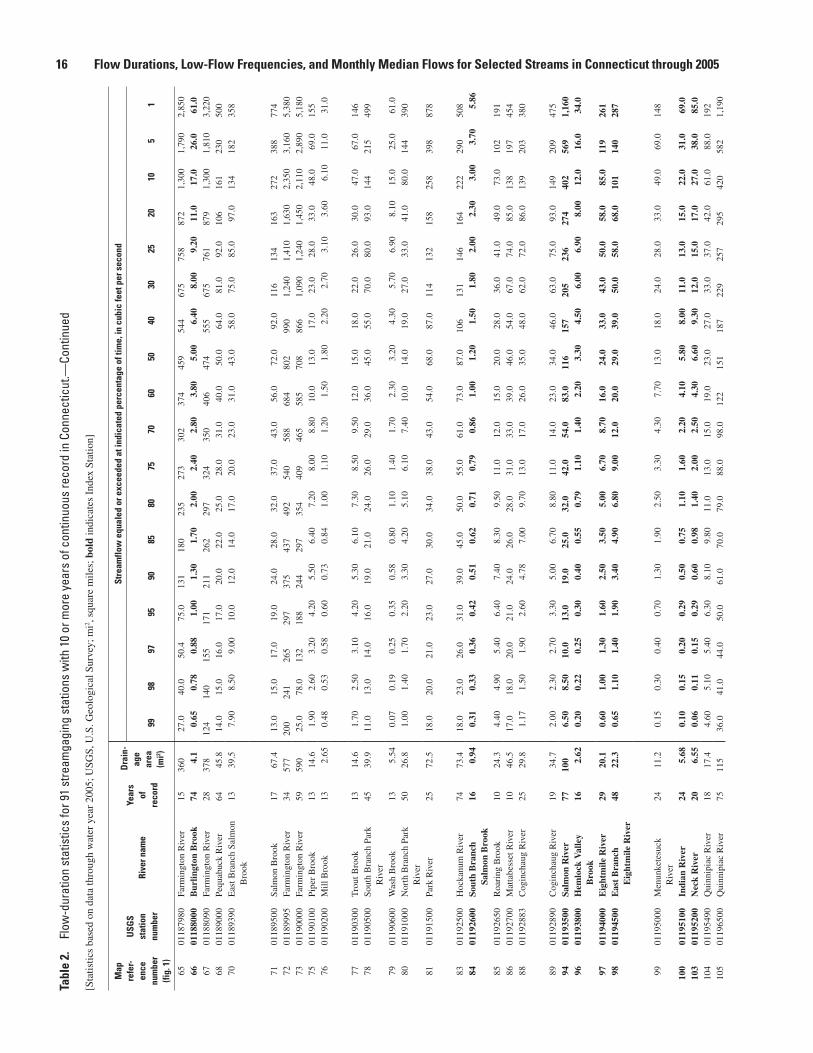
16 Flow Durations, Low-Flow Frequencies, and Monthly Median Flows for Selected Streams in Connecticut through 2005Ta
ble
2.
Flow
-dur
atio
n st
atis
tics
for 9
1 st
ream
gagi
ng s
tatio
ns w
ith 1
0 or
mor
e ye
ars
of c
ontin
uous
reco
rd in
Con
nect
icut
.—Co
ntin
ued
[Sta
tistic
s ba
sed
on d
ata
thro
ugh
wat
er y
ear
2005
; USG
S, U
.S. G
eolo
gica
l Sur
vey;
mi2 ,
squa
re m
iles;
bol
d in
dica
tes
Inde
x St
atio
n]
Map
re
fer-
ence
nu
mbe
r (fi
g. 1
)
USG
S st
atio
n nu
mbe
rRi
ver n
ame
Year
s of
re
cord
Dra
in-
age
area
(m
i2 )
Stre
amflo
w e
qual
ed o
r exc
eede
d at
indi
cate
d pe
rcen
tage
of t
ime,
in c
ubic
feet
per
sec
ond
9998
9795
9085
8075
7060
5040
3025
2010
51
6501
1879
80Fa
rmin
gton
Riv
er15
360
27.0
40.0
50.4
75.0
131
180
235
273
302
374
459
544
675
758
872
1,30
01,
790
2,85
066
0118
8000
Bur
lingt
on B
rook
744.
10.
650.
780.
881.
001.
301.
702.
002.
402.
803.
805.
006.
408.
009.
2011
.017
.026
.061
.067
0118
8090
Farm
ingt
on R
iver
2837
812
414
015
517
121
126
229
732
435
040
647
455
567
576
187
91,
300
1,81
03,
220
6801
1890
00Pe
quab
uck
Riv
er64
45.8
14.0
15.0
16.0
17.0
20.0
22.0
25.0
28.0
31.0
40.0
50.0
64.0
81.0
92.0
106
161
230
500
7001
1893
90E
ast B
ranc
h Sa
lmon
B
rook
1339
.57.
908.
509.
0010
.012
.014
.017
.020
.023
.031
.043
.058
.075
.085
.097
.013
418
235
8
7101
1895
00Sa
lmon
Bro
ok17
67.4
13.0
15.0
17.0
19.0
24.0
28.0
32.0
37.0
43.0
56.0
72.0
92.0
116
134
163
272
388
774
7201
1899
95Fa
rmin
gton
Riv
er34
577
200
241
265
297
375
437
492
540
588
684
802
990
1,24
01,
410
1,63
02,
350
3,16
05,
380
7301
1900
00Fa
rmin
gton
Riv
er59
590
25.0
78.0
132
188
244
297
354
409
465
585
708
866
1,09
01,
240
1,45
02,
110
2,89
05,
180
7501
1901
00Pi
per
Bro
ok13
14.6
1.90
2.60
3.20
4.20
5.50
6.40
7.20
8.00
8.80
10.0
13.0
17.0
23.0
28.0
33.0
48.0
69.0
155
7601
1902
00M
ill B
rook
132.
650.
480.
530.
580.
600.
730.
841.
001.
101.
201.
501.
802.
202.
703.
103.
606.
1011
.031
.0
7701
1903
00T
rout
Bro
ok13
14.6
1.70
2.50
3.10
4.20
5.30
6.10
7.30
8.50
9.50
12.0
15.0
18.0
22.0
26.0
30.0
47.0
67.0
146
7801
1905
00So
uth
Bra
nch
Park
R
iver
4539
.911
.013
.014
.016
.019
.021
.024
.026
.029
.036
.045
.055
.070
.080
.093
.014
421
549
9
7901
1906
00W
ash
Bro
ok13
5.54
0.07
0.19
0.25
0.35
0.58
0.80
1.10
1.40
1.70
2.30
3.20
4.30
5.70
6.90
8.10
15.0
25.0
61.0
8001
1910
00N
orth
Bra
nch
Park
R
iver
5026
.81.
001.
401.
702.
203.
304.
205.
106.
107.
4010
.014
.019
.027
.033
.041
.080
.014
439
0
8101
1915
00Pa
rk R
iver
2572
.518
.020
.021
.023
.027
.030
.034
.038
.043
.054
.068
.087
.011
413
215
825
839
887
8
8301
1925
00H
ocka
num
Riv
er74
73.4
18.0
23.0
26.0
31.0
39.0
45.0
50.0
55.0
61.0
73.0
87.0
106
131
146
164
222
290
508
8401
1926
00So
uth
Bra
nch
Salm
on B
rook
160.
940.
310.
330.
360.
420.
510.
620.
710.
790.
861.
001.
201.
501.
802.
002.
303.
003.
705.
86
8501
1926
50R
oari
ng B
rook
1024
.34.
404.
905.
406.
407.
408.
309.
5011
.012
.015
.020
.028
.036
.041
.049
.073
.010
219
186
0119
2700
Mat
tabe
sset
Riv
er10
46.5
17.0
18.0
20.0
21.0
24.0
26.0
28.0
31.0
33.0
39.0
46.0
54.0
67.0
74.0
85.0
138
197
454
8801
1928
83C
ogin
chau
g R
iver
2529
.81.
171.
501.
902.
604.
787.
009.
7013
.017
.026
.035
.048
.062
.072
.086
.013
920
338
0
8901
1928
90C
ogin
chau
g R
iver
1934
.72.
002.
302.
703.
305.
006.
708.
8011
.014
.023
.034
.046
.063
.075
.093
.014
920
947
594
0119
3500
Salm
on R
iver
7710
06.
508.
5010
.013
.019
.025
.032
.042
.054
.083
.011
615
720
523
627
440
256
91,
160
9601
1938
00H
emlo
ck V
alle
y B
rook
162.
620.
200.
220.
250.
300.
400.
550.
791.
101.
402.
203.
304.
506.
006.
908.
0012
.016
.034
.0
9701
1940
00E
ight
mile
Riv
er29
20.1
0.60
1.00
1.30
1.60
2.50
3.50
5.00
6.70
8.70
16.0
24.0
33.0
43.0
50.0
58.0
85.0
119
261
9801
1945
00E
ast
Bra
nch
E
ight
mile
Riv
er48
22.3
0.65
1.10
1.40
1.90
3.40
4.90
6.80
9.00
12.0
20.0
29.0
39.0
50.0
58.0
68.0
101
140
287
9901
1950
00M
enun
kete
suck
R
iver
2411
.20.
150.
300.
400.
701.
301.
902.
503.
304.
307.
7013
.018
.024
.028
.033
.049
.069
.014
8
100
0119
5100
Indi
an R
iver
245.
680.
100.
150.
200.
290.
500.
751.
101.
602.
204.
105.
808.
0011
.013
.015
.022
.031
.069
.010
301
1952
00N
eck
Riv
er20
6.55
0.06
0.11
0.15
0.29
0.60
0.98
1.40
2.00
2.50
4.30
6.60
9.30
12.0
15.0
17.0
27.0
38.0
85.0
104
0119
5490
Qui
nnip
iac
Riv
er18
17.4
4.60
5.10
5.40
6.30
8.10
9.80
11.0
13.0
15.0
19.0
23.0
27.0
33.0
37.0
42.0
61.0
88.0
192
105
0119
6500
Qui
nnip
iac
Riv
er75
115
36.0
41.0
44.0
50.0
61.0
70.0
79.0
88.0
98.0
122
151
187
229
257
295
420
582
1,19
0
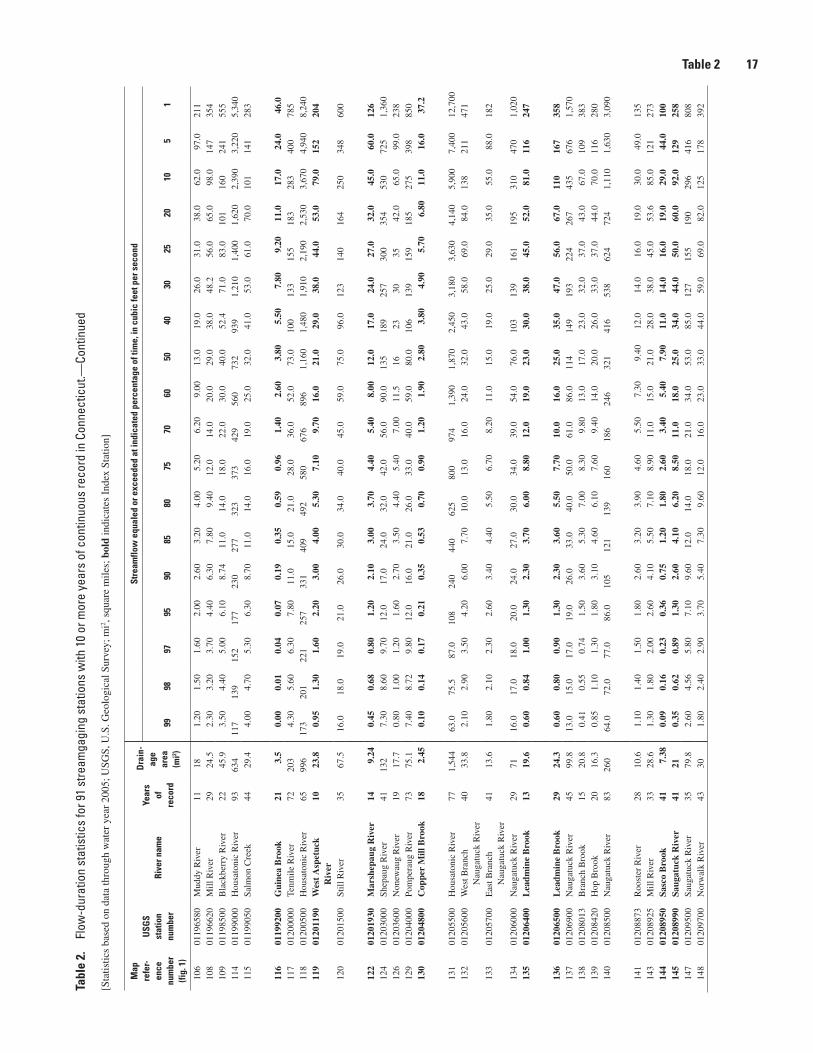
Table 2 17Ta
ble
2.
Flow
-dur
atio
n st
atis
tics
for 9
1 st
ream
gagi
ng s
tatio
ns w
ith 1
0 or
mor
e ye
ars
of c
ontin
uous
reco
rd in
Con
nect
icut
.—Co
ntin
ued
[Sta
tistic
s ba
sed
on d
ata
thro
ugh
wat
er y
ear
2005
; USG
S, U
.S. G
eolo
gica
l Sur
vey;
mi2 ,
squa
re m
iles;
bol
d in
dica
tes
Inde
x St
atio
n]
Map
re
fer-
ence
nu
mbe
r (fi
g. 1
)
USG
S st
atio
n nu
mbe
rRi
ver n
ame
Year
s of
re
cord
Dra
in-
age
area
(m
i2 )
Stre
amflo
w e
qual
ed o
r exc
eede
d at
indi
cate
d pe
rcen
tage
of t
ime,
in c
ubic
feet
per
sec
ond
9998
9795
9085
8075
7060
5040
3025
2010
51
106
0119
6580
Mud
dy R
iver
1118
1.20
1.50
1.60
2.00
2.60
3.20
4.00
5.20
6.20
9.00
13.0
19.0
26.0
31.0
38.0
62.0
97.0
211
108
0119
6620
Mill
Riv
er29
24.5
2.30
3.20
3.70
4.40
6.30
7.80
9.40
12.0
14.0
20.0
29.0
38.0
48.2
56.0
65.0
98.0
147
354
109
0119
8500
Bla
ckbe
rry
Riv
er22
45.9
3.50
4.40
5.00
6.10
8.74
11.0
14.0
18.0
22.0
30.0
40.0
52.4
71.0
83.0
101
160
241
555
114
0119
9000
Hou
sato
nic
Riv
er93
634
117
139
152
177
230
277
323
373
429
560
732
939
1,21
01,
400
1,62
02,
390
3,22
05,
340
115
0119
9050
Salm
on C
reek
4429
.44.
004.
705.
306.
308.
7011
.014
.016
.019
.025
.032
.041
.053
.061
.070
.010
114
128
3
116
0119
9200
Gui
nea
Bro
ok21
3.5
0.00
0.01
0.04
0.07
0.19
0.35
0.59
0.96
1.40
2.60
3.80
5.50
7.80
9.20
11.0
17.0
24.0
46.0
117
0120
0000
Tenm
ile R
iver
7220
34.
305.
606.
307.
8011
.015
.021
.028
.036
.052
.073
.010
013
315
518
328
340
078
511
801
2005
00H
ousa
toni
c R
iver
6599
617
320
122
125
733
140
949
258
067
689
61,
160
1,48
01,
910
2,19
02,
530
3,67
04,
940
8,24
011
901
2011
90W
est
Asp
etuc
k R
iver
1023
.80.
951.
301.
602.
203.
004.
005.
307.
109.
7016
.021
.029
.038
.044
.053
.079
.015
220
4
120
0120
1500
Still
Riv
er35
67.5
16.0
18.0
19.0
21.0
26.0
30.0
34.0
40.0
45.0
59.0
75.0
96.0
123
140
164
250
348
600
122
0120
1930
Mar
shep
aug
Riv
er14
9.24
0.45
0.68
0.80
1.20
2.10
3.00
3.70
4.40
5.40
8.00
12.0
17.0
24.0
27.0
32.0
45.0
60.0
126
124
0120
3000
Shep
aug
Riv
er41
132
7.30
8.60
9.70
12.0
17.0
24.0
32.0
42.0
56.0
90.0
135
189
257
300
354
530
725
1,36
012
601
2036
00N
onew
aug
Riv
er19
17.7
0.80
1.00
1.20
1.60
2.70
3.50
4.40
5.40
7.00
11.5
1623
3035
42.0
65.0
99.0
238
129
0120
4000
Pom
pera
ug R
iver
7375
.17.
408.
729.
8012
.016
.021
.026
.033
.040
.059
.080
.010
613
915
918
527
539
885
013
001
2048
00C
oppe
r M
ill B
rook
182.
450.
100.
140.
170.
210.
350.
530.
700.
901.
201.
902.
803.
804.
905.
706.
8011
.016
.037
.2
131
0120
5500
Hou
sato
nic
Riv
er77
1,54
463
.075
.587
.010
824
044
062
580
097
41,
390
1,87
02,
450
3,18
03,
630
4,14
05,
900
7,40
012
,700
132
0120
5600
Wes
t Bra
nch
N
auga
tuck
Riv
er40
33.8
2.10
2.90
3.50
4.20
6.00
7.70
10.0
13.0
16.0
24.0
32.0
43.0
58.0
69.0
84.0
138
211
471
133
0120
5700
Eas
t Bra
nch
N
auga
tuck
Riv
er41
13.6
1.80
2.10
2.30
2.60
3.40
4.40
5.50
6.70
8.20
11.0
15.0
19.0
25.0
29.0
35.0
55.0
88.0
182
134
0120
6000
Nau
gatu
ck R
iver
2971
16.0
17.0
18.0
20.0
24.0
27.0
30.0
34.0
39.0
54.0
76.0
103
139
161
195
310
470
1,02
013
501
2064
00L
eadm
ine
Bro
ok13
19.6
0.60
0.84
1.00
1.30
2.30
3.70
6.00
8.80
12.0
19.0
23.0
30.0
38.0
45.0
52.0
81.0
116
247
136
0120
6500
Lea
dmin
e B
rook
2924
.30.
600.
800.
901.
302.
303.
605.
507.
7010
.016
.025
.035
.047
.056
.067
.011
016
735
813
701
2069
00N
auga
tuck
Riv
er45
99.8
13.0
15.0
17.0
19.0
26.0
33.0
40.0
50.0
61.0
86.0
114
149
193
224
267
435
676
1,57
013
801
2080
13B
ranc
h B
rook
1520
.80.
410.
550.
741.
503.
605.
307.
008.
309.
8013
.017
.023
.032
.037
.043
.067
.010
938
313
901
2084
20H
op B
rook
20
16.3
0.85
1.10
1.30
1.80
3.10
4.60
6.10
7.60
9.40
14.0
20.0
26.0
33.0
37.0
44.0
70.0
116
280
140
0120
8500
Nau
gatu
ck R
iver
8326
064
.072
.077
.086
.010
512
113
916
018
624
632
141
653
862
472
41,
110
1,63
03,
090
141
0120
8873
Roo
ster
Riv
er28
10.6
1.10
1.40
1.50
1.80
2.60
3.20
3.90
4.60
5.50
7.30
9.40
12.0
14.0
16.0
19.0
30.0
49.0
135
143
0120
8925
Mill
Riv
er33
28.6
1.30
1.80
2.00
2.60
4.10
5.50
7.10
8.90
11.0
15.0
21.0
28.0
38.0
45.0
53.6
85.0
121
273
144
0120
8950
Sasc
o B
rook
417.
380.
090.
160.
230.
360.
751.
201.
802.
603.
405.
407.
9011
.014
.016
.019
.029
.044
.010
014
501
2089
90Sa
ugat
uck
Riv
er41
210.
350.
620.
891.
302.
604.
106.
208.
5011
.018
.025
.034
.044
.050
.060
.092
.012
925
814
701
2095
00Sa
ugat
uck
Riv
er35
79.8
2.60
4.56
5.80
7.10
9.60
12.0
14.0
18.0
21.0
34.0
53.0
85.0
127
155
190
296
416
808
148
0120
9700
Nor
wal
k R
iver
4330
1.80
2.40
2.90
3.70
5.40
7.30
9.60
12.0
16.0
23.0
33.0
44.0
59.0
69.0
82.0
125
178
392
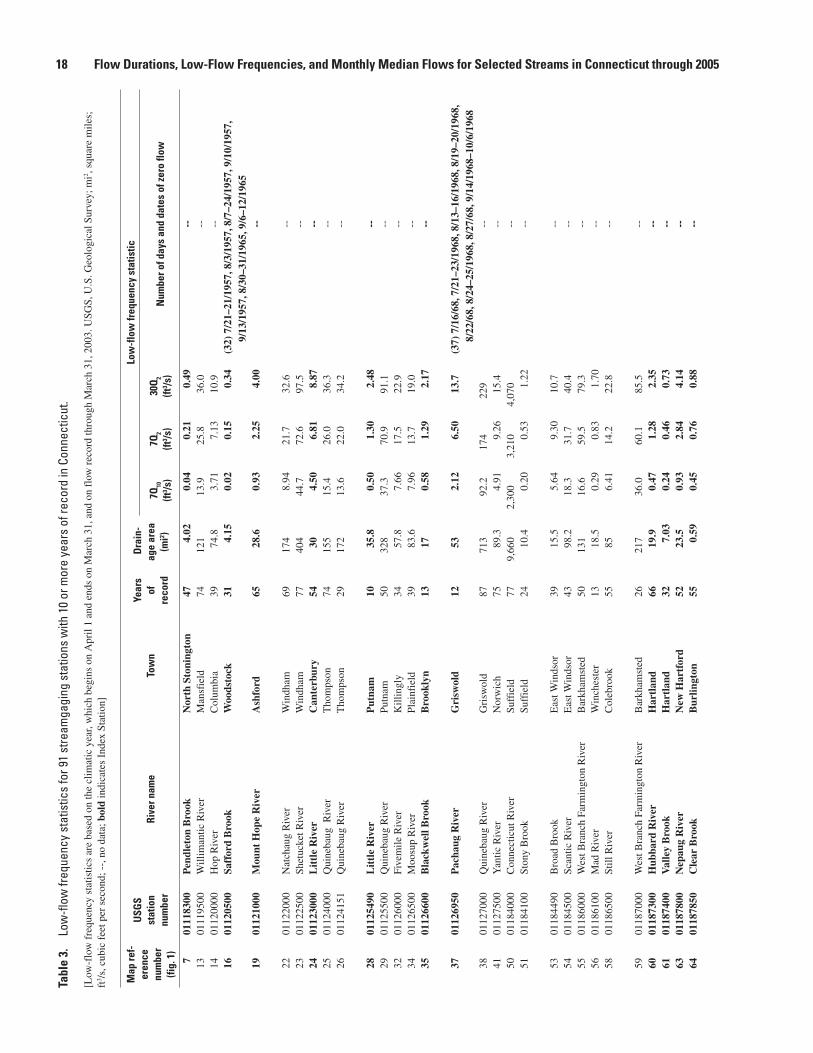
18 Flow Durations, Low-Flow Frequencies, and Monthly Median Flows for Selected Streams in Connecticut through 2005Ta
ble
3.
Low
-flow
freq
uenc
y st
atis
tics
for 9
1 st
ream
gagi
ng s
tatio
ns w
ith 1
0 or
mor
e ye
ars
of re
cord
in C
onne
ctic
ut.—
Cont
inue
d
[Low
-flo
w f
requ
ency
sta
tistic
s ar
e ba
sed
on th
e cl
imat
ic y
ear,
whi
ch b
egin
s on
Apr
il 1
and
ends
on
Mar
ch 3
1, a
nd o
n fl
ow r
ecor
d th
roug
h M
arch
31,
200
3. U
SGS,
U.S
. Geo
logi
cal S
urve
y; m
i2 , sq
uare
mile
s;
ft3 /
s, c
ubic
fee
t per
sec
ond;
--,
no
data
; bol
d in
dica
tes
Inde
x St
atio
n]
Map
ref-
eren
ce
num
ber
(fig.
1)
USG
S st
atio
n nu
mbe
rRi
ver n
ame
Tow
nYe
ars
of
reco
rd
Dra
in-
age
area
(m
i2 )
Low
-flo
w fr
eque
ncy
stat
istic
7Q10
(ft
3 /s)
7Q2
(ft3 /s
)30
Q2
(ft3 /s
)N
umbe
r of d
ays
and
date
s of
zer
o flo
w
701
1183
00P
endl
eton
Bro
okN
orth
Sto
ning
ton
474.
020.
040.
210.
49--
1301
1195
00W
illim
antic
Riv
erM
ansf
ield
7412
113
.925
.836
.0--
1401
1200
00H
op R
iver
Col
umbi
a39
74.8
3.71
7.13
10.9
--16
0112
0500
Saff
ord
Bro
okW
oods
tock
314.
150.
020.
150.
34(3
2) 7
/21–
21/1
957,
8/3
/195
7, 8
/7–2
4/19
57, 9
/10/
1957
, 9/
13/1
957,
8/3
0–31
/196
5, 9
/6–1
2/19
6519
0112
1000
Mou
nt H
ope
Riv
erA
shfo
rd65
28.6
0.93
2.25
4.00
--
2201
1220
00N
atch
aug
Riv
erW
indh
am69
174
8.94
21.7
32.6
--23
0112
2500
Shet
ucke
t Riv
erW
indh
am77
404
44.7
72.6
97.5
--24
0112
3000
Lit
tle
Riv
erC
ante
rbur
y54
304.
506.
818.
87--
2501
1240
00Q
uine
baug
Riv
erT
hom
pson
7415
515
.426
.036
.3--
2601
1241
51Q
uine
baug
Riv
erT
hom
pson
2917
213
.622
.034
.2--
2801
1254
90L
ittl
e R
iver
P
utna
m10
35.8
0.50
1.30
2.48
--29
0112
5500
Qui
neba
ug R
iver
Putn
am50
328
37.3
70.9
91.1
--32
0112
6000
Five
mile
Riv
erK
illin
gly
3457
.87.
6617
.522
.9--
3401
1265
00M
oosu
p R
iver
Plai
nfie
ld39
83.6
7.96
13.7
19.0
--35
0112
6600
Bla
ckw
ell B
rook
Bro
okly
n13
170.
581.
292.
17--
3701
1269
50P
acha
ug R
iver
Gri
swol
d12
532.
126.
5013
.7(3
7) 7
/16/
68, 7
/21–
23/1
968,
8/1
3–16
/196
8, 8
/19–
20/1
968,
8/
22/6
8, 8
/24–
25/1
968,
8/2
7/68
, 9/1
4/19
68–1
0/6/
1968
3801
1270
00Q
uine
baug
Riv
erG
risw
old
8771
392
.217
422
9--
4101
1275
00Y
antic
Riv
erN
orw
ich
7589
.34.
919.
2615
.4--
5001
1840
00C
onne
ctic
ut R
iver
Suff
ield
779,
660
2,30
03,
210
4,07
0--
5101
1841
00St
ony
Bro
okSu
ffie
ld24
10.4
0.20
0.53
1.22
--
5301
1844
90B
road
Bro
okE
ast W
inds
or39
15.5
5.64
9.30
10.7
--54
0118
4500
Scan
tic R
iver
Eas
t Win
dsor
4398
.218
.331
.740
.4--
5501
1860
00W
est B
ranc
h Fa
rmin
gton
Riv
erB
arkh
amst
ed50
131
16.6
59.5
79.3
--56
0118
6100
Mad
Riv
erW
inch
este
r13
18.5
0.29
0.83
1.70
--58
0118
6500
Still
Riv
erC
oleb
rook
5585
6.41
14.2
22.8
--
5901
1870
00W
est B
ranc
h Fa
rmin
gton
Riv
erB
arkh
amst
ed26
217
36.0
60.1
85.5
--60
0118
7300
Hub
bard
Riv
erH
artl
and
6619
.90.
471.
282.
35--
6101
1874
00V
alle
y B
rook
Har
tlan
d32
7.03
0.24
0.46
0.73
--63
0118
7800
Nep
aug
Riv
erN
ew H
artf
ord
5223
.50.
932.
844.
14--
6401
1878
50C
lear
Bro
okB
urlin
gton
550.
590.
450.
760.
88--
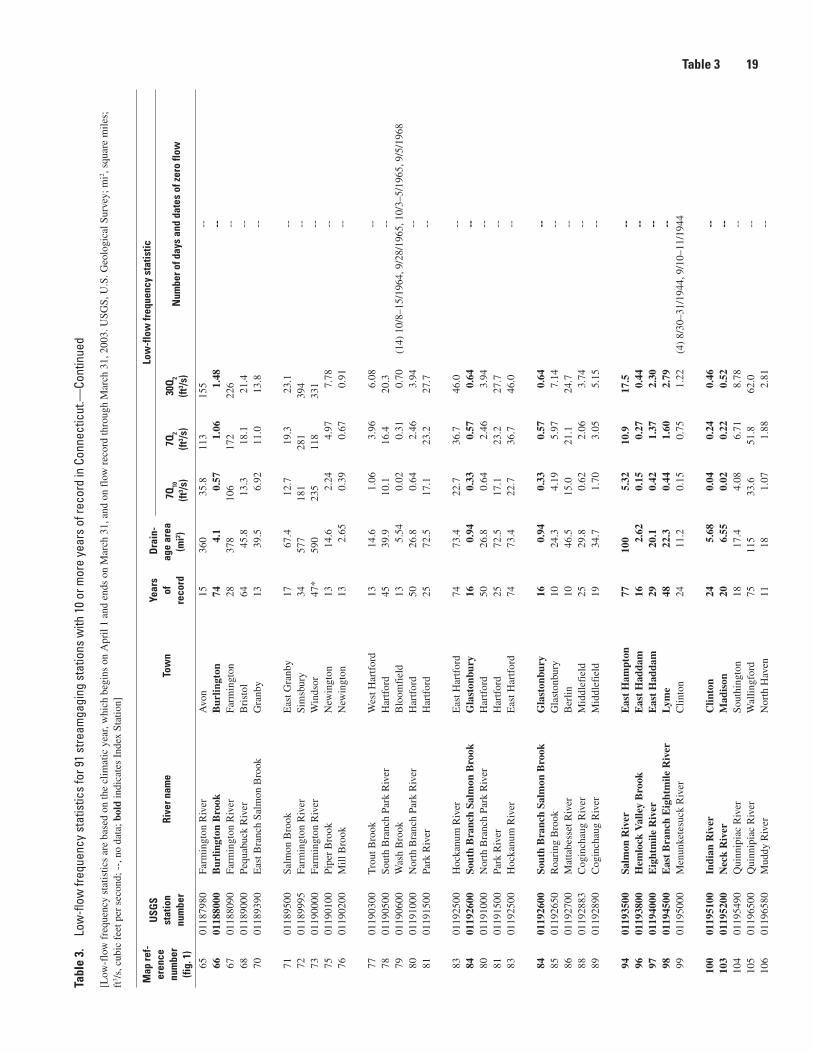
Table 3 19Ta
ble
3.
Low
-flow
freq
uenc
y st
atis
tics
for 9
1 st
ream
gagi
ng s
tatio
ns w
ith 1
0 or
mor
e ye
ars
of re
cord
in C
onne
ctic
ut.—
Cont
inue
d
[Low
-flo
w f
requ
ency
sta
tistic
s ar
e ba
sed
on th
e cl
imat
ic y
ear,
whi
ch b
egin
s on
Apr
il 1
and
ends
on
Mar
ch 3
1, a
nd o
n fl
ow r
ecor
d th
roug
h M
arch
31,
200
3. U
SGS,
U.S
. Geo
logi
cal S
urve
y; m
i2 , sq
uare
mile
s;
ft3 /
s, c
ubic
fee
t per
sec
ond;
--,
no
data
; bol
d in
dica
tes
Inde
x St
atio
n]
Map
ref-
eren
ce
num
ber
(fig.
1)
USG
S st
atio
n nu
mbe
rRi
ver n
ame
Tow
nYe
ars
of
reco
rd
Dra
in-
age
area
(m
i2 )
Low
-flo
w fr
eque
ncy
stat
istic
7Q10
(ft
3 /s)
7Q2
(ft3 /s
)30
Q2
(ft3 /s
)N
umbe
r of d
ays
and
date
s of
zer
o flo
w
6501
1879
80Fa
rmin
gton
Riv
erA
von
1536
035
.811
315
5--
6601
1880
00B
urlin
gton
Bro
okB
urlin
gton
744.
10.
571.
061.
48--
6701
1880
90Fa
rmin
gton
Riv
erFa
rmin
gton
2837
810
617
222
6--
6801
1890
00Pe
quab
uck
Riv
erB
rist
ol64
45.8
13.3
18.1
21.4
--70
0118
9390
Eas
t Bra
nch
Salm
on B
rook
Gra
nby
1339
.56.
9211
.013
.8--
7101
1895
00Sa
lmon
Bro
okE
ast G
ranb
y17
67.4
12.7
19.3
23.1
--72
0118
9995
Farm
ingt
on R
iver
Sim
sbur
y34
577
181
281
394
--73
0119
0000
Farm
ingt
on R
iver
W
inds
or47
*59
023
511
833
1--
7501
1901
00Pi
per
Bro
okN
ewin
gton
1314
.62.
244.
977.
78--
7601
1902
00M
ill B
rook
New
ingt
on13
2.65
0.39
0.67
0.91
--
7701
1903
00T
rout
Bro
okW
est H
artf
ord
1314
.61.
063.
966.
08--
7801
1905
00So
uth
Bra
nch
Park
Riv
erH
artf
ord
4539
.910
.116
.420
.3--
7901
1906
00W
ash
Bro
okB
loom
fiel
d13
5.54
0.02
0.31
0.70
(14)
10/
8–15
/196
4, 9
/28/
1965
, 10/
3–5/
1965
, 9/5
/196
880
0119
1000
Nor
th B
ranc
h Pa
rk R
iver
Har
tfor
d50
26.8
0.64
2.46
3.94
--81
0119
1500
Park
Riv
erH
artf
ord
2572
.517
.123
.227
.7--
8301
1925
00H
ocka
num
Riv
erE
ast H
artf
ord
7473
.422
.736
.746
.0--
8401
1926
00So
uth
Bra
nch
Salm
on B
rook
Gla
ston
bury
160.
940.
330.
570.
64--
8001
1910
00N
orth
Bra
nch
Park
Riv
erH
artf
ord
5026
.80.
642.
463.
94--
8101
1915
00Pa
rk R
iver
Har
tfor
d25
72.5
17.1
23.2
27.7
--83
0119
2500
Hoc
kanu
m R
iver
Eas
t Har
tfor
d74
73.4
22.7
36.7
46.0
--
8401
1926
00So
uth
Bra
nch
Salm
on B
rook
Gla
ston
bury
160.
940.
330.
570.
64--
8501
1926
50R
oari
ng B
rook
Gla
ston
bury
1024
.34.
195.
977.
14--
8601
1927
00M
atta
bess
et R
iver
Ber
lin10
46.5
15.0
21.1
24.7
--88
0119
2883
Cog
inch
aug
Riv
erM
iddl
efie
ld25
29.8
0.62
2.06
3.74
--89
0119
2890
Cog
inch
aug
Riv
erM
iddl
efie
ld19
34.7
1.70
3.05
5.15
--
9401
1935
00Sa
lmon
Riv
erE
ast
Ham
pton
7710
05.
3210
.917
.5--
9601
1938
00H
emlo
ck V
alle
y B
rook
Eas
t H
adda
m16
2.62
0.15
0.27
0.44
--97
0119
4000
Eig
htm
ile R
iver
Eas
t H
adda
m29
20.1
0.42
1.37
2.30
--98
0119
4500
Eas
t B
ranc
h E
ight
mile
Riv
erL
yme
4822
.30.
441.
602.
79--
9901
1950
00M
enun
kete
suck
Riv
erC
linto
n24
11.2
0.15
0.75
1.22
(4)
8/30
–31/
1944
, 9/1
0–11
/194
4
100
0119
5100
Indi
an R
iver
Clin
ton
245.
680.
040.
240.
46--
103
0119
5200
Nec
k R
iver
Mad
ison
206.
550.
020.
220.
52--
104
0119
5490
Qui
nnip
iac
Riv
erSo
uthi
ngto
n18
17.4
4.08
6.71
8.78
--10
501
1965
00Q
uinn
ipia
c R
iver
Wal
lingf
ord
7511
533
.651
.862
.0--
106
0119
6580
Mud
dy R
iver
Nor
th H
aven
1118
1.07
1.88
2.81
--
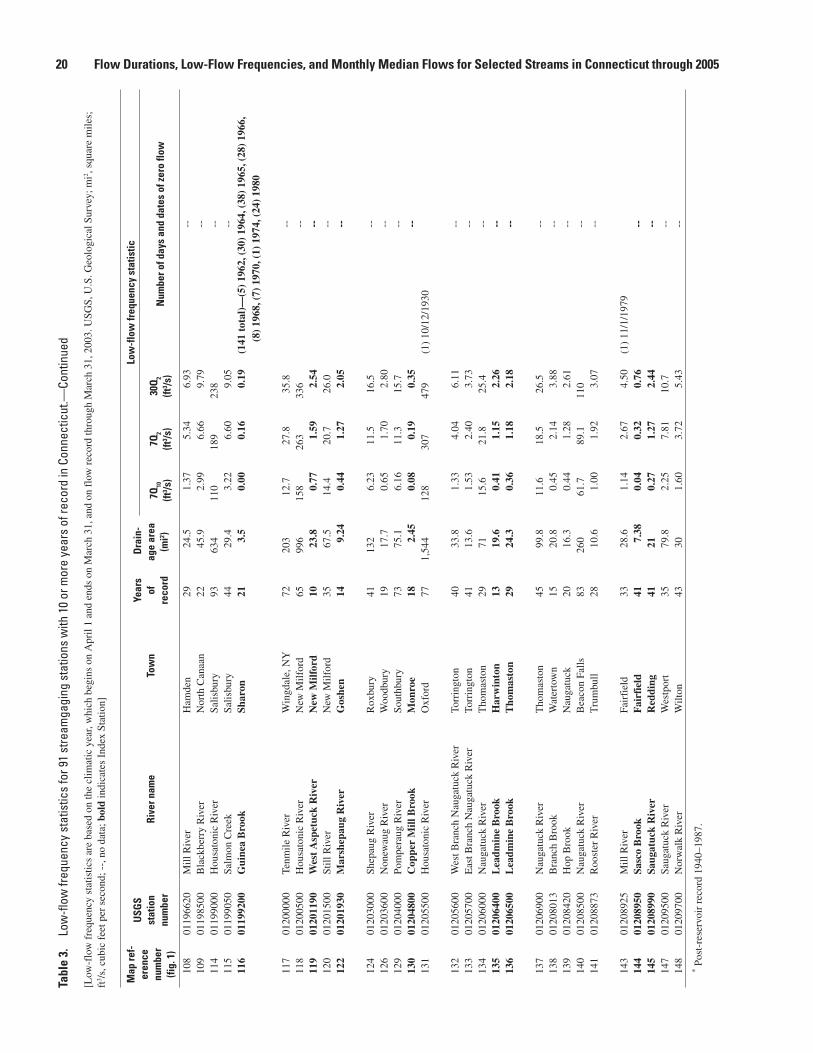
20 Flow Durations, Low-Flow Frequencies, and Monthly Median Flows for Selected Streams in Connecticut through 2005Ta
ble
3.
Low
-flow
freq
uenc
y st
atis
tics
for 9
1 st
ream
gagi
ng s
tatio
ns w
ith 1
0 or
mor
e ye
ars
of re
cord
in C
onne
ctic
ut.—
Cont
inue
d
[Low
-flo
w f
requ
ency
sta
tistic
s ar
e ba
sed
on th
e cl
imat
ic y
ear,
whi
ch b
egin
s on
Apr
il 1
and
ends
on
Mar
ch 3
1, a
nd o
n fl
ow r
ecor
d th
roug
h M
arch
31,
200
3. U
SGS,
U.S
. Geo
logi
cal S
urve
y; m
i2 , sq
uare
mile
s;
ft3 /
s, c
ubic
fee
t per
sec
ond;
--,
no
data
; bol
d in
dica
tes
Inde
x St
atio
n]
Map
ref-
eren
ce
num
ber
(fig.
1)
USG
S st
atio
n nu
mbe
rRi
ver n
ame
Tow
nYe
ars
of
reco
rd
Dra
in-
age
area
(m
i2 )
Low
-flo
w fr
eque
ncy
stat
istic
7Q10
(ft
3 /s)
7Q2
(ft3 /s
)30
Q2
(ft3 /s
)N
umbe
r of d
ays
and
date
s of
zer
o flo
w
108
0119
6620
Mill
Riv
erH
amde
n29
24.5
1.37
5.34
6.93
--10
901
1985
00B
lack
berr
y R
iver
Nor
th C
anaa
n22
45.9
2.99
6.66
9.79
--11
401
1990
00H
ousa
toni
c R
iver
Salis
bury
9363
411
018
923
8--
115
0119
9050
Salm
on C
reek
Salis
bury
4429
.43.
226.
609.
05--
116
0119
9200
Gui
nea
Bro
okSh
aron
213.
50.
000.
160.
19(1
41 t
otal
)—(5
) 19
62, (
30)
1964
, (38
) 19
65, (
28)
1966
, (8
) 19
68, (
7) 1
970,
(1)
197
4, (
24)
1980
117
0120
0000
Tenm
ile R
iver
Win
gdal
e, N
Y72
203
12.7
27.8
35.8
--11
801
2005
00H
ousa
toni
c R
iver
New
Milf
ord
6599
615
826
333
6--
119
0120
1190
Wes
t A
spet
uck
Riv
erN
ew M
ilfor
d10
23.8
0.77
1.59
2.54
--12
001
2015
00St
ill R
iver
New
Milf
ord
3567
.514
.420
.726
.0--
122
0120
1930
Mar
shep
aug
Riv
erG
oshe
n14
9.24
0.44
1.27
2.05
--
124
0120
3000
Shep
aug
Riv
erR
oxbu
ry
4113
26.
2311
.516
.5--
126
0120
3600
Non
ewau
g R
iver
Woo
dbur
y19
17.7
0.65
1.70
2.80
--12
901
2040
00Po
mpe
raug
Riv
erSo
uthb
ury
7375
.16.
1611
.315
.7--
130
0120
4800
Cop
per
Mill
Bro
okM
onro
e18
2.45
0.08
0.19
0.35
--13
101
2055
00H
ousa
toni
c R
iver
Oxf
ord
771,
544
128
307
479
(1)
10/1
2/19
30
132
0120
5600
Wes
t Bra
nch
Nau
gatu
ck R
iver
Torr
ingt
on40
33.8
1.33
4.04
6.11
--13
301
2057
00E
ast B
ranc
h N
auga
tuck
Riv
erTo
rrin
gton
4113
.61.
532.
403.
73--
134
0120
6000
Nau
gatu
ck R
iver
Tho
mas
ton
2971
15.6
21.8
25.4
--13
501
2064
00L
eadm
ine
Bro
okH
arw
into
n13
19.6
0.41
1.15
2.26
--13
601
2065
00L
eadm
ine
Bro
okT
hom
asto
n29
24.3
0.36
1.18
2.18
--
137
0120
6900
Nau
gatu
ck R
iver
Tho
mas
ton
4599
.811
.618
.526
.5--
138
0120
8013
Bra
nch
Bro
okW
ater
tow
n15
20.8
0.45
2.14
3.88
--13
901
2084
20H
op B
rook
N
auga
tuck
2016
.30.
441.
282.
61--
140
0120
8500
Nau
gatu
ck R
iver
Bea
con
Falls
8326
061
.789
.111
0--
141
0120
8873
Roo
ster
Riv
erT
rum
bull
2810
.61.
001.
923.
07--
143
0120
8925
Mill
Riv
erFa
irfi
eld
3328
.61.
142.
674.
50(1
) 11
/1/1
979
144
0120
8950
Sasc
o B
rook
Fai
rfie
ld41
7.38
0.04
0.32
0.76
--14
501
2089
90Sa
ugat
uck
Riv
erR
eddi
ng41
210.
271.
272.
44--
147
0120
9500
Saug
atuc
k R
iver
Wes
tpor
t35
79.8
2.25
7.81
10.7
--14
801
2097
00N
orw
alk
Riv
erW
ilton
4330
1.60
3.72
5.43
--
* Pos
t-re
serv
oir
reco
rd 1
940–
1987
.
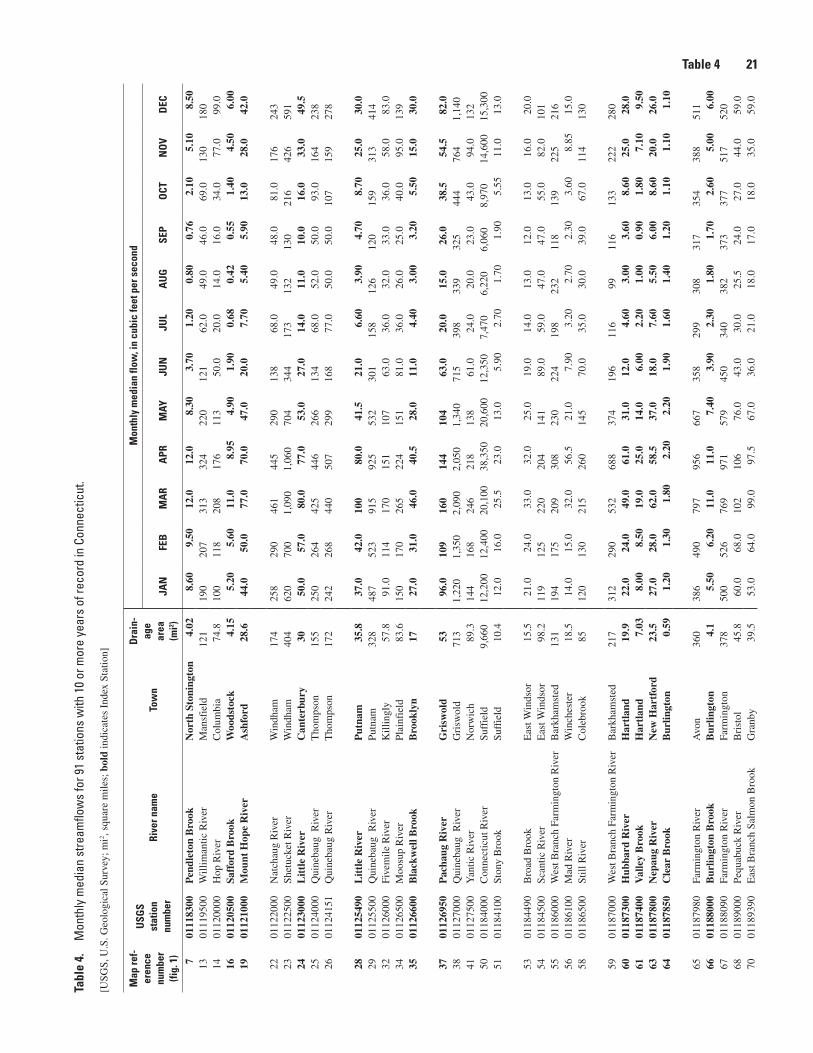
Table 4 21Ta
ble
4.
Mon
thly
med
ian
stre
amflo
ws
for 9
1 st
atio
ns w
ith 1
0 or
mor
e ye
ars
of re
cord
in C
onne
ctic
ut.—
Cont
inue
d
[USG
S, U
.S. G
eolo
gica
l Sur
vey;
mi2 ,
squa
re m
iles;
bol
d in
dica
tes
Inde
x St
atio
n]
Map
ref-
eren
ce
num
ber
(fig.
1)
USG
S st
atio
n nu
mbe
rRi
ver n
ame
Tow
n
Dra
in-
age
area
(m
i2 )
Mon
thly
med
ian
flow
, in
cubi
c fe
et p
er s
econ
d
JAN
FEB
MA
RA
PRM
AYJU
NJU
LA
UG
SEP
OCT
NO
VD
EC
701
1183
00P
endl
eton
Bro
okN
orth
Sto
ning
ton
4.02
8.60
9.50
12.0
12.0
8.30
3.70
1.20
0.80
0.76
2.10
5.10
8.50
1301
1195
00W
illim
antic
Riv
erM
ansf
ield
121
190
207
313
324
220
121
62.0
49.0
46.0
69.0
130
180
1401
1200
00H
op R
iver
Col
umbi
a74
.810
011
820
817
611
350
.020
.014
.016
.034
.077
.099
.016
0112
0500
Saff
ord
Bro
okW
oods
tock
4.15
5.20
5.60
11.0
8.95
4.90
1.90
0.68
0.42
0.55
1.40
4.50
6.00
1901
1210
00M
ount
Hop
e R
iver
Ash
ford
28.6
44.0
50.0
77.0
70.0
47.0
20.0
7.70
5.40
5.90
13.0
28.0
42.0
2201
1220
00N
atch
aug
Riv
erW
indh
am17
425
829
046
144
529
013
868
.049
.048
.081
.017
624
323
0112
2500
Shet
ucke
t Riv
erW
indh
am40
462
070
01,
090
1,06
070
434
417
313
213
021
642
659
124
0112
3000
Lit
tle
Riv
er
Can
terb
ury
3050
.057
.080
.077
.053
.027
.014
.011
.010
.016
.033
.049
.525
0112
4000
Qui
neba
ug R
iver
Tho
mps
on15
525
026
442
544
626
613
468
.052
.050
.093
.016
423
826
0112
4151
Qui
neba
ug R
iver
Tho
mps
on17
224
226
844
050
729
916
877
.050
.050
.010
715
927
8
2801
1254
90L
ittl
e R
iver
P
utna
m35
.837
.042
.010
080
.041
.521
.06.
603.
904.
708.
7025
.030
.029
0112
5500
Qui
neba
ug R
iver
Putn
am32
848
752
391
592
553
230
115
812
612
015
931
341
432
0112
6000
Five
mile
Riv
erK
illin
gly
57.8
91.0
114
170
151
107
63.0
36.0
32.0
33.0
36.0
58.0
83.0
3401
1265
00M
oosu
p R
iver
Plai
nfie
ld83
.615
017
026
522
415
181
.036
.026
.025
.040
.095
.013
935
0112
6600
Bla
ckw
ell B
rook
Bro
okly
n17
27.0
31.0
46.0
40.5
28.0
11.0
4.40
3.00
3.20
5.50
15.0
30.0
3701
1269
50P
acha
ug R
iver
Gri
swol
d53
96.0
109
160
144
104
63.0
20.0
15.0
26.0
38.5
54.5
82.0
3801
1270
00Q
uine
baug
Riv
erG
risw
old
713
1,22
01,
350
2,09
02,
050
1,34
071
539
833
932
544
476
41,
140
4101
1275
00Y
antic
Riv
erN
orw
ich
89.3
144
168
246
218
138
61.0
24.0
20.0
23.0
43.0
94.0
132
5001
1840
00C
onne
ctic
ut R
iver
Suff
ield
9,66
012
,200
12,4
0020
,100
38,3
5020
,600
12,3
507,
470
6,22
06,
060
8,97
014
,600
15,3
0051
0118
4100
Ston
y B
rook
Suff
ield
10.4
12.0
16.0
25.5
23.0
13.0
5.90
2.70
1.70
1.90
5.55
11.0
13.0
5301
1844
90B
road
Bro
okE
ast W
inds
or15
.521
.024
.033
.032
.025
.019
.014
.013
.012
.013
.016
.020
.054
0118
4500
Scan
tic R
iver
Eas
t Win
dsor
98.2
119
125
220
204
141
89.0
59.0
47.0
47.0
55.0
82.0
101
5501
1860
00W
est B
ranc
h Fa
rmin
gton
Riv
erB
arkh
amst
ed13
119
417
520
930
823
022
419
823
211
813
922
521
656
0118
6100
Mad
Riv
erW
inch
este
r18
.514
.015
.032
.056
.521
.07.
903.
202.
702.
303.
608.
8515
.058
0118
6500
Still
Riv
erC
oleb
rook
8512
013
021
526
014
570
.035
.030
.039
.067
.011
413
0
5901
1870
00W
est B
ranc
h Fa
rmin
gton
Riv
erB
arkh
amst
ed21
731
229
053
268
837
419
611
699
116
133
222
280
6001
1873
00H
ubba
rd R
iver
Har
tlan
d19
.922
.024
.049
.061
.031
.012
.04.
603.
003.
608.
6025
.028
.061
0118
7400
Val
ley
Bro
okH
artl
and
7.03
8.00
8.50
19.0
25.0
14.0
6.00
2.20
1.00
0.90
1.80
7.10
9.50
6301
1878
00N
epau
g R
iver
New
Har
tfor
d23
.527
.028
.062
.058
.537
.018
.07.
605.
506.
008.
6020
.026
.064
0118
7850
Cle
ar B
rook
Bur
lingt
on0.
591.
201.
301.
802.
202.
201.
901.
601.
401.
201.
101.
101.
10
6501
1879
80Fa
rmin
gton
Riv
erA
von
360
386
490
797
956
667
358
299
308
317
354
388
511
6601
1880
00B
urlin
gton
Bro
okB
urlin
gton
4.1
5.50
6.20
11.0
11.0
7.40
3.90
2.30
1.80
1.70
2.60
5.00
6.00
6701
1880
90Fa
rmin
gton
Riv
erFa
rmin
gton
378
500
526
769
971
579
450
340
382
373
377
517
520
6801
1890
00Pe
quab
uck
Riv
erB
rist
ol45
.860
.068
.010
210
676
.043
.030
.025
.524
.027
.044
.059
.070
0118
9390
Eas
t Bra
nch
Salm
on B
rook
Gra
nby
39.5
53.0
64.0
99.0
97.5
67.0
36.0
21.0
18.0
17.0
18.0
35.0
59.0
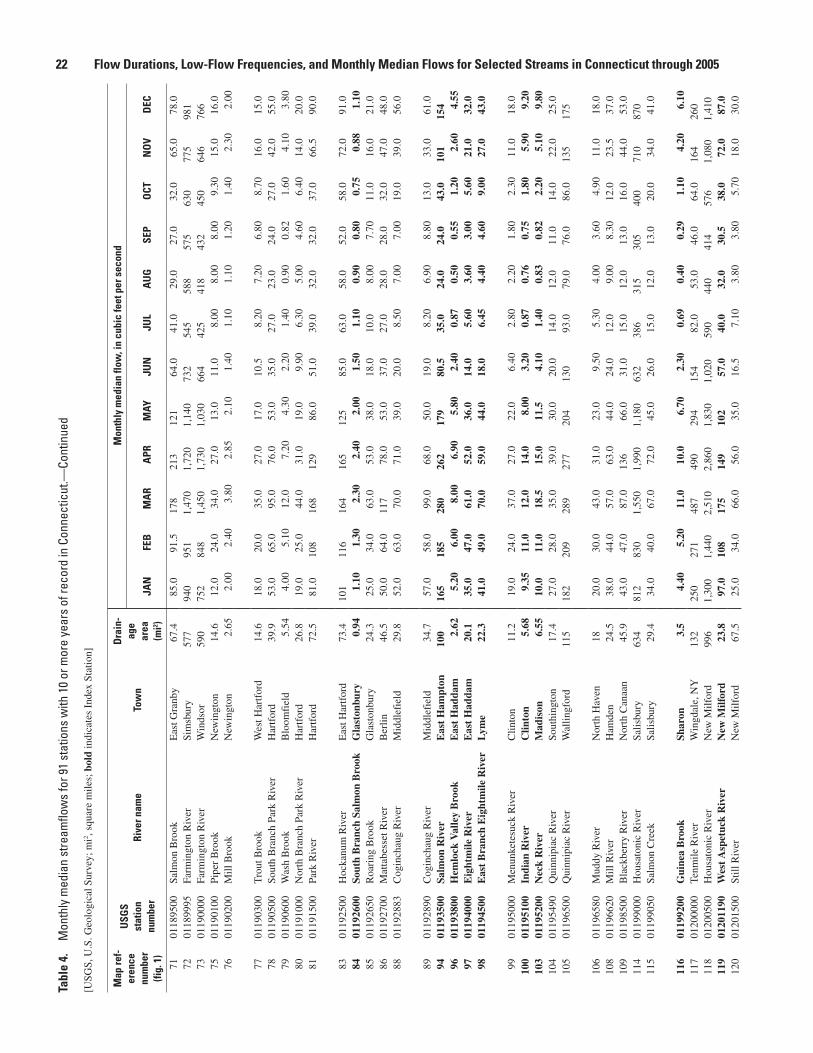
22 Flow Durations, Low-Flow Frequencies, and Monthly Median Flows for Selected Streams in Connecticut through 2005Ta
ble
4.
Mon
thly
med
ian
stre
amflo
ws
for 9
1 st
atio
ns w
ith 1
0 or
mor
e ye
ars
of re
cord
in C
onne
ctic
ut.—
Cont
inue
d
[USG
S, U
.S. G
eolo
gica
l Sur
vey;
mi2 ,
squa
re m
iles;
bol
d in
dica
tes
Inde
x St
atio
n]
Map
ref-
eren
ce
num
ber
(fig.
1)
USG
S st
atio
n nu
mbe
rRi
ver n
ame
Tow
n
Dra
in-
age
area
(m
i2 )
Mon
thly
med
ian
flow
, in
cubi
c fe
et p
er s
econ
d
JAN
FEB
MA
RA
PRM
AYJU
NJU
LA
UG
SEP
OCT
NO
VD
EC
7101
1895
00Sa
lmon
Bro
okE
ast G
ranb
y67
.485
.091
.517
821
312
164
.041
.029
.027
.032
.065
.078
.072
0118
9995
Farm
ingt
on R
iver
Sim
sbur
y57
794
095
11,
470
1,72
01,
140
732
545
588
575
630
775
981
7301
1900
00Fa
rmin
gton
Riv
erW
inds
or59
075
284
81,
450
1,73
01,
030
664
425
418
432
450
646
766
7501
1901
00Pi
per
Bro
okN
ewin
gton
14.6
12.0
24.0
34.0
27.0
13.0
11.0
8.00
8.00
8.00
9.30
15.0
16.0
7601
1902
00M
ill B
rook
New
ingt
on2.
652.
002.
403.
802.
852.
101.
401.
101.
101.
201.
402.
302.
00
7701
1903
00T
rout
Bro
okW
est H
artf
ord
14.6
18.0
20.0
35.0
27.0
17.0
10.5
8.20
7.20
6.80
8.70
16.0
15.0
7801
1905
00So
uth
Bra
nch
Park
Riv
erH
artf
ord
39.9
53.0
65.0
95.0
76.0
53.0
35.0
27.0
23.0
24.0
27.0
42.0
55.0
7901
1906
00W
ash
Bro
okB
loom
fiel
d5.
544.
005.
1012
.07.
204.
302.
201.
400.
900.
821.
604.
103.
8080
0119
1000
Nor
th B
ranc
h Pa
rk R
iver
Har
tfor
d26
.819
.025
.044
.031
.019
.09.
906.
305.
004.
606.
4014
.020
.081
0119
1500
Park
Riv
erH
artf
ord
72.5
81.0
108
168
129
86.0
51.0
39.0
32.0
32.0
37.0
66.5
90.0
8301
1925
00H
ocka
num
Riv
erE
ast H
artf
ord
73.4
101
116
164
165
125
85.0
63.0
58.0
52.0
58.0
72.0
91.0
8401
1926
00So
uth
Bra
nch
Salm
on B
rook
Gla
ston
bury
0.94
1.10
1.30
2.30
2.40
2.00
1.50
1.10
0.90
0.80
0.75
0.88
1.10
8501
1926
50R
oari
ng B
rook
Gla
ston
bury
24.3
25.0
34.0
63.0
53.0
38.0
18.0
10.0
8.00
7.70
11.0
16.0
21.0
8601
1927
00M
atta
bess
et R
iver
Ber
lin46
.550
.064
.011
778
.053
.037
.027
.028
.028
.032
.047
.048
.088
0119
2883
Cog
inch
aug
Riv
erM
iddl
efie
ld29
.852
.063
.070
.071
.039
.020
.08.
507.
007.
0019
.039
.056
.0
8901
1928
90C
ogin
chau
g R
iver
Mid
dlef
ield
34.7
57.0
58.0
99.0
68.0
50.0
19.0
8.20
6.90
8.80
13.0
33.0
61.0
9401
1935
00Sa
lmon
Riv
erE
ast
Ham
pton
100
165
185
280
262
179
80.5
35.0
24.0
24.0
43.0
101
154
9601
1938
00H
emlo
ck V
alle
y B
rook
Eas
t H
adda
m2.
625.
206.
008.
006.
905.
802.
400.
870.
500.
551.
202.
604.
5597
0119
4000
Eig
htm
ile R
iver
Eas
t H
adda
m20
.135
.047
.061
.052
.036
.014
.05.
603.
603.
005.
6021
.032
.098
0119
4500
Eas
t B
ranc
h E
ight
mile
Riv
erL
yme
22.3
41.0
49.0
70.0
59.0
44.0
18.0
6.45
4.40
4.60
9.00
27.0
43.0
9901
1950
00M
enun
kete
suck
Riv
erC
linto
n11
.219
.024
.037
.027
.022
.06.
402.
802.
201.
802.
3011
.018
.010
001
1951
00In
dian
Riv
erC
linto
n5.
689.
3511
.012
.014
.08.
003.
200.
870.
760.
751.
805.
909.
2010
301
1952
00N
eck
Riv
erM
adis
on6.
5510
.011
.018
.515
.011
.54.
101.
400.
830.
822.
205.
109.
8010
401
1954
90Q
uinn
ipia
c R
iver
Sout
hing
ton
17.4
27.0
28.0
35.0
39.0
30.0
20.0
14.0
12.0
11.0
14.0
22.0
25.0
105
0119
6500
Qui
nnip
iac
Riv
erW
allin
gfor
d11
518
220
928
927
720
413
093
.079
.076
.086
.013
517
5
106
0119
6580
Mud
dy R
iver
Nor
th H
aven
1820
.030
.043
.031
.023
.09.
505.
304.
003.
604.
9011
.018
.010
801
1966
20M
ill R
iver
Ham
den
24.5
38.0
44.0
57.0
63.0
44.0
24.0
12.0
9.00
8.30
12.0
23.5
37.0
109
0119
8500
Bla
ckbe
rry
Riv
erN
orth
Can
aan
45.9
43.0
47.0
87.0
136
66.0
31.0
15.0
12.0
13.0
16.0
44.0
53.0
114
0119
9000
Hou
sato
nic
Riv
erSa
lisbu
ry63
481
283
01,
550
1,99
01,
180
632
386
315
305
400
710
870
115
0119
9050
Salm
on C
reek
Salis
bury
29.4
34.0
40.0
67.0
72.0
45.0
26.0
15.0
12.0
13.0
20.0
34.0
41.0
116
0119
9200
Gui
nea
Bro
okSh
aron
3.5
4.40
5.20
11.0
10.0
6.70
2.30
0.69
0.40
0.29
1.10
4.20
6.10
117
0120
0000
Tenm
ile R
iver
Win
gdal
e, N
Y13
225
027
148
749
029
415
482
.053
.046
.064
.016
426
011
801
2005
00H
ousa
toni
c R
iver
New
Milf
ord
996
1,30
01,
440
2,51
02,
860
1,83
01,
020
590
440
414
576
1,08
01,
410
119
0120
1190
Wes
t A
spet
uck
Riv
erN
ew M
ilfor
d23
.897
.010
817
514
910
257
.040
.032
.030
.538
.072
.087
.012
001
2015
00St
ill R
iver
New
Milf
ord
67.5
25.0
34.0
66.0
56.0
35.0
16.5
7.10
3.80
3.80
5.70
18.0
30.0
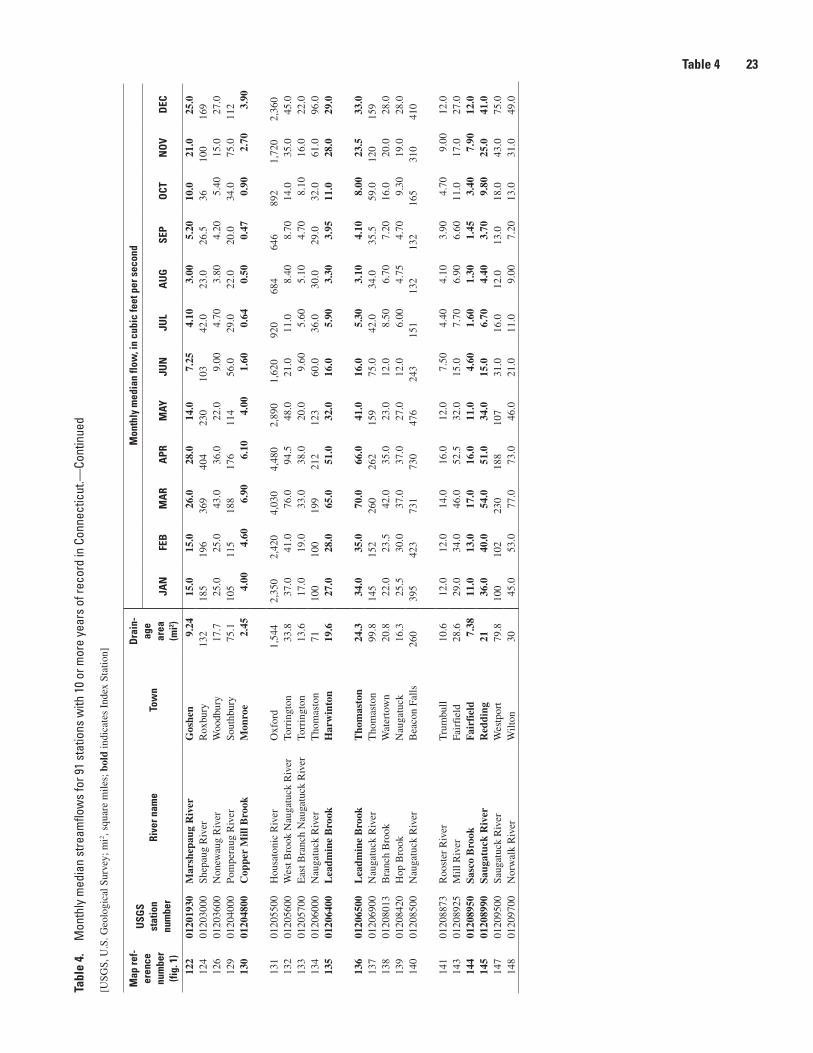
Table 4 23Ta
ble
4.
Mon
thly
med
ian
stre
amflo
ws
for 9
1 st
atio
ns w
ith 1
0 or
mor
e ye
ars
of re
cord
in C
onne
ctic
ut.—
Cont
inue
d
[USG
S, U
.S. G
eolo
gica
l Sur
vey;
mi2 ,
squa
re m
iles;
bol
d in
dica
tes
Inde
x St
atio
n]
Map
ref-
eren
ce
num
ber
(fig.
1)
USG
S st
atio
n nu
mbe
rRi
ver n
ame
Tow
n
Dra
in-
age
area
(m
i2 )
Mon
thly
med
ian
flow
, in
cubi
c fe
et p
er s
econ
d
JAN
FEB
MA
RA
PRM
AYJU
NJU
LA
UG
SEP
OCT
NO
VD
EC
122
0120
1930
Mar
shep
aug
Riv
erG
oshe
n9.
2415
.015
.026
.028
.014
.07.
254.
103.
005.
2010
.021
.025
.012
401
2030
00Sh
epau
g R
iver
Rox
bury
13
218
519
636
940
423
010
342
.023
.026
.536
100
169
126
0120
3600
Non
ewau
g R
iver
Woo
dbur
y17
.725
.025
.043
.036
.022
.09.
004.
703.
804.
205.
4015
.027
.012
901
2040
00Po
mpe
raug
Riv
erSo
uthb
ury
75.1
105
115
188
176
114
56.0
29.0
22.0
20.0
34.0
75.0
112
130
0120
4800
Cop
per
Mill
Bro
okM
onro
e2.
454.
004.
606.
906.
104.
001.
600.
640.
500.
470.
902.
703.
90
131
0120
5500
Hou
sato
nic
Riv
erO
xfor
d1,
544
2,35
02,
420
4,03
04,
480
2,89
01,
620
920
684
646
892
1,72
02,
360
132
0120
5600
Wes
t Bro
ok N
auga
tuck
Riv
erTo
rrin
gton
33.8
37.0
41.0
76.0
94.5
48.0
21.0
11.0
8.40
8.70
14.0
35.0
45.0
133
0120
5700
Eas
t Bra
nch
Nau
gatu
ck R
iver
Torr
ingt
on13
.617
.019
.033
.038
.020
.09.
605.
605.
104.
708.
1016
.022
.013
401
2060
00N
auga
tuck
Riv
erT
hom
asto
n71
100
100
199
212
123
60.0
36.0
30.0
29.0
32.0
61.0
96.0
135
0120
6400
Lea
dmin
e B
rook
Har
win
ton
19.6
27.0
28.0
65.0
51.0
32.0
16.0
5.90
3.30
3.95
11.0
28.0
29.0
136
0120
6500
Lea
dmin
e B
rook
Tho
mas
ton
24.3
34.0
35.0
70.0
66.0
41.0
16.0
5.30
3.10
4.10
8.00
23.5
33.0
137
0120
6900
Nau
gatu
ck R
iver
Tho
mas
ton
99.8
145
152
260
262
159
75.0
42.0
34.0
35.5
59.0
120
159
138
0120
8013
Bra
nch
Bro
okW
ater
tow
n20
.822
.023
.542
.035
.023
.012
.08.
506.
707.
2016
.020
.028
.013
901
2084
20H
op B
rook
N
auga
tuck
16.3
25.5
30.0
37.0
37.0
27.0
12.0
6.00
4.75
4.70
9.30
19.0
28.0
140
0120
8500
Nau
gatu
ck R
iver
Bea
con
Falls
260
395
423
731
730
476
243
151
132
132
165
310
410
141
0120
8873
Roo
ster
Riv
erT
rum
bull
10.6
12.0
12.0
14.0
16.0
12.0
7.50
4.40
4.10
3.90
4.70
9.00
12.0
143
0120
8925
Mill
Riv
erFa
irfi
eld
28.6
29.0
34.0
46.0
52.5
32.0
15.0
7.70
6.90
6.60
11.0
17.0
27.0
144
0120
8950
Sasc
o B
rook
Fai
rfie
ld7.
3811
.013
.017
.016
.011
.04.
601.
601.
301.
453.
407.
9012
.014
501
2089
90Sa
ugat
uck
Riv
erR
eddi
ng21
36.0
40.0
54.0
51.0
34.0
15.0
6.70
4.40
3.70
9.80
25.0
41.0
147
0120
9500
Saug
atuc
k R
iver
Wes
tpor
t79
.810
010
223
018
810
731
.016
.012
.013
.018
.043
.075
.014
801
2097
00N
orw
alk
Riv
erW
ilton
3045
.053
.077
.073
.046
.021
.011
.09.
007.
2013
.031
.049
.0
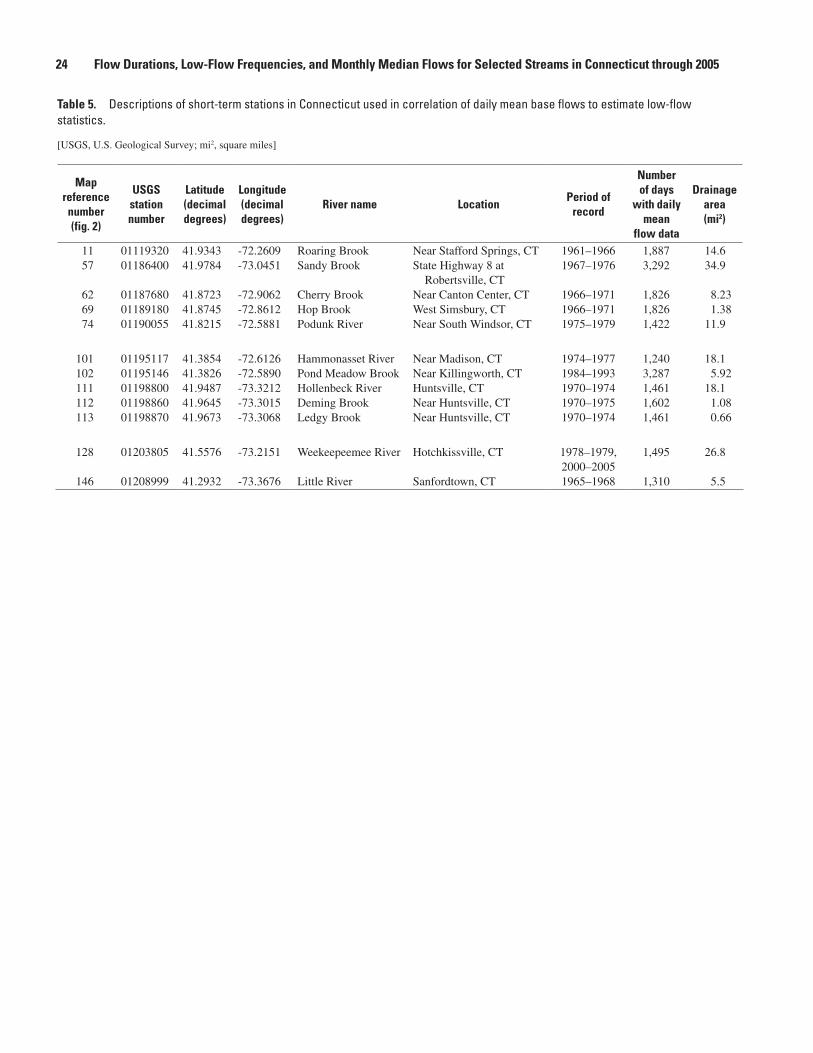
24 Flow Durations, Low-Flow Frequencies, and Monthly Median Flows for Selected Streams in Connecticut through 2005
Table 5. Descriptions of short-term stations in Connecticut used in correlation of daily mean base flows to estimate low-flow statistics.
[USGS, U.S. Geological Survey; mi2, square miles]
Map reference
number (fig. 2)
USGS station number
Latitude (decimal degrees)
Longitude (decimal degrees)
River name LocationPeriod of
record
Number of days
with daily mean
flow data
Drainage area (mi2)
11 01119320 41.9343 -72.2609 Roaring Brook Near Stafford Springs, CT 1961–1966 1,887 14.657 01186400 41.9784 -73.0451 Sandy Brook State Highway 8 at
Robertsville, CT1967–1976 3,292 34.9
62 01187680 41.8723 -72.9062 Cherry Brook Near Canton Center, CT 1966–1971 1,826 8.2369 01189180 41.8745 -72.8612 Hop Brook West Simsbury, CT 1966–1971 1,826 1.3874 01190055 41.8215 -72.5881 Podunk River Near South Windsor, CT 1975–1979 1,422 11.9
101 01195117 41.3854 -72.6126 Hammonasset River Near Madison, CT 1974–1977 1,240 18.1102 01195146 41.3826 -72.5890 Pond Meadow Brook Near Killingworth, CT 1984–1993 3,287 5.92111 01198800 41.9487 -73.3212 Hollenbeck River Huntsville, CT 1970–1974 1,461 18.1112 01198860 41.9645 -73.3015 Deming Brook Near Huntsville, CT 1970–1975 1,602 1.08113 01198870 41.9673 -73.3068 Ledgy Brook Near Huntsville, CT 1970–1974 1,461 0.66
128 01203805 41.5576 -73.2151 Weekeepeemee River Hotchkissville, CT 1978–1979,2000–2005
1,495 26.8
146 01208999 41.2932 -73.3676 Little River Sanfordtown, CT 1965–1968 1,310 5.5
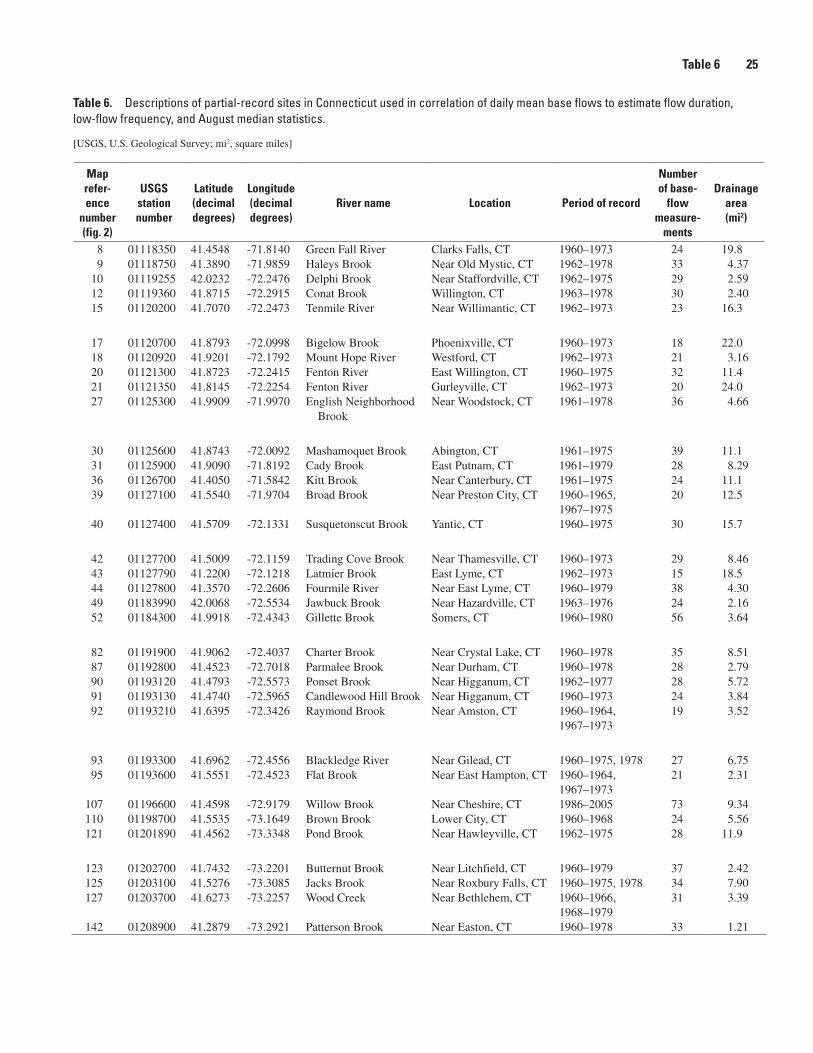
Table 6 25
Table 6. Descriptions of partial-record sites in Connecticut used in correlation of daily mean base flows to estimate flow duration, low-flow frequency, and August median statistics.
[USGS, U.S. Geological Survey; mi2, square miles]
Map refer-ence
number (fig. 2)
USGS station number
Latitude (decimal degrees)
Longitude (decimal degrees)
River name Location Period of record
Number of base-
flow measure-
ments
Drainage area (mi2)
8 01118350 41.4548 -71.8140 Green Fall River Clarks Falls, CT 1960–1973 24 19.89 01118750 41.3890 -71.9859 Haleys Brook Near Old Mystic, CT 1962–1978 33 4.37
10 01119255 42.0232 -72.2476 Delphi Brook Near Staffordville, CT 1962–1975 29 2.5912 01119360 41.8715 -72.2915 Conat Brook Willington, CT 1963–1978 30 2.4015 01120200 41.7070 -72.2473 Tenmile River Near Willimantic, CT 1962–1973 23 16.3
17 01120700 41.8793 -72.0998 Bigelow Brook Phoenixville, CT 1960–1973 18 22.018 01120920 41.9201 -72.1792 Mount Hope River Westford, CT 1962–1973 21 3.1620 01121300 41.8723 -72.2415 Fenton River East Willington, CT 1960–1975 32 11.421 01121350 41.8145 -72.2254 Fenton River Gurleyville, CT 1962–1973 20 24.027 01125300 41.9909 -71.9970 English Neighborhood
BrookNear Woodstock, CT 1961–1978 36 4.66
30 01125600 41.8743 -72.0092 Mashamoquet Brook Abington, CT 1961–1975 39 11.131 01125900 41.9090 -71.8192 Cady Brook East Putnam, CT 1961–1979 28 8.2936 01126700 41.4050 -71.5842 Kitt Brook Near Canterbury, CT 1961–1975 24 11.139 01127100 41.5540 -71.9704 Broad Brook Near Preston City, CT 1960–1965,
1967–197520 12.5
40 01127400 41.5709 -72.1331 Susquetonscut Brook Yantic, CT 1960–1975 30 15.7
42 01127700 41.5009 -72.1159 Trading Cove Brook Near Thamesville, CT 1960–1973 29 8.4643 01127790 41.2200 -72.1218 Latmier Brook East Lyme, CT 1962–1973 15 18.544 01127800 41.3570 -72.2606 Fourmile River Near East Lyme, CT 1960–1979 38 4.3049 01183990 42.0068 -72.5534 Jawbuck Brook Near Hazardville, CT 1963–1976 24 2.1652 01184300 41.9918 -72.4343 Gillette Brook Somers, CT 1960–1980 56 3.64
82 01191900 41.9062 -72.4037 Charter Brook Near Crystal Lake, CT 1960–1978 35 8.5187 01192800 41.4523 -72.7018 Parmalee Brook Near Durham, CT 1960–1978 28 2.7990 01193120 41.4793 -72.5573 Ponset Brook Near Higganum, CT 1962–1977 28 5.7291 01193130 41.4740 -72.5965 Candlewood Hill Brook Near Higganum, CT 1960–1973 24 3.8492 01193210 41.6395 -72.3426 Raymond Brook Near Amston, CT 1960–1964,
1967–197319 3.52
93 01193300 41.6962 -72.4556 Blackledge River Near Gilead, CT 1960–1975, 1978 27 6.7595 01193600 41.5551 -72.4523 Flat Brook Near East Hampton, CT 1960–1964,
1967–197321 2.31
107 01196600 41.4598 -72.9179 Willow Brook Near Cheshire, CT 1986–2005 73 9.34110 01198700 41.5535 -73.1649 Brown Brook Lower City, CT 1960–1968 24 5.56121 01201890 41.4562 -73.3348 Pond Brook Near Hawleyville, CT 1962–1975 28 11.9
123 01202700 41.7432 -73.2201 Butternut Brook Near Litchfield, CT 1960–1979 37 2.42125 01203100 41.5276 -73.3085 Jacks Brook Near Roxbury Falls, CT 1960–1975, 1978 34 7.90127 01203700 41.6273 -73.2257 Wood Creek Near Bethlehem, CT 1960–1966,
1968–197931 3.39
142 01208900 41.2879 -73.2921 Patterson Brook Near Easton, CT 1960–1978 33 1.21
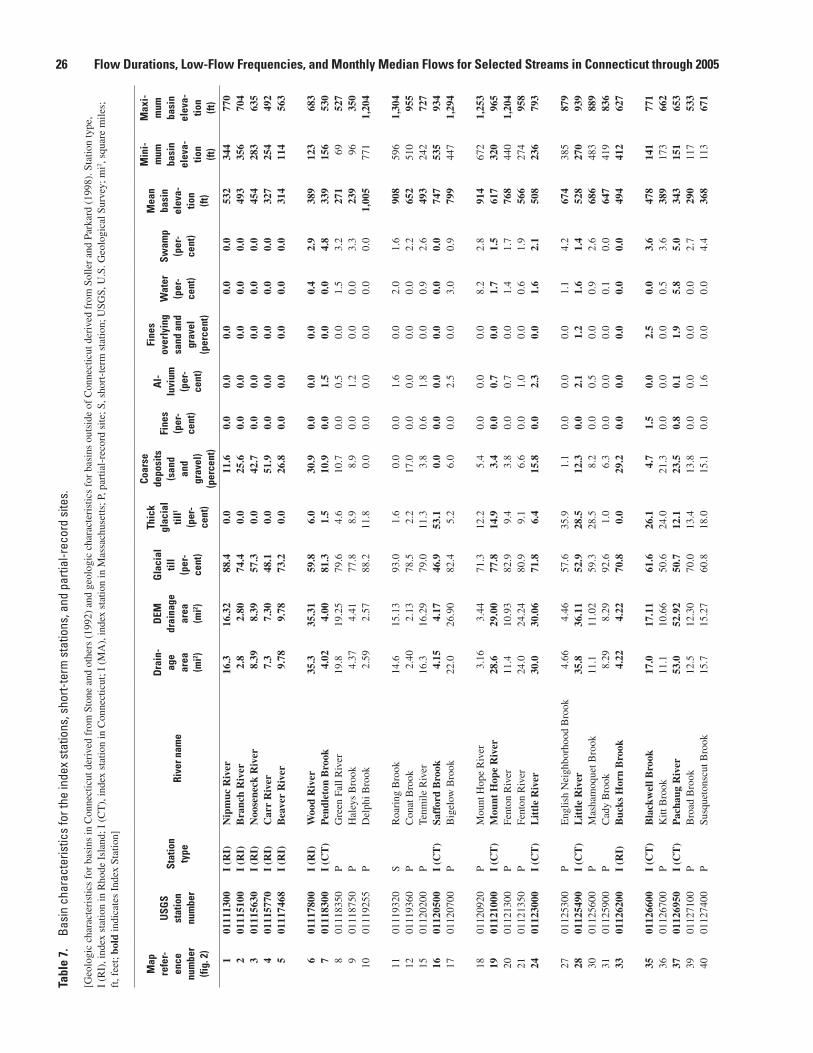
26 Flow Durations, Low-Flow Frequencies, and Monthly Median Flows for Selected Streams in Connecticut through 2005Ta
ble
7.
Basi
n ch
arac
teris
tics
for t
he in
dex
stat
ions
, sho
rt-te
rm s
tatio
ns, a
nd p
artia
l-rec
ord
site
s.—
Cont
inue
d
[Geo
logi
c ch
arac
teri
stic
s fo
r ba
sins
in C
onne
ctic
ut d
eriv
ed f
rom
Sto
ne a
nd o
ther
s (1
992)
and
geo
logi
c ch
arac
teri
stic
s fo
r ba
sins
out
side
of
Con
nect
icut
der
ived
fro
m S
olle
r an
d Pa
rkar
d (1
998)
. Sta
tion
type
, I
(RI)
, ind
ex s
tatio
n in
Rho
de I
slan
d; I
(C
T),
inde
x st
atio
n in
Con
nect
icut
; I (
MA
), in
dex
stat
ion
in M
assa
chus
etts
; P, p
artia
l-re
cord
site
; S, s
hort
-ter
m s
tatio
n; U
SGS,
U.S
. Geo
logi
cal S
urve
y; m
i2 , sq
uare
mile
s;
ft, f
eet;
bold
indi
cate
s In
dex
Stat
ion]
Map
re
fer-
ence
nu
mbe
r (fi
g. 2
)
USG
S
stat
ion
num
ber
Stat
ion
type
Rive
r nam
e
Dra
in-
age
area
(m
i2 )
DEM
dr
aina
ge
area
(m
i2 )
Gla
cial
til
l (p
er-
cent
)
Thic
k gl
acia
l til
l1 (p
er-
cent
)
Coar
se
depo
sits
(s
and
and
grav
el)
(per
cent
)
Fine
s (p
er-
cent
)
Al-
luvi
um
(per
-ce
nt)
Fine
s ov
erly
ing
sand
and
gr
avel
(p
erce
nt)
Wat
er
(per
-ce
nt)
Swam
p (p
er-
cent
)
Mea
n ba
sin
elev
a-tio
n
(ft)
Min
i-m
um
basi
n el
eva-
tion
(ft
)
Max
i-m
um
basi
n el
eva-
tion
(ft
)1
0111
1300
I (R
I)N
ipm
uc R
iver
16.3
16.3
288
.40.
011
.60.
00.
00.
00.
00.
053
234
477
02
0111
5100
I (R
I)B
ranc
h R
iver
2.8
2.80
74.4
0.0
25.6
0.0
0.0
0.0
0.0
0.0
493
356
704
301
1156
30I
(RI)
Noo
sene
ck R
iver
8.39
8.39
57.3
0.0
42.7
0.0
0.0
0.0
0.0
0.0
454
283
635
401
1157
70I
(RI)
Car
r R
iver
7.3
7.30
48.1
0.0
51.9
0.0
0.0
0.0
0.0
0.0
327
254
492
501
1174
68I
(RI)
Bea
ver
Riv
er9.
789.
7873
.20.
026
.80.
00.
00.
00.
00.
031
411
456
3
601
1178
00I
(RI)
Woo
d R
iver
35.3
35.3
159
.86.
030
.90.
00.
00.
00.
42.
938
912
368
37
0111
8300
I (C
T)
Pen
dlet
on B
rook
4.02
4.00
81.3
1.5
10.9
0.0
1.5
0.0
0.0
4.8
339
156
530
801
1183
50P
Gre
en F
all R
iver
19.8
19.2
579
.64.
610
.70.
00.
50.
01.
53.
227
169
527
901
1187
50P
Hal
eys
Bro
ok4.
374.
4177
.88.
98.
90.
01.
20.
00.
03.
323
996
350
1001
1192
55P
Del
phi B
rook
2.59
2.57
88.2
11.8
0.0
0.0
0.0
0.0
0.0
0.0
1,00
577
11,
204
1101
1193
20S
Roa
ring
Bro
ok14
.615
.13
93.0
1.6
0.0
0.0
1.6
0.0
2.0
1.6
908
596
1,30
412
0111
9360
PC
onat
Bro
ok2.
402.
1378
.52.
217
.00.
00.
00.
00.
02.
265
251
095
515
0112
0200
PTe
nmile
Riv
er16
.316
.29
79.0
11.3
3.8
0.6
1.8
0.0
0.9
2.6
493
242
727
1601
1205
00I
(CT
)Sa
ffor
d B
rook
4.15
4.17
46.9
53.1
0.0
0.0
0.0
0.0
0.0
0.0
747
535
934
1701
1207
00P
Big
elow
Bro
ok22
.026
.90
82.4
5.2
6.0
0.0
2.5
0.0
3.0
0.9
799
447
1,29
4
1801
1209
20P
Mou
nt H
ope
Riv
er3.
163.
4471
.312
.25.
40.
00.
00.
08.
22.
891
467
21,
253
1901
1210
00I
(CT
)M
ount
Hop
e R
iver
28.6
29.0
077
.814
.93.
40.
00.
70.
01.
71.
561
732
096
520
0112
1300
PFe
nton
Riv
er11
.410
.93
82.9
9.4
3.8
0.0
0.7
0.0
1.4
1.7
768
440
1,20
421
0112
1350
PFe
nton
Riv
er
24.0
24.2
480
.99.
16.
60.
01.
00.
00.
61.
956
627
495
824
0112
3000
I (C
T)
Lit
tle
Riv
er
30.0
30.0
671
.86.
415
.80.
02.
30.
01.
62.
150
823
679
3
2701
1253
00P
Eng
lish
Nei
ghbo
rhoo
d B
rook
4.66
4.46
57.6
35.9
1.1
0.0
0.0
0.0
1.1
4.2
674
385
879
2801
1254
90I
(CT
)L
ittl
e R
iver
35
.836
.11
52.9
28.5
12.3
0.0
2.1
1.2
1.6
1.4
528
270
939
3001
1256
00P
Mas
ham
oque
t Bro
ok11
.111
.02
59.3
28.5
8.2
0.0
0.5
0.0
0.9
2.6
686
483
889
3101
1259
00P
Cad
y B
rook
8.29
8.29
92.6
1.0
6.3
0.0
0.0
0.0
0.1
0.0
647
419
836
3301
1262
00I
(RI)
Buc
ks H
orn
Bro
ok4.
224.
2270
.80.
029
.20.
00.
00.
00.
00.
049
441
262
7
3501
1266
00I
(CT
)B
lack
wel
l Bro
ok17
.017
.11
61.6
26.1
4.7
1.5
0.0
2.5
0.0
3.6
478
141
771
3601
1267
00P
Kitt
Bro
ok
11.1
10.6
650
.624
.021
.30.
00.
00.
00.
53.
638
917
366
237
0112
6950
I (C
T)
Pac
haug
Riv
er53
.052
.92
50.7
12.1
23.5
0.8
0.1
1.9
5.8
5.0
343
151
653
3901
1271
00P
Bro
ad B
rook
12
.512
.30
70.0
13.4
13.8
0.0
0.0
0.0
0.0
2.7
290
117
533
4001
1274
00P
Susq
ueto
nscu
t Bro
ok15
.715
.27
60.8
18.0
15.1
0.0
1.6
0.0
0.0
4.4
368
113
671
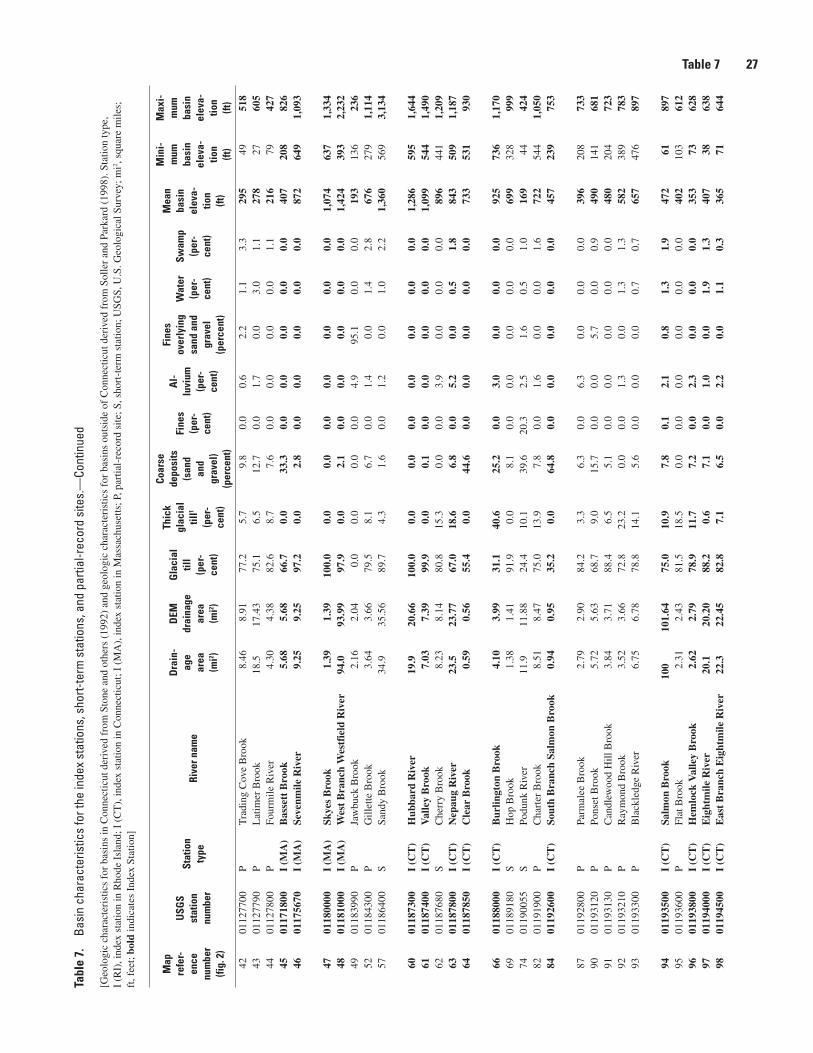
Table 7 27Ta
ble
7.
Basi
n ch
arac
teris
tics
for t
he in
dex
stat
ions
, sho
rt-te
rm s
tatio
ns, a
nd p
artia
l-rec
ord
site
s.—
Cont
inue
d
[Geo
logi
c ch
arac
teri
stic
s fo
r ba
sins
in C
onne
ctic
ut d
eriv
ed f
rom
Sto
ne a
nd o
ther
s (1
992)
and
geo
logi
c ch
arac
teri
stic
s fo
r ba
sins
out
side
of
Con
nect
icut
der
ived
fro
m S
olle
r an
d Pa
rkar
d (1
998)
. Sta
tion
type
, I
(RI)
, ind
ex s
tatio
n in
Rho
de I
slan
d; I
(C
T),
inde
x st
atio
n in
Con
nect
icut
; I (
MA
), in
dex
stat
ion
in M
assa
chus
etts
; P, p
artia
l-re
cord
site
; S, s
hort
-ter
m s
tatio
n; U
SGS,
U.S
. Geo
logi
cal S
urve
y; m
i2 , sq
uare
mile
s;
ft, f
eet;
bold
indi
cate
s In
dex
Stat
ion]
Map
re
fer-
ence
nu
mbe
r (fi
g. 2
)
USG
S
stat
ion
num
ber
Stat
ion
type
Rive
r nam
e
Dra
in-
age
area
(m
i2 )
DEM
dr
aina
ge
area
(m
i2 )
Gla
cial
til
l (p
er-
cent
)
Thic
k gl
acia
l til
l1 (p
er-
cent
)
Coar
se
depo
sits
(s
and
and
grav
el)
(per
cent
)
Fine
s (p
er-
cent
)
Al-
luvi
um
(per
-ce
nt)
Fine
s ov
erly
ing
sand
and
gr
avel
(p
erce
nt)
Wat
er
(per
-ce
nt)
Swam
p (p
er-
cent
)
Mea
n ba
sin
elev
a-tio
n
(ft)
Min
i-m
um
basi
n el
eva-
tion
(ft
)
Max
i-m
um
basi
n el
eva-
tion
(ft
)42
0112
7700
PT
radi
ng C
ove
Bro
ok8.
468.
9177
.25.
79.
80.
00.
62.
21.
13.
329
549
518
4301
1277
90P
Lat
imer
Bro
ok18
.517
.43
75.1
6.5
12.7
0.0
1.7
0.0
3.0
1.1
278
2760
544
0112
7800
PFo
urm
ile R
iver
4.30
4.38
82.6
8.7
7.6
0.0
0.0
0.0
0.0
1.1
216
7942
745
0117
1800
I (M
A)
Bas
sett
Bro
ok5.
685.
6866
.70.
033
.30.
00.
00.
00.
00.
040
720
882
646
0117
5670
I (M
A)
Seve
nmile
Riv
er9.
259.
2597
.20.
02.
80.
00.
00.
00.
00.
087
264
91,
093
4701
1800
00I
(MA
)Sk
yes
Bro
ok1.
391.
3910
0.0
0.0
0.0
0.0
0.0
0.0
0.0
0.0
1,07
463
71,
334
4801
1810
00I
(MA
)W
est
Bra
nch
Wes
tfie
ld R
iver
94.0
93.9
997
.90.
02.
10.
00.
00.
00.
00.
01,
424
393
2,23
249
0118
3990
PJa
wbu
ck B
rook
2.16
2.04
0.0
0.0
0.0
0.0
4.9
95.1
0.0
0.0
193
136
236
5201
1843
00P
Gill
ette
Bro
ok3.
643.
6679
.58.
16.
70.
01.
40.
01.
42.
867
627
91,
114
5701
1864
00S
Sand
y B
rook
34.9
35.5
689
.74.
31.
60.
01.
20.
01.
02.
21,
360
569
3,13
4
6001
1873
00I
(CT
)H
ubba
rd R
iver
19.9
20.6
610
0.0
0.0
0.0
0.0
0.0
0.0
0.0
0.0
1,28
659
51,
644
6101
1874
00I
(CT
)V
alle
y B
rook
7.03
7.39
99.9
0.0
0.1
0.0
0.0
0.0
0.0
0.0
1,09
954
41,
490
6201
1876
80S
Che
rry
Bro
ok8.
238.
1480
.815
.30.
00.
03.
90.
00.
00.
089
644
11,
209
6301
1878
00I
(CT
)N
epau
g R
iver
23.5
23.7
767
.018
.66.
80.
05.
20.
00.
51.
884
350
91,
187
6401
1878
50I
(CT
)C
lear
Bro
ok0.
590.
5655
.40.
044
.60.
00.
00.
00.
00.
073
353
193
0
6601
1880
00I
(CT
)B
urlin
gton
Bro
ok4.
103.
9931
.140
.625
.20.
03.
00.
00.
00.
092
573
61,
170
6901
1891
80S
Hop
Bro
ok1.
381.
4191
.90.
08.
10.
00.
00.
00.
00.
069
932
899
974
0119
0055
SPo
dunk
Riv
er11
.911
.88
24.4
10.1
39.6
20.3
2.5
1.6
0.5
1.0
169
4442
482
0119
1900
PC
hart
er B
rook
8.51
8.47
75.0
13.9
7.8
0.0
1.6
0.0
0.0
1.6
722
544
1,05
084
0119
2600
I (C
T)
Sout
h B
ranc
h Sa
lmon
Bro
ok0.
940.
9535
.20.
064
.80.
00.
00.
00.
00.
045
723
975
3
8701
1928
00P
Parm
alee
Bro
ok2.
792.
9084
.23.
36.
30.
06.
30.
00.
00.
039
620
873
390
0119
3120
PPo
nset
Bro
ok5.
725.
6368
.79.
015
.70.
00.
05.
70.
00.
949
014
168
191
0119
3130
PC
andl
ewoo
d H
ill B
rook
3.84
3.71
88.4
6.5
5.1
0.0
0.0
0.0
0.0
0.0
480
204
723
9201
1932
10P
Ray
mon
d B
rook
3.52
3.66
72.8
23.2
0.0
0.0
1.3
0.0
1.3
1.3
582
389
783
9301
1933
00P
Bla
ckle
dge
Riv
er6.
756.
7878
.814
.15.
60.
00.
00.
00.
70.
765
747
689
7
9401
1935
00I
(CT
)Sa
lmon
Bro
ok
100
101.
6475
.010
.97.
80.
12.
10.
81.
31.
947
261
897
9501
1936
00P
Flat
Bro
ok2.
312.
4381
.518
.50.
00.
00.
00.
00.
00.
040
210
361
296
0119
3800
I (C
T)
Hem
lock
Val
ley
Bro
ok2.
622.
7978
.911
.77.
20.
02.
30.
00.
00.
035
373
628
9701
1940
00I
(CT
)E
ight
mile
Riv
er20
.120
.20
88.2
0.6
7.1
0.0
1.0
0.0
1.9
1.3
407
3863
898
0119
4500
I (C
T)
Eas
t B
ranc
h E
ight
mile
Riv
er22
.322
.45
82.8
7.1
6.5
0.0
2.2
0.0
1.1
0.3
365
7164
4
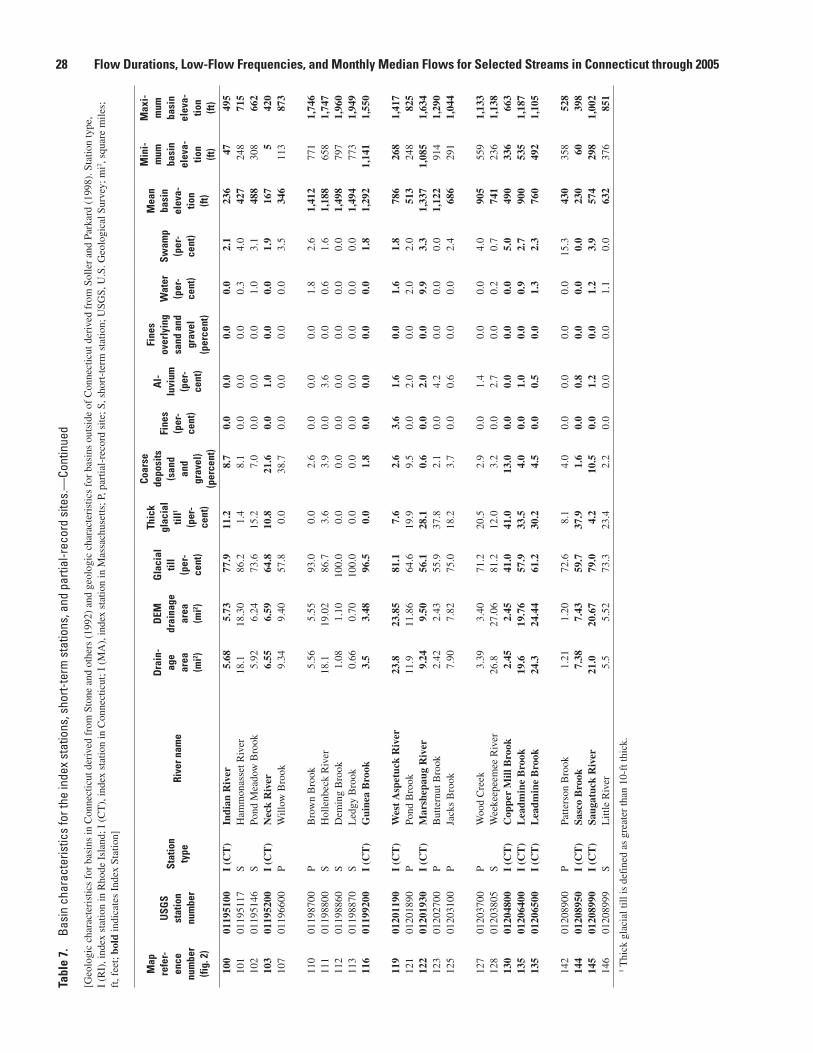
28 Flow Durations, Low-Flow Frequencies, and Monthly Median Flows for Selected Streams in Connecticut through 2005Ta
ble
7.
Basi
n ch
arac
teris
tics
for t
he in
dex
stat
ions
, sho
rt-te
rm s
tatio
ns, a
nd p
artia
l-rec
ord
site
s.—
Cont
inue
d
[Geo
logi
c ch
arac
teri
stic
s fo
r ba
sins
in C
onne
ctic
ut d
eriv
ed f
rom
Sto
ne a
nd o
ther
s (1
992)
and
geo
logi
c ch
arac
teri
stic
s fo
r ba
sins
out
side
of
Con
nect
icut
der
ived
fro
m S
olle
r an
d Pa
rkar
d (1
998)
. Sta
tion
type
, I
(RI)
, ind
ex s
tatio
n in
Rho
de I
slan
d; I
(C
T),
inde
x st
atio
n in
Con
nect
icut
; I (
MA
), in
dex
stat
ion
in M
assa
chus
etts
; P, p
artia
l-re
cord
site
; S, s
hort
-ter
m s
tatio
n; U
SGS,
U.S
. Geo
logi
cal S
urve
y; m
i2 , sq
uare
mile
s;
ft, f
eet;
bold
indi
cate
s In
dex
Stat
ion]
Map
re
fer-
ence
nu
mbe
r (fi
g. 2
)
USG
S
stat
ion
num
ber
Stat
ion
type
Rive
r nam
e
Dra
in-
age
area
(m
i2 )
DEM
dr
aina
ge
area
(m
i2 )
Gla
cial
til
l (p
er-
cent
)
Thic
k gl
acia
l til
l1 (p
er-
cent
)
Coar
se
depo
sits
(s
and
and
grav
el)
(per
cent
)
Fine
s (p
er-
cent
)
Al-
luvi
um
(per
-ce
nt)
Fine
s ov
erly
ing
sand
and
gr
avel
(p
erce
nt)
Wat
er
(per
-ce
nt)
Swam
p (p
er-
cent
)
Mea
n ba
sin
elev
a-tio
n
(ft)
Min
i-m
um
basi
n el
eva-
tion
(ft
)
Max
i-m
um
basi
n el
eva-
tion
(ft
)10
001
1951
00I
(CT
)In
dian
Riv
er5.
685.
7377
.911
.28.
70.
00.
00.
00.
02.
123
647
495
101
0119
5117
SH
amm
onas
set R
iver
18.1
18.3
086
.21.
48.
10.
00.
00.
00.
34.
042
724
871
510
201
1951
46S
Pond
Mea
dow
Bro
ok5.
926.
2473
.615
.27.
00.
00.
00.
01.
03.
148
830
866
210
301
1952
00I
(CT
)N
eck
Riv
er6.
556.
5964
.810
.821
.60.
01.
00.
00.
01.
916
75
420
107
0119
6600
PW
illow
Bro
ok9.
349.
4057
.80.
038
.70.
00.
00.
00.
03.
534
611
387
3
110
0119
8700
PB
row
n B
rook
5.56
5.55
93.0
0.0
2.6
0.0
0.0
0.0
1.8
2.6
1,41
277
11,
746
111
0119
8800
SH
olle
nbec
k R
iver
18.1
19.0
286
.73.
63.
90.
03.
60.
00.
61.
61,
188
658
1,74
711
201
1988
60S
Dem
ing
Bro
ok1.
081.
1010
0.0
0.0
0.0
0.0
0.0
0.0
0.0
0.0
1,49
879
71,
960
113
0119
8870
SL
edgy
Bro
ok0.
660.
7010
0.0
0.0
0.0
0.0
0.0
0.0
0.0
0.0
1,49
477
31,
949
116
0119
9200
I (C
T)
Gui
nea
Bro
ok3.
53.
4896
.50.
01.
80.
00.
00.
00.
01.
81,
292
1,14
11,
550
119
0120
1190
I (C
T)
Wes
t A
spet
uck
Riv
er23
.823
.85
81.1
7.6
2.6
3.6
1.6
0.0
1.6
1.8
786
268
1,41
712
101
2018
90P
Pond
Bro
ok11
.911
.86
64.6
19.9
9.5
0.0
2.0
0.0
2.0
2.0
513
248
825
122
0120
1930
I (C
T)
Mar
shep
aug
Riv
er9.
249.
5056
.128
.10.
60.
02.
00.
09.
93.
31,
337
1,08
51,
634
123
0120
2700
PB
utte
rnut
Bro
ok2.
422.
4355
.937
.82.
10.
04.
20.
00.
00.
01,
122
914
1,29
012
501
2031
00P
Jack
s B
rook
7.90
7.82
75.0
18.2
3.7
0.0
0.6
0.0
0.0
2.4
686
291
1,04
4
127
0120
3700
PW
ood
Cre
ek
3.39
3.40
71.2
20.5
2.9
0.0
1.4
0.0
0.0
4.0
905
559
1,13
312
801
2038
05S
Wee
keep
eem
ee R
iver
26.8
27.0
681
.212
.03.
20.
02.
70.
00.
20.
774
123
61,
138
130
0120
4800
I (C
T)
Cop
per
Mill
Bro
ok2.
452.
4541
.041
.013
.00.
00.
00.
00.
05.
049
033
666
313
501
2064
00I
(CT
)L
eadm
ine
Bro
ok19
.619
.76
57.9
33.5
4.0
0.0
1.0
0.0
0.9
2.7
900
535
1,18
713
501
2065
00I
(CT
)L
eadm
ine
Bro
ok24
.324
.44
61.2
30.2
4.5
0.0
0.5
0.0
1.3
2.3
760
492
1,10
5
142
0120
8900
PPa
tters
on B
rook
1.
211.
2072
.68.
14.
00.
00.
00.
00.
015
.343
035
852
814
401
2089
50I
(CT
)Sa
sco
Bro
ok7.
387.
4359
.737
.91.
60.
00.
80.
00.
00.
023
060
398
145
0120
8990
I (C
T)
Saug
atuc
k R
iver
21.0
20.6
779
.04.
210
.50.
01.
20.
01.
23.
957
429
81,
002
146
0120
8999
SL
ittle
Riv
er5.
55.
5273
.323
.42.
20.
00.
00.
01.
10.
063
237
685
11 T
hick
gla
cial
till
is d
efin
ed a
s gr
eate
r th
an 1
0-ft
thic
k.
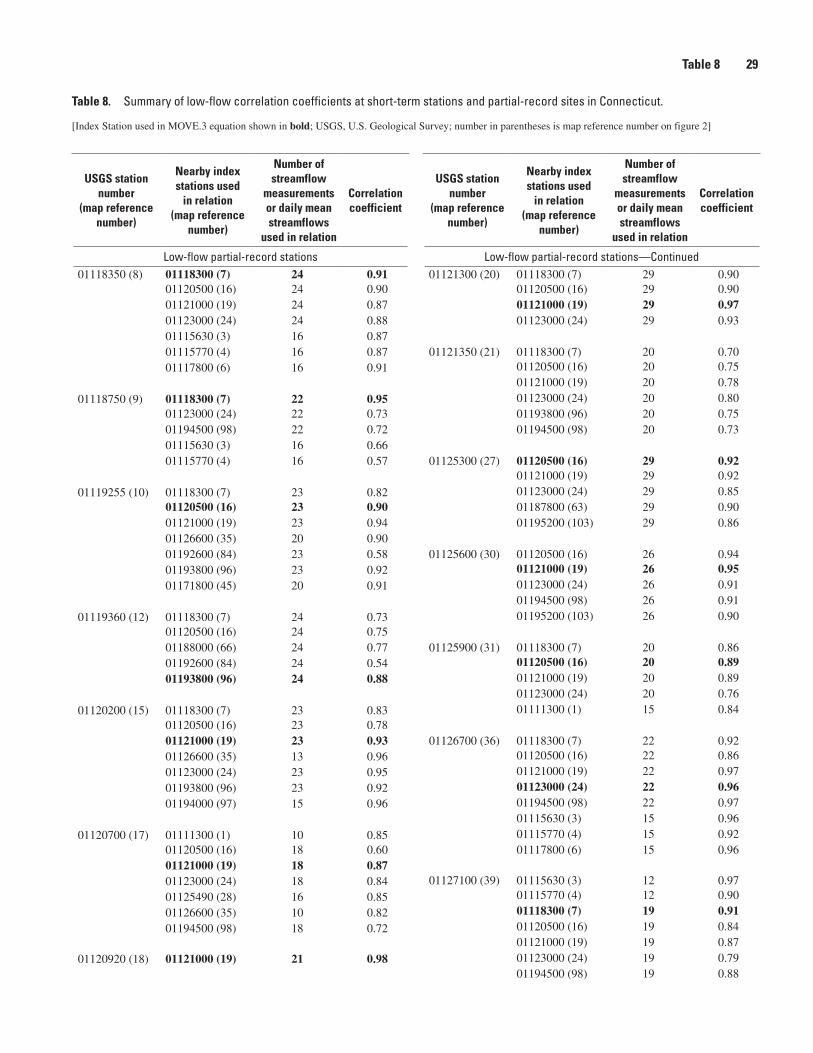
Table 8 29
USGS station number
(map reference number)
Nearby index stations used
in relation (map reference
number)
Number of streamflow
measurements or daily mean streamflows
used in relation
Correlation coefficient
Low-flow partial-record stations—Continued01121300 (20) 01118300 (7) 29 0.90
01120500 (16) 29 0.9001121000 (19) 29 0.9701123000 (24) 29 0.93
01121350 (21) 01118300 (7) 20 0.7001120500 (16) 20 0.7501121000 (19) 20 0.7801123000 (24) 20 0.8001193800 (96) 20 0.7501194500 (98) 20 0.73
01125300 (27) 01120500 (16) 29 0.9201121000 (19) 29 0.9201123000 (24) 29 0.8501187800 (63) 29 0.9001195200 (103) 29 0.86
01125600 (30) 01120500 (16) 26 0.9401121000 (19) 26 0.9501123000 (24) 26 0.9101194500 (98) 26 0.9101195200 (103) 26 0.90
01125900 (31) 01118300 (7) 20 0.8601120500 (16) 20 0.8901121000 (19) 20 0.8901123000 (24) 20 0.7601111300 (1) 15 0.84
01126700 (36) 01118300 (7) 22 0.9201120500 (16) 22 0.8601121000 (19) 22 0.9701123000 (24) 22 0.9601194500 (98) 22 0.9701115630 (3) 15 0.9601115770 (4) 15 0.9201117800 (6) 15 0.96
01127100 (39) 01115630 (3) 12 0.9701115770 (4) 12 0.9001118300 (7) 19 0.9101120500 (16) 19 0.8401121000 (19) 19 0.8701123000 (24) 19 0.7901194500 (98) 19 0.88
USGS station number
(map reference number)
Nearby index stations used
in relation (map reference
number)
Number of streamflow
measurements or daily mean streamflows
used in relation
Correlation coefficient
Low-flow partial-record stations01118350 (8) 01118300 (7) 24 0.91
01120500 (16) 24 0.9001121000 (19) 24 0.8701123000 (24) 24 0.8801115630 (3) 16 0.8701115770 (4) 16 0.8701117800 (6) 16 0.91
01118750 (9) 01118300 (7) 22 0.9501123000 (24) 22 0.7301194500 (98) 22 0.7201115630 (3) 16 0.6601115770 (4) 16 0.57
01119255 (10) 01118300 (7) 23 0.8201120500 (16) 23 0.9001121000 (19) 23 0.9401126600 (35) 20 0.9001192600 (84) 23 0.5801193800 (96) 23 0.9201171800 (45) 20 0.91
01119360 (12) 01118300 (7) 24 0.7301120500 (16) 24 0.7501188000 (66) 24 0.7701192600 (84) 24 0.5401193800 (96) 24 0.88
01120200 (15) 01118300 (7) 23 0.8301120500 (16) 23 0.7801121000 (19) 23 0.9301126600 (35) 13 0.9601123000 (24) 23 0.9501193800 (96) 23 0.9201194000 (97) 15 0.96
01120700 (17) 01111300 (1) 10 0.8501120500 (16) 18 0.6001121000 (19) 18 0.8701123000 (24) 18 0.8401125490 (28) 16 0.8501126600 (35) 10 0.8201194500 (98) 18 0.72
01120920 (18) 01121000 (19) 21 0.98
Table 8. Summary of low-flow correlation coefficients at short-term stations and partial-record sites in Connecticut.
[Index Station used in MOVE.3 equation shown in bold; USGS, U.S. Geological Survey; number in parentheses is map reference number on figure 2]
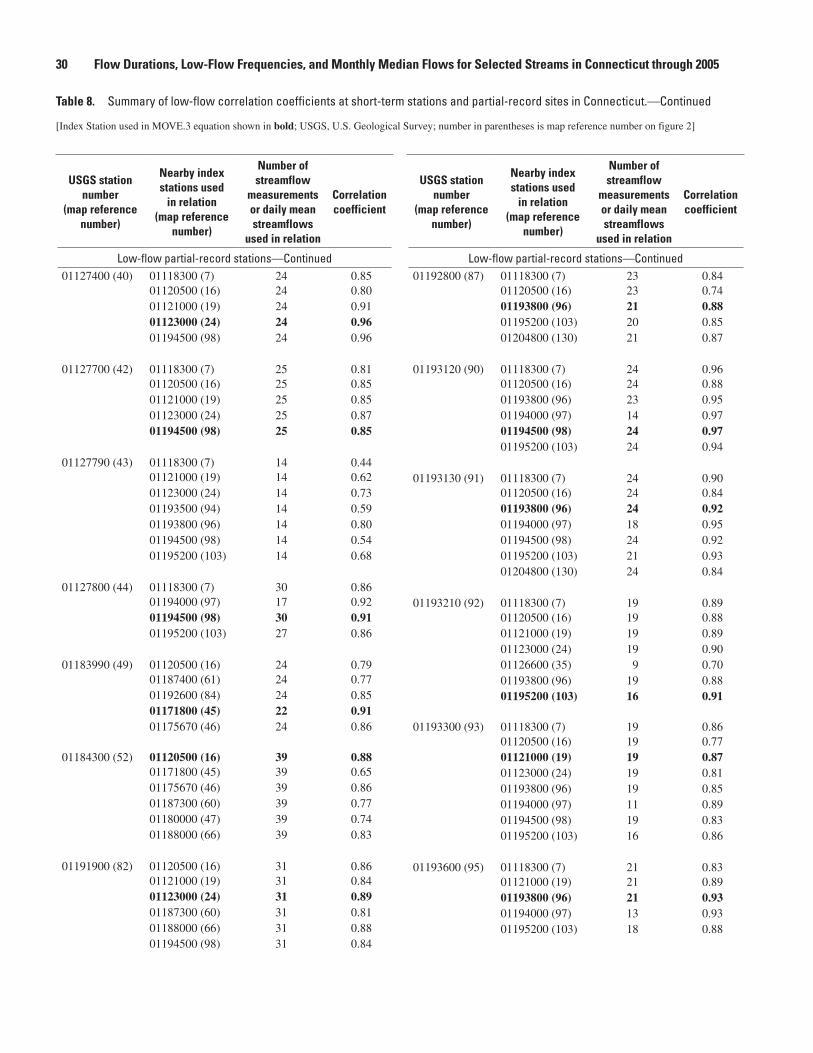
30 Flow Durations, Low-Flow Frequencies, and Monthly Median Flows for Selected Streams in Connecticut through 2005
USGS station number
(map reference number)
Nearby index stations used
in relation (map reference
number)
Number of streamflow
measurements or daily mean streamflows
used in relation
Correlation coefficient
Low-flow partial-record stations—Continued01127400 (40) 01118300 (7) 24 0.85
01120500 (16) 24 0.8001121000 (19) 24 0.9101123000 (24) 24 0.9601194500 (98) 24 0.96
01127700 (42) 01118300 (7) 25 0.8101120500 (16) 25 0.8501121000 (19) 25 0.8501123000 (24) 25 0.8701194500 (98) 25 0.85
01127790 (43) 01118300 (7) 14 0.4401121000 (19) 14 0.6201123000 (24) 14 0.7301193500 (94) 14 0.5901193800 (96) 14 0.8001194500 (98) 14 0.5401195200 (103) 14 0.68
01127800 (44) 01118300 (7) 30 0.8601194000 (97) 17 0.9201194500 (98) 30 0.9101195200 (103) 27 0.86
01183990 (49) 01120500 (16) 24 0.7901187400 (61) 24 0.7701192600 (84) 24 0.8501171800 (45) 22 0.9101175670 (46) 24 0.86
01184300 (52) 01120500 (16) 39 0.8801171800 (45) 39 0.6501175670 (46) 39 0.8601187300 (60) 39 0.7701180000 (47) 39 0.7401188000 (66) 39 0.83
01191900 (82) 01120500 (16) 31 0.8601121000 (19) 31 0.8401123000 (24) 31 0.8901187300 (60) 31 0.8101188000 (66) 31 0.8801194500 (98) 31 0.84
USGS station number
(map reference number)
Nearby index stations used
in relation (map reference
number)
Number of streamflow
measurements or daily mean streamflows
used in relation
Correlation coefficient
Low-flow partial-record stations—Continued01192800 (87) 01118300 (7) 23 0.84
01120500 (16) 23 0.7401193800 (96) 21 0.8801195200 (103) 20 0.8501204800 (130) 21 0.87
01193120 (90) 01118300 (7) 24 0.9601120500 (16) 24 0.8801193800 (96) 23 0.9501194000 (97) 14 0.9701194500 (98) 24 0.9701195200 (103) 24 0.94
01193130 (91) 01118300 (7) 24 0.9001120500 (16) 24 0.8401193800 (96) 24 0.9201194000 (97) 18 0.9501194500 (98) 24 0.9201195200 (103) 21 0.9301204800 (130) 24 0.84
01193210 (92) 01118300 (7) 19 0.8901120500 (16) 19 0.8801121000 (19) 19 0.8901123000 (24) 19 0.9001126600 (35) 9 0.7001193800 (96) 19 0.8801195200 (103) 16 0.91
01193300 (93) 01118300 (7) 19 0.8601120500 (16) 19 0.7701121000 (19) 19 0.8701123000 (24) 19 0.8101193800 (96) 19 0.8501194000 (97) 11 0.8901194500 (98) 19 0.8301195200 (103) 16 0.86
01193600 (95) 01118300 (7) 21 0.8301121000 (19) 21 0.8901193800 (96) 21 0.9301194000 (97) 13 0.9301195200 (103) 18 0.88
Table 8. Summary of low-flow correlation coefficients at short-term stations and partial-record sites in Connecticut.—Continued
[Index Station used in MOVE.3 equation shown in bold; USGS, U.S. Geological Survey; number in parentheses is map reference number on figure 2]
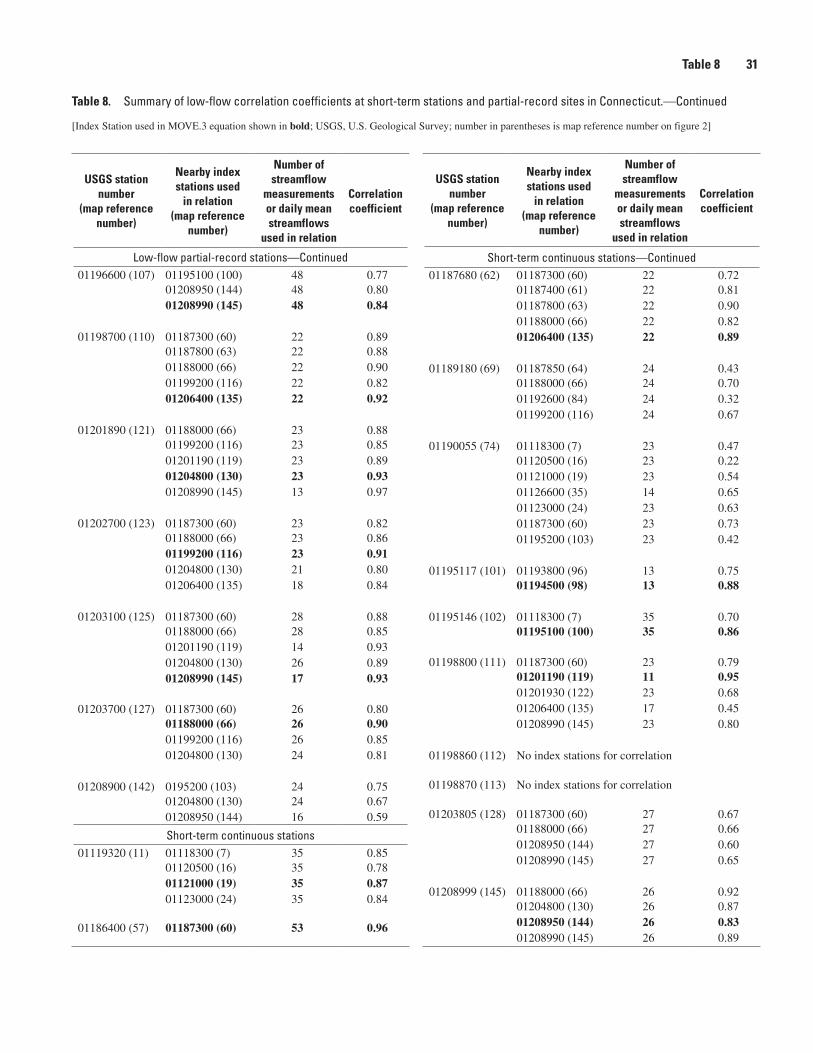
Table 8 31
USGS station number
(map reference number)
Nearby index stations used
in relation (map reference
number)
Number of streamflow
measurements or daily mean streamflows
used in relation
Correlation coefficient
Low-flow partial-record stations—Continued01196600 (107) 01195100 (100) 48 0.77
01208950 (144) 48 0.8001208990 (145) 48 0.84
01198700 (110) 01187300 (60) 22 0.8901187800 (63) 22 0.8801188000 (66) 22 0.9001199200 (116) 22 0.8201206400 (135) 22 0.92
01201890 (121) 01188000 (66) 23 0.8801199200 (116) 23 0.8501201190 (119) 23 0.8901204800 (130) 23 0.9301208990 (145) 13 0.97
01202700 (123) 01187300 (60) 23 0.8201188000 (66) 23 0.8601199200 (116) 23 0.9101204800 (130) 21 0.8001206400 (135) 18 0.84
01203100 (125) 01187300 (60) 28 0.8801188000 (66) 28 0.8501201190 (119) 14 0.9301204800 (130) 26 0.8901208990 (145) 17 0.93
01203700 (127) 01187300 (60) 26 0.8001188000 (66) 26 0.9001199200 (116) 26 0.8501204800 (130) 24 0.81
01208900 (142) 0195200 (103) 24 0.7501204800 (130) 24 0.6701208950 (144) 16 0.59
Short-term continuous stations01119320 (11) 01118300 (7) 35 0.85
01120500 (16) 35 0.7801121000 (19) 35 0.8701123000 (24) 35 0.84
01186400 (57) 01187300 (60) 53 0.96
USGS station number
(map reference number)
Nearby index stations used
in relation (map reference
number)
Number of streamflow
measurements or daily mean streamflows
used in relation
Correlation coefficient
Short-term continuous stations—Continued01187680 (62) 01187300 (60) 22 0.72
01187400 (61) 22 0.8101187800 (63) 22 0.9001188000 (66) 22 0.8201206400 (135) 22 0.89
01189180 (69) 01187850 (64) 24 0.4301188000 (66) 24 0.7001192600 (84) 24 0.3201199200 (116) 24 0.67
01190055 (74) 01118300 (7) 23 0.4701120500 (16) 23 0.2201121000 (19) 23 0.5401126600 (35) 14 0.6501123000 (24) 23 0.6301187300 (60) 23 0.7301195200 (103) 23 0.42
01195117 (101) 01193800 (96) 13 0.7501194500 (98) 13 0.88
01195146 (102) 01118300 (7) 35 0.7001195100 (100) 35 0.86
01198800 (111) 01187300 (60) 23 0.7901201190 (119) 11 0.9501201930 (122) 23 0.6801206400 (135) 17 0.4501208990 (145) 23 0.80
01198860 (112) No index stations for correlation
01198870 (113) No index stations for correlation
01203805 (128) 01187300 (60) 27 0.6701188000 (66) 27 0.6601208950 (144) 27 0.6001208990 (145) 27 0.65
01208999 (145) 01188000 (66) 26 0.9201204800 (130) 26 0.8701208950 (144) 26 0.8301208990 (145) 26 0.89
Table 8. Summary of low-flow correlation coefficients at short-term stations and partial-record sites in Connecticut.—Continued
[Index Station used in MOVE.3 equation shown in bold; USGS, U.S. Geological Survey; number in parentheses is map reference number on figure 2]
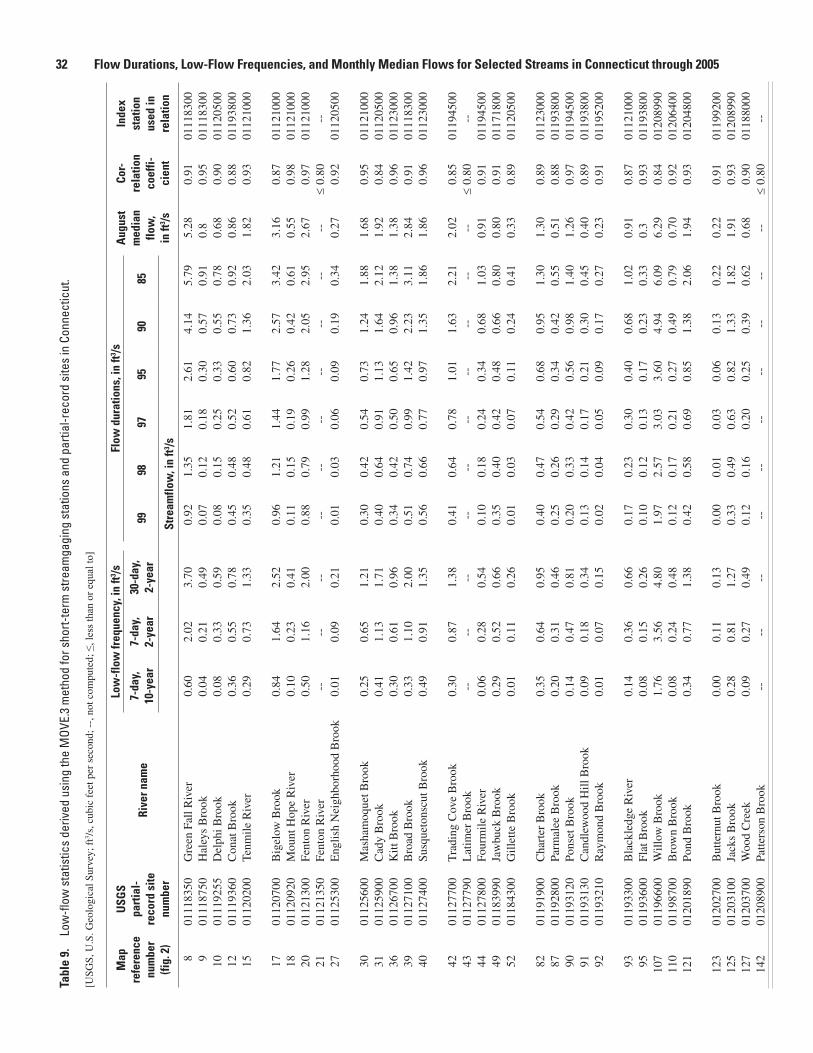
32 Flow Durations, Low-Flow Frequencies, and Monthly Median Flows for Selected Streams in Connecticut through 2005Ta
ble
9.
Low
-flow
sta
tistic
s de
rived
usi
ng th
e M
OVE.
3 m
etho
d fo
r sho
rt-te
rm s
tream
gagi
ng s
tatio
ns a
nd p
artia
l-rec
ord
site
s in
Con
nect
icut
.
[USG
S, U
.S. G
eolo
gica
l Sur
vey;
ft3 /
s, c
ubic
fee
t per
sec
ond;
--,
not
com
pute
d; ≤
, les
s tha
n or
equ
al to
]
Map
re
fere
nce
num
ber
(fig.
2)
USG
S pa
rtia
l-re
cord
site
nu
mbe
r
Rive
r nam
e
Low
-flo
w fr
eque
ncy,
in ft
3 /sFl
ow d
urat
ions
, in
ft3 /sA
ugus
t m
edia
n flo
w,
in ft
3 /s
Cor-
rela
tion
coef
fi-ci
ent
Inde
x
stat
ion
used
in
rela
tion
7-da
y,
10-y
ear
7-da
y,
2-ye
ar30
-day
, 2-
year
9998
9795
9085
Stre
amflo
w, i
n ft3 /s
801
1183
50G
reen
Fal
l Riv
er0.
602.
023.
700.
921.
351.
812.
614.
145.
795.
280.
9101
1183
009
0111
8750
Hal
eys
Bro
ok0.
040.
210.
490.
070.
120.
180.
300.
570.
910.
80.
9501
1183
0010
0111
9255
Del
phi B
rook
0.08
0.33
0.59
0.08
0.15
0.25
0.33
0.55
0.78
0.68
0.90
0112
0500
1201
1193
60C
onat
Bro
ok0.
360.
550.
780.
450.
480.
520.
600.
730.
920.
860.
8801
1938
0015
0112
0200
Tenm
ile R
iver
0.29
0.73
1.33
0.35
0.48
0.61
0.82
1.36
2.03
1.82
0.93
0112
1000
1701
1207
00B
igel
ow B
rook
0.84
1.64
2.52
0.96
1.21
1.44
1.77
2.57
3.42
3.16
0.87
0112
1000
1801
1209
20M
ount
Hop
e R
iver
0.10
0.23
0.41
0.11
0.15
0.19
0.26
0.42
0.61
0.55
0.98
0112
1000
2001
1213
00Fe
nton
Riv
er0.
501.
162.
000.
880.
790.
991.
282.
052.
952.
670.
9701
1210
0021
0112
1350
Fent
on R
iver
----
----
----
----
----
≤ 0.
80--
2701
1253
00E
nglis
h N
eigh
borh
ood
Bro
ok0.
010.
090.
210.
010.
030.
060.
090.
190.
340.
270.
9201
1205
00
3001
1256
00M
asha
moq
uet B
rook
0.25
0.65
1.21
0.30
0.42
0.54
0.73
1.24
1.88
1.68
0.95
0112
1000
3101
1259
00C
ady
Bro
ok0.
411.
131.
710.
400.
640.
911.
131.
642.
121.
920.
8401
1205
0036
0112
6700
Kitt
Bro
ok0.
300.
610.
960.
340.
420.
500.
650.
961.
381.
380.
9601
1230
0039
0112
7100
Bro
ad B
rook
0.33
1.10
2.00
0.51
0.74
0.99
1.42
2.23
3.11
2.84
0.91
0111
8300
4001
1274
00Su
sque
tons
cut B
rook
0.49
0.91
1.35
0.56
0.66
0.77
0.97
1.35
1.86
1.86
0.96
0112
3000
4201
1277
00T
radi
ng C
ove
Bro
ok0.
300.
871.
380.
410.
640.
781.
011.
632.
212.
020.
8501
1945
0043
0112
7790
Lat
imer
Bro
ok--
----
----
----
----
--≤
0.80
--44
0112
7800
Four
mile
Riv
er0.
060.
280.
540.
100.
180.
240.
340.
681.
030.
910.
9101
1945
0049
0118
3990
Jaw
buck
Bro
ok0.
290.
520.
660.
350.
400.
420.
480.
660.
800.
800.
9101
1718
0052
0118
4300
Gill
ette
Bro
ok0.
010.
110.
260.
010.
030.
070.
110.
240.
410.
330.
8901
1205
00
8201
1919
00C
hart
er B
rook
0.35
0.64
0.95
0.40
0.47
0.54
0.68
0.95
1.30
1.30
0.89
0112
3000
8701
1928
00Pa
rmal
ee B
rook
0.20
0.31
0.46
0.25
0.26
0.29
0.34
0.42
0.55
0.51
0.88
0119
3800
9001
1931
20Po
nset
Bro
ok0.
140.
470.
810.
200.
330.
420.
560.
981.
401.
260.
9701
1945
0091
0119
3130
Can
dlew
ood
Hill
Bro
ok0.
090.
180.
340.
130.
140.
170.
210.
300.
450.
400.
8901
1938
0092
0119
3210
Ray
mon
d B
rook
0.01
0.07
0.15
0.02
0.04
0.05
0.09
0.17
0.27
0.23
0.91
0119
5200
9301
1933
00B
lack
ledg
e R
iver
0.14
0.36
0.66
0.17
0.23
0.30
0.40
0.68
1.02
0.91
0.87
0112
1000
9501
1936
00Fl
at B
rook
0.08
0.15
0.26
0.10
0.12
0.13
0.17
0.23
0.33
0.3
0.93
0119
3800
107
0119
6600
Will
ow B
rook
1.76
3.56
4.80
1.97
2.57
3.03
3.60
4.94
6.09
6.29
0.84
0120
8990
110
0119
8700
Bro
wn
Bro
ok0.
080.
240.
480.
120.
170.
210.
270.
490.
790.
700.
9201
2064
0012
101
2018
90Po
nd B
rook
0.34
0.77
1.38
0.42
0.58
0.69
0.85
1.38
2.06
1.94
0.93
0120
4800
123
0120
2700
But
tern
ut B
rook
0.00
0.11
0.13
0.00
0.01
0.03
0.06
0.13
0.22
0.22
0.91
0119
9200
125
0120
3100
Jack
s B
rook
0.28
0.81
1.27
0.33
0.49
0.63
0.82
1.33
1.82
1.91
0.93
0120
8990
127
0120
3700
Woo
d C
reek
0.09
0.27
0.49
0.12
0.16
0.20
0.25
0.39
0.62
0.68
0.90
0118
8000
142
0120
8900
Patte
rson
Bro
ok--
----
----
----
----
--≤
0.80
--
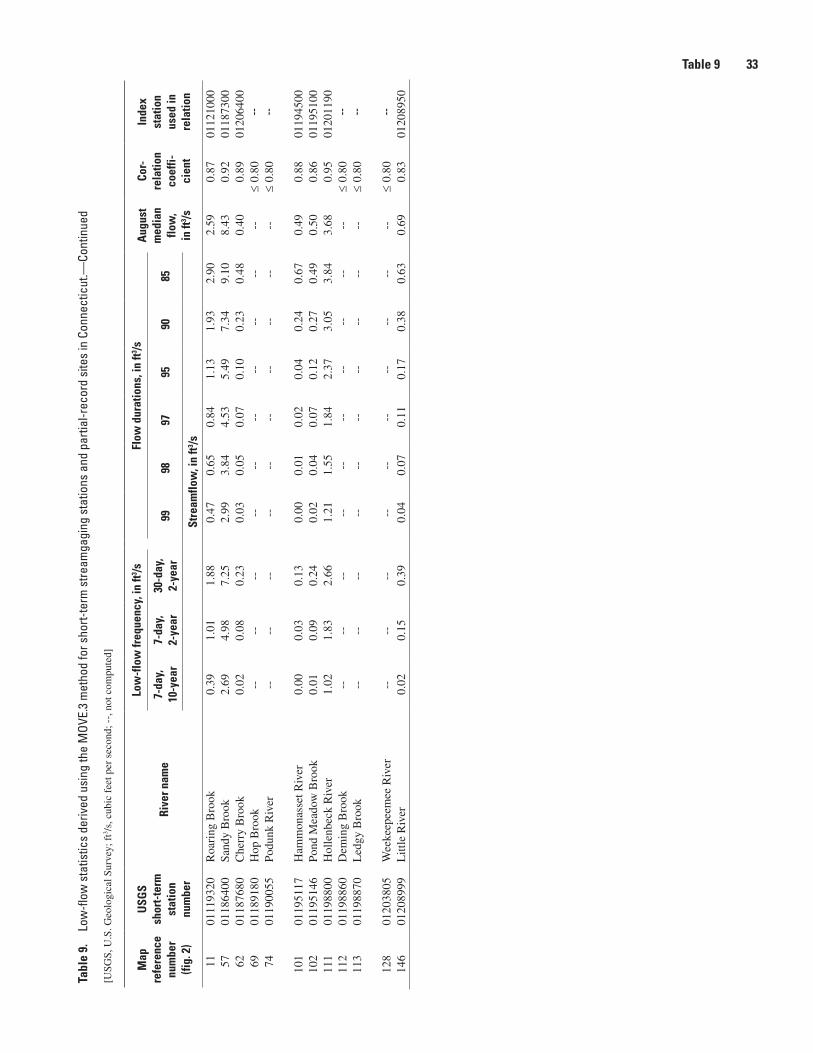
Table 9 33Ta
ble
9.
Low
-flow
sta
tistic
s de
rived
usi
ng th
e M
OVE.
3 m
etho
d fo
r sho
rt-te
rm s
tream
gagi
ng s
tatio
ns a
nd p
artia
l-rec
ord
site
s in
Con
nect
icut
.—Co
ntin
ued
[USG
S, U
.S. G
eolo
gica
l Sur
vey;
ft3 /
s, c
ubic
fee
t per
sec
ond;
--,
not
com
pute
d]
Map
re
fere
nce
num
ber
(fig.
2)
USG
S sh
ort-
term
st
atio
n nu
mbe
r
Rive
r nam
e
Low
-flo
w fr
eque
ncy,
in ft
3 /sFl
ow d
urat
ions
, in
ft3 /sA
ugus
t m
edia
n flo
w,
in ft
3 /s
Cor-
rela
tion
coef
fi-ci
ent
Inde
x
stat
ion
used
in
rela
tion
7-da
y,
10-y
ear
7-da
y,
2-ye
ar30
-day
, 2-
year
9998
9795
9085
Stre
amflo
w, i
n ft3 /s
1101
1193
20R
oari
ng B
rook
0.39
1.01
1.88
0.47
0.65
0.84
1.13
1.93
2.90
2.59
0.87
0112
1000
5701
1864
00Sa
ndy
Bro
ok2.
694.
987.
252.
993.
844.
535.
497.
349.
108.
430.
9201
1873
0062
0118
7680
Che
rry
Bro
ok0.
020.
080.
230.
030.
050.
070.
100.
230.
480.
400.
8901
2064
0069
0118
9180
Hop
Bro
ok--
----
----
----
----
--≤
0.80
--74
0119
0055
Podu
nk R
iver
----
----
----
----
----
≤ 0.
80--
101
0119
5117
Ham
mon
asse
t Riv
er0.
000.
030.
130.
000.
010.
020.
040.
240.
670.
490.
8801
1945
0010
201
1951
46Po
nd M
eado
w B
rook
0.01
0.09
0.24
0.02
0.04
0.07
0.12
0.27
0.49
0.50
0.86
0119
5100
111
0119
8800
Hol
lenb
eck
Riv
er1.
021.
832.
661.
211.
551.
842.
373.
053.
843.
680.
9501
2011
9011
201
1988
60D
emin
g B
rook
----
----
----
----
----
≤ 0.
80--
113
0119
8870
Led
gy B
rook
----
----
----
----
----
≤ 0.
80--
128
0120
3805
Wee
keep
eem
ee R
iver
----
----
----
----
----
≤ 0.
80--
146
0120
8999
Litt
le R
iver
0.02
0.15
0.39
0.04
0.07
0.11
0.17
0.38
0.63
0.69
0.83
0120
8950
Prepared by the Pembroke Publishing Service Center
For more information concerning the research in this report, contact:Virginia de Lima, DirectorU.S. Geological SurveyConnecticut Water Science Center101 Pitkin St.East Hartford, CT 06108
or visit our Web site at:http://ct.water.usgs.gov
Scientific Investigations Report 2007–5270Scientific Investigations Report 2007–5270
Prepared in cooperation with theConnecticut Department of Environmental Protection andNew England Water Pollution Control Commission
Flow Durations, Low-Flow Frequencies, and Monthly Median Flows for Selected Streams in Connecticut through 2005
U.S. Department of the InteriorU.S. Geological Survey
Ahearn—Flow
Durations, Low-Flow
Frequencies, and Monthly M
edian Flows for Selected Stream
s in Connecticut through 2005—Scientific Investigations Report 2007–5270