Embed Size (px)
Citation preview
Flow Development in a Gas-Solids Downer Fluidized Bed HUI ZHANG, JING-XU (JESSE) ZHU and MAURICE A. BERGOUGNOU
Department of Chemical and Biochemical Engineering, Universig of Western Ontario, London, ON N6A 5B9, Canada
The development of gas and solids flow structure was studied in a 9.5 m high and 0.10 m diameter, gassolids cocur- rent downflow circulating fluidized bed (downer). Local solids concentration and particle velocity were measured using two separate optical fibre probes at different radial positions on several axial levels along the downer. The results show that the flow development is significantly influenced by the operating conditions. For most of the conditions under which the experiments were conducted, the gassolids flow reaches its fully developed zone within 3 to 8 m away from the entrance. On the other hand, the development zone can extend as long as the downer itself, under certain conditions. When the solids circulation rate is over 100 kg/m2s, an increasing solids circulation rate largely extends the length of radial flow development. It is found that the flow developments in the core and at the wall are not quite simultaneous. For solids concentration, the core develops more quickly at low gas velocities and the wall region develops faster at high gas velocities. For particle velocity, higher gas velocity speeds up the development of the wall region but does not signifi- cantly affect the development of the core region. The wall region is much more sensitive to the change of superficial gas velocity than the core region. At high superficial gas velocities (> 7 d s ) , a “semi-dead” region is observed in the fully developed zone adjacent to the wall where the dilute solids are moving at a very low velocity.
On a etudie le developpement de la structure d’ecoulement de gaz et de solides dans un lit fluidise circulant a ecoule- ment descendant a cocourant gaz-solides (colonne descendante) de 9,s m de hauteur et 0,lO m de diametre. La concen- tration de solides locale et la vitesse des particules ont ete mesurees a I’aide de deux sondes a fibre optique distinctes pour differentes positions radiales a plusieurs niveaux le long de la colonne descendante. Les resultats montrent que le developpement de I’ecoulement est influence de maniere significative par les conditions de fonctionnement. Pour la plu- part des conditions dans lesquelles ont ete menees les experiences, I’ecoulement gaz-solides atteint sa zone pleinement developpe a une distance comprise entre 3 et 8 m de I’entree. Par ailleurs, la zone de developpement peut s’etendre le long de la colonne elle-m&ne, dans certaines conditions. Lorsque la vitesse de circulation des solides depasse 100 kg/m2s, une vitesse de circulation des solides croissante augmente largement la longueur du developpement d’ecoulement radial. On a trouve que les developpements d’ecoulement dans le coeur et a la paroi ne sont pas tout a fait simultanes. Pour une concentration de solides, la region du coeur se developpe plus rapidement a de faibles vitesses de gaz et la region de la paroi se developpe plus rapidement a des vitesse de gaz elevees. Pour la vitesse des particules, une vitesse de gaz plus grande accelere le developpement de la region de la paroi mais n’affecte pas significativement le developpement de la region du coeur. La region de la paroi est beaucoup plus sensible au changement de vitesse de gaz superticielle que la region du coeur. A des vitesses de gaz superficielles elevees (> 7 d s ) , une region “semi-stagnante” est observee dans la zone pleinement developpee adjacente a la paroi oh les solides dilues se deplacent a une vitesse tres faible.
Keywords: downer reactor, flow development, cocurrent downflow, fluidized bed.
n recent years, more and more attention has been given to I a new type of gassolids reactor, the cocurrent downflow circulating fluidized bed (downer). Compared to the con- ventional upflow riser of a circulating fluidized bed, the downer reactor provides many advantages, such as much more uniform gassolids flow with less aggregation; less gas and solids dispersion; and shorter residence time (Zhu et al., 1995; Wei and Zhu, 1996). These properties are par- ticularly beneficial to the processes of fluidized catalytic cracking (FCC) and residual oil fluidized catalytic cracking (RFCC) where extremely short, but uniform contact times between gas and solids are required (Zhu et al., 1995).
On the other hand, few investigations have been conducted in the downer reactor to understand the gas solids flow structure (Wei and Zhu, 1996). No work has been reported to provide a comprehensive study on the flow development inside the downer. Wang et al. (1992) proposed a postula- tion, that there exist three sections in the downer reactor: the first acceleration section, which is from the top to the posi- tion where the particle velocity is equal to the gas velocity; the second acceleration section, in which the particle velocity continues to increase until the gasparticle slip velocity reach- es a value where the upward drag force counter-balances the gravitational force; and the constant velocity section, where
*Author to whom correspondence may be addressed. E-mail address: [email protected]
both particle and gas velocities remain constant. However, only axial pressure profiles were reported in their study. No result has been reported on the axial distributions of either solids holdup or particle velocity in the downer to verify the above postulation.
The radial gassolids flow structures were studied by two groups of researchers, who reported quite different results. The radial particle velocity profiles obtained by the Tsinghua research group (e.g. Yang et al., 1991; Bai et al., 1991; Wang et al., 1992) suggest a relatively flat particle velocity distribution, with particle velocity slowly increas- ing with the increasing radius, and reaching a maximum at r/R = 0.85 to 0.96. They also reported typical radial solids concentration profiles characterized by a flat core region and a large peak around r/R = 0.94. On the other hand, the results obtained by Herbert et al. (1 994) and Herbert (1997) are quite different from the above. They reported particle velocity profiles of a parabolic shape,with higher velocity in the central region, and solids concentration profiles with a much lower peak located more inwards, at around r/R = 0.6. Since different, and yet limited operating conditions (differ- ent Ug, G, and column diameter) were employed by each group, and the radial profiles were taken at different and limited axial locations, it is difficult to obtain a clear picture on the radial flow structure from those studies.
Therefore, a more systematic study with wider operating conditions is needed to achieve a more comprehensive understanding on the hydrodynamic flow structure in downer
I94 THE CANADIAN JOURNAL OF CHEMICAL ENGINEERING, VOLUME 77, APRIL, 1999
t
‘I (0.25 tn id./ 1 m)
\ Sol& now -DOl valve
Rua main ah
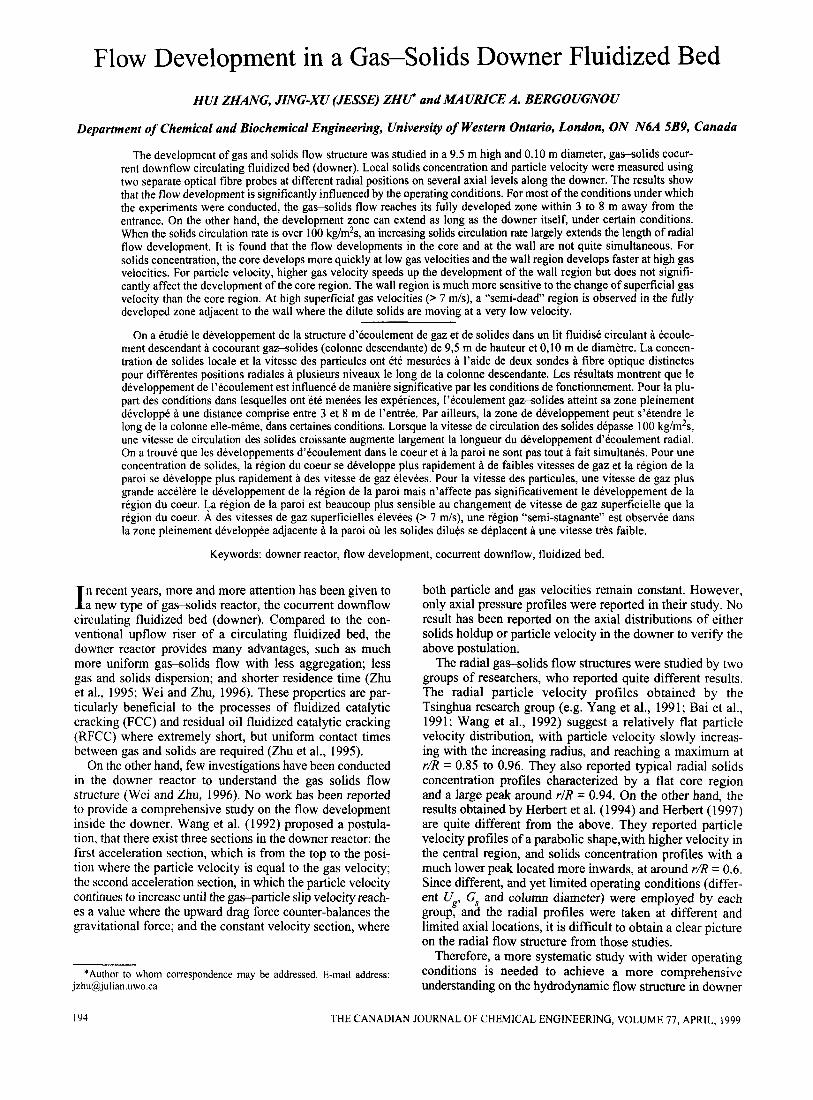
Figure 1 -Schematic diagram of the riseddowner circulating flu- idized bed system.
reactors. In this work, experiments were carried out with superficial gas velocities up to 10 d s and with solids circu- lation rate as high as 200 kg/m2s, to study the radial and axial development of gassolids flow in the downer reactor.
Experimental apparatus
Figure 1 illustrates a schematic flow diagram of the experimental apparatus. The solids were first carried up the 15.1 m tall acrylic riser of 0.1 m diameter by the upflowing air. Then, solids were separated, with an efficiency of greater than 99%, from the air in the primary cyclone installed at the downer top. The air exiting the primary cyclone was further cleaned by the secondary and tertiary cyclones before being finally stripped off fine particles in a baghouse filter. At the downer top, the solids were redis- tributed by a gassolids distributor located below the dipleg of the riser primary cyclone. The solids distributor had a small fluidized bed (held at minimum fluidization), from which particles fell down through thirty-one vertically posi- tioned 12.7 mm 0.d. and 0.36 m long brass tubes into the downer entrance. The gas distributor was a plate with thirty- one 16.7 mm i.d. holes, located below the solids distributor fluidized bed, but 50.8 mm above the bottom exit of the solids feed tubes. Those 3 1 holes were arranged in the same pattern as the 3 1 brass tubes in the solids distributor so that, downer fluidizing gas entering just below the solids distrib- utor fluidized bed was distributed through the 2 mm gap, before it was mixed with downflowing solids. From the downer entrance (the bottom exit of the solids distributor tubes is considered the entrance point or 0 position of the downer), the cocurrent downflow gassolids suspension
0.04
-4- H=0.512 m
x1 0.01
14.0
g- 12.0
s 10.0 9 8.0 - p 6.0 Y Y 5 4.0 n
2.0
g- 12.0
s 10.0 9 8.0 - p 6.0 Y Y 5 4.0 n
2.0
0.0 4 I 0.0 0.2 0.4 0.6 0.8 1 0
Radial podtion r/R
Figure 2 - Typical radial solids concentration and radial particle velocity profiles (Ug = 7.2 m / s and G,7 = 101 kg/m2.s).
travelled down through the 9.3 m long downer column of 0.1 m diameter. At the downer bottom, the solids were first separated from the air in a quick inertial separator, with an efficiency of more than 99%, and then, drained to the storage tank. Solids circulation rate was measured by diverting the collected solids into the measuring vessel for a given period of time. The air was further stripped off the entrained parti- cles by the secondary and tertiary cyclones, before it was finally cleaned through the baghouse. The solids stored in the minimally fluidized storage tank flew through a butter- fly valve into the bottom of the riser and were then entrained up again by the riser air. The particles used for this study were FCC catalyst with a Sauter-mean diameter of 67 pm, a particle density of 1500 kg/m3 and a bulk density of 850 kg/m3. In order to minimize the electric statics found in both the riser and downer column, the de-oiled fluidization air was humidified to a relative humidity of 70 to 80%, by introducing a stream of steam into the main air pipe line.
The local solids concentration and local particle velocity were measured using two different optical fiber probes. The details of the two probes have been separately presented (Zhang et al., 1998; Zhu et al., 1999). The optical fiber probe for solids concentration had a 3.8 mm diameter stain- less steel probe tip containing approximately 8000 emitting and receiving quartz fibers, each 15 pm in diameter. The optical fiber probe utilized to measure the local particle velocity had five fibers (two for light emitting, three for light receiving) and a logic circuit to calculate the particle velocity. The concentration probe was precisely calibrated using a novel calibration procedure, as described by Zhang et al. (1998). The velocity probe was calibrated using a rotating disk device (Zhu, 1999).
Results and discussions
Under several different operating conditions, local parti- cle velocities and solids concentrations were measured at 1 1 radial positions on 8 axial levels. Figure 2 shows typical radial distributions of solids holdup and particle velocity at
THE CANADIAN JOURNAL OF CHEMICAL ENGINEERING, VOLUME 77, APRIL, I999 I95
/%,
0 1 2 3 4 5 6 7 8 0 1 0 1 2 3 4 5 6 7 8 0 10
Disanca horn downer top, H,
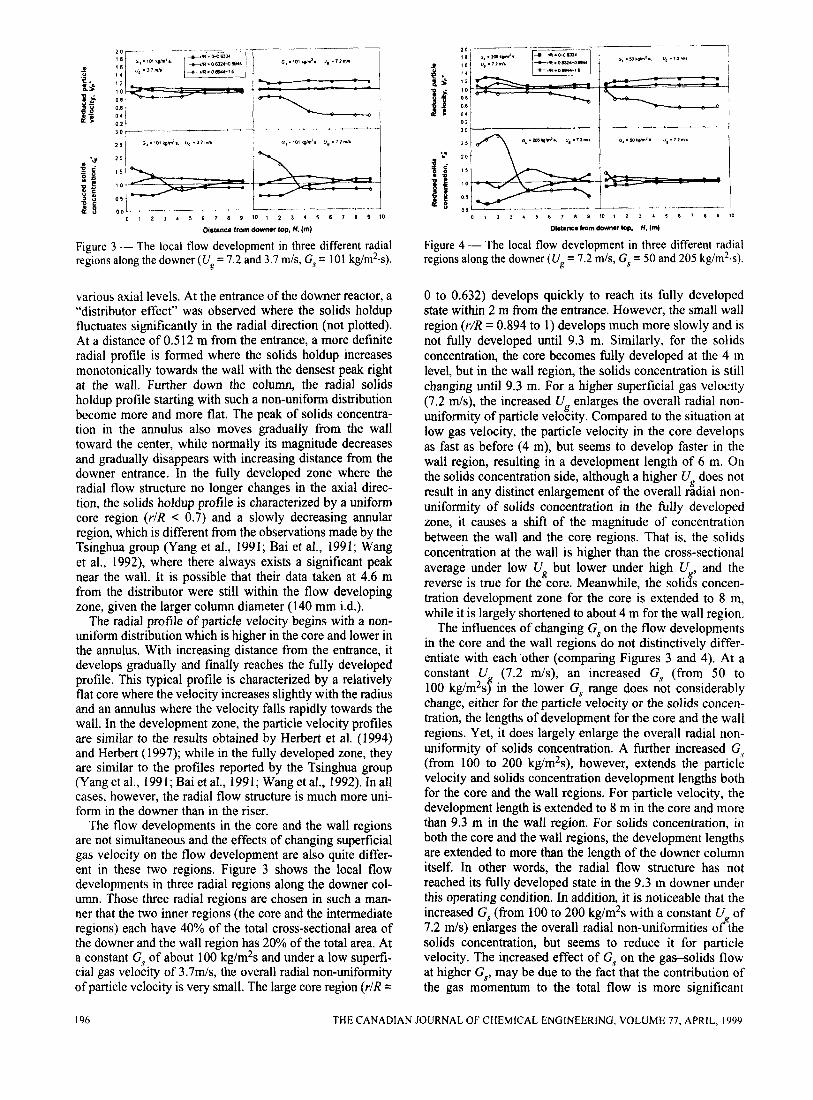
Figure 3 - The local flow development in three different radial regions along the downer ( Ug = 7.2 and 3.7 m/s, G , = 101 kg/m2.s).
various axial levels. At the entrance of the downer reactor, a "distributor effect" was observed where the solids holdup fluctuates significantly in the radial direction (not plotted). At a distance of 0.512 m from the entrance, a more definite radial profile is formed where the solids holdup increases monotonically towards the wall with the densest peak right at the wall. Further down the column, the radial solids holdup profile starting with such a non-uniform distribution become more and more flat. The peak of solids concentra- tion in the annulus also moves gradually from the wall toward the center, while normally its magnitude decreases and gradually disappears with increasing distance from the downer entrance. In the fully developed zone where the radial flow structure no longer changes in the axial direc- tion, the solids holdup profile is characterized by a uniform core region (r/R c 0.7) and a slowly decreasing annular region, which is different from the observations made by the Tsinghua group (Yang et al., 1991; Bai et al., 1991; Wang et al., 1992), where there always exists a significant peak near the wall. It is possible that their data taken at 4.6 m from the distributor were still within the flow developing zone, given the larger column diameter (140 mm id.).
The radial profile of particle velocity begins with a non- uniform distribution which is higher in the core and lower in the annulus. With increasing distance from the entrance, it develops gradually and finally reaches the fully developed profile. This typical profile is characterized by a relatively flat core where the velocity increases slightly with the radius and an annulus where the velocity falls rapidly towards the wall. In the development zone, the particle velocity profiles are similar to the results obtained by Herbert et al. (1994) and Herbert (1997); while in the fully developed zone, they are similar to the profiles reported by the Tsinghua group (Yang et al., 1991; Bai et al., 1991; Wang et al., 1992). In all cases, however, the radial flow structure is much more uni- form in the downer than in the riser.
The flow developments in the core and the wall regions are not simultaneous and the effects of changing superficial gas velocity on the flow development are also quite differ- ent in these two regions. Figure 3 shows the local flow developments in three radial regions along the downer col- umn. Those three radial regions are chosen in such a man- ner that the two inner regions (the core and the intermediate regions) each have 40% of the total cross-sectional area of the downer and the wall region has 20% of the total area. At a constant G,$ of about 100 kg/m2s and under a low superfi- cial gas velocity of 3.7m/s, the overall radial non-uniformity of particle velocity is very small. The large core region (rlR =
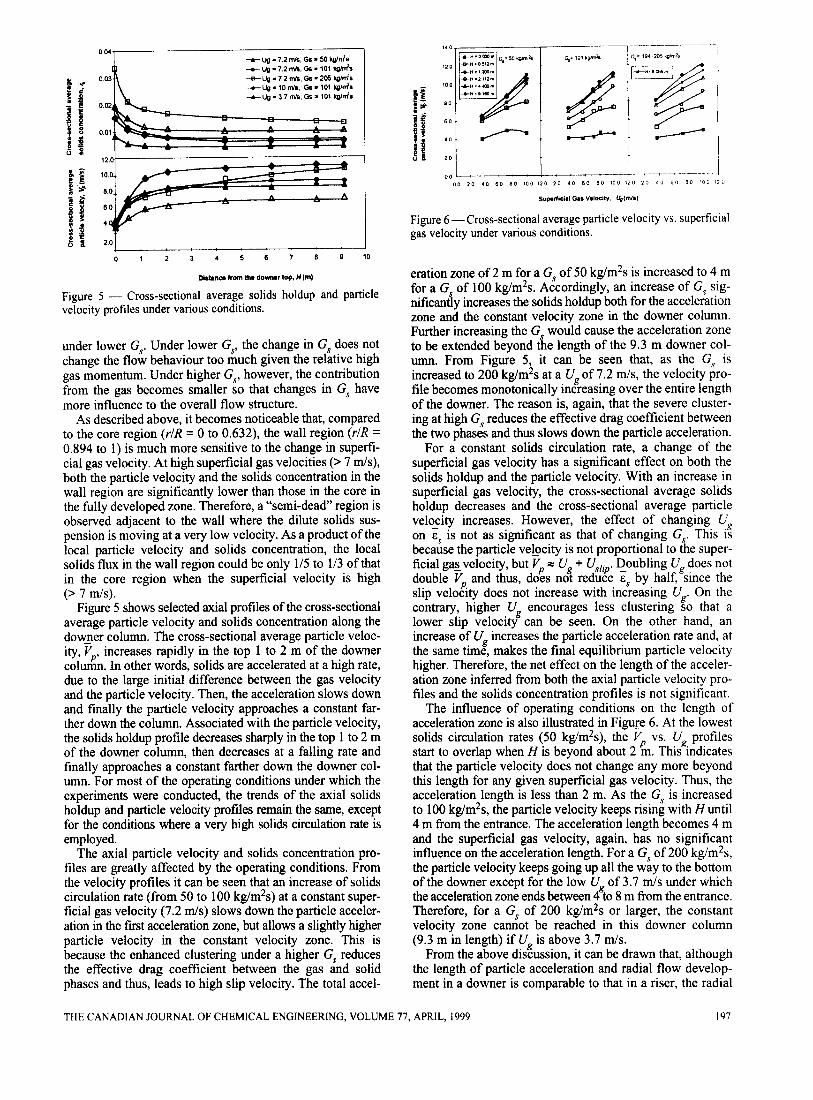
Figure 4 - The local flow development in three different radial regions along the downer (Ug = 7.2 d s , G,, = 50 and 205 kg/m2.s).
0 to 0.632) develops quickly to reach its fully developed state within 2 m from the entrance. However, the small wall region (r/R = 0.894 to 1) develops much more slowly and is not fully developed until 9.3 m. Similarly, for the solids concentration, the core becomes fully developed at the 4 m level, but in the wall region, the solids concentration is still changing until 9.3 m. For a higher superficial gas velocity (7.2 d s ) , the increased Us enlarges the overall radial non- uniformity of particle velocity. Compared to the situation at low gas velocity, the particle velocity in the core develops as fast as before (4 m), but seems to develop faster in the wall region, resulting in a development length of 6 m. On the solids concentration side, although a higher Ug does not result in any distinct enlargement of the overall radial non- uniformity of solids concentration in the fully developed zone, it causes a shift of the magnitude of concentration between the wall and the core regions. That is, the solids concentration at the wall is higher than the cross-sectional average under low Ue but lower under high U , and the reverse is true for the core. Meanwhile, the solicfs concen- tration development zone for the core is extended to 8 m, while it is largely shortened to about 4 m for the wall region.
The influences of changing G,, on the flow developments in the core and the wall regions do not distinctively differ- entiate with each other (comparing Figures 3 and 4). At a constant U (7.2 d s ) , an increased G, (from 50 to 100 kg/m2sf: in the lower G, range does not considerably change, either for the particle velocity or the solids concen- tration, the lengths of development for the core and the wall regions. Yet, it does largely enlarge the overall radial non- uniformity of solids concentration. A further increased G,? (from 100 to 200 kg/m2s), however, extends the particle velocity and solids concentration development lengths both for the core and the wall regions. For particle velocity, the development length is extended to 8 m in the core and more than 9.3 m in the wall region. For solids concentration, in both the core and the wall regions, the development lengths are extended to more than the length of the downer column itself. In other words, the radial flow structure has not reached its fully developed state in the 9.3 m downer under this operating condition. In addition, it is noticeable that the increased G, (from 100 to 200 kg/m2s with a constant U of 7.2 d s ) enlarges the overall radial non-uniformities ofthe solids concentration, but seems to reduce it for particle velocity. The increased effect of G, on the gassolids flow at higher G,,, may be due to the fact that the contribution of the gas momentum to the total flow is more significant
I96 THE CANADIAN JOURNAL OF CHEMICAL ENGINEERING, VOLUME 77, APRIL, 1999
E ‘a 201
0 1 2 3 4 5 6 7 8 8 10
Figure 5 - Cross-sectional average solids holdup and particle velocity profiles under various conditions.
under lower G,. Under lower G,y, the change in G, does not change the flow behaviour too much given the relative high gas momentum. Under higher G.9, however, the contribution from the gas becomes smaller so that changes in G, have more influence to the overall flow structure.
As described above, it becomes noticeable that, compared to the core region (r/R = 0 to 0.632), the wall region (r/R = 0.894 to 1) is much more sensitive to the change in superfi- cial gas velocity. At high superficial gas velocities (> 7 mls), both the particle velocity and the solids concentration in the wall region are significantly lower than those in the core in the fully developed zone. Therefore, a “semi-dead” region is observed adjacent to the wall where the dilute solids sus- pension is moving at a very low velocity. As a product of the local particle velocity and solids concentration, the local solids flux in the wall region could be only 1/5 to 1/3 of that in the core region when the superficial velocity is high
Figure 5 shows selected axial profiles of the cross-sectional average particle velocity and solids concentration along the dowjer column. The cross-sectional average particle veloc- ity, Vp, increases rapidly in the top 1 to 2 m of the downer column. In other words, solids are accelerated at a high rate, due to the large initial difference between the gas velocity and the particle velocity. Then, the acceleration slows down and finally the particle velocity approaches a constant far- ther down the column. Associated with the particle velocity, the solids holdup profile decreases sharply in the top 1 to 2 m of the downer column, then decreases at a falling rate and finally approaches a constant farther down the downer col- umn. For most of the operating conditions under which the experiments were conducted, the trends of the axial solids holdup and particle velocity profiles remain the same, except for the conditions where a very high solids circulation rate is employed.
The axial particle velocity and solids concentration pro- files are greatly affected by the operating conditions. From the velocity profiles it can be seen that an increase of solids circulation rate (from 50 to 100 kg/m2s) at a constant super- ficial gas velocity (7.2 m l s ) slows down the particle acceler- ation in the fmt acceleration zone, but allows a slightly higher particle velocity in the constant velocity zone. This is because the enhanced clustering under a higher G, reduces the effective drag coefficient between the gas and solid phases and thus, leads to high slip velocity. The total accel-
(> 7 m l s ) .
5 % 2 0 1 t 00 2 0 4 0 6 0 80 100 120 20 4 0 6 0 80 100 120 2 0 4 0 6 0 80 1 0 0 120
supdlctal Gas Vdoclty. ~ ( r n i r l
Figure 6 -Cross-sectional average particle velocity vs. superficial gas velocity under various conditions.
eration zone of 2 m for a G,? of 50 kg/m2s is increased to 4 m for a G, of 100 kg/m2s. Accordingly, an increase of G,y sig- nificantly increases the solids holdup both for the acceleration zone and the constant velocity zone in the downer column. Further increasing the G, would cause the acceleration zone to be extended beyond the length of the 9.3 m downer col- umn. From Figure 5 , it can be seen that, as the G,v is increased to 200 kg/m2s at a Ug of 7.2 m l s , the velocity pro- file becomes monotonically increasing over the entire length of the downer. The reason is, again, that the severe cluster- ing at high G, reduces the effective drag coefficient between the two phases and thus slows down the particle acceleration.
For a constant solids circulation rate, a change of the superficial gas velocity has a significant effect on both the solids holdup and the particle velocity. With an increase in superficial gas velocity, the cross-sectional average solids holdup decreases and the cross-sectional average particle velocity increases. However, the effect of changing Us on z, is not as significant as that of changing G,T. This is because the particle vekcity is not proportional to the super- ficial gagvelocity, but Vp c Uf + ?!@. Doubling Ug does not double Vp. and thus, does no re uce E, by half, since the slip velocity does not increase with increasing Ug. On the contrary, higher Ug encourages less clustering so that a lower slip velocity can be seen. On the other hand, an increase of U’ increases the particle acceleration rate and, at the same time, makes the final equilibrium particle velocity higher. Therefore, the net effect on the length of the acceler- ation zone inferred from both the axial particle velocity pro- files and the solids concentration profiles is not significant.
The influence of operating conditions on the length of acceleration zone is also illustrated in Figur-e 6. At the lowest solids circulation rates (50 kg/m2s), the Vp vs. Ug profiles start to overlap when H is beyond about 2 m. This indicates that the particle velocity does not change any more beyond this length for any given superficial gas velocity. Thus, the acceleration length is less than 2 m. As the G, is increased to 100 kg/m2s, the particle velocity keeps rising with Huntil 4 m from the entrance. The acceleration length becomes 4 m and the superficial gas velocity, again, has no significant influence on the acceleration length. For a G,y of 200 kg/m2s, the particle velocity keeps going up all the way to the bottom of the downer except for the low Ug of 3.7 m l s under which the acceleration zone ends between 4 to 8 m from the entrance. Therefore, for a G, of 200 kg/m2s or larger, the constant velocity zone cannot be reached in this downer column (9.3 m in length) if Ug is above 3.7 mls.
From the above discussion, it can be drawn that, although the length of particle acceleration and radial flow develop- ment in a downer is comparable to that in a riser, the radial
THE CANADIAN JOURNAL OF CHEMICAL ENGINEERING, VOLUME 77, APRIL, 1999 I97
flow structures in a downer, both for the solids concentra- tion and particle velocity, are much more uniform than those found in a riser. This makes the downer reactor an excellent potential candidate for industrial applications where high product selectivity is crucial. However, attention should be drawn that too high a gas velocity (> 7 to 10 m / s ) may reduce this advantage of the downer, because the appear- ance of the “semi-dead” region adjacent to the wall in the fully developed zone would begin to cause non-uniform solids residence time distributions.
Conclusions
Compared to a CFB riser, a cocurrent downflow gassolids CFB (downer) has a much more uniform radial flow struc- ture. The radial flow development is significantly influenced by the operating conditions. When solids circulation rate is over 100 kg/m2s, an increasing solids circulation rate signif- icantly extends the length of radial flow development. High superficial gas velocity diversely affects the lengths of flow development in the core and the wall regions. For most of the conditions tested, the gas-solids flow reaches its fully developed zone within 3 to 8 m away from the entrance. On the other hand, the development zone can extend to as long as the downer itself under certain conditions, especially when solids circulation rate is close to 200 kg/m2s.
The flow developments in the core and at the wall are not quite simultaneous. For solids concentration, the center develops more quickly at low gas velocities and the wall region develops faster at high gas velocities. For particle velocity, higher gas velocity speeds up the development of the wall region, but does not significantly affect the devel- opment of the core region. The wall region is much more sensitive to the change in superficial gas velocity than the core region. At high superficial gas velocities (> 7 d s ) , a “semi-dead” region is observed in the fully developed zone adjacent to the wall where the dilute solids suspension is moving at a very low velocity (3 to 5 m/s compared to -10 m/s in the center).
The cross-sectional average particle velocity increases rapidly in the top 1 to 2 m of the downer column, due to the large initial difference between the gas velocity and the par- ticle velocity. Accordingly, solids concentration decreases quickly in the same region. Then the acceleration slows down and finally, the particle velocity approaches a constant farther down the column. The axial particle velocity and solids concentration profiles are greatly affected by the operating conditions. An increase of solids circulation rate slows down the particle acceleration. Too high a G, (e.g. 200 kg/m2s, at U = 7.2 m/s) can extend the acceleration zone beyond the $3 m downer column. An increased super- ficial gas velocity does not significantly change the length of particle acceleration, although a significant change of the magnitude of the particle velocity and solids concentration can be seen.
When the solids circulation rate is below 100 kg/m2s, a changing G,T has no distinct influence on the flow develop- ment. However, beyond this range, an increasing G, has a major effect on both the flow development and the particle acceleration, which may be extended beyond the length of the downer.
Acknowledgement
Research Council of Canada is gratefully acknowledged.
Nomenclature
G, = solids circulation rate, (kg/m2s) H = distance from the downer entrance, (m) r = radius, (m) R = radius of the downer column, (m) U = superficial gas velocity, (m/s) u$, = apparent particle slip velocity, (m/s) 5 = local particle velocity, ( d s ) Vp* = cross-sectional average particle velocity, ( d s )
Vp = reduced local particle velocity, [= Vp/Vp] (-)
Greek letters
E, E,
E,’
References
Bai, D. R., Y. Jin, Z. Q. Yu and N. J. Gan, “Radial Profiles of Local Solid Concentration and Velocity in a Concurrent Downflow Fast Fluidized Bed”, in “Circulating Fluidized Bed Technology III”, P. Basu, M. Horio and M. Hasatani, Eds., Pergamon Press, Toronto, ON (1991), pp. 157-162.
Herbert, P. M., T. A. Gauthier, C. L. Briens and M. A. Bergougnou, “Application of Fiber Optic Reflection Probes to the Measurement of Local Particle Velocity and Concentration in Gas-Solid Flow”, Powder Technol. 80,243-252 (1994).
Herbert, P. M., “Hydrodynamic Study of a Downflow Circulating Fluidized Bed”, Ph.D. Dissertation, The University of Western Ontario, London, Canada ( 1 997).
Wang, Z., D. Bai, and Y. Jin, “Hydrodynamics of Cocurrent Downflow Circulating Fluidized Bed (CDCFB)”, Powder Technol.
Wei, F. and J.-X. Zhu, “Effect of Flow Direction on the Solids Mixing in Gas-Solids Upflow and Downflow Systems”, Chem. Eng. J. 64, 345-352 ( I 996).
Yang, Y. L., Y. Jin, Z. Q. Yu, Z. W. Wang and D. R. Bai, “The Radial Distribution of Local Particle Velocity in a Dilute Circulating Fluidized B e d , in “Circulating Fluidized Bed Technology III”, P. Basu, M. Horio, and M. Hasatani, Eds., Pergamon Press, Toronto, ON (1991), pp. 201-206.
Zhang, H., P. M. Johnston, J.-X. Zhu, H. I. de Lasa, and M. A. Bergougnou, “A Novel Calibration Procedure for a Fibre Optic Concentration Probe”, Powder Technol. 100,260-272 ( 1 998).
Zhu, J.-X., Z.-Q. Yu, Y. Jin, J. R. Grace and A. Issangya, “Cocurrent Downflow Circulating Fluidized Bed (Downer) Reactors - A State of the Art Review”, Can. J. Chem. Eng. 73, 662-677 (1995).
Zhu, J.-X. and F. Wei, “Recent Developments of Downer Reactors and other Types of Short Contact Reactors”, to be included in “Fluidization VIII”, J. F. Large and C. Laguerie Eds., Engineering Foundation, New York, N.Y. (1996), pp. 501-5 10.
Zhu, J.-X., S.-Z. Qin, G.-Z. Li, F.-Y. Li, Y.-L. Yang and H. Zhang, “Direct Measurements of Particle Velocities in a Circulating Fluidized Bed Using a Novel Optical Fibre Probe”, Powder Technol., submitted (1999).
Financial support from the Natural Sciences and Engineering
= local solids holdup, (-) = cross-sectional average solids concentration, (-) = reduced solids concentration, (= E, E,) (-)
-
70,27 1-275 (1992).
Manuscript received July 15, 1998; revised manuscript received December 4, 1998; accepted for publication December 18, 1998.
I98 THE CANADIAN JOURNAL OF CHEMICAL ENGINEERING, VOLUME 77, APRIL, 1999


![Application of a Twin-plane Electrical Capacitance ... · hydrodynamic characteristics in gas-solids fluidized beds. Wang et al. [6] imaged gas bubble shape, length and coalescence](https://img.pdfslide.us/doc/110x75/5e812111a364ac5d941d8e74/application-of-a-twin-plane-electrical-capacitance-hydrodynamic-characteristics.jpg)