Embed Size (px)
Citation preview
~~
Acta Biotechnol. 12 (1992) 5 , 365-375 Akademie Verlag
Flow-Cytometric Investigation of Sterol Content and Proliferation Activity of Yeast
MULLER, S., Loscm, A., BLEY, Th.
WIP Research Group “Biosignale” PermoserstraOe 15 0-7050 Leipzig, F.R.G.
Summary
To understand and control the dynamics of microbial growth and metabolism, a theoretical background based on segregated models is necessary, and therefore flow cytometry is the suitable measuring method. It is shown that additional information to the usual mean-value information, and to the well-known cytometric methods for determining DNA content and size/shape measurement by scattered light, like the distribution of membrane sterol content of baker’s yeast, leads to a more detailed knowledge of growth dynamics. We have found, that a low content of membrane sterols is a characteristic of cells with suppressed proliferation activity, but necessary for high fermentation activity. Also, a high content of membrane sterols seems to enhance the viability and survival capability of harvested and dryed baker’s yeast cells. Therefore, we recommend harvesting cells at a point of medium content of membrane sterols.
Introduction
Extending the widely introduced methods in flow cytometry by the measurement of new cell compartments allows a better understanding ofmicrobial population dynamics [ 1 - 41. Saccharomyces cerevisiae is the focus for our research, due to its broad use in industrial microbiology and its extensively investigated biology. The purpose of this study was to test the application of cytometric methods to detect alterations in the distribution of baker’s yeast populations, induced by changing the starting point and the duration of the fermentation, by changing the supply of specific nutrients, and by cultivation under aerobic/anaerobic growth conditions. Baker’s yeast cells need a certain cell size and a distinct amount of storage material (e.g. trehalose, neutral lipids) to proliferate [5 - 71. However, the start of DNA replication is controlled by membrane compounds like 3B-hydroxysterols. GABER and LORENZ termed this the sparking function of sterols [8 - 91. The mentioned function is described by initiation of proliferation through the C5.6 double bond of 3j?-hydroxysterol (e.g. the native ergosterol in yeast) [lo]. The sterols are involved in regulating the cdc 28 gen, which corresponds to a proteinkinase. The nature of this mechanism is still unclear, but seems to be similar to the principle of hormonal initiation of transcription in specific genes of animal cells [ll].

366 Acta Biotechnologica 12 (1992) 5
Ergosterol, which contributes up to 80% of yeast 3~-hydroxysterols, condensates the membrane phospholipids because of its structural characteristics. On the strength of this event, it regulates membrane fluidity, stability, permeability and metabolic balance [ 12,131. Protection against extreme situations such as dryness, osmotic stress, heat and lack of nutrients, depends mainly on a high membrane sterol content [14]. This was described as the bulk membrane function of 3j%hydroxysterols, which is important for the preservation of viability of dry baker's yeast [IS]. Both functions of 3~-hydroxysterols have an influence on yield (proliferation) and quality (survival function) of baker's yeast. Therefore, we have developed a method to measure the sterol distribution within the population [5, 161. This method, combined with DNA distribution measurements, aIlows conclusions to be made about the cytokinetic status of a cell population and further insight into the processes occurring in single cells. The light scatter investigations revealed additional information about cell size (forward scattering) as well as cell content (granuiarity) and condensation of the membrane (rectangular scattering light).
Materials and Methods
Chemicals
Different nystatin probes were received from Mrs. SCHREIEER, Pharmaceutical Depot of Neuruppin (Brandenburg, Germany). Ethidium bromide, ribonuclease A from bovine pancreas (80 KUNITZ IU) and fluoresceinisothiocyanate were obtained from SERVA, olivomycin from MEDEXPORT (Moscow, U.S.S.R.). Different baker's yeast strains are obtained from Mrs. KOLEV, DHW Leipzig (Saxonia, Germany).
Cell Culture For all purposes, a diploid strain (H 155, IBT) and a tetraploid strain of baker's yeast (S6) were used and cultured in batch on the READER medium, substituted with 0.5% yeast extract and 2% glucose at pH 5.4 and 30 "C. The inoculum was 5 x lo6 cells/ml medium, measured by coulter counter technique. Samples were taken over a period of 28 hours, the glucose of the READER medium was .consumed when lo9 cells/ml were grown. In a fed-batch cultivation, cells were grown in an industrial bioreactor on the following medium: Molasses was added with an increasing gradient from I to 6 hours, and from 7 to 10 hours, rising from 1 1 to 45 g/l, followed by 6 hours of steady conditions. Only at the end of fermentation was the gradient lowered to 19 g/1 molasses. The ammonia concentration was increased from 0.43 g to 1.7 g/l, and the phosphorus concentration decreased from 0.4 to 0.17&11 over a period of 13 and 14 hours, respectively. During this time, the pH rose from 4.0 to 6.0. At the start, the medium contains: 304 mg/l MgSO, x 7 H,O, 17.5 rng ZnSO, x 7 H,O/I and 739.1 mg Biotin (2%)/1.
Staining Procedures Cells were harvested from batch or fed-batch grown cultures, washed in PBS and resuspended to get a concentration of lo7 cells/ml. An aliquot was fixed for 10 minutes by a 70% ethanol/water mixture (4 "C) and washed twice with 0.5 M carbonate/bicarbonate buffer of pH 9.5, due to subsequent specific staining of sterols with the fluoresceinisothiocyanate marked macrolide nystatin Al, as described previously 15, 161. Due to the heterogeneous composition of the acquired nystatin probes of direrent producers, they were checked by HPLC (RP18, 70% 0.I M Na,HPO, pH 6, 30% acetonitril, 319 nm; p: 80 kgf/cm'). Only the nystatin Al bound the mycosamin, which is necessary for conjugating the fluoresceinisothiocyanate [17]. Samples for DNA staining were treated with 1 mg RNase/ml cell suspension (1 x lo7 cells) for 30 minutes at 30 "C. After that, cells were washed with PBS and stained over night in 1.5 ml of staining solution containing 25 pg ethidium bromide/mlO.l M sodiumcitrate buffer with 0.05 M MgCI, x 6 H,O pH 4.5.

MULLER, S., LOSCHE, A. et al., Flow-Cytometric Investigation of Yeast 367
Before cytometric measurements were done, samples had to be separated from the staining solution and put into PBS to be measured immediately because of changing binding equilibrium. DNA staining with olivomycin was done according to the KUCHENBECKER and BRAUN method [18].
Flow Cytometer Cells were analysed by using our self-made flow cytorneter with an argon ion laser, operating at 488 nm, as described in detail in 119, 201. Forward light scatter (3 to 9.6"), perpendicular light scatter (65 to 1 15") and fluorescence intensities were measured. Fluorescence emission and excitation spectra were recorded with a spectral fluorometer (MPF 2A, HITACHI).
Results and Discussion
Spectral Properties of the Stains Investigated
DNA replication and the degree of ploidy were measured by using ethidium bromide or olivomycin. Both have been proved to be effective stains for some kinds of cells [ 18,211. 3P-Hydroxysterols were measured by using fluoresceinisothiocyanate marked nystatin AI. Nystatin A1 is a polyene with four conjugated double bonds, a iacton ring, and a mycosamin sugar. Nystatin A1 has an increased affinity to ergosterol as compared to other sterols [12,13]. The complex formation of free or yeast membrane bound ergosterol after staining with nystatin A1 was measured (spectral fluorometer) and compared with the complex formation of free cholesterol and nystatin A1 (Fig. 1). The addition of 2 0 0 ~ 1 ergosterol
270 310 350 390 430 470 Wave lenght Lnrnl
Fig. 1. Ergosterol- (- ), cholesterol- ( - - -) and cell bound nystatin (. . . . . .) The fluorescence emission maxima of cell bound macrolides is relatively decreased.

368 Acta Biotechnologica 12 (1992) 5
(1 mg/ml acetone) or 200 pl cholesterol (I mg/ml acetone) to nystatin (2 mg/100 pl dimethyl- formamid and 900 pl 0.5 M carbonat/bicarbonate buffer pH 9.5) causes a considerable increase of the fluorescence intensity, and a change of the fluorescence spectra in comparison to those of free nystatin, cholesterol and ergosterol. After replacing ergosterol and cholesterol by yeast cells (S. cerev. H155, 5 x lo6 cell/ml), and an additional nystatin addition, we could not detect any differences regarding the position of the maxima of membrane bound complexes compared to free complexes. We regard this coincidence of the maxima from sterol-polyene complexes in solution, and of cell bound complexes, as proof of the specificity of the polyene-sterol-bound. The correlations of the ratio of fluorescence excitation intensities for the complex formation nystatin-ergosterol, nystatin-cholesterol and nystatin-membrane sterol, measured at 330 and 310 nm (Aflu.max. = 420 nm),aresimilar (F,,,330/F,,,310 = 1.12; 1.03; 1.12,respectively). The nystatin-ergosterol complexes fluoresceing in the UV region could not be detected by 457 nm or 488 nm, the two shortest wavelength of our cytometer. Therefore, a bathochrome shift to the visible region of the excitation spectrum of nystatin was necessary. This was achieved by binding the fluoresceinisothiocyanate to the aminogroup of nystatin Al. This conjugate has an excitation between 330nm and 500nm (AExmax = 385 -430 nm) and could be excitated using an argon ion laser, both with the 457 nm and 488 nm lines (Fig. 2). The quantum yield of the 488 nm line is much higher than that of the other one. For that reason, better coefficients of variation of histograms were received.
60 . ARGON LASER 488 nm
300 400 500 600 Wave lenght [ n m l
Fig. 2. Excitation and emission spectra of free (-) and FITC-labelled ( - - -) nystatin A1
Batch Cultivation
The experimental aim of the batch cultivation was the determination of the DNA replication and the growth dependent changes of the cellular sterol content. The cultivation showed typical biphasic kinetics. After a lag phase of 1-2 hours, cells grew logarithmically for 7-8 hours (approximately 4-5 doublings in cell number).
MULLER, S., LOSCHE, A. et al., Flow-Cytometric Investigation of Yeast 369
2.5 14
1;
2.0 10
8 . Y
- . - - d s 1.5
3 6 :
a8 - w 0 0 c " 5 1.0 w
4
05 2
0 0 5 10 15 20 25 30 35
Time [ h l
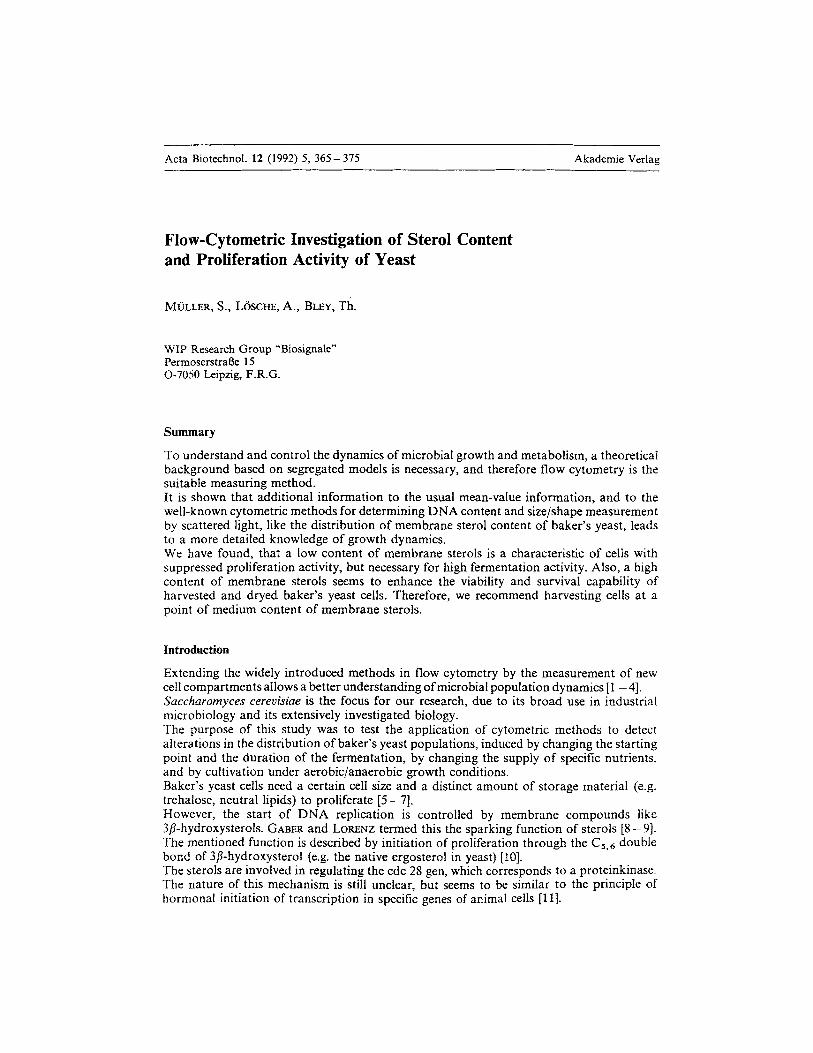
Fig. 3. Batch cultivation of Succhuromyces cereo. HI55 (m) glucose, (0) ethanol
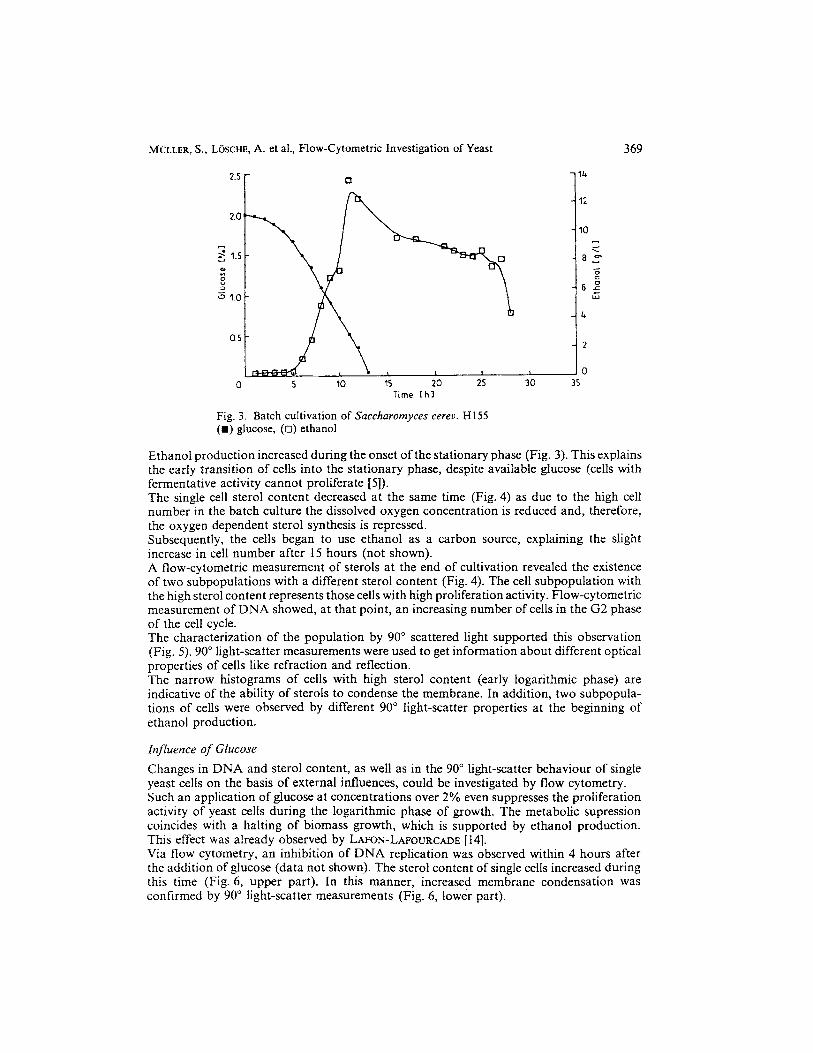
Ethanol production increased during the onset of the stationary phase (Fig. 3). This explains the early transition of cells into the stationary phase, despite available glucose (cells with fermentative activity cannot proliferate [5]) . The single cell sterol content decreased at the same time (Fig. 4) as due to the high cell number in the batch culture the dissolved oxygen concentration is reduced and, therefore, the oxygen dependent sterol synthesis is repressed. Subsequently, the cells began to use ethanol as a carbon source, explaining the slight increase in cell number after 15 hours (not shown). A flow-cytometric measurement of sterols at the end of cultivation revealed the existence of two subpopulations with a different sterol content (Fig. 4). The cell subpopulation with the high sterol content represents those cells with high proliferation activity. Flow-cytometric measurement of DNA showed, at that point, an increasing number of cells in the G2 phase of the cell cycle. The characterization of the population by 90" scattered light supported this observation (Fig. 5). 90" light-scatter measurements were used to get information about different optical properties of cells like refraction and reflection. The narrow histograms of cells with high sterol content (early logarithmic phase) are indicative of the ability of sterols to condense the membrane. In addition, two subpopula- tions of cells were observed by different 90" light-scatter properties at the beginning of ethanol production.
Influence of Glucose
Changes in DNA and sterol content, as well as in the 90" light-scatter behaviour of single yeast cells on the basis of external influences, could be investigated by flow cytometry. Such an application of glucose at concentrations over 2% even suppresses the proliferation activity of yeast cells during the logarithmic phase of growth. The metabolic supression coincides with a halting of biomass growth, which is supported by ethanol production. This effect was already observed by LAFON-LAFOURCADE [14J Via flow cytometry, an inhibition of DNA replication was observed within 4 hours after the addition of glucose (data not shown). The sterol content of single cells increased during this time (Fig. 6, upper part). In this manner, increased membrane condensation was confirmed by 90" light-scatter measurements (Fig. 6 , lower part).
370 Acta Biotechnologica 12 (1992) 5
0 50 100
14 hrs
L 2 l h r s
I 1 hrs K 15 hrs
k 24 hrs
L 50 100
Channel number
Fig. 4. Measurement of sterol content of batch cultured Smcharomyces cereu. HI55
The increased membrane sterol content of the single yeast cell seemed to serve as a protection against high external glucose concentrations, i.e. high osmotic stress, by reducing the membrane fluidity and permeability.
Influence of Sterols on Industrial Yeasts
The flow-cytometric measurement of the single cell sterol content in industrial yeast strains allows a systematic analysis of the fermentation process, and gives further insight into processes occurring in single cells. An important quality characteristic of baker’s yeast is its fermentative activity, measured by (ml produced CO,)/(g biomass x 2 h); i.e. a baker’s yeast of high quality has to fulfil the following conditions: The cells have to stay in the G1 phase of the cell cycle at the time of harvest to ensure an immediate start of fermentation later. Cells in the G2 phase complete the cell cycle before beginning fermentation. That means a loss of time for the user of baker’s yeast.

MULLER, S . , LOSCHE, A. et aI., Flow-Cytornetric Investigation of Yeast 371
21 hrs
k 19 hrs
L 24 hrs
0 50 f00 0 50 ioo Channel number
Fig. 5. Measurement of 90" light scatter behavior of batch cultured Succharomyces cerev. I l l C i
0 50 100 0 50 700 0 50 100 Channel number
Fig. 6. Measurement of sterol content (above) and 90" light scatter (below) of HIS5 cells after C limitation and freshly added glucose (2%) (-) marked cells grown further on the'limited medium ( - - -) marked cells grown on 2% glucose
372 Acta Biotechnologica 12 (1992) 5
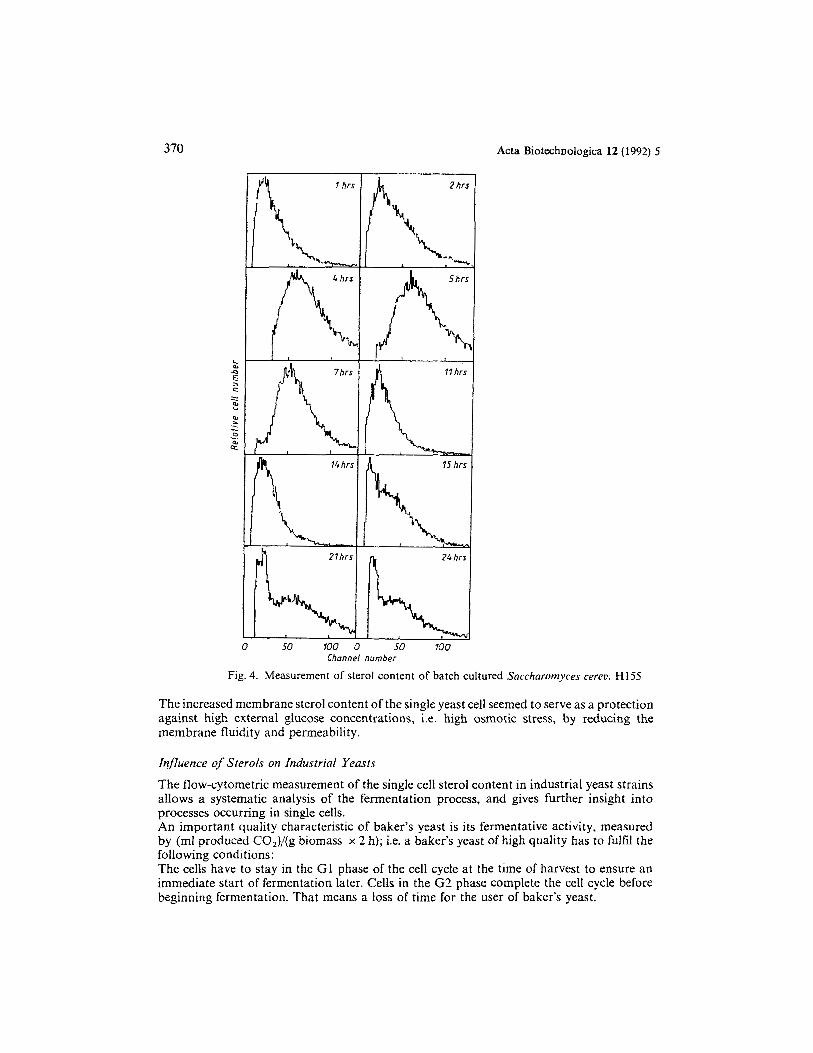
Tab. 1. Different dry baker’s yeast strains (1A - D) are industrial charges of the same strain. (2-6) are different fresh yeast strains. (7 -9) were examined for their fermentation activity according to BRABENDER (Versuchs- anstalt der Hefeindustrie e. V./Berlin). Sterol content is given relatively by maximum channel number. The proportion of the GI to the G2 peak is calculated in percent.
~~~
Yeast Fermentative Sterol DNA Ploidy strain activity content [%] of G2
[ml COJ2 h]
1A 720 35/76 23.5 4 c 1B 875 38/65 52.9 4 c 1 c 985 30157 14.2 4 c ID 1 loo 32/60 17.6 4 c 2 1240 30 11.4 4 c 3 1150 25 8.2 2 c 4 1180 24/50 5.8 2 c 5 1220 36/59 4.1 4 c 6 1240 33/57 5.3 4 c 7 1450 65 4.3 4 c 8 1520 82 5.2 4 c 9 1310 601120 11.2 4 c
A high amount of storage material is necessary to accelerate the fermentative activity. A high viability is as important for fermentative activity as high viability and survival capability. In this regard, ergosterol was described as a survival factor of yeast cells. As shown in Tab. 1, industrially used yeast strains were investigated regarding theiI sterol and DNA content. The amount of storage material was measured, and some conclusions could be drawn via cell size (not shown). Cells with a high amount of storage material are larger then fermenting cells. As observed, the ploidy of cells had no influence on fermentative activity. A high proportion of G2 cells within the yeast population obviously diminished the fermentative activity (e.g. strains 1A and 1B). A direct relationship between fermentative activity and a certain sterol content could not be detected. Still, some strains possessed two subpopulations differing in their sterol content at the time of harvest. Three facts were obtained: The sterol content of dry baker’s yeast is diminished in relation to fresh pressed charges. Yeast populations with a high percentage of G2 cells show bad fermentative activity. The high sterol content of these cells is owed to their proliferation activity. In general, populations with high membrane sterol content, and with almost no celIs in G2, are those with the best fermentative activity. In addition, the specific behavior of the shown yeast strain membranes has to be taken into consideration. The content of membrane sterol differs from strain to strain 115, 221. Therefore, cytometric estimation of yeast fermentative activity is only suitable if different charges of one strain are examined.
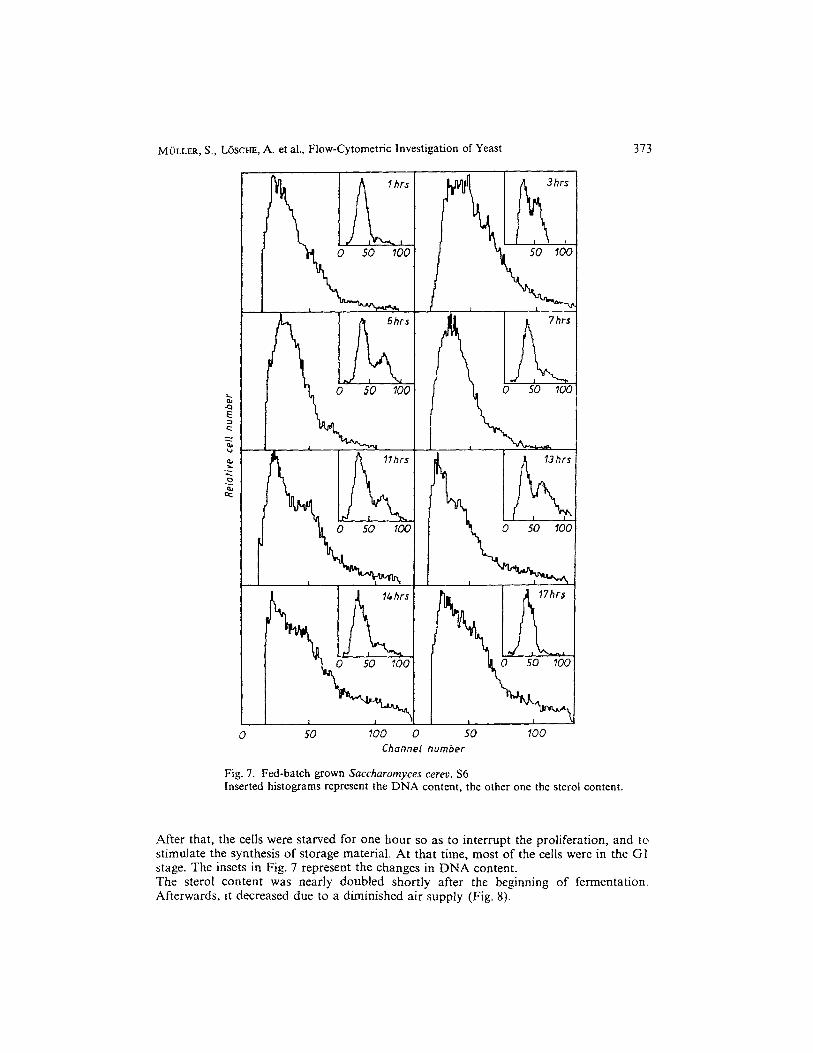
Fermentation of Industrial Baker’s Yeast In order to observe alterations of sterol content during the entire fermentation time, the production process of baker’s yeast was followed in detail by flow cytometry. Samples for DNA, sterol and light scatter measurements were taken over a period of 17.5 hours. Cell proliferation, with doublings in cell number within 60 minutes, took place during the first 6 hours of fermentation (Fig. 7).
MOLLER, S., L~SCHE, A. et al., Flow-Cytometric Investigation of Yeast 373
0 50 100
0 50 100
0 50 loo
14 hrx
0 50 I00
1 I
50 100
@ 50 100
50 100 Channel number
Fig. 7. Fed-batch grown Saccharomyces cerev. S6 Inserted histograms represent the DNA content, the other one the sterol content.
After that, the ceIls were starved for one hour so as to interrupt the proliferation, and to stimulate the synthesis of storage material. At that time, most of the cells were in the GI stage. The insets in Fig. 7 represent the changes in DNA content. The sterol content was nearly doubled shortly after the beginning of fermentation. Afterwards, it decreased due to a diminished air supply (Fig. 8).

374 Acta Biotechnologica 12 (1992) 5
r I I I 1 0 5 10 I5 20
Time Ch I
Fig. 8. Air-supply of the fed-batch fermentation of Sacchoromyces cerev. S6
As a result of the diminished air supply and the resulting food shortage, two yeast populations, varying in their sterol content, have developed (Fig. 7). They could also be detected by 90" light scatter measurements (not shown). At this time, some of cells showed an initial ethanol production. The other cells were able to synthesize sterols, and to proliferate once again, after the end of food shortage (Fig. 7, 8 - 17 hours). A short interruption of air supply led to a decrease in cell membrane sterols during the 131h hour. During this fermentation process, the optimal time to harvest yeast cells was revealed to be at exactly 17 hours after beginning. Only 30 minutes later, parts of the cells were already in the G2 phase (not shown), showing a decreased sterol content due to a decreased oxygen supply (Fig. 8). As a result, the fermentative activity was decreased. The normal industrial process not investigated by flow cytometry was interrupted after 14 hours. Therefore, the percentage of cells in the G2 phase until that time was still high, and the quality of such a baker's yeast charge was diminished.
Conclusions
The intention of the cytometric measurement of changes in DNA, sterol content, and 90" light-scatter behavior of baker's yeast was the development of a method for industrial off-line and on-line process control. The aim of baker's yeast production is to obtain cells with high fermentative activity. Such cells are characterized by an arrest in the G1 phase, a high content of reserve metabolites and 3B-hydroxysterols of membranes. The 3P-hydroxysterols perform two functions; first, the sparking function to initiate proliferation, and second, the bulk membrane or survival function, which is responsible for the protection of cells against outside influences. In this way, the sterol content of cells influences the quantity (proliferation) and the quality (protection) of industrially produced baker's yeast.

M ~ L L E R , S., LOSCHE, A. et al., Flow-Cytometric Investigation of Yeast 375
At the time of harvest, the cells should have a medium sterol content, because they do not perform proliferation, but rather fermentation, if they are to be used as baker’s yeast. Dry baker’s yeast should have a much higher sterol content, due to its rapid decrease through autoxidation to carbon acids during the time of storage. The complexity of running processes in a population is determined by the characteristics of the contained single cells. The fluorescence marking of the 3~-hydroxysterols and DNA content, and their measurement by flow cytometry, offer the possibility of off-line analysis of an industrial process. These results provide new impulses for the design of efficient process control strategies.
Received March 13, 1992
References
[I] BAILEY, J. E., FAZEL-MADJLESSEI, J., MCQUITTY, D. N.: Ann. N.Y. Acad. Sci. 326 (1979), 7. [2] BLEY, Th.: Biotechnol. Adv. 8 (1990), 233. [3] DAIRAKU, K., IZUMOTO, E., MORIKAWA, H., SHIOYA, S., TAKAMATZU, T.: Biotechnol. Bioeng. 24
(1982). 2661. 1987), 399. 41 SCHEPER, Th., HOFFMANN, H., SCHUGERL, K.: Enzyme Microb. Technol. 9
51 MBLLER, S.: Thesis A. Univ. Halle, 1992. 61 HAYLFS, J., NURSE, P.: J. Cell. Sci. 4 (l986), 155. 71 BLEY, Th.: Acta Biotech. 7 (1987), 173. 81 GABER, R. F., COPPLE, D. M., KENNEDY, B. K., VIDAL, M., BARD, M.: Mol
3447. Cell. Biol. 9 (19891,
[9] LORENZ, R. T.; CASEY, W. M., PARKS, L. W.: J. Bacteriol. 171 (1989), 6 169. [lo] NES, W., NUKA, D. H. A., PINTO, W. J.: Lipids 21 (1986), 102. [ I I ] ROSE, A. H.: Yeast 521 (1989), 407. [ 121 DE KRUJIFF, B., GERITTSEN, W. J., OERLEMANS, A., DEMEL, R. A., VAN DEENEN, L. L. M. : Biochim.
[I31 GRASSNER, D.: Z. Naturforsch., Sect. c: Biosci. 38 (1983) 640. [I41 LAFON-LAFOURCADE, S., RIBEREAU-GAYON, P.: Prog. Ind. Microbiol. 19 (l984), 1. [I51 ZIKMANIS, P. B., AUZANE, S. J., AUZIMA, L. P., MARGEVICHA, M. V., BEBER, M. J.: App!. Micro-
[I61 MULLER, S., SCHMIDT, A.: Acta Biotechnol. 9 (1989), 89. 1171 THOMAS, A., PHARM, P., NEWLAND, P., QUINLAN, G. J.: J. Chromdtogr. 216 (1981), 367. [I81 KUCHENBECKER, D., BRAUN, G.: J. Basic Microbiol. 25 (1989, 509. [I91 BRAUN, G., STOLL, P., SCHMIDT, A,: Exp. Techn. Phys. 31 (1983), 435. [20] L~SCHE, A., STOLL, P., MULLER, S., BLEY, Th., SCHMIDT, A.: Exp. Techn. Phys. 3911 (199l), 97. [21] CRISSMANN, H. A., STEINKAMP, I. A.: Cytometry 3 (1982), 84. [22] VOGL, S.: Thesis A., Techn. Univ. Miinchen, 1983.
Biophys. Acta 339 (1974), 8.
biol. Biotechnol. 22 (1985), 265.

![The Sterol Methyltransferases SMT1, SMT2, and … Sterol Methyltransferases SMT1, SMT2, and SMT3 Influence Arabidopsis Development through Nonbrassinosteroid Products1[W][OA] Francine](https://img.pdfslide.us/doc/110x75/5ce0f3ae88c993700d8b6654/the-sterol-methyltransferases-smt1-smt2-and-sterol-methyltransferases-smt1-smt2.jpg)


![Membrány a membránový transport - ulbld.lf1.cuni.cz · STEROL LIPIDS STEROL LIPIDS = lipid molecules with backbone derived from cyclopenta[a]phenanthrene (?) Division according](https://img.pdfslide.us/doc/110x75/5e14db8b3fcccd648c5ac62a/membrny-a-membrnov-transport-ulbldlf1cunicz-sterol-lipids-sterol-lipids.jpg)