Embed Size (px)
Citation preview

Go With the FlowObjective: Students will be able to measure stream velocity and
calculate volume of water in the stream channel to determine flow, also known as discharge.
Location: OutdoorsTime Required: 65 minutesSubjects: Science, MathAlignment to NC Essential Standards for Science:8.E.1Een.2.3.EEn.2.4
Background:Stream flow, or discharge, is the volume of water that moves over a designated point over a fixed period of time. It is often expressed as cubic feet per second (cfs). The flow of a stream is directly related to the amount of water moving off the watershed into the stream channel. It is affected by weather, increasing during rainstorms and decreasing during dry periods. It also changes during the different seasons of the year, decreasing during the summer months when evaporation rates are high and shoreline vegetation is actively growing and removing water from the ground. August and September are usually the months of lowest flow for most streams and rivers in the country. Flow also has a large impact on water quality and the living organisms and habitats within the stream. Large, swiftly flowing rivers can receive pollution discharges and be only slightly affected, whereas small streams have less capacity to dilute and degrade wastes. Stream speed, which increases as the volume of the water in the stream increases, determines the kinds of organisms that can live in the stream (some need fast-flowing areas, others need quiet pools). Stream flow also affects the amount of silt and sediment carried by the stream. Sediment introduced to quiet, slow-flowing streams will settle quickly to the stream bottom. Fast moving streams will keep sediment suspended longer in the water column. Lastly, fast-moving streams generally have higher levels of dissolved oxygen than slow streams because they are better aerated.
Materials: Each group will need: Yardstick for measuring water depth Orange or another floating object Stop watch or watch with second hand Pencil and clipboard Plastic Tape Measure Two flags to mark the stream Copies of the Calculating the Flow Worksheet

Note: It is vital to know the potential upstream contaminants reaching the stream. Animal waste, agricultural runoff (pesticides, herbicides, etc.), industrial wastes, or sewage leaks can be hazards to students and you. If you find a stream with any of the above contaminants, a class must use proper precautions if you decide to collect samples in the stream. Students should wear protective boots, gloves, and goggles when necessary. In case of serious contamination, notify local authorities.
Note: Do not choose a deep pool or riffle. Flowing water is dangerous and students should not be in the water above their knees. If it is moving too fast, do not let the students get in the water. On the other extreme, make sure you have at least a minimal flow of 2 inches, otherwise it will be too shallow to conduct this activity.
Procedures:1. Prior to starting the field portion, lead a discussion on stream flow and its
influences.2. Next head out to the stream site. Divide students into teams of four (4). Each
team should pick a 20-foot section of the stream to work in. Ideally each team should have their own space, but if that is not possible due to accessibility have two teams share the same 20 foot section, but run the test separately. Hand out one set of materials to each team and a copy of the Calculating Stream Flow Worksheet to each person.
AREA3. Each team will now calculate the area of a stream cross section in square
feet. (Area = depth x width) Measure the depth of the stream by starting at the water’s edge and moving across the stream taking several measurements along the way. Then take the average of the depth measurements. Record results on the calculating stream flow worksheet.
4. Next run the tape measure across the stream (from water’s edge to water’s edge). Measure the width of the stream at two locations. Take the average of

the two measurements. Record results on the calculating stream flow worksheet.
5. Multiply the average width and average depth of your stream to determine its area in square feet. Record results on the calculating stream flow worksheet.
SPEED6. Next, each team will calculate the speed of a stream by measuring the rate
at which it flows in feet per second (ft/sec). 7. Starting from the point where the stream area measurements were taken,
mark off a 20-foot section downstream using flags or have two students hold each end of the measuring tape.
8. Each team member picks one of the following jobs: starter, timer, catcher, and recorder. The starter stands at the upstream flag and the catcher stands at the downstream flag with the timer and recorder.
9. Using a stopwatch, the timer will measure how many seconds it takes an orange to float a 20-foot distance. An orange is a good object to use because it has enough buoyancy to float just below the water surface. It is at this position that maximum velocity typically occurs.
10. The starter should position the orange so that it flows into the fastest current. The catcher catches the orange as it passes the downstream flag. The recorder should record the time measured.
11. This "time of travel" measurement should be conducted at least three times and the results averaged – the more trials you do, the more accurate your results will be.
12. Discard any float trials in which the object gets hung up in the stream (by cobbles, roots, debris, etc.).
13. After obtaining the average time, divide the distance in feet by the number of seconds it took the orange to travel that distance. Record results on the “Calculating Stream Flow” worksheet. This is the speed in feet per second.
FLOW14. Scientists have determined that a coefficient or correction factor
is needed for streams due to fact that water at the surface travels faster than near the stream bottom due to resistance from gravel, cobble, etc. By multiplying the surface velocity by a correction coefficient, it decreases the value and gives a better measure of the stream's overall velocity. The coefficient or correction factor is 0.8 for rocky-bottom streams or 0.9 for muddy-bottom streams.
15. To determine flow rate, multiply your stream area by your stream
COEFFICIENT = 0.9 for muddy-bottom streams
COEFFICIENT = 0.8 for rocky-bottom streams

speed. Then multiply that answer by the coefficient, depending on whether you have a rocky or muddy bottom stream.
Here is another way to express flow: FLOW = ALC/ T
A = Average cross-sectional area of the stream in feet (average stream width multiplied by average water depth).
L = Length of the stream reach measured (usually 20 ft.)C = Coefficient (0.8 for rocky-bottom streams or 0.9 for muddy-bottom
streams). T = Time, in seconds, for the float to travel the length of L.
16. Enter your results on the “Calculating Stream Flow” worksheet17. Once all the groups have completed their measurements,
compare the results. Were all the results the same or different? If different, what might have caused them to be different? (possible answers: slope, width of stream, objects in the channel, deep verses shallow water, gravel substrate verses sandy substrate)
Evaluate:For grades 8 - 9:
1. Calculate the velocity of the stream if the orange floats at a rate of 100 feet in 1.5 minutes.
2. Calculate the flow rate of a muddy bottom stream if the average width is 5.5 ft and average depth is 17 inches and the orange floats at a rate of 67 ft in 2.4 minutes.
3. What does the flow tell you about the watershed? 4. What unit is flow measured in? 5. When velocity increases in a stream, what happens? 6. What factors contribute to an increase in water flow?
For grades 9 - 12:
1. If the average depth of the stream is 4 ft and width is 7.5 ft and it took the orange 10 seconds to travel the 10-foot length of the stream, what is the volume?
2. If two streams drain equal sized and comparable watersheds, and one watershed is forested while the other is urban, which will have a greater discharge of water? Why?
Extension:
FLOW = AREA X SPEED X COEFFICIENT

1. In the last step, the students compared their results and hypothesized what caused them to be different. As an extension, have the students investigate streams in their community noting changes that might have been made to them and how it has affected stream flow. Also have the students look at what are some of the consequences that occur as a result of those changes to the stream.
2. Have students convert the various measurements to metric.
Adapted from Georgia Adopt-A-Stream Educator’s GuideBased on Georgia Adopt-A-Stream Visual Stream Survey procedures.
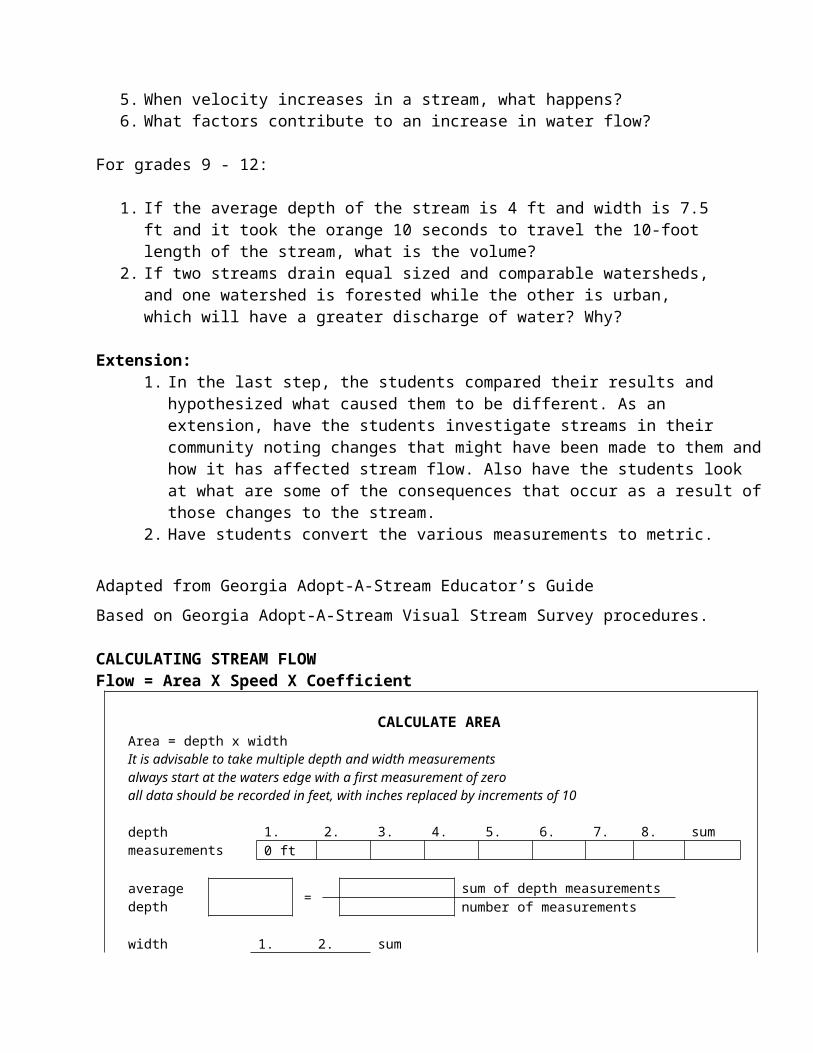
CALCULATING STREAM FLOWFlow = Area X Speed X Coefficient
CALCULATE AREAArea = depth x widthIt is advisable to take multiple depth and width measurementsalways start at the waters edge with a first measurement of zeroall data should be recorded in feet, with inches replaced by increments of 10
depth measurements 1. 2. 3. 4. 5. 6. 7. 8. sum0 ft
average depth = sum of depth measurements
number of measurements
width measurements 1. 2. sum
average width =
sum of width measurementsnumber of measurements
Area = width X depth
CALCULATE SPEED-measure the time it takes a float to travel a desired distanceIt is advisable to take at least 2 measurements of current speedtake measurements from the stream run
length in feet 20 feet is recommended
time in seconds 1. 2. 3. 4. sum
average time = sum of time measurementsnumber of measurements
Speed = length in feet
average time in seconds
CALCULATE STREAM FLOW
Flow cfs = Area X Speed X Coefficient
Flow in cubic feet per second .9 coefficient for muddy bottom stream.8 coefficient for rocky bottom stream

Measuring Channel Cross-SectionObjective: Students will document changes in stream-channel shape,
or stream profile, by measuring the stream channel cross-section.
Location: Outdoors at local streamTime Needed: 60-90 minutesSubjects: Science, MathAlignment to NC Essential Standards for Science:8.E.1Een.2.3.EEn.2.4
Background:Water is a naturally eroding agent of soil. Over time, streams and rivers carve out their unique path and shape. However, human activities have altered the shape and path of many waterways by straightening them out or reducing their floodplain areas. By measuring the cross section of a waterway, scientists have been able to monitor changes in stream shape, also called profile.
Materials: 100-foot engineering measuring tape (has feet marked off in
tenths) 8- to 10-foot measuring stick in increments of feet and tenths
(you can construct one from materials available at the hardware store)
Thick twine (preferably non-stretch builders’ quality) Line level 2- to 3-foot lengths of rebar, nails and hammer (for first measurement) Clips or vise grips to fix tape to rebar or nails. Stream Channel Cross-section Measurement Data form and graph
paper Pencil
Note: Why feet in tenths? Engineering tape measures have feet graduated in tenths instead of inches. When stream cross-sections are “professionally” conducted, engineering tape is used. If you wish to use inches or metrics, that is fine, just remember to use the same measuring units each time! Procedure:
1. Locate a representative section of your stream. Make sure there are no stream hazards—think safety first! Ideally, your site will have some kind of permanent marker that will help you identify it in the future, e.g. a large tree, concrete structure, etc. If a permanent marker is not available, use rebar to mark the endpoints on each bank. The end

points should be set back from your stream, behind the bankfull stage on either side.
End points should be set back from the bank so that if erosion occurs, you will be able to capture that measurement the next time.
2. Stretch your twine between your permanent markers. Using the line level, make sure the twine is perfectly level. If the twine is not level, your vertical measurements (elevation) will not be accurate. Stretch the measuring tape between both endpoints directly beside your twine. Attach the zero end of the tape to the left permanent marker (when looking downstream). Stretch the tape tight and level above the water. You will be taking vertical measurements from the stream substrate to the twine and horizontal measurements along the measuring tape.
3. Starting with the left endpoint at zero, measure horizontal distance along the measuring tape every 2 feet and at each significant stream feature. This includes drops in the streambed or sides, bankfull stage, edge of water, deepest point, sandbars, etc. At those horizontal distances, measure the vertical distance (or elevation) from bank or stream bottom to twine. All measurements are taken from the left bank, when facing downstream. All data should be recorded in feet, with inches replaced by increments of 10. Continue across the channel to the right endpoint. Under Comments, note when you are at the bankfull stage, edge of water and other significant features.
Eying line level to ensure accurate measurements

4. Record the distance and elevation measurements.
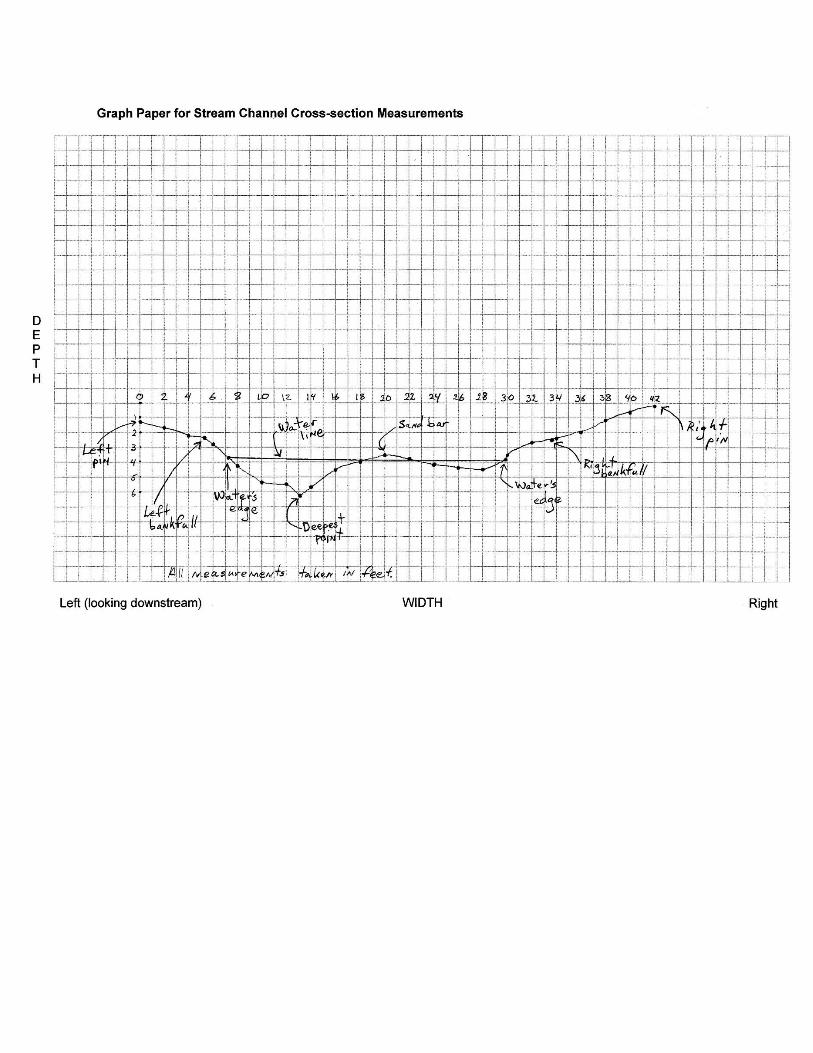
5. On a sheet of graph paper, graph your stream profile to compare future and past measurements. Be sure to include left and right bankfull, water’s edge and sand bars.
Evaluate:1. Ask the students to discuss what causes erosion of the banks. What
causes deposition of sediment?2. Do the students expect to see changes in the shape of the stream over
time? Why?3. Ask the students to calculate discharge using the measurements
obtained in the cross-section.4. Why does the y axis start with zero at the top?
Adapted from Georgia Adopt-A-Stream Educator’s GuideBased on Georgia Adopt-A-Stream Visual Stream Survey procedures.
Stream profile depth measurements every 2 feet and at each important stream feature

Stream Channel Cross-section Measurement DataGroup:
Date:
Location:
CROSS-SECTION CROSS-SECTIONDistance from LEFT Pin
Measurement Depth Comments Distance from
LEFT Pin Measurement Depth Comments
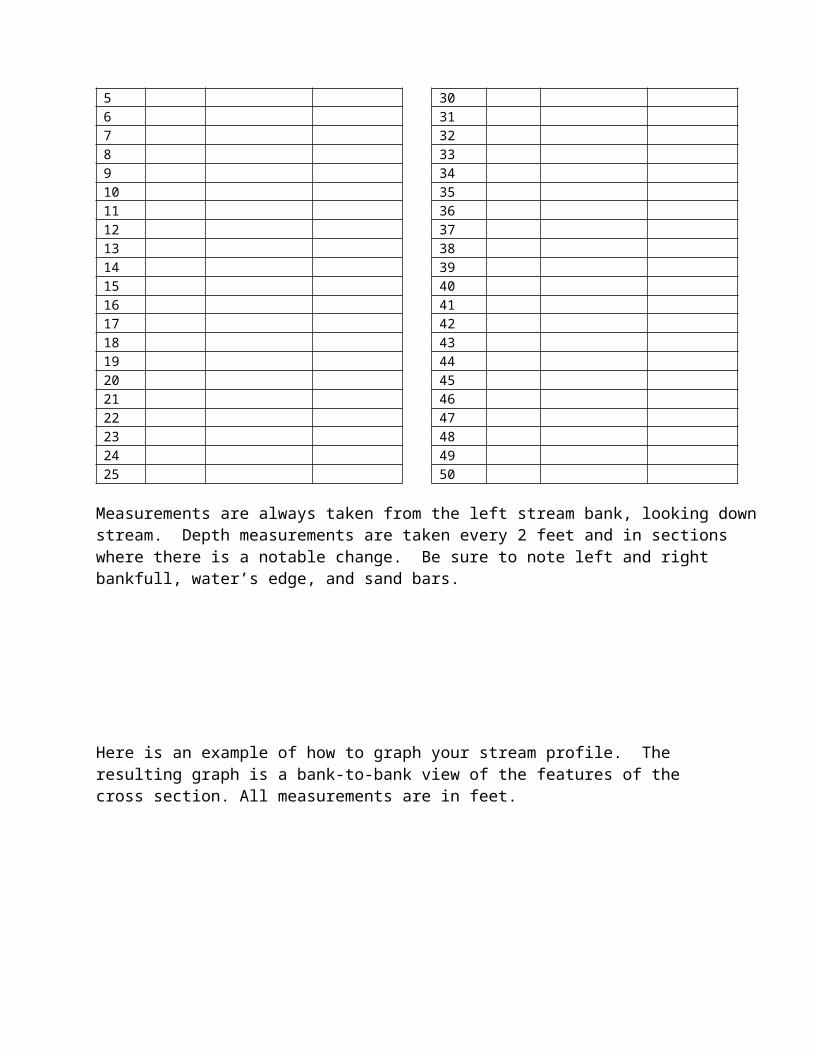
Point Ft. Ft. Point Ft. Ft.1 262 273 284 295 306 317 328 339 3410 3511 3612 3713 3814 3915 4016 4117 4218 4319 4420 4521 4622 4723 4824 4925 50
Measurements are always taken from the left stream bank, looking down stream. Depth measurements are taken every 2 feet and in sections where there is a notable change. Be sure to note left and right bankfull, water’s edge, and sand bars.
Here is an example of how to graph your stream profile. The resulting graph

is a bank-to-bank view of the features of the cross section. All measurements are in feet.
How Much Water Falls Here?Objective: Students will calculate the volume of water that falls
onto an area of the school parking lot. Location: Indoors/OutdoorsTime Needed: 90 minutes (can be divided into two class sessions)Subjects: Science, MathAlignment to NC Essential Standards for Science:8.E.1Een.2.3.EEn.2.4
Background:When it rains, where does the water go? Some of it is absorbed by the soil and plants, some is evaporated back into the air and some runs off the land. When it rains in areas with lots of impervious surface (parking lots, roofs, roads), water runs off to storm drains and drainage ditches, often at a fast rate because it is not absorbed into the ground. Urbanization and other development often adversely affect stream health by increasing the volume of surface runoff entering a local waterway. Urban stormwater runoff may contain sediment, debris, oil, gasoline, and heavy metals (nonpoint source pollution) that it has picked up after traveling over impervious surfaces. When potential pollutants are transported quickly from the land to a waterway, this can cause a phenomenon called “shock loading.” Shock loading is the overloading of water with nutrients, sediment, oil, etc, over a very short period of time giving the organisms little time to adapt to the changes in their environment. Shock loading can result in fish kills or algal blooms depending upon the type of pollutants in the runoff. For example, suspended materials in the runoff can also absorb and store heat that increases the water temperature.
Materials: Yardstick Trundel wheel (optional)
Writing materials Local rainfall data Tape measure Clipboards (optional) Graph paper Calculators
Rulers Long piece of twine (meter and foot intervals)
Preparation:Check online to find out the average annual rainfall for your area.

Procedures: Explain to the students they are going to calculate the volume of runoff from the school parking lot that flows to the nearest stream.
1. Divide the class into teams of 3-5 students.2. Draw a sketch of the parking lot on the board. Have each team
select an area they wish to measure. If the lot has multiple sections, give each group a certain area to measure. Note: Make sure the students use the same measurements (feet or meters).
3. Have the students go outside and take needed measurements. Transfer all measurements to the sketch on the board.
4. Have students copy a sketch of the parking lot with all measurements on a regular piece of paper (Grades 6th - 8th) and/or to scale on graph paper (Grades 9th - 12th).
5. Have each team determine the direction the water runs off the parking lot and locate the nearest stream. Note: A map can be used to find the stream, if the stream is not next to the parking lot. Remember, if the stormwater flows into a storm drain, the drain pipe will lead to the closest stream or drainage ditch.
6. Have the students estimate the area of the parking lot. For example:
Square: Area = Length X WidthTriangle: Area = ½ Base X Height
The values should be in the units the students measured on the parking lot.Add together all the individual shapes’ areas to find the total area of the parking lot.
7. Determine the volume of rain falling on the parking lot annually by multiply the average annual rainfall (convert to feet or meters) by the overall area of the parking lot (square feet or meters). Volume should be recorded in cubic feet (ft3) or cubic meters (m3).
Discussion:1. Where does the runoff from the parking lot go?2. What route does the runoff take? (Storm drain, drainage ditch, stream,
culvert) Is the area from the parking lot to the nearest stream vegetated or paved? If both, estimate percentage of each.
3. Brainstorm ways to slow the flow of water coming from the school’s parking lot to the stream (rain gardens, rain barrels, increase permeable surfaces).

Evaluate:
The following conversions are useful: ______________________________________ 1 ft3 = 7.2827 gallons
1 m3 = 1,000 liters 5 minute shower = 25 gallons or 95 liters Density of water = 1 gallon = 8.34 lbs.
1 liter = 1 kg. _____________________________________
1. Have students calculate the following:
Average annual rainfall: ______________ inchesConvert rainfall from inches to feet
______________ ft (X 1ft/12in.)
Surface Area of Parking Lot ______________ ft2
Volume of runoff ______________ ft3
Convert volume of runoff to gallons
______________ gallons of runoff
Determine how many 5 min. showers can be taken with the amount of runoff
______________ showers
If you took a shower every day, how long would it take to shower this many times?
______________ years
Determine the weight of runoff in lbs.
______________ lbs.
2. Compare the estimates with each other to see the variations in values.

Adapted from Georgia Adopt-A-Stream Educator’s GuideBased on the Environmental Resource Guide.