Embed Size (px)
Citation preview
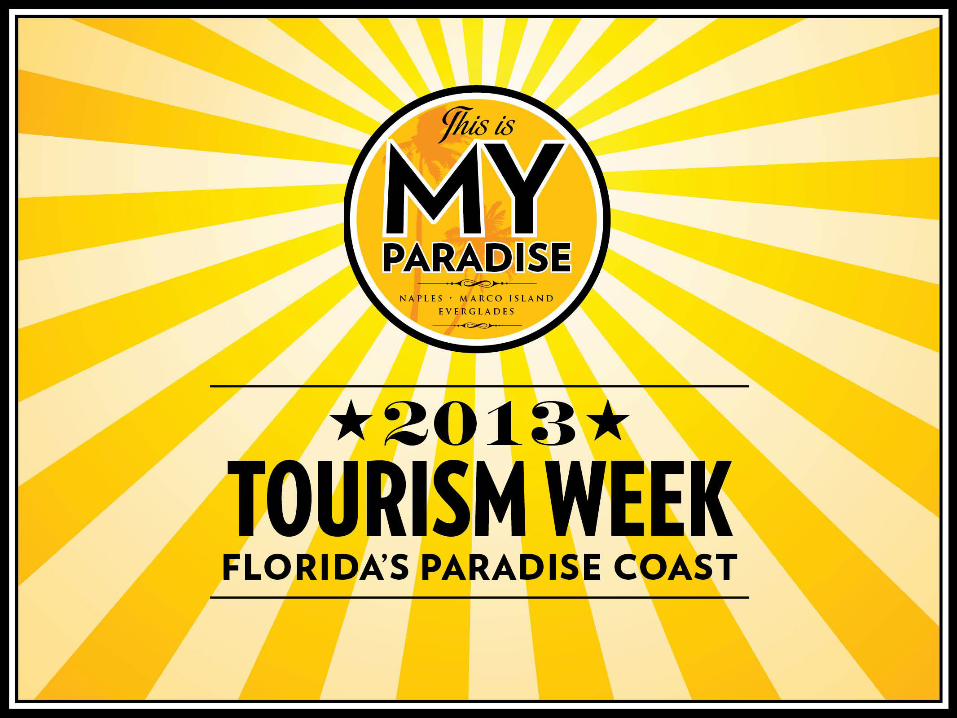

Florida’s Paradise Coast
Leading the Way to Prosperity

Ten Years in Review
Measure 2003 2013
Average Daily Rate $130.32 $166.10
Overnight Visitors 1,312,987 1,573,000
Direct Expenditures $581.5 M $962.5 M
Economic Impact $885.1 M $1,435.1 B
Tourist Tax Revenue $8.628 M $15.146 M
Source: Research Data, Inc; Collier Tax Collector

Excellent Growth in 2012 • # Visitors 1,573,000 +5.6%
• Direct Visitor Expenditures $962,491,300 +11.2%
• Economic Impact $1,435,074,518 +11.2%
• Tourist Tax Revenue $15,145,899 +9.7%
• Annual Hotel Occupancy 68.9% + 2.2 pts or 3.3%
• Annual Average Rate (ADR) $166.10 +$10.3 or 6.6%
• Tourism Industry Jobs 32,300 + 1,700 or 5.6%
• Visitor Sales & Gas Tax $91,870,600 +11.2%
• Tax Savings per Household $690 +11.3%
• Source: Research Data Services 2013

More Visitor Stats- 2012
• Length of Stay 4.6 Days
• Party Size 2.6 People
• First Time Visitors 39.7%
• Average Age 47.7
• Household Income $143,441
• Recommend Paradise Coast 94.3%
• Influenced by Collier Message 41.9%
• ROI (Visitor Spend vs. Ad Spend) $40.79 ($31.22 FY 11)
• Source: Research Data Services, Inc. 2013

International Visitation 2012 • UK/Ireland 102,280 +14.7% • Germany 99,363 +20.7% • France 12,288 +34.1% • Switzerland 10,044 +64.4% • Scandinavia 8,751 +95.3% • Netherlands 7,864 +1.6%
• Total International Visitation 240,590 +18.1% • Direct Visitor Expenditures $197,013,700 +25% • UK Ireland Room Nights 42,858 + 19% • European Room Nights 30,198 + 18%

Most Popular Activities • Beach Activities 74.1% • Dining Out 67.2% • Relaxing 54.9% • Pool 40.5% • Shopping 37.7% • Sightseeing 25.3% • Swimming 23.2% • Nature/Everglades 20.7%
• Source: Research Data Services 2013

* Source: Florida Department of Economic Opportunity, Labor Market Information, Current Employment Statistic Program (CES), Collier County Leisure and Hospitality Sector (04-15-13). (In first quarter of 2013, 2011 and 2012 data was revised.)
Jan. Feb. Mar. Apr. May Jun. Jul. Aug. Sep. Oct. Nov. Dec
2011 23,700 24,200 24,600 24,100 22,400 20,900 20,400 20,300 20,400 21,900 23,600 24,200
2012 25,300 25,800 25,900 25,100 23,600 22,300 21,100 20,900 20,900 22,300 24,300 25,200
2013 25,500 26,300
18,000
19,000
20,000
21,000
22,000
23,000
24,000
25,000
26,000
27,000
28,000
Mo
nth
ly D
ire
ct L
eis
ure
an
d H
osp
ita
lity
Em
plo
ym
en
t
Collier Direct Leisure and Hospitality Employment (Calendar Year)*
2013 2012
2011

Direct Sales Results • 191 RFP’s distributed to area group hotels
– 58 of those RFP’s were booked (30%) – Resulting Room Nights = 15,765 – Room/F&B Revenue = $15,807,161 – Economic Impact $36,052,587
• Total Group Meeting Impact – 342,900 meeting visitors – 685,800 Room Nights – $198.9 Million Direct Expenditures – $295.5 million economic impact – $4.9 million in TDT Revenue

Public Relations Results

Sports Marketing Results
• Sports Event Impact in 2012
• 24 Sports Events Attracted or retained
• 17,589 event visitors; 7,036 participants
• $5,563,142 total direct visitor spending
• 9,351 Total event hotel room nights

Film & Entertainment PROJECTS WRAPPED: 32 # EXPENDITURES • Print 15 $887,000 • TV comm. 5 $233,000 • TV episode 8 $556,000 • Film 2 $ 4,200 • Other 2 $ 8,000

Q 1 2013 Results

$1,276,477
$2,057,493
$2,396,642
$0
$500,000
$1,000,000
$1,500,000
$2,000,000
$2,500,000
$3,000,000
Tourist Tax Revenue
Jan-13 Feb-13 Mar-13
$88,346,300
$134,053,000
$175,696,600
$0
$50,000,000
$100,000,000
$150,000,000
$200,000,000
Direct Visitor Expenditures
Jan-13 Feb-13 Mar-13
$181,867
$422,036
$172,095
$0
$100,000
$200,000
$300,000
$400,000
$500,000
Destination Marketing $$ Spent
Jan-13 Feb-13 Mar-13
$115.94
$0.00
$50.00
$100.00
$150.00
Return on Investment
Jan-13-March 2013

75.80% 89.60% 93.40%
0.00%
20.00%
40.00%
60.00%
80.00%
100.00%
Lodging Occupancy
Jan-13 Feb-13 Mar-13
$178.30
$275.50 $288.30
$0.00
$50.00
$100.00
$150.00
$200.00
$250.00
$300.00
$350.00
Average Daily Lodging Rate
Jan-13 Feb-13 Mar-13
43,928 51,671 41,730
0
500
1,000
1,500
2,000
2,500
3,000
3,500
4,000
0
10000
20000
30000
40000
50000
60000
1/1
/20
13
1/3
/20
13
1/5
/20
13
1/7
/20
13
1/9
/20
13
1/1
1/2
01
3
1/1
3/2
01
3
1/1
5/2
01
3
1/1
7/2
01
3
1/1
9/2
01
3
1/2
1/2
01
3
1/2
3/2
01
3
1/2
5/2
01
3
1/2
7/2
01
3
1/2
9/2
01
3
1/3
1/2
01
3
2/2
/20
13
2/4
/20
13
2/6
/20
13
2/8
/20
13
2/1
0/2
01
3
2/1
2/2
01
3
2/1
4/2
01
3
2/1
6/2
01
3
2/1
8/2
01
3
2/2
0/2
01
3
2/2
2/2
01
3
2/2
4/2
01
3
2/2
6/2
01
3
2/2
8/2
01
3
3/2
/20
13
3/4
/20
13
3/6
/20
13
3/8
/20
13
3/1
0/2
01
3
3/1
2/2
01
3
3/1
4/2
01
3
3/1
6/2
01
3
3/1
8/2
01
3
3/2
0/2
01
3
3/2
2/2
01
3
3/2
4/2
01
3
3/2
6/2
01
3
3/2
8/2
01
3
3/3
0/2
01
3
Daily/Monthly Unique Website Visitors
January Unique Visitors February Unique Visitors March Unique Visitors Unique Visitors
© Research Data Services, Inc. 2013
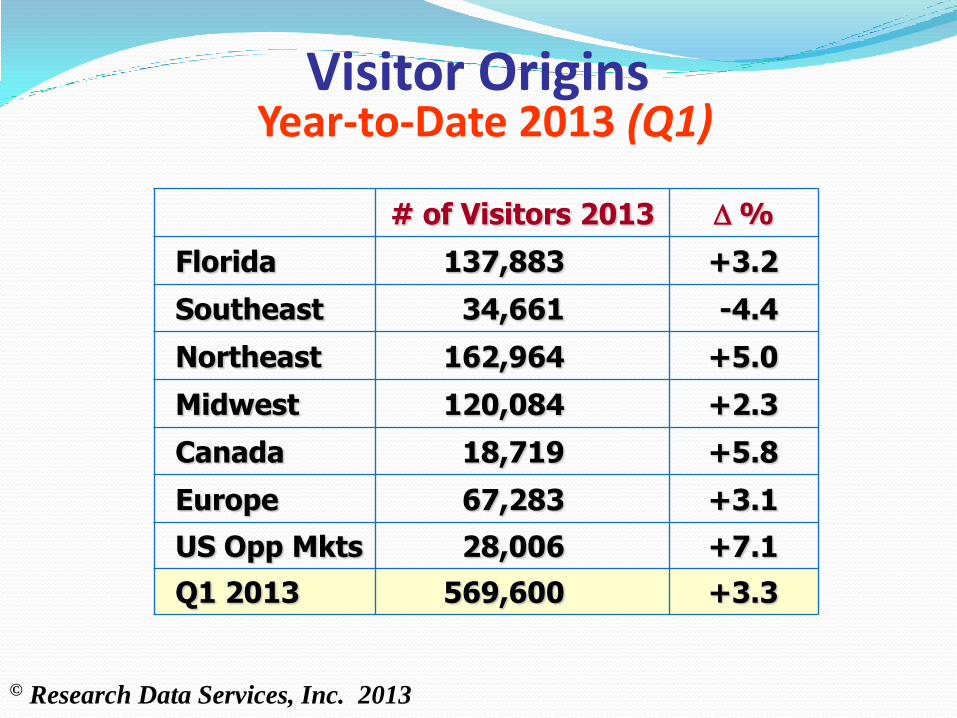
Visitor Origins Year-to-Date 2013 (Q1)
# of Visitors 2013 D %
Florida 137,883 +3.2
Southeast 34,661 -4.4
Northeast 162,964 +5.0
Midwest 120,084 +2.3
Canada 18,719 +5.8
Europe 67,283 +3.1
US Opp Mkts 28,006 +7.1
Q1 2013 569,600 +3.3

Smith Travel Occupancy March 2013
Occupancy (%)
Trans % D 12-13 Grp % D 12-13 Total
Naples MSA 57.3% +12.3% 29.8% -6.6% 87.6%
Miami-Hialeah 60.1% +7.1% 25.2% -0.4% 89.1%
Florida Keys 83.0% +3.6% 7.8% -11.2% 91.0%
Ft. Myers 69.3% +9.3% 13.1% -25.2% 85.9%
Sarasota-Bradenton 64.4% -1.7% 22.3% +2.0% 86.9%
Clearwater 67.9% +4.1% 19.5% -19.7% 87.4%
St. Petersburg 61.7% -1.3% 23.9% -0.8% 86.9%
Palm Bch Cty 60.0% +9.4% 23.7% -19.2% 86.5%
Ft. Lauderdale 60.5% +2.7% 21.5% +8.8% 88.4%
SOURCE: SMITH TRAVEL RESEARCH, INC.

ADR ($)
Trans % D 12-13 Grp % D 12-13 Total
Naples MSA $308.68 +14.5% $215.68 +1.3% $276.18
Miami-Hialeah $259.83 +15.1% $210.43 +11.0% $238.12
Florida Keys $301.68 +9.2% $265.56 +9.9% $298.26
Ft. Myers $202.75 +4.4% $138.27 +10.3% $187.14
Sarasota-Bradenton $176.29 +9.7% $109.56 -8.3% $158.84
Clearwater $176.89 +7.8% $122.35 +8.0% $164.73
St. Petersburg $165.23 +11.2% $146.30 +0.5% $159.00
Palm Bch Cty $229.39 +9.6% $174.25 +6.1% $208.93
Ft. Lauderdale $160.85 +11.1% $160.30 +3.4% $153.34
Smith Travel ADR March 2013
SOURCE: SMITH TRAVEL RESEARCH, INC.

Smith Travel Occupancy/ADR March 2013
Occupancy ADR RevPAR
2013 % D 2013 % D 2013 % D
Naples MSA 87.6% +3.8% $276.18 +12.7% $241.81 +17.0%
Naples Upscale 92.4% +1.5% $370.10 +16.8% $341.92 +18.6%
Miami-Hialeah 89.1% +4.1% $238.12 +14.4% $212.20 +19.1%
Florida Keys 91.0% +2.2% $298.26 +9.4% $271.34 +11.8%
Ft. Myers 85.9% +1.7% $187.14 +7.2% $160.77 +9.0%
Sarasota-Bradenton 86.9% -1.4% $158.84 +6.3% $138.10 +4.9%
Clearwater 87.4% -2.4% $164.73 +9.6% $143.95 +7.0%
St. Petersburg 86.9% -1.1% $159.00 +8.2% $138.20 +7.1%
Palm Beach County 86.5% +1.7% $208.93 +8.7% $180.66 +10.6%
Ft. Lauderdale 88.4% +5.0% $153.34 +8.6% $135.53 +14.1%
SOURCE: SMITH TRAVEL RESEARCH, INC.

Chicago Outdoor
Winter 2013 Campaign

New York Transit

eScapes Consumer & Meetings Email Campaign
SUNSHINE, FRESH AIR AND THE MOST
PRODUCTIVE MEETING EVER.
We have just what the doctor ordered for your next medical meeting. Florida’s Paradise
Coast offers everything to unite and motivate your group, from inspiring team-building
adventures to unforgettable experiences on Gulf of Mexico beaches. Also discover top
meeting properties for every budget, irresistible incentives and easy access with non-stop
flights from 41 destinations. So for a healthy ROI, plan on paradise.
The Naples, Marco Island, Everglades Convention and Visitors Bureau will be hosting
special events this spring and look forward to meeting you in person in Philadelphia on
February 27 and Atlanta on March 7. For details, email
Reserve your place in paradise
HOTELS DEALS VENUES FREE SALES TOOLS
FEATURED MEETING AND CONFERENCE HOTELS:
DISCOVER AN ISLAND FOR TWO.
Forget about having the beach to yourself. Have a whole island to yourself in the famed
Ten Thousand Islands. Rekindle romance under breathtaking sunsets. Be pampered
shamelessly at world-class resorts. Relax and play on warm, sun-kissed beaches. Whether
you’re planning a Valentine’s Day escape or just a romantic getaway, Florida’s Paradise
Coast is ready to make you fall in love all over again.
Reserve your place in paradise
HOTELS ROMANCE VIDEOS PLAN NOW
VISIT-WORTH Y EVENTS
EVERGLADES SEAFOOD FESTIVAL
FEBRUARY 8-10
Taste the sweet life in Everglades City, the “Stone Crab Capital
of the World” for incredible seafood fresh from the Gulf of
Mexico, live music, arts, crafts, rides and more.
Learn more
PGA ACE GROUP CLASSIC TOURNAMENT
FEBRUARY 12-17
WHERE TO STAY
PORT OF THE ISLANDS EVERGLADES
ADVENTURE RESORT
It’s a new year and time for new experiences. Come stay right in
the heart of the Everglades and explore its unique ecosystem.
Featuring guest quarters, on-site dining, full-service marina and
much more. Contact our Wilderness Concierge to help arrange
your Everglades tour.
RATES FROM $149. LEARN MORE
HILTON MARCO ISLAND BEACH RESORT AND
SPA
Treat yourself to the Island Escape Inclusive package from this
Four Diamond beach resort. Enjoy a rate of $199 per night for
spacious, modern junior suite accommodations; complimentary
hot breakfast buffet for two each day ($40 value); unlimited high
speed Internet access ($10 value); beach umbrella ($20 value);
and daily parking ($10 value).
LEARN MORE ABOUT THE ISLAND ESCAPE
INCLUSIVE PACKAGE
MARCO BEACH OCEAN RESORT
Experience the perfect vacation in paradise at this Four Diamond
all-suite resort on four miles of gorgeous beach. Elegantly
appointed suites feature kitchens and balconies with shimmering
Gulf of Mexico views. Enjoy exceptional service, dining, spa
and pool within steps and nearby golf, tennis and shopping.
RATES START AT $159. LEARN MORE
SEE ALL HOTELS AND RESORTS
This is the official e-newsletter for the Naples, Marco Island, Everglades
Convention & Visitors Bureau. All materials copyright © 2013 by Naples, Marco
Island, Everglades Convention and Visitors Bureau, 2800 N. Horseshoe Dr.,
Naples, Florida, 34104. All rights reserved.
Unsubscribe Privacy Policy Forward to a friend

Orbitz.com
Weather.com
Weather.com
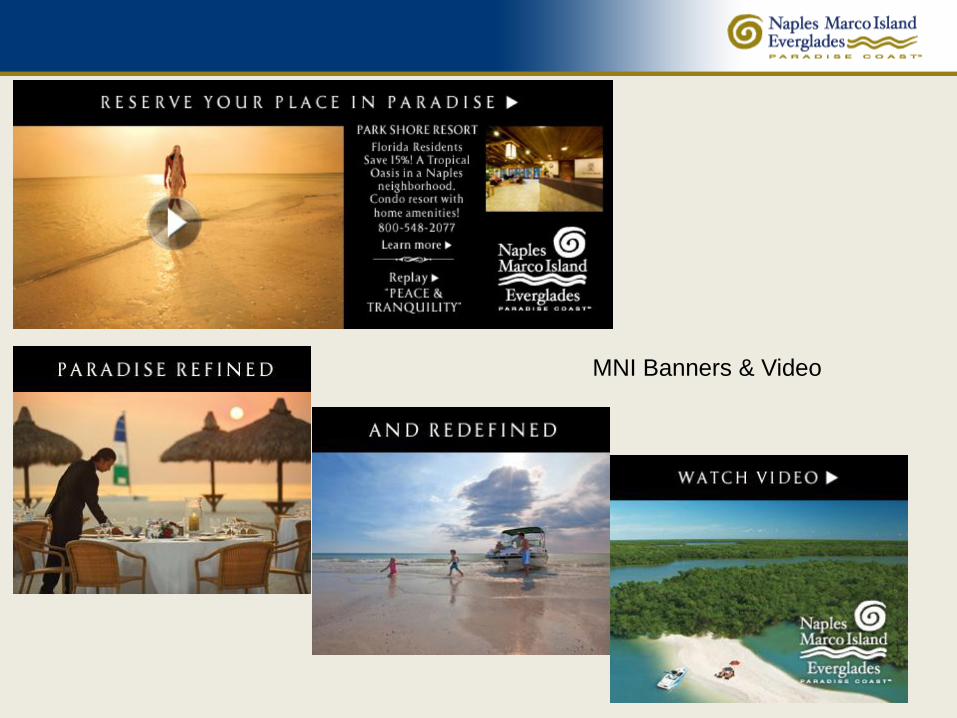
MNI Banners & Video
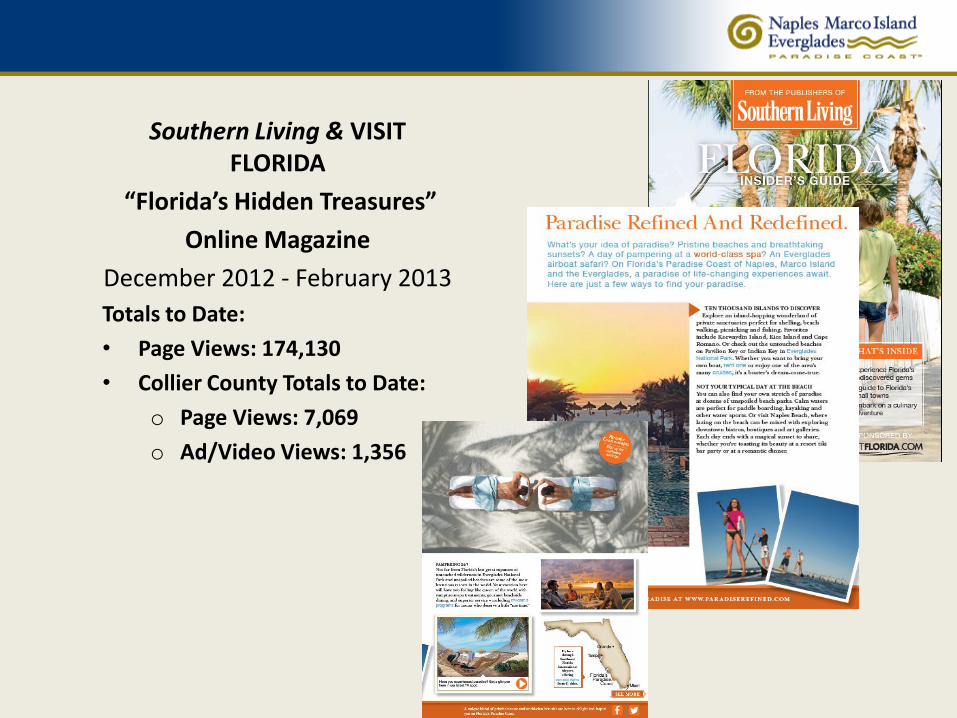
Southern Living & VISIT
FLORIDA
“Florida’s Hidden Treasures”
Online Magazine
December 2012 - February 2013
Totals to Date:
• Page Views: 174,130
• Collier County Totals to Date:
o Page Views: 7,069
o Ad/Video Views: 1,356

ParadiseRefined.com – Landing Page

Spring/Summer 2013 Weather.com
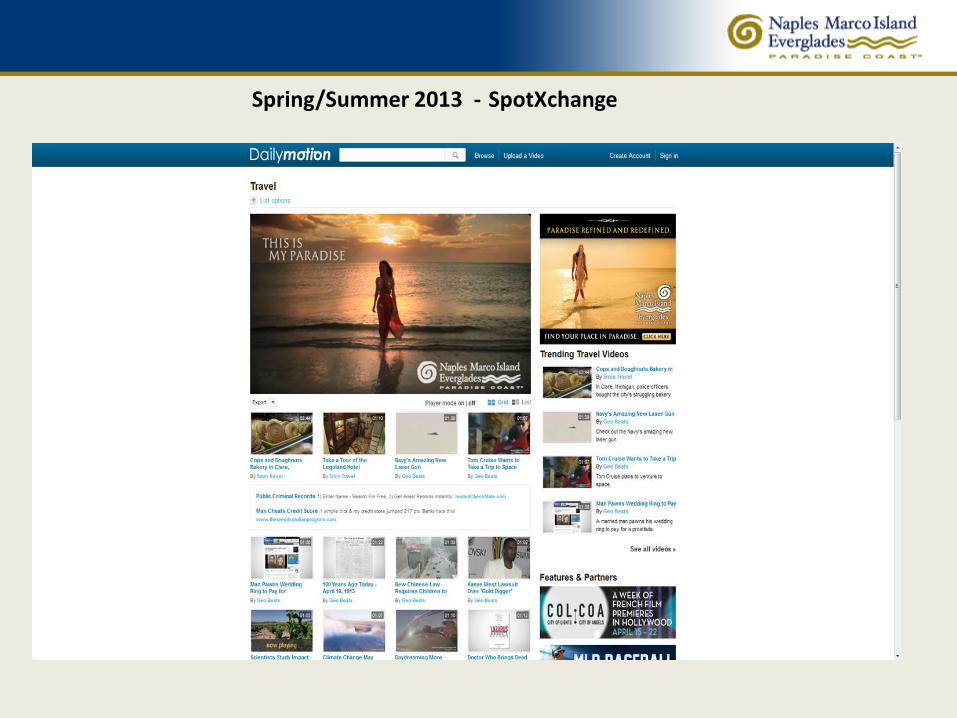
Spring/Summer 2013 -
SpotXchange

Spring/Summer 2013


Winter Campaign Highlights 2013 • Campaign responses made up 45.64% of website traffic, or 21,492 visits.
• Paradise Refined was the most requested page • The open rate for the March Consumer eScapes was 2,488 opens (14.73%), a 28.6% increase over February’s distribution
• The click through rate (CTR) for the March Consumer eScapes was 14.79%, a 6% increase over February’s 12.02% CTR – most popular link was the Park Shore Resort • The open rate for the March Meeting eScapes was 674 opens (17.65%), a 21% increase over January’s distribution • The click through rate for the March Meeting eScapes was 5.49%, well above the industry average CTR of 2.71% • 11.3 million page impressions across 1.7 million users on Facebook, and 301,400 impressions on Twitter – a 10.4% increase over February on Twitter • Increase of 139 fans on Facebook and 188 followers, 716 link clicks, 60 mentions and 30 re-tweets on Twitter this month

The Best is Yet to Come!
More Visitors = More Jobs More Jobs = Prosperity A Winning Combination

Please Join us in the Ballroom
• Honor this year’s Stars of Collier County’s Hospitality & Tourism Industry
• 11th Annual Paradise Coast Tourism Star Awards
• Check in and pick up Rally Signs and Buttons
• Show your enthusiasm for our area’s largest private sector industry


![CWS ParadiseLine. · 2019-04-02 · 12 ] Paradise Air Bar 13 ] Paradise Seatcleaner 14 ] Paradise Toiletpaper 15 ] Paradise Superroll 16 ] Paradise Paper Bin 17 ] Paradise Ladycare](https://img.pdfslide.us/doc/110x75/5f4d115eb47f9811753b5af9/cws-2019-04-02-12-paradise-air-bar-13-paradise-seatcleaner-14-paradise.jpg)