Embed Size (px)
Citation preview
FLORIDA STATE UNIVERSITY
COLLEGE OF EDUCATION
MODELING THE REASONING PROCESSES IN EXPERTS AND NOVICES’ ARGUMENT
DIAGRAMMING TASK: SEQUENTIAL ANALYSIS OF DIAGRAMMING BEHAVIOR
AND THINK-ALOUD DATA
By
HAE YOUNG KIM
A Dissertation submitted to the
Department of Educational Psychology and Learning Systems
in partial fulfillment of the
requirements for the degree of
Doctor of Philosophy
Degree Awarded:
Spring Semester, 2015
ii
Hae Young Kim defended this dissertation on April 13, 2015.
The members of the supervisory committee were:
Allan Jeong
Professor Directing Dissertation
Michael Kaschak
University Representative
Valerie Shute
Committee Member
Vanessa Dennen
Committee Member
The Graduate School has verified and approved the above-named committee members, and
certifies that the dissertation has been approved in accordance with university requirements.

iii
I dedicate this work to my mother, Jeong Ja Ma, who loves and supports me in my life, and to
my children, Aileen Yerin and Daniel Seojin.
iv
ACKNOWLEDGMENTS
First of all, acknowledgment goes to my parents, Jeong Ja Ma and Myung Jun Kim, who
supported me through difficult times in my doctoral studies. As a mother of two children, I was
able to spend time with them in the USA because of my mother’s help. When I gave birth to my
first child, my mom held my hand during my c-section. She took care of me and my two babies
and helped me to perform my dual roles as mother and student. My father always says good
things about me ever since I was a kid. His positive belief and strong support led me to pursue
my dream and to achieve my goals. Seeing my mom’s tears as expression of joy and pride, I
realized again how much love I have received from my mom. Without my family’s love and
support, I could not have finished my doctoral studies.
Also, I would like to give many thanks to my advisor, Dr. Allan Jeong. Dr. Jeong is a
patient and considerate professor. Whenever I fell down and lost motivation, he provided me
new insights to help me overcome emotional obstacles. Without his advising, I would not have
been able to complete my dissertation. I deeply appreciate his knowledge and helpful advising.
My committee, Dr.Valerie Shute and Dr.Vanessa Dennen are great instructors and I
learned a lot from their courses. Dr. Shute is an excellent researcher and life mentor and I
always think that I wish I could live like her. Also, Dr. Dennen provided me various teaching
experiences and her support really helped to make me to complete my PhD without financial
difficulty and to prepare for my future career. My previous committee Dr. Jonathan Adams
provided new insights on my research so that I could see my project from a different point of
view. Lastly, Dr.Michael Kaschak, as my new committee, willingly took my request to be my
outside committee and helped me get through the final defense. Without their support and
advising, I could not have finished my dissertation.
v
In addition, I would like to thank Dr. Woon Jee Lee, my friend and an excellent
researcher. She helped me to analyze my data and contributed to the analysis. Also, thank you
to Karen Hand for volunteering her excellent editing skills to help me improve the quality of
writing in my dissertation. Lastly, I would like to thank my former advisors who inspired me to
be an educational researcher, Dr. Chul-Hwan Lee and Dr. Seon-Gwan Han. They showed their
strong belief in me and supported me in my future studies.
I have to mention that I had a great opportunity to learn Educational Statistics and
Measurement at FSU. Especially, Dr. Betsy Becker, Dr. Yangyun Yang, and Dr. Russell
Almond who taught me statistics and helped me to earn a Master of Science in Educational
Statistics and Measurement. This was a really outstanding privilege that I had since I had great
professors at FSU.
Lastly, I also thank to Dr. Danielle Sherdan as my former boss. She has the warmest heart
and positive attitudes toward people and life. Her consistent support helped me financially and
emotionally to go through my doctoral life.
And Mary Kate McKee is a wonderful person who cares every student in Instructional
Systems and Learning Technologies. I am very lucky to have all these amazing people in my
life.
Now, I’m closing my acknowledgment as imaging myself to hold my future students’
hands on their graduation day. I would like to share my experiences with my students and
inspire them to pursue and achieve their goals. In future, I hope I can be the one of the amazing
mentors and teachers whom l listed above.
vi
TABLE OF CONTENTS
List of Tables ...................................................................................................................................x
List of Figures ............................................................................................................................... xii
Acknowledgments........................................................................................................................... iv
Abstract ......................................................................................................................................... xiv
CHAPTER 1: INTRODUCTION ................................................................................................... 1
Lack of Critical Thinking in Higher Education ........................................................................................ 1
Teaching Critical Thinking with Argument Analysis............................................................................... 2
Supporting Argument Analysis with Diagramming Tools ....................................................................... 3
Need for Identifying Reasoning Processes Used to Diagram Arguments ................................................ 6
Comparing Experts versus Novices to Identify Reasoning Processes that Produce More Accurate
Maps ........................................................................................................................................................ 8
What Argument Diagramming Can and Cannot Reveal About the Process ............................................ 9
Goals of the Study .................................................................................................................................. 12
Significance of this Study ....................................................................................................................... 13
CHAPTER 2: LITERATURE REVIEW ...................................................................................... 15
Overview ................................................................................................................................................ 15
Critical Thinking and Argument Analysis .............................................................................................. 16
Argument Structure ............................................................................................................................ 18
Problems in Real-World Arguments .................................................................................................. 21
Approach to Argument Analysis ........................................................................................................ 22
Argument Mapping to Enhance Argument Analysis ......................................................................... 23
Cautions in Using Argument-Mapping Software ............................................................................... 29
Reasoning Processes ............................................................................................................................... 30
Effects of Content and Context on Reasoning Processes ................................................................... 33
Reasoning in Arguments .................................................................................................................... 34
Informal Arguments in Everyday Life ............................................................................................... 35
Common Reasoning Fallacies ............................................................................................................ 36
Research on Argument Diagramming Processes ............................................................................... 41
Expertise Research ................................................................................................................................. 43
vii
Characteristics of Expertise ................................................................................................................ 44
Definition of Expertise ....................................................................................................................... 45
Expertise in Reasoning Process .......................................................................................................... 48
Literature Review for Methodologies ..................................................................................................... 55
Verbal Reports ................................................................................................................................... 55
Think-Aloud Protocol ........................................................................................................................ 56
Limitations of Concurrent Think-aloud Protocol. .............................................................................. 57
CHAPTER 3: METHOD .............................................................................................................. 59
Overview ................................................................................................................................................ 59
Research Design and Approach .............................................................................................................. 60
Participants ............................................................................................................................................. 60
Settings and Technology ........................................................................................................................ 61
Procedures .............................................................................................................................................. 61
Introductory Session ........................................................................................................................... 61
Training Session ................................................................................................................................. 62
Tasks .................................................................................................................................................. 63
Data Collection ....................................................................................................................................... 66
Assessing the Quality of Argument Diagrams ................................................................................... 66
Coding the Video and Audio Data.......................................................................................................... 70
Data Analysis .......................................................................................................................................... 71
Assumptions for Sequential Analysis ................................................................................................ 74
Limitation of Sequential Analysis ...................................................................................................... 80
Scoring Students’ Argument Diagrams .............................................................................................. 81
CHAPTER 4: RESULTS .............................................................................................................. 84
Introduction ............................................................................................................................................ 84
Demographic Information ...................................................................................................................... 84
Research Question 1: What Reasoning Processes Do Experts and Novices Perform when Diagramming
a Complex Argument? ............................................................................................................................ 88
Sequential Patterns in Experts’ Actions ............................................................................................. 89
Sequential Analysis of Novice Actions .............................................................................................. 93
Transitional State Diagrams of Patterns in Action Sequences of Expert vs. Novice ......................... 95
viii
Research Question 2: What Differences Exist in the Reasoning Processes Used by Experts versus
Novices? ............................................................................................................................................... 101
Similarities in the Reasoning Processes of Experts and Novices ..................................................... 101
Differences In the Reasoning Processes of Experts and Novices .................................................... 102
Research Question 3: Which Processes Might Help Produce Diagrams of High versus Low
Accuracy? ............................................................................................................................................. 104
Primary Findings .............................................................................................................................. 104
Post-hoc Analysis ............................................................................................................................. 104
Frequencies and Transitional Probabilities between Action Sequences .......................................... 104
Sequential Patterns Exhibited by the Two High versus Low Performers ........................................ 109
Sequential Patterns Exhibited by the High Performers .................................................................... 109
Sequential Patterns Exhibited by the Low Performers ..................................................................... 109
Qualitative Findings ............................................................................................................................. 112
Coding Processes.............................................................................................................................. 112
Five Global Processes Used for Diagramming an Argument Map .................................................. 120
Types of Reasoning by Experts and Novices ................................................................................... 129
Experts Use of Two Strategies to Analyze and Construct an Argument Map ................................. 130
Experts Also Committed Reasoning Fallacies ................................................................................. 132
Summary of Main Qualitative Findings ........................................................................................... 137
Outliers and Limitations ................................................................................................................... 139
CHAPTER 5: DISCUSSION ...................................................................................................... 141
Research Question 1. What Reasoning Processes Do Experts and Novices Perform When
Diagramming a Complex Argument? ................................................................................................... 141
Research Question 2: What Differences Exist in the Reasoning Processes Used by Experts versus
Novices? ............................................................................................................................................... 145
Research Question 3: Which Processes Might Help Produce Diagrams of High versus Low
Accuracy? ............................................................................................................................................. 146
Qualitative Findings and Discussion .................................................................................................... 149
Instructional and Software Design Implications ................................................................................... 153
Limitations of the Study ....................................................................................................................... 156
Limitations of Sequential Analysis ....................................................................................................... 158
Directions for Future Research ............................................................................................................. 159
ix
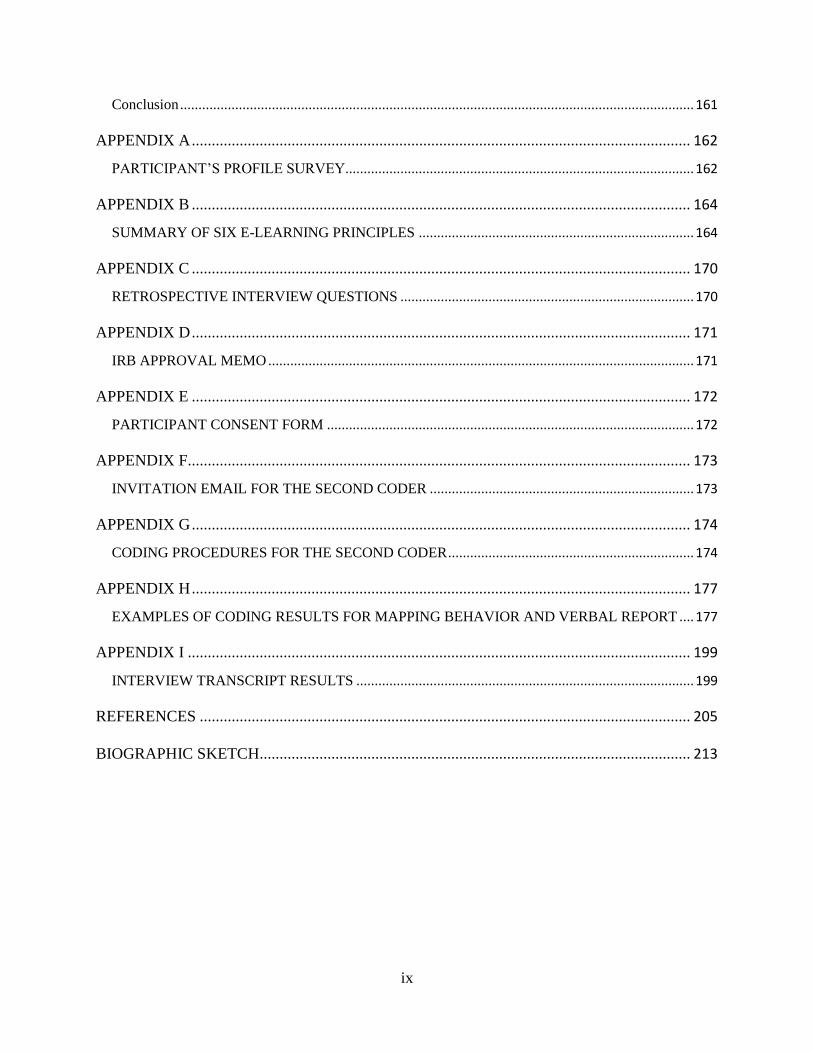
Conclusion ............................................................................................................................................ 161
APPENDIX A ............................................................................................................................. 162
PARTICIPANT’S PROFILE SURVEY............................................................................................... 162
APPENDIX B ............................................................................................................................. 164
SUMMARY OF SIX E-LEARNING PRINCIPLES ........................................................................... 164
APPENDIX C ............................................................................................................................. 170
RETROSPECTIVE INTERVIEW QUESTIONS ................................................................................ 170
APPENDIX D ............................................................................................................................. 171
IRB APPROVAL MEMO .................................................................................................................... 171
APPENDIX E ............................................................................................................................. 172
PARTICIPANT CONSENT FORM .................................................................................................... 172
APPENDIX F.............................................................................................................................. 173
INVITATION EMAIL FOR THE SECOND CODER ........................................................................ 173
APPENDIX G ............................................................................................................................. 174
CODING PROCEDURES FOR THE SECOND CODER ................................................................... 174
APPENDIX H ............................................................................................................................. 177
EXAMPLES OF CODING RESULTS FOR MAPPING BEHAVIOR AND VERBAL REPORT .... 177
APPENDIX I .............................................................................................................................. 199
INTERVIEW TRANSCRIPT RESULTS ............................................................................................ 199
REFERENCES ........................................................................................................................... 205
BIOGRAPHIC SKETCH............................................................................................................ 213
x
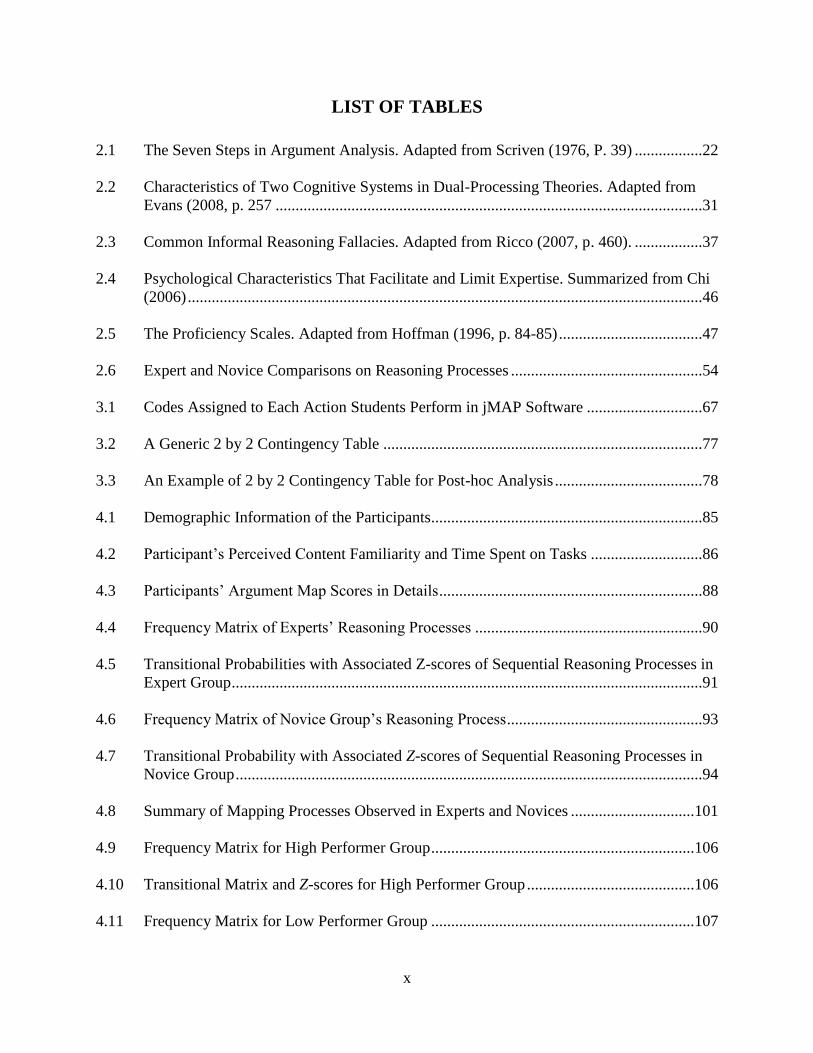
LIST OF TABLES
2.1 The Seven Steps in Argument Analysis. Adapted from Scriven (1976, P. 39) .................22
2.2 Characteristics of Two Cognitive Systems in Dual-Processing Theories. Adapted from
Evans (2008, p. 257 ...........................................................................................................31
2.3 Common Informal Reasoning Fallacies. Adapted from Ricco (2007, p. 460). .................37
2.4 Psychological Characteristics That Facilitate and Limit Expertise. Summarized from Chi
(2006) .................................................................................................................................46
2.5 The Proficiency Scales. Adapted from Hoffman (1996, p. 84-85) ....................................47
2.6 Expert and Novice Comparisons on Reasoning Processes ................................................54
3.1 Codes Assigned to Each Action Students Perform in jMAP Software .............................67
3.2 A Generic 2 by 2 Contingency Table ................................................................................77
3.3 An Example of 2 by 2 Contingency Table for Post-hoc Analysis .....................................78
4.1 Demographic Information of the Participants....................................................................85
4.2 Participant’s Perceived Content Familiarity and Time Spent on Tasks ............................86
4.3 Participants’ Argument Map Scores in Details ..................................................................88
4.4 Frequency Matrix of Experts’ Reasoning Processes .........................................................90
4.5 Transitional Probabilities with Associated Z-scores of Sequential Reasoning Processes in
Expert Group ......................................................................................................................91
4.6 Frequency Matrix of Novice Group’s Reasoning Process .................................................93
4.7 Transitional Probability with Associated Z-scores of Sequential Reasoning Processes in
Novice Group .....................................................................................................................94
4.8 Summary of Mapping Processes Observed in Experts and Novices ...............................101
4.9 Frequency Matrix for High Performer Group ..................................................................106
4.10 Transitional Matrix and Z-scores for High Performer Group ..........................................106
4.11 Frequency Matrix for Low Performer Group ..................................................................107
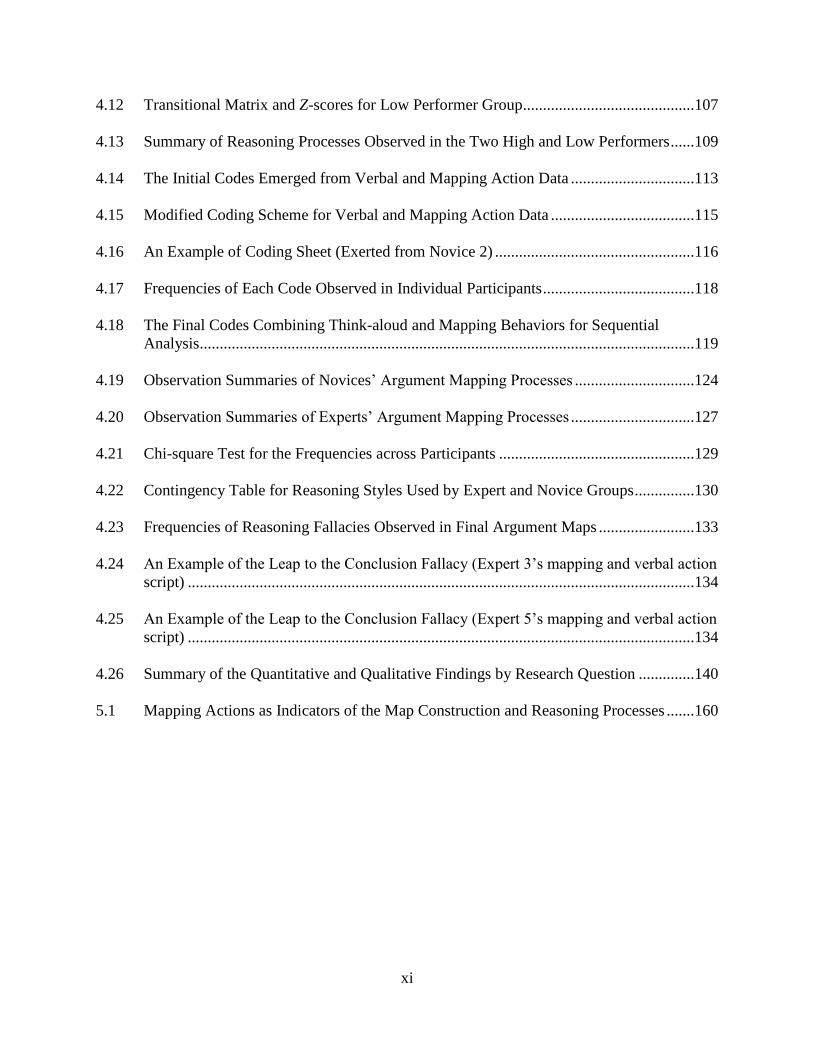
xi
4.12 Transitional Matrix and Z-scores for Low Performer Group...........................................107
4.13 Summary of Reasoning Processes Observed in the Two High and Low Performers ......109
4.14 The Initial Codes Emerged from Verbal and Mapping Action Data ...............................113
4.15 Modified Coding Scheme for Verbal and Mapping Action Data ....................................115
4.16 An Example of Coding Sheet (Exerted from Novice 2) ..................................................116
4.17 Frequencies of Each Code Observed in Individual Participants ......................................118
4.18 The Final Codes Combining Think-aloud and Mapping Behaviors for Sequential
Analysis............................................................................................................................119
4.19 Observation Summaries of Novices’ Argument Mapping Processes ..............................124
4.20 Observation Summaries of Experts’ Argument Mapping Processes ...............................127
4.21 Chi-square Test for the Frequencies across Participants .................................................129
4.22 Contingency Table for Reasoning Styles Used by Expert and Novice Groups ...............130
4.23 Frequencies of Reasoning Fallacies Observed in Final Argument Maps ........................133
4.24 An Example of the Leap to the Conclusion Fallacy (Expert 3’s mapping and verbal action
script) ...............................................................................................................................134
4.25 An Example of the Leap to the Conclusion Fallacy (Expert 5’s mapping and verbal action
script) ...............................................................................................................................134
4.26 Summary of the Quantitative and Qualitative Findings by Research Question ..............140
5.1 Mapping Actions as Indicators of the Map Construction and Reasoning Processes .......160
xii
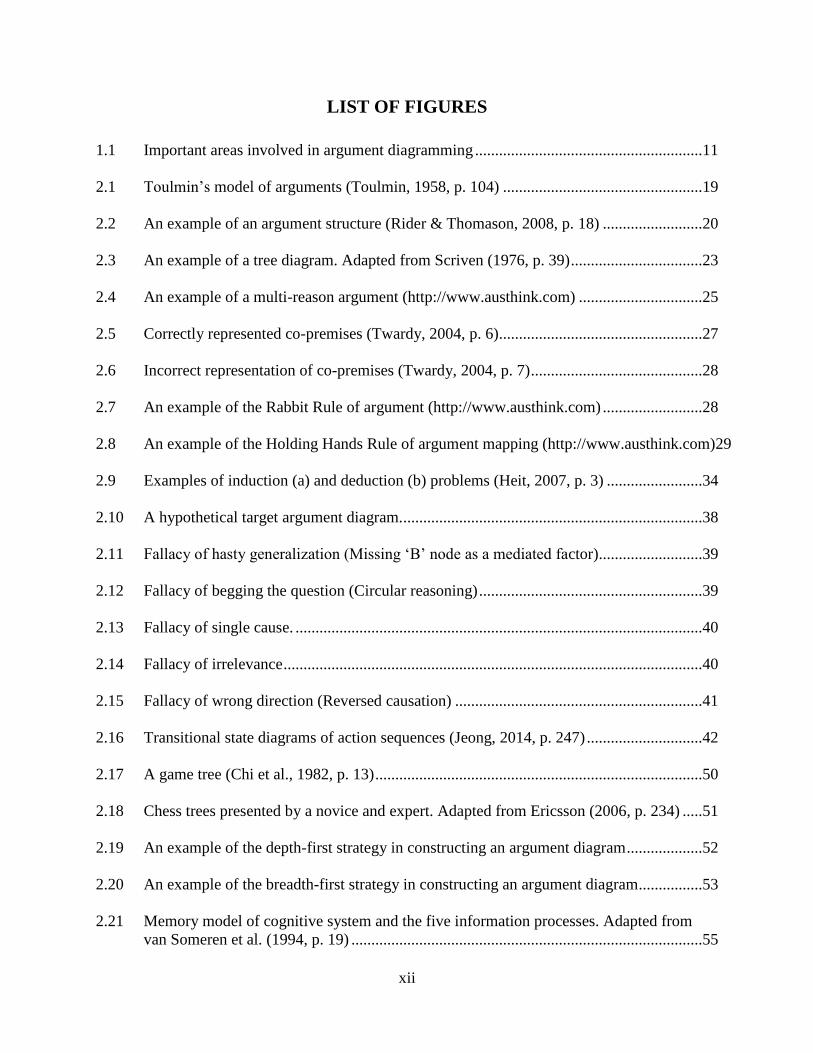
LIST OF FIGURES
1.1 Important areas involved in argument diagramming .........................................................11
2.1 Toulmin’s model of arguments (Toulmin, 1958, p. 104) ..................................................19
2.2 An example of an argument structure (Rider & Thomason, 2008, p. 18) .........................20
2.3 An example of a tree diagram. Adapted from Scriven (1976, p. 39) .................................23
2.4 An example of a multi-reason argument (http://www.austhink.com) ...............................25
2.5 Correctly represented co-premises (Twardy, 2004, p. 6) ...................................................27
2.6 Incorrect representation of co-premises (Twardy, 2004, p. 7) ...........................................28
2.7 An example of the Rabbit Rule of argument (http://www.austhink.com) .........................28
2.8 An example of the Holding Hands Rule of argument mapping (http://www.austhink.com)29
2.9 Examples of induction (a) and deduction (b) problems (Heit, 2007, p. 3) ........................34
2.10 A hypothetical target argument diagram............................................................................38
2.11 Fallacy of hasty generalization (Missing ‘B’ node as a mediated factor)..........................39
2.12 Fallacy of begging the question (Circular reasoning) ........................................................39
2.13 Fallacy of single cause. ......................................................................................................40
2.14 Fallacy of irrelevance .........................................................................................................40
2.15 Fallacy of wrong direction (Reversed causation) ..............................................................41
2.16 Transitional state diagrams of action sequences (Jeong, 2014, p. 247) .............................42
2.17 A game tree (Chi et al., 1982, p. 13) ..................................................................................50
2.18 Chess trees presented by a novice and expert. Adapted from Ericsson (2006, p. 234) .....51
2.19 An example of the depth-first strategy in constructing an argument diagram ...................52
2.20 An example of the breadth-first strategy in constructing an argument diagram ................53
2.21 Memory model of cognitive system and the five information processes. Adapted from
van Someren et al. (1994, p. 19) ........................................................................................55
xiii
2.22 An illustration of concurrent think aloud protocol (Ericsson, 2006, p. 227) .....................57
3.1 The screen capture of a student jMAP with a default arrangement of nodes. ...................63
3.2 The overview of the procedure and data collection process. .............................................65
3.3 The criterion map. ..............................................................................................................69
3.4 An example of a transitional frequency matrix ..................................................................72
3.5 An example of a transitional probability matrix ................................................................73
3.6 An example of z-scores matrix ..........................................................................................74
3.7 A transitional diagram of Group A ....................................................................................76
3.8 A transitional diagram of Group B ....................................................................................76
3.9 The revised criterion map. .................................................................................................82
4.1 Transitional diagram of the expert group reasoning processes. .........................................92
4.2. The transitional diagram of the novice group’s reasoning processes. ...............................95
4.3. Comparisons of two transitional diagrams of the expert (left) and novice (right)’s
reasoning processes. ...........................................................................................................96
4.4. Bar graph to represent the participants’ final argument map scores. ...............................105
4.5. Transitional diagrams of the two high (left) and the two low performers (right) ............108
4.6. The diagram point at which Expert 3 committed the leaping to conclusions fallacy. .....135
xiv
ABSTRACT
A variety of software tools and guidelines have been developed to help students diagram,
analyze, and better understand complex arguments. However, little or no empirical evidence
exists to validate whether the processes embedded within existing tools and guidelines are
processes that produce better argument diagrams. As a result, the purpose of this study was to
determine: 1) the mapping and reasoning processes used by experts and novices to analyze
complex arguments; 2) how the processes performed by experts versus novices differ; and 3)
based on the observed differences, identify the processes that facilitate and hinder more accurate
argument analysis. The verbal reasoning and argument-diagramming processes of four experts in
argumentation and five novices across four different graduate programs were recorded on video
as they constructed their argument maps using a diagramming software application called jMAP
and as they verbalized their thought processes in a think-aloud protocol/interview. Sequential
analysis was used to identify and differentiate the sequences of mapping actions used by experts
versus novices and the sequences of mapping actions that were used to produce the highest
versus lowest quality argument diagrams. The findings from this indicated that the experts’
processes for positioning, linking, and reviewing nodes produced more accurate maps than the
processes used by novices. Based on these findings, I discussed several possible interpretations
of the four experts’ reasoning processes in the context of argument diagramming tasks and in the
context of more global reasoning processes identified from a qualitative analysis of the video
recordings and verbal protocols. Lastly, I presented several educational implications with regard
to using the experts’ processes as a model for scaffolding and helping students better analyze and
evaluate complex arguments and for designing diagramming software.
1
CHAPTER 1
INTRODUCTION
Lack of Critical Thinking in Higher Education
The Partnership for 21st Century Skills (2009) claims that the U.S. education system should
prepare every student with critical thinking skills to enable students to be successful in their daily
lives. In fact, many educators have stressed the importance of critical thinking since the 20th
century and have claimed that promoting student critical thinking should be one of the most
essential goals in higher education (Davies, 2011; Harrell, 2011; McMillan, 1987). In addition to
having a deeper understanding of specific subject knowledge, undergraduate and graduate
students should be encouraged to develop critical thinking skills so that they are able to
effectively reason and accurately judge information and thinking (McMillan, 1987). Employers
have stressed that it is important that future employees possess strong critical thinking skills to
be successful in performing a variety of tasks (Davies, 2013; The Chronicle of Higher Education
& American Public Media’s Marketplace, 2012).
Even though there is some controversy over the definition of critical thinking, most
educators agree that reasoning, analyzing, judging and evaluating information are essential
components of critical thinking (Cosgrove, 2011; Harrell, 2011; The Partnership for 21st Century
Skills, 2009). For example, Kuhn (1991) claims that argument skills are fundamental
competencies for critical thinking. In everyday life, people face many arguments when making
important decisions or judgments. Some information may be incorrect and some arguments may
be based on faulty or inaccurate evidence. As a result, people are often unable to make the best
judgments when solving everyday problems. Similar to Kuhn’s definition of critical thinking,
Paul and Elder (2001) define critical thinking as “the art of analyzing and evaluating thinking
2
with a view to improving it” (p.2). Recently, the Partnership for 21st Century Skills (2009) and
Binkley et al. (2012) defined critical thinking as effective reasoning, systems thinking, and
judgments/decision-making skills (The Partnership for 21st Century skills, 2009). The
Partnership for 21st Century Skills (2009) identified the following sub-skills of critical thinking:
using an appropriate reasoning method based on the situation, analyzing interactions among
elements and outcomes in a complex system, analyzing evidence/claims/arguments, inferring,
drawing conclusions, and evaluating arguments and alternatives.
Although critical thinking is considered to be an essential skill in higher education and
professional areas, recent research shows that many college students fail to develop critical
thinking skills to the extent that they can effectively use the skills (Davies, 2011; Reimold,
Slifstein, Heinz, Mueller-Schauenburg, & Bares, 2006; Gold & Holman, 2002; Kuhn, 1991).
Davies (2013) points out that employers are more likely to hire students with strong critical
thinking skills than students with weak critical thinking skills despite their superior grades and
content knowledge. This trend may reflect the ever changing dynamic nature and complexity of
today’s real-world problems. As a result, teaching and improving students’ critical thinking is a
paramount goal in higher education.
Teaching Critical Thinking with Argument Analysis
To address students’ deficiencies in critical thinking, argument analysis is one method
that has been used in higher education to teach critical thinking across many, if not most,
disciplines (e.g., education, philosophy, psychology, economics, and political science) because
argumentation is an essential part of the scientific and problem-solving process. Bensely (2010)
defines argument analysis as a process of “evaluating evidence, drawing appropriate conclusions
along with other skills, such as distinguishing arguments from non-arguments and finding
3
assumptions” (p. 49). As a result, the skill of analyzing arguments is an important component of
critical thinking and hence is a skill that college students should develop (Harrell, 2008).
Specifically, argument analysis is the study of logical relationships among claims presented
in an argument (which can be mutually supporting or opposing opinions/claims) – an important
part of the process of reasoning through premises to reach a conclusion. In argument analysis,
students identify the functional roles of each proposition (i.e., conclusion, premise, co-premise,
counterargument), analyze the hierarchical relationships among propositions across major and
minor premises (i.e., levels of premise), and evaluate the quality and validity of a given
argument. It is a process that can be used to help identify flaws and evaluate the truth value of
stated arguments, which ultimately can help one draw more well-reasoned conclusions and make
better decisions.
Supporting Argument Analysis with Diagramming Tools
The structure of a presented argument can be complex and ill-defined. As a result,
argument analysis requires students to perform cognitive operations that are complex and multi-
step. For example, an argument analysis begins with the process of extracting the true intent or
major premise (or claim) presented in the text and distinguishing the major from the minor
premises – premises that are presented to establish the veracity of the major claim. Each minor
premise itself can be accompanied by a series or chain of premises presented to establish (and
sometimes, to challenge) the truth value of the minor premise. As a result, the analysis of an
argument requires one to flesh out the hierarchical relationships behind all major and minor
premises so that flaws in the lines of reasoning can be identified to determine the overall quality
and truth value of a given claim or conclusion. These processes of argument analysis require
significant attention, memory, and cognitive effort and are likely to produce heavy cognitive load
4
that can inhibit performance and learning (Harrell, 2007; van Bruggen, Kirschner, & Jochems,
2002). Another challenge that one faces when analyzing arguments is when minor premises or
assumptions are not explicitly stated, thus requiring students to infer the missing premise in order
to establish the logical relationship between given premises and a given conclusion (Ennis,
1982). Lastly, the individual’s biases, beliefs, and emotional states regarding a given topic can
affect the reasoning process and the quality of the final conclusion (Correia, 2011; Klaczynski,
2000) .
To address these challenges, argument diagramming software has been developed to help
students draw visual diagrams to scaffold the process of mapping out the hierarchical
relationships between major and minor premises (Braak, Oostendorp, Prakken & Vreeswijk,
2006). Diagramming software like Belvedere (De Neys, 2006), Rationale (van Gelder, 2007),
and jMAP (Jeong, 2010) enables students to draw, position, and link multiple nodes to create
diagrams that provide a visual and spatial means of mapping out and conveying complex
hierarchical relationships among premises. Using this approach, students do not have to rely
solely on memorizing multiple series’ of propositions in the form of verbal representations. As a
result, the use of argument diagrams can help to reduce cognitive load when analyzing complex
arguments (Harrell, 2007; van Bruggen, Kirschner, & Jochems, 2002). In other words, the use of
diagramming tools enables students to allocate more working memory capacity to interpret the
text, identify the functional elements of the text (premises, supports, objections, counter-
arguments, etc.), and analyze the nature and quality of the hierarchical relationships between
premises.
Recent studies on the impact of diagramming software on students’ argumentation skills in
higher education have reported positive effects (Harrell, 2011; Twardy, 2004; Bruggen,
5
Boshuizen, & Kirschner, 2003; van Gelder, 2002). For instance, Harrell (2011) found that
teaching argumentation with diagramming tools enhances college students’ critical thinking
skills. Prior to Harrell’s study, Easterday, Aleven, and Scheines (2007) examined the effects of
diagrams and diagramming tools on causal reasoning in college students. They found that by
having students create their own causal diagrams, students exhibited more complex cognitive
processes (combined comprehension, construction and interpretation) than students that simply
studied a given set of texts or causal diagrams. Like argument diagrams, causal diagrams enable
students to articulate and better understand the causal relationships between event-based
arguments and, as a result, help to improve students’ causal reasoning skills in the same manner
that argument diagrams help to improve students’ analysis of semantic relationships between
premises.
However, a critical review of research on the efficacy of using tools for diagramming and
visualizing arguments revealed that the majority of studies found no significant differences in
their effects on student learning (Braak et al., 2006). The review revealed that a large majority of
the research lacked validity due to problems in experimental design. As a result, the efficacy of
using such mapping tools is still in question. Also, the assessment of learning with students’
maps varied in terms of the nature of the tasks and subject matter, mapping techniques
(hierarchical, networking, etc.), and scoring rules employed by studies (Ruiz-Primo &
Shavelson, 1996). As a result, the overall effectiveness of these tools when used to teach
argumentation remains inconclusive.
6
Need for Identifying Reasoning Processes Used to Diagram Arguments
Braak et al.’s (2006) critical review noted that most, if not all, prior studies on argument
diagramming tools assessed students’ argumentation skills based on the evaluation of the final
product – students’ argument diagrams. The emphasis on evaluating the final maps alone has not
helped to advance our understanding of how students construct their argument diagrams, what
processes they use, and which of the processes are most effective. Likewise, prior research has
focused primarily on determining the effects of particular interventions on students’
understanding of arguments, not on how the interventions affect the processes students use to
construct an argument diagram (Kuhn & Udell, 2003) and how the resulting changes in these
processes in turn affect the final maps. Achieving a deeper understanding of the processes
students use to diagram arguments may help us to understand why and when particular tools
work and do not work. However, little research has been conducted to explicitly model and
distinguish the processes that improve versus hinder students’ analysis and understanding of
complex arguments.
In addition to the processes used to construct argument diagrams are the processes of
logical reasoning – another essential part of analyzing and evaluating arguments (Goel, Buchel,
Frith, & Dolan, 2000). Logical fallacies (e.g., leaping to conclusions, slippery slope, circular
arguments) and the processes used to identify and resolve these fallacies are illustrations of the
types of high-level reasoning processes that can occur when analyzing arguments. However, the
research that has examined reasoning processes provides a very limited picture of which and how
these particular processes are used to produce high quality versus low quality analysis of
arguments. For example, the reasoning processes used to analyze a syllogism has been a
frequent area of research (Evans, 2003; Johnson-Laird, 1999; Schaeken, 2000) within the field of
7
cognitive psychology. A syllogism is a logical form of an argument that includes three
propositions: two premises and one conclusion. Syllogistic reasoning is a form of deductive
reasoning in which a set of logical rules is applied to evaluate whether or not the conclusion is
true or false. However, arguments in the real world often involve the analysis of multiple,
complex, and/or incomplete syllogisms. Van Bruggen et al. (2003) describe the characteristics
of real world arguments as ‘ill-structured, incomplete, ambiguous, and not rule-based’.
Furthermore, the relationships among propositions are often probabilistic or conditional in nature
and not absolute in truth. As a result, the types of processes that help or hinder students’ ability
to successfully diagram complex arguments have not yet been thoroughly examined and
identified in prior research.
With the goal of identifying some of these processes, Jeong (2010) developed the jMAP
software application to automatically capture and codify the sequences of mechanical actions
students perform while constructing complex diagrams. This type of data can be sequentially
analyzed and potentially used to visualize, reveal, and identify the mental reasoning processes
used to produce high and low quality argument diagrams. For example, Jeong (2014) found that
high performers were more likely to perform certain action sequences than low performers.
High performers not only deleted links three times more often than low performers, high
performers were also likely to follow a link deletion by adding a new link (delete new link).
This particular action sequence can indicate a situation where high performers are correcting for
errors produced by leaping to conclusions (when AC and BC should be changed to
ABC). In addition, high performers not only deleted links more often than low performers,
they also re-routed existing links between nodes four times more often than low performers –
another action that can be used to correct for errors in an argument diagram. Given these
8
findings, Jeong concluded that the mechanical actions students perform on their diagrams may
serve as useful indicators of reasoning processes that produce more accurate maps and deeper
understanding of complex arguments (Jeong, 2014).
Although Jeong (2014) found sequential patterns that may help to explain the differences in
students’ map accuracy, it is still not clear what underlying reasoning processes are associated
with and account for specific diagramming actions and action sequences. As a result, more
qualitative research is needed to reveal the processes of reasoning underlying the diagramming
process in order to explain observed differences in students’ argument analysis and diagrams. In
other words, a qualitative approach is needed to identify and categorize both the mapping and
reasoning processes used by students to generate a tentative but explanatory theory about map
construction processes (Patton, 2001). Identifying both the reasoning and diagramming
processes that help and hinder students’ analysis and understanding will ultimately contribute to
further development and improvement of instructional interventions and diagramming tools.
Comparing Experts versus Novices to Identify Reasoning Processes that Produce
More Accurate Maps
The reasoning processes that lead to more accurate versus less accurate maps can be
identified by comparing the reasoning processes used by subject-matter experts to the processes
used by novices. Cognitive research has shown that experts use different cognitive processes
than novices to produce superior performances on tasks (Livingston & Borko, 1989; Norman,
2005). A study conducted by King, Wood, and Mines (1990) compared reasoning skills between
two groups – graduate and undergraduate students – and found that graduate students (expert
group) performed better in reasoning skills required for solving ill-defined complex problems
than undergraduate students (novice group). Even though their study does not explain how
9
graduate students’ reasoning processes differ from undergraduate students, the result indicates
that graduate students possess some, if not higher, levels of expertise in reasoning skills than
undergraduate students. However, King et al. (1990) pointed out that even advanced doctoral
students were unable to attain some of the higher levels of reasoning skills required to analyze
the most complex arguments. Their findings suggest that the development of reasoning skills
may be an ongoing and continual process as people engage in more academic cognitive tasks.
In the medical field, Norman (2005) found that experts in clinical diagnosis – whom were
found to possess better content knowledge, intuitive probabilistic skill, and experiential
knowledge than novices – make better use of memory and mental representation and clinical
diagnostic reasoning processes than novices. Likewise, experts in teaching have been found to
possess cognitive schemata that are more sophisticated, modifiable, interconnected and easily
accessible than those of novice teachers (Livingston & Borko, 1989). Livingston and Borko
(1989) concluded that some of these noted differences between expert and novice teachers can
affect the reasoning processes that are used and, in turn, affect the quality of outcomes in
constructing lesson plans. At this time, however, no studies have yet been conducted to
explicitly determine and model the reasoning processes used by experts versus novices.
What Argument Diagramming Can and Cannot Reveal About the Process
Observing the actions and action sequences students perform while constructing their
argument diagrams can potentially provide insights into the reasoning processes used to produce
more accurate argument diagrams (areas Y, X, and W in Figure 1.1) and less accurate argument
diagrams (areas R, Z, and M in Figure 1.1). By comparing sequential patterns in diagramming
behaviors used by novices versus experts, we can identify what types of action sequences
produce more versus less accurate diagrams as has been shown in Jeong’s (2014) study.
10
Although observations of diagramming processes may provide behavioral indicators of which
reasoning processes are being used by students to produce more accurate argument diagrams
(area X in Figure 1.1) and less accurate diagrams (area Z in Figure 1.1), the observed action
sequences student perform on their argument diagrams alone may not fully capture all of the
step-by-step reasoning processes that underlie each action students perform on their diagrams.
Furthermore, the diagramming actions students perform on an argument diagram may not be
representative of the internal reasoning processes that take place concurrently and/or between
diagramming actions to produce more accurate diagrams (area Y in Figure 1.1) versus less
accurate diagrams (area R in Figure 1.1).
For example, suppose a student creates an argument diagram containing three nodes: A,
B, and Claim. If the student correctly links B Claim and then correctly links A B, the
observer can surmise that the student has successfully used a backwards approach to identify the
major premise that supports the Claim, and then immediately moved on to identifying the minor
premises (A) that support the major premise B. In this case, this one-to-one correspondence
between diagramming processes and reasoning processes illustrates some of the possible
processes noted in area X of Figure 1.1. In contrast, a student that incorrectly links A Claim
and then links B Claim would reveal that the student has made a hasty generalization or is
leaping to conclusions (the belief that A leads to Claim when, in fact, A’s influence on the Claim
is moderated by B). This type of flaw in students’ reasoning process would be represented in
area Z of Figure 1.1 – an area that falls outside the Content Understanding circle. Area Y in
Figure 1.1 can represent, for example, a situation where the student correctly links B Claim,
then directs and redirects his/her eye gaze between A and Claim while making a mental
assessment of the possible linkage between A and Claim, then makes a determination as to
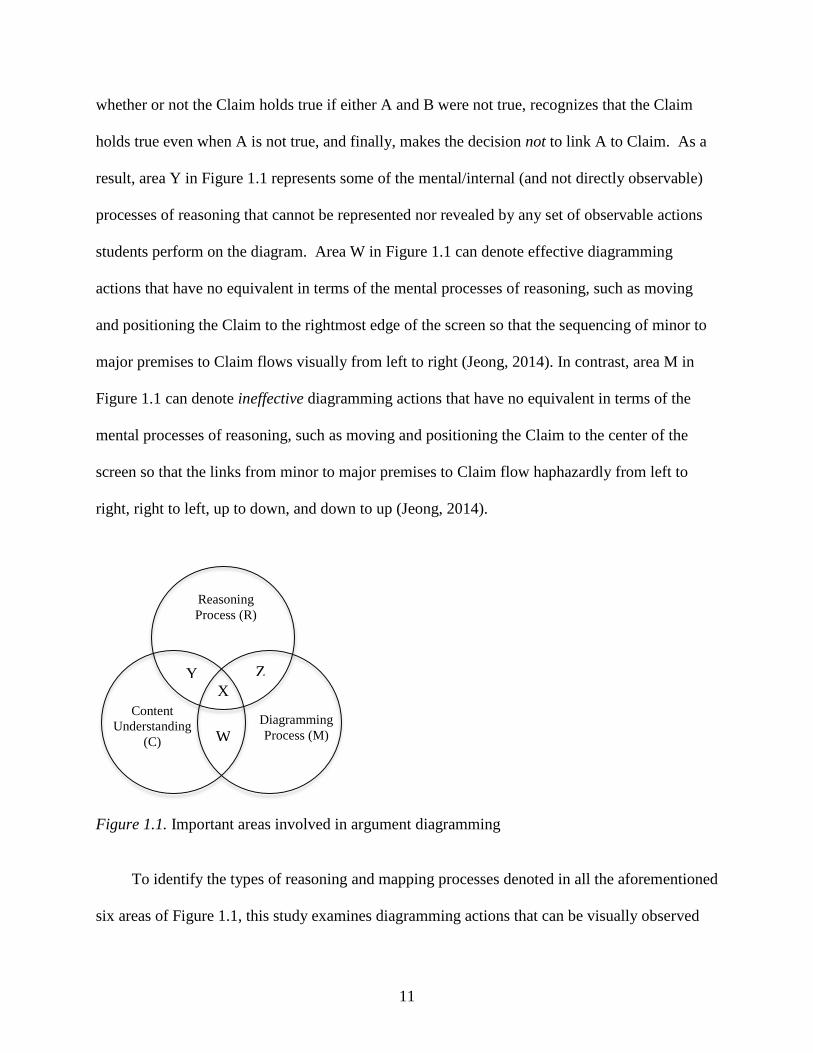
11
whether or not the Claim holds true if either A and B were not true, recognizes that the Claim
holds true even when A is not true, and finally, makes the decision not to link A to Claim. As a
result, area Y in Figure 1.1 represents some of the mental/internal (and not directly observable)
processes of reasoning that cannot be represented nor revealed by any set of observable actions
students perform on the diagram. Area W in Figure 1.1 can denote effective diagramming
actions that have no equivalent in terms of the mental processes of reasoning, such as moving
and positioning the Claim to the rightmost edge of the screen so that the sequencing of minor to
major premises to Claim flows visually from left to right (Jeong, 2014). In contrast, area M in
Figure 1.1 can denote ineffective diagramming actions that have no equivalent in terms of the
mental processes of reasoning, such as moving and positioning the Claim to the center of the
screen so that the links from minor to major premises to Claim flow haphazardly from left to
right, right to left, up to down, and down to up (Jeong, 2014).
Figure 1.1. Important areas involved in argument diagramming
To identify the types of reasoning and mapping processes denoted in all the aforementioned
six areas of Figure 1.1, this study examines diagramming actions that can be visually observed
Reasoning
Process (R)
X
ZY
Content
Understanding
(C)
Diagramming
Process (M) W
12
and performed by the subjects on diagrams displayed on the computer screen (areas W, M, X and
Z in Figure 1.1). Furthermore, this study examines the mental (and not directly observable)
processes that are performed by recording and analyzing the subjects’ verbal descriptions of the
mental processes they are performing (areas Y, R, X, and Z in Figure 1.1). The verbal
descriptions of the reasoning processes used by experts and novices are generated in this study
by using think-aloud protocol interviews. As a result, this study incorporates video recordings of
diagramming actions, verbal protocols, and retrospective interviews to identify in detail the
processes novices and experts use to analyze complex arguments.
Goals of the Study
Using think-aloud protocol and jMAP diagramming software, I will observe, code, and
identify the reasoning processes used by experts and novices to analyze a complex argument. I
will then analyze the coded data to identify sequential patterns in the actions experts and novices
perform while diagramming arguments in order to determine the mapping actions (and the
reasoning processes that are indicated by the mapping actions) that help to produce high versus
low understanding of complex arguments. Then I will use qualitative analysis to explore the
global processes that participants perform and to interpret the mapping processes identified with
the sequential analysis. As a result, this study addresses the following research questions:
1. What reasoning processes do experts and novices perform when diagramming a complex
argument?
2. What differences exist in the reasoning processes used by experts versus novices?
3. Which processes might help produce diagrams of high versus low accuracy?
13
Significance of this Study
Possessing good analytic skills is very important for graduate students given that these
skills help students to solve complex problems with multiple interrelated factors in real world
settings. Due to the tendency in prior research to overlook learning processes and to focus on
learning outcomes (Braak et al., 2006; Kuhn & Udell, 2003), studies on diagramming arguments
as a means of teaching argumentation skills have not yet examined the very processes that
students use while constructing argument diagrams. Other than the studies by Jeong (2012,
2014), few studies have yet identified the reasoning processes that help and/or hinder students’
ability to improve on their analysis and understanding of complex arguments while constructing
argument maps. The findings from this study provide preliminary insights into the types of
processes that can be promoted and discouraged when teaching students how to analyze and
diagram arguments. Identifying the unique processes used by experts (and not by novices) can
help us identify effective approaches to analyzing arguments and may provide helpful and
evidence-based guidelines and cognitive prompts (what you need to ask and think when you
identify the relationships between claims, etc.) to assist novice students in the argument analysis
process. Ultimately, the findings in this study will help researchers: a) better understand and
explain why particular interventions work or do not work in terms of how they affect the process,
and how in turn the process affects outcomes; and b) develop diagramming software that can
provide automated real-time process-oriented feedback to help students apply the appropriate
and most effective reasoning processes.
This study also helps to illustrate one approach to combining and integrating the use of
multiple data collection instruments (records of diagramming actions, think-aloud protocol,
retrospective interview) to identify, model, and better understand the processes of learning in
14
general. A separate look into the findings of this study from each data source will also help to
illustrate the possible shortcomings of using each data source alone to study and model complex
processes. For example, the findings from this study will illustrate some of the possible benefits
and shortcomings of using sequential analysis and related techniques to identify general patterns
in the processes used to achieve outcomes in complex learning tasks. With the increased level of
detail and specificity needed to identify, model, and better understand learning and problem-
solving from a process-oriented approach, this study can serve to help us understand the possible
limitations of and to improve on current methods used in the fledgling field of data mining and
learning analytics.
15
CHAPTER 2
LITERATURE REVIEW
Overview
To establish the justification, rationale, and theoretical and methodological framework for
this study, I present a review of the literature across four main topics: the use of argument
diagrams to support critical thinking and argument analysis; reasoning processes; differences in
reasoning processes between experts and novices; and think-aloud methods used to model
cognitive processes. First, I introduce the concept of arguments, its relationship to critical
thinking, the structures of complex arguments, and some of the prescribed procedures for
analyzing arguments. Next, I describe some computer-supported argument-diagramming tools
and argument-mapping rules used to enhance students’ argument diagramming and argument
analysis. Also, I present a review of studies that have examined diagramming processes and
point out what is lacking in current research about argument diagramming. Then I proceed to a
discussion of reasoning processes providing the two theoretical views of reasoning – problem
and process views – and dual-processing theories as the theoretical framework of this study. In
addition, I discuss different types of logical fallacies that people commit when analyzing
informal arguments and how some of the common reasoning fallacies can be identified in
students’ argument diagrams. To achieve a deeper understanding of reasoning processes that
produce high and low quality argument maps, comparisons between expert and novice reasoning
processes are reviewed to establish a methodological foundation for this study. Lastly, I discuss
a think-aloud method to model the experts’ and novices’ processes used to diagram and analyze
complex arguments.
16
As for the strategies that were used to search for the literature cited in this chapter, I used
ISI Web-of knowledge, Science Direct, and Google Scholar with the following (but not limited
to) search terms: ‘argument map*’, ‘reasoning or/and processes’, ‘experts and reasoning’,
‘expertise’, and ‘think-aloud protocol’. Among the citations that were listed in my search
results, I limited my search to journals in order to select articles that are from peer-reviewed
journals with high numbers of citations.
Critical Thinking and Argument Analysis
What is critical thinking? Siegel (1989) describes a critical thinker as a person who is
able to assess claims, make judgments, and reach a conclusion or take an action based on
reasons. “To be a critical thinker is to be appropriately moved by reasons” (Siegel, 1989, p.2).
Ennis (1989) defines critical thinking as “reasonable reflective thinking focused on deciding
what to believe or do” (p.4). Similar to Ennis’s assumption, Kuhn believes critical thinking is
related to thinking about thinking, a process he refers to as metacognition (1999). Practically
speaking, Ennis and Kuhn’s conception of critical thinking is rather broad in relation to Siegel’s
conception of critical thinking – too broad to apply to teaching and instruction. For this reason,
this study adopts Siegel’s definition of critical thinking by defining critical thinking as the ability
to evaluate claims (data), make judgments, and reach a conclusion based on reason.
Since the time of Socrates and the use of the Socratic method to develop questioning and
reasoning skills, critical thinking has been emphasized by most educators as one of the most
important educational goals in educational systems (Siegel, 1989). As social problems become
more complex and multifaceted, society requires people to possess critical thinking skills in
order to make good decisions and solve a variety of complex problems. In particular, higher
education programs have emphasized critical thinking (Davies, 2011; Harrell, 2011; McMillan,
17
1987) and there exists the expectation that schools should help elevate critical thinkers to higher
levels beyond simply being subject matter experts in their major field of study.
However, researchers have pointed out that our efforts in developing students’ critical
thinking in higher education have fallen short and have not adequately prepared students with the
level of critical thinking skills needed to address today’s complex problems. Despite the
consistent emphasis on critical thinking, higher education programs do not provide students with
sufficient experiences to successfully perform sophisticated high-level critical thinking
(Reimold, Slifstein, Heinz, Mueller-Schauenburg, & Bares, 2006). Davies (2011) criticizes the
fact that graduates are not equipped with the abilities required by employers, namely, the ability
to think critically and to reason and make judgments to resolve real-world problems in work
settings. Just as Kuhn (2007) pointed out the lack of argument skills in average adults, Gold and
Holman (2001), too, describe deficiencies in the ability of managers to analyze arguments,
understand perspectives which are different from their own, identify fallacies in arguments, and
establish and challenge the veracity of arguments with supporting or counter evidence. The lack
of these skills is prevalent, and hence the lack of development in critical thinking skills in college
and graduate-level education should increase educators’ attention on determining how to better
teach critical thinking across all disciplines.
To help students engage in critical thinking in higher education, argument analysis is one
instructional activity that has been used across many disciplines such as law, management,
economics, psychology, and philosophy (Bensley, Crowe, Bernhardt, Buckner, & Allman, 2010).
For example, Bensley et al. (2010) examined whether explicitly teaching argument analysis skills
enhanced students’ critical thinking in psychology courses at the college level. They found that
students with direct instruction in argument analysis had significant gains in critical thinking
18
compared to students with no argument analysis instruction. However, Bensley et al. (2010) did
not examine or test the efficacy of using specific techniques for teaching argument analysis
skills, nor did they identify the instructional materials used to teach argument analysis. Detailed
information about the procedures used to teach argument analysis is needed in order to produce
an operational definition of argument analysis so that further studies can be done to replicate
prior findings. Although Bensley et al. (2010) present a conceptual breakdown of the skills
associated with argument analysis (e.g., distinguishing arguments from non-arguments,
recognizing types of evidence and evaluating evidence, identifying assumptions in a text), the
majority of the skills they identified were low-order thinking processes (e.g., recognition,
identify). Furthermore, the argument task they examined in the study did not involve the
processes of analyzing the structure of an argument or the processes of identifying fallacies
within an argument. According to Harrell (2007), argument analysis must focus on: 1) the
logical structure of an argument; and 2) assessing the argument’s soundness (Harrell, 2007). The
logical structure of an argument shows how the conclusion is deduced from evidence and
premises, while the soundness of an argument deals with whether each claim is valid (Lim,
2011).
Argument Structure
Toulmin’s (1958) model of argumentation provides a graphical representation of the
fundamental structure of an argument (Figure 2.1). Toulmin’s model suggests that a good
analysis of an argument must take into consideration six important elements: data, claims,
warrants, qualifiers, rebuttals, and backing. Based on his book “The Uses of Argument” (1958),
data consists of facts and observations about a situation being discussed that leads to further
observations or facts, and ultimately, to the claim(s). Warrants connect claims and data by
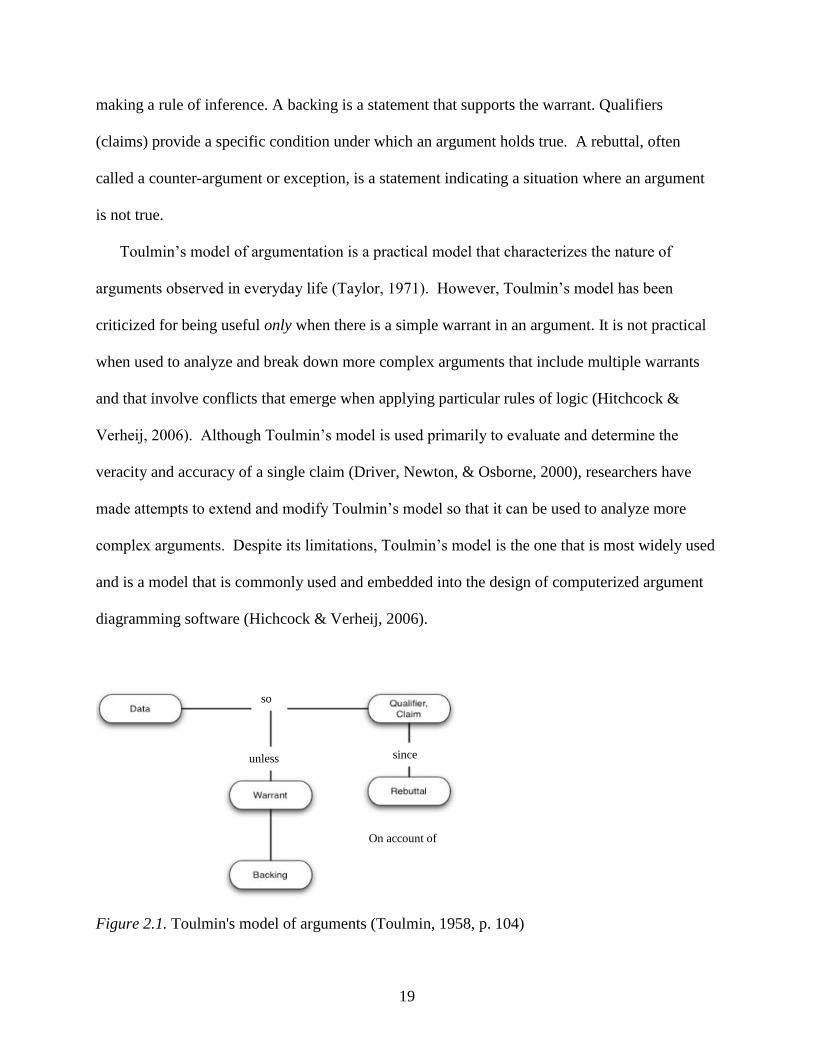
19
making a rule of inference. A backing is a statement that supports the warrant. Qualifiers
(claims) provide a specific condition under which an argument holds true. A rebuttal, often
called a counter-argument or exception, is a statement indicating a situation where an argument
is not true.
Toulmin’s model of argumentation is a practical model that characterizes the nature of
arguments observed in everyday life (Taylor, 1971). However, Toulmin’s model has been
criticized for being useful only when there is a simple warrant in an argument. It is not practical
when used to analyze and break down more complex arguments that include multiple warrants
and that involve conflicts that emerge when applying particular rules of logic (Hitchcock &
Verheij, 2006). Although Toulmin’s model is used primarily to evaluate and determine the
veracity and accuracy of a single claim (Driver, Newton, & Osborne, 2000), researchers have
made attempts to extend and modify Toulmin’s model so that it can be used to analyze more
complex arguments. Despite its limitations, Toulmin’s model is the one that is most widely used
and is a model that is commonly used and embedded into the design of computerized argument
diagramming software (Hichcock & Verheij, 2006).
Figure 2.1. Toulmin's model of arguments (Toulmin, 1958, p. 104)
so
unless since
On account of

20
An argument consists in its most simple form of a conclusion and premise(s). A
conclusion is what the speaker/author argues. Premises are claims provided to support or oppose
the conclusion. The argument grows more complex when co-premises, objections, and rebuttals
are added to the argument. Co-premises are two or more premises that mutually support a given
conclusion or higher-order premise. An objection is a reason that challenges the veracity of
conclusions, premises and/or minor premises, whereas a rebuttal is an objection to an objection.
Figure 2.2 provides an illustration of a hierarchically structured argument that consists of the
elements described above (conclusion, premise and co-premises, objections, rebuttals).
Figure 2.2. An example of an argument structure (Rider & Thomason, 2008, p.18)
21
Problems in Real-World Arguments
In real-world settings, arguments are formulated, analyzed, and evaluated to resolve
social and scientific controversies and to generate solutions to complex problems (Taylor, 1996).
Contrary to formal arguments, which are well structured and complete, real-world problems and
arguments are ill-structured, incomplete, and complex (Jonassen, 1997). As a result, the
arguments presented to resolve conflicts and to solve such problems are also ill-structured and
complex. For example, the global warming argument is multifaceted in that it involves science,
economics, and health issues. Hence, one must consider all factors to make a good decision or
find a good solution. As arguments become more complex, understanding such arguments
becomes increasingly difficult.
Furthermore, real-world arguments are often presented in ways that make the arguments
difficult to analyze and evaluate. Sometimes, the conclusion in an argument is not stated
explicitly (Govier, 1987). In such cases, one must at times infer a speaker’s position and
conclusion based on the lines of reasoning and claims present within the argument (but only
when the claims and lines of reasoning are presented clearly). Likewise, the premises and/or
assumptions underlying the argument may be missing or poorly stated (Govier, 1987). In this
case, one must fill in the gaps by identifying the missing premises and assumptions, and if one is
unable to do this, an accurate evaluation of the argument may be very difficult if not impossible
to accomplish. However, the process of identifying missing premises (as well as the relationships
between multiple premises) can be facilitated by creating argument maps - visual diagrams that
are constructed during the process of mapping and flushing out the possible relationships
between stated premises and conclusions.
22
Approach to Argument Analysis
To facilitate the process of analyzing ill-structured, incomplete, and complex arguments,
Scriven (1976) prescribed a seven-step process (Table 2.1).
Table 2.1
The Seven Steps in Argument Analysis. Adapted from Scriven (1976, p. 39)
Step # Description of Each Step
Step 1. Clarification of Meaning (of the argument and of its components)
Step 2. Identification of Conclusions (stated and unstated)
Step 3. Portrayal of Structure
Step 4. Formulation of (Unstated) Assumptions (the ‘missing premises’)
Step 5. Criticism of
a. The Premises (given and ‘missing’)
b. The Inferences
Step 6. Introduction of Other Relevant Arguments
Step 7. Overall Evaluation of Argument in Light of Information Produced from steps 1
through 6.
The first step is to clarify the “meaning of the argument and of components” (1976, p.39).
In this step, students read arguments for comprehension, define terms when needed and identify
unstated premises, if any. The second step is to identify main and/or secondary conclusions.
After this step, students create the relational structure between premises and conclusions by
numbering each claim and linking premises and conclusions in a tree diagram (Figure 2.3). This
structure shows the hierarchical relationships between claims, and flows from top to bottom to
diagram the argument’s structure (with the main conclusion placed at the bottom of the diagram).
In this particular step, Scriven stressed the importance of finding ‘missing premises’ or ‘missing
assumptions’ to infer the relationships. He suggested the use of parentheses when there are
unstated premises or conclusions in the argument (Figure 2.3). The fourth step, which is the most
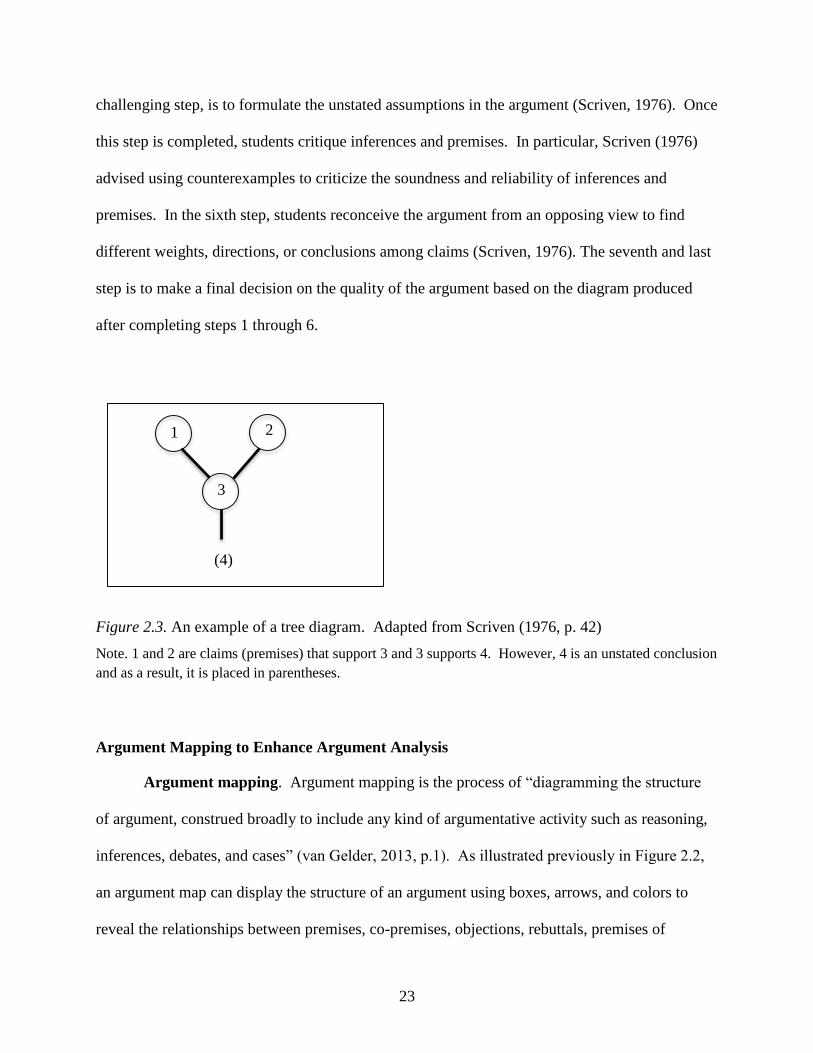
23
challenging step, is to formulate the unstated assumptions in the argument (Scriven, 1976). Once
this step is completed, students critique inferences and premises. In particular, Scriven (1976)
advised using counterexamples to criticize the soundness and reliability of inferences and
premises. In the sixth step, students reconceive the argument from an opposing view to find
different weights, directions, or conclusions among claims (Scriven, 1976). The seventh and last
step is to make a final decision on the quality of the argument based on the diagram produced
after completing steps 1 through 6.
Figure 2.3. An example of a tree diagram. Adapted from Scriven (1976, p. 42)
Note. 1 and 2 are claims (premises) that support 3 and 3 supports 4. However, 4 is an unstated conclusion
and as a result, it is placed in parentheses.
Argument Mapping to Enhance Argument Analysis
Argument mapping. Argument mapping is the process of “diagramming the structure
of argument, construed broadly to include any kind of argumentative activity such as reasoning,
inferences, debates, and cases” (van Gelder, 2013, p.1). As illustrated previously in Figure 2.2,
an argument map can display the structure of an argument using boxes, arrows, and colors to
reveal the relationships between premises, co-premises, objections, rebuttals, premises of
1
3
2
(4)
24
premises, and a major conclusion. Boxes contain a claim stated like a conclusion and the
premises. Lines and arrows represent the relationship between claims. The color of arrows or
boxes indicates whether a claim supports or opposes the upper premise or conclusion.
Visualizing an argument helps students enhance reasoning skills and critical thinking
(Harrell, 2007; Twardy, 2004; van Gelder, 2002a). Drawing an argument map can facilitate
argument analysis because of the following reasons: 1) the ease with which the boxes can be
visually scanned, moved, and positioned in relation to one another enables the student to
manipulate and explore the possible relationships between the boxes; 2) the cognitive load
placed on the learner while performing this complex process is reduced considerably by enabling
the learner to analyze abstract ideas using both visual and spatial representations (Harrell, 2007);
and as a result, 3) the student can allocate more cognitive resources to identify the relationships
between claims and premises, identify the structure of the argument, and assess the validity
and/or strength of the claims.
Argument-mapping software. To facilitate the process of mapping out arguments,
argument mapping software programs have been developed and tested to determine their effects
on students’ critical thinking/argument analysis skills. Reason!Able is a computerized argument-
mapping tool originally developed by van Gelder (2001) to help people understand informal
reasoning and identify the structure of an argument. The latest upgrade to the Reason!Able
software (van Gelder, 2002a) is the Rationale software application (van Gelder, 2007). Rationale
was designed purposely to support argument mapping. As a result, it provides a set of unique
functions to help people map out and identify the structure of a complex argument. For example,
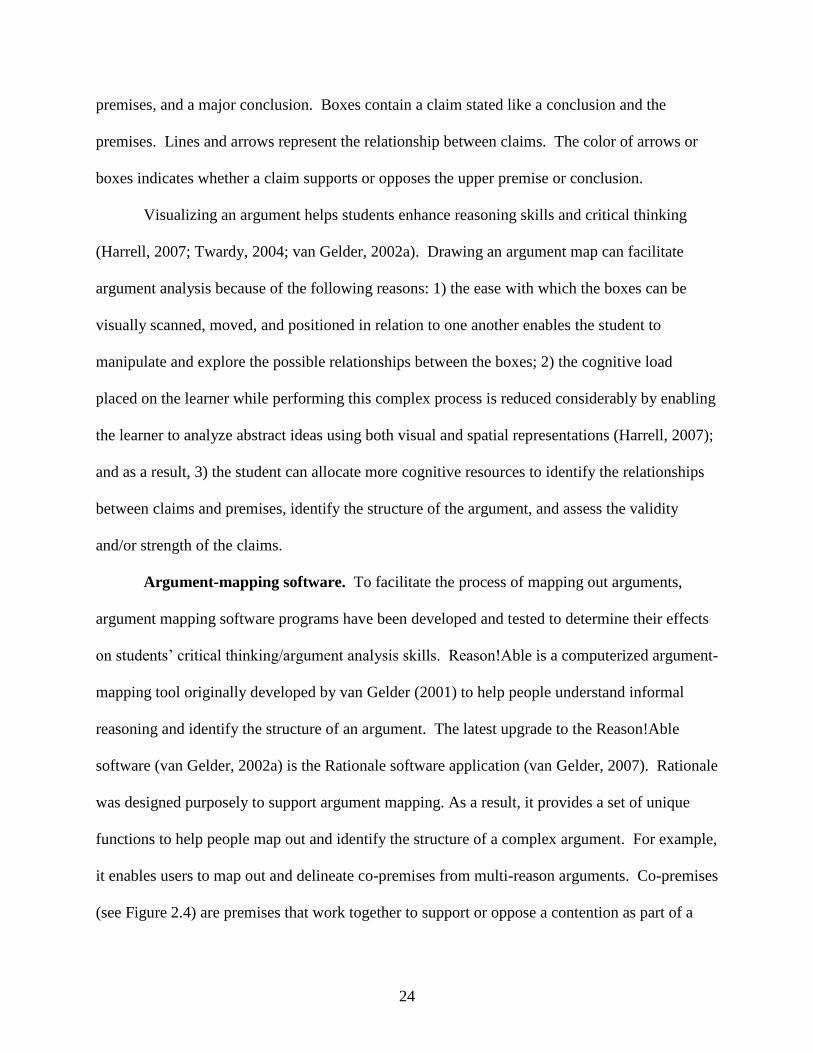
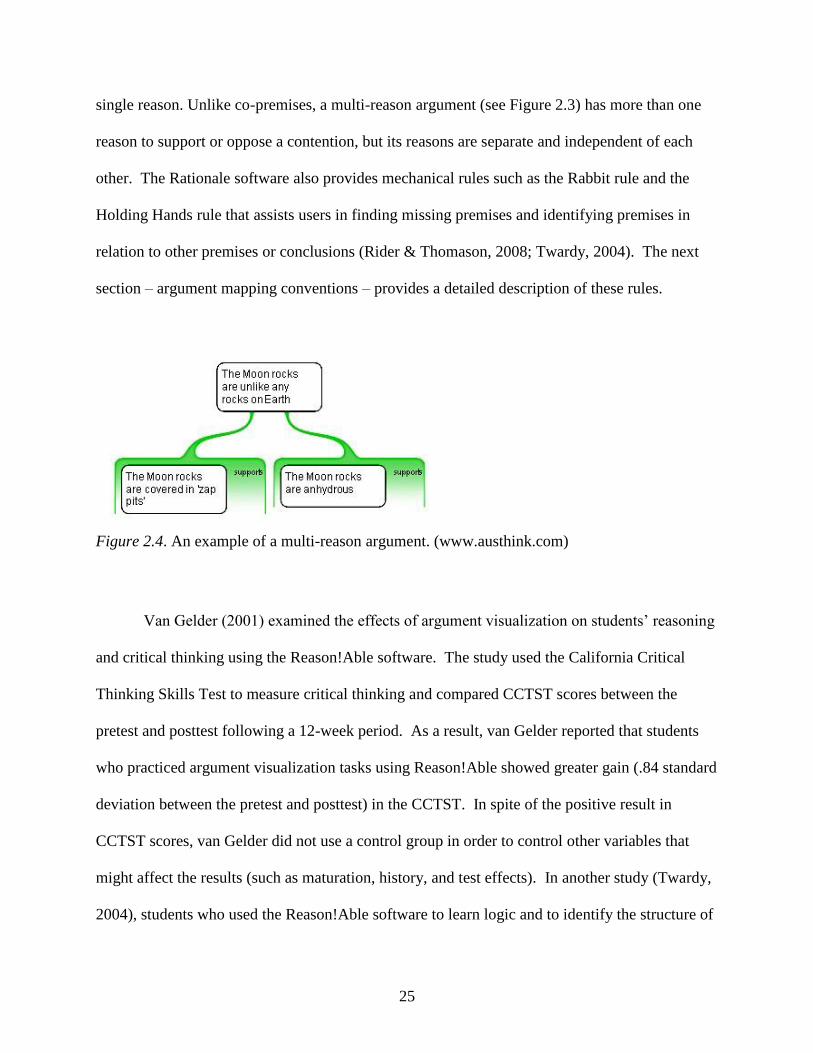
it enables users to map out and delineate co-premises from multi-reason arguments. Co-premises
(see Figure 2.4) are premises that work together to support or oppose a contention as part of a
25
single reason. Unlike co-premises, a multi-reason argument (see Figure 2.3) has more than one
reason to support or oppose a contention, but its reasons are separate and independent of each
other. The Rationale software also provides mechanical rules such as the Rabbit rule and the
Holding Hands rule that assists users in finding missing premises and identifying premises in
relation to other premises or conclusions (Rider & Thomason, 2008; Twardy, 2004). The next
section – argument mapping conventions – provides a detailed description of these rules.
Figure 2.4. An example of a multi-reason argument. (www.austhink.com)
Van Gelder (2001) examined the effects of argument visualization on students’ reasoning
and critical thinking using the Reason!Able software. The study used the California Critical
Thinking Skills Test to measure critical thinking and compared CCTST scores between the
pretest and posttest following a 12-week period. As a result, van Gelder reported that students
who practiced argument visualization tasks using Reason!Able showed greater gain (.84 standard
deviation between the pretest and posttest) in the CCTST. In spite of the positive result in
CCTST scores, van Gelder did not use a control group in order to control other variables that
might affect the results (such as maturation, history, and test effects). In another study (Twardy,
2004), students who used the Reason!Able software to learn logic and to identify the structure of
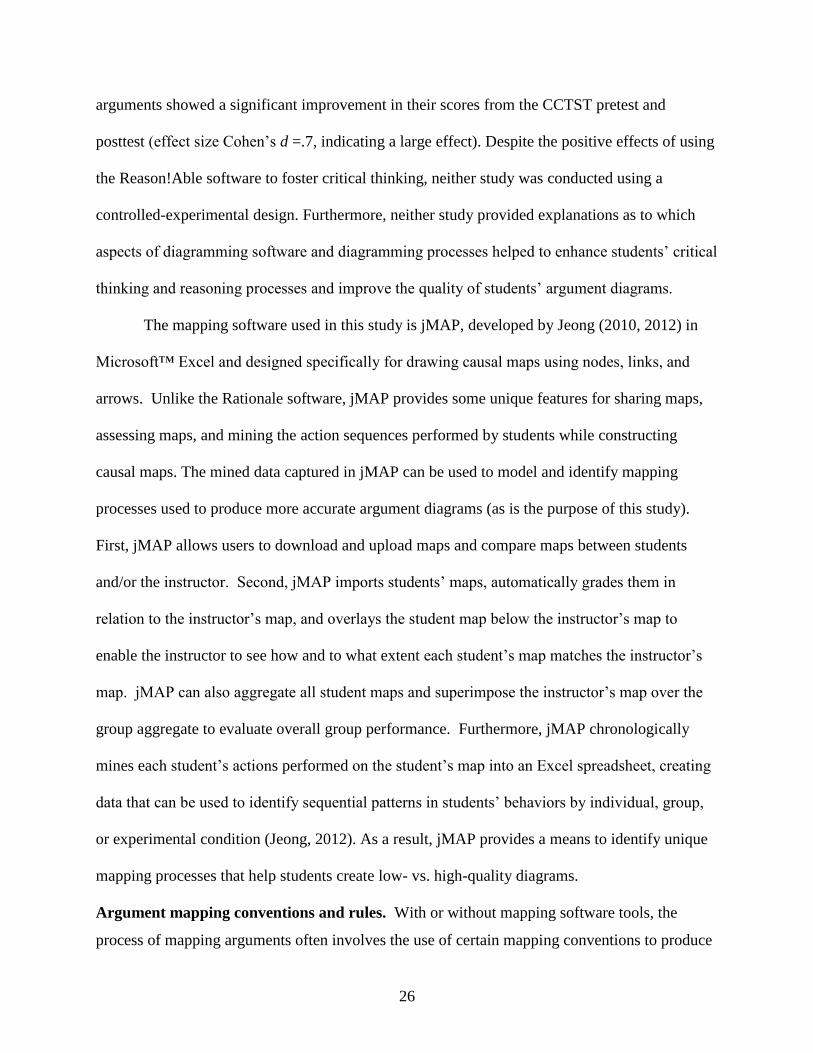
26
arguments showed a significant improvement in their scores from the CCTST pretest and
posttest (effect size Cohen’s d =.7, indicating a large effect). Despite the positive effects of using
the Reason!Able software to foster critical thinking, neither study was conducted using a
controlled-experimental design. Furthermore, neither study provided explanations as to which
aspects of diagramming software and diagramming processes helped to enhance students’ critical
thinking and reasoning processes and improve the quality of students’ argument diagrams.
The mapping software used in this study is jMAP, developed by Jeong (2010, 2012) in
Microsoft™ Excel and designed specifically for drawing causal maps using nodes, links, and
arrows. Unlike the Rationale software, jMAP provides some unique features for sharing maps,
assessing maps, and mining the action sequences performed by students while constructing
causal maps. The mined data captured in jMAP can be used to model and identify mapping
processes used to produce more accurate argument diagrams (as is the purpose of this study).
First, jMAP allows users to download and upload maps and compare maps between students
and/or the instructor. Second, jMAP imports students’ maps, automatically grades them in
relation to the instructor’s map, and overlays the student map below the instructor’s map to
enable the instructor to see how and to what extent each student’s map matches the instructor’s
map. jMAP can also aggregate all student maps and superimpose the instructor’s map over the
group aggregate to evaluate overall group performance. Furthermore, jMAP chronologically
mines each student’s actions performed on the student’s map into an Excel spreadsheet, creating
data that can be used to identify sequential patterns in students’ behaviors by individual, group,
or experimental condition (Jeong, 2012). As a result, jMAP provides a means to identify unique
mapping processes that help students create low- vs. high-quality diagrams.
Argument mapping conventions and rules. With or without mapping software tools, the
process of mapping arguments often involves the use of certain mapping conventions to produce
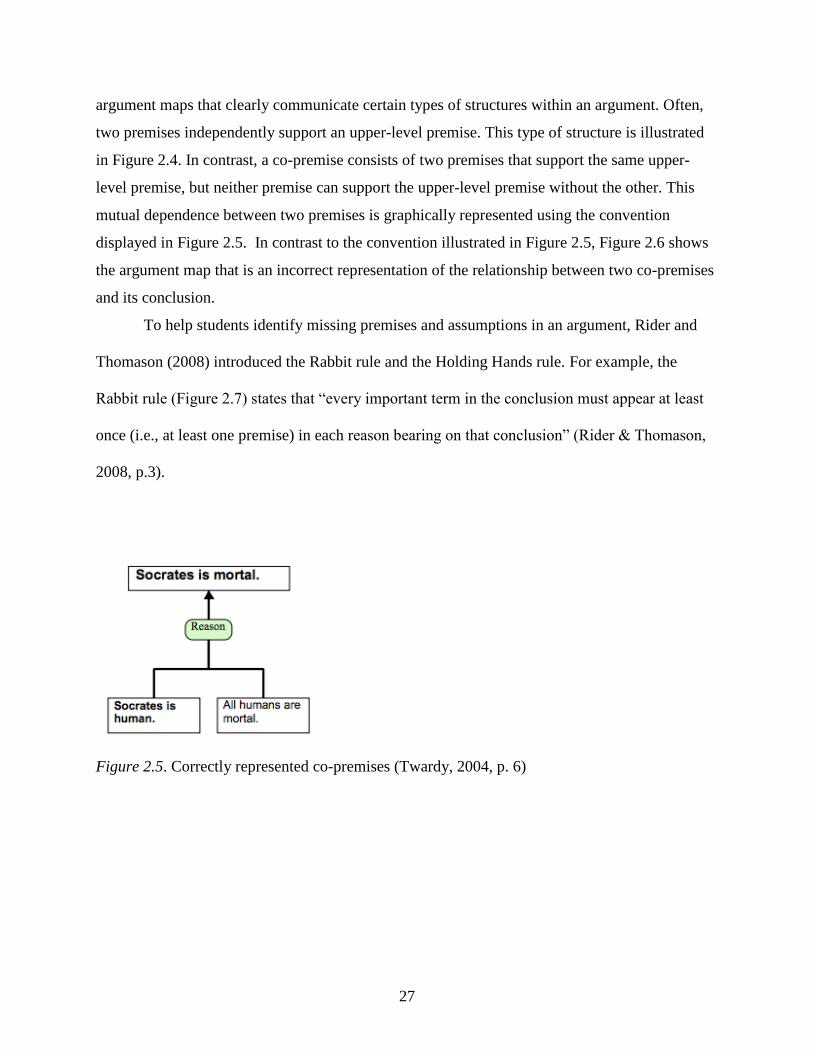
27
argument maps that clearly communicate certain types of structures within an argument. Often,
two premises independently support an upper-level premise. This type of structure is illustrated
in Figure 2.4. In contrast, a co-premise consists of two premises that support the same upper-
level premise, but neither premise can support the upper-level premise without the other. This
mutual dependence between two premises is graphically represented using the convention
displayed in Figure 2.5. In contrast to the convention illustrated in Figure 2.5, Figure 2.6 shows
the argument map that is an incorrect representation of the relationship between two co-premises
and its conclusion.
To help students identify missing premises and assumptions in an argument, Rider and
Thomason (2008) introduced the Rabbit rule and the Holding Hands rule. For example, the
Rabbit rule (Figure 2.7) states that “every important term in the conclusion must appear at least
once (i.e., at least one premise) in each reason bearing on that conclusion” (Rider & Thomason,
2008, p.3).
Figure 2.5. Correctly represented co-premises (Twardy, 2004, p. 6)
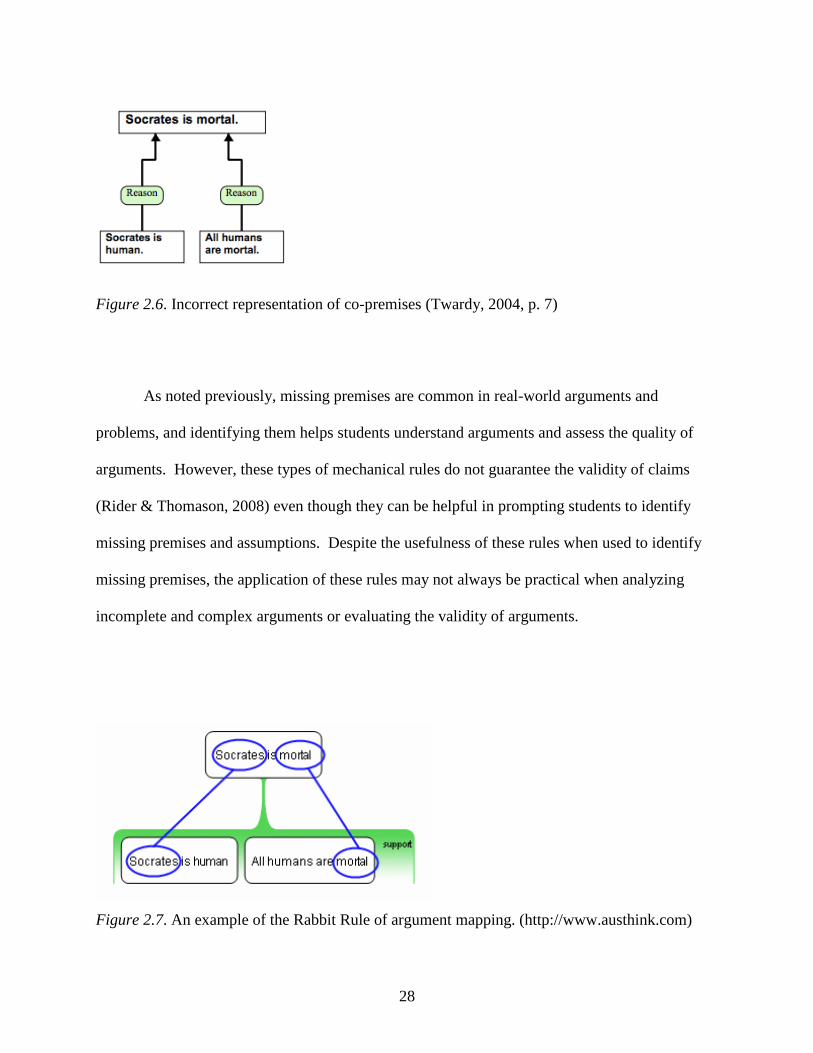
28
Figure 2.6. Incorrect representation of co-premises (Twardy, 2004, p. 7)
As noted previously, missing premises are common in real-world arguments and
problems, and identifying them helps students understand arguments and assess the quality of
arguments. However, these types of mechanical rules do not guarantee the validity of claims
(Rider & Thomason, 2008) even though they can be helpful in prompting students to identify
missing premises and assumptions. Despite the usefulness of these rules when used to identify
missing premises, the application of these rules may not always be practical when analyzing
incomplete and complex arguments or evaluating the validity of arguments.
Figure 2.7. An example of the Rabbit Rule of argument mapping. (http://www.austhink.com)
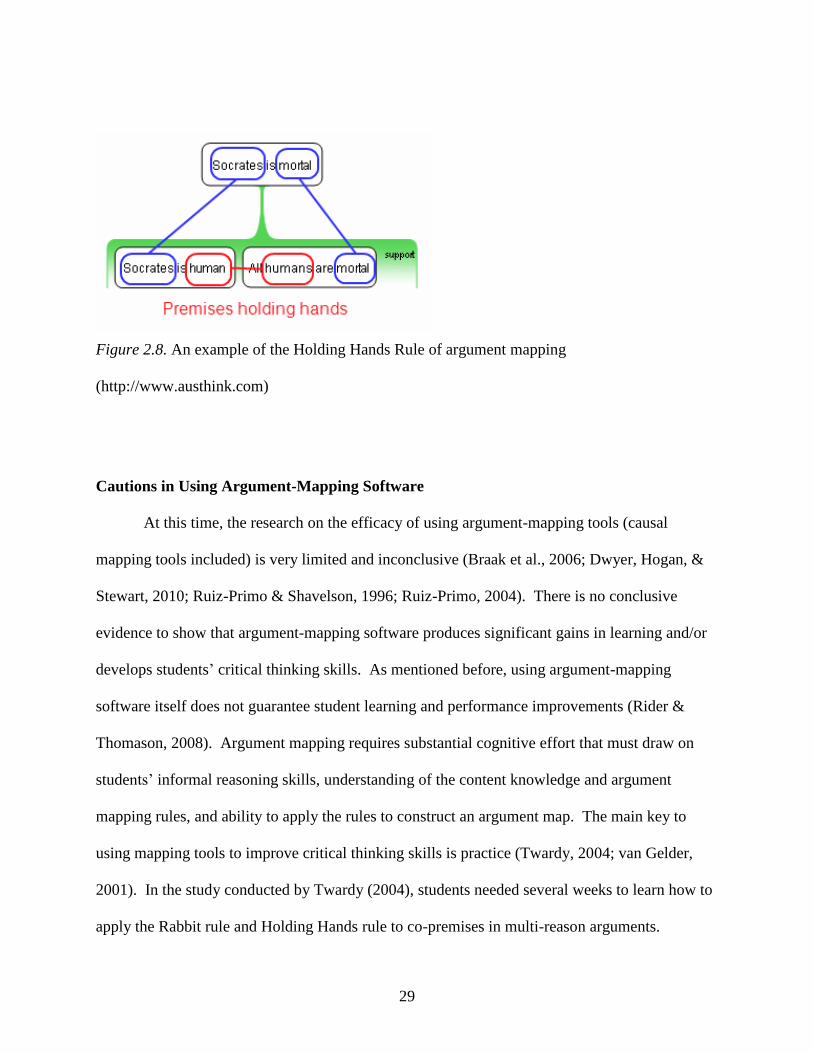
29
Figure 2.8. An example of the Holding Hands Rule of argument mapping
(http://www.austhink.com)
Cautions in Using Argument-Mapping Software
At this time, the research on the efficacy of using argument-mapping tools (causal
mapping tools included) is very limited and inconclusive (Braak et al., 2006; Dwyer, Hogan, &
Stewart, 2010; Ruiz-Primo & Shavelson, 1996; Ruiz-Primo, 2004). There is no conclusive
evidence to show that argument-mapping software produces significant gains in learning and/or
develops students’ critical thinking skills. As mentioned before, using argument-mapping
software itself does not guarantee student learning and performance improvements (Rider &
Thomason, 2008). Argument mapping requires substantial cognitive effort that must draw on
students’ informal reasoning skills, understanding of the content knowledge and argument
mapping rules, and ability to apply the rules to construct an argument map. The main key to
using mapping tools to improve critical thinking skills is practice (Twardy, 2004; van Gelder,
2001). In the study conducted by Twardy (2004), students needed several weeks to learn how to
apply the Rabbit rule and Holding Hands rule to co-premises in multi-reason arguments.
30
Furthermore, Rider and Thomason (2008) suggest that critical thinking skills require repeated
practice with gradual increases in the complexity of arguments.
Despite the finding that learning the processes used to produce accurate argument
diagrams takes time and practice, no research at this time has been conducted to empirically test
and determine which map construction processes (and the reasoning processes that are reflected
in the map construction processes) produce more versus less accurate argument maps. Previous
studies on argument mapping have focused almost solely on assessing the quality of students’
final maps as a product of the mapping activity, and have tested the effects of argument-mapping
activities on students’ scores on traditional critical thinking tests (Braak et al., 2006).
Furthermore, the findings from these previous studies on the effectiveness of argument maps are
inconclusive due to flaws in experimental design, the measures used in the studies, and the small
numbers of empirical studies that have been conducted thus far. Without a deeper understanding
of underlying processes of reasoning used to construct an accurate argument map, it is difficult to
determine what aspects of a particular mapping program help or inhibit students’ ability to
produce high versus low-quality argument maps. Identifying and understanding the actual
processes students perform (which is the purpose of this study) while analyzing and mapping
arguments may help to explain when and why particular mapping programs work and do not
work.
Reasoning Processes
To explain reasoning processes used for argument diagramming, two theories from
psychology serve as the theoretical framework: The one-process theory and the dual-process
theory. The one-process theory presumes that, in general, one type of reasoning governs the
processes used to perform induction and deduction on reasoning (Johnson-Laird, 1983). In
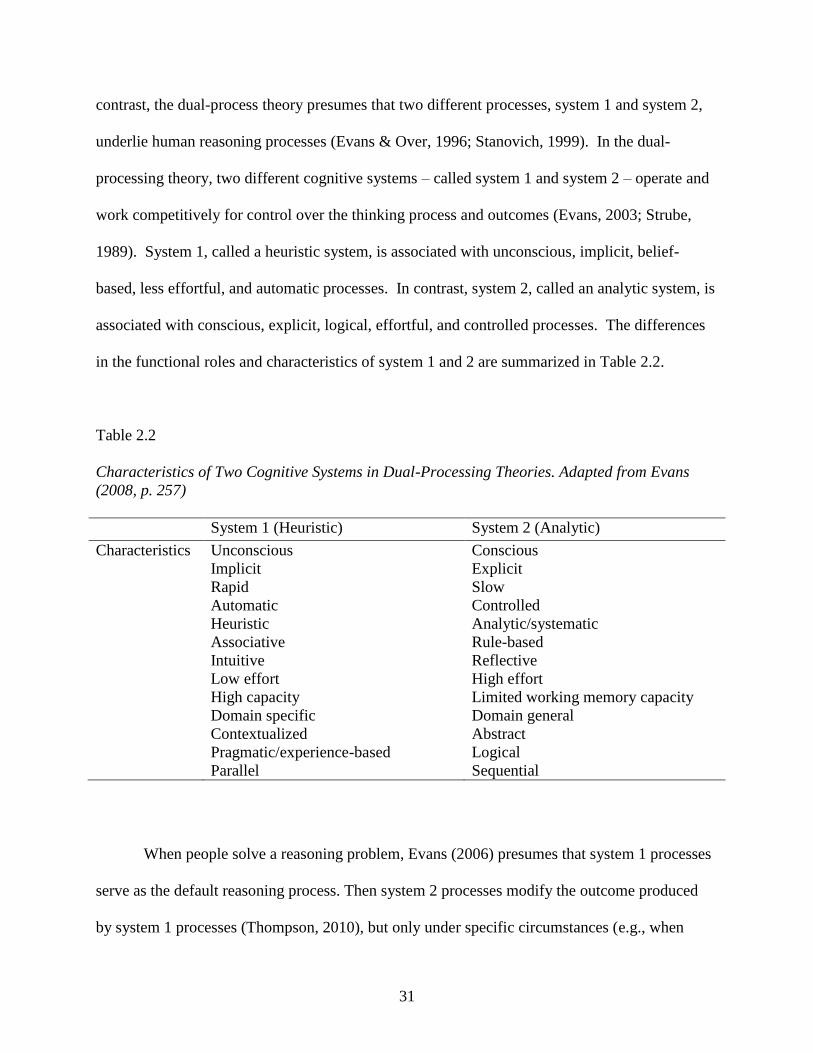
31
contrast, the dual-process theory presumes that two different processes, system 1 and system 2,
underlie human reasoning processes (Evans & Over, 1996; Stanovich, 1999). In the dual-
processing theory, two different cognitive systems – called system 1 and system 2 – operate and
work competitively for control over the thinking process and outcomes (Evans, 2003; Strube,
1989). System 1, called a heuristic system, is associated with unconscious, implicit, belief-
based, less effortful, and automatic processes. In contrast, system 2, called an analytic system, is
associated with conscious, explicit, logical, effortful, and controlled processes. The differences
in the functional roles and characteristics of system 1 and 2 are summarized in Table 2.2.
Table 2.2
Characteristics of Two Cognitive Systems in Dual-Processing Theories. Adapted from Evans
(2008, p. 257)
System 1 (Heuristic) System 2 (Analytic)
Characteristics Unconscious
Implicit
Rapid
Automatic
Heuristic
Associative
Intuitive
Low effort
High capacity
Domain specific
Contextualized
Pragmatic/experience-based
Parallel
Conscious
Explicit
Slow
Controlled
Analytic/systematic
Rule-based
Reflective
High effort
Limited working memory capacity
Domain general
Abstract
Logical
Sequential
When people solve a reasoning problem, Evans (2006) presumes that system 1 processes
serve as the default reasoning process. Then system 2 processes modify the outcome produced
by system 1 processes (Thompson, 2010), but only under specific circumstances (e.g., when
32
there is sufficient time to revisit answers or to engage in metacognitive judgments, when given
certain deductive or inductive instructions). Also, content and context can play an important role
as to when system 1 is automatically activated because system 1 processes are largely reliant on
the retrieval of knowledge and experiences from memory that are relevant to the problem at hand
(Verschueren et al., 2005). Even though the two systems do not exactly correspond to induction
and deduction, the dual-process theories presume that inductive reasoning relies primarily on
system 1, which is fast, heuristic, and affected by context, whereas deductive reasoning is more
likely to rely on system 2, which is more deliberative, analytic and rule-based (Heit, 2007).
Although the dual-processing theory provides a useful framework to help us understand
the nature of some of the cognitive processes underlying reasoning, the constructs used to
differentiate system 1 from system 2 presented in Table 2.2 may not be mutually exclusive. In
addition, studies that have tested the dual-processing theories have produced either inconsistent
or inconclusive findings, which could largely be attributed to problems with the operational
definitions of each construct (Evans, 2008). Furthermore, studies have shown that one’s
heuristic response or analytic response can involve processes associated with either system 1 or
system 2 processes (De Neys, 2006). For example, an expert might appear to solve a logical task
using a rapid automatic process. However, this does not preclude the possibility that the expert is
putting forth high levels of conscious cognitive effort, given that the expert can also rely on his
or her prior experience and abundant practice to help complete the task rapidly. This suggests
that a particular outcome (e.g., rapid completion of task) is by no means a clear or certain
indication of the processes that are used to achieve that outcome. As a result, outcome measures
cannot and should not be used to determine what processes are being used (De Neys, 2006).
33
To address some of these issues, Evans (2008) suggests that the two systems should be
integrated into a single system by centering and tying these characteristics to the construct of
working memory and information processing processes. Working memory (WM) is considered
to be the executive controller of cognitive processes and, in particular, supports reasoning and
comprehension (Baddley & Hitch, 1974). Studies have found that people with high WM
capacity perform better than those with low WM capacities when reasoning tasks conflict with
their beliefs (Stanovich & West, 2000) and emotions (De Neys, 2006). These findings provide
some evidence (although at only a surface level) to support the hypotheses that the processes
used to analyze arguments can differ and can influence the quality and accuracy of one’s
argument analysis and understanding of complex arguments. The purpose of this study is to
break down the processes that people use when analyzing a complex argument into explicit,
more detailed, and discrete action sequences (and the cognitive operations associated with those
actions) to fully examine, model, and better understand the actual processes that support/inhibit
argument analysis.
Effects of Content and Context on Reasoning Processes
In addition to the effects of processes on argument analysis, psychologists have found
that content effects (Johnson-Laird, 2008), individual differences (i.e., intelligence; Evans, 2002;
Stanovich, 1999), and belief bias (Klauer, Musch, & Naumer, 2000) can influence human
reasoning process and outcomes (Evans, 2002). Although competence in reasoning skills is
believed to be independent of context or content (Evans, 2002), everyday reasoning in real life
involves “probabilistic, uncertain, approximate reasoning” (Heit, 2007). This type of reasoning is
inductive in nature, and hence is highly influenced by content and context. In fact, researchers
have found that people tend not to use deductive reasoning to solve every day reasoning
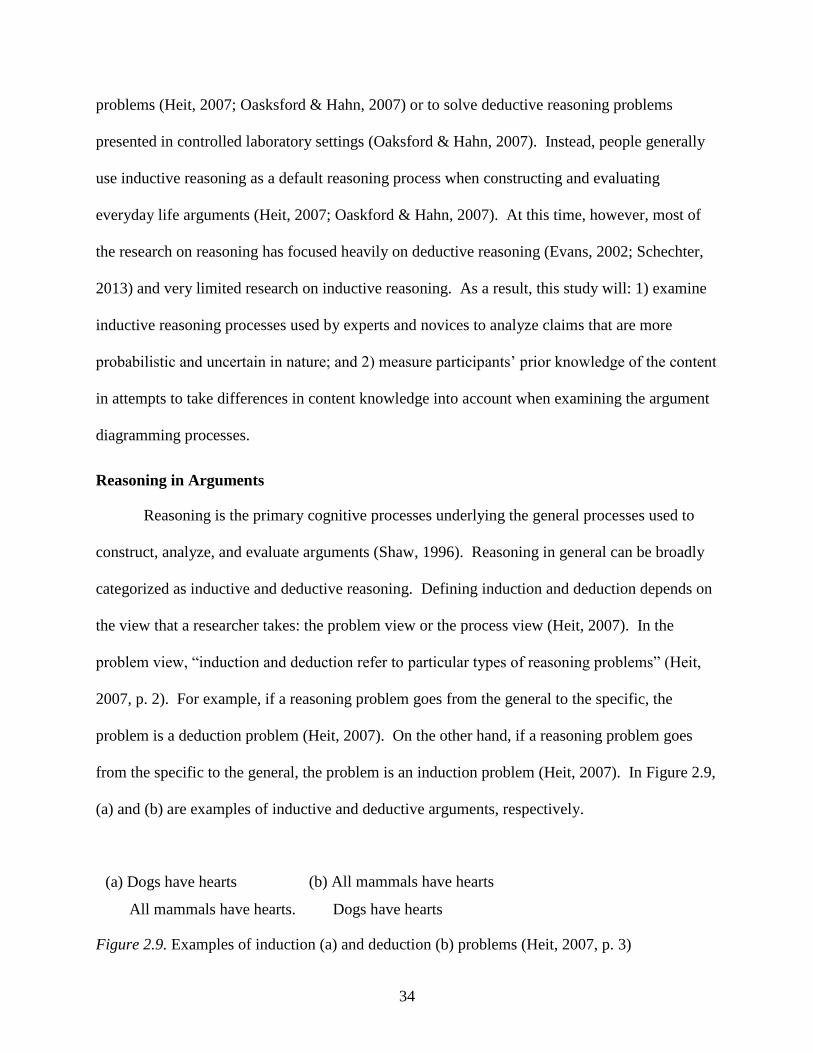
34
problems (Heit, 2007; Oasksford & Hahn, 2007) or to solve deductive reasoning problems
presented in controlled laboratory settings (Oaksford & Hahn, 2007). Instead, people generally
use inductive reasoning as a default reasoning process when constructing and evaluating
everyday life arguments (Heit, 2007; Oaskford & Hahn, 2007). At this time, however, most of
the research on reasoning has focused heavily on deductive reasoning (Evans, 2002; Schechter,
2013) and very limited research on inductive reasoning. As a result, this study will: 1) examine
inductive reasoning processes used by experts and novices to analyze claims that are more
probabilistic and uncertain in nature; and 2) measure participants’ prior knowledge of the content
in attempts to take differences in content knowledge into account when examining the argument
diagramming processes.
Reasoning in Arguments
Reasoning is the primary cognitive processes underlying the general processes used to
construct, analyze, and evaluate arguments (Shaw, 1996). Reasoning in general can be broadly
categorized as inductive and deductive reasoning. Defining induction and deduction depends on
the view that a researcher takes: the problem view or the process view (Heit, 2007). In the
problem view, “induction and deduction refer to particular types of reasoning problems” (Heit,
2007, p. 2). For example, if a reasoning problem goes from the general to the specific, the
problem is a deduction problem (Heit, 2007). On the other hand, if a reasoning problem goes
from the specific to the general, the problem is an induction problem (Heit, 2007). In Figure 2.9,
(a) and (b) are examples of inductive and deductive arguments, respectively.
(a) Dogs have hearts
All mammals have hearts.
(b) All mammals have hearts
Dogs have hearts
Figure 2.9. Examples of induction (a) and deduction (b) problems (Heit, 2007, p. 3)
35
From the process view of reasoning, “induction and deduction refer to psychological
processes” (Heit, 2007, p.2) and the question as to whether a problem is an induction or
deduction problem is irrelevant. Instead, the question of interest is which type of reasoning
processes (induction or deduction process) are used by people to arrive at a conclusion. In this
case, deductive reasoning is a psychological process that draws a valid conclusion based on the
given assumption that all premises are true (Johnson-Laird, 1999). In contrast, inductive
reasoning is a psychological process that infers a probability of conclusions to be plausible given
a set of premises, but this type of reasoning process does not guarantee the truth of its
conclusions even when all premises support or enable the conclusions (Schechter, 2013). In
summary, the goals of deductive and inductive reasoning are to arrive at an answer as to whether
or not a conclusion is true or false given the premises and to judge whether or not a conclusion is
strong/weak or plausible/implausible, respectively. The processes of inductive reasoning will be
examined in this particular study.
Informal Arguments in Everyday Life
Informal, “everyday life” arguments (such as those found in newspapers, advertisement
and academic journals) differ from formal arguments in terms of the structure of the arguments
and the rules used to evaluate the arguments. Shaw (1996) described two main characteristics of
informal arguments. First, informal arguments do not have an explicit formal argument structure
of premises and a conclusion. Instead, informal arguments include missing premises or unstated
assumptions and supporting and/or opposing premises. Second, informal arguments require
more inductive reasoning than deductive reasoning due to the fact that oftentimes formal logical
rules are not applicable to evaluating informal arguments. Informal arguments are ill-defined
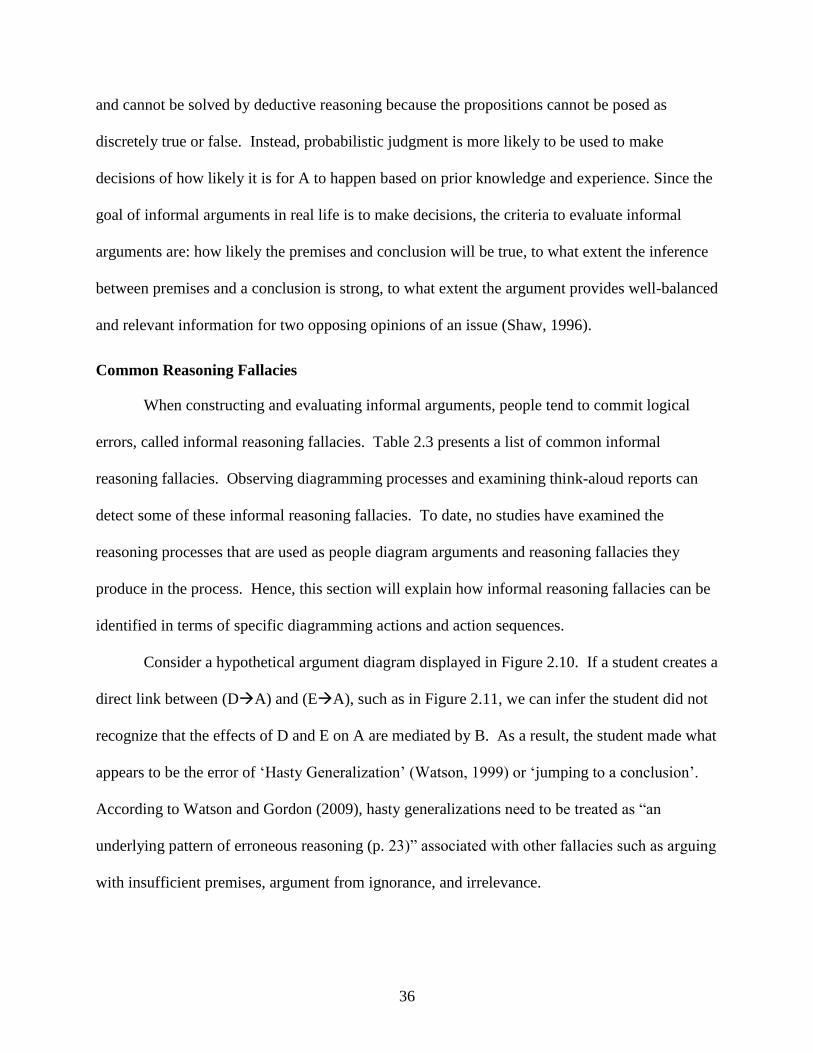
36
and cannot be solved by deductive reasoning because the propositions cannot be posed as
discretely true or false. Instead, probabilistic judgment is more likely to be used to make
decisions of how likely it is for A to happen based on prior knowledge and experience. Since the
goal of informal arguments in real life is to make decisions, the criteria to evaluate informal
arguments are: how likely the premises and conclusion will be true, to what extent the inference
between premises and a conclusion is strong, to what extent the argument provides well-balanced
and relevant information for two opposing opinions of an issue (Shaw, 1996).
Common Reasoning Fallacies
When constructing and evaluating informal arguments, people tend to commit logical
errors, called informal reasoning fallacies. Table 2.3 presents a list of common informal
reasoning fallacies. Observing diagramming processes and examining think-aloud reports can
detect some of these informal reasoning fallacies. To date, no studies have examined the
reasoning processes that are used as people diagram arguments and reasoning fallacies they
produce in the process. Hence, this section will explain how informal reasoning fallacies can be
identified in terms of specific diagramming actions and action sequences.
Consider a hypothetical argument diagram displayed in Figure 2.10. If a student creates a
direct link between (DA) and (EA), such as in Figure 2.11, we can infer the student did not
recognize that the effects of D and E on A are mediated by B. As a result, the student made what
appears to be the error of ‘Hasty Generalization’ (Watson, 1999) or ‘jumping to a conclusion’.
According to Watson and Gordon (2009), hasty generalizations need to be treated as “an
underlying pattern of erroneous reasoning (p. 23)” associated with other fallacies such as arguing
with insufficient premises, argument from ignorance, and irrelevance.
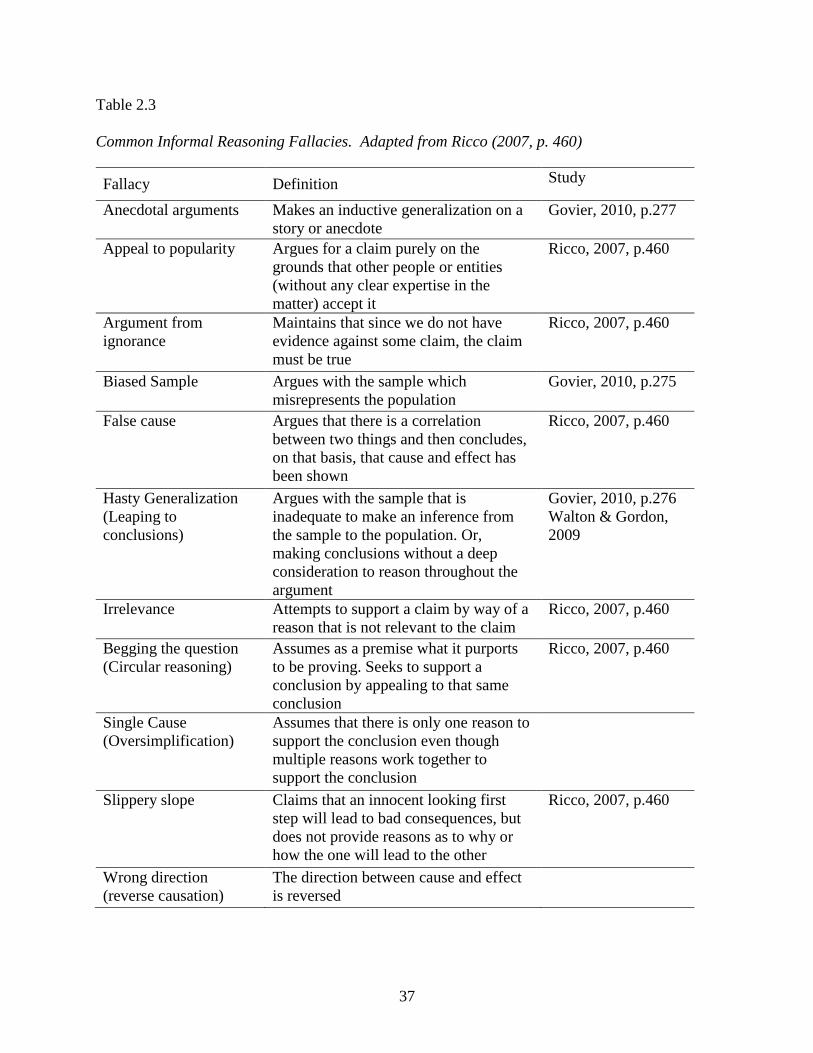
37
Table 2.3
Common Informal Reasoning Fallacies. Adapted from Ricco (2007, p. 460)
Fallacy Definition Study
Anecdotal arguments Makes an inductive generalization on a
story or anecdote
Govier, 2010, p.277
Appeal to popularity Argues for a claim purely on the
grounds that other people or entities
(without any clear expertise in the
matter) accept it
Ricco, 2007, p.460
Argument from
ignorance
Maintains that since we do not have
evidence against some claim, the claim
must be true
Ricco, 2007, p.460
Biased Sample Argues with the sample which
misrepresents the population
Govier, 2010, p.275
False cause Argues that there is a correlation
between two things and then concludes,
on that basis, that cause and effect has
been shown
Ricco, 2007, p.460
Hasty Generalization
(Leaping to
conclusions)
Argues with the sample that is
inadequate to make an inference from
the sample to the population. Or,
making conclusions without a deep
consideration to reason throughout the
argument
Govier, 2010, p.276
Walton & Gordon,
2009
Irrelevance Attempts to support a claim by way of a
reason that is not relevant to the claim
Ricco, 2007, p.460
Begging the question
(Circular reasoning)
Assumes as a premise what it purports
to be proving. Seeks to support a
conclusion by appealing to that same
conclusion
Ricco, 2007, p.460
Single Cause
(Oversimplification)
Assumes that there is only one reason to
support the conclusion even though
multiple reasons work together to
support the conclusion
Slippery slope Claims that an innocent looking first
step will lead to bad consequences, but
does not provide reasons as to why or
how the one will lead to the other
Ricco, 2007, p.460
Wrong direction
(reverse causation)
The direction between cause and effect
is reversed
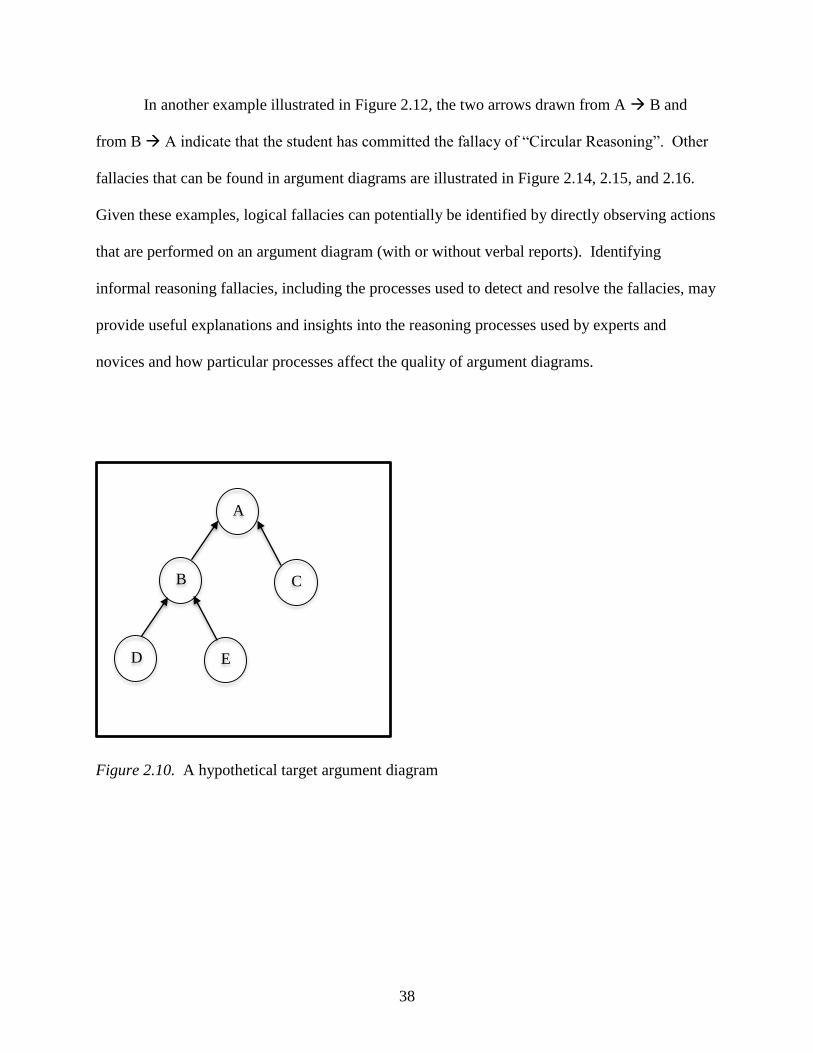
38
In another example illustrated in Figure 2.12, the two arrows drawn from A B and
from B A indicate that the student has committed the fallacy of “Circular Reasoning”. Other
fallacies that can be found in argument diagrams are illustrated in Figure 2.14, 2.15, and 2.16.
Given these examples, logical fallacies can potentially be identified by directly observing actions
that are performed on an argument diagram (with or without verbal reports). Identifying
informal reasoning fallacies, including the processes used to detect and resolve the fallacies, may
provide useful explanations and insights into the reasoning processes used by experts and
novices and how particular processes affect the quality of argument diagrams.
A
B C
D E
Figure 2.10. A hypothetical target argument diagram
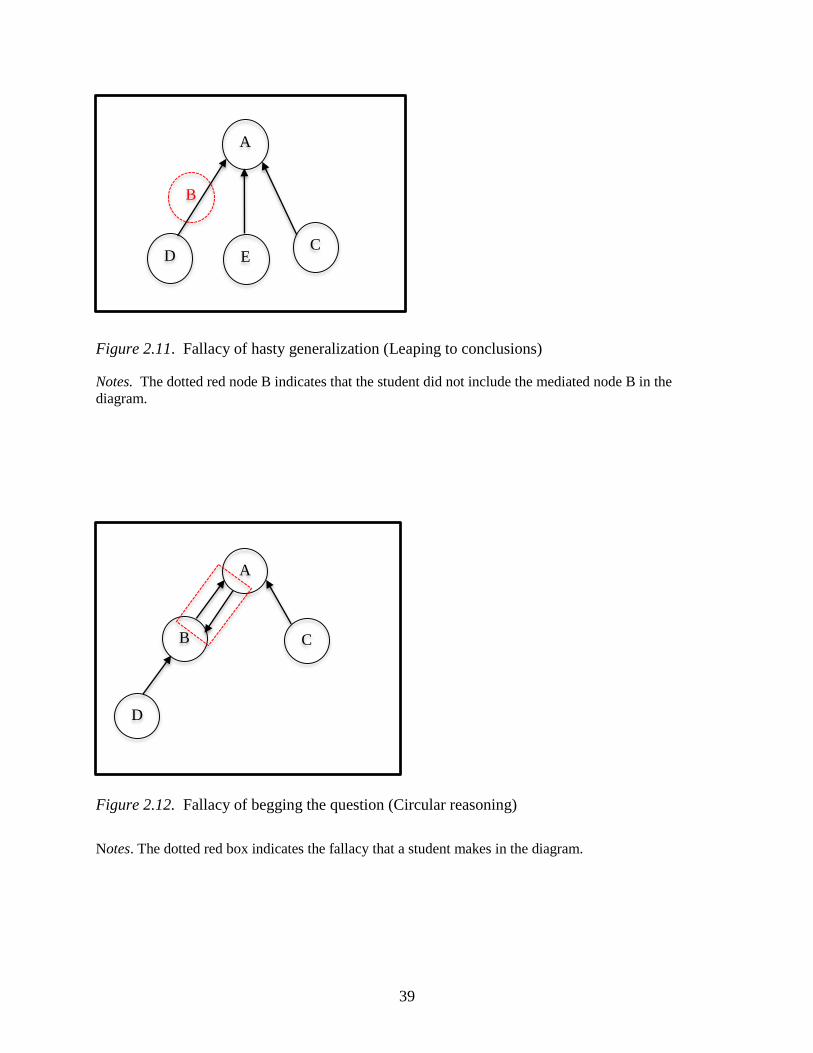
39
A
C D E
B
Figure 2.11. Fallacy of hasty generalization (Leaping to conclusions)
Notes. The dotted red node B indicates that the student did not include the mediated node B in the
diagram.
A
B C
D
Figure 2.12. Fallacy of begging the question (Circular reasoning)
Notes. The dotted red box indicates the fallacy that a student makes in the diagram.
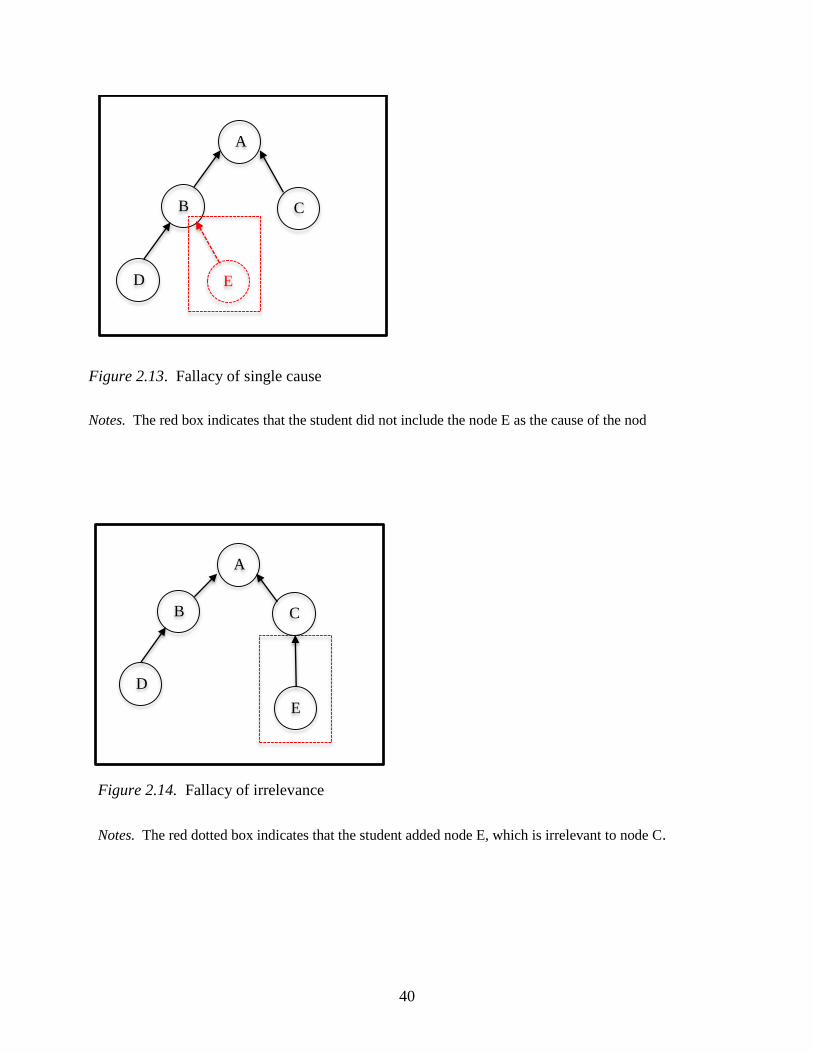
40
A
B C
D E
Figure 2.13. Fallacy of single cause
Notes. The red box indicates that the student did not include the node E as the cause of the node B in the diagram.
A
B C
D
E
Figure 2.14. Fallacy of irrelevance
Notes. The red dotted box indicates that the student added node E, which is irrelevant to node C.
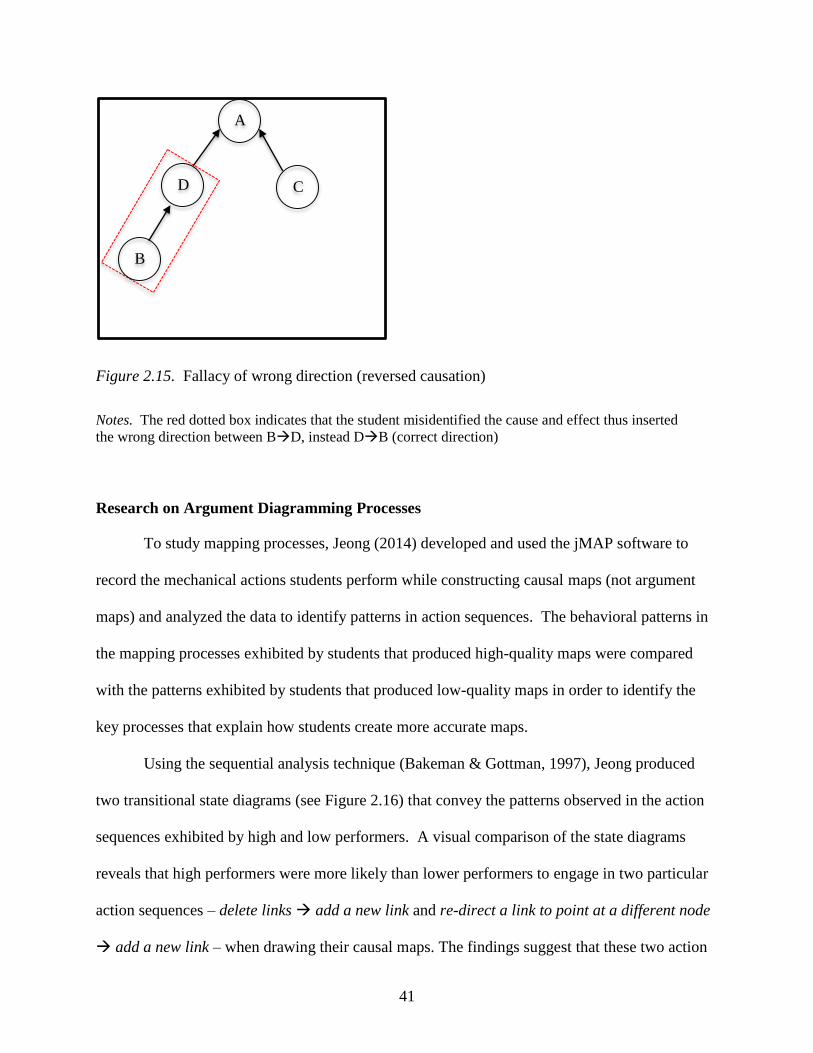
41
Research on Argument Diagramming Processes
To study mapping processes, Jeong (2014) developed and used the jMAP software to
record the mechanical actions students perform while constructing causal maps (not argument
maps) and analyzed the data to identify patterns in action sequences. The behavioral patterns in
the mapping processes exhibited by students that produced high-quality maps were compared
with the patterns exhibited by students that produced low-quality maps in order to identify the
key processes that explain how students create more accurate maps.
Using the sequential analysis technique (Bakeman & Gottman, 1997), Jeong produced
two transitional state diagrams (see Figure 2.16) that convey the patterns observed in the action
sequences exhibited by high and low performers. A visual comparison of the state diagrams
reveals that high performers were more likely than lower performers to engage in two particular
action sequences – delete links add a new link and re-direct a link to point at a different node
add a new link – when drawing their causal maps. The findings suggest that these two action
A
D C
B
Figure 2.15. Fallacy of wrong direction (reversed causation)
Notes. The red dotted box indicates that the student misidentified the cause and effect thus inserted
the wrong direction between BD, instead DB (correct direction)
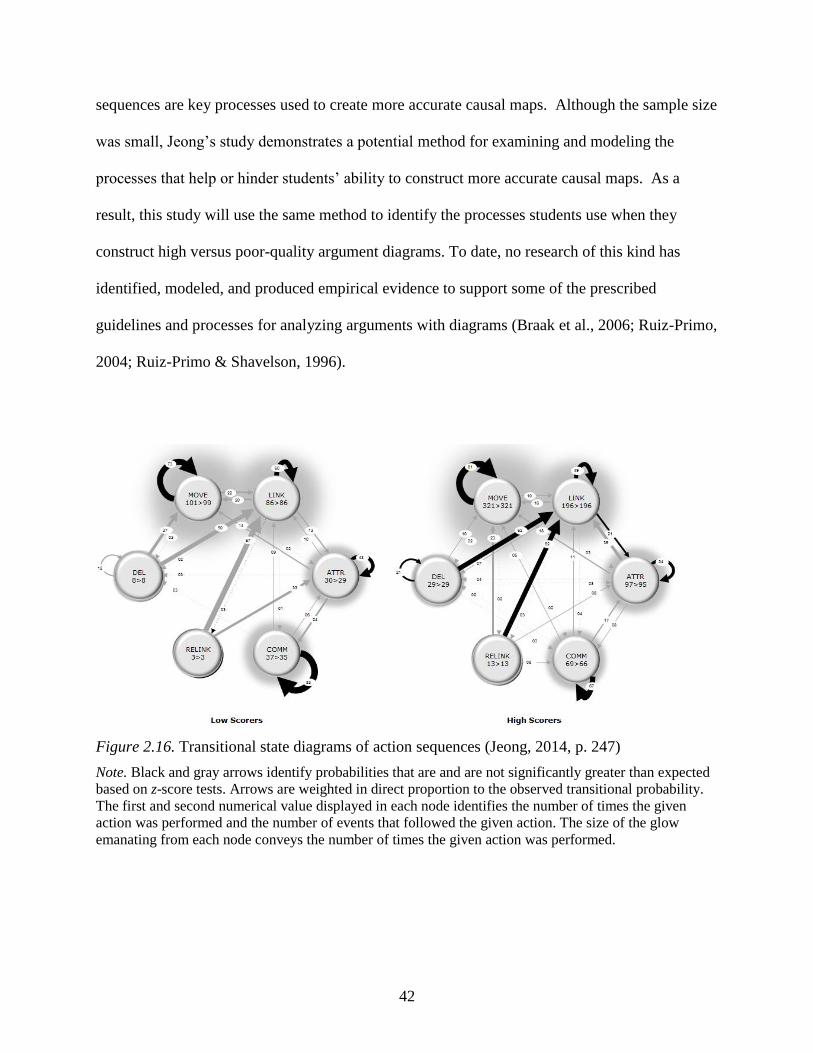
42
sequences are key processes used to create more accurate causal maps. Although the sample size
was small, Jeong’s study demonstrates a potential method for examining and modeling the
processes that help or hinder students’ ability to construct more accurate causal maps. As a
result, this study will use the same method to identify the processes students use when they
construct high versus poor-quality argument diagrams. To date, no research of this kind has
identified, modeled, and produced empirical evidence to support some of the prescribed
guidelines and processes for analyzing arguments with diagrams (Braak et al., 2006; Ruiz-Primo,
2004; Ruiz-Primo & Shavelson, 1996).
Figure 2.16. Transitional state diagrams of action sequences (Jeong, 2014, p. 247)
Note. Black and gray arrows identify probabilities that are and are not significantly greater than expected
based on z-score tests. Arrows are weighted in direct proportion to the observed transitional probability.
The first and second numerical value displayed in each node identifies the number of times the given
action was performed and the number of events that followed the given action. The size of the glow
emanating from each node conveys the number of times the given action was performed.
43
Expertise Research
Cognitive abilities and performances of experts have been studied across various
disciplines such as psychology, medicine, physics, education, sports, arts, and so on. In
particular, cognitive psychologists have tried to illuminate cognitive architectures of expertise
and to characterize experts’ cognitive abilities such as knowledge representation, memory bias,
and reasoning bias (Hoffman, 1996). These cognitive characteristics or components unique to
experts can be applied to the development of computational systems that model expert reasoning
(Hoffman, 1996: Farrington-Darby & Wilson, 2006) or to the development of instruction or
training that enables novices to acquire expertise (Crespo, Torres, & Recio, 2004).
Framing the research on expertise are two different views (absolute view and relative
view) – each with its own set of assumptions and definition of expertise. According to Chi
(2006), the absolute view in expertise focuses on outstanding or exceptional individuals in a
domain to identify their performances and underlying cognitive mechanisms of expertise. Since
the main focus is on the individual possessing an exceptional skill, the validity of these studies
relies heavily on the accurate identification of experts within any given domain. If an “expert”
examined in a study does not actually possess the characteristics that define expertise, the result
of a study is neither valid nor reliable. In contrast, the relative view focuses on making
comparisons between experts and novices to identify the unique characteristics of experts and to
measure relative levels of expertise between the two groups. The general goal of relative view
research is to use the findings to augment training or instruction for novices so they may attain
domain-expertise. Thus, uniformly defining experts and novices across studies may not be as
crucial to obtaining valid conclusions as in absolute view studies (Chi, 2006). In this study, a
44
relative view is taken because comparisons will be made between experts and novices on the
processes used to create argument diagrams.
Characteristics of Expertise
Though the assumptions of both viewpoints differ, research findings from both
viewpoints provide evidence to indicate that experts have cognitive characteristics that are
distinct from novices. Farrington-Darby and Wilson (2006) present the psychological
characteristics of experts: greater content knowledge and experiences within a domain, more
effective working memory and long-term memory, more detailed and elaborated mental structure
of knowledge, and more accurate and faster intuition and prediction than novices. Though most
studies show that experts perform better than novices, some expertise studies have produced
results to show that experts do not always perform better and sometimes perform worse than
novices. Chi (2006) points out that the majority of literature on expertise has tended to overlook
the characteristics that limit expertise. In addition to the positive characteristics of expertise, Chi
(2006) describes the negative characteristics that limit expertise (see Table 2.4). The most
salient negative characteristic of experts is in fact their high level of domain knowledge. Due to
their greater knowledge and mastery skills within their specialized field and their high level of
confidence in their own performance, experts tend to gloss over details, rely on contextual cues,
generate hypotheses in accordance with their domain expertise, and thus produce inaccurate
diagnoses, predictions, and judgments (Chi, 2006). Many of the characteristics listed in Table
2.4 may help explain some of the actions experts perform on their argument diagrams observed
in this study.
45
Definition of Expertise
The definition of ‘expert’ remains vague and differs across studies (Feldon, 2007;
Hoffman, 1996; Simon, 1980) and viewpoints (absolute or relative view). From the absolute
view, experts are defined in terms of individuals with quantitative evidence that exhibit
exceptional excellence in knowledge and skills within a domain (Chi, 2006). From the relative
view, experts are defined more liberally and are contextually operationalized because the relative
view focuses on ‘relative expertise’ in comparison to non-experts (novices) within a particular
situation/context/setting (Chi, 2006). Alternatively, Hoffman argues that experts and novices can
be defined along a developmental continuum of expertise. As shown in Table 2.5, Hoffman
(1996) provides the seven-proficiency scale of expertise in terms of cognitive developmental
levels of individuals. Based on the development continuum of expertise, Hoffman presents three
categories with which to define experts: cognitive developmental level, knowledge structure, and
reasoning processes (1996).
Experts can be defined as individuals who reach the highest cognitive developmental
level with “articulated, conceptual, principled understanding” and “accumulated skills based on
experience and practice” (Hoffman, 1996, p. 83). Experts’ performance and knowledge are
stable with consistent and deliberate practice and their intuitive judgment skills develop as they
accumulate experience (Hoffman, 1996). Secondly, experts can be defined in terms of
knowledge structure. Compared to novices, experts’ knowledge structures are more effective at
organizing and interconnecting information in meaningful ways and more effective at retrieving
relevant information based on situation or context (Hoffman 1996).
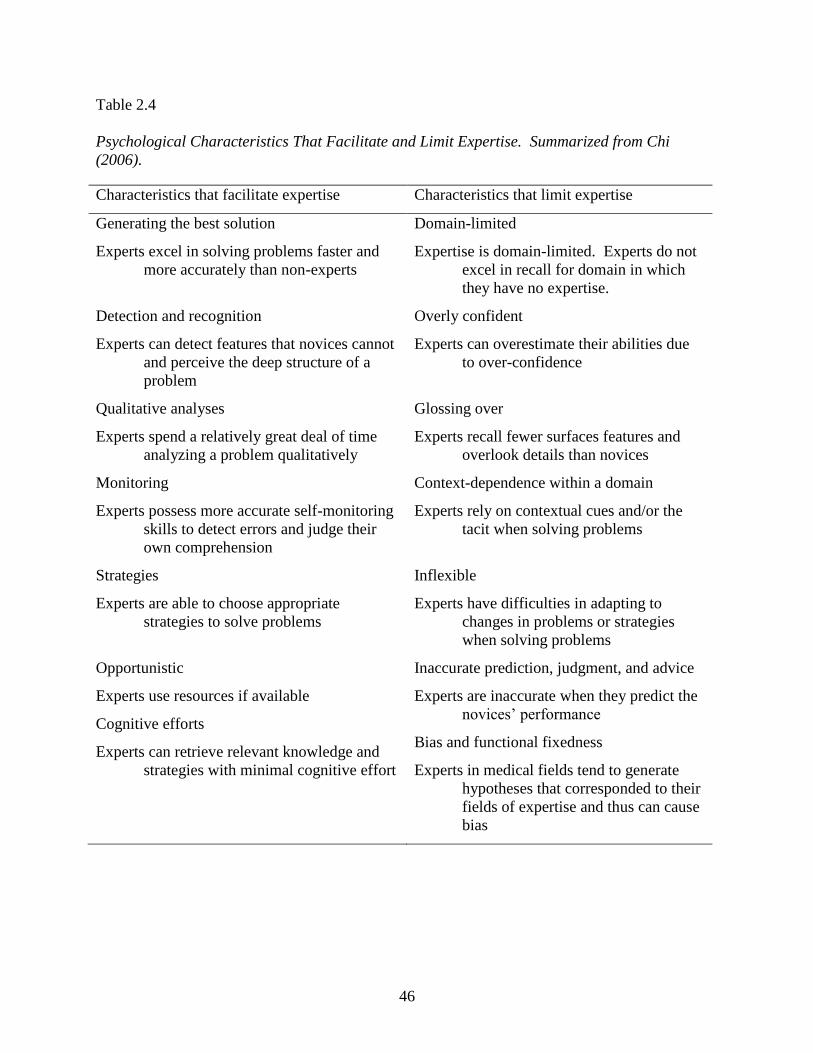
46
Table 2.4
Psychological Characteristics That Facilitate and Limit Expertise. Summarized from Chi
(2006).
Characteristics that facilitate expertise Characteristics that limit expertise
Generating the best solution
Experts excel in solving problems faster and
more accurately than non-experts
Domain-limited
Expertise is domain-limited. Experts do not
excel in recall for domain in which
they have no expertise.
Detection and recognition
Experts can detect features that novices cannot
and perceive the deep structure of a
problem
Overly confident
Experts can overestimate their abilities due
to over-confidence
Qualitative analyses
Experts spend a relatively great deal of time
analyzing a problem qualitatively
Glossing over
Experts recall fewer surfaces features and
overlook details than novices
Monitoring
Experts possess more accurate self-monitoring
skills to detect errors and judge their
own comprehension
Context-dependence within a domain
Experts rely on contextual cues and/or the
tacit when solving problems
Strategies
Experts are able to choose appropriate
strategies to solve problems
Inflexible
Experts have difficulties in adapting to
changes in problems or strategies
when solving problems
Opportunistic
Experts use resources if available
Cognitive efforts
Experts can retrieve relevant knowledge and
strategies with minimal cognitive effort
Inaccurate prediction, judgment, and advice
Experts are inaccurate when they predict the
novices’ performance
Bias and functional fixedness
Experts in medical fields tend to generate
hypotheses that corresponded to their
fields of expertise and thus can cause
bias
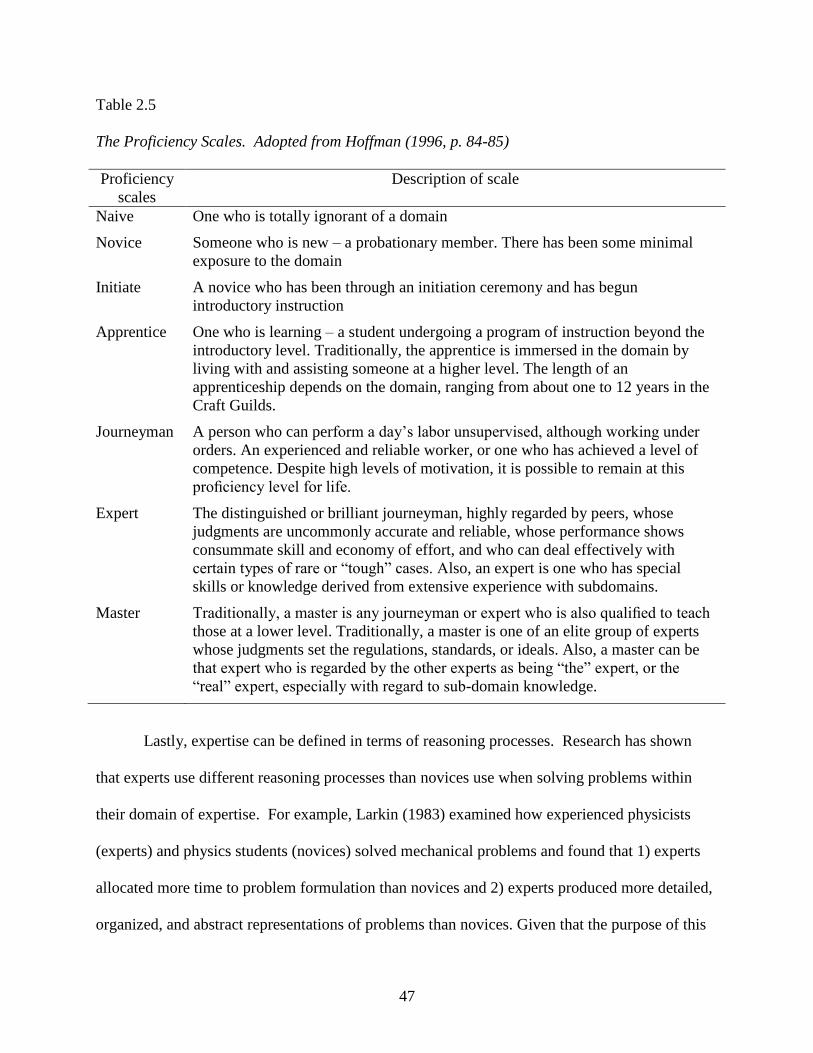
47
Table 2.5
The Proficiency Scales. Adopted from Hoffman (1996, p. 84-85)
Proficiency
scales
Description of scale
Naive One who is totally ignorant of a domain
Novice Someone who is new – a probationary member. There has been some minimal
exposure to the domain
Initiate A novice who has been through an initiation ceremony and has begun
introductory instruction
Apprentice One who is learning – a student undergoing a program of instruction beyond the
introductory level. Traditionally, the apprentice is immersed in the domain by
living with and assisting someone at a higher level. The length of an
apprenticeship depends on the domain, ranging from about one to 12 years in the
Craft Guilds.
Journeyman A person who can perform a day’s labor unsupervised, although working under
orders. An experienced and reliable worker, or one who has achieved a level of
competence. Despite high levels of motivation, it is possible to remain at this
proficiency level for life.
Expert The distinguished or brilliant journeyman, highly regarded by peers, whose
judgments are uncommonly accurate and reliable, whose performance shows
consummate skill and economy of effort, and who can deal effectively with
certain types of rare or “tough” cases. Also, an expert is one who has special
skills or knowledge derived from extensive experience with subdomains.
Master Traditionally, a master is any journeyman or expert who is also qualified to teach
those at a lower level. Traditionally, a master is one of an elite group of experts
whose judgments set the regulations, standards, or ideals. Also, a master can be
that expert who is regarded by the other experts as being “the” expert, or the
“real” expert, especially with regard to sub-domain knowledge.
Lastly, expertise can be defined in terms of reasoning processes. Research has shown
that experts use different reasoning processes than novices use when solving problems within
their domain of expertise. For example, Larkin (1983) examined how experienced physicists
(experts) and physics students (novices) solved mechanical problems and found that 1) experts
allocated more time to problem formulation than novices and 2) experts produced more detailed,
organized, and abstract representations of problems than novices. Given that the purpose of this
48
study is to examine the reasoning processes used by experts and novices to diagram the structural
relationships between conclusions and premises, the latter two categories, knowledge structure
and reasoning processes, are of particular relevance and interest in this study.
Expertise in Reasoning Process
Research shows that experts in various domains possess and use superior reasoning skills
that are distinct from those used by novices when solving problems within their domain of
expertise. For example, Schunn and Anderson (1999) examined how knowledge within the
domain of expertise affected scientific reasoning processes. They recruited three groups:
domain-experts in memory research, task-experts (researchers from another field in psychology),
and novices (undergraduates from various disciplines), and tested how each group designed an
experiment in cognitive psychology. The task involved domain specific knowledge of memory
research and general scientific reasoning skills to design an experiment - skills such as using
variables, interpreting data, and drawing conclusions. Schunn and Anderson (1999) found that a)
domain-experts outperformed task-experts and novices in domain-specific skills (selection of
useful variables, prediction of possible interaction between variables and violation rules), b)
domain and task-experts performed similarly in general reasoning skills (interpreting data,
drawing conclusions, and linking these conclusions to theories), and c) task-experts
outperformed novices in general reasoning skills but task-experts and novices performed poorly
in domain-specific skills. Schunn and Anderson’s (1999) findings suggest that experts possess
higher level of reasoning skills that are required for designing and analyzing research regardless
of their domain-specific knowledge. These findings suggest that expertise in reasoning
processes may exist independent of domain-specific knowledge and thus can be treated as a
domain-general skill. For this reason, this study assumes that the expert participants possess the
49
reasoning skills required to analyze a complex argument independent of their prior knowledge of
the domain/content embedded within the arguments they are asked to diagram.
What are the characteristics of experts’ reasoning processes? A study that examined the
types of reasoning processes involved in the medical field showed that experts tend to use
deductive reasoning processes when making a diagnostic decision based on presented evidence
or symptoms (Crespo, Torres, & Recio, 2004). Crespo et al. (2004) examined the reasoning
processes that characterized different developmental levels of expertise in dentistry. In their
study, three groups (expert, intermediate, and novice; Table 2.6) performed a dental diagnosis.
Crespo et al. (2004) found three different sequences of reasoning processes after analyzing
verbal protocol data: inductive, deductive, and a combination of backward and forward. In
particular, two out of five experts used deductive reasoning and three experts used a combination
of deductive and inductive reasoning to reach the diagnostic decision. In the intermediate and
novice groups, the deductive reasoning process was not observed during the task, and inductive
reasoning (used by 3 novices and 3 intermediate) and the combination of both types of reasoning
(used by 2 novices and 2 intermediate) were observed. Crespo et al. (2004) found the two
experts who used deductive reasoning provided a quick and accurate diagnosis compared to their
counterparts who used a combination of both types of reasoning. As a result, deduction, used by
experts, led to fast and accurate diagnosis while induction, used by novices and intermediates,
produced slower and inaccurate diagnosis. The differences in a sequence of reasoning process
affect the speed and accuracy of diagnostic decision-making. Based in part on these findings,
this study will determine to what extent experts in argumentation and critical thinking use
particular reasoning processes (e.g., top-down versus bottom up reasoning) in comparison to the
processes used by novices.
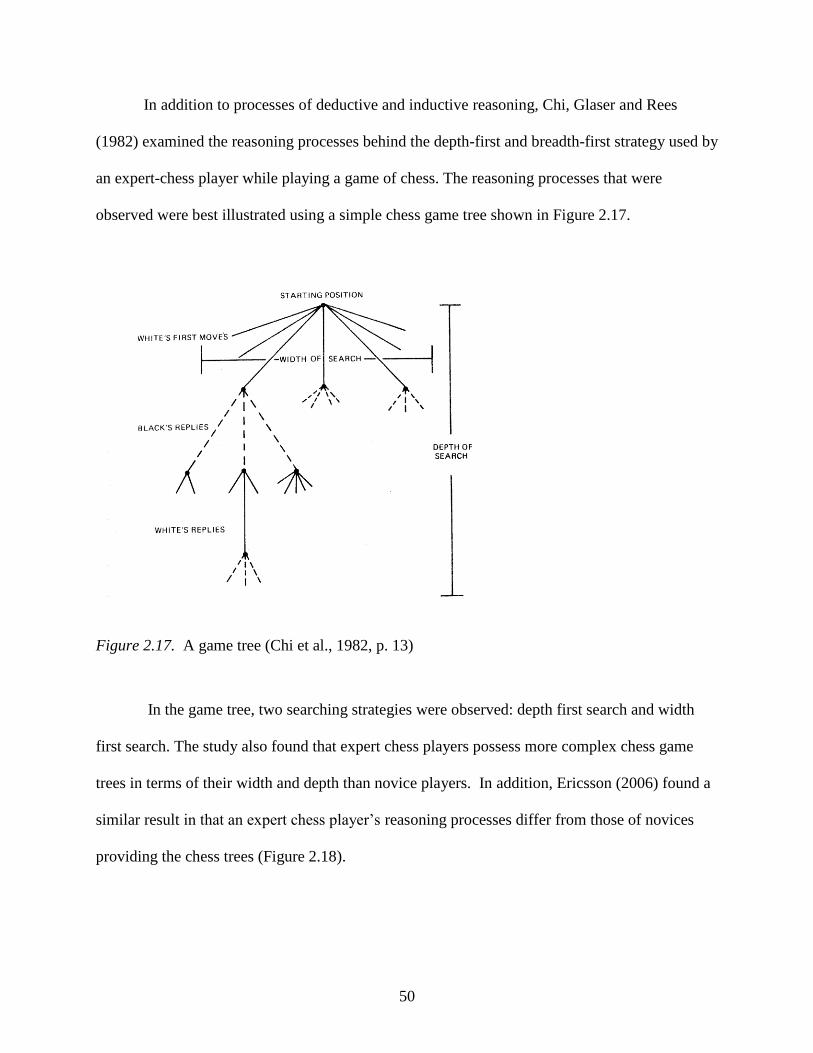
50
In addition to processes of deductive and inductive reasoning, Chi, Glaser and Rees
(1982) examined the reasoning processes behind the depth-first and breadth-first strategy used by
an expert-chess player while playing a game of chess. The reasoning processes that were
observed were best illustrated using a simple chess game tree shown in Figure 2.17.
Figure 2.17. A game tree (Chi et al., 1982, p. 13)
In the game tree, two searching strategies were observed: depth first search and width
first search. The study also found that expert chess players possess more complex chess game
trees in terms of their width and depth than novice players. In addition, Ericsson (2006) found a
similar result in that an expert chess player’s reasoning processes differ from those of novices
providing the chess trees (Figure 2.18).
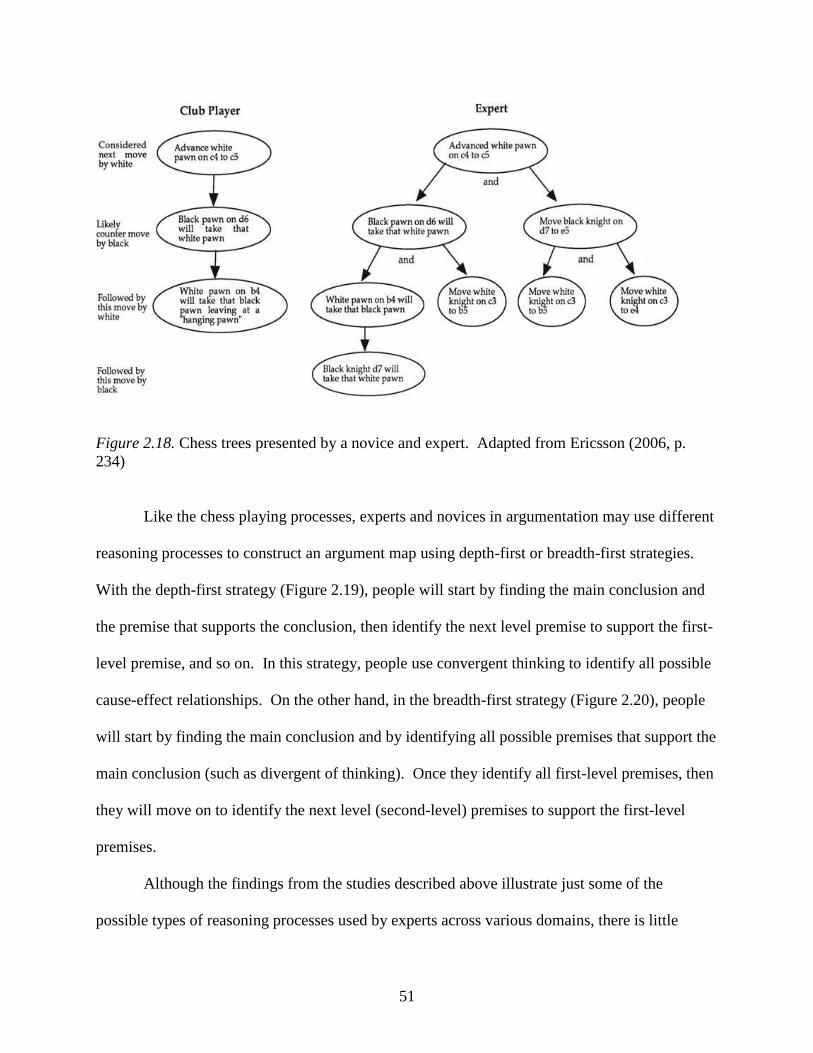
51
Figure 2.18. Chess trees presented by a novice and expert. Adapted from Ericsson (2006, p.
234)
Like the chess playing processes, experts and novices in argumentation may use different
reasoning processes to construct an argument map using depth-first or breadth-first strategies.
With the depth-first strategy (Figure 2.19), people will start by finding the main conclusion and
the premise that supports the conclusion, then identify the next level premise to support the first-
level premise, and so on. In this strategy, people use convergent thinking to identify all possible
cause-effect relationships. On the other hand, in the breadth-first strategy (Figure 2.20), people
will start by finding the main conclusion and by identifying all possible premises that support the
main conclusion (such as divergent of thinking). Once they identify all first-level premises, then
they will move on to identify the next level (second-level) premises to support the first-level
premises.
Although the findings from the studies described above illustrate just some of the
possible types of reasoning processes used by experts across various domains, there is little
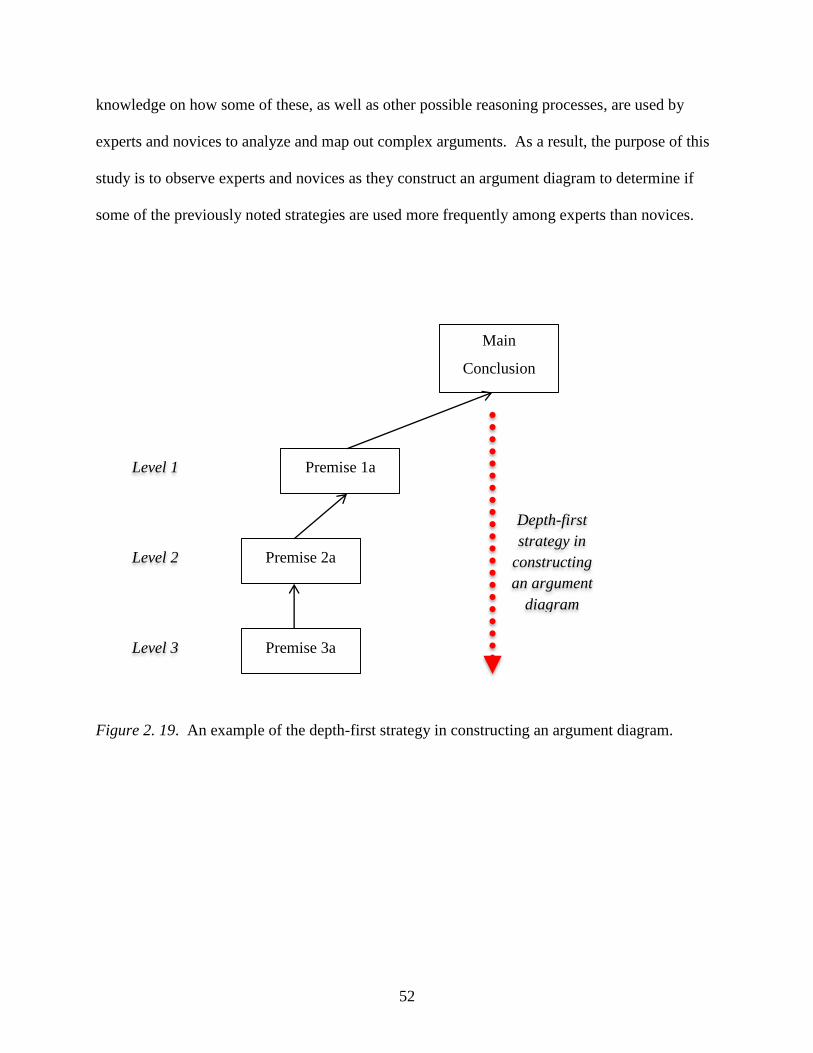
52
knowledge on how some of these, as well as other possible reasoning processes, are used by
experts and novices to analyze and map out complex arguments. As a result, the purpose of this
study is to observe experts and novices as they construct an argument diagram to determine if
some of the previously noted strategies are used more frequently among experts than novices.
Figure 2. 19. An example of the depth-first strategy in constructing an argument diagram.
Main
Conclusion
Premise 1a
Premise 2a
Premise 3a
Level 1
Level 2
Level 3
Depth-first
strategy in
constructing
an argument
diagram
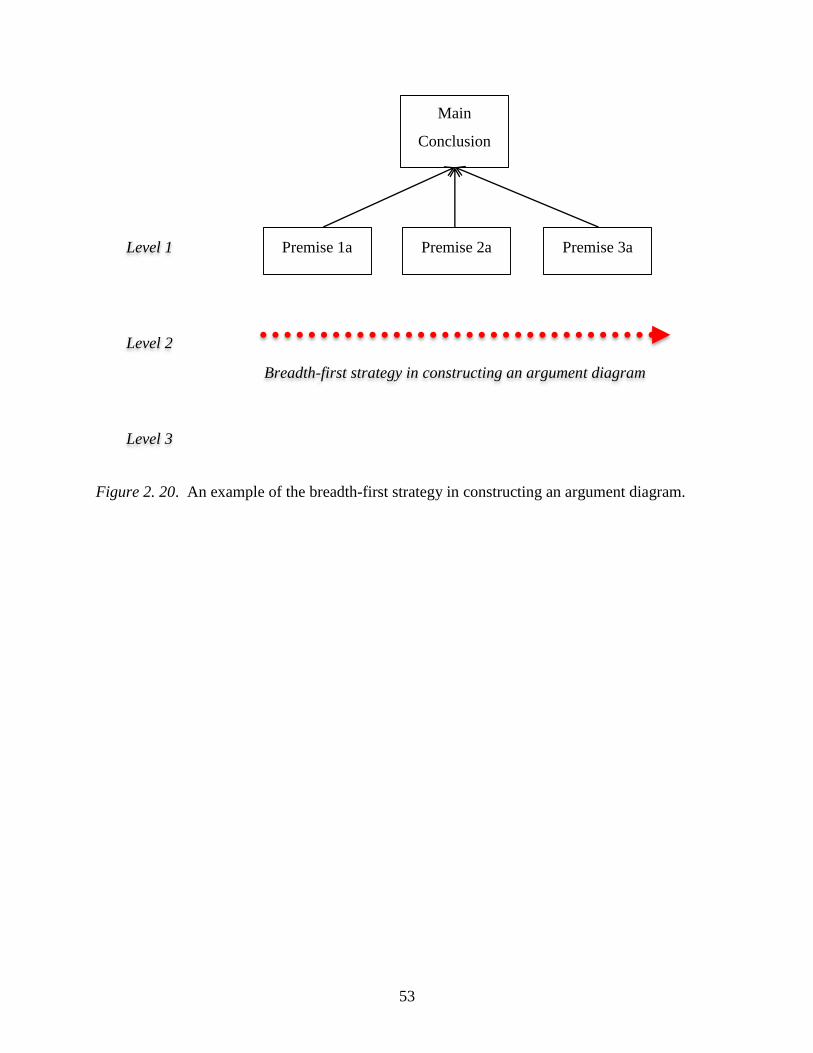
53
Figure 2. 20. An example of the breadth-first strategy in constructing an argument diagram.
Main
Conclusion
Premise 1a Premise 2a Premise 3a Level 1
Level 2
Level 3
Breadth-first strategy in constructing an argument diagram
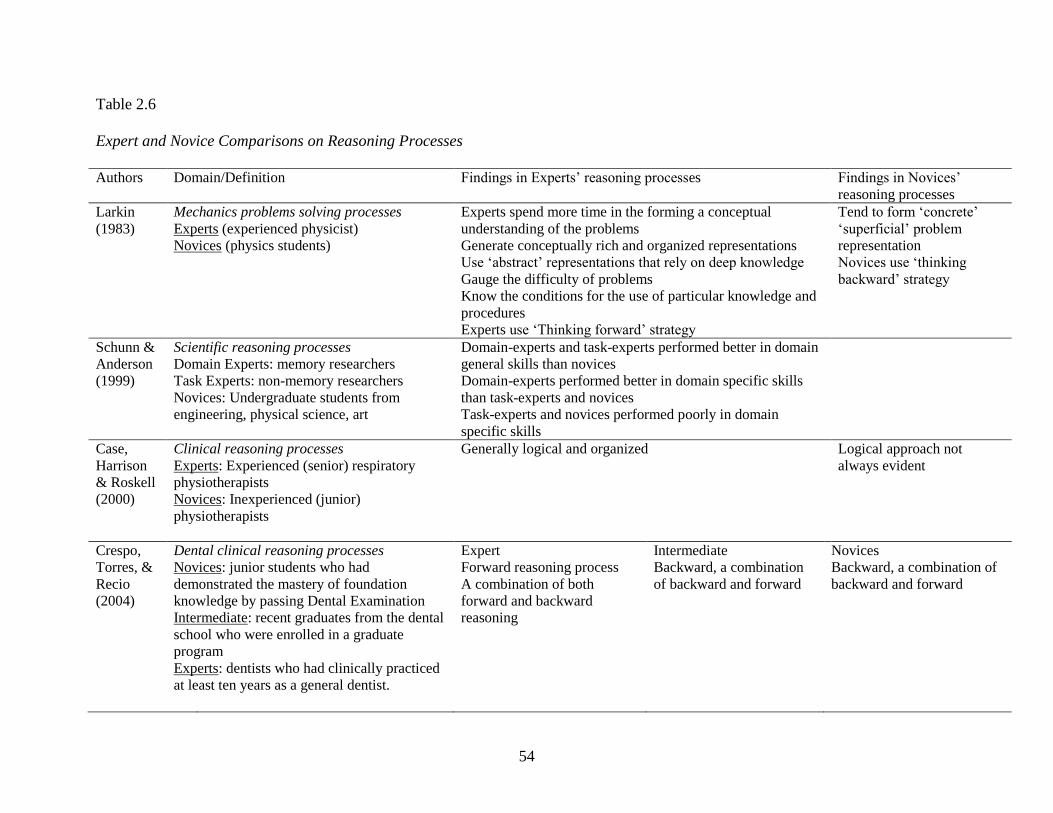
54
Table 2.6
Expert and Novice Comparisons on Reasoning Processes
Authors Domain/Definition Findings in Experts’ reasoning processes Findings in Novices’
reasoning processes
Larkin
(1983)
Mechanics problems solving processes
Experts (experienced physicist)
Novices (physics students)
Experts spend more time in the forming a conceptual
understanding of the problems
Generate conceptually rich and organized representations
Use ‘abstract’ representations that rely on deep knowledge
Gauge the difficulty of problems
Know the conditions for the use of particular knowledge and
procedures
Experts use ‘Thinking forward’ strategy
Tend to form ‘concrete’
‘superficial’ problem
representation
Novices use ‘thinking
backward’ strategy
Schunn &
Anderson
(1999)
Scientific reasoning processes
Domain Experts: memory researchers
Task Experts: non-memory researchers
Novices: Undergraduate students from
engineering, physical science, art
Domain-experts and task-experts performed better in domain
general skills than novices
Domain-experts performed better in domain specific skills
than task-experts and novices
Task-experts and novices performed poorly in domain
specific skills
Case,
Harrison
& Roskell
(2000)
Clinical reasoning processes
Experts: Experienced (senior) respiratory
physiotherapists
Novices: Inexperienced (junior)
physiotherapists
Generally logical and organized Logical approach not
always evident
Crespo,
Torres, &
Recio
(2004)
Dental clinical reasoning processes
Novices: junior students who had
demonstrated the mastery of foundation
knowledge by passing Dental Examination
Intermediate: recent graduates from the dental
school who were enrolled in a graduate
program
Experts: dentists who had clinically practiced
at least ten years as a general dentist.
Expert
Forward reasoning process
A combination of both
forward and backward
reasoning
Intermediate
Backward, a combination
of backward and forward
Novices
Backward, a combination of
backward and forward
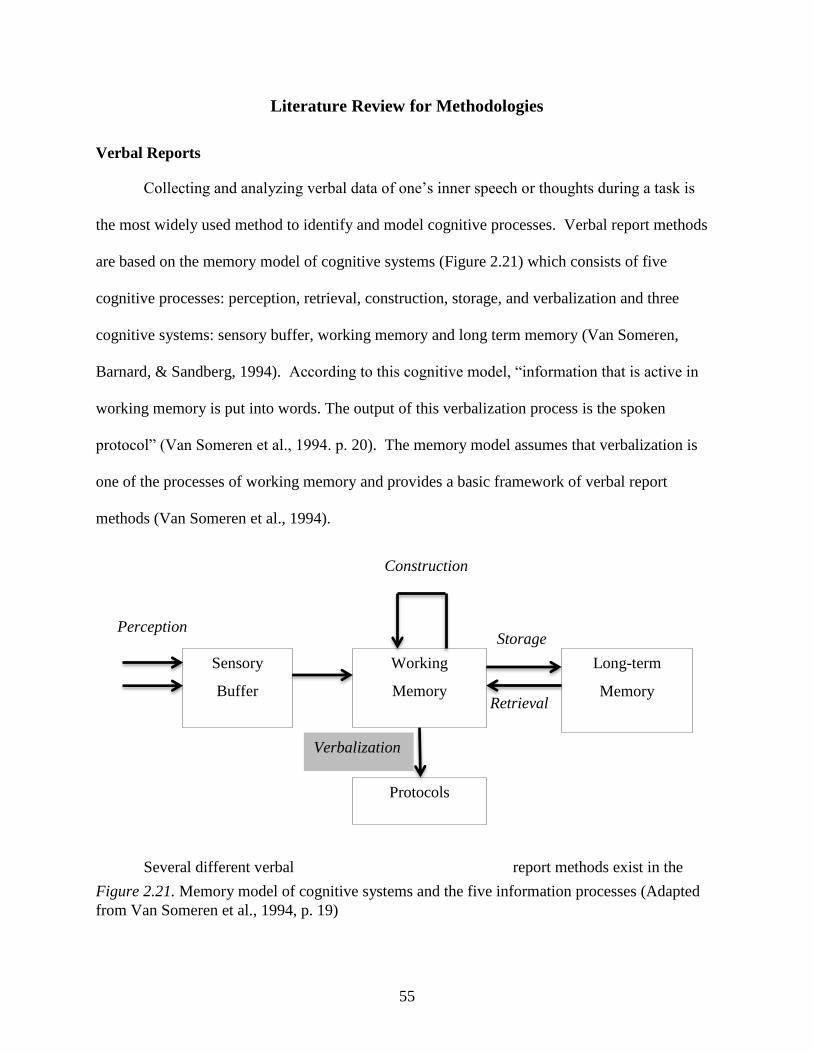
55
Literature Review for Methodologies
Verbal Reports
Collecting and analyzing verbal data of one’s inner speech or thoughts during a task is
the most widely used method to identify and model cognitive processes. Verbal report methods
are based on the memory model of cognitive systems (Figure 2.21) which consists of five
cognitive processes: perception, retrieval, construction, storage, and verbalization and three
cognitive systems: sensory buffer, working memory and long term memory (Van Someren,
Barnard, & Sandberg, 1994). According to this cognitive model, “information that is active in
working memory is put into words. The output of this verbalization process is the spoken
protocol” (Van Someren et al., 1994. p. 20). The memory model assumes that verbalization is
one of the processes of working memory and provides a basic framework of verbal report
methods (Van Someren et al., 1994).
Several different verbal report methods exist in the
Figure 2.21. Memory model of cognitive systems and the five information processes (Adapted
from Van Someren et al., 1994, p. 19)
Sensory
Buffer
Working
Memory
Long-term
Memory
Protocols
Perception
Retrieval
Storage
Construction
Verbalization
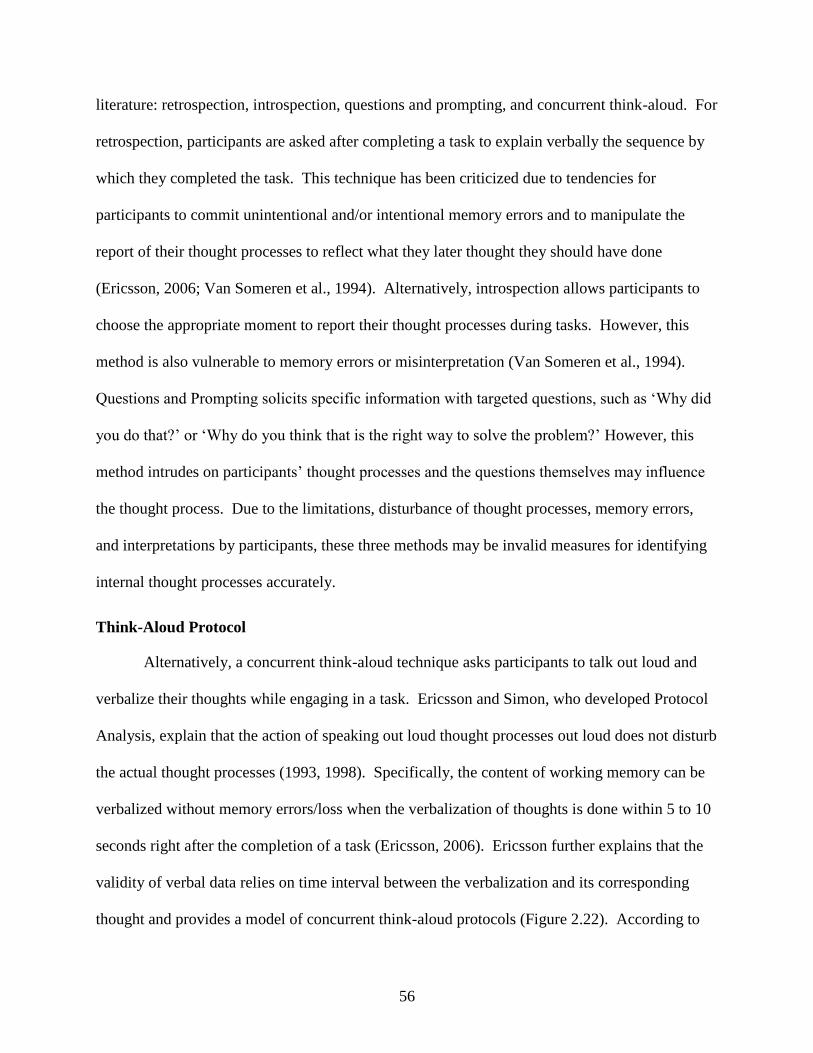
56
literature: retrospection, introspection, questions and prompting, and concurrent think-aloud. For
retrospection, participants are asked after completing a task to explain verbally the sequence by
which they completed the task. This technique has been criticized due to tendencies for
participants to commit unintentional and/or intentional memory errors and to manipulate the
report of their thought processes to reflect what they later thought they should have done
(Ericsson, 2006; Van Someren et al., 1994). Alternatively, introspection allows participants to
choose the appropriate moment to report their thought processes during tasks. However, this
method is also vulnerable to memory errors or misinterpretation (Van Someren et al., 1994).
Questions and Prompting solicits specific information with targeted questions, such as ‘Why did
you do that?’ or ‘Why do you think that is the right way to solve the problem?’ However, this
method intrudes on participants’ thought processes and the questions themselves may influence
the thought process. Due to the limitations, disturbance of thought processes, memory errors,
and interpretations by participants, these three methods may be invalid measures for identifying
internal thought processes accurately.
Think-Aloud Protocol
Alternatively, a concurrent think-aloud technique asks participants to talk out loud and
verbalize their thoughts while engaging in a task. Ericsson and Simon, who developed Protocol
Analysis, explain that the action of speaking out loud thought processes out loud does not disturb
the actual thought processes (1993, 1998). Specifically, the content of working memory can be
verbalized without memory errors/loss when the verbalization of thoughts is done within 5 to 10
seconds right after the completion of a task (Ericsson, 2006). Ericsson further explains that the
validity of verbal data relies on time interval between the verbalization and its corresponding
thought and provides a model of concurrent think-aloud protocols (Figure 2.22). According to
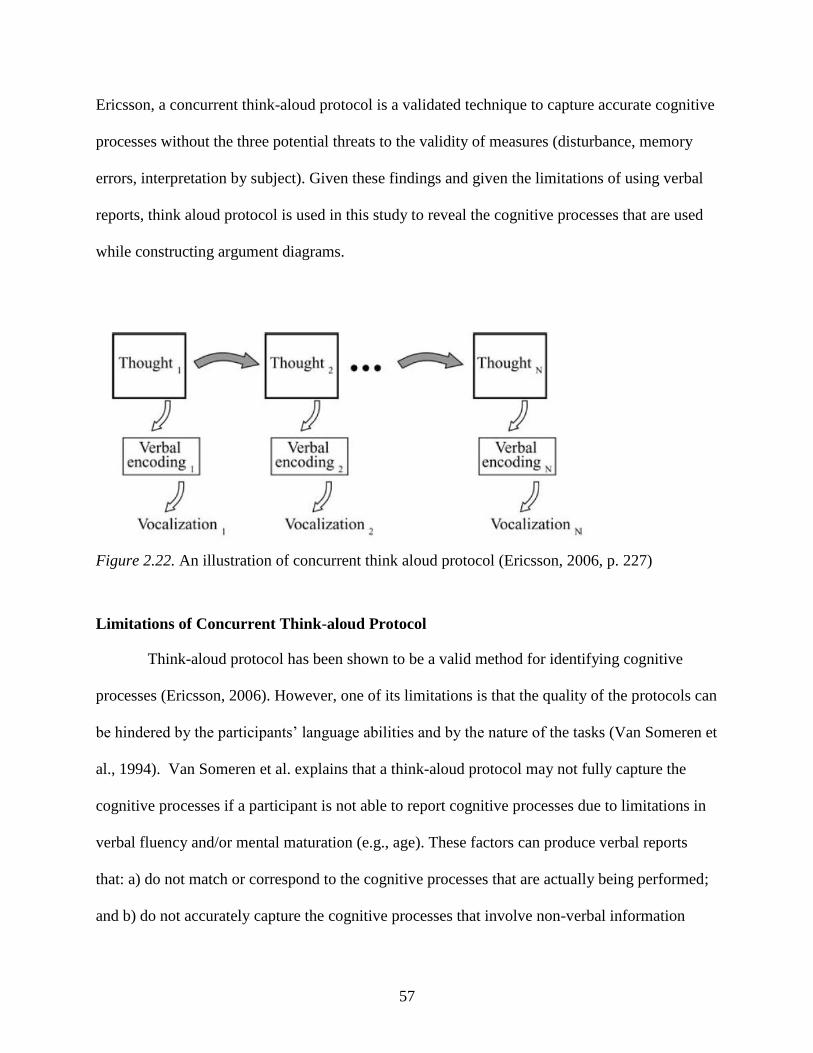
57
Ericsson, a concurrent think-aloud protocol is a validated technique to capture accurate cognitive
processes without the three potential threats to the validity of measures (disturbance, memory
errors, interpretation by subject). Given these findings and given the limitations of using verbal
reports, think aloud protocol is used in this study to reveal the cognitive processes that are used
while constructing argument diagrams.
Figure 2.22. An illustration of concurrent think aloud protocol (Ericsson, 2006, p. 227)
Limitations of Concurrent Think-aloud Protocol
Think-aloud protocol has been shown to be a valid method for identifying cognitive
processes (Ericsson, 2006). However, one of its limitations is that the quality of the protocols can
be hindered by the participants’ language abilities and by the nature of the tasks (Van Someren et
al., 1994). Van Someren et al. explains that a think-aloud protocol may not fully capture the
cognitive processes if a participant is not able to report cognitive processes due to limitations in
verbal fluency and/or mental maturation (e.g., age). These factors can produce verbal reports
that: a) do not match or correspond to the cognitive processes that are actually being performed;
and b) do not accurately capture the cognitive processes that involve non-verbal information

58
(Van Someren et al., 1994). As a result, the participants in this study are selected according to
their cognitive maturation and language ability. Furthermore, the task in this study involves the
use and analysis of verbal rather than non-verbal information.
59
CHAPTER 3
METHOD
Overview
The purpose of this study is to explore the reasoning processes performed by experts and
novices while analyzing and diagramming a complex argument. Analyzing, and most of all,
identifying differences in the diagramming processes used by experts versus novices can help to
explain which and how particular reasoning processes are used to achieve a better understanding
of a complex argument. However, observing the diagramming processes themselves may not
fully reveal the actual reasoning processes that participants use while analyzing arguments. To
fully understand the reasoning processes, participants’ cognitive processes need to be identified
along with their diagramming processes. For this reason, participants’ cognitive processes
(called thought processes) were captured with the think-aloud protocol and a retrospective
interview. Using a qualitative approach, video recordings of the verbal protocol and interview
sessions were examined to develop a coding scheme that identifies the specific actions
performed during the process of diagramming a complex argument. The coding scheme was then
developed to code the actions of both experts and novices. The codes from each group were
sequentially analyzed to identify behavioral patterns that may reveal specific reasoning processes
used or not used by experts and by novices. As a result, this chapter describes in detail how the
research design, participants, tasks, materials, procedures, and data analysis addressed the
research questions.
60
Research Design and Approach
This study utilized a mixed method design. First, a qualitative method was used to
collect data on reasoning operations (cognitive processes) and reasoning behaviors (diagramming
processes). I used a general coding development strategy to generate coding schemes and
categories that explained unknown phenomena and diagramming processes. Sequential Analysis
was used to identify the sequential patterns demonstrated in a) diagramming processes performed
by experts and novices and b) cognitive processes used by two groups. To capture diagramming
and cognitive processes, I used jMAP software to capture experts and novices diagramming
behaviors and used in conjunction with a think-aloud protocol to capture their cognitive
processes to explain the underlying reasons behind their diagramming behaviors. Lastly,
qualitative analysis was used to help determine to what extent the action sequences identified
with sequential analysis can serve as indicators of global level reasoning processes. As a result, I
used qualitative findings to help evaluate the value of using sequential analysis as a method for
assessing and diagnosing students’ reasoning processes. At this time, research on diagramming
arguments is incomplete in the three aspects this study addressed: the precise processes that lead
to high quality argument diagrams; the processes that lead to low quality argument diagrams; and
the differences in experts’ and novices’ reasoning processes.
Participants
A total of ten participants were drawn from across departments at a large university
located at southeast in the USA: five experts in argumentation as the expert group and five
graduate students as the novice group. Nielson (1994) recommended that 4 ±1 sample sizes are
enough for studies employing think-aloud protocol. As for the sampling strategy, a purposeful
and convenience sampling will be used to recruit the experts and novices. The criteria to be
61
included in the expert group are 1) be an instructor in argumentation and/or 2) have formal
training in argumentation. The criteria for the novice group are 1) be a graduate student and 2)
do not have formal training in argumentation. I recruited the participants via an email and via
graduate level class visits. I completed the recruitment of participants and data collection
between May and September 2014.
Settings and Technology
For this study, the main lab was set up in the Education building at FSU with various
devices. In general, participants visited the lab to participate in the study. But in some cases, I
visited participants’ offices and installed the same devices that I used in the lab to conduct the
study. Each study was conducted in a one-on-one session. Diagram construction was performed
on a laptop with a mouse and keyboard. jMAP software was used by each participant to
construct an argument map and O-Cam recorded the computer screen and verbal protocol as
participants constructed their argument diagrams. The current time was displayed at the bottom
of the computer screen. A voice recorder with a microphone was used to capture participants’
voices.
Procedures
Introductory Session
Once the participants visited the lab for the study, the researcher explained the general
purpose of the study, the activity that participants should perform, and the data collection and
devices. The participants were asked to sign the consent form if they agreed to participate in the
study and to the use of the data. Then, participants completed a survey created by the researcher
to record participants’ demographic information and experience level – data the researcher used
to help classify participants as experts or novices (Appendix A). During this session, the
62
researcher also emphasized that pseudonyms would be used to protect participants’ privacy;
participants could withdraw from the study at any time without consequence; and, at the end of
the study, participants would receive a $25 gift card in appreciation of their time and effort.
Training Session
For training purposes, each participant was instructed by the researcher on how to use
jMAP to construct an argument map. The jMAP software is an Excel-based software tool that
enables students to draw argument diagrams by using and positioning nodes and arrows. The
jMAP software was selected over other argument diagramming software because jMAP
automatically records each action a student performs while constructing the argument diagram.
Most of all, jMAP records the time at which each action is performed and records it in a human
readable format in an Excel spreadsheet. In the training, the researcher provided a 2-minute
rudimentary video demonstration on how to use jMAP to move and re-position a node, how to
insert a directional arrow to link one node to another node, how to delete an arrow, how to detach
one end of an arrow from one node and re-attach it to a different node, and how to change the
color of an arrow from black (supporting premise) to red (opposing premise), or vice versa. The
video did not provide information on how to analyze an argument during the diagramming
process. To ensure that all participants were familiar with the basic mechanics of using jMAP,
the participants completed a mini argument map that consisted of five nodes (claims about the
importance of critical thinking in college students) as an exercise in jMAP to replicate the basic
diagramming tasks demonstrated by the training video and the researcher. While creating the
exercise map, the researcher asked the participant to talk aloud to share what she or he was
thinking and/or looking at, to familiarize the participants with the talk-aloud protocol.
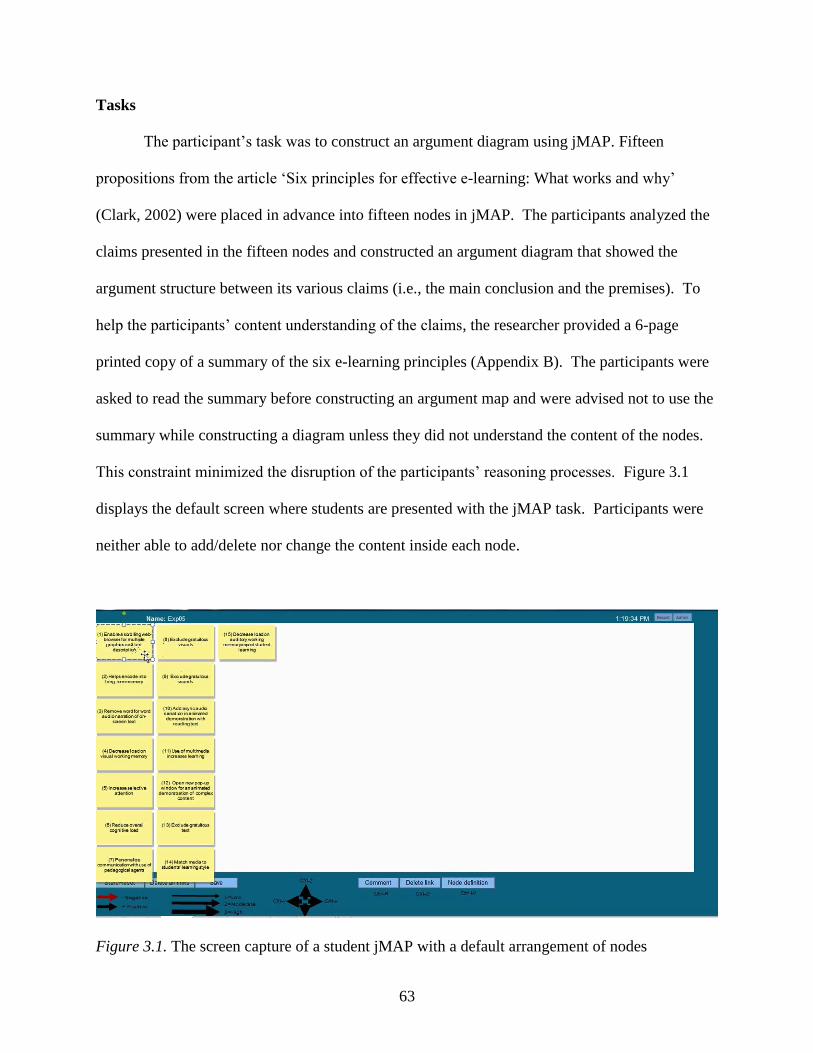
63
Tasks
The participant’s task was to construct an argument diagram using jMAP. Fifteen
propositions from the article ‘Six principles for effective e-learning: What works and why’
(Clark, 2002) were placed in advance into fifteen nodes in jMAP. The participants analyzed the
claims presented in the fifteen nodes and constructed an argument diagram that showed the
argument structure between its various claims (i.e., the main conclusion and the premises). To
help the participants’ content understanding of the claims, the researcher provided a 6-page
printed copy of a summary of the six e-learning principles (Appendix B). The participants were
asked to read the summary before constructing an argument map and were advised not to use the
summary while constructing a diagram unless they did not understand the content of the nodes.
This constraint minimized the disruption of the participants’ reasoning processes. Figure 3.1
displays the default screen where students are presented with the jMAP task. Participants were
neither able to add/delete nor change the content inside each node.
Figure 3.1. The screen capture of a student jMAP with a default arrangement of nodes
64
In addition, participants were instructed to insert arrows to identify and convey the
logical connections between the premises and the claim. Red arrows were to be used to represent
a premise with an opposing relationship to the parent premise or claim, and black arrows were to
be used to represent a premise with a supporting relationship.
The participants talked aloud to verbally report what they were thinking while
constructing the argument diagram. The verbal reports were recorded along with the video
recording of the actions participants performed in jMAP while constructing the diagram. During
the session, if the researcher saw that the participant did not talk following a period of 5 or more
seconds, the researcher gave a prompt for the participant to report his or her current thoughts by
reminding the participant to ‘keep talking’ in order to facilitate the verbal reporting of thought
processes used while constructing the diagrams. During the argument diagramming task, the
researcher did not provide any hints or answer any questions on how to map out the relationships
between the premises and main claim. However, if a participant had difficulties using the jMAP
software, the researcher provided technical guidance.
Retrospective Interview Session
Following the completion of the argument mapping session, the researcher asked an
open-ended question about the diagramming processes and experiences in general. The
participants shared details about their diagramming strategies, processes, and any difficulties that
they experienced during the task. After the open-ended question, the participants were asked a
total of seven structured questions (Appendix C) to acquire more details about the processes
participants used to construct their argument diagrams. The participants looked at and referred
to their final diagram to help them answer the questions and recalled some of the processes they
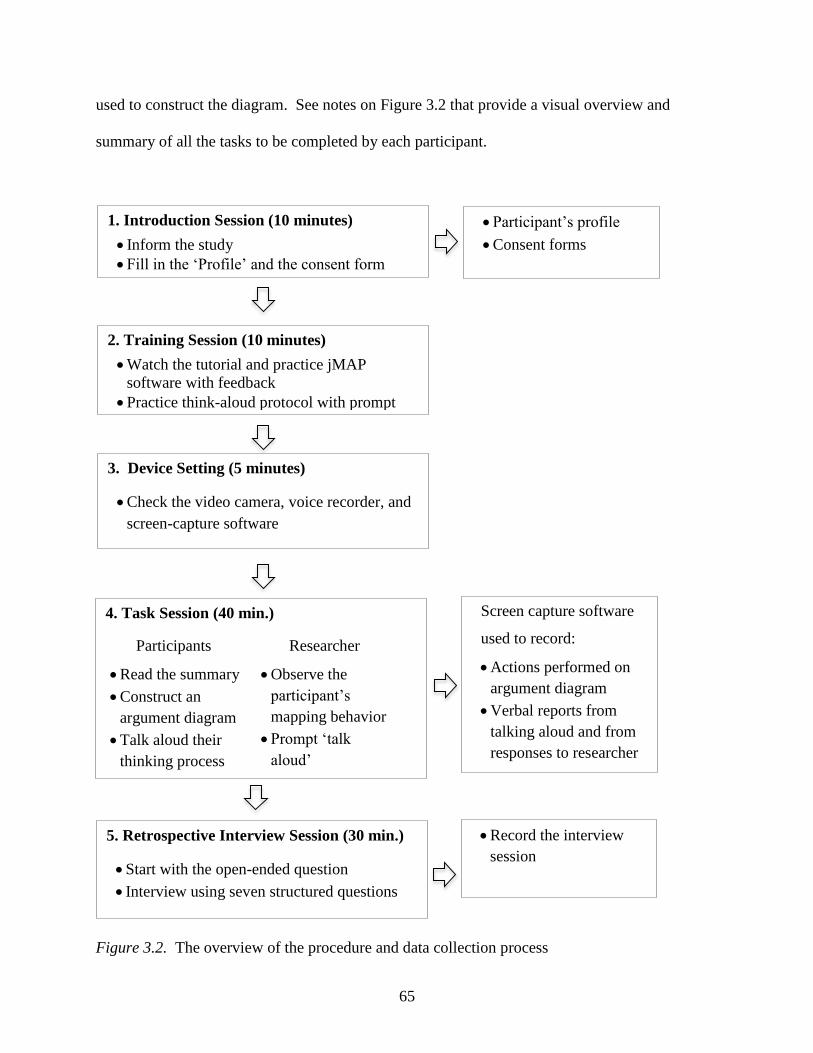
65
used to construct the diagram. See notes on Figure 3.2 that provide a visual overview and
summary of all the tasks to be completed by each participant.
Figure 3.2. The overview of the procedure and data collection process
1. Introduction Session (10 minutes)
Inform the study
Fill in the ‘Profile’ and the consent form
2. Training Session (10 minutes)
Watch the tutorial and practice jMAP
software with feedback
Practice think-aloud protocol with prompt
3. Device Setting (5 minutes)
Check the video camera, voice recorder, and
screen-capture software
4. Task Session (40 min.)
Participants Researcher
Read the summary
Construct an
argument diagram
Talk aloud their
thinking process
Observe the
participant’s
mapping behavior
Prompt ‘talk
aloud’
5. Retrospective Interview Session (30 min.)
Start with the open-ended question
Interview using seven structured questions
z z
Participant’s profile
Consent forms
Screen capture software
used to record:
Actions performed on
argument diagram
Verbal reports from
talking aloud and from
responses to researcher
prompts
Record the interview
session
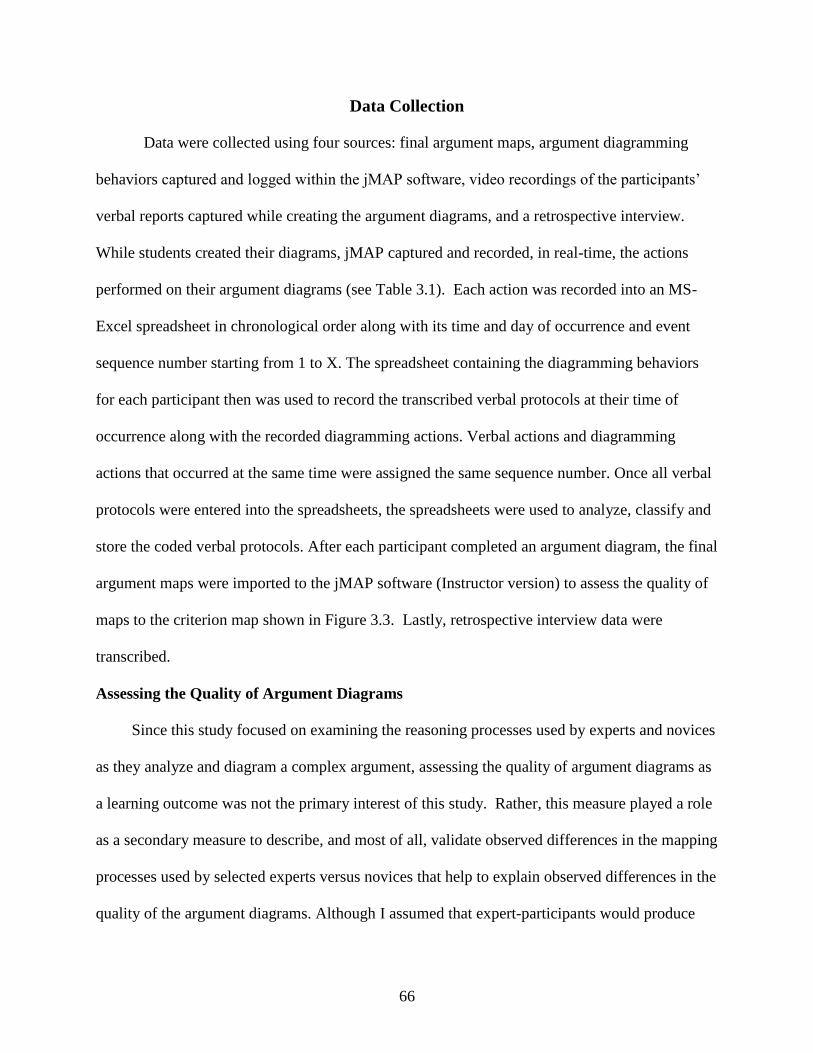
66
Data Collection
Data were collected using four sources: final argument maps, argument diagramming
behaviors captured and logged within the jMAP software, video recordings of the participants’
verbal reports captured while creating the argument diagrams, and a retrospective interview.
While students created their diagrams, jMAP captured and recorded, in real-time, the actions
performed on their argument diagrams (see Table 3.1). Each action was recorded into an MS-
Excel spreadsheet in chronological order along with its time and day of occurrence and event
sequence number starting from 1 to X. The spreadsheet containing the diagramming behaviors
for each participant then was used to record the transcribed verbal protocols at their time of
occurrence along with the recorded diagramming actions. Verbal actions and diagramming
actions that occurred at the same time were assigned the same sequence number. Once all verbal
protocols were entered into the spreadsheets, the spreadsheets were used to analyze, classify and
store the coded verbal protocols. After each participant completed an argument diagram, the final
argument maps were imported to the jMAP software (Instructor version) to assess the quality of
maps to the criterion map shown in Figure 3.3. Lastly, retrospective interview data were
transcribed.
Assessing the Quality of Argument Diagrams
Since this study focused on examining the reasoning processes used by experts and novices
as they analyze and diagram a complex argument, assessing the quality of argument diagrams as
a learning outcome was not the primary interest of this study. Rather, this measure played a role
as a secondary measure to describe, and most of all, validate observed differences in the mapping
processes used by selected experts versus novices that help to explain observed differences in the
quality of the argument diagrams. Although I assumed that expert-participants would produce
67
Table 3.1
Codes Assigned to Each Action Students Perform in jMAP Software
Final
codes Code Definition
LINK ADDR added new link pointing to the right
ADDL added new link pointing to the left
ADDU added new link pointing up
ADDD added new link pointing down
LK2 attached link to the affected node
RELINK RLK1 redirected the existing link to a new causal node
RLK2 redirected the existing link to a new affected node
- ULK1 detached the beginning tail of the link
- ULK2 detached the end of the link
ATTR ATT- changed link to color red to convey a negative or inverse
relationship
ATT+ changed link to the color black to convey a positive relationship
ATT2L changed link to low level of impact (not used in this study)
ATT2M changed link to moderate level of impact (not used in this study)
ATT2H changed link to high level of impact (not used in this study)
DEL DEL deleted the link
MOVE MS moved a node (which was the same node as the last moved node)
MDn moved node to the north of the previously moved node
MDne moved node to the NE of the previously moved node
MDe moved node to the East of the previously moved node
MDse moved node to the SE of the previously moved node
MDse moved node to the South of the previously moved node
MDsw moved node to the SW of the previously moved node
MDw moved node to the West of the previously moved node
MDnw moved node to the NW of the previously moved node
COMM COM added comment to link to explain how node influences affected
node
CREV revised the existing comment on the given link
68
high-quality argument maps, their superior performance was not always guaranteed. Thus, this
secondary measure informed us as to whether or not the selected experts performed better than
the novices in terms of the quality of argument diagrams. If the results showed the expert group
scored higher than the novice group on the quality of argument diagrams, the experts’ diagrams
were categorized as high quality maps while the novices’ diagrams would be categorized as low
quality maps. If the results showed no overall differences in quality between the experts and the
novices’ diagrams, this study: a) would have rank order the performance of all ten participants
from highest to lowest performer; and b) identified and compared the reasoning processes used
by the two lowest versus the two highest performers.
Each individual argument diagram was imported into jMAP to compare and score the
diagrams across three criteria. The jMAP software identifies, counts, and visually presents
missing links with gray arrows and matching links with dark green arrows when comparing a
participant map to a criterion map (see Figure 3.3) collaboratively constructed by a subject
matter expert in the ISLT program and me. The percentage of links in the participants’ maps that
are also in the criterion map determines the measure/level of accuracy in participants’ maps. As a
result, the first criterion used to measure accuracy is based on a percentage score so that
participants that indiscriminately insert links between every possible pair of nodes score lower
than participants that insert the links through genuine thought and deliberation. For the second
criteria, accuracy is measured in terms of the number of nodes that are correctly identified and
positioned at the bottom of the diagram as a root cause (a node with no arrows pointing into the
node, and with only arrows that point out from the node).
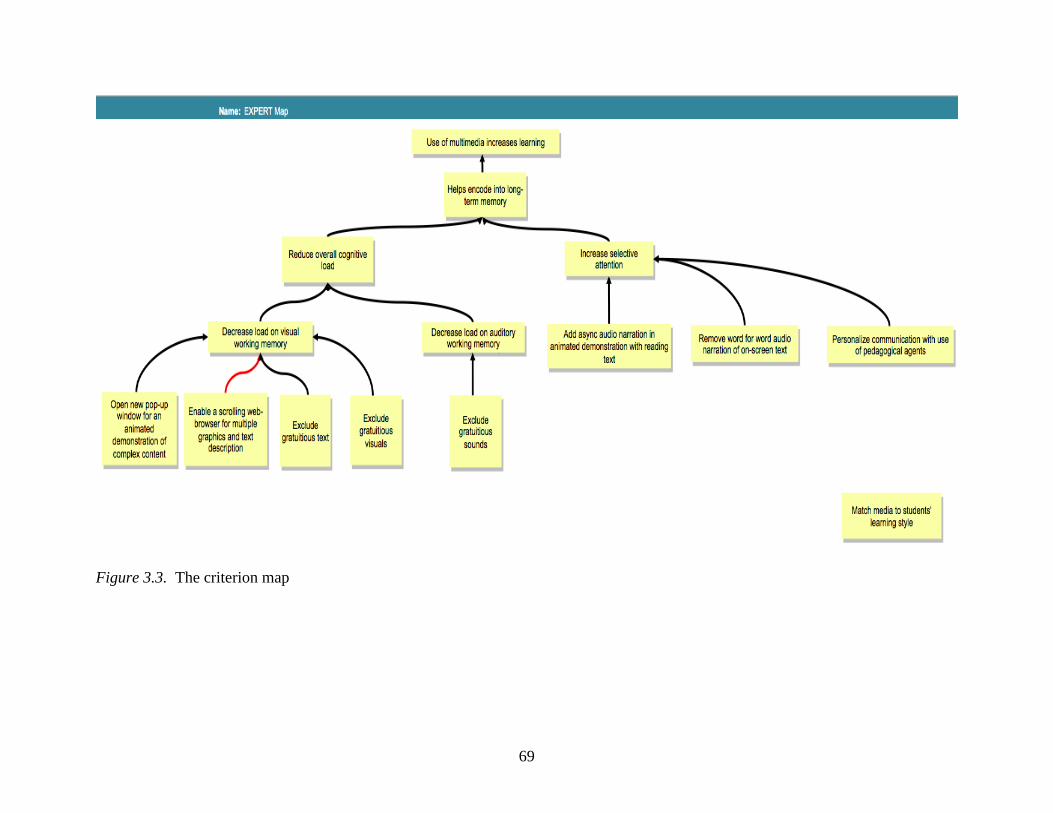
69
Figure 3.3. The criterion map
70
The third criterion is the number of chained links that directly stem out from each
correctly identified root cause (and only those that are correctly identified) up to the main
conclusion. The cumulative score across all three criteria are used to determine the overall
quality of each participant’s argument diagram. For example, if it is the case that
ABCDCONCLUSION, a diagram that contains A B C F CONCLUSION
receives 2 points and the diagram that contains A B C D F CONCLUSION would
receive 3 points, while the diagram that contains A C D CONCLUSION receives 0
points. This third criteria is perhaps the most important measure because it assesses how well the
participant is able to articulate the causal mechanism that explains how and why a particular root
cause (or multimedia principle) ultimately affects the learning outcome.
Coding the Video and Audio Data
Three different sources of data - diagramming behaviors (video), think-aloud data, and
interviews - were be transcribed and coded. jMAP was used to automatically log various types
of actions performed by participants while constructing a diagram. However, the validity of the
actions captured by jMAP has not yet been empirically tested. As a result, both the diagramming
actions and verbal reports captured in the video recordings were manually transcribed and then
coded to help ensure that the diagramming behaviors (and associated reasoning processes) that
were not recorded or recognized by jMAP were included in the data analysis. Through an
iterative and close examination of the video and audio recordings, initial coding schemes were
developed to identify and categorize the diagramming actions performed by each participant and
reasoning processes used by participants. After creating the initial coding scheme (creating a list
of defining codes for behaviors and verbal reports) for the video and audio data, a second coder
coded the same data in order to establish reliability of the data coding. The second coder was
71
trained by coding one expert and one novice’s video data to identify verbal utterances observed
in the video recordings. Although some researchers do not value the calculation of a numerical
inter-rater reliability on coding within qualitative research frameworks (Guba &Lincoln, 1994;
Madill, Jordan, & Shirley, 2000), generating an acceptable inter-rater reliability using Cohen’s
Kappa between two coders may contribute to minimizing possible errors and biases when
interpreting actions or texts in the given data.
After the second coder completed the coding task, I compared both coding results and
calculated the inter-rater reliability using Cohen’s Kappa coefficient (Cohen, 1960). According
to Cohen (1960), Kappa is a useful index of the agreement between two coders when: 1) the
units are independent; 2) the data are categorical/nominal; and 3) judges conduct their ratings
independently. In this study, the units of the video data set (diagramming behaviors) are nominal
scales and independent. Also, two coders conducted the coding process independently. In
practice, Kappa values from .41 to .60 indicate ‘moderate agreement,’ and values from .60 to .80
are substantial (Landis & Koch, 1977). While the reliability was less than .41, I discussed the
discrepancies in the coding results with the second coder and we came to a consensus by re-
coding the data that showed discrepancies until we reached an acceptable value (ranged from .41
to .60) of inter-rater reliability of the coding results. Commonalities and differences noted
between the codes determined the final categories and number of categories presented in the final
coding scheme.
Data Analysis
The coded data were sequentially analyzed (Bakeman & Gottman, 1997) within each
group (experts vs. novices) to identify overall patterns in the sequences of actions performed by
each group using the Discussion Analysis Tool or DAT (Jeong, 2012). First, all codes were
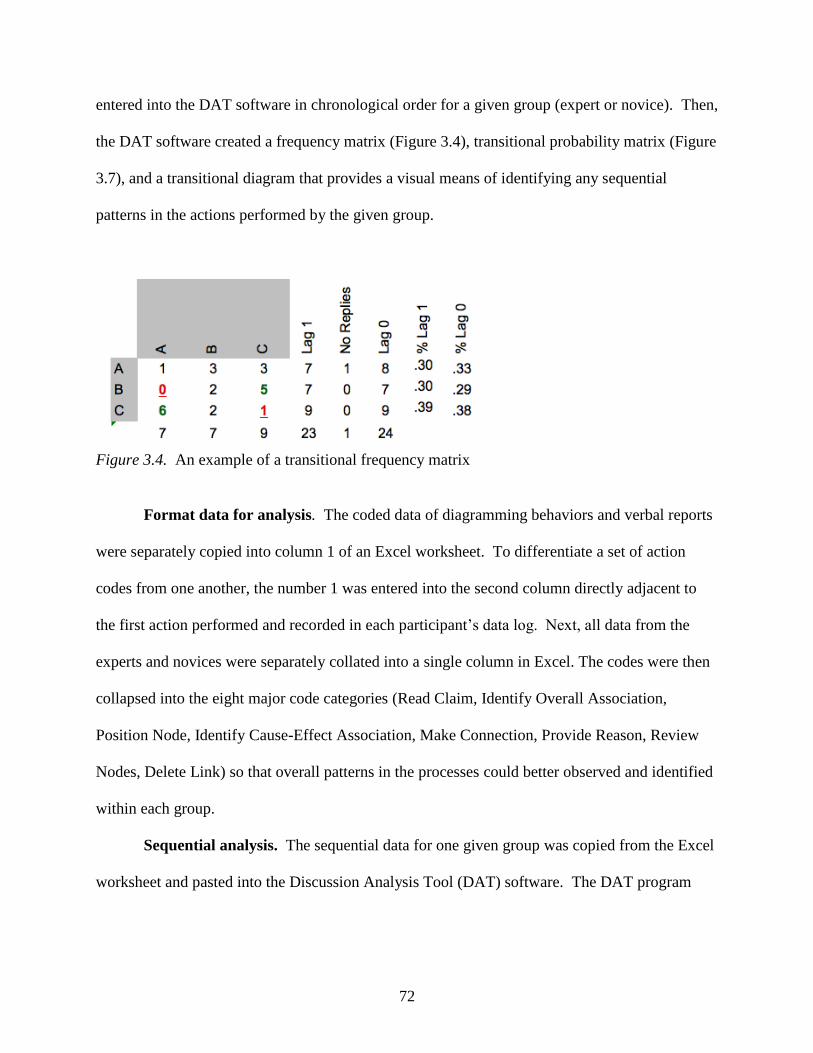
72
entered into the DAT software in chronological order for a given group (expert or novice). Then,
the DAT software created a frequency matrix (Figure 3.4), transitional probability matrix (Figure
3.7), and a transitional diagram that provides a visual means of identifying any sequential
patterns in the actions performed by the given group.
Figure 3.4. An example of a transitional frequency matrix
Format data for analysis. The coded data of diagramming behaviors and verbal reports
were separately copied into column 1 of an Excel worksheet. To differentiate a set of action
codes from one another, the number 1 was entered into the second column directly adjacent to
the first action performed and recorded in each participant’s data log. Next, all data from the
experts and novices were separately collated into a single column in Excel. The codes were then
collapsed into the eight major code categories (Read Claim, Identify Overall Association,
Position Node, Identify Cause-Effect Association, Make Connection, Provide Reason, Review
Nodes, Delete Link) so that overall patterns in the processes could better observed and identified
within each group.
Sequential analysis. The sequential data for one given group was copied from the Excel
worksheet and pasted into the Discussion Analysis Tool (DAT) software. The DAT program
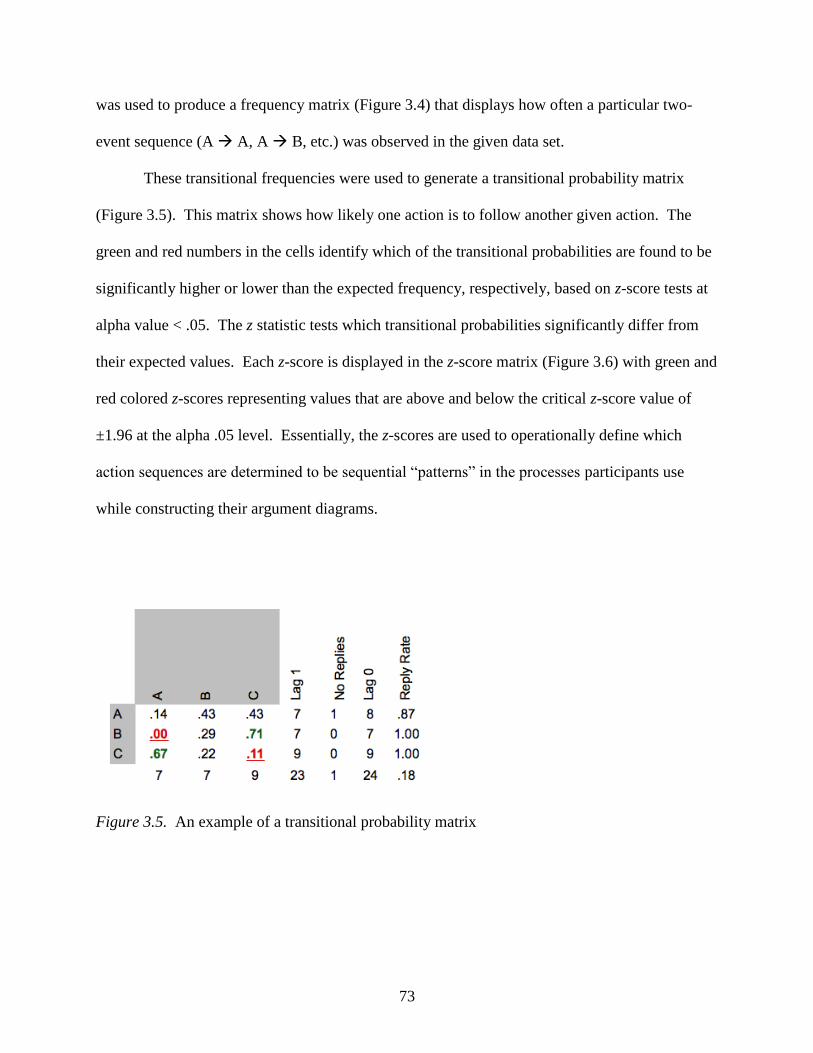
73
was used to produce a frequency matrix (Figure 3.4) that displays how often a particular two-
event sequence (A A, A B, etc.) was observed in the given data set.
These transitional frequencies were used to generate a transitional probability matrix
(Figure 3.5). This matrix shows how likely one action is to follow another given action. The
green and red numbers in the cells identify which of the transitional probabilities are found to be
significantly higher or lower than the expected frequency, respectively, based on z-score tests at
alpha value < .05. The z statistic tests which transitional probabilities significantly differ from
their expected values. Each z-score is displayed in the z-score matrix (Figure 3.6) with green and
red colored z-scores representing values that are above and below the critical z-score value of
±1.96 at the alpha .05 level. Essentially, the z-scores are used to operationally define which
action sequences are determined to be sequential “patterns” in the processes participants use
while constructing their argument diagrams.
Figure 3.5. An example of a transitional probability matrix
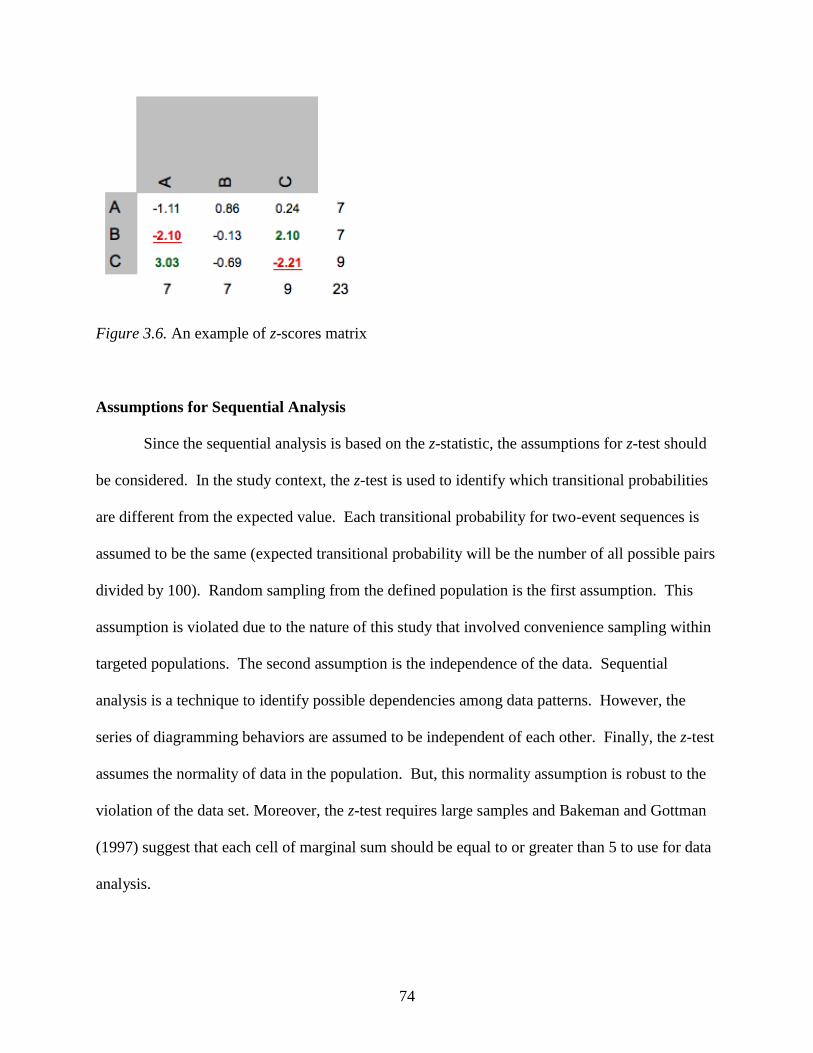
74
Figure 3.6. An example of z-scores matrix
Assumptions for Sequential Analysis
Since the sequential analysis is based on the z-statistic, the assumptions for z-test should
be considered. In the study context, the z-test is used to identify which transitional probabilities
are different from the expected value. Each transitional probability for two-event sequences is
assumed to be the same (expected transitional probability will be the number of all possible pairs
divided by 100). Random sampling from the defined population is the first assumption. This
assumption is violated due to the nature of this study that involved convenience sampling within
targeted populations. The second assumption is the independence of the data. Sequential
analysis is a technique to identify possible dependencies among data patterns. However, the
series of diagramming behaviors are assumed to be independent of each other. Finally, the z-test
assumes the normality of data in the population. But, this normality assumption is robust to the
violation of the data set. Moreover, the z-test requires large samples and Bakeman and Gottman
(1997) suggest that each cell of marginal sum should be equal to or greater than 5 to use for data
analysis.
75
Identify action sequence patterns. To provide a clearer and Gestalt view of the patterns
identified in the transitional probability matrices for each group, the DAT software generated a
transitional state diagram using data from the expert group and a second state diagram using data
from the novice group. For example, the transitional state diagrams (Figures 3.7, 3.8) provide a
visual representation of the observed patterns. To determine whether there are differences
between the processes used by the experts versus the novices, the two state diagrams are placed
side by side for comparison. Of particular interest are the patterns (transitional probabilities
found to be significantly higher than the expected probability based on z-score tests with p < .05)
observed among the processes used by experts but not observed among novices. For example,
we can observe a total of three patterns, AB, BC, and CA in both Groups A and B
(Figures 3.7, 3.8). The pattern that is unique to Group A is AB while the pattern that is unique
to Group B is CA. The unique processes reveal what may be the desired target processes that
explain what it is that experts do to create more accurate argument diagrams. The undesirable
processes are also determined by identifying the patterns observed only in the state diagram for
the novices, but not observed among the experts. In summary, the following process was used to
compare the transitional state diagrams to reveal processes that could potentially help and/or
inhibit students’ ability to create more accurate argument diagrams:
1) Identify total number of patterns observed between the expert and novice groups.
2) Identify how many and which of these patterns are unique to the expert group.
3) Identify how many and which of these patterns are unique to the novice group.
4) Interpret the unique sets of patterns to discern any larger global that might reveal the key
processes used to create more accurate argument diagrams.
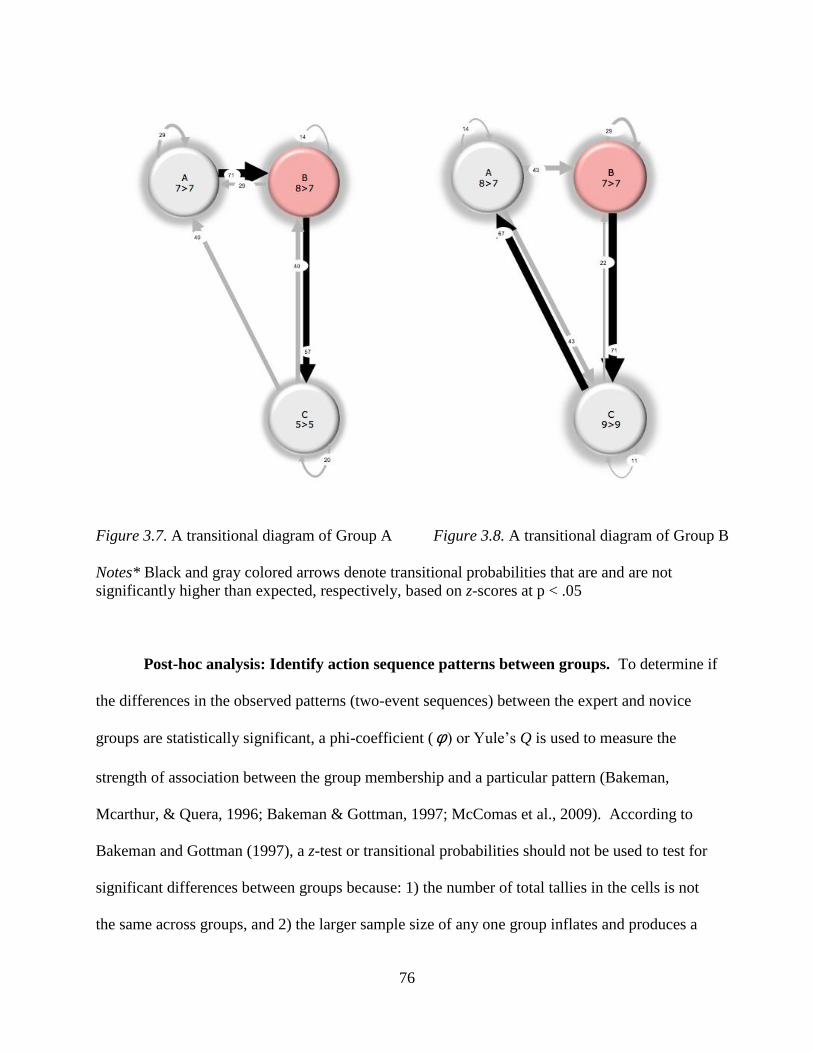
76
Figure 3.7. A transitional diagram of Group A
Notes* Black and gray colored arrows denote transitional probabilities that are and are not
significantly higher than expected, respectively, based on z-scores at p < .05
Post-hoc analysis: Identify action sequence patterns between groups. To determine if
the differences in the observed patterns (two-event sequences) between the expert and novice
groups are statistically significant, a phi-coefficient (f ) or Yule’s Q is used to measure the
strength of association between the group membership and a particular pattern (Bakeman,
Mcarthur, & Quera, 1996; Bakeman & Gottman, 1997; McComas et al., 2009). According to
Bakeman and Gottman (1997), a z-test or transitional probabilities should not be used to test for
significant differences between groups because: 1) the number of total tallies in the cells is not
the same across groups, and 2) the larger sample size of any one group inflates and produces a
Figure 3.8. A transitional diagram of Group B
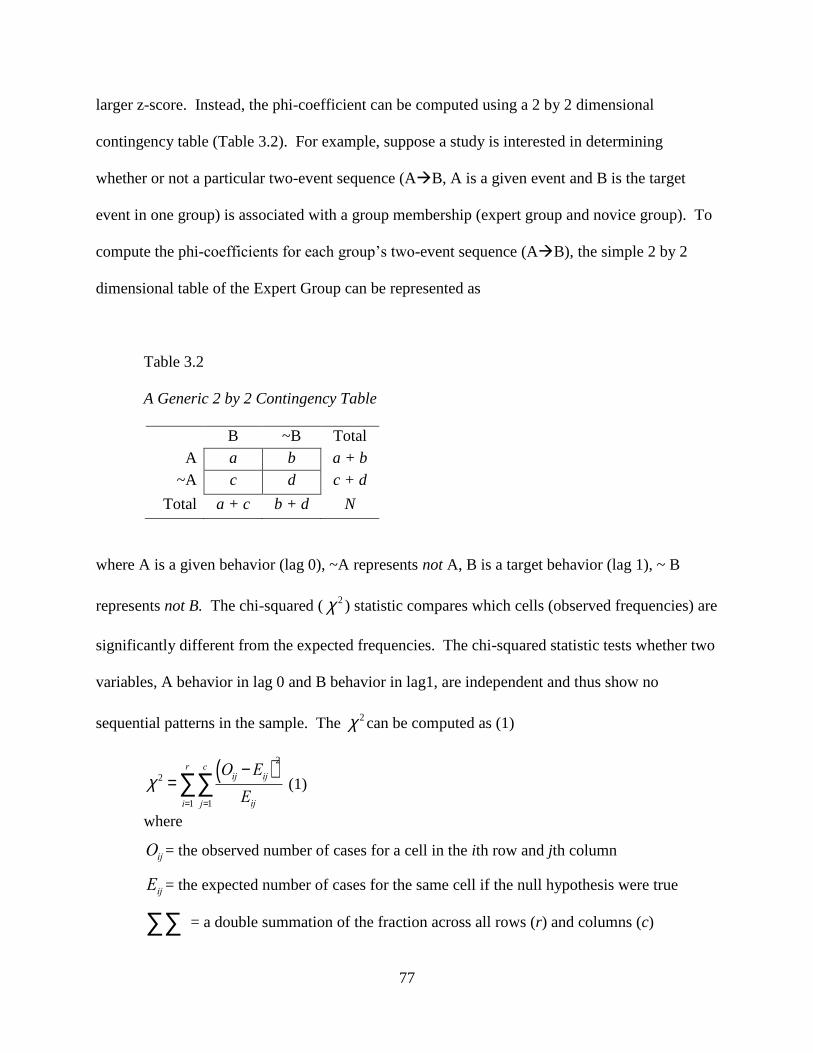
77
larger z-score. Instead, the phi-coefficient can be computed using a 2 by 2 dimensional
contingency table (Table 3.2). For example, suppose a study is interested in determining
whether or not a particular two-event sequence (AB, A is a given event and B is the target
event in one group) is associated with a group membership (expert group and novice group). To
compute the phi-coefficients for each group’s two-event sequence (AB), the simple 2 by 2
dimensional table of the Expert Group can be represented as
Table 3.2
A Generic 2 by 2 Contingency Table
B ~B Total
A a b a + b
~A c d c + d
Total a + c b + d N
where A is a given behavior (lag 0), ~A represents not A, B is a target behavior (lag 1), ~ B
represents not B. The chi-squared ( c 2) statistic compares which cells (observed frequencies) are
significantly different from the expected frequencies. The chi-squared statistic tests whether two
variables, A behavior in lag 0 and B behavior in lag1, are independent and thus show no
sequential patterns in the sample. The c 2can be computed as (1)
c 2 =Oij -Eij( )
2
Eijj=1
c
åi=1
r
å (1)
where
Oij= the observed number of cases for a cell in the ith row and jth column
Eij = the expected number of cases for the same cell if the null hypothesis were true
åå = a double summation of the fraction across all rows (r) and columns (c)
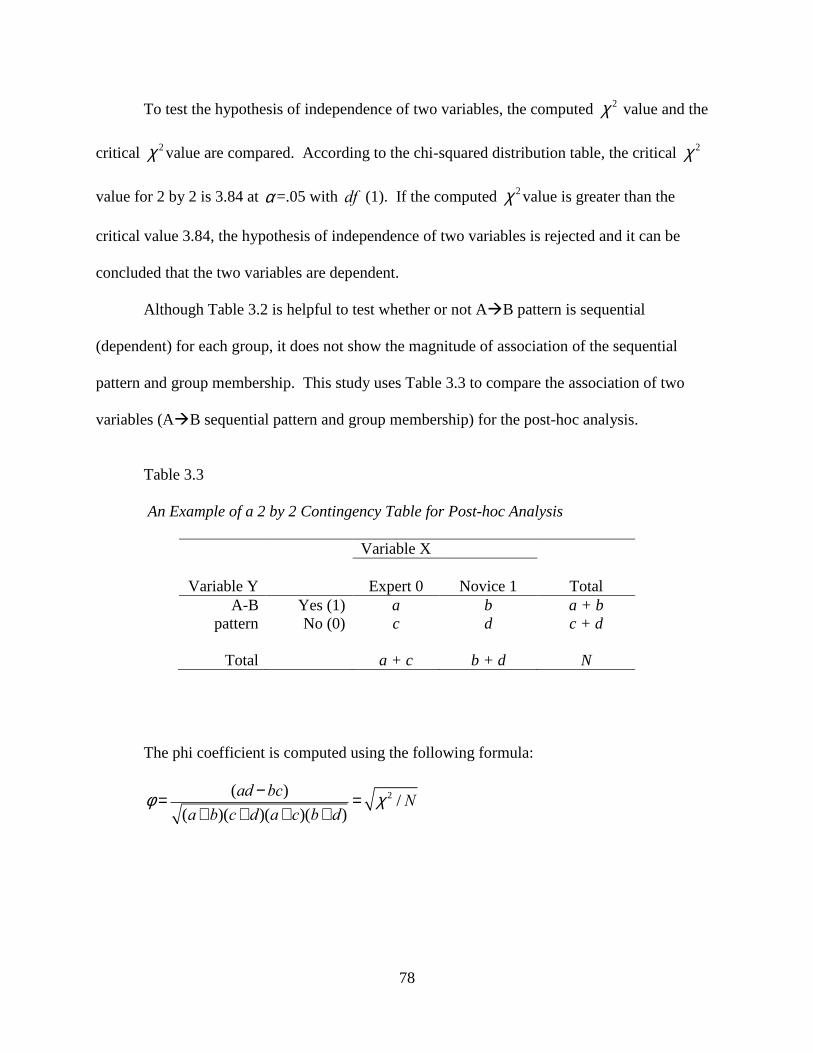
78
To test the hypothesis of independence of two variables, the computed c 2 value and the
critical c 2value are compared. According to the chi-squared distribution table, the critical c 2
value for 2 by 2 is 3.84 at a=.05 with df (1). If the computed c 2value is greater than the
critical value 3.84, the hypothesis of independence of two variables is rejected and it can be
concluded that the two variables are dependent.
Although Table 3.2 is helpful to test whether or not AB pattern is sequential
(dependent) for each group, it does not show the magnitude of association of the sequential
pattern and group membership. This study uses Table 3.3 to compare the association of two
variables (AB sequential pattern and group membership) for the post-hoc analysis.
Table 3.3
An Example of a 2 by 2 Contingency Table for Post-hoc Analysis
Variable X
Variable Y
Expert 0
Novice 1
Total
A-B
pattern
Yes (1) a b a + b
No (0) c d c + d
Total a + c b + d N
The phi coefficient is computed using the following formula:
f =(ad -bc)
(a+b)(c+d)(a+ c)(b+ d)= c 2 / N
79
Based on the definition, we can have the phi coefficient for the Expert group of AB sequence.
Likewise, the phi coefficient for the Novice group of the AB sequence can be computed. The
range of the phi-coefficient is -1 to 1 with zero indicating no association. The result can be
interpreted using the rule of thumb of a phi coefficient: above .90 indicates an extremely strong
relationship, .70 to .89 indicates a strong relationship, .50 to .69 a moderate relationship, .30 to
.49 a low relationship, and below .30 a weak relationship (Pett, 1997). By comparing the two phi
coefficients, we can report and compare the magnitudes of association between the sequential
action and group membership. If we get the phi close to 1, Group 1 is strongly related to the A-B
pattern.
The null hypothesis is “the sequential behavior AB is not significantly associated with
the group (experts and novices).” To test the null hypothesis using the phi coefficient, two
variables XY should be dichotomous and observations should be independent and representing
frequencies (Pett, 1997). The data in this study may violate the independency assumptions of
observations. According to Bakeman and Gottman (1997), the violation of independency of
observations merely affects the result and the phi-coefficient can be used in the sequential
analysis to measure the strength of association between two variables.
Post-hoc analysis: Identify action sequences patterns between experts and between
novices. To examine the similarities and differences among experts and among novices, I
presented five experts’ state diagrams and five novices’ state diagrams side by side. Then, I
compared the experts’ state diagrams to determine to what extend experts use the same processes
using the same statistical analysis and tests described above. Also, I compared the novices’ state
diagrams to determine to what extent novices use the same processes.
80
Post-hoc analysis of retrospective interview data. Retrospective interview data was
analyzed to provide detailed explanations of specific sequential patterns used by individuals and
groups. The use of the interview helped the researcher to further identify and elaborate on
reasoning processes revealed in the sequential analysis and to achieve a deeper understanding of
how experts and novices analyze complex arguments. For each individual, I classified the
strategies that were used and any difficulties or problems that were experienced. Next, I
examined how the patterns identified in sequential analysis correspond to and are a product of
the strategies and difficulties reported in the retrospective interview.
Limitation of Sequential Analysis
As the participant’s time on task and number of actions performed increases in number,
the frequencies in the frequency matrices increase in number and so, too, will the corresponding
z-score. As a result, each participant’s time on task must be taken into consideration. Because it
is not possible to control the amount of time each participant needs to complete an argument
diagram, the alternative is to examine a fixed number of actions that the participants perform on
their argument diagrams from the beginning of the diagramming task. This fixed number can be
set to the least number of actions among the six participants used to complete the diagramming
task.
A second limitation of using sequential analysis is that the minimum number of tallies in
the frequency tables should be equal to or greater than five (Bakeman & Gottman, 1997). Thus,
the cells that possess values less than five should be treated as ‘missing data’ and excluded from
the data analysis.
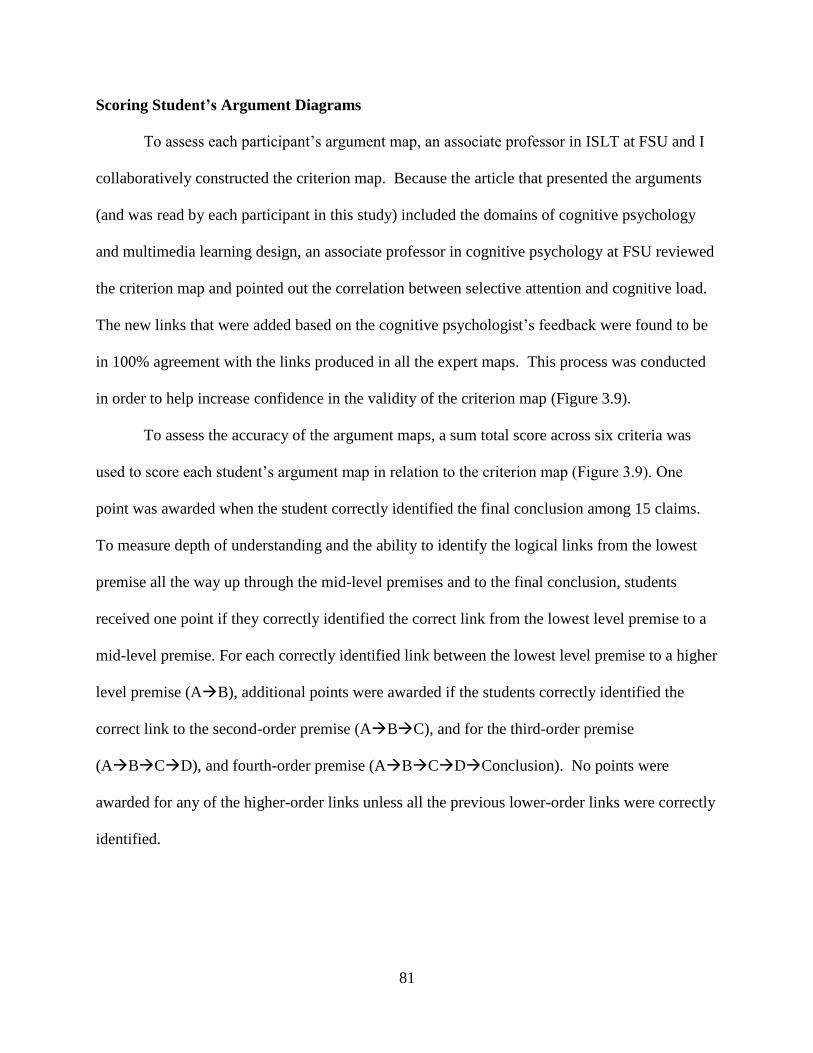
81
Scoring Student’s Argument Diagrams
To assess each participant’s argument map, an associate professor in ISLT at FSU and I
collaboratively constructed the criterion map. Because the article that presented the arguments
(and was read by each participant in this study) included the domains of cognitive psychology
and multimedia learning design, an associate professor in cognitive psychology at FSU reviewed
the criterion map and pointed out the correlation between selective attention and cognitive load.
The new links that were added based on the cognitive psychologist’s feedback were found to be
in 100% agreement with the links produced in all the expert maps. This process was conducted
in order to help increase confidence in the validity of the criterion map (Figure 3.9).
To assess the accuracy of the argument maps, a sum total score across six criteria was
used to score each student’s argument map in relation to the criterion map (Figure 3.9). One
point was awarded when the student correctly identified the final conclusion among 15 claims.
To measure depth of understanding and the ability to identify the logical links from the lowest
premise all the way up through the mid-level premises and to the final conclusion, students
received one point if they correctly identified the correct link from the lowest level premise to a
mid-level premise. For each correctly identified link between the lowest level premise to a higher
level premise (AB), additional points were awarded if the students correctly identified the
correct link to the second-order premise (ABC), and for the third-order premise
(ABCD), and fourth-order premise (ABCDConclusion). No points were
awarded for any of the higher-order links unless all the previous lower-order links were correctly
identified.
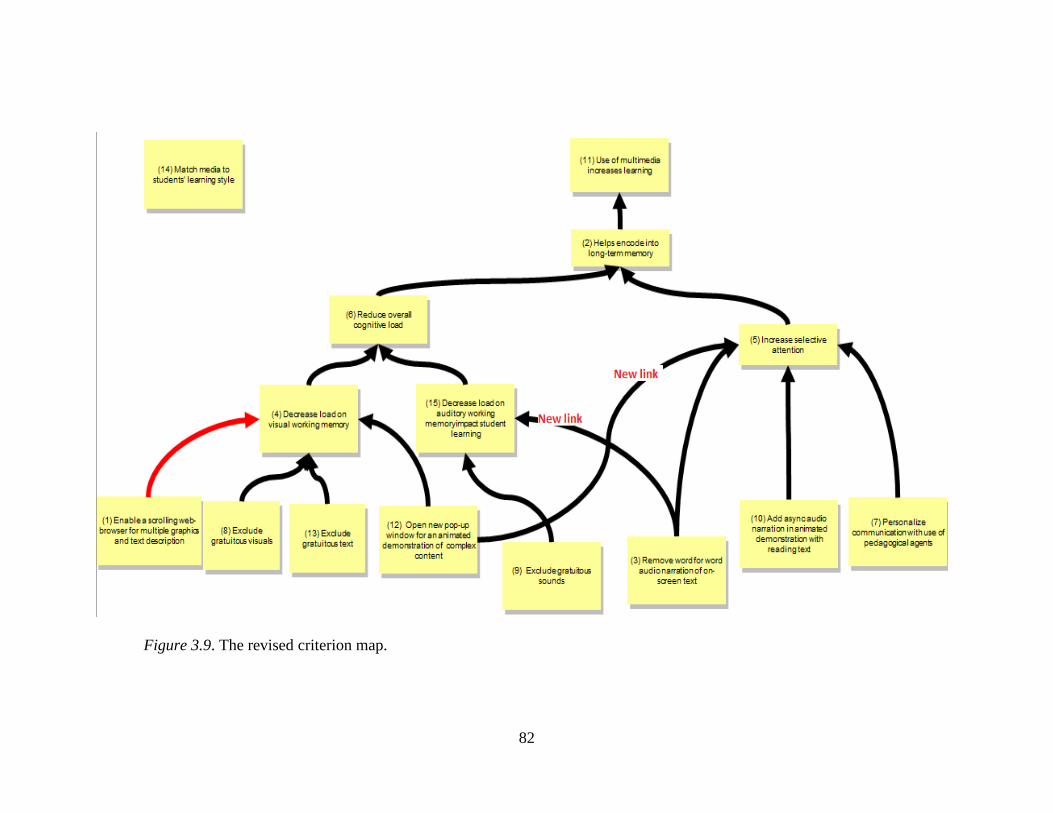
82
Figure 3.9. The revised criterion map.

83
Because the criterion map contained five hierarchical levels from the bottom premises to the
final conclusion, up to four points could be awarded for correctly identifying a four-level chain
of premises that linked the lowest-level premise all the way to the final conclusion. Finally, the
sixth criteria deducted a half point for each link with an incorrect direction and incorrect valence.
84
CHAPTER 4
RESULTS
Introduction
The purpose of this study was to explore the reasoning processes used by experts and
novices to analyze a complex argument in order to identify the reasoning processes that are
associated with and possibly used to achieve higher versus lower understanding of complex
arguments. To meet the goal of the research, this study addressed three research questions: 1)
What reasoning processes do experts and novices perform when diagramming a complex
argument? 2) What differences exist in the reasoning processes used by experts versus novices?
and 3) Which processes might help produce diagrams of high versus low accuracy? This chapter
begins with the demographic information of the participants and then presents the quantitative
analysis findings for each research question. After presenting the results from sequential
analysis, I present the qualitative analysis findings to help explain the reasoning processes
identified with sequential analysis and evaluate the value of using sequential analysis as a
method for assessing and diagnosing participants’ reasoning processes.
Demographic Information
The participants in this study were five graduate students and five instructors, all from a
higher education institution in the southeastern United States. The sample was purposefully
selected and assigned to two groups: novice and expert. The novice group included one male and
four female master-level graduate students ranging in age from 24- to 54-years-old from four
different departments in Counseling, Information Studies, and Education (Table 4.1). One
novice in this sample reported previous coursework in reasoning and argumentation, but four of
the novices had taken no formal argumentation/reasoning courses.
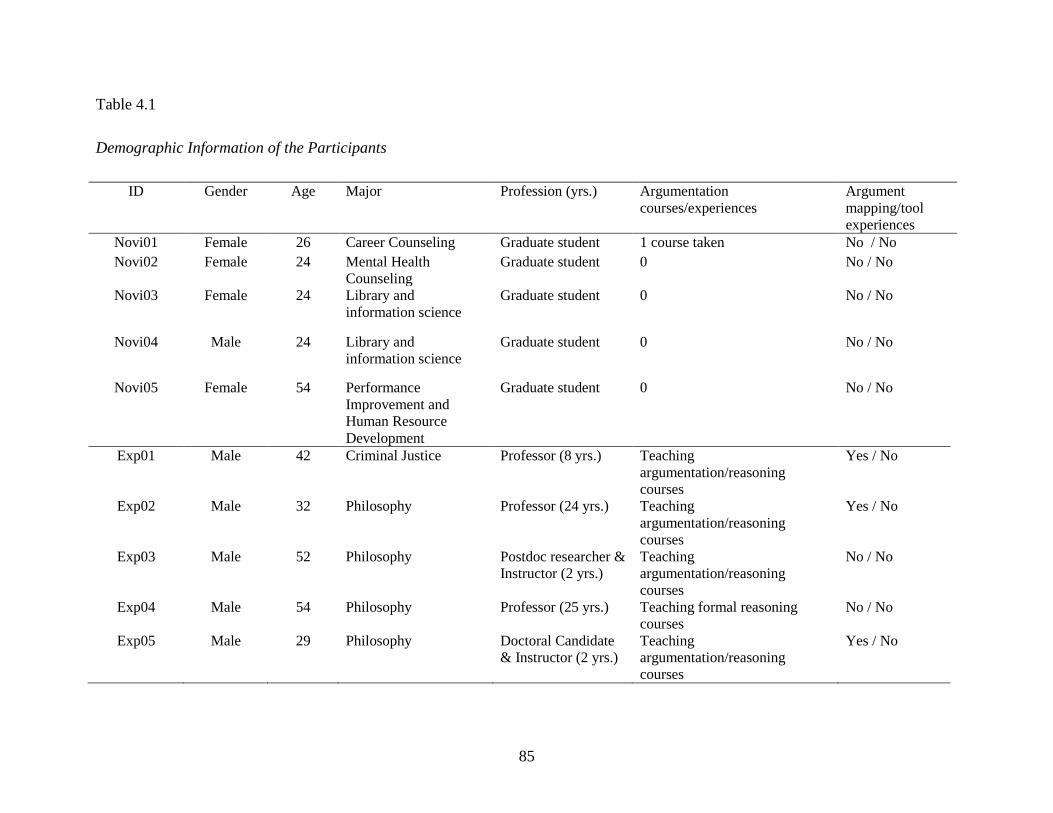
85
Table 4.1
Demographic Information of the Participants
ID Gender Age Major Profession (yrs.) Argumentation
courses/experiences
Argument
mapping/tool
experiences
Novi01 Female 26 Career Counseling Graduate student 1 course taken No / No
Novi02 Female 24 Mental Health
Counseling
Graduate student 0 No / No
Novi03 Female 24 Library and
information science
Graduate student 0 No / No
Novi04 Male 24 Library and
information science
Graduate student 0 No / No
Novi05 Female 54 Performance
Improvement and
Human Resource
Development
Graduate student 0 No / No
Exp01 Male 42 Criminal Justice Professor (8 yrs.) Teaching
argumentation/reasoning
courses
Yes / No
Exp02 Male 32 Philosophy Professor (24 yrs.) Teaching
argumentation/reasoning
courses
Yes / No
Exp03 Male 52 Philosophy Postdoc researcher &
Instructor (2 yrs.)
Teaching
argumentation/reasoning
courses
No / No
Exp04 Male 54 Philosophy Professor (25 yrs.) Teaching formal reasoning
courses
No / No
Exp05 Male 29 Philosophy Doctoral Candidate
& Instructor (2 yrs.)
Teaching
argumentation/reasoning
courses
Yes / No
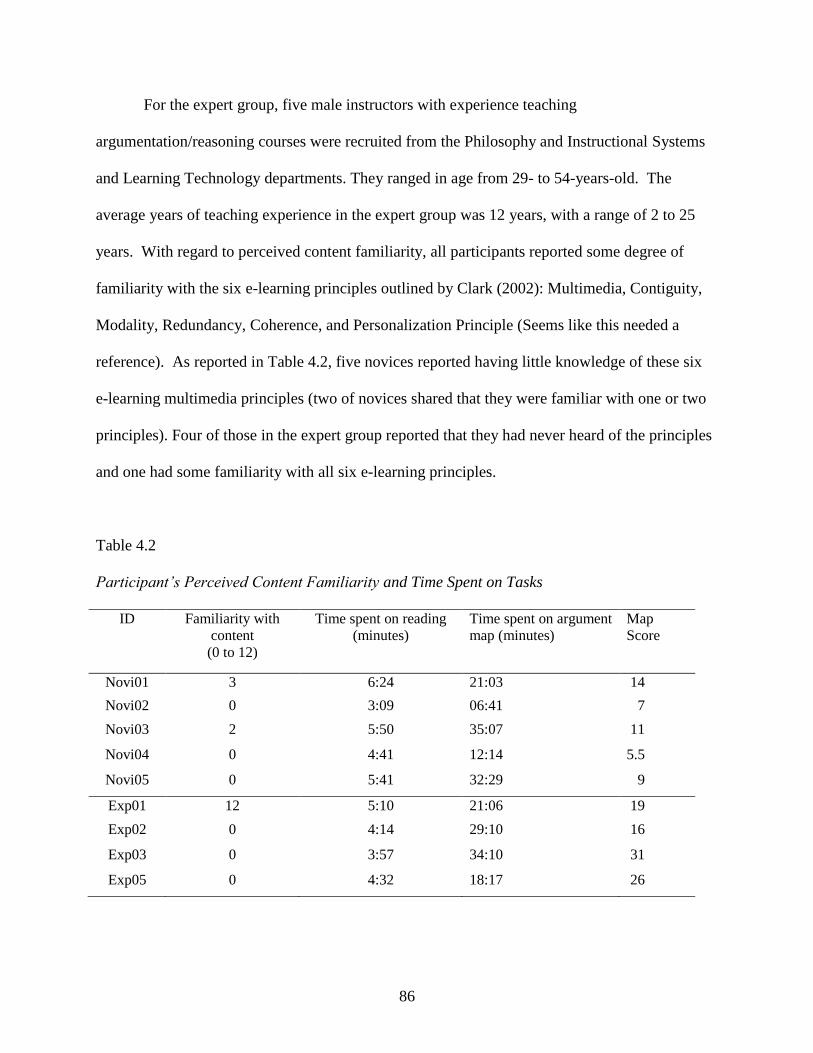
86
For the expert group, five male instructors with experience teaching
argumentation/reasoning courses were recruited from the Philosophy and Instructional Systems
and Learning Technology departments. They ranged in age from 29- to 54-years-old. The
average years of teaching experience in the expert group was 12 years, with a range of 2 to 25
years. With regard to perceived content familiarity, all participants reported some degree of
familiarity with the six e-learning principles outlined by Clark (2002): Multimedia, Contiguity,
Modality, Redundancy, Coherence, and Personalization Principle (Seems like this needed a
reference). As reported in Table 4.2, five novices reported having little knowledge of these six
e-learning multimedia principles (two of novices shared that they were familiar with one or two
principles). Four of those in the expert group reported that they had never heard of the principles
and one had some familiarity with all six e-learning principles.
Table 4.2
Participant’s Perceived Content Familiarity and Time Spent on Tasks
ID Familiarity with
content
(0 to 12)
Time spent on reading
(minutes)
Time spent on argument
map (minutes)
Map
Score
Novi01 3 6:24 21:03 14
Novi02 0 3:09 06:41 7
Novi03 2 5:50 35:07 11
Novi04 0 4:41 12:14 5.5
Novi05 0 5:41 32:29 9
Exp01 12 5:10 21:06 19
Exp02 0 4:14 29:10 16
Exp03 0 3:57 34:10 31
Exp05 0 4:32 18:17 26
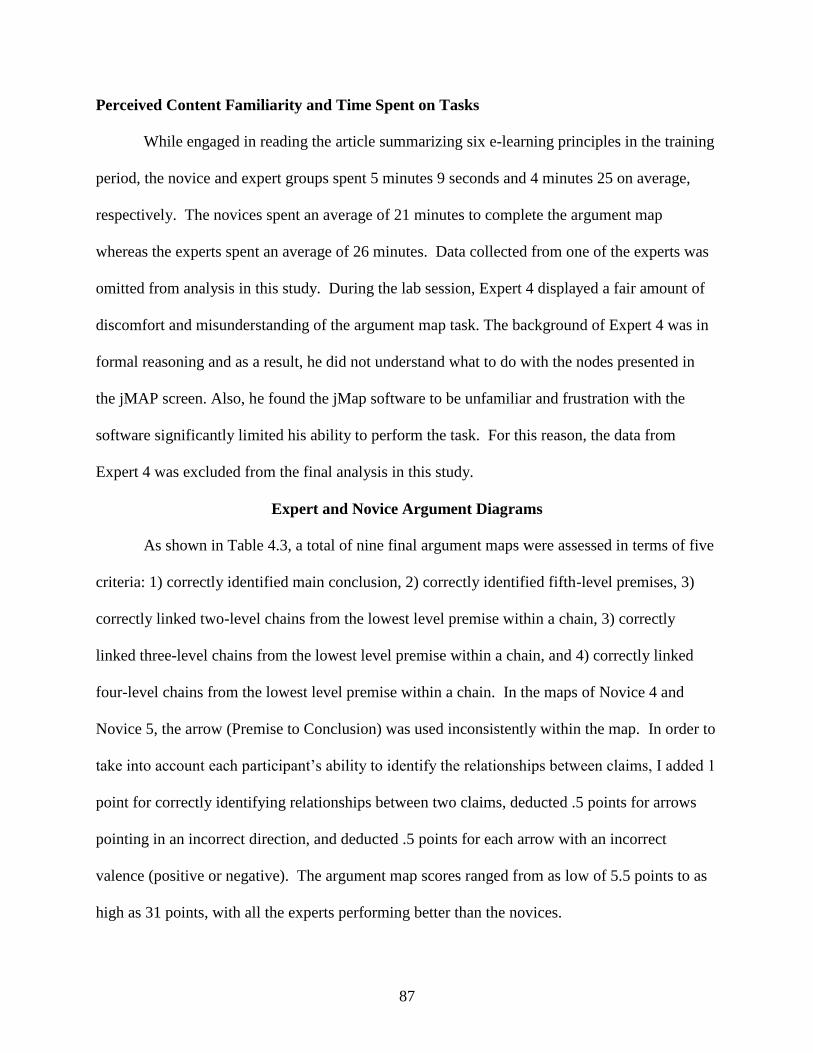
87
Perceived Content Familiarity and Time Spent on Tasks
While engaged in reading the article summarizing six e-learning principles in the training
period, the novice and expert groups spent 5 minutes 9 seconds and 4 minutes 25 on average,
respectively. The novices spent an average of 21 minutes to complete the argument map
whereas the experts spent an average of 26 minutes. Data collected from one of the experts was
omitted from analysis in this study. During the lab session, Expert 4 displayed a fair amount of
discomfort and misunderstanding of the argument map task. The background of Expert 4 was in
formal reasoning and as a result, he did not understand what to do with the nodes presented in
the jMAP screen. Also, he found the jMap software to be unfamiliar and frustration with the
software significantly limited his ability to perform the task. For this reason, the data from
Expert 4 was excluded from the final analysis in this study.
Expert and Novice Argument Diagrams
As shown in Table 4.3, a total of nine final argument maps were assessed in terms of five
criteria: 1) correctly identified main conclusion, 2) correctly identified fifth-level premises, 3)
correctly linked two-level chains from the lowest level premise within a chain, 3) correctly
linked three-level chains from the lowest level premise within a chain, and 4) correctly linked
four-level chains from the lowest level premise within a chain. In the maps of Novice 4 and
Novice 5, the arrow (Premise to Conclusion) was used inconsistently within the map. In order to
take into account each participant’s ability to identify the relationships between claims, I added 1
point for correctly identifying relationships between two claims, deducted .5 points for arrows
pointing in an incorrect direction, and deducted .5 points for each arrow with an incorrect
valence (positive or negative). The argument map scores ranged from as low of 5.5 points to as
high as 31 points, with all the experts performing better than the novices.
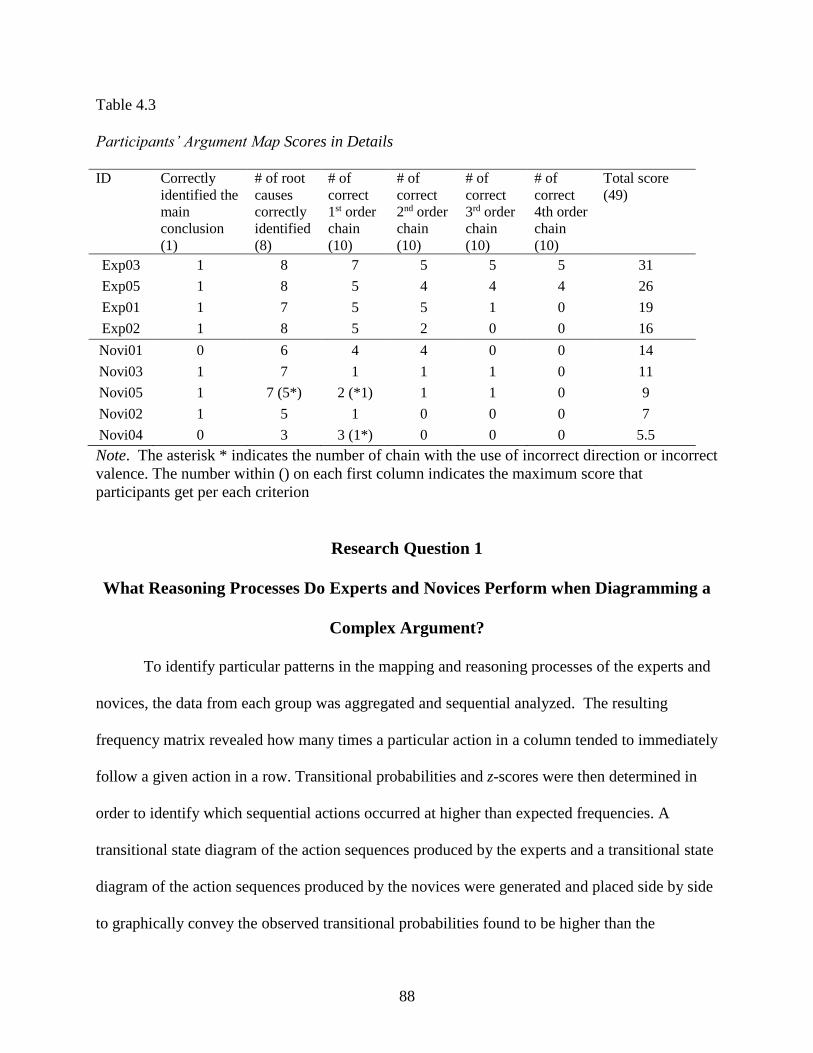
88
Table 4.3
Participants’ Argument Map Scores in Details
ID Correctly
identified the
main
conclusion
(1)
# of root
causes
correctly
identified
(8)
# of
correct
1st order
chain
(10)
# of
correct
2nd order
chain
(10)
# of
correct
3rd order
chain
(10)
# of
correct
4th order
chain
(10)
Total score
(49)
Exp03 1 8 7 5 5 5 31
Exp05 1 8 5 4 4 4 26
Exp01 1 7 5 5 1 0 19
Exp02 1 8 5 2 0 0 16
Novi01 0 6 4 4 0 0 14
Novi03 1 7 1 1 1 0 11
Novi05 1 7 (5*) 2 (*1) 1 1 0 9
Novi02 1 5 1 0 0 0 7
Novi04 0 3 3 (1*) 0 0 0 5.5
Note. The asterisk * indicates the number of chain with the use of incorrect direction or incorrect
valence. The number within () on each first column indicates the maximum score that
participants get per each criterion
Research Question 1
What Reasoning Processes Do Experts and Novices Perform when Diagramming a
Complex Argument?
To identify particular patterns in the mapping and reasoning processes of the experts and
novices, the data from each group was aggregated and sequential analyzed. The resulting
frequency matrix revealed how many times a particular action in a column tended to immediately
follow a given action in a row. Transitional probabilities and z-scores were then determined in
order to identify which sequential actions occurred at higher than expected frequencies. A
transitional state diagram of the action sequences produced by the experts and a transitional state
diagram of the action sequences produced by the novices were generated and placed side by side
to graphically convey the observed transitional probabilities found to be higher than the
89
expected, and to reveal more global and larger sequences of actions that depict the mapping
processes used by experts and by novices.
Sequential Patterns in Experts’ Actions
The observed frequency of each action sequence observed in the expert group is reported in
Table 4.4. The total number of two-event sequences observed was 746 among the four experts
whose data was included in the analysis. The two most frequently observed actions were Read
Claim (225 times) and Identify Association (141 times) and the two least frequent actions were
Provide Reason (11 times) and Delete Link (26 times).
Based on the values reported in the expert group’s frequency matrix (Table 4.4), the transitional
probabilities and z-scores in Table 4.5) and the resulting transitional state diagram in Figure 4.1
reveal a total of nine sequential “patterns” (action sequences that occurred at significantly higher
frequencies than expected): Read Claim Read Claim, Read Claim Identify Association,
Identify Association Position Node, Identify Cause-effect Association Reason, Identify
Cause-effect Association Make Connection, Position Node Read Claim, Make Connection
Identify Cause-effect Association, Review Review, and Delete link Delete Link. The
two most frequent actions followed by Read Claim were Read Claim (119 times) and Identify
Association (66 times) given the total of 225 actions that immediately followed Read Claim. As
a result, the transitional probabilities of RC RC and RC IA was .53 % and 29% with z-
scores of 9.08 and 4.43, respectively, at alpha level p < .05.
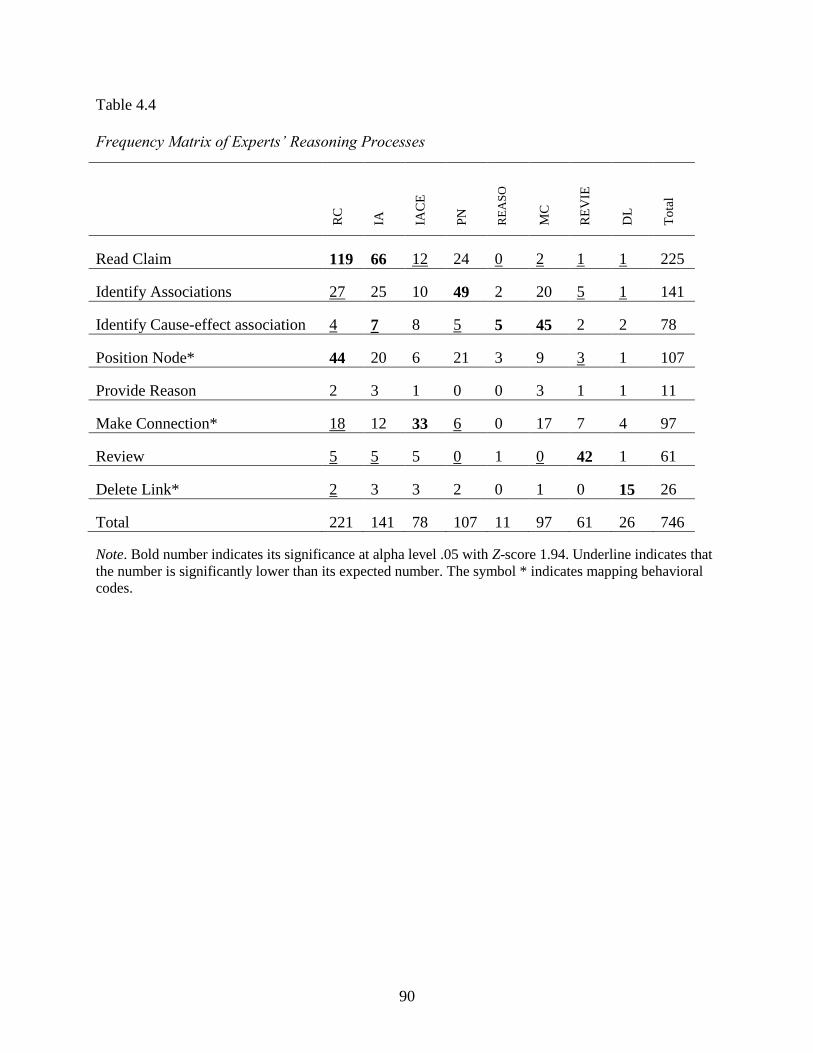
90
Table 4.4
Frequency Matrix of Experts’ Reasoning Processes
Note. Bold number indicates its significance at alpha level .05 with Z-score 1.94. Underline indicates that
the number is significantly lower than its expected number. The symbol * indicates mapping behavioral
codes.
RC
IA
IAC
E
PN
RE
AS
O
MC
RE
VIE
DL
To
tal
Read Claim 119 66 12 24 0 2 1 1 225
Identify Associations 27 25 10 49 2 20 5 1 141
Identify Cause-effect association 4 7 8 5 5 45 2 2 78
Position Node* 44 20 6 21 3 9 3 1 107
Provide Reason 2 3 1 0 0 3 1 1 11
Make Connection* 18 12 33 6 0 17 7 4 97
Review 5 5 5 0 1 0 42 1 61
Delete Link* 2 3 3 2 0 1 0 15 26
Total 221 141 78 107 11 97 61 26 746
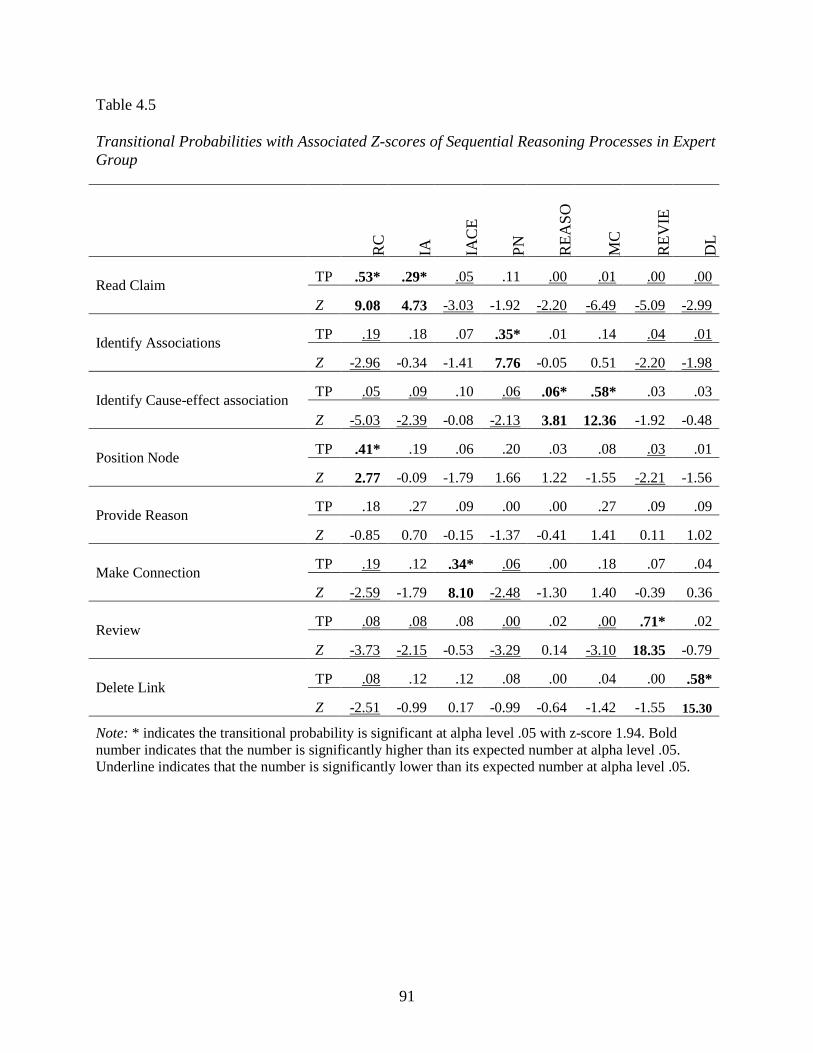
91
Table 4.5
Transitional Probabilities with Associated Z-scores of Sequential Reasoning Processes in Expert
Group
Note: * indicates the transitional probability is significant at alpha level .05 with z-score 1.94. Bold
number indicates that the number is significantly higher than its expected number at alpha level .05.
Underline indicates that the number is significantly lower than its expected number at alpha level .05.
RC
IA
IAC
E
PN
RE
AS
O
MC
RE
VIE
DL
Read Claim TP .53* .29* .05 .11 .00 .01 .00 .00
Z 9.08 4.73 -3.03 -1.92 -2.20 -6.49 -5.09 -2.99
Identify Associations TP .19 .18 .07 .35* .01 .14 .04 .01
Z -2.96 -0.34 -1.41 7.76 -0.05 0.51 -2.20 -1.98
Identify Cause-effect association TP .05 .09 .10 .06 .06* .58* .03 .03
Z -5.03 -2.39 -0.08 -2.13 3.81 12.36 -1.92 -0.48
Position Node TP .41* .19 .06 .20 .03 .08 .03 .01
Z 2.77 -0.09 -1.79 1.66 1.22 -1.55 -2.21 -1.56
Provide Reason TP .18 .27 .09 .00 .00 .27 .09 .09
Z -0.85 0.70 -0.15 -1.37 -0.41 1.41 0.11 1.02
Make Connection TP .19 .12 .34* .06 .00 .18 .07 .04
Z -2.59 -1.79 8.10 -2.48 -1.30 1.40 -0.39 0.36
Review TP .08 .08 .08 .00 .02 .00 .71* .02
Z -3.73 -2.15 -0.53 -3.29 0.14 -3.10 18.35 -0.79
Delete Link TP .08 .12 .12 .08 .00 .04 .00 .58*
Z -2.51 -0.99 0.17 -0.99 -0.64 -1.42 -1.55 15.30
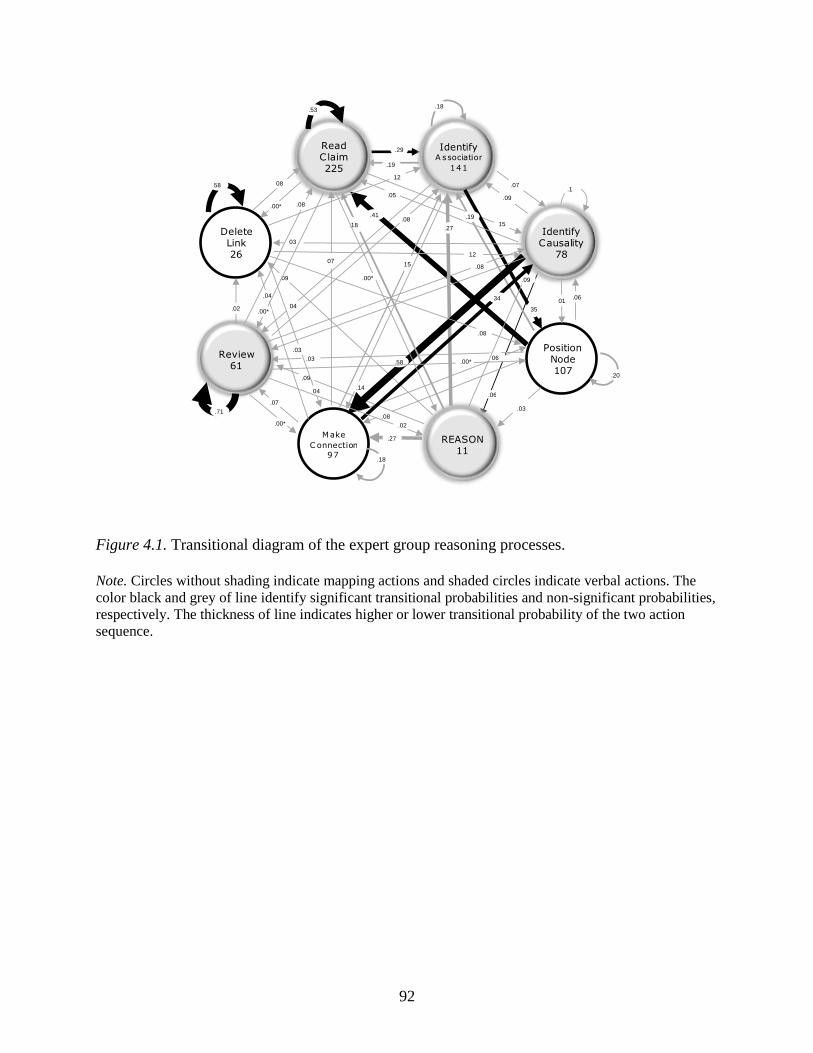
92
Figure 4.1. Transitional diagram of the expert group reasoning processes.
DeleteLink26
PositionNode107
Review61
.07
.06
.19
ReadClaim225
REASON11
Make
C onnection
97
.29
.53
07
15
IdentifyA ssociation
141
3504
.05 .09
.1
01
03
IdentifyCausality
78
.41 .19
.03
.08
.03
.27
.27
.09
.09
15
06
.18
.07
.08
.71
.02
58 0812
12
04
.18
.14
.58
.03
.06
.20
.18
.09
34.04
.08
.08
.02
.08
.00*
.00*
.00*
.00*
.00*
Note. Circles without shading indicate mapping actions and shaded circles indicate verbal actions. The
color black and grey of line identify significant transitional probabilities and non-significant probabilities,
respectively. The thickness of line indicates higher or lower transitional probability of the two action
sequence.
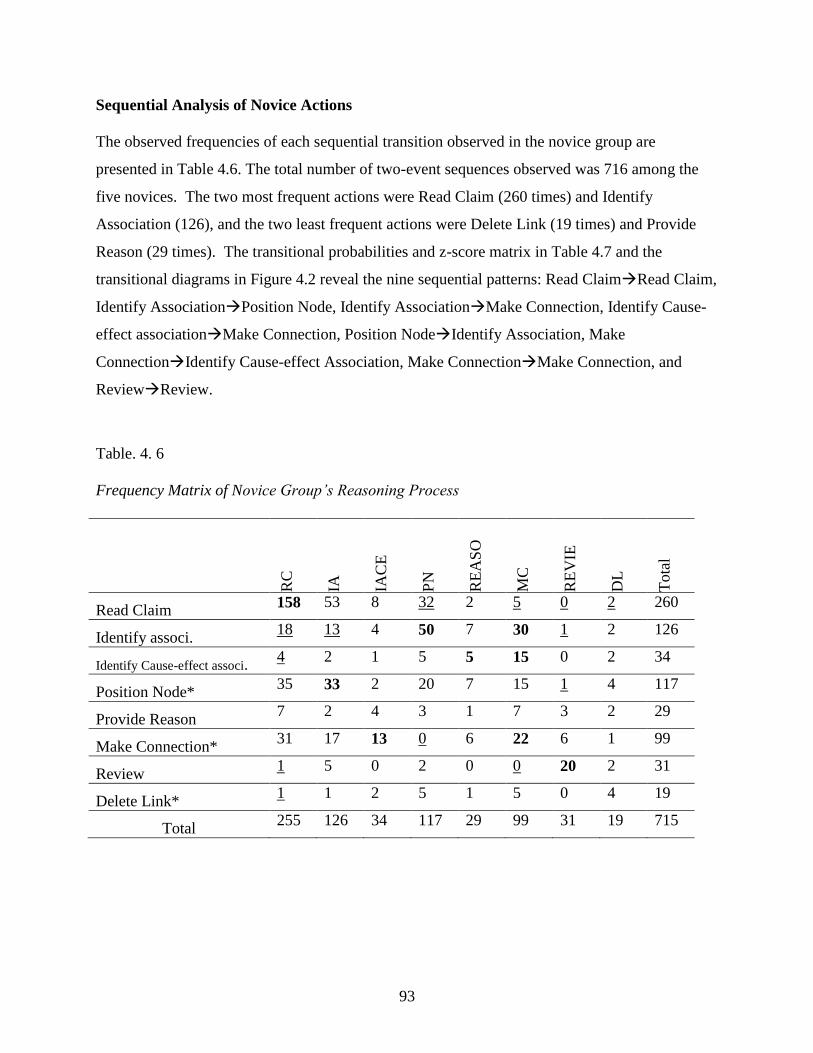
93
Sequential Analysis of Novice Actions
The observed frequencies of each sequential transition observed in the novice group are
presented in Table 4.6. The total number of two-event sequences observed was 716 among the
five novices. The two most frequent actions were Read Claim (260 times) and Identify
Association (126), and the two least frequent actions were Delete Link (19 times) and Provide
Reason (29 times). The transitional probabilities and z-score matrix in Table 4.7 and the
transitional diagrams in Figure 4.2 reveal the nine sequential patterns: Read ClaimRead Claim,
Identify AssociationPosition Node, Identify AssociationMake Connection, Identify Cause-
effect associationMake Connection, Position NodeIdentify Association, Make
ConnectionIdentify Cause-effect Association, Make ConnectionMake Connection, and
ReviewReview.
Table. 4. 6
Frequency Matrix of Novice Group’s Reasoning Process
RC
IA
IAC
E
PN
RE
AS
O
MC
RE
VIE
DL
Tota
l
Read Claim 158 53 8 32 2 5 0 2 260
Identify associ. 18 13 4 50 7 30 1 2 126
Identify Cause-effect associ. 4 2 1 5 5 15 0 2 34
Position Node* 35 33 2 20 7 15 1 4 117
Provide Reason 7 2 4 3 1 7 3 2 29
Make Connection* 31 17 13 0 6 22 6 1 99
Review 1 5 0 2 0 0 20 2 31
Delete Link* 1 1 2 5 1 5 0 4 19
Total 255 126 34 117 29 99 31 19 715
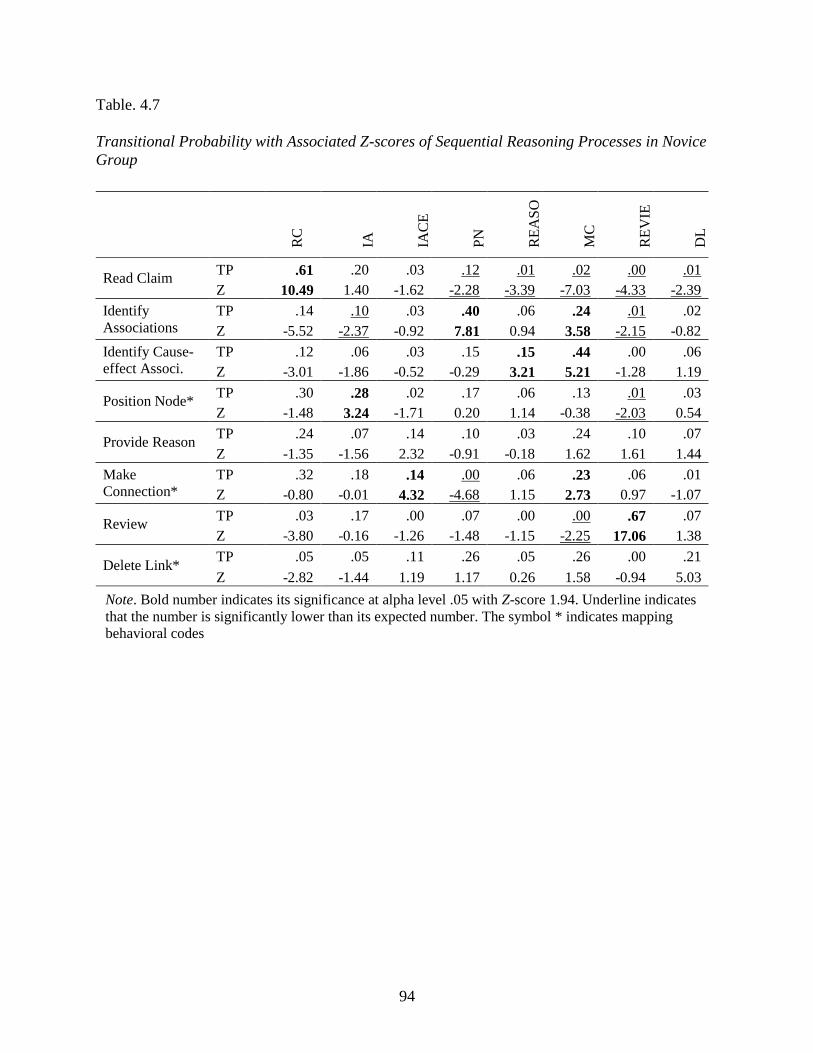
94
Table. 4.7
Transitional Probability with Associated Z-scores of Sequential Reasoning Processes in Novice
Group
R
C
IA
IAC
E
PN
RE
AS
O
MC
RE
VIE
DL
Read Claim TP .61 .20 .03 .12 .01 .02 .00 .01
Z 10.49 1.40 -1.62 -2.28 -3.39 -7.03 -4.33 -2.39
Identify
Associations
TP .14 .10 .03 .40 .06 .24 .01 .02
Z -5.52 -2.37 -0.92 7.81 0.94 3.58 -2.15 -0.82
Identify Cause-
effect Associ.
TP .12 .06 .03 .15 .15 .44 .00 .06
Z -3.01 -1.86 -0.52 -0.29 3.21 5.21 -1.28 1.19
Position Node* TP .30 .28 .02 .17 .06 .13 .01 .03
Z -1.48 3.24 -1.71 0.20 1.14 -0.38 -2.03 0.54
Provide Reason TP .24 .07 .14 .10 .03 .24 .10 .07
Z -1.35 -1.56 2.32 -0.91 -0.18 1.62 1.61 1.44
Make
Connection*
TP .32 .18 .14 .00 .06 .23 .06 .01
Z -0.80 -0.01 4.32 -4.68 1.15 2.73 0.97 -1.07
Review TP .03 .17 .00 .07 .00 .00 .67 .07
Z -3.80 -0.16 -1.26 -1.48 -1.15 -2.25 17.06 1.38
Delete Link* TP .05 .05 .11 .26 .05 .26 .00 .21
Z -2.82 -1.44 1.19 1.17 0.26 1.58 -0.94 5.03
Note. Bold number indicates its significance at alpha level .05 with Z-score 1.94. Underline indicates
that the number is significantly lower than its expected number. The symbol * indicates mapping
behavioral codes
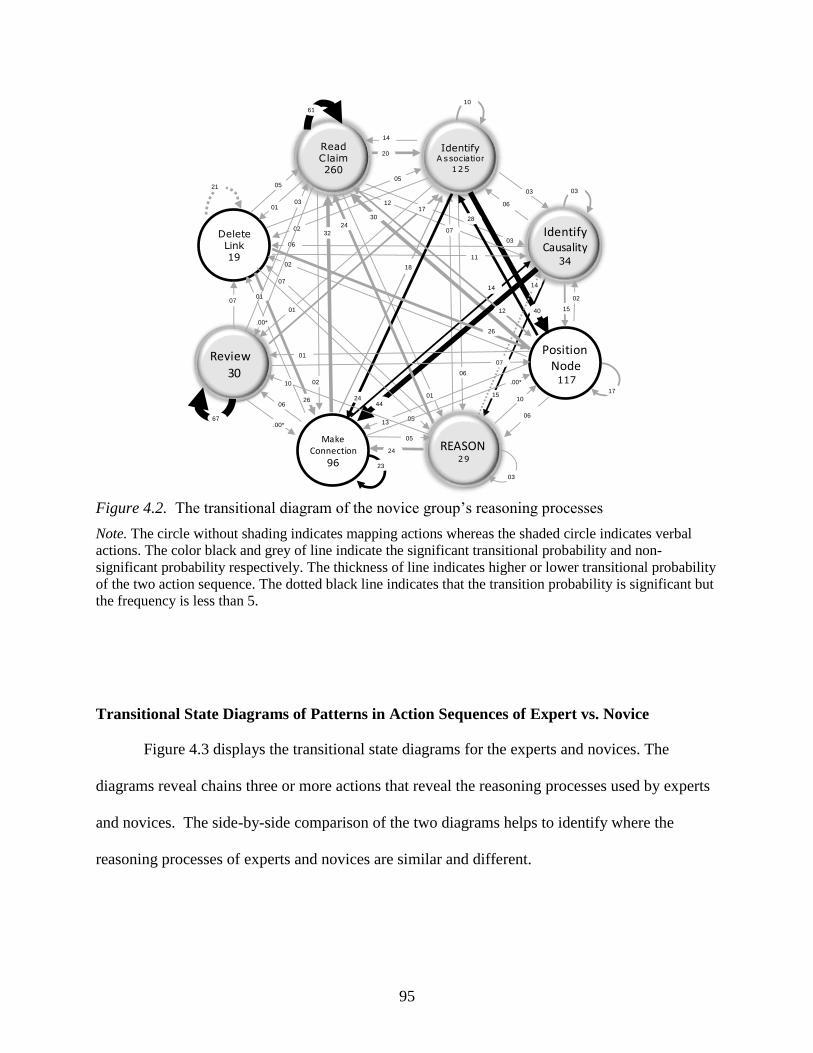
95
Figure 4.2. The transitional diagram of the novice group’s reasoning processes
Note. The circle without shading indicates mapping actions whereas the shaded circle indicates verbal
actions. The color black and grey of line indicate the significant transitional probability and non-
significant probability respectively. The thickness of line indicates higher or lower transitional probability
of the two action sequence. The dotted black line indicates that the transition probability is significant but
the frequency is less than 5.
Transitional State Diagrams of Patterns in Action Sequences of Expert vs. Novice
Figure 4.3 displays the transitional state diagrams for the experts and novices. The
diagrams reveal chains three or more actions that reveal the reasoning processes used by experts
and novices. The side-by-side comparison of the two diagrams helps to identify where the
reasoning processes of experts and novices are similar and different.
DeleteLink19
PositionNode117
Review
30
03
15
ReadClaim260
REASON29
Make Connection
96
20
61
03
IdentifyA ssociation
125
40
06
01
12 06
03
15
06
IdentifyCausality
34
30 28
0613
02
07
10
03
24
07
18
23
17
07
21 0505
11
2601
01
10
14
24
02
44
02
17
01
24
1414
05
06
01
07
.00*
26
12
0210
32
03
67 05
.00*
.00*
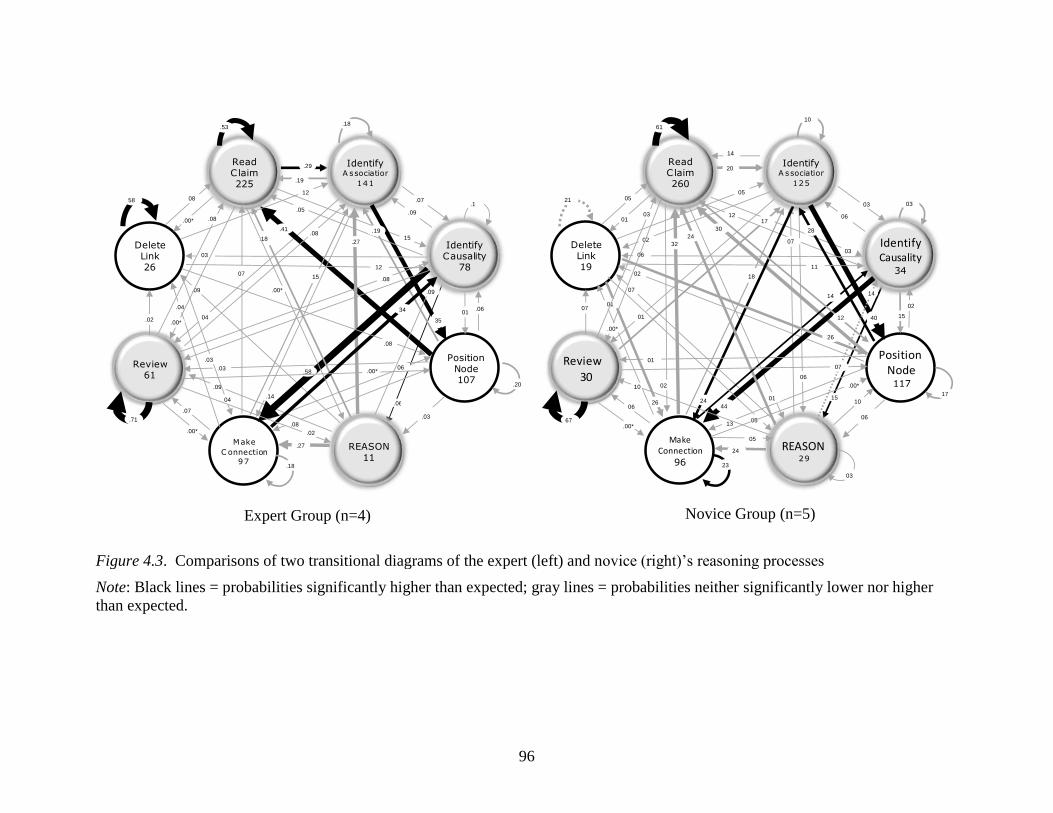
96
Figure 4.3. Comparisons of two transitional diagrams of the expert (left) and novice (right)’s reasoning processes
Note: Black lines = probabilities significantly higher than expected; gray lines = probabilities neither significantly lower nor higher
than expected.
DeleteLink26
PositionNode107
Review61
.07
.06
.19
ReadClaim225
REASON11
Make
C onnection
97
.29
.53
07
15
IdentifyA ssociation
141
3504
.05 .09
.1
01
03
IdentifyCausality
78
.41 .19
.03
.08
.03
.27
.27
.09
.09
15
06
.18
.07
.08
.71
.02
58 0812
12
04
.18
.14
.58
.03
.06
.20
.18
.09
34.04
.08
.08
.02
.08
.00*
.00*
.00*
.00*
.00*
DeleteLink19
PositionNode117
Review
30
03
15
ReadClaim260
REASON29
Make Connection
96
20
61
03
IdentifyA ssociation
125
40
06
01
12 06
03
15
06
IdentifyCausality
34
30 28
0613
02
07
10
03
24
07
18
23
17
07
21 0505
11
2601
01
10
14
24
02
44
02
17
01
24
1414
05
06
01
07
.00*
26
12
0210
32
03
67 05
.00*
.00*
Expert Group (n=4) Novice Group (n=5)
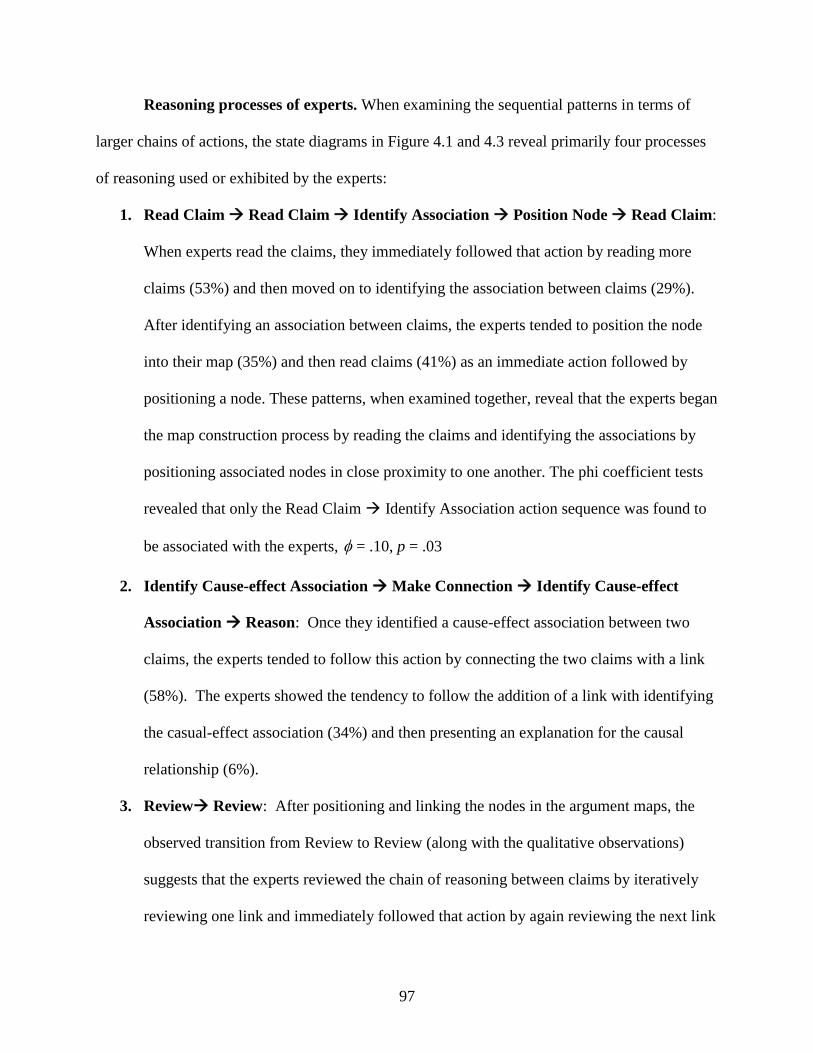
97
Reasoning processes of experts. When examining the sequential patterns in terms of
larger chains of actions, the state diagrams in Figure 4.1 and 4.3 reveal primarily four processes
of reasoning used or exhibited by the experts:
1. Read Claim Read Claim Identify Association Position Node Read Claim:
When experts read the claims, they immediately followed that action by reading more
claims (53%) and then moved on to identifying the association between claims (29%).
After identifying an association between claims, the experts tended to position the node
into their map (35%) and then read claims (41%) as an immediate action followed by
positioning a node. These patterns, when examined together, reveal that the experts began
the map construction process by reading the claims and identifying the associations by
positioning associated nodes in close proximity to one another. The phi coefficient tests
revealed that only the Read Claim Identify Association action sequence was found to
be associated with the experts, = .10, p = .03
2. Identify Cause-effect Association Make Connection Identify Cause-effect
Association Reason: Once they identified a cause-effect association between two
claims, the experts tended to follow this action by connecting the two claims with a link
(58%). The experts showed the tendency to follow the addition of a link with identifying
the casual-effect association (34%) and then presenting an explanation for the causal
relationship (6%).
3. Review Review: After positioning and linking the nodes in the argument maps, the
observed transition from Review to Review (along with the qualitative observations)
suggests that the experts reviewed the chain of reasoning between claims by iteratively
reviewing one link and immediately followed that action by again reviewing the next link
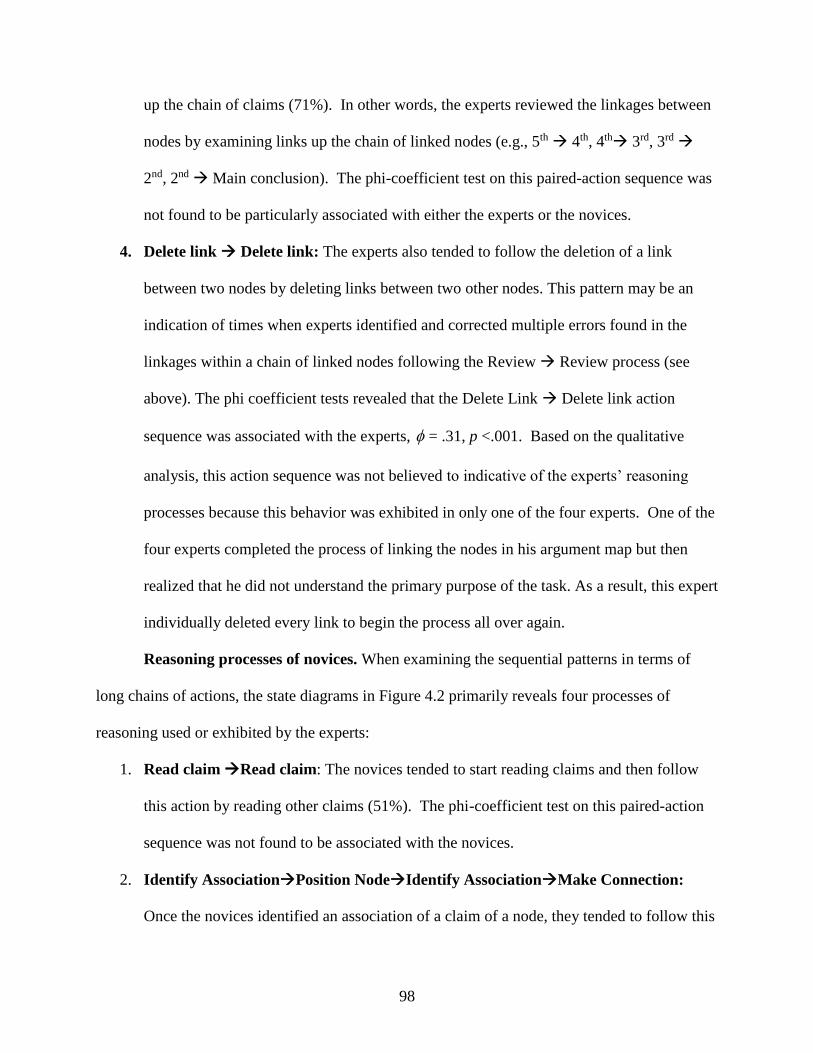
98
up the chain of claims (71%). In other words, the experts reviewed the linkages between
nodes by examining links up the chain of linked nodes (e.g., 5th 4th, 4th 3rd, 3rd
2nd, 2nd Main conclusion). The phi-coefficient test on this paired-action sequence was
not found to be particularly associated with either the experts or the novices.
4. Delete link Delete link: The experts also tended to follow the deletion of a link
between two nodes by deleting links between two other nodes. This pattern may be an
indication of times when experts identified and corrected multiple errors found in the
linkages within a chain of linked nodes following the Review Review process (see
above). The phi coefficient tests revealed that the Delete Link Delete link action
sequence was associated with the experts, = .31, p <.001. Based on the qualitative
analysis, this action sequence was not believed to indicative of the experts’ reasoning
processes because this behavior was exhibited in only one of the four experts. One of the
four experts completed the process of linking the nodes in his argument map but then
realized that he did not understand the primary purpose of the task. As a result, this expert
individually deleted every link to begin the process all over again.
Reasoning processes of novices. When examining the sequential patterns in terms of
long chains of actions, the state diagrams in Figure 4.2 primarily reveals four processes of
reasoning used or exhibited by the experts:
1. Read claim Read claim: The novices tended to start reading claims and then follow
this action by reading other claims (51%). The phi-coefficient test on this paired-action
sequence was not found to be associated with the novices.
2. Identify AssociationPosition NodeIdentify AssociationMake Connection:
Once the novices identified an association of a claim of a node, they tended to follow this
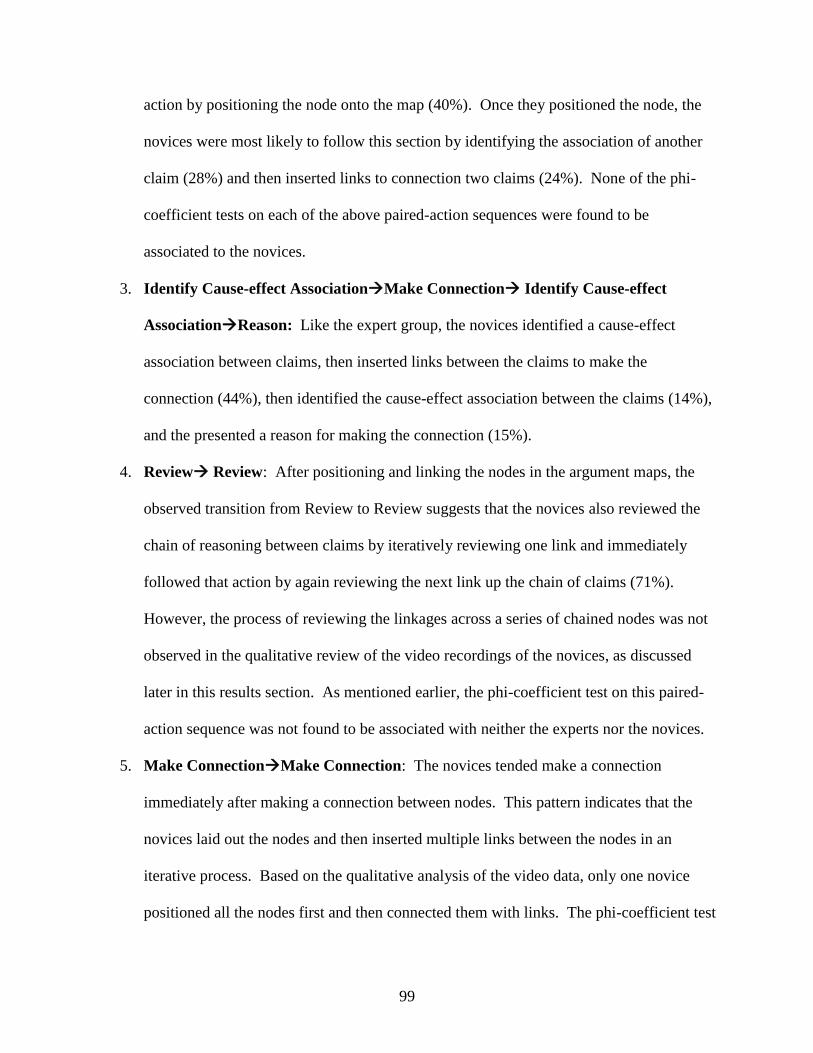
99
action by positioning the node onto the map (40%). Once they positioned the node, the
novices were most likely to follow this section by identifying the association of another
claim (28%) and then inserted links to connection two claims (24%). None of the phi-
coefficient tests on each of the above paired-action sequences were found to be
associated to the novices.
3. Identify Cause-effect AssociationMake Connection Identify Cause-effect
AssociationReason: Like the expert group, the novices identified a cause-effect
association between claims, then inserted links between the claims to make the
connection (44%), then identified the cause-effect association between the claims (14%),
and the presented a reason for making the connection (15%).
4. Review Review: After positioning and linking the nodes in the argument maps, the
observed transition from Review to Review suggests that the novices also reviewed the
chain of reasoning between claims by iteratively reviewing one link and immediately
followed that action by again reviewing the next link up the chain of claims (71%).
However, the process of reviewing the linkages across a series of chained nodes was not
observed in the qualitative review of the video recordings of the novices, as discussed
later in this results section. As mentioned earlier, the phi-coefficient test on this paired-
action sequence was not found to be associated with neither the experts nor the novices.
5. Make ConnectionMake Connection: The novices tended make a connection
immediately after making a connection between nodes. This pattern indicates that the
novices laid out the nodes and then inserted multiple links between the nodes in an
iterative process. Based on the qualitative analysis of the video data, only one novice
positioned all the nodes first and then connected them with links. The phi-coefficient test

100
on this paired action sequence was not significant, indicating that this action sequence
was not associated with neither the novices nor experts.
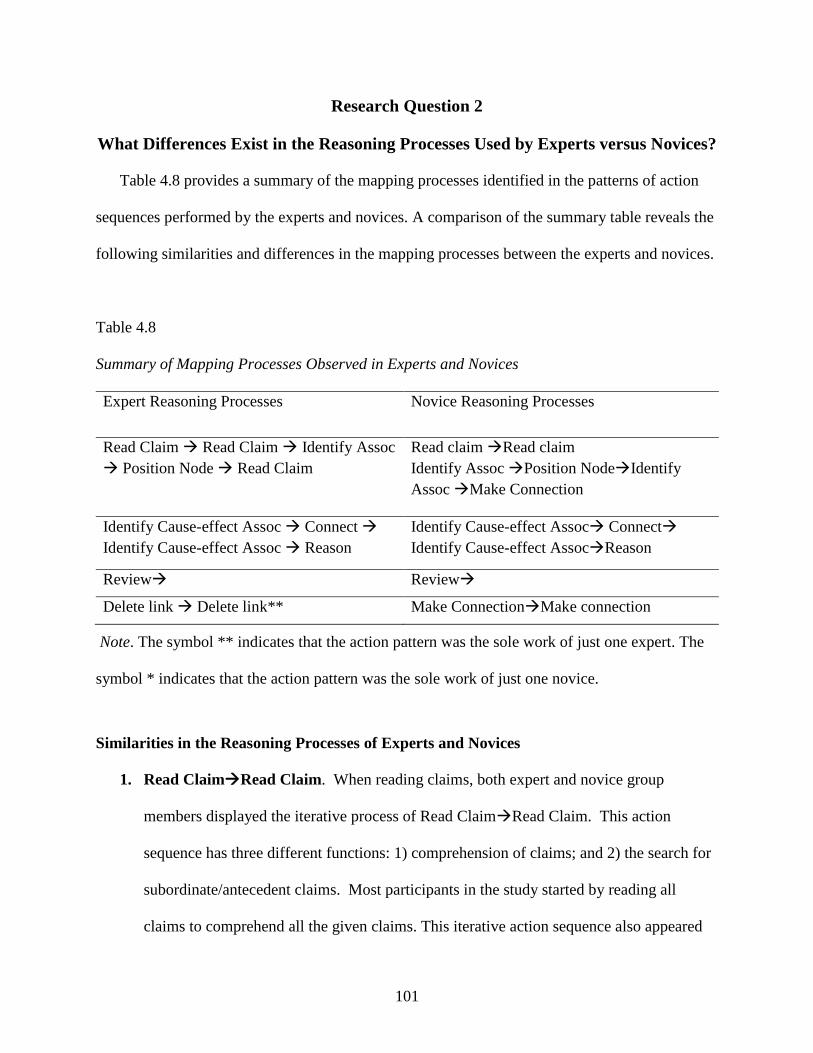
101
Research Question 2
What Differences Exist in the Reasoning Processes Used by Experts versus Novices?
Table 4.8 provides a summary of the mapping processes identified in the patterns of action
sequences performed by the experts and novices. A comparison of the summary table reveals the
following similarities and differences in the mapping processes between the experts and novices.
Table 4.8
Summary of Mapping Processes Observed in Experts and Novices
Expert Reasoning Processes Novice Reasoning Processes
Read Claim Read Claim Identify Assoc
Position Node Read Claim
Read claim Read claim
Identify Assoc Position NodeIdentify
Assoc Make Connection
Identify Cause-effect Assoc Connect
Identify Cause-effect Assoc Reason
Identify Cause-effect Assoc Connect
Identify Cause-effect AssocReason
Review Review
Delete link Delete link** Make ConnectionMake connection
Note. The symbol ** indicates that the action pattern was the sole work of just one expert. The
symbol * indicates that the action pattern was the sole work of just one novice.
Similarities in the Reasoning Processes of Experts and Novices
1. Read ClaimRead Claim. When reading claims, both expert and novice group
members displayed the iterative process of Read ClaimRead Claim. This action
sequence has three different functions: 1) comprehension of claims; and 2) the search for
subordinate/antecedent claims. Most participants in the study started by reading all
claims to comprehend all the given claims. This iterative action sequence also appeared
102
when the expert and novice participants searched for a claim that was a subordinate or
antecedent claim to another claim on the map.
2. Identify Cause-effect Assoc Connect Identify Cause-effect Assoc Reason.
Both experts and novices used this action sequence to insert links to connect two claims.
Once connecting two claims, both experts and novices verbally provided some
explanation of the cause effect relationship between the two claims. For example, “I’m
connecting A to B” or, “A will help B.” Sometimes, they explained the cause-effect
association after making connections when they realized that they did not verbally
convey this action in their think-aloud report.
3. Review Review. Although this action sequence was observed in both experts and
novices, the experts tended to frequently review the links from bottom up after adding a
new node to the bottom of an existing chain of claims. Also, the experts used this
iterative process when finalizing their maps - reviewing all the chains of claims from root
level up to the main conclusion (e.g., ABCD). In contrast, the novices also
reviewed the link between two nodes (e.g., nodes AB) and then reviewed the link
between two other nodes (e.g., CD), but two nodes that are not chained to the two
linked nodes previously reviewed.
Differences in the Reasoning Processes Of Experts and Novices
1. To position nodes, experts exhibited the reasoning process of Read Claim Read Claim
Identify Assoc Position Node Read Claim where they initially postulated the
argument structure before actually connecting the claims with links. On the other hand,
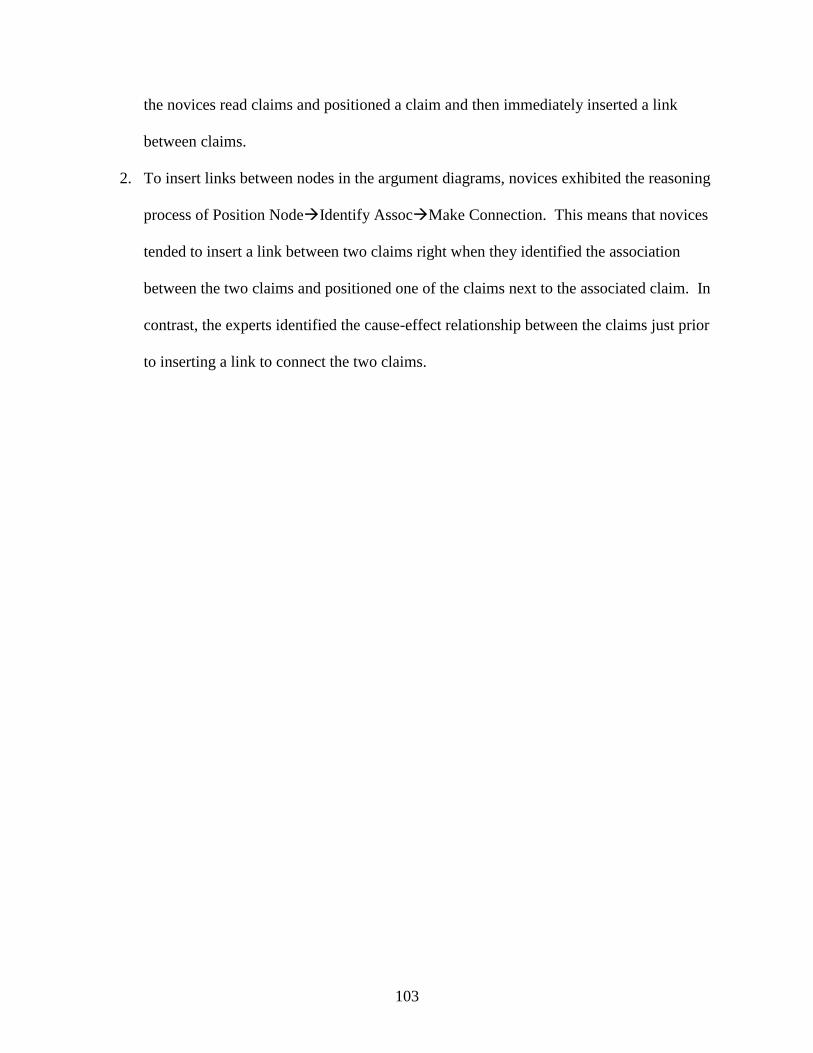
103
the novices read claims and positioned a claim and then immediately inserted a link
between claims.
2. To insert links between nodes in the argument diagrams, novices exhibited the reasoning
process of Position NodeIdentify AssocMake Connection. This means that novices
tended to insert a link between two claims right when they identified the association
between the two claims and positioned one of the claims next to the associated claim. In
contrast, the experts identified the cause-effect relationship between the claims just prior
to inserting a link to connect the two claims.
104
Research Question 3
Which Processes Might Help Produce Diagrams of High versus Low Accuracy?
Primary Findings
The reasoning processes found to be unique to the experts (as identified in the previous
section) provide indications of the types of processes that may help students produce argument
diagrams of high accuracy. In contrast, the reasoning processes found to be unique to the novices
provide indications of the types of processes that may hinder students’ ability to produce more
accurate argument diagrams. The findings presented in the previous section suggest that two
particular processes that were unique to experts (one, to position nodes, and the other, to insert
links between nodes) can help to explain how students might produce more accurate argument
diagrams.
Post-hoc Analysis
To further determine whether the two reasoning processes described above, and perhaps
other reasoning processes, were unique to participants who produced argument diagrams of high
accuracy, the participants of this study were categorized into three groups: high, moderate, and
low scores (see Figure 4.4). To examine any reasoning processes associated with superior
performances in the argument map task, the actions of two highest performers and the two lowest
performers’ data sets were sequentially analyzed.
Frequencies and Transitional Probabilities between Action Sequences
Tables 4.9 and 4.11 present the observed frequencies of sequential actions observed in
the two highest performers and the two lowest performers. The total action sequences in the two
groups were 362 for the high performers and 182 for the low performers. Overall, the high
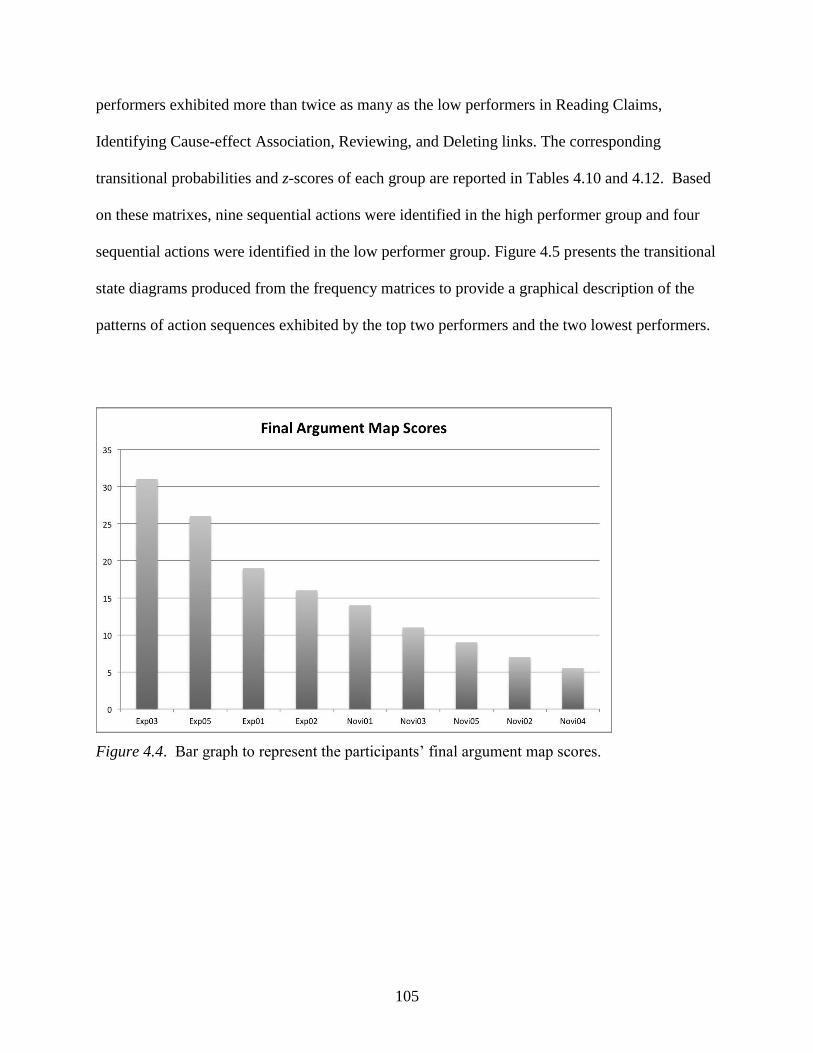
105
performers exhibited more than twice as many as the low performers in Reading Claims,
Identifying Cause-effect Association, Reviewing, and Deleting links. The corresponding
transitional probabilities and z-scores of each group are reported in Tables 4.10 and 4.12. Based
on these matrixes, nine sequential actions were identified in the high performer group and four
sequential actions were identified in the low performer group. Figure 4.5 presents the transitional
state diagrams produced from the frequency matrices to provide a graphical description of the
patterns of action sequences exhibited by the top two performers and the two lowest performers.
Figure 4.4. Bar graph to represent the participants’ final argument map scores.
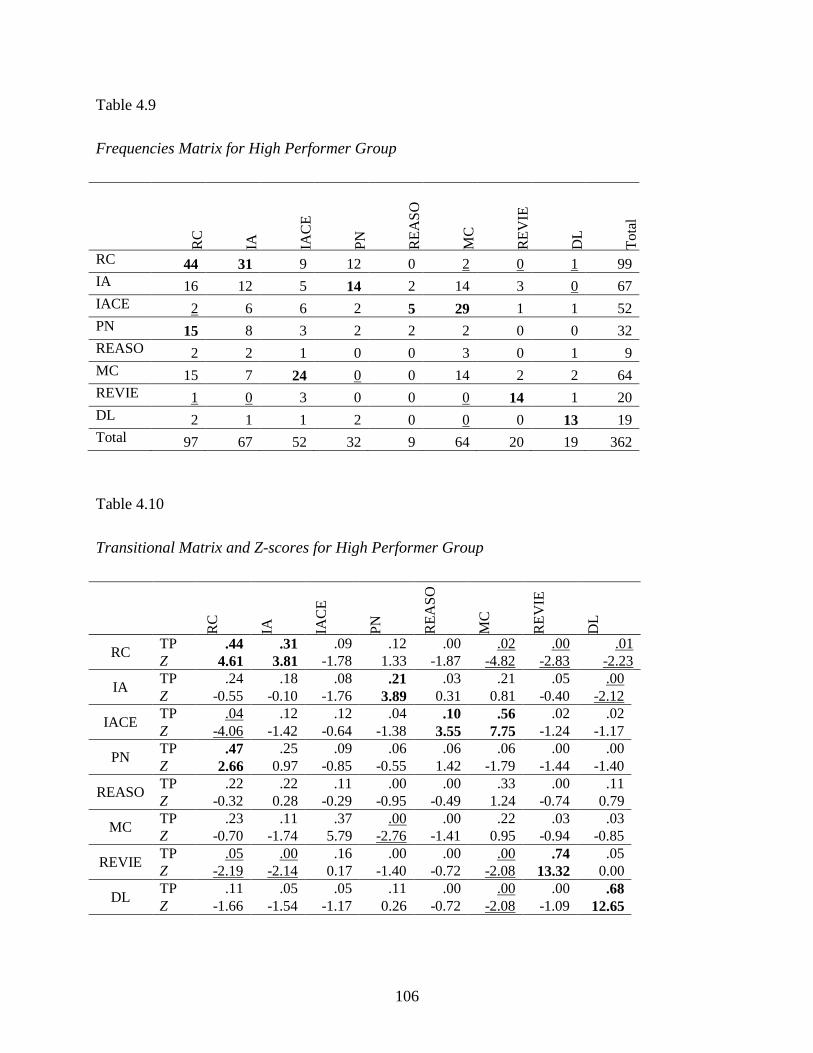
106
Table 4.9
Frequencies Matrix for High Performer Group
R
C
IA
IAC
E
PN
RE
AS
O
MC
RE
VIE
DL
To
tal
RC 44 31 9 12 0 2 0 1 99
IA 16 12 5 14 2 14 3 0 67
IACE 2 6 6 2 5 29 1 1 52
PN 15 8 3 2 2 2 0 0 32
REASO 2 2 1 0 0 3 0 1 9
MC 15 7 24 0 0 14 2 2 64
REVIE 1 0 3 0 0 0 14 1 20
DL 2 1 1 2 0 0 0 13 19
Total 97 67 52 32 9 64 20 19 362
Table 4.10
Transitional Matrix and Z-scores for High Performer Group
RC
IA
IAC
E
PN
RE
AS
O
MC
RE
VIE
DL
RC TP .44 .31 .09 .12 .00 .02 .00 .01
Z 4.61 3.81 -1.78 1.33 -1.87 -4.82 -2.83 -2.23
IA TP .24 .18 .08 .21 .03 .21 .05 .00
Z -0.55 -0.10 -1.76 3.89 0.31 0.81 -0.40 -2.12
IACE TP .04 .12 .12 .04 .10 .56 .02 .02
Z -4.06 -1.42 -0.64 -1.38 3.55 7.75 -1.24 -1.17
PN TP .47 .25 .09 .06 .06 .06 .00 .00
Z 2.66 0.97 -0.85 -0.55 1.42 -1.79 -1.44 -1.40
REASO TP .22 .22 .11 .00 .00 .33 .00 .11
Z -0.32 0.28 -0.29 -0.95 -0.49 1.24 -0.74 0.79
MC TP .23 .11 .37 .00 .00 .22 .03 .03
Z -0.70 -1.74 5.79 -2.76 -1.41 0.95 -0.94 -0.85
REVIE TP .05 .00 .16 .00 .00 .00 .74 .05
Z -2.19 -2.14 0.17 -1.40 -0.72 -2.08 13.32 0.00
DL TP .11 .05 .05 .11 .00 .00 .00 .68
Z -1.66 -1.54 -1.17 0.26 -0.72 -2.08 -1.09 12.65
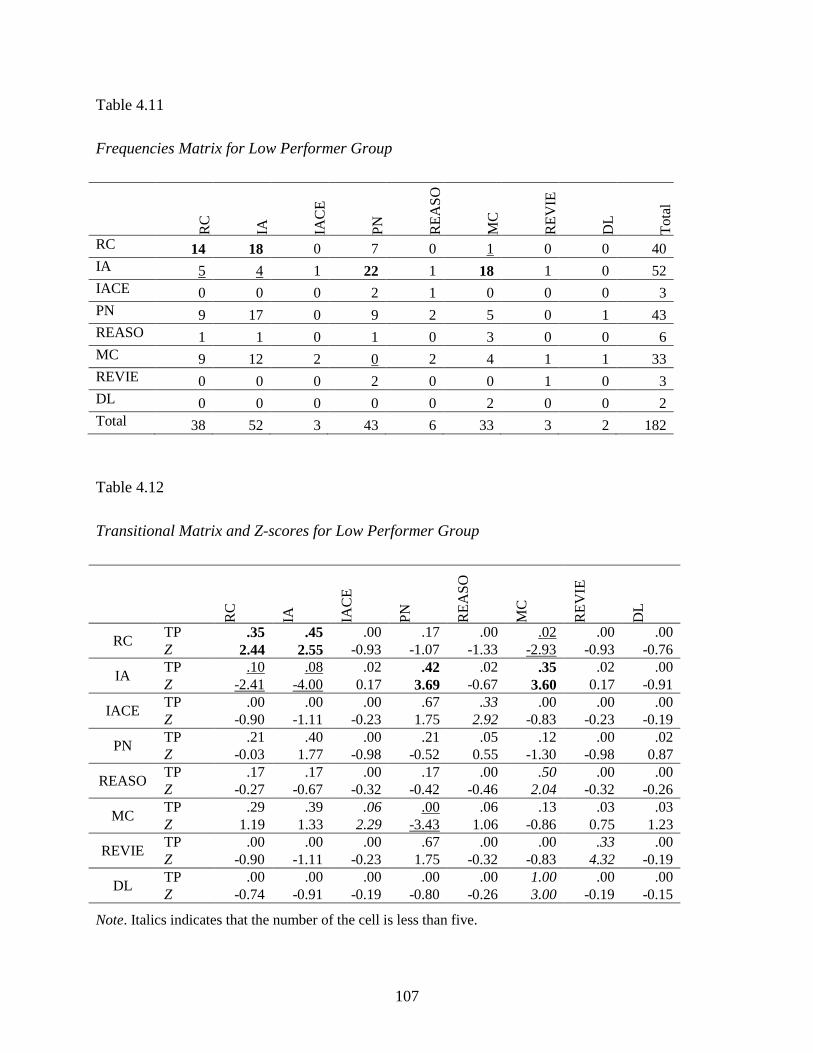
107
Table 4.11
Frequencies Matrix for Low Performer Group
R
C
IA
IAC
E
PN
RE
AS
O
MC
RE
VIE
DL
To
tal
RC 14 18 0 7 0 1 0 0 40
IA 5 4 1 22 1 18 1 0 52
IACE 0 0 0 2 1 0 0 0 3
PN 9 17 0 9 2 5 0 1 43
REASO 1 1 0 1 0 3 0 0 6
MC 9 12 2 0 2 4 1 1 33
REVIE 0 0 0 2 0 0 1 0 3
DL 0 0 0 0 0 2 0 0 2
Total 38 52 3 43 6 33 3 2 182
Table 4.12
Transitional Matrix and Z-scores for Low Performer Group
RC
IA
IAC
E
PN
RE
AS
O
MC
RE
VIE
DL
RC
TP .35 .45 .00 .17 .00 .02 .00 .00
Z 2.44 2.55 -0.93 -1.07 -1.33 -2.93 -0.93 -0.76
IA TP .10 .08 .02 .42 .02 .35 .02 .00
Z -2.41 -4.00 0.17 3.69 -0.67 3.60 0.17 -0.91
IACE TP .00 .00 .00 .67 .33 .00 .00 .00
Z -0.90 -1.11 -0.23 1.75 2.92 -0.83 -0.23 -0.19
PN TP .21 .40 .00 .21 .05 .12 .00 .02
Z -0.03 1.77 -0.98 -0.52 0.55 -1.30 -0.98 0.87
REASO TP .17 .17 .00 .17 .00 .50 .00 .00
Z -0.27 -0.67 -0.32 -0.42 -0.46 2.04 -0.32 -0.26
MC TP .29 .39 .06 .00 .06 .13 .03 .03
Z 1.19 1.33 2.29 -3.43 1.06 -0.86 0.75 1.23
REVIE TP .00 .00 .00 .67 .00 .00 .33 .00
Z -0.90 -1.11 -0.23 1.75 -0.32 -0.83 4.32 -0.19
DL TP .00 .00 .00 .00 .00 1.00 .00 .00
Z -0.74 -0.91 -0.19 -0.80 -0.26 3.00 -0.19 -0.15
Note. Italics indicates that the number of the cell is less than five.
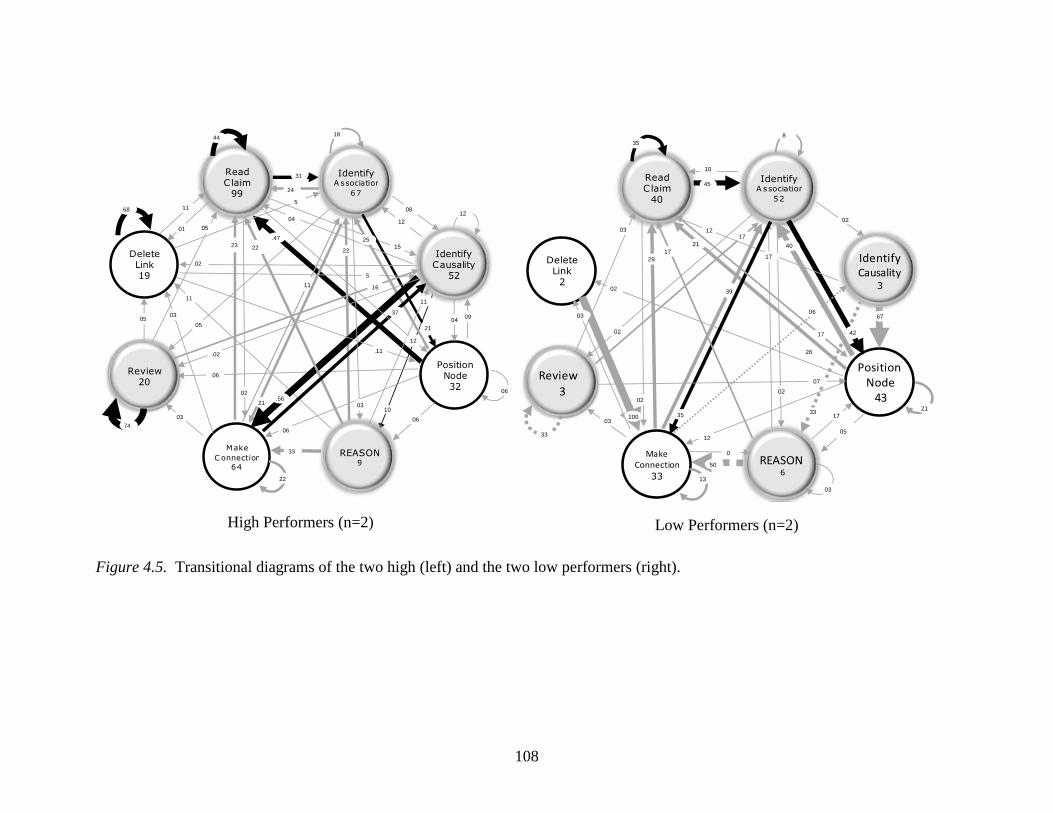
108
Figure 4.5. Transitional diagrams of the two high (left) and the two low performers (right).
DeleteLink19
PositionNode32
Review20
08
10
24
ReadClaim
99
REASON9
Make
C onnection
64
31
44
23 15
IdentifyA ssociation
67
2105
04 12
12
04
02
IdentifyCausality
52
.47 25
06
06
.06
22
33
11
11
22
03
74
05
68 115
5
18
21.56
.02
09
06
22
11
3703
05
16
.11
12
02
01
03
DeleteLink
2
PositionNode
43
Review
3
02
33
ReadClaim
40
REASON6
Make Connection
33
45
35
IdentifyA ssociation
52
42
02
02
12
67
IdentifyCausality
3
21 40
0512
02
17
17
03
50
39
13
17
100
8
10
3521
17
06
0
03
03
07
26
17
02
29
03
33
High Performers (n=2) Low Performers (n=2)
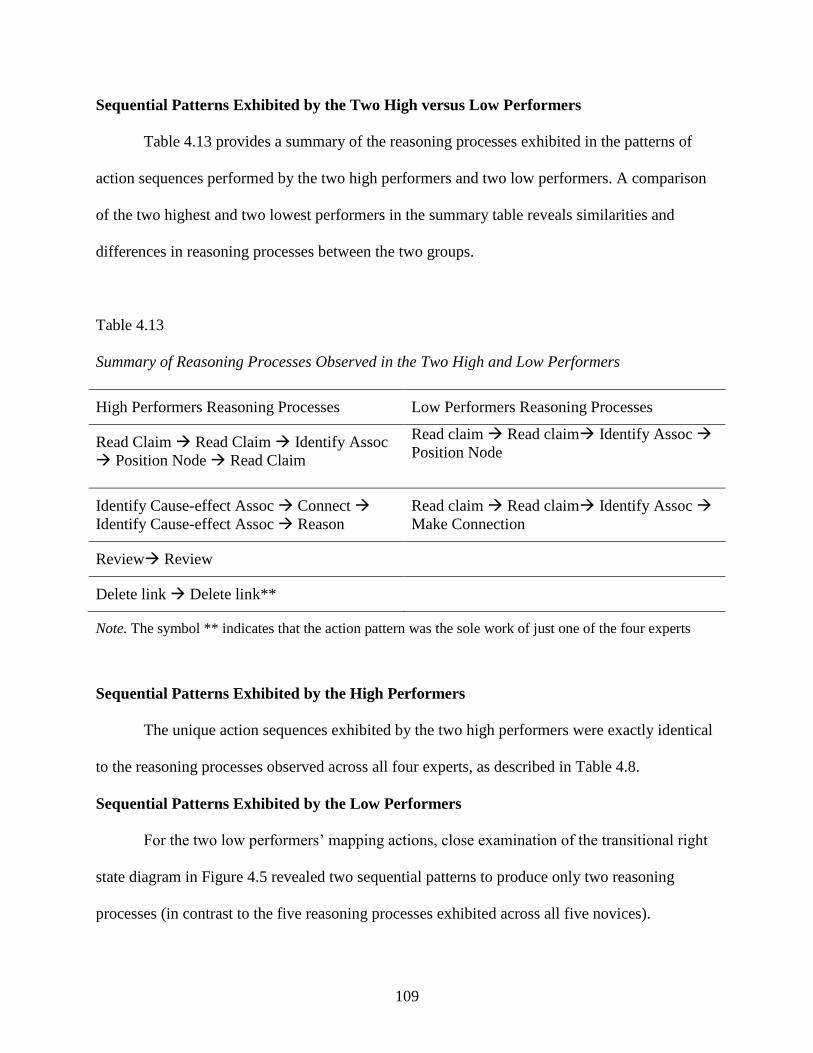
109
Sequential Patterns Exhibited by the Two High versus Low Performers
Table 4.13 provides a summary of the reasoning processes exhibited in the patterns of
action sequences performed by the two high performers and two low performers. A comparison
of the two highest and two lowest performers in the summary table reveals similarities and
differences in reasoning processes between the two groups.
Table 4.13
Summary of Reasoning Processes Observed in the Two High and Low Performers
High Performers Reasoning Processes Low Performers Reasoning Processes
Read Claim Read Claim Identify Assoc
Position Node Read Claim
Read claim Read claim Identify Assoc
Position Node
Identify Cause-effect Assoc Connect
Identify Cause-effect Assoc Reason
Read claim Read claim Identify Assoc
Make Connection
Review Review
Delete link Delete link**
Note. The symbol ** indicates that the action pattern was the sole work of just one of the four experts
Sequential Patterns Exhibited by the High Performers
The unique action sequences exhibited by the two high performers were exactly identical
to the reasoning processes observed across all four experts, as described in Table 4.8.
Sequential Patterns Exhibited by the Low Performers
For the two low performers’ mapping actions, close examination of the transitional right
state diagram in Figure 4.5 revealed two sequential patterns to produce only two reasoning
processes (in contrast to the five reasoning processes exhibited across all five novices).
110
1. Read ClaimRead claim Identify AssociationPosition Node: To position a
node, the low performers started by reading a claim and then immediately followed this
action by reading another claim (35%). After reading one of more claims, the low
performers tended to follow this action by identifying the association between the claims
(45%), then positioning the claim (42%). None of the pair-action sequences observed
within this process were found to be associated with the low performers based on the phi
coefficient tests.
2. Read ClaimRead claim Identify AssociationConnect: To insert a link between
two claims, the low performers started by reading a claim. This action was most likely
followed by reading another claim (45%). The low performers would follow reading the
claims by identifying associations between the claims, and then insert links to make the
connection (35%) between the claims. The phi coefficient tests on the action sequences
observed in this mapping process revealed that the action sequence Identify Association
Make Connection was associated with the low performers, =.23, p < .05.
Reasoning Processes that Helped or Hindered Production of Highly Accurate Diagrams
A review and comparison of the mapping processes presented in Table 4.13 reveals three
specific findings that help to explain how the experts were able to produce more accurate
argument diagrams, and insights that suggest what processes that students in general can use to
help them produce more accurate argument diagrams:
1. When positioning nodes in an argument diagram, both experts read claims, identified
associations, and then positioned the nodes in an iterative process while refraining
from inserting links between the associated nodes.
111
2. When inserting links between nodes, the experts used the process of identifying
cause-effect relationships between nodes (as opposed to identifying relationship in
general) before inserting a link between two nodes. In addition, the experts were able
to provide a reason or justification for inserting the link between the two nodes.
3. The experts engaged in an iterative and extended process of reviewing the links
between the series of chained nodes within their argument diagrams to identify
potential errors in links.
112
Qualitative Findings
Coding Processes
The participants’ mapping behaviors and verbal reports were transcribed and analyzed to
identify and construct the initial coding categories. Using the method of content analysis, I
developed the initial coding categories by operationally defining them and assigning each code
to the mapping action and think aloud data (Table 4.14). To develop meaningful categories that
explained specific actions in the reasoning processes, only the purposeful mapping actions and
verbal utterances related to the task were coded. In other words, the behavioral actions that were
not directly related to the reasoning processes, such as the action of moving nodes for purely
aesthetic reasons, were omitted from the analysis. Also, verbal reports that were not related to
the reasoning processes, such as asking technical questions (“How can I connect this arrow to
the red dot?”) or miscellaneous utterances (e.g., “Where are you from?” “I’m old to do this”)
were not included in the analysis. Some verbal data and map behaviors shared the same meaning
or function. For example, moving a node under/next to/above a previous identified node in the
map indicated that the participant identified some kind of association between the nodes. Some
participants verbally described associations as they moved and positioned a node next to another
node, whereas some participants simply moved a node without verbally describing or explaining
this action. By observing each participant’s behavioral and verbal data, the reasoning processes
used to analyze and structure the complex argument maps were identified for each individual
participant.
The set of coding categories emerged from the analysis of each individual participant’s
verbal protocol/data, with new categories added to the coding scheme when new actions could
not be assigned to any of the existing categories. For example, code IA (Identifying Association)
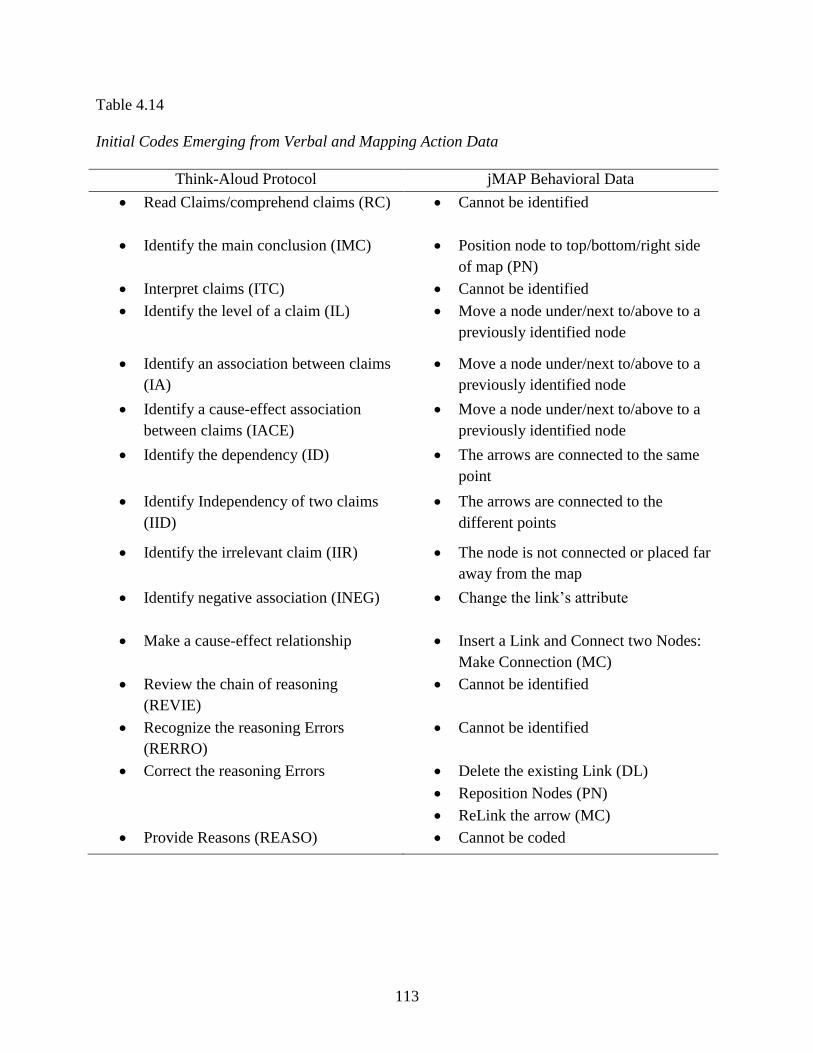
113
Table 4.14
Initial Codes Emerging from Verbal and Mapping Action Data
Think-Aloud Protocol jMAP Behavioral Data
Read Claims/comprehend claims (RC) Cannot be identified
Identify the main conclusion (IMC) Position node to top/bottom/right side
of map (PN)
Interpret claims (ITC) Cannot be identified
Identify the level of a claim (IL) Move a node under/next to/above to a
previously identified node
Identify an association between claims
(IA)
Move a node under/next to/above to a
previously identified node
Identify a cause-effect association
between claims (IACE)
Move a node under/next to/above to a
previously identified node
Identify the dependency (ID) The arrows are connected to the same
point
Identify Independency of two claims
(IID)
The arrows are connected to the
different points
Identify the irrelevant claim (IIR) The node is not connected or placed far
away from the map
Identify negative association (INEG) Change the link’s attribute
Make a cause-effect relationship Insert a Link and Connect two Nodes:
Make Connection (MC)
Review the chain of reasoning
(REVIE)
Cannot be identified
Recognize the reasoning Errors
(RERRO)
Cannot be identified
Correct the reasoning Errors Delete the existing Link (DL)
Reposition Nodes (PN)
ReLink the arrow (MC)
Provide Reasons (REASO) Cannot be coded
114
indicates that a participant verbally stated that there is some relationship between two claims.
Then, a new code was generated when a participant specifically identified the cause-effect
relationship between two claims (IACE) using terms like “if-then,” “because,” and “when.”
Using this coding process, a total of 13 reasoning processes emerged from the verbal
protocol/data: RC (Read a claim), IA (Identify Associations), IL (Identify a level of a claim),
IMC (Identify the main conclusion), IACE (Identify cause-effect relationship), ID (Identify the
dependency between claims), IID (Identify the independency between claims), IIR (Identify the
irrelevant claim) and INEG (Identify the negative relationship), ITC (Interpret/evaluate claims),
REVIE (Review the chain of the reasoning), RERRO (Recognize reasoning errors) and REASO
(Provide reason). Three behavioral codes were identified to describe the mechanical processes of
constructing the argument maps: PN (Position node), MC (Make a connection), and DL (Delete
link).
As shown in Table 4.14, some particular reasoning processes could be identified by either
observing the participants’ mapping behavior or the participants’ verbal reports. For example,
verbally describing the negative relationship between two claims (INEG) in think-aloud data was
equivalent to the act of changing the attributes of a link (CA) in mapping behaviors. To avoid
redundancy in the coded data, I recorded only one action code but not both. Some particular
reasoning processes, such as identifying an irrelevant claim, could not be identified by solely
observing the mapping behavior. Taking into consideration the redundancies in action codes, I
developed a new coding scheme (Table 4.15) and applied it to the participants’ mapping
behaviors and verbal data. I then assigned the codes to the behavioral actions and the verbal
reports as illustrated in Table 4.16.
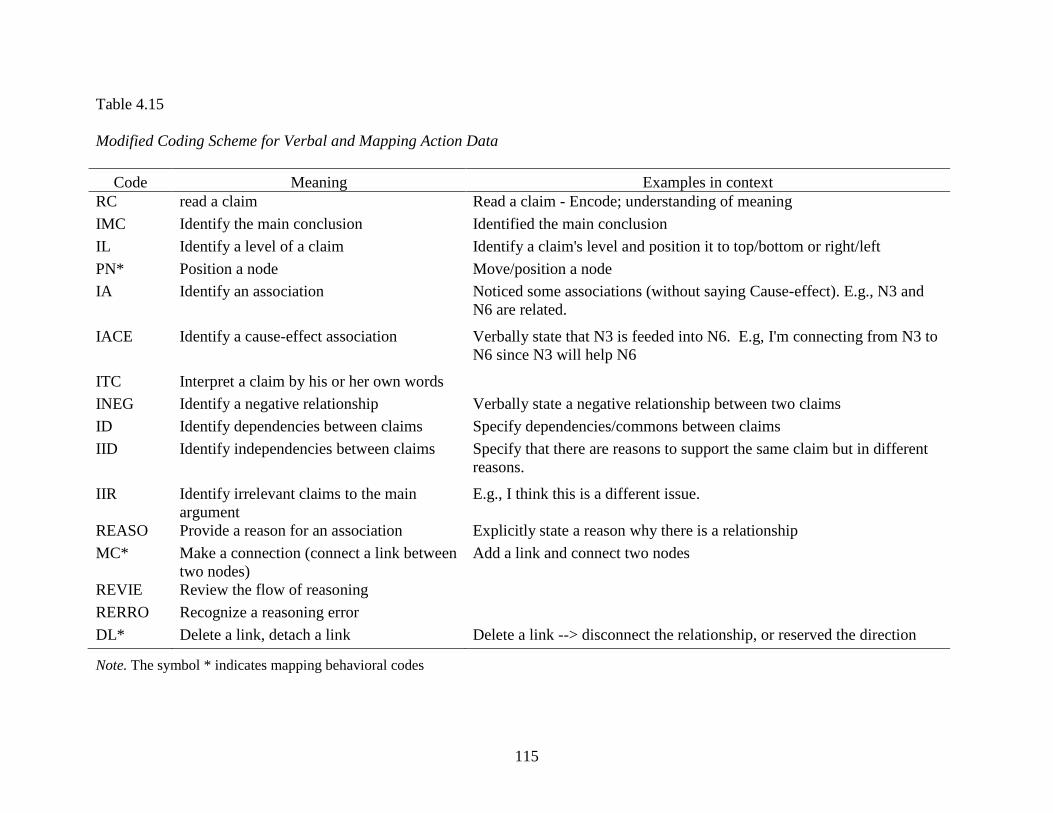
115
Table 4.15
Modified Coding Scheme for Verbal and Mapping Action Data
Code Meaning Examples in context
RC read a claim Read a claim - Encode; understanding of meaning
IMC Identify the main conclusion Identified the main conclusion
IL Identify a level of a claim Identify a claim's level and position it to top/bottom or right/left
PN* Position a node Move/position a node
IA Identify an association Noticed some associations (without saying Cause-effect). E.g., N3 and
N6 are related.
IACE Identify a cause-effect association Verbally state that N3 is feeded into N6. E.g, I'm connecting from N3 to
N6 since N3 will help N6
ITC Interpret a claim by his or her own words
INEG Identify a negative relationship Verbally state a negative relationship between two claims
ID Identify dependencies between claims Specify dependencies/commons between claims
IID Identify independencies between claims Specify that there are reasons to support the same claim but in different
reasons.
IIR Identify irrelevant claims to the main
argument
E.g., I think this is a different issue.
REASO Provide a reason for an association Explicitly state a reason why there is a relationship
MC* Make a connection (connect a link between
two nodes)
Add a link and connect two nodes
REVIE Review the flow of reasoning
RERRO Recognize a reasoning error
DL* Delete a link, detach a link Delete a link --> disconnect the relationship, or reserved the direction
Note. The symbol * indicates mapping behavioral codes
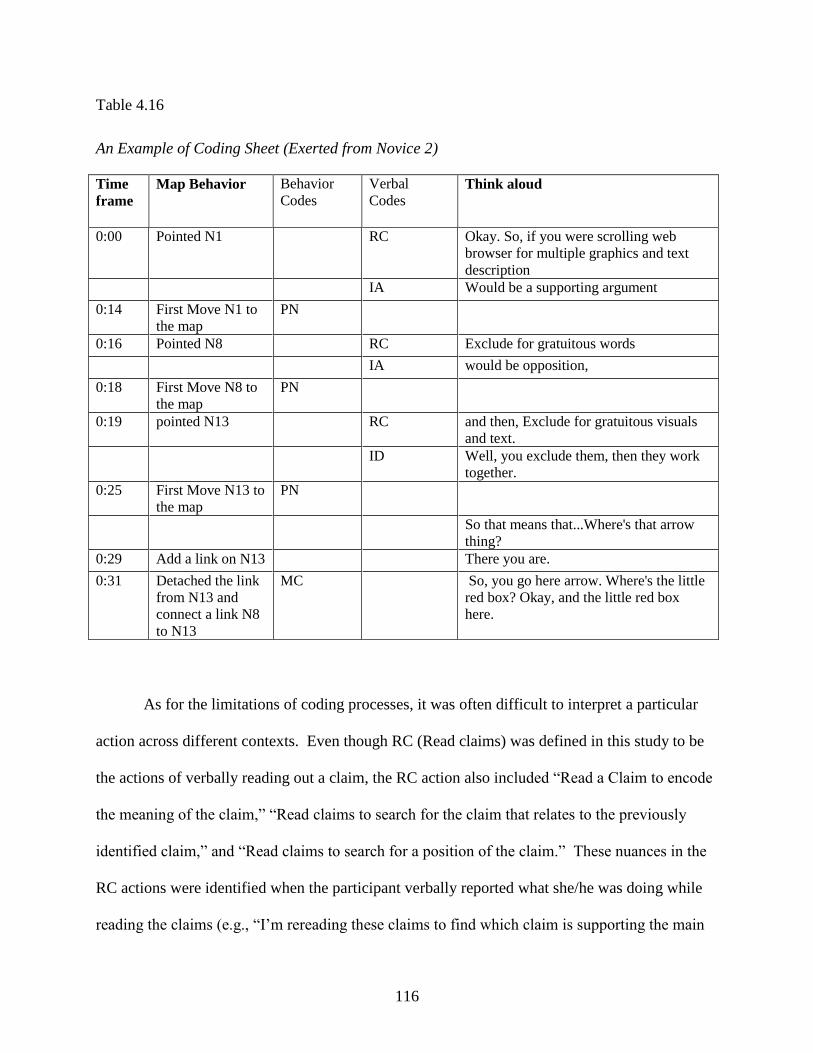
116
Table 4.16
An Example of Coding Sheet (Exerted from Novice 2)
Time
frame
Map Behavior Behavior
Codes
Verbal
Codes Think aloud
0:00 Pointed N1 RC Okay. So, if you were scrolling web
browser for multiple graphics and text
description
IA Would be a supporting argument
0:14 First Move N1 to
the map
PN
0:16 Pointed N8 RC Exclude for gratuitous words
IA would be opposition,
0:18 First Move N8 to
the map
PN
0:19 pointed N13 RC and then, Exclude for gratuitous visuals
and text.
ID Well, you exclude them, then they work
together.
0:25 First Move N13 to
the map
PN
So that means that...Where's that arrow
thing?
0:29 Add a link on N13 There you are.
0:31 Detached the link
from N13 and
connect a link N8
to N13
MC So, you go here arrow. Where's the little
red box? Okay, and the little red box
here.
As for the limitations of coding processes, it was often difficult to interpret a particular
action across different contexts. Even though RC (Read claims) was defined in this study to be
the actions of verbally reading out a claim, the RC action also included “Read a Claim to encode
the meaning of the claim,” “Read claims to search for the claim that relates to the previously
identified claim,” and “Read claims to search for a position of the claim.” These nuances in the
RC actions were identified when the participant verbally reported what she/he was doing while
reading the claims (e.g., “I’m rereading these claims to find which claim is supporting the main
117
conclusion,” “I’m reading claims to find the main conclusion,” etc.). However, some
participants simply described the action they were performing (“I am linking these two claims”)
without explaining why they performed the particular action (e.g., I am linking these two claims
because A can only happen if B happens).
With regard to inter-coder reliability, an educational researcher with prior experience
examining mapping processes was invited to take on the role of second coder and was trained to
code the verbal data set. The researcher created a coding scheme (Table 4.17) and a training
document for the second coder. After that, the researcher randomly chose one expert and one
novice and sent the verbal transcripts to the second coder along with their video files. The
second coder learned the coding scheme and examples and independently coded the verbal data
while simultaneously watching the video. After the second rater coded this data independently,
both raters agreed that some codes needed to be combined or collapsed into a single code due to
their infrequent occurrence in the verbal data (Table 4.17). Table 4.17 showed the frequencies of
each code per participant and the average frequencies within each group. Since sequential
analysis requires more than 5 per action sequence to conduct a reliable z-score test, some codes
(IMC, IL, ID, IID, IIR, INEG) were collapsed into the IA code/category. In the end, a total of
eight codes (three codes from the mapping behaviors and five codes from the think aloud data)
were finalized and used to conduct the sequential analysis (Table 4.18). Using the finalized
coding scheme, the two coders reviewed and re-coded the videos and verbal transcripts of the
two selected participants. The researcher then computed Cohen’s kappa to assess the inter-coder
reliability on the coding results between two coders. The inter-rater reliability for the first data
set was .78, indicating substantial agreement between the two raters. For the second data set,
inter-rater reliability was .97, indicating almost perfect agreement between two raters.
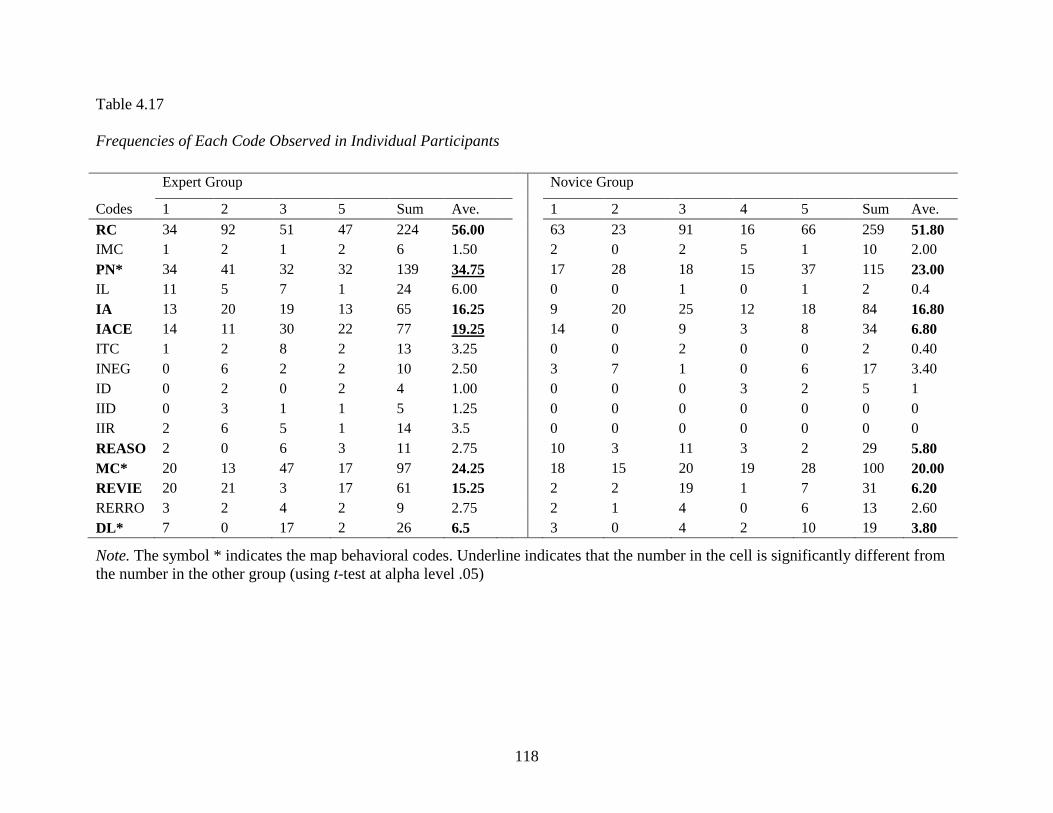
118
Table 4.17
Frequencies of Each Code Observed in Individual Participants
Note. The symbol * indicates the map behavioral codes. Underline indicates that the number in the cell is significantly different from
the number in the other group (using t-test at alpha level .05)
Expert Group Novice Group
Codes 1 2 3 5 Sum Ave. 1 2 3 4 5 Sum Ave.
RC 34 92 51 47 224 56.00 63 23 91 16 66 259 51.80
IMC 1 2 1 2 6 1.50 2 0 2 5 1 10 2.00
PN* 34 41 32 32 139 34.75 17 28 18 15 37 115 23.00
IL 11 5 7 1 24 6.00 0 0 1 0 1 2 0.4
IA 13 20 19 13 65 16.25 9 20 25 12 18 84 16.80
IACE 14 11 30 22 77 19.25 14 0 9 3 8 34 6.80
ITC 1 2 8 2 13 3.25 0 0 2 0 0 2 0.40
INEG 0 6 2 2 10 2.50 3 7 1 0 6 17 3.40
ID 0 2 0 2 4 1.00 0 0 0 3 2 5 1
IID 0 3 1 1 5 1.25 0 0 0 0 0 0 0
IIR 2 6 5 1 14 3.5 0 0 0 0 0 0 0
REASO 2 0 6 3 11 2.75 10 3 11 3 2 29 5.80
MC* 20 13 47 17 97 24.25 18 15 20 19 28 100 20.00
REVIE 20 21 3 17 61 15.25 2 2 19 1 7 31 6.20
RERRO 3 2 4 2 9 2.75 2 1 4 0 6 13 2.60
DL* 7 0 17 2 26 6.5 3 0 4 2 10 19 3.80
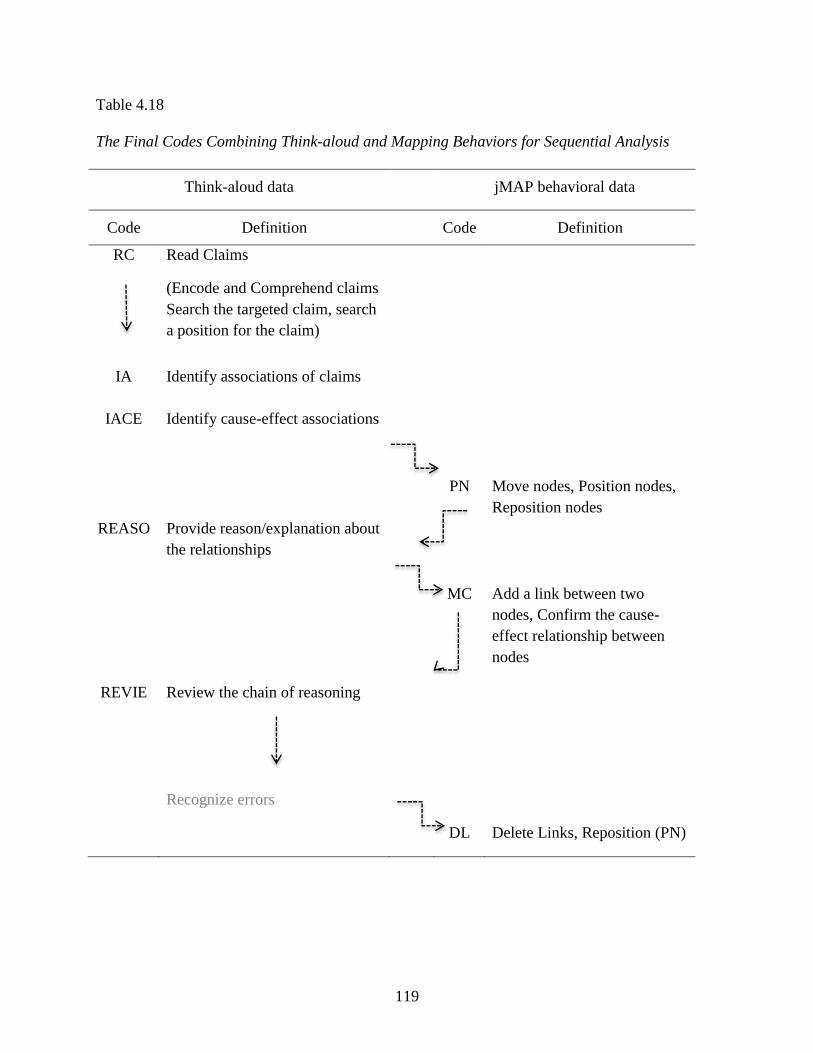
119
Table 4.18
The Final Codes Combining Think-aloud and Mapping Behaviors for Sequential Analysis
Think-aloud data jMAP behavioral data
Code Definition Code Definition
RC Read Claims
(Encode and Comprehend claims
Search the targeted claim, search
a position for the claim)
IA
IACE
Identify associations of claims
Identify cause-effect associations
PN Move nodes, Position nodes,
Reposition nodes
REASO Provide reason/explanation about
the relationships
MC Add a link between two
nodes, Confirm the cause-
effect relationship between
nodes
REVIE Review the chain of reasoning
Recognize errors
DL Delete Links, Reposition (PN)
120
Five Global Processes Used for Diagramming an Argument Map
The qualitative analysis of the video recordings revealed similarities in the processes used
by participants at the global level as well as some individual differences in the specific action
sequences used to construct their argument maps. The specific mapping actions identified by the
qualitative analysis are presented first, followed by a qualitative description of global level
processes observed across all participants. Tables 4.19 and 4.20 present a summary of the
processes used by both experts and novices to construct the argument diagrams when examined
at a global level. Examination of such global actions across all the participants revealed five
global processes or the following five steps: 1) scan all fifteen claims; 2) find the final
conclusion; 3) structure the argument map; 4) review the logic of reasoning chains; 5), correct
reasoning errors. For some participants, all five of these operations were observed and
performed in this particular sequence.
Step1: Scan all claims. The first action exhibited by seven of the nine participants (four
experts and three novices) was to read all claims. In this step, participants focused on
comprehending or scanning the claims across the fifteen nodes to determine the nature of each
claim. The two other novices did not read all the claims. Instead they read one claim to three
claims and then positioned the node as an immediate action.
I'm just going to read through all of these reasons and see where I'll begin, how I'll form
the map. So I'm just going to read them out loud. (Novice 03)
The first thing I'm going to do here is just read these 15 items. (Expert 02)
Step 2. Identify the main conclusion. Following the scanning of claims, eight of the
nine participants (four novices and four experts) identified (or attempted to identify) which of the
fifteen nodes contained the main conclusion of the argument. Once identifying the conclusion,
they positioned it at a specific location on their screen (e.g., the top of the screen). Although
121
some participants could not identify the main conclusion in this step, they were able to find the
conclusion later on in the process of structuring the nodes in their argument map. One novice
was not able to correctly identify the main conclusion and as a result, the novice randomly chose
and positioned a node to begin the map construction process. However, this novice did
eventually identify the correct conclusion.
Step 3. Structure the arguments. As soon as the main conclusion was positioned, all
nine participants started the work of constructing their argument maps. Two approaches to
constructing the arguments were identified among the nine participants: structured and
unstructured approaches. The participants who used the structured approach provided verbal
explanations of how they were going about structuring the claims. For example, Expert 1 stated,
“I would use hierarchical structure at this time” and then placed the main conclusion at the top of
his map. Expert 2 stated, “What I want to do is I put these results to the right side and then I will
find the subordinate claims for each node.” After loosely categorizing the claims, the experts
started to structure the argument map by using top-down or bottom-up reasoning processes. For
example, Experts 1, 2, 3 and Novice 3 used top-down reasoning processes in which they started
their argument map by identifying the main conclusion and the major premise(s) to support the
main conclusion. Then, they identified the third-level claims that supported the second-level
claim and so on. On the other hand, Novice 5 identified the specific claims at the lowest level
(root cause claims) first and then identified more general claims using bottom-up reasoning
processes. In particular, Expert 5 and Novice 1 started by identifying the main conclusion and its
major conclusion using top-down reasoning then switched their strategies to identify all specific
claims at the lowest level and match their parental claims using bottom-up reasoning processes.
122
The participants who used an unstructured approach did not verbally state nor describe
the strategies they were using to construct their argument diagrams. Even though Novice 1
stated that she would place supporting claims to the left side of the map and opposing claims to
the right side, at the end, she mixed the supporting and opposing claims in the same place. In
addition, the participants who used unstructured approaches did not exhibit either top-down or
bottom-up reasoning processes. Novice 2 read the nodes in the order in which they were
displayed on screen and would move a particular node into the map based on the evaluation of
the claim as true or not true. In Novice 2’s map, every claim was directly linked to the main
conclusion. As a result, Novice 2 failed to identify and illustrate the complex hierarchical
relationships between the minor premises and conclusion. In addition, Novice 2’s map included
a circular loop between claims and a set of isolated or orphaned premises that were disconnected
from the main conclusion. In Novice 4’s map, there were three separate sets of argument maps
with two of these sets of premises revealing no connection or relevance to the main conclusion.
Step 4. Review the logical flow of chain of reasoning. Reviewing the logical flow
within the chains of linked claims occurred at different times during the task: in the middle of
map construction and after the map construction as a final review. In the expert group, all four
experts exhibited this behavior frequently while identifying and constructing the argument
structure. Using this iterative review process, experts found errors in the way claims were linked
and as a result, applied more elaborative reasoning to improve the structure of claims. At the
completion of the argument map, the experts reviewed the chain of linked premises using a
bottom-to-top or top-to-bottom approach. In contrast, the novice rarely performed this type of
review process (except on some occasions with Novice 3 and 5). In particular, Novice 2 and 4
did not exhibit any such behavior during the entire map construction process.
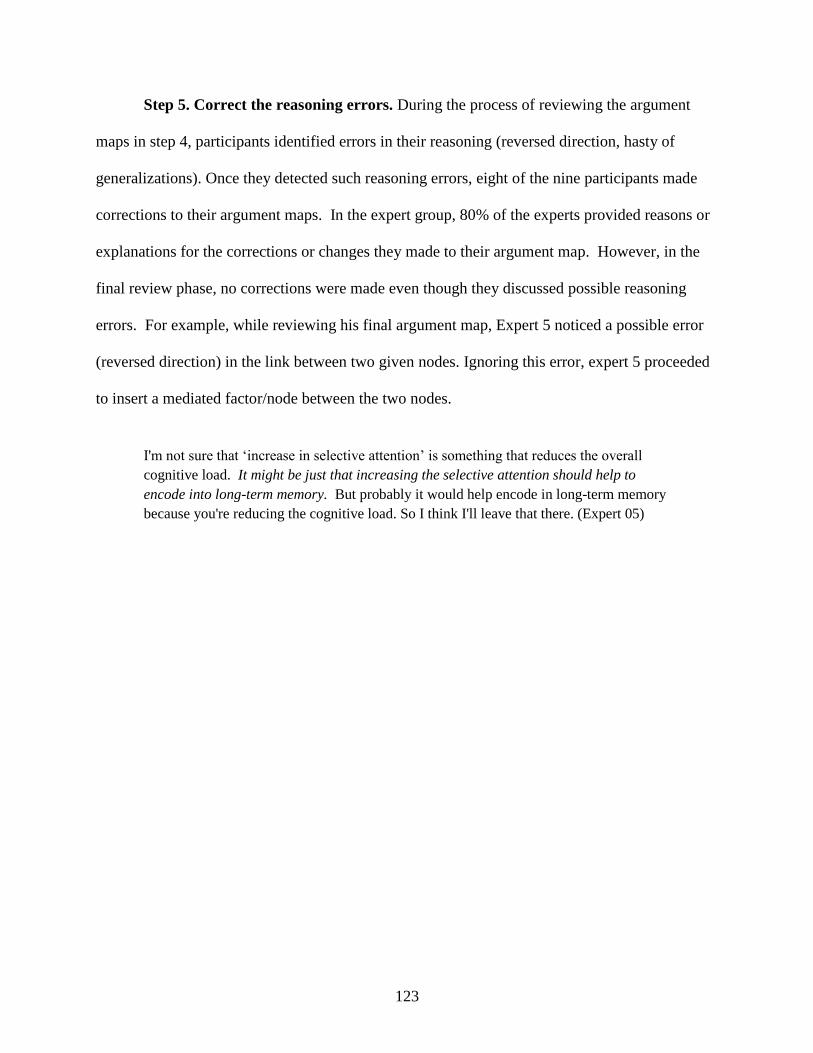
123
Step 5. Correct the reasoning errors. During the process of reviewing the argument
maps in step 4, participants identified errors in their reasoning (reversed direction, hasty of
generalizations). Once they detected such reasoning errors, eight of the nine participants made
corrections to their argument maps. In the expert group, 80% of the experts provided reasons or
explanations for the corrections or changes they made to their argument map. However, in the
final review phase, no corrections were made even though they discussed possible reasoning
errors. For example, while reviewing his final argument map, Expert 5 noticed a possible error
(reversed direction) in the link between two given nodes. Ignoring this error, expert 5 proceeded
to insert a mediated factor/node between the two nodes.
I'm not sure that ‘increase in selective attention’ is something that reduces the overall
cognitive load. It might be just that increasing the selective attention should help to
encode into long-term memory. But probably it would help encode in long-term memory
because you're reducing the cognitive load. So I think I'll leave that there. (Expert 05)
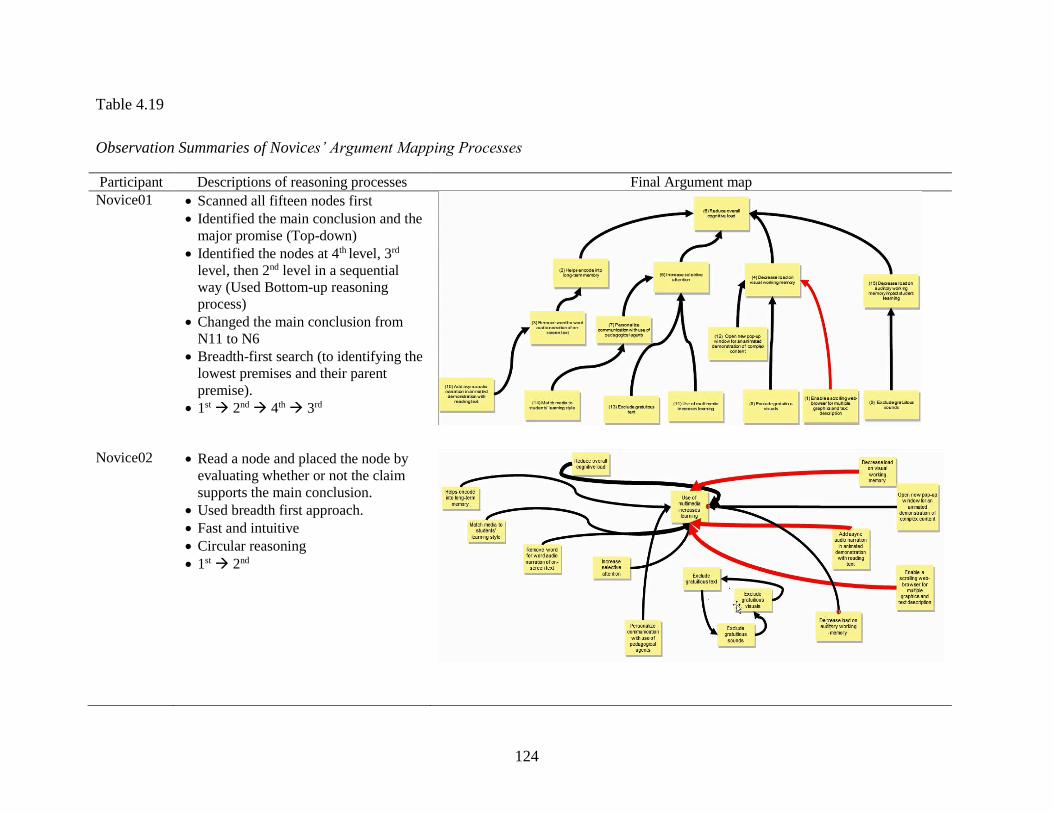
124
Table 4.19
Observation Summaries of Novices’ Argument Mapping Processes
Participant Descriptions of reasoning processes Final Argument map
Novice01 Scanned all fifteen nodes first
Identified the main conclusion and the
major promise (Top-down)
Identified the nodes at 4th level, 3rd
level, then 2nd level in a sequential
way (Used Bottom-up reasoning
process)
Changed the main conclusion from
N11 to N6
Breadth-first search (to identifying the
lowest premises and their parent
premise).
1st 2nd 4th 3rd
Novice02 Read a node and placed the node by
evaluating whether or not the claim
supports the main conclusion.
Used breadth first approach.
Fast and intuitive
Circular reasoning
1st 2nd
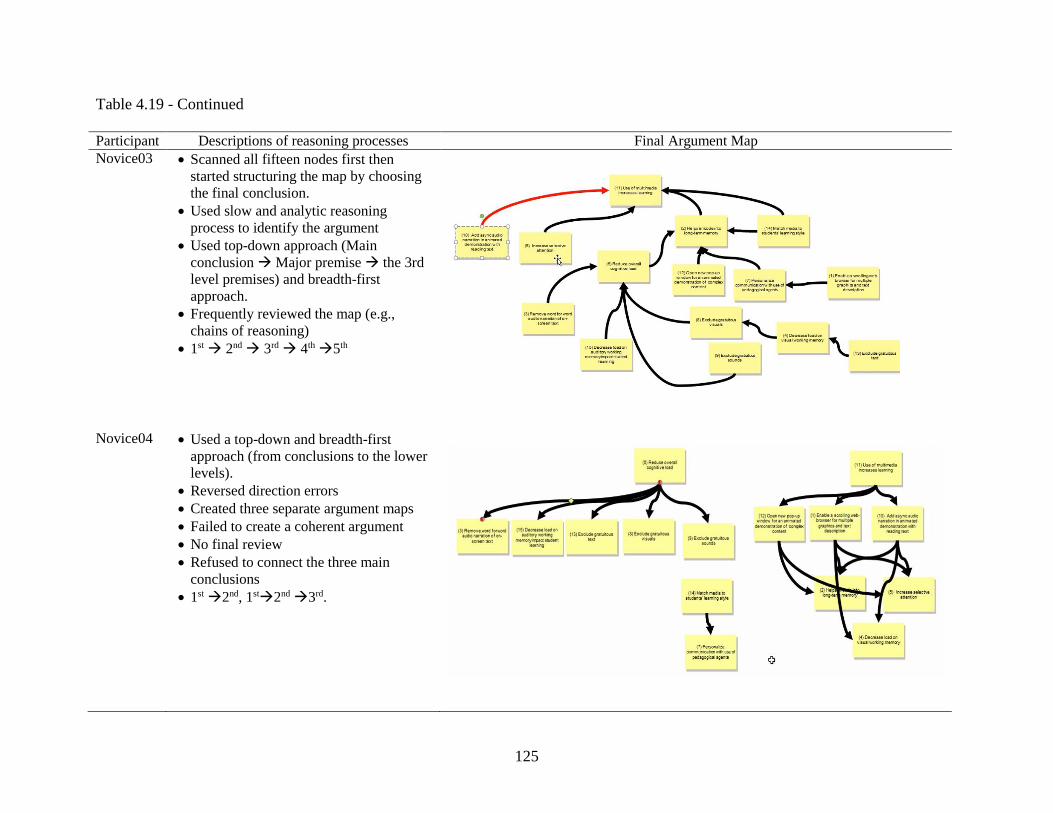
125
Table 4.19 - Continued
Participant Descriptions of reasoning processes Final Argument Map
Novice03 Scanned all fifteen nodes first then
started structuring the map by choosing
the final conclusion.
Used slow and analytic reasoning
process to identify the argument
Used top-down approach (Main
conclusion Major premise the 3rd
level premises) and breadth-first
approach.
Frequently reviewed the map (e.g.,
chains of reasoning)
1st 2nd 3rd 4th 5th
Novice04 Used a top-down and breadth-first
approach (from conclusions to the lower
levels).
Reversed direction errors
Created three separate argument maps
Failed to create a coherent argument
No final review
Refused to connect the three main
conclusions
1st 2nd, 1st2nd 3rd.
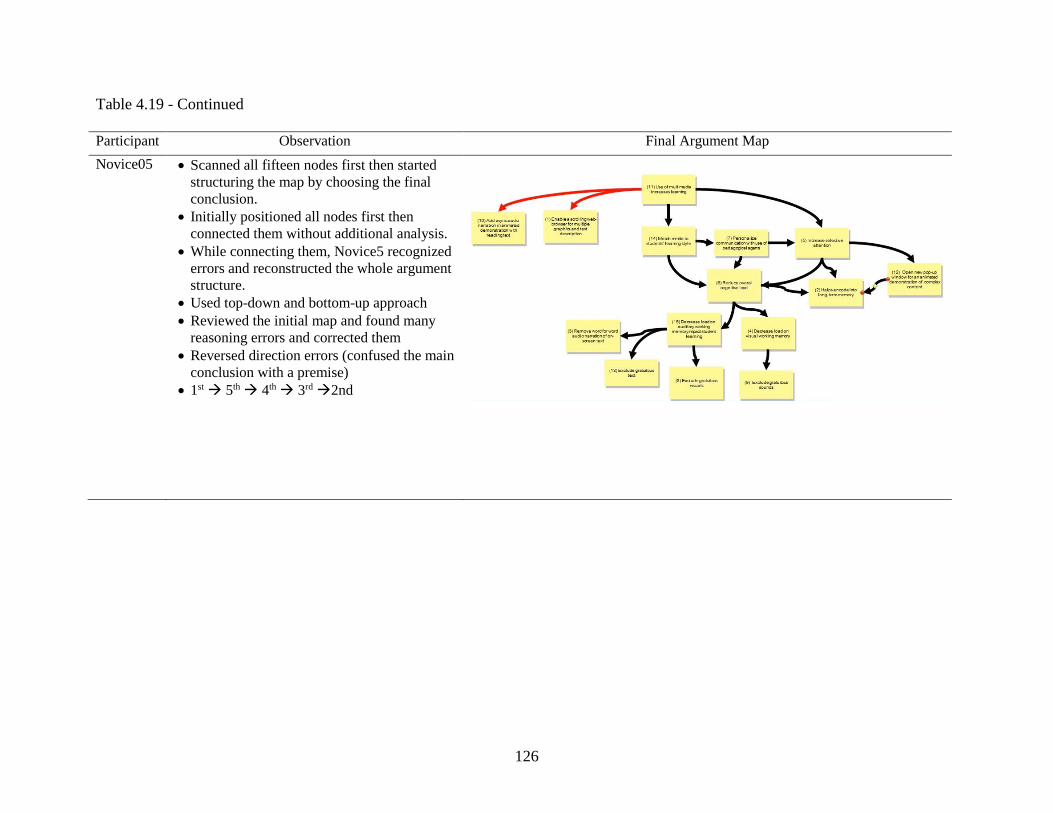
126
Table 4.19 - Continued
Participant Observation Final Argument Map
Novice05 Scanned all fifteen nodes first then started
structuring the map by choosing the final
conclusion.
Initially positioned all nodes first then
connected them without additional analysis.
While connecting them, Novice5 recognized
errors and reconstructed the whole argument
structure.
Used top-down and bottom-up approach
Reviewed the initial map and found many
reasoning errors and corrected them
Reversed direction errors (confused the main
conclusion with a premise)
1st 5th 4th 3rd 2nd
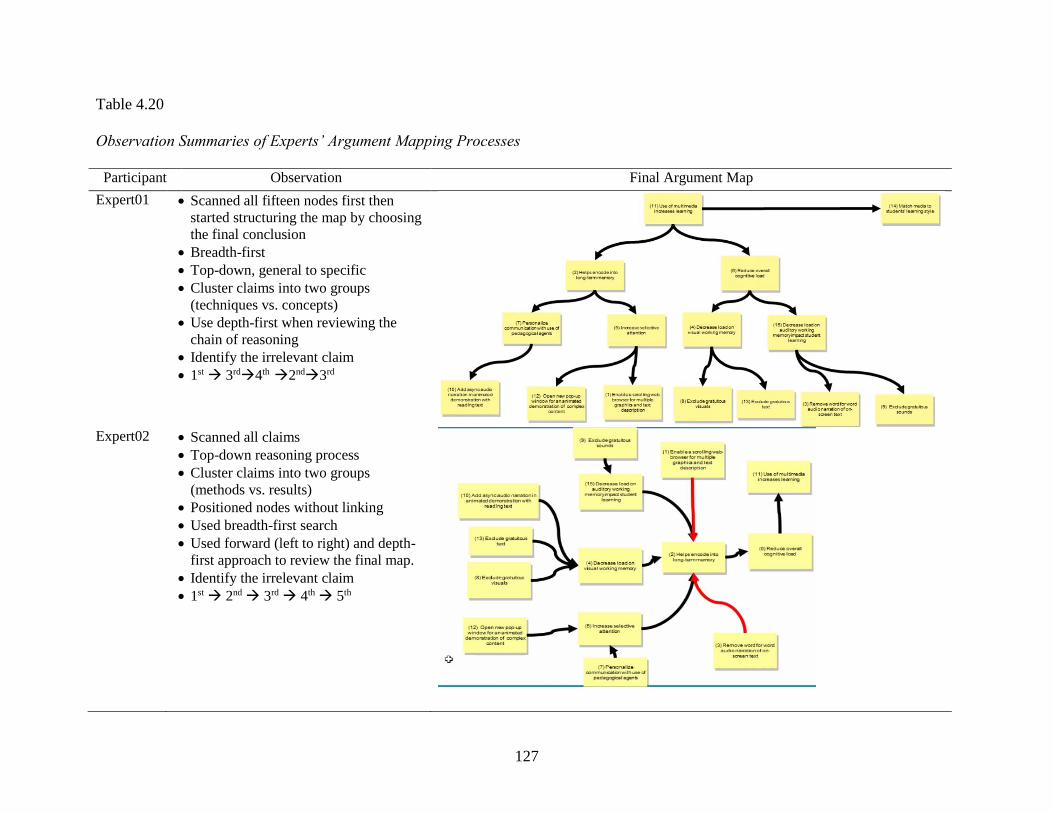
127
Table 4.20
Observation Summaries of Experts’ Argument Mapping Processes
Participant Observation Final Argument Map
Expert01 Scanned all fifteen nodes first then
started structuring the map by choosing
the final conclusion
Breadth-first
Top-down, general to specific
Cluster claims into two groups
(techniques vs. concepts)
Use depth-first when reviewing the
chain of reasoning
Identify the irrelevant claim
1st 3rd4th
2nd3rd
Expert02 Scanned all claims
Top-down reasoning process
Cluster claims into two groups
(methods vs. results)
Positioned nodes without linking
Used breadth-first search
Used forward (left to right) and depth-
first approach to review the final map.
Identify the irrelevant claim
1st 2nd 3rd 4th 5th
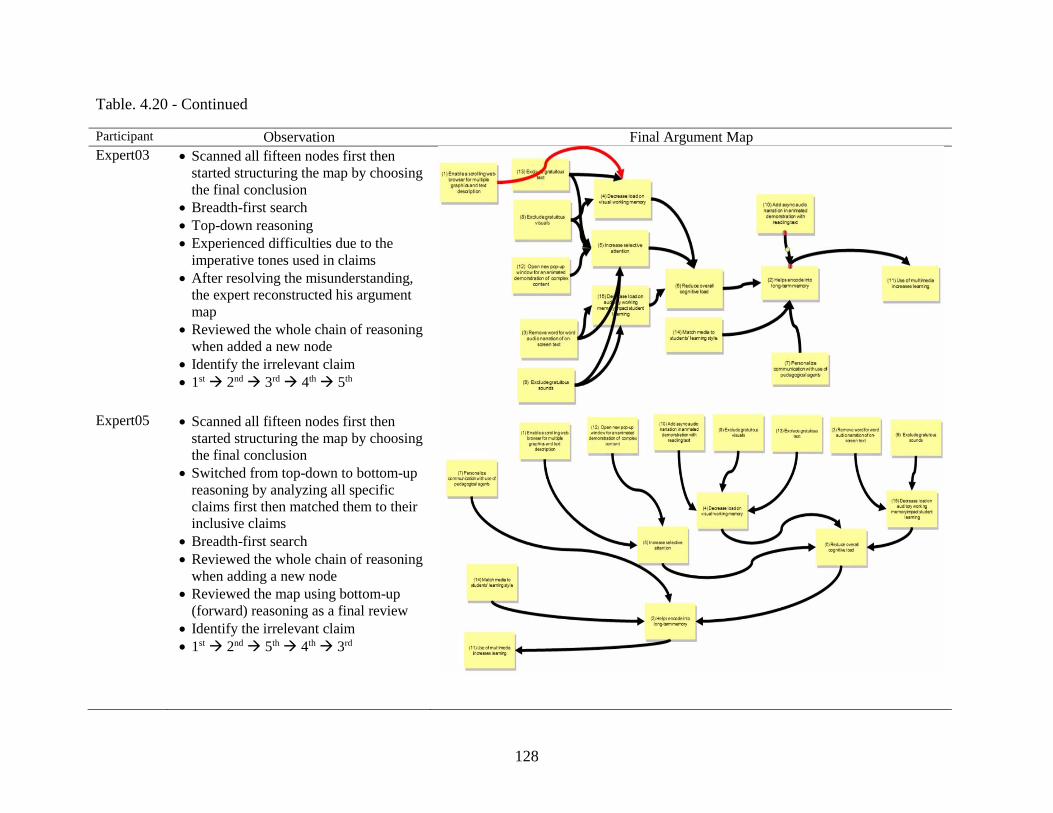
128
Table. 4.20 - Continued
Participant Observation Final Argument Map
Expert03 Scanned all fifteen nodes first then
started structuring the map by choosing
the final conclusion
Breadth-first search
Top-down reasoning
Experienced difficulties due to the
imperative tones used in claims
After resolving the misunderstanding,
the expert reconstructed his argument
map
Reviewed the whole chain of reasoning
when added a new node
Identify the irrelevant claim
1st 2nd 3rd 4th 5th
Expert05 Scanned all fifteen nodes first then
started structuring the map by choosing
the final conclusion
Switched from top-down to bottom-up
reasoning by analyzing all specific
claims first then matched them to their
inclusive claims
Breadth-first search
Reviewed the whole chain of reasoning
when adding a new node
Reviewed the map using bottom-up
(forward) reasoning as a final review
Identify the irrelevant claim
1st 2nd 5th 4th 3rd
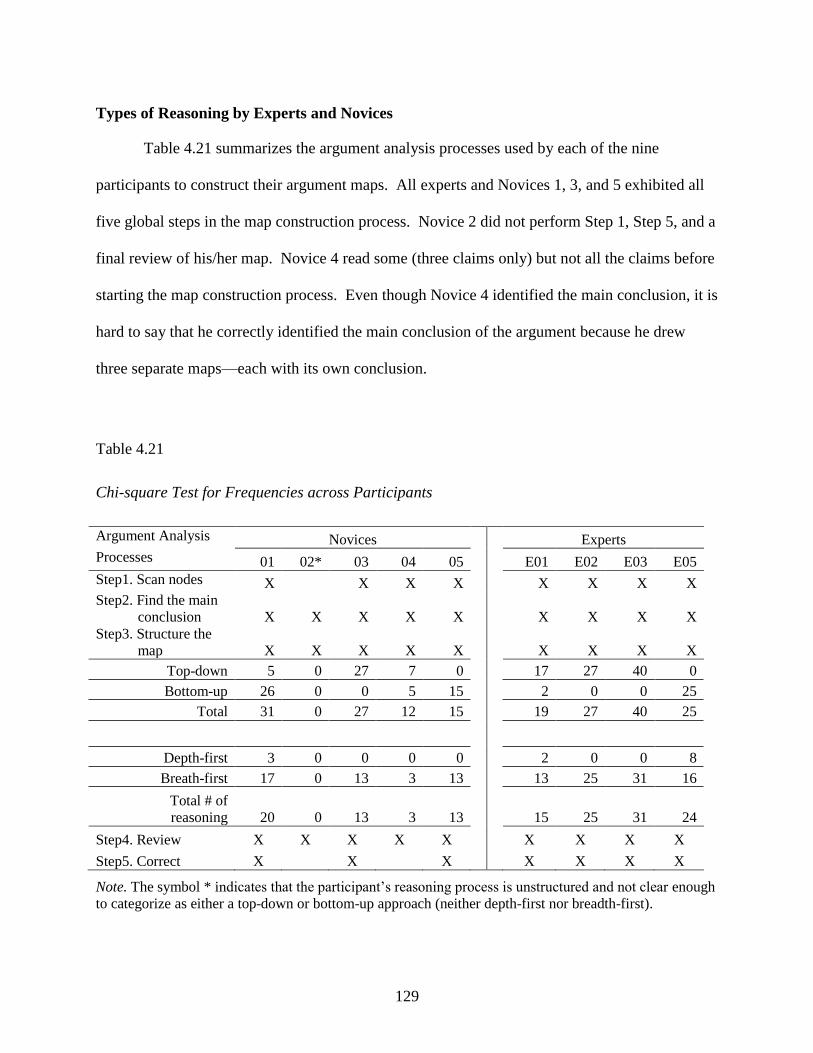
129
Types of Reasoning by Experts and Novices
Table 4.21 summarizes the argument analysis processes used by each of the nine
participants to construct their argument maps. All experts and Novices 1, 3, and 5 exhibited all
five global steps in the map construction process. Novice 2 did not perform Step 1, Step 5, and a
final review of his/her map. Novice 4 read some (three claims only) but not all the claims before
starting the map construction process. Even though Novice 4 identified the main conclusion, it is
hard to say that he correctly identified the main conclusion of the argument because he drew
three separate maps—each with its own conclusion.
Table 4.21
Chi-square Test for Frequencies across Participants
Argument Analysis Novices Experts
Processes 01 02* 03 04 05 E01 E02 E03 E05
Step1. Scan nodes X X X X X X X X
Step2. Find the main
conclusion X X X X X X X X X
Step3. Structure the
map X X X X X X X X X
Top-down 5 0 27 7 0 17 27 40 0
Bottom-up 26 0 0 5 15 2 0 0 25
Total 31 0 27 12 15 19 27 40 25
Depth-first 3 0 0 0 0 2 0 0 8
Breath-first 17 0 13 3 13 13 25 31 16
Total # of
reasoning 20 0 13 3 13 15 25 31 24
Step4. Review X X X X X X X X X
Step5. Correct X X X X X X X
Note. The symbol * indicates that the participant’s reasoning process is unstructured and not clear enough
to categorize as either a top-down or bottom-up approach (neither depth-first nor breadth-first).
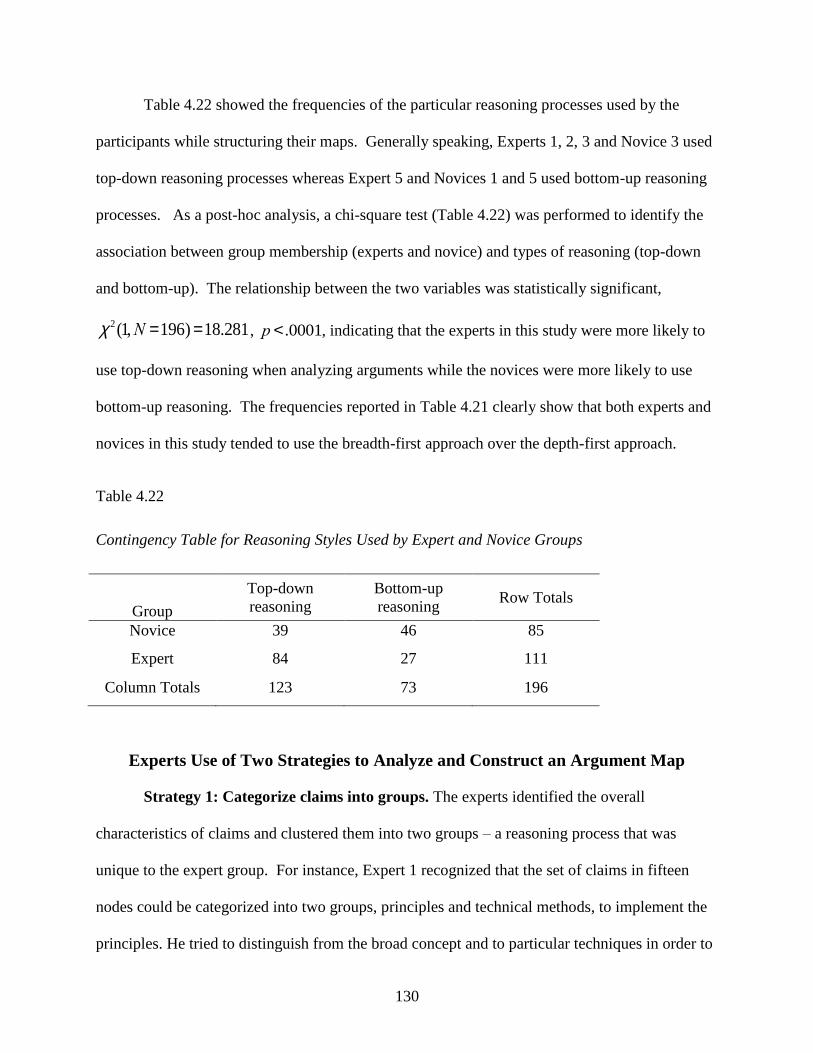
130
Table 4.22 showed the frequencies of the particular reasoning processes used by the
participants while structuring their maps. Generally speaking, Experts 1, 2, 3 and Novice 3 used
top-down reasoning processes whereas Expert 5 and Novices 1 and 5 used bottom-up reasoning
processes. As a post-hoc analysis, a chi-square test (Table 4.22) was performed to identify the
association between group membership (experts and novice) and types of reasoning (top-down
and bottom-up). The relationship between the two variables was statistically significant,
, , indicating that the experts in this study were more likely to
use top-down reasoning when analyzing arguments while the novices were more likely to use
bottom-up reasoning. The frequencies reported in Table 4.21 clearly show that both experts and
novices in this study tended to use the breadth-first approach over the depth-first approach.
Table 4.22
Contingency Table for Reasoning Styles Used by Expert and Novice Groups
Group
Top-down
reasoning
Bottom-up
reasoning Row Totals
Novice 39 46 85
Expert 84 27 111
Column Totals 123 73 196
Experts Use of Two Strategies to Analyze and Construct an Argument Map
Strategy 1: Categorize claims into groups. The experts identified the overall
characteristics of claims and clustered them into two groups – a reasoning process that was
unique to the expert group. For instance, Expert 1 recognized that the set of claims in fifteen
nodes could be categorized into two groups, principles and technical methods, to implement the
principles. He tried to distinguish from the broad concept and to particular techniques in order to
c 2(1,N =196) =18.281 p < .0001
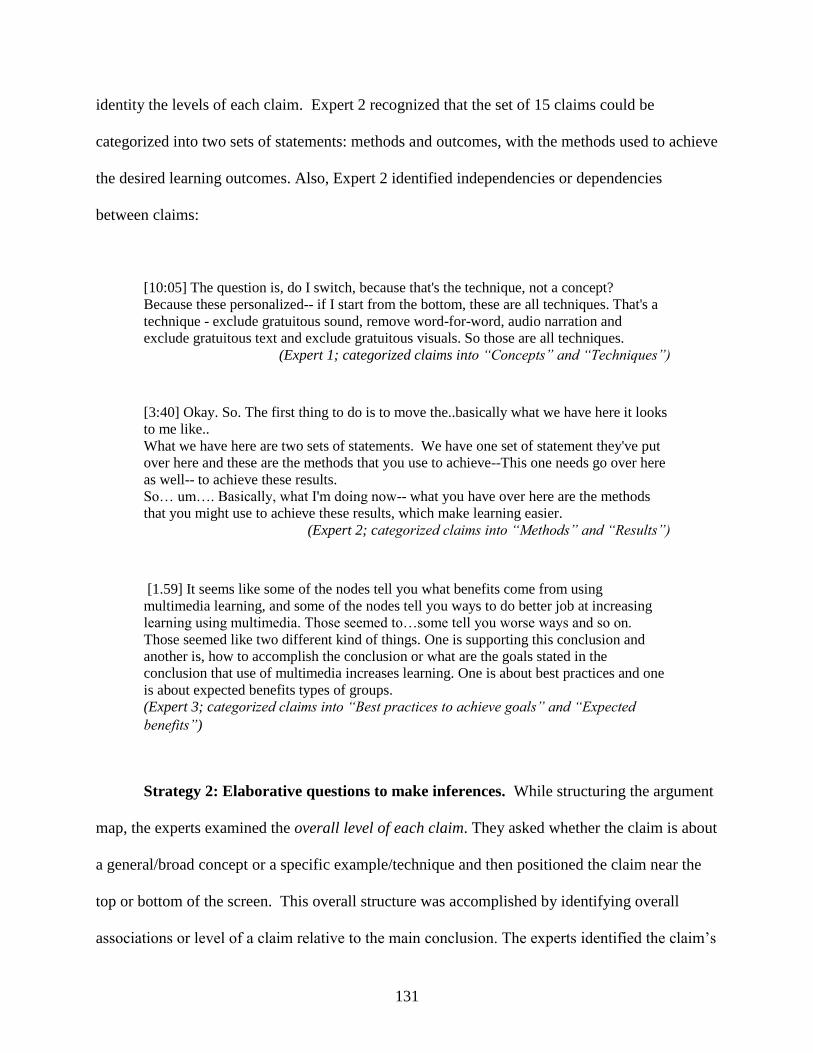
131
identity the levels of each claim. Expert 2 recognized that the set of 15 claims could be
categorized into two sets of statements: methods and outcomes, with the methods used to achieve
the desired learning outcomes. Also, Expert 2 identified independencies or dependencies
between claims:
[10:05] The question is, do I switch, because that's the technique, not a concept?
Because these personalized-- if I start from the bottom, these are all techniques. That's a
technique - exclude gratuitous sound, remove word-for-word, audio narration and
exclude gratuitous text and exclude gratuitous visuals. So those are all techniques.
(Expert 1; categorized claims into “Concepts” and “Techniques”)
[3:40] Okay. So. The first thing to do is to move the..basically what we have here it looks
to me like..
What we have here are two sets of statements. We have one set of statement they've put
over here and these are the methods that you use to achieve--This one needs go over here
as well-- to achieve these results.
So… um…. Basically, what I'm doing now-- what you have over here are the methods
that you might use to achieve these results, which make learning easier.
(Expert 2; categorized claims into “Methods” and “Results”)
[1.59] It seems like some of the nodes tell you what benefits come from using
multimedia learning, and some of the nodes tell you ways to do better job at increasing
learning using multimedia. Those seemed to…some tell you worse ways and so on.
Those seemed like two different kind of things. One is supporting this conclusion and
another is, how to accomplish the conclusion or what are the goals stated in the
conclusion that use of multimedia increases learning. One is about best practices and one
is about expected benefits types of groups.
(Expert 3; categorized claims into “Best practices to achieve goals” and “Expected
benefits”)
Strategy 2: Elaborative questions to make inferences. While structuring the argument
map, the experts examined the overall level of each claim. They asked whether the claim is about
a general/broad concept or a specific example/technique and then positioned the claim near the
top or bottom of the screen. This overall structure was accomplished by identifying overall
associations or level of a claim relative to the main conclusion. The experts identified the claim’s
132
level relative to another claim in order to decide which claim was subordinate to the other.
Another important question the experts posed to themselves was how particular claims depended
on the support of two or more prior or subordinate claims. Lastly, the experts also examined and
questioned the relevance or irrelevance of a claim to the overall argument.
Experts Also Committed Reasoning Fallacies
To identify the types of reasoning fallacies made by participants, I observed all
participants’ final maps and compared them to the criterion map. I reported the frequencies of
each reasoning fallacy made by each participant in Table 4.23. All the novices in this study
(except for Novice 2) leapt to conclusions (did not correctly identify the mediating claims that
connect a low level claim to the main conclusion), made erroneous associations between nodes
(connected a node to the wrong parental/antecedent node), reversed causation (swapped the
cause and effect), and established insufficient cause (identified a single reason when multiple
reasons were needed to support a claim). Novice 2, on the other hand, connected all 14 claims
directly to the main conclusion to produce an argument diagram with only two levels, without
making errors in association or mistakenly reversing causation between nodes. In contrast, all the
experts in this study committed two reasoning fallacies - leaping to conclusions and making
erroneous associations, with Expert 2 committing reversed causation and establishing
insufficient cause.
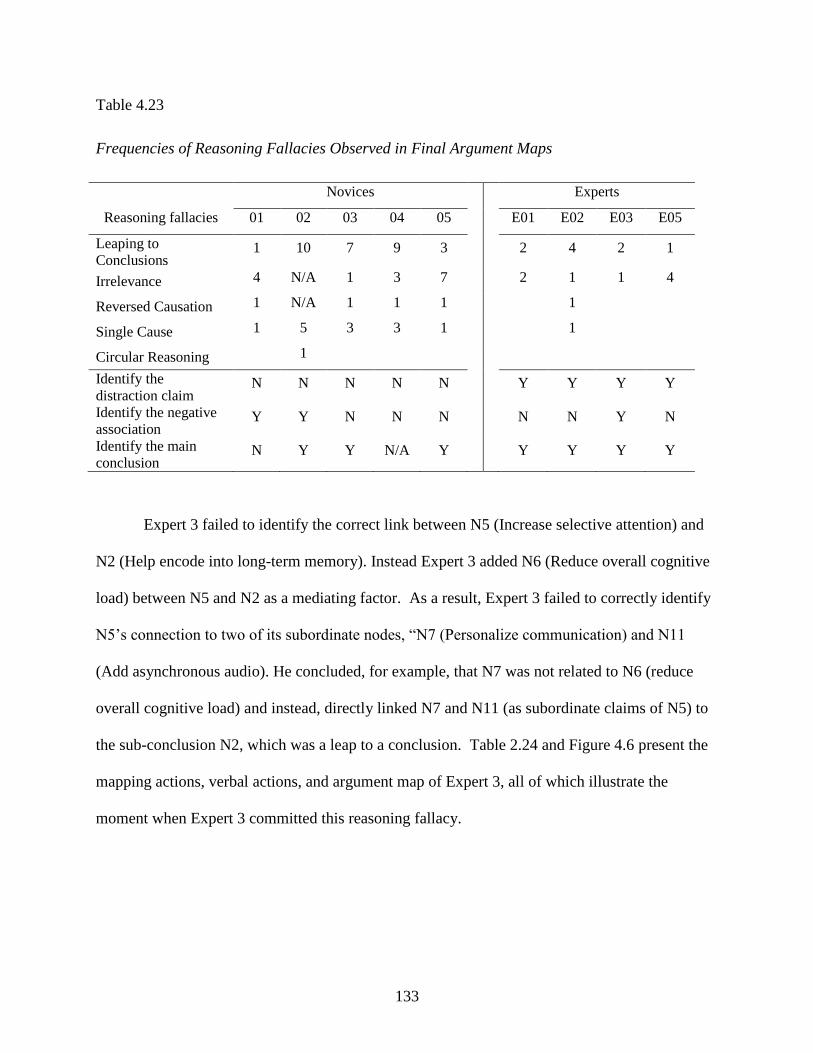
133
Table 4.23
Frequencies of Reasoning Fallacies Observed in Final Argument Maps
Novices Experts
Reasoning fallacies 01 02 03 04 05 E01 E02 E03 E05
Leaping to
Conclusions 1 10 7 9 3 2 4 2 1
Irrelevance 4 N/A 1 3 7 2 1 1 4
Reversed Causation 1 N/A 1 1 1 1
Single Cause 1 5 3 3 1 1
Circular Reasoning 1
Identify the
distraction claim N N N N N Y Y Y Y
Identify the negative
association Y Y N N N N N Y N
Identify the main
conclusion N Y Y N/A Y Y Y Y Y
Expert 3 failed to identify the correct link between N5 (Increase selective attention) and
N2 (Help encode into long-term memory). Instead Expert 3 added N6 (Reduce overall cognitive
load) between N5 and N2 as a mediating factor. As a result, Expert 3 failed to correctly identify
N5’s connection to two of its subordinate nodes, “N7 (Personalize communication) and N11
(Add asynchronous audio). He concluded, for example, that N7 was not related to N6 (reduce
overall cognitive load) and instead, directly linked N7 and N11 (as subordinate claims of N5) to
the sub-conclusion N2, which was a leap to a conclusion. Table 2.24 and Figure 4.6 present the
mapping actions, verbal actions, and argument map of Expert 3, all of which illustrate the
moment when Expert 3 committed this reasoning fallacy.
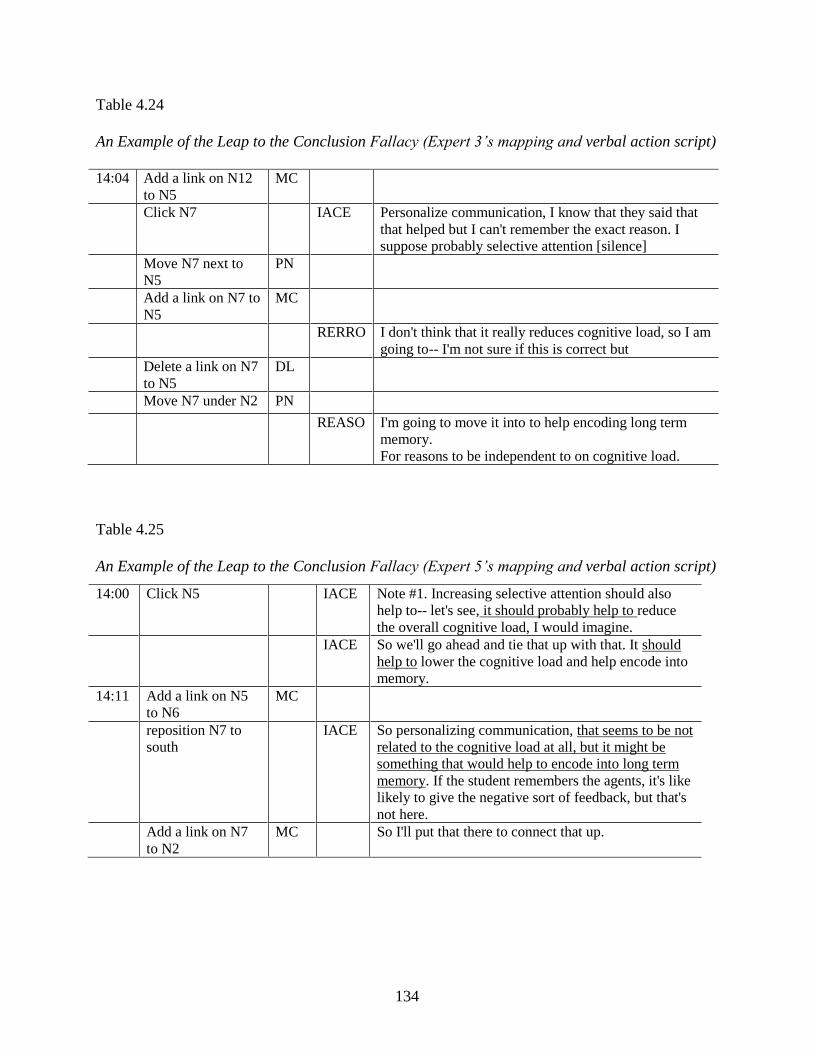
134
Table 4.24
An Example of the Leap to the Conclusion Fallacy (Expert 3’s mapping and verbal action script)
14:04 Add a link on N12
to N5
MC
Click N7 IACE Personalize communication, I know that they said that
that helped but I can't remember the exact reason. I
suppose probably selective attention [silence]
Move N7 next to
N5
PN
Add a link on N7 to
N5
MC
RERRO I don't think that it really reduces cognitive load, so I am
going to-- I'm not sure if this is correct but
Delete a link on N7
to N5
DL
Move N7 under N2 PN
REASO I'm going to move it into to help encoding long term
memory.
For reasons to be independent to on cognitive load.
Table 4.25
An Example of the Leap to the Conclusion Fallacy (Expert 5’s mapping and verbal action script)
14:00 Click N5 IACE Note #1. Increasing selective attention should also
help to-- let's see, it should probably help to reduce
the overall cognitive load, I would imagine.
IACE So we'll go ahead and tie that up with that. It should
help to lower the cognitive load and help encode into
memory.
14:11 Add a link on N5
to N6
MC
reposition N7 to
south
IACE So personalizing communication, that seems to be not
related to the cognitive load at all, but it might be
something that would help to encode into long term
memory. If the student remembers the agents, it's like
likely to give the negative sort of feedback, but that's
not here.
Add a link on N7
to N2
MC So I'll put that there to connect that up.
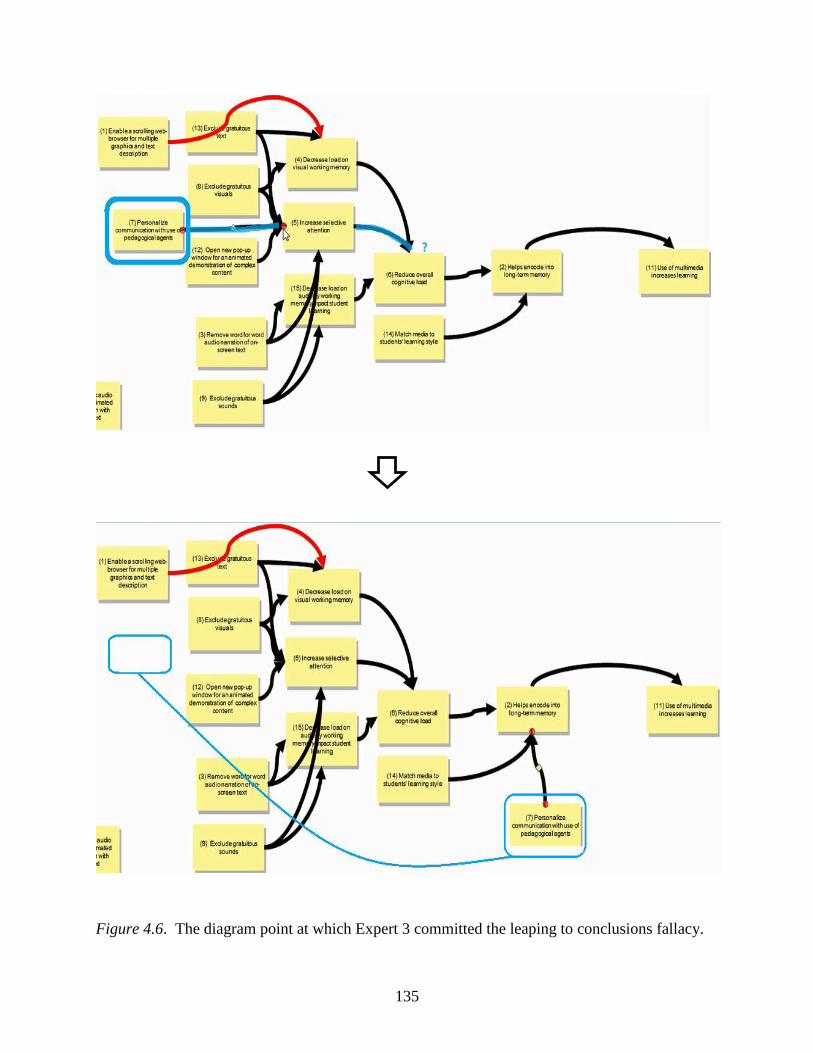
135
Figure 4.6. The diagram point at which Expert 3 committed the leaping to conclusions fallacy.
136
The same reasoning fallacy (leaping to conclusions) was observed when Expert 5 initially
connected N5 to N6 using causal reasoning (see note #1 in Table 2.25). After inserting an arrow
from N5 to N6, Expert 5 analyzed N7 (use of personalized communication using a pedagogical
agent) and concluded that N7 did not relate to N6 (reduce overall cognitive load). For that
reason, Expert 5 directly linked N7 to N2 (help encode into long-term memory, the sub-
conclusion).
In addition to these observed reasoning fallacies, the task of constructing the argument
map also included three important tasks: identifying an irrelevant claim as distraction claim,
identifying a negative claim with an inverse relationship to its parent claim, and identifying the
main conclusion of the argument. All experts pointed out the irrelevance of claim N14
(Matching media to student learning style will increase learning) to the overall argument
whereas all novices failed to identify this claim as irrelevant to the main conclusion. The
reasoning of the experts seemed to be based on a review of the available evidence presented in
the article the participants read and reviewed prior to constructing the argument maps, whereas
the reasoning of the novices was based more on personal belief regarding the effects of media on
student learning style.
[13:00] I'm ignoring up here ‘match media to student's learning style’ because that's just
one, conceptually doesn't seem to fit.
[19:23] I would almost toss 14 out, though. I don't feel strongly about that.
(Expert 1)
[10:21] I don't know what the heck this does. ‘Match media to student learning style.’ I
don't understand why that is. I'm going to just leave this one out for now. That seems to
be,‘match media,’ that seems, you could see that as a conclusion. It seems more of the
motivation for this whole thing.
[15:00] So this one, ‘match media style’—I don't know where this one goes. I might
have to leave this one for now. I think ultimately he may not find a place.
[23:40] Match-- I don't know what to do with 14.
[28:21] Then, ‘match media style to learning style’—I don't know what to do with that.
That just seems to me not especially helpful to the overall argument.
(Expert 2)
137
[9:20] I'm not sure how to understand ‘match media’ this time. So I'm just going to leave
it. That could just be made broader than I first understood it. I've read in the study and
there's no such thing as learning style, because they haven't been able to—some people
learn better in auditory and some are better with visual. But there's not much evidence for
that.
[35:20] Only one I'm not sure about is 'match media to student learning style' because
understood them one way. I have read empirical studies that indicate that there is no such
thing as learning style. But I guess you could understand it more broadly to say using
media helps encode long term memory.
As long as you don't try to only give visual stuff to visual learners, or something like that.
I'm not sure how narrowly you can understand that... need to understand that, so I'll just
leave it there.
(Expert 3)
Finally, all experts correctly identified the main conclusion, N11 The use of multimedia
increases learning, while two of the five novices failed to correctly identify the main conclusion.
Identifying the negative association seemed to be the most difficult task for both novice and
expert groups since only three participants correctly identified the negative association between
Claim N1 and N4.
Summary of Main Qualitative Findings
The following is a summary of the main findings drawn from the qualitative analysis of
data derived from the video recordings of the argument diagram construction process:
1. The participants exhibited five global actions to analyze and construct the argument map.
Their five global actions of argument diagramming were: 1) Scan claims; 2) Identify the
main conclusion; 3) Structure the argument; 4) Review; and 5) Correct reasoning
fallacies. All experts performed the five global actions at higher levels than the novices
whereas the novices performed all or some parts of the actions at a lower level.
2. The experts tended to use top-down reasoning processes whereas the novices tend to use
bottom-up reasoning to structure the claims in their argument maps.
3. With regard to the searching approach, all participants used breadth-first searching
approach as opposed to using a depth-first approach.
138
4. The experts used elaborative argument analysis approach prior to inserting links between
the nodes – an approach that start first by categorizing the claims into groups, then
identifying an overall level of a claim, the dependencies between claims, causality, and
irrelevance between claims.
5. Although the experts did commit some reasoning fallacies as did the novices, the experts
all together tended to make fewer leaps to conclusion, associations with irrelevant claims,
reversed causation, and single cause fallacies.
139
Outliers and Limitations
Originally, five experts in the fields of argumentation and philosophy participated in this
study. Experts 3 and 5 experienced difficulty in understanding the argument mapping task due to
the imperative tone used some of the claims. For example, Expert 3 stated “Especially in
philosophy - in our field - if you put it into an imperative tone, you're not stating something that's
true or false. If I say, ‘Close the window.’ True or false? It's almost like asking a question. (…)
But if you say, ‘This helps with encoding long-term memory.’ That could be true, or that could
be false. (…) When I first saw this, some of these were put in the imperatival tone, the
grammatical category of imperatives, increased selective intention, reduce overall cognitive load,
Use of personalized communication skills, That to me, sounds like, ‘This is what you should do.’
But saying what some should do is not the same as describing a fact.”
Because Expert 4 showed a high level of frustration and discomfort with the jMAP
argument task, he asked frequent questions that led to my active involvement and frequent
interventions during the mapping process. As a result, I decided not to include his argument map
and verbal reports in the analysis. Even though Expert 3 stated that he had misunderstandings
about the task, he voluntarily proposed to re-construct his argument map. After reviewing his
mapping processes before/after interview, I decided to include his map due to my minimal
involvement during the construction of the map and due to his superior analytical skills.
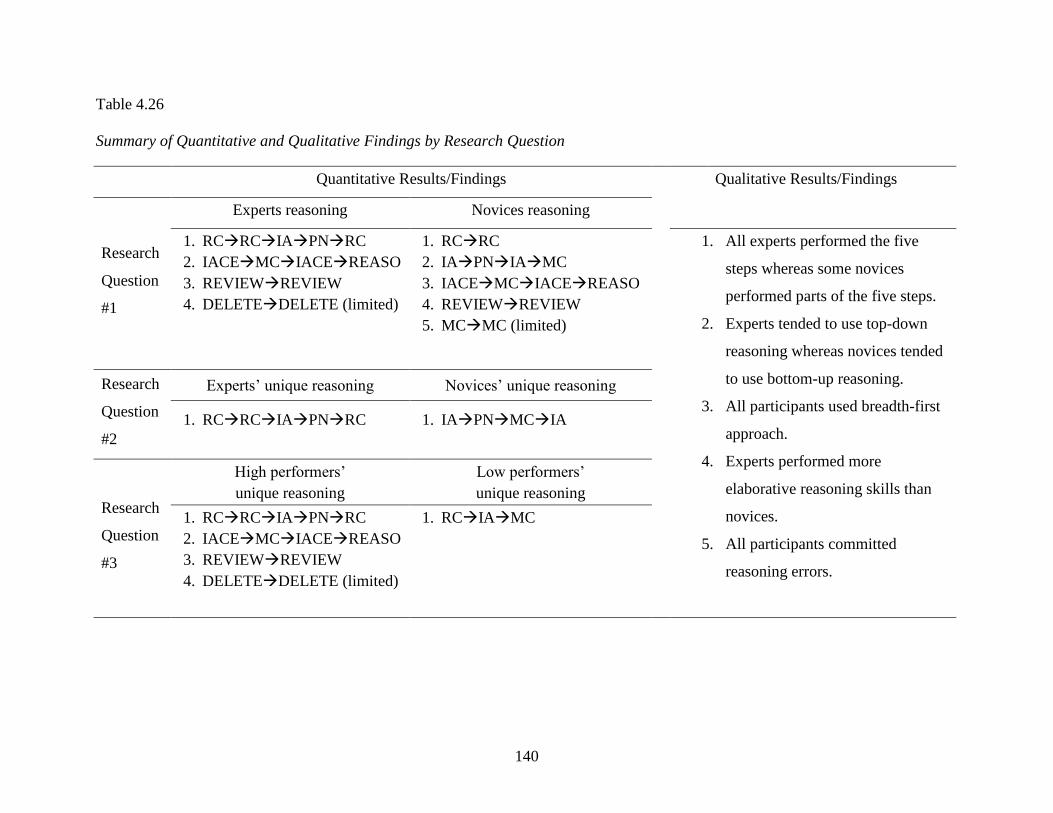
140
Table 4.26
Summary of Quantitative and Qualitative Findings by Research Question
Quantitative Results/Findings Qualitative Results/Findings
Research
Question
#1
Experts reasoning Novices reasoning
1. RCRCIAPNRC
2. IACEMCIACEREASO
3. REVIEWREVIEW
4. DELETEDELETE (limited)
1. RCRC
2. IAPNIAMC
3. IACEMCIACEREASO
4. REVIEWREVIEW
5. MCMC (limited)
1. All experts performed the five
steps whereas some novices
performed parts of the five steps.
2. Experts tended to use top-down
reasoning whereas novices tended
to use bottom-up reasoning.
3. All participants used breadth-first
approach.
4. Experts performed more
elaborative reasoning skills than
novices.
5. All participants committed
reasoning errors.
Research
Question
#2
Experts’ unique reasoning Novices’ unique reasoning
1. RCRCIAPNRC
1. IAPNMCIA
Research
Question
#3
High performers’
unique reasoning
Low performers’
unique reasoning
1. RCRCIAPNRC
2. IACEMCIACEREASO
3. REVIEWREVIEW
4. DELETEDELETE (limited)
1. RCIAMC
141
CHAPTER 5
DISCUSSION
I started this study with two questions. How do people reason? What are the differences
between good reasoners and bad reasoners when they analyze a complex argument? To answer
these questions, I explored the argument mapping and reasoning processes used by expert and
novice reasoners, identified the differences in mapping and reasoning processes between the two
groups, and finally identified the mapping and reasoning processes associated with the high
quality argument maps. Using sequential analysis and qualitative analysis, I arrived at the
findings and results presented in Table 4.26.
In this chapter, I discuss the findings of this study according to the three research
questions and interpret the findings in light of the relevant literature. Then, I outline the
implications of the findings for educators who teach reasoning and critical thinking, as well as
the potential impact for students in higher education who lack reasoning skills. Lastly, I discuss
the limitations in the study and conclude with future recommendations for teaching reasoning in
higher education.
Research Question #1.
What Reasoning Processes do Experts and Novices Perform When Diagramming a
Complex Argument?
Overall, the state diagrams reveal that neither the experts nor the novices exhibited any
patterns that consisted of large and long sequences of five or more actions. Instead, the diagrams
comparing the top two experts versus the low performing novices revealed patterns in sequences
that consisted of two to four actions at most, with both experts and novices revealing roughly the
142
same number of patterns in the processes used to construct their argument diagrams. This latter
finding is consistent with the first reported qualitative finding – the finding that both the experts
and novices exhibited all or as many as five global actions to analyze and construct the argument
map (scan claims, identify main conclusion, structure the argument, review, and correct
reasoning fallacies).
The following is a description of each of the processes revealed by the experts and by the
novices, and a discussion of the meaning or significance of each observed process in relation to
its overall purpose/function and in relation to the findings from the qualitative analysis of the
argument mapping process.
Expert Processes. The expert process for positioning nodes was Read Claim Read
Claim Identify Assoc Position Node Read Claim. Experts’ positioning of nodes was
preceded by two cognitive actions: 1) comprehension of a claim; and 2) identification of a
claim’s overall association. This process indicates that the experts used this process to create an
initial portrayal or rough approximation of the argument structure by using this process to
iteratively position related nodes in close proximity based on the identified associations between
given nodes before inserting links between any of the nodes (as reported in the qualitative
finding #4). This iterative process of positioning and/or re-positioning nodes suggests that the
experts were are to: 1) recognize the overall complexity of the relationships between claims; and
2) take a flexible attitude toward the initial positions of nodes knowing that the initial positions
of the nodes are likely to change when examining and taking other premises into consideration.
For these reasons, experts tended to position associated premises in close proximity to one
another without inserting links to connect the premises.
143
The expert process for linking nodes was Identify Cause-Effect AssociationMake
ConnectionIdentify Cause-effect AssociationReason. Experts’ insertion of links between
two nodes was preceded by identifying the cause-effect association. Once the experts inserted a
link between two nodes based on the identified cause-effect relationship, the experts again
identified the cause-effect relationship and provided a verbal explanation of the noted casual-
effect association. This process shows that the experts were able to explain the reasons for
inserting specific links between nodes, and explain why it is that the experts were able to
produce more accurate argument diagrams (as reported in the qualitative finding #4). However,
the process of inserting connections and then identifying the cause-effect relationship between
the nodes may not be a process that experts inherently use to create their argument diagrams, but
instead, may be simply a behavior that was produced by the task demands of participating in the
think-aloud protocol where the participants were asked to explain their actions.
The expert process for reviewing nodes was performed in an iterative process as the
experts reviewed the chain of reasoning after adding a new node to an existing chain of linked
nodes. The qualitative observations (qualitative finding #1) revealed that experts reviewed the
links within a particular chain of nodes (starting from the lowest level node to and through the
chain of premises leading to the main conclusion) prior to adding a new node to an existing chain
of nodes. The experts then followed this action by conducting a final review of the entire chain
of premises leading up to the conclusion. Overall, this iterative process of reviewing the
connections between nodes suggests that expert reasoners take a deliberate and analytic approach
to making inferences between premises and conclusions.
The expert process for repeated deleting links was observed primarily in the actions of
one and only one expert. This expert constructed an initial argument map but then re-constructed
144
the entire argument map after realizing that he had misunderstood or misinterpreted the
requirements and purpose of the argument mapping task. Overall, the deletion of links rarely
occurred across the four experts because they were very careful and deliberate in the process of
inserting the links between nodes. The experts tried to clearly identify the causal relationships
between nodes before they inserted links between nodes. This deliberate and careful approach
led them to use the delete action on a very infrequent basis.
Novice Processes. The novice process of positioning nodes was preceded by only one
cognitive action - identifying an association. Novices identified the association between two
nodes and then positioned the node on the map to convey the association of one node to another
node. The qualitative observations revealed that some novices performed this process in a fast
and intuitive manner without pausing to carefully reflect on the precise nature and/or accuracy of
the association between two nodes. One plausible explanation for this observed behavior among
the novices is that the novices may not have been fully aware of and/or did not anticipate the true
complexity in the relationships between the premises and conclusion when analyzing the given
argument (or any argument in general). This process of positioning nodes by novices was
reported in the qualitative finding #4.
The novice processes for linking nodes were identified across three different processes.
Novices inserted links between two nodes after: 1) identifying an overall association and
positioning a node; 2) identifying cause-effect association; and 3) inserting a link between two
other nodes. Of these three processes used to insert links between nodes, the last process (the
iterative process of inserting links between nodes) was exhibited in only one of the five novices.
This particular novice positioned all the nodes in the diagram first and then inserted links
145
between the nodes to complete the argument map. For this reason, the repeated linking process
will be excluded from further discussion because this process was the product of one outlier.
The novice process for reviewing nodes appeared infrequently among the five novices.
Novices reviewed the previous chain when they added a new node but limited their review to one
chain and did not review the links up the chain to the final claim or conclusion. For example, if
they added a new node to the 5th level, then they reviewed the 4th 3rd nodes but not the entire
chain of links from 4th 3rd 2nd the main conclusion. One plausible explanations as to
why the novices did not thoroughly review the chain of reasoning is that the novices’ may not be
aware that the veracity of the conclusion relies on the veracity of each and every premise along
the chain of premises.
Research Question #2
What Differences Exist in the Reasoning Processes Used by Experts versus Novices?
Overall, the experts exhibited four reasoning processes used to position nodes, link
nodes, review linked nodes, and delete links between nodes. In contrast, the novices exhibited
five processes used primarily to read/identify claims, link nodes, review linked nodes. Omitting
the processes that were observed solely in one expert (iterative deletion of links) and solely in
one novice (iteratively making connections between nodes), the experts exhibited a total of three
processes whereas the novices exhibited a total of four processes. Of the three processes
exhibited by the experts, only one of the processes (iterative process used to positioning nodes)
was not exhibited and was different from those exhibited by the novices. Of the four processes
exhibited by the novices, only one of these four processes was substantively different from those
exhibited by the experts (the iterative process used to position nodes and inserting links between
nodes). As a result, the main difference between the processes used by experts versus the
146
processes used by novices was that the experts used an iterative process to position nodes,
whereas the novices used an iterative process to both position and link the nodes. The experts
positioned nodes by first reading the claims and identifying their inter-relationship before
positioning the nodes based on their identified relationship. Contrary to the experts, the novices
did not position nodes iteratively. Instead, the novices positioned a node and then immediately
inserted a link between the nodes. These noted differences in process and their meaning and
significance/implications are discussed in the next section under research question 3.
The phi coefficient tests conducted in this study provided some measure of association
between a particular two-action sequential pattern and group membership. For the expert
groups, the 1) Read Claim Identify Assoc., 2) ConnectionIdentify Cause-effect Assoc., and
3) Delete Delete patterns were found to be associated with experts’ action sequences (but in a
weak manner or to a small degree). However, none of these associations appear to lend
additional support for the two observed differences in the reasoning processes – processes that
consist of three or more sequences of actions. However, it must be noted that the phi coefficient
test only examines group association for actions pairs as opposed to testing and examining group
association for longer sequences of actions that more fully capture the processes of reasoning
used by the experts and the novices. As a result, the phi-coefficient tests and results were overall
considered to be not relevant or of central importance in this study.
Research Question #3
Which Processes Might Help Produce Diagrams of High versus Low Accuracy?
High Performers’ Unique Reasoning Processes.
The sequential patterns exhibited by the two highest performers provide some
suggestions as to what processes might help to produce diagrams of higher accuracy. The two
147
highest performers produced reasoning processes that were identical to three patterns observed
across all four experts: 1) the expert process for positioning nodes, 2) the process for linking
nodes, and 3) the process for reviewing nodes.
Why does the expert iterative process of positioning nodes help them to produce a more
accurate argument map? One possible reason is that experts are able to identify semantic
relationships by identifying similarity, comparison, inclusion and abstraction. As a result,
experts can easily organize complex claims into groups and better recognize and analyze their
hierarchical relationships. In other words, grouping claims by placing associated claims in close
proximity can help experts tease out their complex hierarchical relationships and produce more
accurate argument diagrams. Early in the mapping process, it was observed that the experts
verbally stated that they needed to position and reposition nodes until they believed that the
identified the final and correct position of each nodes in the process of working out the
hierarchical relationships between all the nodes. The use of iterative process of positioning nodes
enabled the experts to change the relationships between the nodes quickly and easily (without
having to delete and re-insert links between nodes) and hence enabled them to more efficiently
think through all the possible relationships between the nodes in the process of identifying the
correct links/connections between the nodes.
With regard to the process for linking nodes, the experts examined the cause-effect
relationship between two claims (e.g., B is the result of A, A helps B happen) to make decisions
on when to insert a link between two claims. This process helped experts to produce a more
accurate map because it required the experts to make more explicit their explanations and
justifications for inserting a link between two nodes (e.g., identifying a missing premise that
completes the connection between two premises).
148
After adding a node to the existing chain of nodes, the high performers reviewed the flow
of reasoning from the lowest node up to the main conclusion. This iterative and extended review
process helped them to detect reasoning fallacies (e.g., leaping to conclusions), refine the
hierarchical relationships between the nodes, and as a result, create more accurate maps.
Low Performers’ Unique Reasoning Process
One specific process for linking nodes (Identify Association Connect) appeared to be a
unique process used only by the two lowest performers based on the results of the phi coefficient
test. The two novices showed a tendency to immediately insert a link between claims once they
identified their association (e.g., A is related to B. or A is supporting B) without making more
explicit the precise cause-effect relationships between the two claims. How is it that this
particular process of linking nodes might hinder students’ ability to produce higher quality
argument maps? One possible reason is the novices (unlike the experts) may not have
recognized the true complexity of the given arguments (or other arguments in general). And as a
result, the novices were too quick and premature in inserting the links between claims instead of
taking the necessary time to position and re-position related claims in close proximity to
thoroughly explore all their possible relationships. Furthermore, adding links prematurely can
make it more difficult and discourage the novice from moving and repositioning nodes to correct
for logical fallacies because the process of changing the position of nodes (and their associations
with other nodes) requires students to delete the outdated links, re-insert new links, and/or re-
route existing links so that the links are not placed on top of other nodes and visually obstruct the
nodes.
149
Qualitative Findings and Discussion
Even though the sequential analysis provided indications of mapping actions that serve as
potential indicators of some of the reasoning processes identified in the qualitative analysis,
some important actions, such as identifying the main conclusion, recognizing reasoning errors,
identifying the independencies/dependencies between premises, and identifying irrelevant claims,
were not revealed in the results of the sequential analysis because these particular processes of
reasoning occurred at a very low frequency. For example, identifying the main conclusion likely
occurred one and only one time for each participant. Likewise, finding the irrelevant claim
(since there was only one irrelevant claim in the argument) also likely occurred one and only one
time. Furthermore, only one negative relationship was present in the criterion argument map. In
addition, five other reasoning processes that are perhaps more global in nature could not be
revealed from the sequential analysis of the mapping actions (at least not from the coding
scheme developed and used in this current student to code the mapping actions). From the
qualitative analysis, this study identified the following five reasoning processes.
1. Five-step to Argument Map: The experts performed five stages in the process of
constructing their argument maps: 1) read all claims, 2) identify the main conclusion; 3) structure
the map; 4) review the map; and 5) recognize reasoning errors and make revisions. Overall, this
five stage process is overall very similar to the seven-stage process identified by Scriven (1976).
2. Top-down versus Bottom-up: Second, experts tended to use a top-down reasoning
process whereas the novices tended to use a bottom-up reasoning process while analyzing and
constructing the argument maps. In particular, three experts out of four dominantly used top-
down reasoning and two novices used bottom-up reasoning (one novice used top-down, one
novice used both top-down and bottom-up, and the other novice’s processes did not fit into either
150
category). This result is consistent with the previous findings that show that the use of top-down
reasoning is one of main characteristics of experts (Cross, 2004).
3. Breadth-first Approach. Third, with respect to the types of searching processes, the
experts and novices used ‘breadth-first’ strategy over ‘depth-first’ strategy.
4. Sophisticated Reasoning Skills. Fourth, experts demonstrated more sophisticated
questions and strategies used to analyze relationships, posing questions like “What is the overall
level of this claim “, “What is the claim that supports the major premise?” “Are they supporting
the ordinate claim by working together (dependently as co-premise) or are they independent
reasons?”, “Is this claim relevant to the main argument?”, “Do they have a negative relationship
or a positive relationship?” “Is the relationship between claims strong or weak?” These types of
questions demonstrate how the experts used various analytical approaches to reason through and
to identify the associations between claims. Although some novices exhibited more
sophisticated reasoning skills than other novices, the novices overall demonstrated a lower level
in reasoning ability in terms of the types of questions that the experts posed to themselves. For
example, novices 2 and 4 used an intuitive and fast processing approach to produce a low quality
map. Novices 3 and 5 on the other hand exhibited some of the analytical questioning and
processes like the experts but were not able to carry through with the process to correct for errors
in their maps. Conversely, some novices were able to detect errors in their map, and yet were
unable to go through the proper questioning process to make corrections to the noted errors.
5. Reasoning Fallacies for Everyone. While the expert group performed better at
analyzing and constructing the argument map than the novice group, both experts and novices
committed fallacies in their reasoning. Previous research has shown that reasoning fallacies are
not associated with specific reasoning processes, neither deductive nor inductive reasoning
151
(Neuman, 2003; Ricco, 2003). Instead, reasoning fallacies are associated with the reasoner’s
level of content knowledge, especially argument from ignorance, circular reasoning, and slippery
slope (Hahns & Oaksford, 2007). Reasoning skills are also associated with factors such as
general cognitive ability (Weinstock, Neuman, & Glassner, 2006; Svedholm-Häkkinen, 2015) or
educational level. This study selected participants who were largely unfamiliar with the content.
So as expected, experts sometimes linked their claims without identifying the mediating claim to
the main conclusion (indication of leaping to conclusion and slippery slope fallacies) and they
linked claims (very technical and specific claims) to incorrect super-ordinate claims. However,
the experts in this study committed few errors in circular reasoning, and few errors in reversed
causation, and single cause fallacies.
On the other hand, the reasoning novices tended to also commit the fallacies of leaping to
conclusion and slippery slope as well as reversed causation due to the lack of content knowledge.
In addition, the novices committed the fallacies of irrelevance and single cause. The question
now is exactly how and why are these observed reasoning fallacies associated with “lack of
content knowledge” and/or “lack of reasoning skills”? Previous research has found that lack of
content knowledge is associated with specific reasoning fallacies, but does not identify nor
explain how lack of content knowledge produces deficiencies in the mapping and reasoning
processes that produce these specific fallacies in logic. It would be helpful to diagnose how lack
of content knowledge influences and changes the reasoning processes in ways that lead to logical
fallacies. By doing so, appropriate instruction and interventions can be presented to students to
ameliorate the negative effects of deficiencies in content knowledge.
Another interesting finding was that the experts tended to reason based on evidence
whereas the novices tended to reason based on personal belief. In this study, the participants
152
were presented a distraction claim that was not true (yet was highly believable and conceivable),
and not relevant to the main argument. In this study, the five novices included and linked the
distractor claim (“matching media to students’ learning style increases learning”) to node(s) in
the argument map without question. On the other hand, the experts raised questions about the
validity of the claim and correctly identified this claim as irrelevant to the main argument. These
findings suggest that the novices tended to accept the validity of a claim when the claim matched
their own belief system, whereas the experts demonstrated their ability to examine the distractor
claim based on logic as opposed to personal beliefs. Findings from prior studies has shown that
the bias from personal beliefs does not appear to interfere with the reasoning processes for
people with high reasoning skills, whereas the effects of personal beliefs is strong for people
with inadequate reasoning skills (Svedholm-Häkkinen, 2015). Given that nearly all the
participants in this study were not content experts in multimedia and instructional design, content
knowledge does not appear to be a factor in explaining the differences in logical fallacies
committed by the experts and novices. Instead, the observed differences appear to be associated
with differences in their skills with the processes of reasoning. From the dual-process
perspective, the experts in this study examined the claim’s association based on the use of logic
rather than personal belief due whereas the novices (with their weaker skills and experience with
reasoning) appeared to have relied on using more intuitive reasoning processes that rely on
personal beliefs – intuitive processes that were more prone to producing fallacies in logic.
153
Instructional and Software Design Implications
The findings in this study suggest that examining the reasoning processes of experts and
novices at both the micro level (mapping actions) and global level (reasoning strategies) can help
us identify the types of processes that can potentially help students’ produce higher quality
argument maps and achieve deeper understanding of complex arguments. The findings in this
study suggest that instructors should encourage students (when diagramming arguments) to
apply the following procedure: 1) use an iterative process of positioning nodes while carefully
examining the cause-effect relationships between nodes; 2) iteratively review links between
nodes across each chain of linked nodes; and 3) insert the links between nodes once their
hierarchical relationships have been examined. For example, students can be instructed at or
near the beginning of the mapping process to place associated claims in close proximity to one
another based on their careful review of the cause-effects relationships, but wait to insert links
between the nodes at a later time so that the nodes can be easily re-positioned as new
relationships are discovered. Once the nodes are placed in their desired location, students can
then be instructed to carefully and iteratively review the chain of links connecting the lowest
level premises up to the main conclusion while making explicit to students the common types of
fallacies they should look out for in their argument maps.
Although these three processes can also be used to facilitate the analysis of complex
arguments in other contexts that do not involve the use of diagrams (e.g., group discussions,
written essays), using these processes to construct argument diagrams is particularly important
for the following reasons. Diagrams are used heavily in industry to conduct root cause analysis
because it enables industries and organizations to chart out the multitude of variables and events
that contribute to breakdowns in process, and to identify the root causes for the breakdown so
154
that solutions that can be identified to directly address the root causes and not the symptoms of
the problem. Most of all, argument analysis is a highly complex process that can be learned
much more effectively when given sufficient practice and immediate feedback (Twardy, 2004;
van Gelder, 2001). One way to provide more practice and feedback is to embed these processes
directly into argument mapping software so that the software can scaffold these processes as
students are creating argument diagrams, diagnose the processes used by students in relation to
the desired/target processes, and provide immediate prompts and individualized feedback to
guide students through the map construction process.
To create argument mapping software that can scaffold these three processes, students
can be encouraged and/or required to use the iterative process of positioning nodes by disabling
the link insertion function in the software and making the linking function available only after a
student has positioned all or a subset of nodes. Second, the mapping software can be designed to
detect whether the student has positioned the outcome node near top of screen and monitor how
many times each node has been moved and/or re-positioned to indicate to what extent the
students is actively exploring and revising the node positions and their hierarchical structure.
Once the student feels that all the nodes have been placed in the desired location, the software
can provide a one-step function that automatically inserts links between all the nodes based on
each node’s proximity and relative position to other nodes. Before this auto linking function is
executed, however, the system can prompt the student to spend more time evaluating the
hierarchical relationships between the nodes if the system detects a deficiency in the number of
times the students executes the iterative node positioning process/action. These types of
software functions can be used and systematically manipulated to conduct controlled

155
experiments to test the effects of each specific process on students’ understanding of complex
arguments.
156
Limitations of the Study
Although this study provides insights into the mapping and reasoning processes used by
experts and novice graduate students, the findings are not conclusive because this study
employed an exploratory design rather than a controlled experimental design. As a result, the
cause effect relationship between the observed processes and map quality cannot be verified
using the data drawn from this study. Another limitation of this study is that its findings cannot
be generalized to the larger population. The targeted participants were experts who teach
argumentation courses and novice graduate students with limited argumentation experience. As a
result, the processes observed in the novices in this study may not be processes observed in
novices across other student populations (e.g., undergraduates, high school students).
Furthermore, the participants in this study were skewed by gender in both the expert (100%
male) and novice (80% female) groups. However, there is little evidence to indicate that gender
difference exist in the reasoning skills of college students (Kuhn, 1992). Prior content
knowledge, on the other hand, has been found to affect reasoning processes (Hahns & Oaksford,
2007). Due to the fact that expert 1 reported the highest level of content familiarity, there is the
possibility that expert 1’s reasoning processes may have skewed the reasoning processes found
in the expert group. However, expert 1 scored third highest in map accuracy even though he was
scored highest in content familiarity. Given these circumstances, any unintended effects from
uneven gender between groups and the levels of content familiarity were likely to be minimal in
my study, particularly given the overall consistency in the patterns of actions observed across the
four experts in this study.
In addition, the participants in this study used a computerized mapping tool, jMAP, to
analyze and construct their argument maps given 15 claims extracted in advance by the
157
researcher (not the participants). For this reason, the participants’ reasoning processes may have
been constrained by this particular aspect of the task design. As a result, this study’s findings
may not be applicable or generalizable to contexts where participants are required to perform the
entire argument analysis process (including the process of extracting and identifying the meaning
of premises) as described by Scriven (1976). For example, the premises in jMAP were not only
extracted in advance by the researcher, but they were also randomly arranged on the initial jMAP
screen. If the participants had been asked to extract the premises from the article on multimedia
principles, the participants would be able to identify each premise in immediate context to any
other related premises and conclusions stated and described within the article. As a result, having
the participants extract the premises directly from the article might simplify the process of
identifying the associations between premises so that less time is spent on positioning and re-
positioning nodes to explore their possible relationships.
Another limitation of this study was the presence of individual differences in the
participants’ ability to verbalize their thought processes. Even though all participants were
native English speakers, some participants verbalized their thought processes less frequently than
other participants. Some participants appeared to be unable to simultaneously talk out loud
while analyzing and constructing their argument maps even with frequent prompting from the
researcher. Sometimes, participants merely reported what they were doing (identifying their
actions) instead of presenting an explanation and justification for their actions. At this time, it
cannot be determined whether their difficulty in verbalizing their thought processes can be
attributed to their ability to apply reasoning skills or the unfamiliarity with the talk out loud
protocol.
158
Finally, the format of the sentences used to describe each premise within each node
should be stated in declarative form, not in imperative form. In this study, several sentences
started with a verb. From the interviews with two of the experts in argumentation, using
commands or imperative tones can hinder the argument analysis process and, can in fact, confuse
students. These imperative sentences confused two experts and due to this confusion, one of
these two experts (the one expert that was omitted from the data analysis) was not able to
complete the argument diagramming task without excessive prompting and guidance from the
researcher. Even though other participants did not report this problem, this could be a possible
threat to the validity of the findings reported in this study.
Limitations of Sequential Analysis
Sequential analysis requires a minimum number for the cell frequencies in each action
sequence. For this reason, if a marginal cell frequency is less than 5, sequential analysis cannot
detect it as an important pattern. Along the same lines, the critical p-value of .05 used in the
sequential analysis in this study to test for all possible action sequences was chosen because this
study was exploratory in nature. Perhaps a more conservative p value with increase in sample
size could be used to more accurately determine and identify differences between the specific
processes used by the experts versus the novices in future studies. Also, the phi coefficients
reported in this study only examined the magnitude of the difference between specific action
pairs, whereas the main focus of this study was to examine larger sequences of actions to identify
reasoning processes of 3 or more actions in a sequence. An alternative statistic is needed to
determine the magnitude of the differences in the frequency of two-, three-, and four-event
sequence exhibited by the experts and novices
159
Directions for Future Research
Most of all, no cause-effect relationships between the observed processes and
performance scores can be determined from the findings in this study because this study did not
use an experimental design. To test the effects of specific reasoning processes on performance,
different versions of an argument mapping software program can be developed to guide its users
in using different reasoning processes (e.g., top-down versus bottom-up) in order to test and
compare the effects of specific reasoning processes on map accuracy and student understanding
of complex arguments. Furthermore, the computerized argument tool could be programmed to
employ sequential analysis to compute and recognize what processes students are using and what
types of reasoning fallacies students are making to create the mechanism for delivering prompts,
feedback, and strategies that can help students produce accurate argument maps and achieve
more precise understanding of complex arguments.
Another recommendation is to conduct further research examining the relationships
between the mapping and reasoning processes identified in this study’s qualitative analysis of the
argument map construction process. Table 5.1 shows that in this study, mapping processes were
found to be potential indicators of three of the five main steps in the map construction process
(scan claims, construct argument, review) identified in this study’s qualitative analysis. As a
result, further research can be done to identify mapping actions associated with the other two
remaining steps in the map construction process (identify conclusion, correct fallacies). Future
studies can also refine the coding scheme developed in this study so that the sequential analysis
of mapping actions can: 1) detect, measure, and monitor students’ use of top-down, bottom-up,
depth first, and breadth first approaches used to construct arguments in step 3; and 2) determine
which reasoning processes tend to produce or not produce specific reasoning fallacies (e.g.,
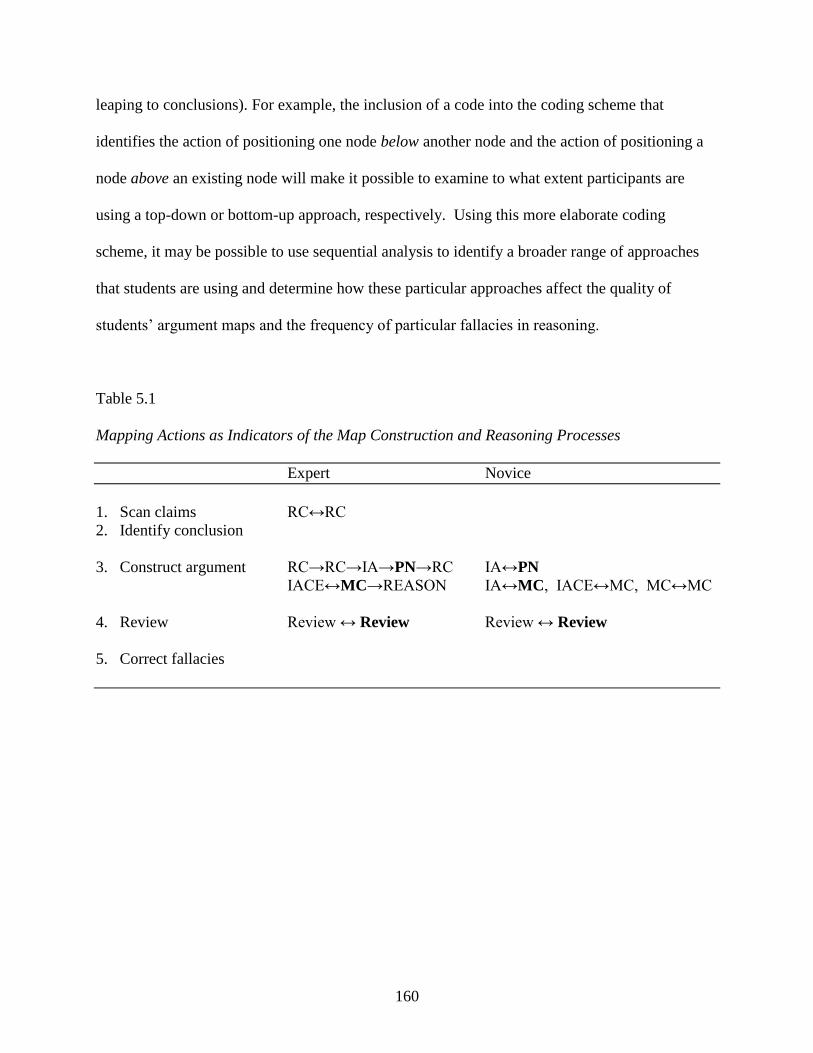
160
leaping to conclusions). For example, the inclusion of a code into the coding scheme that
identifies the action of positioning one node below another node and the action of positioning a
node above an existing node will make it possible to examine to what extent participants are
using a top-down or bottom-up approach, respectively. Using this more elaborate coding
scheme, it may be possible to use sequential analysis to identify a broader range of approaches
that students are using and determine how these particular approaches affect the quality of
students’ argument maps and the frequency of particular fallacies in reasoning.
Table 5.1
Mapping Actions as Indicators of the Map Construction and Reasoning Processes
Expert Novice
1. Scan claims RC↔RC
2. Identify conclusion
3. Construct argument RC→RC→IA→PN→RC IA↔PN
IACE↔MC→REASON IA↔MC, IACE↔MC, MC↔MC
4. Review Review ↔ Review Review ↔ Review
5. Correct fallacies
161
Conclusion
As an educator and researcher in higher education, understanding student reasoning
processes is an important yet challenging task. The goal of higher education is to train students
to think critically and to use accurate reasoning skills to deal with complex arguments. The
findings in this study demonstrate that graduate students’ reasoning skills can vary in terms of
the strategies they employ (compared to processes used by experts) and the level of
understanding that can be achieved by employing specific strategies. As a result, educators need
to focus efforts on identifying students’ current reasoning skills and teaching more advanced
reasoning skills, in addition to teaching knowledge and content specific to their disciplines. One
way to improve students’ reasoning skills is to first identify, test, and model the reasoning
processes used by experts. Once these processes have been adequately tested and validated,
students reasoning skills can be improved by providing students with guidance on how to
perform these very processes. This guiding and modeling of processes can in the future be
implemented with computerized adaptive argument mapping software – software that can be
used for both diagnostic purposes (e.g., recognize students’ behavioral patterns and reasoning
fallacies, and then provide adaptive feedback to improve their performances) and instructional
purposes (i.e., to support and teach the use of specific processes). Although more evidence and
study are needed to fully identify and understand the reasoning processes of experts, this study
provides initial insights into how people reason when they are asked to create a complex
argument structure using a computerized mapping tool and also provides insights into the
potential use of sequential analysis as a means to identifying key processes of effective
argumentation.
162
APPENDIX A
PARTICIPANT’S PROFILE SURVEY
Your identification number is ________.
Please answer the following questions.
Age: ( )
Gender: (female, male)
Profession
I am currently (graduate student________ professor________).
If you are a student, how many semesters have you completed so far? ( )
If you are a professor, how many years have you been so? ( )
If you are a professor, what is your field of expertise?
Writing and reviewing journal experience
How many years have you been actively involved in writing journal articles?
How many articles have you published?
How many years have you served as a peer-reviewer for journal articles?
How many articles have you reviewed?
Are you familiar with the article ‘Six principles of effective e-Learning: What works and
why? (Ruth Clark) Please circle your familiarity of each principle using three scales (never
heard of it, know it some, very well know)
o Multimedia Principle (never heard of it, know it some, Know it very well)
o Congruity Principle (never heard of it, know it some, Know it very well)
o Modality Principle (never heard of it, know it some, Know it very well)

163
o Redundancy Principle (never heard of it, know it some, Know it very well)
o Coherence Principle (never heard of it, know it some, Know it very well)
o Personalization Principle (never heard of it, know it some, Know it very well)
Have you ever used the jMAP software to create a map? (Yes, No)
Have you used other mapping software to create a map such as concept maps or/and network
maps? (Yes, No)

164
APPENDIX B
SUMMARY OF SIX E-LEARNING PRINCIPLES
Original Article: Clark, R. (2002). Six principles of effective e-Learning: What works and why.
The e-Learning Developer’s Journal, 1-20. Retrieved from
http://faculty.washington.edu/farkas/HCDE510-Fall2012/ClarkMultimediaPrinciples(Mayer).pdf
The Multimedia Principle: adding graphics to words can improve learning.
By graphics we refer to a variety of illustrations including still graphics such as line
drawings, charts, and photographs and motion graphics such as animation and video.
Research has shown that graphics can improve learning. The trick is to use illustrations that
are congruent with the instructional message. Images added for entertainment or dramatic
value not only don’t improve learning but they can actually depress learning.
Mayer compared learning about various mechanical and scientific processes including how a
bicycle pump works and how lightning forms, from lessons that used words alone or used
words and pictures (including still graphics and animations). In most cases he found much
improved understanding when pictures were included.
Figure 1. e-Learning illustrating a biological process.
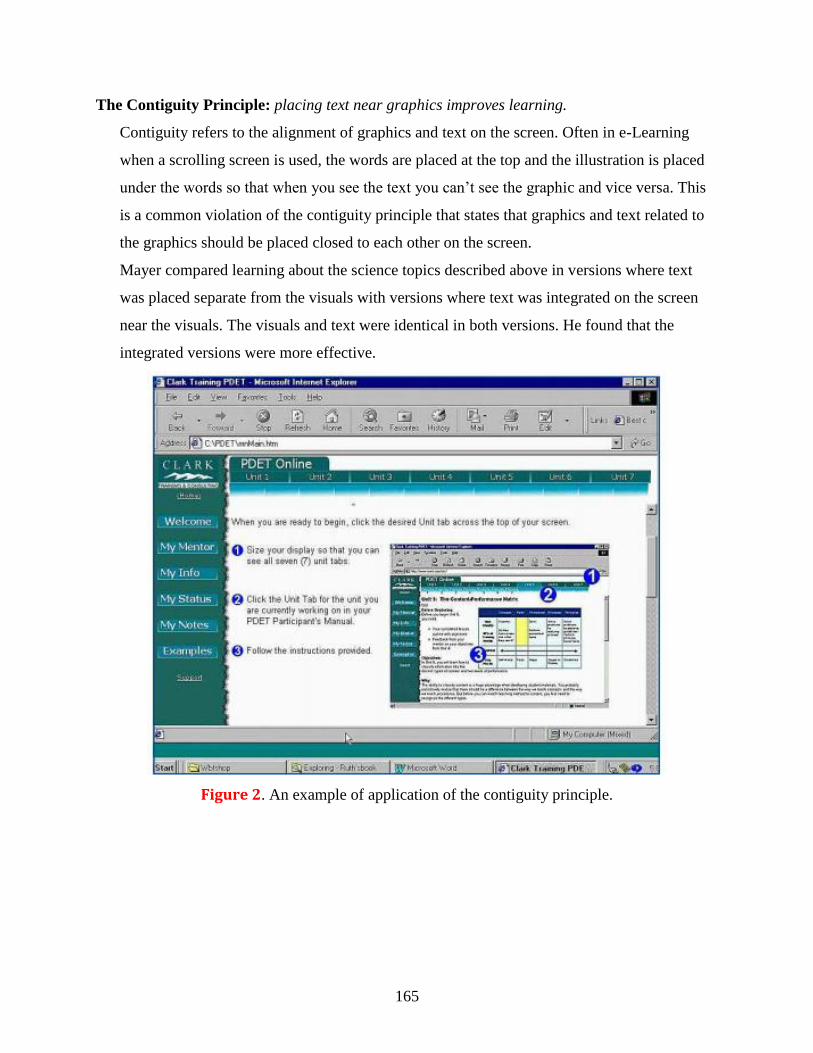
165
The Contiguity Principle: placing text near graphics improves learning.
Contiguity refers to the alignment of graphics and text on the screen. Often in e-Learning
when a scrolling screen is used, the words are placed at the top and the illustration is placed
under the words so that when you see the text you can’t see the graphic and vice versa. This
is a common violation of the contiguity principle that states that graphics and text related to
the graphics should be placed closed to each other on the screen.
Mayer compared learning about the science topics described above in versions where text
was placed separate from the visuals with versions where text was integrated on the screen
near the visuals. The visuals and text were identical in both versions. He found that the
integrated versions were more effective.
Figure 2. An example of application of the contiguity principle.
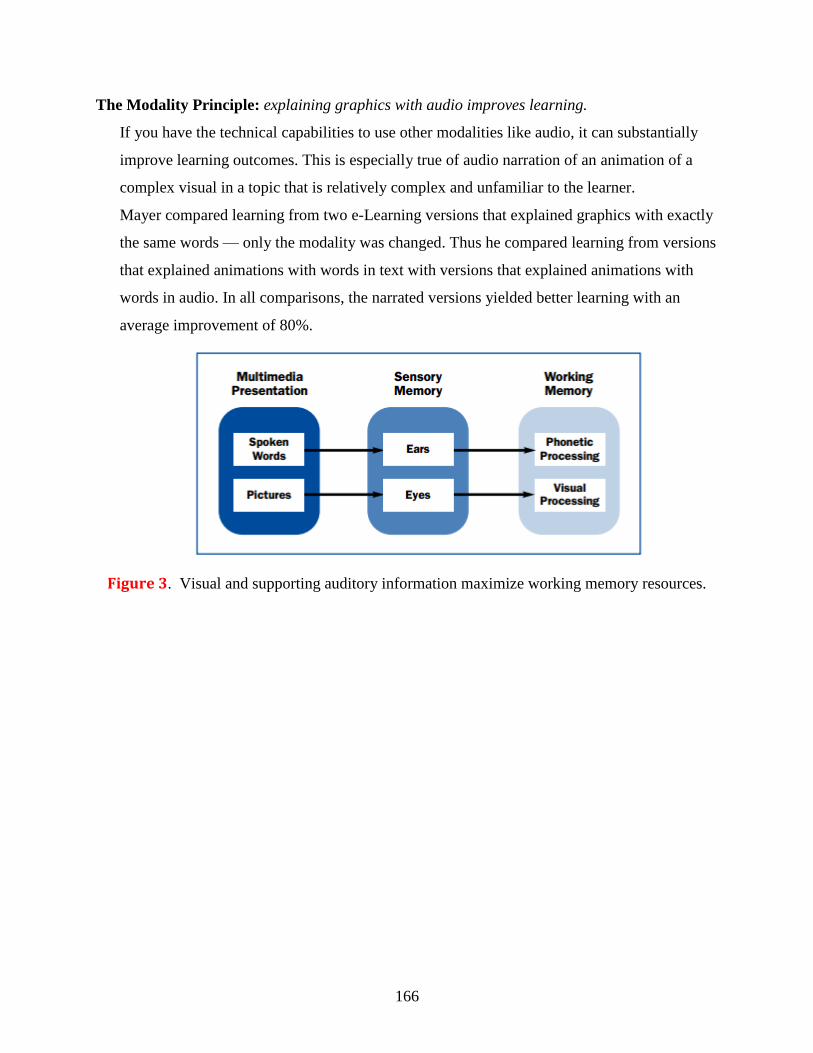
166
The Modality Principle: explaining graphics with audio improves learning.
If you have the technical capabilities to use other modalities like audio, it can substantially
improve learning outcomes. This is especially true of audio narration of an animation of a
complex visual in a topic that is relatively complex and unfamiliar to the learner.
Mayer compared learning from two e-Learning versions that explained graphics with exactly
the same words — only the modality was changed. Thus he compared learning from versions
that explained animations with words in text with versions that explained animations with
words in audio. In all comparisons, the narrated versions yielded better learning with an
average improvement of 80%.
Figure 3. Visual and supporting auditory information maximize working memory resources.
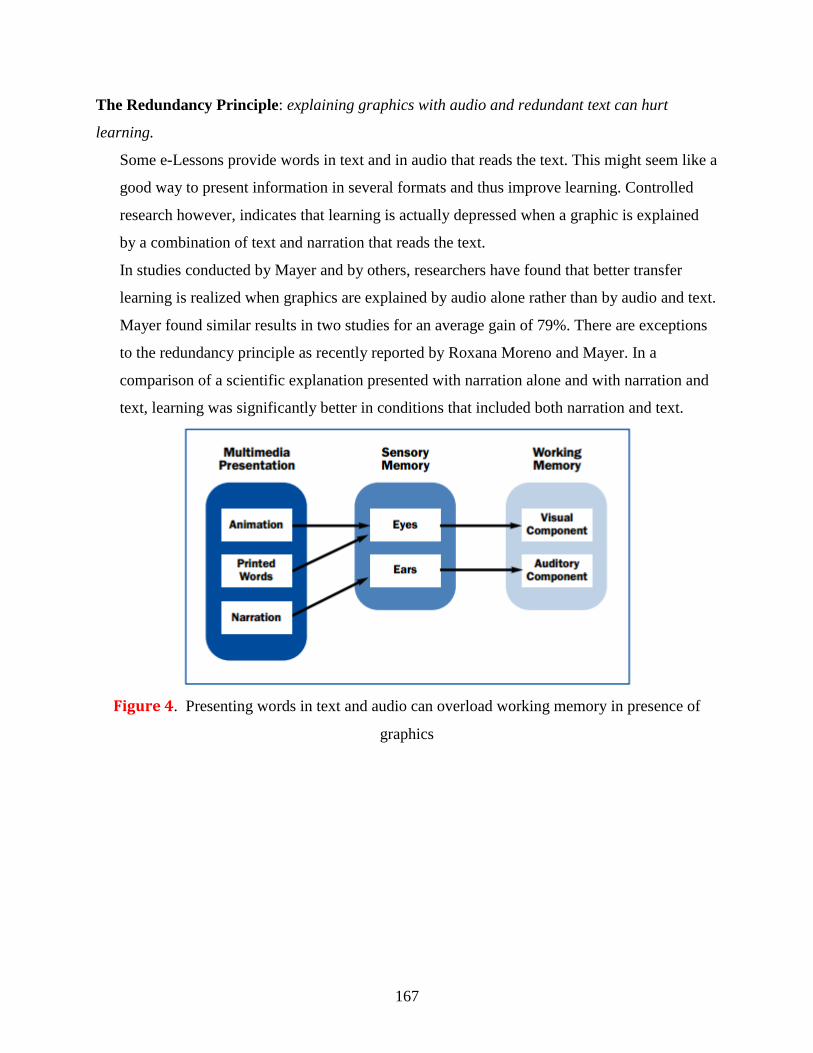
167
The Redundancy Principle: explaining graphics with audio and redundant text can hurt
learning.
Some e-Lessons provide words in text and in audio that reads the text. This might seem like a
good way to present information in several formats and thus improve learning. Controlled
research however, indicates that learning is actually depressed when a graphic is explained
by a combination of text and narration that reads the text.
In studies conducted by Mayer and by others, researchers have found that better transfer
learning is realized when graphics are explained by audio alone rather than by audio and text.
Mayer found similar results in two studies for an average gain of 79%. There are exceptions
to the redundancy principle as recently reported by Roxana Moreno and Mayer. In a
comparison of a scientific explanation presented with narration alone and with narration and
text, learning was significantly better in conditions that included both narration and text.
Figure 4. Presenting words in text and audio can overload working memory in presence of
graphics
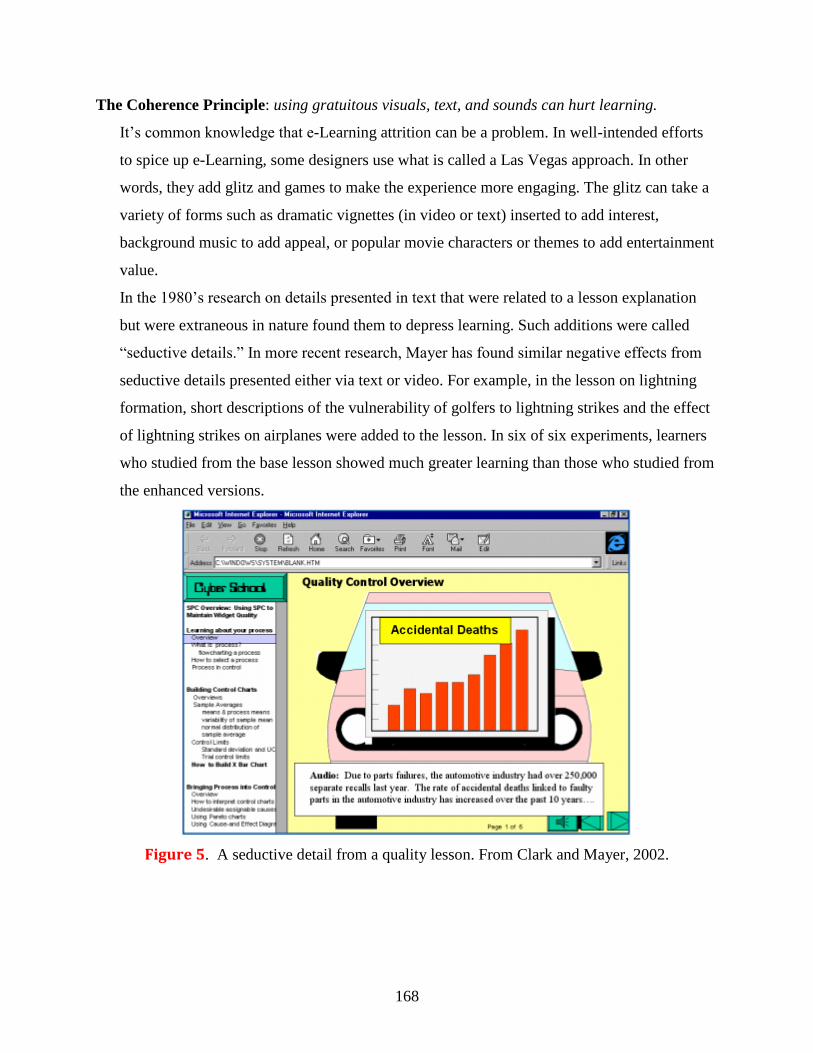
168
The Coherence Principle: using gratuitous visuals, text, and sounds can hurt learning.
It’s common knowledge that e-Learning attrition can be a problem. In well-intended efforts
to spice up e-Learning, some designers use what is called a Las Vegas approach. In other
words, they add glitz and games to make the experience more engaging. The glitz can take a
variety of forms such as dramatic vignettes (in video or text) inserted to add interest,
background music to add appeal, or popular movie characters or themes to add entertainment
value.
In the 1980’s research on details presented in text that were related to a lesson explanation
but were extraneous in nature found them to depress learning. Such additions were called
“seductive details.” In more recent research, Mayer has found similar negative effects from
seductive details presented either via text or video. For example, in the lesson on lightning
formation, short descriptions of the vulnerability of golfers to lightning strikes and the effect
of lightning strikes on airplanes were added to the lesson. In six of six experiments, learners
who studied from the base lesson showed much greater learning than those who studied from
the enhanced versions.
Figure 5. A seductive detail from a quality lesson. From Clark and Mayer, 2002.
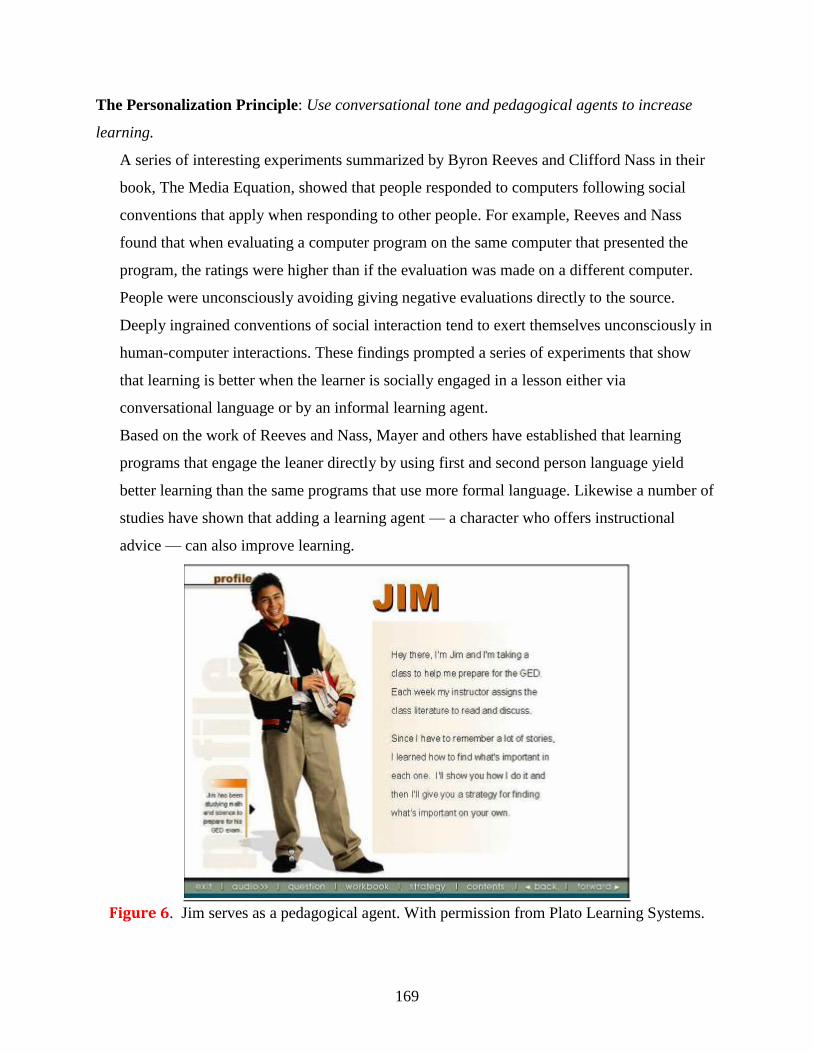
169
The Personalization Principle: Use conversational tone and pedagogical agents to increase
learning.
A series of interesting experiments summarized by Byron Reeves and Clifford Nass in their
book, The Media Equation, showed that people responded to computers following social
conventions that apply when responding to other people. For example, Reeves and Nass
found that when evaluating a computer program on the same computer that presented the
program, the ratings were higher than if the evaluation was made on a different computer.
People were unconsciously avoiding giving negative evaluations directly to the source.
Deeply ingrained conventions of social interaction tend to exert themselves unconsciously in
human-computer interactions. These findings prompted a series of experiments that show
that learning is better when the learner is socially engaged in a lesson either via
conversational language or by an informal learning agent.
Based on the work of Reeves and Nass, Mayer and others have established that learning
programs that engage the leaner directly by using first and second person language yield
better learning than the same programs that use more formal language. Likewise a number of
studies have shown that adding a learning agent — a character who offers instructional
advice — can also improve learning.
Figure 6. Jim serves as a pedagogical agent. With permission from Plato Learning Systems.
170
APPENDIX C
RETROSPECTIVE INTERVIEW QUESTIONS
1. Please share any thought you have in regards to your experiences with the argument
diagramming task.
2. Did you use any particular strategies to help you construct your argument map?
3. Can you describe the process you used to create your argument diagram? For example, what
was the first action you performed for the task? Why? What was the next action and why?
Describe how you went about identifying the relationships between the nodes.
4. What difficulties did you have while constructing your argument map? How did you solve
the difficulties you have had?
5. Have you read the article ‘Six e-learning principle before? YES NO
6. Please indicate on your argument map which principles you already knew prior to the start of
this argument mapping session. Please circle the nodes using blue pen.
7. Can you tell me which relationships in your diagram were difficult to identify and can you
explain why?
a. How did you identify the relationship between the premises?
b. Did you insert any links between premises by merely guessing their possible
relationships?
8. Were you able to think-aloud while constructing the map? Did you filter out certain thoughts
that you would or would not say? Why?
171
APPENDIX D
IRB APPROVAL MEMO

172
APPENDIX E
PARTICIPANT CONSENT FORM

173
APPENDIX F
INVITATION EMAIL FOR THE SECOND CODER
Dear. Dr. ****
Thank you for accepting my invitation letter that requested you participating in my
research as a second coder. I will provide you 1) coding schemes, 2) Direction for coding and 3)
data files. Please read the direction and let me know if you have any questions. Thank you again.
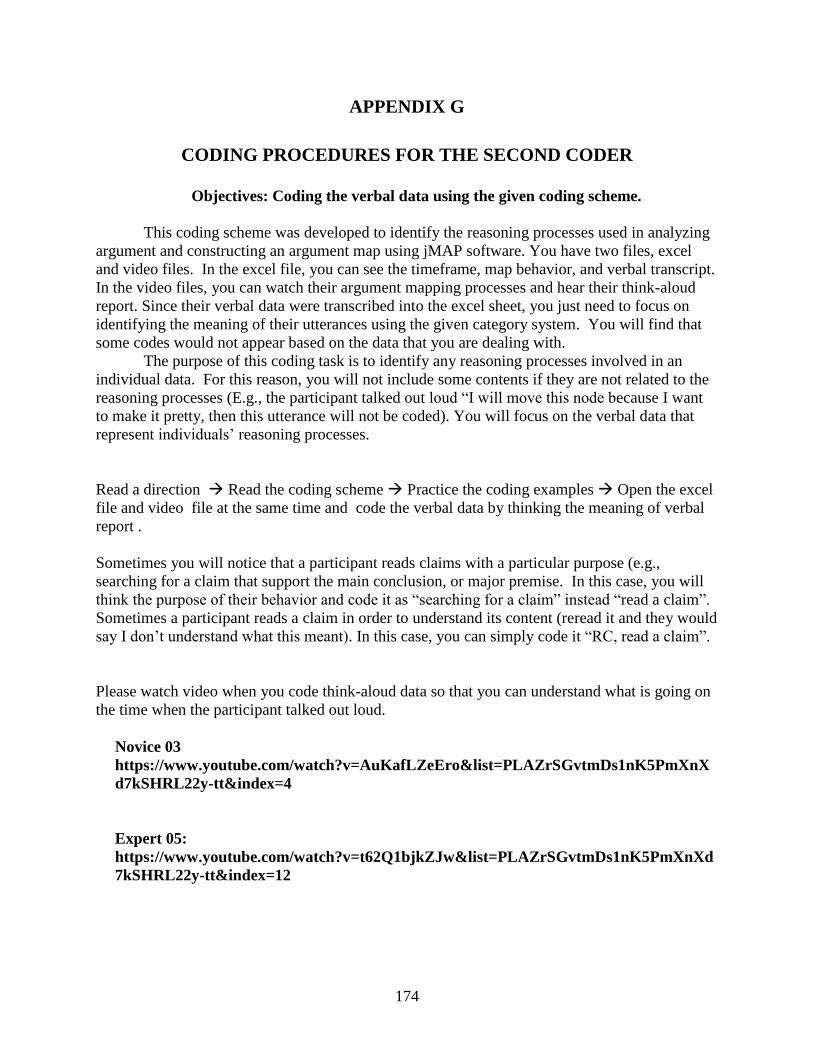
174
APPENDIX G
CODING PROCEDURES FOR THE SECOND CODER
Objectives: Coding the verbal data using the given coding scheme.
This coding scheme was developed to identify the reasoning processes used in analyzing
argument and constructing an argument map using jMAP software. You have two files, excel
and video files. In the excel file, you can see the timeframe, map behavior, and verbal transcript.
In the video files, you can watch their argument mapping processes and hear their think-aloud
report. Since their verbal data were transcribed into the excel sheet, you just need to focus on
identifying the meaning of their utterances using the given category system. You will find that
some codes would not appear based on the data that you are dealing with.
The purpose of this coding task is to identify any reasoning processes involved in an
individual data. For this reason, you will not include some contents if they are not related to the
reasoning processes (E.g., the participant talked out loud “I will move this node because I want
to make it pretty, then this utterance will not be coded). You will focus on the verbal data that
represent individuals’ reasoning processes.
Read a direction Read the coding scheme Practice the coding examples Open the excel
file and video file at the same time and code the verbal data by thinking the meaning of verbal
report .
Sometimes you will notice that a participant reads claims with a particular purpose (e.g.,
searching for a claim that support the main conclusion, or major premise. In this case, you will
think the purpose of their behavior and code it as “searching for a claim” instead “read a claim”.
Sometimes a participant reads a claim in order to understand its content (reread it and they would
say I don’t understand what this meant). In this case, you can simply code it “RC, read a claim”.
Please watch video when you code think-aloud data so that you can understand what is going on
the time when the participant talked out loud.
Novice 03
https://www.youtube.com/watch?v=AuKafLZeEro&list=PLAZrSGvtmDs1nK5PmXnX
d7kSHRL22y-tt&index=4
Expert 05:
https://www.youtube.com/watch?v=t62Q1bjkZJw&list=PLAZrSGvtmDs1nK5PmXnXd
7kSHRL22y-tt&index=12
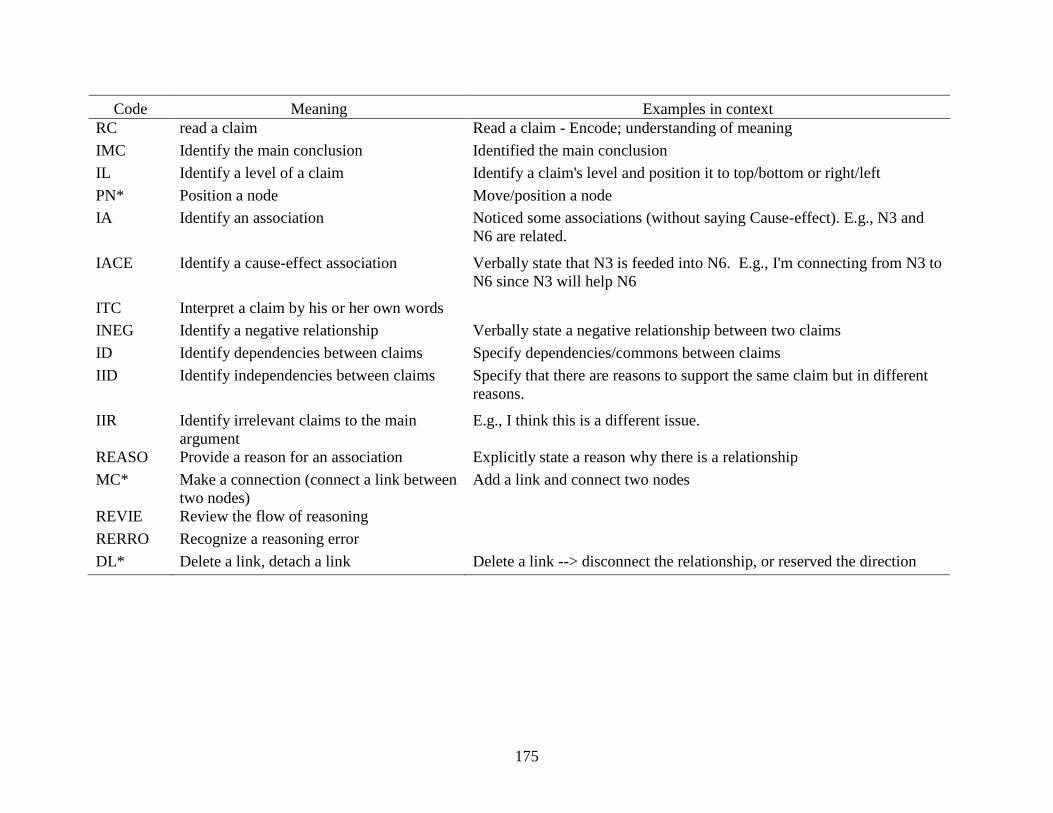
175
Code Meaning Examples in context
RC read a claim Read a claim - Encode; understanding of meaning
IMC Identify the main conclusion Identified the main conclusion
IL Identify a level of a claim Identify a claim's level and position it to top/bottom or right/left
PN* Position a node Move/position a node
IA Identify an association Noticed some associations (without saying Cause-effect). E.g., N3 and
N6 are related.
IACE Identify a cause-effect association Verbally state that N3 is feeded into N6. E.g., I'm connecting from N3 to
N6 since N3 will help N6
ITC Interpret a claim by his or her own words
INEG Identify a negative relationship Verbally state a negative relationship between two claims
ID Identify dependencies between claims Specify dependencies/commons between claims
IID Identify independencies between claims Specify that there are reasons to support the same claim but in different
reasons.
IIR Identify irrelevant claims to the main
argument
E.g., I think this is a different issue.
REASO Provide a reason for an association Explicitly state a reason why there is a relationship
MC* Make a connection (connect a link between
two nodes)
Add a link and connect two nodes
REVIE Review the flow of reasoning
RERRO Recognize a reasoning error
DL* Delete a link, detach a link Delete a link --> disconnect the relationship, or reserved the direction
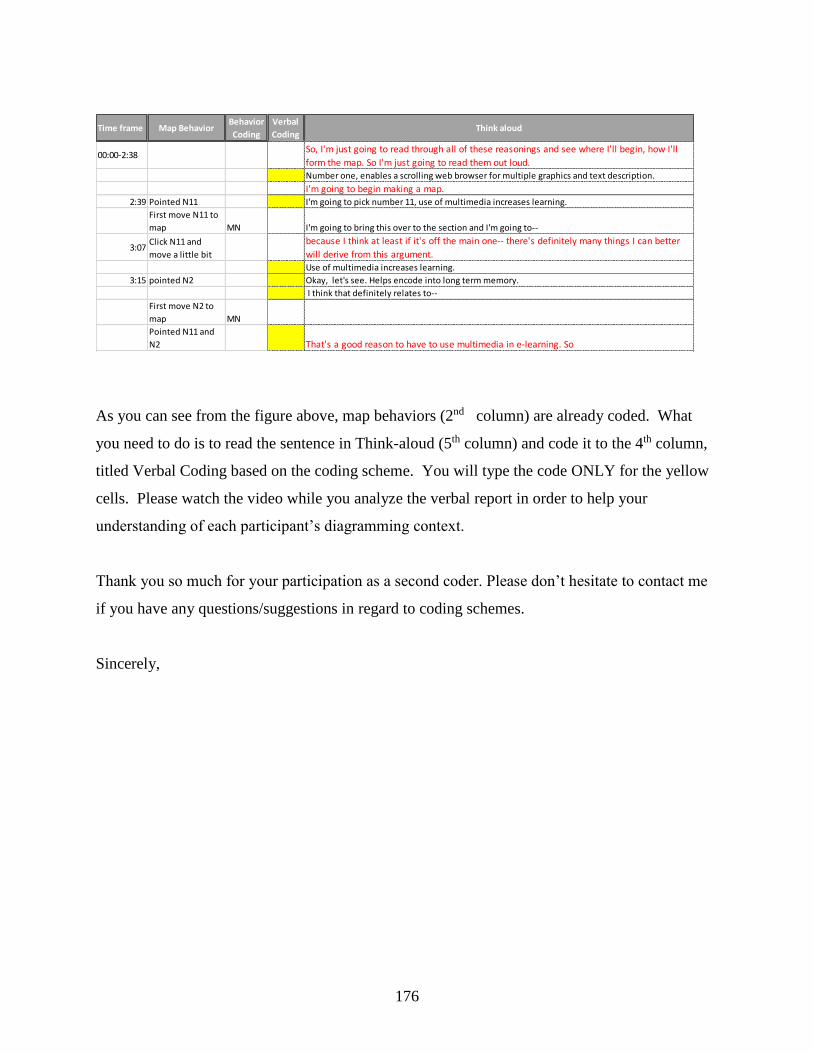
176
As you can see from the figure above, map behaviors (2nd column) are already coded. What
you need to do is to read the sentence in Think-aloud (5th column) and code it to the 4th column,
titled Verbal Coding based on the coding scheme. You will type the code ONLY for the yellow
cells. Please watch the video while you analyze the verbal report in order to help your
understanding of each participant’s diagramming context.
Thank you so much for your participation as a second coder. Please don’t hesitate to contact me
if you have any questions/suggestions in regard to coding schemes.
Sincerely,
Time frame Map BehaviorBehavior
Coding
Verbal
CodingThink aloud
00:00-2:38So, I'm just going to read through all of these reasonings and see where I'll begin, how I'll
form the map. So I'm just going to read them out loud. Number one, enables a scrolling web browser for multiple graphics and text description.
I'm going to begin making a map. 2:39 Pointed N11 I'm going to pick number 11, use of multimedia increases learning.
First move N11 to
map MN I'm going to bring this over to the section and I'm going to--
3:07Click N11 and
move a little bit
because I think at least if it's off the main one-- there's definitely many things I can better
will derive from this argument.
Use of multimedia increases learning.
3:15 pointed N2 Okay, let's see. Helps encode into long term memory.
I think that definitely relates to--
First move N2 to
map MN
Pointed N11 and
N2 That's a good reason to have to use multimedia in e-learning. So
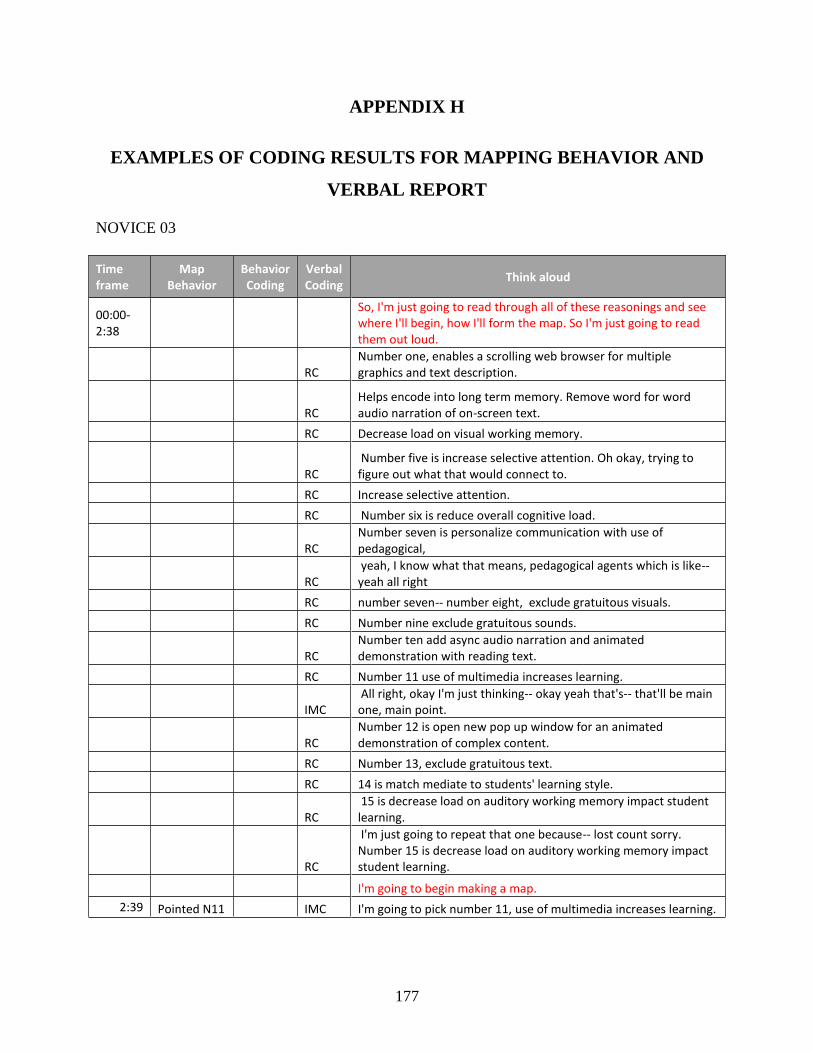
177
APPENDIX H
EXAMPLES OF CODING RESULTS FOR MAPPING BEHAVIOR AND
VERBAL REPORT
NOVICE 03
Time frame
Map Behavior
Behavior Coding
Verbal Coding
Think aloud
00:00-2:38
So, I'm just going to read through all of these reasonings and see where I'll begin, how I'll form the map. So I'm just going to read them out loud.
RC
Number one, enables a scrolling web browser for multiple graphics and text description.
RC
Helps encode into long term memory. Remove word for word audio narration of on-screen text.
RC Decrease load on visual working memory.
RC
Number five is increase selective attention. Oh okay, trying to figure out what that would connect to.
RC Increase selective attention.
RC Number six is reduce overall cognitive load.
RC
Number seven is personalize communication with use of pedagogical,
RC
yeah, I know what that means, pedagogical agents which is like-- yeah all right
RC number seven-- number eight, exclude gratuitous visuals.
RC Number nine exclude gratuitous sounds.
RC
Number ten add async audio narration and animated demonstration with reading text.
RC Number 11 use of multimedia increases learning.
IMC
All right, okay I'm just thinking-- okay yeah that's-- that'll be main one, main point.
RC
Number 12 is open new pop up window for an animated demonstration of complex content.
RC Number 13, exclude gratuitous text.
RC 14 is match mediate to students' learning style.
RC
15 is decrease load on auditory working memory impact student learning.
RC
I'm just going to repeat that one because-- lost count sorry. Number 15 is decrease load on auditory working memory impact student learning.
I'm going to begin making a map.
2:39 Pointed N11 IMC I'm going to pick number 11, use of multimedia increases learning.
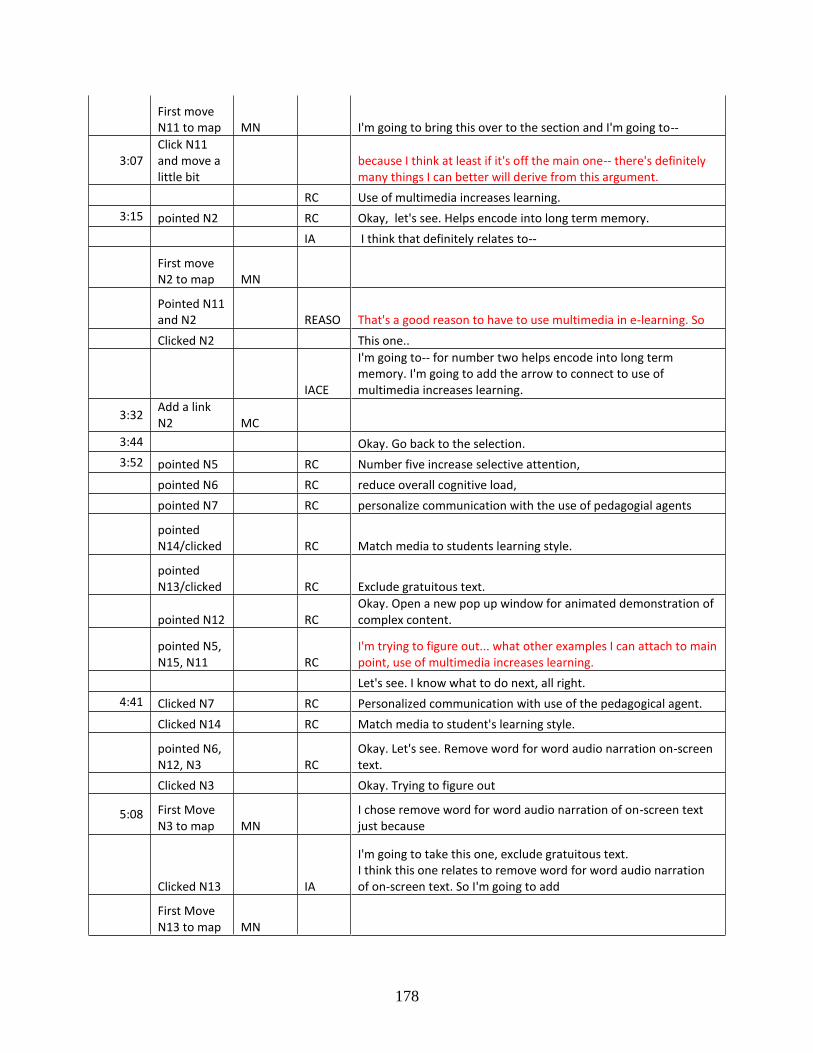
178
First move N11 to map MN I'm going to bring this over to the section and I'm going to--
3:07 Click N11 and move a little bit
because I think at least if it's off the main one-- there's definitely many things I can better will derive from this argument.
RC Use of multimedia increases learning.
3:15 pointed N2 RC Okay, let's see. Helps encode into long term memory.
IA I think that definitely relates to--
First move N2 to map MN
Pointed N11 and N2 REASO That's a good reason to have to use multimedia in e-learning. So
Clicked N2 This one..
IACE
I'm going to-- for number two helps encode into long term memory. I'm going to add the arrow to connect to use of multimedia increases learning.
3:32 Add a link N2 MC
3:44 Okay. Go back to the selection.
3:52 pointed N5 RC Number five increase selective attention,
pointed N6 RC reduce overall cognitive load,
pointed N7 RC personalize communication with the use of pedagogial agents
pointed N14/clicked RC Match media to students learning style.
pointed N13/clicked RC Exclude gratuitous text.
pointed N12 RC
Okay. Open a new pop up window for animated demonstration of complex content.
pointed N5, N15, N11 RC
I'm trying to figure out... what other examples I can attach to main point, use of multimedia increases learning.
Let's see. I know what to do next, all right.
4:41 Clicked N7 RC Personalized communication with use of the pedagogical agent.
Clicked N14 RC Match media to student's learning style.
pointed N6, N12, N3 RC
Okay. Let's see. Remove word for word audio narration on-screen text.
Clicked N3 Okay. Trying to figure out
5:08 First Move N3 to map
MN
I chose remove word for word audio narration of on-screen text just because
Clicked N13 IA
I'm going to take this one, exclude gratuitous text. I think this one relates to remove word for word audio narration of on-screen text. So I'm going to add
First Move N13 to map MN
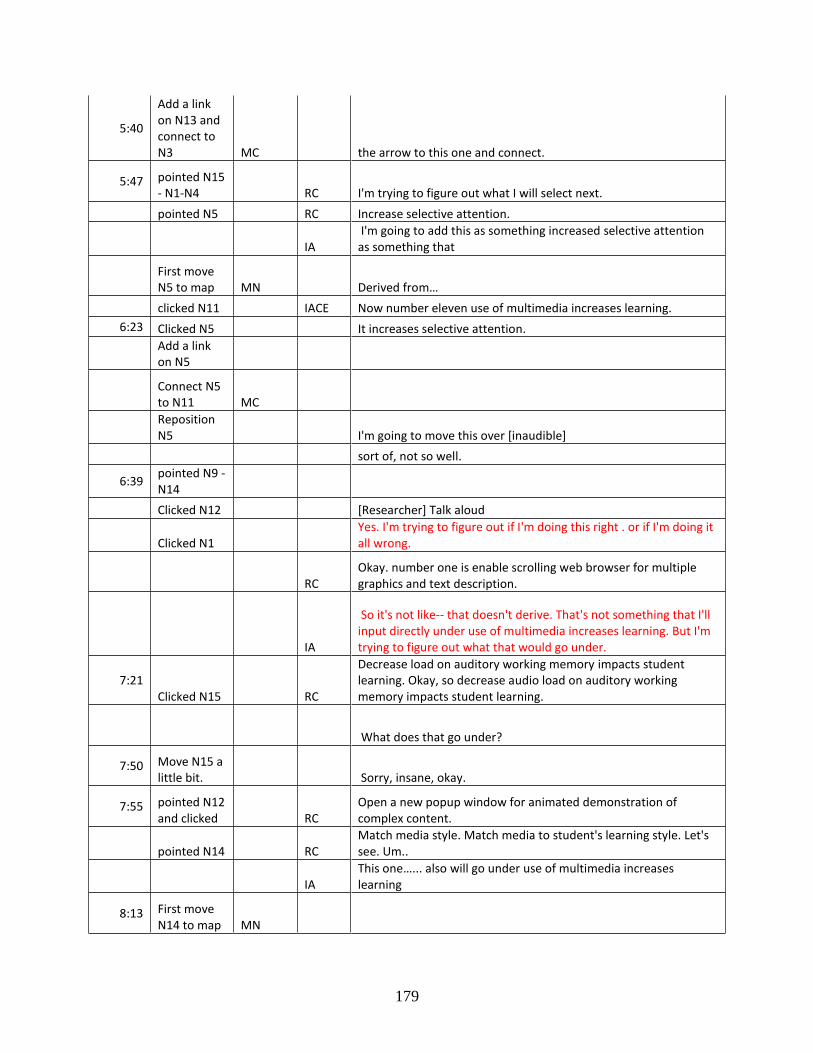
179
5:40
Add a link on N13 and connect to N3 MC the arrow to this one and connect.
5:47 pointed N15 - N1-N4 RC I'm trying to figure out what I will select next.
pointed N5 RC Increase selective attention.
IA
I'm going to add this as something increased selective attention as something that
First move N5 to map MN Derived from…
clicked N11 IACE Now number eleven use of multimedia increases learning.
6:23 Clicked N5 It increases selective attention.
Add a link on N5
Connect N5 to N11 MC
Reposition N5 I'm going to move this over [inaudible]
sort of, not so well.
6:39 pointed N9 -N14
Clicked N12 [Researcher] Talk aloud
Clicked N1
Yes. I'm trying to figure out if I'm doing this right . or if I'm doing it all wrong.
RC
Okay. number one is enable scrolling web browser for multiple graphics and text description.
IA
So it's not like-- that doesn't derive. That's not something that I'll input directly under use of multimedia increases learning. But I'm trying to figure out what that would go under.
7:21 Clicked N15 RC
Decrease load on auditory working memory impacts student learning. Okay, so decrease audio load on auditory working memory impacts student learning.
What does that go under?
7:50 Move N15 a little bit. Sorry, insane, okay.
7:55 pointed N12 and clicked RC
Open a new popup window for animated demonstration of complex content.
pointed N14 RC
Match media style. Match media to student's learning style. Let's see. Um..
IA
This one…... also will go under use of multimedia increases learning
8:13 First move N14 to map MN
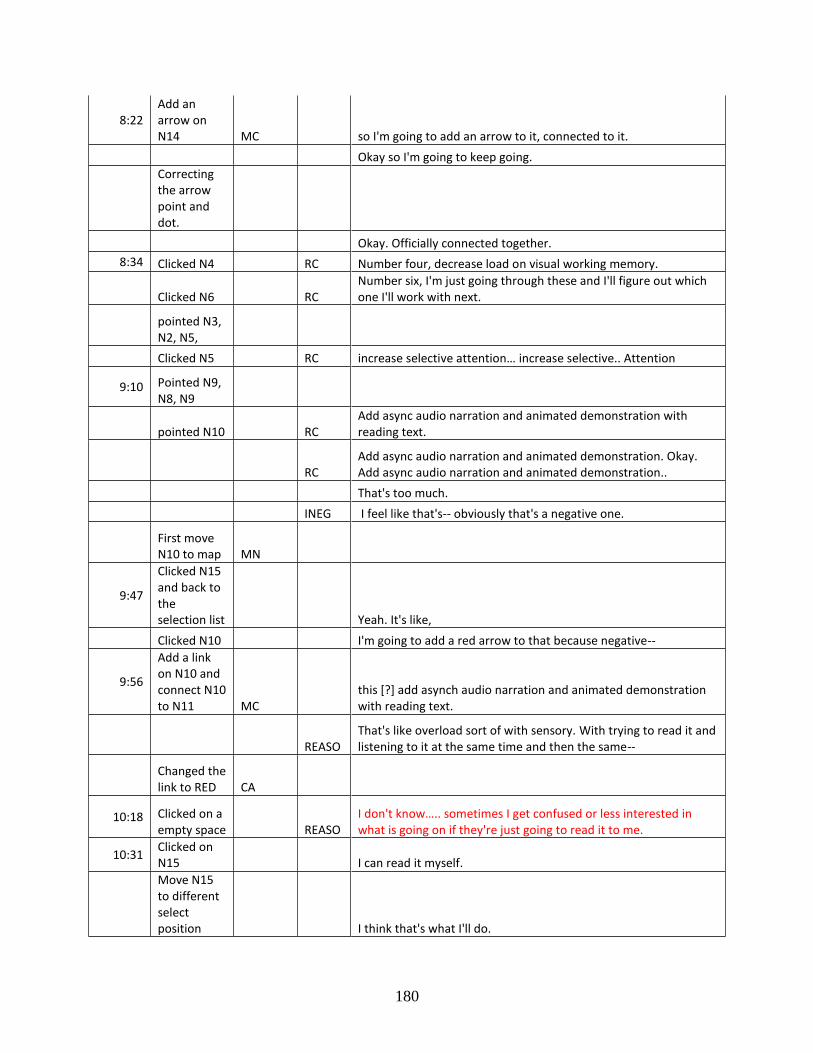
180
8:22 Add an arrow on N14 MC so I'm going to add an arrow to it, connected to it.
Okay so I'm going to keep going.
Correcting the arrow point and dot.
Okay. Officially connected together.
8:34 Clicked N4 RC Number four, decrease load on visual working memory.
Clicked N6 RC
Number six, I'm just going through these and I'll figure out which one I'll work with next.
pointed N3, N2, N5,
Clicked N5 RC increase selective attention… increase selective.. Attention
9:10 Pointed N9, N8, N9
pointed N10 RC
Add async audio narration and animated demonstration with reading text.
RC
Add async audio narration and animated demonstration. Okay. Add async audio narration and animated demonstration..
That's too much.
INEG I feel like that's-- obviously that's a negative one.
First move N10 to map MN
9:47
Clicked N15 and back to the selection list Yeah. It's like,
Clicked N10 I'm going to add a red arrow to that because negative--
9:56
Add a link on N10 and connect N10 to N11 MC
this [?] add asynch audio narration and animated demonstration with reading text.
REASO
That's like overload sort of with sensory. With trying to read it and listening to it at the same time and then the same--
Changed the link to RED CA
10:18 Clicked on a empty space REASO
I don't know….. sometimes I get confused or less interested in what is going on if they're just going to read it to me.
10:31 Clicked on N15 I can read it myself.
Move N15 to different select position I think that's what I'll do.
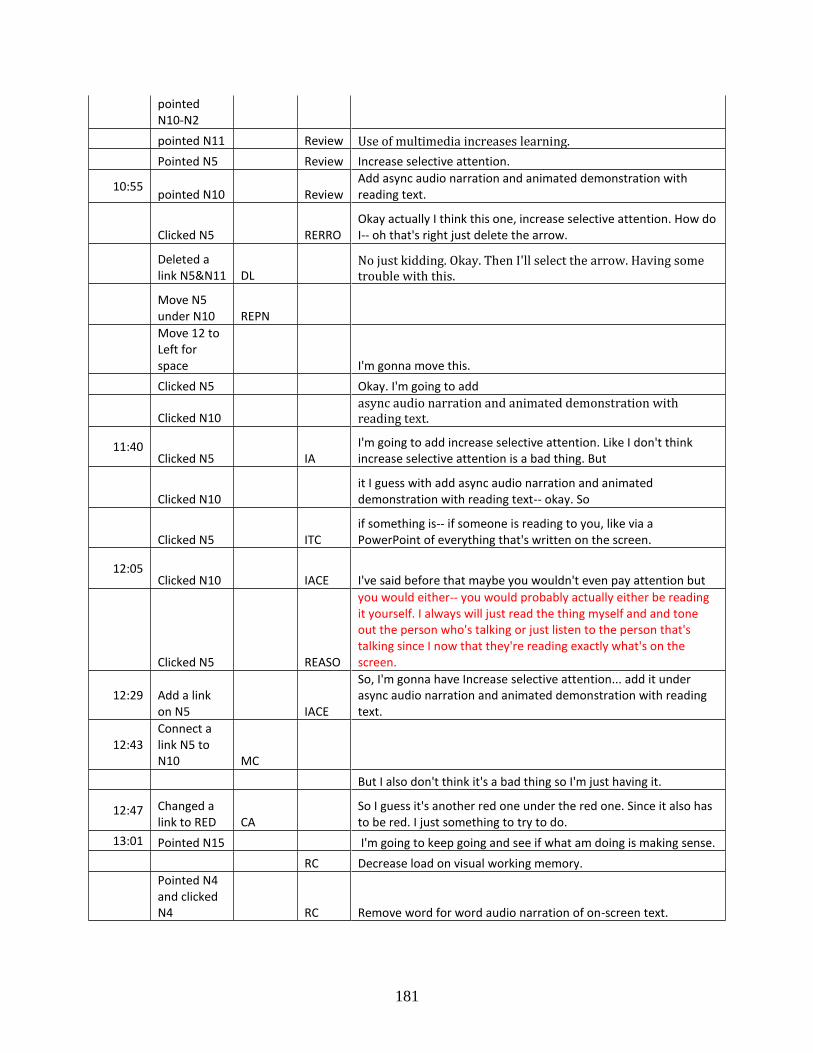
181
pointed N10-N2
pointed N11 Review Use of multimedia increases learning.
Pointed N5 Review Increase selective attention.
10:55 pointed N10 Review
Add async audio narration and animated demonstration with reading text.
Clicked N5 RERRO
Okay actually I think this one, increase selective attention. How do I-- oh that's right just delete the arrow.
Deleted a link N5&N11 DL
No just kidding. Okay. Then I'll select the arrow. Having some trouble with this.
Move N5 under N10 REPN
Move 12 to Left for space I'm gonna move this.
Clicked N5 Okay. I'm going to add
Clicked N10
async audio narration and animated demonstration with reading text.
11:40 Clicked N5 IA
I'm going to add increase selective attention. Like I don't think increase selective attention is a bad thing. But
Clicked N10
it I guess with add async audio narration and animated demonstration with reading text-- okay. So
Clicked N5 ITC
if something is-- if someone is reading to you, like via a PowerPoint of everything that's written on the screen.
12:05 Clicked N10 IACE I've said before that maybe you wouldn't even pay attention but
Clicked N5 REASO
you would either-- you would probably actually either be reading it yourself. I always will just read the thing myself and and tone out the person who's talking or just listen to the person that's talking since I now that they're reading exactly what's on the screen.
12:29 Add a link on N5 IACE
So, I'm gonna have Increase selective attention... add it under async audio narration and animated demonstration with reading text.
12:43 Connect a link N5 to N10 MC
But I also don't think it's a bad thing so I'm just having it.
12:47 Changed a link to RED CA
So I guess it's another red one under the red one. Since it also has to be red. I just something to try to do.
13:01 Pointed N15 I'm going to keep going and see if what am doing is making sense.
RC Decrease load on visual working memory.
Pointed N4 and clicked N4 RC
Remove word for word audio narration of on-screen text.
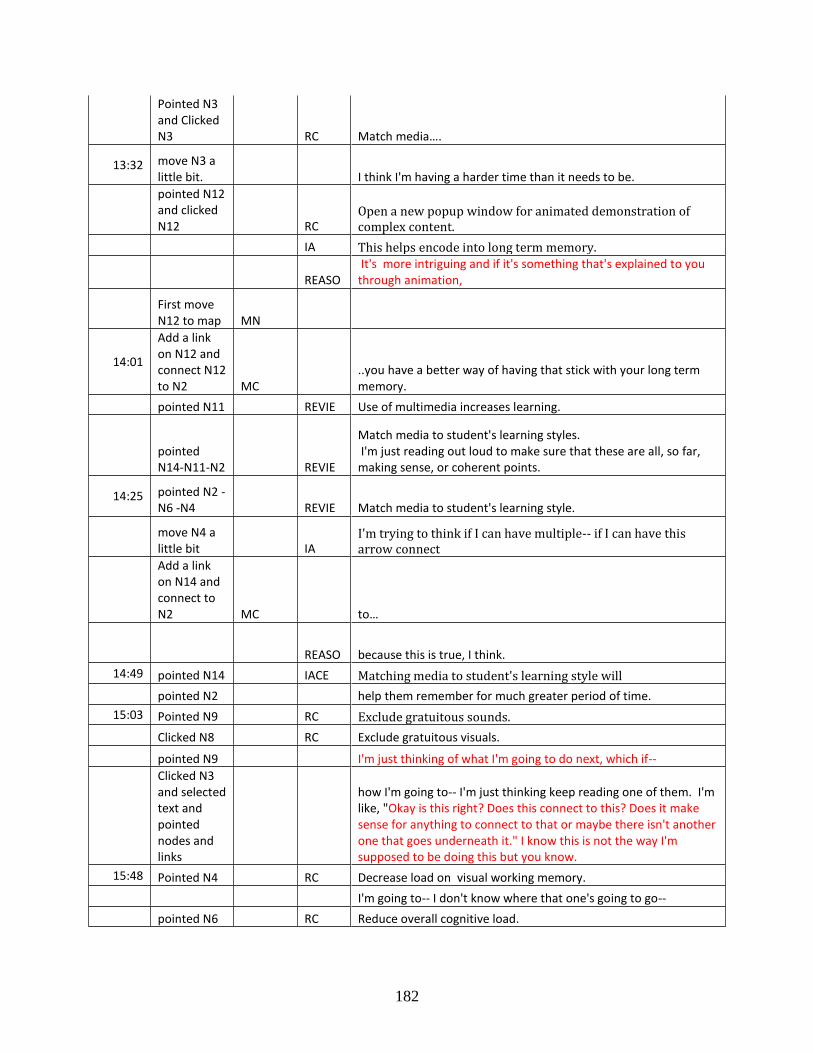
182
Pointed N3 and Clicked N3 RC Match media….
13:32 move N3 a little bit. I think I'm having a harder time than it needs to be.
pointed N12 and clicked N12 RC
Open a new popup window for animated demonstration of complex content.
IA This helps encode into long term memory.
REASO
It's more intriguing and if it's something that's explained to you through animation,
First move N12 to map MN
14:01
Add a link on N12 and connect N12 to N2 MC
..you have a better way of having that stick with your long term memory.
pointed N11 REVIE Use of multimedia increases learning.
pointed N14-N11-N2 REVIE
Match media to student's learning styles. I'm just reading out loud to make sure that these are all, so far, making sense, or coherent points.
14:25 pointed N2 - N6 -N4 REVIE Match media to student's learning style.
move N4 a little bit IA
I'm trying to think if I can have multiple-- if I can have this arrow connect
Add a link on N14 and connect to N2 MC to…
REASO because this is true, I think.
14:49 pointed N14 IACE Matching media to student's learning style will
pointed N2 help them remember for much greater period of time.
15:03 Pointed N9 RC Exclude gratuitous sounds.
Clicked N8 RC Exclude gratuitous visuals.
pointed N9 I'm just thinking of what I'm going to do next, which if--
Clicked N3 and selected text and pointed nodes and links
how I'm going to-- I'm just thinking keep reading one of them. I'm like, "Okay is this right? Does this connect to this? Does it make sense for anything to connect to that or maybe there isn't another one that goes underneath it." I know this is not the way I'm supposed to be doing this but you know.
15:48 Pointed N4 RC Decrease load on visual working memory.
I'm going to-- I don't know where that one's going to go--
pointed N6 RC Reduce overall cognitive load.
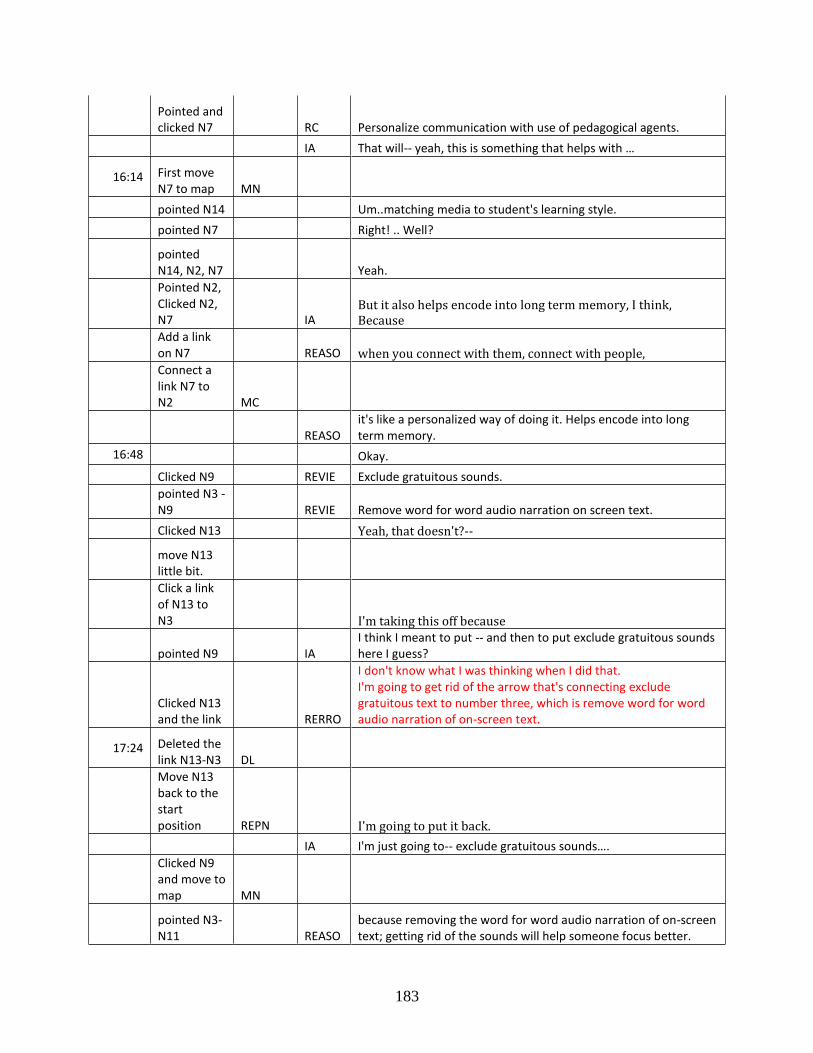
183
Pointed and clicked N7 RC Personalize communication with use of pedagogical agents.
IA That will-- yeah, this is something that helps with …
16:14 First move N7 to map MN
pointed N14 Um..matching media to student's learning style.
pointed N7 Right! .. Well?
pointed N14, N2, N7 Yeah.
Pointed N2, Clicked N2, N7 IA
But it also helps encode into long term memory, I think, Because
Add a link on N7 REASO when you connect with them, connect with people,
Connect a link N7 to N2 MC
REASO
it's like a personalized way of doing it. Helps encode into long term memory.
16:48 Okay.
Clicked N9 REVIE Exclude gratuitous sounds.
pointed N3 - N9 REVIE Remove word for word audio narration on screen text.
Clicked N13 Yeah, that doesn't?--
move N13 little bit.
Click a link of N13 to N3 I'm taking this off because
pointed N9 IA
I think I meant to put -- and then to put exclude gratuitous sounds here I guess?
Clicked N13 and the link RERRO
I don't know what I was thinking when I did that. I'm going to get rid of the arrow that's connecting exclude gratuitous text to number three, which is remove word for word audio narration of on-screen text.
17:24 Deleted the link N13-N3 DL
Move N13 back to the start position REPN I'm going to put it back.
IA I'm just going to-- exclude gratuitous sounds….
Clicked N9 and move to map MN
pointed N3-N11 REASO
because removing the word for word audio narration of on-screen text; getting rid of the sounds will help someone focus better.
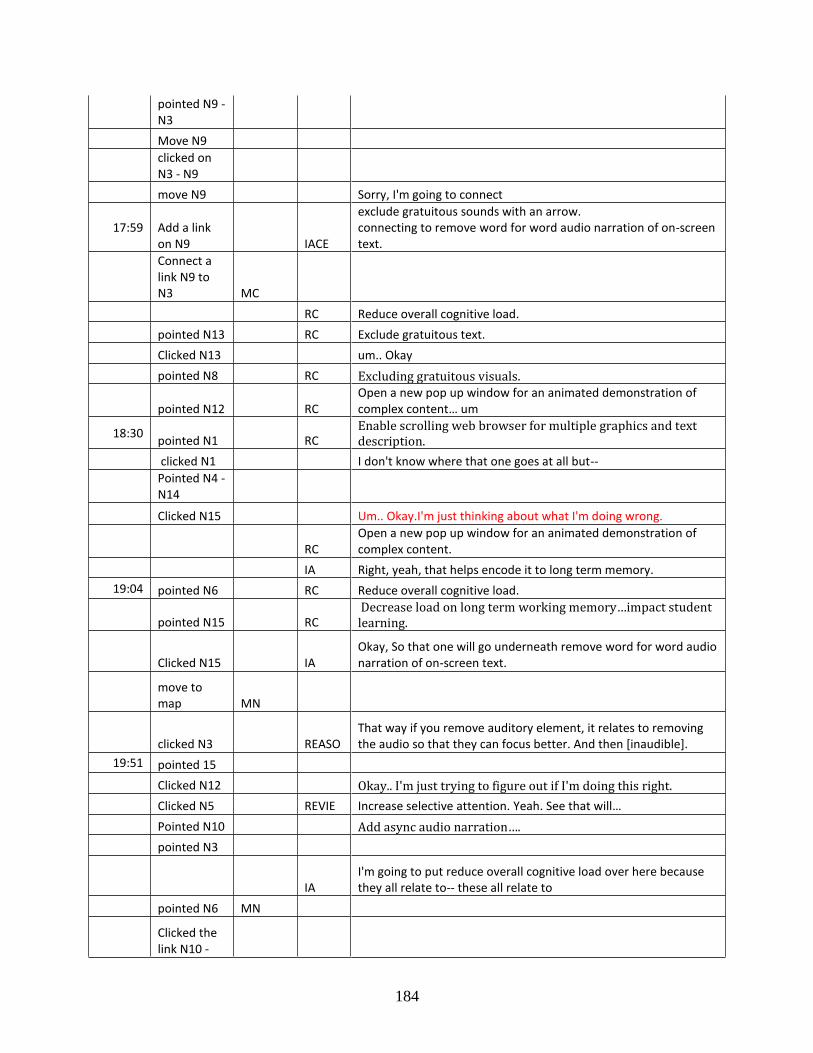
184
pointed N9 - N3
Move N9
clicked on N3 - N9
move N9 Sorry, I'm going to connect
17:59 Add a link on N9 IACE
exclude gratuitous sounds with an arrow. connecting to remove word for word audio narration of on-screen text.
Connect a link N9 to N3 MC
RC Reduce overall cognitive load.
pointed N13 RC Exclude gratuitous text.
Clicked N13 um.. Okay
pointed N8 RC Excluding gratuitous visuals.
pointed N12 RC
Open a new pop up window for an animated demonstration of complex content… um
18:30 pointed N1 RC
Enable scrolling web browser for multiple graphics and text description.
clicked N1 I don't know where that one goes at all but--
Pointed N4 - N14
Clicked N15 Um.. Okay.I'm just thinking about what I'm doing wrong.
RC
Open a new pop up window for an animated demonstration of complex content.
IA Right, yeah, that helps encode it to long term memory.
19:04 pointed N6 RC Reduce overall cognitive load.
pointed N15 RC
Decrease load on long term working memory…impact student learning.
Clicked N15 IA
Okay, So that one will go underneath remove word for word audio narration of on-screen text.
move to map MN
clicked N3 REASO
That way if you remove auditory element, it relates to removing the audio so that they can focus better. And then [inaudible].
19:51 pointed 15
Clicked N12 Okay.. I'm just trying to figure out if I'm doing this right.
Clicked N5 REVIE Increase selective attention. Yeah. See that will…
Pointed N10 Add async audio narration….
pointed N3
IA
I'm going to put reduce overall cognitive load over here because they all relate to-- these all relate to
pointed N6 MN
Clicked the link N10 -
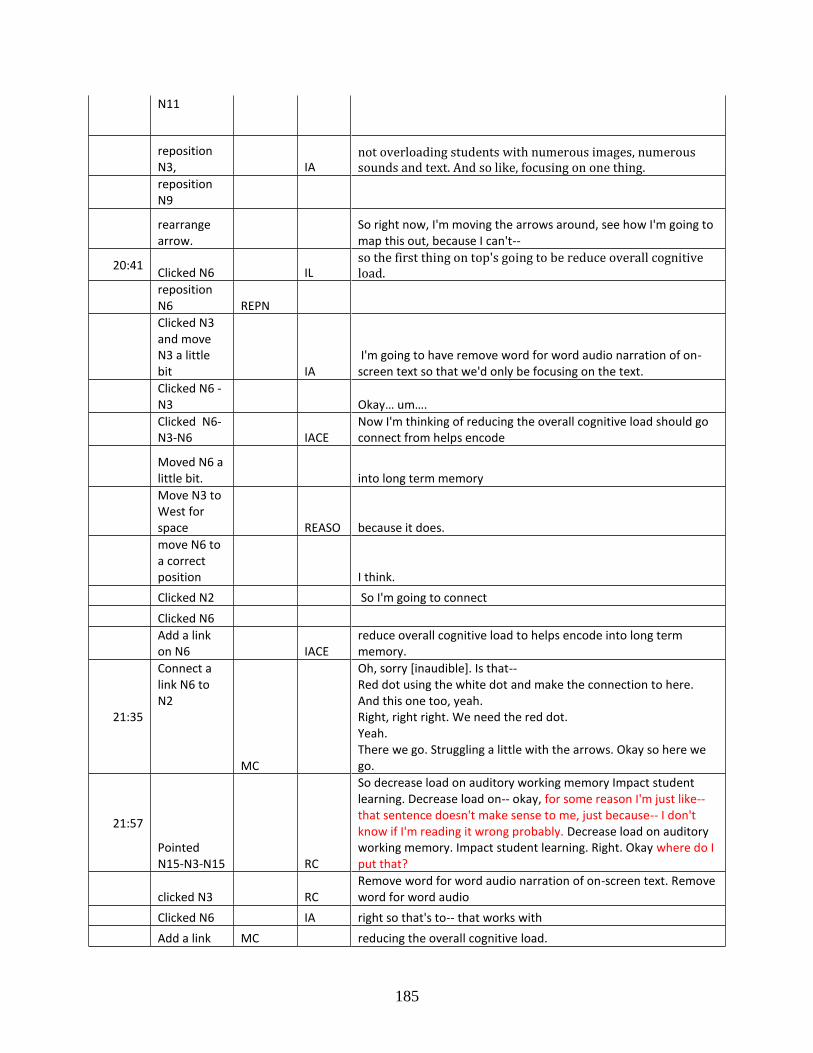
185
N11
reposition N3, IA
not overloading students with numerous images, numerous sounds and text. And so like, focusing on one thing.
reposition N9
rearrange arrow.
So right now, I'm moving the arrows around, see how I'm going to map this out, because I can't--
20:41 Clicked N6 IL
so the first thing on top's going to be reduce overall cognitive load.
reposition N6 REPN
Clicked N3 and move N3 a little bit IA
I'm going to have remove word for word audio narration of on-screen text so that we'd only be focusing on the text.
Clicked N6 - N3 Okay… um….
Clicked N6-N3-N6 IACE
Now I'm thinking of reducing the overall cognitive load should go connect from helps encode
Moved N6 a little bit. into long term memory
Move N3 to West for space REASO because it does.
move N6 to a correct position I think.
Clicked N2 So I'm going to connect
Clicked N6
Add a link on N6 IACE
reduce overall cognitive load to helps encode into long term memory.
21:35
Connect a link N6 to N2
MC
Oh, sorry [inaudible]. Is that-- Red dot using the white dot and make the connection to here. And this one too, yeah. Right, right right. We need the red dot. Yeah. There we go. Struggling a little with the arrows. Okay so here we go.
21:57
Pointed N15-N3-N15 RC
So decrease load on auditory working memory Impact student learning. Decrease load on-- okay, for some reason I'm just like-- that sentence doesn't make sense to me, just because-- I don't know if I'm reading it wrong probably. Decrease load on auditory working memory. Impact student learning. Right. Okay where do I put that?
clicked N3 RC
Remove word for word audio narration of on-screen text. Remove word for word audio
Clicked N6 IA right so that's to-- that works with
Add a link MC reducing the overall cognitive load.
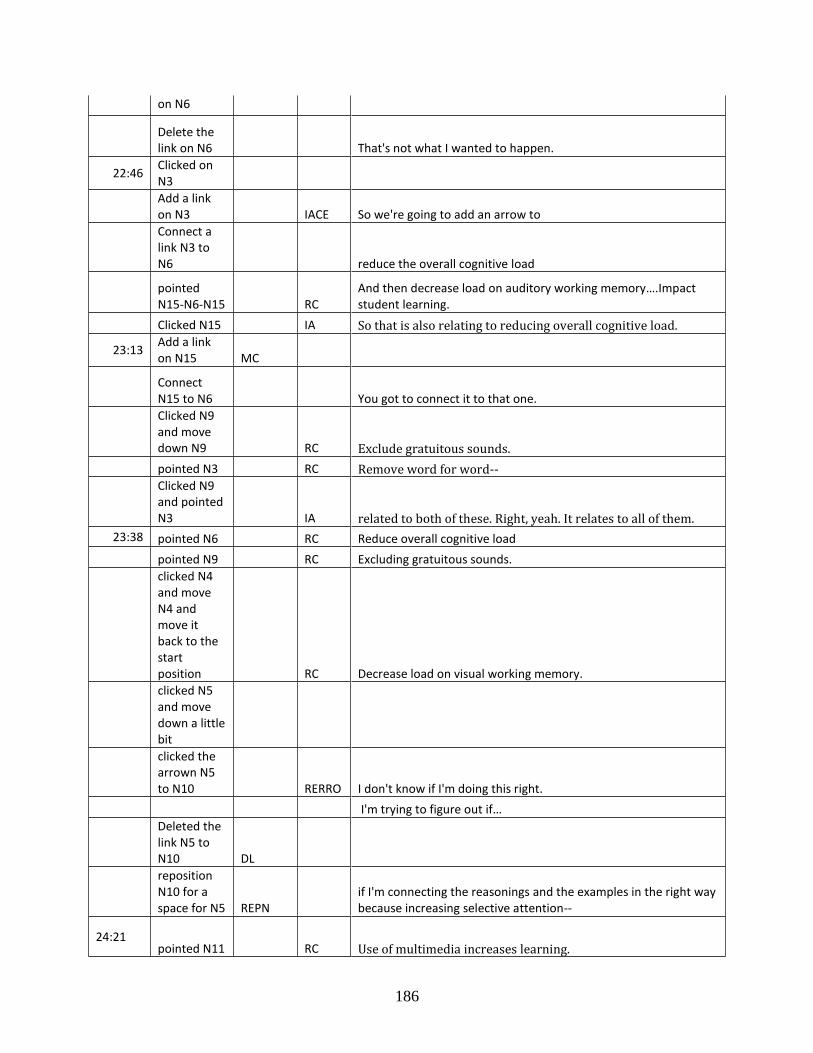
186
on N6
Delete the link on N6 That's not what I wanted to happen.
22:46 Clicked on N3
Add a link on N3 IACE So we're going to add an arrow to
Connect a link N3 to N6 reduce the overall cognitive load
pointed N15-N6-N15 RC
And then decrease load on auditory working memory….Impact student learning.
Clicked N15 IA So that is also relating to reducing overall cognitive load.
23:13 Add a link on N15 MC
Connect N15 to N6 You got to connect it to that one.
Clicked N9 and move down N9 RC Exclude gratuitous sounds.
pointed N3 RC Remove word for word--
Clicked N9 and pointed N3 IA related to both of these. Right, yeah. It relates to all of them.
23:38 pointed N6 RC Reduce overall cognitive load
pointed N9 RC Excluding gratuitous sounds.
clicked N4 and move N4 and move it back to the start position RC Decrease load on visual working memory.
clicked N5 and move down a little bit
clicked the arrown N5 to N10 RERRO I don't know if I'm doing this right.
I'm trying to figure out if…
Deleted the link N5 to N10 DL
reposition N10 for a space for N5 REPN
if I'm connecting the reasonings and the examples in the right way because increasing selective attention--
24:21 pointed N11 RC Use of multimedia increases learning.
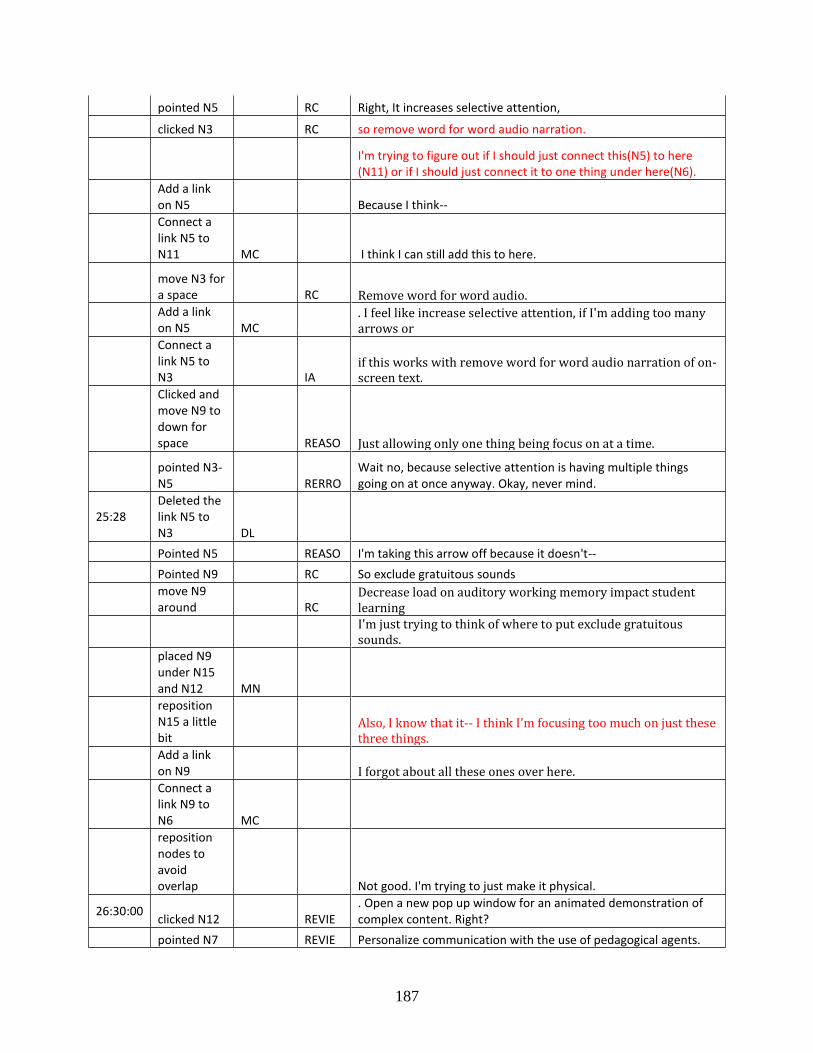
187
pointed N5 RC Right, It increases selective attention,
clicked N3 RC so remove word for word audio narration.
I'm trying to figure out if I should just connect this(N5) to here (N11) or if I should just connect it to one thing under here(N6).
Add a link on N5 Because I think--
Connect a link N5 to N11 MC I think I can still add this to here.
move N3 for a space RC Remove word for word audio.
Add a link on N5 MC
. I feel like increase selective attention, if I'm adding too many arrows or
Connect a link N5 to N3 IA
if this works with remove word for word audio narration of on-screen text.
Clicked and move N9 to down for space REASO Just allowing only one thing being focus on at a time.
pointed N3-N5 RERRO
Wait no, because selective attention is having multiple things going on at once anyway. Okay, never mind.
25:28 Deleted the link N5 to N3 DL
Pointed N5 REASO I'm taking this arrow off because it doesn't--
Pointed N9 RC So exclude gratuitous sounds
move N9 around RC
Decrease load on auditory working memory impact student learning
I'm just trying to think of where to put exclude gratuitous sounds.
placed N9 under N15 and N12 MN
reposition N15 a little bit
Also, I know that it-- I think I'm focusing too much on just these three things.
Add a link on N9 I forgot about all these ones over here.
Connect a link N9 to N6 MC
reposition nodes to avoid overlap Not good. I'm trying to just make it physical.
26:30:00 clicked N12 REVIE
. Open a new pop up window for an animated demonstration of complex content. Right?
pointed N7 REVIE Personalize communication with the use of pedagogical agents.
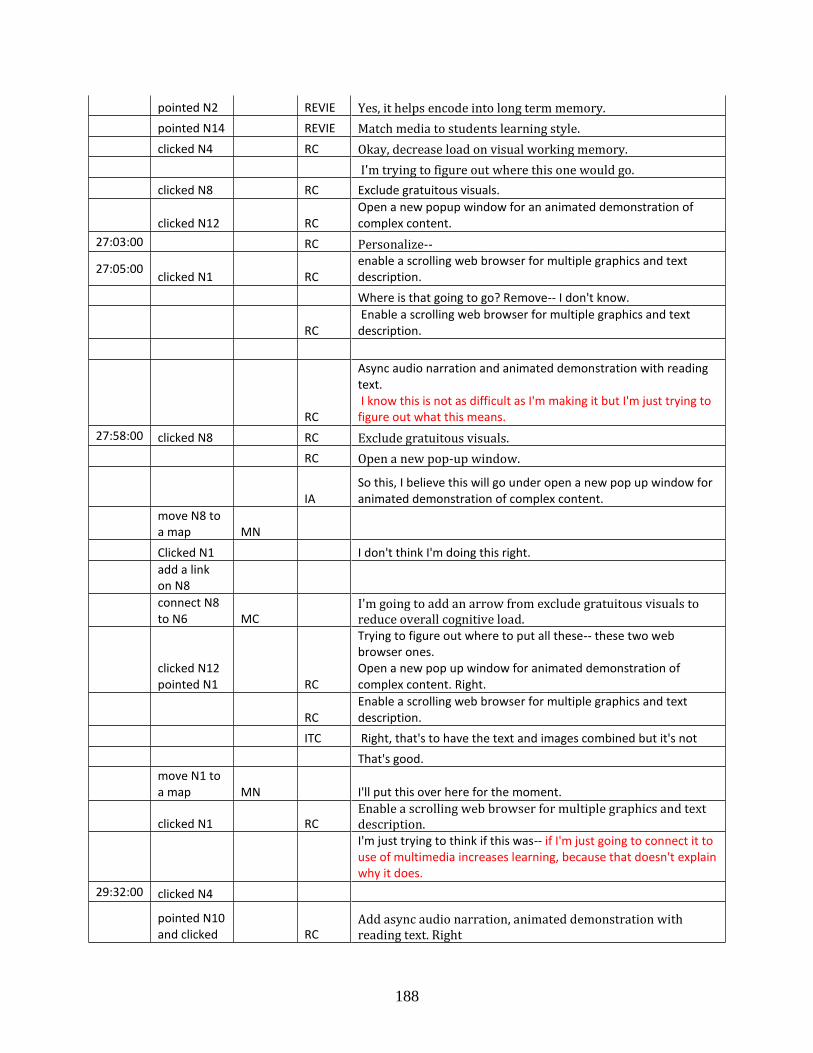
188
pointed N2 REVIE Yes, it helps encode into long term memory.
pointed N14 REVIE Match media to students learning style.
clicked N4 RC Okay, decrease load on visual working memory.
I'm trying to figure out where this one would go.
clicked N8 RC Exclude gratuitous visuals.
clicked N12 RC
Open a new popup window for an animated demonstration of complex content.
27:03:00 RC Personalize--
27:05:00 clicked N1 RC
enable a scrolling web browser for multiple graphics and text description.
Where is that going to go? Remove-- I don't know.
RC
Enable a scrolling web browser for multiple graphics and text description.
RC
Async audio narration and animated demonstration with reading text. I know this is not as difficult as I'm making it but I'm just trying to figure out what this means.
27:58:00 clicked N8 RC Exclude gratuitous visuals.
RC Open a new pop-up window.
IA
So this, I believe this will go under open a new pop up window for animated demonstration of complex content.
move N8 to a map MN
Clicked N1 I don't think I'm doing this right.
add a link on N8
connect N8 to N6 MC
I'm going to add an arrow from exclude gratuitous visuals to reduce overall cognitive load.
clicked N12 pointed N1 RC
Trying to figure out where to put all these-- these two web browser ones. Open a new pop up window for animated demonstration of complex content. Right.
RC
Enable a scrolling web browser for multiple graphics and text description.
ITC Right, that's to have the text and images combined but it's not
That's good.
move N1 to a map MN I'll put this over here for the moment.
clicked N1 RC
Enable a scrolling web browser for multiple graphics and text description.
I'm just trying to think if this was-- if I'm just going to connect it to use of multimedia increases learning, because that doesn't explain why it does.
29:32:00 clicked N4
pointed N10 and clicked RC
Add async audio narration, animated demonstration with reading text. Right
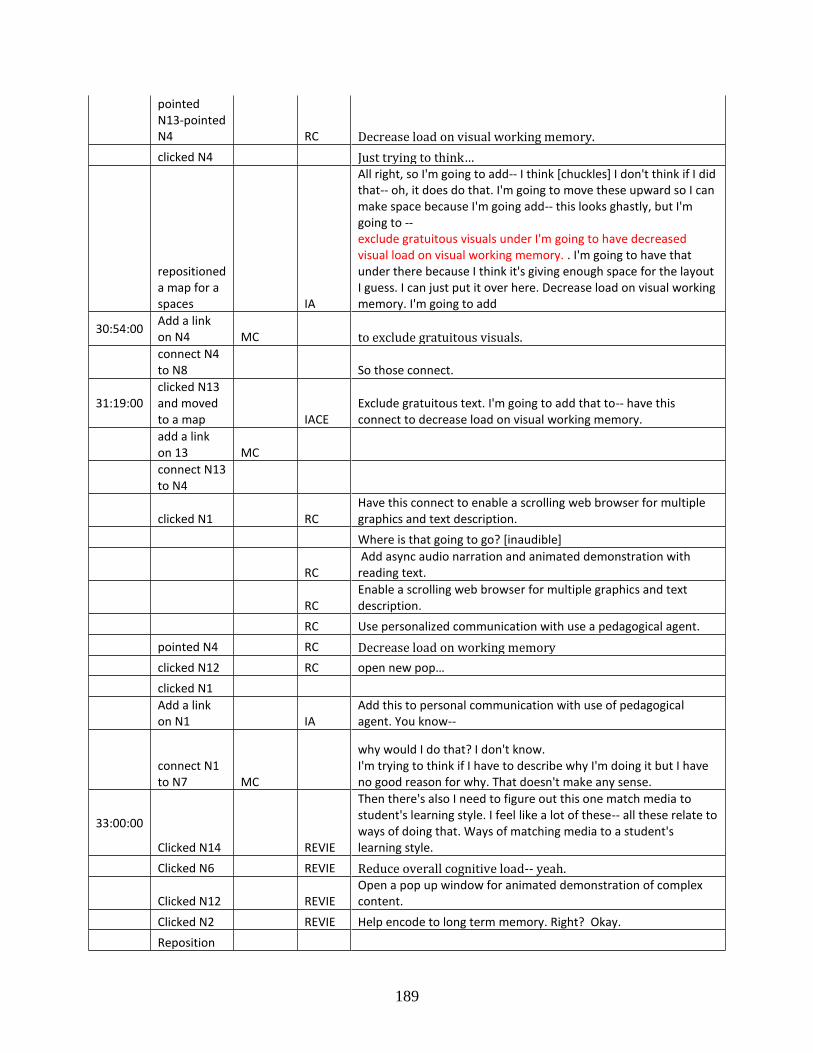
189
pointed N13-pointed N4 RC Decrease load on visual working memory.
clicked N4 Just trying to think…
repositioned a map for a spaces IA
All right, so I'm going to add-- I think [chuckles] I don't think if I did that-- oh, it does do that. I'm going to move these upward so I can make space because I'm going add-- this looks ghastly, but I'm going to -- exclude gratuitous visuals under I'm going to have decreased visual load on visual working memory. . I'm going to have that under there because I think it's giving enough space for the layout I guess. I can just put it over here. Decrease load on visual working memory. I'm going to add
30:54:00 Add a link on N4 MC to exclude gratuitous visuals.
connect N4 to N8 So those connect.
31:19:00 clicked N13 and moved to a map IACE
Exclude gratuitous text. I'm going to add that to-- have this connect to decrease load on visual working memory.
add a link on 13 MC
connect N13 to N4
clicked N1 RC
Have this connect to enable a scrolling web browser for multiple graphics and text description.
Where is that going to go? [inaudible]
RC
Add async audio narration and animated demonstration with reading text.
RC
Enable a scrolling web browser for multiple graphics and text description.
RC Use personalized communication with use a pedagogical agent.
pointed N4 RC Decrease load on working memory
clicked N12 RC open new pop…
clicked N1
Add a link on N1 IA
Add this to personal communication with use of pedagogical agent. You know--
connect N1 to N7 MC
why would I do that? I don't know. I'm trying to think if I have to describe why I'm doing it but I have no good reason for why. That doesn't make any sense.
33:00:00
Clicked N14 REVIE
Then there's also I need to figure out this one match media to student's learning style. I feel like a lot of these-- all these relate to ways of doing that. Ways of matching media to a student's learning style.
Clicked N6 REVIE Reduce overall cognitive load-- yeah.
Clicked N12 REVIE
Open a pop up window for animated demonstration of complex content.
Clicked N2 REVIE Help encode to long term memory. Right? Okay.
Reposition
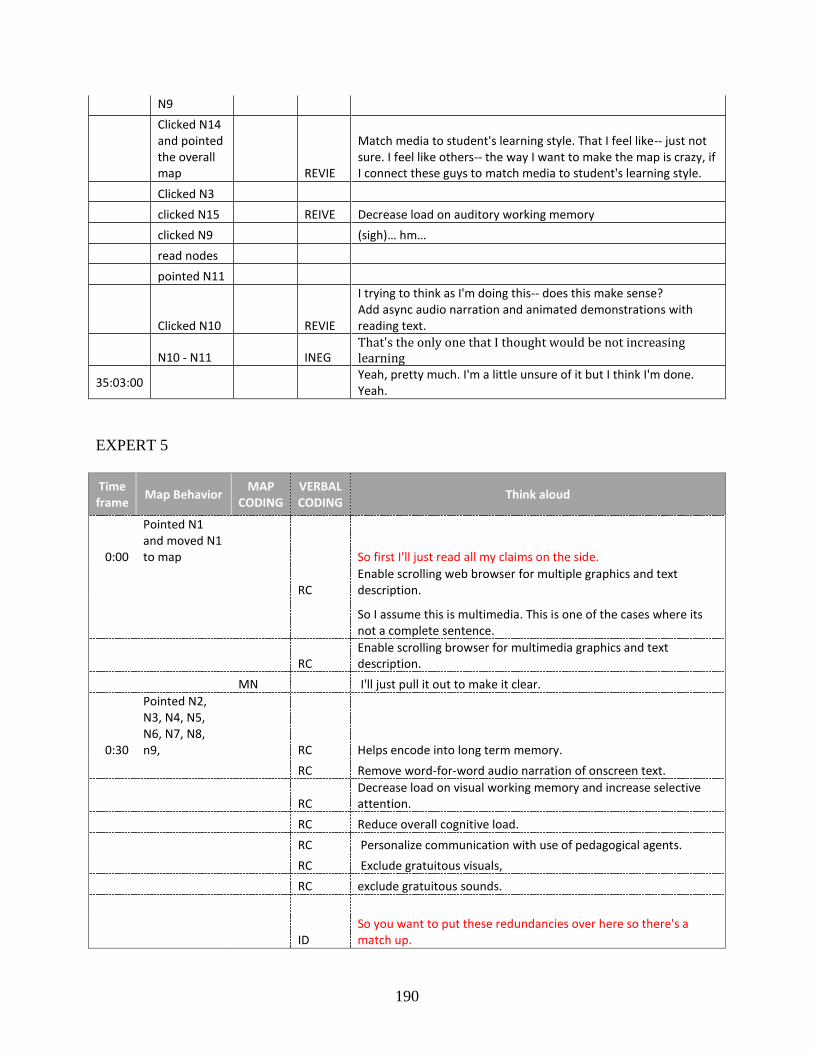
190
N9
Clicked N14 and pointed the overall map REVIE
Match media to student's learning style. That I feel like-- just not sure. I feel like others-- the way I want to make the map is crazy, if I connect these guys to match media to student's learning style.
Clicked N3
clicked N15 REIVE Decrease load on auditory working memory
clicked N9 (sigh)… hm…
read nodes
pointed N11
Clicked N10 REVIE
I trying to think as I'm doing this-- does this make sense? Add async audio narration and animated demonstrations with reading text.
N10 - N11 INEG
That's the only one that I thought would be not increasing learning
35:03:00
Yeah, pretty much. I'm a little unsure of it but I think I'm done. Yeah.
EXPERT 5
Time frame
Map Behavior MAP
CODING VERBAL CODING
Think aloud
0:00
Pointed N1 and moved N1 to map So first I'll just read all my claims on the side.
RC Enable scrolling web browser for multiple graphics and text description.
So I assume this is multimedia. This is one of the cases where its not a complete sentence.
RC Enable scrolling browser for multimedia graphics and text description.
MN I'll just pull it out to make it clear.
0:30
Pointed N2, N3, N4, N5, N6, N7, N8, n9, RC Helps encode into long term memory.
RC Remove word-for-word audio narration of onscreen text.
RC Decrease load on visual working memory and increase selective attention.
RC Reduce overall cognitive load.
RC Personalize communication with use of pedagogical agents.
RC Exclude gratuitous visuals,
RC exclude gratuitous sounds.
ID So you want to put these redundancies over here so there's a match up.
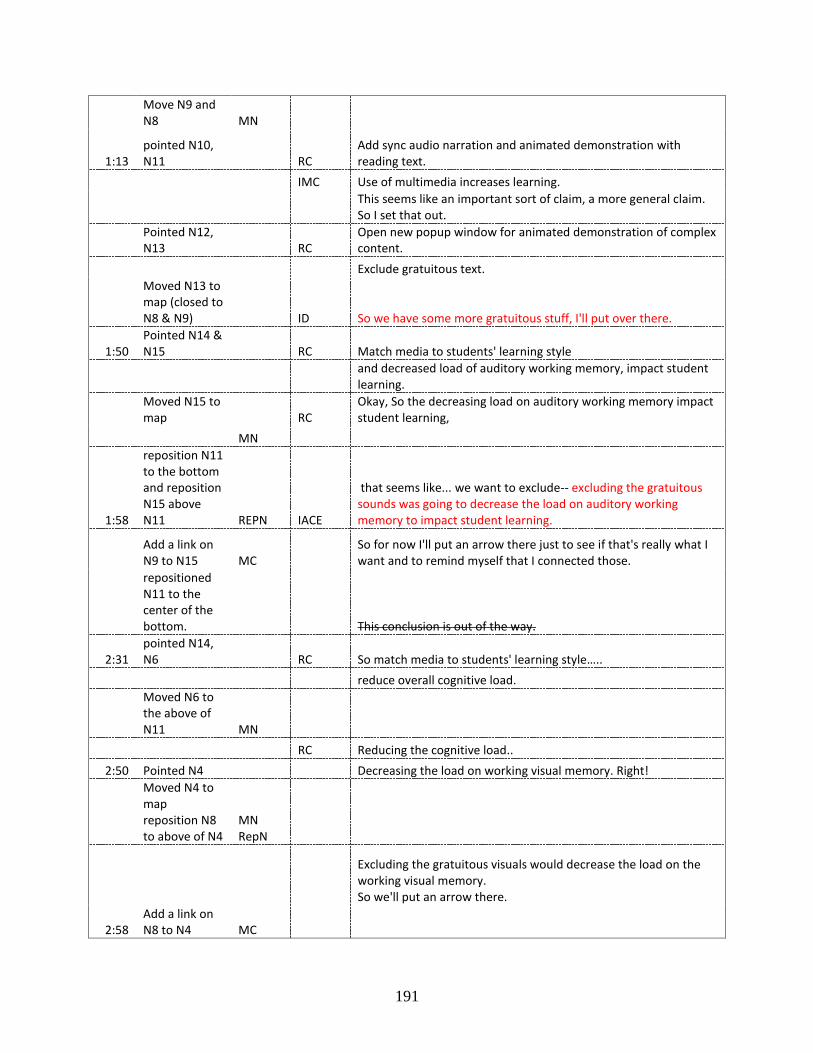
191
Move N9 and N8 MN
1:13 pointed N10, N11 RC
Add sync audio narration and animated demonstration with reading text.
IMC Use of multimedia increases learning.
This seems like an important sort of claim, a more general claim. So I set that out.
Pointed N12, N13 RC
Open new popup window for animated demonstration of complex content.
Exclude gratuitous text.
Moved N13 to map (closed to N8 & N9) ID So we have some more gratuitous stuff, I'll put over there.
1:50 Pointed N14 & N15 RC Match media to students' learning style
and decreased load of auditory working memory, impact student learning.
Moved N15 to map RC
Okay, So the decreasing load on auditory working memory impact student learning,
MN
1:58
reposition N11 to the bottom and reposition N15 above N11 REPN IACE
that seems like... we want to exclude-- excluding the gratuitous sounds was going to decrease the load on auditory working memory to impact student learning.
Add a link on N9 to N15 MC
So for now I'll put an arrow there just to see if that's really what I want and to remind myself that I connected those.
repositioned N11 to the center of the bottom. This conclusion is out of the way.
2:31 pointed N14, N6 RC So match media to students' learning style…..
reduce overall cognitive load.
Moved N6 to the above of N11 MN
RC Reducing the cognitive load..
2:50 Pointed N4 Decreasing the load on working visual memory. Right!
Moved N4 to map reposition N8 to above of N4
MN RepN
Excluding the gratuitous visuals would decrease the load on the working visual memory. So we'll put an arrow there.
2:58 Add a link on N8 to N4 MC
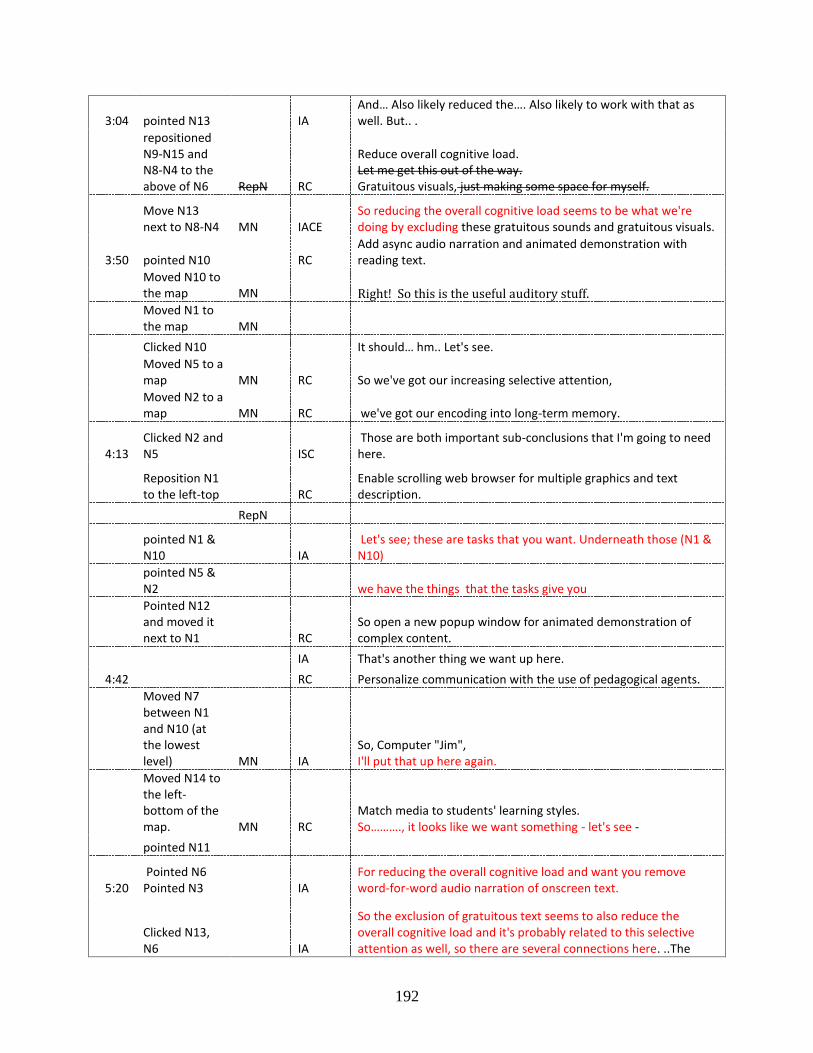
192
3:04 pointed N13 IA And… Also likely reduced the…. Also likely to work with that as well. But.. .
repositioned N9-N15 and N8-N4 to the above of N6 RepN RC
Reduce overall cognitive load. Let me get this out of the way. Gratuitous visuals, just making some space for myself.
Move N13 next to N8-N4 MN IACE
So reducing the overall cognitive load seems to be what we're doing by excluding these gratuitous sounds and gratuitous visuals.
3:50 pointed N10 RC Add async audio narration and animated demonstration with reading text.
Moved N10 to the map MN Right! So this is the useful auditory stuff.
Moved N1 to the map MN
Clicked N10 It should… hm.. Let's see.
Moved N5 to a map MN RC So we've got our increasing selective attention,
Moved N2 to a map MN RC we've got our encoding into long-term memory.
4:13 Clicked N2 and N5 ISC
Those are both important sub-conclusions that I'm going to need here.
Reposition N1 to the left-top RC
Enable scrolling web browser for multiple graphics and text description.
RepN
pointed N1 & N10 IA
Let's see; these are tasks that you want. Underneath those (N1 & N10)
pointed N5 & N2 we have the things that the tasks give you
Pointed N12 and moved it next to N1 RC
So open a new popup window for animated demonstration of complex content.
IA That's another thing we want up here.
4:42 RC Personalize communication with the use of pedagogical agents.
Moved N7 between N1 and N10 (at the lowest level) MN IA
So, Computer "Jim", I'll put that up here again.
Moved N14 to the left-bottom of the map. MN RC
Match media to students' learning styles. So………., it looks like we want something - let's see -
pointed N11
5:20 Pointed N6 Pointed N3 IA
For reducing the overall cognitive load and want you remove word-for-word audio narration of onscreen text.
Clicked N13, N6 IA
So the exclusion of gratuitous text seems to also reduce the overall cognitive load and it's probably related to this selective attention as well, so there are several connections here. ..The
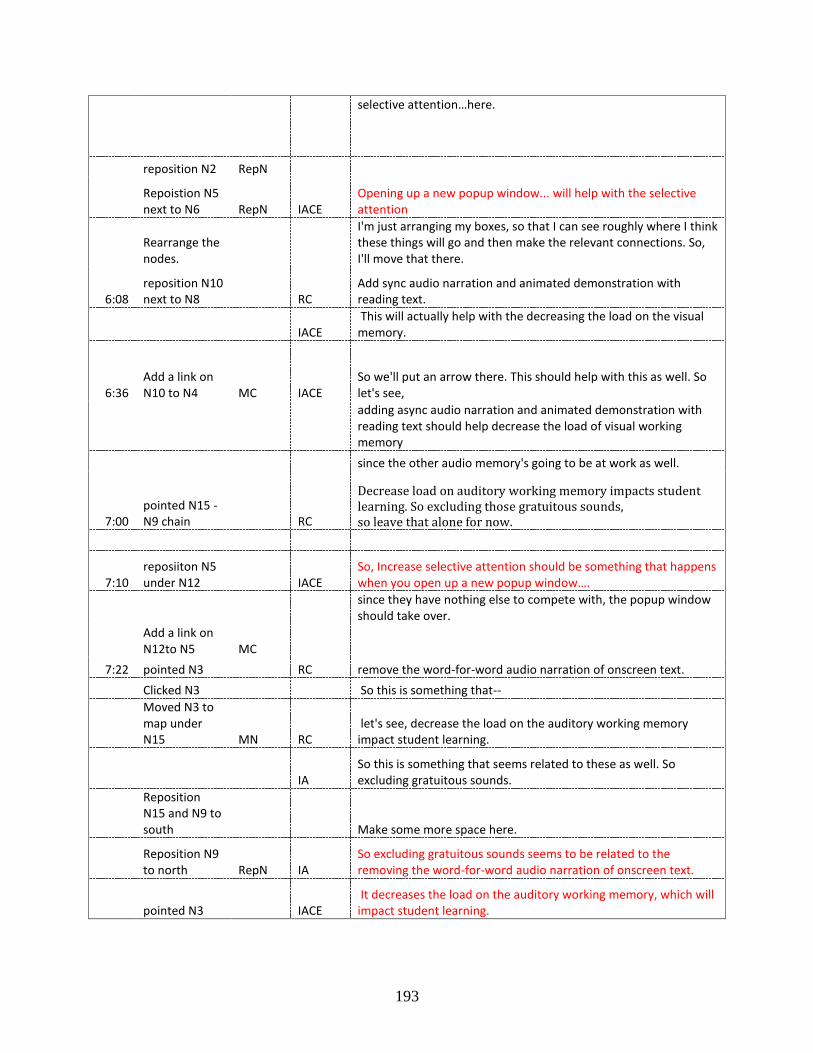
193
selective attention…here.
reposition N2 RepN
Repoistion N5 next to N6 RepN IACE
Opening up a new popup window... will help with the selective attention
Rearrange the nodes.
I'm just arranging my boxes, so that I can see roughly where I think these things will go and then make the relevant connections. So, I'll move that there.
6:08 reposition N10 next to N8 RC
Add sync audio narration and animated demonstration with reading text.
IACE This will actually help with the decreasing the load on the visual memory.
6:36 Add a link on N10 to N4 MC IACE
So we'll put an arrow there. This should help with this as well. So let's see,
adding async audio narration and animated demonstration with reading text should help decrease the load of visual working memory
since the other audio memory's going to be at work as well.
7:00 pointed N15 -N9 chain RC
Decrease load on auditory working memory impacts student learning. So excluding those gratuitous sounds, so leave that alone for now.
7:10 reposiiton N5 under N12 IACE
So, Increase selective attention should be something that happens when you open up a new popup window….
since they have nothing else to compete with, the popup window should take over.
Add a link on N12to N5 MC
7:22 pointed N3 RC remove the word-for-word audio narration of onscreen text.
Clicked N3 So this is something that--
Moved N3 to map under N15 MN RC
let's see, decrease the load on the auditory working memory impact student learning.
IA So this is something that seems related to these as well. So excluding gratuitous sounds.
Reposition N15 and N9 to south Make some more space here.
Reposition N9 to north RepN IA
So excluding gratuitous sounds seems to be related to the removing the word-for-word audio narration of onscreen text.
pointed N3 IACE It decreases the load on the auditory working memory, which will impact student learning.
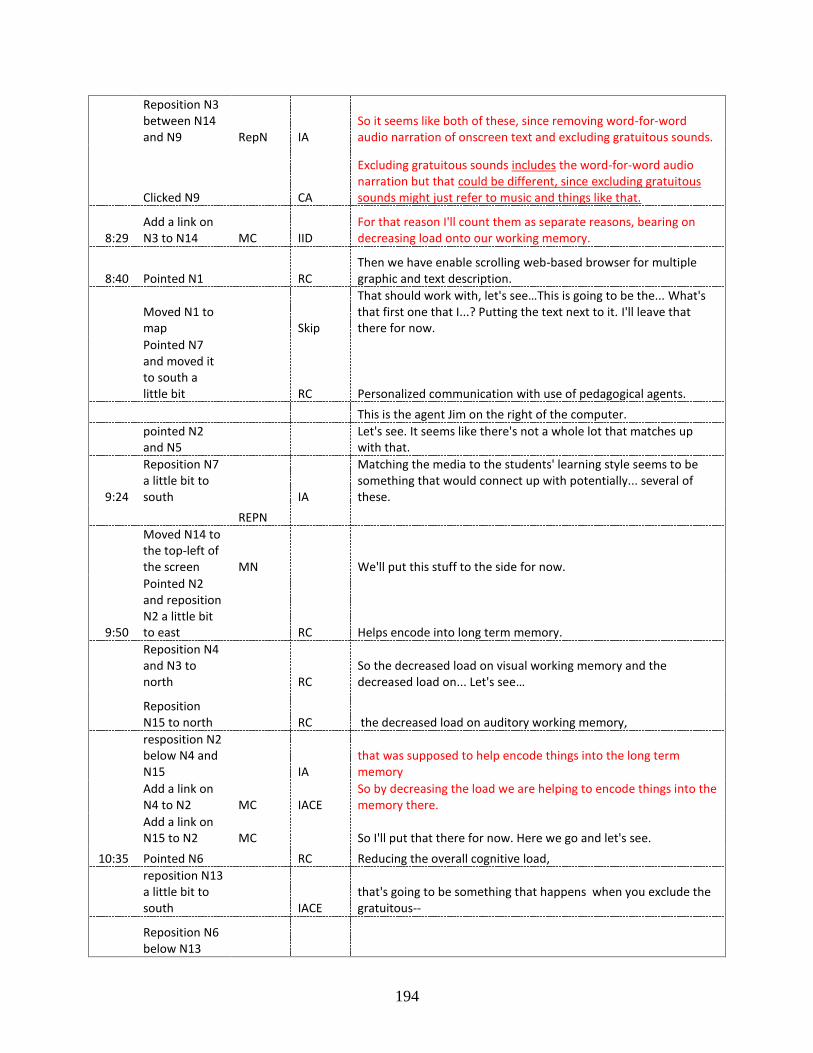
194
Reposition N3 between N14 and N9 RepN IA
So it seems like both of these, since removing word-for-word audio narration of onscreen text and excluding gratuitous sounds.
Clicked N9 CA
Excluding gratuitous sounds includes the word-for-word audio narration but that could be different, since excluding gratuitous sounds might just refer to music and things like that.
8:29 Add a link on N3 to N14 MC IID
For that reason I'll count them as separate reasons, bearing on decreasing load onto our working memory.
8:40 Pointed N1 RC Then we have enable scrolling web-based browser for multiple graphic and text description.
Moved N1 to map Skip
That should work with, let's see…This is going to be the... What's that first one that I...? Putting the text next to it. I'll leave that there for now.
Pointed N7 and moved it to south a little bit RC Personalized communication with use of pedagogical agents.
This is the agent Jim on the right of the computer.
pointed N2 and N5
Let's see. It seems like there's not a whole lot that matches up with that.
9:24
Reposition N7 a little bit to south IA
Matching the media to the students' learning style seems to be something that would connect up with potentially... several of these.
REPN
Moved N14 to the top-left of the screen MN We'll put this stuff to the side for now.
9:50
Pointed N2 and reposition N2 a little bit to east RC Helps encode into long term memory.
Reposition N4 and N3 to north RC
So the decreased load on visual working memory and the decreased load on... Let's see…
Reposition N15 to north RC the decreased load on auditory working memory,
resposition N2 below N4 and N15 IA
that was supposed to help encode things into the long term memory
Add a link on N4 to N2 MC IACE
So by decreasing the load we are helping to encode things into the memory there.
Add a link on N15 to N2 MC So I'll put that there for now. Here we go and let's see.
10:35 Pointed N6 RC Reducing the overall cognitive load,
reposition N13 a little bit to south IACE
that's going to be something that happens when you exclude the gratuitous--
Reposition N6 below N13
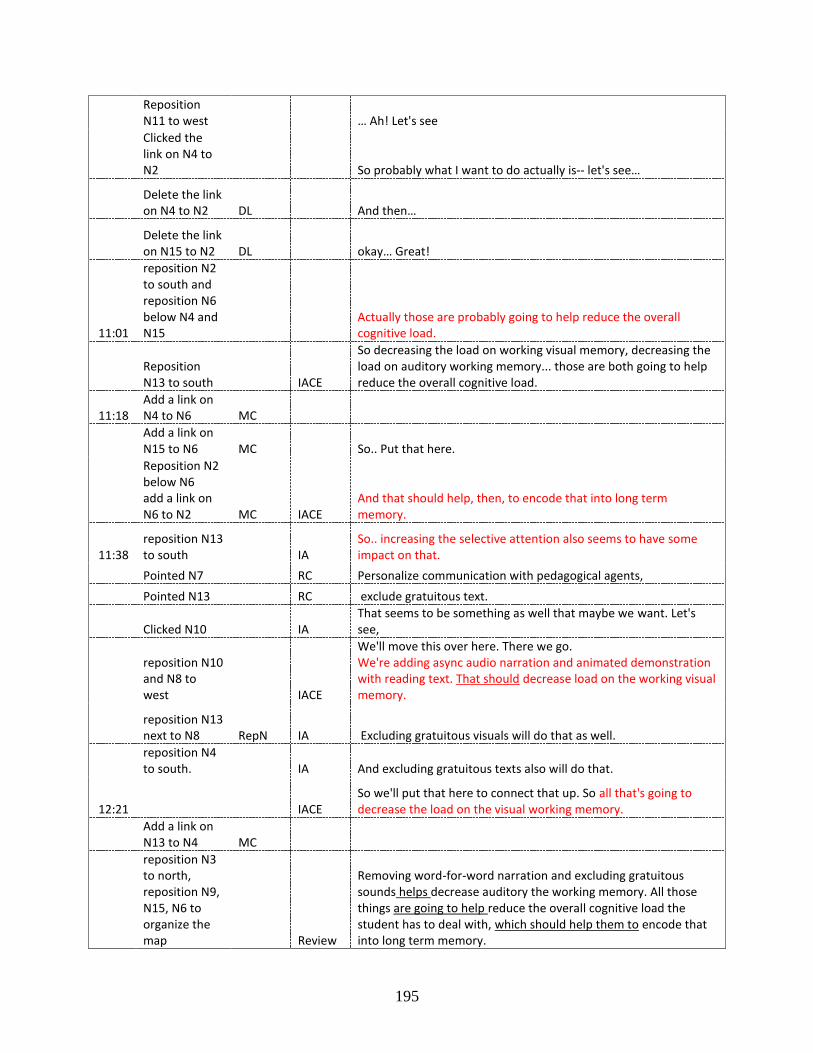
195
Reposition N11 to west … Ah! Let's see
Clicked the link on N4 to N2 So probably what I want to do actually is-- let's see…
Delete the link on N4 to N2 DL And then…
Delete the link on N15 to N2 DL okay… Great!
11:01
reposition N2 to south and reposition N6 below N4 and N15
Actually those are probably going to help reduce the overall cognitive load.
Reposition N13 to south IACE
So decreasing the load on working visual memory, decreasing the load on auditory working memory... those are both going to help reduce the overall cognitive load.
11:18 Add a link on N4 to N6 MC
Add a link on N15 to N6 MC So.. Put that here.
Reposition N2 below N6 add a link on N6 to N2 MC IACE
And that should help, then, to encode that into long term memory.
11:38 reposition N13 to south IA
So.. increasing the selective attention also seems to have some impact on that.
Pointed N7 RC Personalize communication with pedagogical agents,
Pointed N13 RC exclude gratuitous text.
Clicked N10 IA That seems to be something as well that maybe we want. Let's see,
reposition N10 and N8 to west IACE
We'll move this over here. There we go. We're adding async audio narration and animated demonstration with reading text. That should decrease load on the working visual memory.
reposition N13 next to N8 RepN IA Excluding gratuitous visuals will do that as well.
reposition N4 to south. IA And excluding gratuitous texts also will do that.
12:21 IACE So we'll put that here to connect that up. So all that's going to decrease the load on the visual working memory.
Add a link on N13 to N4 MC
reposition N3 to north, reposition N9, N15, N6 to organize the map Review
Removing word-for-word narration and excluding gratuitous sounds helps decrease auditory the working memory. All those things are going to help reduce the overall cognitive load the student has to deal with, which should help them to encode that into long term memory.
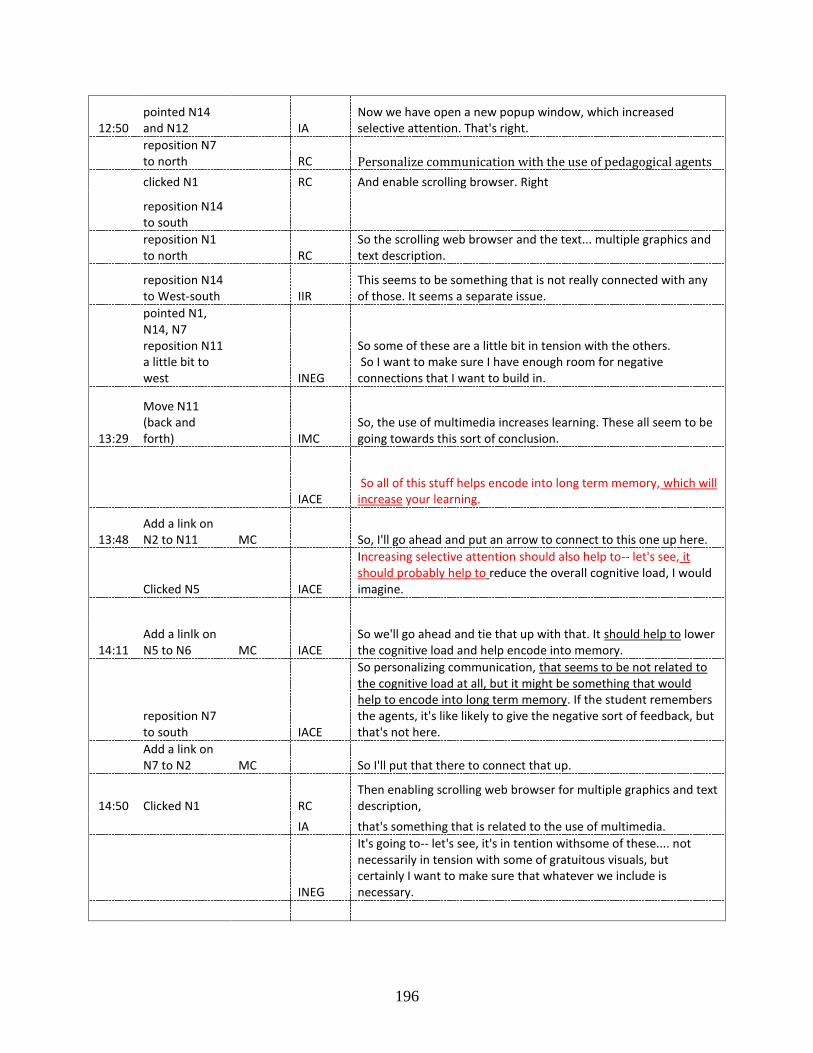
196
12:50 pointed N14 and N12 IA
Now we have open a new popup window, which increased selective attention. That's right.
reposition N7 to north RC Personalize communication with the use of pedagogical agents
clicked N1 RC And enable scrolling browser. Right
reposition N14 to south
reposition N1 to north RC
So the scrolling web browser and the text... multiple graphics and text description.
reposition N14 to West-south IIR
This seems to be something that is not really connected with any of those. It seems a separate issue.
pointed N1, N14, N7 reposition N11 a little bit to west INEG
So some of these are a little bit in tension with the others. So I want to make sure I have enough room for negative connections that I want to build in.
13:29
Move N11 (back and forth) IMC
So, the use of multimedia increases learning. These all seem to be going towards this sort of conclusion.
IACE So all of this stuff helps encode into long term memory, which will increase your learning.
13:48 Add a link on N2 to N11 MC So, I'll go ahead and put an arrow to connect to this one up here.
Clicked N5 IACE
Increasing selective attention should also help to-- let's see, it should probably help to reduce the overall cognitive load, I would imagine.
14:11 Add a linlk on N5 to N6 MC IACE
So we'll go ahead and tie that up with that. It should help to lower the cognitive load and help encode into memory.
reposition N7 to south IACE
So personalizing communication, that seems to be not related to the cognitive load at all, but it might be something that would help to encode into long term memory. If the student remembers the agents, it's like likely to give the negative sort of feedback, but that's not here.
Add a link on N7 to N2 MC So I'll put that there to connect that up.
14:50 Clicked N1 RC Then enabling scrolling web browser for multiple graphics and text description,
IA that's something that is related to the use of multimedia.
INEG
It's going to-- let's see, it's in tention withsome of these.... not necessarily in tension with some of gratuitous visuals, but certainly I want to make sure that whatever we include is necessary.
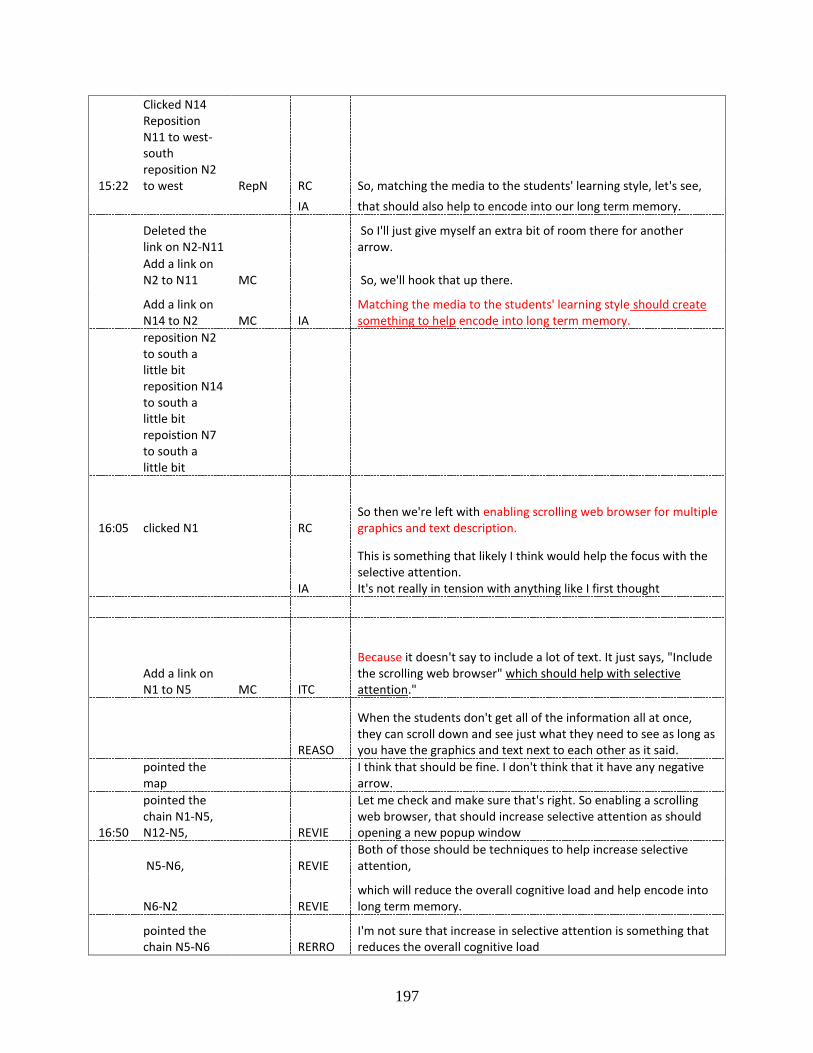
197
15:22
Clicked N14 Reposition N11 to west-south reposition N2 to west RepN RC So, matching the media to the students' learning style, let's see,
IA that should also help to encode into our long term memory.
Deleted the link on N2-N11
So I'll just give myself an extra bit of room there for another arrow.
Add a link on N2 to N11 MC So, we'll hook that up there.
Add a link on N14 to N2 MC IA
Matching the media to the students' learning style should create something to help encode into long term memory.
reposition N2 to south a little bit reposition N14 to south a little bit repoistion N7 to south a little bit
16:05 clicked N1 RC So then we're left with enabling scrolling web browser for multiple graphics and text description.
IA
This is something that likely I think would help the focus with the selective attention. It's not really in tension with anything like I first thought
Add a link on N1 to N5 MC ITC
Because it doesn't say to include a lot of text. It just says, "Include the scrolling web browser" which should help with selective attention."
REASO
When the students don't get all of the information all at once, they can scroll down and see just what they need to see as long as you have the graphics and text next to each other as it said.
pointed the map
I think that should be fine. I don't think that it have any negative arrow.
16:50
pointed the chain N1-N5, N12-N5, REVIE
Let me check and make sure that's right. So enabling a scrolling web browser, that should increase selective attention as should opening a new popup window
N5-N6, REVIE Both of those should be techniques to help increase selective attention,
N6-N2 REVIE which will reduce the overall cognitive load and help encode into long term memory.
pointed the chain N5-N6 RERRO
I'm not sure that increase in selective attention is something that reduces the overall cognitive load
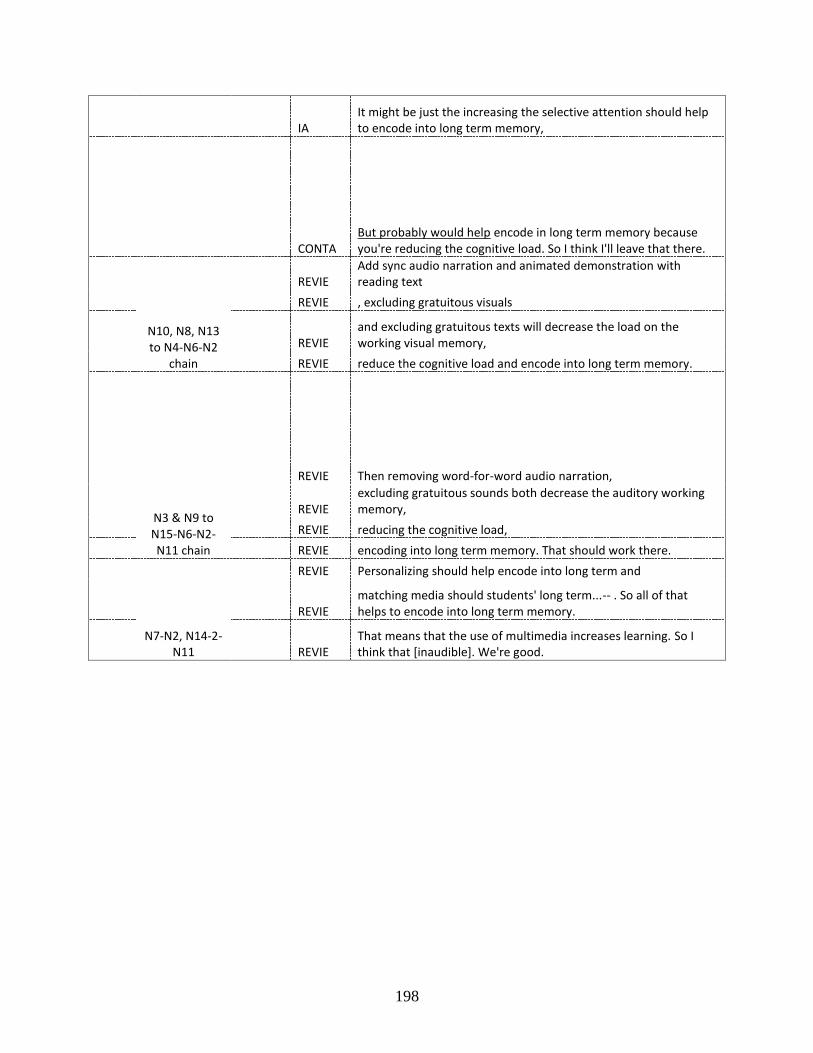
198
IA It might be just the increasing the selective attention should help to encode into long term memory,
CONTA But probably would help encode in long term memory because you're reducing the cognitive load. So I think I'll leave that there.
N10, N8, N13 to N4-N6-N2
chain
REVIE Add sync audio narration and animated demonstration with reading text
REVIE , excluding gratuitous visuals
REVIE and excluding gratuitous texts will decrease the load on the working visual memory,
REVIE reduce the cognitive load and encode into long term memory.
N3 & N9 to N15-N6-N2-N11 chain
REVIE Then removing word-for-word audio narration,
REVIE excluding gratuitous sounds both decrease the auditory working memory,
REVIE reducing the cognitive load,
REVIE encoding into long term memory. That should work there.
N7-N2, N14-2-N11
REVIE Personalizing should help encode into long term and
REVIE matching media should students' long term...-- . So all of that helps to encode into long term memory.
REVIE That means that the use of multimedia increases learning. So I think that [inaudible]. We're good.
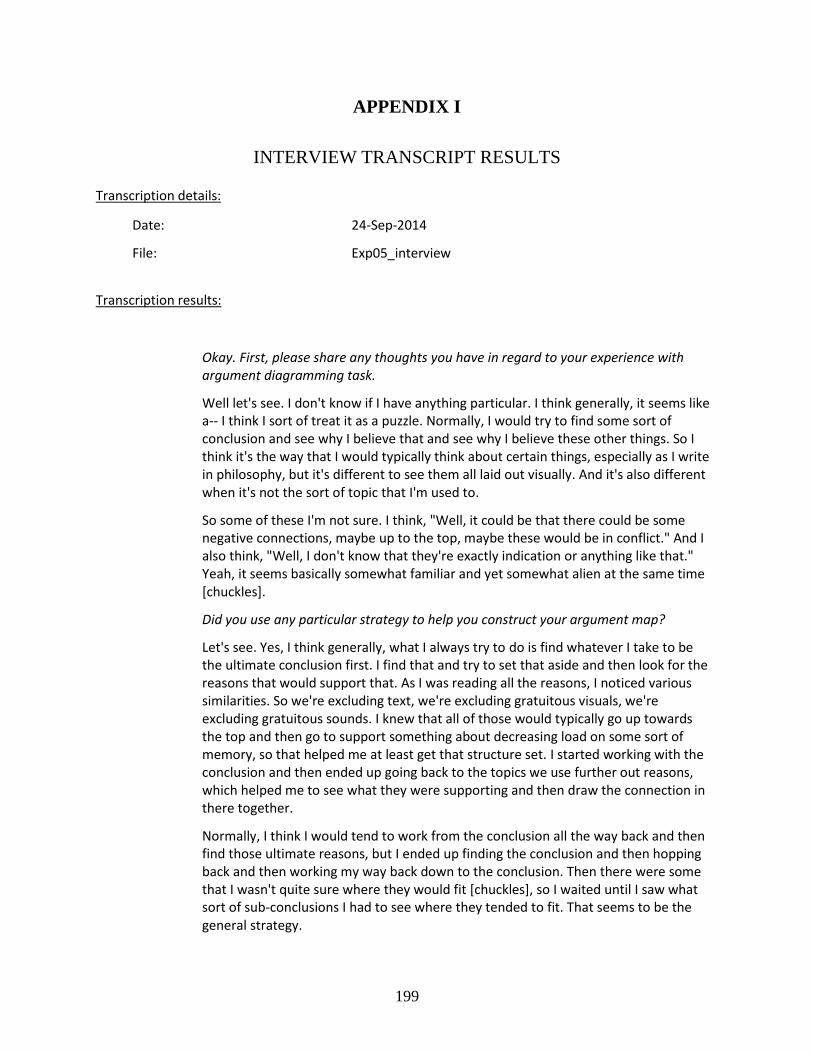
199
APPENDIX I
INTERVIEW TRANSCRIPT RESULTS
Transcription details:
Date: 24-Sep-2014
File: Exp05_interview
Transcription results:
Okay. First, please share any thoughts you have in regard to your experience with argument diagramming task.
Well let's see. I don't know if I have anything particular. I think generally, it seems like a-- I think I sort of treat it as a puzzle. Normally, I would try to find some sort of conclusion and see why I believe that and see why I believe these other things. So I think it's the way that I would typically think about certain things, especially as I write in philosophy, but it's different to see them all laid out visually. And it's also different when it's not the sort of topic that I'm used to.
So some of these I'm not sure. I think, "Well, it could be that there could be some negative connections, maybe up to the top, maybe these would be in conflict." And I also think, "Well, I don't know that they're exactly indication or anything like that." Yeah, it seems basically somewhat familiar and yet somewhat alien at the same time [chuckles].
Did you use any particular strategy to help you construct your argument map?
Let's see. Yes, I think generally, what I always try to do is find whatever I take to be the ultimate conclusion first. I find that and try to set that aside and then look for the reasons that would support that. As I was reading all the reasons, I noticed various similarities. So we're excluding text, we're excluding gratuitous visuals, we're excluding gratuitous sounds. I knew that all of those would typically go up towards the top and then go to support something about decreasing load on some sort of memory, so that helped me at least get that structure set. I started working with the conclusion and then ended up going back to the topics we use further out reasons, which helped me to see what they were supporting and then draw the connection in there together.
Normally, I think I would tend to work from the conclusion all the way back and then find those ultimate reasons, but I ended up finding the conclusion and then hopping back and then working my way back down to the conclusion. Then there were some that I wasn't quite sure where they would fit [chuckles], so I waited until I saw what sort of sub-conclusions I had to see where they tended to fit. That seems to be the general strategy.
200
Can you describe the process you used to create your argument diagram? For example-- well, you're already playing that [chuckles]. What was the first action you performed for the task and why? What was the next [exponent?] why they [put a?] thing? I think different [?]. Okay. Let's go.
Okay. So just--
That's first?
Yeah. So first, I find the conclusion. I try to pull that out and set that aside. At first, I was just reading through all the statements and then when I found the one that I thought was the conclusion, I put that on the side. Then I would start to group some of these ones that seem similar. It's about including various gratuitous things. Then I noticed the statements about decreasing the load on the working memory, and auditory memory, the visual memory and things like that. Those seem to connect together to reduce the overall cognitive load. So that helped to me draw those together. Then I could see that there was various other boxes that would also fit in as ways to decrease the load on the working visual memory or whatever which would fit in nicely with the overall cognitive load.
And then from that, I just had the extra ones that I saw. I guess the selective attention seem to fit in fairly well. I could know that the pop-up window would help to increase the selective attention. Enabling the browser also, then I had to fit that one in. I realized that probably increases selective attention, as well. And then the last two, they didn't seem to fit in with anything else I had. So they seem to just ways to encode in the long-term memory. That's why I put those last. These were the first ones I kind of figured out because I was focused on the other sort of connections and schemes.
I have a question. When I observed your performing, you were not sure about this link. And then you just left the link here. So can you elaborate?
Right. So the link between the increasing the selective attention and reducing the overall cognitive load. I wasn't sure why they're increasing the selective attention would be a way to encode it into the long-term memory, or if the way that it encodes it into the long-term memory is by reducing the overall cognitive load. When you increase their selective attention, there's less that is going on cognitively. There's less reduction in the cognitive load. That's the reason why it helps to encode it into the long-term memory.
If the reason that increasing the selective attention helps to encode it into long-term memory is because it reduces the overall cognitive load, then that's what I have diagrammed. That's what I seemed to think was going on. If that's not the case, then I would not want this arrow here. I'd want to take that out and put it straight down to encode in the long-term memory. Maybe it does that in a different way, but it seemed like that was a way that increasing the selective attention would help to encode it into long-term memory. So I left that arrow there.
You thought this one is mediate between selective attention and--
Right. Right. This is the way in which-- so it increases selective attention by reducing
201
the cognitive load. I'm sorry, you increase selective attention which means that you reduce the cognitive load and that helps to encode into long-term memory. If you don't have this middle way or if you don't reduce the cognitive load when you increase the selective attention in that way. And there are some other explanation that helps to explain why it encodes in the long-term memory, then I would want to take out that arrow.
Have you ever taken a psychology course [before then?]?
I took some psychology classes, undergrad. But it's been many, many years ago [chuckles].
So this terminology is not really new thing for you.
It's not entirely new, no. Especially the [common?] that I am using in my reason and critical thinking class now. It's sort of related to that, right? Especially the selective attention right now. So some of these terms are familiar, but the theories about how they work and connect up, I'm not as familiar with.
Okay. Next question. I think this is [going to do?]. What difficulties did you have while constructing your argument map? How did you solve that difficulties?
Right. Essentially, these few [crosstalk]-- yeah, I'm sorry. Because you got the screen. These three here - 1, 7, and 14 - I didn't see them as relating to what I had started to do over in this area. I had left them to the side and then I wasn't quite sure exactly where they were going to fit. I suppose that was a difficulty just in the sense that I wasn't quite sure where these would go in the long run. But once I had organized these in a way that I wanted to organize all the other, the working memory and the cognitive load stuff, then I realized that I already had 12, [as?] connect that to increase the selective attention.
And then when I thought about what enabling the scrolling web browser would do, that seems to limit what you can see, right, in the same way that the pop-up window does. So that seemed to fit up nicely with the increase in the selective attention, which just left these last two - 7 and 14 - and neither of those seem to fit into anything that I've done over here. But, it didn't seem that those, straightforwardly, lead to 11, that use multimedia increases learning. So it seems that I would need to connect through that with two, that they would encode them in long-term memory.
In the article - The Personalized Communication with Jim - right there, it was sort of connected but not really explicitly something that they were saying that would help to encode into long-term memory. But it seemed that when you have something that you can name and you become familiar with, it's a lot of easier to remember that sort of thing. It seemed like that was a clear path to go through. And then the same with matching the media to the students' learning style. If it's something that the way they learn, that's going to help to remember it better. So both of those seem like loose threads, but it seemed that they've best fit.
Do you believe media? That student have different learning style and you need to match auditory learning or visual learner or something like that. Do you think that's true?
202
Yeah. I think that certain students, yeah. They'd be ones that would match better with auditory or visual, right? Yeah. In that sense then, I could see that working, I suppose, some way possibly over in this area, if you can connect this up somehow. But I'm not sure how matching the media to their learning styles would fit in with say, excluding any of these, or adding. So it could be a reason, say, to add the sync audio narration and demonstration with the reading text, right? So that you get two sorts of ways that they're getting the information so that you can kind of match it to the learning style. But that's not so much matching into the learning style, it's just giving them several different learning styles so whichever one fits with them is the one they can appeal to or use.
Have you read the article?
No.
No. Okay. Please indicate on your argument map which principle you're [leading?] you prior to that start of this argument mapping session. For example, did you know about multimedia principle?
No. I don't think I knew--
You knew of that.
I don't think I knew any of them. I think, at least, certainly not by those names. I think I've heard of--
Like the concept?
Right. The concepts of--
Which one do you think?
Let's see.
This one is [?]-
Right. I think the redundancy principle for sure. And--
This one?
Right. No, I guess not. Let's see. It was the-- right, so I think that the redundancy and the coherence principle both, those basic concepts I was familiar with. To a lesser extent, maybe the personalization principle. But the other one is not really a [principle?].
So you'd already say this. Then can you tell me which relationship in your diagram were difficult to identify? Can you explain why? You already say something. Lets start with green and the relationship was kind of difficult or-- to make that one as a--?
The relationship between-- lets see. It's like this one and this one was a bit difficult to identify for me (N14-N2, N7-N2). I think probably, this one and this one, as well. Second [?] the little green check. I think this one was slightly at first up with this, but after thinking about it and realizing that amounted the same as 12, then this one (N1-N5, N5-N6)didn't really seem like it was that bad. I think all the rest of these, let's see, I felt fairly confident that those were ways to match up except for it. So, say, this one,
203
this sort of connection here would be the only other one that I wasn't quite so sure how it was going to work.
Look at this relationship, okay? So [add those?] think [on those?] audio narration, and animated demonstration with written tasks will decrease the load in visual-working memory or something?
Yeah. I think that when you add the audio narration with the reading text, so the thought there was that the student doesn't have to-- they might not even read the information, right, if you have the audio narration of the text. Or if they do read it, say, as an automatic type process, right? So it's like dual-process existing one something or other where they just happen to kind of read it but they don't have to spend their cognitive energy trying to read it and understand it as much. I was assuming that would decrease the load on the visual-working memory and it would allow them to just kind of learn in different ways?
They listen?
Right. They can hear it instead of reading it, right.
They can hear it instead of looking at it? Okay.
That's the thought, yeah.
This one is kind of important. When you insert a link between the [premise?] and you were not sure, did you use guessing? For example, like this one here or here, did you guess or just...?
Right. I think that I tried to not put any links in until I felt fairly confident that I wanted them there. If I did put a link in, the only reason why I wanted to delete it was to put something else in between as a separate step. I think that when it came to the end - and I just had these two left, 7 and 14 - I wouldn't say that I guessed at the relationship. I think I--
You had some reason.
Right. I could rationalize why I made the connections. I think I was the least confident, so I wasn't sure if I was creating a story to make this fit. That made sense because that was what was left, and it didn't seem to fit into what I'd already created on the other side. But I don't think there was anything that I just guessed, I suppose, in that sort of sense. Usually, I wasn't quite sure how this would work, so I would think about what that connection was, and I could see how there would be a connection there. So it was some sort of rationalizing process for [that?].
Okay. So you had your own rationale to connect.
Yeah. And I'm not sure that the rationale that I used is--
Correct of not, but anyway, you--
Right. But I could certainly defend it if I needed to [laughter].
This one is the last one, I think. Were you able to think aloud while constructing the map, or did you filter out certain thought that you would...?
204
Yeah. I don't think that I filtered out thoughts, at least not intentionally [chuckles] if I did. I think the thinking aloud, often-- there's a lot of reading what I'm seeing so that there's not just a silence. So I don't think that there was anything that I filtered out. There might have been fleeting thoughts that just didn't quite come to the surface, that I didn't quite say. But if that happened, it wasn't intentional sort of way.
How percent is your thought were verbalized, do you think?
Let's see. I don't know. I would assume probably in the 90s, 90%.
90? Do you remember some thought that you didn't verbalize?
I don't remember any thought that I didn't verbalized. So I would assume that it's probably pretty high, but I'd like to leave some room for error. Usually, I remember thinking, "Well, you know, I'll put this off to the side because I'm not sure exactly where this goes," but I would usually say that it's happened, and then I also say, "Well, there's this arrow here. I'm not sure if that should go there." Maybe one thing is I think that when I use the-- right. So this arrow here that you asked about, and so you heard me say something about it, right?
I heard. Yeah. You say, "It's direct link here" or like that.
Right. So at least I thought that I said this but maybe I didn't. I suppose you have the recording, you can check that I said, "No, I think this is okay" and I thought that I'd given some reason why I think that it's okay. But I don't know that I fully expressed the thought. So of course, now that we've talked about it, right, I have. That might be something that just I think, "No. I think this is going to be okay because I think that this is the way that it's going. It's reducing overall cognitive load." Other than that, I can't think of anything that-- I suppose if this one didn't come out either - since you asked about this one as well - I think this is something that I thought that adding the audio narration and the animated demonstration through reading text would decrease the visual working memory because the students wouldn't have to say--
Read the text.
Read it. Right. They don't have to read the text so that helps out with the visual working memory. They can just rely on listening to the text if they need to. I think that was the other thought that I can think of that might not have been verbalized in the way that would [be?]. I think that should be it.
That's great. Because you gave this also, this relationship based on your reason, right? When you are scrolling the browser and you can just press the information that you want to read so that increase selective attention, right?
Right. Yeah.
That was very nice.
205
REFERENCES
Austhink. (2006, December 7). Argument Mapping Tutorials. Retrieved from
http://rationale.austhink.com/rationale2.0/tutorials/
Baddeley, A.D., & Hitch, G.J. (1974). Working memory. In G.H Bower (Eds.), The psychology
of learning and motivation (pp.48-90). New York: Academic Press.
Bakeman, R., & Gottman, J.M. (1997). Observing Interaction: An Introduction to Sequential
Analysis. Cambridge: Cambridge University Press.
Bensley, A. D. (2010). A brief guide for teaching and assessing critical thinking in psychology.
Observer, 23(10), 49-53.
Bensley, D. A., Crowe, D. S., Bernhardt, P., Buckner, C., & Allman, A. L. (2010). Teaching and
Assessing Critical Thinking Skills for Argument Analysis in Psychology. Teaching of
Psychology, 37(2), 91-96. doi: 10.1080/00986281003626656
Binkley, M., Erstad, O, Herman, J., Raizen, S., Ripley, M., Rubmle, M. (2012). Defining 21st
Century skills. In P. Griffin, B. McGaw & E. Care (Eds.), Assessment and teaching of
21st century skills (pp. 17-66). New York: Springer.
Braak, S. W. van den., Oostendorp, H. van, Prakken, H., & Vreeswijk, G. A. (2006). A critical
review of argument visualization tools: Do users become better reasoners? In F. Grasso,
R. Kibble, & C. A. Reed (Eds.), Workshop Notes of the ECAI-2006 Workshop on
Computational Models of Natural Argument (pp. 67-75). Riva del Garda:Italy.
Case, K., Harrison, K., & Roskell, C. (2000). Differences in the clinical reasoning process of
expert and novice cardio respiratory physiotherapists. Physiotherapy, 86(1), 14-21.
Cellier, F., Eyrolle, C., & Marine, C. (1997). Expertise in dynamic environments. Results of
comparison between novice and expert operators in supervision of dynamic environment.
Ergonomics, 40 (1), 28–50.
Chi, M. T. H (2006). Two approaches to the study of experts’ characteristics. In Ericsson K.A.,
Charness, N., Feltovich, P., & Hoffman, R. (Eds.), Cambridge handbook of expertise and
expert performance. (pp. 121-30), Cambridge University Press.
Chi, M. T., Glaser, R., & Rees, E. (1982). Expertise in problem solving. In R. J. Sternberg (Ed.),
Advances in the psychology of human intelligence (pp. 7-77). Hillsdale, NJ: Erlbaum.
Clark, R. (2002). Six principles of effective e-Learning: What works and why. The e-Learning
Developer’s Journal, 1-20. Retrieved from
http://faculty.washington.edu/farkas/HCDE510-
Fall2012/ClarkMultimediaPrinciples(Mayer).pdf
Cohen, J. (1960). A coefficient of agreement for nominal scales. Educational Psychological
Measurement, 20(1), 37-46.
Correia, V. (2011). Biased and fallacies: The role of motivated irrationality in fallacious
reasoning. Journal of Reasoning and Argumentation, 3(1), 107-127.
206
Cosgrove, R. (2011). Critical thinking in the Oxford tutorial: a call for an explicit and systematic
approach. Higher Education Research & Development, 30(3), 343-356. doi:
10.1080/07294360.2010.487259
Crespo, K.E., Torres, J. E., & Recio, M. E. (2004). Reasoning process characteristics in the
diagnostic skills of beginner, competent, and expert dentists. Journal of Dental
Education, 68(12), 1235-1244.
Cross, N. (2004). Expertise in design: an overview. Design Studies, 25(5), 427–441
Davies, M. (2011). Introduction to the special issue on critical thinking in higher education.
Higher Education Research & Development, 30(3), 255-260.
Davies, M. (2013). Critical thinking and the disciplines reconsidered. Higher Education
Research & Development, 32(4), 529-544.
De Neys, W. (2006). Dual Processing in Reasoning Two Systems but One Reasoner.
Psychological Science, 17(5), 428-433.
Driver, R., Newton, P., & Osborne, J. (2000). Establishing the norms of scientific argumentation
in classrooms. Science Education, 84(3), 287-312
Dwyer, C.P., Hogan, M.J., & Stewart, I. (2010). The evaluation of argument mapping as a
learning tool: Comparing the effects of map reading versus text reading on
comprehension and recall of arguments. Thinking Skills and Creativity, 5(1), 16-22.
Easterday, M. W., Aleven, V., & Scheines, R. (2007). Tis Better to Construct than to Receive?
The Effects of Diagram Tools on Causal Reasoning. In R. Luckin, K. R. Koedinger, & J.
Greer (Eds.), Frontiers in artificial intelligence and applications: Vol. 158. Artificial
intelligence in education: Building technology rich learning contexts that work. (pp. 93-
100). Amsterdam: IOS Press.
Elqayam, S. & Evans, St.B.T. (2011). Subtracting “ought” from “is”: Descriptivism versus
normativism in the study of human thinking. Behavioral and Brain Sciences, 34(5), 233-
290.
Ennis, R. H. (1982). Identifying implicit assumptions. Synthese, 51(1), 61-86. doi:
10.1007/bf00413849
Ennis, R. H. (1989). Critical thinking and subject specificity: Clarification and needed research.
Educational Researcher, 18(3), 4-10.
Ericsson, K. A. (2006). Protocol analysis and expert thought: Concurrent verbalizations of
thinking during experts' performance on representative task. In K. A. Ericsson, N.
Charness, P. Feltovich, and R. R. Hoffman, R. R. (Eds.). Cambridge handbook of
expertise and expert performance (pp. 223-242). Cambridge, UK: Cambridge University
Press.
Ericsson, K. A., & Simon, H. A. (1993). Protocol analysis; Verbal reports as data (revised
edition). Cambridge, MA: Bradfordbooks/MIT Press.
207
Ericsson, K. A., & Simon, H.A. (1998). How to study thinking in everyday life: Contrasting
think-aloud protocols with descriptions and explanations of thinking. Mind, Culture, and
Activity, 5(3), 178-186.
Ericsson, K.A., & Lehmann, A.C. (1996). Expert and exceptional performance: Evidence of
maximal adaptation to task constraints. Annual Review of Psychology, 47, 273-305.
Ericsson, K.A., & Simon, H.A. (1983). Protocol analysis: Verbal reports as data. Cambridge,
Mass: MIT Press.
Evans, J. S. B. T. (2002). Logic and human reasoning: An assessment of the deduction paradigm.
Psychological Bulletin, 128(8), 978-996.
Evans, J. S. B. T. (2003). In two minds: Dual-process accounts of reasoning. Trends in Cognitive
Sciences, 7(10), 454-459. doi: 10.1016/j.tics.2003.08.012
Evans, J. S. B. T. (2006). The heuristic-analytic theory of reasoning: Extension and evaluation.
Psychonomic Bulletin & Review, 13, 378-395.
Evans, J. S. B. T. (2008). Dual-processing accounts of reasoning, judgment, and social cognition.
Annual Review of Psychology, 59, 255-278. doi:
10.1146/annurev.psych.59.103006.093629
Evans, J. S. B. T., & Over, D. E. (1996). Rationality and reasoning. Hove, UK:Psychology
Farrington-Darby, T., & Wilson, J.R. (2006). The nature of expertise: Fundamental review.
Applied Ergonomics, 37(1), 17-32.
Feldon, D. (2007). The implications of research on expertise for curriculum and pedagogy.
Educational Psychology Review, 19(2), 91-110
Glaser, R., & Chi, M. T. H. (1988). Overview. In M.T. H. Chi, R. Glaser, & M. J. Farr (Eds.),
The nature of expertise (pp. 15-27). Hillsdale, NJ: Lawrence Erlbaum.
Goel, V., Buchel, C., Frith, C., & Dolan, R.J. (2000). Dissociation of mechanisms underlying
syllogistic reasoning. NeuroImage, 12, 504-514. Doi:10.1006/nimg.2000.0636
Gold, J., Holman, D., & Thorpe, R. (2002). The role of argument analysis and storytelling in
facilitating critical thinking. Management Learning, 33(3), 371-388.
Govier, T. (1987). Problems in Argument analysis and evaluation. Dordrecht: The Netherlands:
Foris Publications Holland.
Guba, E. G., & Lincoln, Y.S.(1994). Competing paradigms in qualitative research. In N. K.
Denzin and Y. Lincoln (Eds.), Handbook of qualitative research, (pp.105–117).
Thousand Oaks, CA: Sage
Hahn, U. & Oaksford, M. (2007). The rationality of informal argumentation: A Bayesian
approach to reasoning fallacies. Psychological Review, 114(3), 704–732
Harrell, M. (2007). Using argument diagramming software to teach critical thinking skills.
Proceedings of the 5th International Conference on Education and Information Systems,
Technologies and Applications. July, Orlando. 2007
208
Harrell, M. (2008). No Computer Program Required: Even Pencil-and-Paper Argument Mapping
Improves Critical-Thinking Skills. Teaching Philosophy, 31(4).
Harrell, M. (2011). Argument diagramming and critical thinking in introductory philosophy.
Higher Education Research & Development, 30(3), 371-385. doi:
10.1080/07294360.2010.502559
Heit, E. (2007). What is induction and why we study it? In Feeney, A., & Heit, E. (Eds.),
Inductive reasoning: Experimental, developmental, and computational approaches (pp.1-
24). Cambridge: Cambridge University Press.
Hitchcock, D., & Verheij, B. (2006). Introduction. In D.Hitchcok & B.Verheij (Eds.), Arguing on
the Toulmin Model: New essays in argument analysis and evaluation (pp. 1-23).
Dordrecht: The Netherlands: Springer.
Hoffman, R.R. (1996). Defining expertise. In Williams, R., Faulkner, W., & Fleck, J. (Eds.),
Exploring expertise (pp.81-100). Edinburgh, Scotland: University of Edinburgh Press.
Jeong, A. (2010). Assessing change in learners’ causal understanding using sequential analysis
and causal maps. In V.J. Shute, & B.J. Becker (Eds.), Innovative assessment for 21st
century: Supporting educational needs (pp. 187-206). New York: Springer-Verlag.
Jeong, A. (2012). DAT software. Retrieved January 31, 2012, http://myweb.fsu.edu/ajeong/dat
Jeong, A. (2012). jMAP. Retrieved from https://sites.google.com/site/causalmaps/
Jeong, A. C. (2014). Sequentially analyzing and modeling causal mapping processes that
produce high versus low Causal understanding. In Ifenthaler, D., & Hanewald, R. (Eds.),
Digital Knowledge Maps in Education: Technology Enhanced Support for Teachers and
Learners (pp. 239-252). Association of Educational Communication & Technology.
Johnson-Laird, P. N. (1983). Mental models. Cambridge, MA: Harvard University Press.
Johnson-Laird, P. N. (1999). Deductive reasoning. Annual Review of Psychology, 50(1), 109-
135.
Johnson-Laird, P. N. (2008). Mental models and deductive reasoning. In J. E. Adler & L. J. Rips
(Eds.), Reasoning: Studies of Human Inference and Its Foundation (pp. 206-222).
Cambridge, UK: Cambridge University Press.
Jonassen, D.H. (1997). Instructional design for well-structured and ill-structure problems.
Educational Technology Research and Development, 45(1), 656-694.
King, P. M., Wood, P. K., & Mines, R. A. (1990). Critical thinking among college and graduate
students. The Review of Higher Education 13(2), 167-186.
Klaczynski, P. A. (2000). Motivated Scientific Reasoning Biases, Epistemological Beliefs, and
Theory Polarization: A Two-Process Approach to Adolescent Cognition. Child
development, 71(5), 1347-1366. doi: 10.1111/1467-8624.00232
Klauer, K. C., Musch, J., & Naumer. B. (2000). On belief bias in syllogistic reasoning.
Psychological Review, 107(4), 852-884. doi:10.1037/0033-295X.107.4.852
209
Koro-Ljungberg, M., Doublas, E.P., Therriault, D., & Malcolm, Z. (2012). Reconceptulizing and
decentering think-aloud methodology in qualitative research. Qualitative Research, 0(0),
1-19.
Kuhn, D. (1991). The Skills of Argument. Cambridge: Cambridge University Press.
Kuhn, D. (1992). Thinking as argument. Harvard Educational Review, 62(2), 155-179
Kuhn, D. (1999). A developmental model of critical thinking. Educational Researcher, 28(2),
16-26.
Kuhn, D. (2007). Jumping to conclusions: Can people be counted on to make sound judgments?
Scientific American Mind, 18 (1, Feb/Mar), 44-51.
Kuhn, D., & Udell, W. (2003). The development of argument skills. Child Development, 74(5),
1245-1260.
Landis, R.R., & Joch G.G. (1977). The measurement of observer agreement for categorical data.
Biometrics, 33(1), 159-174.
Larkin, J.H. (1983). The role of problem representation in physics. In A.L. Stevens & D. Gentner
(Eds.), Mental Models, (pp.75-99). Hillsdale, NY: Erlbaum.
Lim, L. (2011). Beyond logic and argument analysis: Critical thinking, everyday problems and
democratic deliberation in Cambridge International Examinations' Thinking Skills
curriculum. Journal of Curriculum Studies, 43(6), 783-807. doi:
10.1080/00220272.2011.590231
Livingston, C., & Borko, H. (1989). Expert-novice differences in teaching: A cognitive analysis
and implications for teacher education. Journal of Teacher Education, 40(4), 36-42.
Madill, A., Jordan, A. & Shirley, C. (2000). Objectivity and reliability in qualitative analysis:
Realist, contextualist and radical constructionist epistemologies. British Journal of
Psychology, 91(1), 1–20. doi: 10.1348/000712600161646. Mahwah, NJ: Lawrence
Erlbaum Associates.
Mayer, R. E. (2010). Problem solving and reasoning. In V. Aukrust (Eds.), Learning and
Cognition (pp.112-117). Oxford, UK: Academic Press
McMillan, J. H. (1987). Enhancing college-students critical thinking: A review of studies.
Research in Higher Education, 26(1), 3-29. doi: 10.1007/bf00991931
Neuman, Y., & Weizman, E. (2003). The role of text representation in students’ ability to
identify fallacious arguments. Quarterly Journal of Experimental Psychology, 56, 849-
865
Nielsen, J. (1994). Estimating the number of subjects needed for a thinking aloud test.
International Journal of Human-Computer Studies, 41(3), 385-397.
Norman, G. (2005). Research in clinical reasoning: Past history and current trends. Medical
Education, 39, 418-427
210
Oaksford, M. & Hahn, U. (2007). Induction, deduction, and argument strength in human
reasoning and argumentation. In Feeney, A., & Heit, E. (Eds.), Inductive reasoning:
Experimental, developmental, and computational approaches (pp.260-301). Cambridge:
Cambridge University Press.
Partnership for 21st Century Skills. (2009, December). P21 framework definitions. Retrieved
from http://www.p21.org/storage/documents/P21_Framework_Definitions.pdf.
Patton, M. Q. (2001). Qualitative Research & Evaluation Methods, 3rd edition. Thousand oaks,
CA: Sage Publications.
Paul, R., & Elder, L. (2001). The miniature guide to critical thinking: Concepts & tools. Dillon
Beach, CA: The Foundation for Critical Thinking.
Pett, M.A. (1997). Nonparametric statistics in health care research: Statistics for small sample
and unusual distribution. Thousand Oaks, CA: Sage Publications .
Reimold, M., Slifstein, M., Heinz, A., Mueller-Schauenburg, W., & Bares, R. (2006). Effect of
spatial smoothing on t-maps: arguments for going back from t-maps to masked contrast
images. Journal of Cerebral Blood Flow and Metabolism, 26(6). doi:
10.1038/sj.jcbfm.9600231
Rider, Y., Thomason, N. (2008). Cognitive and pedagogical benefits of argument mapping:
L.A.M.P. guides the way to better thinking. In A., Okada. S.J.B., Shum, & T., Sherborne
(Eds.), Knowledge Cartography: Software tools and mapping techniques (Advanced
Information and Knowledge Processing) (pp.113-130). London: UK: Springer-Verlag.
Ruiz-Primo, M. A. & Shavelson, R. J. (1996). Problems and issues in the use of concept maps in
science assessment. Journal of Research in Science Teaching, 33(6), 569-600.
Ruiz-Primo, M. A. (2004, September). Examining concept maps as an assessment tool.
In Concept maps: Theory, methodology, technology. Proceedings of the first
international conference on concept mapping (Vol. 1, pp. 555-562).
Schaeken, W. (2000). Deductive reasoning and strategies. Mahwah, N.J: L. Erlbaum Associates.
Schechter, J. (2013). Deductive reasoning. In H.E. Pashler (Eds.), Encyclopedia of the mind (pp.
227-231). Thousand Oaks, CA: Sage Publications.
Schunn, C. D., & Anderson, J. R. (1999). The generality/specificity of expertise in scientific
reasoning. Cognitive Science, 23(3), 337-370.
Scriven, M. (1976). Reasoning. New York: McGraw-Hill.
Shanteau, J. (1992). Competence in experts: The role of task characteristics. Organizational
Behavior and Human Decision Processes, 53(2), 252-266.
Shaw, V.F. (1996). The cognitive processes in informal reasoning. Thinking & Reasoning, 2(1),
51-80.
Siegel, H. (1989). The Rationality of Science, Critical Thinking, and Science Education.
Synthese, 80(1), 9-41.
211
Simon, H. A. (1980). Problem solving and education. In Tuma, T., & Reif, R. (Eds.), Problem
Solving and Education: Issues in teaching and research (pp.81-96). Erlbaum, NJ:
Hillside.
Stanovich, K. E. (1999). Who is rational? Studies of individual differences in reasoning.
Mahwah, NJ: Elrbaum.
Stanovich, K. E., & West, R. F. (2000). Individual differences in reasoning: Implications for the
rationality debate? Behavioral and Brain Sciences, 23(5), 645-665. doi:
10.1017/s0140525x00003435
Strube, P. (1989). A content-analysis of arguments and explanations presented to students in
physical science textbooks: A model and an example. International Journal of Science
Education, 11(2), 195-202.
Svedholm-Häkkinen, A.M. (2015). Highly reflective reasoners show no signs of belief
inhibition, Acta Psycholoica, 154, 69-76
Taylor, C. (1996). Defining science. Madison, WI: University of Wisconsin Press.
Taylor, V.L. (1971). The art of argument. Metuchen, N.J.: The Scarecrow Press.
The Chronicle of Higher Education & America Public Media’s Marketplace, (2012, December).
The role of higher education in career development: Employer perceptions. Retrieved
from http://chronicle.com/items/biz/pdf/Employers%20Survey.pdf.
Thomas, D. R. (2006). A general inductive approach for analyzing qualitative evaluation
data. American journal of evaluation, 27(2), 237-246.
Thompson, V. A. (2010). Towards a metacognitive dual process theory of conditional reasoning.
In Oaksford, M., & Chater, N. (Eds.), Cognition and Conditionals - Probability and
Logic in Human Thinking (335-354). Oxford, UK: Oxford University Press.
Toulmin, S. E. (1958). The uses of argument. Cambridge: Cambridge University Press.
Twardy, C. (2004). Argument maps improve critical thinking. Teaching Philosophy, 27, 95–116.
van Bruggen, J.M., Boshuizen, H.P.A., & Kirschner, P.A. (2003). A cognitive framework for
cooperative problem solving with argument visualization. In P.A. Kirschner, S.J.
Buckingham Shum, & C.S. Carr (Eds.) Visualizing argumentation: Software tools for
collaborative and educational sense-making (pp.25-47). London: Springer-Verlag.
van Bruggen, J.M., Kirschner, P.A., & Jochems, W. (2002). External representation of
argumentation in CSCL and the management of cognitive load. Learning and Instruction,
12(1), 121-138.
van Gelder, T. (2013). Argument mapping. In Pashler, H. (Eds.), Encyclopedia of the Mind (pp.
13-14). Thousand Oaks, CA: Sage.
Van Gelder, T. J. (2001). How to improve critical thinking using educational technology. In G.
Kennedy, M. Keppell, C. McNaught & T. Petrovic (Eds.), Meeting at the crossroads:
Proceedings of the 18th annual conference of the Australasian Society for computers in
learning in tertiary education (pp. 539-548). Melbourne: Biomedical Multimedia Uni,
The University of Melboure.
212
Van Gelder, T. J. (2002a). Enhancing deliberation through computer supported argument
mapping. In Kirschner, P.A., Buckingham Shum S.J., Carr, C.S. (Eds.) Visualizing
argumentation: Software tools for collaborative and educational sense-making (pp. 97-
115). London: Springer-Verlag.
van Gelder, T. J. (2002b). Argument Mapping with Reason!Able. The American Philosophical
Association Newsletter on Philosophy and Computers, 85-90.
van Gelder, T. J. (2007). The Rationale for Rationale™. Law, Probability and Risk, 6, 23-42.
doi:10.1093/lpr/mgm032
Van Someren, M. W., Barnard, Y. F., & Sandberg, J. A. (1994). The think aloud method: A
practical guide to modeling cognitive processes. London: Academic Press.
Verschueren, N., Schaeken, W., & d’Ydewalle, G. (2005). A dual-process specification of causal
conditional reasoning. Thinking & Reasoning, 11, 278–293.
doi:10.1080/13546780442000178
Walton, D, & Gordon, T.F. (2009). Jumping to a conclusion: Fallacies and standards of proof.
Informal Logic, 29(2), 215-243.
Walton, D. (1999). Rethinking the fallacy of hasty generalization. Argumentation, 13(2), 161-
182.
Walton, D.N. (1989). Reasoned use of expertise in argumentation. Argumentations, 3, 59-73,
Weinstock, M.P., Neuman, Y., & Glassner, A. (2006). Identification of informal reasoning
fallacies as a function of epistemological level, grade level, and cognitive ability. Journal
of Educational Psychology, 89(2), 327–341
213
BIOGRAPHIC SKETCH
Areas of Interest
Critical thinking and reasoning processes in argument analysis
Implement of visual mapping tools in higher education
Student Motivation and online learning design
Education
Florida State University, Tallahassee, FL Sep.2007 – May 2015
Doctor of Philosophy in Instructional Systems & Learning Technology
Dissertation title: Modeling the reasoning processes in experts and novices’
argument diagramming task: Sequential Analysis of diagramming behavior and
Thinking-Aloud Data.
Florida State University, Tallahassee, FL Aug.2009 – Aug.2012
Master of Science in Measurement and Statistics
University of Utah, Salt Lake City, UT Sep. 2004 – Jul. 2005
Graduate Exchange Program in Teaching & Learning Department
Gyeongin National University of Education, Incheon, Korea Mar.2002 – Feb.2006
Master of Science in Elementary Computer Education,
Thesis title: A Study on How to Organize Concept Knowledge of Computer
Disciplines for the Elementary Level
Gyeongin National University of Education, Incheon, Korea Mar.1995 – Feb.1999
Bachelor of Education (Focus area: Korean Education)