Embed Size (px)
Citation preview
1
FLORIDA AND THE CLEAN POWER PLAN: A STATE, A FEDERAL
REGULATION AND A CLIMATE SITUATION
A thesis presented by
Monique N. Cunningham-Brijbasi, MBA, CESCO
To
Doctor of Law and Policy Program
In partial fulfillment of the requirements for the degree of
Doctor of Law and Policy
College of Professional Studies
Northeastern University
Boston, Massachusetts
June 2016

2
DEDICATION
This doctoral thesis is dedicated to my children, Hayden and Zoë.

3
ACKNOWLEDGEMENTS
I wish to thank all of the air and chemical engineers who have provided guidance and
support throughout this research. Thank you to Patrick Knight at Synapse Energy Economics for
teaching me how to use Synapse’s Clean Power Plan Planning Tool for my research analysis. I
especially thank John Powell, my second reader and supervisor of four years, for always
believing in me and allowing me to harass him with a ton of questions while writing my research
proposal. After all of that, he’s still agreed to be my second reader. Your insights and guidance
have guided me through this journey and made my thesis stronger.
With deep gratitude, I acknowledge the faculty and staff of Northeastern University’s
Doctor of Law and Policy program, especially Dr. Neenah Estrella-Luna, my primary advisor.
Your support and guidance have been instrumental in more ways than I can count. I would also
like to thank Northeastern University’s College of Professional Studies for embracing and
promoting practice-based doctoral level education. Moreover, I cannot go without recognizing
the inimitable and venerable Cohort VIII – my fellow students who have challenged, frustrated,
supported, and entertained me – that has made the past two years a special era in my life. I will
miss joining all of you in the “library” after class.
It would not be fair for me to neglect mentioning my coworkers, friends and family, who
have listened to me cry and vent as they have continued to support me through my journey.
Special thanks go to: Mezline Cunningham-Smith, Vijay Brijbasi, Enid Roberts, Rudolph
Roberts, Yanessy Miranda, Yvette Theodore, Majid Shah, Fadner Theodore, Juan Zamora, Mark
Rogers, and Jeremy Moodie.
4
ABSTRACT
Florida’s unique ecosystem – consisting of porous limestone, coastal property, and
abundant energy resources – is a significant reason for the state government to consider an
environmental policy to mitigate potential threats to the vitality of this ecosystem associated with
current and future climate change. Presently, Florida is already facing concurrent, and often
related, economic and environmental crises that can be linked to inadvertent climate
modifications. Based on readily available measures identified in the Environmental Protection
Agency’s Clean Power Plan to reduce carbon dioxide emissions, this study recommends the state
of Florida implements a climate disturbance and adaptation fee as a method of mitigating risks
associated with inadvertent climate modifications.
5
TABLE OF CONTENTS
Contents
Acknowledgements ......................................................................................................................... 3
Abstract ........................................................................................................................................... 4
Introduction ................................................................................................................................... 12
Changes in the Climate, Human Influence ............................................................................. 14
Climate Modifications ............................................................................................................ 15
Bangladesh .............................................................................................................................. 16
Isle de Jean Charles ................................................................................................................. 16
South Florida ........................................................................................................................... 17
Environmental Policy: Clean Power Plan ............................................................................... 18
Mitigating the Risk of Inadvertent Climate Modifications with Energy Policy ..................... 19
Methods toward Compliance: Meeting the Emission Reduction Goals ................................. 20
Florida’s Energy Future. ......................................................................................................... 20
Compliance Factors ................................................................................................................ 21
Supreme Court Litigation ....................................................................................................... 23
The Path Forward .................................................................................................................... 25
Structure of the Thesis ............................................................................................................ 25
Literature Review.......................................................................................................................... 26
Environmental Economics ...................................................................................................... 26
Impact on different Socio-Economic Groups. ........................................................................ 27
Discount Rate. ......................................................................................................................... 28
Resource Allocation ................................................................................................................ 29
6
Economics of Uncertainty....................................................................................................... 31
Method and Research Design ....................................................................................................... 33
Research Questions ................................................................................................................. 34
Research Framework .............................................................................................................. 35
Research Method .................................................................................................................... 35
Scenario Methodology. ........................................................................................................... 36
Adjusting Values for Cost Benefit Analysis. .......................................................................... 40
Incremental Benefits (PVB). ................................................................................................... 41
Incremental Costs (PVC). ....................................................................................................... 42
Cost-benefit Analysis Ratio. ................................................................................................... 42
Costs and Benefits per Floridian. ............................................................................................ 42
Limitations of Study ............................................................................................................... 43
Ethical Statement .................................................................................................................... 43
Results ........................................................................................................................................... 44
Carbon Dioxide Emissions ..................................................................................................... 44
Generation Change.................................................................................................................. 46
Reference Case........................................................................................................................ 46
Policy Scenario CCR. ............................................................................................................. 47
Policy Scenario CNG .............................................................................................................. 48
Policy Scenario CRE............................................................................................................... 49
Policy Scenario CEE ............................................................................................................... 50
Policy Scenario CCE............................................................................................................... 51
Annual Costs ........................................................................................................................... 52
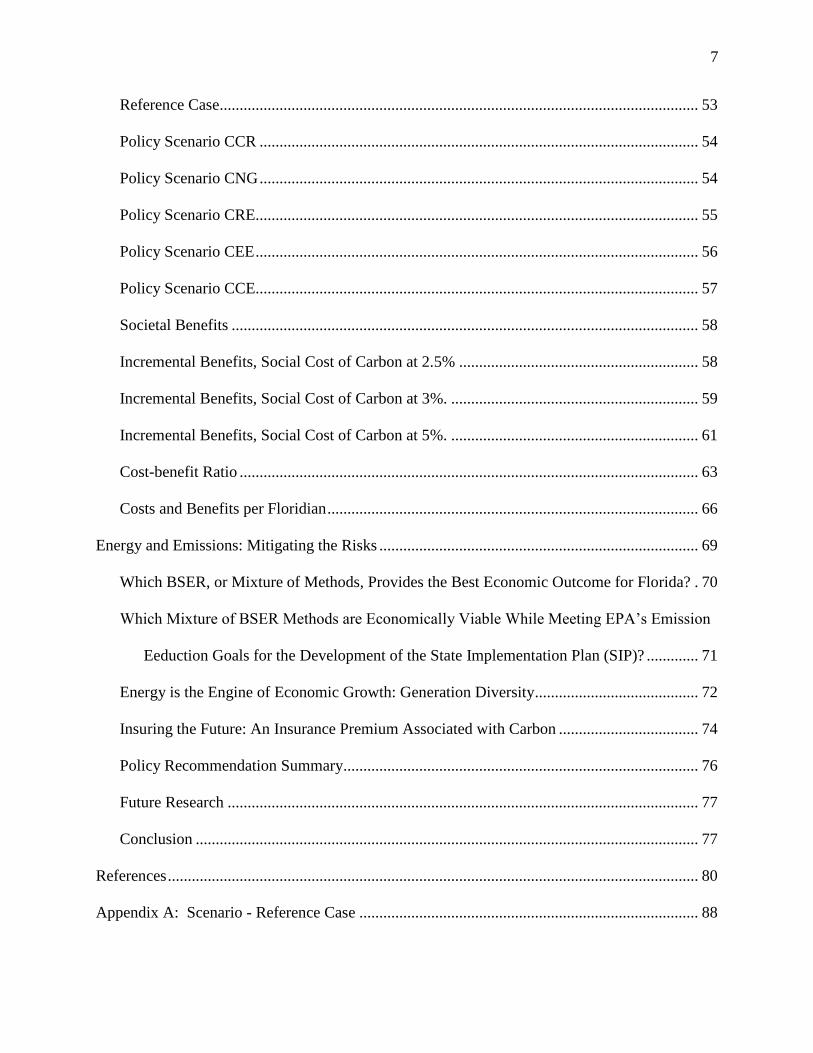
7
Reference Case........................................................................................................................ 53
Policy Scenario CCR .............................................................................................................. 54
Policy Scenario CNG .............................................................................................................. 54
Policy Scenario CRE............................................................................................................... 55
Policy Scenario CEE ............................................................................................................... 56
Policy Scenario CCE............................................................................................................... 57
Societal Benefits ..................................................................................................................... 58
Incremental Benefits, Social Cost of Carbon at 2.5% ............................................................ 58
Incremental Benefits, Social Cost of Carbon at 3%. .............................................................. 59
Incremental Benefits, Social Cost of Carbon at 5%. .............................................................. 61
Cost-benefit Ratio ................................................................................................................... 63
Costs and Benefits per Floridian ............................................................................................. 66
Energy and Emissions: Mitigating the Risks ................................................................................ 69
Which BSER, or Mixture of Methods, Provides the Best Economic Outcome for Florida? . 70
Which Mixture of BSER Methods are Economically Viable While Meeting EPA’s Emission
Eeduction Goals for the Development of the State Implementation Plan (SIP)? ............. 71
Energy is the Engine of Economic Growth: Generation Diversity ......................................... 72
Insuring the Future: An Insurance Premium Associated with Carbon ................................... 74
Policy Recommendation Summary......................................................................................... 76
Future Research ...................................................................................................................... 77
Conclusion .............................................................................................................................. 77
References ..................................................................................................................................... 80
Appendix A: Scenario - Reference Case ..................................................................................... 88
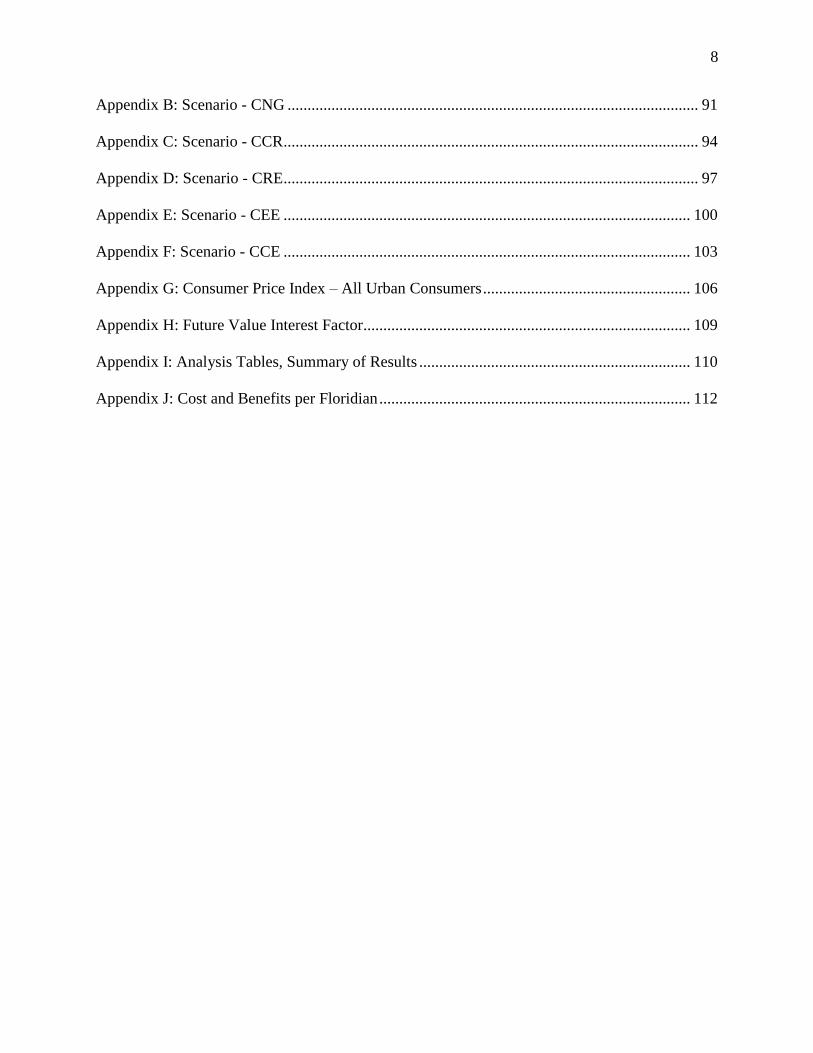
8
Appendix B: Scenario - CNG ....................................................................................................... 91
Appendix C: Scenario - CCR ........................................................................................................ 94
Appendix D: Scenario - CRE ........................................................................................................ 97
Appendix E: Scenario - CEE ...................................................................................................... 100
Appendix F: Scenario - CCE ...................................................................................................... 103
Appendix G: Consumer Price Index – All Urban Consumers .................................................... 106
Appendix H: Future Value Interest Factor.................................................................................. 109
Appendix I: Analysis Tables, Summary of Results .................................................................... 110
Appendix J: Cost and Benefits per Floridian .............................................................................. 112
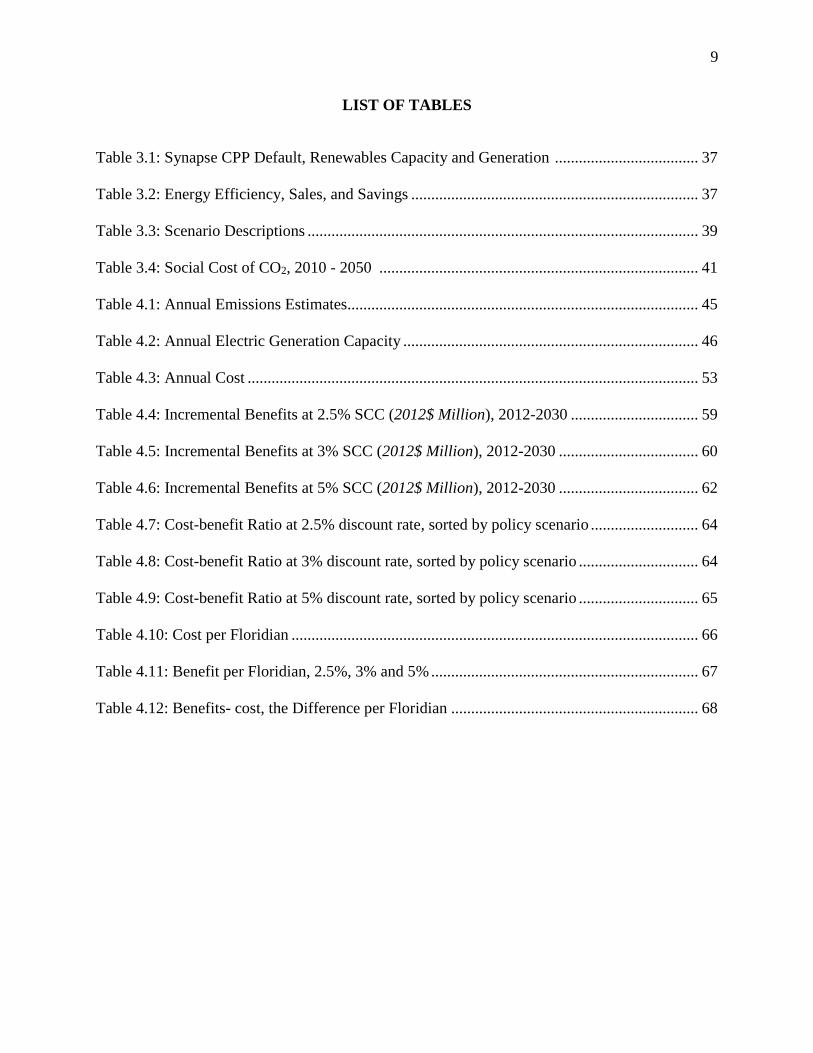
9
LIST OF TABLES
Table 3.1: Synapse CPP Default, Renewables Capacity and Generation .................................... 37
Table 3.2: Energy Efficiency, Sales, and Savings ........................................................................ 37
Table 3.3: Scenario Descriptions .................................................................................................. 39
Table 3.4: Social Cost of CO2, 2010 - 2050 ................................................................................ 41
Table 4.1: Annual Emissions Estimates........................................................................................ 45
Table 4.2: Annual Electric Generation Capacity .......................................................................... 46
Table 4.3: Annual Cost ................................................................................................................. 53
Table 4.4: Incremental Benefits at 2.5% SCC (2012$ Million), 2012-2030 ................................ 59
Table 4.5: Incremental Benefits at 3% SCC (2012$ Million), 2012-2030 ................................... 60
Table 4.6: Incremental Benefits at 5% SCC (2012$ Million), 2012-2030 ................................... 62
Table 4.7: Cost-benefit Ratio at 2.5% discount rate, sorted by policy scenario ........................... 64
Table 4.8: Cost-benefit Ratio at 3% discount rate, sorted by policy scenario .............................. 64
Table 4.9: Cost-benefit Ratio at 5% discount rate, sorted by policy scenario .............................. 65
Table 4.10: Cost per Floridian ...................................................................................................... 66
Table 4.11: Benefit per Floridian, 2.5%, 3% and 5% ................................................................... 67
Table 4.12: Benefits- cost, the Difference per Floridian .............................................................. 68
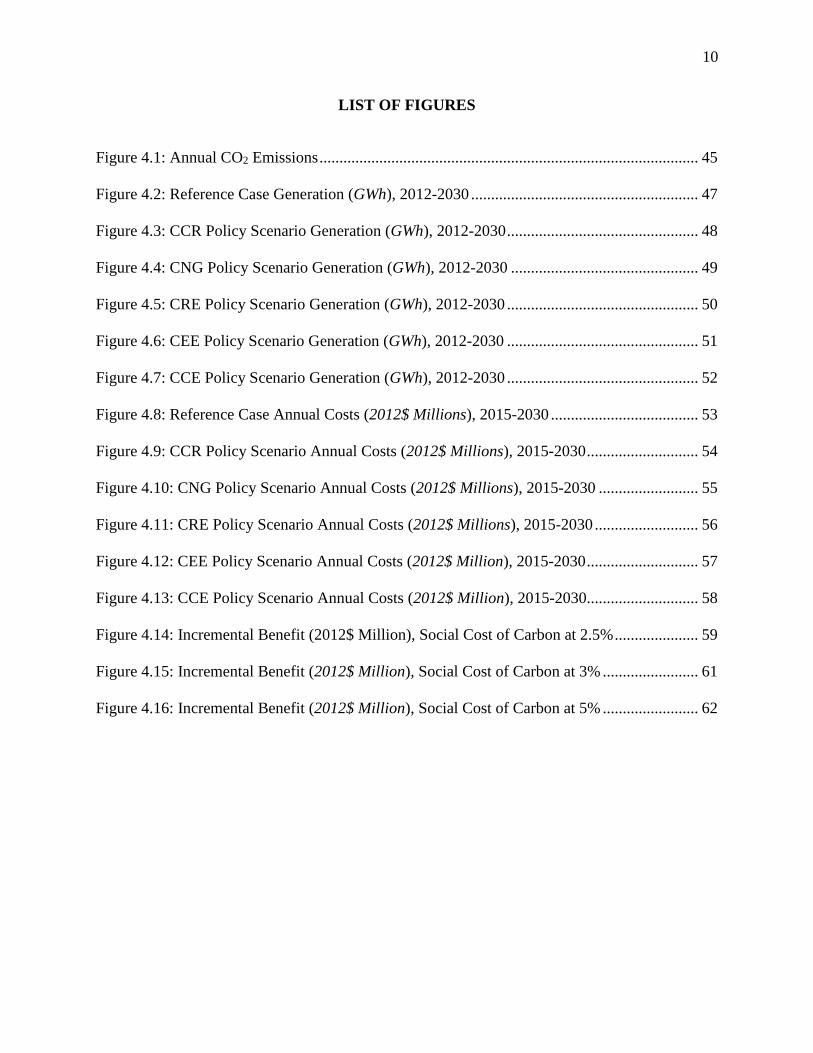
10
LIST OF FIGURES
Figure 4.1: Annual CO2 Emissions ............................................................................................... 45
Figure 4.2: Reference Case Generation (GWh), 2012-2030 ......................................................... 47
Figure 4.3: CCR Policy Scenario Generation (GWh), 2012-2030 ................................................ 48
Figure 4.4: CNG Policy Scenario Generation (GWh), 2012-2030 ............................................... 49
Figure 4.5: CRE Policy Scenario Generation (GWh), 2012-2030 ................................................ 50
Figure 4.6: CEE Policy Scenario Generation (GWh), 2012-2030 ................................................ 51
Figure 4.7: CCE Policy Scenario Generation (GWh), 2012-2030 ................................................ 52
Figure 4.8: Reference Case Annual Costs (2012$ Millions), 2015-2030 ..................................... 53
Figure 4.9: CCR Policy Scenario Annual Costs (2012$ Millions), 2015-2030 ............................ 54
Figure 4.10: CNG Policy Scenario Annual Costs (2012$ Millions), 2015-2030 ......................... 55
Figure 4.11: CRE Policy Scenario Annual Costs (2012$ Millions), 2015-2030 .......................... 56
Figure 4.12: CEE Policy Scenario Annual Costs (2012$ Million), 2015-2030 ............................ 57
Figure 4.13: CCE Policy Scenario Annual Costs (2012$ Million), 2015-2030............................ 58
Figure 4.14: Incremental Benefit (2012$ Million), Social Cost of Carbon at 2.5% ..................... 59
Figure 4.15: Incremental Benefit (2012$ Million), Social Cost of Carbon at 3% ........................ 61
Figure 4.16: Incremental Benefit (2012$ Million), Social Cost of Carbon at 5% ........................ 62
11
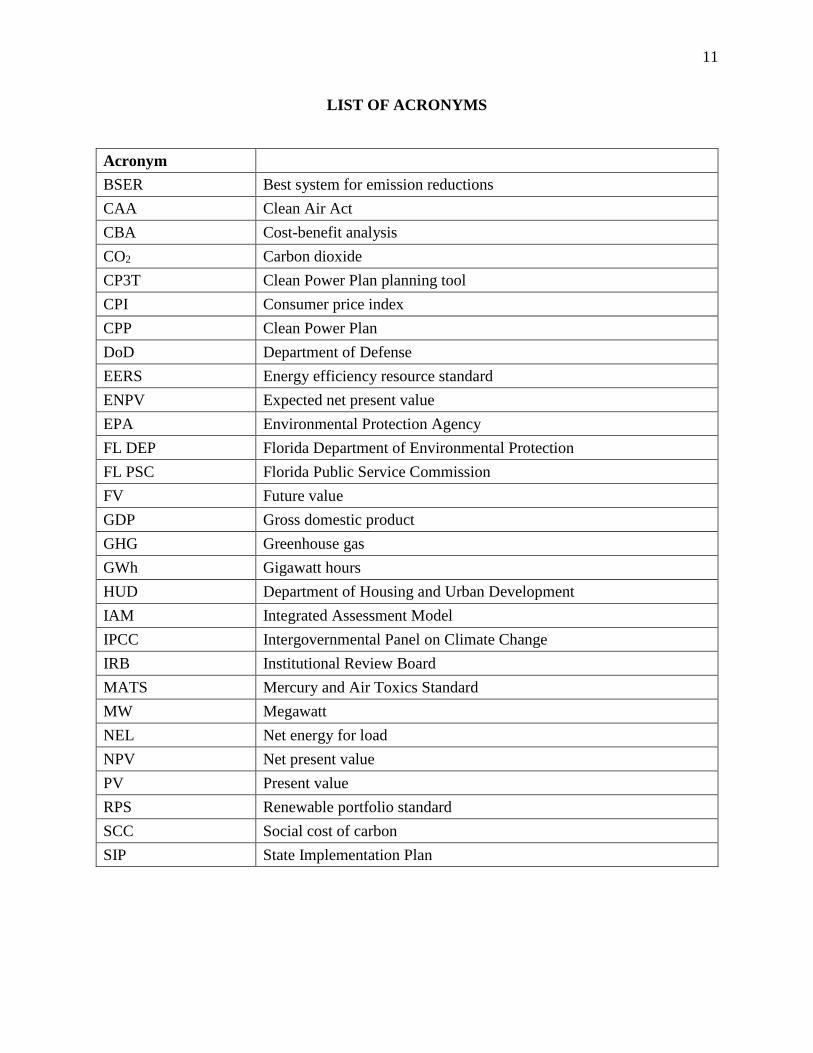
LIST OF ACRONYMS
Acronym
BSER Best system for emission reductions
CAA Clean Air Act
CBA Cost-benefit analysis
CO2 Carbon dioxide
CP3T Clean Power Plan planning tool
CPI Consumer price index
CPP Clean Power Plan
DoD Department of Defense
EERS Energy efficiency resource standard
ENPV Expected net present value
EPA Environmental Protection Agency
FL DEP Florida Department of Environmental Protection
FL PSC Florida Public Service Commission
FV Future value
GDP Gross domestic product
GHG Greenhouse gas
GWh Gigawatt hours
HUD Department of Housing and Urban Development
IAM Integrated Assessment Model
IPCC Intergovernmental Panel on Climate Change
IRB Institutional Review Board
MATS Mercury and Air Toxics Standard
MW Megawatt
NEL Net energy for load
NPV Net present value
PV Present value
RPS Renewable portfolio standard
SCC Social cost of carbon
SIP State Implementation Plan
12
The climate is a common good, belonging to all and meant for all. At
the global level, it is a complex system linked to many of the essential
conditions for human life. – Pope Francis, Encyclical Letter Laudato Si’ of the
Holy Father Francis On Care for Our Common Home
Chapter 1
Introduction
As nations develop their own environmental policies to mitigate rising seas, weather
extremes, and altered precipitation patterns, the citizen response to these strategies will be
economically and politically critical. Accordingly, using tools to mitigate the risk associated
with inadvertent climate modifications can be a useful in evaluating environmental policies
needed to address these changes. An ideal environmental policy is balanced, meet the
environmental and health needs to the public while accounting against the typical business as
usual perspective (Hultman, Hassenzahl, & Rayner, 2010).
Worldwide, the economic risks associated with continued anthropogenic greenhouse gas
(GHG) emissions are beginning to manifest in both local and global environmental catastrophes.
The effects of human-induced stress on the environment have been apparent in rising coastal
water, crippling damage from storm surges, and frequent seasons of extreme heat. Between
2010 and 2015, the U.S. has spent over $242.2 billion dollars responding to weather-related
disasters.
One such disaster has been Hurricane Isaac in 2012, which cost the U.S. approximately
$2.9 billion dollars. A large, tropical cyclone, Isaac has generated storm surges and flooding
throughout many southeastern states, including Florida (National Centers for Environmental
13
Information, n.d.). Costly environmental disasters like Hurricane Isaac continue to place stress
on the national economy.
Thus, it is time for nations, especially industrialized nations, to create policies that
mitigate the risks associated with global warming. Over the last several decades, numerous
climatologists and other scientists have studied the impacts associated with increasing
greenhouse gases (GHGs) on our planet. GHGs, like carbon dioxide (CO2), do not dissipate
quickly; rather, they trap the Sun’s rays within the atmosphere, which causes the planet to get
warmer.
The impacts of this warming have altered weather patterns globally. These atmospheric
fluctuations include droughts, coastal erosion, storm intensity and location, water availability,
flooding, and changes in rainfall pattern (Nordhaus, 2013). The impacts are severe enough that
the U.S. Department of Defense (DoD) (2015) has released a report noting that continued
environmental degradation threatens the financial stability of numerous nations. The DoD
(2015) has also acknowledged that the impacts on the climate are projected to increase over time.
By reviewing case studies, the DoD has recognized that climate risks can exacerbate
socioeconomic problems, thereby generating unforeseen vulnerabilities and potentially causing
conflicts in regions not considered at risk for disturbances (Department of Defense, 2015).
Further, one does not have to leave the U.S. to find areas that are vulnerable to current
climate turmoil. The Southeast region – which includes Alabama, Arkansas, Florida, Georgia,
Kentucky, Louisiana, Mississippi, North Carolina, South Carolina, Tennessee, Texas, and
Virginia – has recently experienced the downside of growth in their manufacturing and energy
production sectors, in the form of increases in carbon emissions.
14
Florida is one of several coastal communities that has the potential to see catastrophic
losses from rising sea levels. According to a risk analysis conducted by the Risky Business
Project, existing property in Florida has the potential be damaged by global warming events,
costing the state between $5.6 billion and $14.8 billion by 2030 (Kinniburgh, Bloomberg,
Paulson, Jr, & Steyer, 2015). Significant losses of public and private property along the state’s
8,436 miles1 of coastal shoreline will negatively impact Florida’s economy, particularly the
tourism industry. At Increasing temperatures will also increase pressure on the energy industry to
meet skyrocketing demands for electricity. In order to meet the demand, the state will need to
generate exponentially growing amounts of electricity to feed the grid, which will lead to an
increase in electricity rates to cover the associated costs (Staletovich, 2015; Kinniburgh, Greer
Simonton, & Allouch, 2015).
Changes in the Climate, Human Influence
In recent decades, industrial nations have worked to reduce their contributions to
atmospheric pollution. These efforts have taken the forms of endangered species protection and
cleaner air and water, resulting in an improved quality of life. However, these policies have not
addressed a growing national dependency on fossil fuels. Environmental sinks are unable to
absorb continually increasing GHG emissions from industrial growth and depleted resources.
The severe weather events resulting from such emissions beget serious social and
economic consequences. In May, 2014, the National Climate Assessment Report found that over
1 The shoreline coastline mileage of the outer coast, offshore islands, sounds, bays, rivers, and creeks are included to
the head of tidewater or to a point where tidal waters narrow to a width of 100 feet. Source: NOAA Office for
Coastal Management, General Coastline and Shoreline Mileage of the United States:
https://coast.noaa.gov/data/docs/states/shorelines.pdf
15
the past decade, various weather-related events have caused significant disruptions and damage
to infrastructure and agriculture. Between 2013 and 2014, the U.S. experienced 17 different
weather disaster events, resulting in 166 deaths, with estimated losses of $41 billion dollars
(National Centers for Environmental Information, n.d.).
Moreover, the Intergovernmental Panel on Climate Change’s (IPCC) 2014 Climate
Change Synthesis Report finds that changes in global temperatures, specifically decreasing
occurrence of cold days and nights and increasing frequency of warm days and nights, are likely
consequences of some human influence. These climatic changes are expected to result in
changes in the frequency and intensity of temperature extremes. Population size, lifestyle
choices, energy consumption, economic activity, and land use patterns contribute to
anthropogenic GHG emissions.
Climate Modifications
The continuous debate about whether current climate patterns are a result of
anthropogenic or natural influences seems to be rhetoric with no logical purpose. Assuming that
these climate disturbances are purely natural, it still may not make sense for the world’s
population to continue to exhaust the planet’s natural resources. David Atkinson, of the Arctic
Research Center, shows that regardless of whether climatic disruptions are caused by human
activity or natural cyclical changes, there are still people who are experiencing the impacts of
such atmospheric turmoil in the present (Nash, 2010). Entire communities in the U.S., as well as
globally, are finding that they are unable to continue the ways of life they are accustomed to due
to extreme weather events, sea level rise, erosion, and the loss of natural resources on which to
survive.
16
Some communities are facing the need to either relocate due to climatic changes
impacting their ecosystems. Areas like South Florida, Isle de Jean Charles, Louisiana, and
Bangladesh are just three examples of communities dealing with worsening climate patterns.
Unlike the other two, however, South Florida is not dealing with human rights violations, like
those of the indigenous people of Isle de Jean Charles.
Bangladesh. Bangladesh is a well-known example of disappearing coastal communities.
The city’s environmental tragedies are not confined to coastal flooding; instead, impacts include
changes in precipitation, increased cyclone intensity, and increased temperature. Many families
in Bangladesh have fled their coastal communities to relocate to the capital, Dhaka. Generally,
these displaced families live in the slums of their new cities.
This migration from coastal communities to the slums has created another epidemic as a
result of inadvertent climatic modifications: the health risk crisis. In 2007, the capital of
Bangladesh was home to 13.5 million people. By 2025, it hosted 22 million people. Neither the
city nor the country of India is able to meet the demand from its growing population. Common
consequences of overcrowding include sanitation issues, poor drainage, and fresh water scarcity.
Approximately one-third of Bangladesh’s population lives below the poverty line, and
approximately 17% live in extreme poverty (Shaw, Mallick, & Islam, 2013).
Isle de Jean Charles. Isle de Jean Charles, an island south of New Orleans, Louisiana, is
home to the Biloxi-Chitimacha-Choctaw Indians. Traditionally known as a fishing, trapping,
and hunting culture in Terrebonne Parish, this community has found itself inundated with water,
making it impossible for many to stay. Moreover, oil and gas companies have spent years in this
area dredging canals to run pipelines along Louisiana’s coast. Doing so has removed the barrier
17
of marshes protecting Isle de Jean Charles from storm surges (Maldonado, Shearer, Bronen,
Peterson, & Lazrus, 2013).
The continuous loss of land from dredging, erosion, sea level rise, and storm surges has
resulted in the U.S.’ first climate refugees. The Department of Housing and Urban Development
(HUD) awarded $48 million to relocate the entire community. HUD’s program director for the
grant, Marion McFadden, has stated that the agency must be “cognizant of the obligation to
taxpayers to not throw good money after bad” (Davenport & Robertson, 2016). Every analysis
of the remaining land has shown that the problems outweigh any feasible solutions to save the
community (U.S. Army Corps of Engineers – Mississippi Valley Division, 2013). Accordingly,
the current residents must agree to relocate to drier land, losing the land they have called home
for decades.
South Florida. In 2009, Monroe, Miami-Dade, Broward, and Palm Beach counties held
their first Southeast Florida Regional Climate Leadership Summit, during which leaders from
each county came together to discuss current and future climate pattern issues impacting their
communities. This summit led to the formation of the Florida Regional Climate Change
Compact. The goal of the Compact focused on coordinating advocacy efforts towards state and
federal policies, developing programs for mitigation and adaption strategies, and keeping the
lines of communication open between the four counties so that they may identify emerging
issues around climate resiliency. Serving over 5.6 million residents, these counties decided to
develop and advocate for policy reform because the impacts of inadvertent climate modifications
were affecting their communities (Southeast Florida Regional Climate Change Compact
Counties, 2012).
18
South Florida’s beaches are currently eroding away and coastal communities are
investing millions of dollars to protect the shoreline. As noted by a local reporter, “Even if
climate change isn’t to blame for the increased local erosion that followed Hurricane Sandy,
rising sea levels and expectations for intensified future storms is already affecting the decisions
about how to reconstruct roads and shorelines” (Reid, 2013). Coastal communities throughout
the state are seeking methods for the establishment of a climate resilient infrastructure – to
address current and future shoreline damage.
In 2013, the Compact worked to identify which roads, bridges, and airports were at risk
for storm surges, flooding, and sea level rise. Once identified, the counties worked on a plan to
determine which vulnerable infrastructures should be repaired and which should be built
elsewhere. The city of Miami Beach invested $500 million to install pumps throughout the
island to raise roads and seawalls. This measure mitigated damage caused by continuous sunny
day flooding that was occurring during the seasonal high tides (Flechas & Staletovich, 2015).
Environmental Policy: Clean Power Plan
Following the 2014 Climate Assessment Report, President Obama initiated global
warming legislation at the national level. The White House crafted the President’s Climate
Action Plan, which directed the EPA to reduce CO2 emissions from the electric utility sector. In
response, the EPA drafted the Clean Power Plan (CPP) to reduce the country’s CO2 emissions
from existing electric generating units by allowing states to develop an emissions reduction plan
consistent with their specific economic conditions, energy market, and energy generation
opportunities.2 The EPA’s intention for the CPP was for compliance to be flexible,
2 The CPP focuses exclusively on existing units. This rule does not focus on new units.
19
acknowledging that different states had unique opportunities to cut carbon emissions while
satisfying their energy demands.
In order for the EPA to meet this objective, several environmental economic models have
been utilized to determine which method allows the electric utility sector to reduce CO2
emissions while providing affordable electricity to their customers. Utilizing standard
environmental economic modeling, the EPA estimate that the CPP will reduce annual CO2
emissions by 32 percent below 2005 levels by 2030 (Clean Power Plan for Existing Stationary
Sources, 2015, sec. 40 CFR Part 60). The proposed CPP utilizes three methods that provide a
roadmap toward reducing carbon pollution.3 The final CPP establishes a uniform national CO2
emission performance rate for stationary combustion turbines (natural gas combined cycle) and
fuel-fired electric steam units (coal, natural gas, or oil). The final standards comprise the
foundation for EPA’s state-specific emission reduction goals.
Mitigating the Risk of Inadvertent Climate Modifications with Energy Policy
In order to protect its citizens, each nation must evaluate how it will mitigate the risks
associated with climate change. To date, only a few countries have attempted to quantify and
develop policies to mitigate the risks associated with climate disruptions. In the U.S., the CPP
serves as a first step in mitigating the risks associated with anthropogenic GHG emissions. If
industrialized nations reduce their emissions, the continued pressures on the world’s
environmental sinks may subside significantly. This reduction may stifle global temperature
increases, normalize precipitation patterns, and reduce land erosion in coastal communities.
3 The final BSERs focus on supply-side measures that reduce emissions from power plants, and do not rely on
demand-side energy efficiency (EE) as a building block. The EPA anticipates that, due to its low costs and potential
in every state, demand-side EE will be a significant component of state plans under the Clean Power Plan.
20
However, developing an effective environmental policy requires regulators to consider
the economic viability of the policy. Mitchell Polinsky (2011) shows that economic efficiency
considers the relationship between any set of cumulative benefits and the associated costs. Thus,
the EPA has determined that the CPP will have an economic impact on the electric utility sector,
and the benefits outweigh the actual cost to comply. These benefits include public health safety
and energy security.
There are concerns, however, that the CPP will increase net costs, which will be passed
down to electric company customers. An internal EPA analysis does show that customers will
experience some increase in electricity rates; but, over time, these costs will decrease (Hibbard,
Okie & Tierney, 2014). Hence, the EPA’s challenge is in finding a balance between the costs
and benefits of maintaining clean air in growing economies. As states enter this new frontier in
energy policy, investors will have to evaluate which technologies they support to reduce
emissions from the energy sector, while maintaining strong local economies (Staff, 2007).
Methods toward Compliance: Meeting the Emission Reduction Goals
The EPA uses 2012 as the baseline year from which to make a determination of the
emission reduction goals for each state. The CPP provides both states and electric companies
numerous options for reducing CO2 emissions. The emission reduction goals are tailored to the
electricity needs and capabilities of each state. In addition, the states may utilize other methods
to achieve their emission reduction goals. These outlined options include, but are not limited to,
investing in energy efficiency programs, renewable energy, fuel switching, and reducing use of
coal-fired electricity generation.
Florida’s Energy Future. For electricity generation, Florida’s fuel of choice has long
been natural gas. In 2011, the state saw an increase of natural gas to 57.7% of the net energy for
21
load (NEL). According to Florida’s Public Service Commission’s 2012 Ten-Year Site Plan,
utility companies throughout the state are encouraged to reduce their consumption of natural gas
by substituting more renewable energy and nuclear generation. In the 2015 Ten-Year Site Plan,
renewable energy is predicted to provide 1,638 MW of generation capacity, accounting for 2.8%
of overall state generation capacity.
In addition to renewable energy, Florida’s utilities must consider how to make consumer
energy consumption more efficient, improve efficiency standards for new construction, and
encourage energy efficient appliances for residential and commercial customers (Florida Public
Service Commission, 2015). Between the inclusion of energy efficiency programs, fuel load
switch, and increasing renewable energy capacity, Florida’s electric utilities will either need to
continue their normal business operations, or make additional adjustments to achieve the
emission reduction goals set by the EPA.
Compliance Factors
The EPA has assigned each state specific emission reduction goals. However, the EPA’s
CPP does not dictate how these standards are to be reached (Oates & Jaramillo, 2015). The EPA
requires states to develop and submit a state implementation plan (SIP) that establishes carbon
dioxide performance standards for the electric utility sector (Glaser, McGuffey III, & Gaines,
n.d.). These standards can be satisfied by establishing a best system of emission reductions
(BSER), which enable states to cut carbon emissions while meeting their energy demands and
maintaining economic growth (Oates & Jaramillo, 2015).
Depending on a state’s electricity production mix, it may elect to abstain from developing
a SIP. Similar to the Affordable Care Act, if a state does not submit a SIP to the EPA, then the
22
EPA will create a federal plan in lieu of the SIP (Glaser et al., n.d.). Ideally, each state should
create an SIP that considers the most economically efficient plan to minimize cost increases to
utility customers, or at least reduce costs over time. In the process, states that make an effort to
satisfy the SCC will have a better understanding of the potential economic and health benefits
associated with the CPP.4
The final rule allows states to select which approach they will use to achieve their
emission reduction goals. This includes either an emissions standards approach or a state
measures approach. If a state pursues an emissions standards approach, it will be required to
implement the federally enforceable emissions rate standards at the affected unit level. This
approach has the potential for multi-state collaborations with an emission rate or mass-based
trading system.
The state measures approach provides states with the flexibility to achieve the equivalent
CO2 emission standards by using the emissions standards at the unit level in conjunction with
other standards that are enforceable by the state. If these enforceable plans do not achieve their
targeted emission reduction goals under the state measures approach, the federally enforceable
standards will take precedent.
4 The SCC does consider the economic and health benefits to some extent. However, these marginal economic and
health costs and benefits are only estimates. Several research studies, as well as the EPA’s Regulatory Impact
Analysis, argue that it is impossible to determine all of the economic and health benefits. What is included in the
SCC currently can only be considered a limited estimate of economic and health benefits, since there is no real
consensus on the calculations.
23
Supreme Court Litigation
On June 29, 2015, the Supreme Court, found that the EPA should have considered cost
when it published the Mercury and Air Toxics Standards (MATS) (Michigan v. EPA, 2015). The
MATS rule was designed to protect the public from mercury emissions and other air pollutants.5
The Supreme Court’s decision regarding the MATS rule played a pivotal role in the
considerations for CPP. The Court decided that the EPA could establish that a regulation was
“appropriate and necessary” if the agency considered compliance costs at the onset of the
rulemaking process. The EPA did not consider the cost of compliance when they enacted the
MATS rule. The cost concerns at the center of the mercury rule decision did not apply to the
CPP, since the CPP was drafted under a different Clean Air Act (CAA) provision that explicitly
required the EPA to consider cost. Moreover, the flexibility under the CPP allowed states to
choose the best method to reduce CO2 emissions by using the most cost effective method
available.
In early 2016, 29 states, including Florida, petitioned the Supreme Court to issue a stay
pending the D.C. Circuit’s review the CPP. The states argued that the CPP was an unattainable
and burdensome regulation (State of West Virginia, State of Texas, et. al v. United Stated
Environmental Protection Agency, and Regina McCarthy, 2016, p. 10). In an unprecedented
decision, the Supreme Court ruled in favor of the CPP. The states and industry groups asserted
that EPA’s shifting of electricity generation from fossil fuels to other sources was outside the
5 The EPA determined that “mercury is highly toxic, persistent, and bioaccumulates in food chains”, and therefore
was “appropriate and necessary” to regulate emissions under §7412. However, this decision was made without any
consideration of costs. (Brief of the Federal Respondents, State of Michigan v, Environmental Protection Agency, et
al., Utility Air Regulatory Group v. Environmental Protection Agency, et al., National Mining Association v.
Environmental Protection Agency, et al., 2015).
24
scope of the provision in the CAA. 6 Accordingly, the states were not required to begin working
towards satisfying the terms of the CPP until the D.C. Circuit completed its review. The goal in
petitioning was to prevent a similar outcome to that of the Michigan v. EPA, 135 S. Ct. 2699
(2015) decision. Because the regulation being challenged in this case was not maintained, states
were required to comply with a law that was later overturned by the Supreme Court.
The Court’s decision to order a stay suggested that a majority in the Court were
questioning whether the EPA had the authority to use the CAA to craft the CPP. The Attorney
General’s response to the motion argued that the CPP “identifies highly cost-effective and
proven emission-reduction strategies that are already widely employed by power plants”
(Respondent EPA’s Opposition to Motions to Stay Final Rule, State of West Virginia, State of
Texas, et. al v. United Stated Environmental Protection Agency, and Regina McCarthy, Docket
#1586661, 2015).
In a separate brief opposing the stay, respondents, including several South Florida
communities, asserted that any stay ordered by the Court would cause irreversible harm to many
areas in the U.S. that were already experiencing the effects of a modified climate pattern. This
legal battle seemed to utilize the same data to support different conclusions. The petitioners in
this case pointed to a decline in the nation’s coal industries as a result of the regulations placed
on the energy generating facilities, forcing them to switch to other fuel sources. The
respondents, in contrast, used the same data to argue that, as natural gas prices continued to
decline, natural gas had become a cost-competitive solution for utilities to switch to. This
6 Generation shifting, as noted in the petition, is what the EPA is employing to shift electricity generation from fossil
fuels to renewable energy. The EPA is using Section 111(d) to support its crafting of the CPP.
25
dispute among states, utilities, local government and communities, and environmental groups has
continued into the latter part of 2016.
The Path Forward
This research evaluates the opportunities associated with the implementation of the
CPP. Using standard environmental economic methods, the analysis of the CPP will help guide
states in determining the economic impacts of this energy policies. The CPP will undoubtedly
force Florida’s power generation sector to spend a significant amount of money in order to
comply with the regulation. However, doing nothing will cost future Floridians financially and
affect their communities (Kinniburgh, Greer Simonton, et al., 2015). As evidence, Miami Beach
is currently investing $400-$500 million to pump flood water associated with king tides from the
streets into the bay (Flechas & Staletovich, 2015). Thus, past ignorance of CO2 emissions is
forcing coastal communities to spend resources for pumping systems with the hope that these
systems will help save their homes.
Structure of the Thesis
In the next chapter, a brief literature review of environmental economics, resource
allocation, and the economics of uncertainty is outlined. In Chapter 3, this study’s research
methodology is described in detail, including each policy scenario and overview of the cost-
benefit analysis. Chapter 4 is a detailed analysis of the results, covering the policy consequences
from each scenario in terms of emissions, generation, costs, societal benefits, as well as the costs
and benefits per Floridian. In Chapter 5, an evaluation is made of the CPP which demonstrates
that the environmental health benefits outweigh the cost to comply. The analysis shows that
there are available methods by which Florida can combat current and future climatic change. It
is argued that the use of a carbon fee will help Florida to finance climate resilient activities.
26
Chapter 2
Literature Review
This literature review surveys various methods used when developing a policy to address
possible environmental impacts. The goal of the Clean Power Plan (CPP) is to reduce
greenhouse gas (GHG) emissions from the electric utility sector. In order for the Environmental
Protection Agency (EPA) to meet this objective, several environmental economic models have
been utilized to determine which method would allow the electric utility sector to reduce carbon
dioxide (CO2) emissions while providing affordable electricity to their customers (Clean Power
Plan for Existing Stationary Sources, 2015, sec. 40 CFR Part 60).
Environmental Economics
Evaluating environmental resources draws from two major areas: economic goods and
free goods. An economic good is “anything which yields utility to someone and which is scarce”
(Asafu-Adjaye, 2000). If the total supply is less than the demand, then it is scarce. In contrast, a
free good represents a good in enough supply “to satisfy everybody’s wants at a zero price”
(Sullivan & Arias, 1972). Air is commonly considered to be a free good. However, pollution
emitted into the air has a cost associated with it, and these costs should be accounted for in the
development of environmental and energy policy.
Executive Order 12866, issued by President William J. Clinton in 1993, requires agencies
to use a cost-benefit analysis to determine the impacts of a pending regulation. The social cost of
carbon (SCC) is one method of calculating these costs. It allows agencies to incorporate the
benefits of reducing CO2 emissions into their cost-benefit analyses of “regulatory actions that
have small, or ‘marginal’, impacts on cumulative global emissions” (Environmental Protection
Agency, 2010, p. 2).
27
More specifically, the SCC represents the “incremental damage caused by the emission
of an incremental unit of CO2” (Hatase & Managi, 2015, p. 243). These incremental increases in
GHGs include “net agricultural productivity, human health, property damages from increased
flood risk, and the value of ecosystem services due to climate change” (Environmental Protection
Agency, 2010, p. 2). For the CPP, the EPA has determined that the costs will range from $40 per
short ton of CO2 in 2020, to $48 per short ton of CO2 in 2030 (Clean Power Plan for Existing
Stationary Sources, 2015, sec. 40 CFR Part 60).7
Impact on different Socio-Economic Groups. Kaswan’s (2014) research evaluates the
benefits and drawbacks associated with policies designed to reduce emissions, and how these
policies impact various socio-economic groups. The continued increase of greenhouse gases has
the potential to negatively affect every socio-economic group, especially those without the
resources to cope with and respond to a changing climate. Accordingly, the Department of
Defense (DoD) has announced that modifications to climate patterns “will aggravate problems
such as poverty, social tensions, environmental degradation, ineffectual leadership and weak
political institutions that threaten stability in a number of countries” (Frelinghuysen, 2014). The
problems noted by the DoD are comprised of actual costs associated with anthropogenic GHG
emissions. However, the costs associated with reducing emissions while slowing the rate of
inadvertent climate modifications will require a reduction in price of many goods and services
(Nordhaus, 2013). New technologies to reduce emissions will most likely require costs to be
7 According to Table 1 of the CPP, the EPA has determined that the climate benefit estimate reflects global impacts
from CO2 emission changes and does not account for changes in non-CO2 GHG emissions. Also, discount rates
applied to SCC are different from other estimates because CO2 emissions are long-lived and damages occur over
many years. The benefit estimates in this table are based on the average SCC estimated for a 3% discount rate;
however, it is important to consider the full range of SCC values. As shown in the RIA, climate benefits are also
estimated using the other three SCC estimates (model average at 2.5 percent discount rate, 3 percent, and 5 percent;
95th percentile at 3 percent). The SCC estimates are year-specific and increase over time.
28
passed to customers, directly affecting citizens of the lower socio-economic classes. For
example, the reduction of CO2 emissions in fuel economy for equipment used for farming may
have an increased the prices of equipment and the products produced.
Discount Rate. The discount rate is an essential economic analysis tool to determine the
effectiveness of an environmental policy. The discount rate accounts for the expected net present
value (ENPV) of a project at a constant rate equivalent to the net present value (NPV) decreasing
over time. Currently, each country uses its own method of calculating discount rates. Thus,
economists are generally unable to agree on “what is the appropriate value of an uncertain
future” (Weitzman, 2001). Arrow et al. (2013) notes that in the United States, the discount has
remained constant at 3%. Other countries, like the United Kingdom and France, use a declining
discount rate that addresses the “rate at which society is willing to trade consumption in the
future for consumption today” (Arrow et al., 2013, p. 349).
Since the discount rate considers future policy implications, the use of a constant rate
versus a declining rate should be compared. Should future generations be held less accountable
for current policy decisions? The time preference accounts for societal needs to receive goods
and services right away, while deferring costs to future generations (HM Treasury, n.d.)
According to the HM Treasury’s The Green Book: Appraisal and Evaluation in Central
Government, projects with a timeframe that exceeds thirty years, like the CPP, should use a
declining discount rate. However, the EPA has utilized a constant discount rate of 3% to
determine the potential benefits from reducing emissions. In addition to the 3% discount rate,
the EPA notes that its Regulatory Impact Analysis has determined climatic benefits at 2.5 %, 3
%, and 5% values (Environmental Protection Agency, 2015).
29
Resource Allocation
The CPP attempts to achieve Pareto efficiency by dividing resources while trying to
provide equitable solutions to all stakeholders. The goal of environmental policy generally
presumes that no group of people should exploit environmental resources to the detriment of
others (Sullivan & Arias, 1972). Therefore, the goal outlined by the EPA to reduce CO2
emissions could be viewed as an attempt to achieve Pareto efficiency through careful
management of energy markets. Through the allocation of resources to improve the lives of
many.
Richard Bishop (1993) illustrates how economic efficiency is achievable through the
market. Markets and governmental policies create incentives and rules to help achieve economic
efficiency. The CPP encourages states to become more energy efficient while considering their
energy markets. Reducing emissions through energy efficiency policies is one of the most
efficient methods to effectively preserve an energy supply (Yearwood, Travezan, Harmsen, &
van Toledo, 2013).
Regulators and financial markets alike are constantly considering how weather patterns
are changing, especially storm intensity, flooding, and droughts. Under these circumstances,
environmental policies and risk management are similar in that the determination of fairness
must be distributed to all individuals. Hultman et al. (2010) details how achieving a Pareto
efficient environmental policy and risk management can be considered together:
Climate change and associated policy responses raise many
questions familiar to risk management, including the relative
importance of familiar and unfamiliar risks, the fairness of their
distribution, the credibility of different sources of knowledge and
expertise, and our attitudes toward others from whom the threat
30
originates or who are responsible for preventing or failing to
prevent the unwanted outcome.
The CPP is an example of the EPA’s attempt to achieve Pareto efficiency by searching
for equitable solutions to meet the needs of all stakeholders. As with any policy, there are
economic costs associated with the CPP’s goal to reduce emissions. These economic costs must
be taken into consideration when assessing how to comply with this regulation. Due to the
unique resources and energy demands within each state, the economic impact will vary by state.
As such, each state requires a unique framework to achieve the EPA’s emission reduction goals.
It should be noted that there are differences between energy efficiency and economic
efficiency. However, in order to be considered a sustainable policy the CPP must consider the
environment, social equity, as well as economic viability. (Gillingham, Newell, & Palmer, 2009;
Thiele, 2013). The future welfare of all stakeholders should be considered throughout the policy
development process. The continuous economic growth of society, without policies in place to
combat inadvertent climate modifications, will most likely result in damage to the planet.
Stagnant economic growth will result in less damage, but will render more members of society at
an economic disadvantage in their ability to their environment.
Balancing economic growth and reducing environmental impact is a dilemma. An
environmentally sound policy should also consider the socio-economic impacts by considering
how the policy will protect citizens who are at risk from inaction (Thiele, 2013). The growing
desire for a higher standard of living may result in a better economic future for later generations
within an environment unable to sustain itself (Nordhaus, 2013).
31
Economics of Uncertainty
Emissions from CO2 have the potential to be controlled through the implementation of
policies to reduce the potential burden on future generations. In a report completed by Risk
Business, climate change has been compared to “an interest-only loan we are putting on the
backs of future generations” (Gordon, 2014). At the current rate of continuous GHG emissions,
future generations may not have the capability to mitigate impacts from environmental
deterioration. This leaves future generations to deal with an uncertain future.
Traditionally, economic theory assumes the decisions related to the consumption,
investment, and production of materials are made by impartial experts. The uncertainty in these
decisions is “ignored or explicitly ‘assumed away’” (BORCH, 1968). Implicitly, uncertainty is
not realistic to ignore. These uncertainties are accounted for by spreading the risk. The most
common risk aversion method is known as insurance, a bond or note that is paid now for use
later, and is dependent on the occurrence of particular events. By pooling the risk associated
with flooding, fire, or weather events, the insurance carrier is able to insure millions against
unpredictable occurrences. The insurance policy places a monetary value on every positive and
negative event tied to an insurance premium. This shift in the portfolio influences an
individual’s attitude toward the risk (Arrow, 1971).
The risk-sharing contracts (i.e., insurance policies) are dependent upon proportionate
collections from everyone in the risk pool. The use of insurance as a method to mitigate the
impacts associated with climate disturbances becomes a public good; everyone benefits from
spreading the risk. As such, an insurance policy that Floridians pay into can become a cost-
sharing mechanism that could fund climate mitigation efforts throughout the state.

32
The cost of carbon is highly contested and economists continually debate how to
calculate it. While that debate continues, coastal communities are forced to address and finance
their perpetual climate uncertainty. Should a cost-benefit analysis of compliance with the CPP
show excess monetary benefits, it could serve as a basis for the state’s insurance premiums for
risks related to inadvertent climate modifications.
33
Chapter 3
Method and Research Design
This research evaluates the potential economic impacts of the Clean Power Plan (CPP) on
the state of Florida. By using a straightforward cost-benefit analysis (CBA), estimates of the
long-term effects the CPP may have on Florida stakeholders have been calculated. Similar to a
study published by the Center for Climate and Energy Solutions, the goal of this analysis is to
provide high-level insights with which to guide policymakers and stakeholders through the
implementation of the CPP, or the implementation of any carbon dioxide reduction policy for
Florida.
The underlying assumptions and calculations crafted by the Environmental Protection
Agency (EPA) have been designed to create state-specific emission reduction targets, as well as
develop a standard CO2 emission performance rate. The CPP proposes multiple methods that
states may use to reduce carbon pollution from the electric utility sector. Conversely, there are
economic costs associated with CPP’s emission reduction policy. These economic costs must be
taken into consideration when analyzing how to comply with this regulation.
Due to the unique resources and energy demands within each state, the economic impact
of complying with the CPP varies by state. Thus, it is expected that each state will develop a
unique framework to achieve the EPA’s emission reduction goals. Accordingly, this study has
two goals. The first is to determine which predictive methods have the potential to provide
Florida with the best set of tools for achieving the emission reduction goals outlined in the CPP.
The second is to determine if the potential costs outweigh the benefits, and how the
implementation of these actions may impact Floridians in the future.
34
The proposed CPP applies four best systems for emission reduction (BSER)8 standards,
using a state’s 2012 baseline emissions to derive an attainable emission threshold for each state.
The four BSER approaches are as follows: (1) heat rate/efficiency improvements to coal plants;
(2) re-dispatch from high emitting sources to low emitting sources, like natural gas combined
cycle units; (3) investing in renewable energy by generating electricity from low-to-zero
emission sources; and (4) efficiency savings from demand side energy (EPA Webinar, 2014). In
its final draft of the CPP, the EPA removed BSER 4 and significantly modified approaches 1-3.
The new BSER approaches include the following: (1) improving energy efficiency of coal and
oil-fired steam turbines; (2) shifting load from high emitting sources to low emitting sources; and
(3) increasing the amount of renewable megawatts within the generation mix (Clean Power Plan
for Existing Stationary Sources, 2015, sec. 40 CFR Part 60).
Research Questions
This research addresses the following questions: (1) Which BSER, or mixture of
methods, can provide the best economic outcome for the Florida? (2) Which mixture of BSER
methods are economically viable while meeting the EPA’s emission reduction goals for the
development of a State Implementation Plan (SIP)?
With the results from this analysis, the Florida Department of Environmental Protection
(FL DEP) and other policymakers may gain some insight on how the state might comply with the
CPP. According to the EPA, the CPP will reduce emissions of CO2 and other air pollutants from
8 Under the Clean Air Act, section 111(d), the state plans must establish standards of performance that
reflect the degree of emission limitations achievable through the application of best system for emission reduction
(BSER) that, taking into account the cost of achieving the reduction and any air quality, health and environmental
impacts, and energy requirements.
35
the electric utility sector. Since each state is able to select which method it will use to reduce
emissions, the cost of compliance will vary. Therefore, this research focuses on calculating the
cost of compliance for Florida. Ultimately, this study aims to provide recommendations to the
FL DEP, or to the EPA, in the development of Florida’s SIP.9
Research Framework
The goal of this research is to determine which compliance methods might be best for
Florida to pursue in order to comply with the CPP. The research will not consider the recent stay
by the U.S. Supreme Court, current litigation before the federal appellate court, or the possibility
of future changes to policy direction. The flexibility of the CPP provides a framework within
which states can select methods to implement in order to reduce CO2 emissions, even though it is
not through a federal mandate. Florida’s unique ecosystem of porous limestone, property along
the coast, and energy production mix are significant reasons for the state to consider an
environmental policy that may mitigate the risks associated with modifications to climate
patterns, regardless of litigation outcome.
Research Method
This study seeks to evaluate the effects of policy actions and related opportunity costs.
To do so, modeling framework is used to describe any efficiency gains and losses. Synapse’s
Clean Power Plan Planning Tool (CP3T) has been used for all methodological considerations.10
9 If the FL DEP does not create a SIP, the EPA will create one for the state. On August 3, 2015, the EPA announced
its proposed federal plan for states that fail to submit an “approvable plan”. According to the EPA, “the federal plan
is an important measure to ensure that congressionally mandated emission standards under the authority of the CAA
are implemented” (Federal Plan Requirements for Greenhouse Gas Emissions from Electric Utility Generating
Units Constructed on or Before January 8, 2014; Model Trading Rules; Amendments to Framework Regulations,
2015) 10 CP3T is completely open-source. Users are free to make any changes to any of the formulas and/or inputs. The
tool is available for download at cp3t.com.
36
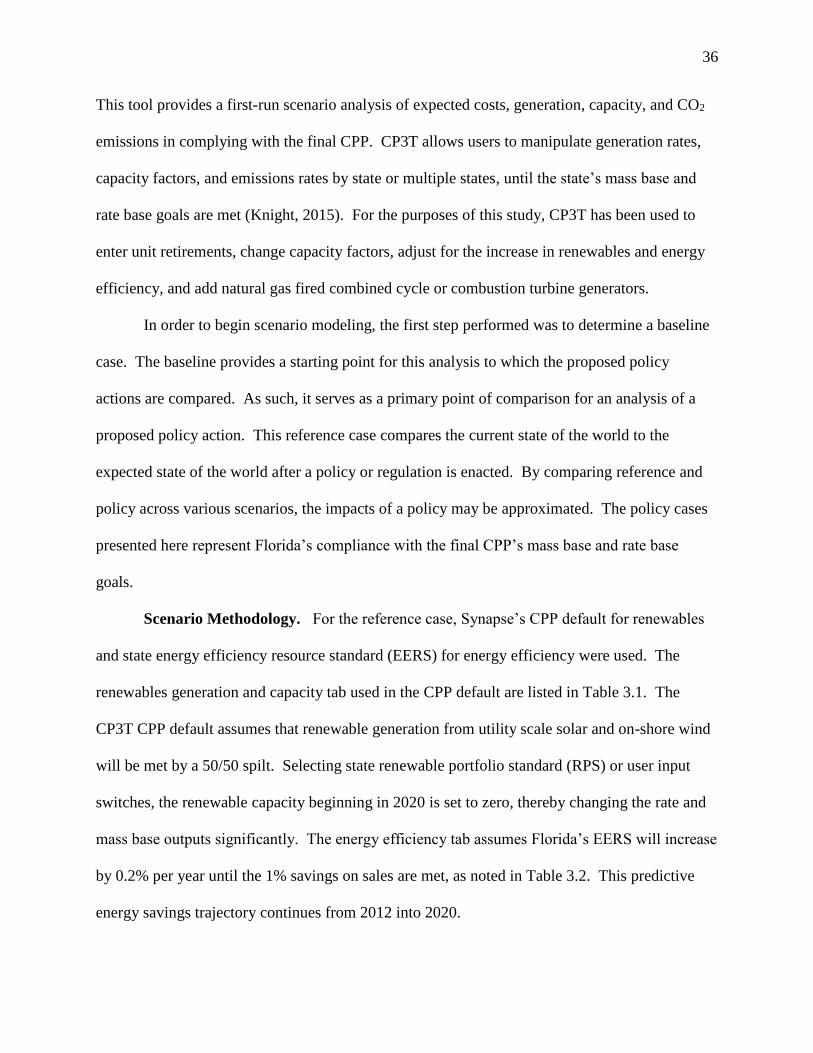
This tool provides a first-run scenario analysis of expected costs, generation, capacity, and CO2
emissions in complying with the final CPP. CP3T allows users to manipulate generation rates,
capacity factors, and emissions rates by state or multiple states, until the state’s mass base and
rate base goals are met (Knight, 2015). For the purposes of this study, CP3T has been used to
enter unit retirements, change capacity factors, adjust for the increase in renewables and energy
efficiency, and add natural gas fired combined cycle or combustion turbine generators.
In order to begin scenario modeling, the first step performed was to determine a baseline
case. The baseline provides a starting point for this analysis to which the proposed policy
actions are compared. As such, it serves as a primary point of comparison for an analysis of a
proposed policy action. This reference case compares the current state of the world to the
expected state of the world after a policy or regulation is enacted. By comparing reference and
policy across various scenarios, the impacts of a policy may be approximated. The policy cases
presented here represent Florida’s compliance with the final CPP’s mass base and rate base
goals.
Scenario Methodology. For the reference case, Synapse’s CPP default for renewables
and state energy efficiency resource standard (EERS) for energy efficiency were used. The
renewables generation and capacity tab used in the CPP default are listed in Table 3.1. The
CP3T CPP default assumes that renewable generation from utility scale solar and on-shore wind
will be met by a 50/50 spilt. Selecting state renewable portfolio standard (RPS) or user input
switches, the renewable capacity beginning in 2020 is set to zero, thereby changing the rate and
mass base outputs significantly. The energy efficiency tab assumes Florida’s EERS will increase
by 0.2% per year until the 1% savings on sales are met, as noted in Table 3.2. This predictive
energy savings trajectory continues from 2012 into 2020.
37
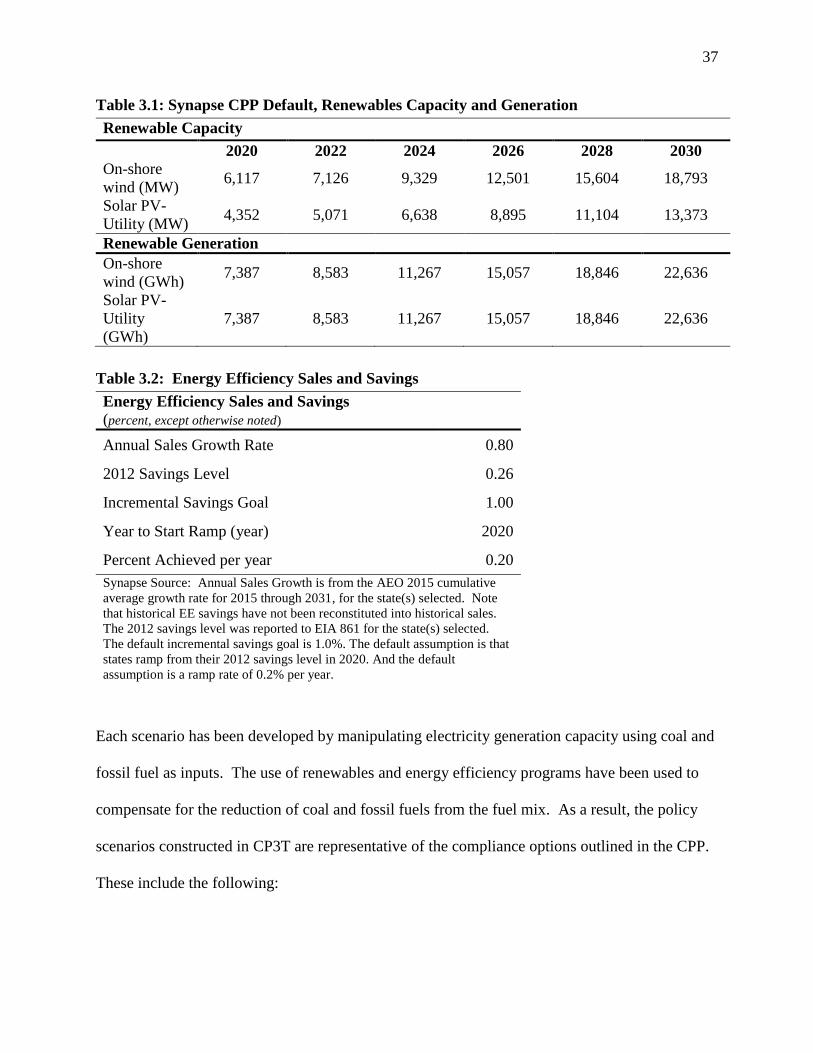
Table 3.1: Synapse CPP Default, Renewables Capacity and Generation
Renewable Capacity
2020 2022 2024 2026 2028 2030
On-shore
wind (MW) 6,117 7,126 9,329 12,501 15,604 18,793
Solar PV-
Utility (MW) 4,352 5,071 6,638 8,895 11,104 13,373
Renewable Generation
On-shore
wind (GWh) 7,387 8,583 11,267 15,057 18,846 22,636
Solar PV-
Utility
(GWh)
7,387 8,583 11,267 15,057 18,846 22,636
Table 3.2: Energy Efficiency Sales and Savings
Energy Efficiency Sales and Savings
(percent, except otherwise noted)
Annual Sales Growth Rate 0.80
2012 Savings Level 0.26
Incremental Savings Goal 1.00
Year to Start Ramp (year) 2020
Percent Achieved per year 0.20
Synapse Source: Annual Sales Growth is from the AEO 2015 cumulative
average growth rate for 2015 through 2031, for the state(s) selected. Note
that historical EE savings have not been reconstituted into historical sales.
The 2012 savings level was reported to EIA 861 for the state(s) selected.
The default incremental savings goal is 1.0%. The default assumption is that
states ramp from their 2012 savings level in 2020. And the default
assumption is a ramp rate of 0.2% per year.
Each scenario has been developed by manipulating electricity generation capacity using coal and
fossil fuel as inputs. The use of renewables and energy efficiency programs have been used to
compensate for the reduction of coal and fossil fuels from the fuel mix. As a result, the policy
scenarios constructed in CP3T are representative of the compliance options outlined in the CPP.
These include the following:
38
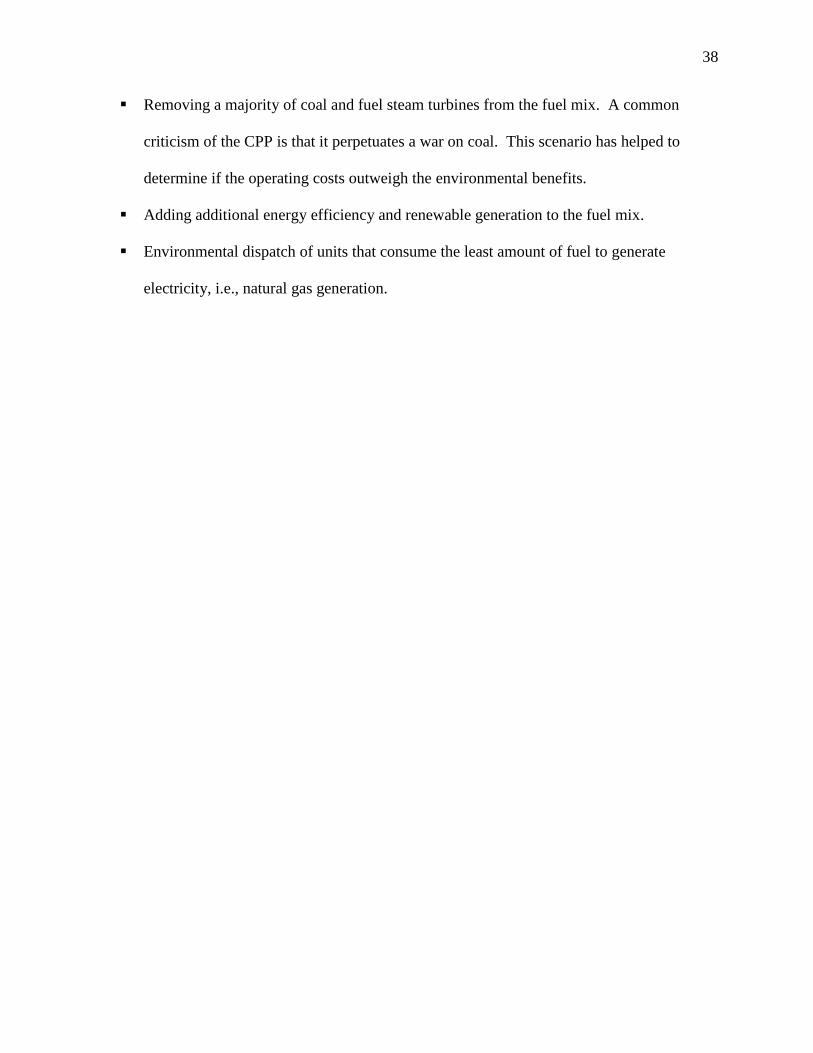
Removing a majority of coal and fuel steam turbines from the fuel mix. A common
criticism of the CPP is that it perpetuates a war on coal. This scenario has helped to
determine if the operating costs outweigh the environmental benefits.
Adding additional energy efficiency and renewable generation to the fuel mix.
Environmental dispatch of units that consume the least amount of fuel to generate
electricity, i.e., natural gas generation.
39
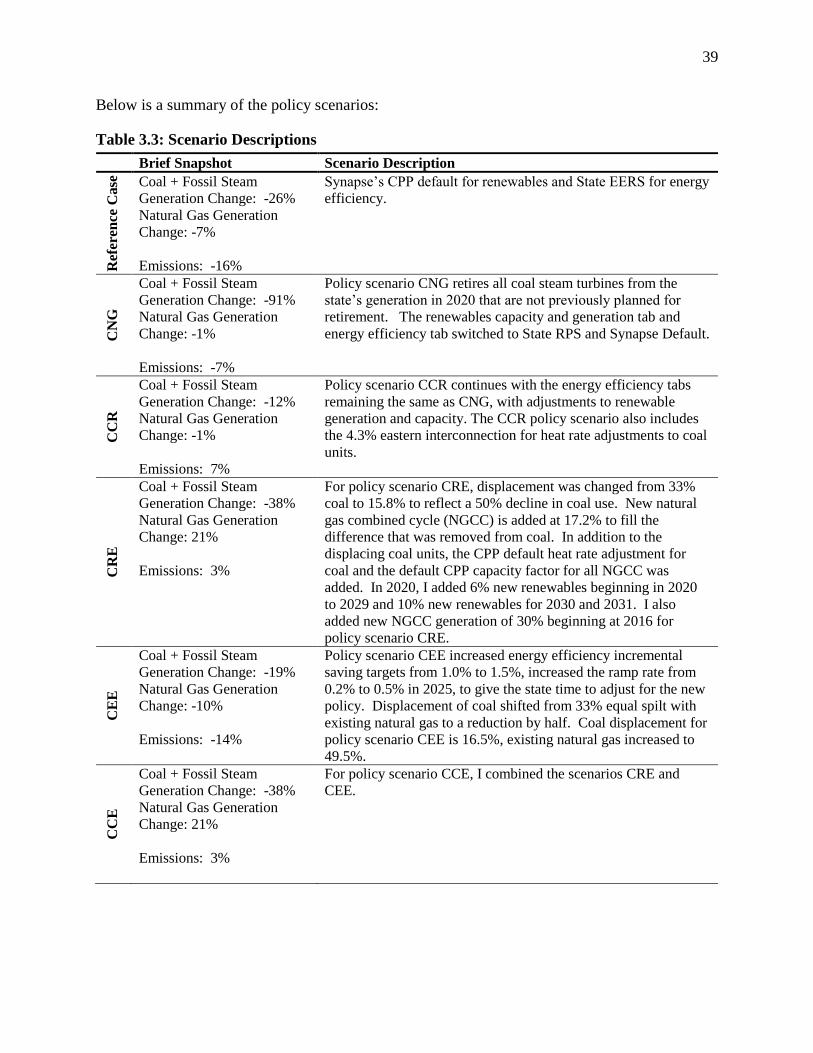
Below is a summary of the policy scenarios:
Table 3.3: Scenario Descriptions
Brief Snapshot Scenario Description
Ref
eren
ce C
ase
Coal + Fossil Steam
Generation Change: -26%
Natural Gas Generation
Change: -7%
Emissions: -16%
Synapse’s CPP default for renewables and State EERS for energy
efficiency.
CN
G
Coal + Fossil Steam
Generation Change: -91%
Natural Gas Generation
Change: -1%
Emissions: -7%
Policy scenario CNG retires all coal steam turbines from the
state’s generation in 2020 that are not previously planned for
retirement. The renewables capacity and generation tab and
energy efficiency tab switched to State RPS and Synapse Default.
CC
R
Coal + Fossil Steam
Generation Change: -12%
Natural Gas Generation
Change: -1%
Emissions: 7%
Policy scenario CCR continues with the energy efficiency tabs
remaining the same as CNG, with adjustments to renewable
generation and capacity. The CCR policy scenario also includes
the 4.3% eastern interconnection for heat rate adjustments to coal
units.
CR
E
Coal + Fossil Steam
Generation Change: -38%
Natural Gas Generation
Change: 21%
Emissions: 3%
For policy scenario CRE, displacement was changed from 33%
coal to 15.8% to reflect a 50% decline in coal use. New natural
gas combined cycle (NGCC) is added at 17.2% to fill the
difference that was removed from coal. In addition to the
displacing coal units, the CPP default heat rate adjustment for
coal and the default CPP capacity factor for all NGCC was
added. In 2020, I added 6% new renewables beginning in 2020
to 2029 and 10% new renewables for 2030 and 2031. I also
added new NGCC generation of 30% beginning at 2016 for
policy scenario CRE.
CE
E
Coal + Fossil Steam
Generation Change: -19%
Natural Gas Generation
Change: -10%
Emissions: -14%
Policy scenario CEE increased energy efficiency incremental
saving targets from 1.0% to 1.5%, increased the ramp rate from
0.2% to 0.5% in 2025, to give the state time to adjust for the new
policy. Displacement of coal shifted from 33% equal spilt with
existing natural gas to a reduction by half. Coal displacement for
policy scenario CEE is 16.5%, existing natural gas increased to
49.5%.
CC
E
Coal + Fossil Steam
Generation Change: -38%
Natural Gas Generation
Change: 21%
Emissions: 3%
For policy scenario CCE, I combined the scenarios CRE and
CEE.
40
Adjusting Values for Cost Benefit Analysis. As noted in the Intergovernmental Panel
on Climate Change’s (IPCC) Climate Change 2014 Synthesis Report, effectively evaluating
policies that may cause disruptions to the climate involves “valuation and mediation among
diverse values and may be aided by the analytic methods of several normative disciplines”
(Pachauri & Mayer, 2015). Here, a CBA has been utilized. This standard method for evaluation
“reflects ethical principles, and take account of non-marketed goods, equity, behavioral biases,
ancillary benefits and cost and the differing values of money to different people” (Pachauri &
Mayer, 2015). Thus, this evaluation method enables holistic analysis of the CPP.
In order to determine if the CPP will be socially beneficial for Florida stakeholders, the
social benefits have been simulated until they reach Pareto efficiency (Asafu-Adjaye, 2000). To
determine the benefits associated with the CPP, the highly debated social cost of carbon (SCC)
estimate provided by the EPA has been used. Policy impacts to an individual’s income vary
depending on the benefits associated with an extra metric ton of emissions in a given year.
Depending on the economic tool used, the SCC varies greatly. The EPA has used three
integrated assessment models (IAMs) for estimating the SCC. The marginal social damages
associated with CO2 have not been determined to be zero. Since the debate on which
methodology to use for the SCC is outside the scope of this study, it has been determined that
using the EPA’s IAMs estimation will provide a fair representation of the predominant models
used.
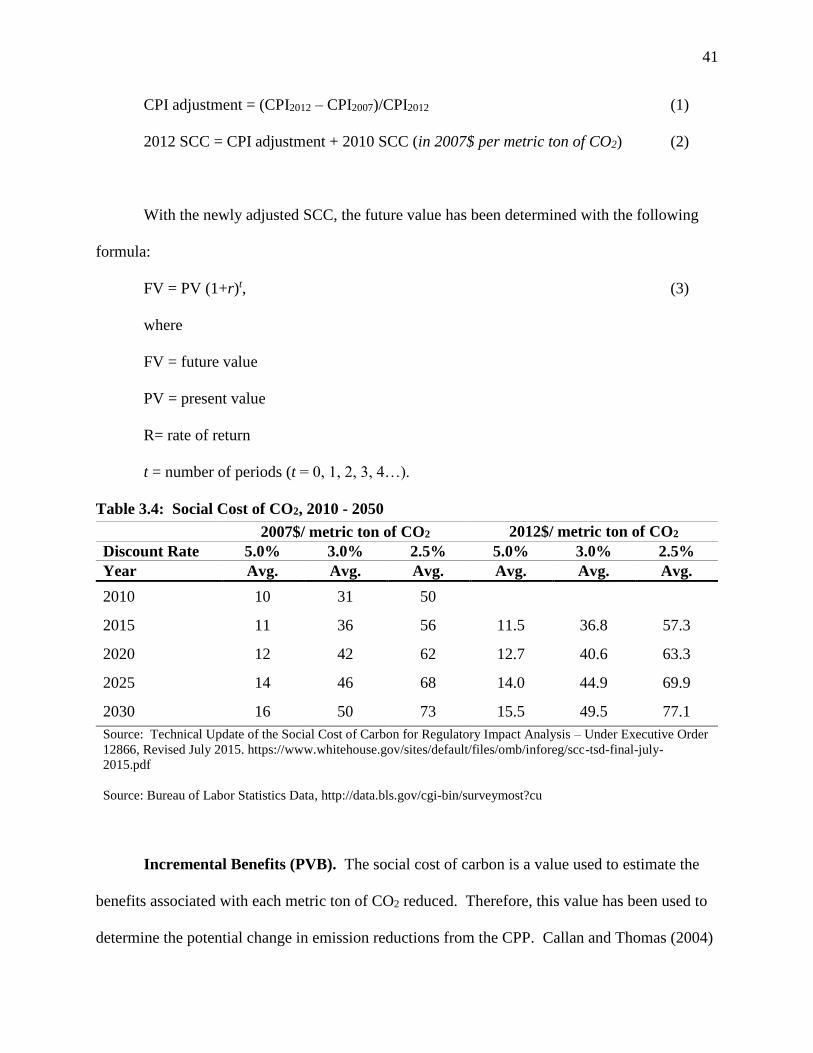
The revised SCC Technical Support Document published by the EPA for 2010-2050 has
been calculated using 2007 dollars. In order to run an analysis consistently in 2012 dollars, the
Bureau of Labor Statistics’ Consumer Price Index (CPI) has been used to adjust all values. This
conversion uses the following simple formula:
41
CPI adjustment = (CPI2012 – CPI2007)/CPI2012 (1)
2012 SCC = CPI adjustment + 2010 SCC (in 2007$ per metric ton of CO2) (2)
With the newly adjusted SCC, the future value has been determined with the following
formula:
FV = PV (1+r)t, (3)
where
FV = future value
PV = present value
R= rate of return
t = number of periods (t = 0, 1, 2, 3, 4…).
Table 3.4: Social Cost of CO2, 2010 - 2050
2007$/ metric ton of CO2 2012$/ metric ton of CO2
Discount Rate 5.0% 3.0% 2.5% 5.0% 3.0% 2.5%
Year Avg. Avg. Avg. Avg. Avg. Avg.
2010 10 31 50
2015 11 36 56 11.5 36.8 57.3
2020 12 42 62 12.7 40.6 63.3
2025 14 46 68 14.0 44.9 69.9
2030 16 50 73 15.5 49.5 77.1
Source: Technical Update of the Social Cost of Carbon for Regulatory Impact Analysis – Under Executive Order
12866, Revised July 2015. https://www.whitehouse.gov/sites/default/files/omb/inforeg/scc-tsd-final-july-
2015.pdf
Source: Bureau of Labor Statistics Data, http://data.bls.gov/cgi-bin/surveymost?cu
Incremental Benefits (PVB). The social cost of carbon is a value used to estimate the
benefits associated with each metric ton of CO2 reduced. Therefore, this value has been used to
determine the potential change in emission reductions from the CPP. Callan and Thomas (2004)
42
note that “the reduction in health, ecological, and property damages associated with an
environmental policy initiative” is the incremental benefit. Importantly, the evaluation of the
CPP must include the reduction of estimated damages over time in order to appropriately
measure the incremental benefits associated with the policy.
Incremental Costs (PVC). The CPP will require power generators to review their
operations in order to improve efficiency, change fuel load, or incorporate renewable resources
into their generation capacity. With these changes, explicit and implicit costs will be incurred.
These incremental costs include existing expenditures, costs after the policy is implemented, and
the difference between the two. The annual cost estimated by Synapse includes the operational
cost, fixed operational cost, and variable operational costs.
Cost-benefit Analysis Ratio. In order to distinguish which policy scenario may be the
best option, adjusted incremental costs and benefits have been compared. The PVB/PVC ratio
conveys the benefits of a policy option per dollar of costs incurred (Callan & Thomas, 2004).
Analysis with a cost-benefit ratio greater than 1 demonstrates that the benefits outweigh the
costs; hence, the net benefits are positive. A higher ratio begets larger benefits relative to costs.
If (PVB/PVC) > 1, for a given option, the option is considered feasible.
Costs and Benefits per Floridian. The costs and benefits for each policy scenario per
Floridian have been considered. To this ratio, the Florida’s Office of Economic and
Demographic Research projections for population have been used (Office of Economic and
Demographic Research, 2015). From there, the values obtained through the CBA have been
divided by Florida’s projected populations at various years to determine the potential costs and
benefits of the CPP per Floridian.
43
Limitations of Study
This research utilizes a CBA which provides a framework for quantifying and comparing
the costs and benefits associated with the CPP. The Synapse tool used for the evaluation of the
CPP as it relates to Florida has provided insights on the operating and maintenance costs
involved with this new environmental policy. Other related costs are not included. In a study
completed by Elizabeth Stanton and Frank Ackerman (2007), the cost of inaction is evaluated.
These costs are divided into (1) the loss of tourism revenue, (2) at-risk residential real estate, (3)
increase in electricity costs, and (4) damage from hurricanes. Due to time constraints, these costs
have not been incorporated into this analysis. Thus, both costs and benefits estimated here
should be viewed as conservative.
Ethical Statement
The proposal for this research has been reviewed by the Northeastern University’s
Institutional Review Board (IRB). After their review, the IRB has determined that this research
is exempt from review because the data has been obtained from open sources and contains no
personal information.
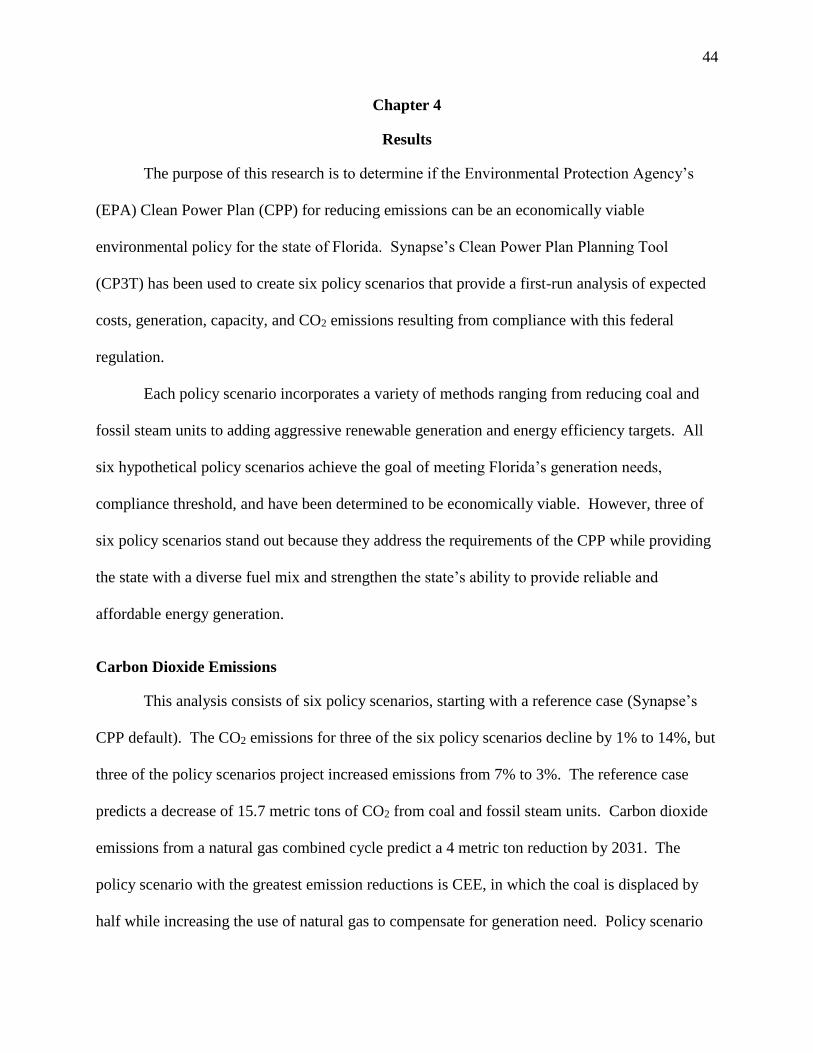
44
Chapter 4
Results
The purpose of this research is to determine if the Environmental Protection Agency’s
(EPA) Clean Power Plan (CPP) for reducing emissions can be an economically viable
environmental policy for the state of Florida. Synapse’s Clean Power Plan Planning Tool
(CP3T) has been used to create six policy scenarios that provide a first-run analysis of expected
costs, generation, capacity, and CO2 emissions resulting from compliance with this federal
regulation.
Each policy scenario incorporates a variety of methods ranging from reducing coal and
fossil steam units to adding aggressive renewable generation and energy efficiency targets. All
six hypothetical policy scenarios achieve the goal of meeting Florida’s generation needs,
compliance threshold, and have been determined to be economically viable. However, three of
six policy scenarios stand out because they address the requirements of the CPP while providing
the state with a diverse fuel mix and strengthen the state’s ability to provide reliable and
affordable energy generation.
Carbon Dioxide Emissions
This analysis consists of six policy scenarios, starting with a reference case (Synapse’s
CPP default). The CO2 emissions for three of the six policy scenarios decline by 1% to 14%, but
three of the policy scenarios project increased emissions from 7% to 3%. The reference case
predicts a decrease of 15.7 metric tons of CO2 from coal and fossil steam units. Carbon dioxide
emissions from a natural gas combined cycle predict a 4 metric ton reduction by 2031. The
policy scenario with the greatest emission reductions is CEE, in which the coal is displaced by
half while increasing the use of natural gas to compensate for generation need. Policy scenario
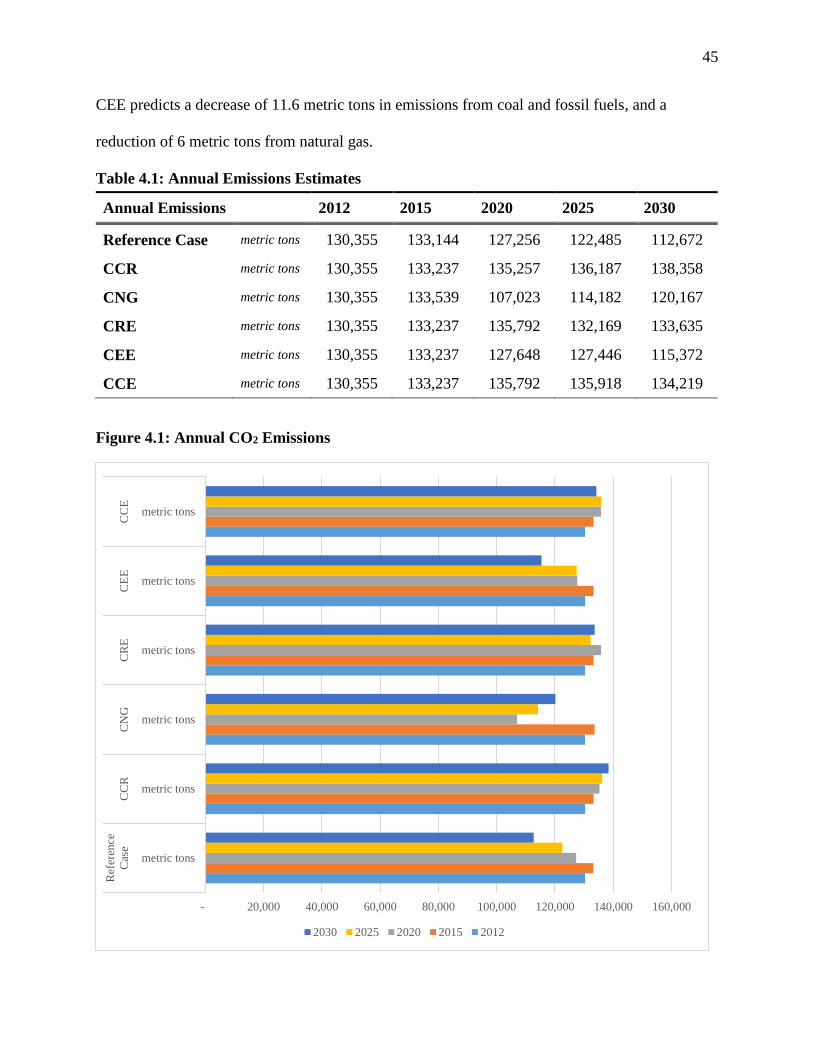
45
CEE predicts a decrease of 11.6 metric tons in emissions from coal and fossil fuels, and a
reduction of 6 metric tons from natural gas.
Table 4.1: Annual Emissions Estimates
Annual Emissions 2012 2015 2020 2025 2030
Reference Case metric tons 130,355 133,144 127,256 122,485 112,672
CCR metric tons 130,355 133,237 135,257 136,187 138,358
CNG metric tons 130,355 133,539 107,023 114,182 120,167
CRE metric tons 130,355 133,237 135,792 132,169 133,635
CEE metric tons 130,355 133,237 127,648 127,446 115,372
CCE metric tons 130,355 133,237 135,792 135,918 134,219
Figure 4.1: Annual CO2 Emissions
- 20,000 40,000 60,000 80,000 100,000 120,000 140,000 160,000
metric tons
metric tons
metric tons
metric tons
metric tons
metric tons
Ref
eren
ce
Cas
eC
CR
CN
GC
RE
CE
EC
CE
2030 2025 2020 2015 2012
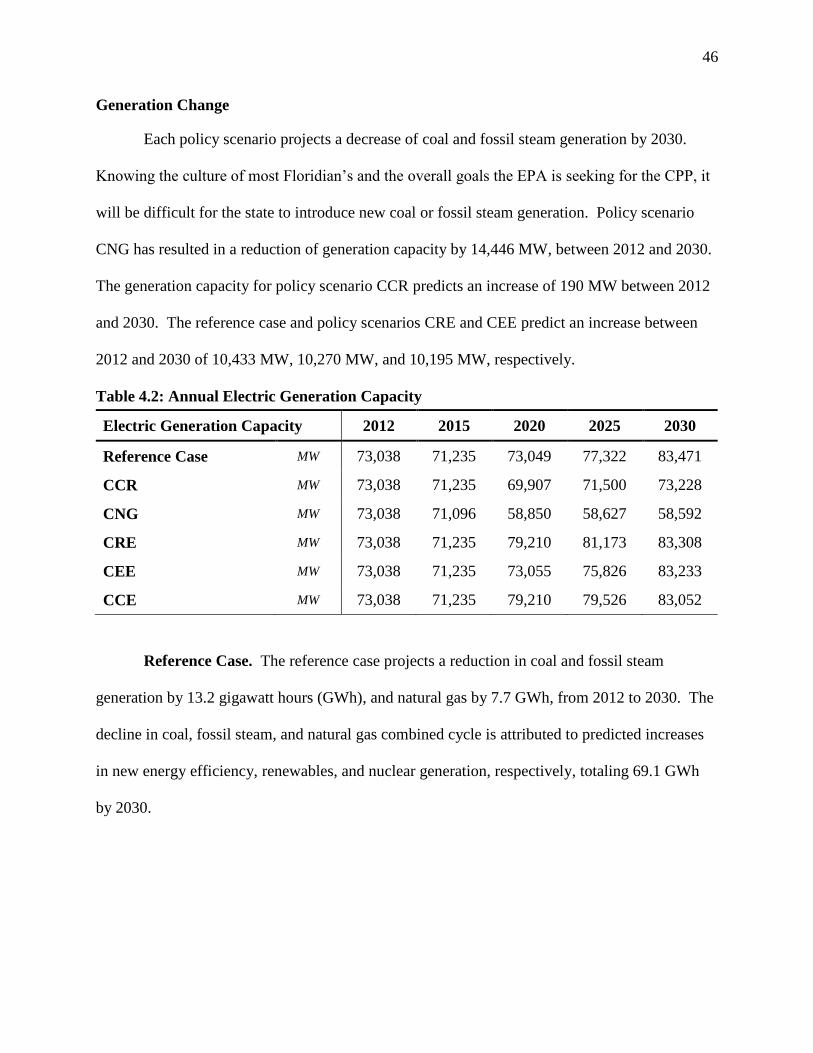
46
Generation Change
Each policy scenario projects a decrease of coal and fossil steam generation by 2030.
Knowing the culture of most Floridian’s and the overall goals the EPA is seeking for the CPP, it
will be difficult for the state to introduce new coal or fossil steam generation. Policy scenario
CNG has resulted in a reduction of generation capacity by 14,446 MW, between 2012 and 2030.
The generation capacity for policy scenario CCR predicts an increase of 190 MW between 2012
and 2030. The reference case and policy scenarios CRE and CEE predict an increase between
2012 and 2030 of 10,433 MW, 10,270 MW, and 10,195 MW, respectively.
Table 4.2: Annual Electric Generation Capacity
Electric Generation Capacity 2012 2015 2020 2025 2030
Reference Case MW 73,038 71,235 73,049 77,322 83,471
CCR MW 73,038 71,235 69,907 71,500 73,228
CNG MW 73,038 71,096 58,850 58,627 58,592
CRE MW 73,038 71,235 79,210 81,173 83,308
CEE MW 73,038 71,235 73,055 75,826 83,233
CCE MW 73,038 71,235 79,210 79,526 83,052
Reference Case. The reference case projects a reduction in coal and fossil steam
generation by 13.2 gigawatt hours (GWh), and natural gas by 7.7 GWh, from 2012 to 2030. The
decline in coal, fossil steam, and natural gas combined cycle is attributed to predicted increases
in new energy efficiency, renewables, and nuclear generation, respectively, totaling 69.1 GWh
by 2030.
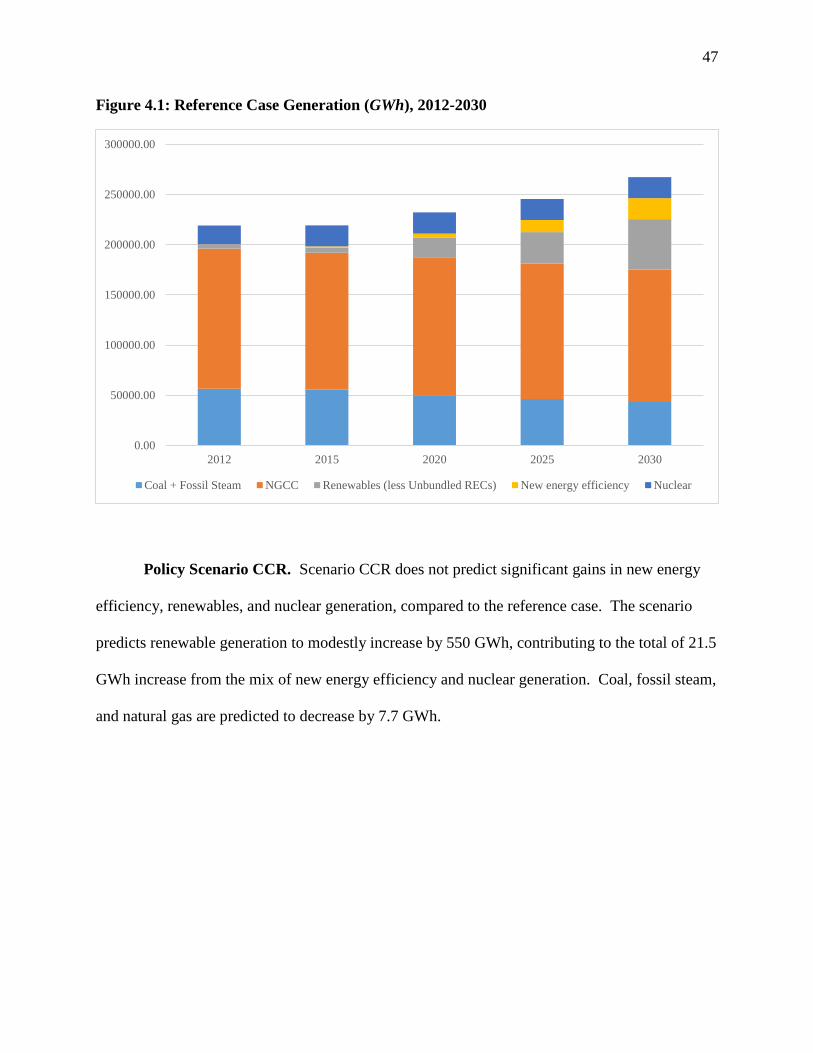
47
Figure 4.1: Reference Case Generation (GWh), 2012-2030
Policy Scenario CCR. Scenario CCR does not predict significant gains in new energy
efficiency, renewables, and nuclear generation, compared to the reference case. The scenario
predicts renewable generation to modestly increase by 550 GWh, contributing to the total of 21.5
GWh increase from the mix of new energy efficiency and nuclear generation. Coal, fossil steam,
and natural gas are predicted to decrease by 7.7 GWh.
0.00
50000.00
100000.00
150000.00
200000.00
250000.00
300000.00
2012 2015 2020 2025 2030
Coal + Fossil Steam NGCC Renewables (less Unbundled RECs) New energy efficiency Nuclear
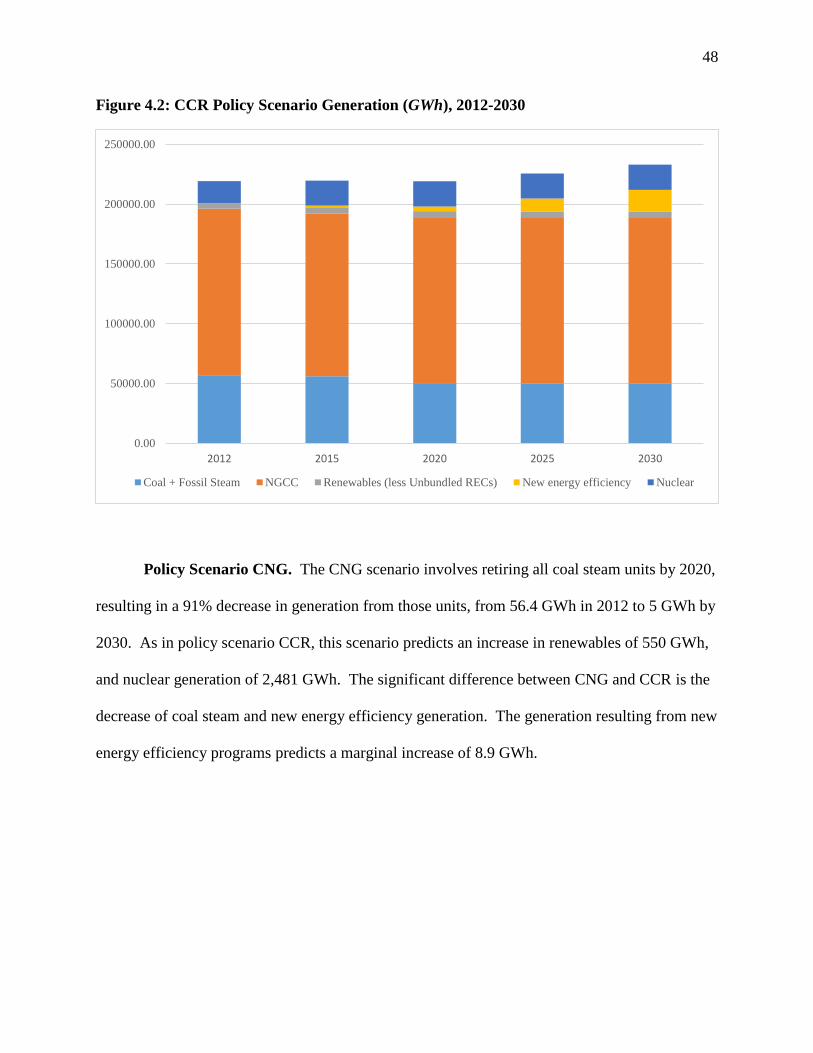
48
Figure 4.2: CCR Policy Scenario Generation (GWh), 2012-2030
Policy Scenario CNG. The CNG scenario involves retiring all coal steam units by 2020,
resulting in a 91% decrease in generation from those units, from 56.4 GWh in 2012 to 5 GWh by
2030. As in policy scenario CCR, this scenario predicts an increase in renewables of 550 GWh,
and nuclear generation of 2,481 GWh. The significant difference between CNG and CCR is the
decrease of coal steam and new energy efficiency generation. The generation resulting from new
energy efficiency programs predicts a marginal increase of 8.9 GWh.
0.00
50000.00
100000.00
150000.00
200000.00
250000.00
2012 2015 2020 2025 2030
Coal + Fossil Steam NGCC Renewables (less Unbundled RECs) New energy efficiency Nuclear
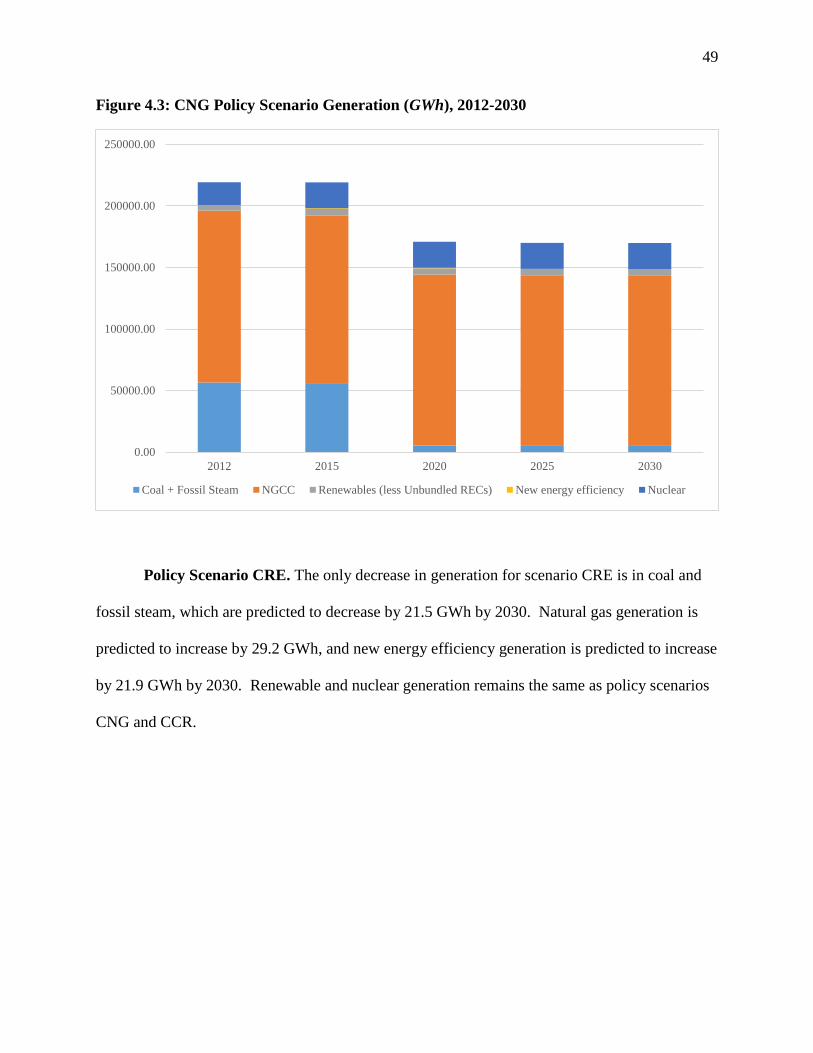
49
Figure 4.3: CNG Policy Scenario Generation (GWh), 2012-2030
Policy Scenario CRE. The only decrease in generation for scenario CRE is in coal and
fossil steam, which are predicted to decrease by 21.5 GWh by 2030. Natural gas generation is
predicted to increase by 29.2 GWh, and new energy efficiency generation is predicted to increase
by 21.9 GWh by 2030. Renewable and nuclear generation remains the same as policy scenarios
CNG and CCR.
0.00
50000.00
100000.00
150000.00
200000.00
250000.00
2012 2015 2020 2025 2030
Coal + Fossil Steam NGCC Renewables (less Unbundled RECs) New energy efficiency Nuclear
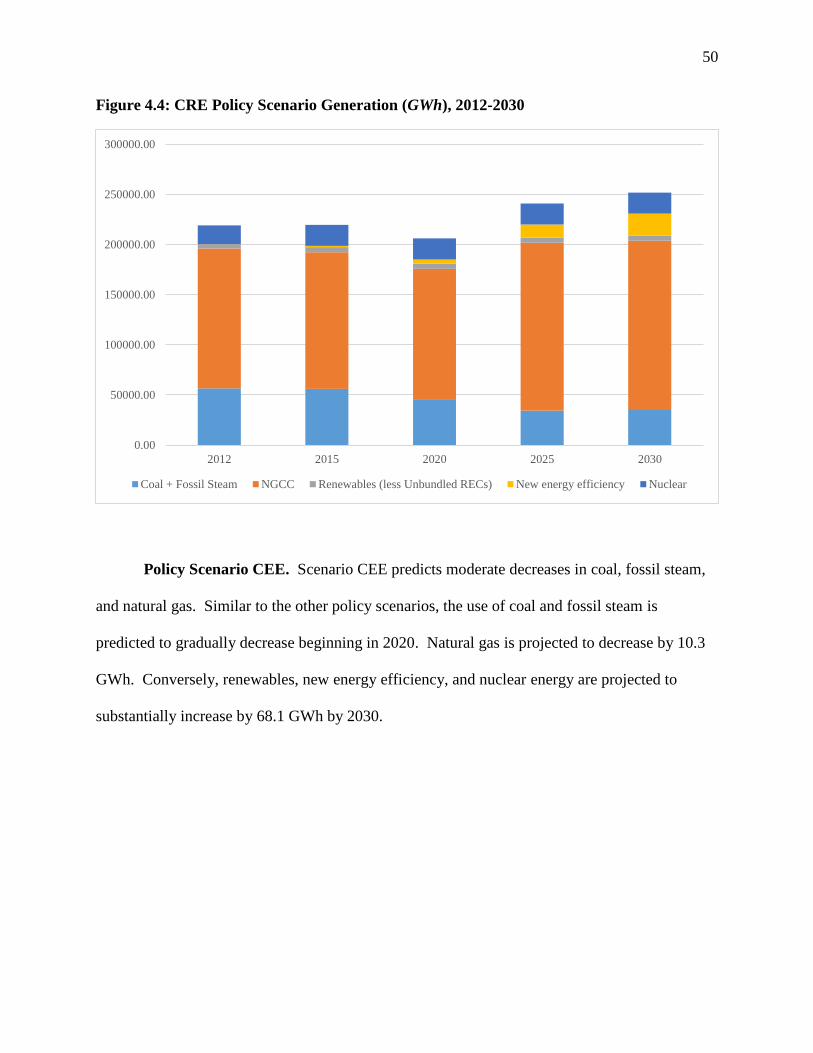
50
Figure 4.4: CRE Policy Scenario Generation (GWh), 2012-2030
Policy Scenario CEE. Scenario CEE predicts moderate decreases in coal, fossil steam,
and natural gas. Similar to the other policy scenarios, the use of coal and fossil steam is
predicted to gradually decrease beginning in 2020. Natural gas is projected to decrease by 10.3
GWh. Conversely, renewables, new energy efficiency, and nuclear energy are projected to
substantially increase by 68.1 GWh by 2030.
0.00
50000.00
100000.00
150000.00
200000.00
250000.00
300000.00
2012 2015 2020 2025 2030
Coal + Fossil Steam NGCC Renewables (less Unbundled RECs) New energy efficiency Nuclear
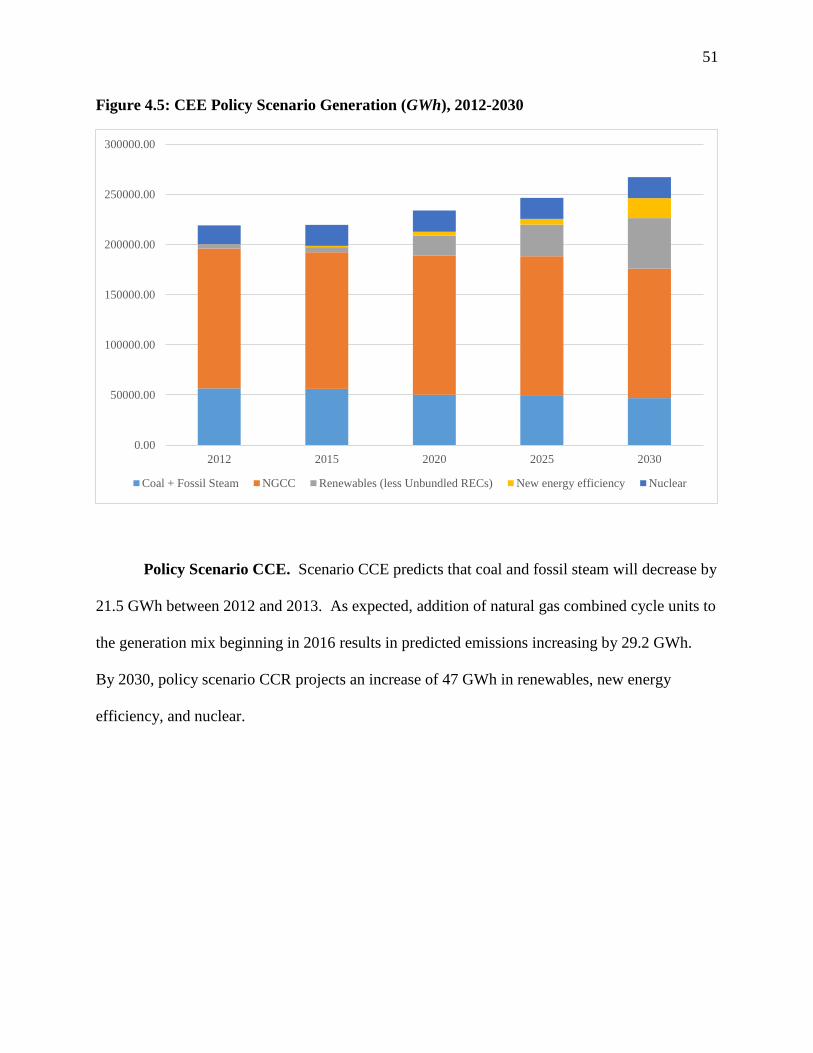
51
Figure 4.5: CEE Policy Scenario Generation (GWh), 2012-2030
Policy Scenario CCE. Scenario CCE predicts that coal and fossil steam will decrease by
21.5 GWh between 2012 and 2013. As expected, addition of natural gas combined cycle units to
the generation mix beginning in 2016 results in predicted emissions increasing by 29.2 GWh.
By 2030, policy scenario CCR projects an increase of 47 GWh in renewables, new energy
efficiency, and nuclear.
0.00
50000.00
100000.00
150000.00
200000.00
250000.00
300000.00
2012 2015 2020 2025 2030
Coal + Fossil Steam NGCC Renewables (less Unbundled RECs) New energy efficiency Nuclear
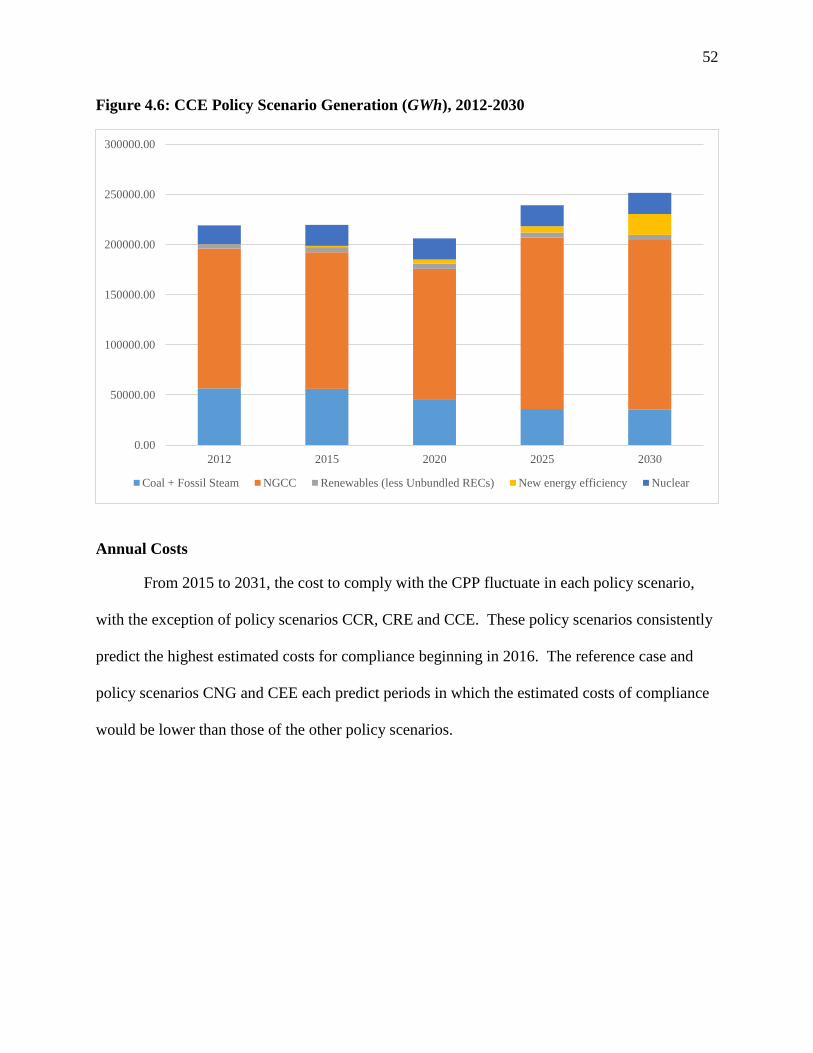
52
Figure 4.6: CCE Policy Scenario Generation (GWh), 2012-2030
Annual Costs
From 2015 to 2031, the cost to comply with the CPP fluctuate in each policy scenario,
with the exception of policy scenarios CCR, CRE and CCE. These policy scenarios consistently
predict the highest estimated costs for compliance beginning in 2016. The reference case and
policy scenarios CNG and CEE each predict periods in which the estimated costs of compliance
would be lower than those of the other policy scenarios.
0.00
50000.00
100000.00
150000.00
200000.00
250000.00
300000.00
2012 2015 2020 2025 2030
Coal + Fossil Steam NGCC Renewables (less Unbundled RECs) New energy efficiency Nuclear
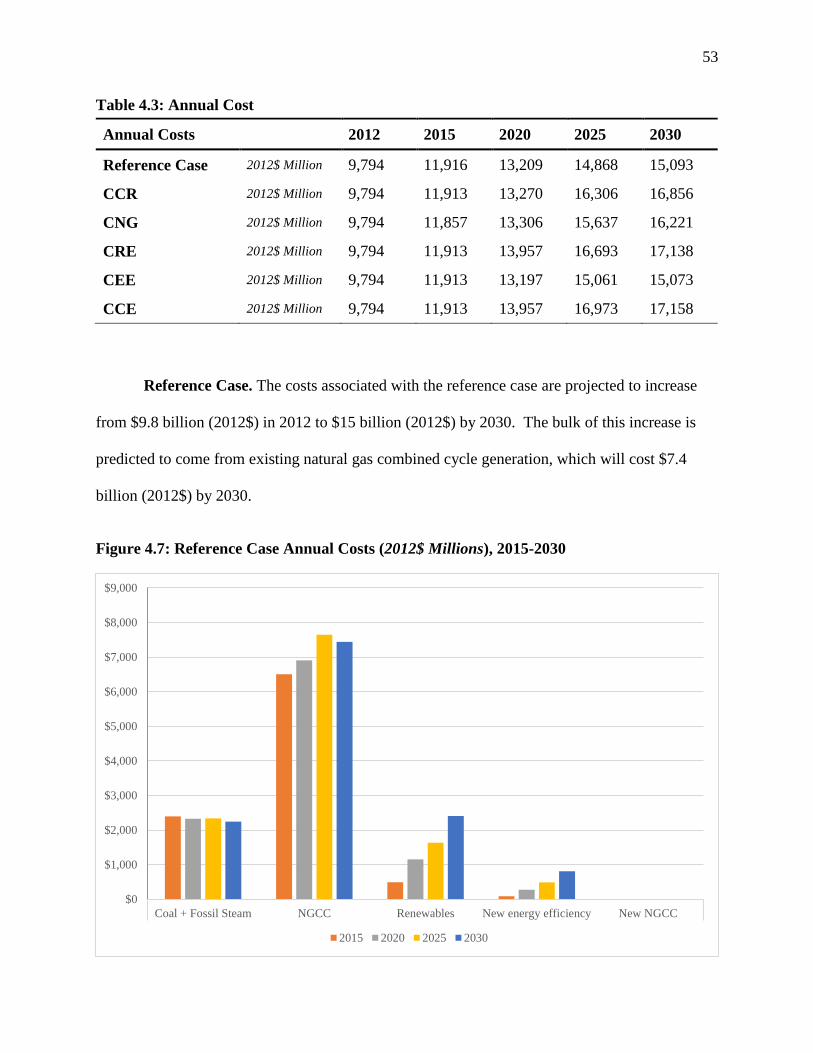
53
Table 4.3: Annual Cost
Annual Costs 2012 2015 2020 2025 2030
Reference Case 2012$ Million 9,794 11,916 13,209 14,868 15,093
CCR 2012$ Million 9,794 11,913 13,270 16,306 16,856
CNG 2012$ Million 9,794 11,857 13,306 15,637 16,221
CRE 2012$ Million 9,794 11,913 13,957 16,693 17,138
CEE 2012$ Million 9,794 11,913 13,197 15,061 15,073
CCE 2012$ Million 9,794 11,913 13,957 16,973 17,158
Reference Case. The costs associated with the reference case are projected to increase
from $9.8 billion (2012$) in 2012 to $15 billion (2012$) by 2030. The bulk of this increase is
predicted to come from existing natural gas combined cycle generation, which will cost $7.4
billion (2012$) by 2030.
Figure 4.7: Reference Case Annual Costs (2012$ Millions), 2015-2030
$0
$1,000
$2,000
$3,000
$4,000
$5,000
$6,000
$7,000
$8,000
$9,000
Coal + Fossil Steam NGCC Renewables New energy efficiency New NGCC
2015 2020 2025 2030
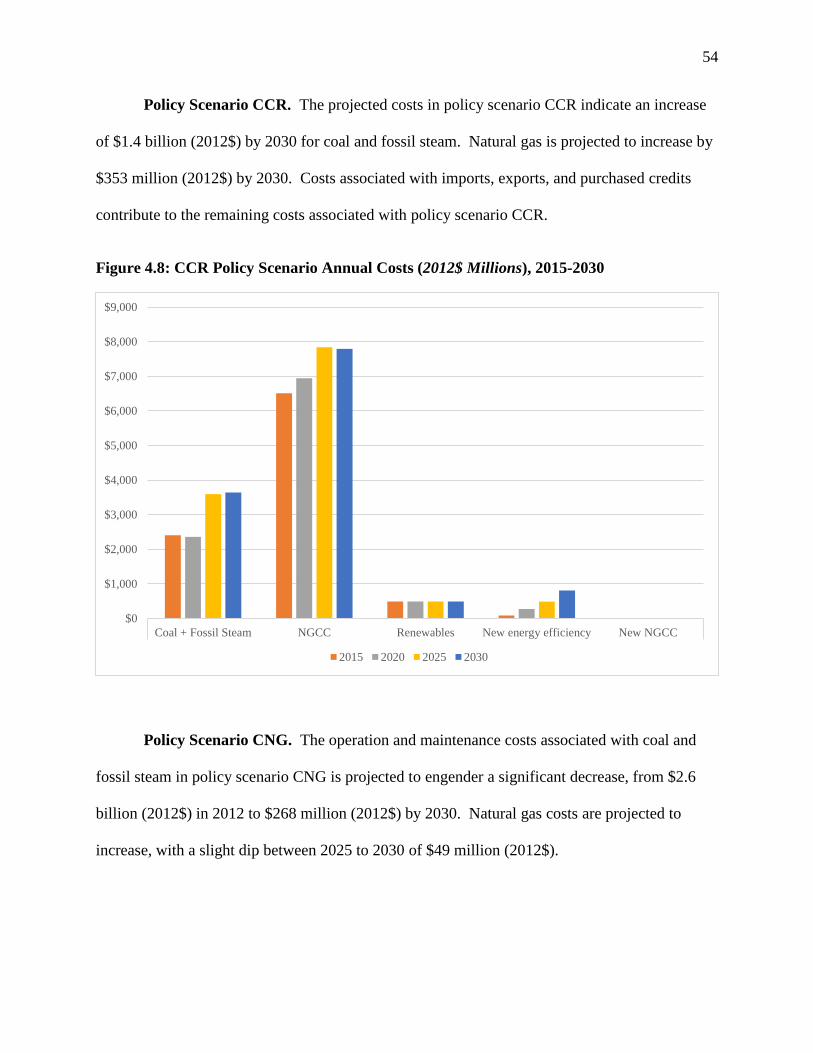
54
Policy Scenario CCR. The projected costs in policy scenario CCR indicate an increase
of $1.4 billion (2012$) by 2030 for coal and fossil steam. Natural gas is projected to increase by
$353 million (2012$) by 2030. Costs associated with imports, exports, and purchased credits
contribute to the remaining costs associated with policy scenario CCR.
Figure 4.8: CCR Policy Scenario Annual Costs (2012$ Millions), 2015-2030
Policy Scenario CNG. The operation and maintenance costs associated with coal and
fossil steam in policy scenario CNG is projected to engender a significant decrease, from $2.6
billion (2012$) in 2012 to $268 million (2012$) by 2030. Natural gas costs are projected to
increase, with a slight dip between 2025 to 2030 of $49 million (2012$).
$0
$1,000
$2,000
$3,000
$4,000
$5,000
$6,000
$7,000
$8,000
$9,000
Coal + Fossil Steam NGCC Renewables New energy efficiency New NGCC
2015 2020 2025 2030
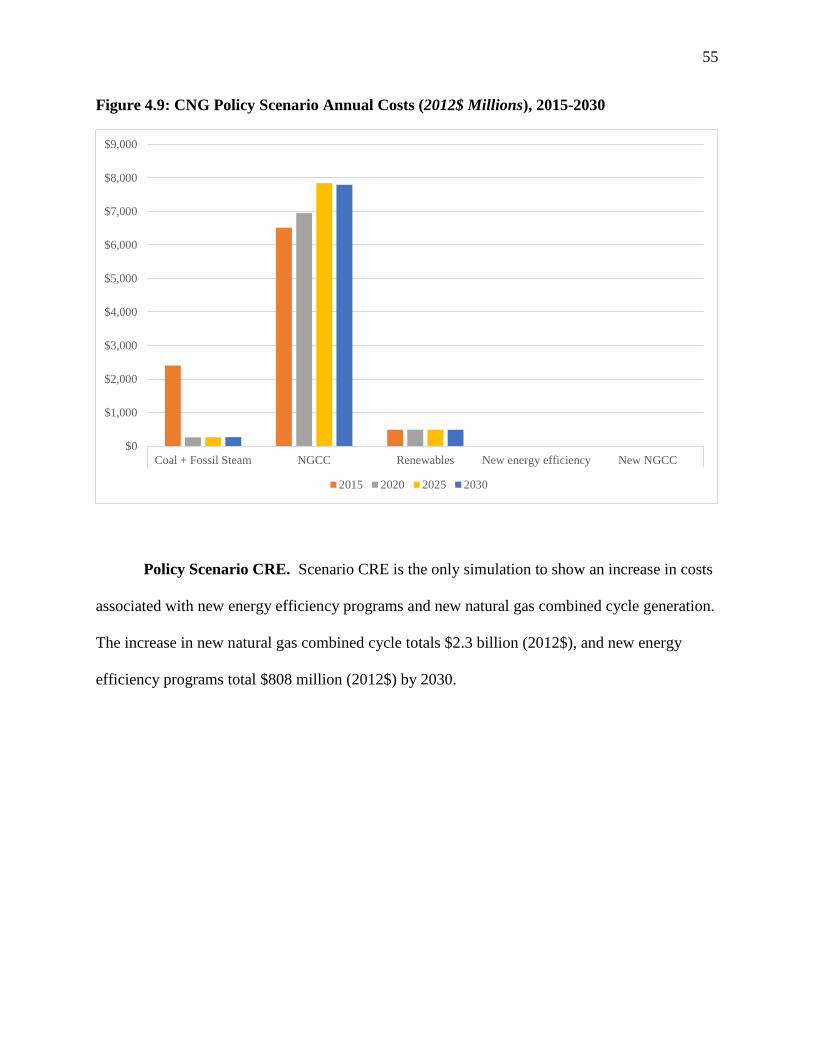
55
Figure 4.9: CNG Policy Scenario Annual Costs (2012$ Millions), 2015-2030
Policy Scenario CRE. Scenario CRE is the only simulation to show an increase in costs
associated with new energy efficiency programs and new natural gas combined cycle generation.
The increase in new natural gas combined cycle totals $2.3 billion (2012$), and new energy
efficiency programs total $808 million (2012$) by 2030.
$0
$1,000
$2,000
$3,000
$4,000
$5,000
$6,000
$7,000
$8,000
$9,000
Coal + Fossil Steam NGCC Renewables New energy efficiency New NGCC
2015 2020 2025 2030
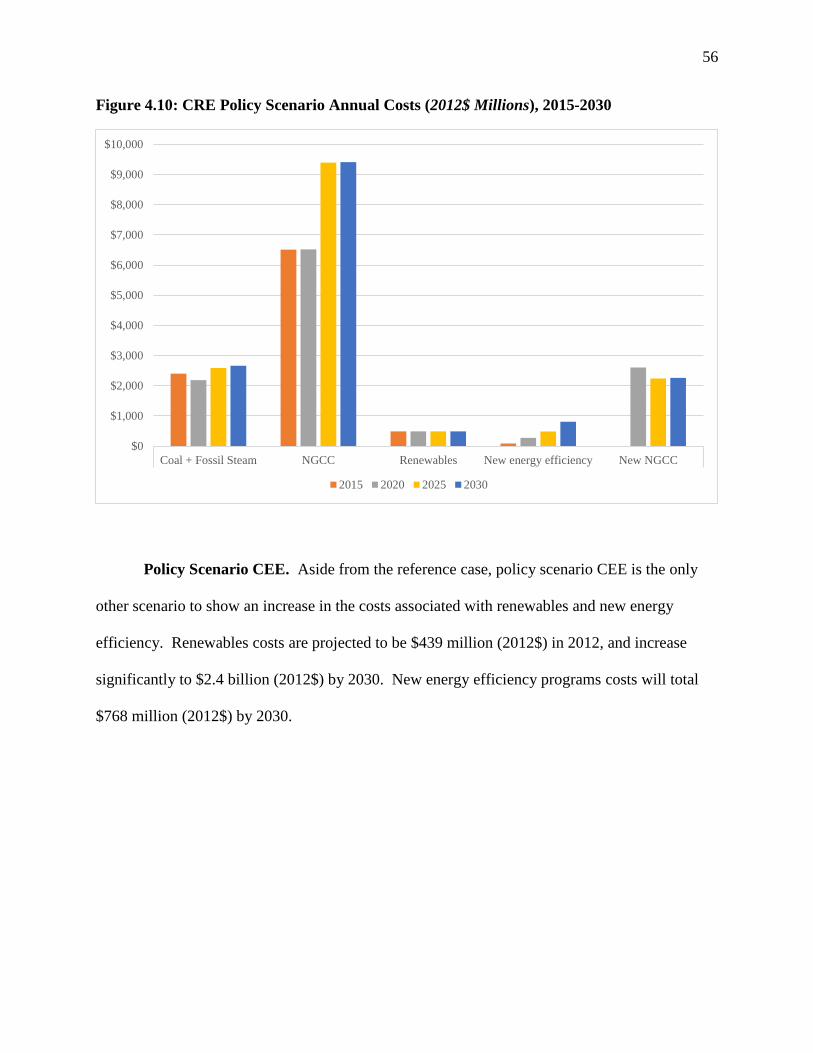
56
Figure 4.10: CRE Policy Scenario Annual Costs (2012$ Millions), 2015-2030
Policy Scenario CEE. Aside from the reference case, policy scenario CEE is the only
other scenario to show an increase in the costs associated with renewables and new energy
efficiency. Renewables costs are projected to be $439 million (2012$) in 2012, and increase
significantly to $2.4 billion (2012$) by 2030. New energy efficiency programs costs will total
$768 million (2012$) by 2030.
$0
$1,000
$2,000
$3,000
$4,000
$5,000
$6,000
$7,000
$8,000
$9,000
$10,000
Coal + Fossil Steam NGCC Renewables New energy efficiency New NGCC
2015 2020 2025 2030
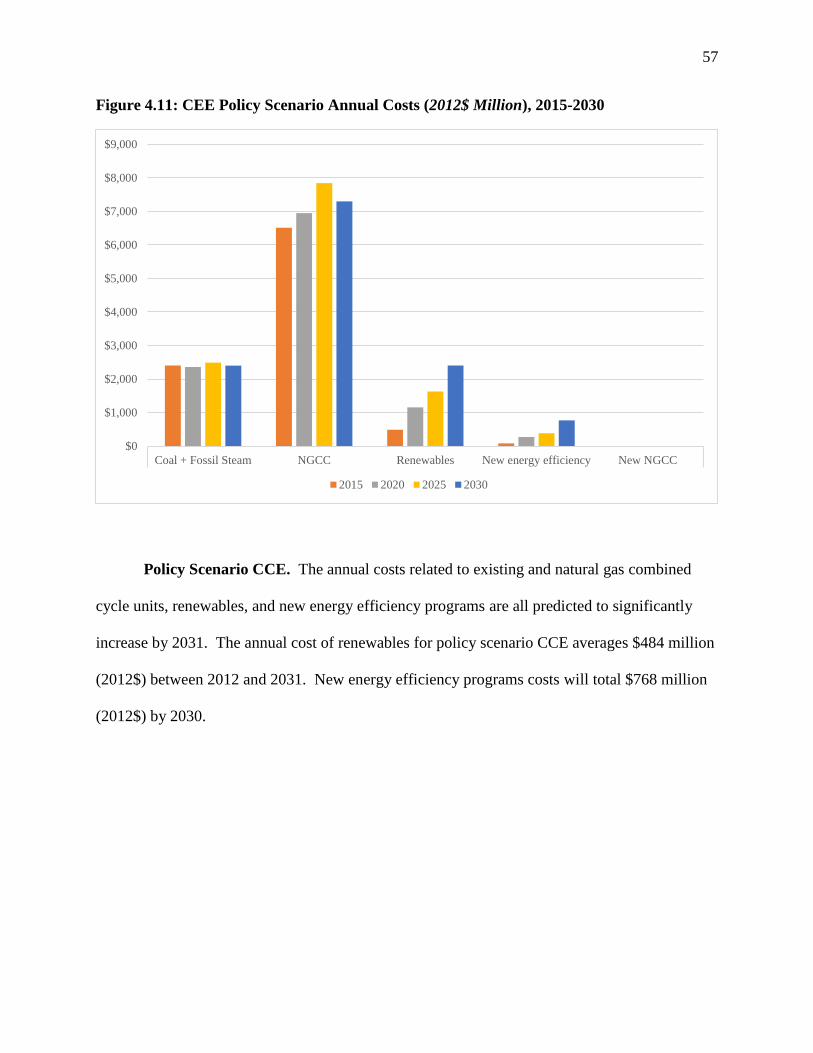
57
Figure 4.11: CEE Policy Scenario Annual Costs (2012$ Million), 2015-2030
Policy Scenario CCE. The annual costs related to existing and natural gas combined
cycle units, renewables, and new energy efficiency programs are all predicted to significantly
increase by 2031. The annual cost of renewables for policy scenario CCE averages $484 million
(2012$) between 2012 and 2031. New energy efficiency programs costs will total $768 million
(2012$) by 2030.
$0
$1,000
$2,000
$3,000
$4,000
$5,000
$6,000
$7,000
$8,000
$9,000
Coal + Fossil Steam NGCC Renewables New energy efficiency New NGCC
2015 2020 2025 2030
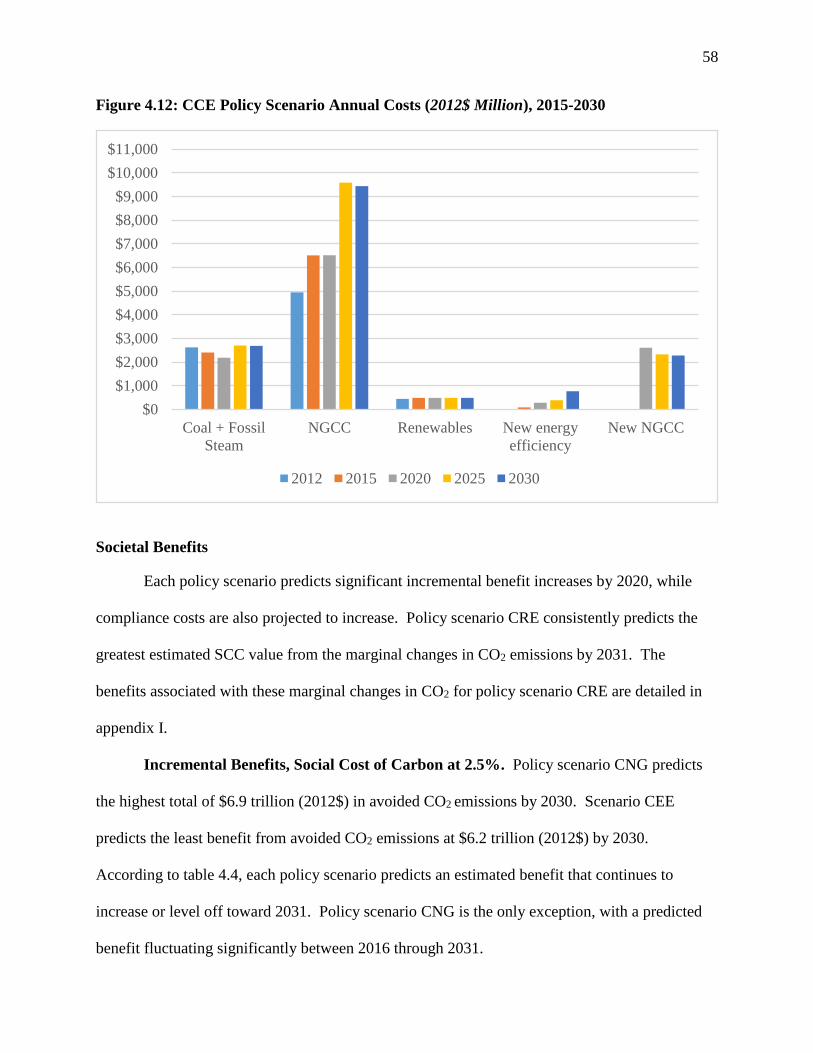
58
Figure 4.12: CCE Policy Scenario Annual Costs (2012$ Million), 2015-2030
Societal Benefits
Each policy scenario predicts significant incremental benefit increases by 2020, while
compliance costs are also projected to increase. Policy scenario CRE consistently predicts the
greatest estimated SCC value from the marginal changes in CO2 emissions by 2031. The
benefits associated with these marginal changes in CO2 for policy scenario CRE are detailed in
appendix I.
Incremental Benefits, Social Cost of Carbon at 2.5%. Policy scenario CNG predicts
the highest total of $6.9 trillion (2012$) in avoided CO2 emissions by 2030. Scenario CEE
predicts the least benefit from avoided CO2 emissions at $6.2 trillion (2012$) by 2030.
According to table 4.4, each policy scenario predicts an estimated benefit that continues to
increase or level off toward 2031. Policy scenario CNG is the only exception, with a predicted
benefit fluctuating significantly between 2016 through 2031.
$0
$1,000
$2,000
$3,000
$4,000
$5,000
$6,000
$7,000
$8,000
$9,000
$10,000
$11,000
Coal + Fossil
Steam
NGCC Renewables New energy
efficiency
New NGCC
2012 2015 2020 2025 2030
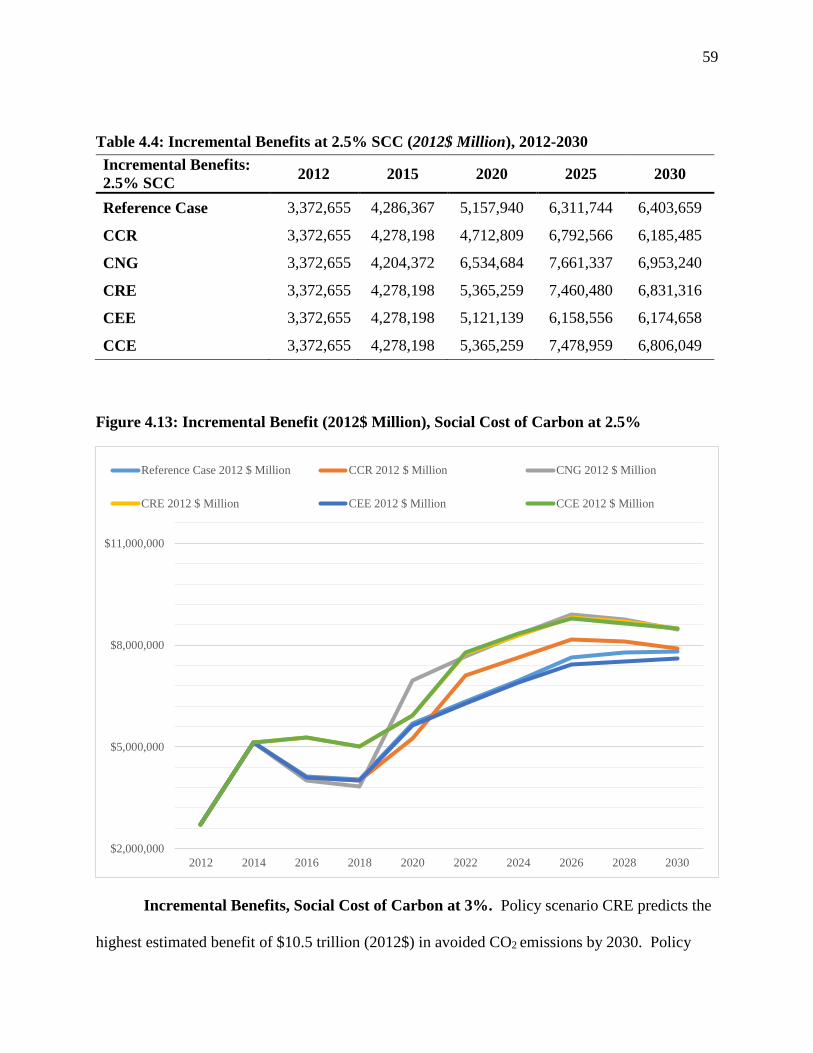
59
Table 4.4: Incremental Benefits at 2.5% SCC (2012$ Million), 2012-2030
Incremental Benefits:
2.5% SCC 2012 2015 2020 2025 2030
Reference Case 3,372,655 4,286,367 5,157,940 6,311,744 6,403,659
CCR 3,372,655 4,278,198 4,712,809 6,792,566 6,185,485
CNG 3,372,655 4,204,372 6,534,684 7,661,337 6,953,240
CRE 3,372,655 4,278,198 5,365,259 7,460,480 6,831,316
CEE 3,372,655 4,278,198 5,121,139 6,158,556 6,174,658
CCE 3,372,655 4,278,198 5,365,259 7,478,959 6,806,049
Figure 4.13: Incremental Benefit (2012$ Million), Social Cost of Carbon at 2.5%
Incremental Benefits, Social Cost of Carbon at 3%. Policy scenario CRE predicts the
highest estimated benefit of $10.5 trillion (2012$) in avoided CO2 emissions by 2030. Policy
$2,000,000
$5,000,000
$8,000,000
$11,000,000
2012 2014 2016 2018 2020 2022 2024 2026 2028 2030
Reference Case 2012 $ Million CCR 2012 $ Million CNG 2012 $ Million
CRE 2012 $ Million CEE 2012 $ Million CCE 2012 $ Million
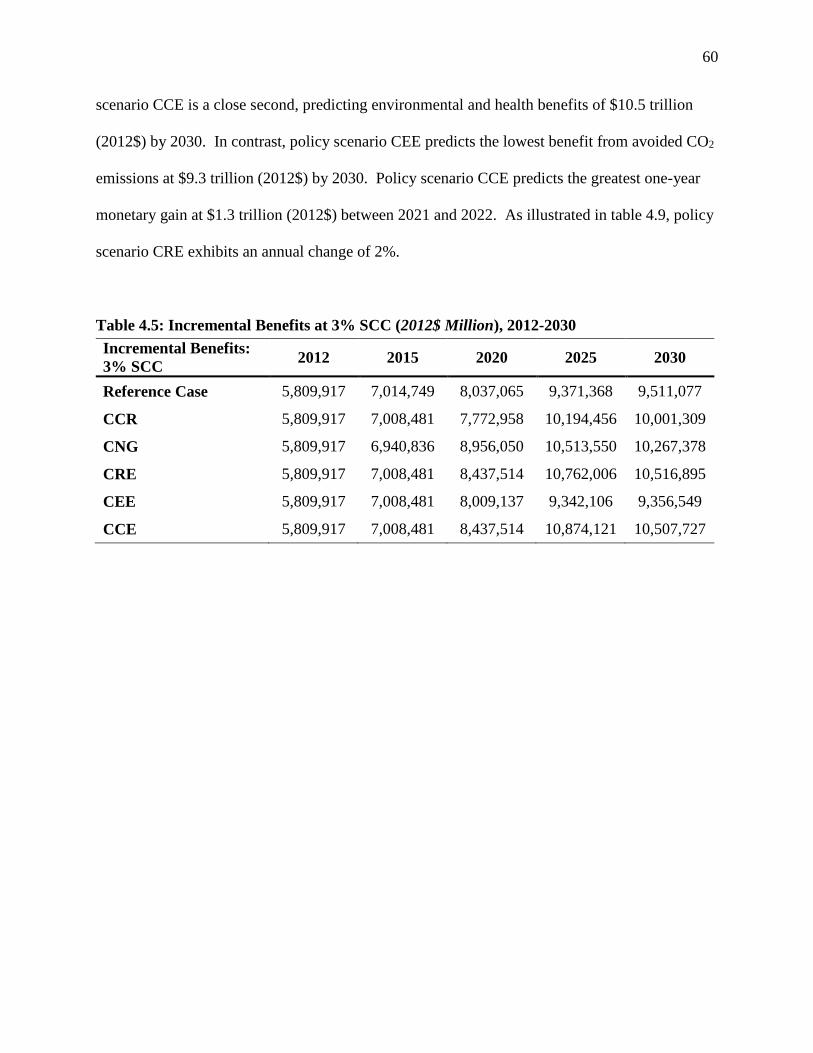
60
scenario CCE is a close second, predicting environmental and health benefits of $10.5 trillion
(2012$) by 2030. In contrast, policy scenario CEE predicts the lowest benefit from avoided CO2
emissions at $9.3 trillion (2012$) by 2030. Policy scenario CCE predicts the greatest one-year
monetary gain at $1.3 trillion (2012$) between 2021 and 2022. As illustrated in table 4.9, policy
scenario CRE exhibits an annual change of 2%.
Table 4.5: Incremental Benefits at 3% SCC (2012$ Million), 2012-2030
Incremental Benefits:
3% SCC 2012 2015 2020 2025 2030
Reference Case 5,809,917 7,014,749 8,037,065 9,371,368 9,511,077
CCR 5,809,917 7,008,481 7,772,958 10,194,456 10,001,309
CNG 5,809,917 6,940,836 8,956,050 10,513,550 10,267,378
CRE 5,809,917 7,008,481 8,437,514 10,762,006 10,516,895
CEE 5,809,917 7,008,481 8,009,137 9,342,106 9,356,549
CCE 5,809,917 7,008,481 8,437,514 10,874,121 10,507,727
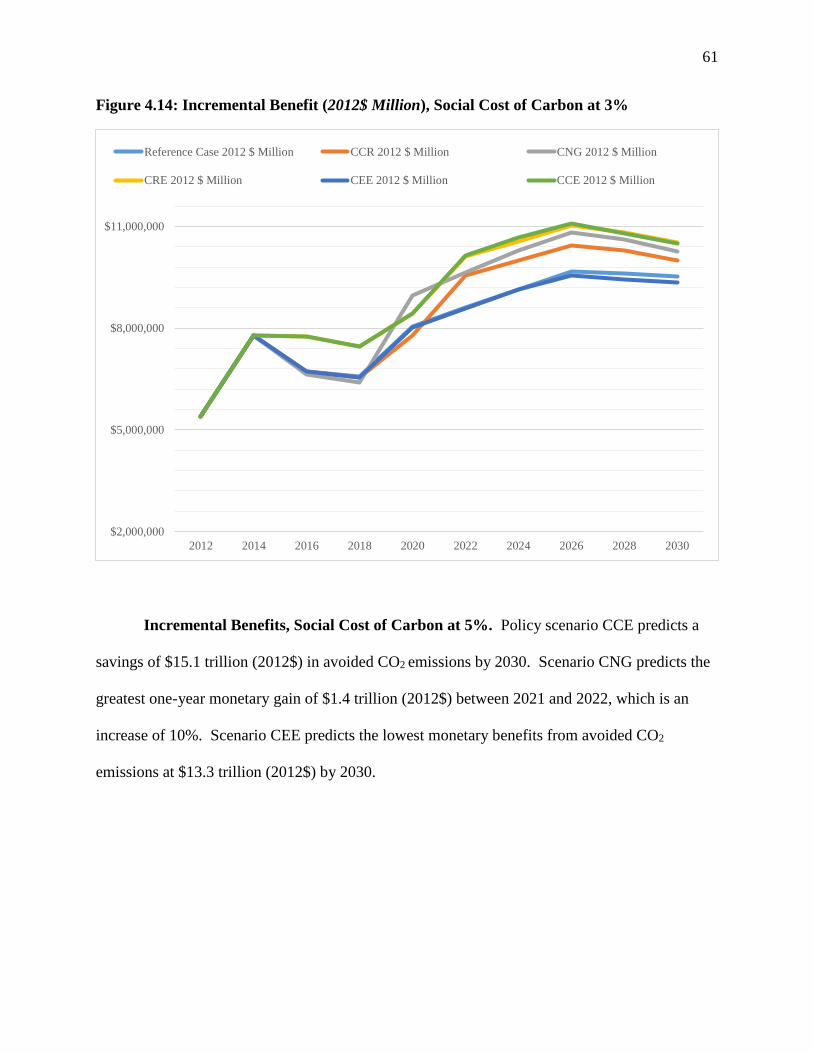
61
Figure 4.14: Incremental Benefit (2012$ Million), Social Cost of Carbon at 3%
Incremental Benefits, Social Cost of Carbon at 5%. Policy scenario CCE predicts a
savings of $15.1 trillion (2012$) in avoided CO2 emissions by 2030. Scenario CNG predicts the
greatest one-year monetary gain of $1.4 trillion (2012$) between 2021 and 2022, which is an
increase of 10%. Scenario CEE predicts the lowest monetary benefits from avoided CO2
emissions at $13.3 trillion (2012$) by 2030.
$2,000,000
$5,000,000
$8,000,000
$11,000,000
2012 2014 2016 2018 2020 2022 2024 2026 2028 2030
Reference Case 2012 $ Million CCR 2012 $ Million CNG 2012 $ Million
CRE 2012 $ Million CEE 2012 $ Million CCE 2012 $ Million
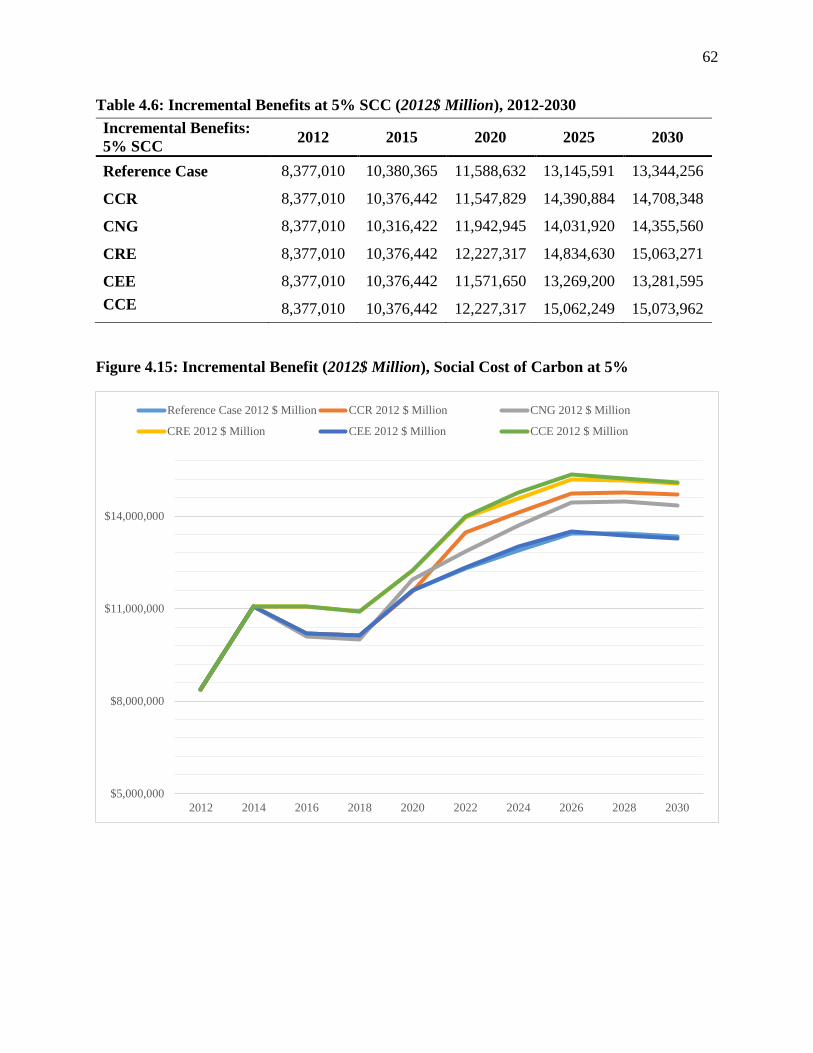
62
Table 4.6: Incremental Benefits at 5% SCC (2012$ Million), 2012-2030
Incremental Benefits:
5% SCC 2012 2015 2020 2025 2030
Reference Case 8,377,010 10,380,365 11,588,632 13,145,591 13,344,256
CCR 8,377,010 10,376,442 11,547,829 14,390,884 14,708,348
CNG 8,377,010 10,316,422 11,942,945 14,031,920 14,355,560
CRE 8,377,010 10,376,442 12,227,317 14,834,630 15,063,271
CEE 8,377,010 10,376,442 11,571,650 13,269,200 13,281,595
CCE 8,377,010 10,376,442 12,227,317 15,062,249 15,073,962
Figure 4.15: Incremental Benefit (2012$ Million), Social Cost of Carbon at 5%
$5,000,000
$8,000,000
$11,000,000
$14,000,000
2012 2014 2016 2018 2020 2022 2024 2026 2028 2030
Reference Case 2012 $ Million CCR 2012 $ Million CNG 2012 $ Million
CRE 2012 $ Million CEE 2012 $ Million CCE 2012 $ Million
63
Cost-benefit Ratio
This analysis shows that regardless of the method used to develop a state implementation
plan, the benefits associated with the policy outweigh the costs. Policy scenario CRE predicts
the highest cost-benefit ratio between 2016 and 2019. By 2020, policy scenario CNG predicts
the highest cost-benefit ratio between 2020 and 2030.
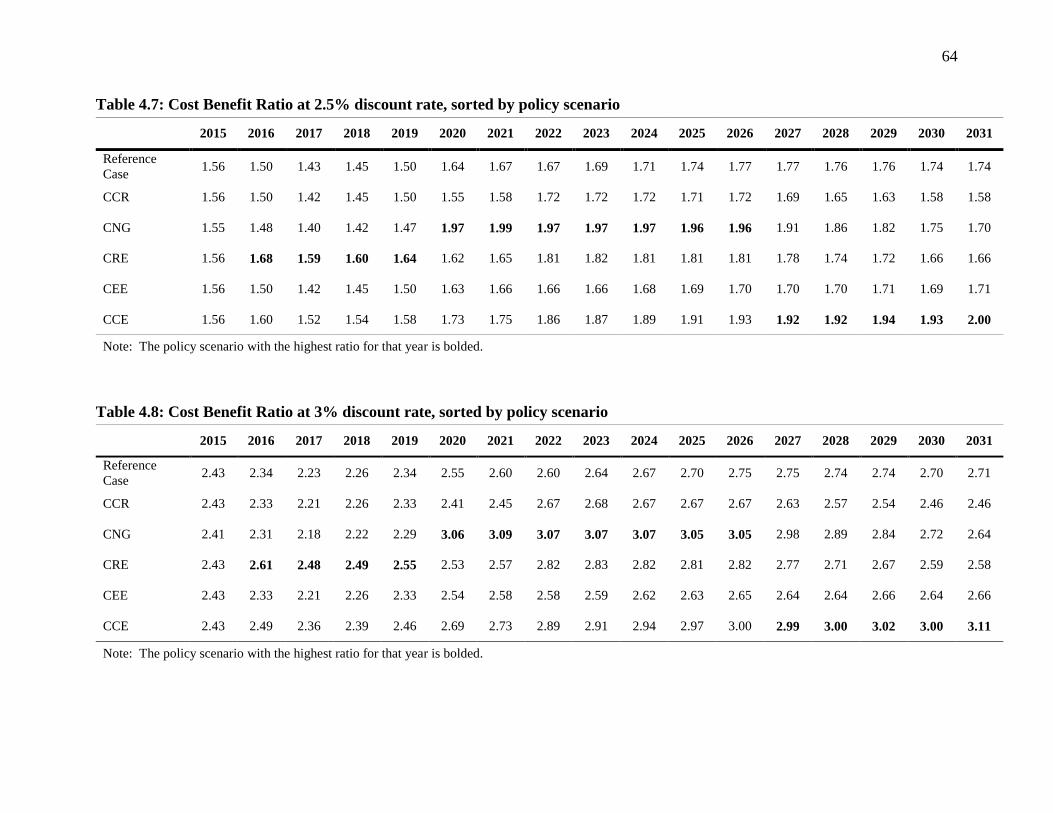
64
Table 4.7: Cost Benefit Ratio at 2.5% discount rate, sorted by policy scenario
2015 2016 2017 2018 2019 2020 2021 2022 2023 2024 2025 2026 2027 2028 2029 2030 2031
Reference
Case 1.56 1.50 1.43 1.45 1.50 1.64 1.67 1.67 1.69 1.71 1.74 1.77 1.77 1.76 1.76 1.74 1.74
CCR 1.56 1.50 1.42 1.45 1.50 1.55 1.58 1.72 1.72 1.72 1.71 1.72 1.69 1.65 1.63 1.58 1.58
CNG 1.55 1.48 1.40 1.42 1.47 1.97 1.99 1.97 1.97 1.97 1.96 1.96 1.91 1.86 1.82 1.75 1.70
CRE 1.56 1.68 1.59 1.60 1.64 1.62 1.65 1.81 1.82 1.81 1.81 1.81 1.78 1.74 1.72 1.66 1.66
CEE 1.56 1.50 1.42 1.45 1.50 1.63 1.66 1.66 1.66 1.68 1.69 1.70 1.70 1.70 1.71 1.69 1.71
CCE 1.56 1.60 1.52 1.54 1.58 1.73 1.75 1.86 1.87 1.89 1.91 1.93 1.92 1.92 1.94 1.93 2.00
Note: The policy scenario with the highest ratio for that year is bolded.
Table 4.8: Cost Benefit Ratio at 3% discount rate, sorted by policy scenario
2015 2016 2017 2018 2019 2020 2021 2022 2023 2024 2025 2026 2027 2028 2029 2030 2031
Reference
Case 2.43 2.34 2.23 2.26 2.34 2.55 2.60 2.60 2.64 2.67 2.70 2.75 2.75 2.74 2.74 2.70 2.71
CCR 2.43 2.33 2.21 2.26 2.33 2.41 2.45 2.67 2.68 2.67 2.67 2.67 2.63 2.57 2.54 2.46 2.46
CNG 2.41 2.31 2.18 2.22 2.29 3.06 3.09 3.07 3.07 3.07 3.05 3.05 2.98 2.89 2.84 2.72 2.64
CRE 2.43 2.61 2.48 2.49 2.55 2.53 2.57 2.82 2.83 2.82 2.81 2.82 2.77 2.71 2.67 2.59 2.58
CEE 2.43 2.33 2.21 2.26 2.33 2.54 2.58 2.58 2.59 2.62 2.63 2.65 2.64 2.64 2.66 2.64 2.66
CCE 2.43 2.49 2.36 2.39 2.46 2.69 2.73 2.89 2.91 2.94 2.97 3.00 2.99 3.00 3.02 3.00 3.11
Note: The policy scenario with the highest ratio for that year is bolded.
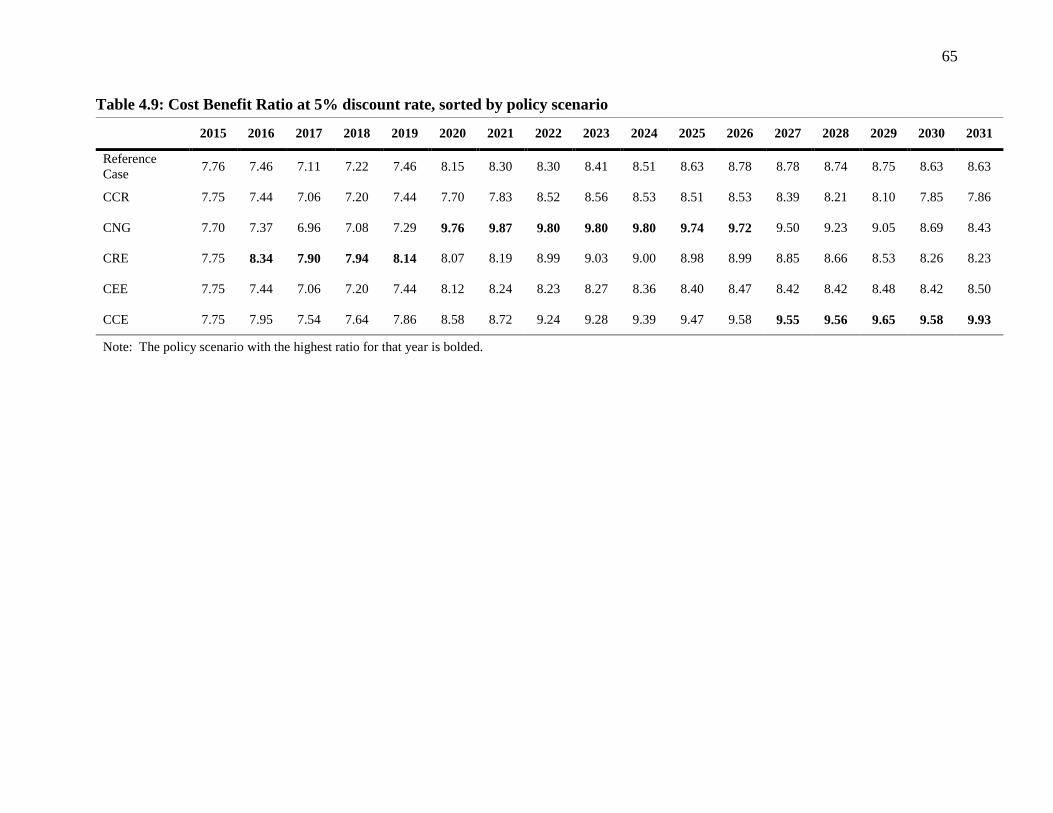
65
Table 4.9: Cost Benefit Ratio at 5% discount rate, sorted by policy scenario
2015 2016 2017 2018 2019 2020 2021 2022 2023 2024 2025 2026 2027 2028 2029 2030 2031
Reference
Case 7.76 7.46 7.11 7.22 7.46 8.15 8.30 8.30 8.41 8.51 8.63 8.78 8.78 8.74 8.75 8.63 8.63
CCR 7.75 7.44 7.06 7.20 7.44 7.70 7.83 8.52 8.56 8.53 8.51 8.53 8.39 8.21 8.10 7.85 7.86
CNG 7.70 7.37 6.96 7.08 7.29 9.76 9.87 9.80 9.80 9.80 9.74 9.72 9.50 9.23 9.05 8.69 8.43
CRE 7.75 8.34 7.90 7.94 8.14 8.07 8.19 8.99 9.03 9.00 8.98 8.99 8.85 8.66 8.53 8.26 8.23
CEE 7.75 7.44 7.06 7.20 7.44 8.12 8.24 8.23 8.27 8.36 8.40 8.47 8.42 8.42 8.48 8.42 8.50
CCE 7.75 7.95 7.54 7.64 7.86 8.58 8.72 9.24 9.28 9.39 9.47 9.58 9.55 9.56 9.65 9.58 9.93
Note: The policy scenario with the highest ratio for that year is bolded.
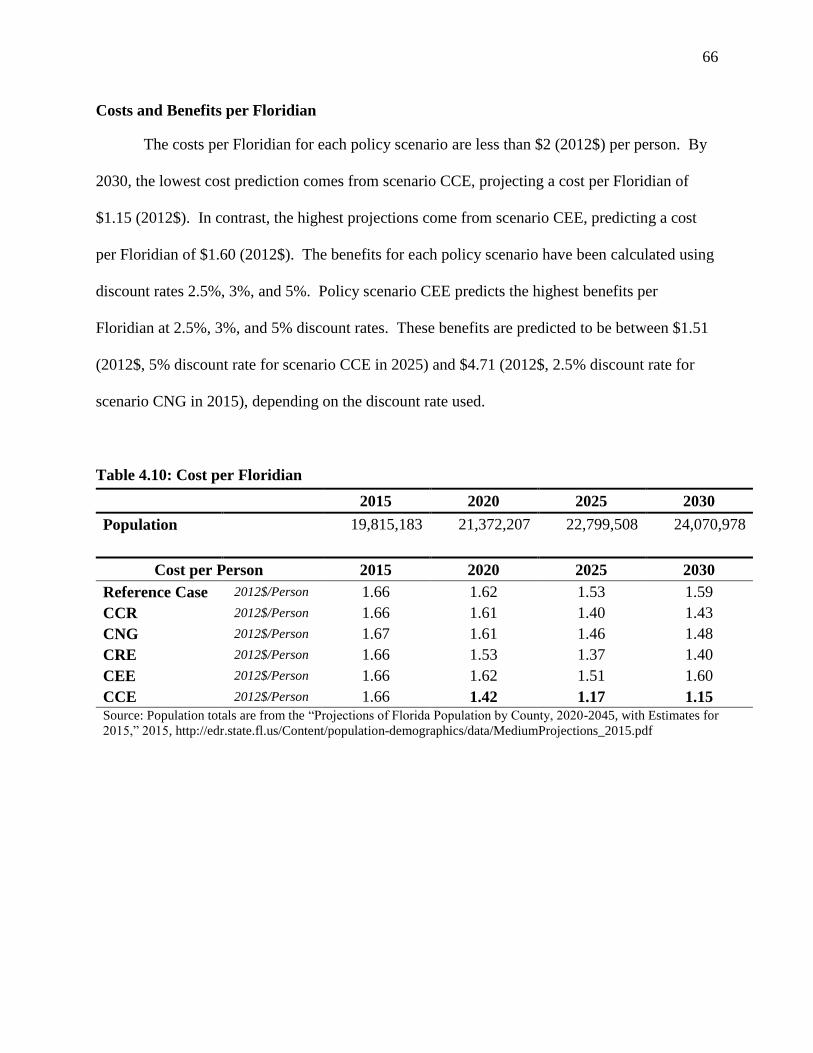
66
Costs and Benefits per Floridian
The costs per Floridian for each policy scenario are less than $2 (2012$) per person. By
2030, the lowest cost prediction comes from scenario CCE, projecting a cost per Floridian of
$1.15 (2012$). In contrast, the highest projections come from scenario CEE, predicting a cost
per Floridian of $1.60 (2012$). The benefits for each policy scenario have been calculated using
discount rates 2.5%, 3%, and 5%. Policy scenario CEE predicts the highest benefits per
Floridian at 2.5%, 3%, and 5% discount rates. These benefits are predicted to be between $1.51
(2012$, 5% discount rate for scenario CCE in 2025) and $4.71 (2012$, 2.5% discount rate for
scenario CNG in 2015), depending on the discount rate used.
Table 4.10: Cost per Floridian
2015 2020 2025 2030
Population 19,815,183 21,372,207 22,799,508 24,070,978
Cost per Person 2015 2020 2025 2030
Reference Case 2012$/Person 1.66 1.62 1.53 1.59
CCR 2012$/Person 1.66 1.61 1.40 1.43
CNG 2012$/Person 1.67 1.61 1.46 1.48
CRE 2012$/Person 1.66 1.53 1.37 1.40
CEE 2012$/Person 1.66 1.62 1.51 1.60
CCE 2012$/Person 1.66 1.42 1.17 1.15 Source: Population totals are from the “Projections of Florida Population by County, 2020-2045, with Estimates for
2015,” 2015, http://edr.state.fl.us/Content/population-demographics/data/MediumProjections_2015.pdf
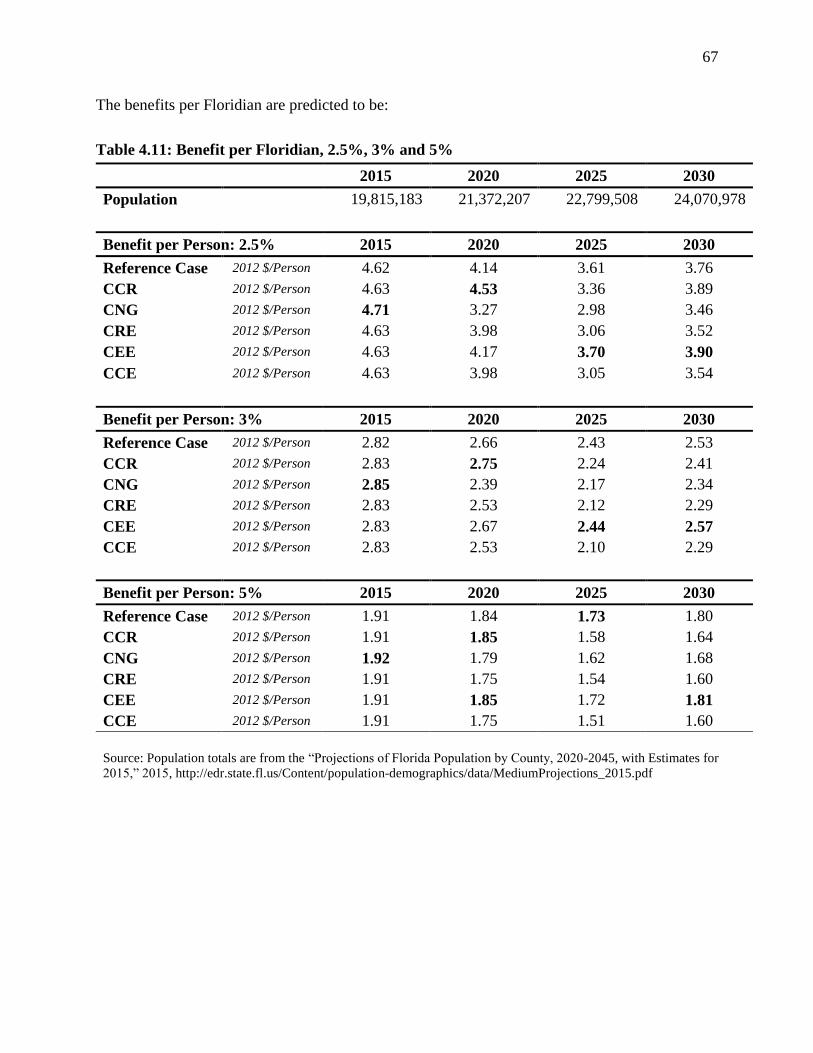
67
The benefits per Floridian are predicted to be:
Table 4.11: Benefit per Floridian, 2.5%, 3% and 5%
2015 2020 2025 2030
Population 19,815,183 21,372,207 22,799,508 24,070,978
Benefit per Person: 2.5% 2015 2020 2025 2030
Reference Case 2012 $/Person 4.62 4.14 3.61 3.76
CCR 2012 $/Person 4.63 4.53 3.36 3.89
CNG 2012 $/Person 4.71 3.27 2.98 3.46
CRE 2012 $/Person 4.63 3.98 3.06 3.52
CEE 2012 $/Person 4.63 4.17 3.70 3.90
CCE 2012 $/Person 4.63 3.98 3.05 3.54
Benefit per Person: 3% 2015 2020 2025 2030
Reference Case 2012 $/Person 2.82 2.66 2.43 2.53
CCR 2012 $/Person 2.83 2.75 2.24 2.41
CNG 2012 $/Person 2.85 2.39 2.17 2.34
CRE 2012 $/Person 2.83 2.53 2.12 2.29
CEE 2012 $/Person 2.83 2.67 2.44 2.57
CCE 2012 $/Person 2.83 2.53 2.10 2.29
Benefit per Person: 5% 2015 2020 2025 2030
Reference Case 2012 $/Person 1.91 1.84 1.73 1.80
CCR 2012 $/Person 1.91 1.85 1.58 1.64
CNG 2012 $/Person 1.92 1.79 1.62 1.68
CRE 2012 $/Person 1.91 1.75 1.54 1.60
CEE 2012 $/Person 1.91 1.85 1.72 1.81
CCE 2012 $/Person 1.91 1.75 1.51 1.60
Source: Population totals are from the “Projections of Florida Population by County, 2020-2045, with Estimates for
2015,” 2015, http://edr.state.fl.us/Content/population-demographics/data/MediumProjections_2015.pdf
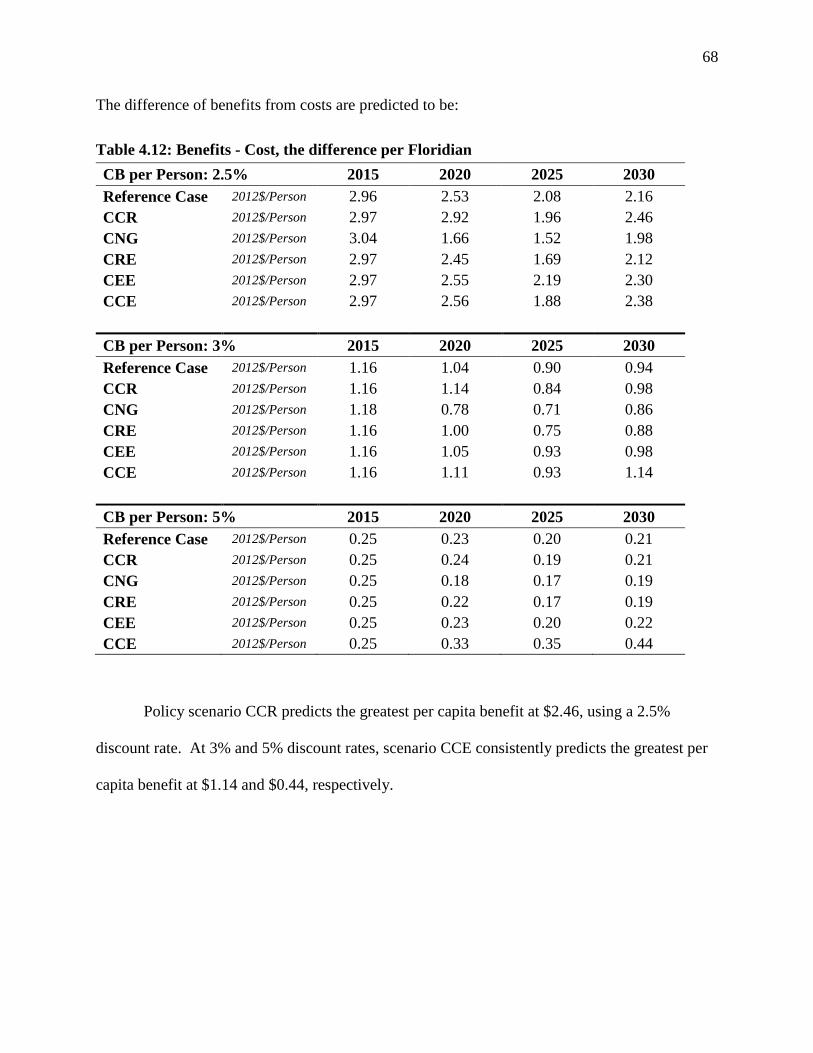
68
The difference of benefits from costs are predicted to be:
Table 4.12: Benefits - Cost, the difference per Floridian
CB per Person: 2.5% 2015 2020 2025 2030
Reference Case 2012$/Person 2.96 2.53 2.08 2.16
CCR 2012$/Person 2.97 2.92 1.96 2.46
CNG 2012$/Person 3.04 1.66 1.52 1.98
CRE 2012$/Person 2.97 2.45 1.69 2.12
CEE 2012$/Person 2.97 2.55 2.19 2.30
CCE 2012$/Person 2.97 2.56 1.88 2.38
CB per Person: 3% 2015 2020 2025 2030
Reference Case 2012$/Person 1.16 1.04 0.90 0.94
CCR 2012$/Person 1.16 1.14 0.84 0.98
CNG 2012$/Person 1.18 0.78 0.71 0.86
CRE 2012$/Person 1.16 1.00 0.75 0.88
CEE 2012$/Person 1.16 1.05 0.93 0.98
CCE 2012$/Person 1.16 1.11 0.93 1.14
CB per Person: 5% 2015 2020 2025 2030
Reference Case 2012$/Person 0.25 0.23 0.20 0.21
CCR 2012$/Person 0.25 0.24 0.19 0.21
CNG 2012$/Person 0.25 0.18 0.17 0.19
CRE 2012$/Person 0.25 0.22 0.17 0.19
CEE 2012$/Person 0.25 0.23 0.20 0.22
CCE 2012$/Person 0.25 0.33 0.35 0.44
Policy scenario CCR predicts the greatest per capita benefit at $2.46, using a 2.5%
discount rate. At 3% and 5% discount rates, scenario CCE consistently predicts the greatest per
capita benefit at $1.14 and $0.44, respectively.
69
Chapter 5
Energy and Emissions: Mitigating the Risks
The main objective of the Clean Power Plan (CPP) created by the Environmental
Protection Agency (EPA) is to reduce carbon dioxide (CO2) emissions from the electric utility
sector. The CPP outlines various methods that states may adopt in developing a state
implementation plan (SIP) to reduce CO2 emissions. In this study, the policy scenarios which
incorporate a variety of methods, ranging from reductions in coal and fossil steam units to adding
aggressive renewable generation and energy efficiency targets. Each scenario predicts that the
benefits associated with the policy will significantly outweigh the costs. The cost-benefit ratio
for each scenario exceeds 1, indicating that each scenario should be considered as feasible.
This study focuses on the economic impacts associated with addressing current and future
climate disruptions to the state of Florida, with the understanding that Florida cannot confront
this climatic turmoil alone. Florida, like other regions, is facing an economic and environmental
dilemma. Thus, the intention of this research is to help guide policy makers in their efforts to
determine Florida’s energy generation future and emissions reduction goals.
The method used for evaluating the CPP utilizes a cost-benefit analysis, which is a
standard environmental policy metric. The social cost of carbon (SCC) has been used to estimate
the value of mitigating the risks associated with CO2 emissions. To determine the costs
associated with the CPP, Synapse’s Clean Power Plan Planning Tool (CP3T) has been utilize as
a predictive simulation model. The CP3T enables adjustments to numerous factors involved in
determining emissions and costs related to parametric scenarios, in order to evaluate the best
system for emission reduction (BSER) methods outlined in the CPP.
Six policy scenario models have been run. Of these six scenarios, one serves as a
baseline reference case and reflects the minimal effort that Florida can exert to reduce emissions
70
and comply with the CPP. The remaining policy scenarios incorporate the EPA’s suggested
BSER methods. As a result, the policy scenarios studied here illustrate significant decreases in
generation from coal and fossil steam. However, three of the six scenarios predict increases in
CO2 emissions. One of the scenario’s projected increases are likely due to a 21% increase in
natural gas generation.
Which BSER, or mixture of methods, provides the best economic outcome for
Florida? Three policy scenarios consistently predict the highest cost-benefit ratios for
different calendar years. Policy scenarios CRE, CNG, and CCE predict the best economic
outcome for electric utility customers in Florida. Between 2016 and 2019, scenario CRE
projects the highest cost-benefit ratio. In this scenario, reliance on coal is reduced by 50%, new
natural gas combined cycle units are added in 2016, and renewables are added at a 6% rate
between 2020 to 2029 annually, then increased to 10% by 2030. The diversity of fuel sources,
addition of renewables, and the increased compliance costs result in a much better cost-benefit
ratio in the short-term, as predicted by the CRE scenario.
Between 2020 and 2026, the scenario CNG predicts the highest cost-benefit ratio.
Electric generation is predicted to decrease by 91%, beginning in 2020, because any unit listed as
a coal steam that has not already been scheduled for retirement has been forced into retirement
by 2020. The annual costs and benefits are predicted to increase over the analysis duration, but
this cost-benefit ratio may not provide an accurate policy outcome for the state.
Between 2027 and 2031, scenario CCE predicts the highest cost-benefit ratio. This
scenario combines the energy efficiency assumptions made in CEE – in which the incremental
savings goal is increased from 1.0% to 1.5% – with a start ramp rate of 0.5% in 2025, versus
0.2% in 2020. Additionally, new renewables have been added at 6% between 2020 and 2029,
71
which then increase to 10% in 2030 and 2031. In scenario CCE, annual compliance costs and
monetary benefits increase steadily from year to year. In actuality, policy scenario CCE
consistently predicts the second highest cost-benefit ratio from year to year.
Which mixture of BSER methods are economically viable while meeting EPA’s
emission reduction goals for the development of the State Implementation Plan (SIP)? By
incorporating the SCC, policy scenarios CRE, CNG, and CCE predict economically viable
options for policy makers to consider. Policy scenarios CRE and CCE show increased CO2
emissions by 3%; however, according to CP3T, Florida’s CPP mass-based and rate-based
emission reduction goals have not been met. The generation capacity for both policy scenarios
show increasing margins, as do the annual cost and monetary benefits. The benefits predicted in
policy scenario CRE are short-lived, indicating that it does not provide longevity for economic
vitality.
Policy scenario CNG proposes to retire all coal steam generating units. Relying on this
as a generation mix is concerning. As the population continues to increase, relying on oil and
natural gas as the predominant generation fuel will not be sustainable. In 2012, the generation
statewide has been an estimated 73,038 megawatts (MW), and under policy scenario CNG it
decreased to 58,592 MW. Since the population of Florida is not expected to decrease
significantly by 2030, policy scenario CNG alone is not likely to meet future generation demand.
Given the shortcomings of policy scenarios CRE and CNG, the most economically viable
policy scenario for the development of Florida’s SIP is CCE. The annual cost associated with
this policy scenario is consistently high, but when evaluated in relation to the state’s projected
population, the cost per Floridian is estimated to be $1.42, $1.17 and $1.15 for years 2020, 2025
and 2030, respectively. The monetary benefits are not the highest from year to year, and like all
72
other policy scenarios, the monetary benefits per Floridian steadily decrease. In 2025, each
policy scenario shows a reduction in monetized benefits, with an increase by 2030. Regardless,
CCE seems to be the most economically stable, compared to the other policy scenarios.
Energy is the Engine of Economic Growth: Generation Diversity
This study reveals that scenario CCE provides the greatest diversity of fuel sources for
the state. In order to create a resilient and sustainable energy market, diversity of the fuel used
for generation must be a priority. The U.S. has experienced a reduction in CO2 emissions over
the past five years. Depending on the news or research source, the reasons for this decrease are a
result of switching fuel source from coal to natural gas, or the financial crisis that bottomed out
in 2007-2008, or both. Over the last several years, numerous states have enacted environmental
policies to reduce CO2 emissions and diversify electricity generation. These methods have been
reviewed by the EPA as an effort to analyze the economic costs related to climate change. The
resulting CPP has incorporated BSER methods that have been used successfully by other states.
Each year, Florida’s Public Service Commission’s (PSC) Ten Year Site Plan stresses the
importance for the state’s electric utilities to maintain a balanced fuel supply for electricity
generation. This request is evident in the 2007 Site Plan, in which the PSC (2007) states the
following:
The uncertainty associated with future natural gas and coal prices
and emergency energy policy at the state and federal levels
concerning the impact of greenhouse gas emissions have resulted
in several coal-fired plants no longer being considered as part of
the current planning process.
Over the last several years, this policy decision has resulted in numerous utilities finding
new methods for meeting fuel diversity requirements that do not include generation from coal
fired units. Fuel diversity throughout any electrical grid adds value by stabilizing supply prices
73
and ensuring reliability. The risk mitigation strategy associated with a diversified fuel source for
generation protects customers from the volatile commodities market and enhances the reliability
of supply.
After the turbulent 2004 and 2005 hurricane seasons that impinged upon the country
hurricanes Charley (August 13, 2004), Frances (September 5, 2004), Ivan (September 19, 2004),
Jeanne (September 24, 2004), Dennis (2005), Katrina (August 25, 2005), Rita (September 19,
2005), and Wilma (October 24, 2005), costs in the natural gas markets increased significantly.
According to the Federal Energy Regulatory Commission, New England bilateral power prices
increased by an average of 21% shortly after Hurricane Katrina made landfall (Abtew, Huebner,
Ciuca, & Swartz, 2006; Federal Energy Regulatory Commission, 2005). In 2005, natural gas
represented 32.5% of Florida’s energy generating fuel source. By 2014, natural gas became the
dominant fuel source for the state, at 58.8% (Florida Public Service Commission, 2015).
Florida’s use of natural gas as a dominant fuel for energy production is projected to grow
slowly over the next several years. The continued growth of natural gas as the dominant fuel
source can impact the state’s customers financially. In order for utility customers to receive cost-
effective and reliable electricity, the utility industry will need to incorporate additional fuel
sources to meet a growing demand that is not solely restricted to the fuel commodities market.
Makovich, Marks, and Martin (2014) have shown that “an integration of fuels and technologies
produces the least-cost power production mix”. As Florida’s PSC continues to review site plans
from the investor-owned, municipal, and cooperative electric utilities, the integrated resources
must include a combination of demand-side and supply-side resources.
74
Insuring the Future: An insurance premium associated with Carbon
In order to curb emissions, generate energy innovation, and invest in energy efficiency
programs, a carbon tax is viewed by many economists as a cost-effective method for reducing
CO2 emissions (Hsu, 2011; Lin & Li, 2011). A carbon tax would be a type of Pigovian tax,
which is taxation on an externality. The Pigovian tax serves “to finance the government’s
activities, to provide public goods, or to redistribute income” (Salanié, 2011). In turn, the
Pigovian tax has the potential to drive innovation and competition to reduce CO2 emissions.
This study recommends that Florida’s policymakers enact a Pigovian tax to pay into an
environmental fund to serve as an insurance policy to pay for the unpredictable consequences
related to climate disruptions. The results of this study show that by using the SCC at the 3%
discount rate – a rate generally accepted by environmental economists – the cost per ton of
carbon emitted is $36.61 (2012$).
The term “tax” in itself conjures negative reactions from many individuals, especially
policymakers, largely because of its symbolic meaning. As has been detailed by Murray
Edelman (1964) in his seminal work, The Symbolic Uses of Politics, symbolism is a significant
component within the political arena. Policy researchers like Deborah Stone (2012) and John W.
Kingdon (2011) have delved into how these symbols impact the direction of a policy. Symbols
are intrinsic to the individuals that decide to use them. Either through metaphors or narrative
stories, symbols generate emotions of the populous from problem to desired policy solution.
Hence, the idea of establishing a carbon tax may not be likely to motivate social change or garner
needed support from Floridians.
A more viable option for motivating the populous is to reframe the need for this
environmental policy as an insurance premium, similar to how health, property, and vehicle
75
insurances are purchased. This insurance premium, climate disturbance and adaptation fee, is a
cost-sharing mechanism to help pay for the costs associated with mitigating current and potential
losses related to the changes in the climate.
The climate disturbance and adaptation fee helps to address the externalities, in this case
CO2 emissions, involved in electricity generation. The CO2 emissions produced by electric
utilities are currently a cost not accounted for in the day-to-day generation operations; therefore,
the incentive to incorporate a diverse generation capacity is minimal. Florida’s policymakers
should consider incorporating a carbon tax into any energy or emissions policy to deal with the
environmental costs involved in generating electricity. A climate disturbance and adaptation fee
for CO2 emissions will ultimately encourage Florida’s electric utilities to reduce emissions,
which will promote adoption of alternative fuels, support mitigation efforts, and fund energy
efficiency programs (Lin & Li, 2011).
Compared to other air pollutants, measuring the amount of CO2 emissions from any
source requires very little effort from the utilities companies, since the carbon content from most
fossil fuels are known from point of extraction. The costs associated with carbon are, however,
highly disputed. Depending on the modeling tool used, the estimates for the marginal damages
from CO2 emissions vary widely (Lin & Li, 2011). This study proposes use of the Interagency
Working Group’s (IWG) SCC estimates to establish a climate disturbance and adaptation fee.
The fee will provide the financial assistance to drive innovation and energy efficiency, as well as
reduce emissions.
Ultimately, responsibility for this global problem needs to be taken by citizens who are
utilizing the world’s natural resources daily. The cost of carbon entering the atmosphere has a
76
social and environment cost attached to it. The “unpriced emissions distort markets at so many
points and transactions in our economy”; yet, no one has been held accountable for his or her
role in producing this socio-environmental harm (Hsu, 2011).
Policy Recommendation Summary
Distributed among Florida’s population, compliance with the CPP results in a net benefit
in all of the policy scenarios evaluated. The cost per Floridian to comply with the CPP (in
2012$) by 2030 ranges from $1.15 to $1.60. The benefits (at a 3% discount in 2012$) per
Floridian range from $3.46 to $3.90, producing a net surplus between $0.88 and $1.14. While all
policy scenarios are economically viable, the best policy scenario for Floridians is CCE. Policy
scenario CCE supports the addition of renewables, new natural gas combined cycle units, and the
implementation of energy efficiency programs. The cost per Floridian (in 2012$) for this policy
scenario by 2030 is $1.15, and the benefits per Floridian (at 3% discount in 2012$) are $2.29,
which provide a net surplus of $1.14. This study proposes that the $1.14 per Floridian be used to
pay for climate resiliency projects throughout the state, through a climate disturbance and
adaptation fee.
The CPP, like other federal policies, requires the states to oversee and ensure compliance.
When the national economy is doing well, state governments typically are able to enjoy this
revenue boom with the development of new programs. When the economy weakens, states are
forced to reduce programs and increase taxes to supplement their state budgets. If Florida elects
to create a climate disturbance and adaptation fee to help its residents, it will allow the state to
have greater control in the development of policies and programs that support climate resiliency
throughout the state.
77
The current climatic issues confronting Floridians involve protecting state lands, water
areas, greenways and unique ecosystems. Through the implementation of a fee, Floridians will
help fund the Florida Communities Trust, under the existing Florida Forever Act, to provide
assistance to local governments and nonprofits with which to reinvest in disadvantaged
communities throughout the state. Allocating the funds from the climate disturbance and
adaptation fee will provide the necessary financial assistance needed for the hardest hit
communities facing climate disturbances.
Future Research
The potential economic impacts of climatic activity on the state have widespread
consequences. The state’s main economic drivers are tourism and agriculture. If these industries
begin to decline due to the climate disturbances, the way of life for millions of residents within
the state will be drastically impacted. In a study evaluating the economic impacts that these
climate disturbances will have on Florida’s economy, the potential loss of gross domestic
product (GDP) ranges from 1.6% in 2025, and increases to 5.0% by 2100 (Stanton & Ackerman,
2007). This loss of revenue will dramatically influence how the state will be able to respond to
these climate disturbances. Future research should replicate Stanton and Ackerman’s (2007)
study using the information developed in this study to more comprehensively estimate the
impacts and demonstrate what is at stake for the state. Comparing the results from both analyses
will help to redirect the policy discussion in a positive direction.
Conclusion
Nationally ranked as number 4 in the country, Florida’s GDP totaled $893 billion in
2015. A portion of the contributing economic drivers for the state included tourism and
agriculture. In 2015, Florida hosted a total 104 million visitors, which equated to $89.1 billion in
78
tourism spending. Domestic travelers to the state totaled 89 million, while 15 million were
international and Canadian tourists (VISIT Florida - Research, n.d.). Approximately 41% of
domestic visitors participated in numerous waterfront activities in 2014 (Florida Department of
Environmental Protection, n.d., VISIT Florida - Research FAQ, n.d.).
In 2013, the state’s 48,000 commercial farms also boosted to the state’s economy with
exports totaling over $4 billion. The state’s commercial vegetable farms produced a wide range
of produce, which included oranges, tomatoes, snap beans, avocados, strawberries, sweat corn,
and tangerines, to name a few. In 2012, Florida’s livestock industry contributed $296 billion to
the state’s economy (Florida Department of Agriculture, n.d.). The tourism and agriculture
industries within the state provided a glimpse into what might be in store from the unpredictable
impacts associated with climate disruption. The unforeseen climate impacts on Floridians have
also been predicted to incur losses between $5.6 billion and $14.8 billion to existing property
(Kinniburgh, Bloomberg, et al., 2015).
These potential economic impacts due to continued climate disruption are the driving
force for this study. There are numerous disputes centered on the applicability of and economic
impacts associated with the CPP. By using a standard environmental economic method for the
analysis, Florida’s policy makers, regulatory groups, and public and private policy analysts will
benefit from a state-centered overview of the potential monetary effects that the CPP will have
on the state.
The costs associated with CO2 emissions are not currently being accounted for by current
projections, especially from the electricity generation sector, which scientists have agreed is a
major cause of current and future climate disruptions. In an effort to mitigate this environmental
loss, the emission reduction goals outlined by the CPP will force the electric utility sector to
79
invest a large amount of money to modify their generation capacity. These costs will ultimately
be passed down to electric utility customers; however, citizens need to determine which is more
valuable to them: clean air, continued economic growth, climate resilient communities,
ecosystem, or higher electricity rates due to the lack of fuel diversity.
The EPA’s development of the CPP is a step in the right direction. Unfortunately, many
states, including Florida, have challenged its legality. The CPP will force the electricity
generation sector to spend a significant amount of money in order to comply. However, Florida
is at a tipping point where continued degradation of environmental resources can potentially cost
more than complying with CPP. This study supports the EPA’s argument that the benefits
outweigh the costs to comply with the CPP. The research also highlights that there are available
methods through which the state can invest in itself to enable constant climatic activity.
The establishment of a climate disturbance and adaptation fee will help Florida to finance
climate resilient activities to communities throughout the state. An annual per capita cost of
$1.14 from the net surplus, reinvested back into communities experiencing flooding and beach
erosion, is a logical approach that most Floridians will likely support.
80
References
Abtew, W., Huebner, R. S., Ciuca, V., & Swartz, E. (2006, March). The 2005 Hurricane Season
in South Florida. South Florida Water Management District, Environmental Resource
Assessment Department, Water Quality Assessment Division. Retrieved from
http://www.sfwmd.gov/portal/page/portal/pg_grp_tech_pubs/portlet_tech_pubs/era-
439.pdf
Arrow, K. (1971). Essays in the Theory of Risk-Bearing. Chicago: Markham Publishing
Company.
Arrow, K., Cropper, M., Gollier, C., Groom, B., Heal, G., Newell, R., … Weitzman, M. (2013).
Determining Benefits and Costs for Future Generations. Science, 341(6144), 349–350.
http://doi.org/10.1126/science.1235665
Asafu-Adjaye, J. (2000). Environmental economics for non-economists. Singapore: World
Scientific.
Bishop, R. C. (1993). Economic efficiency, sustainability, and biodiversity. Ambio, 69–73.
BORCH, K. H. (1968). The Economics of Uncertainty. (PSME-2). Princeton University Press.
Retrieved from http://www.jstor.org/stable/j.ctt183pnhf
Brief of the Federal Respondents, State of Michigan v, Environmental Protection Agency, et al.,
Utility Air Regulatory Group v. Environmental Protection Agency, et al., National
Mining Association v. Environmental Protection Agency, et al., No. No. 14-46, 14-47,
and 12-49 (U.S. Supreme Court March 2015).
Bureau of Labor Statistics Data. (n.d.). Retrieved April 9, 2016, from http://data.bls.gov/cgi-
bin/surveymost
Callan, S., & Thomas, J. M. (2004). Environmental economics & management: theory, policy,
and applications (3rd ed). Mason, Ohio: Thomson/South-Western.
81
Carbon Pollution Emission Guidelines for Existing Stationary Sources: Electric Utility
Generating Units, RIN 2060-AR33 EPA-HQ-OAR-2013-0602 § 40 CFR Part 60 (2015).
Retrieved from https://www.federalregister.gov/articles/2014/06/18/2014-13726/carbon-
pollution-emission-guidelines-for-existing-stationary-sources-electric-utility-generating
Davenport, C., & Robertson, C. (2016, May 2). Resettling the First American “Climate
Refugees.” The New York Times. Retrieved from
http://www.nytimes.com/2016/05/03/us/resettling-the-first-american-climate-
refugees.html
Department of Defense. (2015, July 23). DoD Releases Report on Security Implications of
Climate Change. Retrieved January 24, 2016, from http://www.defense.gov/News-
Article-View/Article/612710/dod-releases-report-on-security-implications-of-climate-
change
Edelmen, M. (1964). The Symbolic Uses of Politics. Urbana: University of Illinois Press.
Environmental Protection Agency. (2010, February). Technical Support Document: Social Cost
of Carbon for Regulatory Impact Analysis Under Executive Order 12866. Interagency
Working Group on Social Cost of Carbon, United States Government. Retrieved from
http://www3.epa.gov/otaq/climate/regulations/scc-tsd.pdf
Federal Energy Regulatory Commission. (2005). Gulf Coast Storms Exacerbate Tight Natural
Gas Supplies; Already High Prices Driven Higher. Retrieved from
http://www.ferc.gov/EventCalendar/Files/20051020121515-Gaspricereport.pdf
Federal Plan Requirements for Greenhouse Gas Emissions from Electric Utility Generating Units
Constructed on or Before January 8, 2014; Model Trading Rules; Amendments to
82
Framework Regulations, RIN 2060-AS47 40 CFR Part 62 (2015). Retrieved from
http://www.epa.gov/airquality/cpp/cpp-proposed-federal-plan.pdf
Flechas, J., & Staletovich, J. (2015, October 23). Miami Beach’s battle to stem rising tides.
Retrieved April 6, 2016, from
http://www.miamiherald.com/news/local/community/miami-dade/miami-
beach/article41141856.html
Florida Department of Agriculture. (n.d.). Florida Agriculture Overview and Statistics. Retrieved
April 27, 2016, from http://www.freshfromflorida.com/Divisions-Offices/Marketing-and-
Development/Education/For-Researchers/Florida-Agriculture-Overview-and-Statistics
Florida Department of Environmental Protection. (n.d.). Beaches and Coastal Systems. Retrieved
April 27, 2016, from http://www.dep.state.fl.us/beaches/
Florida’s Office of Economic and Demographic Research. (2015, April 1). Projections of Florida
Population by County, 2020-2045, with Estimates for 2015. Retrieved from
http://edr.state.fl.us/Content/population-demographics/data/MediumProjections_2015.pdf
Florida Public Service Commission. (2015). Review of the 2015 Ten-Year Site Plans for
Florida’s Electric Utilities. Retrieved from
http://www.psc.state.fl.us/Files/PDF/Utilities/Electricgas/TenYearSitePlans/2015/Review
Frelinghuysen, R. Department of Defense Appropriations Act, 2015, Pub. L. No. H.R. 4870
(2014). Retrieved from https://www.congress.gov/bill/113th-congress/house-
bill/4870/text
Gillingham, K., Newell, R. G., & Palmer, K. (2009). Energy efficiency economics and policy.
National Bureau of Economic Research.
83
Glaser, P. S., McGuffey III, C. W., & Gaines, H. W. (n.d.). EPA’s Section 111 (d) Carbon Rule:
What if States Just Said No? Retrieved from http://www.ieca-us.com/wp-
content/uploads/EPA-Section-111d-Carbon-Rule_What-if-States-Just-Said-
No_11.2014.pdf
Gordon, K. (2014). The economic risks of climate change in the United States (Risky Business
Project). Rhodium Group. Retrieved from
http://riskybusiness.org/site/assets/uploads/2015/09/RiskyBusiness_Report_WEB_09_08
_14.pdf
Hatase, K., & Managi, S. (2015). Increase in carbon prices: analysis of energy-economy
modeling. Environmental Economics and Policy Studies, 17(2), 241–262.
http://doi.org/10.1007/s10018-014-0101-2
Hibbard, P., Okie, A., & Tierney, S. (2014). EPA’s Clean Power Plan: States’ Tools for
Reducing Costs and Increasing Benefits to Consumers. Washington: Analysis Group.
HM Treasury. (n.d.). The Green Book: Appraisal and Evaluation in Central Government.
Retrieved from
https://www.gov.uk/government/uploads/system/uploads/attachment_data/file/220541/gr
een_book_complete.pdf
Hsu, S.-L. (2011). The case for a carbon tax getting past our hang-ups to effective climate
policy. Washington, DC: Island Press. Retrieved from http://site.ebrary.com/id/10500356
Hultman, N. E., Hassenzahl, D. M., & Rayner, S. (2010). Climate Risk. Annual Review of
Environment and Resources, 35(1), 283–303.
http://doi.org/10.1146/annurev.environ.051308.084029
84
Kaswan, A. (2014). Controlling Power Plants: The Co-Pollutant Implications of EPA’s Clean
Air Act § 111 (d) Options for Greenhouse Gases. Virginia Environmental Law Journal,
32(173).
Kingdon, J. W. (2011). Agendas, alternatives, and public policies (Updated 2nd ed). Boston:
Longman.
Kinniburgh, F., Bloomberg, M., Paulson, Jr, H., & Steyer, T. (2015). Come Heat or High Water:
Climate Risk in the Southeastern U.S. and Texas. Risk Business. Retrieved from
http://riskybusiness.org/site/assets/uploads/2015/09/Climate-Risk-in-Southeast-and-
Texas.pdf
Kinniburgh, F., Greer Simonton, M., & Allouch, C. (2015). Risky Business: The bottom line on
climate change, Come heat and high water: Climate risk inthe southeastern U.S. and
Texas. Risky Business. Retrieved from
http://riskybusiness.org/site/assets/uploads/2015/09/Climate-Risk-in-Southeast-and-
Texas.pdf
Knight, P. (2015, November 23). Clean Power Plan Tool (CP3T): Usesr Manual Version 2.2.
Synapse Energy Economics, Inc. Retrieved from www.synapse-
energy.com/sites/default/files/tools/CP3T-User-Manual.pdf
Lin, B., & Li, X. (2011). The effect of carbon tax on per capita CO2 emissions. Energy Policy,
39(9), 5137–5146. http://doi.org/10.1016/j.enpol.2011.05.050
Maldonado, J. K., Shearer, C., Bronen, R., Peterson, K., & Lazrus, H. (2013). The impact of
climate change on tribal communities in the US: displacement, relocation, and human
rights. Climatic Change, 120(3), 601–614. http://doi.org/10.1007/s10584-013-0746-z
85
Michigan v. EPA, No. 135 S. Ct. 2699, 576 US 14, 192 L. Ed. 2d 674 (U.S. Supreme Court
2015).
Nash, M. P. (2010). Climate Refugee. L.A. Think Tank.
National Centers for Environmental Information. (n.d.). Billion-Dollar Weather and Climate
Disasters: Table of Events. Retrieved February 27, 2016, from
https://www.ncdc.noaa.gov/billions/events
Nordhaus, W. D. (2013). The climate casino: risk, uncertainty, and economics for a warming
world. New Haven: Yale University Press.
Oates, D. L., & Jaramillo, P. (2015). State Cooperation Under the EPA’s Proposed Clean Power
Plan. The Electricity Journal, 28(3), 26–40. http://doi.org/10.1016/j.tej.2015.03.007
Pachauri, R. K., Mayer, L., & Intergovernmental Panel on Climate Change. (2015). Climate
change 2014: synthesis report. Retrieved from http://www.ipcc.ch/pdf/assessment-
report/ar5/syr/SYR_AR5_FINAL_full.pdf
Reid, A. (2013, February 5). South Florida Climate Change: “We Are All Getting Wet
Together.” Retrieved May 7, 2016, from
http://www.huffingtonpost.com/2012/12/07/south-florida-steps-up-climate-change-
efforts_n_2254698.html
Salanié, B. (2011). Economics of Taxation (2nd Edition). Cambridge, MA, USA: MIT Press.
Retrieved from http://www.ebrary.com
Shaw, R., Mallick, F., & Islam, A. (Eds.). (2013). Climate Change Adaptation Actions in
Bangladesh. Tokyo: Springer Japan. Retrieved from
http://link.springer.com/10.1007/978-4-431-54249-0
86
Southeast Florida Regional Climate Change Compact Counties. A Region Responds to a
Changing Climate: Regional Climate Action Plan. (2012, October). Retrieved from
http://www.southeastfloridaclimatecompact.org//wp-content/uploads/2014/09/regional-
climate-action-plan-final-ada-compliant.pdf
Staff, A. J. (2007). Managing Climate Risk. London: Thorogood. Retrieved from
http://public.eblib.com/choice/PublicFullRecord.aspx?p=3038114
Staletovich, J. (2015, July 27). Florida leads nation in property at risk from climate change. The
Miami Herald. Retrieved from
http://www.miamiherald.com/news/local/environment/article29029159.html
Stanton, E., & Ackerman, F. (2007). Florida and Climate Change: The Cost of Inaction. Tufts
University, Global Development and Environment Institute and Stockholm Environment
Institute - US Center. Retrieved from
http://www.ase.tufts.edu/gdae/Pubs/rp/Florida_hr.pdf
State of West Virginia, State of Texas, et. al v. United Stated Environmental Protection Agency,
and Regina McCarthy (U.S. Supreme Court January 26, 2016). Retrieved from
http://www.scotusblog.com/wp-content/uploads/2016/01/15A773-application.pdf
Stone, D. A. (2012). Policy paradox: The art of political decision making. WW Norton New
York.
Sullivan, J. J., & Arias, F. H. (1972). Concepts and principles for environmental economics. B.C.
Envtl. Aff. L. Rev. 597, 2(3). Retrieved from
http://lawdigitalcommons.bc.edu/ealr/vol2/iss3/8
Thiele, L. P. (2013). Sustainability. Retrieved from
http://public.eblib.com/choice/publicfullrecord.aspx?p=1174343
87
U.S. Army Corps of Engineers – Mississippi Valley Division. (2013). Revised Programmatic
Environmental Impact Statement (Final). Retrieved from
http://www.mvn.usace.army.mil/Portals/56/docs/PD/Projects/MTG/FinalRevisedProgram
maticEISMtoG.pdf
VISIT Florida - Research. (n.d.). Retrieved April 27, 2016, from
http://www.visitflorida.org/resources/research/
VISIT Florida - Research FAQ. (n.d.). Retrieved April 27, 2016, from
http://www.visitflorida.org/resources/research/research-faq/
Weitzman, M. L. (2001). Gamma Discounting. American Economic Review, 91(1), 260–271.
http://doi.org/10.1257/aer.91.1.260
Yearwood Travezan, J., Harmsen, R., & van Toledo, G. (2013). Policy analysis for energy
efficiency in the built environment in Spain. Energy Policy, 61, 317–326.
http://doi.org/10.1016/j.enpol.2013.05.096
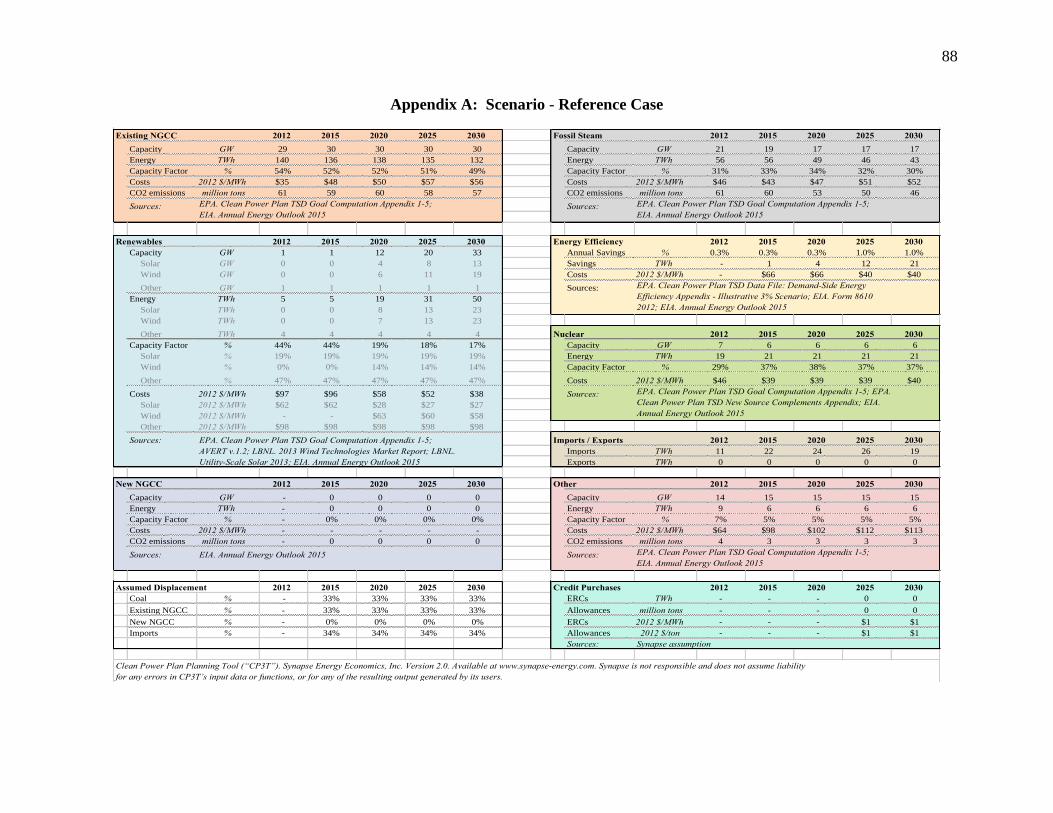
88
Appendix A: Scenario - Reference Case
Existing NGCC 2012 2015 2020 2025 2030 Fossil Steam 2012 2015 2020 2025 2030
Capacity GW 29 30 30 30 30 Capacity GW 21 19 17 17 17
Energy TWh 140 136 138 135 132 Energy TWh 56 56 49 46 43
Capacity Factor % 54% 52% 52% 51% 49% Capacity Factor % 31% 33% 34% 32% 30%
Costs 2012 $/MWh $35 $48 $50 $57 $56 Costs 2012 $/MWh $46 $43 $47 $51 $52
CO2 emissions million tons 61 59 60 58 57 CO2 emissions million tons 61 60 53 50 46
Sources: Sources:
Renewables 2012 2015 2020 2025 2030 Energy Efficiency 2012 2015 2020 2025 2030
Capacity GW 1 1 12 20 33 Annual Savings % 0.3% 0.3% 0.3% 1.0% 1.0%
Solar GW 0 0 4 8 13 Savings TWh - 1 4 12 21
Wind GW 0 0 6 11 19 Costs 2012 $/MWh - $66 $66 $40 $40
Other GW 1 1 1 1 1 Sources:
Energy TWh 5 5 19 31 50
Solar TWh 0 0 8 13 23
Wind TWh 0 0 7 13 23
Other TWh 4 4 4 4 4 Nuclear 2012 2015 2020 2025 2030
Capacity Factor % 44% 44% 19% 18% 17% Capacity GW 7 6 6 6 6
Solar % 19% 19% 19% 19% 19% Energy TWh 19 21 21 21 21
Wind % 0% 0% 14% 14% 14% Capacity Factor % 29% 37% 38% 37% 37%
Other % 47% 47% 47% 47% 47% Costs 2012 $/MWh $46 $39 $39 $39 $40
Costs 2012 $/MWh $97 $96 $58 $52 $38 Sources:
Solar 2012 $/MWh $62 $62 $28 $27 $27
Wind 2012 $/MWh - - $63 $60 $58
Other 2012 $/MWh $98 $98 $98 $98 $98
Sources: Imports / Exports 2012 2015 2020 2025 2030
Imports TWh 11 22 24 26 19
Exports TWh 0 0 0 0 0
New NGCC 2012 2015 2020 2025 2030 Other 2012 2015 2020 2025 2030
Capacity GW - 0 0 0 0 Capacity GW 14 15 15 15 15
Energy TWh - 0 0 0 0 Energy TWh 9 6 6 6 6
Capacity Factor % - 0% 0% 0% 0% Capacity Factor % 7% 5% 5% 5% 5%
Costs 2012 $/MWh - - - - - Costs 2012 $/MWh $64 $98 $102 $112 $113
CO2 emissions million tons - 0 0 0 0 CO2 emissions million tons 4 3 3 3 3
Sources: EIA. Annual Energy Outlook 2015 Sources:
Assumed Displacement 2012 2015 2020 2025 2030 Credit Purchases 2012 2015 2020 2025 2030
Coal % - 33% 33% 33% 33% ERCs TWh - - - 0 0
Existing NGCC % - 33% 33% 33% 33% Allowances million tons - - - 0 0
New NGCC % - 0% 0% 0% 0% ERCs 2012 $/MWh - - - $1 $1
Imports % - 34% 34% 34% 34% Allowances 2012 $/ton - - - $1 $1
Sources: Synapse assumption
EPA. Clean Power Plan TSD Goal Computation Appendix 1-5;
EIA. Annual Energy Outlook 2015
Clean Power Plan Planning Tool (“CP3T”). Synapse Energy Economics, Inc. Version 2.0. Available at www.synapse-energy.com. Synapse is not responsible and does not assume liability
for any errors in CP3T’s input data or functions, or for any of the resulting output generated by its users.
EPA. Clean Power Plan TSD Goal Computation Appendix 1-5;
EIA. Annual Energy Outlook 2015
EPA. Clean Power Plan TSD Goal Computation Appendix 1-5;
EIA. Annual Energy Outlook 2015
EPA. Clean Power Plan TSD Data File: Demand-Side Energy
Efficiency Appendix - Illustrative 3% Scenario; EIA. Form 8610
2012; EIA. Annual Energy Outlook 2015
EPA. Clean Power Plan TSD Goal Computation Appendix 1-5; EPA.
Clean Power Plan TSD New Source Complements Appendix; EIA.
Annual Energy Outlook 2015
EPA. Clean Power Plan TSD Goal Computation Appendix 1-5;
AVERT v.1.2; LBNL. 2013 Wind Technologies Market Report; LBNL.
Utility-Scale Solar 2013; EIA. Annual Energy Outlook 2015
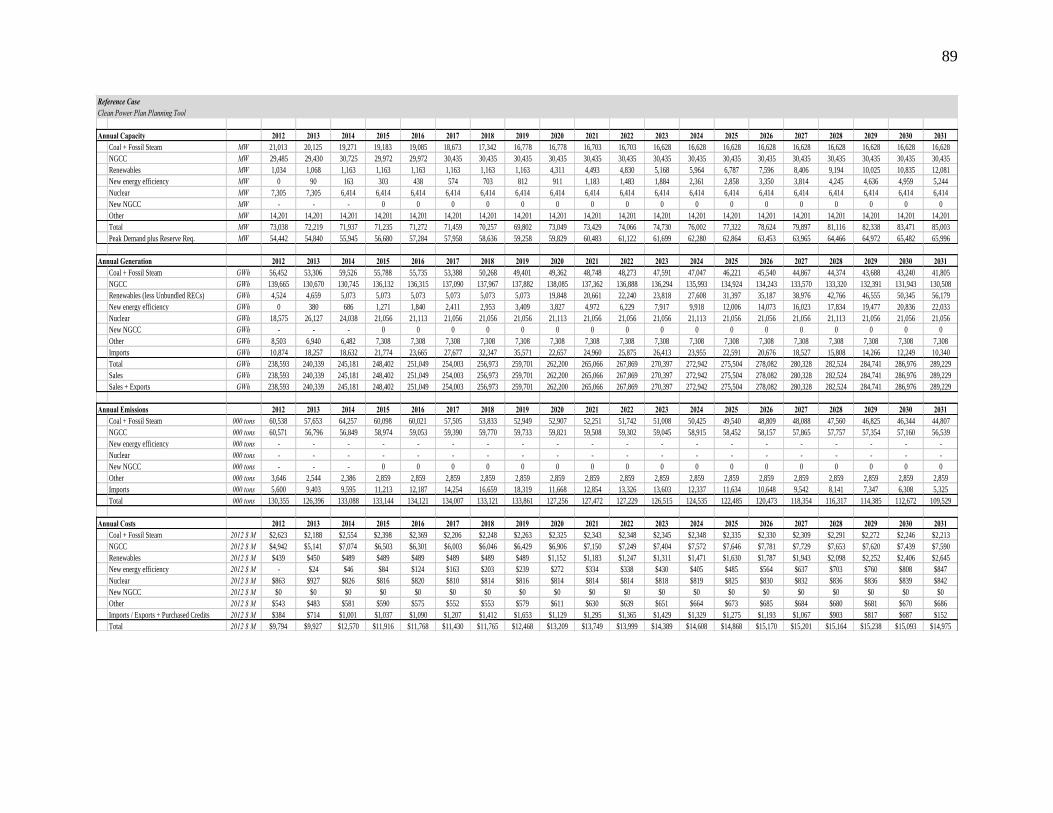
89
Reference Case
Clean Power Plan Planning Tool
Annual Capacity 2012 2013 2014 2015 2016 2017 2018 2019 2020 2021 2022 2023 2024 2025 2026 2027 2028 2029 2030 2031
Coal + Fossil Steam MW 21,013 20,125 19,271 19,183 19,085 18,673 17,342 16,778 16,778 16,703 16,703 16,628 16,628 16,628 16,628 16,628 16,628 16,628 16,628 16,628
NGCC MW 29,485 29,430 30,725 29,972 29,972 30,435 30,435 30,435 30,435 30,435 30,435 30,435 30,435 30,435 30,435 30,435 30,435 30,435 30,435 30,435
Renewables MW 1,034 1,068 1,163 1,163 1,163 1,163 1,163 1,163 4,311 4,493 4,830 5,168 5,964 6,787 7,596 8,406 9,194 10,025 10,835 12,081
New energy efficiency MW 0 90 163 303 438 574 703 812 911 1,183 1,483 1,884 2,361 2,858 3,350 3,814 4,245 4,636 4,959 5,244
Nuclear MW 7,305 7,305 6,414 6,414 6,414 6,414 6,414 6,414 6,414 6,414 6,414 6,414 6,414 6,414 6,414 6,414 6,414 6,414 6,414 6,414
New NGCC MW - - - 0 0 0 0 0 0 0 0 0 0 0 0 0 0 0 0 0
Other MW 14,201 14,201 14,201 14,201 14,201 14,201 14,201 14,201 14,201 14,201 14,201 14,201 14,201 14,201 14,201 14,201 14,201 14,201 14,201 14,201
Total MW 73,038 72,219 71,937 71,235 71,272 71,459 70,257 69,802 73,049 73,429 74,066 74,730 76,002 77,322 78,624 79,897 81,116 82,338 83,471 85,003
Peak Demand plus Reserve Req. MW 54,442 54,840 55,945 56,680 57,284 57,958 58,636 59,258 59,829 60,483 61,122 61,699 62,280 62,864 63,453 63,965 64,466 64,972 65,482 65,996
Annual Generation 2012 2013 2014 2015 2016 2017 2018 2019 2020 2021 2022 2023 2024 2025 2026 2027 2028 2029 2030 2031
Coal + Fossil Steam GWh 56,452 53,306 59,526 55,788 55,735 53,388 50,268 49,401 49,362 48,748 48,273 47,591 47,047 46,221 45,540 44,867 44,374 43,688 43,240 41,805
NGCC GWh 139,665 130,670 130,745 136,132 136,315 137,090 137,967 137,882 138,085 137,362 136,888 136,294 135,993 134,924 134,243 133,570 133,320 132,391 131,943 130,508
Renewables (less Unbundled RECs) GWh 4,524 4,659 5,073 5,073 5,073 5,073 5,073 5,073 19,848 20,661 22,240 23,818 27,608 31,397 35,187 38,976 42,766 46,555 50,345 56,179
New energy efficiency GWh 0 380 686 1,271 1,840 2,411 2,953 3,409 3,827 4,972 6,229 7,917 9,918 12,006 14,073 16,023 17,834 19,477 20,836 22,033
Nuclear GWh 18,575 26,127 24,038 21,056 21,113 21,056 21,056 21,056 21,113 21,056 21,056 21,056 21,113 21,056 21,056 21,056 21,113 21,056 21,056 21,056
New NGCC GWh - - - 0 0 0 0 0 0 0 0 0 0 0 0 0 0 0 0 0
Other GWh 8,503 6,940 6,482 7,308 7,308 7,308 7,308 7,308 7,308 7,308 7,308 7,308 7,308 7,308 7,308 7,308 7,308 7,308 7,308 7,308
Imports GWh 10,874 18,257 18,632 21,774 23,665 27,677 32,347 35,571 22,657 24,960 25,875 26,413 23,955 22,591 20,676 18,527 15,808 14,266 12,249 10,340
Total GWh 238,593 240,339 245,181 248,402 251,049 254,003 256,973 259,701 262,200 265,066 267,869 270,397 272,942 275,504 278,082 280,328 282,524 284,741 286,976 289,229
Sales GWh 238,593 240,339 245,181 248,402 251,049 254,003 256,973 259,701 262,200 265,066 267,869 270,397 272,942 275,504 278,082 280,328 282,524 284,741 286,976 289,229
Sales + Exports GWh 238,593 240,339 245,181 248,402 251,049 254,003 256,973 259,701 262,200 265,066 267,869 270,397 272,942 275,504 278,082 280,328 282,524 284,741 286,976 289,229
Annual Emissions 2012 2013 2014 2015 2016 2017 2018 2019 2020 2021 2022 2023 2024 2025 2026 2027 2028 2029 2030 2031
Coal + Fossil Steam 000 tons 60,538 57,653 64,257 60,098 60,021 57,505 53,833 52,949 52,907 52,251 51,742 51,008 50,425 49,540 48,809 48,088 47,560 46,825 46,344 44,807
NGCC 000 tons 60,571 56,796 56,849 58,974 59,053 59,390 59,770 59,733 59,821 59,508 59,302 59,045 58,915 58,452 58,157 57,865 57,757 57,354 57,160 56,539
New energy efficiency 000 tons - - - - - - - - - - - - - - - - - - - -
Nuclear 000 tons - - - - - - - - - - - - - - - - - - - -
New NGCC 000 tons - - - 0 0 0 0 0 0 0 0 0 0 0 0 0 0 0 0 0
Other 000 tons 3,646 2,544 2,386 2,859 2,859 2,859 2,859 2,859 2,859 2,859 2,859 2,859 2,859 2,859 2,859 2,859 2,859 2,859 2,859 2,859
Imports 000 tons 5,600 9,403 9,595 11,213 12,187 14,254 16,659 18,319 11,668 12,854 13,326 13,603 12,337 11,634 10,648 9,542 8,141 7,347 6,308 5,325
Total 000 tons 130,355 126,396 133,088 133,144 134,121 134,007 133,121 133,861 127,256 127,472 127,229 126,515 124,535 122,485 120,473 118,354 116,317 114,385 112,672 109,529
Annual Costs 2012 2013 2014 2015 2016 2017 2018 2019 2020 2021 2022 2023 2024 2025 2026 2027 2028 2029 2030 2031
Coal + Fossil Steam 2012 $ M $2,623 $2,188 $2,554 $2,398 $2,369 $2,206 $2,248 $2,263 $2,325 $2,343 $2,348 $2,345 $2,348 $2,335 $2,330 $2,309 $2,291 $2,272 $2,246 $2,213
NGCC 2012 $ M $4,942 $5,141 $7,074 $6,503 $6,301 $6,003 $6,046 $6,429 $6,906 $7,150 $7,249 $7,404 $7,572 $7,646 $7,781 $7,729 $7,653 $7,620 $7,439 $7,590
Renewables 2012 $ M $439 $450 $489 $489 $489 $489 $489 $489 $1,152 $1,183 $1,247 $1,311 $1,471 $1,630 $1,787 $1,943 $2,098 $2,252 $2,406 $2,645
New energy efficiency 2012 $ M - $24 $46 $84 $124 $163 $203 $239 $272 $334 $338 $430 $405 $485 $564 $637 $703 $760 $808 $847
Nuclear 2012 $ M $863 $927 $826 $816 $820 $810 $814 $816 $814 $814 $814 $818 $819 $825 $830 $832 $836 $836 $839 $842
New NGCC 2012 $ M $0 $0 $0 $0 $0 $0 $0 $0 $0 $0 $0 $0 $0 $0 $0 $0 $0 $0 $0 $0
Other 2012 $ M $543 $483 $581 $590 $575 $552 $553 $579 $611 $630 $639 $651 $664 $673 $685 $684 $680 $681 $670 $686
Imports / Exports + Purchased Credits 2012 $ M $384 $714 $1,001 $1,037 $1,090 $1,207 $1,412 $1,653 $1,129 $1,295 $1,365 $1,429 $1,329 $1,275 $1,193 $1,067 $903 $817 $687 $152
Total 2012 $ M $9,794 $9,927 $12,570 $11,916 $11,768 $11,430 $11,765 $12,468 $13,209 $13,749 $13,999 $14,389 $14,608 $14,868 $15,170 $15,201 $15,164 $15,238 $15,093 $14,975
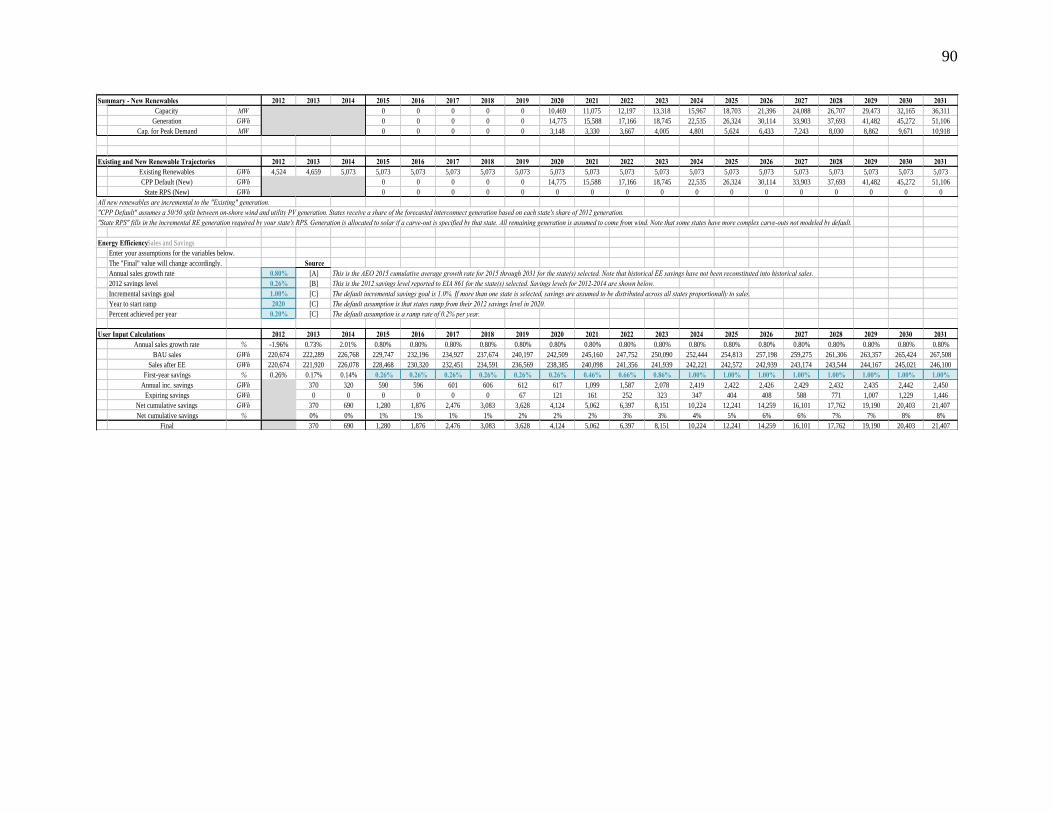
90
Summary - New Renewables 2012 2013 2014 2015 2016 2017 2018 2019 2020 2021 2022 2023 2024 2025 2026 2027 2028 2029 2030 2031
Capacity MW 0 0 0 0 0 10,469 11,075 12,197 13,318 15,967 18,703 21,396 24,088 26,707 29,473 32,165 36,311
Generation GWh 0 0 0 0 0 14,775 15,588 17,166 18,745 22,535 26,324 30,114 33,903 37,693 41,482 45,272 51,106
Cap. for Peak Demand MW 0 0 0 0 0 3,148 3,330 3,667 4,005 4,801 5,624 6,433 7,243 8,030 8,862 9,671 10,918
Existing and New Renewable Trajectories 2012 2013 2014 2015 2016 2017 2018 2019 2020 2021 2022 2023 2024 2025 2026 2027 2028 2029 2030 2031
Existing Renewables GWh 4,524 4,659 5,073 5,073 5,073 5,073 5,073 5,073 5,073 5,073 5,073 5,073 5,073 5,073 5,073 5,073 5,073 5,073 5,073 5,073
CPP Default (New) GWh 0 0 0 0 0 14,775 15,588 17,166 18,745 22,535 26,324 30,114 33,903 37,693 41,482 45,272 51,106
State RPS (New) GWh 0 0 0 0 0 0 0 0 0 0 0 0 0 0 0 0 0
All new renewables are incremental to the "Existing" generation.
"CPP Default" assumes a 50/50 split between on-shore wind and utility PV generation. States receive a share of the forecasted interconnect generation based on each state's share of 2012 generation.
"State RPS" fills in the incremental RE generation required by your state's RPS. Generation is allocated to solar if a carve-out is specified by that state. All remaining generation is assumed to come from wind. Note that some states have more complex carve-outs not modeled by default.
Energy Efficiency Sales and Savings
Enter your assumptions for the variables below.
The "Final" value will change accordingly. Source
Annual sales growth rate 0.80% [A] This is the AEO 2015 cumulative average growth rate for 2015 through 2031 for the state(s) selected. Note that historical EE savings have not been reconstituted into historical sales.
2012 savings level 0.26% [B] This is the 2012 savings level reported to EIA 861 for the state(s) selected. Savings levels for 2012-2014 are shown below.
Incremental savings goal 1.00% [C] The default incremental savings goal is 1.0%. If more than one state is selected, savings are assumed to be distributed across all states proportionally to sales.
Year to start ramp 2020 [C] The default assumption is that states ramp from their 2012 savings level in 2020.
Percent achieved per year 0.20% [C] The default assumption is a ramp rate of 0.2% per year.
User Input Calculations 2012 2013 2014 2015 2016 2017 2018 2019 2020 2021 2022 2023 2024 2025 2026 2027 2028 2029 2030 2031
Annual sales growth rate % -1.96% 0.73% 2.01% 0.80% 0.80% 0.80% 0.80% 0.80% 0.80% 0.80% 0.80% 0.80% 0.80% 0.80% 0.80% 0.80% 0.80% 0.80% 0.80% 0.80%
BAU sales GWh 220,674 222,289 226,768 229,747 232,196 234,927 237,674 240,197 242,509 245,160 247,752 250,090 252,444 254,813 257,198 259,275 261,306 263,357 265,424 267,508
Sales after EE GWh 220,674 221,920 226,078 228,468 230,320 232,451 234,591 236,569 238,385 240,098 241,356 241,939 242,221 242,572 242,939 243,174 243,544 244,167 245,021 246,100
First-year savings % 0.26% 0.17% 0.14% 0.26% 0.26% 0.26% 0.26% 0.26% 0.26% 0.46% 0.66% 0.86% 1.00% 1.00% 1.00% 1.00% 1.00% 1.00% 1.00% 1.00%
Annual inc. savings GWh 370 320 590 596 601 606 612 617 1,099 1,587 2,078 2,419 2,422 2,426 2,429 2,432 2,435 2,442 2,450
Expiring savings GWh 0 0 0 0 0 0 67 121 161 252 323 347 404 408 588 771 1,007 1,229 1,446
Net cumulative savings GWh 370 690 1,280 1,876 2,476 3,083 3,628 4,124 5,062 6,397 8,151 10,224 12,241 14,259 16,101 17,762 19,190 20,403 21,407
Net cumulative savings % 0% 0% 1% 1% 1% 1% 2% 2% 2% 3% 3% 4% 5% 6% 6% 7% 7% 8% 8%
Final 370 690 1,280 1,876 2,476 3,083 3,628 4,124 5,062 6,397 8,151 10,224 12,241 14,259 16,101 17,762 19,190 20,403 21,407
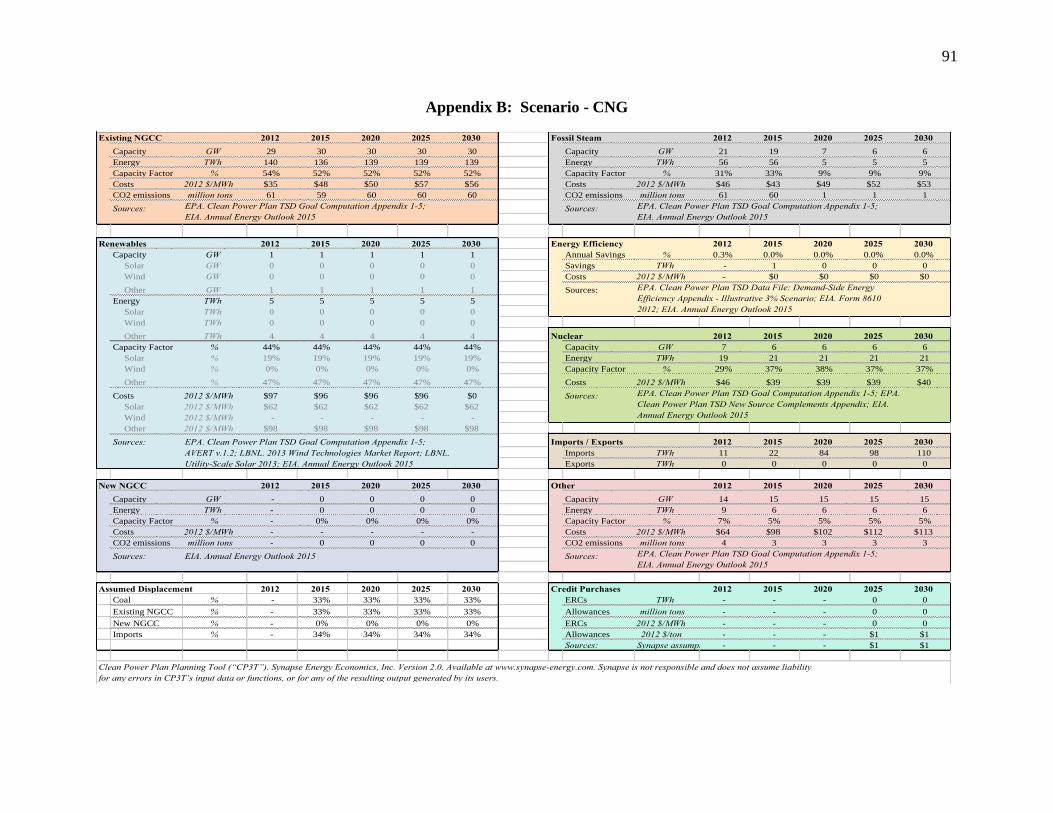
91
Appendix B: Scenario - CNG
Existing NGCC 2012 2015 2020 2025 2030 Fossil Steam 2012 2015 2020 2025 2030
Capacity GW 29 30 30 30 30 Capacity GW 21 19 7 6 6
Energy TWh 140 136 139 139 139 Energy TWh 56 56 5 5 5
Capacity Factor % 54% 52% 52% 52% 52% Capacity Factor % 31% 33% 9% 9% 9%
Costs 2012 $/MWh $35 $48 $50 $57 $56 Costs 2012 $/MWh $46 $43 $49 $52 $53
CO2 emissions million tons 61 59 60 60 60 CO2 emissions million tons 61 60 1 1 1
Sources: Sources:
Renewables 2012 2015 2020 2025 2030 Energy Efficiency 2012 2015 2020 2025 2030
Capacity GW 1 1 1 1 1 Annual Savings % 0.3% 0.0% 0.0% 0.0% 0.0%
Solar GW 0 0 0 0 0 Savings TWh - 1 0 0 0
Wind GW 0 0 0 0 0 Costs 2012 $/MWh - $0 $0 $0 $0
Other GW 1 1 1 1 1 Sources:
Energy TWh 5 5 5 5 5
Solar TWh 0 0 0 0 0
Wind TWh 0 0 0 0 0
Other TWh 4 4 4 4 4 Nuclear 2012 2015 2020 2025 2030
Capacity Factor % 44% 44% 44% 44% 44% Capacity GW 7 6 6 6 6
Solar % 19% 19% 19% 19% 19% Energy TWh 19 21 21 21 21
Wind % 0% 0% 0% 0% 0% Capacity Factor % 29% 37% 38% 37% 37%
Other % 47% 47% 47% 47% 47% Costs 2012 $/MWh $46 $39 $39 $39 $40
Costs 2012 $/MWh $97 $96 $96 $96 $0 Sources:
Solar 2012 $/MWh $62 $62 $62 $62 $62
Wind 2012 $/MWh - - - - -
Other 2012 $/MWh $98 $98 $98 $98 $98
Sources: Imports / Exports 2012 2015 2020 2025 2030
Imports TWh 11 22 84 98 110
Exports TWh 0 0 0 0 0
New NGCC 2012 2015 2020 2025 2030 Other 2012 2015 2020 2025 2030
Capacity GW - 0 0 0 0 Capacity GW 14 15 15 15 15
Energy TWh - 0 0 0 0 Energy TWh 9 6 6 6 6
Capacity Factor % - 0% 0% 0% 0% Capacity Factor % 7% 5% 5% 5% 5%
Costs 2012 $/MWh - - - - - Costs 2012 $/MWh $64 $98 $102 $112 $113
CO2 emissions million tons - 0 0 0 0 CO2 emissions million tons 4 3 3 3 3
Sources: EIA. Annual Energy Outlook 2015 Sources:
Assumed Displacement 2012 2015 2020 2025 2030 Credit Purchases 2012 2015 2020 2025 2030
Coal % - 33% 33% 33% 33% ERCs TWh - - - 0 0
Existing NGCC % - 33% 33% 33% 33% Allowances million tons - - - 0 0
New NGCC % - 0% 0% 0% 0% ERCs 2012 $/MWh - - - 0 0
Imports % - 34% 34% 34% 34% Allowances 2012 $/ton - - - $1 $1
Sources: Synapse assumption - - - $1 $1
Clean Power Plan Planning Tool (“CP3T”). Synapse Energy Economics, Inc. Version 2.0. Available at www.synapse-energy.com. Synapse is not responsible and does not assume liability
for any errors in CP3T’s input data or functions, or for any of the resulting output generated by its users.
EPA. Clean Power Plan TSD Goal Computation Appendix 1-5;
EIA. Annual Energy Outlook 2015
EPA. Clean Power Plan TSD Goal Computation Appendix 1-5;
EIA. Annual Energy Outlook 2015
EPA. Clean Power Plan TSD Data File: Demand-Side Energy
Efficiency Appendix - Illustrative 3% Scenario; EIA. Form 8610
2012; EIA. Annual Energy Outlook 2015
EPA. Clean Power Plan TSD Goal Computation Appendix 1-5; EPA.
Clean Power Plan TSD New Source Complements Appendix; EIA.
Annual Energy Outlook 2015
EPA. Clean Power Plan TSD Goal Computation Appendix 1-5;
AVERT v.1.2; LBNL. 2013 Wind Technologies Market Report; LBNL.
Utility-Scale Solar 2013; EIA. Annual Energy Outlook 2015
EPA. Clean Power Plan TSD Goal Computation Appendix 1-5;
EIA. Annual Energy Outlook 2015

92
CNG
Clean Power Plan Planning Tool
Annual Capacity 2012 2013 2014 2015 2016 2017 2018 2019 2020 2021 2022 2023 2024 2025 2026 2027 2028 2029 2030 2031
Coal + Fossil Steam MW 21,013 20,125 19,271 19,183 19,085 18,673 17,342 16,778 6,527 6,452 6,452 6,377 6,377 6,377 6,377 6,377 6,377 6,377 6,377 6,377
NGCC MW 29,485 29,430 30,725 29,972 29,972 30,435 30,435 30,435 30,435 30,435 30,435 30,435 30,435 30,435 30,435 30,435 30,435 30,435 30,435 30,435
Renewables MW 1,034 1,068 1,163 1,163 1,163 1,163 1,163 1,163 1,163 1,163 1,163 1,163 1,163 1,163 1,163 1,163 1,163 1,163 1,163 1,163
New energy efficiency MW 0 90 163 163 161 160 158 139 110 78 69 49 38 38 37 22 5 2 2 2
Nuclear MW 7,305 7,305 6,414 6,414 6,414 6,414 6,414 6,414 6,414 6,414 6,414 6,414 6,414 6,414 6,414 6,414 6,414 6,414 6,414 6,414
New NGCC MW - - - 0 0 0 0 0 0 0 0 0 0 0 0 0 0 0 0 0
Other MW 14,201 14,201 14,201 14,201 14,201 14,201 14,201 14,201 14,201 14,201 14,201 14,201 14,201 14,201 14,201 14,201 14,201 14,201 14,201 14,201
Total MW 73,038 72,219 71,937 71,096 70,995 71,045 69,713 69,130 58,850 58,743 58,734 58,639 58,628 58,627 58,627 58,612 58,595 58,592 58,592 58,592
Peak Demand plus Reserve Req. MW 54,442 54,840 55,945 56,680 57,284 57,958 58,636 59,258 59,829 60,483 61,122 61,699 62,280 62,864 63,453 63,965 64,466 64,972 65,482 65,996
Annual Generation 2012 2013 2014 2015 2016 2017 2018 2019 2020 2021 2022 2023 2024 2025 2026 2027 2028 2029 2030 2031
Coal + Fossil Steam GWh 56,452 53,306 59,526 55,981 56,119 54,855 50,858 50,075 5,311 5,163 5,163 5,074 5,088 5,074 5,074 5,074 5,088 5,074 5,074 5,074
NGCC GWh 139,665 130,670 130,745 136,325 136,699 138,556 138,556 138,556 138,935 138,556 138,556 138,556 138,935 138,556 138,556 138,556 138,936 138,556 138,556 138,556
Renewables (less Unbundled RECs) GWh 4,524 4,659 5,073 5,073 5,073 5,073 5,073 5,073 5,073 5,073 5,073 5,073 5,073 5,073 5,073 5,073 5,073 5,073 5,073 5,073
New energy efficiency GWh 0 380 686 686 676 671 665 583 463 327 291 207 159 158 156 93 23 9 9 9
Nuclear GWh 18,575 26,127 24,038 21,056 21,113 21,056 21,056 21,056 21,113 21,056 21,056 21,056 21,113 21,056 21,056 21,056 21,113 21,056 21,056 21,056
New NGCC GWh - - - 0 0 0 0 0 0 0 0 0 0 0 0 0 0 0 0 0
Other GWh 8,503 6,940 6,482 7,308 7,308 7,308 7,308 7,308 7,308 7,308 7,308 7,308 7,308 7,308 7,308 7,308 7,308 7,308 7,308 7,308
Imports GWh 10,874 18,257 18,632 21,973 24,060 26,485 33,457 37,049 83,996 87,583 90,423 93,123 95,265 98,279 100,859 103,168 104,983 107,665 109,900 112,153
Total GWh 238,593 240,339 245,181 248,402 251,049 254,003 256,973 259,701 262,200 265,066 267,869 270,397 272,942 275,504 278,082 280,328 282,524 284,741 286,976 289,229
Sales GWh 238,593 240,339 245,181 248,402 251,049 254,003 256,973 259,701 262,200 265,066 267,869 270,397 272,942 275,504 278,082 280,328 282,524 284,741 286,976 289,229
Sales + Exports GWh 238,593 240,339 245,181 248,402 251,049 254,003 256,973 259,701 262,200 265,066 267,869 270,397 272,942 275,504 278,082 280,328 282,524 284,741 286,976 289,229
Annual Emissions 2012 2013 2014 2015 2016 2017 2018 2019 2020 2021 2022 2023 2024 2025 2026 2027 2028 2029 2030 2031
Coal + Fossil Steam 000 tons 60,538 57,653 64,257 60,306 60,435 59,084 54,464 53,672 716 697 697 684 686 684 684 684 686 684 684 684
NGCC 000 tons 60,571 56,796 56,849 59,058 59,220 60,025 60,025 60,025 60,190 60,025 60,025 60,025 60,190 60,025 60,025 60,025 60,190 60,025 60,025 60,025
New energy efficiency 000 tons - - - - - - - - - - - - - - - - - - - -
Nuclear 000 tons - - - - - - - - - - - - - - - - - - - -
New NGCC 000 tons - - - 0 0 0 0 0 0 0 0 0 0 0 0 0 0 0 0 0
Other 000 tons 3,646 2,544 2,386 2,859 2,859 2,859 2,859 2,859 2,859 2,859 2,859 2,859 2,859 2,859 2,859 2,859 2,859 2,859 2,859 2,859
Imports 000 tons 5,600 9,403 9,595 11,316 12,391 13,640 17,231 19,080 43,258 45,105 46,568 47,959 49,062 50,613 51,943 53,132 54,066 55,448 56,599 57,759
Total 000 tons 130,355 126,396 133,088 133,539 134,904 135,608 134,579 135,636 107,023 108,686 110,148 111,527 112,796 114,182 115,511 116,700 117,801 119,016 120,167 121,327
Annual Costs 2012 2013 2014 2015 2016 2017 2018 2019 2020 2021 2022 2023 2024 2025 2026 2027 2028 2029 2030 2031
Coal + Fossil Steam 2012 $ M $2,623 $2,188 $2,554 $2,405 $2,382 $2,256 $2,270 $2,289 $259 $257 $260 $258 $262 $264 $266 $267 $268 $269 $268 $272
NGCC 2012 $ M $4,942 $5,141 $7,074 $6,512 $6,318 $6,063 $6,070 $6,459 $6,946 $7,209 $7,332 $7,520 $7,728 $7,841 $8,018 $8,003 $7,959 $7,956 $7,792 $8,034
Renewables 2012 $ M $439 $450 $489 $489 $489 $489 $489 $489 $489 $489 $489 $489 $489 $489 $489 $489 $489 $489 $489 $489
New energy efficiency 2012 $ M - $24 $46 $0 $0 $0 $0 $0 $0 $0 $0 $0 $0 $0 $0 $0 $0 $0 $0 $0
Nuclear 2012 $ M $863 $927 $826 $816 $820 $810 $814 $816 $814 $814 $814 $818 $819 $825 $830 $832 $836 $836 $839 $842
New NGCC 2012 $ M $0 $0 $0 $0 $0 $0 $0 $0 $0 $0 $0 $0 $0 $0 $0 $0 $0 $0 $0 $0
Other 2012 $ M $543 $483 $581 $590 $575 $552 $553 $579 $611 $630 $639 $651 $664 $673 $685 $684 $680 $681 $670 $686
Imports / Exports + Purchased Credits 2012 $ M $384 $714 $1,001 $1,046 $1,108 $1,155 $1,461 $1,721 $4,187 $4,542 $4,771 $5,040 $5,284 $5,546 $5,821 $5,943 $5,998 $6,165 $6,163 $5,877
Total 2012 $ M $9,794 $9,927 $12,570 $11,857 $11,692 $11,324 $11,656 $12,353 $13,306 $13,942 $14,305 $14,776 $15,246 $15,637 $16,110 $16,218 $16,230 $16,396 $16,221 $16,200
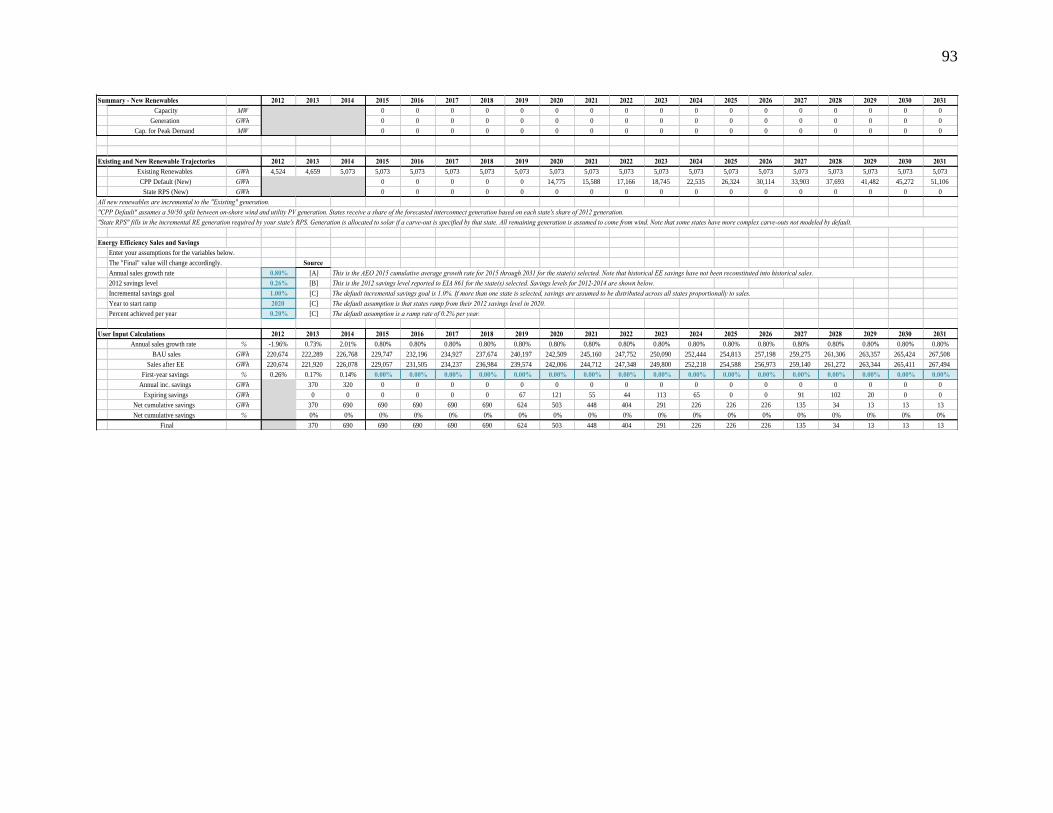
93
Summary - New Renewables 2012 2013 2014 2015 2016 2017 2018 2019 2020 2021 2022 2023 2024 2025 2026 2027 2028 2029 2030 2031
Capacity MW 0 0 0 0 0 0 0 0 0 0 0 0 0 0 0 0 0
Generation GWh 0 0 0 0 0 0 0 0 0 0 0 0 0 0 0 0 0
Cap. for Peak Demand MW 0 0 0 0 0 0 0 0 0 0 0 0 0 0 0 0 0
Existing and New Renewable Trajectories 2012 2013 2014 2015 2016 2017 2018 2019 2020 2021 2022 2023 2024 2025 2026 2027 2028 2029 2030 2031
Existing Renewables GWh 4,524 4,659 5,073 5,073 5,073 5,073 5,073 5,073 5,073 5,073 5,073 5,073 5,073 5,073 5,073 5,073 5,073 5,073 5,073 5,073
CPP Default (New) GWh 0 0 0 0 0 14,775 15,588 17,166 18,745 22,535 26,324 30,114 33,903 37,693 41,482 45,272 51,106
State RPS (New) GWh 0 0 0 0 0 0 0 0 0 0 0 0 0 0 0 0 0
All new renewables are incremental to the "Existing" generation.
"CPP Default" assumes a 50/50 split between on-shore wind and utility PV generation. States receive a share of the forecasted interconnect generation based on each state's share of 2012 generation.
"State RPS" fills in the incremental RE generation required by your state's RPS. Generation is allocated to solar if a carve-out is specified by that state. All remaining generation is assumed to come from wind. Note that some states have more complex carve-outs not modeled by default.
Energy Efficiency Sales and Savings
Enter your assumptions for the variables below.
The "Final" value will change accordingly. Source
Annual sales growth rate 0.80% [A] This is the AEO 2015 cumulative average growth rate for 2015 through 2031 for the state(s) selected. Note that historical EE savings have not been reconstituted into historical sales.
2012 savings level 0.26% [B] This is the 2012 savings level reported to EIA 861 for the state(s) selected. Savings levels for 2012-2014 are shown below.
Incremental savings goal 1.00% [C] The default incremental savings goal is 1.0%. If more than one state is selected, savings are assumed to be distributed across all states proportionally to sales.
Year to start ramp 2020 [C] The default assumption is that states ramp from their 2012 savings level in 2020.
Percent achieved per year 0.20% [C] The default assumption is a ramp rate of 0.2% per year.
User Input Calculations 2012 2013 2014 2015 2016 2017 2018 2019 2020 2021 2022 2023 2024 2025 2026 2027 2028 2029 2030 2031
Annual sales growth rate % -1.96% 0.73% 2.01% 0.80% 0.80% 0.80% 0.80% 0.80% 0.80% 0.80% 0.80% 0.80% 0.80% 0.80% 0.80% 0.80% 0.80% 0.80% 0.80% 0.80%
BAU sales GWh 220,674 222,289 226,768 229,747 232,196 234,927 237,674 240,197 242,509 245,160 247,752 250,090 252,444 254,813 257,198 259,275 261,306 263,357 265,424 267,508
Sales after EE GWh 220,674 221,920 226,078 229,057 231,505 234,237 236,984 239,574 242,006 244,712 247,348 249,800 252,218 254,588 256,973 259,140 261,272 263,344 265,411 267,494
First-year savings % 0.26% 0.17% 0.14% 0.00% 0.00% 0.00% 0.00% 0.00% 0.00% 0.00% 0.00% 0.00% 0.00% 0.00% 0.00% 0.00% 0.00% 0.00% 0.00% 0.00%
Annual inc. savings GWh 370 320 0 0 0 0 0 0 0 0 0 0 0 0 0 0 0 0 0
Expiring savings GWh 0 0 0 0 0 0 67 121 55 44 113 65 0 0 91 102 20 0 0
Net cumulative savings GWh 370 690 690 690 690 690 624 503 448 404 291 226 226 226 135 34 13 13 13
Net cumulative savings % 0% 0% 0% 0% 0% 0% 0% 0% 0% 0% 0% 0% 0% 0% 0% 0% 0% 0% 0%
Final 370 690 690 690 690 690 624 503 448 404 291 226 226 226 135 34 13 13 13

94
Appendix C: Scenario - CCR
Existing NGCC 2012 2015 2020 2025 2030 Fossil Steam 2012 2015 2020 2025 2030
Capacity GW 29 30 30 30 30 Capacity GW 21 19 17 17 17
Energy TWh 140 136 139 139 139 Energy TWh 56 56 50 50 50
Capacity Factor % 54% 52% 52% 52% 52% Capacity Factor % 31% 33% 34% 34% 34%
Costs 2012 $/MWh $35 $48 $50 $57 $56 Costs 2012 $/MWh $46 $43 $47 $72 $73
CO2 emissions million tons 61 59 60 60 60 CO2 emissions million tons 61 60 54 51 51
Sources: Sources:
Renewables 2012 2015 2020 2025 2030 Energy Efficiency 2012 2015 2020 2025 2030
Capacity GW 1 1 1 1 1 Annual Savings % 0.3% 0.3% 0.3% 1.0% 1.0%
Solar GW 0 0 0 0 0 Savings TWh - 1 4 11 18
Wind GW 0 0 0 0 0 Costs 2012 $/MWh - $66 $66 $40 $40
Other GW 1 1 1 1 1 Sources:
Energy TWh 5 5 5 5 5
Solar TWh 0 0 0 0 0
Wind TWh 0 0 0 0 0
Other TWh 4 4 4 4 4 Nuclear 2012 2015 2020 2025 2030
Capacity Factor % 44% 44% 44% 44% 44% Capacity GW 7 6 6 6 6
Solar % 19% 19% 19% 19% 19% Energy TWh 19 21 21 21 21
Wind % 0% 0% 0% 0% 0% Capacity Factor % 29% 37% 38% 37% 37%
Other % 47% 47% 47% 47% 47% Costs 2012 $/MWh $46 $39 $39 $39 $40
Costs 2012 $/MWh $97 $96 $96 $96 $0 Sources:
Solar 2012 $/MWh $62 $62 $62 $62 $62
Wind 2012 $/MWh - - - - -
Other 2012 $/MWh $98 $98 $98 $98 $98
Sources: Imports / Exports 2012 2015 2020 2025 2030
Imports TWh 11 21 36 42 47
Exports TWh 0 0 0 0 0
New NGCC 2012 2015 2020 2025 2030 Other 2012 2015 2020 2025 2030
Capacity GW - 0 0 0 0 Capacity GW 14 15 15 15 15
Energy TWh - 0 0 0 0 Energy TWh 9 6 6 6 6
Capacity Factor % - 0% 0% 0% 0% Capacity Factor % 7% 5% 5% 5% 5%
Costs 2012 $/MWh - - - - - Costs 2012 $/MWh $64 $98 $102 $112 $113
CO2 emissions million tons - 0 0 0 0 CO2 emissions million tons 4 3 3 3 3
Sources: EIA. Annual Energy Outlook 2015 Sources:
Assumed Displacement 2012 2015 2020 2025 2030 Credit Purchases 2012 2015 2020 2025 2030
Coal % - 33% 33% 33% 33% ERCs TWh - - - 0 0
Existing NGCC % - 33% 33% 33% 33% Allowances million tons - - - 0 0
New NGCC % - 0% 0% 0% 0% ERCs 2012 $/MWh - - - $1 $1
Imports % - 34% 34% 34% 34% Allowances 2012 $/ton - - - $1 $1
Sources: Synapse assumption
Clean Power Plan Planning Tool (“CP3T”). Synapse Energy Economics, Inc. Version 2.0. Available at www.synapse-energy.com. Synapse is not responsible and does not assume liability for any errors in CP3T’s input
data or functions, or for any of the resulting output generated by its users.
EPA. Clean Power Plan TSD Goal Computation Appendix 1-5;
EIA. Annual Energy Outlook 2015
EPA. Clean Power Plan TSD Goal Computation Appendix 1-5;
EIA. Annual Energy Outlook 2015
EPA. Clean Power Plan TSD Data File: Demand-Side Energy Efficiency
Appendix - Illustrative 3% Scenario; EIA. Form 8610 2012; EIA. Annual Energy
Outlook 2015
EPA. Clean Power Plan TSD Goal Computation Appendix 1-5; EPA. Clean
Power Plan TSD New Source Complements Appendix; EIA. Annual Energy
Outlook 2015
EPA. Clean Power Plan TSD Goal Computation Appendix 1-5; AVERT v.1.2;
LBNL. 2013 Wind Technologies Market Report; LBNL. Utility-Scale Solar 2013;
EIA. Annual Energy Outlook 2015
EPA. Clean Power Plan TSD Goal Computation Appendix 1-5;
EIA. Annual Energy Outlook 2015
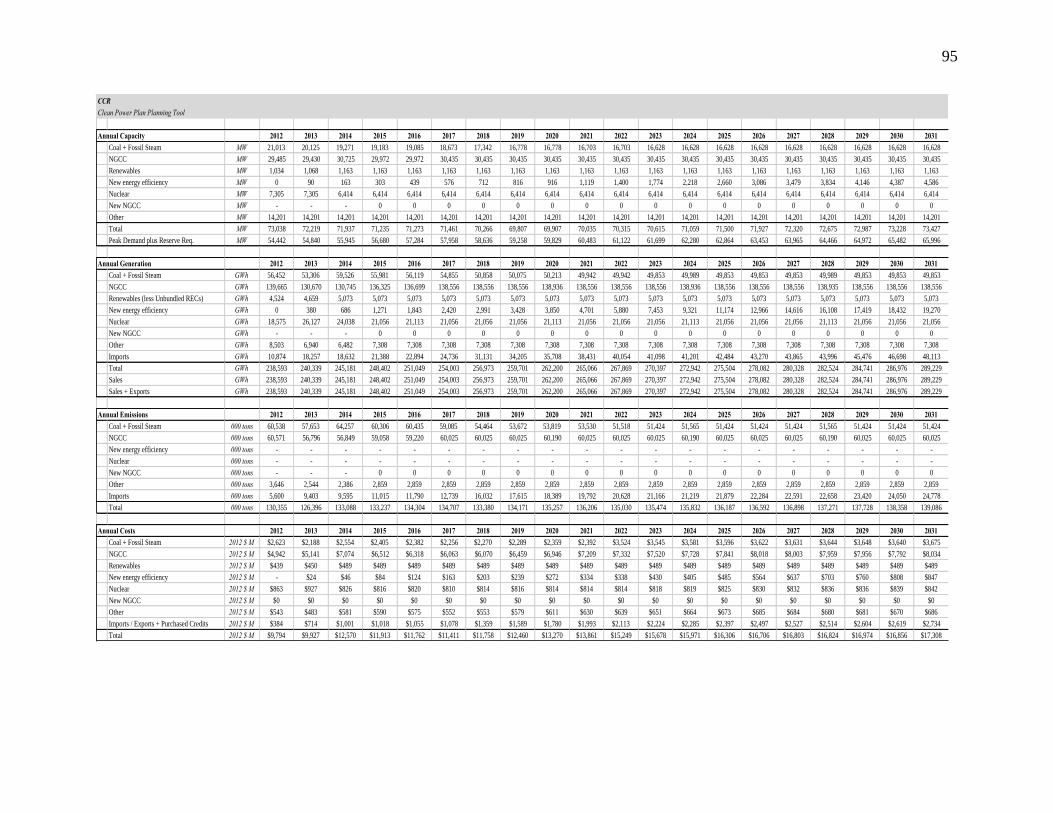
95
CCR
Clean Power Plan Planning Tool
Annual Capacity 2012 2013 2014 2015 2016 2017 2018 2019 2020 2021 2022 2023 2024 2025 2026 2027 2028 2029 2030 2031
Coal + Fossil Steam MW 21,013 20,125 19,271 19,183 19,085 18,673 17,342 16,778 16,778 16,703 16,703 16,628 16,628 16,628 16,628 16,628 16,628 16,628 16,628 16,628
NGCC MW 29,485 29,430 30,725 29,972 29,972 30,435 30,435 30,435 30,435 30,435 30,435 30,435 30,435 30,435 30,435 30,435 30,435 30,435 30,435 30,435
Renewables MW 1,034 1,068 1,163 1,163 1,163 1,163 1,163 1,163 1,163 1,163 1,163 1,163 1,163 1,163 1,163 1,163 1,163 1,163 1,163 1,163
New energy efficiency MW 0 90 163 303 439 576 712 816 916 1,119 1,400 1,774 2,218 2,660 3,086 3,479 3,834 4,146 4,387 4,586
Nuclear MW 7,305 7,305 6,414 6,414 6,414 6,414 6,414 6,414 6,414 6,414 6,414 6,414 6,414 6,414 6,414 6,414 6,414 6,414 6,414 6,414
New NGCC MW - - - 0 0 0 0 0 0 0 0 0 0 0 0 0 0 0 0 0
Other MW 14,201 14,201 14,201 14,201 14,201 14,201 14,201 14,201 14,201 14,201 14,201 14,201 14,201 14,201 14,201 14,201 14,201 14,201 14,201 14,201
Total MW 73,038 72,219 71,937 71,235 71,273 71,461 70,266 69,807 69,907 70,035 70,315 70,615 71,059 71,500 71,927 72,320 72,675 72,987 73,228 73,427
Peak Demand plus Reserve Req. MW 54,442 54,840 55,945 56,680 57,284 57,958 58,636 59,258 59,829 60,483 61,122 61,699 62,280 62,864 63,453 63,965 64,466 64,972 65,482 65,996
Annual Generation 2012 2013 2014 2015 2016 2017 2018 2019 2020 2021 2022 2023 2024 2025 2026 2027 2028 2029 2030 2031
Coal + Fossil Steam GWh 56,452 53,306 59,526 55,981 56,119 54,855 50,858 50,075 50,213 49,942 49,942 49,853 49,989 49,853 49,853 49,853 49,989 49,853 49,853 49,853
NGCC GWh 139,665 130,670 130,745 136,325 136,699 138,556 138,556 138,556 138,936 138,556 138,556 138,556 138,936 138,556 138,556 138,556 138,935 138,556 138,556 138,556
Renewables (less Unbundled RECs) GWh 4,524 4,659 5,073 5,073 5,073 5,073 5,073 5,073 5,073 5,073 5,073 5,073 5,073 5,073 5,073 5,073 5,073 5,073 5,073 5,073
New energy efficiency GWh 0 380 686 1,271 1,843 2,420 2,991 3,428 3,850 4,701 5,880 7,453 9,321 11,174 12,966 14,616 16,108 17,419 18,432 19,270
Nuclear GWh 18,575 26,127 24,038 21,056 21,113 21,056 21,056 21,056 21,113 21,056 21,056 21,056 21,113 21,056 21,056 21,056 21,113 21,056 21,056 21,056
New NGCC GWh - - - 0 0 0 0 0 0 0 0 0 0 0 0 0 0 0 0 0
Other GWh 8,503 6,940 6,482 7,308 7,308 7,308 7,308 7,308 7,308 7,308 7,308 7,308 7,308 7,308 7,308 7,308 7,308 7,308 7,308 7,308
Imports GWh 10,874 18,257 18,632 21,388 22,894 24,736 31,131 34,205 35,708 38,431 40,054 41,098 41,201 42,484 43,270 43,865 43,996 45,476 46,698 48,113
Total GWh 238,593 240,339 245,181 248,402 251,049 254,003 256,973 259,701 262,200 265,066 267,869 270,397 272,942 275,504 278,082 280,328 282,524 284,741 286,976 289,229
Sales GWh 238,593 240,339 245,181 248,402 251,049 254,003 256,973 259,701 262,200 265,066 267,869 270,397 272,942 275,504 278,082 280,328 282,524 284,741 286,976 289,229
Sales + Exports GWh 238,593 240,339 245,181 248,402 251,049 254,003 256,973 259,701 262,200 265,066 267,869 270,397 272,942 275,504 278,082 280,328 282,524 284,741 286,976 289,229
Annual Emissions 2012 2013 2014 2015 2016 2017 2018 2019 2020 2021 2022 2023 2024 2025 2026 2027 2028 2029 2030 2031
Coal + Fossil Steam 000 tons 60,538 57,653 64,257 60,306 60,435 59,085 54,464 53,672 53,819 53,530 51,518 51,424 51,565 51,424 51,424 51,424 51,565 51,424 51,424 51,424
NGCC 000 tons 60,571 56,796 56,849 59,058 59,220 60,025 60,025 60,025 60,190 60,025 60,025 60,025 60,190 60,025 60,025 60,025 60,190 60,025 60,025 60,025
New energy efficiency 000 tons - - - - - - - - - - - - - - - - - - - -
Nuclear 000 tons - - - - - - - - - - - - - - - - - - - -
New NGCC 000 tons - - - 0 0 0 0 0 0 0 0 0 0 0 0 0 0 0 0 0
Other 000 tons 3,646 2,544 2,386 2,859 2,859 2,859 2,859 2,859 2,859 2,859 2,859 2,859 2,859 2,859 2,859 2,859 2,859 2,859 2,859 2,859
Imports 000 tons 5,600 9,403 9,595 11,015 11,790 12,739 16,032 17,615 18,389 19,792 20,628 21,166 21,219 21,879 22,284 22,591 22,658 23,420 24,050 24,778
Total 000 tons 130,355 126,396 133,088 133,237 134,304 134,707 133,380 134,171 135,257 136,206 135,030 135,474 135,832 136,187 136,592 136,898 137,271 137,728 138,358 139,086
Annual Costs 2012 2013 2014 2015 2016 2017 2018 2019 2020 2021 2022 2023 2024 2025 2026 2027 2028 2029 2030 2031
Coal + Fossil Steam 2012 $ M $2,623 $2,188 $2,554 $2,405 $2,382 $2,256 $2,270 $2,289 $2,359 $2,392 $3,524 $3,545 $3,581 $3,596 $3,622 $3,631 $3,644 $3,648 $3,640 $3,675
NGCC 2012 $ M $4,942 $5,141 $7,074 $6,512 $6,318 $6,063 $6,070 $6,459 $6,946 $7,209 $7,332 $7,520 $7,728 $7,841 $8,018 $8,003 $7,959 $7,956 $7,792 $8,034
Renewables 2012 $ M $439 $450 $489 $489 $489 $489 $489 $489 $489 $489 $489 $489 $489 $489 $489 $489 $489 $489 $489 $489
New energy efficiency 2012 $ M - $24 $46 $84 $124 $163 $203 $239 $272 $334 $338 $430 $405 $485 $564 $637 $703 $760 $808 $847
Nuclear 2012 $ M $863 $927 $826 $816 $820 $810 $814 $816 $814 $814 $814 $818 $819 $825 $830 $832 $836 $836 $839 $842
New NGCC 2012 $ M $0 $0 $0 $0 $0 $0 $0 $0 $0 $0 $0 $0 $0 $0 $0 $0 $0 $0 $0 $0
Other 2012 $ M $543 $483 $581 $590 $575 $552 $553 $579 $611 $630 $639 $651 $664 $673 $685 $684 $680 $681 $670 $686
Imports / Exports + Purchased Credits 2012 $ M $384 $714 $1,001 $1,018 $1,055 $1,078 $1,359 $1,589 $1,780 $1,993 $2,113 $2,224 $2,285 $2,397 $2,497 $2,527 $2,514 $2,604 $2,619 $2,734
Total 2012 $ M $9,794 $9,927 $12,570 $11,913 $11,762 $11,411 $11,758 $12,460 $13,270 $13,861 $15,249 $15,678 $15,971 $16,306 $16,706 $16,803 $16,824 $16,974 $16,856 $17,308
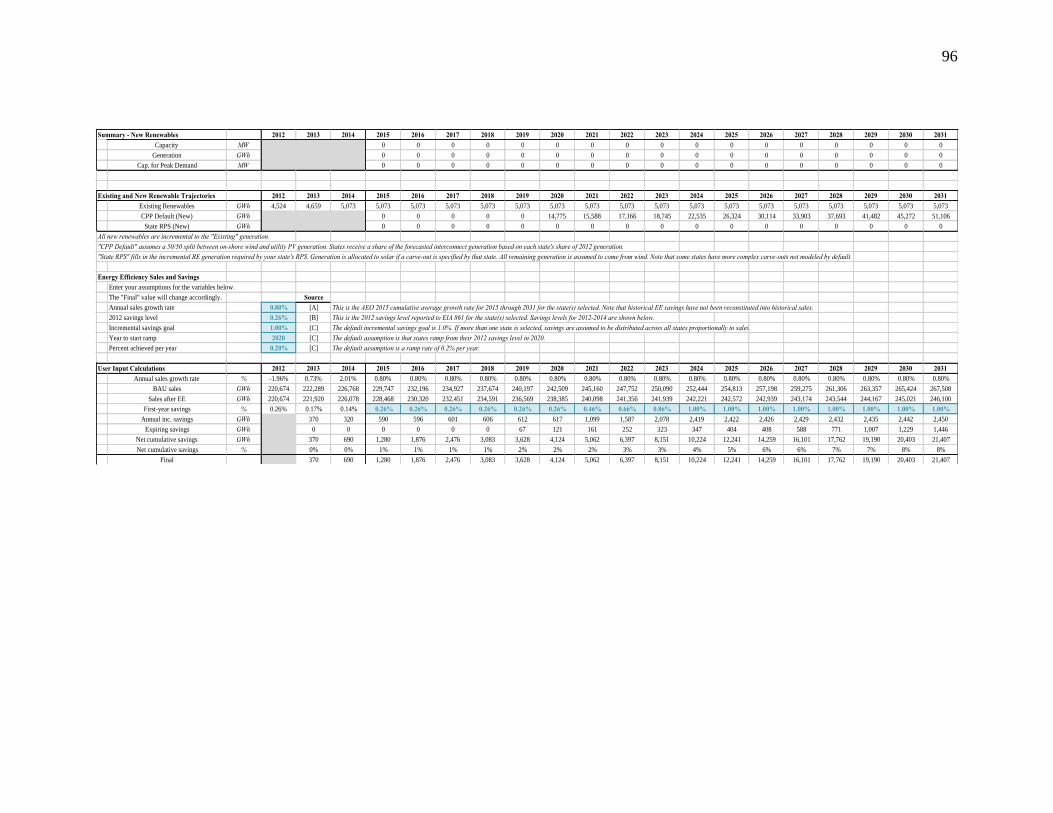
96
Summary - New Renewables 2012 2013 2014 2015 2016 2017 2018 2019 2020 2021 2022 2023 2024 2025 2026 2027 2028 2029 2030 2031
Capacity MW 0 0 0 0 0 0 0 0 0 0 0 0 0 0 0 0 0
Generation GWh 0 0 0 0 0 0 0 0 0 0 0 0 0 0 0 0 0
Cap. for Peak Demand MW 0 0 0 0 0 0 0 0 0 0 0 0 0 0 0 0 0
Existing and New Renewable Trajectories 2012 2013 2014 2015 2016 2017 2018 2019 2020 2021 2022 2023 2024 2025 2026 2027 2028 2029 2030 2031
Existing Renewables GWh 4,524 4,659 5,073 5,073 5,073 5,073 5,073 5,073 5,073 5,073 5,073 5,073 5,073 5,073 5,073 5,073 5,073 5,073 5,073 5,073
CPP Default (New) GWh 0 0 0 0 0 14,775 15,588 17,166 18,745 22,535 26,324 30,114 33,903 37,693 41,482 45,272 51,106
State RPS (New) GWh 0 0 0 0 0 0 0 0 0 0 0 0 0 0 0 0 0
All new renewables are incremental to the "Existing" generation.
"CPP Default" assumes a 50/50 split between on-shore wind and utility PV generation. States receive a share of the forecasted interconnect generation based on each state's share of 2012 generation.
"State RPS" fills in the incremental RE generation required by your state's RPS. Generation is allocated to solar if a carve-out is specified by that state. All remaining generation is assumed to come from wind. Note that some states have more complex carve-outs not modeled by default.
Energy Efficiency Sales and Savings
Enter your assumptions for the variables below.
The "Final" value will change accordingly. Source
Annual sales growth rate 0.80% [A] This is the AEO 2015 cumulative average growth rate for 2015 through 2031 for the state(s) selected. Note that historical EE savings have not been reconstituted into historical sales.
2012 savings level 0.26% [B] This is the 2012 savings level reported to EIA 861 for the state(s) selected. Savings levels for 2012-2014 are shown below.
Incremental savings goal 1.00% [C] The default incremental savings goal is 1.0%. If more than one state is selected, savings are assumed to be distributed across all states proportionally to sales.
Year to start ramp 2020 [C] The default assumption is that states ramp from their 2012 savings level in 2020.
Percent achieved per year 0.20% [C] The default assumption is a ramp rate of 0.2% per year.
User Input Calculations 2012 2013 2014 2015 2016 2017 2018 2019 2020 2021 2022 2023 2024 2025 2026 2027 2028 2029 2030 2031
Annual sales growth rate % -1.96% 0.73% 2.01% 0.80% 0.80% 0.80% 0.80% 0.80% 0.80% 0.80% 0.80% 0.80% 0.80% 0.80% 0.80% 0.80% 0.80% 0.80% 0.80% 0.80%
BAU sales GWh 220,674 222,289 226,768 229,747 232,196 234,927 237,674 240,197 242,509 245,160 247,752 250,090 252,444 254,813 257,198 259,275 261,306 263,357 265,424 267,508
Sales after EE GWh 220,674 221,920 226,078 228,468 230,320 232,451 234,591 236,569 238,385 240,098 241,356 241,939 242,221 242,572 242,939 243,174 243,544 244,167 245,021 246,100
First-year savings % 0.26% 0.17% 0.14% 0.26% 0.26% 0.26% 0.26% 0.26% 0.26% 0.46% 0.66% 0.86% 1.00% 1.00% 1.00% 1.00% 1.00% 1.00% 1.00% 1.00%
Annual inc. savings GWh 370 320 590 596 601 606 612 617 1,099 1,587 2,078 2,419 2,422 2,426 2,429 2,432 2,435 2,442 2,450
Expiring savings GWh 0 0 0 0 0 0 67 121 161 252 323 347 404 408 588 771 1,007 1,229 1,446
Net cumulative savings GWh 370 690 1,280 1,876 2,476 3,083 3,628 4,124 5,062 6,397 8,151 10,224 12,241 14,259 16,101 17,762 19,190 20,403 21,407
Net cumulative savings % 0% 0% 1% 1% 1% 1% 2% 2% 2% 3% 3% 4% 5% 6% 6% 7% 7% 8% 8%
Final 370 690 1,280 1,876 2,476 3,083 3,628 4,124 5,062 6,397 8,151 10,224 12,241 14,259 16,101 17,762 19,190 20,403 21,407
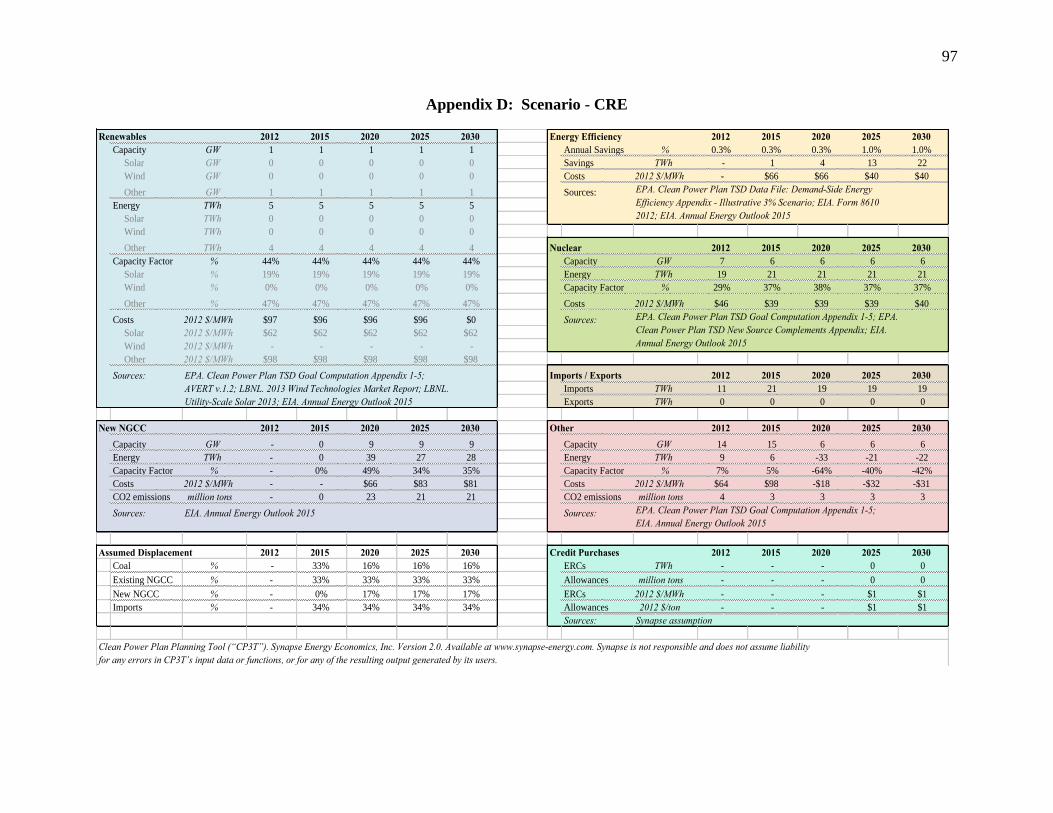
97
Appendix D: Scenario - CRE
Renewables 2012 2015 2020 2025 2030 Energy Efficiency 2012 2015 2020 2025 2030
Capacity GW 1 1 1 1 1 Annual Savings % 0.3% 0.3% 0.3% 1.0% 1.0%
Solar GW 0 0 0 0 0 Savings TWh - 1 4 13 22
Wind GW 0 0 0 0 0 Costs 2012 $/MWh - $66 $66 $40 $40
Other GW 1 1 1 1 1 Sources:
Energy TWh 5 5 5 5 5
Solar TWh 0 0 0 0 0
Wind TWh 0 0 0 0 0
Other TWh 4 4 4 4 4 Nuclear 2012 2015 2020 2025 2030
Capacity Factor % 44% 44% 44% 44% 44% Capacity GW 7 6 6 6 6
Solar % 19% 19% 19% 19% 19% Energy TWh 19 21 21 21 21
Wind % 0% 0% 0% 0% 0% Capacity Factor % 29% 37% 38% 37% 37%
Other % 47% 47% 47% 47% 47% Costs 2012 $/MWh $46 $39 $39 $39 $40
Costs 2012 $/MWh $97 $96 $96 $96 $0 Sources:
Solar 2012 $/MWh $62 $62 $62 $62 $62
Wind 2012 $/MWh - - - - -
Other 2012 $/MWh $98 $98 $98 $98 $98
Sources: Imports / Exports 2012 2015 2020 2025 2030
Imports TWh 11 21 19 19 19
Exports TWh 0 0 0 0 0
New NGCC 2012 2015 2020 2025 2030 Other 2012 2015 2020 2025 2030
Capacity GW - 0 9 9 9 Capacity GW 14 15 6 6 6
Energy TWh - 0 39 27 28 Energy TWh 9 6 -33 -21 -22
Capacity Factor % - 0% 49% 34% 35% Capacity Factor % 7% 5% -64% -40% -42%
Costs 2012 $/MWh - - $66 $83 $81 Costs 2012 $/MWh $64 $98 -$18 -$32 -$31
CO2 emissions million tons - 0 23 21 21 CO2 emissions million tons 4 3 3 3 3
Sources: EIA. Annual Energy Outlook 2015 Sources:
Assumed Displacement 2012 2015 2020 2025 2030 Credit Purchases 2012 2015 2020 2025 2030
Coal % - 33% 16% 16% 16% ERCs TWh - - - 0 0
Existing NGCC % - 33% 33% 33% 33% Allowances million tons - - - 0 0
New NGCC % - 0% 17% 17% 17% ERCs 2012 $/MWh - - - $1 $1
Imports % - 34% 34% 34% 34% Allowances 2012 $/ton - - - $1 $1
Sources: Synapse assumption
Clean Power Plan Planning Tool (“CP3T”). Synapse Energy Economics, Inc. Version 2.0. Available at www.synapse-energy.com. Synapse is not responsible and does not assume liability
for any errors in CP3T’s input data or functions, or for any of the resulting output generated by its users.
EPA. Clean Power Plan TSD Data File: Demand-Side Energy
Efficiency Appendix - Illustrative 3% Scenario; EIA. Form 8610
2012; EIA. Annual Energy Outlook 2015
EPA. Clean Power Plan TSD Goal Computation Appendix 1-5; EPA.
Clean Power Plan TSD New Source Complements Appendix; EIA.
Annual Energy Outlook 2015
EPA. Clean Power Plan TSD Goal Computation Appendix 1-5;
AVERT v.1.2; LBNL. 2013 Wind Technologies Market Report; LBNL.
Utility-Scale Solar 2013; EIA. Annual Energy Outlook 2015
EPA. Clean Power Plan TSD Goal Computation Appendix 1-5;
EIA. Annual Energy Outlook 2015
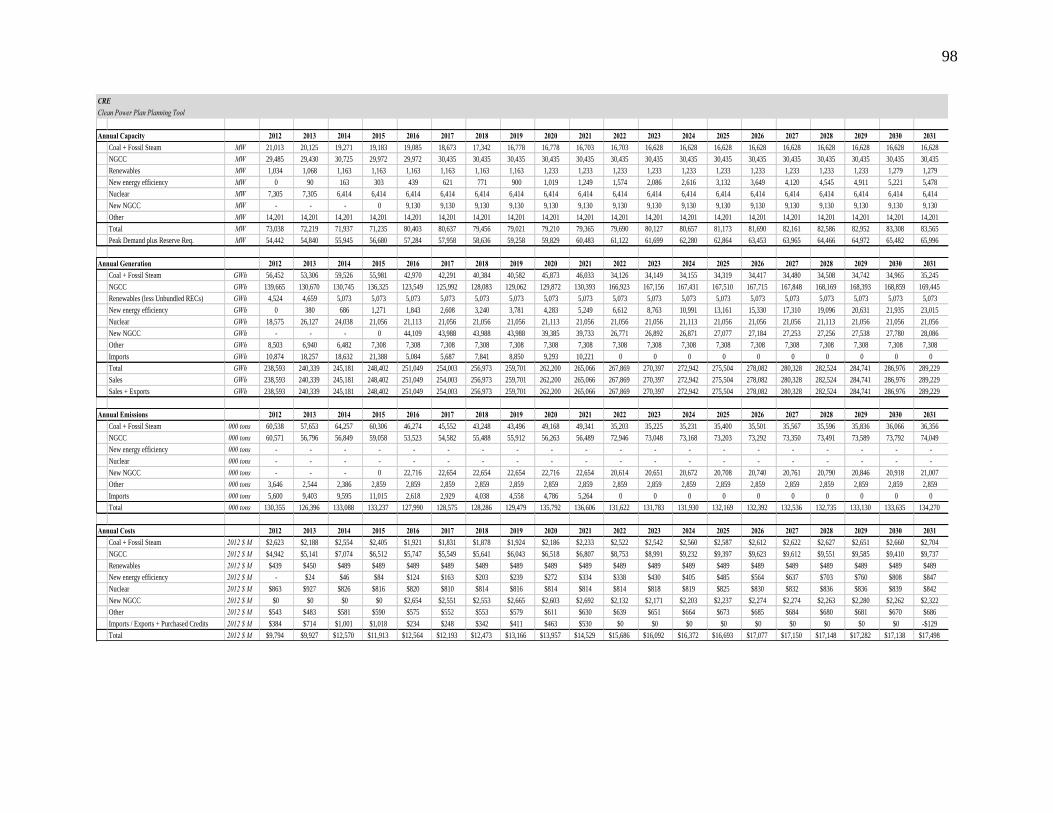
98
CRE
Clean Power Plan Planning Tool
Annual Capacity 2012 2013 2014 2015 2016 2017 2018 2019 2020 2021 2022 2023 2024 2025 2026 2027 2028 2029 2030 2031
Coal + Fossil Steam MW 21,013 20,125 19,271 19,183 19,085 18,673 17,342 16,778 16,778 16,703 16,703 16,628 16,628 16,628 16,628 16,628 16,628 16,628 16,628 16,628
NGCC MW 29,485 29,430 30,725 29,972 29,972 30,435 30,435 30,435 30,435 30,435 30,435 30,435 30,435 30,435 30,435 30,435 30,435 30,435 30,435 30,435
Renewables MW 1,034 1,068 1,163 1,163 1,163 1,163 1,163 1,163 1,233 1,233 1,233 1,233 1,233 1,233 1,233 1,233 1,233 1,233 1,279 1,279
New energy efficiency MW 0 90 163 303 439 621 771 900 1,019 1,249 1,574 2,086 2,616 3,132 3,649 4,120 4,545 4,911 5,221 5,478
Nuclear MW 7,305 7,305 6,414 6,414 6,414 6,414 6,414 6,414 6,414 6,414 6,414 6,414 6,414 6,414 6,414 6,414 6,414 6,414 6,414 6,414
New NGCC MW - - - 0 9,130 9,130 9,130 9,130 9,130 9,130 9,130 9,130 9,130 9,130 9,130 9,130 9,130 9,130 9,130 9,130
Other MW 14,201 14,201 14,201 14,201 14,201 14,201 14,201 14,201 14,201 14,201 14,201 14,201 14,201 14,201 14,201 14,201 14,201 14,201 14,201 14,201
Total MW 73,038 72,219 71,937 71,235 80,403 80,637 79,456 79,021 79,210 79,365 79,690 80,127 80,657 81,173 81,690 82,161 82,586 82,952 83,308 83,565
Peak Demand plus Reserve Req. MW 54,442 54,840 55,945 56,680 57,284 57,958 58,636 59,258 59,829 60,483 61,122 61,699 62,280 62,864 63,453 63,965 64,466 64,972 65,482 65,996
Annual Generation 2012 2013 2014 2015 2016 2017 2018 2019 2020 2021 2022 2023 2024 2025 2026 2027 2028 2029 2030 2031
Coal + Fossil Steam GWh 56,452 53,306 59,526 55,981 42,970 42,291 40,384 40,582 45,873 46,033 34,126 34,149 34,155 34,319 34,417 34,480 34,508 34,742 34,965 35,245
NGCC GWh 139,665 130,670 130,745 136,325 123,549 125,992 128,083 129,062 129,872 130,393 166,923 167,156 167,431 167,510 167,715 167,848 168,169 168,393 168,859 169,445
Renewables (less Unbundled RECs) GWh 4,524 4,659 5,073 5,073 5,073 5,073 5,073 5,073 5,073 5,073 5,073 5,073 5,073 5,073 5,073 5,073 5,073 5,073 5,073 5,073
New energy efficiency GWh 0 380 686 1,271 1,843 2,608 3,240 3,781 4,283 5,249 6,612 8,763 10,991 13,161 15,330 17,310 19,096 20,631 21,935 23,015
Nuclear GWh 18,575 26,127 24,038 21,056 21,113 21,056 21,056 21,056 21,113 21,056 21,056 21,056 21,113 21,056 21,056 21,056 21,113 21,056 21,056 21,056
New NGCC GWh - - - 0 44,109 43,988 43,988 43,988 39,385 39,733 26,771 26,892 26,871 27,077 27,184 27,253 27,256 27,538 27,780 28,086
Other GWh 8,503 6,940 6,482 7,308 7,308 7,308 7,308 7,308 7,308 7,308 7,308 7,308 7,308 7,308 7,308 7,308 7,308 7,308 7,308 7,308
Imports GWh 10,874 18,257 18,632 21,388 5,084 5,687 7,841 8,850 9,293 10,221 0 0 0 0 0 0 0 0 0 0
Total GWh 238,593 240,339 245,181 248,402 251,049 254,003 256,973 259,701 262,200 265,066 267,869 270,397 272,942 275,504 278,082 280,328 282,524 284,741 286,976 289,229
Sales GWh 238,593 240,339 245,181 248,402 251,049 254,003 256,973 259,701 262,200 265,066 267,869 270,397 272,942 275,504 278,082 280,328 282,524 284,741 286,976 289,229
Sales + Exports GWh 238,593 240,339 245,181 248,402 251,049 254,003 256,973 259,701 262,200 265,066 267,869 270,397 272,942 275,504 278,082 280,328 282,524 284,741 286,976 289,229
Annual Emissions 2012 2013 2014 2015 2016 2017 2018 2019 2020 2021 2022 2023 2024 2025 2026 2027 2028 2029 2030 2031
Coal + Fossil Steam 000 tons 60,538 57,653 64,257 60,306 46,274 45,552 43,248 43,496 49,168 49,341 35,203 35,225 35,231 35,400 35,501 35,567 35,596 35,836 36,066 36,356
NGCC 000 tons 60,571 56,796 56,849 59,058 53,523 54,582 55,488 55,912 56,263 56,489 72,946 73,048 73,168 73,203 73,292 73,350 73,491 73,589 73,792 74,049
New energy efficiency 000 tons - - - - - - - - - - - - - - - - - - - -
Nuclear 000 tons - - - - - - - - - - - - - - - - - - - -
New NGCC 000 tons - - - 0 22,716 22,654 22,654 22,654 22,716 22,654 20,614 20,651 20,672 20,708 20,740 20,761 20,790 20,846 20,918 21,007
Other 000 tons 3,646 2,544 2,386 2,859 2,859 2,859 2,859 2,859 2,859 2,859 2,859 2,859 2,859 2,859 2,859 2,859 2,859 2,859 2,859 2,859
Imports 000 tons 5,600 9,403 9,595 11,015 2,618 2,929 4,038 4,558 4,786 5,264 0 0 0 0 0 0 0 0 0 0
Total 000 tons 130,355 126,396 133,088 133,237 127,990 128,575 128,286 129,479 135,792 136,606 131,622 131,783 131,930 132,169 132,392 132,536 132,735 133,130 133,635 134,270
Annual Costs 2012 2013 2014 2015 2016 2017 2018 2019 2020 2021 2022 2023 2024 2025 2026 2027 2028 2029 2030 2031
Coal + Fossil Steam 2012 $ M $2,623 $2,188 $2,554 $2,405 $1,921 $1,831 $1,878 $1,924 $2,186 $2,233 $2,522 $2,542 $2,560 $2,587 $2,612 $2,622 $2,627 $2,651 $2,660 $2,704
NGCC 2012 $ M $4,942 $5,141 $7,074 $6,512 $5,747 $5,549 $5,641 $6,043 $6,518 $6,807 $8,753 $8,991 $9,232 $9,397 $9,623 $9,612 $9,551 $9,585 $9,410 $9,737
Renewables 2012 $ M $439 $450 $489 $489 $489 $489 $489 $489 $489 $489 $489 $489 $489 $489 $489 $489 $489 $489 $489 $489
New energy efficiency 2012 $ M - $24 $46 $84 $124 $163 $203 $239 $272 $334 $338 $430 $405 $485 $564 $637 $703 $760 $808 $847
Nuclear 2012 $ M $863 $927 $826 $816 $820 $810 $814 $816 $814 $814 $814 $818 $819 $825 $830 $832 $836 $836 $839 $842
New NGCC 2012 $ M $0 $0 $0 $0 $2,654 $2,551 $2,553 $2,665 $2,603 $2,692 $2,132 $2,171 $2,203 $2,237 $2,274 $2,274 $2,263 $2,280 $2,262 $2,322
Other 2012 $ M $543 $483 $581 $590 $575 $552 $553 $579 $611 $630 $639 $651 $664 $673 $685 $684 $680 $681 $670 $686
Imports / Exports + Purchased Credits 2012 $ M $384 $714 $1,001 $1,018 $234 $248 $342 $411 $463 $530 $0 $0 $0 $0 $0 $0 $0 $0 $0 -$129
Total 2012 $ M $9,794 $9,927 $12,570 $11,913 $12,564 $12,193 $12,473 $13,166 $13,957 $14,529 $15,686 $16,092 $16,372 $16,693 $17,077 $17,150 $17,148 $17,282 $17,138 $17,498
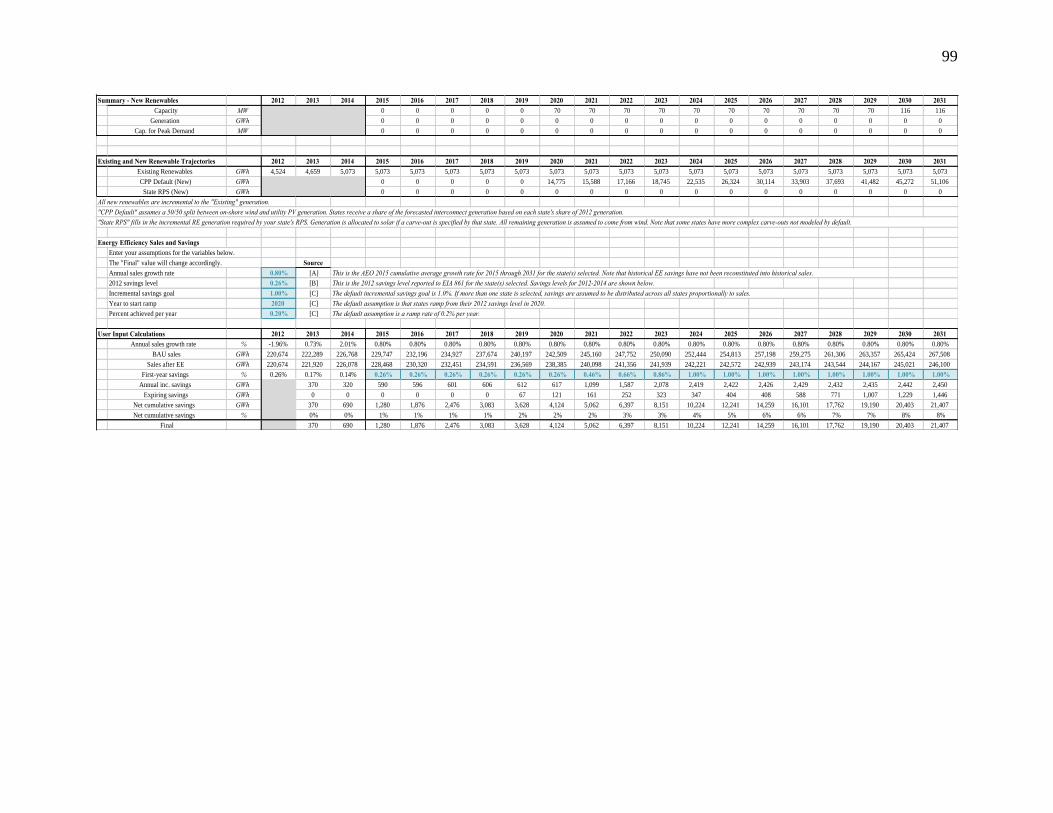
99
Summary - New Renewables 2012 2013 2014 2015 2016 2017 2018 2019 2020 2021 2022 2023 2024 2025 2026 2027 2028 2029 2030 2031
Capacity MW 0 0 0 0 0 70 70 70 70 70 70 70 70 70 70 116 116
Generation GWh 0 0 0 0 0 0 0 0 0 0 0 0 0 0 0 0 0
Cap. for Peak Demand MW 0 0 0 0 0 0 0 0 0 0 0 0 0 0 0 0 0
Existing and New Renewable Trajectories 2012 2013 2014 2015 2016 2017 2018 2019 2020 2021 2022 2023 2024 2025 2026 2027 2028 2029 2030 2031
Existing Renewables GWh 4,524 4,659 5,073 5,073 5,073 5,073 5,073 5,073 5,073 5,073 5,073 5,073 5,073 5,073 5,073 5,073 5,073 5,073 5,073 5,073
CPP Default (New) GWh 0 0 0 0 0 14,775 15,588 17,166 18,745 22,535 26,324 30,114 33,903 37,693 41,482 45,272 51,106
State RPS (New) GWh 0 0 0 0 0 0 0 0 0 0 0 0 0 0 0 0 0
All new renewables are incremental to the "Existing" generation.
"CPP Default" assumes a 50/50 split between on-shore wind and utility PV generation. States receive a share of the forecasted interconnect generation based on each state's share of 2012 generation.
"State RPS" fills in the incremental RE generation required by your state's RPS. Generation is allocated to solar if a carve-out is specified by that state. All remaining generation is assumed to come from wind. Note that some states have more complex carve-outs not modeled by default.
Energy Efficiency Sales and Savings
Enter your assumptions for the variables below.
The "Final" value will change accordingly. Source
Annual sales growth rate 0.80% [A] This is the AEO 2015 cumulative average growth rate for 2015 through 2031 for the state(s) selected. Note that historical EE savings have not been reconstituted into historical sales.
2012 savings level 0.26% [B] This is the 2012 savings level reported to EIA 861 for the state(s) selected. Savings levels for 2012-2014 are shown below.
Incremental savings goal 1.00% [C] The default incremental savings goal is 1.0%. If more than one state is selected, savings are assumed to be distributed across all states proportionally to sales.
Year to start ramp 2020 [C] The default assumption is that states ramp from their 2012 savings level in 2020.
Percent achieved per year 0.20% [C] The default assumption is a ramp rate of 0.2% per year.
User Input Calculations 2012 2013 2014 2015 2016 2017 2018 2019 2020 2021 2022 2023 2024 2025 2026 2027 2028 2029 2030 2031
Annual sales growth rate % -1.96% 0.73% 2.01% 0.80% 0.80% 0.80% 0.80% 0.80% 0.80% 0.80% 0.80% 0.80% 0.80% 0.80% 0.80% 0.80% 0.80% 0.80% 0.80% 0.80%
BAU sales GWh 220,674 222,289 226,768 229,747 232,196 234,927 237,674 240,197 242,509 245,160 247,752 250,090 252,444 254,813 257,198 259,275 261,306 263,357 265,424 267,508
Sales after EE GWh 220,674 221,920 226,078 228,468 230,320 232,451 234,591 236,569 238,385 240,098 241,356 241,939 242,221 242,572 242,939 243,174 243,544 244,167 245,021 246,100
First-year savings % 0.26% 0.17% 0.14% 0.26% 0.26% 0.26% 0.26% 0.26% 0.26% 0.46% 0.66% 0.86% 1.00% 1.00% 1.00% 1.00% 1.00% 1.00% 1.00% 1.00%
Annual inc. savings GWh 370 320 590 596 601 606 612 617 1,099 1,587 2,078 2,419 2,422 2,426 2,429 2,432 2,435 2,442 2,450
Expiring savings GWh 0 0 0 0 0 0 67 121 161 252 323 347 404 408 588 771 1,007 1,229 1,446
Net cumulative savings GWh 370 690 1,280 1,876 2,476 3,083 3,628 4,124 5,062 6,397 8,151 10,224 12,241 14,259 16,101 17,762 19,190 20,403 21,407
Net cumulative savings % 0% 0% 1% 1% 1% 1% 2% 2% 2% 3% 3% 4% 5% 6% 6% 7% 7% 8% 8%
Final 370 690 1,280 1,876 2,476 3,083 3,628 4,124 5,062 6,397 8,151 10,224 12,241 14,259 16,101 17,762 19,190 20,403 21,407
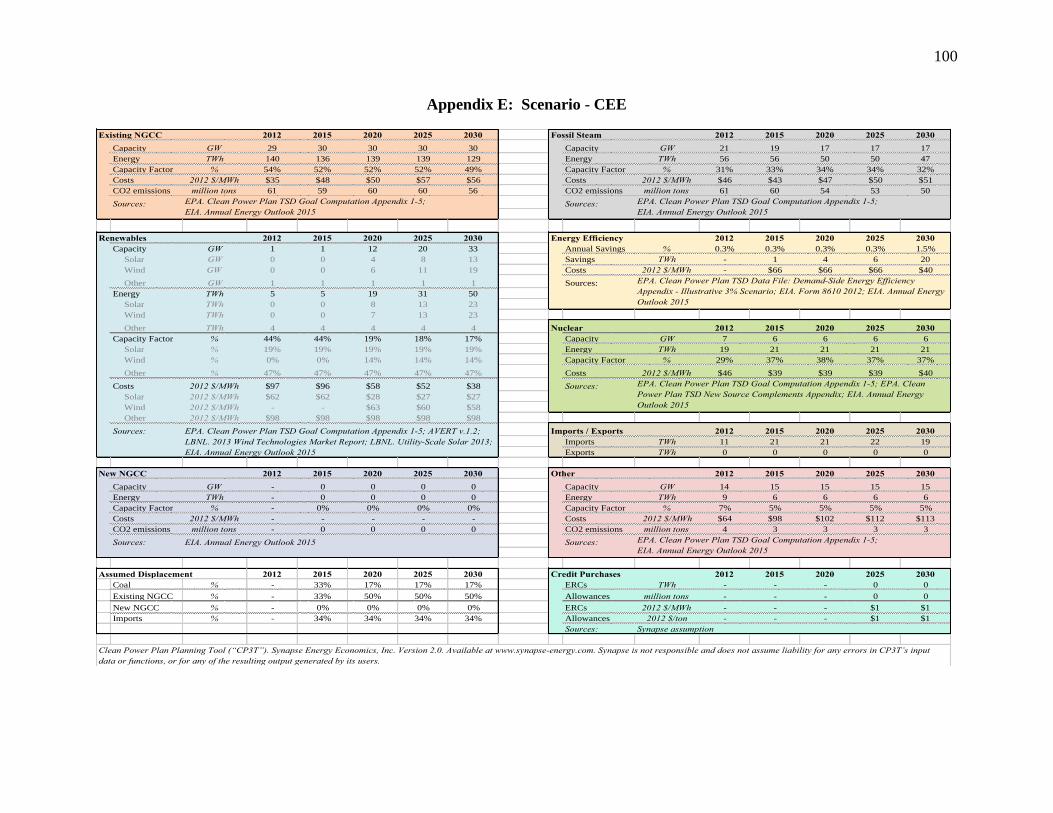
100
Appendix E: Scenario - CEE
Existing NGCC 2012 2015 2020 2025 2030 Fossil Steam 2012 2015 2020 2025 2030
Capacity GW 29 30 30 30 30 Capacity GW 21 19 17 17 17
Energy TWh 140 136 139 139 129 Energy TWh 56 56 50 50 47
Capacity Factor % 54% 52% 52% 52% 49% Capacity Factor % 31% 33% 34% 34% 32%
Costs 2012 $/MWh $35 $48 $50 $57 $56 Costs 2012 $/MWh $46 $43 $47 $50 $51
CO2 emissions million tons 61 59 60 60 56 CO2 emissions million tons 61 60 54 53 50
Sources: Sources:
Renewables 2012 2015 2020 2025 2030 Energy Efficiency 2012 2015 2020 2025 2030
Capacity GW 1 1 12 20 33 Annual Savings % 0.3% 0.3% 0.3% 0.3% 1.5%
Solar GW 0 0 4 8 13 Savings TWh - 1 4 6 20
Wind GW 0 0 6 11 19 Costs 2012 $/MWh - $66 $66 $66 $40
Other GW 1 1 1 1 1 Sources:
Energy TWh 5 5 19 31 50
Solar TWh 0 0 8 13 23
Wind TWh 0 0 7 13 23
Other TWh 4 4 4 4 4 Nuclear 2012 2015 2020 2025 2030
Capacity Factor % 44% 44% 19% 18% 17% Capacity GW 7 6 6 6 6
Solar % 19% 19% 19% 19% 19% Energy TWh 19 21 21 21 21
Wind % 0% 0% 14% 14% 14% Capacity Factor % 29% 37% 38% 37% 37%
Other % 47% 47% 47% 47% 47% Costs 2012 $/MWh $46 $39 $39 $39 $40
Costs 2012 $/MWh $97 $96 $58 $52 $38 Sources:
Solar 2012 $/MWh $62 $62 $28 $27 $27
Wind 2012 $/MWh - - $63 $60 $58
Other 2012 $/MWh $98 $98 $98 $98 $98
Sources: Imports / Exports 2012 2015 2020 2025 2030
Imports TWh 11 21 21 22 19
Exports TWh 0 0 0 0 0
New NGCC 2012 2015 2020 2025 2030 Other 2012 2015 2020 2025 2030
Capacity GW - 0 0 0 0 Capacity GW 14 15 15 15 15
Energy TWh - 0 0 0 0 Energy TWh 9 6 6 6 6
Capacity Factor % - 0% 0% 0% 0% Capacity Factor % 7% 5% 5% 5% 5%
Costs 2012 $/MWh - - - - - Costs 2012 $/MWh $64 $98 $102 $112 $113
CO2 emissions million tons - 0 0 0 0 CO2 emissions million tons 4 3 3 3 3
Sources: EIA. Annual Energy Outlook 2015 Sources:
Assumed Displacement 2012 2015 2020 2025 2030 Credit Purchases 2012 2015 2020 2025 2030
Coal % - 33% 17% 17% 17% ERCs TWh - - - 0 0
Existing NGCC % - 33% 50% 50% 50% Allowances million tons - - - 0 0
New NGCC % - 0% 0% 0% 0% ERCs 2012 $/MWh - - - $1 $1
Imports % - 34% 34% 34% 34% Allowances 2012 $/ton - - - $1 $1
Sources: Synapse assumption
Clean Power Plan Planning Tool (“CP3T”). Synapse Energy Economics, Inc. Version 2.0. Available at www.synapse-energy.com. Synapse is not responsible and does not assume liability for any errors in CP3T’s input
data or functions, or for any of the resulting output generated by its users.
EPA. Clean Power Plan TSD Goal Computation Appendix 1-5;
EIA. Annual Energy Outlook 2015
EPA. Clean Power Plan TSD Goal Computation Appendix 1-5;
EIA. Annual Energy Outlook 2015
EPA. Clean Power Plan TSD Data File: Demand-Side Energy Efficiency
Appendix - Illustrative 3% Scenario; EIA. Form 8610 2012; EIA. Annual Energy
Outlook 2015
EPA. Clean Power Plan TSD Goal Computation Appendix 1-5; EPA. Clean
Power Plan TSD New Source Complements Appendix; EIA. Annual Energy
Outlook 2015
EPA. Clean Power Plan TSD Goal Computation Appendix 1-5; AVERT v.1.2;
LBNL. 2013 Wind Technologies Market Report; LBNL. Utility-Scale Solar 2013;
EIA. Annual Energy Outlook 2015
EPA. Clean Power Plan TSD Goal Computation Appendix 1-5;
EIA. Annual Energy Outlook 2015
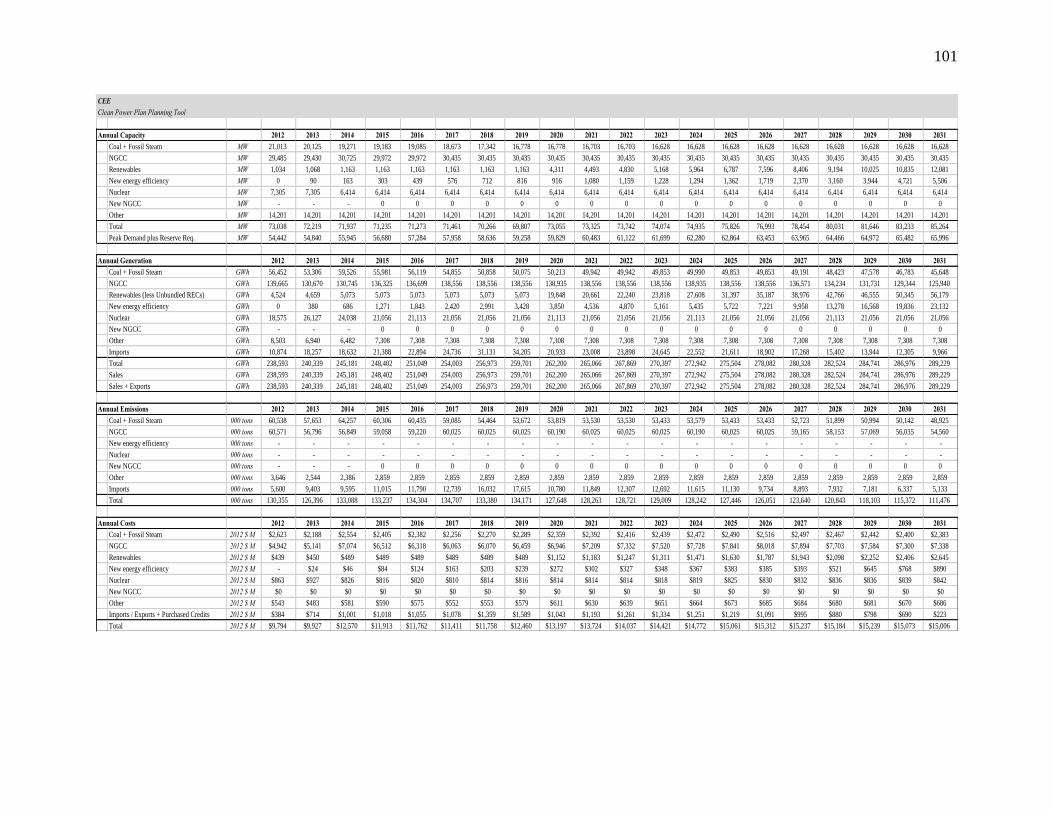
101
CEE
Clean Power Plan Planning Tool
Annual Capacity 2012 2013 2014 2015 2016 2017 2018 2019 2020 2021 2022 2023 2024 2025 2026 2027 2028 2029 2030 2031
Coal + Fossil Steam MW 21,013 20,125 19,271 19,183 19,085 18,673 17,342 16,778 16,778 16,703 16,703 16,628 16,628 16,628 16,628 16,628 16,628 16,628 16,628 16,628
NGCC MW 29,485 29,430 30,725 29,972 29,972 30,435 30,435 30,435 30,435 30,435 30,435 30,435 30,435 30,435 30,435 30,435 30,435 30,435 30,435 30,435
Renewables MW 1,034 1,068 1,163 1,163 1,163 1,163 1,163 1,163 4,311 4,493 4,830 5,168 5,964 6,787 7,596 8,406 9,194 10,025 10,835 12,081
New energy efficiency MW 0 90 163 303 439 576 712 816 916 1,080 1,159 1,228 1,294 1,362 1,719 2,370 3,160 3,944 4,721 5,506
Nuclear MW 7,305 7,305 6,414 6,414 6,414 6,414 6,414 6,414 6,414 6,414 6,414 6,414 6,414 6,414 6,414 6,414 6,414 6,414 6,414 6,414
New NGCC MW - - - 0 0 0 0 0 0 0 0 0 0 0 0 0 0 0 0 0
Other MW 14,201 14,201 14,201 14,201 14,201 14,201 14,201 14,201 14,201 14,201 14,201 14,201 14,201 14,201 14,201 14,201 14,201 14,201 14,201 14,201
Total MW 73,038 72,219 71,937 71,235 71,273 71,461 70,266 69,807 73,055 73,325 73,742 74,074 74,935 75,826 76,993 78,454 80,031 81,646 83,233 85,264
Peak Demand plus Reserve Req. MW 54,442 54,840 55,945 56,680 57,284 57,958 58,636 59,258 59,829 60,483 61,122 61,699 62,280 62,864 63,453 63,965 64,466 64,972 65,482 65,996
Annual Generation 2012 2013 2014 2015 2016 2017 2018 2019 2020 2021 2022 2023 2024 2025 2026 2027 2028 2029 2030 2031
Coal + Fossil Steam GWh 56,452 53,306 59,526 55,981 56,119 54,855 50,858 50,075 50,213 49,942 49,942 49,853 49,990 49,853 49,853 49,191 48,423 47,578 46,783 45,648
NGCC GWh 139,665 130,670 130,745 136,325 136,699 138,556 138,556 138,556 138,935 138,556 138,556 138,556 138,935 138,556 138,556 136,571 134,234 131,731 129,344 125,940
Renewables (less Unbundled RECs) GWh 4,524 4,659 5,073 5,073 5,073 5,073 5,073 5,073 19,848 20,661 22,240 23,818 27,608 31,397 35,187 38,976 42,766 46,555 50,345 56,179
New energy efficiency GWh 0 380 686 1,271 1,843 2,420 2,991 3,428 3,850 4,536 4,870 5,161 5,435 5,722 7,221 9,958 13,278 16,568 19,836 23,132
Nuclear GWh 18,575 26,127 24,038 21,056 21,113 21,056 21,056 21,056 21,113 21,056 21,056 21,056 21,113 21,056 21,056 21,056 21,113 21,056 21,056 21,056
New NGCC GWh - - - 0 0 0 0 0 0 0 0 0 0 0 0 0 0 0 0 0
Other GWh 8,503 6,940 6,482 7,308 7,308 7,308 7,308 7,308 7,308 7,308 7,308 7,308 7,308 7,308 7,308 7,308 7,308 7,308 7,308 7,308
Imports GWh 10,874 18,257 18,632 21,388 22,894 24,736 31,131 34,205 20,933 23,008 23,898 24,645 22,552 21,611 18,902 17,268 15,402 13,944 12,305 9,966
Total GWh 238,593 240,339 245,181 248,402 251,049 254,003 256,973 259,701 262,200 265,066 267,869 270,397 272,942 275,504 278,082 280,328 282,524 284,741 286,976 289,229
Sales GWh 238,593 240,339 245,181 248,402 251,049 254,003 256,973 259,701 262,200 265,066 267,869 270,397 272,942 275,504 278,082 280,328 282,524 284,741 286,976 289,229
Sales + Exports GWh 238,593 240,339 245,181 248,402 251,049 254,003 256,973 259,701 262,200 265,066 267,869 270,397 272,942 275,504 278,082 280,328 282,524 284,741 286,976 289,229
Annual Emissions 2012 2013 2014 2015 2016 2017 2018 2019 2020 2021 2022 2023 2024 2025 2026 2027 2028 2029 2030 2031
Coal + Fossil Steam 000 tons 60,538 57,653 64,257 60,306 60,435 59,085 54,464 53,672 53,819 53,530 53,530 53,433 53,579 53,433 53,433 52,723 51,899 50,994 50,142 48,925
NGCC 000 tons 60,571 56,796 56,849 59,058 59,220 60,025 60,025 60,025 60,190 60,025 60,025 60,025 60,190 60,025 60,025 59,165 58,153 57,069 56,035 54,560
New energy efficiency 000 tons - - - - - - - - - - - - - - - - - - - -
Nuclear 000 tons - - - - - - - - - - - - - - - - - - - -
New NGCC 000 tons - - - 0 0 0 0 0 0 0 0 0 0 0 0 0 0 0 0 0
Other 000 tons 3,646 2,544 2,386 2,859 2,859 2,859 2,859 2,859 2,859 2,859 2,859 2,859 2,859 2,859 2,859 2,859 2,859 2,859 2,859 2,859
Imports 000 tons 5,600 9,403 9,595 11,015 11,790 12,739 16,032 17,615 10,780 11,849 12,307 12,692 11,615 11,130 9,734 8,893 7,932 7,181 6,337 5,133
Total 000 tons 130,355 126,396 133,088 133,237 134,304 134,707 133,380 134,171 127,648 128,263 128,721 129,009 128,242 127,446 126,051 123,640 120,843 118,103 115,372 111,476
Annual Costs 2012 2013 2014 2015 2016 2017 2018 2019 2020 2021 2022 2023 2024 2025 2026 2027 2028 2029 2030 2031
Coal + Fossil Steam 2012 $ M $2,623 $2,188 $2,554 $2,405 $2,382 $2,256 $2,270 $2,289 $2,359 $2,392 $2,416 $2,439 $2,472 $2,490 $2,516 $2,497 $2,467 $2,442 $2,400 $2,383
NGCC 2012 $ M $4,942 $5,141 $7,074 $6,512 $6,318 $6,063 $6,070 $6,459 $6,946 $7,209 $7,332 $7,520 $7,728 $7,841 $8,018 $7,894 $7,703 $7,584 $7,300 $7,338
Renewables 2012 $ M $439 $450 $489 $489 $489 $489 $489 $489 $1,152 $1,183 $1,247 $1,311 $1,471 $1,630 $1,787 $1,943 $2,098 $2,252 $2,406 $2,645
New energy efficiency 2012 $ M - $24 $46 $84 $124 $163 $203 $239 $272 $302 $327 $348 $367 $383 $385 $393 $521 $645 $768 $890
Nuclear 2012 $ M $863 $927 $826 $816 $820 $810 $814 $816 $814 $814 $814 $818 $819 $825 $830 $832 $836 $836 $839 $842
New NGCC 2012 $ M $0 $0 $0 $0 $0 $0 $0 $0 $0 $0 $0 $0 $0 $0 $0 $0 $0 $0 $0 $0
Other 2012 $ M $543 $483 $581 $590 $575 $552 $553 $579 $611 $630 $639 $651 $664 $673 $685 $684 $680 $681 $670 $686
Imports / Exports + Purchased Credits 2012 $ M $384 $714 $1,001 $1,018 $1,055 $1,078 $1,359 $1,589 $1,043 $1,193 $1,261 $1,334 $1,251 $1,219 $1,091 $995 $880 $798 $690 $223
Total 2012 $ M $9,794 $9,927 $12,570 $11,913 $11,762 $11,411 $11,758 $12,460 $13,197 $13,724 $14,037 $14,421 $14,772 $15,061 $15,312 $15,237 $15,184 $15,239 $15,073 $15,006
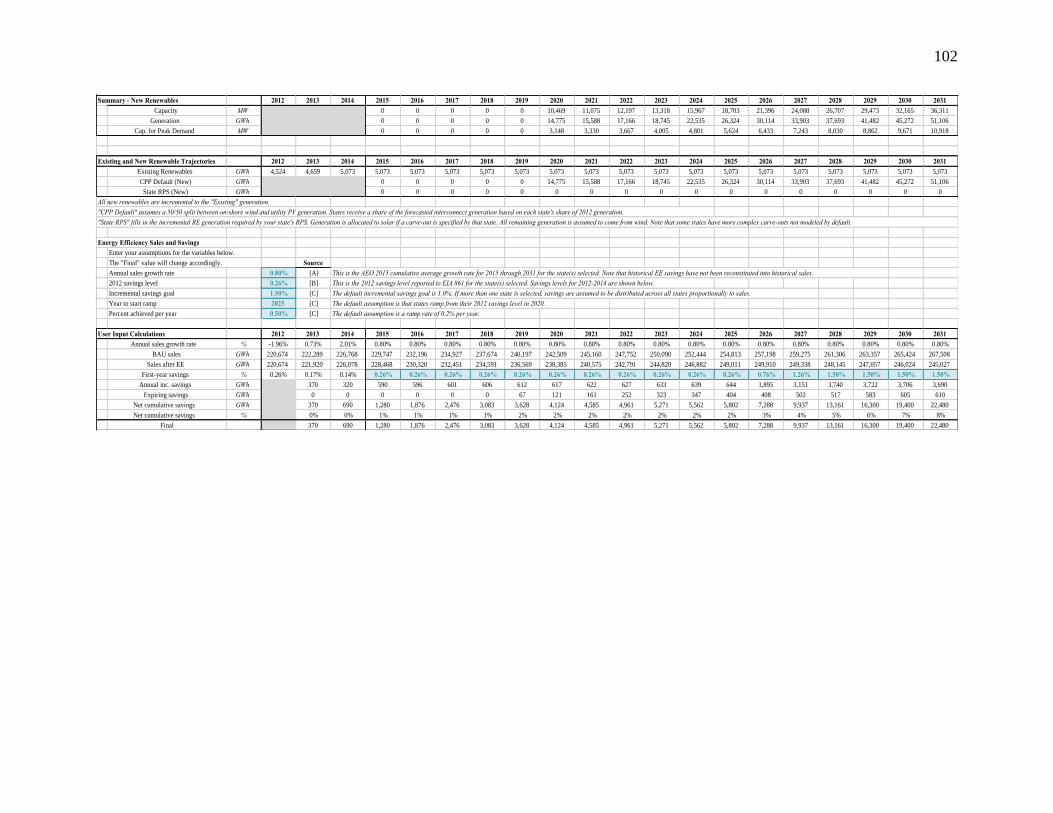
102
Summary - New Renewables 2012 2013 2014 2015 2016 2017 2018 2019 2020 2021 2022 2023 2024 2025 2026 2027 2028 2029 2030 2031
Capacity MW 0 0 0 0 0 10,469 11,075 12,197 13,318 15,967 18,703 21,396 24,088 26,707 29,473 32,165 36,311
Generation GWh 0 0 0 0 0 14,775 15,588 17,166 18,745 22,535 26,324 30,114 33,903 37,693 41,482 45,272 51,106
Cap. for Peak Demand MW 0 0 0 0 0 3,148 3,330 3,667 4,005 4,801 5,624 6,433 7,243 8,030 8,862 9,671 10,918
Existing and New Renewable Trajectories 2012 2013 2014 2015 2016 2017 2018 2019 2020 2021 2022 2023 2024 2025 2026 2027 2028 2029 2030 2031
Existing Renewables GWh 4,524 4,659 5,073 5,073 5,073 5,073 5,073 5,073 5,073 5,073 5,073 5,073 5,073 5,073 5,073 5,073 5,073 5,073 5,073 5,073
CPP Default (New) GWh 0 0 0 0 0 14,775 15,588 17,166 18,745 22,535 26,324 30,114 33,903 37,693 41,482 45,272 51,106
State RPS (New) GWh 0 0 0 0 0 0 0 0 0 0 0 0 0 0 0 0 0
All new renewables are incremental to the "Existing" generation.
"CPP Default" assumes a 50/50 split between on-shore wind and utility PV generation. States receive a share of the forecasted interconnect generation based on each state's share of 2012 generation.
"State RPS" fills in the incremental RE generation required by your state's RPS. Generation is allocated to solar if a carve-out is specified by that state. All remaining generation is assumed to come from wind. Note that some states have more complex carve-outs not modeled by default.
Energy Efficiency Sales and Savings
Enter your assumptions for the variables below.
The "Final" value will change accordingly. Source
Annual sales growth rate 0.80% [A] This is the AEO 2015 cumulative average growth rate for 2015 through 2031 for the state(s) selected. Note that historical EE savings have not been reconstituted into historical sales.
2012 savings level 0.26% [B] This is the 2012 savings level reported to EIA 861 for the state(s) selected. Savings levels for 2012-2014 are shown below.
Incremental savings goal 1.50% [C] The default incremental savings goal is 1.0%. If more than one state is selected, savings are assumed to be distributed across all states proportionally to sales.
Year to start ramp 2025 [C] The default assumption is that states ramp from their 2012 savings level in 2020.
Percent achieved per year 0.50% [C] The default assumption is a ramp rate of 0.2% per year.
User Input Calculations 2012 2013 2014 2015 2016 2017 2018 2019 2020 2021 2022 2023 2024 2025 2026 2027 2028 2029 2030 2031
Annual sales growth rate % -1.96% 0.73% 2.01% 0.80% 0.80% 0.80% 0.80% 0.80% 0.80% 0.80% 0.80% 0.80% 0.80% 0.80% 0.80% 0.80% 0.80% 0.80% 0.80% 0.80%
BAU sales GWh 220,674 222,289 226,768 229,747 232,196 234,927 237,674 240,197 242,509 245,160 247,752 250,090 252,444 254,813 257,198 259,275 261,306 263,357 265,424 267,508
Sales after EE GWh 220,674 221,920 226,078 228,468 230,320 232,451 234,591 236,569 238,385 240,575 242,791 244,820 246,882 249,011 249,910 249,338 248,145 247,057 246,024 245,027
First-year savings % 0.26% 0.17% 0.14% 0.26% 0.26% 0.26% 0.26% 0.26% 0.26% 0.26% 0.26% 0.26% 0.26% 0.26% 0.76% 1.26% 1.50% 1.50% 1.50% 1.50%
Annual inc. savings GWh 370 320 590 596 601 606 612 617 622 627 633 639 644 1,895 3,151 3,740 3,722 3,706 3,690
Expiring savings GWh 0 0 0 0 0 0 67 121 161 252 323 347 404 408 502 517 583 605 610
Net cumulative savings GWh 370 690 1,280 1,876 2,476 3,083 3,628 4,124 4,585 4,961 5,271 5,562 5,802 7,288 9,937 13,161 16,300 19,400 22,480
Net cumulative savings % 0% 0% 1% 1% 1% 1% 2% 2% 2% 2% 2% 2% 2% 3% 4% 5% 6% 7% 8%
Final 370 690 1,280 1,876 2,476 3,083 3,628 4,124 4,585 4,961 5,271 5,562 5,802 7,288 9,937 13,161 16,300 19,400 22,480

103
Appendix F: Scenario - CCE
Existing NGCC 2012 2015 2020 2025 2030 Fossil Steam 2012 2015 2020 2025 2030
Capacity GW 29 30 30 30 30 Capacity GW 21 19 17 17 17
Energy TWh 140 136 130 171 169 Energy TWh 56 56 46 36 35
Capacity Factor % 54% 52% 49% 64% 64% Capacity Factor % 31% 33% 31% 25% 24%
Costs 2012 $/MWh $35 $48 $50 $56 $56 Costs 2012 $/MWh $46 $43 $48 $75 $76
CO2 emissions million tons 61 59 56 75 74 CO2 emissions million tons 61 60 49 37 36
Sources: Sources:
Renewables 2012 2015 2020 2025 2030 Energy Efficiency 2012 2015 2020 2025 2030
Capacity GW 1 1 1 1 1 Annual Savings % 0.3% 0.3% 0.3% 0.3% 1.5%
Solar GW 0 0 0 0 0 Savings TWh - 1 4 6 21
Wind GW 0 0 0 0 0 Costs 2012 $/MWh - $66 $66 $66 $40
Other GW 1 1 1 1 1 Sources:
Energy TWh 5 5 5 5 5
Solar TWh 0 0 0 0 0
Wind TWh 0 0 0 0 0
Other TWh 4 4 4 4 4 Nuclear 2012 2015 2020 2025 2030
Capacity Factor % 44% 44% 44% 44% 44% Capacity GW 7 6 6 6 6
Solar % 19% 19% 19% 19% 19% Energy TWh 19 21 21 21 21
Wind % 0% 0% 0% 0% 0% Capacity Factor % 29% 37% 38% 37% 37%
Other % 47% 47% 47% 47% 47% Costs 2012 $/MWh $46 $39 $39 $39 $40
Costs 2012 $/MWh $97 $96 $96 $96 $0 Sources:
Solar 2012 $/MWh $62 $62 $62 $62 $62
Wind 2012 $/MWh - - - - -
Other 2012 $/MWh $98 $98 $98 $98 $98
Sources: Imports / Exports 2012 2015 2020 2025 2030
Imports TWh 11 21 19 19 19
Exports TWh 0 0 0 0 0
New NGCC 2012 2015 2020 2025 2030 Other 2012 2015 2020 2025 2030
Capacity GW - 0 9 9 9 Capacity GW 14 15 6 6 6
Energy TWh - 0 39 29 28 Energy TWh 9 6 -33 -23 -22
Capacity Factor % - 0% 49% 36% 35% Capacity Factor % 7% 5% -64% -44% -42%
Costs 2012 $/MWh - - $66 $81 $81 Costs 2012 $/MWh $64 $98 -$18 -$29 -$31
CO2 emissions million tons - 0 23 21 21 CO2 emissions million tons 4 3 3 3 3
Sources: EIA. Annual Energy Outlook 2015 Sources:
Assumed Displacement 2012 2015 2020 2025 2030 Credit Purchases 2012 2015 2020 2025 2030
Coal % - 33% 16% 16% 16% ERCs TWh - - - 0 0
Existing NGCC % - 33% 33% 33% 33% Allowances million tons - - - 0 0
New NGCC % - 0% 17% 17% 17% ERCs 2012 $/MWh - - - $1 $1
Imports % - 34% 34% 34% 34% Allowances 2012 $/ton - - - $1 $1
Sources: Synapse assumption
Clean Power Plan Planning Tool (“CP3T”). Synapse Energy Economics, Inc. Version 2.0. Available at www.synapse-energy.com. Synapse is not responsible and does not assume liability for any errors in CP3T’s input
data or functions, or for any of the resulting output generated by its users.
EPA. Clean Power Plan TSD Goal Computation Appendix 1-5;
EIA. Annual Energy Outlook 2015
EPA. Clean Power Plan TSD Goal Computation Appendix 1-5;
EIA. Annual Energy Outlook 2015
EPA. Clean Power Plan TSD Data File: Demand-Side Energy Efficiency
Appendix - Illustrative 3% Scenario; EIA. Form 8610 2012; EIA. Annual Energy
Outlook 2015
EPA. Clean Power Plan TSD Goal Computation Appendix 1-5; EPA. Clean
Power Plan TSD New Source Complements Appendix; EIA. Annual Energy
Outlook 2015
EPA. Clean Power Plan TSD Goal Computation Appendix 1-5; AVERT v.1.2;
LBNL. 2013 Wind Technologies Market Report; LBNL. Utility-Scale Solar 2013;
EIA. Annual Energy Outlook 2015
EPA. Clean Power Plan TSD Goal Computation Appendix 1-5;
EIA. Annual Energy Outlook 2015
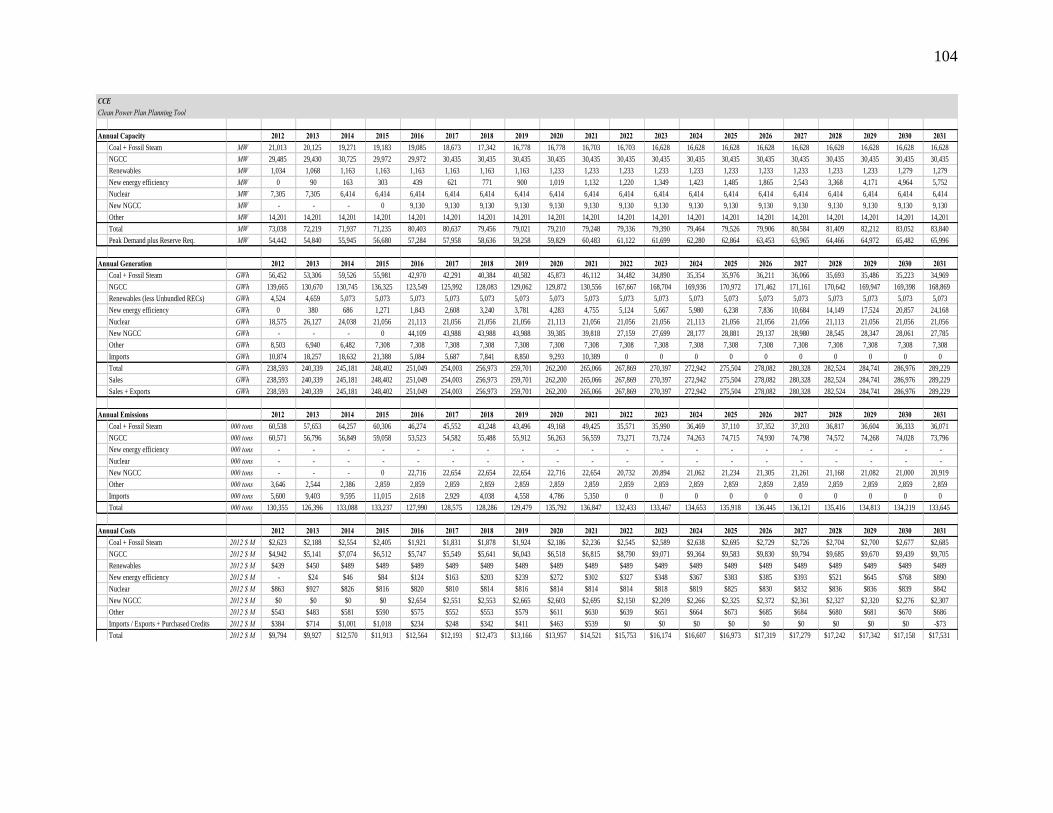
104
CCE
Clean Power Plan Planning Tool
Annual Capacity 2012 2013 2014 2015 2016 2017 2018 2019 2020 2021 2022 2023 2024 2025 2026 2027 2028 2029 2030 2031
Coal + Fossil Steam MW 21,013 20,125 19,271 19,183 19,085 18,673 17,342 16,778 16,778 16,703 16,703 16,628 16,628 16,628 16,628 16,628 16,628 16,628 16,628 16,628
NGCC MW 29,485 29,430 30,725 29,972 29,972 30,435 30,435 30,435 30,435 30,435 30,435 30,435 30,435 30,435 30,435 30,435 30,435 30,435 30,435 30,435
Renewables MW 1,034 1,068 1,163 1,163 1,163 1,163 1,163 1,163 1,233 1,233 1,233 1,233 1,233 1,233 1,233 1,233 1,233 1,233 1,279 1,279
New energy efficiency MW 0 90 163 303 439 621 771 900 1,019 1,132 1,220 1,349 1,423 1,485 1,865 2,543 3,368 4,171 4,964 5,752
Nuclear MW 7,305 7,305 6,414 6,414 6,414 6,414 6,414 6,414 6,414 6,414 6,414 6,414 6,414 6,414 6,414 6,414 6,414 6,414 6,414 6,414
New NGCC MW - - - 0 9,130 9,130 9,130 9,130 9,130 9,130 9,130 9,130 9,130 9,130 9,130 9,130 9,130 9,130 9,130 9,130
Other MW 14,201 14,201 14,201 14,201 14,201 14,201 14,201 14,201 14,201 14,201 14,201 14,201 14,201 14,201 14,201 14,201 14,201 14,201 14,201 14,201
Total MW 73,038 72,219 71,937 71,235 80,403 80,637 79,456 79,021 79,210 79,248 79,336 79,390 79,464 79,526 79,906 80,584 81,409 82,212 83,052 83,840
Peak Demand plus Reserve Req. MW 54,442 54,840 55,945 56,680 57,284 57,958 58,636 59,258 59,829 60,483 61,122 61,699 62,280 62,864 63,453 63,965 64,466 64,972 65,482 65,996
Annual Generation 2012 2013 2014 2015 2016 2017 2018 2019 2020 2021 2022 2023 2024 2025 2026 2027 2028 2029 2030 2031
Coal + Fossil Steam GWh 56,452 53,306 59,526 55,981 42,970 42,291 40,384 40,582 45,873 46,112 34,482 34,890 35,354 35,976 36,211 36,066 35,693 35,486 35,223 34,969
NGCC GWh 139,665 130,670 130,745 136,325 123,549 125,992 128,083 129,062 129,872 130,556 167,667 168,704 169,936 170,972 171,462 171,161 170,642 169,947 169,398 168,869
Renewables (less Unbundled RECs) GWh 4,524 4,659 5,073 5,073 5,073 5,073 5,073 5,073 5,073 5,073 5,073 5,073 5,073 5,073 5,073 5,073 5,073 5,073 5,073 5,073
New energy efficiency GWh 0 380 686 1,271 1,843 2,608 3,240 3,781 4,283 4,755 5,124 5,667 5,980 6,238 7,836 10,684 14,149 17,524 20,857 24,168
Nuclear GWh 18,575 26,127 24,038 21,056 21,113 21,056 21,056 21,056 21,113 21,056 21,056 21,056 21,113 21,056 21,056 21,056 21,113 21,056 21,056 21,056
New NGCC GWh - - - 0 44,109 43,988 43,988 43,988 39,385 39,818 27,159 27,699 28,177 28,881 29,137 28,980 28,545 28,347 28,061 27,785
Other GWh 8,503 6,940 6,482 7,308 7,308 7,308 7,308 7,308 7,308 7,308 7,308 7,308 7,308 7,308 7,308 7,308 7,308 7,308 7,308 7,308
Imports GWh 10,874 18,257 18,632 21,388 5,084 5,687 7,841 8,850 9,293 10,389 0 0 0 0 0 0 0 0 0 0
Total GWh 238,593 240,339 245,181 248,402 251,049 254,003 256,973 259,701 262,200 265,066 267,869 270,397 272,942 275,504 278,082 280,328 282,524 284,741 286,976 289,229
Sales GWh 238,593 240,339 245,181 248,402 251,049 254,003 256,973 259,701 262,200 265,066 267,869 270,397 272,942 275,504 278,082 280,328 282,524 284,741 286,976 289,229
Sales + Exports GWh 238,593 240,339 245,181 248,402 251,049 254,003 256,973 259,701 262,200 265,066 267,869 270,397 272,942 275,504 278,082 280,328 282,524 284,741 286,976 289,229
Annual Emissions 2012 2013 2014 2015 2016 2017 2018 2019 2020 2021 2022 2023 2024 2025 2026 2027 2028 2029 2030 2031
Coal + Fossil Steam 000 tons 60,538 57,653 64,257 60,306 46,274 45,552 43,248 43,496 49,168 49,425 35,571 35,990 36,469 37,110 37,352 37,203 36,817 36,604 36,333 36,071
NGCC 000 tons 60,571 56,796 56,849 59,058 53,523 54,582 55,488 55,912 56,263 56,559 73,271 73,724 74,263 74,715 74,930 74,798 74,572 74,268 74,028 73,796
New energy efficiency 000 tons - - - - - - - - - - - - - - - - - - - -
Nuclear 000 tons - - - - - - - - - - - - - - - - - - - -
New NGCC 000 tons - - - 0 22,716 22,654 22,654 22,654 22,716 22,654 20,732 20,894 21,062 21,234 21,305 21,261 21,168 21,082 21,000 20,919
Other 000 tons 3,646 2,544 2,386 2,859 2,859 2,859 2,859 2,859 2,859 2,859 2,859 2,859 2,859 2,859 2,859 2,859 2,859 2,859 2,859 2,859
Imports 000 tons 5,600 9,403 9,595 11,015 2,618 2,929 4,038 4,558 4,786 5,350 0 0 0 0 0 0 0 0 0 0
Total 000 tons 130,355 126,396 133,088 133,237 127,990 128,575 128,286 129,479 135,792 136,847 132,433 133,467 134,653 135,918 136,445 136,121 135,416 134,813 134,219 133,645
Annual Costs 2012 2013 2014 2015 2016 2017 2018 2019 2020 2021 2022 2023 2024 2025 2026 2027 2028 2029 2030 2031
Coal + Fossil Steam 2012 $ M $2,623 $2,188 $2,554 $2,405 $1,921 $1,831 $1,878 $1,924 $2,186 $2,236 $2,545 $2,589 $2,638 $2,695 $2,729 $2,726 $2,704 $2,700 $2,677 $2,685
NGCC 2012 $ M $4,942 $5,141 $7,074 $6,512 $5,747 $5,549 $5,641 $6,043 $6,518 $6,815 $8,790 $9,071 $9,364 $9,583 $9,830 $9,794 $9,685 $9,670 $9,439 $9,705
Renewables 2012 $ M $439 $450 $489 $489 $489 $489 $489 $489 $489 $489 $489 $489 $489 $489 $489 $489 $489 $489 $489 $489
New energy efficiency 2012 $ M - $24 $46 $84 $124 $163 $203 $239 $272 $302 $327 $348 $367 $383 $385 $393 $521 $645 $768 $890
Nuclear 2012 $ M $863 $927 $826 $816 $820 $810 $814 $816 $814 $814 $814 $818 $819 $825 $830 $832 $836 $836 $839 $842
New NGCC 2012 $ M $0 $0 $0 $0 $2,654 $2,551 $2,553 $2,665 $2,603 $2,695 $2,150 $2,209 $2,266 $2,325 $2,372 $2,361 $2,327 $2,320 $2,276 $2,307
Other 2012 $ M $543 $483 $581 $590 $575 $552 $553 $579 $611 $630 $639 $651 $664 $673 $685 $684 $680 $681 $670 $686
Imports / Exports + Purchased Credits 2012 $ M $384 $714 $1,001 $1,018 $234 $248 $342 $411 $463 $539 $0 $0 $0 $0 $0 $0 $0 $0 $0 -$73
Total 2012 $ M $9,794 $9,927 $12,570 $11,913 $12,564 $12,193 $12,473 $13,166 $13,957 $14,521 $15,753 $16,174 $16,607 $16,973 $17,319 $17,279 $17,242 $17,342 $17,158 $17,531
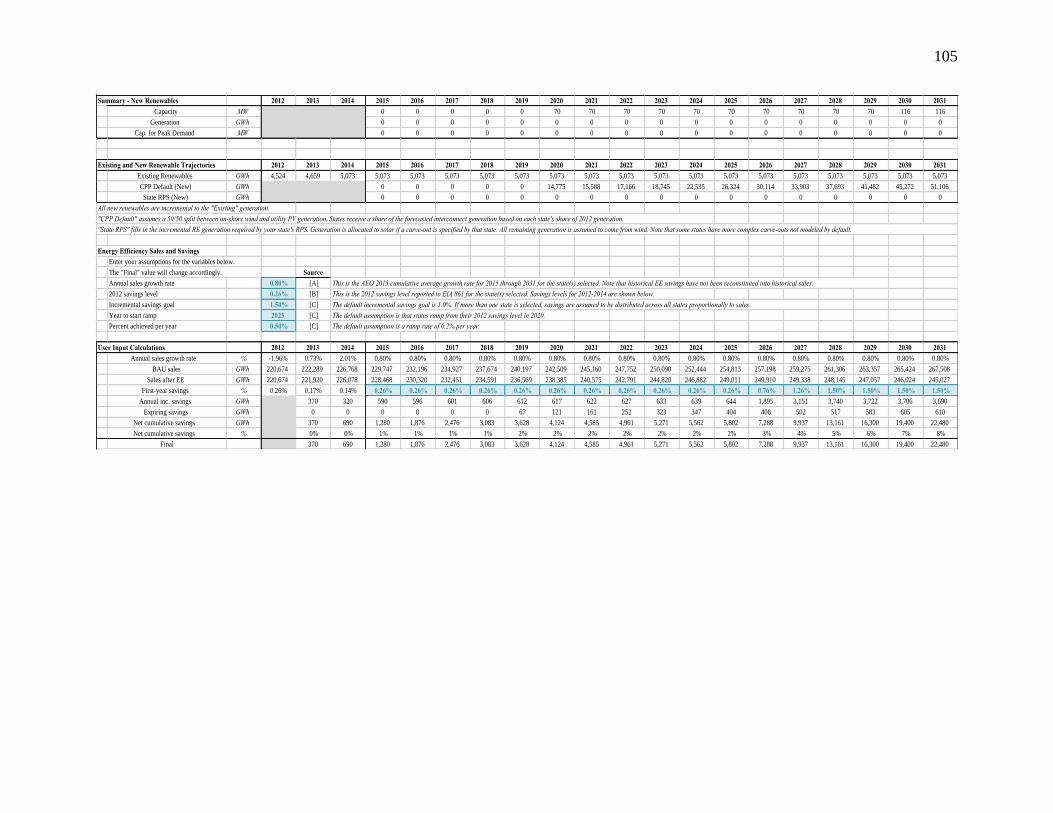
105
Summary - New Renewables 2012 2013 2014 2015 2016 2017 2018 2019 2020 2021 2022 2023 2024 2025 2026 2027 2028 2029 2030 2031
Capacity MW 0 0 0 0 0 70 70 70 70 70 70 70 70 70 70 116 116
Generation GWh 0 0 0 0 0 0 0 0 0 0 0 0 0 0 0 0 0
Cap. for Peak Demand MW 0 0 0 0 0 0 0 0 0 0 0 0 0 0 0 0 0
Existing and New Renewable Trajectories 2012 2013 2014 2015 2016 2017 2018 2019 2020 2021 2022 2023 2024 2025 2026 2027 2028 2029 2030 2031
Existing Renewables GWh 4,524 4,659 5,073 5,073 5,073 5,073 5,073 5,073 5,073 5,073 5,073 5,073 5,073 5,073 5,073 5,073 5,073 5,073 5,073 5,073
CPP Default (New) GWh 0 0 0 0 0 14,775 15,588 17,166 18,745 22,535 26,324 30,114 33,903 37,693 41,482 45,272 51,106
State RPS (New) GWh 0 0 0 0 0 0 0 0 0 0 0 0 0 0 0 0 0
All new renewables are incremental to the "Existing" generation.
"CPP Default" assumes a 50/50 split between on-shore wind and utility PV generation. States receive a share of the forecasted interconnect generation based on each state's share of 2012 generation.
"State RPS" fills in the incremental RE generation required by your state's RPS. Generation is allocated to solar if a carve-out is specified by that state. All remaining generation is assumed to come from wind. Note that some states have more complex carve-outs not modeled by default.
Energy Efficiency Sales and Savings
Enter your assumptions for the variables below.
The "Final" value will change accordingly. Source
Annual sales growth rate 0.80% [A] This is the AEO 2015 cumulative average growth rate for 2015 through 2031 for the state(s) selected. Note that historical EE savings have not been reconstituted into historical sales.
2012 savings level 0.26% [B] This is the 2012 savings level reported to EIA 861 for the state(s) selected. Savings levels for 2012-2014 are shown below.
Incremental savings goal 1.50% [C] The default incremental savings goal is 1.0%. If more than one state is selected, savings are assumed to be distributed across all states proportionally to sales.
Year to start ramp 2025 [C] The default assumption is that states ramp from their 2012 savings level in 2020.
Percent achieved per year 0.50% [C] The default assumption is a ramp rate of 0.2% per year.
User Input Calculations 2012 2013 2014 2015 2016 2017 2018 2019 2020 2021 2022 2023 2024 2025 2026 2027 2028 2029 2030 2031
Annual sales growth rate % -1.96% 0.73% 2.01% 0.80% 0.80% 0.80% 0.80% 0.80% 0.80% 0.80% 0.80% 0.80% 0.80% 0.80% 0.80% 0.80% 0.80% 0.80% 0.80% 0.80%
BAU sales GWh 220,674 222,289 226,768 229,747 232,196 234,927 237,674 240,197 242,509 245,160 247,752 250,090 252,444 254,813 257,198 259,275 261,306 263,357 265,424 267,508
Sales after EE GWh 220,674 221,920 226,078 228,468 230,320 232,451 234,591 236,569 238,385 240,575 242,791 244,820 246,882 249,011 249,910 249,338 248,145 247,057 246,024 245,027
First-year savings % 0.26% 0.17% 0.14% 0.26% 0.26% 0.26% 0.26% 0.26% 0.26% 0.26% 0.26% 0.26% 0.26% 0.26% 0.76% 1.26% 1.50% 1.50% 1.50% 1.50%
Annual inc. savings GWh 370 320 590 596 601 606 612 617 622 627 633 639 644 1,895 3,151 3,740 3,722 3,706 3,690
Expiring savings GWh 0 0 0 0 0 0 67 121 161 252 323 347 404 408 502 517 583 605 610
Net cumulative savings GWh 370 690 1,280 1,876 2,476 3,083 3,628 4,124 4,585 4,961 5,271 5,562 5,802 7,288 9,937 13,161 16,300 19,400 22,480
Net cumulative savings % 0% 0% 1% 1% 1% 1% 2% 2% 2% 2% 2% 2% 2% 3% 4% 5% 6% 7% 8%
Final 370 690 1,280 1,876 2,476 3,083 3,628 4,124 4,585 4,961 5,271 5,562 5,802 7,288 9,937 13,161 16,300 19,400 22,480
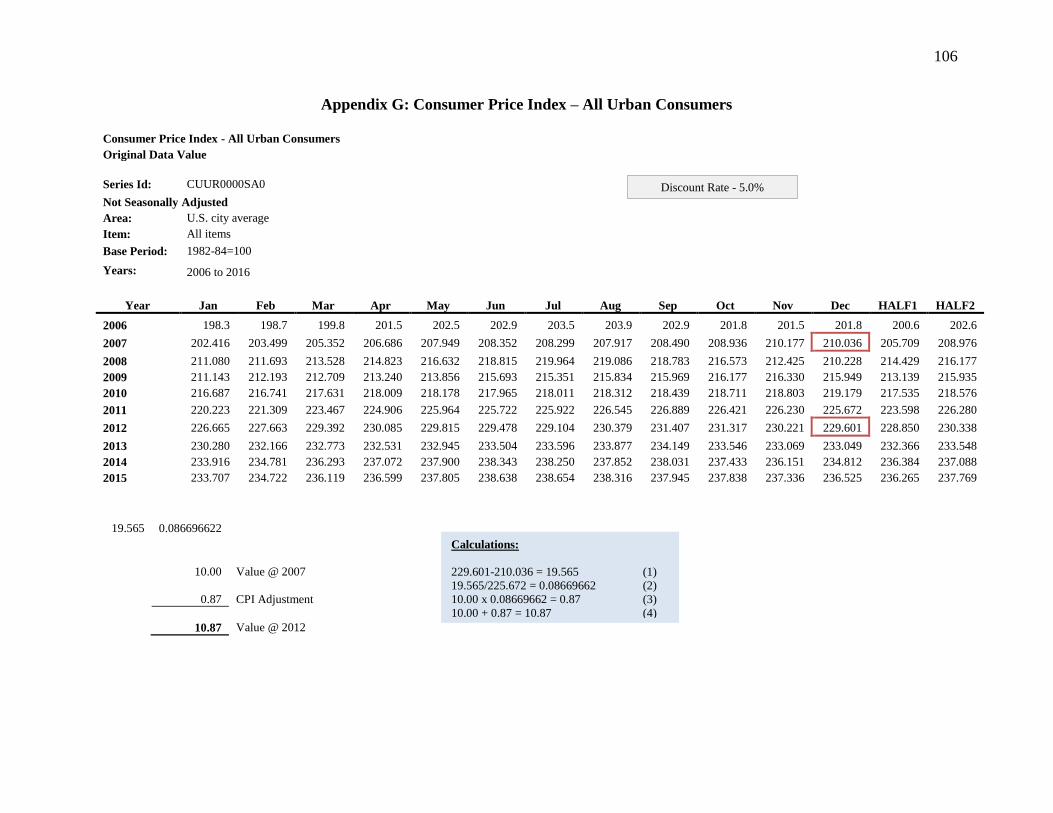
106
Appendix G: Consumer Price Index – All Urban Consumers
Consumer Price Index - All Urban Consumers
Original Data Value
Series Id: CUUR0000SA0
Not Seasonally Adjusted
Area: U.S. city average
Item: All items
Base Period: 1982-84=100
Years: 2006 to 2016
Year Jan Feb Mar Apr May Jun Jul Aug Sep Oct Nov Dec HALF1 HALF2
2006 198.3 198.7 199.8 201.5 202.5 202.9 203.5 203.9 202.9 201.8 201.5 201.8 200.6 202.6
2007 202.416 203.499 205.352 206.686 207.949 208.352 208.299 207.917 208.490 208.936 210.177 210.036 205.709 208.976
2008 211.080 211.693 213.528 214.823 216.632 218.815 219.964 219.086 218.783 216.573 212.425 210.228 214.429 216.177
2009 211.143 212.193 212.709 213.240 213.856 215.693 215.351 215.834 215.969 216.177 216.330 215.949 213.139 215.935
2010 216.687 216.741 217.631 218.009 218.178 217.965 218.011 218.312 218.439 218.711 218.803 219.179 217.535 218.576
2011 220.223 221.309 223.467 224.906 225.964 225.722 225.922 226.545 226.889 226.421 226.230 225.672 223.598 226.280
2012 226.665 227.663 229.392 230.085 229.815 229.478 229.104 230.379 231.407 231.317 230.221 229.601 228.850 230.338
2013 230.280 232.166 232.773 232.531 232.945 233.504 233.596 233.877 234.149 233.546 233.069 233.049 232.366 233.548
2014 233.916 234.781 236.293 237.072 237.900 238.343 238.250 237.852 238.031 237.433 236.151 234.812 236.384 237.088
2015 233.707 234.722 236.119 236.599 237.805 238.638 238.654 238.316 237.945 237.838 237.336 236.525 236.265 237.769
19.565 0.086696622
10.00 Value @ 2007
0.87 CPI Adjustment
10.87 Value @ 2012
Calculations:
229.601-210.036 = 19.565 (1)
19.565/225.672 = 0.08669662 (2)
10.00 x 0.08669662 = 0.87 (3)
10.00 + 0.87 = 10.87 (4)
Discount Rate - 5.0%
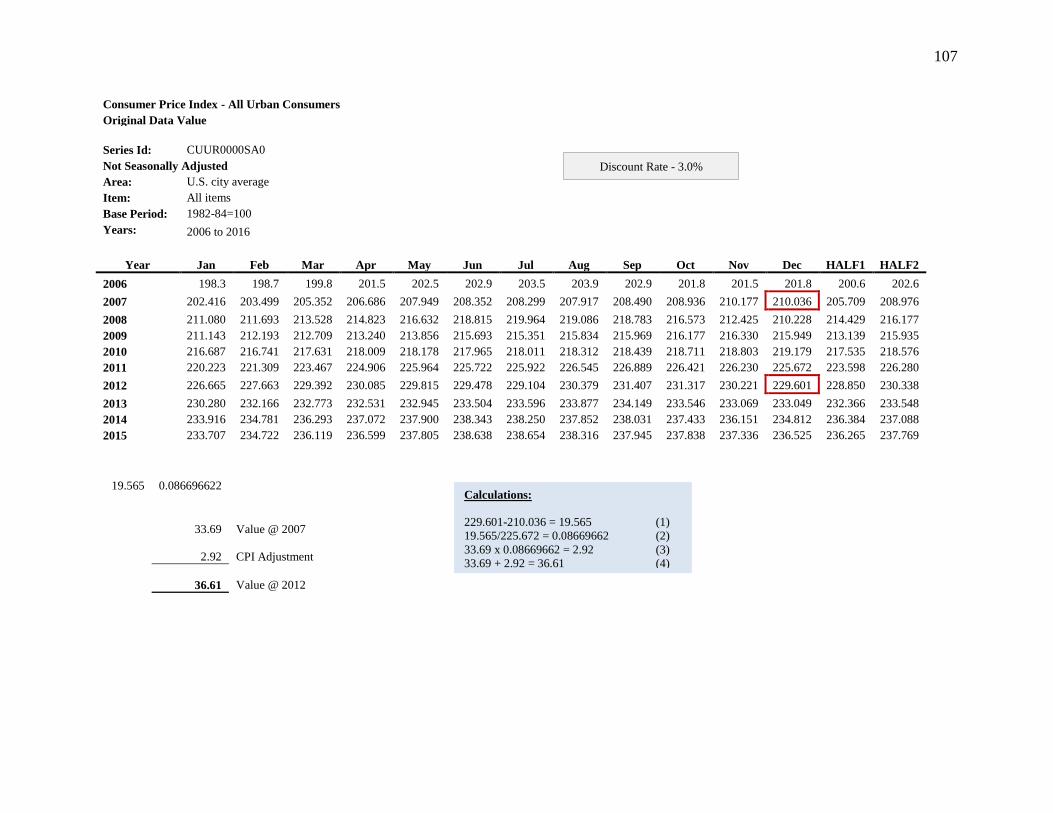
107
Consumer Price Index - All Urban Consumers
Original Data Value
Series Id: CUUR0000SA0
Not Seasonally Adjusted
Area: U.S. city average
Item: All items
Base Period: 1982-84=100
Years: 2006 to 2016
Year Jan Feb Mar Apr May Jun Jul Aug Sep Oct Nov Dec HALF1 HALF2
2006 198.3 198.7 199.8 201.5 202.5 202.9 203.5 203.9 202.9 201.8 201.5 201.8 200.6 202.6
2007 202.416 203.499 205.352 206.686 207.949 208.352 208.299 207.917 208.490 208.936 210.177 210.036 205.709 208.976
2008 211.080 211.693 213.528 214.823 216.632 218.815 219.964 219.086 218.783 216.573 212.425 210.228 214.429 216.177
2009 211.143 212.193 212.709 213.240 213.856 215.693 215.351 215.834 215.969 216.177 216.330 215.949 213.139 215.935
2010 216.687 216.741 217.631 218.009 218.178 217.965 218.011 218.312 218.439 218.711 218.803 219.179 217.535 218.576
2011 220.223 221.309 223.467 224.906 225.964 225.722 225.922 226.545 226.889 226.421 226.230 225.672 223.598 226.280
2012 226.665 227.663 229.392 230.085 229.815 229.478 229.104 230.379 231.407 231.317 230.221 229.601 228.850 230.338
2013 230.280 232.166 232.773 232.531 232.945 233.504 233.596 233.877 234.149 233.546 233.069 233.049 232.366 233.548
2014 233.916 234.781 236.293 237.072 237.900 238.343 238.250 237.852 238.031 237.433 236.151 234.812 236.384 237.088
2015 233.707 234.722 236.119 236.599 237.805 238.638 238.654 238.316 237.945 237.838 237.336 236.525 236.265 237.769
19.565 0.086696622
33.69 Value @ 2007
2.92 CPI Adjustment
36.61 Value @ 2012
Calculations:
229.601-210.036 = 19.565 (1)
19.565/225.672 = 0.08669662 (2)
33.69 x 0.08669662 = 2.92 (3)
33.69 + 2.92 = 36.61 (4)
Discount Rate - 3.0%
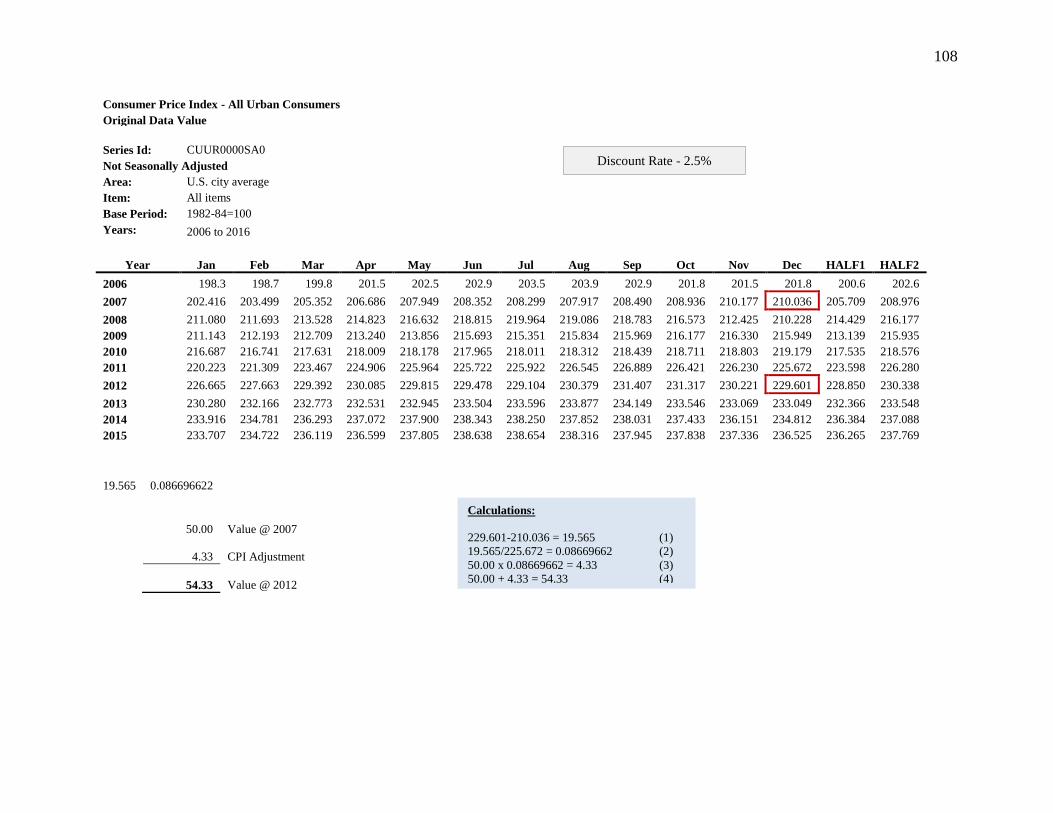
108
Consumer Price Index - All Urban Consumers
Original Data Value
Series Id: CUUR0000SA0
Not Seasonally Adjusted
Area: U.S. city average
Item: All items
Base Period: 1982-84=100
Years: 2006 to 2016
Year Jan Feb Mar Apr May Jun Jul Aug Sep Oct Nov Dec HALF1 HALF2
2006 198.3 198.7 199.8 201.5 202.5 202.9 203.5 203.9 202.9 201.8 201.5 201.8 200.6 202.6
2007 202.416 203.499 205.352 206.686 207.949 208.352 208.299 207.917 208.490 208.936 210.177 210.036 205.709 208.976
2008 211.080 211.693 213.528 214.823 216.632 218.815 219.964 219.086 218.783 216.573 212.425 210.228 214.429 216.177
2009 211.143 212.193 212.709 213.240 213.856 215.693 215.351 215.834 215.969 216.177 216.330 215.949 213.139 215.935
2010 216.687 216.741 217.631 218.009 218.178 217.965 218.011 218.312 218.439 218.711 218.803 219.179 217.535 218.576
2011 220.223 221.309 223.467 224.906 225.964 225.722 225.922 226.545 226.889 226.421 226.230 225.672 223.598 226.280
2012 226.665 227.663 229.392 230.085 229.815 229.478 229.104 230.379 231.407 231.317 230.221 229.601 228.850 230.338
2013 230.280 232.166 232.773 232.531 232.945 233.504 233.596 233.877 234.149 233.546 233.069 233.049 232.366 233.548
2014 233.916 234.781 236.293 237.072 237.900 238.343 238.250 237.852 238.031 237.433 236.151 234.812 236.384 237.088
2015 233.707 234.722 236.119 236.599 237.805 238.638 238.654 238.316 237.945 237.838 237.336 236.525 236.265 237.769
19.565 0.086696622
50.00 Value @ 2007
4.33 CPI Adjustment
54.33 Value @ 2012
Discount Rate - 2.5%
Calculations:
229.601-210.036 = 19.565 (1)
19.565/225.672 = 0.08669662 (2)
50.00 x 0.08669662 = 4.33 (3)
50.00 + 4.33 = 54.33 (4)
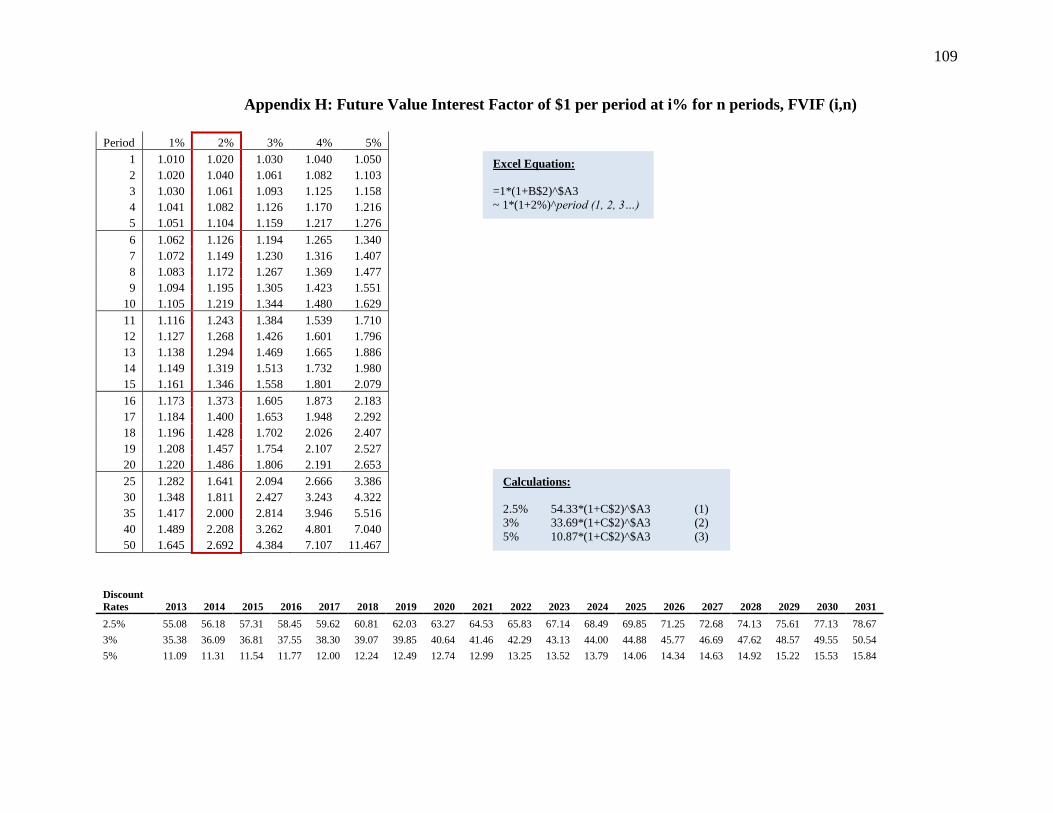
109
Appendix H: Future Value Interest Factor of $1 per period at i% for n periods, FVIF (i,n)
Period 1% 2% 3% 4% 5%
1 1.010 1.020 1.030 1.040 1.050
2 1.020 1.040 1.061 1.082 1.103
3 1.030 1.061 1.093 1.125 1.158
4 1.041 1.082 1.126 1.170 1.216
5 1.051 1.104 1.159 1.217 1.276
6 1.062 1.126 1.194 1.265 1.340
7 1.072 1.149 1.230 1.316 1.407
8 1.083 1.172 1.267 1.369 1.477
9 1.094 1.195 1.305 1.423 1.551
10 1.105 1.219 1.344 1.480 1.629
11 1.116 1.243 1.384 1.539 1.710
12 1.127 1.268 1.426 1.601 1.796
13 1.138 1.294 1.469 1.665 1.886
14 1.149 1.319 1.513 1.732 1.980
15 1.161 1.346 1.558 1.801 2.079
16 1.173 1.373 1.605 1.873 2.183
17 1.184 1.400 1.653 1.948 2.292
18 1.196 1.428 1.702 2.026 2.407
19 1.208 1.457 1.754 2.107 2.527
20 1.220 1.486 1.806 2.191 2.653
25 1.282 1.641 2.094 2.666 3.386
30 1.348 1.811 2.427 3.243 4.322
35 1.417 2.000 2.814 3.946 5.516
40 1.489 2.208 3.262 4.801 7.040
50 1.645 2.692 4.384 7.107 11.467
Discount
Rates 2013 2014 2015 2016 2017 2018 2019 2020 2021 2022 2023 2024 2025 2026 2027 2028 2029 2030 2031
2.5% 55.08 56.18 57.31 58.45 59.62 60.81 62.03 63.27 64.53 65.83 67.14 68.49 69.85 71.25 72.68 74.13 75.61 77.13 78.67
3% 35.38 36.09 36.81 37.55 38.30 39.07 39.85 40.64 41.46 42.29 43.13 44.00 44.88 45.77 46.69 47.62 48.57 49.55 50.54
5% 11.09 11.31 11.54 11.77 12.00 12.24 12.49 12.74 12.99 13.25 13.52 13.79 14.06 14.34 14.63 14.92 15.22 15.53 15.84
Excel Equation:
=1*(1+B$2)^$A3
~ 1*(1+2%)^period (1, 2, 3…)
Calculations:
2.5% 54.33*(1+C$2)^$A3 (1)
3% 33.69*(1+C$2)^$A3 (2)
5% 10.87*(1+C$2)^$A3 (3)
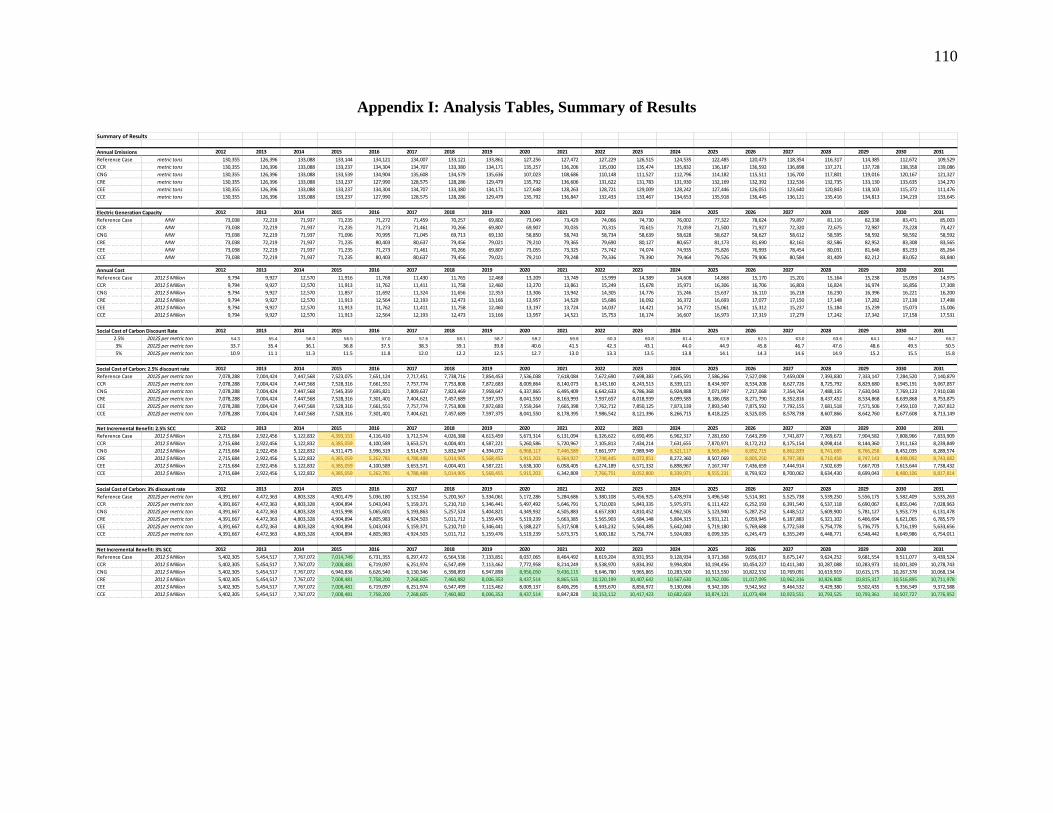
110
Appendix I: Analysis Tables, Summary of Results
Summary of Results
2012 2013 2014 2015 2016 2017 2018 2019 2020 2021 2022 2023 2024 2025 2026 2027 2028 2029 2030 2031
Reference Case metric tons 130,355 126,396 133,088 133,144 134,121 134,007 133,121 133,861 127,256 127,472 127,229 126,515 124,535 122,485 120,473 118,354 116,317 114,385 112,672 109,529
CCR metric tons 130,355 126,396 133,088 133,237 134,304 134,707 133,380 134,171 135,257 136,206 135,030 135,474 135,832 136,187 136,592 136,898 137,271 137,728 138,358 139,086
CNG metric tons 130,355 126,396 133,088 133,539 134,904 135,608 134,579 135,636 107,023 108,686 110,148 111,527 112,796 114,182 115,511 116,700 117,801 119,016 120,167 121,327
CRE metric tons 130,355 126,396 133,088 133,237 127,990 128,575 128,286 129,479 135,792 136,606 131,622 131,783 131,930 132,169 132,392 132,536 132,735 133,130 133,635 134,270
CEE metric tons 130,355 126,396 133,088 133,237 134,304 134,707 133,380 134,171 127,648 128,263 128,721 129,009 128,242 127,446 126,051 123,640 120,843 118,103 115,372 111,476
CCE metric tons 130,355 126,396 133,088 133,237 127,990 128,575 128,286 129,479 135,792 136,847 132,433 133,467 134,653 135,918 136,445 136,121 135,416 134,813 134,219 133,645
2012 2013 2014 2015 2016 2017 2018 2019 2020 2021 2022 2023 2024 2025 2026 2027 2028 2029 2030 2031
Reference Case MW 73,038 72,219 71,937 71,235 71,272 71,459 70,257 69,802 73,049 73,429 74,066 74,730 76,002 77,322 78,624 79,897 81,116 82,338 83,471 85,003
CCR MW 73,038 72,219 71,937 71,235 71,273 71,461 70,266 69,807 69,907 70,035 70,315 70,615 71,059 71,500 71,927 72,320 72,675 72,987 73,228 73,427
CNG MW 73,038 72,219 71,937 71,096 70,995 71,045 69,713 69,130 58,850 58,743 58,734 58,639 58,628 58,627 58,627 58,612 58,595 58,592 58,592 58,592
CRE MW 73,038 72,219 71,937 71,235 80,403 80,637 79,456 79,021 79,210 79,365 79,690 80,127 80,657 81,173 81,690 82,161 82,586 82,952 83,308 83,565
CEE MW 73,038 72,219 71,937 71,235 71,273 71,461 70,266 69,807 73,055 73,325 73,742 74,074 74,935 75,826 76,993 78,454 80,031 81,646 83,233 85,264
CCE MW 73,038 72,219 71,937 71,235 80,403 80,637 79,456 79,021 79,210 79,248 79,336 79,390 79,464 79,526 79,906 80,584 81,409 82,212 83,052 83,840
Annual Emissions
Electric Generation Capacity
2012 2013 2014 2015 2016 2017 2018 2019 2020 2021 2022 2023 2024 2025 2026 2027 2028 2029 2030 2031
Reference Case 2012 $ Million 9,794 9,927 12,570 11,916 11,768 11,430 11,765 12,468 13,209 13,749 13,999 14,389 14,608 14,868 15,170 15,201 15,164 15,238 15,093 14,975
CCR 2012 $ Million 9,794 9,927 12,570 11,913 11,762 11,411 11,758 12,460 13,270 13,861 15,249 15,678 15,971 16,306 16,706 16,803 16,824 16,974 16,856 17,308
CNG 2012 $ Million 9,794 9,927 12,570 11,857 11,692 11,324 11,656 12,353 13,306 13,942 14,305 14,776 15,246 15,637 16,110 16,218 16,230 16,396 16,221 16,200
CRE 2012 $ Million 9,794 9,927 12,570 11,913 12,564 12,193 12,473 13,166 13,957 14,529 15,686 16,092 16,372 16,693 17,077 17,150 17,148 17,282 17,138 17,498
CEE 2012 $ Million 9,794 9,927 12,570 11,913 11,762 11,411 11,758 12,460 13,197 13,724 14,037 14,421 14,772 15,061 15,312 15,237 15,184 15,239 15,073 15,006
CCE 2012 $ Million 9,794 9,927 12,570 11,913 12,564 12,193 12,473 13,166 13,957 14,521 15,753 16,174 16,607 16,973 17,319 17,279 17,242 17,342 17,158 17,531
Social Cost of Carbon Discount Rate 2012 2013 2014 2015 2016 2017 2018 2019 2020 2021 2022 2023 2024 2025 2026 2027 2028 2029 2030 2031
2.5% 2012$ per metric ton 54.3 55.4 56.0 56.5 57.0 57.6 58.1 58.7 59.2 59.8 60.3 60.8 61.4 61.9 62.5 63.0 63.6 64.1 64.7 65.2
3% 2012$ per metric ton 33.7 35.4 36.1 36.8 37.5 38.3 39.1 39.8 40.6 41.5 42.3 43.1 44.0 44.9 45.8 46.7 47.6 48.6 49.5 50.5
5% 2012$ per metric ton 10.9 11.1 11.3 11.5 11.8 12.0 12.2 12.5 12.7 13.0 13.3 13.5 13.8 14.1 14.3 14.6 14.9 15.2 15.5 15.8
2012 2013 2014 2015 2016 2017 2018 2019 2020 2021 2022 2023 2024 2025 2026 2027 2028 2029 2030 2031
Reference Case 2012$ per metric ton 7,078,288 7,004,424 7,447,568 7,523,075 7,651,124 7,717,451 7,738,716 7,854,453 7,536,038 7,618,084 7,672,690 7,698,383 7,645,591 7,586,266 7,527,098 7,459,009 7,393,830 7,333,147 7,284,520 7,140,879
CCR 2012$ per metric ton 7,078,288 7,004,424 7,447,568 7,528,316 7,661,551 7,757,774 7,753,808 7,872,683 8,009,864 8,140,073 8,143,160 8,243,513 8,339,121 8,434,907 8,534,208 8,627,726 8,725,792 8,829,680 8,945,191 9,067,857
CNG 2012$ per metric ton 7,078,288 7,004,424 7,447,568 7,545,359 7,695,821 7,809,637 7,823,469 7,958,647 6,337,865 6,495,409 6,642,633 6,786,368 6,924,888 7,071,997 7,217,068 7,354,764 7,488,135 7,630,043 7,769,123 7,910,038
CRE 2012$ per metric ton 7,078,288 7,004,424 7,447,568 7,528,316 7,301,401 7,404,621 7,457,689 7,597,375 8,041,550 8,163,993 7,937,657 8,018,939 8,099,585 8,186,058 8,271,790 8,352,816 8,437,452 8,534,868 8,639,868 8,753,875
CEE 2012$ per metric ton 7,078,288 7,004,424 7,447,568 7,528,316 7,661,551 7,757,774 7,753,808 7,872,683 7,559,264 7,665,398 7,762,712 7,850,125 7,873,139 7,893,540 7,875,592 7,792,155 7,681,518 7,571,506 7,459,103 7,267,812
CCE 2012$ per metric ton 7,078,288 7,004,424 7,447,568 7,528,316 7,301,401 7,404,621 7,457,689 7,597,375 8,041,550 8,178,395 7,986,542 8,121,396 8,266,715 8,418,225 8,525,035 8,578,738 8,607,866 8,642,760 8,677,608 8,713,149
Annual Cost
Social Cost of Carbon: 2.5% discount rate
2012 2013 2014 2015 2016 2017 2018 2019 2020 2021 2022 2023 2024 2025 2026 2027 2028 2029 2030 2031
Reference Case 2012 $ Million 2,715,684 2,922,456 5,122,832 4,393,153 4,116,410 3,712,574 4,026,388 4,613,459 5,673,314 6,131,094 6,326,622 6,690,495 6,962,317 7,281,650 7,643,299 7,741,877 7,769,672 7,904,582 7,808,966 7,833,909
CCR 2012 $ Million 2,715,684 2,922,456 5,122,832 4,385,059 4,100,589 3,653,571 4,004,401 4,587,221 5,260,586 5,720,967 7,105,813 7,434,214 7,631,655 7,870,971 8,172,212 8,175,154 8,098,414 8,144,360 7,911,163 8,239,849
CNG 2012 $ Million 2,715,684 2,922,456 5,122,832 4,311,475 3,996,319 3,514,571 3,832,947 4,394,072 6,968,117 7,446,589 7,661,977 7,989,949 8,321,117 8,565,494 8,892,715 8,862,839 8,741,685 8,766,258 8,452,035 8,289,574
CRE 2012 $ Million 2,715,684 2,922,456 5,122,832 4,385,059 5,262,781 4,788,488 5,014,905 5,568,455 5,915,203 6,364,927 7,748,445 8,072,851 8,272,360 8,507,069 8,805,250 8,797,383 8,710,458 8,747,143 8,498,092 8,743,682
CEE 2012 $ Million 2,715,684 2,922,456 5,122,832 4,385,059 4,100,589 3,653,571 4,004,401 4,587,221 5,638,100 6,058,405 6,274,189 6,571,332 6,898,967 7,167,747 7,436,659 7,444,914 7,502,639 7,667,703 7,613,644 7,738,432
CCE 2012 $ Million 2,715,684 2,922,456 5,122,832 4,385,059 5,262,781 4,788,488 5,014,905 5,568,455 5,915,203 6,342,809 7,766,751 8,052,800 8,339,971 8,555,231 8,793,922 8,700,062 8,634,430 8,699,043 8,480,106 8,817,814
2012 2013 2014 2015 2016 2017 2018 2019 2020 2021 2022 2023 2024 2025 2026 2027 2028 2029 2030 2031
Reference Case 2012$ per metric ton 4,391,667 4,472,363 4,803,328 4,901,479 5,036,180 5,132,554 5,200,567 5,334,061 5,172,286 5,284,686 5,380,108 5,456,925 5,478,974 5,496,548 5,514,381 5,525,738 5,539,250 5,556,175 5,582,409 5,535,263
CCR 2012$ per metric ton 4,391,667 4,472,363 4,803,328 4,904,894 5,043,043 5,159,371 5,210,710 5,346,441 5,497,492 5,646,791 5,710,003 5,843,335 5,975,971 6,111,422 6,252,193 6,391,540 6,537,118 6,690,067 6,855,046 7,028,963
CNG 2012$ per metric ton 4,391,667 4,472,363 4,803,328 4,915,998 5,065,601 5,193,863 5,257,524 5,404,821 4,349,932 4,505,883 4,657,830 4,810,452 4,962,505 5,123,940 5,287,252 5,448,512 5,609,900 5,781,127 5,953,779 6,131,478
CRE 2012$ per metric ton 4,391,667 4,472,363 4,803,328 4,904,894 4,805,983 4,924,503 5,011,712 5,159,476 5,519,239 5,663,385 5,565,903 5,684,148 5,804,315 5,931,121 6,059,945 6,187,883 6,321,102 6,466,694 6,621,065 6,785,579
CEE 2012$ per metric ton 4,391,667 4,472,363 4,803,328 4,904,894 5,043,043 5,159,371 5,210,710 5,346,441 5,188,227 5,317,508 5,443,232 5,564,485 5,642,040 5,719,180 5,769,688 5,772,538 5,754,778 5,736,775 5,716,199 5,633,656
CCE 2012$ per metric ton 4,391,667 4,472,363 4,803,328 4,904,894 4,805,983 4,924,503 5,011,712 5,159,476 5,519,239 5,673,375 5,600,182 5,756,774 5,924,083 6,099,335 6,245,473 6,355,249 6,448,771 6,548,442 6,649,986 6,754,011
2012 2013 2014 2015 2016 2017 2018 2019 2020 2021 2022 2023 2024 2025 2026 2027 2028 2029 2030 2031
Reference Case 2012 $ Million 5,402,305 5,454,517 7,767,072 7,014,749 6,731,355 6,297,472 6,564,536 7,133,851 8,037,065 8,464,492 8,619,204 8,931,953 9,128,934 9,371,368 9,656,017 9,675,147 9,624,252 9,681,554 9,511,077 9,439,524
CCR 2012 $ Million 5,402,305 5,454,517 7,767,072 7,008,481 6,719,097 6,251,974 6,547,499 7,113,462 7,772,958 8,214,249 9,538,970 9,834,392 9,994,804 10,194,456 10,454,227 10,411,340 10,287,088 10,283,973 10,001,309 10,278,743
CNG 2012 $ Million 5,402,305 5,454,517 7,767,072 6,940,836 6,626,540 6,130,346 6,398,893 6,947,898 8,956,050 9,436,115 9,646,780 9,965,865 10,283,500 10,513,550 10,822,532 10,769,091 10,619,919 10,615,175 10,267,378 10,068,134
CRE 2012 $ Million 5,402,305 5,454,517 7,767,072 7,008,481 7,758,200 7,268,605 7,460,882 8,006,353 8,437,514 8,865,535 10,120,199 10,407,642 10,567,630 10,762,006 11,017,095 10,962,316 10,826,808 10,815,317 10,516,895 10,711,978
CEE 2012 $ Million 5,402,305 5,454,517 7,767,072 7,008,481 6,719,097 6,251,974 6,547,499 7,113,462 8,009,137 8,406,295 8,593,670 8,856,972 9,130,066 9,342,106 9,542,562 9,464,532 9,429,380 9,502,435 9,356,549 9,372,588
CCE 2012 $ Million 5,402,305 5,454,517 7,767,072 7,008,481 7,758,200 7,268,605 7,460,882 8,006,353 8,437,514 8,847,828 10,153,112 10,417,423 10,682,603 10,874,121 11,073,484 10,923,551 10,793,525 10,793,361 10,507,727 10,776,952
Net Incremental Benefit: 3% SCC
Social Cost of Carbon: 3% discount rate
Net Incremental Benefit: 2.5% SCC
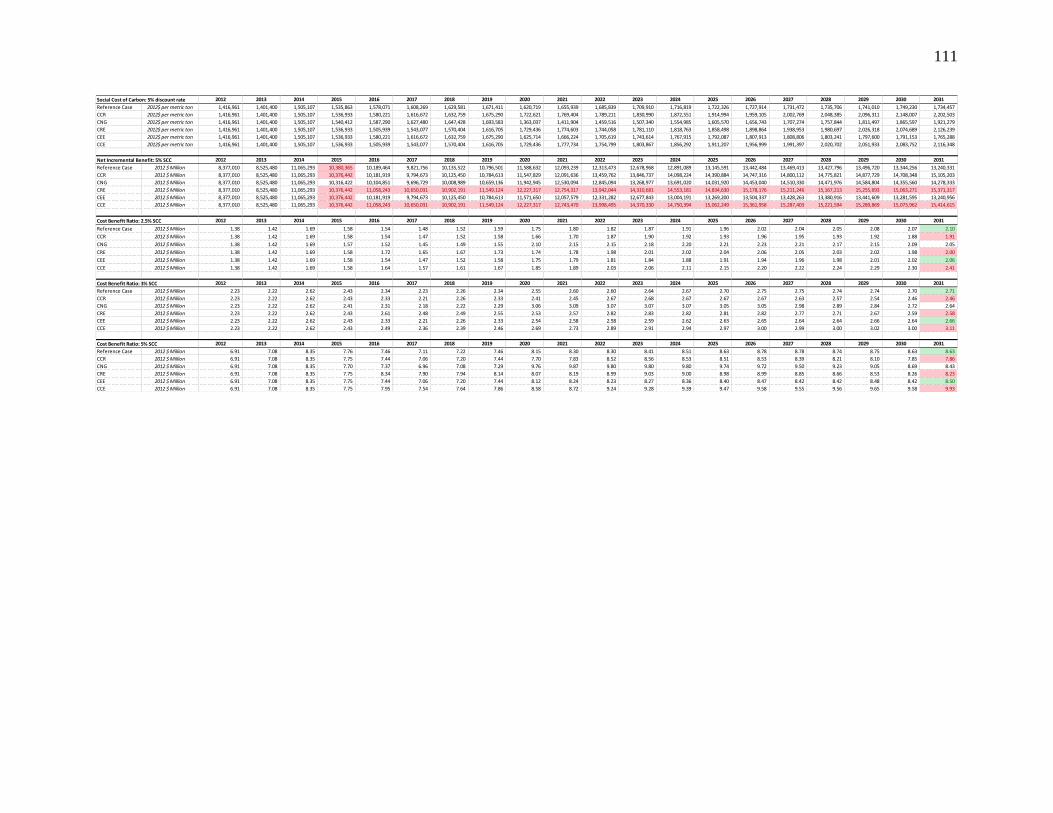
111
2012 2013 2014 2015 2016 2017 2018 2019 2020 2021 2022 2023 2024 2025 2026 2027 2028 2029 2030 2031
Reference Case 2012$ per metric ton 1,416,961 1,401,400 1,505,107 1,535,863 1,578,071 1,608,269 1,629,581 1,671,411 1,620,719 1,655,939 1,685,839 1,709,910 1,716,819 1,722,326 1,727,914 1,731,472 1,735,706 1,741,010 1,749,230 1,734,457
CCR 2012$ per metric ton 1,416,961 1,401,400 1,505,107 1,536,933 1,580,221 1,616,672 1,632,759 1,675,290 1,722,621 1,769,404 1,789,211 1,830,990 1,872,551 1,914,994 1,959,105 2,002,769 2,048,385 2,096,311 2,148,007 2,202,503
CNG 2012$ per metric ton 1,416,961 1,401,400 1,505,107 1,540,412 1,587,290 1,627,480 1,647,428 1,693,583 1,363,037 1,411,904 1,459,516 1,507,340 1,554,985 1,605,570 1,656,743 1,707,274 1,757,844 1,811,497 1,865,597 1,921,279
CRE 2012$ per metric ton 1,416,961 1,401,400 1,505,107 1,536,933 1,505,939 1,543,077 1,570,404 1,616,705 1,729,436 1,774,603 1,744,058 1,781,110 1,818,763 1,858,498 1,898,864 1,938,953 1,980,697 2,026,318 2,074,689 2,126,239
CEE 2012$ per metric ton 1,416,961 1,401,400 1,505,107 1,536,933 1,580,221 1,616,672 1,632,759 1,675,290 1,625,714 1,666,224 1,705,619 1,743,614 1,767,915 1,792,087 1,807,913 1,808,806 1,803,241 1,797,600 1,791,153 1,765,288
CCE 2012$ per metric ton 1,416,961 1,401,400 1,505,107 1,536,933 1,505,939 1,543,077 1,570,404 1,616,705 1,729,436 1,777,734 1,754,799 1,803,867 1,856,292 1,911,207 1,956,999 1,991,397 2,020,702 2,051,933 2,083,752 2,116,348
2012 2013 2014 2015 2016 2017 2018 2019 2020 2021 2022 2023 2024 2025 2026 2027 2028 2029 2030 2031
Reference Case 2012 $ Million 8,377,010 8,525,480 11,065,293 10,380,365 10,189,464 9,821,756 10,135,522 10,796,501 11,588,632 12,093,239 12,313,473 12,678,968 12,891,089 13,145,591 13,442,484 13,469,413 13,427,796 13,496,720 13,344,256 13,240,331
CCR 2012 $ Million 8,377,010 8,525,480 11,065,293 10,376,442 10,181,919 9,794,673 10,125,450 10,784,613 11,547,829 12,091,636 13,459,762 13,846,737 14,098,224 14,390,884 14,747,316 14,800,112 14,775,821 14,877,729 14,708,348 15,105,203
CNG 2012 $ Million 8,377,010 8,525,480 11,065,293 10,316,422 10,104,851 9,696,729 10,008,989 10,659,136 11,942,945 12,530,094 12,845,094 13,268,977 13,691,020 14,031,920 14,453,040 14,510,330 14,471,976 14,584,804 14,355,560 14,278,333
CRE 2012 $ Million 8,377,010 8,525,480 11,065,293 10,376,442 11,058,243 10,650,031 10,902,191 11,549,124 12,227,317 12,754,317 13,942,044 14,310,681 14,553,181 14,834,630 15,178,176 15,211,246 15,167,213 15,255,693 15,063,271 15,371,317
CEE 2012 $ Million 8,377,010 8,525,480 11,065,293 10,376,442 10,181,919 9,794,673 10,125,450 10,784,613 11,571,650 12,057,579 12,331,282 12,677,843 13,004,191 13,269,200 13,504,337 13,428,263 13,380,916 13,441,609 13,281,595 13,240,956
CCE 2012 $ Million 8,377,010 8,525,480 11,065,293 10,376,442 11,058,243 10,650,031 10,902,191 11,549,124 12,227,317 12,743,470 13,998,495 14,370,330 14,750,394 15,062,249 15,361,958 15,287,403 15,221,594 15,289,869 15,073,962 15,414,615
2012 2013 2014 2015 2016 2017 2018 2019 2020 2021 2022 2023 2024 2025 2026 2027 2028 2029 2030 2031
Reference Case 2012 $ Million 1.38 1.42 1.69 1.58 1.54 1.48 1.52 1.59 1.75 1.80 1.82 1.87 1.91 1.96 2.02 2.04 2.05 2.08 2.07 2.10
CCR 2012 $ Million 1.38 1.42 1.69 1.58 1.54 1.47 1.52 1.58 1.66 1.70 1.87 1.90 1.92 1.93 1.96 1.95 1.93 1.92 1.88 1.91
CNG 2012 $ Million 1.38 1.42 1.69 1.57 1.52 1.45 1.49 1.55 2.10 2.15 2.15 2.18 2.20 2.21 2.23 2.21 2.17 2.15 2.09 2.05
CRE 2012 $ Million 1.38 1.42 1.69 1.58 1.72 1.65 1.67 1.73 1.74 1.78 1.98 2.01 2.02 2.04 2.06 2.05 2.03 2.02 1.98 2.00
CEE 2012 $ Million 1.38 1.42 1.69 1.58 1.54 1.47 1.52 1.58 1.75 1.79 1.81 1.84 1.88 1.91 1.94 1.96 1.98 2.01 2.02 2.06
CCE 2012 $ Million 1.38 1.42 1.69 1.58 1.64 1.57 1.61 1.67 1.85 1.89 2.03 2.06 2.11 2.15 2.20 2.22 2.24 2.29 2.30 2.41
2012 2013 2014 2015 2016 2017 2018 2019 2020 2021 2022 2023 2024 2025 2026 2027 2028 2029 2030 2031
Reference Case 2012 $ Million 2.23 2.22 2.62 2.43 2.34 2.23 2.26 2.34 2.55 2.60 2.60 2.64 2.67 2.70 2.75 2.75 2.74 2.74 2.70 2.71
CCR 2012 $ Million 2.23 2.22 2.62 2.43 2.33 2.21 2.26 2.33 2.41 2.45 2.67 2.68 2.67 2.67 2.67 2.63 2.57 2.54 2.46 2.46
CNG 2012 $ Million 2.23 2.22 2.62 2.41 2.31 2.18 2.22 2.29 3.06 3.09 3.07 3.07 3.07 3.05 3.05 2.98 2.89 2.84 2.72 2.64
CRE 2012 $ Million 2.23 2.22 2.62 2.43 2.61 2.48 2.49 2.55 2.53 2.57 2.82 2.83 2.82 2.81 2.82 2.77 2.71 2.67 2.59 2.58
CEE 2012 $ Million 2.23 2.22 2.62 2.43 2.33 2.21 2.26 2.33 2.54 2.58 2.58 2.59 2.62 2.63 2.65 2.64 2.64 2.66 2.64 2.66
CCE 2012 $ Million 2.23 2.22 2.62 2.43 2.49 2.36 2.39 2.46 2.69 2.73 2.89 2.91 2.94 2.97 3.00 2.99 3.00 3.02 3.00 3.11
2012 2013 2014 2015 2016 2017 2018 2019 2020 2021 2022 2023 2024 2025 2026 2027 2028 2029 2030 2031
Reference Case 2012 $ Million 6.91 7.08 8.35 7.76 7.46 7.11 7.22 7.46 8.15 8.30 8.30 8.41 8.51 8.63 8.78 8.78 8.74 8.75 8.63 8.63
CCR 2012 $ Million 6.91 7.08 8.35 7.75 7.44 7.06 7.20 7.44 7.70 7.83 8.52 8.56 8.53 8.51 8.53 8.39 8.21 8.10 7.85 7.86
CNG 2012 $ Million 6.91 7.08 8.35 7.70 7.37 6.96 7.08 7.29 9.76 9.87 9.80 9.80 9.80 9.74 9.72 9.50 9.23 9.05 8.69 8.43
CRE 2012 $ Million 6.91 7.08 8.35 7.75 8.34 7.90 7.94 8.14 8.07 8.19 8.99 9.03 9.00 8.98 8.99 8.85 8.66 8.53 8.26 8.23
CEE 2012 $ Million 6.91 7.08 8.35 7.75 7.44 7.06 7.20 7.44 8.12 8.24 8.23 8.27 8.36 8.40 8.47 8.42 8.42 8.48 8.42 8.50
CCE 2012 $ Million 6.91 7.08 8.35 7.75 7.95 7.54 7.64 7.86 8.58 8.72 9.24 9.28 9.39 9.47 9.58 9.55 9.56 9.65 9.58 9.93
Cost Benefit Ratio: 2.5% SCC
Cost Benefit Ratio: 3% SCC
Cost Benefit Ratio: 5% SCC
Social Cost of Carbon: 5% discount rate
Net Incremental Benefit: 5% SCC
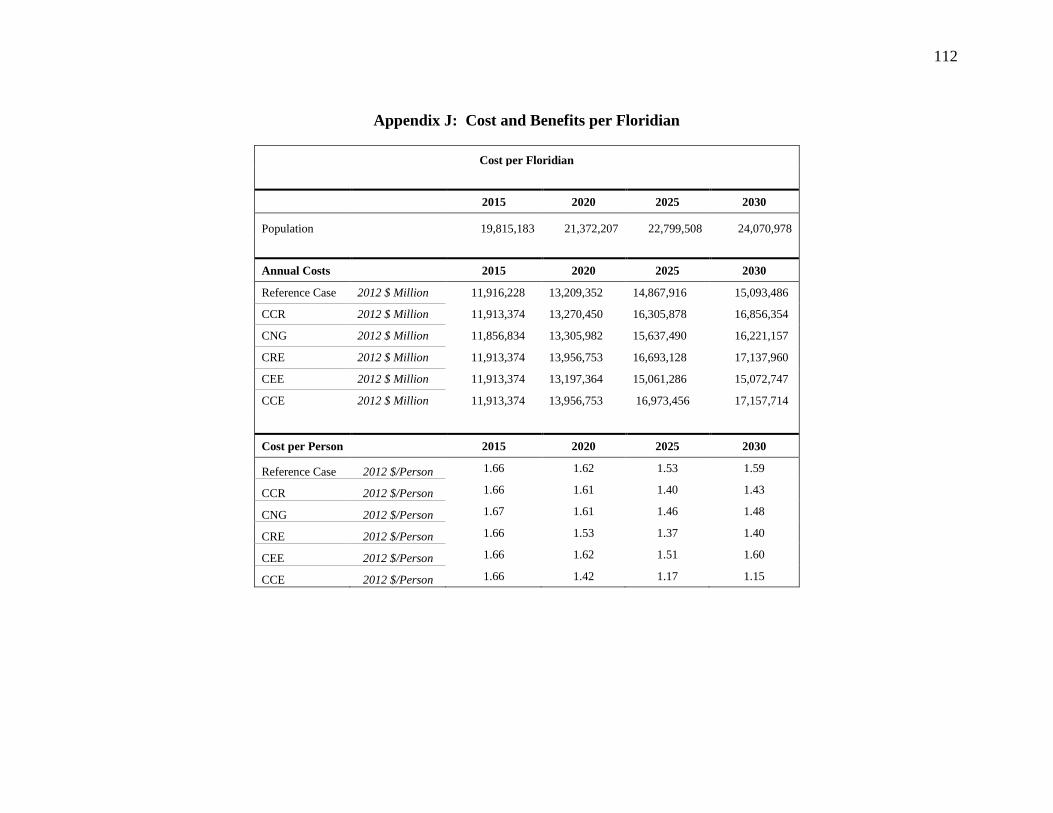
112
Appendix J: Cost and Benefits per Floridian
Cost per Floridian
2015 2020 2025 2030
Population 19,815,183 21,372,207 22,799,508 24,070,978
Annual Costs 2015 2020 2025 2030
Reference Case 2012 $ Million 11,916,228 13,209,352 14,867,916 15,093,486
CCR 2012 $ Million 11,913,374 13,270,450 16,305,878 16,856,354
CNG 2012 $ Million 11,856,834 13,305,982 15,637,490 16,221,157
CRE 2012 $ Million 11,913,374 13,956,753 16,693,128 17,137,960
CEE 2012 $ Million 11,913,374 13,197,364 15,061,286 15,072,747
CCE 2012 $ Million 11,913,374 13,956,753 16,973,456 17,157,714
Cost per Person 2015 2020 2025 2030
Reference Case 2012 $/Person 1.66 1.62 1.53 1.59
CCR 2012 $/Person 1.66 1.61 1.40 1.43
CNG 2012 $/Person 1.67 1.61 1.46 1.48
CRE 2012 $/Person 1.66 1.53 1.37 1.40
CEE 2012 $/Person 1.66 1.62 1.51 1.60
CCE 2012 $/Person 1.66 1.42 1.17 1.15
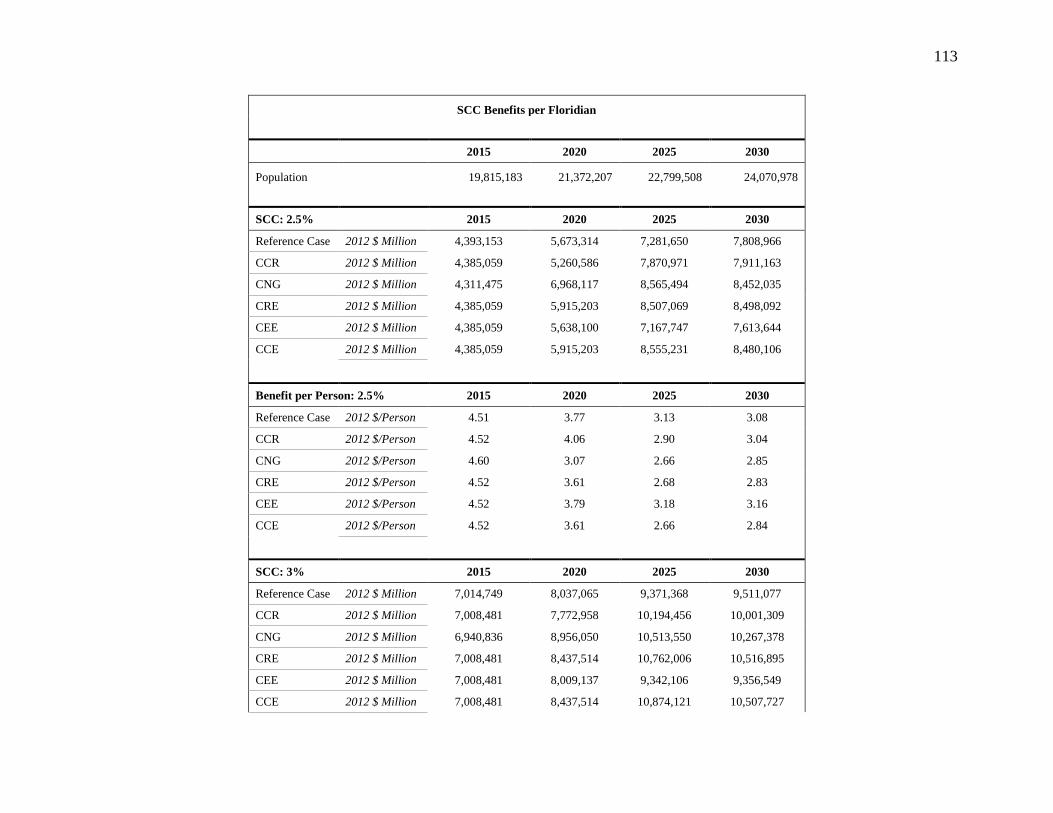
113
SCC Benefits per Floridian
2015 2020 2025 2030
Population 19,815,183 21,372,207 22,799,508 24,070,978
SCC: 2.5% 2015 2020 2025 2030
Reference Case 2012 $ Million 4,393,153 5,673,314 7,281,650 7,808,966
CCR 2012 $ Million 4,385,059 5,260,586 7,870,971 7,911,163
CNG 2012 $ Million 4,311,475 6,968,117 8,565,494 8,452,035
CRE 2012 $ Million 4,385,059 5,915,203 8,507,069 8,498,092
CEE 2012 $ Million 4,385,059 5,638,100 7,167,747 7,613,644
CCE 2012 $ Million 4,385,059 5,915,203 8,555,231 8,480,106
Benefit per Person: 2.5% 2015 2020 2025 2030
Reference Case 2012 $/Person 4.51 3.77 3.13 3.08
CCR 2012 $/Person 4.52 4.06 2.90 3.04
CNG 2012 $/Person 4.60 3.07 2.66 2.85
CRE 2012 $/Person 4.52 3.61 2.68 2.83
CEE 2012 $/Person 4.52 3.79 3.18 3.16
CCE 2012 $/Person 4.52 3.61 2.66 2.84
SCC: 3% 2015 2020 2025 2030
Reference Case 2012 $ Million 7,014,749 8,037,065 9,371,368 9,511,077
CCR 2012 $ Million 7,008,481 7,772,958 10,194,456 10,001,309
CNG 2012 $ Million 6,940,836 8,956,050 10,513,550 10,267,378
CRE 2012 $ Million 7,008,481 8,437,514 10,762,006 10,516,895
CEE 2012 $ Million 7,008,481 8,009,137 9,342,106 9,356,549
CCE 2012 $ Million 7,008,481 8,437,514 10,874,121 10,507,727
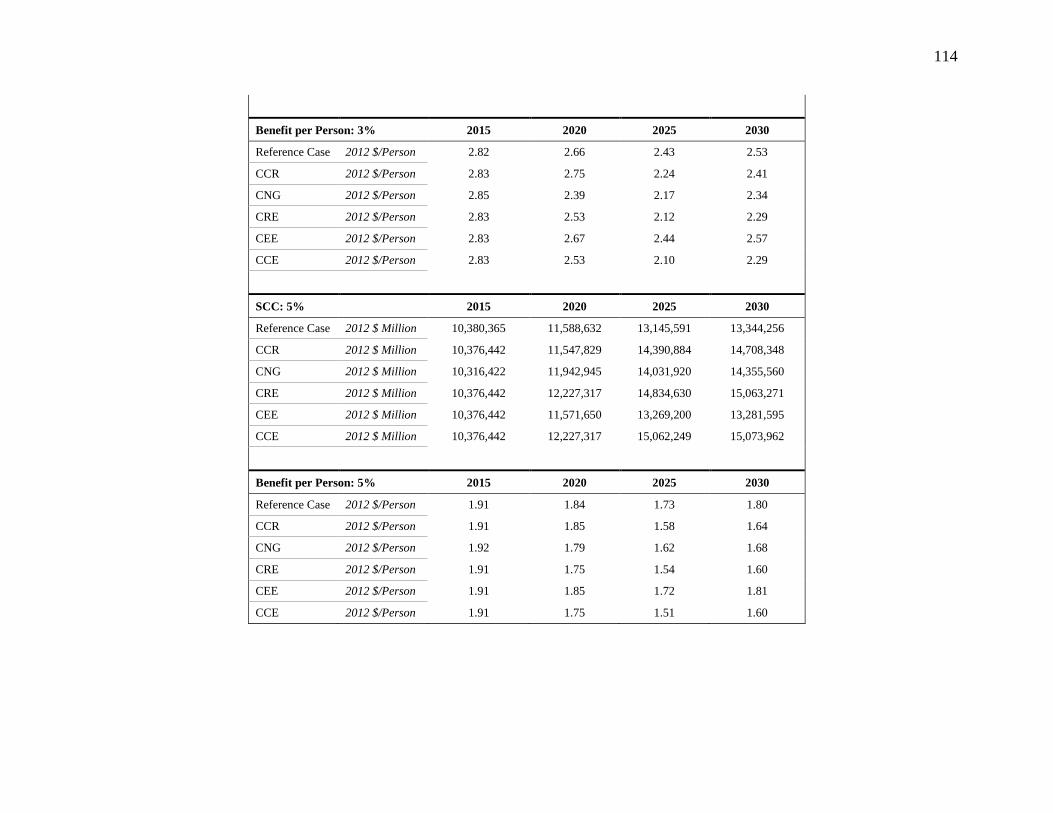
114
Benefit per Person: 3% 2015 2020 2025 2030
Reference Case 2012 $/Person 2.82 2.66 2.43 2.53
CCR 2012 $/Person 2.83 2.75 2.24 2.41
CNG 2012 $/Person 2.85 2.39 2.17 2.34
CRE 2012 $/Person 2.83 2.53 2.12 2.29
CEE 2012 $/Person 2.83 2.67 2.44 2.57
CCE 2012 $/Person 2.83 2.53 2.10 2.29
SCC: 5% 2015 2020 2025 2030
Reference Case 2012 $ Million 10,380,365 11,588,632 13,145,591 13,344,256
CCR 2012 $ Million 10,376,442 11,547,829 14,390,884 14,708,348
CNG 2012 $ Million 10,316,422 11,942,945 14,031,920 14,355,560
CRE 2012 $ Million 10,376,442 12,227,317 14,834,630 15,063,271
CEE 2012 $ Million 10,376,442 11,571,650 13,269,200 13,281,595
CCE 2012 $ Million 10,376,442 12,227,317 15,062,249 15,073,962
Benefit per Person: 5% 2015 2020 2025 2030
Reference Case 2012 $/Person 1.91 1.84 1.73 1.80
CCR 2012 $/Person 1.91 1.85 1.58 1.64
CNG 2012 $/Person 1.92 1.79 1.62 1.68
CRE 2012 $/Person 1.91 1.75 1.54 1.60
CEE 2012 $/Person 1.91 1.85 1.72 1.81
CCE 2012 $/Person 1.91 1.75 1.51 1.60