Embed Size (px)
Citation preview

2 2 5 / S MART W AT ER MANAGEMENT PROJECT
Thailand (Chao Praya Basin)
Tanzania, Kenya, Uganda, Rwanda and Burundi (Lake Victoria Basin)
Benin, Burkina Faso, Côte d’Ivoire, Ghana, Mali and Togo (Volta Basin)
Flood and Drought Management Tools
Case Study
Heather Bond1
Katharine Cross2
Raul Glotzbach2
Bertrand Richaud3
1. International Water Resources Association (IWRA), 2. International Water Association (IWA), 3. DHI

226 / SMART WATER M A NAG E M E NT PR OJ E CT 227 / SMART WATER MANAGEMENT PROJECT
Summary
The high prevalence and severe impacts of flood and drought events on water resources, human communities and ecosystems demonstrate the need for building resilience against such events. Inadequate access to climate, hydrological and other data required for effective decision-making has left communities and organisations unable to properly prepare and plan appropriate management techniques as a method of protection.
To address this need and enhance capabilities for planning for extreme weather events, a smart water management (SWM) approach was initiated: the Flood and Drought Management Tools (FDMT) project. The project is funded by the Global Environment Facility (GEF) under its International Waters (IW) portfolio, and is being implemented by UN Environment and jointly executed by DHI and the International Water Association (IWA). Its objective is to improve the ability of water managers in transboundary river basins to recognize and address the impli-cations of the increased frequency, magnitude, and unpredictability of flood and drought events arising from climate variability and change. Planning approaches supported by the project include Transboundary Diagnostic Analysis/Strategic Action Programme (TDA/SAP), Integrated Water Resources Management (IWRM), and Water Safety Planning (WSP) processes. The project is developing a methodology to support water utilities and basin organisations, involving web-based technical applications to share data and planning tools with stakeholders in their basins.
The Flood and Drought Portal (www.flooddroughtmonitor.com) is the main output of the project and has a series of technical applications supporting stakeholders to carry out baseline assessments using readily available satellite data, impact assessments through the analysis of the data, planning options and a means for disseminating information to relevant groups or individuals. Within the Portal, there is a data and information tool which provides near real-time satellite based data related to determining floods and drought, seasonal and medium range climate forecasts, climate change projections and information relevant for basin and local planning. Other applications hosted on the Flood and Drought Portal include water indicators, drought assessments, water safety planning, issue analysis, and reporting. Each application or tool can be applied individually or together to include information about floods, droughts and future scenarios. The applications in the Portal support planning across scales from the water utility to transboundary basin level, enabling both water basin authorities and local water utilities, which supply drinking water to citizens, to be better prepared and equipped for extreme weather events.
The methodology and tools have been developed to have a global approach to flood and drought planning, which can then be applied to local settings around the world, and three pilot locations affected by extreme weather challenges were selected to develop, test and validate the FDMT methodology. The FDMT project was implemented from 2014-2018 in the Chao Phraya Basin (Thailand), Lake Victoria Basin (East Africa) and Volta Basin (West Africa). Further to the near real-time SWM tools used within the FDMT project, implementation of the project was assisted through capacity building, stakeholder engagement and information dissemination. Stakeholders in the pilot basins, including basin authorities and water utilities, were consulted regularly over the course of the project, including technical training workshops and stakeholder feedback throughout the project. The pilot basins participated in testing and provided feedback to support development of the applications in the Portal. The Portal already has users from 42 transboundary basins from across six continents who have access to the tools and satellite data required to support their short- and long-term planning and management for flooding and droughts.
CASE STUDIES FLOOD AND DROUGHT MANAGEMENT TOOLS CASE STUDY
Table of Contents
Summary 2271. Background 228
1.1 Chao Phraya Basin 2291.2 Lake Victoria Basin 2321.3 Volta Basin 234
2. Water challenge 2372.1 Floods and Drought 2372.2 Data Availability and Sharing 2392.3 Previous Solutions 240
3. SWM Solution 2413.1 The Flood and Drought Portal 2433.2 Applications 2443.3 Capacity Building and Communications 2583.4 Project Stages 2623.5 Project Inputs 2623.6 Enablers 2653.7 Barriers 2683.8 Achievements and Impacts 269
4. Links to the SDGs 2725. Lessons Learned 2746. Conclusion and Next Steps 276
6.1 Future of the Project 276
References 278

228 / SMART WATER M A NAG E M E NT PR OJ E CT 229 / SMART WATER MANAGEMENT PROJECT
This case study provides an overview of the FDMT project, beginning with a background and context of the pilot basins and water challenges that they face. Following this, the SWM solu-tion, the Flood and Drought Management Tools, is illustrated, including project elements such as capacity building, inputs, enablers and barriers. The case study finishes with a discussion on how the project and its impacts are tied into the SDG’s and lessons that can be drawn from the FDMT project experience.
1. Background
The FDMT project responds to a growing sense of urgency around the need to improve resil-ience within river basins, and for this to become a critical part of water management plans. Consequently, the International Waters (IW) focal area of the GEF has identified the increased frequency and unpredictability of floods and droughts as a priority concern in transboundary contexts, along with the other multiple drivers that cause depletion and degradation of shared water resources.
Based on these issues, the project was designed to develop a methodology for basins, which uses SWM tools and decision support systems (DSS) that will allow the access and integration of information on floods and droughts. The DSS has been tested and applied in 3 different pilot basins; however it will be available for all other GEF IW basins. This includes training modules available at the end of the project to ensure that methods can be applied to other basins.
The 3 basins chosen as pilots include the Chao Phraya basin in Thailand, the Lake Victoria basin in eastern Africa and the Volta basin in western Africa (see Figure 1). The selection of these three basins was made on the basis of their environmental, social and economic conditions, the transboundary nature of their basins, and their varying degrees of technical capacity in each region. Furthermore, it was beneficial that the executing organisations (IWA and DHI) already had previously established regional knowledge and networks with local stakeholders in these three basins.
In addition to the three pilot locations, the FDMT project draws from experiences within two ‘learning basins’, the Nile and Danube basins. In these learning basins, collaborations with water management authorities enable IWA and DHI to share and develop the methodology and tools with organisations that have previous experience with flood and drought planning tools. Although the experience from the learning basins was important for developing the FDMT methodology, it is not further documented within this case study.
Expanding further, the FDMT approach strives to have global implications for all trans-boundary basins. This global approach prompts the need for a flexible methodology that ensures that these SWM tools will be available and relevant for stakeholders within any transboundary basin.
C ASE STU DIES FLO O D AND D RO UGH T MANAGE ME NT TOOLS CASE STUDY
Figure 1. Global map outlining the three pilot basins involved in the FDMT project. Source: http://fdmt.iwlearn.org/
The following sections outline the context of each of the three basin pilot studies.
1.1 Chao Phraya Basin
Countries within basin: ThailandCatchment area: 160,400 km2
Population: 30 000 000Urban population: 32%Dominant language: Thai
The Chao Phraya River Basin is an important basin in Thailand as it contains 30% of the country’s land mass and 40% of the population, including the capital city, Bangkok. Bangkok is located at the delta of the Chao Phraya River (see Figure 2) and contains half of the basin’s population, generating almost 80% of the basin’s GDP. This basin was selected due to the rapid pace of its development, economic global importance and its persistent drought and flood events. Despite not being a transboundary basin, there are important lessons to learn in relation to cross departmental agencies (there are more than 30 government agencies dealing with water).
CASE STUDIES FLOOD AND DROUGHT MANAGEMENT TOOLS CASE STUDY

230 / SMART WATER M A NAG E M E NT PR OJ E CT 231 / SMART WATER MANAGEMENT PROJECT
Figure 2. Map of the Chao Phraya basin in Thailand, with the capital and largest city, Bangkok, located at the southern point. Source: GEF IW:LEARN 2016c.
Climate and Hydrology in the Chao Phraya basin
• Seasonal monsoon winds contribute to the high seasonal variability of rainfall in the basin, with the mean rainfall during the rainy season (May – October) contributing 90% of the total annual rainfall.
• For agricultural practices to survive during the dry period, more than 3000 dams have been constructed in the basin over recent years. The two largest dams control 22% of the runoff from the basin and many barrages divert off the main channel for irrigation schemes.
• The northern region of the basin has higher temperatures due to its tropic latitude and inland location, while the south has generally milder temperatures.
• Water service facilities provide domestic water in urban areas, while groundwater wells serve rural communities.
C ASE STU DIES FLO O D AND D RO UGH T MANAGE ME NT TOOLS CASE STUDY
Within this context, the basin faces numerous socio-environmental problems. Agricultural lands cover 90% of the basin, concentrated in the southern region, which has undergone inten-sification causing encroachment of forested regions as well as soil erosion and sedimentation. This reduction in forest cover is detrimental to the land’s ability to retain water, increasing the risks of flash floods and landslides.
Unsustainable groundwater extraction, especially in Bangkok for industrial purposes, has created an annual sinking rate of 10cm of the land the city sits upon. This sinking phenomenon will continue to grow into a greater issue of concern in the future as climate change generates sea level rises and larger waves hit the coastal region. The sea level rise is already underway, with stronger waves, coupled with upstream dams depositing less sediment along the river-mouth, contributing to significant coastal erosion.
Additionally, solid waste and untreated wastewater released from Bangkok and other highly populated areas are leading to the basin’s poor surface water quality and watershed degra-dation. This impacts the ecosystems there, contributing to the loss of native species and the health of people living in proximity to these polluted water bodies.
Key Stakeholders
BASIN ORGANISATIONHydro and Agro Informatics Institute (HAII)
WATER UTILITIES Metropolitan Waterworks Authority (MWA), Provincial Waterworks Authority (PWA)
ADDITIONAL WATER RESOURCE AGENCIES Office of the Natural Resources and Environmental Policy and Planning (ONEP), Royal Irrigation Department (RID), Electricity Generating Authority of Thailand (EGAT), Thailand Meteorological Department (TMD)
To aid in the management of these issues, several institutions exist in the Chao Phraya basin. National committees and boards develop policies for water resource management and conser-vation, namely the National Economic and Social Development Board, the National Environ-ment Board and the National Water Resources Committee. Energy production, including hydropower generation is managed by the Electricity Generating Authority of Thailand (EGAT). There are a number of different committees linking stakeholders and deciding how water is allocated for different uses. The Royal Irrigation Department (RID) also works with EGAT to direct water allocation planning in the basin, especially during the dry season. In 2017, the Office of National Water Resources (ONWR) was established and is in charge of setting overall water management policies and has the final say in allocation of water. Two water author-ities oversee potable water supply; the Metropolitan Waterworks Authority (MWA) works in Bangkok Metropolitan, with the Provincial Waterworks Authority (PWA) operating outside the Metropolitan limits. Within this institutional landscape, there is a strong need for collaboration between stakeholders, in particular around sharing data and information.
Regarding technical capabilities, the stakeholder organisations in the project engaged with in the Chao Phraya basin have a good degree of capability to manage and interpret data needed for planning. EGAT has strong technical capabilities with respect to modelling of water
CASE STUDIES FLOOD AND DROUGHT MANAGEMENT TOOLS CASE STUDY

232 / SMART WATER M A NAG E M E NT PR OJ E CT 233 / SMART WATER MANAGEMENT PROJECT
level, and the Hydro and Agro Informatics Institute (HAII) has extensive experience with real time data, modelling, data integration in the country and Decision Support Systems (DSS). Furthermore, the Thai Meteorological Department (TMD) and Geo-Informatics and Space Technology Development Agency (GISTDA) are involved in climate modelling and forecasting from remote sensing and satellite data. At the local level, the capabilities of the water utilities are different, where the use of climate data varies depending on priorities. There is therefore an opportunity to build the capacity of water utilities particularly around interpreting the information and integrating this in the management and planning of water resources for water service provision.
1.2 Lake Victoria Basin
Countries within basin: Tanzania, Kenya, Uganda, Rwanda and BurundiCatchment area: 251,000 km2
Population: 35 000 000Urban population: 32%Dominant language: English
This lake basin, located in eastern Africa upstream of the Nile basin, is shared among five coun-tries, Tanzania, Kenya, Uganda, Rwanda and Burundi, with the greatest proportion located in Tanzania (see Figure 3). Lake Victoria itself covers a significant portion of the basin, 68,800 km2, making it the largest freshwater lake in Africa, and second largest in the world. The FDMT project concentrates primarily on Kenya, Uganda and Tanzania in this pilot, as these countries when combined cover 80% of the catchment, however, indirect links to Burundi and Rwanda are also made through the basin authority.
Climate and Hydrology in the Lake Victoria basin
• The climate in the basin is equatorial: hot and humid, with bi-modal rainfall patterns.
• Long rains dominate the March – May season and short rains from October – December.
• The greatest input to the lake derives from precipitation and as such, climatic variations in recent years have caused large changes in the water levels.
• Other hydrological contributions come from the several rivers flowing into Lake Victoria, the most notable of which is the Kagera River which contributes 33% of the total inflow.
C ASE STU DIES FLO O D AND D RO UGH T MANAGE ME NT TOOLS CASE STUDY
Figure 3. Map of the Lake Victoria basin, displaying the coverage in Tanzania (44%), Kenya (22%), Uganda (16%), Rwanda (11%) and Burundi (7%). Source: GEF IW:LEARN 2016b.
The climate and water supplied by Lake Victoria have provided favourable conditions for agricul-ture, fishing and other economic activities, which in turn have contributed to the high population density of the Lake Victoria basin. With an average of more than 500 people/km2 and as much as 1200 people/km2, it is one of the most densely populated regions of the world (Tong et al. 2016). Most of the population lives in rural areas and small towns, but in recent years there has been a shift towards urbanisation. Among this population, there is a dependence on natural resources, with agriculture and fisheries being the most substantial livelihoods.
Rapid urbanisation and resource mismanagement have contributed to the many environ-mental issues within the basin, including pollution, biodiversity loss, habitat destruction and soil erosion. Rivers flowing to the lake carry high amounts of silt and nutrients from agriculture processes and untreated wastewater, causing severe eutrophication and dead zones which are unable to sustain life in parts of the lake. Growth of the commercial fishery industry has also significantly contributed to the lake’s ecosystem deterioration, with an 80% reduction in indigenous fish species. Furthermore, land cover changes have resulted in a 70% reduction of the original forest cover in the basin.
Key Stakeholders
BASIN ORGANISATION Lake Victoria Basin Commission (LVBC)
WATER UTILITIES Kisumu Water and Sewerage Company (KIWASCO), National Water and Sewerage Corporation-Jinja (NWSC-Jinja), Mwanza Urban Water and Sewerage Authority (MWAUWASA)
CASE STUDIES FLOOD AND DROUGHT MANAGEMENT TOOLS CASE STUDY
234 / SMART WATER M A NAG E M E NT PR OJ E CT 235 / SMART WATER MANAGEMENT PROJECT
In response to the many environmental concerns within the basin, a few local institutions promote the need for improved water resource management and provide general supervision and co-ordination on all matters relating to the environment. The key basin-level organisa-tion that coordinates sustainable development within the region is the Lake Victoria Basin Commission (LVBC), established in 2005. LVBC is a specialised institution of the East Africa Community (EAC) that developed from the EAC’s Lake Victoria Development Programme (LVDP), a mechanism established in 2001 to coordinate various interventions in the Lake Victoria Basin region and to turn the Basin into an economic growth zone. Within each member state (Tanzania, Kenya, Uganda, Rwanda and Burundi), the LVBC has National Focal Points who are responsible for coordinating national initiatives related to the Basin. There is also coordi-nation between the Member States and the LVDP. The National Focal Points are the main links between the LVDP and the Member States, and are responsible for coordinating and harmo-nizing the activities related to the Lake Victoria Basin conducted by the various Ministries in the Member States, NGOs, special interest groups and other development partners. National ministries contributing to these issues are, for example, the Kenyan and Ugandan National Environment Management Authorities (NEMA) and the National Environment Management Council (NEMC) in Tanzania.
1.3 Volta Basin
Countries within basin: Benin, Burkina Faso, Côte d’Ivoire, Ghana, Mali and TogoCatchment area: 407,093 km2
Population: 23 000 000Urban population: 30%Dominant language: French
The third pilot basin within the FDMT project, the Volta basin, is located within western Africa and is shared among six countries: Benin, Burkina Faso, Côte d’Ivoire, Ghana, Mali and Togo. The FDMT project focuses on Burkina Faso and Ghana, which occupy approximately 85% of the basin, while the remaining countries in the basin are indirectly engaged through the basin authority, the Volta Basin Authority.
Climate and Hydrology in the Volta basin
• Climate is within the sub-humid to semi-arid West-African savannah zone.
• Rainfall patterns are seasonal, with large year to year variability, especially in the northern parts of the basin.
• Further inland of the basin, the aridity increases, the growing season becomes shorter and rainfall is more erratic.
• Potential evaporation rates are very high, especially in the north of the basin, with temperatures as high as 44°C.
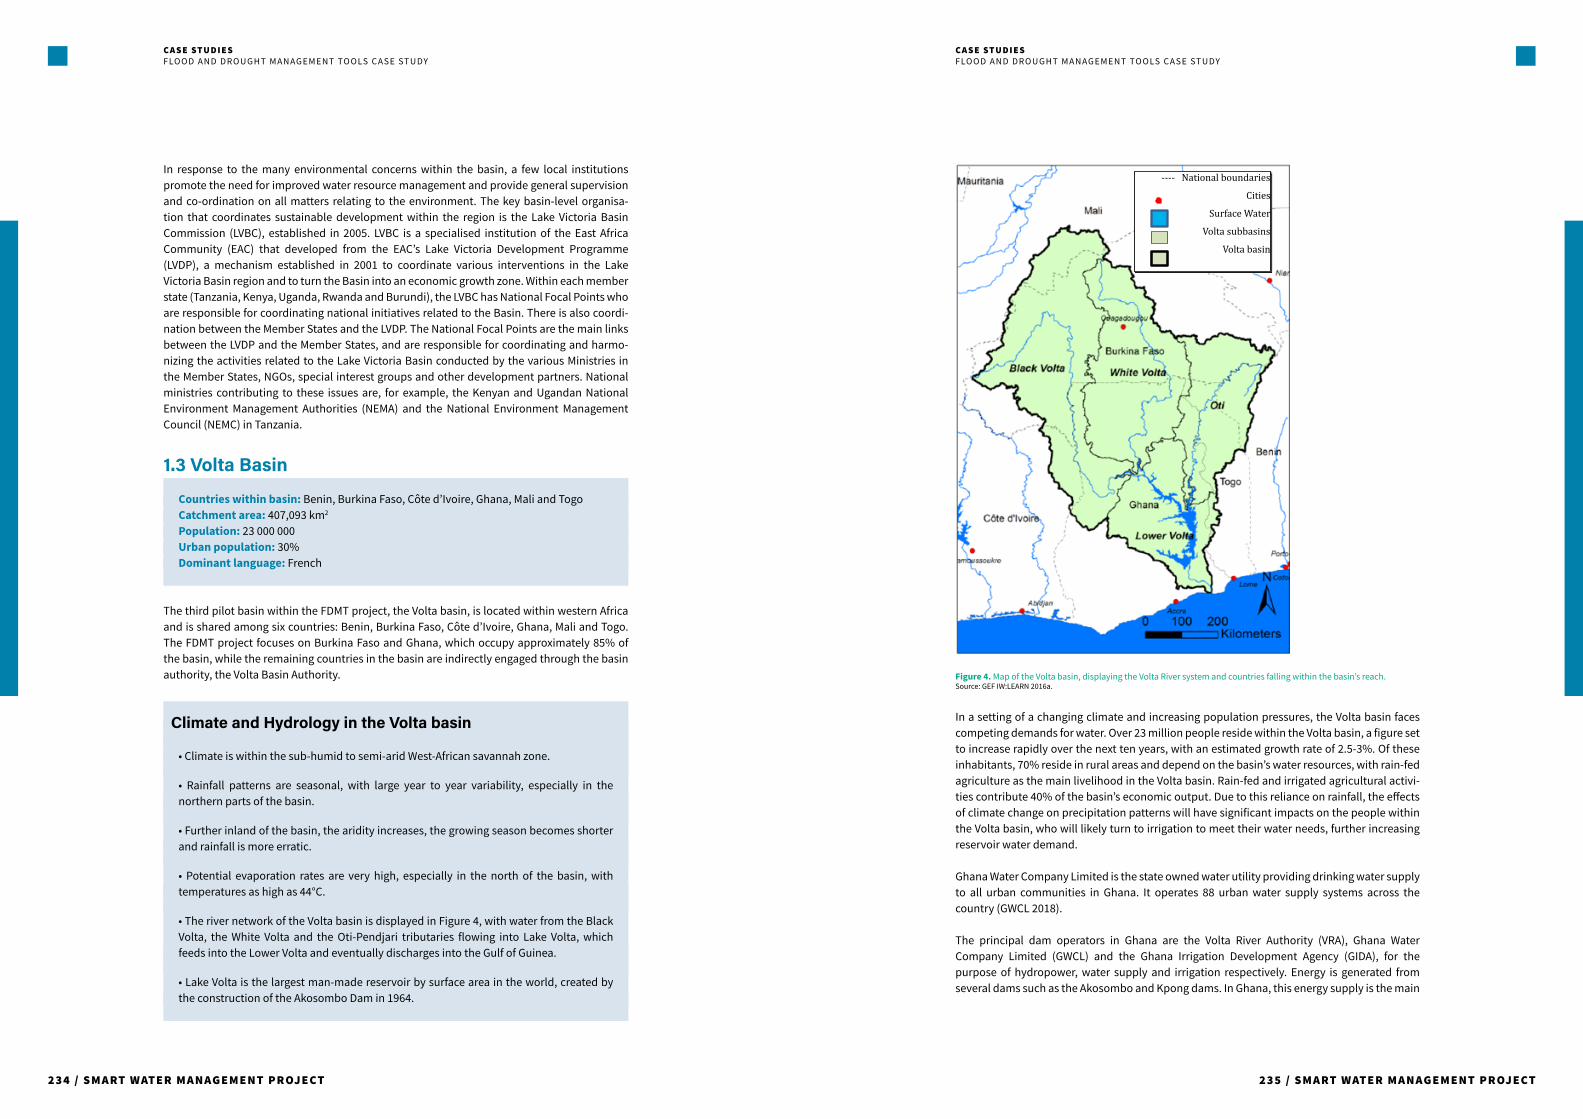
• The river network of the Volta basin is displayed in Figure 4, with water from the Black Volta, the White Volta and the Oti-Pendjari tributaries flowing into Lake Volta, which feeds into the Lower Volta and eventually discharges into the Gulf of Guinea.
• Lake Volta is the largest man-made reservoir by surface area in the world, created by the construction of the Akosombo Dam in 1964.
C ASE STU DIES FLO O D AND D RO UGH T MANAGE ME NT TOOLS CASE STUDY
---- National boundaries
Cities
Surface Water
Volta subbasins
Volta basin
Figure 4. Map of the Volta basin, displaying the Volta River system and countries falling within the basin’s reach. Source: GEF IW:LEARN 2016a.
In a setting of a changing climate and increasing population pressures, the Volta basin faces competing demands for water. Over 23 million people reside within the Volta basin, a figure set to increase rapidly over the next ten years, with an estimated growth rate of 2.5-3%. Of these inhabitants, 70% reside in rural areas and depend on the basin’s water resources, with rain-fed agriculture as the main livelihood in the Volta basin. Rain-fed and irrigated agricultural activi-ties contribute 40% of the basin’s economic output. Due to this reliance on rainfall, the effects of climate change on precipitation patterns will have significant impacts on the people within the Volta basin, who will likely turn to irrigation to meet their water needs, further increasing reservoir water demand.
Ghana Water Company Limited is the state owned water utility providing drinking water supply to all urban communities in Ghana. It operates 88 urban water supply systems across the country (GWCL 2018).
The principal dam operators in Ghana are the Volta River Authority (VRA), Ghana Water Company Limited (GWCL) and the Ghana Irrigation Development Agency (GIDA), for the purpose of hydropower, water supply and irrigation respectively. Energy is generated from several dams such as the Akosombo and Kpong dams. In Ghana, this energy supply is the main
CASE STUDIES FLOOD AND DROUGHT MANAGEMENT TOOLS CASE STUDY

236 / SMART WATER M A NAG E M E NT PR OJ E CT 237 / SMART WATER MANAGEMENT PROJECT
contributor for power production, for example the Akosombo dam supplies 70% of its power needs, and hydropower supports major industries in the region, such as mining and aluminium production (World Bank 2015). For continual power production from these sources, the dams require dependable annual inflow, stored within the Lake Volta, with the greatest amount of replenishment deriving from run-off (World Bank 2015). Industries as well as municipalities require water supplies to promote economic growth and development, elements that are key to helping one of the poorest regions of the world (Ndehedehe 2016).
In Ouagdougou, Burkina Faso, drinking water is supplied by the Ziga Dam. Ziga Dam is oper-ated by the National Office for Water and Sanitation (ONEA), providing about 70% of domestic water supply to Ouagadougou, the main urban centre and capital of Burkina Faso. With the extension of the dam in 2016, it was projected that ONEA can maintain a sufficient water supply to the city of Ouagadougou at least until 2030 based on projected population growth and climate change. The capacity of the dam is designed to withstand a 2 year drought, and is also an important buffer during high rainfall events to prevent downstream flooding. The Bagré Dam, located near Bagré Village in the south of Burkina Faso, is a multi-purpose dam constructed in 1992. Before the expansion of the dam in 2014, seasonal spilling of the dam contributed to severe flooding in northern Ghana. The impact demonstrated the importance of close cooperation between Burkina Faso and Ghana to provide sufficient warning of planned spills of the Bagré Dam.
Key Stakeholders
BASIN ORGANISATION Volta Basin Authority (VBA)
WATER UTILITIES Ghana Water Company Limited (GWCL), National Office for Water and Sanitation (ONEA)
ADDITIONAL WATER RESOURCE AGENCIES Water Resources Commission (WRC) – Ghana Agence de l’ Eau – Burkina Faso
Until recently, the Volta basin lacked basin-wide coordination to help address the many challenges across the five basin countries. Across the different countries within the Volta basin, policies are complex and lack coordination, with the different government agen-cies involved. The VBA, as well as catchment organisations under relevant national water agencies, attempt to bridge national water policies and give an overall view of the water resource management within the basin. All the basin states are committed to Integrated Water Resources Management (IWRM), however major differences in management and insti-tution-building styles are an obstacle to basin-wide cooperation.
Compared to the other two pilot basins of the FDMT project, the Volta basin is limited by institutional and technical capacity, and presents a challenge to overcome these limitations. However, it should be noted that the Chao Phraya basin may have fewer, yet different chal-lenges due to its non-transboundary nature which requires less institutional coordination.
C ASE STU DIES FLO O D AND D RO UGH T MANAGE ME NT TOOLS CASE STUDY
2. Water challenge
2.1 Floods and DroughtFloods and droughts can challenge a water system as they are at the extremes of what is normally expected. Extreme weather events, including floods and drought, are an increasing concern in the Chao Phraya, Lake Victoria and Volta basins. Many drivers contribute to these events, including the changing climate, population growth, increasing demand for water and other resources, changing land use and urbanisation. These factors have increased the prevalence and risk of droughts and floods in southeast Asia and Africa over the last several decades (Pongpiachan et al. 2012, Kundzewicz et al. 2014). The descriptions below outline the specific situations in each of the three pilot basins.
2.1.1 Chao Phraya (Thailand)The Chao Phraya basin endures frequent flood disasters due to the combined reduction of flood retention areas and flood plains to make way for increased development, rapid urban-isation and the intensification of agriculture practices. Furthermore, Bangkok is prone to inundation because of its low elevation relative to the nearby sea, the land subsidence from groundwater abstraction and the filling in of khlongs (urban canals).
This basin experiences a variety of floods, including: • general flooding (unusual presence of water on normally dry land), • river flooding (overflowing rivers), • ocean flooding (inflow of sea water onto land) and • flash flooding (heavy rainfall during a short period of time) (Pongpiachan et al. 2012).
Severe flash floods, which occur regularly, impact the capital city during the rainy season, and in 2011, severe floods triggered by a tropical storm lasted for more than five months (Pongpiachan et al. 2012). The floods during the 2011 monsoon season had drastic impacts, inundating large parts of Bangkok (see Figure 5) and 20 000 km2 of farmland, affecting over 13 million people and causing more than 800 deaths. Analysis of this extreme flooding event has shown that there is an increasing potential for future similar floods, with the sea level rise in the Gulf of Thailand likely to prolong the duration of such events (Promchote, 2016). The researchers conducting this study recommended progressive monitoring of pre- monsoon and monsoon onset rainfall, soil moisture, and sea level height in the basin (Promchote, 2016). This monitoring would allow water managers in the basin to better anticipate the characteristics of future flood events as well as to manage timing and volume of water from reservoirs in order to mitigate the flood impacts.
CASE STUDIES FLOOD AND DROUGHT MANAGEMENT TOOLS CASE STUDY

238 / SMART WATER M A NAG E M E NT PR OJ E CT 239 / SMART WATER MANAGEMENT PROJECT
Figure 5. Bangkok highways inundated in 2011 during the largest flood in recent history in the region. Source: http://www.mowe-it.eu/wordpress/thailands-strategy/
Previously, floods have been controlled by the government of Thailand through grey infra-structure, such as the construction of multi-purpose reservoirs and dikes, to contain flood-waters. This method has been successful in reducing the impacts of flooding events through reducing their extent, however the infrastructure is expensive and flood water might rise faster than with no infrastructure, increasing the overall flood risk. Further projects to better manage floods were initiated by the Thai government following the 2011 disasters, including the construction of larger flood ways, flood barriers, reservoirs, and a better data management system (Jikkham & Wipatayotin 2014).
On the other end of the spectrum, very little rain falls during the dry season (from November to April) in the Chao Phraya basin due to the seasonality of Thailand’s climate, making droughts a regular occurrence as well. They are especially problematic in causing saltwater intrusion in the Chao Phraya River, when the rainwater and dam flows are not sufficient to keep the salt-water from the Gulf of Thailand from entering the river. A significant reduction in dry season rainfall in 2015 meant that Bangkok struggled to provide water to its residents, asking farmers to refrain from irrigation of rice patties and causing large losses in agricultural production that season (Tang 2015).
The government of Thailand is now developing strategic plans to act as guidelines for proper water management for the next 20 years (Apipattanavis et al. 2018). The plans take economic, social and environmental issues into consideration and include (i) integrated water resource management; (ii) government policies and the national economic and social development plan; and (iii) the United Nation's Sustainable Development Goals (Apipattanavis et al. 2018).
C ASE STU DIES FLO O D AND D RO UGH T MANAGE ME NT TOOLS CASE STUDY
2.1.2 Lake VictoriaSimilarly, the Lake Victoria basin faces continual threats from serious floods and drought, with most rainy seasons resulting in at least one flood event. River flooding is the predomi-nant type of flood event in Kenya (Gichere et al. 2013) and in recent years, changes in rainfall and temperature weather patterns have increased the number and severity of floods and dry seasons in the whole basin. The water level within Lake Victoria has experienced great fluctu-ations in the last century due to irregular seasonal and annual rainfall, with implications for water users at the source of the basin and downstream.
Precipitation pattern changes in the basin cause more intense and unpredictable flooding, and drought events not only affect the availability of water resources, but also the health of aquatic ecosystem and the main socio-economic activities in the basin. Major reductions in food production, availability of water and ability to generate hydroelectric power are the conse-quences of drought events in the Lake Victoria basin. Flood disasters have their own troubling impacts in the basin, including the displacement of people, increqsed disease prevalence, and the loss of properties, livelihoods, and in extreme cases, life.
With the risks and hydrological uncertainty created from more common occurrences of extreme weather events, managing resources in this region becomes increasingly difficult. This challenge for management is magnified in a transboundary river basin of five countries, where there is competition for water resources and different systems for monitoring and managing these resources.
2.1.3 VoltaFinally, like the other two pilot basins, floods and droughts are also a prevalent occurrence in the Volta basin, especially in recent years. Ghana has the highest risk of water related hazards among the Volta basin countries, particularly in the north of the country. Major floods in northern Ghana over the past 25 years have caused the destruction of thousands of hectares of farmland, and a serious flood in 2007 caused the death of 56 people, affecting more than 300 000 others.
The upper and mid regions of the basin, including Burkina Faso, experience droughts on a regular basis. These droughts negatively affect food production and other agricultural prod-ucts, as the rainfall and reservoirs for irrigated agriculture cannot meet the needs during periods of water scarcity. In addition, during these periods of water scarcity, the hydropower production potential from the Askombo dam is significantly decreased. This has serious impacts for the people of Ghana, who rely on this hydropower for much of their electricity needs. Severe droughts in 2006 and 2007 meant major energy shortages to several industrial sectors in Ghana, thus affecting the region’s economic stability and potentially reducing foreign investments by investors who do not wish to risk the likelihood of an unsteady energy source.
Increasing changes in the climate further threatens the stability of the climate in the Volta basin. The predicted negative impacts of climate change in the basin include increasing temperature, reduced rainfall and reduced availability of water, water quality deterioration, reduced hydro-power production, spread of water-related diseases and increased poverty.
2.2 Data Availability and SharingThe severity of these extreme weather challenges highlights the urgency to improve the ability to recognise and address flood and drought risks as well as to improve resilience and cooper-ation within river basins and amongst end-users. Basin authorities, water utilities and other regional stakeholders need to cooperate to make adequate short- and long-term plans based
CASE STUDIES FLOOD AND DROUGHT MANAGEMENT TOOLS CASE STUDY
240 / SMART WATER M A NAG E M E NT PR OJ E CT 241 / SMART WATER MANAGEMENT PROJECT
on sound data (Pongpiachan et al. 2012). This recognition leads to the second problem that exists across the three pilot basins; the lack of data; and where data exists, lack of access, as well as poor technical and planning capabilities to be able to forecast and prepare for floods and droughts.
Across the three pilot basins, varying degrees of data availability, sharing and ability to inter-pret information exist. In the Chao Phraya basin, a significant level of data and programs exist including climate, hydrological and geophysical data as well as decision support systems to address issues such as flooding, however there are still challenges with sharing that data across different stakeholders, specifically the large number of government agencies. Mean-while in the Volta and Lake Victoria basins, there is limited data available for authorities and water utilities to use. Historical data sets are minimal, and often data that exists is not reliable due to limited resources to validate it. In addition, the limited resources of basin authorities hinder the capacity to fully engage in projects such as the FDMT, particularly in the Volta and Lake Victoria regions. These restrictions in the two African basins also reflect the situation in many other developing countries.
While a data sharing protocol does exist in the Lake Victoria Basin, designed to improve data availability between basin countries, local stakeholders have found that this protocol is not useful for sharing data and is not functioning as its intended purpose. A stronger protocol or a different method for collecting and distributing data is necessary for water utilities and basin organisations in the Lake Victoria region to access and use the information required for plan-ning for droughts and floods.
2.3 Previous SolutionsTwo projects in the Chao Phraya basin have worked on the potential to improve data and management for flood and drought planning. The Integrated Study on Hydro-Meteorolog-ical Prediction and Adaptation to Climate Change in Thailand (IMPAC-T) project was initiated in 2009 by universities in Thailand and Japan, with support from the Japanese Science and Technology Research Partnership for Sustainable Development. It bridges sectors, including academia, funding agencies and operational authorities, to enhance observation data, develop integrated water resource simulation models and better understand climate change (Davis et al. 2015). It concluded in 2014 and is continued by the new project, Advancing co- Design of integrated Strategies with Adaptation to Climate Change in Thailand (ADAP-T), which promotes dialog between government, citizens, and other stakeholders to construct an adaptation strategy to climate change impacts such as floods and droughts (IMPAC-T 2016).
In addition to these initiatives, the Development of Climate and Disaster Risk Assessment and Application of Risk Information in Development Planning in Thailand (THPRA) project was implemented in two provinces of the basin from 2015-2016. Supported by the United Nations Development Programme and several Thai national agencies, it produced a user-friendly guideline for conducting climate and disaster risk assessments.
In the Lake Victoria basin, there have been several programs established to address water problems, but few to address flooding and drought directly. Key examples of large projects underway in the region are the Lake Victoria Environmental Management Program, aimed at addressing environmental degradation, as well as the Lake Victoria Water Supply and Sanita-tion Programme and USAID Sustainable Water and Sanitation in Africa projects, both focused on improving the delivery of water supplies and health of people in the basin.
Several external organisations have programs operating in the Volta Basin to improve institu-tional capacity for transboundary water management. These organisations, such as the Agence
C ASE STU DIES FLO O D AND D RO UGH T MANAGE ME NT TOOLS CASE STUDY
Française de Développement (AFD), African Development Bank (AfDB) and the Global Environ-ment Facility (GEF), work to promote stakeholder communication and consultation in the Volta basin, as well as helping to collect and share hydrological data. Efforts have been put in place to re-inforce the hydrometric network in the Volta basin. A Hydrological Information System on the water resources of the basin is being established under the Volta-HYCOS project which started in 2006. The West African Science Service Center on Climate Change and Adapted Land Use (WASCAL), funded by the German Federal Ministry of Education and Research (BMBF), is a large-scale, research-focused Climate Service Centre designed to help tackle climate change related challenges and enhance the resilience of human and environmental systems to the increased climate variability. WASCAL collects a large amount of data, and stores them on an online public data-exchange platform on the WASCAL Data Infrastructure, to facilitate the acquisition, management and exchange of data resources.
Despite the current projects operating in these basins, there is still a clear need for a data sharing tool with management instruments to assist in the planning for and management of flood and drought events in these basins.
3. SWM Solution
Building on the previous projects listed above to address the challenges of flood and drought risks in the pilot basins as well as providing a generic solution that can be applied in any trans-boundary basin, the Flood and Drought Management Tools project proposes a new method-ology. The FDMT methodology uses a collection of SWM applications to provide stakeholders in transboundary basins with a package of resources to support short-term (operational) and long-term (strategic) planning. The applications are essentially components of an online Deci-sion Support System (DSS); the Flood and Drought Portal, to support robust risk planning and analysis processes in transboundary basins, improving preparations and resilience for extreme weather events.
The project developed technical tools to support flood and drought planning processes which, previously, may not have fully exploited the information available. The project also aimed to develop an approach and tools that work both on a transboundary level and the local level. GEF International Waters projects have planning methods which focus at the transboundary level. However, decisions made at the regional level (basin) and the local level need to be linked to plans at a larger scale. The project will address this aspect of inter-level communica-tion by providing tools for both scales within a single DSS.
The FDMT project provides climate and water related data and planning applications at different scales to support the baseline and impact assessments. The DSS, in the form of the Flood and Drought Portal, facilitates the inclusion of information about floods, droughts and future scenarios into short- and long-term planning activities based on the predefined processes outlined in Table 1. The types of planning supported include the processes devel-oped by the GEF – TDA and SAP, as well as general IWRM at the basin level and WSP at the utility level. Another aspect of the FDMT project is using an approach that works both at the transboundary and local level. As such, IWRM is used at the basin level to support planning of WSP at the local (water utility) level.
CASE STUDIES FLOOD AND DROUGHT MANAGEMENT TOOLS CASE STUDY

242 / SMART WATER M A NAG E M E NT PR OJ E CT 243 / SMART WATER MANAGEMENT PROJECT
Table 1. The planning and management processes supported by the FDMT applications.
Process Name Acronym Description
Transboundary Diagnostic Analysis
TDA A tool developed by GEF IW to address environmental problems that are transboundary in nature through identifying, quantifying and setting priorities, using the best available scientific evidence.
Strategic Action Programmes
SAP Builds on the priority threats identified in the TDA process, to outline the actions needed to resolve these threats, specifically in transboundary waters.
Integrated Water Resources Management
IWRM A process of planning that integrates the management of several inter-related aspects, including water, land and other related resources for improved sustainability of these resources.
Water Safety Plans WSP An approach to mitigate risks through using comprehensive risk assessments that address health related risks and provide an analysis of all steps in the water supply from catchment to consumer.
The technical applications can be used individually or together to create one integrated workflow area in an online platform, that is available to basin organisations and local users, including water utilities to inform their respective planning approaches (see Figure 6). The online Portal is the entry point for end users to access data and information from models, indi-cators and planning approaches to support planning and resilience building against floods and droughts in the basins.
It is recognised that stakeholders and users require the appropriate capacity to be willing and able to interpret technical data and different planning techniques, such as the SWM solutions presented by the FDMT project. As such, an important aspect of the FDMT methodology is also around capacity building, user engagement and information dissemination. This involves working with stakeholders to build tools that are most relevant to them, training users in how to interpret data and use such tools as well as integrating the technical tools into their existing planning practices. As part of this step in the project, consultations and training sessions with stakeholders in the three pilot basins took place, allowing input from basin and local stake-holders into the methodology and tools. This is an important aspect of the FDMT project as it contributes to the long-term sustainability of the project outputs and continuation of the tools after the project’s initial four-year timeline is complete.
C ASE STU DIES FLO O D AND D RO UGH T MANAGE ME NT TOOLS CASE STUDY
Figure 6. Infographic depicting the integration and inputs to the FDMT tools, to support different types of planning. Source: FDMT Project Factsheet (2015)
3.1 The Flood and Drought PortalBased on stakeholder consultations, understanding the needs and challenges described previ-ously, and the need to support existing planning approaches described in Table 1, the FDMT project is providing relevant tools through an online Portal, called the Flood and Drought Portal. The Portal is the principal entry point for users to access all data and technical appli-cations in one easy-to-use interface. It is versatile in that each application can be used indi-vidually or all together, applied to any global context and provides a means to disseminate information to relevant groups. Figure 7 shows the home screen of the Portal, which can be accessed at http://www.flooddroughtmonitor.com/home. The Flood and Drought Portal is free to access and is openly accessible for anyone online, with the only requirement being the need to register an account and to select one of the available basins as your working basin. Instructions and videos have been created to help users go through the registration process, which are available via the project website at http://fdmt.iwlearn.org.
CASE STUDIES FLOOD AND DROUGHT MANAGEMENT TOOLS CASE STUDY

244 / SMART WATER M A NAG E M E NT PR OJ E CT 245 / SMART WATER MANAGEMENT PROJECT
Figure 7. Home screen of the Flood and Drought Portal used within this project. Source: http://www.flooddroughtmonitor.com/home.
3.2 ApplicationsThe Portal contains a number of distinct applications and over the course of the project, addi-tional applications will be added based on stakeholder input/feedback. The first of these applications, the Data and Information tool, supplies specific information regarding climate and water related data for each basin. The other applications do not provide the data itself, but rather inputs and structure for planning frameworks and templates that can be used by water managers in any basin. Figure 8 displays the list of applications, as it appears online. This section outlines a short description of each of these tools.
Figure 8. The menu screen of the Flood and Drought Portal, displaying the eight main applications and their uses. Source: http://www.flooddroughtmonitor.com/home
C ASE STU DIES FLO O D AND D RO UGH T MANAGE ME NT TOOLS CASE STUDY
3.2.1 Data and Information The first tool presented by the FDMT project is the data and information application. Within this application, basin-specific information is available to users as GIS layers and time series. This information relates to data in Table 2, from the following topics and sources:
• Climate - TRMM, CHIRPS, CRU, GPM, PERSIANN rainfall- Temperature and PET- Flood index and combined drought index
• Forecast and climate change- Seasonal and 2-week forecast (NOAA)- Climate change (CORDEX)
• Vegetation and soil moisture - NDVI - Soil Water Index - Agricultural stress index
• Water levels in lakes and reservoirs- JASON data
• Physical and Socioeconomic data- Population - Urban expansion - Flood risk
Table 2. Available data in the data and information application of FDMT.
Climate Vegetation Soil moistureSocio-
economic
Drought and Flood Indicators
Key input for environmental assessment
• Historic• Near real time• Forecast• Projection
Impact on agricultural sector
• Crop distribution and crop growth• Historic• Near real time
Water availability
• Drought assessment• Flood risk• Historic• Near real time
Socio-economic impact
• Static data• Historic• Future
Hazard assessment
• Statistical measure providing a clear indication of a state
The tool makes up a basic data set of spatially distributed information needed to produce a baseline assessment, available as near real time satellite data (approximately 48 hours), short term and seasonal forecast data for up to nine months in advance, and climate projections. Furthermore, users have the ability to download data as raster files into a commonly used netcdf or csv format, which is compatible with most GIS tools.
The FDMT project does not itself generate the climate data, but rather collects it from other sources (e.g. NASA: https://lpdaac.usgs.gov/dataset_discovery, Copernicus(ESA): http://land.copernicus.eu/, NOAA: https://www.ncdc.noaa.gov/data-access) and processes the infor-mation before making it available in the application and relevant for decision making. As mentioned in the previous section, there is limited access to data, particularly in the African pilot basins, prompting a need to provide a basic set of data. As such, the data provided in the application originates from global and freely available data sets and, satellite based informa-tion. Accessing satellite data allows the inclusion of other transboundary basins within the FDMT methodology. The process for making data available within FDMT includes acquiring,
CASE STUDIES FLOOD AND DROUGHT MANAGEMENT TOOLS CASE STUDY

246 / SMART WATER M A NAG E M E NT PR OJ E CT 247 / SMART WATER MANAGEMENT PROJECT
managing and processing the data by DHI. Quality assurance of the data sets and conversions to the appropriate file type and spatial region happen during this data processing, before being pushed to the web-server. While real time data was not deemed necessary to meet the objec-tives of the project, near real-time data was seen as critical for assessment and identification of drought and flood hazards. One of the criteria for this type of data selection was the ability to retrieve and process the data in as close to real time as possible.
Within the data and information application of the Portal, users view a map of the focus area (basin) which the user selected during the registration process, over which the selected data layers are displayed. The application contains a list of all available data types, each with a corresponding description box available when the data type is selected. This description briefly explains the information and provides the original source link. For data which derives from satellites, the description box also includes the spatial and temporal resolution, satellite name, as well as dates and scope of coverage. A more detailed description of available data sources can be found within the user guide for the data and information application.
Once users have chosen the data they would like to work with in the application, these data sets are available for viewing and analysis. Spatial data can be overlaid on the focus area map for specific dates and using a legend of colours to depict values related to that data type. Figure 9 gives an example of the display of the rainfall (TRMM) data set, showing the spatial spread in the Chao Phraya basin for 25 July 2017. The tool operates on different spatial resolutions, producing area weighted time series for the entire basin, the user location, subarea layers and point locations.
Figure 9. Screenshot of the data and information application displaying a sample of available data, and information box for selected data set. Source: Jessen & Cross, 2018.
After data selection, there are different options for processing and analysing such data in the application. Depending on the data type, the information can be accessed using tables or plotted onto charts for time series across several time frames or as envelope or column plots. Figure 10 gives an example of a time series plot for monthly rainfall in the Volta basin in 2017. The data and information application also includes a variety of flood and drought indices to determine the current and forecasted hazards. For example, the combined drought index is composed of three warning levels (watch, warning and alert) by integrating three drought indicators: standardised precipitation index (SPI), soil moisture and remotely sensed vegetation data.
C ASE STU DIES FLO O D AND D RO UGH T MANAGE ME NT TOOLS CASE STUDY
Figure 10. Screenshot of the output from the time series tool of the data and information application, displaying a monthly rainfall plot for the Volta basin from CHIRPS. This could be useful as a medium term drought forecasting application. Source: http://www.flooddroughtmonitor.com/home
Finally, a document menu of the data and information application lists and gives access to relevant reports. The documents can be fact sheets with more information on specific data types, videos showing the temporal and spatial change of a data type, custom made drought reports or other documents associated with the specific focus area.
3.2.2 Flood and Drought AssessmentsBoth the flood and drought assessment applications establish prediction and early warning systems as part of a proactive risk management process, through identifying current and upcoming hazards as well as their associated level of risk. The main objective of these applica-tions is to detect when and if a drought or flood hazard might occur, along with the location, and severity of this hazard.
The procedure for completing a flood and drought risk assessment begins with determining the location and timing of a flood or drought event, followed by quantifying how the area and sectors exposed to this hazard will be impacted. After the impact assessment, a vulnerability analysis examines the causes behind the drought or flood impact and the priority of these causes. Vulnerability analysis provides the means for interventions or mitigation measures to be targeted specifically against the underlying causes for the drought or flood impacts. While the flood and drought assessment applications function similarly, they are slightly different. The drought assessment application provides warning and risk analysis, whereas the flood assessment application mainly focuses on selected datasets and indicators as well as a rainfall runoff model to predict extreme events.
Hazard identification is the first step users are prompted to complete within the drought assessment application. Identification uses different types of indices to detect the location and timing of hazards. Drought indices cover the entire spectrum of drought types: meteorolog-ical, agricultural and hydrological drought. In the drought assessment application, a warning menu allows users to choose from drought and rainfall indices which are layered over the
CASE STUDIES FLOOD AND DROUGHT MANAGEMENT TOOLS CASE STUDY

248 / SMART WATER M A NAG E M E NT PR OJ E CT 249 / SMART WATER MANAGEMENT PROJECT
basin map, with an adjustable threshold value set by the user that highlights the areas affected by a specific hazard (see Figure 11). An information dialogue box can be opened for each index, describing the data set, its source, coverage dates and calculation, if applicable. This warning application is important for supporting the detection of upcoming drought events across the basin.
Figure 11. Screenshot for the drought assessment application, showing the available warning indices, threshold value and warning legend for ‘Days since rain’ index in the Volta basin. Source: http://www.flooddroughtmonitor.com/home
The other key tool within the drought assessment application is the risk menu, which has an interface for impact assessment and vulnerability analysis for the identified drought hazards. The main output of this page is a map with overlaid hazard and vulnerability values (see Figure 12). The vulnerability tool supports the understanding of exposure to the hazard through layering raster files of sensitive regions over the hazard graphics. Areas are particu-larly sensitive and exposed to drought events through impacts such as reduced crop yield, livestock losses, socioeconomic impacts or reservoir depletion. This is assessed in the applica-tion by delineating areas that rely on rainfed irrigation or urban areas relying on surface water resources. The risk assessment uses the combination of the hazard and vulnerability elements, as risk is often expressed as hazard x vulnerability. This risk analysis identifies areas or groups at different risk levels, which will then be the targets for adaptation or mitigation planning.
C ASE STU DIES FLO O D AND D RO UGH T MANAGE ME NT TOOLS CASE STUDY
Figure 12. Screenshot of the drought assessment application for ‘Days since rain’ risk and ‘Crop mask’ vulnerability in the Volta basin. Source: http://www.flooddroughtmonitor.com/home
Similarly, the flood assessment application supports detection of flood events through providing flood indices and risk assessment tools. These indices are also overlaid on the basin map and are based on data from flash flood potential index, rainfall measurements, global surface water, and medium range rainfall forecasts (see Figure 13). Other tools within the flood assessment application are the creation of charts and tables using the indices and a rainfall runoff function that has the ability to show historic and future runoff, evapotrans-piration, recharge and rainfall. An analysis tool for rainfall runoff is also available within the flood assessment application, where users are able to run simulations of rainfall runoff using climate data within the application, based on the NAM hydrological model.
Figure 13. Screenshot of the flood assessment application for ‘Flash Flood Potential Index’ with the information box, data layered over the Volta basin map and legend. Source: http://www.flooddroughtmonitor.com/home
CASE STUDIES FLOOD AND DROUGHT MANAGEMENT TOOLS CASE STUDY

250 / SMART WATER M A NAG E M E NT PR OJ E CT 251 / SMART WATER MANAGEMENT PROJECT
3.2.3 Issue Analysis The issue analysis application is designed to identify and analyse key environmental issues affecting water resources in a region. The application also examines and evaluates the causes behind associated impacts of each environmental issue based on the Causal Chain Analysis (CCA), a method using an ordered sequence of events linking a problem’s causes to its effects (see Figure 14). After the identification of issues and causes, a rapid assessment prioritises the issues according to the level of severity. This is based on the Water Resource Issues Assessment Method (WRIAM), a process which provides an evaluation of a given issue, a value which can be used for comparison with other issues and a record that can be re-assessed in the future. Ultimately the issue analysis application assists users in understanding the deeper causes contributing to environmental issues such as droughts and floods, and in assessing the severity of each problem, so that they can shape their planning activities accordingly.
Figure 14. Main components of a Causal Chain Analysis. Source: http://www.flooddroughtmonitor.com/home
To begin use of the issue analysis tool, users add an environmental issue, such as water quan-tity and seasonal flows, then characterise this issue. Characterisation of the issue is according to defined parameters including its immediate impact, as well as the immediate, underlying and root causes. The remaining parameters fall into two groups of assessment criteria (see Table 3) and are scored by a numerical value according to the standard definitions from WRIAM. The overall assessment score is calculated by multiplying the results of both groups together. This score relates to an assessment level of the severity of the issue, from no importance to slight, moderate, significant and major negative impact. Figure 15 displays a screenshot of an example of assessment scores for impacts of the environmental issue ‘water quantity and seasonal flows’. This assessment can then be used to compare issues and make decisions as to which issues need the most immediate management attention.
Table 3. WRIAM assessment criteria used to score a given issue in the issue analysis application.
Description Group A Criteria related to the importance of the issue or effect, and which can individually change the score obtained considerably.
Group B Criteria that are of value to the given situation, but individually have a lesser effect on the score obtained.
Spatial extent (A1)Seriousness of impact (A2)
Permanence (B1)Irreversibility (B2)Cumulative Character (B3)
Group result At = (A1) x (A2) Bt = (B1) + (B2) + (B3)
Overall score At x Bt
C ASE STU DIES FLO O D AND D RO UGH T MANAGE ME NT TOOLS CASE STUDY
Figure 15. Example of an issue analysis for ‘Water quantity and seasonal flows’, showing the main functionality within the issue analysis application. Source: http://www.flooddroughtmonitor.com/home
3.2.4 Water Indicator The water indicator application can be used to select indicators for measuring the state of specific issues. It is a library of indicators which can also be set with a user defined framework to shape topics with all the data needed for planning. There are several default frameworks with a selection of indicators which can be used to help shape an IWRM plan, or a framework for water utilities needing to monitor upstream risk.
Indicators monitor the current state or the pressure of a specific issue, through providing the status of a parameter. The indicators and platform for displaying this information in the tool help users better understand the current state of water resources in their region, the changes in these resources and whether interventions produce the desired effect.
Overall, the water indicator application is a learning tool for basin or catchment users and provides the following specific support:
• Assists users in selecting relevant indicators based on a specific issue • Provides a starting point through a default indicator framework that can be adjusted
and complemented to match user needs • Provides an online tool for stakeholders to share their indicator frameworks with others
to allow for consistency • Used as a tool for storing indicator information to support management and planning
The indicators and the indicator framework are the two key ingredients in this application, which holds a library of indicators, each with a detailed description in a pdf metadata sheet. In the tool, when an indicator is selected, an information box provides a description and keywords (see Figure 16), with the metadata sheet which includes the main group category, the purpose of such an indicator, the policy relevance, its usage and interpretation, calcula-tion instructions, data outputs and sources. The tool also allows users to search within the library and add new indicators. As of early 2018, more than 100 indicators have been input into the application. Examples of existing indicators include climate data such as rainfall index, monthly average changes in temperature, groundwater levels, climate moisture index, to social- economic data including social water stress index, mobile phone access and popula-tions served by wastewater services.
CASE STUDIES FLOOD AND DROUGHT MANAGEMENT TOOLS CASE STUDY

252 / SMART WATER M A NAG E M E NT PR OJ E CT 253 / SMART WATER MANAGEMENT PROJECT
It should be noted that the indicator metadata sheets were derived from the River Basin component of the Transboundary Water Assessment Programme, also funded by GEF IW.
Figure 16. The information box for an example indicator, Climate Moisture Index, within the Water Indicator tool of the Flood and Drought Portal. Source: http://www.flooddroughtmonitor.com/home
Building on the list of indicators, a framework applies these indicators to monitor the state of specific issues. As mentioned above there are several frameworks targeted at specific topics, with default options of river basin planning, flood, drought and water utility. Each of these frameworks contains grouped indicators, forming a tabular description that depicts the links between the issue and their respective indicators. Once the framework topic is selected in the application, there are main- and sub-group indicators, under which lists of all the indicators that apply to that category are shown. Figure 17 displays an example framework for drought.
Another feature of the water indicator tool is that it is possible to view the various issues and the causes behind these as entered into the issue analysis application. A user can then add indicators from the indicator list or a framework for the immediate impact, immediate cause, underlying cause and root cause.
This water indicator tool provides a template and resource for water managers at the basin and local scale to monitor the most relevant data types for a specific issue, such as floods and droughts.
C ASE STU DIES FLO O D AND D RO UGH T MANAGE ME NT TOOLS CASE STUDY
Figure 17. Example of a template Indicator Framework for drought, depicted by a screenshot from the water indicator application. Main indicator groups are numbered in blue, sub-group indicators are in orange and the indicators themselves are listed underneath in grey. Source: http://www.flooddroughtmonitor.com/home
3.2.5 Basin PlanningThe basin planning application uses the refined water resources model and planning tools to support the evaluation of various plans, targeted at decision makers without any modelling expertise. The tool begins by providing a baseline model plan of the specific water basin, previ-ously established in the backend of the Portal. Users can create new plans on top of this base-line using a combination of identified and clearly defined investments and external factors (see Figure 18). Each plan or scenario is represented by a series of these inputs to the model.
Figure 18. Components and concept of the basin planning application (left) and screenshot of the investment types within the application (right). Source: http://www.flooddroughtmonitor.com/home
Once the scenario model with the input factors is executed, the available indicators are calculated, the results are stored, and an email is sent to the user when the plan is available. Users can evaluate the resulting outputs of this plan through reviewing the indicator values, presented as tables, charts and on the basin map. Currently available indicators include
CASE STUDIES FLOOD AND DROUGHT MANAGEMENT TOOLS CASE STUDY

254 / SMART WATER M A NAG E M E NT PR OJ E CT 255 / SMART WATER MANAGEMENT PROJECT
annual energy production produced by hydropower schemes (GWh), annual reliability of water supply as the magnitude given a certain demand (m3/s), or as a fraction of demand supplied at a chosen level of probability of exceedance (%), groundwater sustainability index, net present profit value, reservoir status and reservoir status probability. Based on this information, the user is able to create strategies with weighting systems attributed to indicators expressing different policy and strategic focuses. These strategies allow a comprehensive evaluation of the proposed new plan to support informed decision making by users.
Analysis of different plans within the Basin Planning application can be done by comparing key indicator results, as well as by running a simple Multi Criteria Analysis (MCA) and comparing the MCA results. The MCA provides a structured framework for comparison, using a scoring matrix to calculate relative scores based on the weighted strategies previously assigned (see Figure 19). The final result per plan and per strategy, allows a ranking and prioritization of each plan under the weighting scheme carried by each strategy (see Figure 20). The ranked list of plans combines indicator results on the same relative scale, thus reflecting overall plan preference. The plan scoring the highest total relative weighted score can be ranked as the most preferred plan. Moreover, the evaluation can be made into reports that users can export for external use.
Figure 19. Schematic of steps within the analysis of plans in the FDMT basin planning application. Source: http://www.flooddroughtmonitor.com/home
Figure 20. Screenshot of an example MCA result from the basin planning application. Source: http://www.flooddroughtmonitor.com/home
As of early 2018, the basin planning application was still under development, although it has been tested in the Lake Victoria basin.
3.2.6 Water Safety PlanningIt is expected that climactic events such as floods and droughts will have severe impacts on the operations and long term management of water utilities and the quality of drinking water they supply to consumers in their regions, such as in the Chao Phraya, Lake Victoria and Volta basins. Water Safety Planning (WSP) is an approach to protecting drinking water supplies by
C ASE STU DIES FLO O D AND D RO UGH T MANAGE ME NT TOOLS CASE STUDY
applying a comprehensive risk assessment and risk management measures along the entire water supply system, from catchment to consumer. Through this approach, WSPs aim to consistently ensure a safe and acceptable supply of drinking water.
Figure 21. Schematic of the eleven modules making up the Water Safety Planning process.Source: http://www.flooddroughtmonitor.com/home
The WSP application Portal covers the eleven modules associated with development and implementation of the WSP process (see Figure 21). The application aids in the use of the WSP process through the provision of a user-friendly template to prompt the entry of applicable information for each module. The application has a table of contents with eleven modules as defined in the 2009 WHO/IWA Water Safety Planning Manual. Selecting a module opens its rele-vant dialogue box, which can be edited to input data (see Figure 22). Through this approach, the application guides users to complete a system assessment of all the steps within the water supply system, determining current and future hazards and risks along this pathway then determining control measures including monitoring of controls for each risk. All of this infor-mation can be input by users into the application under specified categories and tables. For the monitoring, management and supporting programmes components of the WSP process, the application provides a space to upload relevant documents in various formats. A form can be filled out for the revision components of module 10 (Plan and Carry out Periodic Review of the WSP) and module 11 (Review the WSP Following an Incident), which prompts the input of information such as changes to the water supply system and management to ensure the WSP is up to date.
Throughout the WSP application functionality, information boxes can be accessed which describe the specific module and its components in more detail, as well as relevant links to the Water Safety Portal (see Figure 23). The Water Safety Portal is an online network focused on the implementation of WSPs. It gives further information on the WSP process and its modules, provides a variety of related resources, such as WSP related news and events and discussion forums to share experiences. Moreover, the Water Safety Portal links to the World Health Organisation/ IWA (2009) Water Safety Plan Manual.
CASE STUDIES FLOOD AND DROUGHT MANAGEMENT TOOLS CASE STUDY

256 / SMART WATER M A NAG E M E NT PR OJ E CT 257 / SMART WATER MANAGEMENT PROJECT
Figure 22. Screenshot of Module 2 dialogue box within the WSP application of FDMT. Source: http://www.flooddroughtmonitor.com/home
Figure 23. Screenshot of an Information box for Module 6 (Monitoring control measures) in the WSP application. Source: http://www.flooddroughtmonitor.com/home
C ASE STU DIES FLO O D AND D RO UGH T MANAGE ME NT TOOLS CASE STUDY
3.2.7 ReportingTool offered through the Flood and Drought Portal, is the reporting application, aimed at encouraging information dissemination to stakeholders regarding the plans and background of the decision making process. This information can take various formats in reports or bulle-tins, depending on the audience and the specific content. As such, the reporting application of FDMT is flexible in supplying different reporting templates (Word docx documents) consisting of the overall framework of the report. Each template contains a number of tags, delineated with brackets {}, where the user is prompted to insert content in the form of images, text, chart or tables to replace the tags (see Figure 24). This content links to the other FDMT applications, specifically data and information, so users can input for example charts with the latest climate information, drought hazards or other information from the Flood and Drought Portal. Users can also insert external text files. After users have downloaded the template and input the suggested information, the final report is produced as a pdf or word document (see Figure 25).
Figure 24. Example report template within the FDMT reporting application, highlighting tags for users to input specific information. Source: http://www.flooddroughtmonitor.com/home
CASE STUDIES FLOOD AND DROUGHT MANAGEMENT TOOLS CASE STUDY

258 / SMART WATER M A NAG E M E NT PR OJ E CT 259 / SMART WATER MANAGEMENT PROJECT
Figure 25. Schematic of the template to final reporting concept within the FDMT reporting application. Source: Thailand water utility training presentation on Reporting Application (Jessen & Cross, 2017).
In addition, the reporting application provides a space for users to develop their own reports based on their specific requirements. This can be done by making a new report, or cloning a template report to act as a starting point for a user defined report with modified content and tags. To generate a new report, users upload their own docx template, and fill in a short description of the report. The application recognises tags when the new report is uploaded into the system and users then specify the content of each of these tags. The reporting function rounds out the package of data and planning tools in the Flood and Drought Portal by giving a space for users to create output documents based on the other applications.
3.3 Capacity Building and CommunicationsCommunication, information dissemination and capacity building is a strong and significant aspect of the FDMT project. Several channels of communication have been developed between stakeholders and the project coordinators as well as the production of communication outputs for the general public. Involving the potential future users of the tool in the pilot basins from the beginning of the project strengthened the methodology, enabled ongoing feedback on tool development to ensure relevance and also enhanced the capabilities of the users. Addi-tional learning tools and communication outputs, such as the project website, guidance docu-ments, experience notes and workshops and international events are working to disseminate information on the FDMT project to local project partners and beyond.
To further distribute information on the FDMT project on a global scale, project organ-isers presented the project at several regional and international events. A sampling of events where the FDMT project was represented include: • International Conference on Drought; Valencia, Spain; March 2015• 7th World Water Forum; Daegu & Gyeongsangbuk, Korea; April 2015• European River Symposium; Vienna, Austria; March 2016• Global Water Safety Conference; Palawan, Philippines; April 2016• 6th Africa Water Week; Dar es Salaam, Tanzania; July 2016• Mekong Delta Workshop; Hanoi, Vietnam; October 2016• 7th IWA ASPIRE Conference; Kuala Lumpur, Malaysia; September 2017• IWA Development Congress, Buenos Aires, Argentina; November 2017• International Workshop on Water Scarcity: Taking action in transboundary basins and reducing health impacts; Geneva, Switzerland; December 2017
C ASE STU DIES FLO O D AND D RO UGH T MANAGE ME NT TOOLS CASE STUDY
• IW:LEARN Twinning event – FDMT Technical Training with basin level representatives form GEF projects; Geneva, Switzerland; December 2017• 8th World Water Forum; Brasilia, Brazil; March 2018• 3rd Targeted Regional Workshop for GEF IW projects in east Europe and Asia-Pacific; Bangkok, Thailand; April/May 2018
3.3.1 Stakeholder engagement During the six month initial inception phase of the project in 2014, more than 50 stakeholders from all scales and regions within the three pilot basins were consulted. The series of stake-holder workshops helped shape the methodology of the project and make it relevant to the three regions, while also determining the level of engagement from key stakeholders as the end users of the project. Ultimately these workshops were a key element in determining how the FDMT project could aid in its goals of improving the management and planning for flood and drought events on the ground. The stakeholder consultations gathered data, identified gaps in informed decision-making, and proposed types of information that would be useful to guide both short-term and long-term planning. The key objectives of the consultations included:
• Enhance key stakeholders’ understanding and endorse the objectives of the FDMT project• Understand issues key stakeholders are facing during water planning, focusing on
transboundary issues related to climate change, floods and droughts• Understand the methods and processes which the basin organisations and water
utilities go through during planning, and tools they currently use in planning• Identify other projects or initiatives that could potentially fill issue of data collection and
knowledge gaps of the basin• Gather feedback on the proposed methodology and technical outputs of the FDMT project• Based on stakeholder input and feedback, refine development of methodology and tools.
More than 200 people were trained through annual training programmes were conducted in each basin to build capacity to use the applications among stakeholders and to further improve the FDMT tools. In order to ensure the online tools could be useful for the local conditions in the pilot basins, which often supported only low bandwidth internet connec-tions, the on-the-ground sessions tested its function in this environment. Separate training sessions were organised for basin-level organisations and water utilities in order to provide more targeted learning. Each session allowed stakeholders to test the tools during the training through guided steps and a series of exercises, and then provide feedback to ensure the tools’ relevance and meaningfulness. The annual training sessions helped to improve the FDMT technology, ensure that the tools matched the capabilities of local stakeholders and build capacity of these stakeholders.
3.3.2 Resources & Communication OutputsA variety of communication materials have been developed for the FDMT project to dissem-inate information on the project outputs to stakeholders and a wider audience as well as to encourage further learning. The project website (http://fdmt.iwlearn.org) is the hub of all project information and resources. Most material is translated into French and Thai to accom-modate the language of key stakeholders in the three pilot basins. The following is a list of the different resources that are available on the project website.
CASE STUDIES FLOOD AND DROUGHT MANAGEMENT TOOLS CASE STUDY

260 / SMART WATER M A NAG E M E NT PR OJ E CT 261 / SMART WATER MANAGEMENT PROJECT
Learning Resources• User Guidance Learning resources in the form of informational documents. The online Portal has a step-by-step user guide for each application, outlining how to use each tool. User guides include a quick overview for first time users as well as detailed instructions and explanations of all the functions of the application, with screenshots and diagrams to clearly demonstrate each function. The user guides do not necessarily explain the practical application of the tools, so the FDMT project is also creating more detailed guidance documents on how to interpret data and how to apply the other applications. The guidance documents are most applicable to water utilities to enhance their capacity to integrate the applications in their daily work to inform decisions and management. To further aid in helping stakeholders understand how to use each tool, tutorial and information videos are being created which will be openly accessible.
• Information sheets In addition to the guides for the tools themselves, separate factsheets cover many of the other aspects of the project, including the FDMT project overview, pilot basins profiles, as well as water utility, basin, drought and flood informational sheets.
• Communication Strategy and Media Kit A Communication Strategy and Media Kit were designed to guide stakeholders in the pilot basins in further promoting the FDMT project to its networks. These resources are intended to continue raising awareness of the flood and drought problems and the SWM solution offered through FDMT. The Communication Strategy is a living document, updated on a regular basis, which outlines all the communication products, their purpose and target audience, as well as the key messages of the project. The media kit is a pre-packaged resource of content for blogs, press releases, newsletters and webpages, to provide an overview of the FDMT project for audiences. The kit also includes a social media guide with a project hashtag and a guide to developing blogs as a more digestible communication approach to reach a wider audience.
• Experience notes International Waters Experience notes have been developed as part of the project to share the successful practices, approaches, strategies, lessons and methodologies that emerged in the context of the project work. The purpose of the experience notes is to facilitate a community of related projects and partners to improve through the replication of its own practical experiences. These are especially focused at the GEF IW projects who are one of the key target groups for uptake of the tools. The project has developed two experiences notes addressing the significance and approach of engagement with stakeholder to develop relevant applications for flood and drought planning and the experience in incorporating climate information into Water Safety Planning to ensure the approach is climate resilient.
From a bottom-up learning approach, a community-based forum has been developed for users within the online Portal, called the Knowledge Exchange Portal (see Figure 26). This forum promotes dialogues between users to share their experiences and self-teach through a discus-sion board and online course pages. The Knowledge Exchange Portal is embedded within the web-based system and will assist future users in applying the tools, alongside the other guid-ance materials available on the Flood and Drought Portal and project website.
C ASE STU DIES FLO O D AND D RO UGH T MANAGE ME NT TOOLS CASE STUDY
Figure 26. Screen shot of the Knowledge Exchange Portal. Source: http://www.flooddroughtmonitor.com/hom
To raise awareness of the FDMT project and disseminate project related information to pilot basin partners as well as a wider audience, the following communication outputs were devel-oped by IWA, also hosted on the project website:
Communication Outputs• FDMT Newsletter The FDMT newsletter, (with 12 volumes as of April 2018), provides project updates and engages with project stakeholders, communicating their efforts in addressing flood and drought impacts. The 2-4-page newsletter covers not only project updates, but also relevant report and video resources, upcoming and past project related events and flood and drought related news in the pilot basins and beyond.
• Blog The FDMT blog is an accessible platform for engaging a wider audience in the project, offering a channel for partners to share their knowledge and experience. Around 10 blog posts have been published on the project website, with some of these posts also found on online news sites.
• YouTube Channel Several social media videos, hosted on YouTube, give a quick introduction to the project and the technical applications available in the Flood and Drought Portal. Each video is 1-3 minutes in length with facts and photos to give an informational overview or guide of different tools and topics related to the project. A series of how-to-videos are also being developed which provide quick tutorials on general functionality of the portal and the available applications.
• Webinars A series of technical webinars focus on innovative approaches to Flood and Drought planning and management. These are primarily based on the outcomes of the FDMT project, but also include guest presentations from external stakeholders and organisations. Additional webinars address climate resilient Water Safety Planning jointly organised with WHO, how to interpret climate information with EMANTI and a webinar on strategic recommendations for flood and drought management.
CASE STUDIES FLOOD AND DROUGHT MANAGEMENT TOOLS CASE STUDY

262 / SMART WATER M A NAG E M E NT PR OJ E CT 263 / SMART WATER MANAGEMENT PROJECT
• Infographics (Under development) Representation of different aspects of the project through a blend of illustration and short text, such as displayed in Figure 6. Infographics address transboundary planning, climate resilient water safety planning and flooding and drought.
3.4 Project StagesThe FDMT project implementation process includes five components (see Table 4). After the inception phase in which the project was introduced to stakeholders, initial thoughts on the methodology were developed. Ongoing development and amendments to the methodology have been informed through continued engagement and consultation with stakeholders through planned technical trainings, workshops and events.
Table 4. The five stages of the FDMT project in Lake Victoria, Volta and Chao Phraya basins between 2014-2018. Source: FDMT Semi-annual progress report, June 2015.
Component Number & Name Component Description
0 Inception phaseIntroducing the project to stakeholders; identifying gaps and needs around flood and drought planning
1 Development of methodologies
Development of six (6) methodologies with tools in a DSS, which increase the understanding of flood and drought dynamics and impacts at transboundary and local levels
2Validation and testing at basin-wide level
Application of the methodologies in the three pilot basins to provide the opportunity for integration of flood and drought information into basin level planning (basin wide authorities)
3 Validation & testing at local level
Application of the methodologies in the three pilot basins to provide the opportunity for integration of flood and drought information into local level planning (urban water utilities)
4 Capacity building & dissemination
Learning package developed to provide training and information within and beyond the pilot basins; and project outputs communicated and disseminated to inform global dialogue on water security and adaptation to climate variability and change
3.5 Project InputsThe implementation of this project was made possible due to the financial support of the Global Environment Facility (GEF) trust fund through the UN Environment Programme (UNEP), and the co-financing collected from various stakeholders including the executing agencies, the implementing agency, and local stakeholders in the three basins. The GEF fund provided the core financing of USD 4 million to complete the three pilot basin studies, and the commitments from financial and in kind co-financing among other stakeholders secured more than USD 22 million. In-kind contributions included inputs such as the provi-sion of staff, information, local knowledge and input, development of the technical tools and project support and management. The total budget for the full four-year FDMT project was therefore USD 26 million. The breakdown of funds is provided in Table 5.
C ASE STU DIES FLO O D AND D RO UGH T MANAGE ME NT TOOLS CASE STUDY
Table 5. Summary of main budget components and costs in the FDMT project. Source: Internal FDMT Semi-annual progress report, June 2015.
UNEP Budget ComponentsCost (USD)
Budget (GEF) Co-Financing
Personal ComponentProject personnel, including PMU cost, Consultants for developing training material, missions travels
3,599,753 14,774,367
Subcontractor ComponentSupporting agencies/institutions
Training ComponentNational and regional training courses
288,212 2,533,611
Equipment and PremisesExpendable equipment, Non-expendable equipment, Premises costs
10,640 396,055
Miscellaneous ComponentOperation and maintenance of equipment, Reporting costs (printing and publishing), Communication costs, Project evaluation
151,396 4,760,809
Total Budget 4,050,000 22,464,842
Most personnel supporting the FDMT project were provided by in-kind support from their respective organisations. To implement the project, two key coordinators with support staff were involved. A facilitator in each basin was selected from existing permanent staff of the executing organisations already located in each of the three pilot basins. These staff were key focal points who built relationships among local stakeholders and ensured that visits and training workshops with the coordinators and support teams were productive. The staff and staff numbers changed over the course of the four-year project on a needs basis.
Several partnerships between international organisations aided in the implementation and execution of the FDMT project (see Figure 27). The UN Environment Programme (UNEP) was the key implementing agency while DHI and the International Water Association (IWA) jointly provided the execution support to cover the overall coordination and operation of the project. It is a novel project management arrangement in that neither DHI nor IWA have taken the lead in management, but share different aspects of project coordination. A project Steering Committee was made up of UNEP, DHI, IWA, as well as the pilot basin authorities (LVBC, VBA and HAII) and key resources persons from UNEP-DHI and the Nile Basin Initiative (NBI). This committee meets at least once a year to review the project budget and work plan then provide feedback and guidance to the executing bodies (DHI, IWA).
Figure 27. International organisations involved in the funding, implementation and execution of the FDMT project.
CASE STUDIES FLOOD AND DROUGHT MANAGEMENT TOOLS CASE STUDY

264 / SMART WATER M A NAG E M E NT PR OJ E CT 265 / SMART WATER MANAGEMENT PROJECT
StakeholdersDHI is an international software development and engineering consultant firm that specialises in knowledge sharing of water-related information through their local teams and unique software (DHI, 2018). They develop advanced technologies to better under-stand water environments and have global training and knowledge sharing activities to distribute this data. In the FDMT project, DHI acted as the technical coordinator and technical support team. This support team developed the methodology, conducted modelling, collected remote sensing data, tested tools at basin and local level, and created guidelines.
The other coordinating body within the project management unit for project execution, working closely with DHI, was the International Water Association (IWA). IWA is the largest global network of water professionals with more than 10,000 individual and 500 corpo-rate members in 130 different countries. Each year IWA organizes and sponsors over 40 specialized conferences and seminars on a wide variety of topics in water manage-ment in locations across the globe including the IWA World Water Congress, IWA Water and Development Congress and Annual Leading-edge conferences. IWA publishes 12 scientific journals and 40+ books per year on water management along with IWA scien-tific and technical reports, manuals, reports and electronic services. IWA develops leading edge innovations and synthesizes these through the work of the 50 IWA Specialist Groups and a set of global programmes. One of the key communication channels developed by IWA was through designing and operating the project website. Furthermore, IWA led the engagement of stakeholders and capacity building including the organisation of consultation and outreach conferences, workshops, and special events as well as leading the production of dissemination materials and publications. IWA also focused on bringing the project outputs to water utilities in the pilot basins.
In addition, there has been an ongoing collaboration over the duration of the four-year project with the World Health Organisation (WHO) and Global Water Partnership (GWP) in order to gather knowledge and experience for the development of the methodology and tools. The coordination with WHO and GWP were also done to jointly improve WHO and GWP led projects which are aligned on a similar theme as FDMT. The partner-ship with WHO is on the topic of Water Safety Plans. WHO jointly with IWA produced a manual on WSP which is the basis for the WSP tool within the FDMT. Part of the aim of the WSP tools was to provide support to those using the manual. Similarly, GWP has been conducting a project on integrated drought management and has produced a report on drought indicators. Collaborations with project organisers from both organ-isations have provided extra information and key learnings that have been used to improve the development of the FDMT project.
Since the TDA/SAP tools are designed to assist transboundary management, the basin organisations, including the Volta Basin Authority (VBA), Lake Victoria Basin Commission (LVBC) and Thai Hydro and Agro Informatics Institute (HAII) are also key stakeholders. Figure 28 gives the list of all regional authorities collaborating on the project. Overall, the FDMT project is a cross agency programme with inputs from international organisa-tions, basin commissions and authorities and water utility agencies. With such a large network, it facilitates bringing together the stakeholders involved in managing the basin and openly share data.
The project has also made use of the experience form the learning basins. Strong collab-oration with the Nile Basin Initiative (NBI) and the International Association of Water Supply Companies in the Danube River Catchment Area (IAWD) has helped to shape the development of the methodology and tools. NBI also provided suggestions on how to
C ASE STU DIES FLO O D AND D RO UGH T MANAGE ME NT TOOLS CASE STUDY
address high level buy in to the methodology and tools to ensure better uptake of the applications.
FIGURE 28. Regional authorities from the Chao Phraya, Lake Victoria and Volta basins involved in the execution of the FDMT project.
3.6 Enablers3.6.1 Strong Stakeholder Engagement Ensuring frequent and inclusive stakeholder engagement throughout the duration of the four year FDMT project helped drive and direct the project. It was especially useful having local and basin organisations’ feedback and input during the initiation of the FDMT development, as well as involving them in framing the methodology. This allowed the tools and methodology to be created with direct input as to the needs of users, and further adjustments could be done after annual training sessions with these same stakeholders.
Project partners in Thailand within the Chao Phraya basin were particularly useful in contrib-uting national and local knowledge. Furthermore, these partners had sufficient technical capacity to test and provide critical feedback on the FDMT methodology and tools in order to shape and improve the project outcomes. Stakeholder workshops in the Chao Phraya basin provided project organisers with practical requests for tool adjustment and the Issue Analysis tool was a direct result of feedback from one such workshop. Feedback from trainings in the Volta basin and Lake Victoria basin prompted the switch from a desktop based DSS to an online platform to accommodate the need for a more flexible and user friendly methodology.
The location of the three pilot basins was also considered an enabler for the project, as IWA and DHI already had strong regional knowledge and networks in these locations. DHI had previously implemented information or forecasting systems in the pilot basin regions, so the FDMT project was building on past work, rather than starting from scratch. The established networks with stakeholders allowed a smoother and faster transition to implement FDMT and local knowledge to be available throughout the project. Additionally, as IWA and DHI had staff working in these areas who were familiar with the local agencies, this enabled already developed connections to become stronger as well as stakeholders’ trust and engagement to occur from the beginning of the project.
CASE STUDIES FLOOD AND DROUGHT MANAGEMENT TOOLS CASE STUDY

266 / SMART WATER M A NAG E M E NT PR OJ E CT 267 / SMART WATER MANAGEMENT PROJECT
3.6.2 Effective Project Management ApproachA key enabler to this project’s progress and success was the project management, planning, implementation and reflection style used throughout the process. The FDMT project involved a detailed planning process, and a defined implementation framework with clear roles for each executing agency. To direct the project implementation, a Project Management Unit (PMU) was created, consisting of the technical and outreach coordinators from the executing agencies. The PMU ran biweekly management meetings and oversaw day-to-day administra-tion of the project.
The Steering Committee oversaw the project’s progress and planning stages, helping to guide the direction and ensured detailed reporting. Annual Project Implementation Reviews (PIR), semi-annual reports, consultation reports (including training and workshop reports), blogs and newsletters provided detailed records of the implementation steps and set the tone for the project as it continued. Each semi-annual report had a progress table that covered activities related to each project outcome, and outlined:
• Outcomes and Activities• Expected Completion Date Status• Progress • Issues and Proposed Solutions• Party Responsible
Table 6 provides a snapshot of part of the progress table from a June 2015 semi-annual report, which includes the above elements. Further to the progress structure, reports regularly assessed performance based on a specific framework. An example of this is shown in Table 7.
Table 6. A sample progress table from the planning stages of the FDMT project. (Note: IP refers to In Progress, state % completed). Source: FDMT Semi-annual progress report, June 2015.
OUTCOMES & ACTIVITIES EXPECTED COMPLETION DATE STATUS
PROGRESSDescription of progress & achievements during the reporting period
ISSUES & PROPOSED SOLUTIONSDescription of problems encountered; issues that need to be addressed; decisions/actions to be taken
PARTY RESPONSIBLE
Component 4 Capacity building and dissemination
Outcome 4.1Experience and know how gained through the project is made available within the GEF system and beyond.
Outcome 4.1.1Learning package, including technical specifications and training materials for the application of the new methodology with DSS tools, is tested in 2-3 trainings with basin officials, utility and industry management and operational staff, and representatives from civil society with 15-30 people per training.
Activity 1 – Prepare technical specifications, manuals, guidance and training materials for users in the 3 pilot basins focusing on capacity building in the pilot basins
IP (25%) Technical workshops are being scheduled. Training material will be developed around these trainings will contribute to this activity.
Information from DSS is needed to further develop the technical specifications, manuals, guidance and training materials. A draft will be ready for training in November 2015, but training material will be developed throughout the project through the iterative training workshops. In addition, the project has established a review group so additional time will be needed for comprehensive peer review.
IWA (with DHI support)
C ASE STU DIES FLO O D AND D RO UGH T MANAGE ME NT TOOLS CASE STUDY
Further to the formal planning process of the FDMT project, the semi-annual reviews ensured the practice of constant reflection at six month intervals throughout the project. These reflections allowed time to determine lessons learnt during the implementation stages, so issues could be solved along the way, rather than only realising problems at the completion of the project.
Table 7. A sample of the Performance Evaluation framework for the FDMT project management, from the June 2015 Semi-annual report. Source: FDMT Semi-annual progress report, June 2015.
Component 3 Validation and testing at local level
Objectively Verifiable Indicators Means of Verification
Status 01.01.2015-01.06.2015
Assumptions
Indicator Baseline Target
Output 3.1
Recommendations for inclusion of flood and drought issues in WSP and other local planning methods in the 3 pilot basins with integration of urban and (agro-) industrial water users’ perspectives and realities
Report with recommendations describing the application of the DSS at local level, through the DSS validation on selected application areas, this includes lessons learned from the DSS validation.
Report outlining evaluation of the DSS validation at the local level through project review group.
Recommendations for how to incorporate on floods and droughts from a DSS in existing planning methods for water utilities and other utilities at local and urban level are lacking.
Baseline: 0
Strategic recommendation for application and the DSS use of information on floods and droughts in existing planning methods at the local level with at least 3 end users (utilities across the 3 pilot basins)
Midterm target: Strategic recommendation based on feedback from at least 3 end users (utilities across the 3 pilot basins).
End of project target: Strategic recommendation disseminated to a wider range of water utilities.
Reports from application at local scale including:
Application of the developed DSS at local level. This includes recommendations and lessons learned for applying the planning methodologyStrategic recommendations for inclusion of the DSS in existing planning methods at local levelEvaluation of the DSS validation at local levelSoftware package with DSS for application at local levelFeedback and comments from stakeholders, project steering committee and project review group
Stakeholder consultations established the working environment for how the DSS should be applied and tested in the pilot basins. The project will work with one water utility within each basin, while other utilities will still benefit from the training. It should be noted that utilities are at different levels with regards to their WSP status (some have already developed and are implementing WSP while others are in the process of initiating the WSP), therefore they will have different uses for the WSP tools being developed.
The project is also working closely with WHO to ensure that the tools can potentially be used by utilities beyond the project areas.
Stakeholders recognise the need for use of technical tools in existing planning methods at the local level.
CASE STUDIES FLOOD AND DROUGHT MANAGEMENT TOOLS CASE STUDY

268 / SMART WATER M A NAG E M E NT PR OJ E CT 269 / SMART WATER MANAGEMENT PROJECT
3.6.3 Key Project InputsThe funding and in-kind support received for the project through the implementing agencies and local stakeholders was also a major enabler for the project. The funds provided by GEF and in-kind co-financing from partner and implementing organisations were significant enough to cover the costs of staffing, detailed project management and implementation across the three pilot basins over a four-year period.
The creation of the online Portal was made possible by several enabling inputs to the project. To develop, implement and update the methodology and tools, it was key to have DHI, a global expert at sharing water data, to create a professional, user-friendly and useful online tool. DHI was able to pool resources from their teams of expert staff, especially their remote sensing team to locate the data to be input into the tool, DHI developers to create the Portal and its back-end and their water resources department to oversee and coordinate these activities. Free and global access to satellite climate data made it possible to share information without the need for the project to generate new methods of data collection in the basins, while meeting a basin requirement for any planning approach.
3.7 Barriers3.7.1 Implementation BarriersCompleting the FDMT applications was more time intensive than anticipated which created some limitations in terms of application (although the project has been focused on develop-ment and testing). As the tools were developed in collaboration with local partners, the process of refining the tools after collecting feedback is lengthy as there are constantly new adjustments required after testing. As the applications cannot be fully used until their production is final, this means there is less time available for actual implementation in each basin. This influenced the decision to extend the project by six months, in order to incor-porate the stakeholders’ request for more training sessions of longer lengths and further awareness workshops. An adapted schedule for the last stages of the project was created so all online applications would be completed and active by the end of June 2018, only slightly later than originally planned.
Another barrier faced by the FDMT project implementing agencies was that the methodology cannot be tailored to the specific local conditions of every global transboundary basin it targets. This was particularly challenging as the experience in each of the three pilot basins, showed that local stakeholders’ priorities vary greatly. While it is not possible to develop a tool with all priorities taken into account, it is acknowledged that basin priorities in other areas of the world may also differ from those within the pilot basins. Therefore, there is a need to bridge the gap between different geographical regions, so that FDMT can be flexible and applied glob-ally while addressing the needs of various stakeholders. Despite this limitation, the pilot and learning basins of FDMT were helpful in identifying specifications that could be applicable in other locations, and the planning tools within FDMT are a means of screening to identify and evaluate the key issues at basin or local level.
3.7.2 Stakeholder Capacity and Interest LevelOne of the major challenges encountered in the FDMT project implementation was the limited capacity and data availability among some of the stakeholder partners in the pilot basins. The project was reliant on local stakeholders to implement and apply the tools in a real planning environment, in order for project developers to receive proper feedback and learn from its local use. However, these stakeholders had limited resources to devote to this, especially before the tools were completed. The limited technical capacity of stakeholders was particu-larly challenging in regards to the Volta and Lake Victoria basins. Because of these limitations
C ASE STU DIES FLO O D AND D RO UGH T MANAGE ME NT TOOLS CASE STUDY
in time and capacity, continued support and technical assistance from project organisers were required.
A variety of political influences in the pilot basins at times hampered the engagement of stakeholders for the trainings, workshops and other events. Political unrest in Burkina Faso made it difficult to hold training sessions there. An alternative location in Accra, Ghana was chosen, but due to the greater distance required for stakeholders to travel, attendance was significantly reduced. Limited participation in training events was also seen among Tanzanian stakeholders, as they required permission from their central government to travel to meetings, requiring advance planning time that was not always sufficient.
Another barrier to stakeholder engagement was a wavering level of buy-in and ownership. This project did not provide direct financial investment into a basin organisation, but rather joint learning, which required stakeholders’ time and engagement. As the FDMT methodology was developed to involve local stakeholders in the process as much as possible, the varied level of interest among certain partners in the basins made it difficult to incorporate all their ideas into the process. The variance in buy-in and ownership across basins and stakeholders can be attributed to several factors, including voluntary engagement by stakeholders without the provision of extra resources for execution of specific activities, the perception of a top-down approach to implementation, and limited implementation of the tools during the project’s timeframe. Without the implementation of the tools to a practical situation demonstrating the value of the methodology and tools, it was difficult to see the extent to which managers would be able to practically apply the methodologies and tools in their work without further training and support.
Furthermore, the FDMT project was highly sensitive to economic fluctuations, social issues and cultural barriers. Of these, language was the main impediment to involvement of stakeholders. The communication materials, online Portal and applications were created in English, which is useful for partners in the Lake Victoria Basin where English is the dominant language, however less useful for the other two basins where English is less commonly used. To address this, key documents and communication materials were translated to French (the dominant language in the Volta basin) and Thai (for the Chao Phraya basin), and as much as possible, translators or staff competent in the required language were present at trainings and workshops. None-theless, not all materials are yet translated into these three languages, and translation was not available during all workshop events. The main Portal interface and application tools are still only available in English. Standard webpage translation tools can be applied, however, to enable users to navigate the Portal in a language they are familiar with, and text inputs in any language are accepted when creating the planning templates and frameworks.
3.8 Achievements and ImpactsAt the time of writing in early 2018, the FDMT project is still in its last phase, so long-term impacts are yet to be realised. However, the project has already achieved many of its intended outputs and is on track to accomplish its intended outcomes (see Figure 29).
CASE STUDIES FLOOD AND DROUGHT MANAGEMENT TOOLS CASE STUDY

270 / SMART WATER M A NAG E M E NT PR OJ E CT 271 / SMART WATER MANAGEMENT PROJECT
Figure 29. The five key intended outcomes of the FDMT project, as outlined on the project website. Source: http://fdmt.iwlearn.org/outcomes
3.8.1 FDMT MethodologyAs outlined in the first intended outcome above, the project has jointly developed a method-ology with pilot basin stakeholders, to better understand flood and drought events and their impacts, and to help local stakeholders plan and make decisions to mitigate these impacts. The methodology will not only assist stakeholders in the pilot basins of Volta, Lake Victoria and Chao Phraya basins, but can also be applied to other global transboundary basins. The increased information and planning capacity provided through the FDMT methodology improves resilience and flood and drought preparations, so water basin authorities and water utilities can be better prepared and equipped for extreme weather events.
3.8.2 Online PortalA major accomplishment of the FDMT project was the creation of its main output – the DSS software, embodied in an online Portal with a package of technical applications. The Flood and Drought Portal contains a set of tools, which can be used individually or together for supporting activities within flood and drought planning. These tools, as well as information on how they can be applied in practice, are readily accessible to authorities and utilities across transboundary basins. The Portal and its applications fits into the overall tool set avail-able, such as the Global Water Partenership’s IWRM ToolBox, which contains knowledge and learning about integrated water resources management. The Flood and Drought Portal and its applications could be considered as one of the “tools” within the IWRM Toolbox.
As of May 2018, 700 users had registered on the Portal. Furthermore, the Portal has registered 286 transboundary basins from around the world. Within the online system, basins are classi-fied as operational if there are registered users for that basin. Most applications in the Portal can be generally applied for planning in any basin, but the Data and Information Application uses satellite data specific to a geographical location. When a user registers for a previously non-operational basin, this triggers the technical coordinators at DHI to process the data for this basin. As of early 2018, a total of 42 transboundary basins were operational with registered users, including basins within Africa, Asia, Central America, Europe, the Near East as well as North and South America.
C ASE STU DIES FLO O D AND D RO UGH T MANAGE ME NT TOOLS CASE STUDY
Intended outcomes 2 and 3 have so far been partially realised, with the creation of applications for flood and drought planning aimed at both basin wide and local levels. While not all applica-tions have been fully completed, the project has made significant progress in designing, imple-menting and tweaking applications in accordance with stakeholders’ input.
In addition to the online Portal, the methodologies for how to apply the tools in a planning context have been developed within the FDMT project. Detailed guidance was created outlining how to use each application, as well as how to interpret data, at a level that stakeholders with various capabilities can understand and utilise for their planning purposes. Such guidance was developed primarily for water utilities.
Another accomplishment from the FDMT project execution was its high degree of efficiency in technical, implementation, and management terms. The creation and development of the online Portal was cost-effective compared with the high cost of developing similar commercial DSS, as it was made as a web-based system and used freely available global datasets. Further efficiencies were obtained through reducing personnel requirements; embedding the project management unit within the executing agencies and having local partners volunteer to test the methodologies and tools.
An example of early successful uptake of FDMT is within the Chao Phraya Basin, where Thai stakeholders are already using the Portal and drought assessment tools to develop a plan for drought. In this region, partners are well equipped with the capacity to use the application and certain organisations have shown interest to register all their staff with the Flood and Drought Portal.
Furthermore, the project is working with the IW: Learn1 to promote the Portal and its appli-cations to transboundary basins involved in the TDA/SAP process, which is what the project was originally designed to support.
3.8.3 Capacity Building and Information DisseminationCapacity building across the three pilot basins has largely met the project’s desired outcomes. To share the experiences gained throughout the project, project updates and details are widely available online and further distributed through other activities and mediums, such as events. In addition, a large volume of communication materials and training documents have been produced over the course of the FDMT project. In accordance with the fifth intended project outcome, these materials are widely distributed at a local, regional and international scale, with most accessible online, on the project website and the online Portal.
Consultations, technical training sessions and workshops, information dissemination and awareness raising activities for stakeholders have improved stakeholder knowledge, such as regarding remote sensing knowledge, and increased awareness of the issues and tools now available through FDMT to better plan for flood and droughts. Additionally, there has been a significant increase in stakeholder access to information, tools and knowledge of how to apply the data and tools provided in the FDMT project. The improvement of data access and plan-ning abilities across users in the Volta, Chao Phraya and Lake Victoria basins means that plan-ning authorities and water utilities can be better equipped to address the impacts of floods and droughts. The core project objective to enhance the ability of managers in the pilot basins to recognise and address climate change impacts on floods and droughts has been partially realised in the short-term. Progress still needs to be made to continue strengthening capacity across different stakeholders in the basins, to ensure that they are all able to apply the tools and knowledge gained is applied in operational and strategic planning. IWA and DHI have existing projects and proposals that aim to enable further implementation. 1. IW:LEARN is the Global Environment Facility's (GEF) International Waters Learning Exchange and Resource Network. The IW:LEARN project was established to strengthen transboundary water management around the globe by collecting and sharing best practices, lessons learned, and innovative solutions to common problems across the GEF International Waters portfolio. It promotes learning among project managers, country official, implementing agencies, and other partners (IW:LEARN 2018).
CASE STUDIES FLOOD AND DROUGHT MANAGEMENT TOOLS CASE STUDY
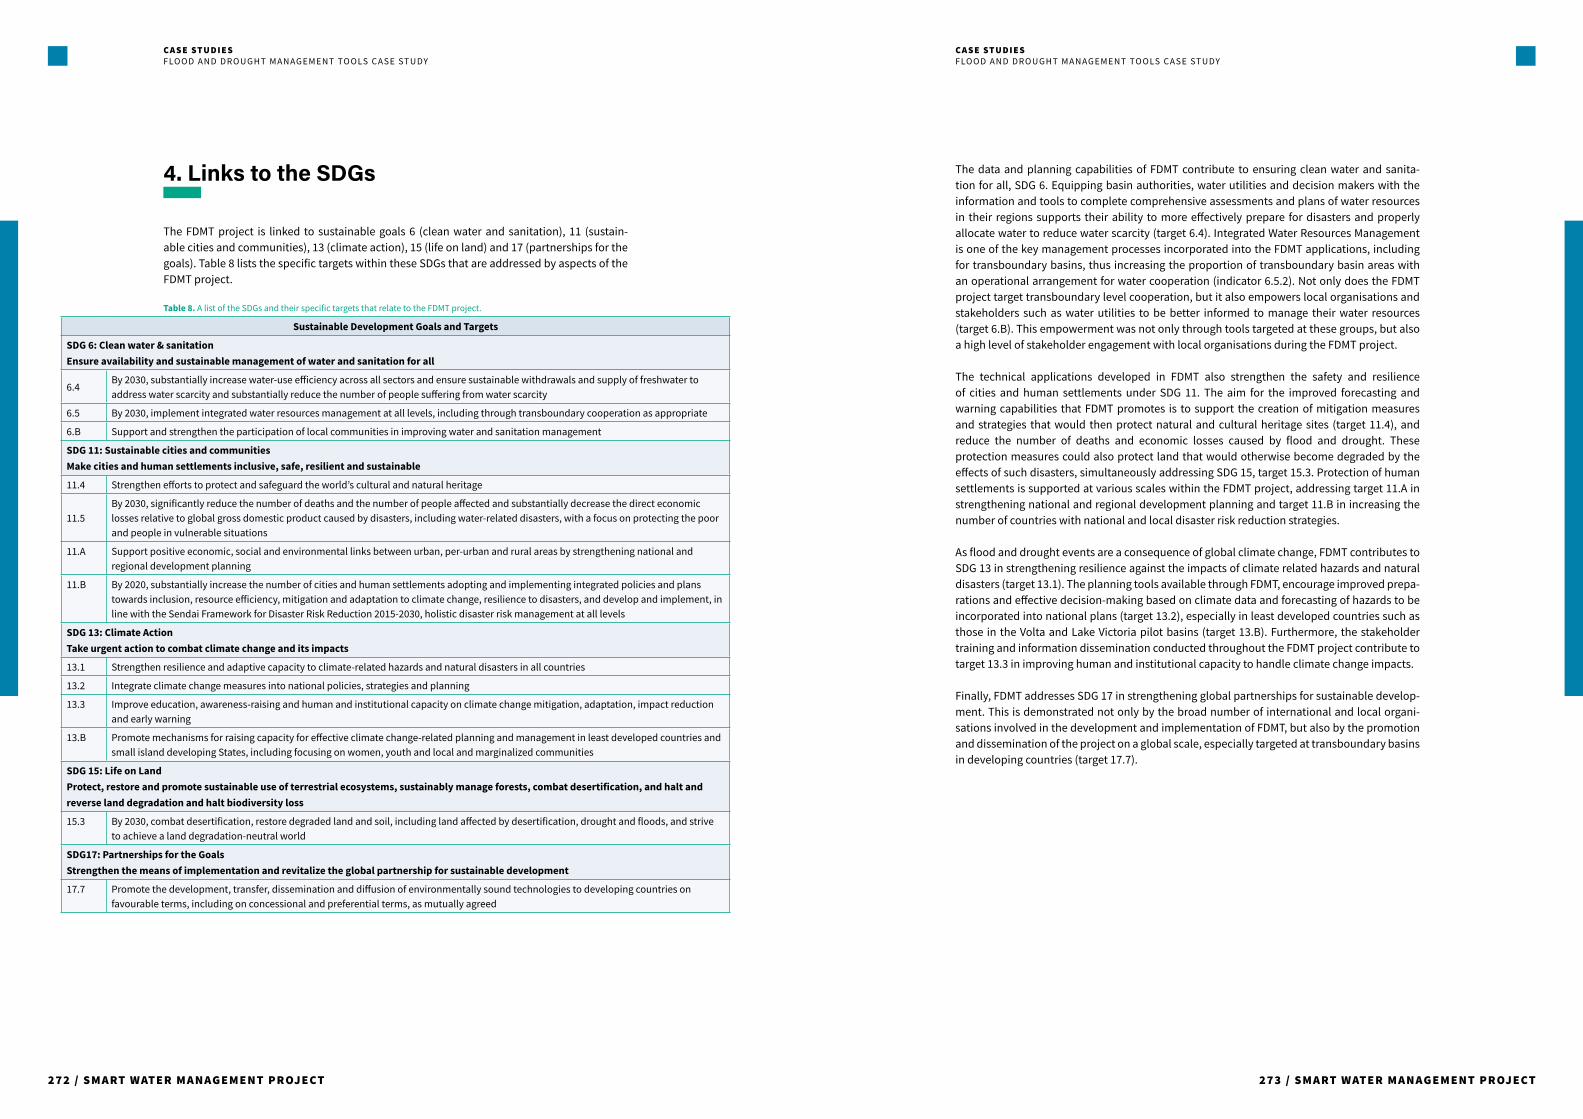
272 / SMART WATER M A NAG E M E NT PR OJ E CT 273 / SMART WATER MANAGEMENT PROJECT
4. Links to the SDGs
The FDMT project is linked to sustainable goals 6 (clean water and sanitation), 11 (sustain-able cities and communities), 13 (climate action), 15 (life on land) and 17 (partnerships for the goals). Table 8 lists the specific targets within these SDGs that are addressed by aspects of the FDMT project.
Table 8. A list of the SDGs and their specific targets that relate to the FDMT project.
Sustainable Development Goals and Targets
SDG 6: Clean water & sanitation Ensure availability and sustainable management of water and sanitation for all
6.4By 2030, substantially increase water-use efficiency across all sectors and ensure sustainable withdrawals and supply of freshwater to address water scarcity and substantially reduce the number of people suffering from water scarcity
6.5 By 2030, implement integrated water resources management at all levels, including through transboundary cooperation as appropriate
6.B Support and strengthen the participation of local communities in improving water and sanitation management
SDG 11: Sustainable cities and communitiesMake cities and human settlements inclusive, safe, resilient and sustainable
11.4 Strengthen efforts to protect and safeguard the world’s cultural and natural heritage
11.5 By 2030, significantly reduce the number of deaths and the number of people affected and substantially decrease the direct economic losses relative to global gross domestic product caused by disasters, including water-related disasters, with a focus on protecting the poor and people in vulnerable situations
11.A Support positive economic, social and environmental links between urban, per-urban and rural areas by strengthening national and regional development planning
11.B By 2020, substantially increase the number of cities and human settlements adopting and implementing integrated policies and plans towards inclusion, resource efficiency, mitigation and adaptation to climate change, resilience to disasters, and develop and implement, in line with the Sendai Framework for Disaster Risk Reduction 2015-2030, holistic disaster risk management at all levels
SDG 13: Climate ActionTake urgent action to combat climate change and its impacts
13.1 Strengthen resilience and adaptive capacity to climate-related hazards and natural disasters in all countries
13.2 Integrate climate change measures into national policies, strategies and planning
13.3 Improve education, awareness-raising and human and institutional capacity on climate change mitigation, adaptation, impact reduction and early warning
13.B Promote mechanisms for raising capacity for effective climate change-related planning and management in least developed countries and small island developing States, including focusing on women, youth and local and marginalized communities
SDG 15: Life on Land Protect, restore and promote sustainable use of terrestrial ecosystems, sustainably manage forests, combat desertification, and halt and reverse land degradation and halt biodiversity loss
15.3 By 2030, combat desertification, restore degraded land and soil, including land affected by desertification, drought and floods, and strive to achieve a land degradation-neutral world
SDG17: Partnerships for the Goals Strengthen the means of implementation and revitalize the global partnership for sustainable development
17.7 Promote the development, transfer, dissemination and diffusion of environmentally sound technologies to developing countries on favourable terms, including on concessional and preferential terms, as mutually agreed
C ASE STU DIES FLO O D AND D RO UGH T MANAGE ME NT TOOLS CASE STUDY
The data and planning capabilities of FDMT contribute to ensuring clean water and sanita-tion for all, SDG 6. Equipping basin authorities, water utilities and decision makers with the information and tools to complete comprehensive assessments and plans of water resources in their regions supports their ability to more effectively prepare for disasters and properly allocate water to reduce water scarcity (target 6.4). Integrated Water Resources Management is one of the key management processes incorporated into the FDMT applications, including for transboundary basins, thus increasing the proportion of transboundary basin areas with an operational arrangement for water cooperation (indicator 6.5.2). Not only does the FDMT project target transboundary level cooperation, but it also empowers local organisations and stakeholders such as water utilities to be better informed to manage their water resources (target 6.B). This empowerment was not only through tools targeted at these groups, but also a high level of stakeholder engagement with local organisations during the FDMT project.
The technical applications developed in FDMT also strengthen the safety and resilience of cities and human settlements under SDG 11. The aim for the improved forecasting and warning capabilities that FDMT promotes is to support the creation of mitigation measures and strategies that would then protect natural and cultural heritage sites (target 11.4), and reduce the number of deaths and economic losses caused by flood and drought. These protection measures could also protect land that would otherwise become degraded by the effects of such disasters, simultaneously addressing SDG 15, target 15.3. Protection of human settlements is supported at various scales within the FDMT project, addressing target 11.A in strengthening national and regional development planning and target 11.B in increasing the number of countries with national and local disaster risk reduction strategies.
As flood and drought events are a consequence of global climate change, FDMT contributes to SDG 13 in strengthening resilience against the impacts of climate related hazards and natural disasters (target 13.1). The planning tools available through FDMT, encourage improved prepa-rations and effective decision-making based on climate data and forecasting of hazards to be incorporated into national plans (target 13.2), especially in least developed countries such as those in the Volta and Lake Victoria pilot basins (target 13.B). Furthermore, the stakeholder training and information dissemination conducted throughout the FDMT project contribute to target 13.3 in improving human and institutional capacity to handle climate change impacts.
Finally, FDMT addresses SDG 17 in strengthening global partnerships for sustainable develop-ment. This is demonstrated not only by the broad number of international and local organi-sations involved in the development and implementation of FDMT, but also by the promotion and dissemination of the project on a global scale, especially targeted at transboundary basins in developing countries (target 17.7).
CASE STUDIES FLOOD AND DROUGHT MANAGEMENT TOOLS CASE STUDY

274 / SMART WATER M A NAG E M E NT PR OJ E CT 275 / SMART WATER MANAGEMENT PROJECT
5. Lessons learned
Over the course of the four-year FDMT project implementation, several key lessons were learned by the project coordinators. The following section provides an overview of the insights gained from the beginning of the project up until early 2018.
Available DataAs the development of the DSS requires climate and water data relevant for planning from the geographical regions, a barrier to the development in the Volta and Lake Victoria basins was the lack of accessible data. Monitoring stations are sparse in the African basins, the data that is available may be unreliable, and there is limited willingness to share the information that is available. These limitations resulted in the use of freely available global satellite data, and a stronger focus on tools for using remote sensing information.
A further element identified throughout the project was the need to include gender related data and indicators to technical applications. At stakeholder workshops and trainings in the three pilot basins, a great majority of participants were male as the operational level for water utilities is highly male dominant, and retrieving data on gender related topics was not possible. While the FDMT project was mindful of gender issues in the water sector, it is clear that more attention should be aimed at inclusive gender planning in the future, in order to overcome the challenge of a sector which predominately employs men in the workforce. Within the project tools, gender indicators have been identified and integrated in the water indicator application. These include: Estimated Female Earned Income Over Male Value (Ratio); Global Gender Gap Index; Rate of Out of School Children of Primary School Age, Female, Time Spent on Collecting Water; and Water and Sanitation Charges. Such indicators can be useful to inform governance and regulatory practices, for example.
Program UsabilityAs the FDMT project aimed to empower local stakeholders with tools to forecast and plan for flood and drought events, a key consideration was the usability of the DSS programs. Identifying the right people and organisations to work with at the basin, national and local level, including technical staff and policy and decision makers was important for effective engagement.
Early in the project water utilities were not clear how outputs would support planning. However, once the WSP tool came online, it was apparent that this was the entry point (as anticipated) to support planning and introduce climate information. Furthermore, efforts were made to provide utilities with continuous updates and training to overcome the lack of clarity, including a focus on improving their technical capacity to use and interpret information from the tools, then integrate this into their planning.
These frequent stakeholder consultations had further benefits that were helpful to improve the project. First, while the originally proposed DSS had impressive capabilities and outputs, there were concerns that it would be too complex for stakeholders with limited technical capabilities to use and understand. This DSS was a comprehensive desktop-based software, enabling users to tailor a planning process based on functionality and user developed scripts. Feedback from technical workshops and training sessions with local stakeholders encouraged a shift to online tools rather than the original desktop-based software which had required users work in the back-end of the system to receive the functions in the front-end. As such,
C ASE STU DIES FLO O D AND D RO UGH T MANAGE ME NT TOOLS CASE STUDY
the project adapted with these modifications to create a more simplified online system to host the tools which can be used individually or together in a single workflow. A further benefit to the online DSS compared to the originally proposed desktop-based software, is its ability to be used by anybody with access to at least low bandwidth internet. This makes it much more accessible on a global scale, and encouraged the use of the tools by stakeholders outside of training sessions.
Another lesson from the consultations was that while the tools from the FDMT project could be useful, they needed to be incorporated into the stakeholders’ current workflows to ensure that they would be actively used after the project end date. Several previous donor funded projects that occurred in some of the pilot regions found that formalised planning methods (i.e. IWRM, TDA/SAP) are often carried out by external consultants, and not used frequently during the day-to-day work in basin organisations. This identified the need to ensure data and outputs from formal planning within the applications can be incorporated into opera-tional planning by the stakeholders. The FDMT project organisers then worked on creating more tools and manuals to guide stakeholders on how to use the information from the tools in decision-making on flood and drought planning, as well as holding awareness workshops on this topic.
A further finding was that long-term climate change modelling is not of as much interest to water utilities in the basin as seasonal forecasting. This is a useful lesson in that more training and focus could be placed on improving the applications for seasonal forecasting for organisa-tions and utilities dealing with operational planning from months to season. While long-term climate planning was not of as much interest to certain users, it was still important for organ-isations to have the tools to develop long-term strategies and guidelines. Additionally, raising awareness of the importance of long term climate change modelling could help engage local partners to think about its use in their environments. Associated with this lesson is the need to understand and manage stakeholders’ expectations while also finding a balance that aligns with the project’s aims.
CommunicationSpecial attention to language considerations was found to be important to ensure commu-nication channels could flow freely between stakeholders and project coordinators. As the local language differs across the three basins, it was critical to have sufficient translators throughout the process. While English is common in the Lake Victoria basin, French is the predominant language in the Volta basin and Thai in Chao Phraya basin. Not only do trans-lators need to provide communication material to stakeholders on the project, but there also needs to be a means for the project coordinators to receive feedback and input from French and Thai speaking local stakeholders. Having members of the project staff team fluent in Thai and French was important to allow this translation.
Beyond language, stakeholders had to be informed of all the benefits of each tool, in order to encourage them to engage with all planning tools. It was found that when stakeholders had a deep understanding of the benefits and functionality of a tool, they were more enthusiastic about using it. This depended on how the benefits were explained to stakeholders, including the approach and languages used. Awareness workshops and technical trainings for stake-holders provided a good opportunity to share with them the benefits and demonstrate the value of each tool.
CASE STUDIES FLOOD AND DROUGHT MANAGEMENT TOOLS CASE STUDY

276 / SMART WATER M A NAG E M E NT PR OJ E CT 277 / SMART WATER MANAGEMENT PROJECT
SustainabilityMany local stakeholders have constrained financial budgets, and lack capacity in some areas, such as human resources, to carry out key activities after the international partners leave. This is an imperative consideration in ensuring the methodology and tools have long-term sustainability and continue functioning in the basins after the closure of the project. This was addressed by attempts to more effectively communicate benefits of FDMT to encourage its use, strong emphasis on trainings for improved capacity building, as well as planning a follow-up phase after implementation.
6. Conclusion, next steps
The Flood and Drought Management Tools project has developed a global approach to help water managers and other relevant partners better prepare for the effects of climate change in transboundary basins using a SWM approach. This has involved the creation of an online Portal with a package of applications or tools that are freely accessible and user-friendly, providing access to satellite data to display relevant climate and water information in oper-ational basins and a number of other relevant tools to support management and planning of water resources. This was made possible through the joint effort of GEF, UNEP, IWA and DHI, as well as basin and local stakeholders in the Volta, Lake Victoria and Chao Phraya basins who were regularly consulted and trained. Active stakeholder involvement, including learning from their knowledge, was essential for the development of the tools as well as for increasing their awareness and capacity to plan and make informed decisions to address the impacts of floods and droughts in their regions.
Furthermore, as the methodology and most applications are flexible with the aim of a global scope, the Portal is currently accessible to all GEF IW transboundary basins.
6.1 Future of the ProjectThe FDMT project will continue within the three pilot basins until the end of 2018, at which time it is anticipated that the Portal and technical applications developed out of the project will be fully functional. The training of stakeholders, fine tuning of tools and a further upcoming crop application will round out the final work on the project in 2018. The crop application includes a crop calendar module and a crop analysis tool to estimate the crop yield or the crop water demand under given environmental conditions based on AquaCrop, a crop water productivity model developed by the Land and Water Division of FAO. DHI, who is responsible for the devel-opment of the technical applications, will ensure that the web based portal is maintained and functional for a period of three years following the project completion. This does not include technical support or training, but efforts are being made to identify additional funding to cover these areas.
To assist with the project sustainability following the end of the pilot projects, learning pack-ages with all the essential information for understanding the project and tools are being developed for the stakeholders in each basin. While project organisers will not be as active in communication with basin partners following 2018, several measures are in place to continue the dialogue on the FDMT project. The executing organisations have a presence in each of the basins (Ghana, Kenya and Bangkok) where they can assist stakeholders and may be able to hold follow-up training sessions after the official project closure. Furthermore, the online Knowledge Exchange Portal provides a bottom-up living learning resource for future users to discuss among themselves in how to best use and apply FDMT.
C ASE STU DIES FLO O D AND D RO UGH T MANAGE ME NT TOOLS CASE STUDY
While the pilot and learning basin work is wrapping up in 2018, several external projects are being conducted by DHI and IWA that build on the FDMT project. DHI is actively pursuing other projects that will use the Portal and technical tools developed from the FDMT project, in order to further refine them and strengthen the technical components of the tool. Specifically, the use of FDMT applications in other projects are further developing and validating data for seasonal climate and drought assessments, enhancing reporting facilities, improving indicators of tools and validating hazard and risk maps. Table 9 outlines the details of projects DHI is currently collaborating on for these objectives. In addition, the use of the tools within these projects will enhance the sustainability efforts of FDMT and help make its use more widespread.
Table 9. External DHI projects which build on the applications from the FDMT project
Project Name Collaborators Location Timeline
Operational Decision Support System World Bank Malawi 2014-2018
Zambezi water resources information system, Enhancement 3: Hydro-meteorological database and decision support system
World Bank Zimbabwe 2016-2018
Improving resiliency of crops to drought through strengthened early warning within Ghana
Climate Technology Centre and Network (CTCN)
Ghana 2016-2017
Adaptation to climate change through improved information and planning tools for Lake Victoria
Climate Technology Centre and Network (CTCN)
Lake Victoria Basin 2017-2018
Development of the Ayeyarwady Decision Support System and Basin Master Plan
World Bank Myanmar 2017-2019
Earth Observations for Sustainable Development ESA Myanmar 2016-2019
Various DHI projects in South East Asia Malaysia, Thailand, Vietnam, Myanmar
ongoing
In addition to the projects DHI is involved in, IWA is also pursuing projects where the appli-cations from the FDMT project can be used. They are working to identify possible areas of collaboration with the World Health Organisation (WHO) to incorporate relevant tools into their projects. The OPEC Fund for International Development (OFID) is funding a Climate Resilient Water Safety Project in East and West Africa that will incorporate elements of the FDMT project. On top of this, several proposals have been developed that integrate the Flood and Drought Portal.
After the successful development and implementation of the FDMT methodology and tools in the Chao Phraya, Lake Victoria and Volta basins, the project is scaling up. Project organisers are promoting FDMT on a global platform to encourage its use in other transboundary basins, with the aim of improving data sharing and informed planning for floods and drought across the world.
CASE STUDIES FLOOD AND DROUGHT MANAGEMENT TOOLS CASE STUDY
278 / SMART WATER M A NAG E M E NT PR OJ E CT 279 / SMART WATER MANAGEMENT PROJECT
References
Apipattanavis, S., Ketpratoom, S., and Kladkempetch,P. 2018. Water Management in Thailand. Irrigation and Drainage, 67(1): pp.113-117.
Davis, I., Yanagisawa, K., and Georgieva, K. 2015. Disaster Risk Reduction for Economic Growth and Livelihood: Investing in Resilience and Development. Routledge: London and New York.
DHI. 2018. The Expert in Water Environments (DHI Profile Flyer). DHI: Hørsholm. Available at: https://www.dhigroup.com/about-us [Accessed 19-04-2018].
GEF IW:LEARN. 2016a. Chao Phraya Basin Factsheet. Flood and Drought Management Tools: GEF, UNEP, IWA, DHI. Available at: http://fdmt.iwlearn.org/docs/information-sheets [Accessed 26-04-2018].
GEF IW:LEARN. 2016b. Lake Victoria Basin Factsheet. Flood and Drought Management Tools: GEF, UNEP, IWA, DHI. Available at: http://fdmt.iwlearn.org/docs/information-sheets [Accessed 12-04-2018].
GEF IW:LEARN. 2016c. Volta Basin Factsheet. Flood and Drought Management Tools: GEF, UNEP, IWA, DHI. Available at: http://fdmt.iwlearn.org/docs/information-sheets [Accessed 08-05-2018].
Gichere, S.K., Olado, G., Anyona, D.N., Matano, A.S., Dida, G.O., Aduom, P.O., Amayi, J. and Ofulla, A.V.O. 2013. Effects of drought and floods on crop and animal losses and socio-eco-nomic status of households in the Lake Victoria Basin of Kenya. Journal of Emerging Trends in Economics and Management Sciences, 4(1): pp.31-41.
GWCL (Ghana Water Company Limited). 2018. Company Profile. Available at: http://www.gwcl.com.gh/company_profile.html [Accessed 05-06-2018].
GWP (Global Water Partnership). 2011. What is IWRM? Global Water Partnership Central and Eastern Europe. Available at: https://www.gwp.org/en/GWP-CEE/about/why/what-is-iwrm/ [Accessed 11-04-2018].
IMPAC-T. 2016. From IMPAC-T, we have now moved forward to ADAP-T. Available at: http://impact.eng.ku.ac.th/cc/?p=542 [Accessed 18-04-2018].
IW:LEARN. 2018. About IW:LEARN. Available at: https://iwlearn.net/abt_iwlearn [Accessed 05-06-2018].
Jessen, O., & Cross, K. 2018. Data and Information Tool – Water Utilities. Thailand water utility training presentation 2018. Available at http://www.flooddroughtmonitor.com/home [Accessed 21-06-2018].
Kundzewicz, Z.W., Kanae, S., Seneviratne, S.I., Handmer, J., Nicholls, N., Peduzzi, P., Mechler, R., Bouwer, L.M., Arnell, N., Mach, K. and Muir-Wood, R., 2014. Flood risk and climate change: global and regional perspectives. Hydrological Sciences Journal, 59(1), pp.1-28.
Ndehedehe, C.E., Awange, J.L., Corner, R.J., Kuhn, M. and Okwuashi, O., 2016. On the poten-tials of multiple climate variables in assessing the spatio-temporal characteristics of hydrolog-ical droughts over the Volta Basin. Science of The Total Environment, 557, pp.819-837.
Pongpiachan, S., Settacharnwit, T., Chalangsut, P., Hirunyatrakul, P. and Kittikoon, I. 2012. Impacts and preventative measures against flooding and coastal erosion in Thailand. WIT Transactions on Ecology and The Environment, 159, pp.155-166.
Promchote, P., Simon Wang, S.Y. and Johnson, P.G. 2016. The 2011 great flood in Thailand: Climate diagnostics and Implications from climate change. Journal of Climate, 29(1), pp.367-379.
C ASE STU DIES FLO O D AND D RO UGH T MANAGE ME NT TOOLS CASE STUDY
Tang, A. 2015. Hit by drought and seawater, Bangkok tap water may run out in a month. Reuters. Available at: https://www.reuters.com/article/us-thailand-drought-water/hit-by-drought-and-seawater-bangkok-tap-water-may-run-out-in-a-month-idUSKCN0PH00920150707 [Accessed 09-05-2018].
Tong, X., Pan, H., Xie, H., Xu, X., Li, F., Chen, L., Luo, X., Liu, S., Chen, P. and Jin, Y., 2016. Estimating water volume variations in Lake Victoria over the past 22 years using multi-mission altimetry and remotely sensed images. Remote Sensing of Environment, 187, pp.400-413.
WHO (World Health Organisation)/ IWA (International Water Association). 2009. Water safety plan manual: Step-by-step risk management for drinking-water suppliers. WHO, Geneva.
World Bank. 2015. Project Information Document Appraisal Stage: Volta River Basin Stra-tegic Action Programme Implementation. Report No.: PIDA24081. World Bank: Washington. Available at: http://documents.worldbank.org/curated/en/398441468008118810/pdf/PID- Appraisal-Print-P149969-04-09-2015-1428617884691.pdf [Accessed 05-06-2018].
CASE STUDIES FLOOD AND DROUGHT MANAGEMENT TOOLS CASE STUDY

IWRA
K-water (the Korean Water Resources Corporation) is the governmental agency for comprehensive water resource development in the Republic of Korea, with a large pool of practical engineering expertise regarding water resources that
has been championing Smart Water Management for the past decade.
IWRA (the International Water Resources Association) are a non-profit, non-governmental, educational organisation established in 1971, providing
a global knowledge based forum for bridging disciplines and geographies by connecting professionals, students, individuals, corporations and institutions concerned with the
sustainable use of the world’s water resources.
Published by K-water200 Sintanjin-ro, Daedeok-gu, Deajeon, Korea, 34350
Copyright 2018 K-waterAll rights reserved. No part of this publication may be reproduced, stored in a retrieval system
or transmitted in any form by any means without prior permission of the publisher. Use of this publication shall be for education, training or study purposes only.
Full acknowledgement must be provided. Any commercial use shall be prohibited.
Printed in Korea.
This publication was prepared by K-water and IWRA in collaboration with various research institutes, water utilities, universities, government agencies, non-government organisations and other experts in Smart Water Management. It was made possible thanks to the financial
support of K-water.
K-water website: www.kwater.or.krIWRA website: www.iwra.org
SWM Project website: www.iwra.org/swm