Embed Size (px)
Citation preview

Flood Analysis and Prediction Support based onUML and Mobile Petri Net Specification and
VerificationSher Afzal Khan, Rao Sohail Iqbal, Nazir Ahmad Zafar and Farooq Ahmad
Abstract—Flood is one of catastrophic disaster that directlyand indirectly affects the living style of people in the criticalregion. It is proved that there is no mechanism to avoid floodbut only a prediction, which can secure the inhabitants ofinundation areas. To predict flood, different countries adopt dif-ferent techniques like SPH (Smooth Particle Hydrodynamics),Hydrograph, FRICS (The Foundation of River Basin IntegratedCommunications), and DMS (Disaster Management Support)etc. However, it is observed that these techniques do not takean advantage of upcoming development to predict the flood.To cater it, in this research a new model is proposed basedon Mobile Agent technology. Usually the inundation area isdistributed over thousands of kilometers, so far communicationamong agents we prefer to use VSAT (Very Small ApertureTerminal). We categorized the mobile agents according toresponsibility like server and client mobile agents. Client isresponsible for discharge calculations, whereas, the servercalculate an inundation area to predict based on the dischargereceived from the client and historical records. The model isdeveloped using UML activity diagram. Finally, the model isspecified using mobile agent Petri net and then verified byreachibility graph.
Index Terms—Flood Prediction; Mobile Agents; UML Activ-ity Diagram; VSAT.
I. INTRODUCTION
FLOOD is purely a threat for human activities inhabit incritical regions [2]. Many countries faced terrible flood
that remained as fear for generations. Most of flood hazardsoccurrences increased in a lot of countries like India [11],Malaysia [7], China[15], Japan [16], Turkey [5], Bulgaria[12], Pakistan and Bangladesh [1]. The world faced thispotent danger which claimed 20,000 lives and 75millionspeople in every year [1]. Pakistan is one of the countries thatfaced a catastrophic disaster of flood in her history whichcaused human, economic and environmental issues. Floodoccurred in Pakistan in August 2010, it severely affectedalmost the whole country, brought the loss of more than3,000 precious lives, and displaced 10 million people duringthis period. This flood inundated approximately 130 millionhectors of croplands [1]. There are many causes of creationthe flood situation: heavy rains over a small area, twists of air
Manuscript received June 05, 2012; revised July 12, 2012. The travelgrant for this work is supported by the Higher Education Commission ofPakistan for oral presentation.
Sher Afzal Khan is with the Department of Computer Sciences, AbdulWali Khan University, Mardan, Pakistan e-mail:[email protected].
Rao Sohail Iqbal is with the Faculty of Information Technology, Univer-sity of Central Punjab, lahore, Pakistan e-mail:[email protected].
Nazir Ahmad Zafar is with the Department of Computer Science,KingFaisal University, Hofuf,SAUDI ARABIA, Email: [email protected]
Farooq Ahmad is with the Faculty of Information Technology, Universityof Central Punjab, lahore, Pakistan e-mail:[email protected].
over water, high tides, tsunamis in sea, failure of reservoir,and unexpected melting of snow due to warm conditions[11], [15], [16]. Similarly passage of time streaming channelsof rivers also lose their capacity of discharge due to sedi-mentation, as a result a flood situation [14]. Floods mostlyoccur in mountain areas, when absorption of water is lowand overflow is not controllable by river channels. Floods arenatural disaster and inevitable but losses can be minimizedwith well managed mechanism. To manage the flood and tominimize the impacts of disaster, techniques of prediction isa great challenge in countries facing it regularly.
The countries like Netherland, India, China, Malaysia, andPakistan etc, are working for appropriate prediction to rescuetheir people. If a flood is forecasted at a time, then a lotof casualties can be avoided. In forecasting, inundation areaneeds to be calculated for evacuating the inhabitant of criticalregion. For this many of techniques are developed in differentcountries to predict the flood in time for taking appropriatedecisions to counter this potent danger [3], [7], [8]. First andmost famous technique adopted is Hydrograph which plota graph of discharge. In the graph, discharge is representedon y-axis with relative to time on x-axis. Unsteady FlowRiver Model is also used to predict the flood, based oncomputer system that take some parameters like input flow ofriver, capacity of river and discharge for flood prediction[3].Some simulations based solutions [2] are developed likeSPH (Smooth Particle Hydrodynamics) and ANFAS [9].SPH used MAYA, GIS (Geographical Information System),DEM (Digital Elevation Model) and remote sensing imageto model inundation area [7], [13]. ANFAS used simulationbased software for estimating inundation area [15]. FRICS(The Foundation of River Basin Integrated Communications)is a web-based solution with 700 different points all overJapan to calculate river flood and apprise the people throughinternet [16]. A project DMS (Disaster Management Support)initiated by Government of India (GOI) and United StatesAgency for International Development (USAID) to rescuethe people of India from a flood danger. DMS emphasis onflood forecasting and create map of inundation area [11]. Aproject implemented in Turkey and Bulgaria has three phases,one for sharing information and rest phases for prediction[12]. Both countries are connected by a permanent andreliable medium with four stations established in Bulgaria formeasuring the discharge and continuously appraising bothcountries by GSM. From the above discussion it revealsthat serious efforts have been taken to reduce human andeconomic losses, however, it is not achieved with appropriatesuccess [8]. Flood monitoring and prediction systems arecritical and crucial and delay in decision or incorrect decision
Proceedings of the World Congress on Engineering and Computer Science 2012 Vol I WCECS 2012, October 24-26, 2012, San Francisco, USA
ISBN: 978-988-19251-6-9 ISSN: 2078-0958 (Print); ISSN: 2078-0966 (Online)
WCECS 2012

Fig. 1. Server and Client Mobile Agent
may make lives in danger. It is seriously required to developa system that can make correct decision at appropriate timebefore the flood occurred. In existing techniques data is trans-ferred from node to node for decision. In some techniquesimage data is transferred that need a high bandwidth [7], [11],[15]. Since the model is distributed in nature and computa-tional, we proposed a mobile agent approach to develop theflood measurement and prediction in this research. MobileAgent is a new version of agent that transfers its code fromone computer to another in spite of data, [13]. It is faster inexecution as compared to systems transferring data [4], [9].The agents in mobile agent systems can migrate to connected(local) as well as disconnected (remote) agent for execution[9]. It has autonomous ability that support its disconnectedexecution without any interruption on connection lost andcommunicates on connection re-establishing. The importanceof the mobile agent technology can be seen from its applica-tion in different areas [4]. In our model we divide the modelin two part server and client agents as shown in the Fig.1.Server is used to initiate the request to a particular clientabout its discharge uses mobile agent. The client read thedischarge at client and updates the server through a mobileagent to server. Finally, the server agent uses the dischargeat client and makes the prediction of flood with inundationarea using historical data of flood about a particular region.
In the system we propose VSAT (Very Small ApertureTerminal) system for communication among mobile agentsdue to its affective performance in any situation of naturaldisaster. The system is modeled using graphical notations ofUML (Unified Modeling Language) i.e., the activity diagram.UML is a graphical language composed of different notation,help in designing and representing the system. Whereas, theactivity diagram is used to describe procedural logic, businessprocess and work flow. It is very close to flowcharts exceptparallel behavior supported in activity diagram [6]. The useof activity diagram increases in capturing a lot of situations.For representing the distributed computing, activity diagramcan be used due to its parallel behavior. Further for thespecification we use mobile Petri net [20] and its verificationis performed by the reachibility tree. Petri net (PN) isone of the formal methods used for the specification andverification of concurrent and distributed systems [19], [21].PN theory has a sound mathematical basis including linearalgebra, graph theory and discrete mathematics. Therefore,net analysis and verification is possible. Many properties canbe decided by theoretical means. Mobile Petri net is theextension of the Petri net [22]. Further, the connected mobilePetri net is a Petri net. Hence all the verification propertiesof PN can be applied to the MPN. The organization of thepaper is as follows: In section 2, model is developed usingactivity diagram. In section 3, specification and verificationis presented. Finally, conclusion is discussed in section 4.
Fig. 2. Sub Activity Diagram of Client
Fig. 3. Activity Diagram of Mobility
II. THE MODEL BASED ON ACTIVITY DIGRAM
Activity diagram made up of actions based on nodes.There is a start and stop symbol known as initial and finalnode of activity. Initial node is representing by a single filledcircle while final by two concentric circles. Activity diagramhas some specific symbols to represent the logic.
• Fork: A fork has single input flows and multiple outputconcurrent flows. It is represented by a heavy bar. Usingfork concurrent threads can be created simultaneously.Each thread can be executed without interrupting toother.
• Join: A join is similar to fork symbol but opposite inbehave. A join has multiple input flows and a singleoutput. It is used to reduce the threads generated by fork.Multiple fork and join can be used, but there must bea corresponding join to a fork symbol. Multiple threads
Proceedings of the World Congress on Engineering and Computer Science 2012 Vol I WCECS 2012, October 24-26, 2012, San Francisco, USA
ISBN: 978-988-19251-6-9 ISSN: 2078-0958 (Print); ISSN: 2078-0966 (Online)
WCECS 2012
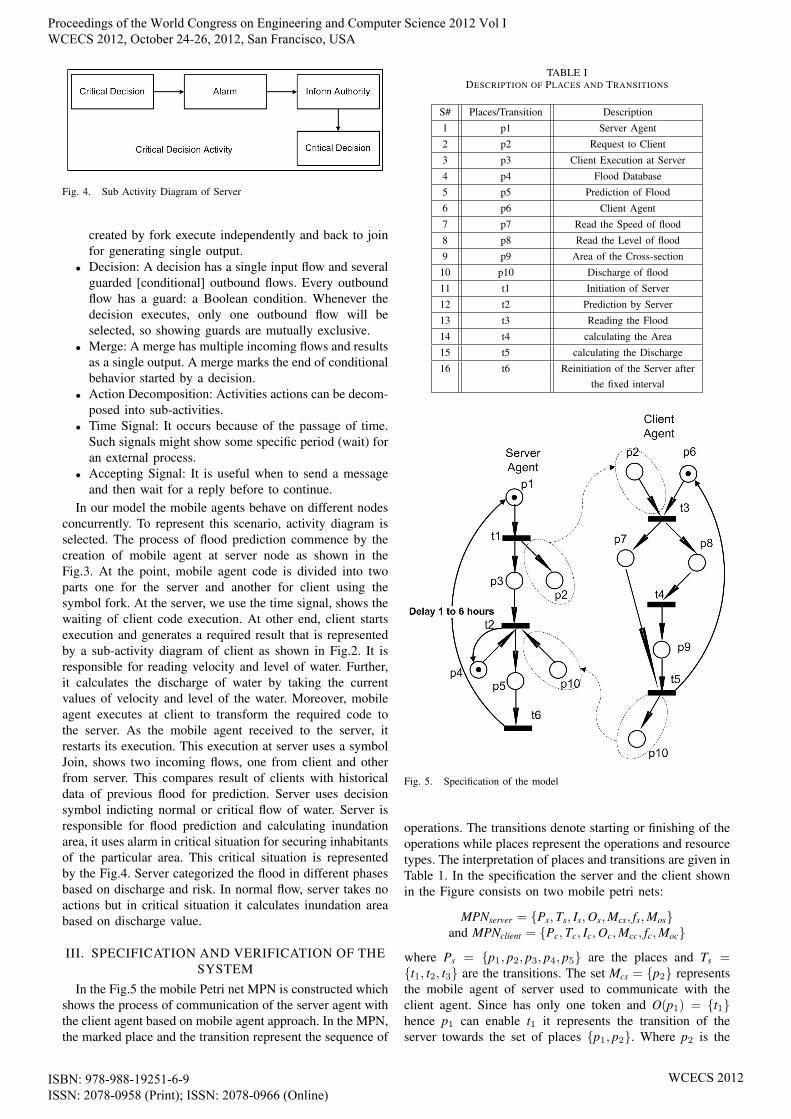
Fig. 4. Sub Activity Diagram of Server
created by fork execute independently and back to joinfor generating single output.
• Decision: A decision has a single input flow and severalguarded [conditional] outbound flows. Every outboundflow has a guard: a Boolean condition. Whenever thedecision executes, only one outbound flow will beselected, so showing guards are mutually exclusive.
• Merge: A merge has multiple incoming flows and resultsas a single output. A merge marks the end of conditionalbehavior started by a decision.
• Action Decomposition: Activities actions can be decom-posed into sub-activities.
• Time Signal: It occurs because of the passage of time.Such signals might show some specific period (wait) foran external process.
• Accepting Signal: It is useful when to send a messageand then wait for a reply before to continue.
In our model the mobile agents behave on different nodesconcurrently. To represent this scenario, activity diagram isselected. The process of flood prediction commence by thecreation of mobile agent at server node as shown in theFig.3. At the point, mobile agent code is divided into twoparts one for the server and another for client using thesymbol fork. At the server, we use the time signal, shows thewaiting of client code execution. At other end, client startsexecution and generates a required result that is representedby a sub-activity diagram of client as shown in Fig.2. It isresponsible for reading velocity and level of water. Further,it calculates the discharge of water by taking the currentvalues of velocity and level of the water. Moreover, mobileagent executes at client to transform the required code tothe server. As the mobile agent received to the server, itrestarts its execution. This execution at server uses a symbolJoin, shows two incoming flows, one from client and otherfrom server. This compares result of clients with historicaldata of previous flood for prediction. Server uses decisionsymbol indicting normal or critical flow of water. Server isresponsible for flood prediction and calculating inundationarea, it uses alarm in critical situation for securing inhabitantsof the particular area. This critical situation is representedby the Fig.4. Server categorized the flood in different phasesbased on discharge and risk. In normal flow, server takes noactions but in critical situation it calculates inundation areabased on discharge value.
III. SPECIFICATION AND VERIFICATION OF THESYSTEM
In the Fig.5 the mobile Petri net MPN is constructed whichshows the process of communication of the server agent withthe client agent based on mobile agent approach. In the MPN,the marked place and the transition represent the sequence of
TABLE IDESCRIPTION OF PLACES AND TRANSITIONS
S# Places/Transition Description
1 p1 Server Agent
2 p2 Request to Client
3 p3 Client Execution at Server
4 p4 Flood Database
5 p5 Prediction of Flood
6 p6 Client Agent
7 p7 Read the Speed of flood
8 p8 Read the Level of flood
9 p9 Area of the Cross-section
10 p10 Discharge of flood
11 t1 Initiation of Server
12 t2 Prediction by Server
13 t3 Reading the Flood
14 t4 calculating the Area
15 t5 calculating the Discharge
16 t6 Reinitiation of the Server afterthe fixed interval
Fig. 5. Specification of the model
operations. The transitions denote starting or finishing of theoperations while places represent the operations and resourcetypes. The interpretation of places and transitions are given inTable 1. In the specification the server and the client shownin the Figure consists on two mobile petri nets:
MPNserver = {Ps,Ts, Is,Os,Mcs, fs,Mos}and MPNclient = {Pc,Tc, Ic,Oc,Mcc, fc,Moc}
where Ps = {p1, p2, p3, p4, p5} are the places and Ts ={t1, t2, t3} are the transitions. The set Mcs = {p2} representsthe mobile agent of server used to communicate with theclient agent. Since has only one token and O(p1) = {t1}hence p1 can enable t1 it represents the transition of theserver towards the set of places {p1, p2}. Where p2 is the
Proceedings of the World Congress on Engineering and Computer Science 2012 Vol I WCECS 2012, October 24-26, 2012, San Francisco, USA
ISBN: 978-988-19251-6-9 ISSN: 2078-0958 (Print); ISSN: 2078-0966 (Online)
WCECS 2012

Fig. 6. Verification of the model
mobile agent uses to activate the mobile Petri net MPNclient ofthe client agent. The specification of client mobile Petri netcontaining Pc = {p6, p7, p8, p9, p10}, Tc = {t3, t4, t5} andthe set Mcc = {p10}. When the server is required to check thestatus of the client, it dispatches the mobile agent {p2}. Thisdescribes the request of the server to know the current statusof the client. In the real sense the data of a flood is usuallyrequired with the interval of one to six hours, where one hourin the critical condition and six hours in the normal situation.The mobile agent {p2}of the server enables the transition ofthe client agent. This further activates the activities denotedby {p7}and {p8}. The {p7} reads the flood speed and {p8}reads the flood levels. Moreover, the condition {p8} enablesthe transition t4 uses the level of a flood to calculate thecross-section area of the region denoted by {p9} throughwhich the flood is passing. At the end of client executionthe conditions {p8} and {p9} enables the transition t5 whichcreates the mobile agent {p10} to the server contains thedischarge of the flood. In server agent, the mobile agent{p10} combined with {p3} and {p4} enables the transition t2.The activity {p4} represents the existing database of the floodand disaster caused. The transition t2 activates {p5} providesthe prediction of the inundation areas. Finally, {p5} enablesthe transition t6 which reinitiate the server after the fixedinterval varying from 1 to 6 hours, depends on the situationof a flood. This is designed by the special arc with delayoption.
A. Verification of the System
To check whether there exist one-to-one functional cor-respondence between the Petri net model and the originalrequirements specification. For this we use the reachabilitytree which is extremely useful for the analysis of PNs. Thismethod involves the enumeration of all reachable markingsor their coverable markings. The Fig.6 shows the reachabilitytree of the model and each marking in the tree lists theplaces holding a token. The reachability tree represents thereachable states of a PN from initial marking {p1+p4+p6}.
In the tree every node represent markings generated andedge from one marking to another represents the transitionfired. Moreover, from the Figure it is depicted that each newmarking enables single transition and leads to single new
marking. It is clear from the tree that the final markingis reachable from their respective initial marking whichrepresents the passing message from the server to the clientand then it ends at the prediction of inundation areas. Everymarking includes the set of places holding a token showingthat the modeled system is safe and the system is undercontrol. The final marking represents the successful operationof the server and client which predicts at server. Moreover,every marking enables a transition showing the absence ofdeadlock in the system.
IV. CONCLUSION
Flood is always a permanent threat for human lives.Efficient prediction techniques can help in securing peopleof inundation area. Existing techniques are not taking thebenefits of advancement of technology developed in recentera. We proposed a model based mobile agent concepts forflood prediction. The specification of the model is presentedby the UML-activity diagram. It described the activitiesand actions which supported concurrent mobility of mobileagents in the system. Further, the whole system is specifiedby mobile Petri net and then verified by the reachibilitygraph. This shows that the system has no deadlock and undercontrol.
REFERENCES
[1] S. Akhtar, The South Asiatic Monsoon And Flood Hazards In The IndusRiver Basin, Pakistan,, Journal of Basic and Applied Sciences (2011),Vol. 7(2), pp 101-115.
[2] P. Anding, Y. Muzhuang and C. Bishan, Flood Hazard Evaluation andGIS in Guangzhou, Proc. Int. Multimedia Technology(ICMT) Conf.,Ningbo (2010), PP 1-4.
[3] L. Bin, C. Xianpu, S. Dongchao and W. Xia, Modeling Techniques ofUnsteady Flow Flood Control River Model ( 2000).
[4] B. Chen, H. H. Cheng and J. Palen, Integrating mobile agent technologywith multi-agent systems for distributed traffic detection and manage-ment system, Transport Research Part C 17 (2009), PP 1-10
[5] H. Cigizoglu, P. Askin, A. Ozturk, A. Gurbuz and O. Ayhan, ArtificialNeural Networks Models In Rainfall-Runoff Modeling of TurkishRivers,” International Conference on river Basin Management, Turcia(2007) pp. 20-27.
[6] M. Dumas and A. H. M. ter Hofstede, UML Activity Diagramsas a Workflow Specification Language. In Proceedings of the 4thInternational Conference on The Unified Modeling Language, ModelingLanguages, Concepts, and Tools, London (2001), pp 76-90.
[7] J. N. Ghazali and A. Kamisn, A Real Time Simulation and Modelingof Flood Hazard,” 12th WSEAS International Conference on System,Heraklion ,Greece (2008), pp 438-443.
[8] Z. Jinxing, W. Yan and L. Yijun, A Review of an Early Warning Tech-nique of Flash Flood and Debris Flow Disaster, ISCO 13th InternationalSoil Conservation Organization Conf., Brisbane, Vol. 4, pp 432-439,July 2004
[9] U. Pinsdorf, V. Roth, Mobile agent Interoperability Patterns and Prac-tice, Proc. of 9 th Annual IEEE Int’l Conf. and Workshop on theEngineering of Computer-Based Systems (ECBS), (2002), pp. 238–244
[10] Samuel and V.E. Sunitha, Document Type Definition for the XMIRepresentation of UML 2.0 Activity Diagram International Journal ofRecent Trends in Engineering , (2009), Vol. 1(1), pp. 85-94
[11] S. K. Sengupta, J. D. Bales, R. Jubach, A. C. Scott,and M. D. Kane,”Flood Forecasting and Inundation Mapping in the Mahanadi RiverBasin: A Collaborative Effort between India and the United States,(2006).
[12] N. Sezen and N. Gunduz, ” Meric River Floods And Turkish- Bulgar-ian Cooperations, ” International Congress on River Basin Management,Turcia, (2007).
[13] W. Yun-fei, Z. Yong-song, C. Wei-hong and L. Peng, ”Flood inndationand disaster prediction based on DEM,” second IITA InternationalConference Geosciences and Remote Sensing, (2010).
[14] Flood control, http : //en.wikipedia.org/wiki/Floodcont−rol, RetrivdSeptember 22, 2011.
Proceedings of the World Congress on Engineering and Computer Science 2012 Vol I WCECS 2012, October 24-26, 2012, San Francisco, USA
ISBN: 978-988-19251-6-9 ISSN: 2078-0958 (Print); ISSN: 2078-0966 (Online)
WCECS 2012

[15] Data Fusion For Flood Analysis and Decision Support,” EuropeanResearch Consortium for Information and Mathematics, ANFAS, http ://www.ercim.org/ANFAS, Retrived September 20, 2011.
[16] Japan Tokai Heavy Rain,” Ministry of lands Japan,” WMO/GWPAssociated Programme on Flood Management, September 2000.
[17] Faces of The Pakistan Flood, http://www.abubakarjamil.com/pakistan-flood-2010/, retrived September 19, 2011.
[18] Perspectives on Charity Accountability,http://rvanbroekhoven.blogspot.com/, retrived September 19, 2011.
[19] Khan, S.A and Zafar, N.A, Improving Moving Block Railway Systemusing Fuzzy Multi-Agent Specification Language, International Journalof Innovative Computing, Information and Control, 7(7(B)):4517-34,2011.
[20] Khan, S.A, Zafar, N.A and Ahmad, F, Petri Net Modeling of RailwayCrossing System using Fuzzy Brakes, International Journal of PhysicalSciences,(2011), Vol.6(14), pp.3389-3397.
[21] Zafar, N.A, Khan, S.A and Araki, K, Towards the Safety Propertiesof Moving Block Railway Interlocking System, International Journal ofInnovative Computing, Information and Control, (Accepted)(2012) 8(7)
[22] Khan, S.A, Zafar, N.A and Ahmad, F, Formal Analysis of SafetyProperties of Railway Interlocking System, PhD Thesis, University ofCentral Punjab, Pakistan, (2011).
Proceedings of the World Congress on Engineering and Computer Science 2012 Vol I WCECS 2012, October 24-26, 2012, San Francisco, USA
ISBN: 978-988-19251-6-9 ISSN: 2078-0958 (Print); ISSN: 2078-0966 (Online)
WCECS 2012


![Quality Prediction Model using UML metrics [1] of [42] Quality prediction model for object oriented software using UML metrics Ana Erika Camargo, Koichiro](https://img.pdfslide.us/doc/110x75/56649e665503460f94b60d53/quality-prediction-model-using-uml-metrics-1-of-42-quality-prediction-model.jpg)