Embed Size (px)
Citation preview

Abstract— This paper presents a simple methodology for river
flood risk map prediction in an urbanized area. River flood risk map
is a function of hazard, vulnerability and exposure. Hence, in this
case, water depth and flow velocity (river flood hazard), land-use
type, road accessibility and debris flow (vulnerability and exposure)
were incorporated. Furthermore, a systematic methodology was
proposed in order to develop and predict river flood risk map for a
range of defined scenarios. Therefore, a total of 6 scenarios were
identified including three rainfall magnitude (20 year, 50 year
and 100 year ARI) and two river basin development conditions
(existing and ultimate). The risk components were combined in
GIS interface and categorized based on a proposed risk value
classification. This case study confirms the efficiency of the
proposed method to some extent. However, more detailed analysis
need to be undertaken towards a well-developed and applicable
framework.
Index Terms— Flood hazard map, Flood risk map, HEC-RAS,
HMS-HMS, Kayu Ara River Basin.
I. INTRODUCTION
Starting in the year 2000s, extreme rainfall events with
high intensity is no longer a new issue in Malaysian urban
cities, especially in the West Coast area. This phenomenon is
formed mostly through convection process [1]. Hence,
flooding is one of the major natural hazards affecting
communities across Malaysia and has caused damages worth
millions of dollars every year. For instance, the required
allocation for flood mitigation projects has increased almost
600% (RM 6000 million) for the 8th
Malaysian Plan
compared to RM 1000 million during the 7th
Malaysian Plan
[2].
Natural risk can be defined as the probability of harmful
consequences or expected loss (of lives, people injured,
property, livelihoods, economic activity disrupted or
environment damaged) resulting from interactions between
natural or human-induced hazards and vulnerable conditions
[3]. Risk is sometimes taken as synonymous with hazard, but
risk has additional implication of the chance and probability a
particular hazard actually occurring. In fact, hazard refers to
the probability of a potentially dangerous phenomenon
occurring in a given location within a specified period of time
[4]. Therefore, risk does not exist if exposure to a harmful
situation does not or will not occur [5-6].
River flood mapping is the process of determining
inundation extents and depth by comparing river water levels
with ground elevation. The process requires the
understanding of flow dynamics over the river and the
1 Discipline of Civil Engineering, School of Engineering, Monash
University Malaysia, Bandar Sunway, Selangor, Malaysia, Email:
[email protected] 2 School of Civil Engineering, Universiti Sains Malaysia, Penang,
Malaysia
adjacent floodplain, topographic relationships and the sound
judgments of the modeler. In fact, river flood mapping is the
foundation of river flood risk prediction, which can be
produced using water depth, flood extent, flow velocity and
flood duration maps [7]. All the existing methods for flood
mapping can be grouped into three major categories namely
analytical, historical and physiographic methods [8]. These
three methods use same procedure to delineate floodplain
boundaries by determining the flood elevation at each river
cross section. The boundaries are then interpolated between
the cross section. The three methods differ only in the way
they determine the water surface profile. River flood
mapping involves three main components as follows [9]:
i. GIS interface as pre-processor (to extract geospatial
data) and post-processor (to visualize model outputs) (i.e.
HEC-GeoHMS and HEC-GeoRAS).
ii. Hydrological model, which develops rainfall-runoff
hydrograph from a design rainfall or historic rainfall event
(i.e. HEC-HMS).
iii. Hydraulic model, which routes the runoff through
river channel to determine water profiles and flow velocity
(i.e. HEC-RAS).
The increasing availability of powerful GIS software
packages offer new opportunities for engineers to perform
flood mapping incorporated with hydrological and hydraulic
models [7]. This is essential as flood modelling is inherently
spatial and hydrological and hydraulic models have large
spatially distributed data requirements [10]. In recent years,
efforts have been made to integrate hydrological and
hydraulic models and GIS to enhance the model outputs,
which led to the establishment of a new branch of hydraulics
and hydrology, namely, hydro-informatics. In general, there
are four methods for incorporating of river basin models into
GIS. They are classified as stand-alone system, loose
coupling system, tight coupling system and embedded
system. In this regard, HEC-GeoRAS and HEC-GeoHMS,
which were utilized in this study, are among tight coupling
system. This paper presents a simple methodology to
generate river flood risk map in an urban area. To this aim,
water depth and flow velocity (river flood hazard), land-use
type, road accessibility and debris flow (vulnerability and
exposure) were incorporated. Moreover, the proposed
methodology was utilized for a case study in Kuala Lumpur
for numbers of defined scenarios.
II. MATERIAL AND METHOD
A. Method
The proposed methodology in this research included five
main components; hydrological modelling, hydraulic
modelling, river flood visualization, river flood hazard
mapping and river flood risk mapping. Note that, in this
River Modelling for Flood Risk Map Prediction: A Case
Study of Kayu Ara River Basin, Malaysia
Sina Alaghmand*1, Rozi b. Abdullah
2, and Ismail Abustan
2
2014 International Conference on Chemical Processes & Environmental Engineering (ICCPEE’14) Dec. 30-31, 2014 Bangkok, Thailand
http://dx.doi.org/10.15242/IAE.IAE1214510 96

research, flood mapping, flood hazard mapping and flood
risk mapping were differentiated. Flood mapping consists of
visualization of hydraulic model results in forms of water
depth and flow velocity, whereas flood hazard mapping
represents combination of water depth and flow velocity to
define various level of flood hazard. Finally, flood risk map
was the resultant of hazard map, land-use, road accessibility
and debris flow risk.
This research involves integration of two numerical
models: HEC Hydrologic Modelling System (HEC-HMS) as
a hydrologic model to simulate rainfall-runoff process and
HEC River Analysis System (HEC-RAS) as a hydraulic
model to route the runoff through river to determine water
surface profiles and flow velocity. In order to assess the
effects of rainfall event magnitude (ARI) and also river basin
land-use development condition on the river flood hazard
maps, six scenarios were defined. These include three
different ARI (20, 50 and 100 years) and two land-use
development conditions (existing and ultimate). In all the
defined scenarios rainfall events with 60 minutes duration are
taken into account. Note that, in order to differentiate
between the various developments conditions, different
percentages of imperviousness were defined for each
development conditions (Table I).
TABLE I: PERCENTAGE OF IMPERVIOUSNESS AREA IN DIFFERENT
DEVELOPMENT CONDITIONS
Development Condition Existing Ultimate
Sub-river basin 1 26% 90%
Sub-river basin 2 26% 90%
Sub-river basin 3 66% 90%
Sub-river basin 4 36% 90%
Sub-river basin 5 66% 90%
B. Study area
Kayu Ara river basin is the case study in this research,
which is located in Kuala Lumpur, Malaysia. The study area
covers an area of 23.22 km2 and is geographically surrounded
within N 3° 6΄ to N 3° 11΄ and E 101° 35΄ to E 101° 39΄.
Kayu Ara river basin is a well-developed urban area with
different land-use and also high population density, and also,
10 rainfall stations and one water level station at the outlet
were available (Figure 1a).
(a)
(b)
Fig. 1. (a) Location of rainfall and water level stations in Kayu Ara river
basin, (b) Geospatial data extracted using HEC-GeoHMS.
III. RESULTS AND DISCUSSION
A. Hydrological modelling
HEC-HMS was used as the hydrological model in this
research, which was linked to GIS using HEC-GeoHMS
extension to extract geospatial input data (Figure 1b). To
develop a reliable numerical model establishing the
credibility of the model is essential. It includes sensitivity
analysis, calibration and validation processes. Sensitivity
analyses were applied to highlight the most sensitive
parameters in the hydrological model. The results of
sensitivity analysis showed that imperviousness, lag-time and
peaking coefficient were the most sensitive parameters.
Moreover, the recorded time series data with 10 minute
intervals was available since 1996. Among the recorded
rainfall and water level time series, 18 rainfall events were
selected for calibration and 18 rainfall events for validation.
The established hydrological model for Kayu Ara was used to
simulate the rainfall-runoff process based on rainfall design
hyetograph extracted from MSMA guideline [11]. Therefore,
IDF polynomial equation for, three ARI (20, 50 and 100
years) were used to derive the design rainfall for 60 minutes
events as an input to HEC-HMS hydrological model (Figure
2). The modeled runoff hydrograph for each scenario,
produced by the validated hydrological model, are shown in
Figure 3.
(a) ARI 20 year
(b) ARI 50 year
2014 International Conference on Chemical Processes & Environmental Engineering (ICCPEE’14) Dec. 30-31, 2014 Bangkok, Thailand
http://dx.doi.org/10.15242/IAE.IAE1214510 97

(c) ARI 100 year
Fig. 2. Hyetographs of the design rainfall for the defined scenarios.
(a)
(b)
Fig. 3. Simulated runoff hydrographs for rainfall events for the six defined scenario; (a) Existing development condition, (b) Ultimate development
condition.
B. Hydraulic modelling and flood visualization
The modeled runoff hydrographs were used as the main
input for hydraulic model. The hydraulic modelling in this
research was conducted for the last 5.1 km of Kayu Ara river.
The hydraulic model, HEC-RAS, were incorporated with
GIS using HEC-GeoRAS extension to prepare geospatial
data. Therefore, 25 surveyed cross-sections at 200 m interval
were used to create Digital Elevation Model (DEM) of the
main channel.
The calibration process of HEC-RAS consisted of a total of
20 events. The flood events for calibration were selected
from the historical data since 1996 at the water level station,
which was located at the outlet of Kayu Ara river basin. In the
validation process, HEC-RAS simulated the flood events
using the calibrated parameters. A total of 10 events, other
than calibration rainfall events, were employed to validate the
model. Furthermore, results of the hydraulic model were
visualized using HEC-GeoRAS. The generated flood extend
maps, flood water depth and flow velocity distribution for the
ultimate development condition scenarios are represented in
Figures 4 and 5.
(a) (b)
(c)
Fig. 4. Water depth and flood extend distribution for ultimate development
condition: (a) ARI 20 year, (b) ARI 50 year and (c) ARI 100 years
(a) (b)
(c)
Fig. 5. Flow velocity distribution for ultimate development condition: (a) ARI 20 year, (b) ARI 50 year and (c) ARI 100 years.
C. Flood hazard mapping
Flood hazard map covers the geographical areas which
could be flooded according to different scenarios [12]. The
magnitude of the damage depends on the flood characteristics
such as water depth and flow velocity [13]. In this study,
water depth and flow velocity are considered as two main
2014 International Conference on Chemical Processes & Environmental Engineering (ICCPEE’14) Dec. 30-31, 2014 Bangkok, Thailand
http://dx.doi.org/10.15242/IAE.IAE1214510 98
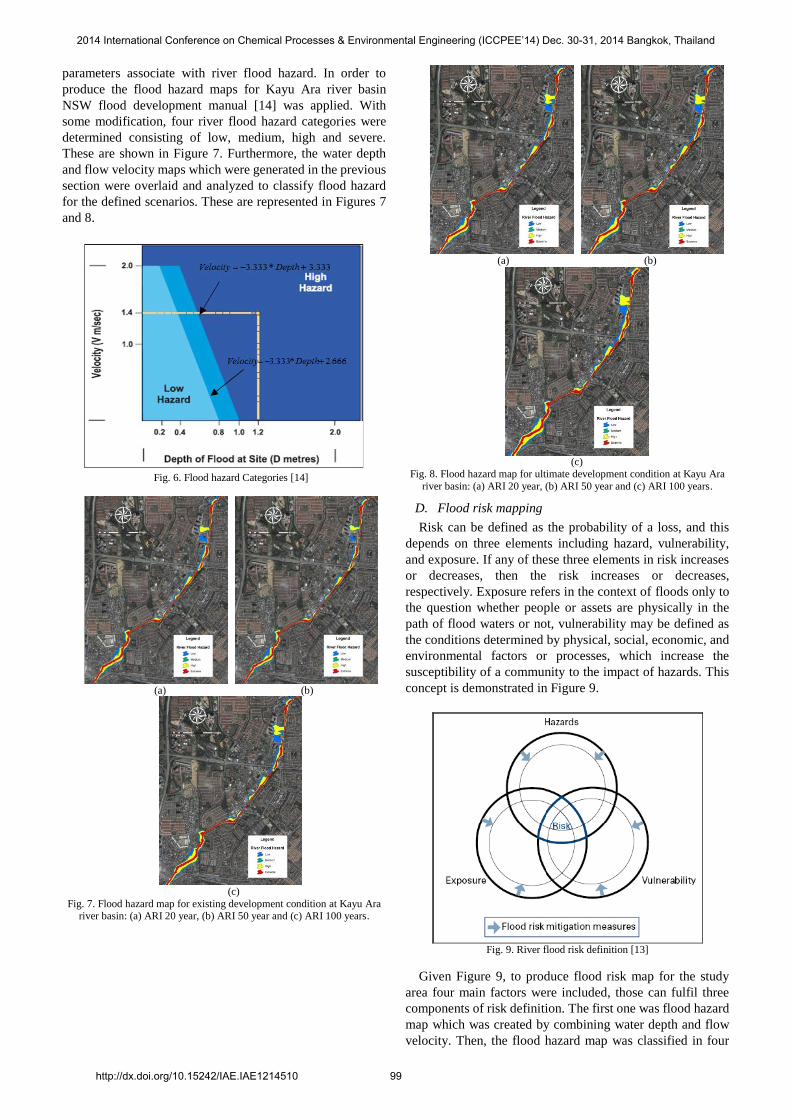
parameters associate with river flood hazard. In order to
produce the flood hazard maps for Kayu Ara river basin
NSW flood development manual [14] was applied. With
some modification, four river flood hazard categories were
determined consisting of low, medium, high and severe.
These are shown in Figure 7. Furthermore, the water depth
and flow velocity maps which were generated in the previous
section were overlaid and analyzed to classify flood hazard
for the defined scenarios. These are represented in Figures 7
and 8.
Fig. 6. Flood hazard Categories [14]
(a) (b)
(c)
Fig. 7. Flood hazard map for existing development condition at Kayu Ara river basin: (a) ARI 20 year, (b) ARI 50 year and (c) ARI 100 years.
(a) (b)
(c)
Fig. 8. Flood hazard map for ultimate development condition at Kayu Ara
river basin: (a) ARI 20 year, (b) ARI 50 year and (c) ARI 100 years.
D. Flood risk mapping
Risk can be defined as the probability of a loss, and this
depends on three elements including hazard, vulnerability,
and exposure. If any of these three elements in risk increases
or decreases, then the risk increases or decreases,
respectively. Exposure refers in the context of floods only to
the question whether people or assets are physically in the
path of flood waters or not, vulnerability may be defined as
the conditions determined by physical, social, economic, and
environmental factors or processes, which increase the
susceptibility of a community to the impact of hazards. This
concept is demonstrated in Figure 9.
Fig. 9. River flood risk definition [13]
Given Figure 9, to produce flood risk map for the study
area four main factors were included, those can fulfil three
components of risk definition. The first one was flood hazard
map which was created by combining water depth and flow
velocity. Then, the flood hazard map was classified in four
2014 International Conference on Chemical Processes & Environmental Engineering (ICCPEE’14) Dec. 30-31, 2014 Bangkok, Thailand
http://dx.doi.org/10.15242/IAE.IAE1214510 99

classes, low, medium, high and extreme hazard. For each
class one value was defined that shows its level in term of
flood risk (Table II).
TABLE II: RISK VALUE FOR FLOOD HAZARD CLASSES
Flood hazard class Low Medium High Extreme
Risk value 1 2 3 4
The second factor which involves in flood risk estimation
is land-use type, which contributes to the vulnerability factor.
For instance, in land-use map, residential and commercial
areas maintain higher risk in comparison with other land-uses
such as roads, water bodies, parks, forests and open areas.
The land-use map was classified in two classes, “residential
and commercial” and “non-residential and non-commercial”.
Therefore, in land-use map pixels with “residential and
commercial” class are assigned “4” and “non-residential and
commercial” are assigned “1” (figure 10b).
The third factor for preparation of flood risk map was
accessibility to main road. A vulnerability analysis considers
the population and structures at risk within the flood
inundated area. In term of vulnerability, the emergency
responses may be required, which includes the need for
evacuation and emergency services. In river flood event the
accessibility to main road is important at least for two
purposes; evacuation of people from inundated area and
emergency services. In fact, locating far from the main road
may lead to slower emergency response during flood
inundation and consequently higher risk (Figure 10c).
The fourth factor which is included in the proposed
methodology is debris flow risk. As the depth of floodwater
increases debris begin to float. For instance, if the flood
velocity is significant, buildings can be destroyed and cars
and caravans can be swept away. In certain areas, the buildup
of debris and the impact of floating objects can cause
significant structural damage to buildings and bridges at the
downstream. Hence, fast moving floodwaters carrying debris
expose a greater threat to both people and structures, than
those with no debris. In this case, debris risk was considered
as a function of distance from the source of the flood. In order
to classify the risk value for debris flows for Kayu Ara river
basin, the distance from the most upstream is considered and
assumed by moving towards downstream amount of debris,
and consequently, the debris risk is increasing (Figure 10d).
All the above mentioned maps were converted into raster
format with 1 m pixel size. In each map, proper values were
assigned for each pixel and combined. Then, the result map
(flood risk) was created based on the summarized risk values
of river flood hazard, land-use type, main road accessibility
and debris flow. For instance, minimum value for the flood
risk map is 4 which reflects the combination of the pixels
with “Low” class in flood hazard map, “non-residential and
commercial” class in land-use type map, “0-100 m” class in
main road accessibility and “0-1500 m” class in debris flow
hazard map. On the other hand, maximum is 16 represents
pixels with “Extreme” class in flood hazard map, “residential
and commercial” class in land-use type map, “> 300 m” class
in main road accessibility and “> 4500 m” class in debris
flow hazard map. Finally, the flood risk map was categorized
into four classes based on the value of each pixel; “Low”
(values 4,5 and 6), “Medium” (values 7, 8 and 9), “High”
(values 10, 11 and 12) and “Extreme” (values 13, 14, 15 and
16). Figure 12 shows summarized the proposed methodology
for flood risk map prediction. Figures 13 and 14 represent the
flood risk maps for Kayu Ara river basin.
(a) Flood hazard map
(b) Land-use map
(c) Main road accessibility map
(d) Debris flow hazard map
(e) Flood risk map
Fig. 10. Summary of proposed methodology for flood risk map prediction.
(a) (b)
(c)
Fig. 11. Flood risk map for existing development condition at Kayu Ara
river basin: (a) ARI 20 year, (b) ARI 50 year and (c) ARI 100 years.
2014 International Conference on Chemical Processes & Environmental Engineering (ICCPEE’14) Dec. 30-31, 2014 Bangkok, Thailand
http://dx.doi.org/10.15242/IAE.IAE1214510 100
(a) (b)
(c)
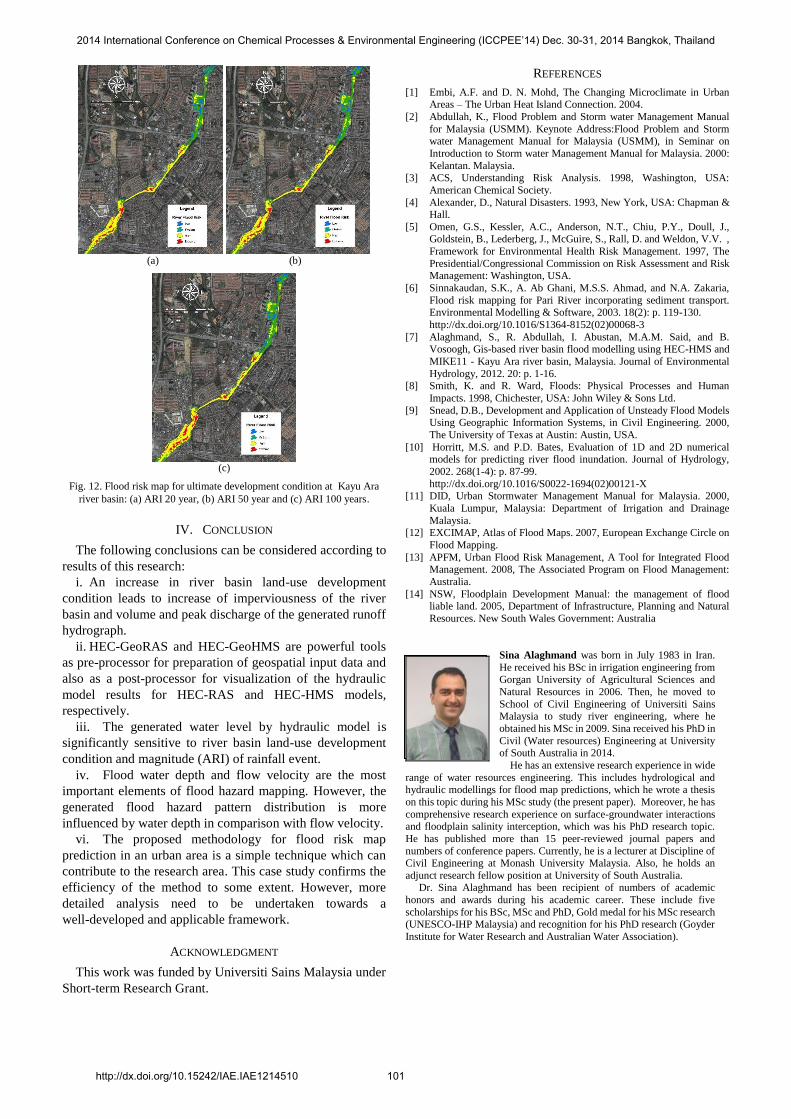
Fig. 12. Flood risk map for ultimate development condition at Kayu Ara
river basin: (a) ARI 20 year, (b) ARI 50 year and (c) ARI 100 years.
IV. CONCLUSION
The following conclusions can be considered according to
results of this research:
i. An increase in river basin land-use development
condition leads to increase of imperviousness of the river
basin and volume and peak discharge of the generated runoff
hydrograph.
ii. HEC-GeoRAS and HEC-GeoHMS are powerful tools
as pre-processor for preparation of geospatial input data and
also as a post-processor for visualization of the hydraulic
model results for HEC-RAS and HEC-HMS models,
respectively.
iii. The generated water level by hydraulic model is
significantly sensitive to river basin land-use development
condition and magnitude (ARI) of rainfall event.
iv. Flood water depth and flow velocity are the most
important elements of flood hazard mapping. However, the
generated flood hazard pattern distribution is more
influenced by water depth in comparison with flow velocity.
vi. The proposed methodology for flood risk map
prediction in an urban area is a simple technique which can
contribute to the research area. This case study confirms the
efficiency of the method to some extent. However, more
detailed analysis need to be undertaken towards a
well-developed and applicable framework.
ACKNOWLEDGMENT
This work was funded by Universiti Sains Malaysia under
Short-term Research Grant.
REFERENCES
[1] Embi, A.F. and D. N. Mohd, The Changing Microclimate in Urban Areas – The Urban Heat Island Connection. 2004.
[2] Abdullah, K., Flood Problem and Storm water Management Manual
for Malaysia (USMM). Keynote Address:Flood Problem and Storm water Management Manual for Malaysia (USMM), in Seminar on
Introduction to Storm water Management Manual for Malaysia. 2000:
Kelantan. Malaysia. [3] ACS, Understanding Risk Analysis. 1998, Washington, USA:
American Chemical Society.
[4] Alexander, D., Natural Disasters. 1993, New York, USA: Chapman & Hall.
[5] Omen, G.S., Kessler, A.C., Anderson, N.T., Chiu, P.Y., Doull, J., Goldstein, B., Lederberg, J., McGuire, S., Rall, D. and Weldon, V.V. ,
Framework for Environmental Health Risk Management. 1997, The
Presidential/Congressional Commission on Risk Assessment and Risk Management: Washington, USA.
[6] Sinnakaudan, S.K., A. Ab Ghani, M.S.S. Ahmad, and N.A. Zakaria,
Flood risk mapping for Pari River incorporating sediment transport. Environmental Modelling & Software, 2003. 18(2): p. 119-130.
http://dx.doi.org/10.1016/S1364-8152(02)00068-3
[7] Alaghmand, S., R. Abdullah, I. Abustan, M.A.M. Said, and B. Vosoogh, Gis-based river basin flood modelling using HEC-HMS and
MIKE11 - Kayu Ara river basin, Malaysia. Journal of Environmental
Hydrology, 2012. 20: p. 1-16. [8] Smith, K. and R. Ward, Floods: Physical Processes and Human
Impacts. 1998, Chichester, USA: John Wiley & Sons Ltd.
[9] Snead, D.B., Development and Application of Unsteady Flood Models Using Geographic Information Systems, in Civil Engineering. 2000,
The University of Texas at Austin: Austin, USA.
[10] Horritt, M.S. and P.D. Bates, Evaluation of 1D and 2D numerical models for predicting river flood inundation. Journal of Hydrology,
2002. 268(1-4): p. 87-99.
http://dx.doi.org/10.1016/S0022-1694(02)00121-X [11] DID, Urban Stormwater Management Manual for Malaysia. 2000,
Kuala Lumpur, Malaysia: Department of Irrigation and Drainage
Malaysia. [12] EXCIMAP, Atlas of Flood Maps. 2007, European Exchange Circle on
Flood Mapping.
[13] APFM, Urban Flood Risk Management, A Tool for Integrated Flood Management. 2008, The Associated Program on Flood Management:
Australia.
[14] NSW, Floodplain Development Manual: the management of flood liable land. 2005, Department of Infrastructure, Planning and Natural
Resources. New South Wales Government: Australia
Sina Alaghmand was born in July 1983 in Iran.
He received his BSc in irrigation engineering from Gorgan University of Agricultural Sciences and
Natural Resources in 2006. Then, he moved to
School of Civil Engineering of Universiti Sains Malaysia to study river engineering, where he
obtained his MSc in 2009. Sina received his PhD in
Civil (Water resources) Engineering at University of South Australia in 2014.
He has an extensive research experience in wide
range of water resources engineering. This includes hydrological and hydraulic modellings for flood map predictions, which he wrote a thesis
on this topic during his MSc study (the present paper). Moreover, he has
comprehensive research experience on surface-groundwater interactions and floodplain salinity interception, which was his PhD research topic.
He has published more than 15 peer-reviewed journal papers and
numbers of conference papers. Currently, he is a lecturer at Discipline of Civil Engineering at Monash University Malaysia. Also, he holds an
adjunct research fellow position at University of South Australia. Dr. Sina Alaghmand has been recipient of numbers of academic
honors and awards during his academic career. These include five
scholarships for his BSc, MSc and PhD, Gold medal for his MSc research (UNESCO-IHP Malaysia) and recognition for his PhD research (Goyder
Institute for Water Research and Australian Water Association).
2014 International Conference on Chemical Processes & Environmental Engineering (ICCPEE’14) Dec. 30-31, 2014 Bangkok, Thailand
http://dx.doi.org/10.15242/IAE.IAE1214510 101