Embed Size (px)
Citation preview

Flight Report
September 09, 2014
Summary
1. HALO Flight Report - AC08 ........................................................................................ 2
1.1 Flight Strategy ......................................................................................................... 2
1.2 Weather Conditions Before the Flight .................................................................... 3
1.3 Conditions During the Flight .................................................................................. 5

2
1. HALO Flight Report - AC08
1.1 Flight Strategy
Today’s flight had focus on inter-comparison between HALO, G-1 and the CHUVA’s
X-band radar over Manacapurú. Both airplanes realized several slices over T3,
capturing atmospheric characteristics inside the radar coverage. A special strategy will
be applied to the radar, which will perform several vertical range-height indicators
(RHI) following the airplanes tracks. One of the objectives is to validate the remote
sensing capability of the radar, through comparison with in-situ data. The took off
occurred at 15:05 UTC (11:05 local time) and landing at 20:19 UTC (16:19 local time).
Figure 1.1 - Flight path of HALO aircraft in September 09, 2014 (AC08). The green circle
represents range rings of distance from X-Band radar. The maximum horizontal distance of
HALO aircraft from radar was 76 km.
Source: http://sigma.cptec.inpe.br/sosmanaus/#

3
1.2 Weather Conditions Before the Flight
Figure 1.2 shows the general weather conditions at 13:00 UTC (9 hours in local time),
approximately two hours before HALO and G-1 took off. To the east of Manaus, fair
weather cumulus was predominant. Some deeper clouds were observed to the
Northwest of Manaus, however outside the reach of the X-band radar. Those systems
were moving in the general direction of West, slightly to the South.
Figure 1.2 - General weather conditions for 09:00 UTC, two hours before HALO
(AC08) and G-1 departures. Red dots are fire spots, green lines are radars coverage.
Satellite image is from the visible channel of GOES-13. Source:
http://sigma.cptec.inpe.br/sosmanaus/#.

4
The Fig.1.3 shows the radiosonde data (a) Skew-T and (b) balloon trajectory for the T3
site at 14:28 UTC (10:28 in local time, some minutes before the flight). It is suggested a
dry environmental between 400 and 200 mb and an wet layer between surface and 600
mb. The wind registered was around 10 m/s in lower levels, with no significant wind
shear. The balloon trajectory show the wind was from east to west.
(a)
(b)
Figure 1.3 - Data from T3 site radiosonde in September 09, 2014 at 14:28 UTC. (a) Skew-
T and (b) Balloon trajectory. Source: http://plot.dmf.arm.gov/plotbrowser/.

5
1.3 Conditions During the Flight
Right after departure, both airplanes started the legs over T3 at Manacapurú, while the
radar started providing RHI fields. Figure 1.4 shows that few clouds were visible by
GOES-13, coherent with isolated fair weather cumulus conditions. The SIPAM S-band
radar observed no rain.
Figure 1.4 - Conditions near the airport close to departure time. Green lines indicate the
X-band radar reach. Satellite image is from GOES-13 visible channel. Source:
http://sigma.cptec.inpe.br/sosmanaus/#.
As the flight progressed, the clouds developed until rain was observed close to
Manacapurú at 18:24 UTC (Figure 1.5a). After three straight legs over T3
(Manacapurú), HALO started circulating in a Northwest-Southeast orientation
repetitively crossing both Solimões and Negro rivers. Figure 1.5b shows that
approximately at 19:12 UTC HALO was close to the precipitating system over the T3
instrumentation. After that, HALO persisted close to this system, collecting data useful
for comparisons also with the ground-based information.

6
a)
b)
Figure 1.5 - GOES-13 visible image and radar reflectivity at a) 18:24 UTC and b)
19:12 UTC. Note: the green lines are the reach of the X-band radar, but the reflectivity
field is from SIPAM’s S-band radar as the former was producing the RHIs. Source:
http://sigma.cptec.inpe.br/sosmanaus/#.
The Fig. 1.6 shows images in visible channel from GOES-13 from 13 to 21 UTC. At
13:30 UTC was observed clouds covering Manaus, with the strongest one occurring in
the northwest of amazon region. During the afternoon (after 19:30 UTC) several deep
clouds with temperature around -60oC appeared. After the HALO flight (after 21:00
UTC) some clouds around Manaus city yet was observed.

7
Figure 1.6 - Visible image from GOES-13 satellite from 13 to 21 UTC in September 09,
2014.
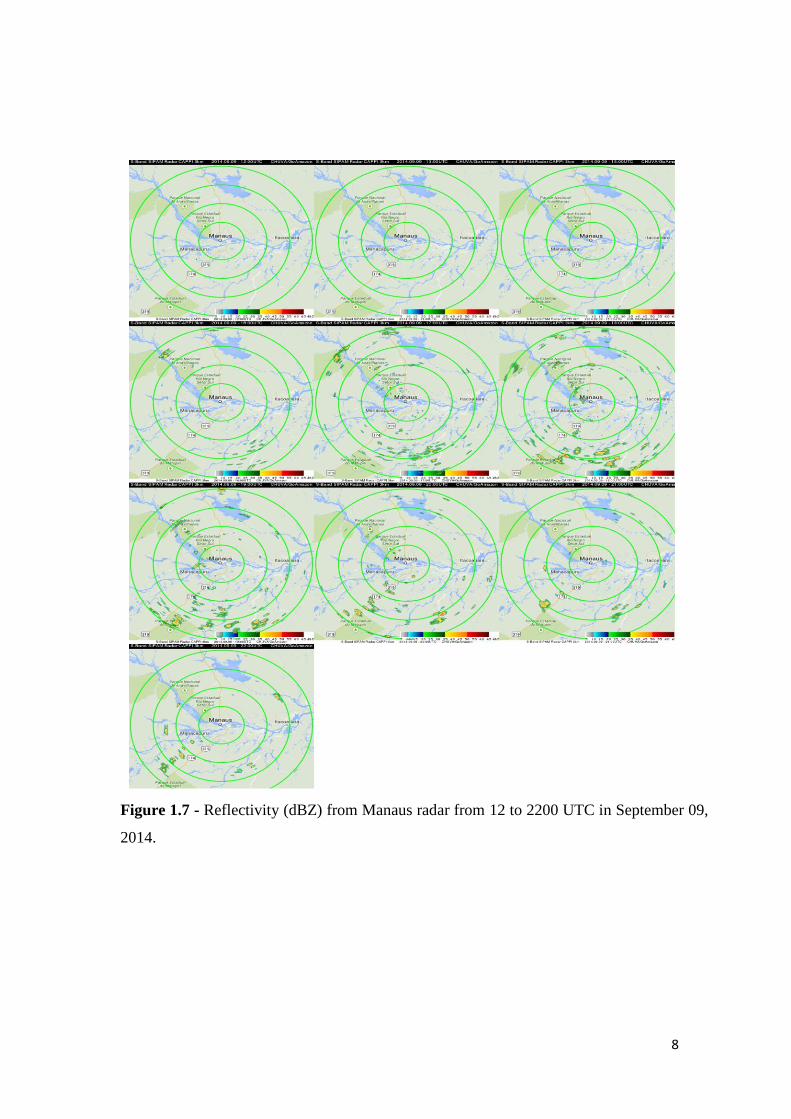
The Fig. 1.7 shows the reflectivity (dBZ) from Manaus radar from 12 UTC to 22:00
UTC. Some precipitation cells were observed just after 16:00 UTC (in consistency with
satellite images) around the Manaus city. However the strongest precipitation cells
appeared close to 18 UTC, with maximum reflectivity around 35 dBZ.
8
Figure 1.7 - Reflectivity (dBZ) from Manaus radar from 12 to 2200 UTC in September 09,
2014.

9
The Fig. 1.8 shows the PPI reflectivity (upper figure) at Manacapuru site 18:58 UTC
from X-Band radar. In addition to SIPAM radar, the X-Band showed the presence just
of small precipitation cells to radar. The cloud top those clouds was close to 6 km, with
supercooled water until 4 km (stronger positive ZDR), as showed by RHIs figures (the
lower figures).
Figure 1.8 - The upper figure is the PPI Reflectivity (dBZ) and the lower figures are the
RHI of horizontal reflectivity (Zh, dBZ), differential reflectivity (Zdr, dB) and specific
differential phase (Kdp, km-1
) from X-band radar at 18:58 UTC in September 09, 2014.

10
The Figs. 1.9 shows some photos showing the HALO and G1 passing above the T3
radar site (upper figure), the middle photo shows picture from HALO of G1 and the
lower is the picture from HALO showing some clouds.
Figure 1.9 - The upper photo shows the HALO and G1 passing above the T3 radar site, the
middle photo shows picture from HALO of G1 and the lower is the picture from HALO
showing some clouds. Courtesy from Vagner Castro/Rachel Albrecht.

Flight Summary: HALO-Campaign ACRIDICON-CHUVA
Flight number: AC08Date, base: 2014-09-09 (Tuesday), SBEGBlock/TO/LDG/Block/FH: ????/1505/2019/????Z /5:40 (may not be exact) Mission type: Formation test flight, cloud profilingFlight pattern: Flight pattern #13, with formation flight with G1 at
lower levels (1500ft), and cloud profiling at stepped levels (4000, 5000, 8000, 9000, 10000, 12000, 14000, 18000, 16000, 14000, 12000 ft), going back and forth around B55a and B54a.
Participants: Aircrew: Pilot: Michael Grossrubatscher Co-Pilot: Steffen GemserTechnician: Thomas Lederer
Scientists: Rachel Albrecht (Mission PI) , Daniel Sauer, StephanMertes, Benhard Bucholz, Thomas Klimach
Observer: Ten. Mendes
FL430
FL180FL160FL140FL120
10000ft9000ft8000ft
5000ft4000ft
1500ft
T3-GoAmazo
B54aSBEGB55a
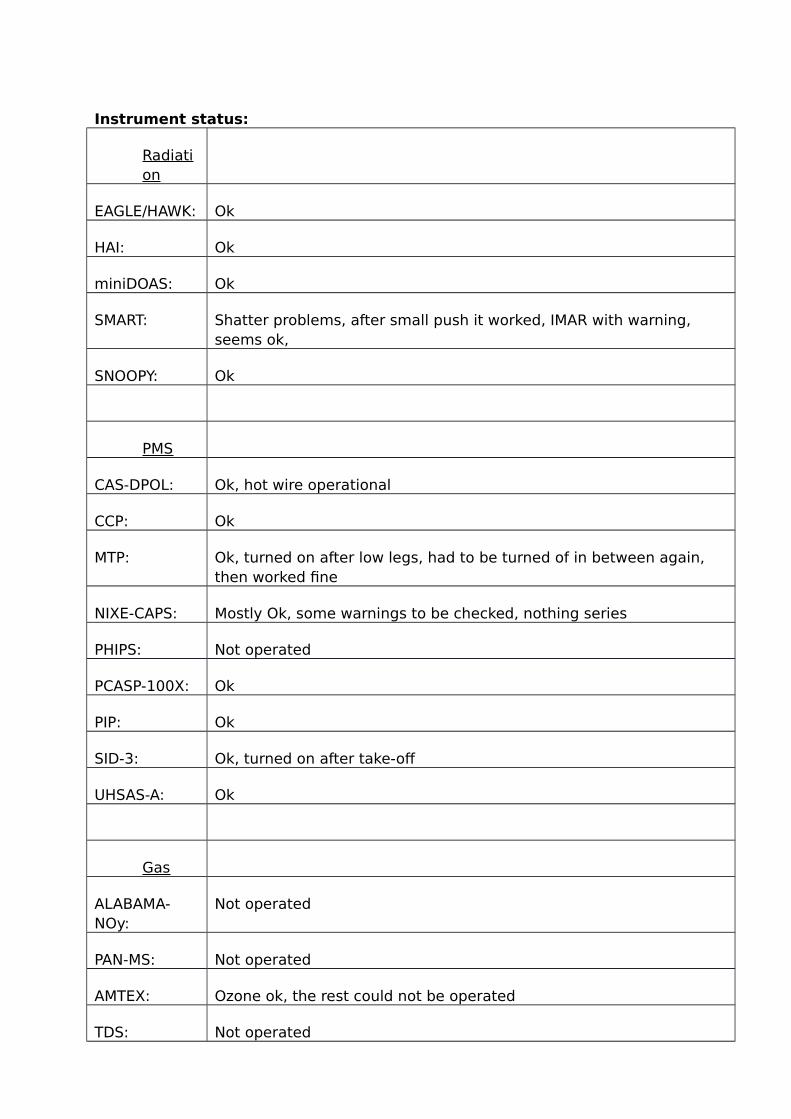
Instrument status:
Radiation
EAGLE/HAWK: Ok
HAI: Ok
miniDOAS: Ok
SMART: Shatter problems, after small push it worked, IMAR with warning, seems ok,
SNOOPY: Ok
PMS
CAS-DPOL: Ok, hot wire operational
CCP: Ok
MTP: Ok, turned on after low legs, had to be turned of in between again, then worked fine
NIXE-CAPS: Mostly Ok, some warnings to be checked, nothing series
PHIPS: Not operated
PCASP-100X: Ok
PIP: Ok
SID-3: Ok, turned on after take-off
UHSAS-A: Ok
Gas
ALABAMA-NOy:
Not operated
PAN-MS: Not operated
AMTEX: Ozone ok, the rest could not be operated
TDS: Not operated

Aerosol
C-ToF-AMS: Ok, was switched several times to CVI, several cloud penetrations
CVI-Rack: Ok, optimum was only slightly changed, electrometer during lower levels
CCN: Ok, might not be affected by the anisokinetic HASI issue, so far so good
AMETYST: Problems with flow control after HASI inlet, probably not isokinetic inlet flows, might affect all instruments behind HASI, first three hours of flight affected
FINCH: Pump switched on during lowest level, okay all the time, was connected to CVI during one time period
BAHAMAS: Ok, time shifts (16 seconds to UTC) have been corrected, we refer to UTC from the time server (system time), check, if you don’t have the UTC it needs to be corrected for past flights, final Bahama file contains real UTC
Front-facing camera
Pilots camera was on until battery died
SatCom: Ok, with some interruptions
Flight remarks:
1505Z: Take off1533Z: Flight formation with G1 @1500ft (may not be exact)
Cloud base at approx. 2500ft1615Z: Hit 1st cloud (MD=10m), and other clouds @3000ft (may not be exact)1618Z: Up to 3500ft1620Z: Up to 4000ft
During 4000 ft level de-icing was switched on and off, should be repeated during next flight with the same cloud
1623Z: Hit cloud @4000ft16:28Z: Hit cloud @5000ft, (MD=5-7m, T=20oC) (only shallow clouds seen from window)1632-1636Z: Hit clouds @5000ft (MD=5.5-10m)1536-1645Z: No clouds, MTP on1645-1649Z: Hit clouds, some with rain (MD=10m)1653Z: @8000ft1654Z: lateral cloud scan with miniDOAS1704-1709Z: Hit clouds, some with rain (MD=15m, T=13oC)
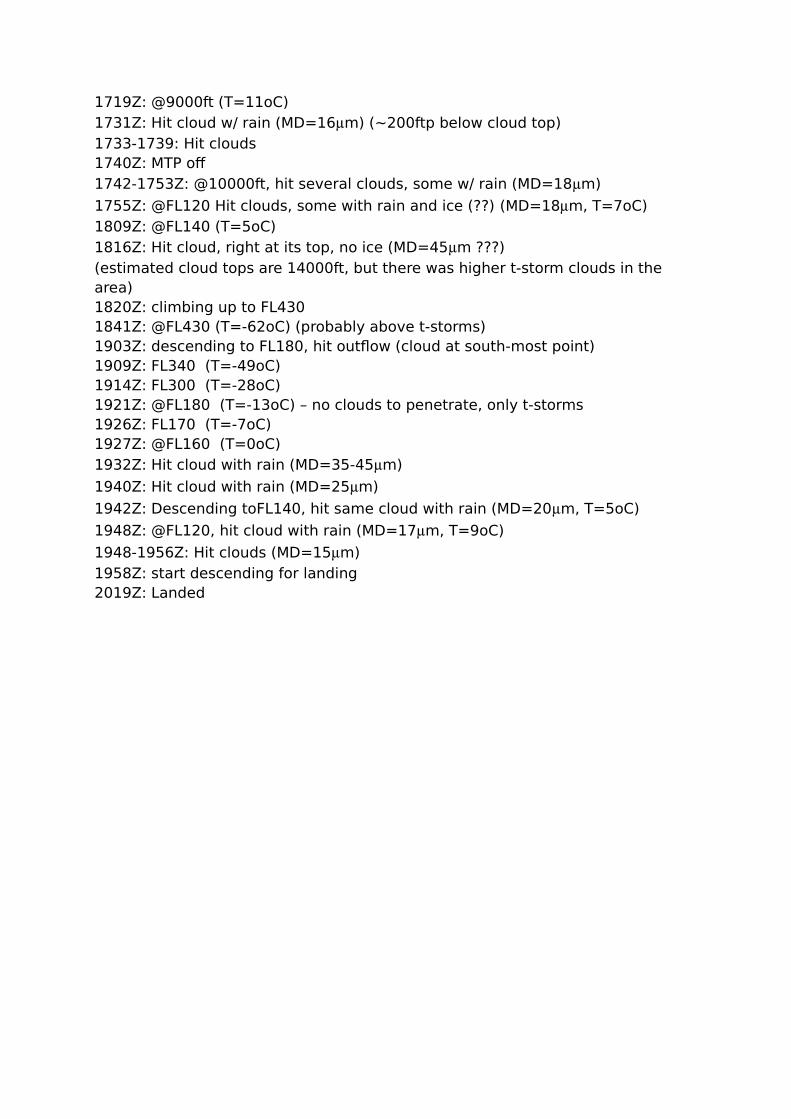
1719Z: @9000ft (T=11oC)1731Z: Hit cloud w/ rain (MD=16m) (~200ftp below cloud top)1733-1739: Hit clouds1740Z: MTP off1742-1753Z: @10000ft, hit several clouds, some w/ rain (MD=18m)
1755Z: @FL120 Hit clouds, some with rain and ice (??) (MD=18m, T=7oC)1809Z: @FL140 (T=5oC)1816Z: Hit cloud, right at its top, no ice (MD=45m ???)(estimated cloud tops are 14000ft, but there was higher t-storm clouds in the area)1820Z: climbing up to FL4301841Z: @FL430 (T=-62oC) (probably above t-storms)1903Z: descending to FL180, hit outflow (cloud at south-most point)1909Z: FL340 (T=-49oC)1914Z: FL300 (T=-28oC)1921Z: @FL180 (T=-13oC) – no clouds to penetrate, only t-storms1926Z: FL170 (T=-7oC)1927Z: @FL160 (T=0oC)1932Z: Hit cloud with rain (MD=35-45m)
1940Z: Hit cloud with rain (MD=25m)
1942Z: Descending toFL140, hit same cloud with rain (MD=20m, T=5oC)
1948Z: @FL120, hit cloud with rain (MD=17m, T=9oC)
1948-1956Z: Hit clouds (MD=15m)1958Z: start descending for landing2019Z: Landed
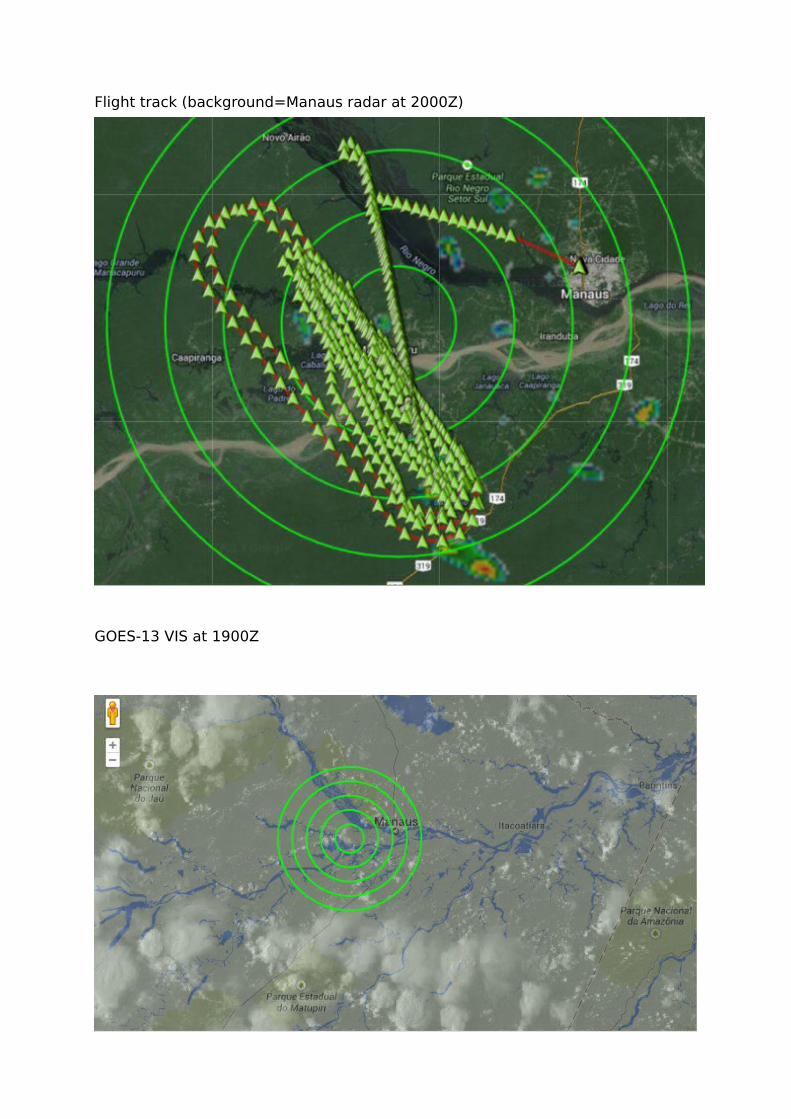
Flight track (background=Manaus radar at 2000Z)
GOES-13 VIS at 1900Z