Embed Size (px)
Citation preview

Flex4Grid Prosumer Flexibility Services for Smart Grid Management
Project no: 646428
Editor: Arso Savanović(SCOM)
Author(s): Arso Savanović (SCOM) Andrej Krpič (SCOM)
Otilia Werner-Kytölä (FIT) Jussi Kiljander (VTT)
Dušan Gabrijelčič (JSI) Živa Stepančič (JSI) Janne Takalo-Matilla (VTT)
Status – Version: V1.0
Date: 31 March 2017
Distribution – Confidentiality: Public
Code: 646428-Flex4Grid – D2.4 Final Cloud-based Data Management Module.doc
WP2
D2.4 Final Cloud-based Data Management Module

Flex4Grid - 646428 31/03/2017
D2.4 Final Cloud-based Data Management Module 2 of 71
Disclaimer
This document contains material, which is the copyright of certain Flex4Grid contractors, and may
not be reproduced or copied without permission. All Flex4Grid consortium partners have agreed to the full publication of this document. The commercial use of any information contained in this document may require a license from the proprietor of that information. The Flex4Grid Consortium
consists of the following companies:
The information in this document is provided “as is” and no guarantee or warranty is given that the
information is fit for any particular purpose. The user thereof uses the information at its sole risk and liability.
Participant
no. Participant organisation name
Part.
short
name
Country
1 (Coordinator) Teknologian tutkimuskeskus VTT VTT FI 2 SAE Automation, s.r.o. SAE SK
3 Smart Com d.o.o. SCOM SI 4 Institut "Jožef Stefan" JSI SI
5 Fraunhofer Institute for applied Information FIT DE 6 Stadtwerke Bonn Energie und Wasser GmbH SWB DE 7 Elektro Celje d.d. ELE SI
8 Bocholter Energie und Wasserversorgung GmbH
BEW DE
Flex4Grid - 646428 31/03/2017
D2.4 Final Cloud-based Data Management Module 3 of 71
Document revision history
Date Issue Author/Editor/Contributor Summary of main changes
27 February 2017 0.1 Arso Savanović (SCOM) Initial draft
20 March 2017 0.2 Jussi Kiljander (VTT), Janne
Takalo-Matilla (VTT)
Section 3.7.
22 March 2017 0.3 Andrej Krpič (SCOM) Sections 3.4 and 3.5
27 March 2017 0.4 Dušan Gabrijelčič (JSI), Živa
Stepančič (JSI)
Sections 3.1, 3.2, and 3.3.
28 March 2017 0.5 Arso Savanović (SCOM) Sections 1 and 7, Executive Summary
29 March 2017 0.6 Dušan Gabrijelčič (JSI) Minor corrections, contribution to Sections
3.7.2 and 5
30 March 2017 0.7 Otilia Werner-Kytölä (FIT), Arso
Savanović(SCOM)
Updates to Section 3.7 and executive
summary
31 March 2017 1.0 Arso Savanović (SCOM) Final release.
Internal review history
Date Reviewer Summary of comments
29 March 2017 Pierre Selmke (BEW) Accepted with small remarks
29 March 2017 Markus Taumberger (VTT) Approved with minor corrections

Flex4Grid - 646428 31/03/2017
D2.4 Final Cloud-based Data Management Module 4 of 71
Table of contents
1. Executive Summary ....................................................................................................................... 6
2. Introduction .................................................................................................................................... 8 2.1. Purpose and scope of this deliverable ....................................................................................... 8 2.2. Document structure ................................................................................................................... 8
2.3. Updates relative to the predecessor deliverable D2.2 ............................................................... 8 3. Services............................................................................................................................................ 9
3.1. Prosumer Cloud Service ........................................................................................................... 9 3.1.1. Implementation snapshot ................................................................................................... 9 3.1.2. Installation setup .............................................................................................................. 10
3.1.3. Service interfaces ............................................................................................................. 11 3.1.4. RESTful management API .............................................................................................. 14
3.1.5. Payloads/Data................................................................................................................... 16 3.1.6. Testing the service ........................................................................................................... 34 3.1.7. Command line tools ......................................................................................................... 34
3.2. MQTT Broker ......................................................................................................................... 35 3.2.1. Purpose............................................................................................................................. 35
3.2.2. Installation........................................................................................................................ 35 3.2.3. Usage................................................................................................................................ 37 3.2.4. Usage examples................................................................................................................ 37
3.3. Data Analytic framework........................................................................................................ 37 3.3.1. Data Processing Framework ............................................................................................ 37 3.3.2. Prediction Model Parameters ........................................................................................... 38
3.3.3. The Prediction Model ...................................................................................................... 46 3.3.4. Processing Model ............................................................................................................. 48
3.4. DMS interface as a service...................................................................................................... 50 3.5. DSO interface as a service ...................................................................................................... 50
3.5.1. Prerequisites ..................................................................................................................... 50
3.5.2. Customization .................................................................................................................. 50 3.5.3. Building............................................................................................................................ 53
3.5.4. Running ............................................................................................................................ 53 3.5.5. Usage – Registration Procedure ....................................................................................... 53 3.5.6. Usage - Global Load Balanced Requests ......................................................................... 61
3.6. Flexibility Aggregation Service .............................................................................................. 62 3.7. End user cloud interfaces ........................................................................................................ 64
3.7.1. REST interface for Prosumer Cloud Service ................................................................... 64 3.7.2. MQTT topics for Real-Time Events ................................................................................ 66 3.7.3. Historical data for visualization ....................................................................................... 68
4. Monitoring .................................................................................................................................... 68 4.1. SmartSNO ............................................................................................................................... 68
5. Cloud services infrastructure...................................................................................................... 70 6. Conclusion and future work ....................................................................................................... 70 7. References ..................................................................................................................................... 71

Flex4Grid - 646428 31/03/2017
D2.4 Final Cloud-based Data Management Module 5 of 71
Table of Figures
Figure 1: Flex4Grid aggregation process........................................................................................... 10 Figure 2: Visualization of summary results from Table 1 for four TPs. ............................................ 39
Figure 3: Visualization of summary results from Table 1 for three environmental parameters. ....... 40 Figure 4: Day peaks in years 2014-2015 from l5 minute measurements for four TP. ...................... 40
Figure 5: Distribution of temperature measurements at 1h time intervals in the years 2014-2015. Points are coloured by class: high, regular or low temperature. ........................................................ 41 Figure 6: Distribution of radiation measurements at 1h time intervals in the years 2014-2015. Points
are coloured by season. ...................................................................................................................... 41 Figure 7: Distribution of precipitation measurements at 1h time intervals in the years 2014-2015.
Points are coloured by season. ........................................................................................................... 42 Figure 8: Scatterplots of environmental parameters and energy consumption at TP Buttejev.most. 42 Figure 9: Scatterplot of temperature and energy consumption at TP Buttejev. most with boxplots,
season clusters and abline marker at 51st day peak. .......................................................................... 43 Figure 10: Scatterplot of temperature and radiation with boxplots and season clusters. ................... 44
Figure 11: Distribution of energy consumption at TP Buttejev.most based on 15-minute time measurement intervals and grouped by day of the week (weekday or weekend). ............................. 45 Figure 12: Distribution of energy consumption at TP Buttejev.most based on 15-minute time
measurement intervals divided into 8 3-h classes (ToD) and grouped by day of the week (weekday or weekend)........................................................................................................................................ 45
Figure 13: Distribution of consumption values of 15-minute time measurements at TP Butteje.most based on ToD and DoW parameters. ................................................................................................. 46 Figure 14: ANN for TP Jeder 1-hour time measurements with one hidden layer (6 neurons). ......... 47
Figure 15: Comparison of standardised actual and predicted consumption values on the test set of TPs Jedert 1-hour time interval data with 1 hidden layer of 6 neurons. ............................................ 47
Figure 16: Process model - data flow. ............................................................................................... 48 Figure 17 Create Invitations............................................................................................................... 53 Figure 18 Invitation List .................................................................................................................... 54
Figure 19 Customer registration page ................................................................................................ 55 Figure 20 Customer registration form page ....................................................................................... 57
Figure 21 Registration in progress page ............................................................................................ 57 Figure 22 Signup confirmation email ................................................................................................ 57 Figure 23 Thank you page ................................................................................................................. 58
Figure 24 User page ........................................................................................................................... 59 Figure 25 New Flex4Grid registration email ..................................................................................... 59
Figure 26 Gateway Registrar ............................................................................................................. 60 Figure 27 Gateway Registrar List view ............................................................................................. 60 Figure 28 GLB Requests – Calendar view ........................................................................................ 61
Figure 29 New LB request ................................................................................................................. 61 Figure 30 LB request results ............................................................................................................. 62
Figure 31. GLB usage for the first time (creates necessary SQL tables). .......................................... 63 Figure 32: SmartSNO ........................................................................................................................ 69

Flex4Grid - 646428 31/03/2017
D2.4 Final Cloud-based Data Management Module 6 of 71
1. Executive Summary The deliverable D2.4 Final Cloud-based Data Management Module is a prototype (DEM – demonstrator), while this report is an accompanying document, which provides an overview of (SW developments of) the Final Cloud-based Data Management prototype. This deliverable is an update of predecessor D2.2 Initial Cloud-based Data Management Module, the changes in D2.4 relative to D2.2. are explained in the introductory section. This D2.4 demonstrator comprises the final prototypes of the Flex4Grid (F4G) cloud data services, which are presented in some detail: Prosumer Cloud Service, MQTT Broker, Data Analytic, DMS interface as a service, DSO interface as a service, Prosumer Flexibility Management, and End user cloud interfaces. Additionally, a short overview of the F4G cloud infrastructure and monitoring system is presented in this report. Prosumer Cloud Service (PCS) is a core and most complex Flex4Grid service in the cloud. It enables collection of the data from various other services and components and storage of the data. The service represents long term "memory" of the system in contrary to the information communicated through the messaging system like MQTT. The latter represents real time traffic and is not stored in the messaging system for extended period of time. Detailed description of service and management interfaces, data, installation, and testing of PCS is provided in this report.
An MQTT broker is a service required by MQTT, the messaging protocol used for much of the event -based communication between many of the Flex4Grid system components. Various implementations of the MQTT broker are available. The implementation chosen for Flex4Grid is Mosquitto, which is BSD licensed open source and readily available for download and installation either in the project homepage or in the native packaging services of many GNU/Linux distributions. The broker installation and usage is described in this report along with links to other deliverables with more Flex4Grid specific details. In Flex4Grid project prediction of peaks in energy consumption is necessary. As energy levels are numeric, we are building a non-linear regression model based on historic consumption data and environmental variables, such as temperature, solar radiation and precipitation. Data processing model for prediction follows the steps for data analytics process: 1) problem definition, 2) acquire data, 3) prepare data, 4) build model, 5) evaluate model, and 6) visualization and interpretation of results. This report describes parameters needed for the prediction model, which were acquired and prepared following steps 2 and 3 above, the prediction model itself, and the data processing model, which is complementary to the six steps of data analytics process The F4G DMS Interface component is a gateway between electricity distribution systems and F4G Cloud Infrastructure. In order to avoid redundancy, it is only briefly described in this report with a link to a detailed description in a dedicated deliverable D3.4 Final DMS Interface Component. The Flex4Grid DSO Interface component can be split into three subcomponents: 1) The DSO Admin interface provides the distribution utility with means to manage Flex4Grid users, gateways and global load events, 2) The DSO User Page interface provides a registration page for participants, and 3) The DSO End-User interface provides a registration API for mobile devices. Implementation and usage of the components are described in this report. The Prosumer Flexibility Management (PFM) consists of two functional blocks: Global and Local Load Balancer. Together they are responsible for incentive based peak reduction activities for household load manipulation. As the Local Load Balancer is out of the scope of this report, it presents installation and usage of the Global Load Balancer module which provides the Flexibility Aggregation Service in the cloud. The end user interface (EUI) is built on top of the Android (minimum SDK version 19) and iOS platforms. The EUI itself is described in D3.5 Final User Interactions, while this report describes cloud APIs utilised by the

Flex4Grid - 646428 31/03/2017
D2.4 Final Cloud-based Data Management Module 7 of 71
end user interface, most notably the API to Prosumer Cloud Service and MQTT topics for relevant real time events. SmartSNO is SCOM’s solution for monitoring network elements and IT/cloud infrastructure using Simple Network Management Protocol (SNMP), as well as REST and MQTT probes. This report provides a brief overview of SmartSNO with a link to more detailed description in deliverable D6.2 First Pilot Deployment. F4G services have been deployed in the cloud infrastructure setup by the project. In the pilot phase the infrastructure has migrated from common to pilot-specific and moved to the piloting country, i.e. the data controller responsible for the pilots and the participating prosumers personal information, as it is described in the Data management plan deliverable D7.1. This report describes deployment of cloud services for the purposes of pilots and testing.

Flex4Grid - 646428 31/03/2017
D2.4 Final Cloud-based Data Management Module 8 of 71
2. Introduction
2.1. Purpose and scope of this deliverable The deliverable D2.4 Final Cloud-based Data Management Module is a result of Tasks T2.1 to T2.4 within WP2 and is a successor to D2.2 Initial Cloud-based Data Management Module. D2.4 is a prototype (DEM – demonstrator), while this report is an accompanying document, which provides an overview of (developments of) the final Cloud-based Data Management prototype. The aim of the D2.4 demonstrator is to provide the final prototype of Flex4Grid cloud data services.
2.2. Document structure The reminder of this deliverable is structured as follows:
Section 3 describes in some detail the final Flex4Grid cloud services prototypes, with a separate subsection for each service, i.e. Prosumer Cloud Service (PCS, formerly named Global data collection and storage), MQTT Broker, Data Analytic Framework, etc.
Section 4 provides an overview of the infrastructure monitoring system
Section 5 provides an overview of the infrastructure providing the services described in Section 3
Section 6 provides concluding remarks
2.3. Updates relative to the predecessor deliverable D2.2 In comparison to its predecessor D2.2, the following main changes have been introduced in deliverable D3.4:
Prosumer Cloud Service (PCS) overhauled:
Global Data Collection and Storage rebranded to Prosumer Cloud Service
Sections 3.1.3 and 3.1.4 updated to match the implementation: interfaces added and updated in the Table 1 and Table 2
A number of collections and resources added in PCS description
PCS deployment documentation is simplified, the notion of service instances has been removed, this is now described in the WP6 reports
Implementation snapshot extended with PCS companion services, listener, aggregation and gateway listener.
Gateway test service section removed, not needed anymore
MQTT section updated, configuration
Data Analytic section overhauled
DMS interface as a service description is shortened and linked to a detailed description of the final component prototype in D3.4
DSO interface component description updated and expanded
Minor updates in the Prosumer Flexibility Service focuses on Flexibility Aggregation, i.e. Global Load Balancing
Minor updates to Monitoring section, with links to descriptions of Flex4Grid specific details in D6.1
Minor updates to Cloud Services Infrastructure section

Flex4Grid - 646428 31/03/2017
D2.4 Final Cloud-based Data Management Module 9 of 71
3. Services
3.1. Prosumer Cloud Service Prosumer Cloud Service is a core Flex4Grid service in the cloud. It enables the collection of data from
various other services and components and storage of the data. The service represents long term
"memory" of the project system in contrary to the information communicated through the messaging
system like MQTT. The latter represents real time traffic and is not stored in the messaging system for
extended period of time.
3.1.1. Implementation snapshot
The Prosumer Cloud Service has been implemented as a web service. The implementation is mostly based
on Python asynchronous Tornado web server.1 The storage itself is based on Mongodb,2 one of the leading
open source NoSQL databases.
The implementation can be found in the project git repository. The main components are:
JSI/cloud/pcs_service.py: Prosumer Cloud Service implementation
JSI/cloud/listener.py: MQTT listener
JSI/cloud/aggregator.py: Aggregation of measurement data
JSI/cloud/gateway_listener.py: Simple web service listening to gateways
JSI/cloud/test*: service and listener unittests
Listener The listener service listens to the MQTT traffic and stores it to the database. The implementation is using
Paho Eclipse MQTT client3. The listener collects measurement messages, devices and household states, LVC
- Version Controller - statuses and other events emitted through the MQTT.
Aggregation service The measurements received from the gateways are not sent in fixed time intervals. The sending interval is
roughly 10 seconds, but due to network conditions and other circumstances the messages could be late, in
different order or even duplicated. They are send with MQTT QoS 1, guaranteeing the messages will be
delivered at least once.
The aggregation service aggregates the messages into intervals of 1 minute, 15 minutes, 1 hour, 6 hours
and a day. The aggregation is done per device, all devices in the household, and areas. The service is run in
parallel to the PCS and triggered in cron4 like manner. As a time scheduler, the Advanced Python Scheduler5
is used. The aggregation itself is done with the help of Mongodb aggregation pipelines.
1 See Tornado web page for details: http://www.tornadoweb.org/en/stable/. 2 See Mongodb home page for details: https://www.mongodb.org/. 3 See the client web page for details: http://www.eclipse.org/paho/ 4 Cron is time based scheduler in Unix l ike systems. 5 See Advanced Python Scheduler web page for details.
Flex4Grid - 646428 31/03/2017
D2.4 Final Cloud-based Data Management Module 10 of 71
The aggregation intervals are aligned with aggregation done on the DMS smart grid measurements. These
measurements are inserted into the PCS by using DMS collect API. The aggregation of that data is done on
the fly at the time of ingest. The data is ingested once per day, for the previous day.
The aggregated data is written in the database in a format similar to one presented in Resource S
(Aggregated information). The data is extended with few time/date identifiers enabling fast data retrieval.
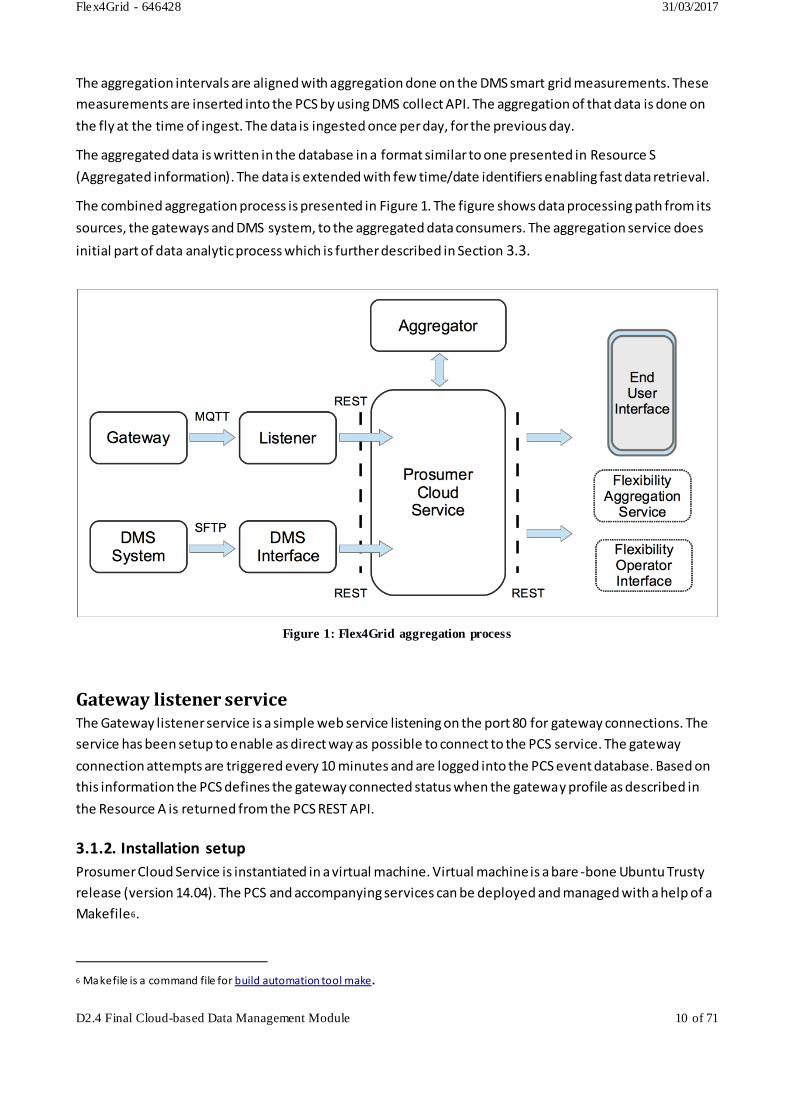
The combined aggregation process is presented in Figure 1. The figure shows data processing path from its
sources, the gateways and DMS system, to the aggregated data consumers. The aggregation service does
initial part of data analytic process which is further described in Section 3.3.
Gateway listener service The Gateway listener service is a simple web service listening on the port 80 for gateway connections. The
service has been setup to enable as direct way as possible to connect to the PCS service. The gateway
connection attempts are triggered every 10 minutes and are logged into the PCS event database. Based on
this information the PCS defines the gateway connected status when the gateway profile as described in
the Resource A is returned from the PCS REST API.
3.1.2. Installation setup
Prosumer Cloud Service is instantiated in a virtual machine. Virtual machine is a bare -bone Ubuntu Trusty
release (version 14.04). The PCS and accompanying services can be deployed and managed with a help of a
Makefile6.
6 Makefile is a command file for build automation tool make.
Figure 1: Flex4Grid aggregation process

Flex4Grid - 646428 31/03/2017
D2.4 Final Cloud-based Data Management Module 11 of 71
The Makefile enables deployment of the services including all required python and other system packages,
changes to the configurations and instantiation of Upstart7 start-up scripts. The Makefile enables combined
services management and updates of the services directly from the project git (make reload).
test:~/flex4grid/JSI/cloud:> make
Targets:
- help (default), outputs this help
- pcs-ssl [GIT_USER=...] deploys pcs-ssl service for user master
- reload [GIT_USER=...] updates from git and restart the pcs-ssl, listener, gateway_listener and
aggregator service
- [start|stop|restart|status] report services status (pcs-ssl&all the services)
- remove-* removes a '*' service
- clean removes unnecessary files
3.1.3. Service interfaces
In the following section, current Prosumer Cloud Service interfaces are presented. The interfaces are
specified as a resource, description of the REST API GET method and payload/data type. All the interfaces
presented in
Table 1 are implemented.
Table 1: Prosumer Cloud Service interfaces
Resource GET method description Payload type
/gateways Returns a list (IDs) of all local
gateways.
collection A
/gateways/<gateway_id> Returns a gateway profile. resource A
/gateways/<gateway_id>/connect According to authenticated
gateway id in the session
returns the gateway profile
resource A
/households Returns a list (IDs) of all
households.
collection B
/households/<household_id> Returns a profile of the
household
resource B
/areas Returns a list (IDs) of areas collection E
/areas/<area_id> Returns an area description resource F
7 Upstart i s event based Unix services start-up system.

Flex4Grid - 646428 31/03/2017
D2.4 Final Cloud-based Data Management Module 12 of 71
Resource GET method description Payload type
/areas/experiment?[parameters] Returns a list of experiments collection G
/areas/<area_id>/experiment?[parameters] Returns a list of area
experiments
collection G
/areas/<area_id>/experiment/<experiment_id> Returns the area experiment resource J
/dso/euid/<eui_id>/sign Returns signed certificate resource N
/dso/households/status Returns the status of all
households and gateways
resource K
/households/<household_id>/devices Returns a list of all Flex4Grid
devices (i.e., smart plugs,
clamps, etc.) deployed into the
household.
collection C
/households/<household_id>/appliances Returns a list of appliances (i.e,
Freezer, TV, washing machines,
etc.) deployed into the
household.
collection D
/households/<household_id>/appliances/<appliance_id> Returns a profile of the
appliance.
resource E
/households/<household_id>/associations Returns a list of active
associations.
collection F
/households/<household_id>/consumption?[parameters] Returns historical consumption
values
resource C
/households/<household_id>/devices/
consumption?[parameters]
Return a consumption of a
Flex4Grid device
resource D
/households/<household_id>/devices/<device_id>/
consumption?[parameters]
Returns device historical
consumption values
resource C
/households/<household_id>/appliances/<appliance_id>/
consumption?[parameters]
Returns appliance historical
consumption values
resource C

Flex4Grid - 646428 31/03/2017
D2.4 Final Cloud-based Data Management Module 13 of 71
Resource GET method description Payload type
/areas/stats[url set¶meters] Returns areas consumption
statistics
resource R
/areas/<area_id>/stats[url set¶meters] Returns area consumption
statistics
resource R
/households/<household_id>/stats[url set¶meters] Return a household
consumption statistics based on
DMS data
resource R
/households/<household_id>/devices/
stats[url set¶meters]
Return a consumption statistics
of all household devices
according to the set or
parameters
resource R
/households/<household_id>/devices/<device_id>/
stats[url set¶meters]
Return a consumption statistics
of a Flex4Grid device according
to the set or parameters
resource R
/areas/aggregate[url set¶meters] Returns areas aggregated
consumption
collection J,K
/areas/<area_id>/aggregate[url set¶meters] Returns the area aggregated
consumption
collection J,K
/households/<household_id>/
aggregate[url set¶meters]
Return a household aggregate
consumption based on DMS
data
collection J,K
/households/<household_id>/devices/aggregate[url
set¶meters]
Return a aggregated
consumption of all household
devices according to the set or
parameters
collection J,K
/households/<household_id>/devices/<device_id>/
aggregate[url set¶meters]
Return a aggregate
consumption of a Flex4Grid
device according to the set or
parameters
collection J,K
/households/<household_id>/events Returns a list of household
related events
collection H

Flex4Grid - 646428 31/03/2017
D2.4 Final Cloud-based Data Management Module 14 of 71
Resource GET method description Payload type
/version Returns current service version resource H
/whoami Returns the information about
credentials used
resource I
3.1.4. RESTful management API
Following RESTful management API is proposed. Some of the resources have fully defined REST API with
PUT, POST and DELETE methods. In some cases, where the calls make no sense, they are omitted and noted
with dash (-). In cases when the information is obtained from MQTT messages, this is noted in parenthesis.
All the methods in the Table 2 are implemented. In MQTT case this means that the implementation is done
in listener.py script as explained in the section 3.1.1.
Table 2: Prosumer Cloud Service management interfaces
Resource PUT POST DELETE
/gateways/<gateway_id> Replaces the
addressed
gateway
description,
resource A
- Deletes the
addressed
gateway
description.
/households/<household_id> Replaces the
addressed
household profile,
resource B
- Deletes the
addressed
household profile.
/households/<household_id>/consumption This data is
collected from the
MQTT, resource C
- -
/households/<household_id>/devices - This data is
collected from the
MQTT, resource D
-
/households/<household_id>/
devices/<device_id>
This data is
collected from the
MQTT, resource D
- -

Flex4Grid - 646428 31/03/2017
D2.4 Final Cloud-based Data Management Module 15 of 71
Resource PUT POST DELETE
/households/<household_id>/devices/
<device_id>/consumption
This data is
collected from the
MQTT, resource C
- -
/households/<household_id>/appliances - Create a new
appliance profile
into the database,
resource E
-
/households/<household_id>/appliances/
<appliance_id>
Replace the
addressed
appliance profile
with a new one,
resource E
- -
/households/<household_id>/associations - Create a new
associations into
the database.
Payload is
Resource G.
-
/household/<household_id>/events This data is
generated from
the MQTT,
resource K
- Deletes events,
collection H
/households/<household_id>/
events/search
Creates a
collection H,
payload is
resource T
/areas/experiment - Creates a new
experiment in all
areas, collection
G, payload is
resource U
-
/areas/<area_id>/experiment - Creates a new
area experiment,
resource J
-

Flex4Grid - 646428 31/03/2017
D2.4 Final Cloud-based Data Management Module 16 of 71
Resource PUT POST DELETE
/dms/collect - Collects DMS data
injected by DSO
interface,
resource L or
collection I
-
/dso/euid/<eui_id>/sign - Accepts certificate
signing request,
resource M
-
/dso/resource/<resource_type>/
<resource_id>/policy/<acl_id>
Adds acl id to the
resource policy,
resource O is
created from the
URL
Remove acl_id
from the resource
policy
/authorize/mqtt - Asks for
authorization to
communicate
through MQTT
broker, resource P
-
/authorize/glb - Asks for
authorization to
access GLB
interfaces,
resource P
-
3.1.5. Payloads/Data
The payloads/data section specifies the information exchanged through the specific interface as noted in
Table 1 and Table 2.
Collection A (Gateways)
Parameter Possible values Description
gateways List List of gateway IDs (e.g. )
Example:
{"gateways": [ "01:23:45:67:89:ab", "ba:98:76:54:32:10", …]}

Flex4Grid - 646428 31/03/2017
D2.4 Final Cloud-based Data Management Module 17 of 71
Collection B (Households)
Parameter Possible values Description
households List List of household IDs
Example:
{"households": [ "bbc14ebe-08f4-4090-add1-854369d71117", "69ac253d-a1dd-414c-a894-2e770f6d9351",
…]}
Collection C (Devices)
Parameter Possible values Description
devices List List of device IDs
Example:
{"devices": [ "bbc14ebe-08f4-4090-add1-854369d71117", "69ac253d-a1dd-414c-a894-2e770f6d9351", …]}
Collection D (Appliances)
Parameter Possible values Description
appliances List List of appliance IDs
Example:
{"appliances": [ "bbc14ebe-08f4-4090-add1-854369d71117", "69ac253d-a1dd-414c-a894-2e770f6d9351",
…]}
Collection E (Areas)
Parameter Possible values Description
areas List List of area IDs
Example:
{"areas": [ "bbc14ebe-08f4-4090-add1-854369d71117", "69ac253d-a1dd-414c-a894-2e770f6d9351", …]}
Collection F (Associations)
Parameter Possible values Description

Flex4Grid - 646428 31/03/2017
D2.4 Final Cloud-based Data Management Module 18 of 71
associations List List of associations.
Example:
{
"associations": [
{
"id": "937d5c08-1285-447b-82ea-bf0a6eeb33eb",
"appliance": {
"id": "214e4532-e49c-12d3-a436-426655210012",
"name": "Freezer",
"location": "Cellar"
}
},
{
"id": "be5dbf2c-5e72-4cc3-adf1-2c1bef17bceb",
"appliance": {
"id": "fe8b7dd1-3a56-4853-b087-737cba8c9e86",
"name": "TV",
"location": "Toilet"
}
},
{
"id": "ce5dbf2c-5e72-4cc3-adf1-2c1bef15ce56",
"appliance": {}
}
]
}
Collection G (Experiment) The start and end time define the boundaries of the enclosed experiments defined as resource J.
Parameter Possible values Description
area_id String Area identifier
experiment_id String Experiment identifier
start_time String (ISO 8601 date format) Start date of the experiment
end_time String (ISO 8601 date format) End date of the experiment
area_experiments List List of resources J

Flex4Grid - 646428 31/03/2017
D2.4 Final Cloud-based Data Management Module 19 of 71
Example:
{
area_id: "69ac253d-a1dd-414c-a894-2e770f6d9351",
experiment_id: "Peak mitigation 23",
start_time: "2017-03-20T13:00:00.00Z",
end_time: "2017-03-20T14:00:00.00Z",
area_experiments: []
}
Collection H (Events)
Parameter Possible values Description
events List A list of resources K
Example:
{
events: [resorce K, …],
}
Collection I (DMS data)
Parameter Possible values Description
measurements List List resources L
Example:
{ measurements = [ resource L, ... ] }
Collection J (Aggregated information)
Parameter Possible values Description
s String Source of information
bi Number Span of the base interval in seconds
bt String (ISO 8601 date format) Time, end of interval
bn String Concatenation, URN of the resource
e List List of resources S

Flex4Grid - 646428 31/03/2017
D2.4 Final Cloud-based Data Management Module 20 of 71
Example, aggregated values for the Flex4Grid area, 60 seconds interval, the data in the list of the resources
S is meaningfully omitted and not repeated:
{
"s" : "f4g/area",
"bi" : 60,
"bn": "vtt-testbed-area",
"bt" : ISODate("2017-03-14T08:31:00Z")
"e": [ resource S, ...]
}
Collection K (Historical data for visualization)
Parameter Possible values Description
name String Name of the measurements
unit String Data unit
interval Number Time span among the samples
interval unit String Unit of the interval
start String (ISO 8601 date format) Strat time of the samples
samples Number Number of samples in the data
data List List of values
Example of the historical data for a day, 1 hour interval:
{
“name”: “energy”,
"unit" : "Wh",
"interval" : 3600,
"interval unit": "second”,
"start" :"2017-03-14T08:31:00Z",
“samples”: 24,
"data": [v1, …]
}

Flex4Grid - 646428 31/03/2017
D2.4 Final Cloud-based Data Management Module 21 of 71
Resource A (Gateway profile)
Parameter Possible values Description
id String Unique identifier of the gateway.
household_id String Unique identifier of the household the gateway is deployed
into.
connected Boolean Local Version Control status
status Document Complex Docker LVC status or retained MQTT message
Example:
{
id: "66bf12f1-f009-48cc-a4e2-7be7c4d644cd",
household_id: "bbc14ebe-08f4-4090-add1-854369d71117",
connected: "True",
status: "LVC status message"
}
Resource B (Household profile)
Parameter Possible values Description
id String Unique identifier of the household.
gw_id String Gateway identification
area_id String Unique identifier of an area in the network in which
the household belongs to.
connected Boolean Connection status based on MQTT messages
ami_data Boolean Indicates availability of the DMS/AMI data
Example:

Flex4Grid - 646428 31/03/2017
D2.4 Final Cloud-based Data Management Module 22 of 71
{
id: "14c24eb5-04f4-40d0-aad1-354369d71125",
area_id: "bbc14ebe-08f4-4090-add1-854369d71117",
gw_id: "F4G-B827EB91E960",
connected: "false",
ami_data : "1",
}
Resource C (Measurement) Simplified measurement format.
Parameter Possible values Description
timestamp String (ISO 8601 date format) Timestamp of the measurement in ISO
8601 date format.
energyCumul Number (kWh) Total cumulative energy
consumption/production in Wh.
power Number (W) Maximum power in W during the time
period.
Example:
{
"timestamp" : "2015-05-10T30:10:10.70Z",
"energy" : "200",
"energyCumul" : "150",
}
Resource CA (Flex4Grid SenML Measurement format) The resource CA is an alternative message format to the resource C. Parts of the format specification have
inspired a number of other resources the PCS returns.
This Flex4Grid data format is based on the SenML specification8. The format conforms to SenML and
provides minimal extensions to support Flex4Grid requirements for sensor measurements, based on
intervals. Example of such measurements are measurements of energy or historical sensor measurements.
The SenML specification is extended in the following base fields:
Base interval: Base interval in seconds. The base interval specifies the time back from the base time as an interval for which the interval values are reported. Base interval field is optional.
8 Media Types for Sensor Markup Language (SenML), 2016.
Flex4Grid - 646428 31/03/2017
D2.4 Final Cloud-based Data Management Module 23 of 71
Base interval samples: A number of samples in the base interval.
The SenML specification is extended in the following measurements or parameter entry fields:
Interval: Each measurement can specify its own interval if needed. In the SenML specification the time entry is added to the base time if both are specified. The interval entry overwrites the base interval if both are present. Interval field is optional.
Interval value: Interval value presents the measurement value in the interval specified. If the field is present either base interval or interval field must be defined.
Computational interval: History messages are up-sampled based on values calculated on sub interval. The computational interval helps to explain the measurement value by reporting the sub interval in seconds. The value does not affect the base time, time or interval interpretations. Energy measurements are an example where this parameter is helpful and sometimes required.
Extreme time: Specifies the time of the extreme in the measurement. In this way the time, for example, of minimal or maximal value in the interval can be reported. The exact extreme time is calculated by adding the extreme time value to the entry measurement time. The extreme time is negative or zero. Its absolute value must be less or equal to the interval time. The extreme time is specified in seconds. The field is optional.
Number of samples: Number of samples on which the interval calculations are made
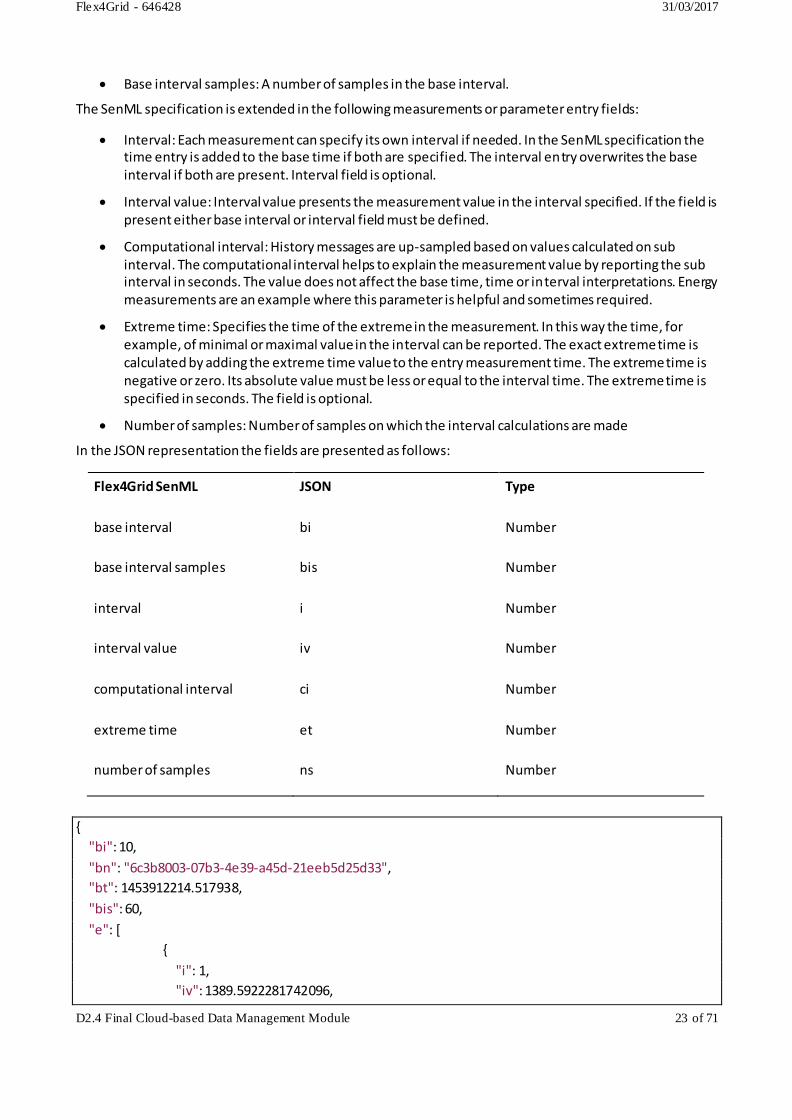
In the JSON representation the fields are presented as follows:
Flex4Grid SenML JSON Type
base interval bi Number
base interval samples bis Number
interval i Number
interval value iv Number
computational interval ci Number
extreme time et Number
number of samples ns Number
{
"bi": 10,
"bn": "6c3b8003-07b3-4e39-a45d-21eeb5d25d33",
"bt": 1453912214.517938,
"bis": 60,
"e": [
{
"i": 1,
"iv": 1389.5922281742096,

Flex4Grid - 646428 31/03/2017
D2.4 Final Cloud-based Data Management Module 24 of 71
"n": "energy",
"u": "J"
},
{
"ci": 1,
"et": -6,
"iv": 0.3241713047027588,
"n": "energy/min",
"u": "J"
},
{
"iv": 2413.8983509425198,
"n": "energy/avg",
"u": "J"
},
{
"ci": 1,
"et": -3,
"iv": 13844.286172509193,
"n": "energy/max",
"u": "J"
},
{
"n": "energy/cumulative",
"s": 590504.8222112656,
"u": "J"
},
{
"n": "power",
"u": "W",
"v": 9883
},
{
"et": -4,
"iv": 368,
"n": "power/min",
"u": "W"
},
{
"et": -4,
"iv": 19315,
"n": "power/max",
"u": "W"
},
{
Flex4Grid - 646428 31/03/2017
D2.4 Final Cloud-based Data Management Module 25 of 71
"et": -4,
"iv": 7084.866666666667,
"n": "power/avg",
"u": "W"
}
]
}
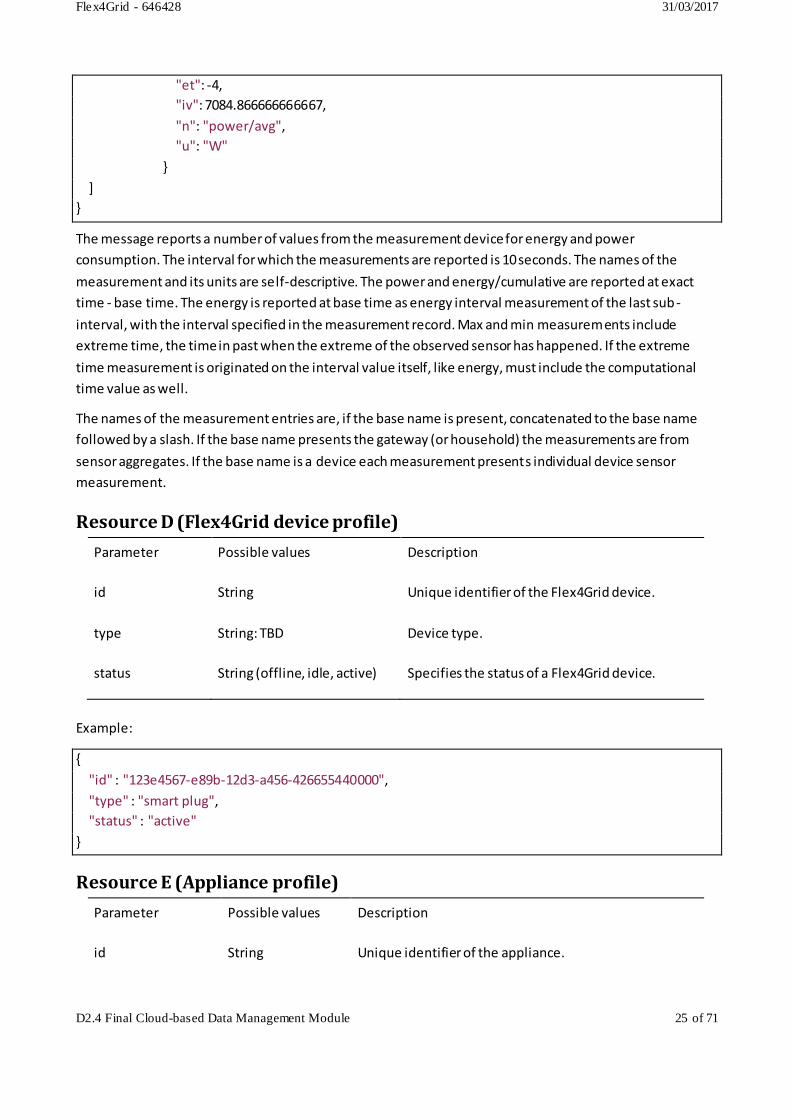
The message reports a number of values from the measurement device for energy and power
consumption. The interval for which the measurements are reported is 10 seconds. The names of the
measurement and its units are self-descriptive. The power and energy/cumulative are reported at exact
time - base time. The energy is reported at base time as energy interval measurement of the last sub-
interval, with the interval specified in the measurement record. Max and min measurements include
extreme time, the time in past when the extreme of the observed sensor has happened. If the extreme
time measurement is originated on the interval value itself, like energy, must include the computational
time value as well.
The names of the measurement entries are, if the base name is present, concatenated to the base name
followed by a slash. If the base name presents the gateway (or household) the measurements are from
sensor aggregates. If the base name is a device each measurement presents individual device sensor
measurement.
Resource D (Flex4Grid device profile)
Parameter Possible values Description
id String Unique identifier of the Flex4Grid device.
type String: TBD Device type.
status String (offline, idle, active) Specifies the status of a Flex4Grid device.
Example:
{
"id" : "123e4567-e89b-12d3-a456-426655440000",
"type" : "smart plug",
"status" : "active"
}
Resource E (Appliance profile)
Parameter Possible values Description
id String Unique identifier of the appliance.

Flex4Grid - 646428 31/03/2017
D2.4 Final Cloud-based Data Management Module 26 of 71
name String Name of the appliance (e.g. Freezer, Fridge, TV, etc.)
location String Location of the appliance (e.g. Kitchen, Cellar, Living
Room, etc.)
Example (Freezer profile):
{
"id" : "214e4532-e49c-12d3-a436-426655210012",
"name": "Freezer",
"location": "Cellar"
}
Resource F (Area profile)
Parameter Possible values Description
id String Unique identifier of the area.
households Array List of household (IDs) in the given area.
Example:
{
"id": "214e4532-e49c-12d3-a436-426655210011",
"households": ["bbc14ebe-08f4-4090-add1-854369d71117", "69ac253d-a1dd-414c-a894-2e770f6d9351",
....]
}
Resource G (Association)
Parameter Possible values Description
id String Unique identifier of the device (i.e., smart plug).
appliance Object Appliance profile.
Example:
{
"id": "937d5c08-1285-447b-82ea-bf0a6eeb33eb",
"appliance": {
"id" : "214e4532-e49c-12d3-a436-426655210012",
"name": "Freezer",
"location": "Cellar"

Flex4Grid - 646428 31/03/2017
D2.4 Final Cloud-based Data Management Module 27 of 71
}
}
Resource H (Version)
Parameter Possible values Description
version String Service version.
Example:
{
"vesrion": "0.16"
}
Resource I (Whoami)
Parameter Possible values Description
user String System user
role String Role
Example:
{
"user": "[email protected]",
"role": "DSO"
}
Resource J (Area Experiment and parameters) Area experiments and parameters is a resource that is both posted and returned from the call. The
test_group and control_group parameters can be omitted if group_split parameter is present. Then the test
and control groups are created randomly.
Parameter Possible values Description
area_id String Area identifier
experiment_id String Experiment identifier
test_group List List of household ids in the test group
control_group List List of the household ids in the control group
Flex4Grid - 646428 31/03/2017
D2.4 Final Cloud-based Data Management Module 28 of 71
group_split Number Control group in percent
start_time String (ISO 8601 date format) Start date of the experiment
end_time String (ISO 8601 date format) End date of the experiment
Example:
{
area_id: "bbc14ebe-08f4-4090-add1-854369d71117",
experiment_id: "Peak mitigation 23",
test_group: [ "bbc14ebe-08f4-4090-add1-854369d71117", …],
control_group: [ "69ac253d-a1dd-414c-a894-2e770f6d9351", …],
start_time: "2017-03-20T13:00:00.00Z",
end_time: "2017-03-20T14:00:00.00Z"
}
Resource K (Event)
Parameter Possible values Description
r Dictionary Specifies the resource with the name of the
resource as key and identifier as a value
c String A comment
a Attribute Atribute identifier
v Variant Atribute value
ts String (ISO 8601 date format) Time stamp
Example:
{
r: {'household': id}, # resource & id
c: 'comment',
a: 'connection/status', # attribute
id: '14c24eb5-04f4-40d0-aad1-354369d71125',
v: True, # value
ts: ISODate timestamp # timestamp
}
Resource L (DMS data)

Flex4Grid - 646428 31/03/2017
D2.4 Final Cloud-based Data Management Module 29 of 71
Parameter Possible values Description
bn String Base name
bi Number Base interval
bt String (ISO 8601 date format) Base time
bu String Base unit
e List List of measurements
Example:
{
'bn': '1001081/24278a82-88e8-4b8c-9710-cc386d40e3a7',
'bi': 900,
'bt': timestamp,
'bu': 'W',
'e': [{'iv': 0.952, 'n': 'power', 't'=57600},
{'iv': 1.44, 'n': 'power', 't'=86400},
{'iv': 1.104, 'n': 'power', 't'=29700},
...}]
}
Resource M (Certificate request)
Parameter Possible values Description
certificate_request String PEM encoded certificate request
Example:
{
"certificate_request": "PEM data"
}
Resource N (Certificate signing response)
Parameter Possible values Description
certificate String PEM encoded certificate
Flex4Grid - 646428 31/03/2017
D2.4 Final Cloud-based Data Management Module 30 of 71
ca_certificates List A list of PEM certificates
Example:
{
'certificate': ...PEM... data,
'ca_certificates': [...PEM... CA cert, ]
}
Resource O (Resource access control policy) The resource access control policy is created from the call parameters.
Parameter Possible values Description
p Dictionary Dictionary with identity or role ids as keys
rt String Resource type
id String Resource identifier
Example:
{
'p': { eui_id1: '',
eui_id2: ''},
'rt': 'household',
'id': household_id
}
Resource P (Access control request)
Parameter Possible values Description
subject String System user id
subjectrole String Role
resource Dictionary Defines resource type and value
action String Defines action on the resource

Flex4Grid - 646428 31/03/2017
D2.4 Final Cloud-based Data Management Module 31 of 71
Example:
{
'subject': clientid,
'subject_role': role,
'resource': {'type': 'topic|url',
'raw': string},
'action': read/write
}
Resource R (Statistic information)
Parameter Possible values Description
bi Number Span of the base interval in seconds
bt String (ISO 8601 date format) Time in seconds since epoch, end of interval
bn String Concatenation, URN of the resource
e List List of statistic values
u String Unit
n String Name of the measured value
v Number Value
et Number Extreme time, relative to bt
Example:
{
"bi": 56080.606403,
"bt": "2017-03-14T08:31:00Z",
"bn": "ae477bdc-a6cf-44d0-9d34-405766e3ad1c/devices/3",
"e": [{"u": "W", "n": "power/avg", "iv": 0.0},
{"iv": 0.0, "n": "power/max", "et": 0.0},
{"iv": 0.0, "n": "power/min", "et": 0.0},
{"n": "power/avg/std", "iv": 0.0},
{"u": "kWh", "n": "energy", "iv": 0.0},
{"u": "W", "v": 0.0, "n": "power"}]
}
Resource S (Aggregated information)

Flex4Grid - 646428 31/03/2017
D2.4 Final Cloud-based Data Management Module 32 of 71
Parameter Possible values Description
s String Source of information
bi Number Span of the base interval in seconds
bt String (ISO 8601 date format) Time, end of interval
bn String Concatenation, URN of the resource
e List List of statistic values
u String Unit
n String Name of the measured value
v Number Value
et Number Extreme time, relative to bt
ns Number Number of aggregated samples
Example, aggregated value for the Flex4Grid area, 60 seconds interval:
{
"s" : "f4g/area",
"bi" : 60,
"bn": "vtt-testbed-area",
"bt" :"2017-03-14T08:31:00Z",
"e": [{"u": "W", "n": "power/avg", "iv": 0.0},
{"iv": 0.0, "n": "power/max", "et": 0.0},
{"iv": 0.0, "n": "power/min", "et": 0.0},
{"n": "power/avg/std", "iv": 0.0},
{"u": "kWh", "n": "energy", "iv": 0.0},
{"n": "count": "ns": 1}
{"u": "W", "v": 0.0, "n": "power"}]
}
Resource T (Event search)
Parameter Possible values Description
start_time String (ISO 8601 date format) Start date
end_time String (ISO 8601 date format) End date

Flex4Grid - 646428 31/03/2017
D2.4 Final Cloud-based Data Management Module 33 of 71
search Dictionary Search query parameters
r Dictionary Resource type as a key and identifier as a
value
a String Resource attribute

Example:
{
start_time: "2017-03-20T13:00:00.00Z",
end_time: "2017-03-20T14:00:00.00Z",
search: { r: {'household': id},
a: 'connection/status'}
}
3.1.6. Testing the service
Two lines of testing are envisioned: via unittest, testing all the interface functionality of the service, and
command line testing. The latter is used to quickly check the functionality of the service.
Unit testing
Prosumer Cloud Service testing All the interfaces passed from the testing server to production server should have unittests written and
passed. The test can be found in the service directory, file test-service.py and run in JSI/pcs directory as:
python3 JSI/pcs/test_secure_pcs_service.py
The tests are prepared per interface and Tornado web server handler. One test should contain all the REST
interfaces the handler handles (GET, PUT, POST, DELETE). For the testing purposes Tornado internal test
environment is used. The environment automatically starts a suitable test web service on local IP address
and port against which the interface (handler) functionality is tested.
Listener tests
Basic listener abilities such as collecting measurements and listening to device profiles changes and
updating the database are tested in the unittest test_listener.py. The test is run in JSI/pcs directory as:
python3 JSI/pcs/test_listener.py
The second set of listener test is related to performance estimation of MQTT clients. The test uses
HBMQTT9, the MQTT client and broker implementation in Python. The tests can be run as:
python3 JSI/pcs/test_mqtt_async.py
3.1.7. Command line tools
The PCS service has a number of command line tools that can be used to ease some often-repeated tasks.
The tools can be found in the directory JSI/bin:
aa_request.py: runs a command using the certificate, key and certification path certificates against the PCS service REST API
check_devices: checks all pilot devices and outputs the average consumption distribution
check_gw_hh_status: checks the status of the gateways and households, displays it in the terminal together with histograms of the connection indicators
9 See HBMQTT github pages for details.

Flex4Grid - 646428 31/03/2017
D2.2 Init ial Cloud-based Data Management Module 35 of 71
make_keystore.py: makes a p12 keystore out of the certificate, key and certification path bundle (tar.gz)
print_keystore.py: prints the keystore information
3.2. MQTT Broker
3.2.1. Purpose
An MQTT broker is a service required by MQTT, the messaging protocol used for much of the event -based communication between many of the Flex4Grid system components. It acts as a kind of hub for the messages between different clients, which include, for example, the different processes running in the local IoT (Internet of Things) gateways and data collectors in the cloud. The broker and its use are described in more detail in Flex4Grid deliverable D3.6 Final Prosumer Flexibility Module [10].
3.2.2. Installation
Various implementations of the MQTT broker are available. The implementation chosen for Flex4Grid is Mosquitto [1], which is BSD licensed open source and readily available for download and installation either in the project home page10 or in the native packaging services of many GNU/Linux distributions. A required feature, though, is the WebSockets support, which is included only in the most recent versions of Mosquitto and may not have reached some distributions' package upstream. In such distributions, the broker may need to be compiled from source. In Ubuntu (or Debian), Mosquitto may be compiled from the package source repository of another Ubuntu release (15.10 in this case):
$ sudo echo “deb-src http://archive.ubuntu.com/ubuntu/ wily main universe” > /etc/apt/sources.list.d/wily-src.list
$ sudo apt-get update
$ sudo apt-get build-dep -y mosquitto=1.4.3-1
$ sudo apt-get source -b mosquitto=1.4.3-1
This should produce a number of resulting package files with a .deb file extension. To install Mosquitto from the resulting packages:
$ sudo dpkg -i mosquitto_1.4.3-1_amd64.deb
$ sudo apt-get install -f -y
Note that some extra packages will be required for compiling the broker and may be removed once the package is compiled. The broker should be configured with l isteners for the following port: * 8883 for MQTT over TLS, require client certification and at least TLS v1.2. This is the IANA registered port for MQTT over TLS (MQTT version 3.1.1 OASIS standard) Provide necessary certificates, issued by the Flex4Grid certificate authority. The certificate and key file paths for the use of the broker are specified in the configuration file (see below).
10 http://mosquitto.org/download

Flex4Grid - 646428 31/03/2017
D2.2 Init ial Cloud-based Data Management Module 36 of 71
The broker security is provided by PCS as policy decision point and the Python plugin developed by the project based on Mosquitto pyauth11 code as enforcement point. More information on the solution is available in the deliverable D2.3. Mosquitto is configured as explained above by writing the following into /etc/mosquitto/conf.d/si_broker_flex4grid.conf:
utosave_interval 1800
persistence_file mosquitto_f4g.db
connection_messages true
log_timestamp true
log_type error
log_dest syslog
l istener 8883
tls_version tlsv1.2
certfi le /etc/mosquitto/certs/secure.broker.flex4grid.eu.chain.pem
keyfile /etc/mosquitto/certs/secure.broker.flex4grid.eu.key
capath /etc/mosquitto/ca_certificates/
require_certificate true
use_identity_as_username true
auth_plugin /usr/local/lib/auth_pl ugin_pyauth.so
auth_opt_pyauth_module JSI.security.mqtt_authorization
auth_opt_authorization_server_url https://pcs.flex4grid.eu:8443/flex4grid/v1/authorize/mqtt
auth_opt_certfi le /etc/mosquitto/certs/secure.broker.flex4grid.eu.chain.pem
auth_opt_keyfile /etc/mosquitto/certs/secure.broker.flex4grid.eu.key
auth_opt_cache_time 600
auth_opt_log 1
auth_opt_log_level debug
auth_opt_log_syslog 1
For more details, see the Mosquitto broker documentation at http://mosquitto.org/documentation .
11 See pyauth GitHub page for details: https://github.com/mbachry/mosquitto_pyauth

Flex4Grid - 646428 31/03/2017
D2.2 Init ial Cloud-based Data Management Module 37 of 71
3.2.3. Usage
Use of the broker is described in detail in deliverable D3.3 [10].
3.2.4. Usage examples
The broker may be tested with any compliant MQTT client, although some clients do not support WebSockets and some do not support TLS. The Mosquitto client may be used to test ports 1883, 8084 and 8883 (the latter requiring a client certificate accepted by the broker) in Debian or Ubuntu:
$ apt-get install mosquito-clients
The command above will install the client commands used below:
$ mosquitto_sub -h 'si.broker.flex4grid.eu' -p 8883 --capath path-to-certificates --cert client-certificate-fi le --key client-
certificate-keyfile -t '/testtopic'
$ mosquitto_pub -h 'si.broker.flex4grid.eu' -p 8883 --capath path-to-certificates --cert client-certificate-fi le --key
client-certificate-keyfile -t '/testtopic' -m 'test message'
The former command is used to subscribe to the topic “/testtopic” and the latter is used to publish to it.
3.3. Data Analytic framework Data analytics is a continuous process of examining data sets containing a variety of data types to uncover hidden patterns, unknown correlations and other useful information. It is a process chain consisting of the following sequence of steps:
Problem definition Acquire data (collect data from various databases and data sources)
Prepare data (extract, transform, load, clean, filter, aggregate data)
Build model (use exploratory data analysis techniques to identify meaningful relationships, patterns, or trends from complex data sets)
Evaluate model
Visualization and interpretation of results
3.3.1. Data Processing Framework
In Flex4Grid project the objective is to distribute the electricity consumption and production in households more evenly, in order to reduce the overload on the grid at peak consumption and peak production times. Therefore prediction of peaks in energy consumption is necessary. As energy levels are numeric, we are building a non-linear regression model based on historic consumption data and environmental variables, such as temperature, radiation and precipitation. Data processing model for prediction follows the steps for data analytics process:
1. Problem definition: problem is validating proposed flexibility management system by measuring its performance in the pilots. Successful performance includes reduction of energy consumption at peak consumption times and increase of energy consumption at peak production times. Reduction or increase in consumption levels are measured in two ways: as di fference between pilot and control group consumption, and as difference between the predicted and actual consumption.

Flex4Grid - 646428 31/03/2017
D2.2 Init ial Cloud-based Data Management Module 38 of 71
2. Acquire data: during the project, several sets of personal and grid data are collected either by surveys or through automated means (as described in deliverable D7.1 [12]. Questionnaires and interviews gather personal participant information, such as type of household, electronic devices in the household, perception of electricity expenses, as well as expectations and satisfaction of the Flex4Grid management system. This data is given voluntarily. Part of personal data is collected automatically at DSOs and contains name, billing address and residential address of the costumer, information about the grid measurement point and measurements performed at the point. Grid data is also collected automatically and includes identifiers of the participants in the trials, grid topological reference of their measurement point, deployed devices information, measurements of the consumption or production at the device and flexibility estimates. Grid data also includes environmental measurements for temperature, radiation and precipitation.
3. Prepare data: prediction of electric energy consumption is based on the part of the data set, which is collected automatically at DSO. First the data set is filtered to the consumption values at the measurement points alongside with metadata date and time. These are then aggregated by date and time at the substation level. Corresponding environmental measurements are added to the aggregated value. To surmise, for each transformer station (denoted as TP) we have a set of aggregated consumption values at 15 minute intervals, corresponding date and time of the measurement, and environmental measurements for temperature, radiation and precipitation.
4. Build model: electric energy consumption is predicted by an artificial neural network model [16]. Neural networks are a machine learning method, which simulate the brain. Using several layers of artificial neurons a model is built through learning. There are two types of learning: supervised and unsupervised; as well as many types of network architectures. As we have historic time series data, supervised learning will be used. Network topology is determined by trial and error for each TP separately.
5. Evaluate model: model is tested on a test set taken aside from the prepared data set prior to learning process. Validation of the model is done by post-analysis of model’s performance and expressed by prediction error. Prediction error is a cumulative error of: prediction error for consumption distribution (differences between actual and predicted energy consumption time series), peak characteristics differences (right choice of peak, peak value (height) and duration (width), prediction error for environmental parameters and arbitrary system error (made in measurement gathering, calculations in the model, choice of ANN-topology or identification of a critical peak based on prediction).
6. Visualization and interpretation of results: data and model results will be presented visually and numerically with corresponding interpretations.
In the following subsections, we describe parameters needed for the prediction model, which were acquired and prepared following steps 2 and 3 above, the prediction model itself, and the data processing model to surmise the above steps of data analytics.
3.3.2. Prediction Model Parameters
Important model parameters were determined by available information (attainabl e measurements) and through exploratory data analysis of the data prepared by DSOs. Parameters collected and prepared by DSO are:
historic consumption data (on several transformer stations) recorded at 15 minute intervals ( i.e. time series data, denoted as TSDh);
temperature measured at the TP at 1 hour time interval in Celsius;
solar radiation measured at the TP at 1 hour time interval in Watt/m2; and precipitation measured at the TP at 1 hour time interval in mm.

Flex4Grid - 646428 31/03/2017
D2.2 Init ial Cloud-based Data Management Module 39 of 71
For presentation purposes, we will use data set from Slovenian partner Elektro Celje (ELE). Data set contains historic data at 15 minute intervals contains 70079 time points. Electric energy consumption was measured at four TPs. Corresponding values for temperature (Temp), radiation (Rad) and precipitation (Prec) were taken at 1h intervals. Using exploratory data analysis on the measurement data, correlations and patterns were detected and consequently accounted for in the modelling stage as additional input parameters. Basic summary (minimum, 1st quantile, medium, mean, 3rd quantile and maximum) for each environmental
parameter and consumption at TP, are shown in Table 3. Visual representations of this data are available in Figure 1.a and Figure 1.b.
Table 3: Basic summary of main parameters in ELE data (four TPs and environmental parameters).
JEDERT BUTTEJEV.MOST ANSKI.VRH LACJA.VAS TEMP RAD PREC MIN 0.00 13.60 0.00 0.00 -20.00 0.00 0.00
1ST QU 22.98 38.40 8.50 9.60 5.00 0.00 0.00
MEDIAN 30.26 57.80 12.00 13.35 12.00 4.00 0.00
MEAN 32.76 56.56 12.75 14.01 11.42 141.50 12.69
3RD QU 39.57 71.60 16.16 17.49 17.00 196.00 0.00
MAX 119.58 158.20 45.62 44.49 36.00 1068.00 2029.00
Figure 2: Visualization of summary results from Table 1 for four TPs.
As shown in Figure 2, TP Buttejev.most has the most variation in consumption and also the highest out of all TPs. Unlike other three stations, minimum consumption at TP Buttejev.most is not zero. Next is TP Jedert with average consumption of 32.76 kW, but also containing more outliers at higher values. Stations TP Anski.vrh and TP Lacja.vas have similar distributions and lower overall consumption. Out of environmental variables, Figure 3, precipitation variable has least variability in the data, as on average the value is zero. On the other hand, variable temperature has an average of 11oC with 50% of the measurements between 5oC and 17oC, and reaches two extremes: 35oC at the highest and -20oC at the lowest.
Flex4Grid - 646428 31/03/2017
D2.2 Init ial Cloud-based Data Management Module 40 of 71
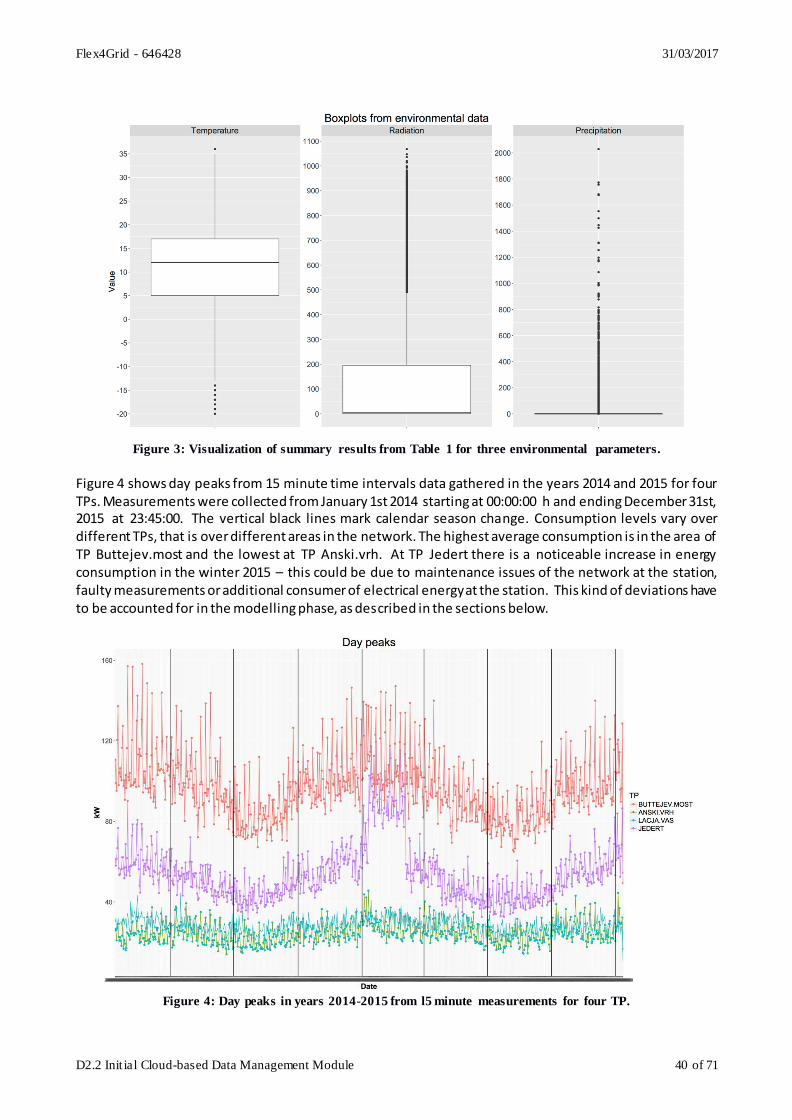
Figure 3: Visualization of summary results from Table 1 for three environmental parameters.
Figure 4 shows day peaks from 15 minute time intervals data gathered in the years 2014 and 2015 for four TPs. Measurements were collected from January 1st 2014 starting at 00:00:00 h and ending December 31st, 2015 at 23:45:00. The vertical black lines mark calendar season change. Consumption levels vary over different TPs, that is over different areas in the network. The highest average consumption is in the area of TP Buttejev.most and the lowest at TP Anski.vrh. At TP Jedert there is a noticeable increase in energy consumption in the winter 2015 – this could be due to maintenance issues of the network at the station, faulty measurements or additional consumer of electrical energy at the station. This kind of deviations have to be accounted for in the modelling phase, as described in the sections below.
Figure 4: Day peaks in years 2014-2015 from l5 minute measurements for four TP.

Flex4Grid - 646428 31/03/2017
D2.2 Init ial Cloud-based Data Management Module 41 of 71
Distribution of environmental measurements in the years 2014-2015 for temperature, radiation and precipitation are displayed separately in Figure 5, Figure 6 and Figure 7 respectively. Distribution for temperature is displayed in Figure 5. We categorized temperature values into 3 categories to reduce noise: low (< 5oC), regular ([5oC, 17oC]) and high (> 17oC).
Figure 5: Distribution of temperature measurements at 1h time intervals in the years 2014-2015. Points are
coloured by class: high, regular or low temperature.
Distribution for radiation measurements is presented in Figure 6. It has a fat tailed distribution12 in a calendar
year. Figure 7 shows distribution of precipitation measurements. Graph points in both figures are coloured according to calendar season.
Figure 6: Distribution of radiation measurements at 1h time intervals in the years 2014-2015. Points are coloured
by season.
12 See Wikipedia for details https://en.wikipedia.org/wiki/Fat-tailed_distribution.

Flex4Grid - 646428 31/03/2017
D2.2 Init ial Cloud-based Data Management Module 42 of 71
Figure 7: Distribution of precipitation measurements at 1h time intervals in the years 2014-2015. Points are
coloured by season.
Figure 8: Scatterplots of environmental parameters and energy consumption at TP Buttejev.most.
Figure 8 shows a scatterplot of the main environmental parameters (Temperature, Radiation and Precipitation) for TP Buttejev.most. Highest energy consumption is in the range of -10oC and +15oC, while peaks based on radiation and precipitation values are more uniformly distributed, and thus less influential in the prediction model. Temperature and radiation parameters have positive correlation, and can be interchangeable for energy consumption prediction model. Due to more complex relationship between
Flex4Grid - 646428 31/03/2017
D2.2 Init ial Cloud-based Data Management Module 43 of 71
temperature and energy consumption, temperature is preferred parameter in the consumption prediction model. For production prediction model radiation parameter has an individual role (for example energy production by photovoltaics). Precipitation is non-linearly correlated with temperature and radiation parameters.
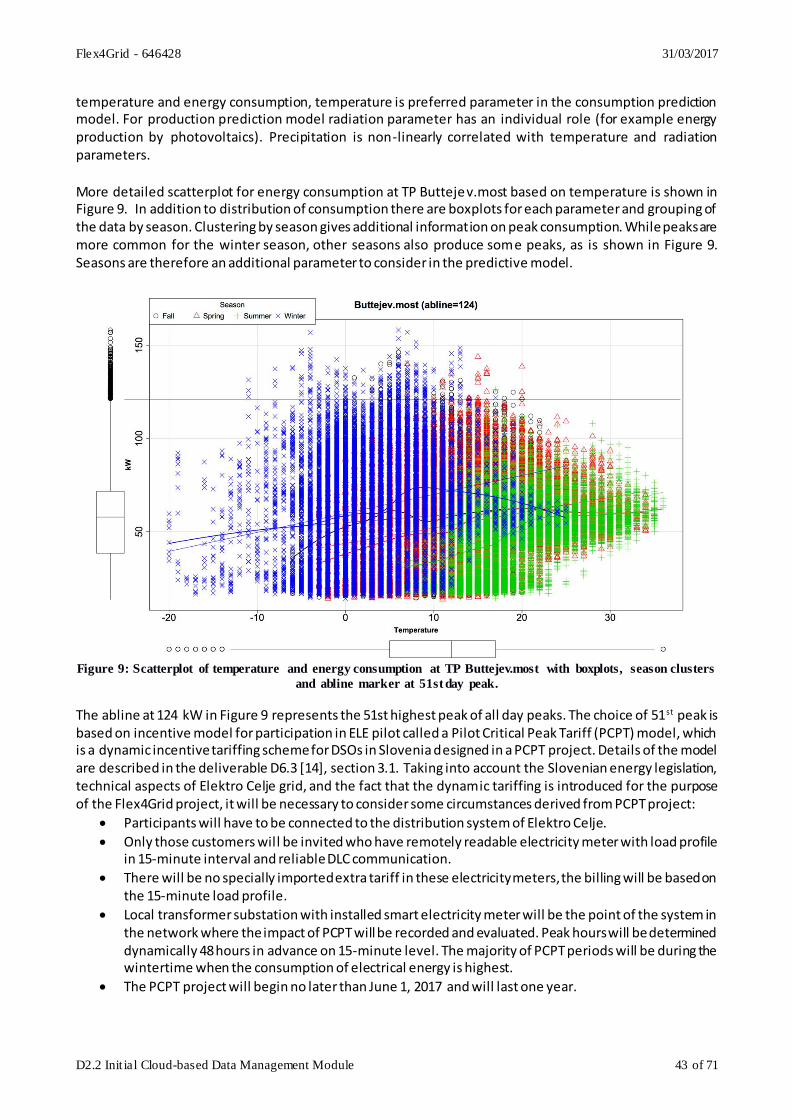
More detailed scatterplot for energy consumption at TP Buttejev.most based on temperature is shown in Figure 9. In addition to distribution of consumption there are boxplots for each parameter and grouping of the data by season. Clustering by season gives additional information on peak consumption. While peaks are more common for the winter season, other seasons also produce some peaks, as is shown in Figure 9. Seasons are therefore an additional parameter to consider in the predictive model.
Figure 9: Scatterplot of temperature and energy consumption at TP Buttejev.most with boxplots, season clusters
and abline marker at 51st day peak.
The abline at 124 kW in Figure 9 represents the 51st highest peak of all day peaks. The choice of 51st peak is based on incentive model for participation in ELE pilot called a Pilot Critical Peak Tariff (PCPT) model, which is a dynamic incentive tariffing scheme for DSOs in Slovenia designed in a PCPT project. Details of the model are described in the deliverable D6.3 [14], section 3.1. Taking into account the Slovenian energy legislation, technical aspects of Elektro Celje grid, and the fact that the dynamic tariffing is introduced for the purpose of the Flex4Grid project, it will be necessary to consider some circumstances derived from PCPT project:
Participants will have to be connected to the distribution system of Elektro Celje.
Only those customers will be invited who have remotely readable electricity meter with load profile in 15-minute interval and reliable DLC communication.
There will be no specially imported extra tariff in these electricity meters, the billing will be based on the 15-minute load profile.
Local transformer substation with installed smart electricity meter will be the point of the system in the network where the impact of PCPT will be recorded and evaluated. Peak hours will be determined dynamically 48 hours in advance on 15-minute level. The majority of PCPT periods will be during the wintertime when the consumption of electrical energy is highest.
The PCPT project will begin no later than June 1, 2017 and will last one year.

Flex4Grid - 646428 31/03/2017
D2.2 Init ial Cloud-based Data Management Module 44 of 71
Dynamic tariff scheme works as an incentive to lower highest peak consumption, therefore the number of peaks with special billing is limited by the Energy Agency of Slovenia to top 50 peaks per year. Correct prediction of these top peaks is thus crucial. Additional scatterplot of radiation as a function of temperature is given in Figure 10 to show the correlation between these two parameters in different seasons. For each season there are two extra lines in the plot – one shows linear regression, while the other shows the loess curve [15], which fits a curve to the data by locally weighted smoothing. As expected, there is higher radiation in spring and summer, and lower in the winter and fall seasons. We also looked for any hidden patterns in the consumption data at each TP based on metadata: Date and Time. We found a difference in daily consumption distribution between weekdays and weekends, as can be seen in Figure 11 in two facets (day and end). All holidays were considered as weekends.
Figure 10: Scatterplot of temperature and radiation with boxplots and season clusters.
Figure 11 reveals additional patterns in consumption given the hour in the day. Measurements of consumption were taken at 15-minute intervals and divided into weekdays and weekends. Distribution for each group is in the corresponding facet. Horizontal line again represents the 51st highest day peak in all historic data. At weekends peaks occur generally between the hours 10 and 14 and in the evening hours between 19h and 20h, while at weekdays the highest peaks are most common between the hours 17 and 20, as shown in Figure 12.

Flex4Grid - 646428 31/03/2017
D2.2 Init ial Cloud-based Data Management Module 45 of 71
Figure 11: Distribution of energy consumption at TP Buttejev.most based on 15-minute time measurement
intervals and grouped by day of the week (weekday or weekend).
Following the trends from Figure 11, we therefore considered time of day (ToD) as a separate parameter, in order to put more weight on the occurrence of peak modes in the historic data. To avoid splitting training data by 24 categories, we separated the day by 3-hour intervals (with 12 time measurements), gaining a total of 8 classes for ToD parameter, presented in Figure 12 and Figure 13. The latter figure presents density for each of ToD classes. There are some notable differences between weekdays and weekends, as well as night and day hours. These values were then inputted into the prediction model.
Figure 12: Distribution of energy consumption at TP Buttejev.most based on 15-minute time measurement
intervals divided into 8 3-h classes (ToD) and grouped by day of the week (weekday or weekend).

Flex4Grid - 646428 31/03/2017
D2.2 Init ial Cloud-based Data Management Module 46 of 71
Through exploratory analysis we found different patterns in the data, including difference in energy consumptions during the day, different distribution of household energy consumption on weekdays versus weekends, as well as difference in seasonal distributions. We included these patterns by defining additional categorical parameters (3) for the model:
Seasons;
Time of Day (ToD); and
Day of the Week (DoW).
Figure 13: Distribution of consumption values of 15-minute time measurements at TP Butteje.most based on
ToD and DoW parameters.
3.3.3. The Prediction Model
For the energy consumption prediction, an artificial neural network (ANN) was used with supervised learning [17]. Topology of the network is changed to suit each TP and is fine-tuned by several trial runs. The input layer (with above parameters taken as inputs) and output layer (energy consumption) are the same in every variation, while the number of hidden layers and hidden neurons vary. Since learning was supervised the data is split into two groups – training set and test set. We trained the ANN on the training set and then tested the model with the test set. There is one output parameter (consumption) and 4 input parameters (defining 15 classes):
ToD (8): 00-02, 03-05, 06-08, 09-11, 12-14, 15-17, 18-20, 21-23; DoW (2): weekend, weekday;
Season (4): winter, spring, summer, fall;
Temperature (3): high, regular, low. Output parameter is a numerical vector, while input parameters are all categorical variables expressed as factors. All parameters are standardised at the beginning – categorical variables are inputted as a design matrix13. Optional input parameters are also radiation (light, no light) and precipitation variables (high, low, none).
13 See Wikipedia for details: https://en.wikipedia.org/wiki/Design_matrix
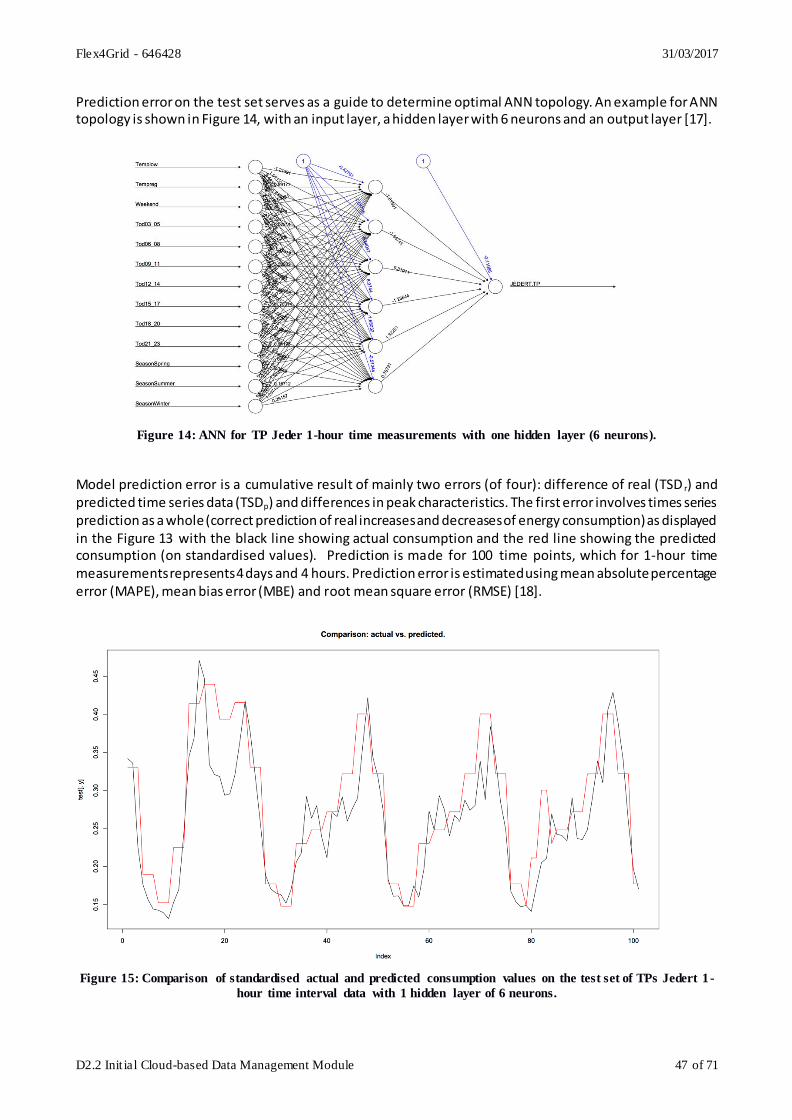
Flex4Grid - 646428 31/03/2017
D2.2 Init ial Cloud-based Data Management Module 47 of 71
Prediction error on the test set serves as a guide to determine optimal ANN topology. An example for ANN topology is shown in Figure 14, with an input layer, a hidden layer with 6 neurons and an output layer [17].
Figure 14: ANN for TP Jeder 1-hour time measurements with one hidden layer (6 neurons).
Model prediction error is a cumulative result of mainly two errors (of four): difference of real (TSD r) and predicted time series data (TSDp) and differences in peak characteristics. The first error involves times series prediction as a whole (correct prediction of real increases and decreases of energy consumption) as displayed in the Figure 13 with the black line showing actual consumption and the red line showing the predicted consumption (on standardised values). Prediction is made for 100 time points, which for 1-hour time measurements represents 4 days and 4 hours. Prediction error is estimated using mean absolute percentage error (MAPE), mean bias error (MBE) and root mean square error (RMSE) [18].
Figure 15: Comparison of standardised actual and predicted consumption values on the test set of TPs Jedert 1 -
hour time interval data with 1 hidden layer of 6 neurons.

Flex4Grid - 646428 31/03/2017
D2.2 Init ial Cloud-based Data Management Module 48 of 71
The second error refers to differences in values of main peak characteristics: width, height, value, time point and the surface of the peak. These characteristics are measured and calculated from the TSD and a predetermined baseline (for example 51st highest day peak in the training data). Peak value is the prediction value of the local extreme at a time interval, where consumption is above the baseline. Height is measured from the peak value to the baseline and width is the interval between two sequential intersections of TSD and the baseline. The surface of the peak is calculated from the width and height of the peak.
3.3.4. Processing Model
Processing model is complementary to the six steps of data analytics process. The data flow process defines data acquisition, data preparation, data modelling, prediction analysis (evaluation of the model) and presenting results. Figure 16 displays an overview of conceptual processing model for prediction of electric energy consumption. At the first run the model learns from historic data via values of input parameters. Model, which is fine-tuned on periodic basis, gets the input values through a DMS interface. Result of the model is the prediction of energy consumption for a predetermined prediction time interval (for example 48 hours), whi ch is sent to Flexibility Operator (FO) interface. After prediction time interval passes, a post-analysis of the model performance in terms of prediction errors is done. To calculate prediction errors of environmental variables against measured values, predicted values ENVp are inputted through DMS interface to the server for post-analysis. Results from post-analysis are used by FO to fine-tune the prediction model.
Figure 16: Process model - data flow.
Fine-tuning of the model and re-learning is either triggered by FO or periodically repeated once per week or even, when necessary (extreme environmental conditions), once per day. Input variables are acquired and prepared as described in the subsections Parameters and Model. Output parameters are prediction distribution of energy (TSD) and peak characteristics with corresponding metadata. All processing parameters are surmised in Table 2. Metadata is recorded for each model run and contains information about Date, Time and Area (which TP in the grid) for all predicted and measured values.

Flex4Grid - 646428 31/03/2017
D2.2 Init ial Cloud-based Data Management Module 49 of 71
Table 4: Input and output parameters in the processing model.
Parameter Possible values Description
Temp (ENV) low, reg, high Classification of temperature measurement
value.
Rad (ENV) light, no light Classification of radiation measurement value.
Prec (ENV) high, low, none Classification of precipitation measurement
value.
ToD 00-02, 03-05, 06-08, 09-
11, 12-14, 15-17, 18-20,
21-23
Clustering 15-minute time measurements into 3-
hour daily time intervals.
DoW day, end Classification based on day of the week. Two
classes: weekday and weekend. Holidays are
classified as the latter.
Season winter, spring, summer,
fall
Date clustering by calendar seasons.
TSD [0,160+] Time Series Data – distribution of energy
consumption (kW) at 15-minute time intervals.
Peak Char Value, height, width,
surface
Peak characteristics based of predetermined
baseline value.
Parameters TSDh, ToD, DoW and Seasons are discerned from historic data measurements by exploratory analysis. Environmental parameters (Temp, Rad, Prec) are additionally measured at time intervals of 1 hour and applied to the whole area of electric grid, that is for all TPs. As we are predicting the values for future TSD, environmental variables have the only unknown input values. These are separately predicted outside of our system. We denote predicted values for environmental variables as ENV p and used them as input in our prediction model. As ENVp are predictions and not measurements we have to account for their prediction error ENVe alongside the prediction error of our model. Once the model is build (learned), we put input variables: ENV p, ToD, DoW and Season, for the next time period (with default for 48h). Prediction is made once per day in the morning and contains the predicted time series data (TSDp), peak characteristics (for predicted peaks) and metadata. Metadata includes additional information, such as date, (prediction) model and area (TP). Information on prediction is sent to the FO interface.

Flex4Grid - 646428 31/03/2017
D2.2 Init ial Cloud-based Data Management Module 50 of 71
After the time period for prediction elapsed (default 48h) a post-analysis of the model performance is made. Performance success is determined by prediction error of the prediction model (TSD difference), prediction error of environmental variables (ENVe) and the discrepancies between peak characteristics of actual and predicted peaks (peak char diff). Once the cumulative error is above tolerance determined by the FO, model has to be fine-tuned and re-learned to decrease the cumulative error. Metadata is unchanged in the post-analysis.
3.4. DMS interface as a service F4G DMS Interface Component is a gateway between electro distribution systems and Flex4grid Cloud Infrastructure. Main functionality of F4G DMS Interface is to collect end user energy consumption data and send it to Prosumer Cloud Service (PCS, formerly GDS). F4G DMS Interface Component overview, explanation of installation and usage is accessible in deliverable D3.4 Final DMS Interface Component [19].
3.5. DSO interface as a service Based on the type of client, we can split Flex4Grid DSO Interface Component into three groups:
- DSO Admin interface provides DSOs (the electro company) with means to manage (i.e., create, update, delete) invitations, household profiles, gateway registration, scheduling of global load events.
- DSO User Page interface provides a registration page for participants
- DSO End-User interface provides a registration API for mobile devices
DSO interface service interacts with Prosumer Cloud service and Global Load Balancing (Prosumer Flexibility Management).
3.5.1. Prerequisites
DSO interface is part of the Flex4Grid project on Github. For installation, access to git repository is needed. F4G DSO Interface Component consists of several microservices packaged using Docker container technology.
- install software listed in Table 4 - pull flex4grid source repository
Table 5. F4G DSO Interface system requirements.
Requirements Version Refer to
Docker Engine 1.11.2 [3]
Docker Compose 1.10.0 [3]
Git 2.1.4 [4]
Gnu Make 4.0 See channels provided by your distribution.
3.5.2. Customization
Inside ./dso-interface subdirectory of a cloned source repository copy env.example to “.env”. This file includes settings that are different between each pilot. File contains comments, but here we provide further elaboration.

Flex4Grid - 646428 31/03/2017
D2.2 Init ial Cloud-based Data Management Module 51 of 71
# FQDN for DSO interface # public pages are accessible via standard SSL 443 port # Admin pages are accessible via 8443 port DSO_HOST=XYZ.dso.flex4grid.eu Fully Qualified Domain Name (DNS name) of the DSO Interface – where it is accessible from the internet. #### ADDRESSES OF OTHER FLEX4GRID SERVICES # PCS URI DSO_PCS_URI=https:///XYZ.flex4grid.eu:8443 # Global Load Balancer URI DSO_GLB_URI=https://XYZ.flex4grid.eu # MQTT Server URI DSO_MQTT_URI=https://XYZ.si.broker.flex4grid.eu Addresses of other components of Flex4Grid system. HTTPS addresses together with ports are required. #### DOES THIS INSTANCE USE AMI DATA? LEM DATA? # 0 - LEM data not available, 1 - LEM data availabl DSO_LEM_DATA=0 # 0 - AMI data not available, 1 - AMI data availabl DSO_AMI_DATA=1 This information is needed by Global Load Balancer, but is provided here, so when new participant registers to the system, his household is registered with right setup in Prosumer Cloud Service (PCS). AMI – consumption data available from DMS (deliverable D3.4); LEM – consumption data available from light sensor on household power consumption meter. #### MASTER DATABASE USERNAME/PASSWORD DSO_DB_USER=dso DSO_DB_PASSWORD=XYZ DSO’s internal database, user and password. ### ### CERTIFICATES ### # key/crt # - for public access (USER-PAGE) # ! prefix with relative path to DSO_CERT_USERPAGE.pem and DSO_CERT_USERPAGE.key files DSO_CERT_USERPAGE=../XYZ-certificates/XYZ.dso.flex4grid.eu # # key/crt (can be the same as for user page) # - for public access (END-USER-IF) # ! prefix with relative path to DSO_CERT_EUI.pem and DSO_CERT_EUI.key files DSO_CERT_EUI=../XYZ-certificates/XYZ.dso.flex4grid.eu # key/crt/chain OU=DSO # - for accessing other services (PCS) and, # - granting access to DSO Administrators (OU=ADMIN) # ! prefix with relative path to: # ! DSO_CERT_DSO.pem, # ! DSO_CERT_DSO.key and # ! DSO_CERT_DSO.chain.pem files DSO_CERT_DSO=../XYZ-certificates/internal.XYZ.dso.flex4grid.eu

Flex4Grid - 646428 31/03/2017
D2.2 Init ial Cloud-based Data Management Module 52 of 71
# key/crt OU=DSO.MANAGER # - for accessing other services (GLB) # ! prefix with relative path to DSO_CERT_DSOMANAGER.pem # ! and DSO_CERT_DSOMANAGER.key files DSO_CERT_DSOMANAGER=../XYZ-certificates/DSO.MANAGER.XYZ Four different X.509 certificates are required:
- USERPAGE for public access of UserPage interface - EUI for public access of EndUser interface - DSO for authentication of DSO Component when accessing Prosumer Cloud Service (PCS) - DSOMANAGER for authentication of DSO Component when accessing Global Load Balancer (GLB)
#### NEW USER NOTIFICATION by EMAIL # mail server address DSO_LP_MAIL_SERVER=XYZ.example.com DSO_LP_MAIL_PORT=25 DSO_LP_MAIL_TLS=1 DSO_LP_MAIL_SSL=0 # valid email address of the sender [email protected] Setup of the email server which is used to send registration and notification emails. DEFAULT_SENDER is used as a sender in these emails. # who will be notified when new household registers? # email addresses separated by comma (no spaces) [email protected] Notify specified DSO administrators when new participant registers. #### USER PAGE INTERFACE # which templates to use in user pages DSO_LP_VARIANT=generic Variant of the User Page implies language of the web page and explicit consent text presented to the participant. Valid variants include:
- generic used for testing, all texts in English
- ele Slovene language and custom ELE explicit consent
- bew and swb German language and custom BEW and SWB explicit consents.
# long random secret used to encrypt cookies DSO_LP_SECRET_KEY=XYZ #### END USER INTERFACE # long random secret used to encrypt cookies DSO_EUI_SECRET_KEY=XYZ Random “SECRET” strings, used for encryption of HTTP cookies.

Flex4Grid - 646428 31/03/2017
D2.2 Init ial Cloud-based Data Management Module 53 of 71
3.5.3. Building
After customization is done, build containers: $ cd flex4grid/dso-interface
$ docker-compose build
3.5.4. Running
Run DSO Interface Compoment, by starting containers: - move to dso-interface subdirectory
$ cd flex4grid/dso-interface
- do a test run of containers $ docker-compose up
o this will run containers in foreground with visible logging - abort execution of containers with CTRL+C - run containers in the background with
$ docker-compose up –d
- inspect logs of running containers with $ docker-compose logs –f
3.5.5. Usage – Registration Procedure
1. Administrator at DSO inserts Invitation Code, Meter Id and Area Id to DSO IF Admin interface:
In a web browser open DSO IF Admin interface14. Select Invitations > Create. Enter the required information (Invitation Code, Meter Id and Area Id) and press the Save button.
Figure 17 Create Invitations
The entered data can be reviewed, corrected or erased in List view. Select Invitations > List.
14 https ://si.dso.flex4grid.eu:8443 for ELE pi lot
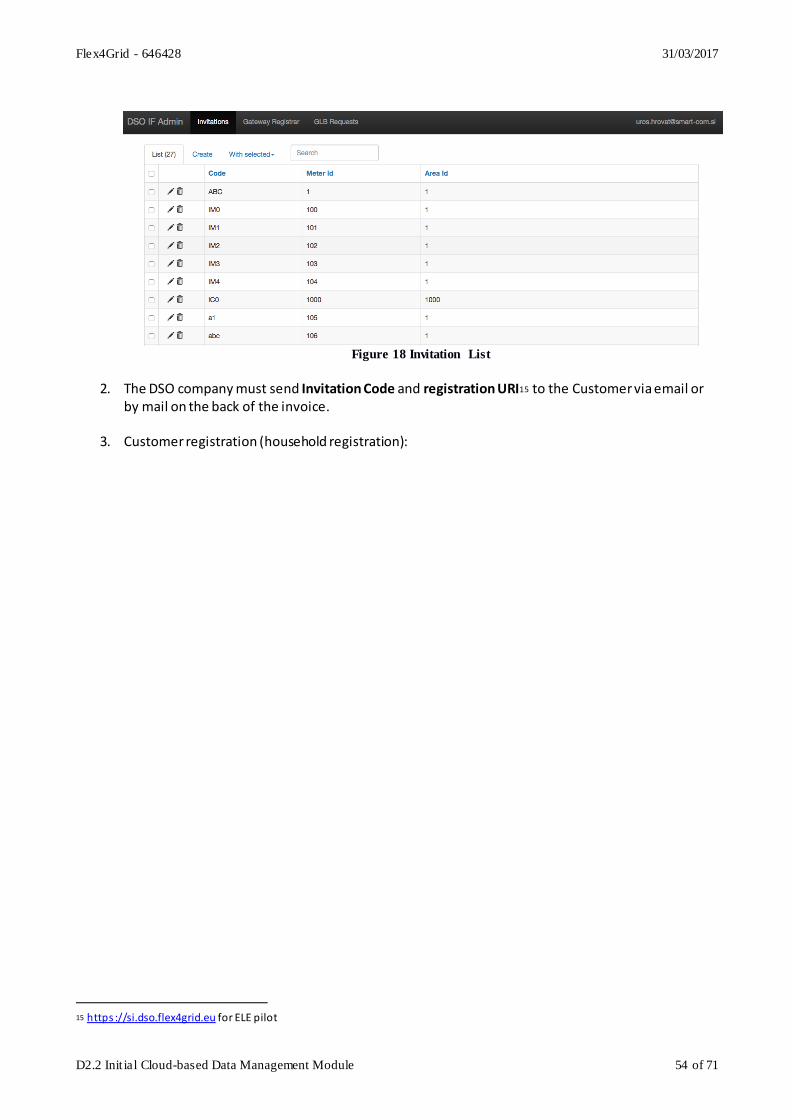
Flex4Grid - 646428 31/03/2017
D2.2 Init ial Cloud-based Data Management Module 54 of 71
Figure 18 Invitation List
2. The DSO company must send Invitation Code and registration URI15 to the Customer via email or
by mail on the back of the invoice.
3. Customer registration (household registration):
15 https ://si.dso.flex4grid.eu for ELE pilot

Flex4Grid - 646428 31/03/2017
D2.2 Init ial Cloud-based Data Management Module 55 of 71
Customer in web browser opens registration URI. Link to the Flex4Grid project page is available on this site. Customer needs to select Register to participate button.
Figure 19 Customer registration page
Customer is redirected to the registration form page. Customer first need to agree with explicit consent, only then can enter the required data:
- Invitation Code provided by DSO (by mail or email) - Email Address - Password

Flex4Grid - 646428 31/03/2017
D2.2 Init ial Cloud-based Data Management Module 56 of 71
- Phone (optional)

Flex4Grid - 646428 31/03/2017
D2.2 Init ial Cloud-based Data Management Module 57 of 71
Figure 20 Customer registration form page
By pressing the Sign up button customer is redirected to Registration in progress page, which informs him about an activation email that has been sent to him.
Figure 21 Registration in progress page
Customer needs to open Signup confirmation email and activate an activation link in a web browser.
Figure 22 Signup confirmation email
Activation link can be used just once. Customer is redirected to Thank you page.

Flex4Grid - 646428 31/03/2017
D2.2 Init ial Cloud-based Data Management Module 58 of 71
Figure 23 Thank you page
There is a link to Sign In page. If the customer signs in, the User page opens and the customer can see his email, household Id and gateway Id.
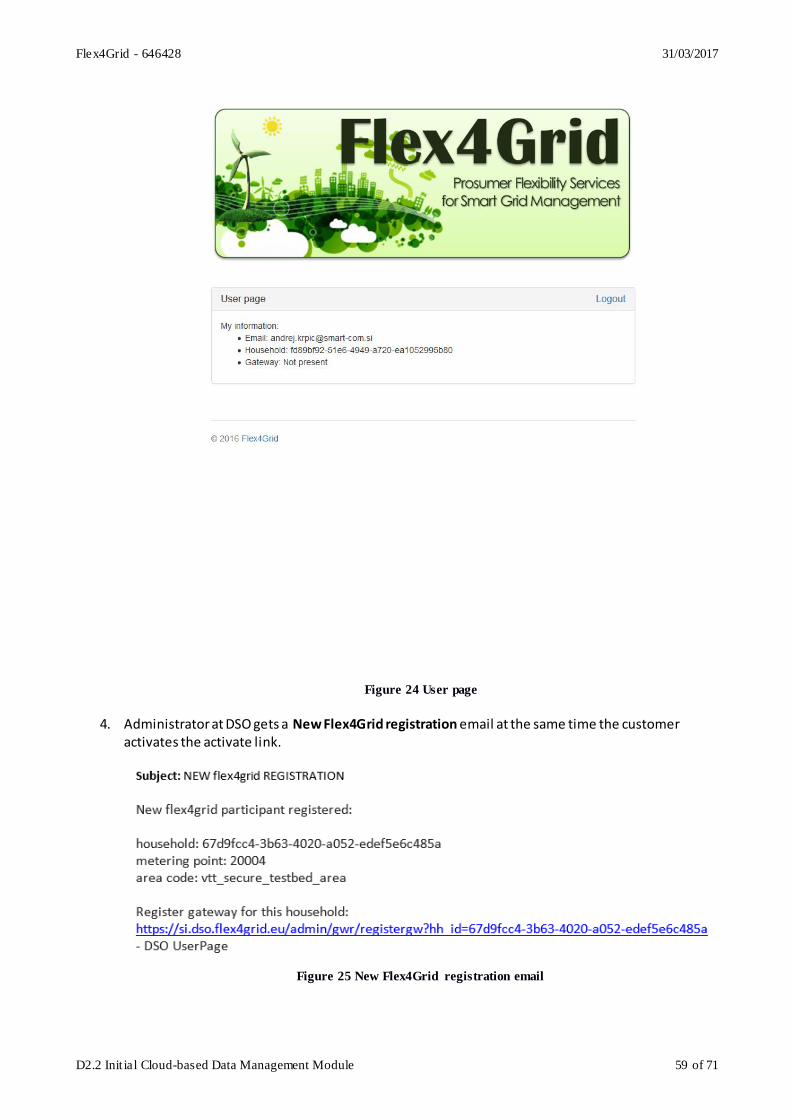
Flex4Grid - 646428 31/03/2017
D2.2 Init ial Cloud-based Data Management Module 59 of 71
Figure 24 User page
4. Administrator at DSO gets a New Flex4Grid registration email at the same time the customer
activates the activate link.
Figure 25 New Flex4Grid registration email

Flex4Grid - 646428 31/03/2017
D2.2 Init ial Cloud-based Data Management Module 60 of 71
5. Administrator at DSO opens DSO IF Admin interface by clicking the gateway registration link send by email (Figure 25) or select Gateway Registrar >Register.
Figure 26 Gateway Registrar
Administrator needs to enter a Gateway ID and press Register button. !!! IMPORTANT: Gateway ID must start with F4G- !!!
List view (Figure 27) lists all the households with area ids and Gateway IDs. “null” indicates households without a gateway.
Figure 27 Gateway Registrar List view
6. Administrator at DSO sends gateway to the right customer.
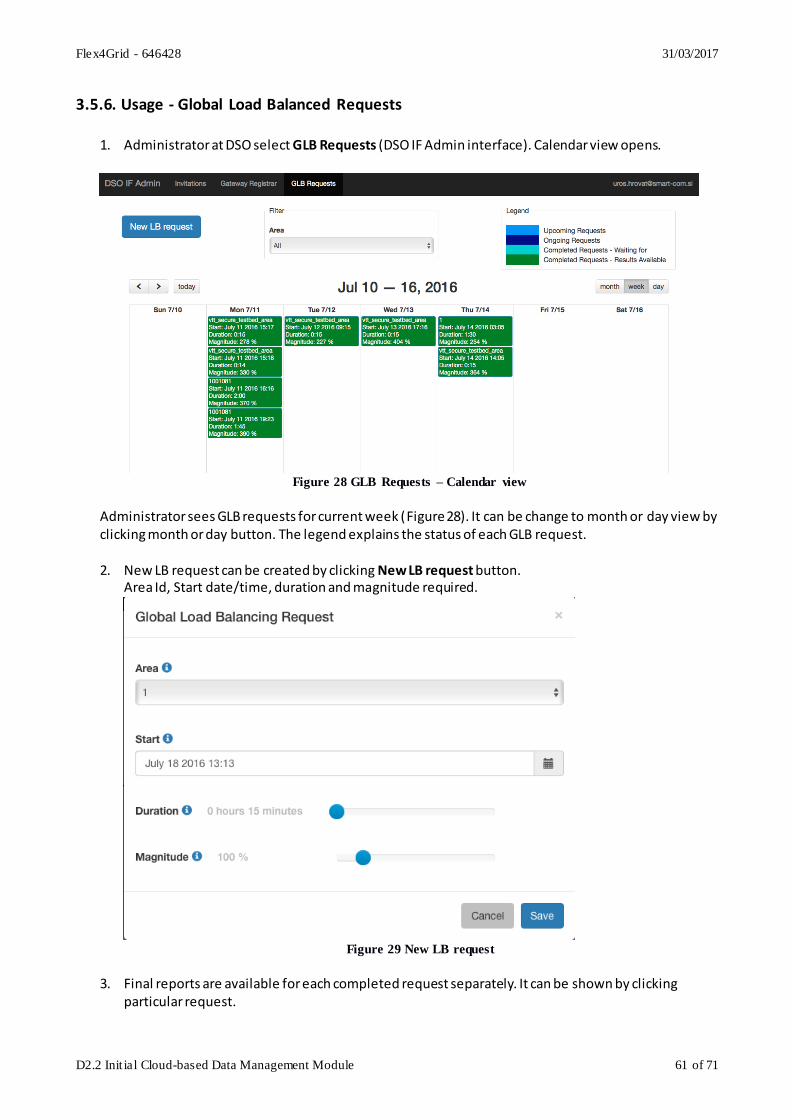
Flex4Grid - 646428 31/03/2017
D2.2 Init ial Cloud-based Data Management Module 61 of 71
3.5.6. Usage - Global Load Balanced Requests
1. Administrator at DSO select GLB Requests (DSO IF Admin interface). Calendar view opens.
Figure 28 GLB Requests – Calendar view
Administrator sees GLB requests for current week (Figure 28). It can be change to month or day view by clicking month or day button. The legend explains the status of each GLB request. 2. New LB request can be created by clicking New LB request button.
Area Id, Start date/time, duration and magnitude required.
Figure 29 New LB request
3. Final reports are available for each completed request separately. It can be shown by clicking
particular request.
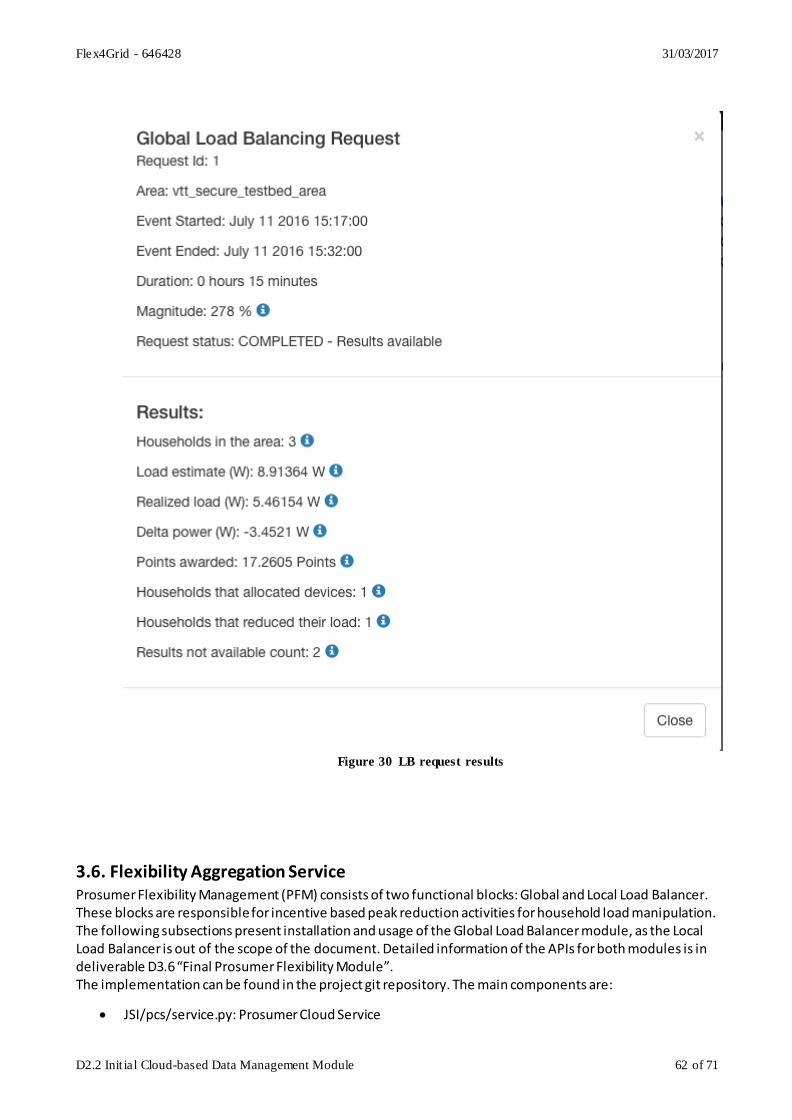
Flex4Grid - 646428 31/03/2017
D2.2 Init ial Cloud-based Data Management Module 62 of 71
Figure 30 LB request results
3.6. Flexibility Aggregation Service Prosumer Flexibility Management (PFM) consists of two functional blocks: Global and Local Load Balancer. These blocks are responsible for incentive based peak reduction activities for household load manipulation. The following subsections present installation and usage of the Global Load Balancer module, as the Local Load Balancer is out of the scope of the document. Detailed information of the APIs for both modules is in deliverable D3.6 “Final Prosumer Flexibility Module”. The implementation can be found in the project git repository. The main components are:
JSI/pcs/service.py: Prosumer Cloud Service

Flex4Grid - 646428 31/03/2017
D2.2 Init ial Cloud-based Data Management Module 63 of 71
global-load-balancer/src/phase1/glb.py: Flexibility Aggregation Service main module
global-load-balancer/docker-compose.yml: Compose file for the Flexibility Aggregation Service
global-load-balancer/Dockerfile.glb: Docker file of the Flexibility Aggregation Service
global-load-balancer/Dockerfile.nginx: Docker file of the nginx
global-load-balancer/Dockerfile.sql: Docker file of the SQL database
global-load-balancer/src/phase1/glb_tester.py: Unit tests of the Flexibility Aggregation Service
Installation
GLB is deployed using Docker and Docker-Compose. It can be built using the following CLI commands:
$ cd flex4grid/global -load-balanced/
$ ./glb-deployment.sh
GLB deployment script (glb-deployment.sh) copies certificates to build directory and runs docker-compose build command. Complete script is shown below.
#!/bin/bash
echo "Building GLB docker images";
mkdir src/phase1/JSI
cp -r ../JSI/security src/phase1/JSI
cp -r ~/certs/GLB_certs/. src/phase1/certs
touch src/phase1/JSI/__init__.py
docker-compose build
#remove temporary fi les
rm -rf src/phase1/JSI
rm -rf src/phase1/certs
Docker compose file (docker-compose.yml) contains three glb instances(glb1, glb2, glb3). Each glb instance has own database instance (db1, db2, db3), which are using MySQL as database engine. Docker compose file creates also one nginx container that is used as a web server, reverse proxy and load balancer for e ach container. Each glb is backed up using separate backup service.
Usage GLB is a service running continuously in the cloud. After building the GLB using build script glb -deployment.sh, glb can be started by
Figure 31. GLB usage for the first time (creates necessary SQL tables).
$ docker compose start

Flex4Grid - 646428 31/03/2017
D2.2 Init ial Cloud-based Data Management Module 64 of 71
3.7. End user cloud interfaces This section describes which cloud APIs the end user interface utilizes. The end user interface is being built on top of the Android (minimum SDK version 19) and iOS platforms. The design approach of the end user interface is described in deliverable D3.5 Final User Interactions Development [11].
3.7.1. REST interface for Prosumer Cloud Service
The end user interface performs three REST related actions: HTTP GET to receive a list of associations between devices and appliances,
HTTP POST to construct an association between a device and an appliance, and
HTTP POST to confirm or reject a load balancing request First two HTTP actions are performed with the Prosumer Cloud Service16 and the last with the Global Load Balancer. In order to lighten the main thread each HTTP method is handled in the background in an asynchronous task [3]. Initially, when launched the end user interface application gets a list of associations via the following REST interface PATH: /households/<household_id>/associations. An association denotes the link between an appliance (e.g. a fridge) and a dedicated device for tracking energy consumption, i.e. smart plug. An example of a returned HTTP body in the form of a JSON payload is displayed below:
In a decade, such construct might dissolve, as appliances will embed a smart plug. Though, as this is currently not the case, such mapping is required. Via the end user interface relevant information, such as the actual name and location of an appliance, can be provided. Doing so the end user interface compiles an id for the appliance (i.e. in a UUID style), which is posted to the cloud using the PA TH that is being used for getting associations. The JSON payload for posting an association is given here:
16 The test prosumer cloud service is deployed in the cloud at https://test.pcs.flex4grid.eu
{ "associations": [
{
"id": "937d5c08-1285-447b-82ea-bf0a6eeb33eb",
"appliance": {
"id": "214e4532-e49c-12d3-a436-426655210012",
"name": "Freezer",
"location": "Cellar"
}
},
{
"id": "ce5dbf2c-5e72-4cc3-adf1-2c1bef15ce56",
"appliance": {}
}
]
}

Flex4Grid - 646428 31/03/2017
D2.2 Init ial Cloud-based Data Management Module 65 of 71
In case the user changes the location of the appliance, this information can of course be updated through the same HTTP verb.
Furthermore, the end user interface may receive a load balancing request via MQTT (see next section), which users may accept or deny. The decision is accordingly posted to the Global Load Balancer as exemplified below.
The REST client(s) of the end user interfaces leverages out of the box APIs of the Android SDK17. The main code executing a HTTP GET in order to receive the list of associations persisted in the cloud is shown below:
Accordingly, the code excerpt below hints on how to perform a HTTP Post in order to create an association, i.e. to do or update a mapping between an appliance and a smart plug.
17 Android URLConnection, http://developer.android.com/intl/pt-br/reference/java/net/URLConnection.html
{
"id": "937d5c08-1285-447b-82ea-bf0a6eeb33eb",
"appliance": {
"id" : "214e4532-e49c-12d3-a436-426655210012",
"name": "Freezer",
"location": "Cellar"
}
}
{
"id" : "3et980v3",
"household_id": "bbc14ebe-08f4-4090-add1-854369d71117"
"timestamp" : "2015-05-10T15:10:10.705677Z",
"status" : "0",
"start" : "2015-05-10T18:00:00.000000Z",
"end" : "2015-05-10T19:00:00.000000Z",
"powerAdjustmentOption" :
{
"powerDelta" : "-500",
"points" : "3"
},
"deltaPowerTarget" : -500
"totalFlexibility" : -700
}
URL url = new URL(http://cloud.flex4grid:8000/households/2/associations");
URLConnection urlConnection = url.openConnection();
InputStream in = new BufferedInputStream(urlConnection.getInputStream());
associationList = readJsonStream(in);

Flex4Grid - 646428 31/03/2017
D2.2 Init ial Cloud-based Data Management Module 66 of 71
3.7.2. MQTT topics for Real-Time Events
The end user interface provides real-time events related to the appliances and receives load-balancing requests as well. For this it subscribes to the following three topics listed in Table 6.
Table 6 MQTT relevant topics for the end user interface
Topic Description /households/<household_id>/device/state A new message to this topic is sent whenever the
device’s state changes. /households/<household_id>/device/consumption Topic for consumption of a single device during
certain time period. /load_balancing/requests/areas/<area_id> Topic for load balancing requests for
corresponding area
The following three excerpts display for each event an example payload being received and accordingly processed at the end user interface (see deliverable D3.5 [11]). The excerpts show the payload for a device consumption event, the payload for a device state event, and for a load balancing request event, respectively.
URL url = new URL(http://cloud.flex4grid:8000/households/2/associations");
URLConnection urlConnection = url.openConnection();
urlConnection.setDoOutput(true);
urlConnection.setRequestMethod("POST");
urlConnection.setRequestProperty("Content-Type","application/json");
writeJsonStream(urlConnection.getOutputStream(), association);
code = urlConnection.getResponseCode();
{
"timestamp" : "2015-05-10T30:10:10.70Z",
"id" : "123e4567-e89b-12d3-a456-426655440000",
"type" : "smart plug",
"status" : "idle"
}

Flex4Grid - 646428 31/03/2017
D2.2 Init ial Cloud-based Data Management Module 67 of 71
The MQTT client of the end user interface leverages the external Eclipse Paho library [4] to receive events via the MQTT broker18. All MQTT events are handled internally by the end user interface , e.g. in Android this is handled as an Android service [5], which informs the main UI thread of events via Android Handler [6] pattern.
The following code excerpt shows how the MQTT client of the end user interface subscribes to the relevant topics using for each topic the QoS level 1 Error! Reference source not found., i.e. the broker will deliver the message to the end user interface at least once, with a confirmation required.
18 Flex4Grid MQTT broker, tcp://si.broker.flex4grid.eu
{
"timestamp" : "2015-05-10T30:10:10.70Z",
"start" : "2015-05-10T00:18:07.703576Z",
"end" : "2015-05-10T00:18:08.803565Z" ,
"energy" : "200",
"energyCumul" : "450",
"powerMax" : "5000",
"powerMin" : "100",
"id" : "7"
}
{
"id" : "3et980v3",
"area_id" : "myArea",
"timestamp" : "2015-05-10T15:10:10.705677Z",
"start" : "2015-05-10T18:00:00.000000Z",
"end" : "2015-05-10T19:00:00.000000Z",
"powerAdjustmentOptions" : [
{
"powerDelta" : "-500", "points" : "3"
},
{
"powerDelta" : "-1000", "points" : "5"
},
{
"powerDelta" : "-1500","points" : "10"
}],
"requestProcessDuration" : "120",
"targetAdjustmentLevel" : "-1500000"
}

Flex4Grid - 646428 31/03/2017
D2.2 Init ial Cloud-based Data Management Module 68 of 71
3.7.3. Historical data for visualization
Presenting historical data is of great importance for the prosumer. Based on this information he can compare consumptions between different days, weeks, months or years. The historical data is stored in the PCS service and available through its REST interface. The PCS services as described in section 3.1, take care that the data is collected from data sources, stored in the storage and aggregated to same time intervals. The common time intervals available are 15 minutes, 1 hour, 6 hours, and day. Additional interval for the gateways is 1 minute. The aggregation interface and the return format is described in Section 3.1. The data is available for all measurement sources: the devices, households/gateways, measurement points (DMS/AMI system) and areas, see the REST aggregate interfaces as defined in Table 1. This document specifies two collections that are available through the same interface at the moment. These are collections J and K. The K is a simplified, easy to use collection to be presented on a mobile device. If needed, for more detailed presentation, the collection J will be used. On the mobile devices, the interface will be used in a combination with a calendar view. Depending on the selected day and history set view the corresponding day, week, month or year will be presented. All the presented views will use a fixed set of aggregated measurements, for example a day 24 measurements, a week 7 days, etc. The plots will be in bars. On the device, it will be possible to seamlessly sweep between the household and measurement point data (DMS/AMI).
4. Monitoring
4.1. SmartSNO The SmartSNO monitoring system is the result of Smart Com R&D and years of experience. The SmartSNO provides user-friendly, safe, and efficient way of monitoring IT infrastructure. It is suitable for both monitoring networks and cloud infrastructure (IaaS, PaaS). SmartSNO can monitor network elements and IT infrastructure using Simple Network Management Protocol (SNMP), as well as REST and MQTT probes. Services can be monitored using passive checks.
mqttClient = new MqttAsyncClient(
"tcp://si.broker.flex4grid.eu:1883",
wifiInfo.getMacAdress(), new MemoryPersistence());
token = mqttClient.connect();
token.waitForCompletion(3500);
mqttClient.setCallback(new MqttEventCallback());
String [] topics = {"/flex4grid/v1/load_balancing/requests/areas/1",
"/flex4grid/v1/households/2/device/state",
"/flex4grid/v1/households/2/device/consumption"
}
int [] ints = {1,1,1};
token = mqttClient.subscribe(topics, ints);
token.waitForCompletion(5000);

Flex4Grid - 646428 31/03/2017
D2.2 Init ial Cloud-based Data Management Module 69 of 71
Passive check is a daemon that runs on a remote machine, collects relevant service information, and send it to SmartSNO backend system.
Figure 32: SmartSNO
SmartSNO instance is implemented to monitor Flex4Grid cloud infrastructure, cloud services and local gateways. More about SmartSNO can be found on the product web page [8], including software download, installation instructions and howtos. More information about the SmartSNO instantiation and use in Flex4Grid is available in Section 4.5 of D6.2 First Pilot Deployment [20].

Flex4Grid - 646428 31/03/2017
D2.2 Init ial Cloud-based Data Management Module 70 of 71
5. Cloud services infrastructure A number of Flex4Grid cloud services have been described in the Section 3. The services are deployed in a
virtual machine or in a Docker container inside the virtual machine. They are deployed in the cloud
infrastructure setup by the project. In the development phase the infrastructure was still common. In pilot
phase the infrastructure has become pilot-specific and moved to the piloting country, i.e. the data
controller responsible for the pilots and the participating prosumers personal information, as it is described
in the Data management plan deliverable D7.1 [12]. Three pilot infrastructures have been setup, two in
Germany, at BEW and SWB, and one in Slovenia at ELE. The infrastructure has been handed over to WP6
for further piloting [20].
In addition, the WP has setup two internal pilot infrastructures for further integration, improvement and
maintenance of the services: the testing and developing infrastructure. The test infrastructure is intended
for running the exact same version of the services as in the production infrastructure. In this way, the
conditions in the infrastructure can be exactly replicated and potentially solved quicker. The development
infrastructure is intended for developing new features, if needed. In practice, mostly the testing
infrastructure is used for both purposes. The infrastructures will be hand over to WP5 and WP6 for further
improvements.
Example services forming the project test cloud infrastructure are:
https://test.pcs.flex4grid.eu: runs test prosumer cloud service (formerly global data collection and
storage), as described in Section 3.1,
https://test.broker.flex4grid.eu: MQTT broker, used in test pilot, as described in Section 3.2,
https://test.dso.flex4grid.eu: runs test DSO interface component as described in Section 3.5,
https://test.glb.flex4grid.eu: runs test global load balancing service, as described in the deliverable
D3.6 [21].
The same services with similar but dedicated URL addresses have been deployed in production pilots in Germany and Slovenia. The pilots use some common infrastructure like trust server, described in the deliverable D2.1 [9] and monitoring service as described in Section 4.
6. Conclusion and future work This deliverable presented the final version of the Flex4Grid cloud data services prototypes: Prosumer Cloud Service, MQTT Broker, Data Analytic, DMS interface as a service, DSO interface as a service, End user cloud interfaces. Additionally, an overview of the cloud data services infrastructure and monitoring system have been presented. In the next phase, the cloud-based data management prototype will be integrated with other final Flex4Grid components (e.g. User Interface and Prosumer Flexibility modules) into the final system prototype, which is due in M30. The final prototype will be implemented and validated in the second pilot, validation results will be reported in D6.6 in M36.

Flex4Grid - 646428 31/03/2017
D2.2 Init ial Cloud-based Data Management Module 71 of 71
7. References
[1] Mosquitto. An Open Source MQTT v3.1/v3.1.1 Broker, 2015. URL: http://mosquitto.org/ [Online; Retrieved on November 27 2015].
[2] Apache Spark, 2015. URL: https://spark.apache.org/ [Online; Retrieved on November 27 2015]. [3] Asynchronous tasks in Android, 2015. http://developer.android.com/intl/pt-
br/reference/android/os/AsyncTask.html [Online; Retrieved on November 27 2015]. [4] Eclipse Paho MQTT library, 2015. URL: http://www.eclipse.org/paho/ [Online; Retrieved on
November 27 2015]. [5] Android service, 2015. URL: http://developer.android.com/intl/pt-
br/reference/android/app/Service.html [Online; Retrieved on November 27 2015]. [6] Android handler, 2015. URL: http://developer.android.com/intl/pt-
br/reference/android/os/Handler.html [Online; Retrieved on November 27 2015]. [7] MQTT QoS levels, 2015. URL: http://mosquitto.org/man/mqtt-7.html [Online; Retrieved on
November 27 2015]. [8] SmartSNO, 2017 . URL: http://www.smartsno.com/ [Online; Retrieved on March 30 2017]. [9] D. Gabrijelčič. D2.3 Final Security and Privacy Module. Flex4Grid project deliverable, March 2017. [10]V. Palacka, J. Kiljander, O. Werner-Kytölä, D. Gabrijelčič, R. Ranchev. D3.6 Final Prosumer Flexibility
Module. Flex4Grid project deliverable, March 2017. [11]A. Savanović, J. Takalo-Mattila, K. Kolehmainen. D3.5 Final User Interactions Development.
Flex4Grid project deliverable, March 2017. [12]D. Gabrijelčič. D7.1 Data Management Plan. Flex4Grid project deliverable, June 2015. [13]T. Dierks and E. Rescorla. The Transport Layer Security (TLS) Protocol Version 1.2. RFC 5246,
Standards Track, 2008. [14]A. Savanović, J. Kiljander, O. Werner-Kytölä, D. Gabrijelčič, V. Palacka, Ž. Stepančič, A. Kos, P. Passi,
and P. Ceferin. D6.3 Validation of first pilot. Flex4Grid project deliverable, December 2016. [15]W. S. Cleveland. Robust Locally Weighted Regression and Smoothing Scatterplots. Journal of the
American Statistical Association. 1979, Vol. 74 (368): 829—836. [16]S. Scardapane, and D. Wang. Randomness in neural networks: an overview. WIREs Data Mining
Knowl Discov. 2017, 7:e1200. Doi: 10.1002/widm.1200 [17]F. Günther, and S. Fritsch. Neuralnet: Training of Neural Networks. The R Journal. 2010, Vol. 2 (1):
30—38 [18]T. Khatib, A. Mohamed, K. Sopian, and M. Mahmoud. Assessment of Artificial Neural Networks for
Hourly Solar Radiation Prediction. International Journal of Photoenergy. 2012 [19]A. Kos, K. Koželj, A. Krpič, A. Savanović. D3.4 Final DMS Interface Component. Flex4Grid project
deliverable, March 2017. [20]A. Kos, J. Kiljander, U. Hrovat, E. Elmasllari, P. Selmke, D. Gabrijelčič, Ž. Stepančič, H. Müller. D6.2
First Pilot Deployment. Flex4Grid project deliverable, July 2016. [21]V. Palacka, J. Kiljander, O. Werner-Kytölä, D. Gabrijelčič. D3.6 Final Prosumer Flexibility Module.
Flex4Grid project deliverable, March 2017.